UNITED STATES
SECURITIES AND EXCHANGE COMMISSION
Washington, D.C. 20549
FORM N-CSR
CERTIFIED SHAREHOLDER REPORT OF REGISTERED MANAGEMENT INVESTMENT COMPANIES
Investment Company Act file number: 811-09637 and 811-09739
Name of Fund: BlackRock Large Cap Series Funds, Inc.
BlackRock Large Cap Core Fund
BlackRock Large Cap Growth Fund
BlackRock Large Cap Value Fund
BlackRock Large Cap Value Retirement Portfolio
Master Large Cap Series LLC
Master Large Cap Core Portfolio
Master Large Cap Growth Portfolio
Master Large Cap Value Portfolio
Fund Address: 100 Bellevue Parkway, Wilmington, DE 19809
Name and address of agent for service: John M. Perlowski, Chief Executive Officer, BlackRock Large Cap Series Funds, Inc. and Master Large Cap Series LLC, 55 East 52nd Street, New York, NY 10055
Registrants’ telephone number, including area code: (800) 441-7762
Date of fiscal year end: 09/30/2016
Date of reporting period: 09/30/2016
Item 1 – Report to Stockholders
SEPTEMBER 30, 2016
BlackRock Large Cap Series Funds, Inc.
▶ BlackRock Large Cap Core Fund
▶ BlackRock Large Cap Growth Fund
▶ BlackRock Large Cap Value Fund
▶ BlackRock Large Cap Value Retirement Portfolio
| | |
| Not FDIC Insured ◾ May Lose Value ◾ No Bank Guarantee | | |
| | |
 | | Shareholders can sign up for e-mail notifications of quarterly statements, annual and semi-annual shareholder reports and prospectuses by enrolling in the electronic delivery program. Electronic copies of shareholder reports and prospectuses are also available on BlackRock’s website. TO ENROLL IN ELECTRONIC DELIVERY: Shareholders Who Hold Accounts with Investment Advisors, Banks or Brokerages: Please contact your financial advisor. Please note that not all investment advisors, banks or brokerages may offer this service. Shareholders Who Hold Accounts Directly with BlackRock: 1. Access the BlackRock website at blackrock.com 2. Select ‘‘Access Your Account” 3. Next, select “eDelivery” in the “Related Resources” box and follow the sign-up instructions |
| | | | | | |
| 2 | | BLACKROCK LARGE CAP SERIES FUNDS, INC. | | SEPTEMBER 30, 2016 | | |
Dear Shareholder,
Most asset classes produced strong returns over the past year, particularly risk assets such as equities and high yield bonds. Central bank policy decisions continued to provide support to financial markets, while changing economic outlooks and geopolitical risks have been major drivers of investor sentiment.
The Federal Reserve (the “Fed”) has long been in the spotlight, particularly leading up to the decision to end its near-zero interest rate policy at the end of 2015, and after, as investors remained focused on the anticipated pace of future rate hikes. With the European Central Bank and the Bank of Japan having moved into stimulus mode, the divergence in global monetary policies drove heightened market volatility heading into 2016 and caused the U.S. dollar to strengthen considerably. The year had a rough start as the strong dollar challenged U.S. companies that generate revenues overseas, and pressured emerging market currencies and commodities prices. Low and volatile oil prices and signs of slowing growth in China were also meaningful factors behind the decline in risk assets early in the year. However, as the first quarter wore on, these pressures abated and a more tempered outlook for U.S. rate hikes helped financial markets rebound.
Volatility spiked in late June when the United Kingdom shocked investors with its vote to leave the European Union. Uncertainty around how the British exit might affect the global economy and political landscape drove investors to high-quality assets, pushing already low global yields to even lower levels. However, risk assets recovered swiftly in July as economic data suggested that the consequences had thus far been contained to the United Kingdom.
With a number of factors holding global interest rates down — central bank accommodation, an aging population, and weak productivity growth — assets offering decent yield have become increasingly scarce. As a result, income-seeking investors have stretched into riskier assets despite high valuations in many sectors. History implies that high valuations and low growth results in lower returns for risk assets. Still, perceived safe havens have their own risks, and investors are wise to carefully assess risk and potential reward.
At BlackRock, we believe investors need to think globally, extend their scope across a broad array of asset classes and be prepared to adjust accordingly as market conditions change over time. We encourage you to talk with your financial advisor and visit blackrock.com for further insight about investing in today’s markets.
Sincerely,

Rob Kapito
President, BlackRock Advisors, LLC

Rob Kapito
President, BlackRock Advisors, LLC
| | | | | | | | |
| Total Returns as of September 30, 2016 | |
| | | 6-month | | | 12-month | |
U.S. large cap equities
(S&P 500® Index) | | | 6.40% | | | | 15.43% | |
U.S. small cap equities
(Russell 2000® Index) | | | 13.18 | | | | 15.47 | |
International equities
(MSCI Europe, Australasia,
Far East Index) | | | 4.88 | | | | 6.52 | |
Emerging market equities
(MSCI Emerging Markets
Index) | | | 9.75 | | | | 16.78 | |
3-month Treasury bills
(BofA Merrill Lynch
3-Month U.S. Treasury
Bill Index) | | | 0.17 | | | | 0.27 | |
U.S. Treasury securities
(BofA Merrill Lynch
10-Year U.S. Treasury
Index) | | | 2.25 | | | | 5.59 | |
U.S. investment grade
bonds (Bloomberg Barclays
U.S. Aggregate Bond Index) | | | 2.68 | | | | 5.19 | |
Tax-exempt municipal
bonds (S&P Municipal
Bond Index) | | | 2.53 | | | | 5.84 | |
U.S. high yield bonds
(Bloomberg Barclays U.S.
Corporate High Yield 2%
Issuer Capped Index) | | | 11.38 | | | | 12.74 | |
|
| Past performance is no guarantee of future results. Index performance is shown for illustrative purposes only. You cannot invest directly in an index. | |
| | | | | | |
| | | THIS PAGE NOT PART OF YOUR FUND REPORT | | | | 3 |
| | | | |
| Fund Summary as of September 30, 2016 | | | BlackRock Large Cap Core Fund | |
BlackRock Large Cap Core Fund’s (the “Fund”) investment objective is to seek long-term capital growth. In other words, the Fund tries to choose investments that will increase in value.
|
| Portfolio Management Commentary |
How did the Fund perform?
| • | | For the 12-month period ended September 30, 2016, the Fund, through its investment in Master Large Cap Core Portfolio (the “Portfolio”), underperformed its benchmark, the Russell 1000® Index. |
What factors influenced performance?
| • | | While the Portfolio had a solid finish to 2015, the first half of 2016 was challenged and this weakness weighed on its one-year results. Among the main drivers of the Portfolio’s underperformance in the first half of 2016 were two areas of high conviction for the investment adviser, namely an overweight to banks within financials and underweights to stability/bond proxies. |
| • | | The investment adviser is overweight U.S. banks on the belief that they were significantly under-earning relative to their normalized earnings power, pressured by a low-rate environment, increased regulatory headwinds, depressed capital markets activity and an inflated cost structure. U.S. banks substantially underperformed early in 2016 on speculation low commodity prices would weigh further on inflation expectations and credit expenses. Additionally, market volatility and uncertainty led to a sharp slowdown in capital markets activity, resulting in negatively revised expectations for bank earnings reports. U.S. banks experienced further weakness in June as the Brexit result exacerbated the concern around lower long-term rates and the perpetual Fed waiting game. The group recouped some of its losses in the third quarter of 2016 amid a modestly improved interest rate outlook, though it was not enough to offset the earlier-year underperformance. |
| • | | At the same time, in keeping with its disciplined quantitative and fundamental process, the investment adviser made the deliberate decision to resist the market’s structural grab for stability/bond proxy stocks such as utilities and telecommunication services, which boast relatively high dividend yields, but lack the fundamental or valuation support it requires. This long-standing underweight proved a considerable headwind for the Portfolio in the first half of 2016. The sectors significantly outperformed as investors sought refuge during the market tumult in the period, with a frenetic search for yield in the low/negative interest rate environment lending additional support. As with financials, the third quarter of 2016 saw a reversal, with the sectors giving back some of their earlier-year gains amid both a broader move away from traditional defensives and growing speculation of an impending rate hike. |
| • | | Beyond the abovementioned factors, the Portfolio had a few stock-specific disappointments in the annual period, including Western Digital |
| | | Corp., CVS Health Corp. and Cognizant Technology Solutions Corp. An underweight to Amazon.com Inc. hurt as well. |
| • | | On the positive side, relative performance was supported by selection within the food products segment of consumer staples. Tyson Foods Inc. was the top contributor in both the sector and the Portfolio overall as the company significantly beat earnings expectations, with strong performance in all segments. Investors had been concerned about the cyclicality of its chicken business, but the company’s margins proved far stronger than expected, leading to a significant re-rating of the shares. |
| • | | Elsewhere, while the overall information technology (“IT”) sector detracted from Portfolio performance, holdings Activision Blizzard Inc. and NVIDIA Corp. were among the top individual contributors in the 12 months. Activision outperformed early in the reporting period after the announcement of the King Digital Entertainment acquisition, which provides strong earnings and cash flow accretion. Shares further benefited as investors reacted positively to revenue and earnings upside and an upgraded outlook for fiscal year 2016. User metrics are positive and Activision management continues to pivot the company from one-time game purchase revenues to many digital transactions from a highly-engaged user base. NVIDIA delivered strong results through the period, consistently exceeding expectations as it transitions from PC and mobile components supplier to graphics platform provider. Overall, the company continues to benefit from increased sentiment around deep learning, virtual reality and autonomous driving, all segments in which it has silicon technology leadership. |
| • | | The Portfolio’s absence in Wells Fargo & Co. also aided relative returns. |
Describe recent portfolio activity.
| • | | Due to a combination of portfolio trading activity and market movement during the 12-month period, the Portfolio’s weighting in the materials sector increased, particularly within containers & packaging and metals & mining. IT exposure also increased. The biggest reduction was in the financials sector, largely with respect to insurance. Health care exposure declined as well, especially providers & services. |
Describe portfolio positioning at period end.
| • | | Relative to the Russell 1000® Index, the Portfolio ended the period with its largest sector overweights in IT and consumer discretionary, followed by financials and health care. Real estate, industrials and utilities were the most significant underweights. |
The views expressed reflect the opinions of BlackRock as of the date of this report and are subject to change based on changes in market, economic or other conditions. These views are not intended to be a forecast of future events and are no guarantee of future results.
| | | | | | |
| 4 | | BLACKROCK LARGE CAP SERIES FUNDS, INC. | | SEPTEMBER 30, 2016 | | |
| | | | |
| | | | BlackRock Large Cap Core Fund | |
|
| Total Return Based on a $10,000 Investment |
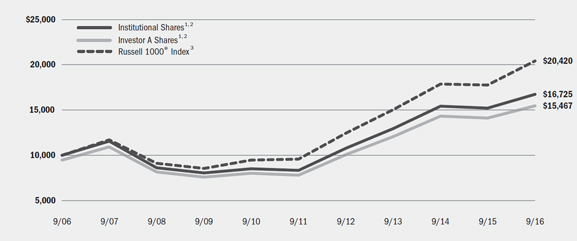
| | 1 | Assuming maximum sales charges, if any, transaction costs and other operating expenses, including administration fees, if any. Institutional Shares do not have a sales charge. |
| | 2 | The Fund invests all of its assets in the Portfolio, a series of Master Large Cap Series LLC. The Portfolio invests at least 80% of its assets in equity securities, primarily common stock, of large cap companies located in the United States that the investment adviser selects from among those that are, at the time of purchase, included in the Russell 1000® Index. |
| | 3 | An index that measures the performance of the large cap segment of the U.S. equity universe. It is a subset of the Russell 3000® Index and includes approximately 1,000 of the largest securities based on a combination of their market capitalization and current index membership. The index represents approximately 92% of the total market capitalization of the Russell 3000® Index. |
|
| Performance Summary for the Period Ended September 30, 2016 |
| | | | | | | | | | | | | | | | | | | | | | | | | | | | | | | | | | | |
| | | | | Average Annual Total Returns4 |
| | | | | 1 Year | | 5 Years | | 10 Years |
| | | 6-Month
Total Returns | | w/o sales
charge | | w/ sales
charge | | w/o sales
charge | | w/ sales
charge | | w/o sales
charge | | w/ sales
charge |
Institutional | | | | 4.69 | % | | | | 9.97 | % | | | | N/A | | | | | 14.98 | % | | | | N/A | | | | | 5.28 | % | | | | N/A | |
Service | | | | 4.38 | | | | | 9.50 | | | | | N/A | | | | | 14.54 | | | | | N/A | | | | | 4.97 | | | | | N/A | |
Investor A | | | | 4.58 | | | | | 9.67 | | | | | 3.91 | % | | | | 14.65 | | | | | 13.42 | % | | | | 5.02 | | | | | 4.46 | % |
Investor B | | | | 4.11 | | | | | 8.78 | | | | | 4.28 | | | | | 13.70 | | | | | 13.46 | | | | | 4.34 | | | | | 4.34 | |
Investor C | | | | 4.11 | | | | | 8.78 | | | | | 7.78 | | | | | 13.67 | | | | | 13.67 | | | | | 4.12 | | | | | 4.12 | |
Class R | | | | 4.43 | | | | | 9.36 | | | | | N/A | | | | | 14.28 | | | | | N/A | | | | | 4.64 | | | | | N/A | |
Russell 1000® Index | | | | 6.67 | | | | | 14.93 | | | | | N/A | | | | | 16.41 | | | | | N/A | | | | | 7.40 | | | | | N/A | |
| | 4 | | Assuming maximum sales charges, if any. Average annual total returns with and without sales charges reflect reductions for distribution and service fees. See “About Fund Performance” on page 12 for a detailed description of share classes, including any related sales charges and fees. |
| | | | N/A—Not applicable as share class and index do not have a sales charge. |
| | | | Past performance is not indicative of future results. |
| | | | Performance results may include adjustments made for financial reporting purposes in accordance with U.S. generally accepted accounting principles. |
| | | | | | | | | | | | | | | | | | | | | | | | | | | | | | | | | | | |
| | | Actual | | Hypothetical6 | | |
| | | Beginning
Account Value
April 1, 2016 | | Ending
Account Value
September 30, 2016 | | Expenses Paid
During the Period5 | | Beginning
Account Value
April 1, 2016 | | Ending
Account Value
September 30, 2016 | | Expenses Paid
During the Period5 | | Annualized
Expense
Ratio |
Institutional | | | $ | 1,000.00 | | | | $ | 1,046.90 | | | | $ | 4.45 | | | | $ | 1,000.00 | | | | $ | 1,020.65 | | | | $ | 4.39 | | | | | 0.87 | % |
Service | | | $ | 1,000.00 | | | | $ | 1,043.80 | | | | $ | 6.44 | | | | $ | 1,000.00 | | | | $ | 1,018.70 | | | | $ | 6.36 | | | | | 1.26 | % |
Investor A | | | $ | 1,000.00 | | | | $ | 1,045.80 | | | | $ | 5.83 | | | | $ | 1,000.00 | | | | $ | 1,019.30 | | | | $ | 5.76 | | | | | 1.14 | % |
Investor B | | | $ | 1,000.00 | | | | $ | 1,041.10 | | | | $ | 10.05 | | | | $ | 1,000.00 | | | | $ | 1,015.15 | | | | $ | 9.92 | | | | | 1.97 | % |
Investor C | | | $ | 1,000.00 | | | | $ | 1,041.10 | | | | $ | 10.10 | | | | $ | 1,000.00 | | | | $ | 1,015.10 | | | | $ | 9.97 | | | | | 1.98 | % |
Class R | | | $ | 1,000.00 | | | | $ | 1,044.30 | | | | $ | 7.36 | | | | $ | 1,000.00 | | | | $ | 1,017.80 | | | | $ | 7.26 | | | | | 1.44 | % |
| | 5 | | For each class of the Fund, expenses are equal to the annualized expense ratio for the class, multiplied by the average account value over the period, multiplied by 183/366 (to reflect the one-half year period shown). Because the Fund invests all of its assets in the Portfolio, the expense table reflects the net expenses of both the Fund and the Portfolio in which it invests. |
| | 6 | | Hypothetical 5% annual return before expenses is calculated by prorating the number of days in the most recent fiscal half year divided by 366. |
| | | | See “Disclosure of Expenses” on page 12 for further information on how expenses were calculated. |
| | | | | | |
| | | BLACKROCK LARGE CAP SERIES FUNDS, INC. | | SEPTEMBER 30, 2016 | | 5 |
| | |
| Fund Summary as of September 30, 2016 | | BlackRock Large Cap Growth Fund |
BlackRock Large Cap Growth Fund’s (the “Fund”) investment objective is to seek long-term capital growth. In other words, the Fund tries to choose investments that will increase in value.
|
| Portfolio Management Commentary |
How did the Fund perform?
| • | | For the 12-month period ended September 30, 2016, the Fund, through its investment in Master Large Cap Growth Portfolio (the “Portfolio”), underperformed its benchmark, the Russell 1000® Growth Index. |
What factors influenced performance?
| • | | In sector terms, the prime detractor from performance was industrials, due largely to the Portfolio’s exposure to airlines. Financials was an additional drag, with bank holdings and absence in real estate investment trusts having the most negative impact. Conversely, information technology (“IT”) and consumer discretionary were the top contributors to relative performance. Semiconductor and software holdings drove gains in IT, while selection within media and specialty retail benefited in consumer discretionary. |
| • | | In stock specifics, an underweight in Amazon.com Inc. was the largest single detractor in the annual period. Overall, the longer-term nature and ‘quality growth’ focus of the investment adviser’s quantitative model positions the Portfolio more toward stable growth companies versus hyper-growth names like Amazon, which have strong prospects but lack the valuation support the investment adviser requires. |
| • | | IT holdings Cognizant Technology Solutions Corp. and Alliance Data Systems Corp. also hindered relative results. Cognizant underperformed earlier in 2016 due to concerns about slowing revenue growth as the labor-arbitrage business model reaches its limits, with investors wondering whether they will succeed in an attempted pivot to a software-platform consulting model. Toward the end of the reporting period, Cognizant lowered revenue guidance as health care and financial clients cut IT budgets. Shares came under additional pressure on the last day of the reporting period after the company self-disclosed possible violations of the U.S. Foreign Corrupt Practices Act and the resignation of its President, who was popular with Wall Street. Alliance Data reported an in-line fourth quarter and reiterated 2016 guidance, but the stock sold off primarily on macro worries as the guidance included higher credit losses versus a year ago. |
| • | | On the positive side, NVIDIA Corp. was the top individual contributor within the Portfolio. The company delivered strong results through the period, consistently exceeding expectations as it transitions from PC and mobile components supplier to graphics platform provider. Overall, NVIDIA continues to benefit from increased sentiment around deep learning, virtual reality and autonomous driving, all segments in which the company has silicon technology leadership. |
| • | | Positions in Activision Blizzard Inc. and Tyson Foods Inc. also aided relative returns. Activision outperformed early in the reporting period after the announcement of the King Digital Entertainment acquisition, which provides strong earnings and cash flow accretion. Shares further benefited as investors reacted positively to revenue and earnings upside and an upgraded outlook for fiscal year 2016. User metrics are positive and Activision management continues to pivot the company from one-time game purchase revenues to many digital transactions from a highly-engaged user base. Tyson significantly beat earnings expectations, with strong performance in all segments. Investors had been concerned about the cyclicality of its chicken business, but the company’s margins proved far stronger than expected, leading to a significant re-rating of the shares. |
Describe recent portfolio activity.
| • | | Due to a combination of portfolio trading activity and market movement during the 12-month period, the Portfolio’s weightings in the materials and health care sectors increased, particularly within containers & packaging and biotechnology, respectively. The Portfolio’s weightings in industrials and financials decreased. |
Describe portfolio positioning at period end.
| • | | Relative to the Russell 1000® Growth Index, the Portfolio ended the period with its largest sector overweight in health care, followed by financials and IT. Industrials was the most significant underweight, followed by real estate. |
The views expressed reflect the opinions of BlackRock as of the date of this report and are subject to change based on changes in market, economic or other conditions. These views are not intended to be a forecast of future events and are no guarantee of future results.
| | | | | | |
| 6 | | BLACKROCK LARGE CAP SERIES FUNDS, INC. | | SEPTEMBER 30, 2016 | | |
| | |
| | | BlackRock Large Cap Growth Fund |
|
| Total Return Based on a $10,000 Investment |
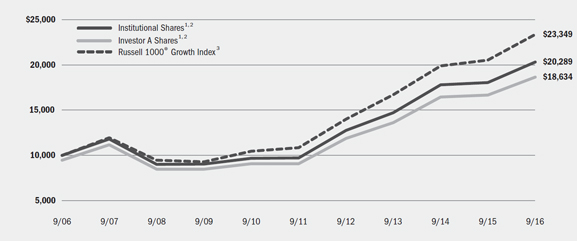
| | 1 | Assuming maximum sales charges, if any, transaction costs and other operating expenses, including administration fees, if any. Institutional Shares do not have a sales charge. |
| | 2 | The Fund invests all of its assets in the Portfolio, a series of Master Large Cap Series LLC. The Portfolio invests at least 80% of its assets in equity securities, primarily common stock, of large cap companies located in the United States that the investment adviser selects from among those that are, at the time of purchase, included in the Russell 1000® Growth Index. |
| | 3 | An unmanaged index that measures the performance of the large cap growth segment of the U.S. equity universe and consists of those Russell 1000® securities with higher price-to-book ratios and higher forecasted growth values. |
|
| Performance Summary for the Period Ended September 30, 2016 |
| | | | | | | | | | | | | | | | | | | | | | | | | | | | | | | | | | | |
| | | | | Average Annual Total Returns4 |
| | | | | 1 Year | | 5 Years | | 10 Years |
| | | 6-Month
Total Returns | | w/o sales
charge | | w/ sales
charge | | w/o sales
charge | | w/ sales
charge | | w/o sales
charge | | w/ sales
charge |
Institutional | | | | 3.75 | % | | | | 12.44 | % | | | | N/A | | | | | 15.87 | % | | | | N/A | | | | | 7.33 | % | | | | N/A | |
Service | | | | 3.62 | | | | | 12.08 | | | | | N/A | | | | | 15.51 | | | | | N/A | | | | | 7.05 | | | | | N/A | |
Investor A | | | | 3.55 | | | | | 12.00 | | | | | 6.12 | % | | | | 15.51 | | | | | 14.27 | % | | | | 7.00 | | | | | 6.42 | % |
Investor B | | | | 3.20 | | | | | 11.32 | | | | | 6.82 | | | | | 14.57 | | | | | 14.34 | | | | | 6.31 | | | | | 6.31 | |
Investor C | | | | 3.15 | | | | | 11.16 | | | | | 10.16 | | | | | 14.62 | | | | | 14.62 | | | | | 6.16 | | | | | 6.16 | |
Class R | | | | 3.45 | | | | | 11.73 | | | | | N/A | | | | | 15.20 | | | | | N/A | | | | | 6.68 | | | | | N/A | |
Russell 1000® Growth Index | | | | 5.22 | | | | | 13.76 | | | | | N/A | | | | | 16.60 | | | | | N/A | | | | | 8.85 | | | | | N/A | |
| | 4 | | Assuming maximum sales charges, if any. Average annual total returns with and without sales charges reflect reductions for distribution and service fees. See “About Fund Performance” on page 12 for a detailed description of share classes, including any related sales charges and fees. |
| | | | N/A—Not applicable as share class and index do not have a sales charge. |
| | | | Past performance is not indicative of future results. |
| | | | Performance results may include adjustments made for financial reporting purposes in accordance with U.S. generally accepted accounting principles. |
| | | | | | | | | | | | | | |
| | | Actual | | Hypothetical6 | | |
| | | Beginning
Account Value
April 1, 2016 | | Ending
Account Value
September 30, 2016 | | Expenses Paid
During the Period5 | | Beginning
Account Value
April 1, 2016 | | Ending
Account Value
September 30, 2016 | | Expenses Paid
During the Period5 | | Annualized
Expense Ratio |
Institutional | | $1,000.00 | | $1,037.50 | | $4.28 | | $1,000.00 | | $1,020.80 | | $4.24 | | 0.84% |
Service | | $1,000.00 | | $1,036.20 | | $5.75 | | $1,000.00 | | $1,019.35 | | $5.70 | | 1.13% |
Investor A | | $1,000.00 | | $1,035.50 | | $5.75 | | $1,000.00 | | $1,019.35 | | $5.70 | | 1.13% |
Investor B | | $1,000.00 | | $1,032.00 | | $9.80 | | $1,000.00 | | $1,015.35 | | $9.72 | | 1.93% |
Investor C | | $1,000.00 | | $1,031.50 | | $9.90 | | $1,000.00 | | $1,015.25 | | $9.82 | | 1.95% |
Class R | | $1,000.00 | | $1,034.50 | | $7.02 | | $1,000.00 | | $1,018.10 | | $6.96 | | 1.38% |
| | 5 | | For each class of the Fund, expenses are equal to the annualized expense ratio for the class, multiplied by the average account value over the period, multiplied by 183/366 (to reflect the one-half year period shown). Because the Fund invests all of its assets in the Portfolio, the expense table reflects the net expenses of both the Fund and the Portfolio in which it invests. |
| | 6 | | Hypothetical 5% annual return before expenses is calculated by prorating the number of days in the most recent fiscal half year divided by 366. |
| | | | See “Disclosure of Expenses” on page 12 for further information on how expenses were calculated. |
| | | | | | |
| | | BLACKROCK LARGE CAP SERIES FUNDS, INC. | | SEPTEMBER 30, 2016 | | 7 |
| | |
| Fund Summary as of September 30, 2016 | | BlackRock Large Cap Value Fund |
BlackRock Large Cap Value Fund’s (the “Fund”) investment objective is to seek long-term capital growth. In other words, the Fund tries to choose investments that will increase in value.
|
| Portfolio Management Commentary |
How did the Fund perform?
| • | | For the 12-month period ended September 30, 2016, the Fund, through its investment in Master Large Cap Value Portfolio (the “Portfolio”), underperformed its benchmark, the Russell 1000® Value Index. |
What factors influenced performance?
| • | | While the Portfolio had a solid finish to 2015, the first half of 2016 was challenged and this weakness weighed on its one-year results. Among the main drivers of the Portfolio’s underperformance in the first half of 2016 were two areas of high conviction for the investment adviser, namely an overweight to banks within financials and underweights to stability/bond proxies. |
| • | | The investment adviser is overweight U.S. banks on the belief that they were significantly under-earning relative to their normalized earnings power, pressured by a low-rate environment, increased regulatory headwinds, depressed capital markets activity and an inflated cost structure. U.S. banks substantially underperformed early in 2016 on speculation low commodity prices would weigh further on inflation expectations and credit expenses. Additionally, market volatility and uncertainty led to a sharp slowdown in capital markets activity, resulting in negatively revised expectations for bank earnings reports. U.S. banks experienced further weakness in June as the Brexit result exacerbated the concern around lower long-term rates and the perpetual Fed waiting game. The group recouped some of its losses in the third quarter of 2016 amid a modestly improved interest rate outlook, though it was not enough to offset the earlier-year underperformance. |
| • | | At the same time, in keeping with its disciplined quantitative and fundamental process, the investment adviser made the deliberate decision to resist the market’s structural grab for stability/bond proxy stocks such as utilities and telecommunication services, which boast relatively high dividend yields, but lack the fundamental or valuation support it requires. This long-standing underweight proved a considerable headwind for the Portfolio in the first half of 2016. The sectors significantly outperformed as investors sought refuge during the market tumult in the period, with a frenetic search for yield in the low/negative interest rate environment lending additional support. As with financials, the third quarter of 2016 saw a reversal, with the sectors giving back some of their earlier-year gains amid both a broader move away from traditional defensives and growing speculation of an impending rate hike. |
| • | | Beyond the abovementioned factors, the Portfolio had a few stock-specific disappointments in the annual period, including Western Digital Corp., CVS Health Corp. and Teva Pharmaceutical Industries Ltd. |
| • | | On the positive side, relative performance was supported by selection within the food products segment of consumer staples. Tyson Foods Inc. was the top contributor in the sector as the company significantly beat earnings expectations, with strong performance in all segments. Investors had been concerned about the cyclicality of its chicken business, but the company’s margins proved far stronger than expected, leading to a significant re-rating of the shares. |
| • | | Elsewhere, while the overall information technology (“IT”) sector detracted from Portfolio performance, holdings NVIDIA Corp. (top individual contributor) and Activision Blizzard Inc. added value. NVIDIA delivered strong results through the period, consistently exceeding expectations as it transitions from PC and mobile components supplier to graphics platform provider. Overall, the company continues to benefit from increased sentiment around deep learning, virtual reality and autonomous driving, all segments in which it has silicon technology leadership. Activision outperformed early in the reporting period after the announcement of the King Digital Entertainment acquisition, which provides strong earnings and cash flow accretion. Shares further benefited as investors reacted positively to revenue and earnings upside and an upgraded outlook for fiscal year 2016. User metrics are positive and Activision management continues to pivot the company from one-time game purchase revenues to many digital transactions from a highly-engaged user base. |
| • | | The Portfolio’s underweight in Wells Fargo & Co. also aided relative returns. |
Describe recent portfolio activity.
| • | | Due to a combination of portfolio trading activity and market movement during the 12-month period, the Portfolio’s weightings increased in the IT and energy sectors, with additions in materials as well. The biggest reduction was in the financials sector, largely with respect to insurance and banks. Industrials exposure also declined. |
Describe portfolio positioning at period end.
| • | | Relative to the Russell 1000® Value Index, the Portfolio ended the period with its largest sector overweights in consumer discretionary, IT and health care. The most significant underweights were real estate, utilities and industrials. |
The views expressed reflect the opinions of BlackRock as of the date of this report and are subject to change based on changes in market, economic or other conditions. These views are not intended to be a forecast of future events and are no guarantee of future results.
| | | | | | |
| 8 | | BLACKROCK LARGE CAP SERIES FUNDS, INC. | | SEPTEMBER 30, 2016 | | |
| | | | |
| | | | BlackRock Large Cap Value Fund | |
|
| Total Return Based on a $10,000 Investment |
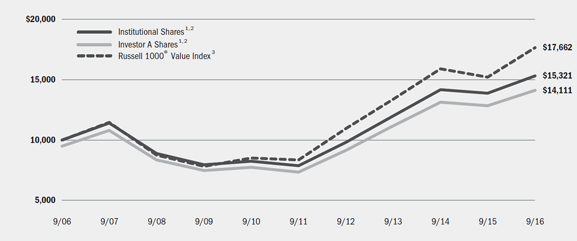
| | 1 | Assuming maximum sales charges, if any, transaction costs and other operating expenses, including administration fees, if any. Institutional Shares do not have a sales charge. |
| | 2 | The Fund invests all of its assets in the Portfolio, a series of Master Large Cap Series LLC. The Portfolio invests at least 80% of its assets in equity securities, primarily common stock, of large cap companies located in the United States that the investment adviser selects from among those that are, at the time of purchase, included in the Russell 1000® Value Index. |
| | 3 | An unmanaged index that is a subset of the Russell 1000® Index that consists of those Russell 1000® securities with lower price-to-book ratios and lower expected growth values. |
|
| Performance Summary for the Period Ended September 30, 2016 |
| | | | | | | | | | | | | | | | | | | | | | | | | | | | | | | | | | | |
| | | | | Average Annual Total Returns4 |
| | | | | 1 Year | | 5 Years | | 10 Years |
| | | 6-Month
Total Returns | | w/o sales
charge | | w/ sales
charge | | w/o sales
charge | | w/ sales
charge | | w/o sales
charge | | w/ sales
charge |
Institutional | | | | 5.93 | % | | | | 10.35 | % | | | | N/A | | | | | 14.30 | % | | | | N/A | | | | | 4.36 | % | | | | N/A | |
Service | | | | 5.74 | | | | | 10.03 | | | | | N/A | | | | | 13.95 | | | | | N/A | | | | | 4.10 | | | | | N/A | |
Investor A | | | | 5.77 | | | | | 10.01 | | | | | 4.23 | % | | | | 13.95 | | | | | 12.73 | % | | | | 4.06 | | | | | 3.50 | % |
Investor B | | | | 5.34 | | | | | 9.07 | | | | | 4.57 | | | | | 12.97 | | | | | 12.72 | | | | | 3.36 | | | | | 3.36 | |
Investor C | | | | 5.38 | | | | | 9.18 | | | | | 8.18 | | | | | 13.04 | | | | | 13.04 | | | | | 3.22 | | | | | 3.22 | |
Class R | | | | 5.61 | | | | | 9.74 | | | | | N/A | | | | | 13.63 | | | | | N/A | | | | | 3.75 | | | | | N/A | |
Russell 1000® Value Index | | | | 8.22 | | | | | 16.20 | | | | | N/A | | | | | 16.15 | | | | | N/A | | | | | 5.85 | | | | | N/A | |
| | 4 | | Assuming maximum sales charges, if any. Average annual total returns with and without sales charges reflect reductions for distribution and service fees. See “About Fund Performance” on page 12 for a detailed description of share classes, including any related sales charges and fees. |
| | | | N/A—Not applicable as share class and index do not have a sales charge. |
| | | | Past performance is not indicative of future results. |
| | | | Performance results may include adjustments made for financial reporting purposes in accordance with U.S. generally accepted accounting principles. |
| | | | | | | | | | | | | | |
| | | Actual | | Hypothetical6 | | |
| | | Beginning
Account Value
April 1, 2016 | | Ending
Account Value
September 30, 2016 | | Expenses Paid
During the Period5 | | Beginning
Account Value
April 1, 2016 | | Ending Account Value
September 30, 2016 | | Expenses Paid
During the Period5 | | Annualized
Expense Ratio |
Institutional | | $1,000.00 | | $1,059.30 | | $4.48 | | $1,000.00 | | $1,020.65 | | $4.39 | | 0.87% |
Service | | $1,000.00 | | $1,057.40 | | $6.07 | | $1,000.00 | | $1,019.10 | | $5.96 | | 1.18% |
Investor A | | $1,000.00 | | $1,057.70 | | $5.97 | | $1,000.00 | | $1,019.20 | | $5.86 | | 1.16% |
Investor B | | $1,000.00 | | $1,053.40 | | $9.91 | | $1,000.00 | | $1,015.35 | | $9.72 | | 1.93% |
Investor C | | $1,000.00 | | $1,053.80 | | $9.91 | | $1,000.00 | | $1,015.35 | | $9.72 | | 1.93% |
Class R | | $1,000.00 | | $1,056.10 | | $7.35 | | $1,000.00 | | $1,017.85 | | $7.21 | | 1.43% |
| | 5 | | For each class of the Fund, expenses are equal to the annualized expense ratio for the class, multiplied by the average account value over the period, multiplied by 183/366 (to reflect the one-half year period shown). Because the Fund invests all of its assets in the Portfolio, the expense table reflects the net expenses of both the Fund and the Portfolio in which it invests. |
| | 6 | | Hypothetical 5% annual return before expenses is calculated by prorating the number of days in the most recent fiscal half year divided by 366. |
| | | | See “Disclosure of Expenses” on page 12 for further information on how expenses were calculated. |
| | | | | | |
| | | BLACKROCK LARGE CAP SERIES FUNDS, INC. | | SEPTEMBER 30, 2016 | | 9 |
| | |
| Fund Summary as of September 30, 2016 | | BlackRock Large Cap Value Retirement Portfolio |
BlackRock Large Cap Value Retirement Portfolio’s (the “Fund”) investment objective is to seek long-term capital growth. In other words, the Fund tries to choose investments that will increase in value.
|
| Portfolio Management Commentary |
How did the Fund perform?
| • | | For the 12-month period ended September 30, 2016, the Fund, through its investment in Master Large Cap Value Portfolio (the “Portfolio”), underperformed its benchmark, the Russell 1000® Value Index. |
What factors influenced performance?
| • | | While the Portfolio had a solid finish to 2015, the first half of 2016 was challenged and this weakness weighed on its one-year results. Among the main drivers of the Portfolio’s underperformance in the first half of 2016 were two areas of high conviction for the investment adviser, namely an overweight to banks within financials and underweights to stability/bond proxies. |
| • | | The investment adviser is overweight U.S. banks on the belief that they were significantly under-earning relative to their normalized earnings power, pressured by a low-rate environment, increased regulatory headwinds, depressed capital markets activity and an inflated cost structure. U.S. banks substantially underperformed early in 2016 on speculation low commodity prices would weigh further on inflation expectations and credit expenses. Additionally, market volatility and uncertainty led to a sharp slowdown in capital markets activity, resulting in negatively revised expectations for bank earnings reports. U.S. banks experienced further weakness in June as the Brexit result exacerbated the concern around lower long-term rates and the perpetual Fed waiting game. The group recouped some of its losses in the third quarter of 2016 amid a modestly improved interest rate outlook, though it was not enough to offset the earlier-year underperformance. |
| • | | At the same time, in keeping with its disciplined quantitative and fundamental process, the investment adviser made the deliberate decision to resist the market’s structural grab for stability/bond proxy stocks such as utilities and telecommunication services, which boast relatively high dividend yields, but lack the fundamental or valuation support it requires. This long-standing underweight proved a considerable headwind for the Portfolio in the first half of 2016. The sectors significantly outperformed as investors sought refuge during the market tumult in the period, with a frenetic search for yield in the low/negative interest rate environment lending additional support. As with financials, the third quarter of 2016 saw a reversal, with the sectors giving back some of their earlier-year gains amid both a broader move away from traditional defensives and growing speculation of an impending rate hike. |
| • | | Beyond the abovementioned factors, the Portfolio had a few stock-specific disappointments in the annual period, including Western Digital Corp., CVS Health Corp. and Teva Pharmaceutical Industries Ltd. |
| • | | On the positive side, relative performance was supported by selection within the food products segment of consumer staples. Tyson Foods Inc. was the top contributor in the sector as the company significantly beat earnings expectations, with strong performance in all segments. Investors had been concerned about the cyclicality of its chicken business, but the company’s margins proved far stronger than expected, leading to a significant re-rating of the shares. |
| • | | Elsewhere, while the overall information technology (“IT”) sector detracted from Portfolio performance, holdings NVIDIA Corp. (top individual contributor) and Activision Blizzard Inc. added value. NVIDIA delivered strong results through the period, consistently exceeding expectations as it transitions from PC and mobile components supplier to graphics platform provider. Overall, the company continues to benefit from increased sentiment around deep learning, virtual reality and autonomous driving, all segments in which it has silicon technology leadership. Activision outperformed early in the reporting period after the announcement of the King Digital Entertainment acquisition, which provides strong earnings and cash flow accretion. Shares further benefited as investors reacted positively to revenue and earnings upside and an upgraded outlook for fiscal year 2016. User metrics are positive and Activision management continues to pivot the company from one-time game purchase revenues to many digital transactions from a highly-engaged user base. |
| • | | The Portfolio’s underweight in Wells Fargo & Co. also aided relative returns. |
Describe recent portfolio activity.
| • | | Due to a combination of portfolio trading activity and market movement during the 12-month period, the Portfolio’s weightings increased in the IT and energy sectors, with additions in materials as well. The biggest reduction was in the financials sector, largely with respect to insurance and banks. Industrials exposure also declined. |
Describe portfolio positioning at period end.
| • | | Relative to the Russell 1000® Value Index, the Portfolio ended the period with its largest sector overweights in consumer discretionary, IT and health care. The most significant underweights were real estate, utilities and industrials. |
The views expressed reflect the opinions of BlackRock as of the date of this report and are subject to change based on changes in market, economic or other conditions. These views are not intended to be a forecast of future events and are no guarantee of future results.
| | | | | | |
| 10 | | BLACKROCK LARGE CAP SERIES FUNDS, INC. | | SEPTEMBER 30, 2016 | | |
| | | | |
| | | | BlackRock Large Cap Value Retirement Portfolio | |
|
| Total Return Based on a $10,000 Investment |
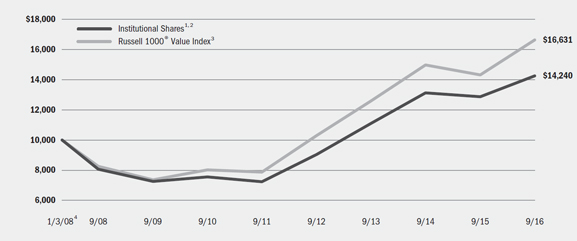
| | 1 | Assuming transaction costs and other operating expenses, including administration fees, if any. |
| | 2 | The Fund invests all of its assets in the Portfolio, a series of Master Large Cap Series LLC. The Portfolio invests at least 80% of its assets in equity securities, primarily common stock, of large cap companies located in the United States that the investment adviser selects from among those that are, at the time of purchase, included in the Russell 1000® Value Index. |
| | 3 | An unmanaged index that is a subset of the Russell 1000® Index that consists of those Russell 1000® securities with lower price-to-book ratios and lower expected growth values. |
| | 4 | Commencement of operations. |
|
| Performance Summary for the Period Ended September 30, 2016 |
| | | | | | | | | | | | | | |
| | | | | Average Annual Total Returns5 | |
| | | 6-Month
Total Returns | | 1 Year | | | 5 Years | | | Since
Inception6 | |
Institutional | | 6.02% | | | 10.62 | % | | | 14.56 | % | | | 4.13% | |
Russell 1000® Value Index | | 8.22 | | | 16.20 | | | | 16.15 | | | | 5.99 | |
| | 5 | | See “About Fund Performance” on page 12 for a detailed description of the share class, including any related sales charges and fees. |
| | 6 | | The Fund commenced operations on January 3, 2008. |
| | | | Past performance is not indicative of future results. |
| | | | Performance results may include adjustments made for financial reporting purposes in accordance with U.S. generally accepted accounting principles. |
| | | | | | | | | | | | | | |
| | | Actual | | Hypothetical8 | | |
| | | Beginning
Account Value
April 1, 2016 | | Ending
Account Value
September 30, 2016 | | Expenses Paid
During the Period7 | | Beginning
Account Value
April 1, 2016 | | Ending
Account Value
September 30, 2016 | | Expenses Paid
During the Period7 | | Annualized
Expense Ratio |
Institutional | | $1,000.00 | | $1,060.20 | | $3.19 | | $1,000.00 | | $1,021.90 | | $3.13 | | 0.62% |
| | 7 | | Expenses are equal to the Fund’s annualized expense ratio, multiplied by the average account value over the period, multiplied by 183/366 (to reflect the one-half year period shown). Because the Fund invests all of its assets in the Portfolio, the expense example reflects the net expenses of both the Fund and the Portfolio in which it invests. |
| | 8 | | Hypothetical 5% annual return before expenses is calculated by prorating the number of days in the most recent fiscal half year divided by 366. |
| | | | See “Disclosure of Expenses” on page 12 for further information on how expenses were calculated. |
| | | | | | |
| | | BLACKROCK LARGE CAP SERIES FUNDS, INC. | | SEPTEMBER 30, 2016 | | 11 |
| | | | |
| About Fund Performance | | | BlackRock Large Cap Series Funds, Inc. | |
| • | | Institutional Shares are not subject to any sales charge. These shares bear no ongoing distribution or service fees and are available only to certain eligible investors. |
| • | | Service Shares are not subject to any sales charge. These shares are subject to a service fee of 0.25% per year (but no distribution fee) and are available only to certain eligible investors. Service Share performance results for BlackRock Large Cap Growth Fund and BlackRock Large Cap Value Fund, prior to October 2, 2006, and for BlackRock Large Cap Core Fund, prior to September 24, 2007, are those of the applicable Fund’s Institutional Shares (which have no distribution or service fees) restated to reflect the Service Share fees. |
| • | | Investor A Shares are subject to a maximum initial sales charge (front-end load) of 5.25% and a service fee of 0.25% per year (but no distribution fee). Certain redemptions of these shares may be subject to a contingent deferred sales charge (“CDSC”) where no initial sales charge was paid at the time of purchase. These shares are generally available through financial intermediaries. |
| • | | Investor B Shares are subject to a maximum CDSC of 4.50%, declining to 0% after six years. In addition, these shares are subject to a distribution fee of 0.75% per year and a service fee of 0.25% per year. These shares automatically convert to Investor A Shares after approximately eight years. (There is no initial sales charge for automatic share conversions.) All returns for periods greater than eight years reflect this conversion. These shares are only available through exchanges and distribution reinvestments by current holders and for purchase by certain employer-sponsored retirement plans. |
| • | | Investor C Shares are subject to a 1.00% CDSC if redeemed within one year of purchase. In addition, these shares are subject to a distribution fee of 0.75% per year and a service fee of 0.25% per year. These shares are generally available through financial intermediaries. |
| • | | Class R Shares are not subject to any sales charge. These shares are subject to a distribution fee of 0.25% per year and a service fee of 0.25% per year. These shares are available only to certain employer-sponsored retirement plans. |
Performance information reflects past performance and does not guarantee future results. Current performance may be lower or higher than the performance data quoted. Refer to www.blackrock.com/funds to obtain performance data current to the most recent month end. Performance results do not reflect the deduction of taxes that a shareholder would pay on Fund distributions or the redemption of Fund shares. Figures shown in the performance tables on the previous pages assume reinvestment of all distributions, if any, at net asset value (“NAV”) on the ex-dividend date. Investment return and principal value of shares will fluctuate so that shares, when redeemed, may be worth more or less than their original cost. Distributions paid to each class of shares will vary because of the different levels of service, distribution and transfer agency fees applicable to each class, which are deducted from the income available to be paid to shareholders.
BlackRock Advisors, LLC (“the Administrator”), the Administrator of BlackRock Large Cap Core Fund, BlackRock Large Cap Growth Fund and BlackRock Large Cap Value Retirement Portfolio, has contractually and Large Cap Value Fund has voluntarily, agreed to waive and/or reimburse a portion of Funds’ expenses. Without such waiver and/or reimbursement, Funds’ performance would have been lower. The Administrator is under no obligation to continue waiving and/or reimbursing its fees after the applicable termination date of such agreement. See Note 4 of the Notes to Financial Statements for additional information on waivers and/or reimbursements.
Shareholders of these Funds may incur the following charges: (a) transactional expenses, such as sales charges and (b) operating expenses, including administration fees, service and distribution fees, including 12b-1 fees, and other fund expenses. The expense examples shown on previous pages (which are based on a hypothetical investment of $1,000 invested on April 1, 2016 and held through September 30, 2016) are intended to assist shareholders both in calculating expenses based on an investment in each Fund and in comparing these expenses with similar costs of investing in other mutual funds.
The expense examples on the previous pages provide information about actual account values and actual expenses. In order to estimate the expenses a shareholder paid during the period covered by this report, shareholders can divide their account value by $1,000 and then multiply the result by the number corresponding to their Fund and share class under the heading entitled “Expenses Paid During the Period.”
The expense examples also provide information about hypothetical account values and hypothetical expenses based the Fund’s actual expense ratio and an assumed rate of return of 5% per year before expenses. In order to assist shareholders in comparing the ongoing expenses of investing in these Funds and other funds, compare the 5% hypothetical example with the 5% hypothetical examples that appear in shareholder reports of other funds.
The expenses shown in the expense examples are intended to highlight shareholders’ ongoing costs only and do not reflect any transactional expenses, such as sales charges, if any. Therefore, the hypothetical examples are useful in comparing ongoing expenses only, and will not help shareholders determine the relative total expenses of owning different funds. If these transactional expenses were included, shareholder expenses would have been higher.
|
| Derivative Financial Instruments |
Master Large Cap Core Portfolio, Master Large Cap Growth Portfolio and Master Large Cap Value Portfolio (the “Portfolios”) may invest in various derivative financial instruments. These instruments are used to obtain exposure to a security, commodity, index, market and/or other asset without owning or taking physical custody of securities commodities and/or other referenced assets or to manage market, equity, credit, interest rate, foreign currency exchange rate, commodity and/or other risks. Derivative financial instruments may give rise to a form of economic leverage and involve risks, including the imperfect correlation between the value of a derivative financial instrument
and the underlying asset, possible default of the counterparty to the transaction or illiquidity of the instrument. The Portfolios’ successful use of a derivative financial instrument depends on the investment adviser’s ability to predict pertinent market movements accurately, which cannot be assured. The use of these instruments may result in losses greater than if they had not been used, may limit the amount of appreciation a Portfolio can realize on an investment and/or may result in lower distributions paid to shareholders. The Portfolios’ investments in these instruments are discussed in detail in the Notes to Financial Statements.
| | | | | | |
| 12 | | BLACKROCK LARGE CAP SERIES FUNDS, INC. | | SEPTEMBER 30, 2016 | | |
| | | | |
| Statements of Assets and Liabilities | | | BlackRock Large Cap Series Funds, Inc. | |
| | | | | | | | | | | | | | | | |
| September 30, 2016 | | BlackRock Large Cap Core Fund | | | BlackRock Large Cap Growth Fund | | | BlackRock Large Cap Value Fund | | | BlackRock Large Cap Value Retirement
Portfolio | |
| | | | | | | | | | | | | | | | |
| Assets | | | | | | | | | | | | | | | | |
Investments at value — from the applicable Portfolio1 | | $ | 1,565,555,845 | | | $ | 1,128,700,270 | | | $ | 635,241,354 | | | $ | 166,681,254 | |
Receivables: | | | | | | | | | | | | | | | | |
Capital shares sold | | | 812,701 | | | | 986,063 | | | | 142,054 | | | | 86,143 | |
From the Administrator | | | 147,852 | | | | 278,165 | | | | — | | | | — | |
Withdrawals from the Portfolio | | | 2,031,104 | | | | 1,199,919 | | | | 1,010,336 | | | | — | |
Prepaid expenses | | | 26,253 | | | | 25,627 | | | | 21,788 | | | | 10,887 | |
| | | | |
Total assets | | | 1,568,573,755 | | | | 1,131,190,044 | | | | 636,415,532 | | | | 166,778,284 | |
| | | | |
| | | | | | | | | | | | | | | | |
| Liabilities | | | | | | | | | | | | | | | | |
Payables: | | | | | | | | | | | | | | | | |
Administration fees | | | 321,583 | | | | 231,775 | | | | 104,427 | | | | — | |
Capital shares redeemed | | | 2,843,805 | | | | 2,185,982 | | | | 1,152,390 | | | | 19,441 | |
Contributions to the Portfolio | | | — | | | | — | | | | — | | | | 66,702 | |
Officer’s fees | | | 2,256 | | | | 1,418 | | | | 1,030 | | | | 204 | |
Other accrued expenses | | | 6,026 | | | | 5,957 | | | | 5,158 | | | | 3,984 | |
Other affiliates | | | 49,987 | | | | 67,618 | | | | 28,167 | | | | 202 | |
Printing fees | | | 40,317 | | | | 25,963 | | | | 17,249 | | | | 3,570 | |
Professional fees | | | 35,170 | | | | 34,101 | | | | 29,522 | | | | 24,795 | |
Service and distribution fees | | | 443,084 | | | | 268,653 | | | | 206,052 | | | | — | |
Transfer agent fees | | | 799,181 | | | | 307,363 | | | | 239,877 | | | | 37,112 | |
| | | | |
Total liabilities | | | 4,541,409 | | | | 3,128,830 | | | | 1,783,872 | | | | 156,010 | |
| | | | |
Net Assets | | $ | 1,564,032,346 | | | $ | 1,128,061,214 | | | $ | 634,631,660 | | | $ | 166,622,274 | |
| | | | |
| | | | | | | | | | | | | | | | |
| Net Assets Consist of | | | | | | | | | | | | | | | | |
Paid-in capital | | $ | 1,154,556,911 | | | $ | 802,355,460 | | | $ | 1,008,665,639 | | | $ | 137,641,992 | |
Undistributed (distribution in excess of) net investment income | | | 7,986,907 | | | | 3,159,599 | | | | 5,033,875 | | | | 1,790,499 | |
Accumulated net realized gain (loss) allocated from the Portfolio | | | 61,350,750 | | | | 62,511,871 | | | | (527,309,466 | ) | | | 15,855,113 | |
Net unrealized appreciation (depreciation) allocated from the Portfolio | | | 340,137,778 | | | | 260,034,284 | | | | 148,241,612 | | | | 11,334,670 | |
| | | | |
Net Assets | | $ | 1,564,032,346 | | | $ | 1,128,061,214 | | | $ | 634,631,660 | | | $ | 166,622,274 | |
| | | | |
| | | | | | | | | | | | | | | | |
1 Investments at cost | | $ | 1,225,418,067 | | | $ | 868,665,986 | | | $ | 486,999,742 | | | $ | 155,346,584 | |
See Notes to Financial Statements.
| | | | | | |
| | | BLACKROCK LARGE CAP SERIES FUNDS, INC. | | SEPTEMBER 30, 2016 | | 13 |
| | | | |
| Statements of Assets and Liabilities (concluded) | | | BlackRock Large Cap Series Funds, Inc. | |
| | | | | | | | | | | | | | | | |
| September 30, 2016 | | BlackRock Large Cap Core Fund | | | BlackRock Large Cap Growth Fund | | | BlackRock Large Cap Value Fund | | | BlackRock Large Cap Value Retirement
Portfolio | |
| | | | | | | | | | | | | | | | |
| Net Asset Value | | | | | | | | | | | | | | | | |
Institutional | | | | | | | | | | | | | | | | |
Net assets | | $ | 450,065,644 | | | $ | 375,317,834 | | | $ | 143,113,390 | | | $ | 166,622,274 | |
| | | | |
Shares outstanding, $ 0.10 par value2 | | | 24,308,546 | | | | 26,071,763 | | | | 6,072,114 | | | | 8,677,735 | |
| | | | |
Net asset value | | $ | 18.51 | | | $ | 14.40 | | | $ | 23.57 | | | $ | 19.20 | |
| | | | |
Service | | | | | | | | | | | | | | | | |
Net assets | | $ | 245,586 | | | $ | 1,713,229 | | | $ | 12,178,826 | | | | — | |
| | | | |
Shares outstanding, $ 0.10 par value3 | | | 13,392 | | | | 119,667 | | | | 520,939 | | | | — | |
| | | | |
Net asset value | | $ | 18.34 | | | $ | 14.32 | | | $ | 23.38 | | | | — | |
| | | | |
Investor A | | | | | | | | | | | | | | | | |
Net assets | | $ | 747,638,835 | | | $ | 549,049,803 | | | $ | 286,786,144 | | | | — | |
| | | | |
Shares outstanding, $ 0.10 par value4 | | | 41,445,605 | | | | 40,064,846 | | | | 12,419,341 | | | | — | |
| | | | |
Net asset value | | $ | 18.04 | | | $ | 13.70 | | | $ | 23.09 | | | | — | |
| | | | |
Investor B | | | | | | | | | | | | | | | | |
Net assets | | $ | 2,714,787 | | | $ | 573,308 | | | $ | 1,341,545 | | | | — | |
| | | | |
Shares outstanding, $ 0.10 par value5 | | | 164,952 | | | | 48,035 | | | | 62,330 | | | | — | |
| | | | |
Net asset value | | $ | 16.46 | | | $ | 11.94 | | | $ | 21.52 | | | | — | |
| | | | |
Investor C | | | | | | | | | | | | | | | | |
Net assets | | $ | 327,446,614 | | | $ | 177,792,170 | | | $ | 156,998,926 | | | | — | |
| | | | |
Shares outstanding, $ 0.10 par value6 | | | 20,186,226 | | | | 15,070,571 | | | | 7,349,934 | | | | — | |
| | | | |
Net asset value | | $ | 16.22 | | | $ | 11.80 | | | $ | 21.36 | | | | — | |
| | | | |
Class R | | | | | | | | | | | | | | | | |
Net assets | | $ | 35,920,880 | | | $ | 23,614,870 | | | $ | 34,212,829 | | | | — | |
| | | | |
Shares outstanding, $ 0.10 par value7 | | | 2,086,366 | | | | 1,831,519 | | | | 1,540,408 | | | | — | |
| | | | |
Net asset value | | $ | 17.22 | | | $ | 12.89 | | | $ | 22.21 | | | | — | |
| | | | |
2 Shares Authorized — Institutional | | | 400 million | | | | 100 million | | | | 400 million | | | | 200 million | |
3 Shares Authorized — Service | | | 50 million | | | | 50 million | | | | 50 million | | | | — | |
4 Shares Authorized — Investor A | | | 300 million | | | | 100 million | | | | 400 million | | | | — | |
5 Shares Authorized — Investor B | | | 200 million | | | | 200 million | | | | 200 million | | | | — | |
6 Shares Authorized — Investor C | | | 400 million | | | | 100 million | | | | 400 million | | | | — | |
7 Shares Authorized — Class R | | | 200 million | | | | 200 million | | | | 200 million | | | | — | |
See Notes to Financial Statements.
| | | | | | |
| 14 | | BLACKROCK LARGE CAP SERIES FUNDS, INC. | | SEPTEMBER 30, 2016 | | |
| | | | |
| Statements of Operations | | | BlackRock Large Cap Series Funds, Inc. | |
| | | | | | | | | | | | | | | | |
| Year Ended September 30, 2016 | | BlackRock Large Cap Core Fund | | | BlackRock Large Cap Growth Fund | | | BlackRock Large Cap Value Fund | | | BlackRock Large Cap Value Retirement
Portfolio | |
| | | | | | | | | | | | | | | | |
| Investment Income | | | | | | | | | | | | | | | | |
Net investment income allocated from the applicable Portfolio: | | | | | | | | | | | | | | | | |
Dividends — unaffiliated | | $ | 28,172,132 | | | $ | 16,269,024 | | | $ | 13,902,494 | | | $ | 3,348,384 | |
Dividends — affiliated | | | 106,955 | | | | 133,363 | | | | 33,678 | | | | 7,911 | |
Securities lending — affiliated — net | | | 17,691 | | | | 135,429 | | | | 18,666 | | | | 4,527 | |
Foreign taxes withheld | | | (213,918 | ) | | | (54,525 | ) | | | (111,403 | ) | | | (27,162 | ) |
Expenses | | | (8,013,837 | ) | | | (6,020,309 | ) | | | (3,627,067 | ) | | | (871,649 | ) |
Fees waived | | | 23,613 | | | | 28,215 | | | | 10,187 | | | | 2,375 | |
| | | | |
Total income | | | 20,092,636 | | | | 10,491,197 | | | | 10,226,555 | | | | 2,464,386 | |
| | | | |
| | | | | | | | | | | | | | | | |
| Fund Expenses | | | | | | | | | | | | | | | | |
Service and distribution — class specific | | | 5,572,712 | | | | 3,400,519 | | | | 2,657,273 | | | | — | |
Administration | | | 4,002,842 | | | | 2,823,185 | | | | 1,688,112 | | | | — | |
Transfer agent — class specific | | | 3,063,150 | | | | 2,038,430 | | | | 1,034,472 | | | | 144,532 | |
Registration | | | 115,188 | | | | 91,557 | | | | 69,751 | | | | 30,210 | |
Printing | | | 85,281 | | | | 46,046 | | | | 36,613 | | | | 12,392 | |
Professional | | | 38,279 | | | | 42,000 | | | | 29,297 | | | | 35,024 | |
Officer | | | 1,128 | | | | 709 | | | | 515 | | | | 102 | |
Miscellaneous | | | 15,977 | | | | 15,646 | | | | 15,308 | | | | 8,314 | |
| | | | |
Total expenses | | | 12,894,557 | | | | 8,458,092 | | | | 5,531,341 | | | | 230,574 | |
Less: | | | | | | | | | | | | | | | | |
Fees waived and/or reimbursed by the Administrator | | | — | | | | — | | | | (337,622 | ) | | | — | |
Transfer agent fees reimbursed — class specific | | | (788,563 | ) | | | (1,125,867 | ) | | | — | | | | (49,641 | ) |
| | | | |
Total expenses after fees waived and/or reimbursed | | | 12,105,994 | | | | 7,332,225 | | | | 5,193,719 | | | | 180,933 | |
| | | | |
Net investment income | | | 7,986,642 | | | | 3,158,972 | | | | 5,032,836 | | | | 2,283,453 | |
| | | | |
| | | | | | | | | | | | | | | | |
| Realized and Unrealized Gain (Loss) Allocated from the Applicable Portfolio | | | | | | | | | | | | | |
Net realized gain from capital distributions received from affiliated investment companies, futures contracts, investments and litigation proceeds | | | 76,648,915 | | | | 72,034,156 | | | | 47,187,364 | | | | 6,663,719 | |
Net change in unrealized appreciation (depreciation) on investments | | | 60,960,840 | | | | 51,443,757 | | | | 7,257,024 | | | | 7,448,185 | |
| | | | |
Total realized and unrealized gain | | | 137,609,755 | | | | 123,477,913 | | | | 54,444,388 | | | | 14,111,904 | |
| | | | |
Net Increase in Net Assets Resulting from Operations | | $ | 145,596,397 | | | $ | 126,636,885 | | | $ | 59,477,224 | | | $ | 16,395,357 | |
| | | | |
See Notes to Financial Statements.
| | | | | | |
| | | BLACKROCK LARGE CAP SERIES FUNDS, INC. | | SEPTEMBER 30, 2016 | | 15 |
| | | | |
| Statements of Changes in Net Assets | | | BlackRock Large Cap Series Funds, Inc. | |
| | | | | | | | | | | | | | | | |
| | | BlackRock
Large Cap Core Fund | | | BlackRock
Large Cap Growth Fund | |
| | | Year Ended September 30, | | | Year Ended September 30, | |
| Increase (Decrease) in Net Assets: | | 2016 | | | 2015 | | | 2016 | | | 2015 | |
| | | | | | | | | | | | | | | | |
| Operations | | | | | | | | | | | | | | | | |
Net investment income | | $ | 7,986,642 | | | $ | 5,797,684 | | | $ | 3,158,972 | | | $ | 1,743,837 | |
Net realized gain | | | 76,648,915 | | | | 106,732,791 | | | | 72,034,156 | | | | 59,523,289 | |
Net change in unrealized appreciation (depreciation) | | | 60,960,840 | | | | (134,894,776 | ) | | | 51,443,757 | | | | (46,726,026 | ) |
| | | | | | | | |
Net increase (decrease) in net assets resulting from operations | | | 145,596,397 | | | | (22,364,301 | ) | | | 126,636,885 | | | | 14,541,100 | |
| | | | | | | | |
| | | | | | | | | | | | | | | | |
| Distributions to Shareholders1 | | | | | | | | | | | | | | | | |
From net investment income: | | | | | | | | | | | | | | | | |
Institutional | | | (3,012,948 | ) | | | (2,772,492 | ) | | | (1,090,221 | ) | | | (970,748 | ) |
Service | | | (3,553 | ) | | | (3,118 | ) | | | — | | | | (1,738 | ) |
Investor A | | | (2,854,302 | ) | | | (2,750,357 | ) | | | (182,655 | ) | | | (372,889 | ) |
Investor C | | | — | | | | (24 | ) | | | — | | | | — | |
Class R | | | (36,755 | ) | | | — | | | | — | | | | — | |
From net realized gain: | | | | | | | | | | | | | | | | |
Institutional | | | (11,403,532 | ) | | | — | | | | (16,535,208 | ) | | | (44,583,980 | ) |
Service | | | (27,834 | ) | | | — | | | | (76,820 | ) | | | (221,822 | ) |
Investor A | | | (19,217,800 | ) | | | — | | | | (26,747,707 | ) | | | (63,450,782 | ) |
Investor B | | | (152,904 | ) | | | — | | | | (64,793 | ) | | | (339,605 | ) |
Investor C | | | (9,895,680 | ) | | | — | | | | (10,917,511 | ) | | | (25,959,863 | ) |
Class R | | | (998,533 | ) | | | — | | | | (1,158,508 | ) | | | (2,951,170 | ) |
| | | | | | | | |
Decrease in net assets resulting from distributions to shareholders | | | (47,603,841 | ) | | | (5,525,991 | ) | | | (56,773,423 | ) | | | (138,852,597 | ) |
| | | | | | | | |
| | | | | | | | | | | | | | | | |
| Capital Share Transactions | | | | | | | | | | | | | | | | |
Net increase (decrease) in net assets derived from capital share transactions | | | (142,644,212 | ) | | | (129,587,233 | ) | | | (24,446,904 | ) | | | 96,763,011 | |
| | | | | | | | |
| | | | | | | | | | | | | | | | |
| Net Assets | | | | | | | | | | | | | | | | |
Total increase (decrease) in net assets | | | (44,651,656 | ) | | | (157,477,525 | ) | | | 45,416,558 | | | | (27,548,486 | ) |
Beginning of year | | | 1,608,684,002 | | | | 1,766,161,527 | | | | 1,082,644,656 | | | | 1,110,193,142 | |
| | | | | | | | |
End of year | | $ | 1,564,032,346 | | | $ | 1,608,684,002 | | | $ | 1,128,061,214 | | | $ | 1,082,644,656 | |
| | | | | | | | |
Undistributed net investment income, end of year | | $ | 7,986,907 | | | $ | 5,907,454 | | | $ | 3,159,599 | | | $ | 1,810,482 | |
| | | | | | | | |
1 Distributions for annual periods determined in accordance with federal income tax regulations.
See Notes to Financial Statements.
| | | | | | |
| 16 | | BLACKROCK LARGE CAP SERIES FUNDS, INC. | | SEPTEMBER 30, 2016 | | |
| | | | |
| Statements of Changes in Net Assets (concluded) | | | BlackRock Large Cap Series Funds, Inc. | |
| | | | | | | | | | | | | | | | |
| | | BlackRock
Large Cap Value Fund | | | BlackRock
Large Cap Value Retirement Portfolio | |
| | | Year Ended September 30, | | | Year Ended September 30, | |
| Increase (Decrease) in Net Assets: | | 2016 | | | 2015 | | | 2016 | | | 2015 | |
| | | | | | | | | | | | | | | | |
| Operations | | | | | | | | | | | | | | | | |
Net investment income | | $ | 5,032,836 | | | $ | 4,294,937 | | | $ | 2,283,453 | | | $ | 2,000,748 | |
Net realized gain | | | 47,187,364 | | | | 63,381,294 | | | | 6,663,719 | | | | 9,220,682 | |
Net change in unrealized appreciation (depreciation) | | | 7,257,024 | | | | (80,328,628 | ) | | | 7,448,185 | | | | (13,808,045 | ) |
| | | | | | | | |
Net increase (decrease) in net assets resulting from operations | | | 59,477,224 | | | | (12,652,397 | ) | | | 16,395,357 | | | | (2,586,615 | ) |
| | | | | | | | |
| | | | | | | | | | | | | | | | |
| Distributions to Shareholders1 | | | | | | | | | | | | | | | | |
From net investment income: | | | | | | | | | | | | | | | | |
Institutional | | | (1,756,581 | ) | | | (2,056,551 | ) | | | (2,100,002 | ) | | | (1,916,633 | ) |
Service | | | (85,689 | ) | | | (108,934 | ) | | | — | | | | — | |
Investor A | | | (2,234,771 | ) | | | (2,671,957 | ) | | | — | | | | — | |
Investor C | | | (55,930 | ) | | | (143,899 | ) | | | — | | | | — | |
Class R | | | (161,972 | ) | | | (215,177 | ) | | | — | | | | — | |
From net realized gains: | | | | | | | | | | | | | | | | |
Institutional | | | — | | | | — | | | | (8,933,243 | ) | | | (16,604,930 | ) |
| | | | | | | | |
Decrease in net assets resulting from distributions to shareholders | | | (4,294,943 | ) | | | (5,196,518 | ) | | | (11,033,245 | ) | | | (18,521,563 | ) |
| | | | | | | | |
| | | | | | | | | | | | | | | | |
| Capital Share Transactions | | | | | | | | | | | | | | | | |
Net increase (decrease) in net assets derived from capital share transactions | | | (101,507,901 | ) | | | (106,811,342 | ) | | | 5,937,578 | | | | 16,565,845 | |
| | | | | | | | |
| | | | | | | | | | | | | | | | |
| Net Assets | | | | | | | | | | | | | | | | |
Total increase (decrease) in net assets | | | (46,325,620 | ) | | | (124,660,257 | ) | | | 11,299,690 | | | | (4,542,333 | ) |
Beginning of year | | | 680,957,280 | | | | 805,617,537 | | | | 155,322,584 | | | | 159,864,917 | |
| | | | | | | | |
End of year | | $ | 634,631,660 | | | $ | 680,957,280 | | | $ | 166,622,274 | | | $ | 155,322,584 | |
| | | | | | | | |
Undistributed net investment income, end of year | | $ | 5,033,875 | | | $ | 4,294,918 | | | $ | 1,790,499 | | | $ | 1,606,798 | |
| | | | | | | | |
1 Distributions for annual periods determined in accordance with federal income tax regulations.
See Notes to Financial Statements.
| | | | | | |
| | | BLACKROCK LARGE CAP SERIES FUNDS, INC. | | SEPTEMBER 30, 2016 | | 17 |
| | | | |
| Financial Highlights | | | BlackRock Large Cap Core Fund | |
| | | | | | | | | | | | | | | | | | | | |
| | | Institutional | |
| | | Year Ended September 30, | |
| | | 2016 | | | 2015 | | | 2014 | | | 2013 | | | 2012 | |
| | | | | | | | | | | | | | | | | | | | |
| Per Share Operating Performance | | | | | | | | | | | | | | | | | | | | |
Net asset value, beginning of year | | $ | 17.36 | | | $ | 17.68 | | | $ | 14.85 | | | $ | 12.64 | | | $ | 9.84 | |
| | | | |
Net investment income1 | | | 0.16 | | | | 0.13 | | | | 0.12 | | | | 0.12 | | | | 0.16 | |
Net realized and unrealized gain (loss) | | | 1.55 | | | | (0.35 | ) | | | 2.71 | | | | 2.36 | | | | 2.73 | |
| | | | |
Net increase (decrease) from investment operations | | | 1.71 | | | | (0.22 | ) | | | 2.83 | | | | 2.48 | | | | 2.89 | |
| | | | |
Distributions:2 | | | | | | | | | | | | | | | | | | | | |
From net investment income | | | (0.12 | ) | | | (0.10 | ) | | | — | | | | (0.27 | ) | | | (0.09 | ) |
From net realized gain | | | (0.44 | ) | | | — | | | | — | | | | — | | | | — | |
| | | | |
Total distributions | | | (0.56 | ) | | | (0.10 | ) | | | — | | | | (0.27 | ) | | | (0.09 | ) |
| | | | |
Net asset value, end of year | | $ | 18.51 | | | $ | 17.36 | | | $ | 17.68 | | | $ | 14.85 | | | $ | 12.64 | |
| | | | |
| | | | | | | | | | | | | | | | | | | | |
| Total Return3 | | | | | | | | | | | | | | | | | | | | |
Based on net asset value | | | 9.97 | %4 | | | (1.25 | )% | | | 19.06 | % | | | 20.00 | % | | | 29.55 | % |
| | | | |
| | | | | | | | | | | | | | | | | | | | |
| Ratios to Average Net Assets5 | | | | | | | | | | | | | | | | | | | | |
Total expenses | | | 0.88 | %6 | | | 0.87 | %6 | | | 0.88 | %6 | | | 0.88 | %6 | | | 0.77 | %6,7 |
| | | | |
Total expenses after fees waived and/or reimbursed | | | 0.87 | %6 | | | 0.87 | %6 | | | 0.87 | %6 | | | 0.88 | %6 | | | 0.77 | %6,7 |
| | | | |
Net investment income | | | 0.88 | %6 | | | 0.72 | %6 | | | 0.70 | %6 | | | 0.90 | %6 | | | 1.41 | %6,7 |
| | | | |
| | | | | | | | | | | | | | | | | | | | |
| Supplemental Data | | | | | | | | | | | | | | | | | | | | |
Net assets, end of year (000) | | $ | 450,066 | | | $ | 458,589 | | | $ | 503,035 | | | $ | 527,236 | | | $ | 513,245 | |
| | | | |
Portfolio turnover rate of the Portfolio | | | 39 | % | | | 41 | % | | | 40 | % | | | 50 | % | | | 128 | % |
| | | | |
| | 1 | | Based on average shares outstanding. |
| | 2 | | Distributions for annual periods determined in accordance with federal income tax regulations. |
| | 3 | | Where applicable, assumes the reinvestment of distributions. |
| | 4 | | Includes proceeds received from a settlement of litigation, which had no impact on the Fund’s total return. |
| | 5 | | Includes the Fund’s share of the Portfolio’s allocated expenses and/or net investment income. |
| | 6 | | Includes the Fund’s share of the Portfolio’s allocated fees waived of less than 0.01%. |
| | 7 | | Includes a non-recurring expense adjustment, which impacted the ratios for total expenses, total expenses after fees waived and/or reimbursed and net investment income. Excluding this adjustment, the ratios would have been 0.90%, 0.90% and 1.28%, respectively. |
See Notes to Financial Statements.
| | | | | | |
| 18 | | BLACKROCK LARGE CAP SERIES FUNDS, INC. | | SEPTEMBER 30, 2016 | | |
| | | | |
| Financial Highlights (continued) | | | BlackRock Large Cap Core Fund | |
| | | | | | | | | | | | | | | | | | | | |
| | | Service | |
| | | Year Ended September 30, | |
| | | 2016 | | | 2015 | | | 2014 | | | 2013 | | | 2012 | |
| | | | | | | | | | | | | | | | | | | | |
| Per Share Operating Performance | | | | | | | | | | | | | | | | | | | | |
Net asset value, beginning of year | | $ | 17.22 | | | $ | 17.55 | | | $ | 14.78 | | | $ | 12.39 | | | $ | 9.60 | |
| | | | |
Net investment income1 | | | 0.09 | | | | 0.07 | | | | 0.06 | | | | 0.07 | | | | 0.11 | |
Net realized and unrealized gain (loss) | | | 1.53 | | | | (0.35 | ) | | | 2.71 | | | | 2.33 | | | | 2.68 | |
| | | | |
Net increase (decrease) from investment operations | | | 1.62 | | | | (0.28 | ) | | | 2.77 | | | | 2.40 | | | | 2.79 | |
| | | | |
Distributions:2 | | | | | | | | | | | | | | | | | | | | |
From net investment income | | | (0.06 | ) | | | (0.05 | ) | | | — | | | | (0.01 | ) | | | — | |
From net realized gain | | | (0.44 | ) | | | — | | | | — | | | | — | | | | — | |
| | | | |
Total distributions | | | (0.50 | ) | | | (0.05 | ) | | | — | | | | (0.01 | ) | | | — | |
| | | | |
Net asset value, end of year | | $ | 18.34 | | | $ | 17.22 | | | $ | 17.55 | | | $ | 14.78 | | | $ | 12.39 | |
| | | | |
| | | | | | | | | | | | | | | | | | | | |
| Total Return3 | | | | | | | | | | | | | | | | | | | | |
Based on net asset value | | | 9.50 | %4 | | | (1.61 | )% | | | 18.74 | % | | | 19.42 | % | | | 29.06 | % |
| | | | |
| | | | | | | | | | | | | | | | | | | | |
| Ratios to Average Net Assets5 | | | | | | | | | | | | | | | | | | | | |
Total expenses | | | 1.23 | %6 | | | 1.21 | %6 | | | 1.20 | %6 | | | 1.20 | %6 | | | 1.05 | %6 |
| | | | |
Total expenses after fees waived and/or reimbursed | | | 1.23 | %6 | | | 1.21 | %6 | | | 1.20 | %6 | | | 1.20 | %6 | | | 1.05 | %6 |
| | | | |
Net investment income | | | 0.51 | %6 | | | 0.39 | %6 | | | 0.38 | %6 | | | 0.55 | %6 | | | 0.96 | %6 |
| | | | |
| | | | | | | | | | | | | | | | | | | | |
| Supplemental Data | | | | | | | | | | | | | | | | | | | | |
Net assets, end of year (000) | | $ | 246 | | | $ | 1,085 | | | $ | 1,096 | | | $ | 968 | | | $ | 1,578 | |
| | | | |
Portfolio turnover rate of the Portfolio | | | 39 | % | | | 41 | % | | | 40 | % | | | 50 | % | | | 128 | % |
| | | | |
| | 1 | | Based on average shares outstanding. |
| | 2 | | Distributions for annual periods determined in accordance with federal income tax regulations. |
| | 3 | | Where applicable, assumes the reinvestment of distributions. |
| | 4 | | Includes proceeds received from a settlement of litigation, which had no impact on the Fund’s total return. |
| | 5 | | Includes the Fund’s share of the Portfolio’s allocated expenses and/or net investment income. |
| | 6 | | Includes the Fund’s share of the Portfolio’s allocated fees waived of less than 0.01%. |
See Notes to Financial Statements.
| | | | | | |
| | | BLACKROCK LARGE CAP SERIES FUNDS, INC. | | SEPTEMBER 30, 2016 | | 19 |
| | | | |
| Financial Highlights (continued) | | | BlackRock Large Cap Core Fund | |
| | | | | | | | | | | | | | | | | | | | |
| | | Investor A | |
| | | Year Ended September 30, | |
| | | 2016 | | | 2015 | | | 2014 | | | 2013 | | | 2012 | |
| | | | | | | | | | | | | | | | | | | | |
| Per Share Operating Performance | | | | | | | | | | | | | | | | | | | | |
Net asset value, beginning of year | | $ | 16.93 | | | $ | 17.24 | | | $ | 14.52 | | | $ | 12.34 | | | $ | 9.61 | |
| | | | |
Net investment income1 | | | 0.11 | | | | 0.08 | | | | 0.07 | | | | 0.09 | | | | 0.12 | |
Net realized and unrealized gain (loss) | | | 1.51 | | | | (0.33 | ) | | | 2.65 | | | | 2.30 | | | | 2.65 | |
| | | | |
Net increase (decrease) from investment operations | | | 1.62 | | | | (0.25 | ) | | | 2.72 | | | | 2.39 | | | | 2.77 | |
| | | | |
Distributions:2 | | | | | | | | | | | | | | | | | | | | |
From net investment income | | | (0.07 | ) | | | (0.06 | ) | | | — | | | | (0.21 | ) | | | (0.04 | ) |
From net realized gain | | | (0.44 | ) | | | — | | | | — | | | | — | | | | — | |
| | | | |
Total distributions | | | (0.51 | ) | | | (0.06 | ) | | | — | | | | (0.21 | ) | | | (0.04 | ) |
| | | | |
Net asset value, end of year | | $ | 18.04 | | | $ | 16.93 | | | $ | 17.24 | | | $ | 14.52 | | | $ | 12.34 | |
| | | | |
| | | | | | | | | | | | | | | | | | | | |
| Total Return3 | | | | | | | | | | | | | | | | | | | | |
Based on net asset value | | | 9.67 | %4 | | | (1.47 | )% | | | 18.73 | % | | | 19.71 | % | | | 28.96 | % |
| | | | |
| | | | | | | | | | | | | | | | | | | | |
| Ratios to Average Net Assets5 | | | | | | | | | | | | | | | | | | | | |
Total expenses | | | 1.24 | %6 | | | 1.23 | %6 | | | 1.24 | %6 | | | 1.26 | %6 | | | 1.28 | %6 |
| | | | |
Total expenses after fees waived and/or reimbursed | | | 1.14 | %6 | | | 1.14 | %6 | | | 1.14 | %6 | | | 1.14 | %6 | | | 1.14 | %6 |
| | | | |
Net investment income | | | 0.62 | %6 | | | 0.45 | %6 | | | 0.44 | %6 | | | 0.65 | %6 | | | 1.04 | %6 |
| | | | |
| | | | | | | | | | | | | | | | | | | | |
| Supplemental Data | | | | | | | | | | | | | | | | | | | | |
Net assets, end of year (000) | | $ | 747,639 | | | $ | 750,260 | | | $ | 810,944 | | | $ | 732,669 | | | $ | 696,484 | |
| | | | |
Portfolio turnover rate of the Portfolio | | | 39 | % | | | 41 | % | | | 40 | % | | | 50 | % | | | 128 | % |
| | | | |
| | 1 | | Based on average shares outstanding. |
| | 2 | | Distributions for annual periods determined in accordance with federal income tax regulations. |
| | 3 | | Where applicable, excludes the effects of any sales charges and assumes the reinvestment of distributions. |
| | 4 | | Includes proceeds received from a settlement of litigation, which had no impact on the Fund’s total return. |
| | 5 | | Includes the Fund’s share of the Portfolio’s allocated expenses and/or net investment income. |
| | 6 | | Includes the Fund’s share of the Portfolio’s allocated fees waived of less than 0.01%. |
See Notes to Financial Statements.
| | | | | | |
| 20 | | BLACKROCK LARGE CAP SERIES FUNDS, INC. | | SEPTEMBER 30, 2016 | | |
| | | | |
| Financial Highlights (continued) | | | BlackRock Large Cap Core Fund | |
| | | | | | | | | | | | | | | | | | | | |
| | | Investor B | |
| | | Year Ended September 30, | |
| | | 2016 | | | 2015 | | | 2014 | | | 2013 | | | 2012 | |
| | | | | | | | | | | | | | | | | | | | |
| Per Share Operating Performance | | | | | | | | | | | | | | | | | | | | |
Net asset value, beginning of year | | $ | 15.55 | | | $ | 15.93 | | | $ | 13.52 | | | $ | 11.43 | | | $ | 8.93 | |
| | | | |
Net investment income (loss)1 | | | (0.04 | ) | | | (0.07 | ) | | | (0.06 | ) | | | (0.02 | ) | | | 0.03 | |
Net realized and unrealized gain (loss) | | | 1.39 | | | | (0.31 | ) | | | 2.47 | | | | 2.15 | | | | 2.47 | |
| | | | |
Net increase (decrease) from investment operations | | | 1.35 | | | | (0.38 | ) | | | 2.41 | | | | 2.13 | | | | 2.50 | |
| | | | |
Distributions:2 | | | | | | | | | | | | | | | | | | | | |
From net investment income | | | — | | | | — | | | | — | | | | (0.04 | ) | | | — | |
From net realized gain | | | (0.44 | ) | | | — | | | | — | | | | — | | | | — | |
| | | | |
Total dividends and distributions | | | (0.44 | ) | | | — | | | | — | | | | (0.04 | ) | | | — | |
| | | | |
Net asset value, end of year | | $ | 16.46 | | | $ | 15.55 | | | $ | 15.93 | | | $ | 13.52 | | | $ | 11.43 | |
| | | | |
| | | | | | | | | | | | | | | | | | | | |
| Total Return3 | | | | | | | | | | | | | | | | | | | | |
Based on net asset value | | | 8.78 | %4 | | | (2.39 | )% | | | 17.83 | % | | | 18.65 | % | | | 28.00 | % |
| | | | |
| | | | | | | | | | | | | | | | | | | | |
| Ratios to Average Net Assets5 | | | | | | | | | | | | | | | | | | | | |
Total expenses | | | 2.94 | %6 | | | 2.48 | %6 | | | 2.29 | %6 | | | 2.30 | %6 | | | 2.18 | %6 |
| | | | |
Total expenses after fees waived and/or reimbursed | | | 1.97 | %6 | | | 1.97 | %6 | | | 1.97 | %6 | | | 1.97 | %6 | | | 1.96 | %6 |
| | | | |
Net investment income (loss) | | | (0.24 | )%6 | | | (0.41 | )%6 | | | (0.39 | )%6 | | | (0.15 | )%6 | | | 0.24 | %6 |
| | | | |
| | | | | | | | | | | | | | | | | | | | |
| Supplemental Data | | | | | | | | | | | | | | | | | | | | |
Net assets, end of year (000) | | $ | 2,715 | | | $ | 5,946 | | | $ | 13,359 | | | $ | 21,835 | | | $ | 33,719 | |
| | | | |
Portfolio turnover rate of the Portfolio | | | 39 | % | | | 41 | % | | | 40 | % | | | 50 | % | | | 128 | % |
| | | | |
| | 1 | | Based on average shares outstanding. |
| | 2 | | Distributions for annual periods determined in accordance with federal income tax regulations. |
| | 3 | | Where applicable, excludes the effects of any sales charges and assumes the reinvestment of distributions. |
| | 4 | | Includes proceeds received from a settlement of litigation, which had no impact on the Fund’s total return. |
| | 5 | | Includes the Fund’s share of the Portfolio’s allocated expenses and/or net investment income. |
| | 6 | | Includes the Fund’s share of the Portfolio’s allocated fees waived of less than 0.01%. |
See Notes to Financial Statements.
| | | | | | |
| | | BLACKROCK LARGE CAP SERIES FUNDS, INC. | | SEPTEMBER 30, 2016 | | 21 |
| | | | |
| Financial Highlights (continued) | | | BlackRock Large Cap Core Fund | |
| | | | | | | | | | | | | | | | | | | | |
| | | Investor C | |
| | | Year Ended September 30, | |
| | | 2016 | | | 2015 | | | 2014 | | | 2013 | | | 2012 | |
| | | | | | | | | | | | | | | | | | | | |
| Per Share Operating Performance | | | | | | | | | | | | | | | | | | | | |
Net asset value, beginning of year | | $ | 15.33 | | | $ | 15.69 | | | $ | 13.32 | | | $ | 11.31 | | | $ | 8.85 | |
| | | | |
Net investment income (loss)1 | | | (0.04 | ) | | | (0.06 | ) | | | (0.06 | ) | | | (0.03 | ) | | | 0.02 | |
Net realized and unrealized gain (loss) | | | 1.37 | | | | (0.30 | ) | | | 2.43 | | | | 2.12 | | | | 2.44 | |
| | | | |
Net increase (decrease) from investment operations | | | 1.33 | | | | (0.36 | ) | | | 2.37 | | | | 2.09 | | | | 2.46 | |
| | | | |
Distributions:2 | | | | | | | | | | | | | | | | | | | | |
From net investment income | | | — | | | | (0.00 | )3 | | | — | | | | (0.08 | ) | | | — | |
From net realized gain | | | (0.44 | ) | | | — | | | | — | | | | — | | | | — | |
| | | | |
Total distributions | | | (0.44 | ) | | | — | | | | — | | | | (0.08 | ) | | | — | |
| | | | |
Net asset value, end of year | | $ | 16.22 | | | $ | 15.33 | | | $ | 15.69 | | | $ | 13.32 | | | $ | 11.31 | |
| | | | |
| | | | | | | | | | | | | | | | | | | | |
| Total Return4 | | | | | | | | | | | | | | | | | | | | |
Based on net asset value | | | 8.78 | %5 | | | (2.29 | )% | | | 17.79 | % | | | 18.62 | % | | | 27.80 | % |
| | | | |
| | | | | | | | | | | | | | | | | | | | |
| Ratios to Average Net Assets6 | | | | | | | | | | | | | | | | | | | | |
Total expenses | | | 1.99 | %7 | | | 1.96 | %7 | | | 1.97 | %7 | | | 2.01 | %7 | | | 1.97 | %7,8 |
| | | | |
Total expenses after fees waived and/or reimbursed | | | 1.98 | %7 | | | 1.96 | %7 | | | 1.97 | %7 | | | 2.01 | %7 | | | 1.97 | %7,8 |
| | | | |
Net investment income (loss) | | | (0.23 | )%7 | | | (0.37 | )%7 | | | (0.39 | )%7 | | | (0.22 | )%7 | | | 0.22 | %7,8 |
| | | | |
| | | | | | | | | | | | | | | | | | | | |
| Supplemental Data | | | | | | | | | | | | | | | | | | | | |
Net assets, end of year (000) | | $ | 327,447 | | | $ | 356,391 | | | $ | 394,765 | | | $ | 369,812 | | | $ | 363,613 | |
| | | | |
Portfolio turnover rate of the Portfolio | | | 39 | % | | | 41 | % | | | 40 | % | | | 50 | % | | | 128 | % |
| | | | |
| | 1 | | Based on average shares outstanding. |
| | 2 | | Distributions for annual periods determined in accordance with federal income tax regulations. |
| | 3 | | Amount is greater than $(0.005) per share. |
| | 4 | | Where applicable, excludes the effects of any sales charges and assumes the reinvestment of distributions. |
| | 5 | | Includes proceeds received from a settlement of litigation, which had no impact on the Fund’s total return. |
| | 6 | | Includes the Fund’s share of the Portfolio’s allocated expenses and/or net investment income. |
| | 7 | | Includes the Fund’s share of the Portfolio’s allocated fees waived of less than 0.01%. |
| | 8 | | Includes a non-recurring expense adjustment, which impacted the ratios for total expenses, total expenses after fees waived and/or reimbursed and net investment income. Excluding this adjustment, the ratios would have been 2.05%, 2.05% and 0.14%, respectively. |
See Notes to Financial Statements.
| | | | | | |
| 22 | | BLACKROCK LARGE CAP SERIES FUNDS, INC. | | SEPTEMBER 30, 2016 | | |
| | | | |
| Financial Highlights (concluded) | | | BlackRock Large Cap Core Fund | |
| | | | | | | | | | | | | | | | | | | | |
| | | Class R | |
| | | Year Ended September 30, | |
| | | 2016 | | | 2015 | | | 2014 | | | 2013 | | | 2012 | |
| | | | | | | | | | | | | | | | | | | | |
| Per Share Operating Performance | | | | | | | | | | | | | | | | | | | | |
Net asset value, beginning of year | | $ | 16.18 | | | $ | 16.47 | | | $ | 13.91 | | | $ | 11.81 | | | $ | 9.19 | |
| | | | |
Net investment income1 | | | 0.05 | | | | 0.03 | | | | 0.02 | | | | 0.04 | | | | 0.07 | |
Net realized and unrealized gain (loss) | | | 1.45 | | | | (0.32 | ) | | | 2.54 | | | | 2.21 | | | | 2.55 | |
| | | | |
Net increase (decrease) from investment operations | | | 1.50 | | | | (0.29 | ) | | | 2.56 | | | | 2.25 | | | | 2.62 | |
| | | | |
Distributions:2 | | | | | | | | | | | | | | | | | | | | |
From net investment income | | | (0.02 | ) | | | — | | | | — | | | | (0.15 | ) | | | — | |
From net realized gain | | | (0.44 | ) | | | — | | | | — | | | | — | | | | — | |
| | | | |
Total distributions | | | (0.46 | ) | | | — | | | | — | | | | (0.15 | ) | | | — | |
| | | | |
Net asset value, end of year | | $ | 17.22 | | | $ | 16.18 | | | $ | 16.47 | | | $ | 13.91 | | | $ | 11.81 | |
| | | | |
| | | | | | | | | | | | | | | | | | | | |
| Total Return3 | | | | | | | | | | | | | | | | | | | | |
Based on net asset value | | | 9.36 | %4 | | | (1.76 | )% | | | 18.40 | % | | | 19.26 | % | | | 28.51 | % |
| | | | |
| | | | | | | | | | | | | | | | | | | | |
| Ratios to Average Net Assets5 | | | | | | | | | | | | | | | | | | | | |
Total expenses | | | 1.45 | %6 | | | 1.44 | %6 | | | 1.43 | %6 | | | 1.48 | %6 | | | 1.53 | %6 |
| | | | |
Total expenses after fees waived and/or reimbursed | | | 1.44 | %6 | | | 1.43 | %6 | | | 1.43 | %6 | | | 1.48 | %6 | | | 1.53 | %6 |
| | | | |
Net investment income | | | 0.31 | %6 | | | 0.15 | %6 | | | 0.15 | %6 | | | 0.32 | %6 | | | 0.66 | %6 |
| | | | |
| | | | | | | | | | | | | | | | | | | | |
| Supplemental Data | | | | | | | | | | | | | | | | | | | | |
Net assets, end of year (000) | | $ | 35,921 | | | $ | 36,412 | | | $ | 42,962 | | | $ | 44,330 | | | $ | 48,790 | |
| | | | |
Portfolio turnover rate of the Portfolio | | | 39 | % | | | 41 | % | | | 40 | % | | | 50 | % | | | 128 | % |
| | | | |
| | 1 | | Based on average shares outstanding. |
| | 2 | | Distributions for annual periods determined in accordance with federal income tax regulations. |
| | 3 | | Where applicable, assumes the reinvestment of distributions. |
| | 4 | | Includes proceeds received from a settlement of litigation, which had no impact on the Fund’s total return. |
| | 5 | | Includes the Fund’s share of the Portfolio’s allocated expenses and/or net investment income. |
| | 6 | | Includes the Fund’s share of the Portfolio’s allocated fees waived of less than 0.01%. |
See Notes to Financial Statements.
| | | | | | |
| | | BLACKROCK LARGE CAP SERIES FUNDS, INC. | | SEPTEMBER 30, 2016 | | 23 |
| | | | |
| Financial Highlights | | | BlackRock Large Cap Growth Fund | |
| | | | | | | | | | | | | | | | | | | | |
| | | Institutional | |
| | | Year Ended September 30, | |
| | | 2016 | | | 2015 | | | 2014 | | | 2013 | | | 2012 | |
| | | | | | | | | | | | | | | | | | | | |
| Per Share Operating Performance | | | | | | | | | | | | | | | | | | | | |
Net asset value, beginning of year | | $ | 13.46 | | | $ | 15.02 | | | $ | 13.32 | | | $ | 12.50 | | | $ | 9.57 | |
| | | | |
Net investment income1 | | | 0.09 | | | | 0.07 | | | | 0.07 | | | | 0.10 | | | | 0.14 | |
Net realized and unrealized gain (loss) | | | 1.54 | | | | 0.17 | | | | 2.63 | | | | 1.65 | | | | 2.83 | |
| | | | |
Net increase from investment operations | | | 1.63 | | | | 0.24 | | | | 2.70 | | | | 1.75 | | | | 2.97 | |
| | | | |
Distributions:2 | | | | | | | | | | | | | | | | | | | | |
From net investment income | | | (0.04 | ) | | | (0.04 | ) | | | (0.02 | ) | | | (0.24 | ) | | | (0.04 | ) |
From net realized gain | | | (0.65 | ) | | | (1.76 | ) | | | (0.98 | ) | | | (0.69 | ) | | | — | |
| | | | |
Total distributions | | | (0.69 | ) | | | (1.80 | ) | | | (1.00 | ) | | | (0.93 | ) | | | (0.04 | ) |
| | | | |
Net asset value, end of year | | $ | 14.40 | | | $ | 13.46 | | | $ | 15.02 | | | $ | 13.32 | | | $ | 12.50 | |
| | | | |
| | | | | | | | | | | | | | | | | | | | |
| Total Return3 | | | | | | | | | | | | | | | | | | | | |
Based on net asset value | | | 12.44 | %4 | | | 1.35 | % | | | 21.16 | % | | | 15.33 | % | | | 31.16 | % |
| | | | |
| | | | | | | | | | | | | | | | | | | | |
| Ratios to Average Net Assets5 | | | | | | | | | | | | | | | | | | | | |
Total expenses | | | 0.95 | %6,7 | | | 0.93 | %7 | | | 0.94 | %7 | | | 0.96 | %7 | | | 0.97 | %7 |
| | | | |
Total expenses after fees waived and/or reimbursed | | | 0.84 | %6,7 | | | 0.89 | %7 | | | 0.94 | %7 | | | 0.96 | %7 | | | 0.97 | %7 |
| | | | |
Net Investment Income | | | 0.62 | %6,7 | | | 0.49 | %7 | | | 0.50 | %7 | | | 0.81 | %7 | | | 1.19 | %7 |
| | | | |
| | | | | | | | | | | | | | | | | | | | |
| Supplemental Data | | | | | | | | | | | | | | | | | | | | |
Net assets, end of year (000) | | $ | 375,318 | | | $ | 341,606 | | | $ | 369,854 | | | $ | 311,127 | | | $ | 267,083 | |
| | | | |
Portfolio turnover rate of the Portfolio | | | 32 | % | | | 41 | % | | | 49 | % | | | 54 | % | | | 132 | % |
| | | | |
| | 1 | | Based on average shares outstanding. |
| | 2 | | Distributions for annual periods determined in accordance with federal income tax regulations. |
| | 3 | | Where applicable, assumes the reinvestment of distributions. |
| | 4 | | Includes proceeds received from a settlement of litigation, which had no impact on the Fund’s total return. |
| | 5 | | Includes the Fund’s share of the Portfolio’s allocated expenses and/or net investment income. |
| | 6 | | Includes the Fund’s share of the Master Large Cap Growth allocated expenses and/or net investment income. Excludes expenses incurred indirectly as a result of the Master Large Cap Growth’s investments in underlying funds is 0.01%. |
| | 7 | | Includes the Fund’s share of the Portfolio’s allocated fees waived of less than 0.01%. |
See Notes to Financial Statements.
| | | | | | |
| 24 | | BLACKROCK LARGE CAP SERIES FUNDS, INC. | | SEPTEMBER 30, 2016 | | |
| | | | |
| Financial Highlights (continued) | | | BlackRock Large Cap Growth Fund | |
| | | | | | | | | | | | | | | | | | | | |
| | | Service | |
| | | Year Ended September 30, | |
| | | 2016 | | | 2015 | | | 2014 | | | 2013 | | | 2012 | |
| | | | | | | | | | | | | | | | | | | | |
| Per Share Operating Performance | | | | | | | | | | | | | | | | | | | | |
Net asset value, beginning of year | | $ | 13.39 | | | $ | 14.96 | | | $ | 13.18 | | | $ | 12.38 | | | $ | 9.48 | |
| | | | |
Net investment income1 | | | 0.05 | | | | 0.03 | | | | 0.03 | | | | 0.07 | | | | 0.09 | |
Net realized and unrealized gain (loss) | | | 1.53 | | | | 0.17 | | | | 2.60 | | | | 1.62 | | | | 2.82 | |
| | | | |
Net increase from investment operations | | | 1.58 | | | | 0.20 | | | | 2.63 | | | | 1.69 | | | | 2.91 | |
| | | | |
Distributions:2 | | | | | | | | | | | | | | | | | | | | |
From net investment income | | | — | | | | (0.01 | ) | | | — | | | | (0.20 | ) | | | (0.01 | ) |
From net realized gain | | | (0.65 | ) | | | (1.76 | ) | | | (0.85 | ) | | | (0.69 | ) | | | — | |
| | | | |
Total distributions | | | (0.65 | ) | | | (1.77 | ) | | | (0.85 | ) | | | (0.89 | ) | | | (0.01 | ) |
| | | | |
Net asset value, end of year | | $ | 14.32 | | | $ | 13.39 | | | $ | 14.96 | | | $ | 13.18 | | | $ | 12.38 | |
| | | | |
| | | | | | | | | | | | | | | | | | | | |
| Total Return3 | | | | | | | | | | | | | | | | | | | | |
Based on net asset value | | | 12.08 | %4 | | | 1.10 | % | | | 20.77 | % | | | 14.98 | % | | | 30.67 | % |
| | | | |
| | | | | | | | | | | | | | | | | | | | |
| Ratios to Average Net Assets5 | | | | | | | | | | | | | | | | | | | | |
Total expenses | | | 1.22 | %6,7 | | | 1.19 | %7 | | | 1.24 | %7 | | | 1.23 | %7 | | | 1.33 | %7 |
| | | | |
Total expenses after fees waived and/or reimbursed | | | 1.13 | %6,7 | | | 1.17 | %7 | | | 1.24 | %7 | | | 1.23 | %7 | | | 1.33 | %7 |
| | | | |
Net investment income | | | 0.33 | %6,7 | | | 0.20 | %7 | | | 0.19 | %7 | | | 0.62 | %7 | | | 0.81 | %7 |
| | | | |
| | | | | | | | | | | | | | | | | | | | |
| Supplemental Data | | | | | | | | | | | | | | | | | | | | |
Net assets, end of year (000) | | $ | 1,713 | | | $ | 1,577 | | | $ | 1,912 | | | $ | 1,624 | | | $ | 11,865 | |
| | | | |
Portfolio turnover rate of the Portfolio | | | 32 | % | | | 41 | % | | | 49 | % | | | 54 | % | | | 132 | % |
| | | | |
| | 1 | | Based on average shares outstanding. |
| | 2 | | Distributions for annual periods determined in accordance with federal income tax regulations. |
| | 3 | | Where applicable, assumes the reinvestment of distributions. |
| | 4 | | Includes proceeds received from a settlement of litigation, which had no impact on the Fund’s total return. |
| | 5 | | Includes the Fund’s share of the Portfolio’s allocated expenses and/or net investment income. |
| | 6 | | Includes the Fund’s share of the Master Large Cap Growth allocated expenses and/or net investment income. Excludes expenses incurred indirectly as a result of the Master Large Cap Growth’s investments in underlying funds is 0.01%. |
| | 7 | | Includes the Fund’s share of the Portfolio’s allocated fees waived of less than 0.01%. |
See Notes to Financial Statements.
| | | | | | |
| | | BLACKROCK LARGE CAP SERIES FUNDS, INC. | | SEPTEMBER 30, 2016 | | 25 |
| | | | |
| Financial Highlights (continued) | | | BlackRock Large Cap Growth Fund | |
| | | | | | | | | | | | | | | | | | | | |
| | | Investor A | |
| | | Year Ended September 30, | |
| | | 2016 | | | 2015 | | | 2014 | | | 2013 | | | 2012 | |
| | | | | | | | | | | | | | | | | | | | |
| Per Share Operating Performance | | | | | | | | | | | | | | | | | | | | |
Net asset value, beginning of year | | $ | 12.85 | | | $ | 14.42 | | | $ | 12.82 | | | $ | 12.09 | | | $ | 9.26 | |
| | | | |
Net investment income1 | | | 0.04 | | | | 0.03 | | | | 0.03 | | | | 0.06 | | | | 0.10 | |
Net realized and unrealized gain (loss) | | | 1.46 | | | | 0.17 | | | | 2.52 | | | | 1.58 | | | | 2.75 | |
| | | | |
Net increase from investment operations | | | 1.50 | | | | 0.20 | | | | 2.55 | | | | 1.64 | | | | 2.85 | |
| | | | |
Distributions:2 | | | | | | | | | | | | | | | | | | | | |
From net investment income | | | (0.00 | )3 | | | (0.01 | ) | | | — | | | | (0.22 | ) | | | (0.02 | ) |
From net realized gain | | | (0.65 | ) | | | (1.76 | ) | | | (0.95 | ) | | | (0.69 | ) | | | — | |
| | | | |
Total distributions | | | (0.65 | ) | | | (1.77 | ) | | | (0.95 | ) | | | (0.91 | ) | | | (0.02 | ) |
| | | | |
Net asset value, end of year | | $ | 13.70 | | | $ | 12.85 | | | $ | 14.42 | | | $ | 12.82 | | | $ | 12.09 | |
| | | | |
| | | | | | | | | | | | | | | | | | | | |
| Total Return4 | | | | | | | | | | | | | | | | | | | | |
Based on net asset value | | | 12.00 | %5 | | | 1.11 | % | | | 20.82 | % | | | 14.90 | % | | | 30.78 | % |
| | | | |
| | | | | | | | | | | | | | | | | | | | |
| Ratios to Average Net Assets6 | | | | | | | | | | | | | | | | | | | | |
Total expenses | | | 1.24 | %7,8 | | | 1.23 | %8 | | | 1.23 | %8 | | | 1.25 | %8 | | | 1.26 | %8 |
| | | | |
Total expenses after fees waived and/or reimbursed | | | 1.13 | %7,8 | | | 1.19 | %8 | | | 1.23 | %8 | | | 1.25 | %8 | | | 1.26 | %8 |
| | | | |
Net investment income | | | 0.33 | %7,8 | | | 0.19 | %8 | | | 0.20 | %8 | | | 0.54 | %8 | | | 0.90 | %8 |
| | | | |
| | | | | | | | | | | | | | | | | | | | |
| Supplemental Data | | | | | | | | | | | | | | | | | | | | |
Net assets, end of year (000) | | $ | 549,050 | | | $ | 524,114 | | | $ | 518,858 | | | $ | 449,729 | | | $ | 405,154 | |
| | | | |
Portfolio turnover rate of the Portfolio | | | 32 | % | | | 41 | % | | | 49 | % | | | 54 | % | | | 132 | % |
| | | | |
| | 1 | | Based on average shares outstanding. |
| | 2 | | Distributions for annual periods determined in accordance with federal income tax regulations. |
| | 3 | | Amount is greater than $(0.005) per share. |
| | 4 | | Where applicable, excludes the effects of any sales charges and assumes the reinvestment of distributions. |
| | 5 | | Includes proceeds received from a settlement of litigation, which had no impact on the Fund’s total return. |
| | 6 | | Includes the Fund’s share of the Portfolio’s allocated expenses and/or net investment income. |
| | 7 | | Includes the Fund’s share of the Master Large Cap Growth allocated expenses and/or net investment income. Excludes expenses incurred indirectly as a result of the Master Large Cap Growth’s investments in underlying funds is 0.01%. |
| | 8 | | Includes the Fund’s share of the Portfolio’s allocated fees waived of less than 0.01%. |
See Notes to Financial Statements.
| | | | | | |
| 26 | | BLACKROCK LARGE CAP SERIES FUNDS, INC. | | SEPTEMBER 30, 2016 | | |
| | | | |
| Financial Highlights (continued) | | | BlackRock Large Cap Growth Fund | |
| | | | | | | | | | | | | | | | | | | | |
| | | Investor B | |
| | | Year Ended September 30, | |
| | | 2016 | | | 2015 | | | 2014 | | | 2013 | | | 2012 | |
| | | | | | | | | | | | | | | | | | | | |
| Per Share Operating Performance | | | | | | | | | | | | | | | | | | | | |
Net asset value, beginning of year | | $ | 11.34 | | | $ | 12.94 | | | $ | 11.56 | | | $ | 10.96 | | | $ | 8.45 | |
| | | | |
Net investment loss1 | | | (0.06 | ) | | | (0.08 | ) | | | (0.07 | ) | | | (0.03 | ) | | | (0.00 | )2 |
Net realized and unrealized gain (loss) | | | 1.31 | | | | 0.15 | | | | 2.27 | | | | 1.42 | | | | 2.51 | |
| | | | |
Net increase from investment operations | | | 1.25 | | | | 0.07 | | | | 2.20 | | | | 1.39 | | | | 2.51 | |
| | | | |
Distributions:3 | | | | | | | | | | | | | | | | | | | | |
From net investment income | | | — | | | | — | | | | — | | | | (0.10 | ) | | | — | |
From net realized gain | | | (0.65 | ) | | | (1.67 | ) | | | (0.82 | ) | | | (0.69 | ) | | | — | |
| | | | |
Total distributions | | | (0.65 | ) | | | (1.67 | ) | | | (0.82 | ) | | | (0.79 | ) | | | — | |
| | | | |
Net asset value, end of year | | $ | 11.94 | | | $ | 11.34 | | | $ | 12.94 | | | $ | 11.56 | | | $ | 10.96 | |
| | | | |
| | | | | | | | | | | | | | | | | | | | |
| Total Return4 | | | | | | | | | | | | | | | | | | | | |
Based on net asset value | | | 11.32 | %5 | | | 0.14 | % | | | 19.87 | % | | | 13.92 | % | | | 29.70 | % |
| | | | |
| | | | | | | | | | | | | | | | | | | | |
| Ratios to Average Net Assets6 | | | | | | | | | | | | | | | | | | | | |
Total expenses | | | 2.20 | %7,8 | | | 2.05 | %8 | | | 2.04 | %8 | | | 2.14 | %8 | | | 2.13 | %8 |
| | | | |
Total expenses after fees waived and/or reimbursed | | | 1.94 | %7,8 | | | 2.02 | %8 | | | 2.03 | %8 | | | 2.14 | %8 | | | 2.13 | %8 |
| | | | |
Net investment loss | | | (0.50 | )%7,8 | | | (0.68 | )%8 | | | (0.60 | )%8 | | | (0.30 | )%8 | | | (0.01 | )%8 |
| | | | |
| | | | | | | | | | | | | | | | | | | | |
| Supplemental Data | | | | | | | | | | | | | | | | | | | | |
Net assets, end of year (000) | | $ | 573 | | | $ | 1,263 | | | $ | 2,771 | | | $ | 4,656 | | | $ | 7,826 | |
| | | | |
Portfolio turnover rate of the Portfolio | | | 32 | % | | | 41 | % | | | 49 | % | | | 54 | % | | | 132 | % |
| | | | |
| | 1 | | Based on average shares outstanding. |
| | 2 | | Amount is greater than $(0.005) per share. |
| | 3 | | Distributions for annual periods determined in accordance with federal income tax regulations. |
| | 4 | | Where applicable, excludes the effects of any sales charges and assumes the reinvestment of distributions. |
| | 5 | | Includes proceeds received from a settlement of litigation, which had no impact on the Fund’s total return. |
| | 6 | | Includes the Fund’s share of the Portfolio’s allocated expenses and/or net investment income. |
| | 7 | | Includes the Fund’s share of the Master Large Cap Growth allocated expenses and/or net investment income. Excludes expenses incurred indirectly as a result of the Master Large Cap Growth’s investments in underlying funds is 0.01%. |
| | 8 | | Includes the Fund’s share of the Portfolio’s allocated fees waived of less than 0.01%. |
See Notes to Financial Statements.
| | | | | | |
| | | BLACKROCK LARGE CAP SERIES FUNDS, INC. | | SEPTEMBER 30, 2016 | | 27 |
| | | | |
| Financial Highlights (continued) | | | BlackRock Large Cap Growth Fund | |
| | | | | | | | | | | | | | | | | | | | |
| | | Investor C | |
| | | Year Ended September 30, | |
| | | 2016 | | | 2015 | | | 2014 | | | 2013 | | | 2012 | |
| | | | | | | | | | | | | | | | | | | | |
| Per Share Operating Performance | | | | | | | | | | | | | | | | | | | | |
Net asset value, beginning of year | | $ | 11.23 | | | $ | 12.85 | | | $ | 11.52 | | | $ | 10.95 | | | $ | 8.44 | |
| | | | |
Net investment income (loss)1 | | | (0.06 | ) | | | (0.07 | ) | | | (0.07 | ) | | | (0.03 | ) | | | 0.01 | |
Net realized and unrealized gain (loss) | | | 1.28 | | | | 0.15 | | | | 2.27 | | | | 1.42 | | | | 2.50 | |
| | | | |
Net increase from investment operations | | | 1.22 | | | | 0.08 | | | | 2.20 | | | | 1.39 | | | | 2.51 | |
| | | | |
Distributions:2 | | | | | | | | | | | | | | | | | | | | |
From net investment income | | | — | | | | — | | | | — | | | | (0.13 | ) | | | — | |
From net realized gain | | | (0.65 | ) | | | (1.70 | ) | | | (0.87 | ) | | | (0.69 | ) | | | — | |
| | | | |
Total distributions | | | (0.65 | ) | | | (1.70 | ) | | | (0.87 | ) | | | (0.82 | ) | | | — | |
| | | | |
Net asset value, end of year | | $ | 11.80 | | | $ | 11.23 | | | $ | 12.85 | | | $ | 11.52 | | | $ | 10.95 | |
| | | | |
| | | | | | | | | | | | | | | | | | | | |
| Total Return3 | | | | | | | | | | | | | | | | | | | | |
Based on net asset value | | | 11.16 | %4 | | | 0.27 | % | | | 19.96 | % | | | 14.02 | % | | | 29.74 | % |
| | | | |
| | | | | | | | | | | | | | | | | | | | |
| Ratios to Average Net Assets5 | | | | | | | | | | | | | | | | | | | | |
Total expenses | | | 2.02 | %6,7 | | | 1.99 | %7 | | | 2.00 | %7 | | | 2.04 | %7 | | | 2.07 | %7 |
| | | | |
Total expenses after fees waived and/or reimbursed | | | 1.95 | %6,7 | | | 1.97 | %7 | | | 2.00 | %7 | | | 2.04 | %7 | | | 2.07 | %7 |
| | | | |
Net investment income (loss) | | | (0.49 | )%6,7 | | | (0.59 | )%7 | | | (0.57 | )%7 | | | (0.24 | )%7 | | | 0.09 | %7 |
| | | | |
| | | | | | | | | | | | | | | | | | | | |
| Supplemental Data | | | | | | | | | | | | | | | | | | | | |
Net assets, end of year (000) | | $ | 177,792 | | | $ | 192,804 | | | $ | 193,491 | | | $ | 171,430 | | | $ | 167,518 | |
| | | | |
Portfolio turnover rate of the Portfolio | | | 32 | % | | | 41 | % | | | 49 | % | | | 54 | % | | | 132 | % |
| | | | |
| | 1 | | Based on average shares outstanding. |
| | 2 | | Distributions for annual periods determined in accordance with federal income tax regulations. |
| | 3 | | Where applicable, excludes the effects of any sales charges and assumes the reinvestment of distributions. |
| | 4 | | Includes proceeds received from a settlement of litigation, which had no impact on the Fund’s total return. |
| | 5 | | Includes the Fund’s share of the Portfolio’s allocated expenses and/or net investment income. |
| | 6 | | Includes the Fund’s share of the Master Large Cap Growth allocated expenses and/or net investment income. Excludes expenses incurred indirectly as a result of the Master Large Cap Growth’s investments in underlying funds is 0.01%. |
| | 7 | | Includes the Fund’s share of the Portfolio’s allocated fees waived of less than 0.01%. |
See Notes to Financial Statements.
| | | | | | |
| 28 | | BLACKROCK LARGE CAP SERIES FUNDS, INC. | | SEPTEMBER 30, 2016 | | |
| | | | |
| Financial Highlights (concluded) | | | BlackRock Large Cap Growth Fund | |
| | | | | | | | | | | | | | | | | | | | |
| | | Class R | |
| | | Year Ended September 30, | |
| | | 2016 | | | 2015 | | | 2014 | | | 2013 | | | 2012 | |
| | | | | | | | | | | | | | | | | | | | |
| Per Share Operating Performance | | | | | | | | | | | | | | | | | | | | |
Net asset value, beginning of year | | $ | 12.15 | | | $ | 13.74 | | | $ | 12.25 | | | $ | 11.58 | | | $ | 8.88 | |
| | | | |
Net investment income (loss)1 | | | 0.01 | | | | (0.01 | ) | | | (0.01 | ) | | | 0.03 | | | | 0.06 | |
Net realized and unrealized gain (loss) | | | 1.38 | | | | 0.16 | | | | 2.41 | | | | 1.51 | | | | 2.64 | |
| | | | |
Net increase from investment operations | | | 1.39 | | | | 0.15 | | | | 2.40 | | | | 1.54 | | | | 2.70 | |
| | | | |
Distributions:2 | | | | | | | | | | | | | | | | | | | | |
From net investment income | | | — | | | | — | | | | — | | | | (0.18 | ) | | | — | |
From net realized gain | | | (0.65 | ) | | | (1.74 | ) | | | (0.91 | ) | | | (0.69 | ) | | | — | |
| | | | |
Total distributions | | | (0.65 | ) | | | (1.74 | ) | | | (0.91 | ) | | | (0.87 | ) | | | — | |
| | | | |
Net asset value, end of year | | $ | 12.89 | | | $ | 12.15 | | | $ | 13.74 | | | $ | 12.25 | | | $ | 11.58 | |
| | | | |
| | | | | | | | | | | | | | | | | | | | |
| Total Return3 | | | | | | | | | | | | | | | | | | | | |
Based on net asset value | | | 11.73 | %4 | | | 0.81 | % | | | 20.50 | % | | | 14.61 | % | | | 30.41 | % |
| | | | |
| | | | | | | | | | | | | | | | | | | | |
| Ratios to Average Net Assets5 | | | | | | | | | | | | | | | | | | | | |
Total expenses | | | 1.48 | %6,7 | | | 1.46 | %7 | | | 1.48 | %7 | | | 1.54 | %7 | | | 1.56 | %7 |
| | | | |
Total expenses after fees waived and/or reimbursed | | | 1.38 | %6,7 | | | 1.44 | %7 | | | 1.48 | %7 | | | 1.54 | %7 | | | 1.56 | %7 |
| | | | |
Net investment income (loss) | | | 0.08 | %6,7 | | | (0.06 | )%7 | | | (0.05 | )%7 | | | 0.27 | %7 | | | 0.57 | %7 |
| | | | |
| | | | | | | | | | | | | | | | | | | | |
| Supplemental Data | | | | | | | | | | | | | | | | | | | | |
Net assets, end of year (000) | | $ | 23,615 | | | $ | 21,279 | | | $ | 23,308 | | | $ | 24,408 | | | $ | 30,101 | |
| | | | |
Portfolio turnover rate of the Portfolio | | | 32 | % | | | 41 | % | | | 49 | % | | | 54 | % | | | 132 | % |
| | | | |
| | 1 | | Based on average shares outstanding. |
| | 2 | | Distributions for annual periods determined in accordance with federal income tax regulations. |
| | 3 | | Where applicable, assumes the reinvestment of distributions. |
| | 4 | | Includes proceeds received from a settlement of litigation, which had no impact on the Fund’s total return. |
| | 5 | | Includes the Fund’s share of the Portfolio’s allocated expenses and/or net investment income. |
| | 6 | | Includes the Fund’s share of the Master Large Cap Growth allocated expenses and/or net investment income. Excludes expenses incurred indirectly as a result of the Master Large Cap Growth’s investments in underlying funds is 0.01%. |
| | 7 | | Includes the Fund’s share of the Portfolio’s allocated fees waived of less than 0.01%. |
See Notes to Financial Statements.
| | | | | | |
| | | BLACKROCK LARGE CAP SERIES FUNDS, INC. | | SEPTEMBER 30, 2016 | | 29 |
| | | | |
| Financial Highlights | | | BlackRock Large Cap Value Fund | |
| | | | | | | | | | | | | | | | | | | | |
| | | Institutional | |
| | | Year Ended September 30, | |
| | | 2016 | | | 2015 | | | 2014 | | | 2013 | | | 2012 | |
| | | | | | | | | | | | | | | | | | | | |
| Per Share Operating Performance | | | | | | | | | | | | | | | | | | | | |
Net asset value, beginning of year | | $ | 21.58 | | | $ | 22.25 | | | $ | 18.85 | | | $ | 15.75 | | | $ | 12.74 | |
| | | | |
Net investment income1 | | | 0.26 | | | | 0.23 | | | | 0.22 | | | | 0.21 | | | | 0.20 | |
Net realized and unrealized gain (loss) | | | 1.96 | | | | (0.65 | ) | | | 3.18 | | | | 3.25 | | | | 2.94 | |
| | | | |
Net increase (decrease) from investment operations | | | 2.22 | | | | (0.42 | ) | | | 3.40 | | | | 3.46 | | | | 3.14 | |
| | | | |
Distributions from net investment income2 | | | (0.23 | ) | | | (0.25 | ) | | | — | | | | (0.36 | ) | | | (0.13 | ) |
| | | | |
Net asset value, end of year | | $ | 23.57 | | | $ | 21.58 | | | $ | 22.25 | | | $ | 18.85 | | | $ | 15.75 | |
| | | | |
| | | | | | | | | | | | | | | | | | | | |
| Total Return3 | | | | | | | | | | | | | | | | | | | | |
Based on net asset value | | | 10.35 | %4 | | | (1.94 | )% | | | 18.04 | % | | | 22.38 | % | | | 24.84 | % |
| | | | |
| | | | | | | | | | | | | | | | | | | | |
| Ratios to Average Net Assets5 | | | | | | | | | | | | | | | | | | | | |
Total expenses | | | 0.92 | %6 | | | 0.91 | %6 | | | 0.89 | %6 | | | 1.00 | %6 | | | 0.96 | % |
| | | | |
Total expenses after fees waived and/or reimbursed | | | 0.87 | %6 | | | 0.86 | %6 | | | 0.84 | %6 | | | 0.94 | %6 | | | 0.95 | % |
| | | | |
Net investment income | | | 1.18 | %6 | | | 1.01 | %6 | | | 1.07 | %6 | | | 1.19 | %6 | | | 1.33 | % |
| | | | |
| | | | | | | | | | | | | | | | | | | | |
| Supplemental Data | | | | | | | | | | | | | | | | | | | | |
Net assets, end of year (000) | | $ | 143,113 | | | $ | 162,376 | | | $ | 184,691 | | | $ | 190,423 | | | $ | 251,764 | |
| | | | |
Portfolio turnover rate of the Portfolio | | | 40 | % | | | 30 | % | | | 32 | % | | | 40 | % | | | 147 | % |
| | | | |
| | 1 | | Based on average shares outstanding. |
| | 2 | | Distributions for annual periods determined in accordance with federal income tax regulations. |
| | 3 | | Where applicable, assumes the reinvestment of distributions. |
| | 4 | | Includes payment received from a settlement of litigation, through its investment in the Master Large Cap Value Portfolio, which impacted the Fund’s total return. Excluding the payment from a settlement of litigation, the Fund’s total return is 10.25%. |
| | 5 | | Includes the Fund’s share of the Portfolio’s allocated expenses and/or net investment income. |
| | 6 | | Includes the Fund’s share of the Portfolio’s allocated fees waived of less than 0.01%. |
See Notes to Financial Statements.
| | | | | | |
| 30 | | BLACKROCK LARGE CAP SERIES FUNDS, INC. | | SEPTEMBER 30, 2016 | | |
| | | | |
| Financial Highlights (continued) | | | BlackRock Large Cap Value Fund | |
| | | | | | | | | | | | | | | | | | | | |
| | | Service | |
| | | Year Ended September 30, | |
| | | 2016 | | | 2015 | | | 2014 | | | 2013 | | | 2012 | |
| | | | | | | | | | | | | | | | | | | | |
| Per Share Operating Performance | | | | | | | | | | | | | | | | | | | | |
Net asset value, beginning of year | | $ | 21.40 | | | $ | 22.07 | | | $ | 18.75 | | | $ | 15.67 | | | $ | 12.71 | |
| | | | |
Net investment income1 | | | 0.19 | | | | 0.16 | | | | 0.16 | | | | 0.16 | | | | 0.15 | |
Net realized and unrealized gain (loss) | | | 1.95 | | | | (0.65 | ) | | | 3.16 | | | | 3.23 | | | | 2.94 | |
| | | | |
Net increase (decrease) from investment operations | | | 2.14 | | | | (0.49 | ) | | | 3.32 | | | | 3.39 | | | | 3.09 | |
| | | | |
Distributions from net investment income2 | | | (0.16 | ) | | | (0.18 | ) | | | — | | | | (0.31 | ) | | | (0.13 | ) |
| | | | |
Net asset value, end of year | | $ | 23.38 | | | $ | 21.40 | | | $ | 22.07 | | | $ | 18.75 | | | $ | 15.67 | |
| | | | |
| | | | | | | | | | | | | | | | | | | | |
| Total Return3 | | | | | | | | | | | | | | | | | | | | |
Based on net asset value | | | 10.03 | %4 | | | (2.27 | )% | | | 17.71 | % | | | 21.98 | % | | | 24.43 | % |
| | | | |
| | | | | | | | | | | | | | | | | | | | |
| Ratios to Average Net Assets5 | | | | | | | | | | | | | | | | | | | | |
Total expenses | | | 1.23 | %6 | | | 1.20 | %6 | | | 1.20 | %6 | | | 1.23 | %6 | | | 1.27 | % |
| | | | |
Total expenses after fees waived and/or reimbursed | | | 1.18 | %6 | | | 1.15 | %6 | | | 1.15 | %6 | | | 1.18 | %6 | | | 1.25 | % |
| | | | |
Net investment income | | | 0.87 | %6 | | | 0.72 | %6 | | | 0.76 | %6 | | | 0.93 | %6 | | | 0.99 | % |
| | | | |
| | | | | | | | | | | | | | | | | | | | |
| Supplemental Data | | | | | | | | | | | | | | | | | | | | |
Net assets, end of year (000) | | $ | 12,179 | | | $ | 11,931 | | | $ | 14,155 | | | $ | 13,296 | | | $ | 28,746 | |
| | | | |
Portfolio turnover rate of the Portfolio | | | 40 | % | | | 30 | % | | | 32 | % | | | 40 | % | | | 147 | % |
| | | | |
| | 1 | | Based on average shares outstanding. |
| | 2 | | Distributions for annual periods determined in accordance with federal income tax regulations. |
| | 3 | | Where applicable, assumes the reinvestment of distributions. |
| | 4 | | Includes payment received from a settlement of litigation, through its investment in the Master Large Cap Value Portfolio, which impacted the Fund’s total return. Excluding the payment from a settlement of litigation, the Fund’s total return is 9.93%. |
| | 5 | | Includes the Fund’s share of the Portfolio’s allocated expenses and/or net investment income. |
| | 6 | | Includes the Fund’s share of the Portfolio’s allocated fees waived of less than 0.01%. |
See Notes to Financial Statements.
| | | | | | |
| | | BLACKROCK LARGE CAP SERIES FUNDS, INC. | | SEPTEMBER 30, 2016 | | 31 |
| | | | |
| Financial Highlights (continued) | | | BlackRock Large Cap Value Fund | |
| | | | | | | | | | | | | | | | | | | | |
| | | Investor A | |
| | | Year Ended September 30, | |
| | | 2016 | | | 2015 | | | 2014 | | | 2013 | | | 2012 | |
| | | | | | | | | | | | | | | | | | | | |
| Per Share Operating Performance | | | | | | | | | | | | | | | | | | | | |
Net asset value, beginning of year | | $ | 21.14 | | | $ | 21.79 | | | $ | 18.52 | | | $ | 15.48 | | | $ | 12.53 | |
| | | | |
Net investment income1 | | | 0.19 | | | | 0.16 | | | | 0.15 | | | | 0.15 | | | | 0.14 | |
Net realized and unrealized gain (loss) | | | 1.92 | | | | (0.64 | ) | | | 3.12 | | | | 3.21 | | | | 2.90 | |
| | | | |
Net increase (decrease) from investment operations | | | 2.11 | | | | (0.48 | ) | | | 3.27 | | | | 3.36 | | | | 3.04 | |
| | | | |
Distributions from net investment income2 | | | (0.16 | ) | | | (0.17 | ) | | | — | | | | (0.32 | ) | | | (0.09 | ) |
| | | | |
Net asset value, end of year | | $ | 23.09 | | | $ | 21.14 | | | $ | 21.79 | | | $ | 18.52 | | | $ | 15.48 | |
| | | | |
| | | | | | | | | | | | | | | | | | | | |
| Total Return3 | | | | | | | | | | | | | | | | | | | | |
Based on net asset value | | | 10.01 | %4 | | | (2.23 | )% | | | 17.66 | % | | | 22.07 | % | | | 24.38 | % |
| | | | |
| | | | | | | | | | | | | | | | | | | | |
| Ratios to Average Net Assets5 | | | | | | | | | | | | | | | | | | | | |
Total expenses | | | 1.22 | %6 | | | 1.22 | %6 | | | 1.22 | %6 | | | 1.26 | %6 | | | 1.27 | % |
| | | | |
Total expenses after fees waived and/or reimbursed | | | 1.17 | %6 | | | 1.17 | %6 | | | 1.17 | %6 | | | 1.21 | %6 | | | 1.26 | % |
| | | | |
Net investment income | | | 0.88 | %6 | | | 0.69 | %6 | | | 0.74 | %6 | | | 0.91 | %6 | | | 0.99 | % |
| | | | |
| | | | | | | | | | | | | | | | | | | | |
| Supplemental Data | | | | | | | | | | | | | | | | | | | | |
Net assets, end of year (000) | | $ | 286,786 | | | $ | 297,653 | | | $ | 352,267 | | | $ | 353,445 | | | $ | 392,575 | |
| | | | |
Portfolio turnover rate of the Portfolio | | | 40 | % | | | 30 | % | | | 32 | % | | | 40 | % | | | 147 | % |
| | | | |
| | 1 | | Based on average shares outstanding. |
| | 2 | | Distributions for annual periods determined in accordance with federal income tax regulations. |
| | 3 | | Where applicable, excludes the effects of any sales charges and assumes the reinvestment of distributions. |
| | 4 | | Includes payment received from a settlement of litigation, through its investment in the Master Large Cap Value Portfolio, which impacted the Fund’s total return. Excluding the payment from a settlement of litigation, the Fund’s total return is 9.91%. |
| | 5 | | Includes the Fund’s share of the Portfolio’s allocated expenses and/or net investment income. |
| | 6 | | Includes the Fund’s share of the Portfolio’s allocated fees waived of less than 0.01%. |
See Notes to Financial Statements.
| | | | | | |
| 32 | | BLACKROCK LARGE CAP SERIES FUNDS, INC. | | SEPTEMBER 30, 2016 | | |
| | | | |
| Financial Highlights (continued) | | | BlackRock Large Cap Value Fund | |
| | | | | | | | | | | | | | | | | | | | |
| | | Investor B | |
| | | Year Ended September 30, | |
| | | 2016 | | | 2015 | | | 2014 | | | 2013 | | | 2012 | |
| | | | | | | | | | | | | | | | | | | | |
| Per Share Operating Performance | | | | | | | | | | | | | | | | | | | | |
Net asset value, beginning of year | | $ | 19.73 | | | $ | 20.36 | | | $ | 17.44 | | | $ | 14.52 | | | $ | 11.78 | |
| | | | |
Net investment income (loss)1 | | | (0.00 | )2 | | | (0.04 | ) | | | (0.01 | ) | | | 0.00 | 3 | | | 0.01 | |
Net realized and unrealized gain (loss) | | | 1.79 | | | | (0.59 | ) | | | 2.93 | | | | 3.03 | | | | 2.73 | |
| | | | |
Net increase (decrease) from investment operations | | | 1.79 | | | | (0.63 | ) | | | 2.92 | | | | 3.03 | | | | 2.74 | |
| | | | |
Distributions from net investment income4 | | | — | | | | — | | | | — | | | | (0.11 | ) | | | — | |
| | | | |
Net asset value, end of year | | $ | 21.52 | | | $ | 19.73 | | | $ | 20.36 | | | $ | 17.44 | | | $ | 14.52 | |
| | | | |
| | | | | | | | | | | | | | | | | | | | |
| Total Return5 | | | | | | | | | | | | | | | | | | | | |
Based on net asset value | | | 9.07 | %6 | | | (3.09 | )% | | | 16.74 | % | | | 20.98 | % | | | 23.26 | % |
| | | | |
| | | | | | | | | | | | | | | | | | | | |
| Ratios to Average Net Assets7 | | | | | | | | | | | | | | | | | | | | |
Total expenses | | | 2.11 | %8 | | | 2.06 | %8 | | | 2.01 | %8 | | | 2.20 | %8 | | | 2.21 | % |
| | | | |
Total expenses after fees waived and/or reimbursed | | | 2.06 | %8 | | | 2.01 | %8 | | | 1.96 | %8 | | | 2.15 | %8 | | | 2.20 | % |
| | | | |
Net investment income (loss) | | | (0.02 | )%8 | | | (0.17 | )%8 | | | (0.05 | )%8 | | | 0.00 | %8 | | | 0.07 | % |
| | | | |
| | | | | | | | | | | | | | | | | | | | |
| Supplemental Data | | | | | | | | | | | | | | | | | | | | |
Net assets, end of year (000) | | $ | 1,342 | | | $ | 2,603 | | | $ | 6,816 | | | $ | 9,377 | | | $ | 15,404 | |
| | | | |
Portfolio turnover rate of the Portfolio | | | 40 | % | | | 30 | % | | | 32 | % | | | 40 | % | | | 147 | % |
| | | | |
| | 1 | | Based on average shares outstanding. |
| | 2 | | Amount is greater than $(0.005) per share. |
| | 3 | | Amount is less than $0.005 per share. |
| | 4 | | Distributions for annual periods determined in accordance with federal income tax regulations. |
| | 5 | | Where applicable, excludes the effects of any sales charges and assumes the reinvestment of distributions. |
| | 6 | | Includes payment received from a settlement of litigation, through its investment in the Master Large Cap Value Portfolio, which impacted the Fund’s total return. Excluding the payment from a settlement of litigation, the Fund’s total return is 8.97%. |
| | 7 | | Includes the Fund’s share of the Portfolio’s allocated expenses and/or net investment income. |
| | 8 | | Includes the Fund’s share of the Portfolio’s allocated fees waived of less than 0.01%. |
See Notes to Financial Statements.
| | | | | | |
| | | BLACKROCK LARGE CAP SERIES FUNDS, INC. | | SEPTEMBER 30, 2016 | | 33 |
| | | | |
| Financial Highlights (continued) | | | BlackRock Large Cap Value Fund | |
| | | | | | | | | | | | | | | | | | | | |
| | | Investor C | |
| | | Year Ended September 30, | |
| | | 2016 | | | 2015 | | | 2014 | | | 2013 | | | 2012 | |
| | | | | | | | | | | | | | | | | | | | |
| Per Share Operating Performance | | | | | | | | | | | | | | | | | | | | |
Net asset value, beginning of year | | $ | 19.57 | | | $ | 20.19 | | | $ | 17.29 | | | $ | 14.45 | | | $ | 11.72 | |
| | | | |
Net investment income (loss)1 | | | 0.02 | | | | (0.01 | ) | | | (0.01 | ) | | | 0.02 | | | | 0.02 | |
Net realized and unrealized gain (loss) | | | 1.78 | | | | (0.60 | ) | | | 2.91 | | | | 2.99 | | | | 2.71 | |
| | | | |
Net increase (decrease) from investment operations | | | 1.80 | | | | (0.61 | ) | | | 2.90 | | | | 3.01 | | | | 2.73 | |
| | | | |
Distributions from net investment income2 | | | (0.01 | ) | | | (0.01 | ) | | | — | | | | (0.17 | ) | | | — | |
| | | | |
Net asset value, end of year | | $ | 21.36 | | | $ | 19.57 | | | $ | 20.19 | | | $ | 17.29 | | | $ | 14.45 | |
| | | | |
| | | | | | | | | | | | | | | | | | | | |
| Total Return3 | | | | | | | | | | | | | | | | | | | | |
Based on net asset value | | | 9.18 | %4 | | | (3.00 | )% | | | 16.77 | % | | | 21.06 | % | | | 23.29 | % |
| | | | |
| | | | | | | | | | | | | | | | | | | | |
| Ratios to Average Net Assets5 | | | | | | | | | | | | | | | | | | | | |
Total expenses | | | 1.98 | %6 | | | 1.98 | %6 | | | 2.01 | %6 | | | 2.07 | %6 | | | 2.12 | % |
| | | | |
Total expenses after fees waived and/or reimbursed | | | 1.93 | %6 | | | 1.93 | %6 | | | 1.95 | %6 | | | 2.02 | %6 | | | 2.11 | % |
| | | | |
Net investment income (loss) | | | 0.12 | %6 | | | (0.07 | )%6 | | | (0.05 | )%6 | | | 0.09 | %6 | | | 0.14 | % |
| | | | |
| | | | | | | | | | | | | | | | | | | | |
| Supplemental Data | | | | | | | | | | | | | | | | | | | | |
Net assets, end of year (000) | | $ | 156,999 | | | $ | 171,844 | | | $ | 204,312 | | | $ | 204,690 | | | $ | 210,681 | |
| | | | |
Portfolio turnover rate of the Portfolio | | | 40 | % | | | 30 | % | | | 32 | % | | | 40 | % | | | 147 | % |
| | | | |
| | 1 | | Based on average shares outstanding. |
| | 2 | | Distributions for annual periods determined in accordance with federal income tax regulations. |
| | 3 | | Where applicable, excludes the effects of any sales charges and assumes the reinvestment of distributions. |
| | 4 | | Includes payment received from a settlement of litigation, through its investment in the Master Large Cap Value Portfolio, which impacted the Fund’s total return. Excluding the payment from a settlement of litigation, the Fund’s total return is 9.08%. |
| | 5 | | Includes the Fund’s share of the Portfolio’s allocated expenses and/or net investment income. |
| | 6 | | Includes the Fund’s share of the Portfolio’s allocated fees waived of less than 0.01%. |
See Notes to Financial Statements.
| | | | | | |
| 34 | | BLACKROCK LARGE CAP SERIES FUNDS, INC. | | SEPTEMBER 30, 2016 | | |
| | | | |
| Financial Highlights (concluded) | | | BlackRock Large Cap Value Fund | |
| | | | | | | | | | | | | | | | | | | | |
| | | Class R | |
| | | Year Ended September 30, | |
| | | 2016 | | | 2015 | | | 2014 | | | 2013 | | | 2012 | |
| | | | | | | | | | | | | | | | | | | | |
| Per Share Operating Performance | | | | | | | | | | | | | | | | | | | | |
Net asset value, beginning of year | | $ | 20.33 | | | $ | 20.96 | | | $ | 17.86 | | | $ | 14.92 | | | $ | 12.08 | |
| | | | |
Net investment income1 | | | 0.13 | | | | 0.09 | | | | 0.09 | | | | 0.10 | | | | 0.09 | |
Net realized and unrealized gain (loss) | | | 1.84 | | | | (0.61 | ) | | | 3.01 | | | | 3.09 | | | | 2.80 | |
| | | | |
Net increase (decrease) from investment operations | | | 1.97 | | | | (0.52 | ) | | | 3.10 | | | | 3.19 | | | | 2.89 | |
| | | | |
Distributions from net investment income2 | | | (0.09 | ) | | | (0.11 | ) | | | — | | | | (0.25 | ) | | | (0.05 | ) |
| | | | |
Net asset value, end of year | | $ | 22.21 | | | $ | 20.33 | | | $ | 20.96 | | | $ | 17.86 | | | $ | 14.92 | |
| | | | |
| | | | | | | | | | | | | | | | | | | | |
| Total Return3 | | | | | | | | | | | | | | | | | | | | |
Based on net asset value | | | 9.74 | %4 | | | (2.52 | )% | | | 17.36 | % | | | 21.70 | % | | | 23.98 | % |
| | | | |
| | | | | | | | | | | | | | | | | | | | |
| Ratios to Average Net Assets5 | | | | | | | | | | | | | | | | | | | | |
Total expenses | | | 1.49 | %6 | | | 1.48 | %6 | | | 1.48 | %6 | | | 1.54 | %6 | | | 1.57 | % |
| | | | |
Total expenses after fees waived and/or reimbursed | | | 1.44 | %6 | | | 1.43 | %6 | | | 1.43 | %6 | | | 1.49 | %6 | | | 1.56 | % |
| | | | |
Net investment income | | | 0.61 | %6 | | | 0.43 | %6 | | | 0.48 | %6 | | | 0.63 | %6 | | | 0.70 | % |
| | | | |
| | | | | | | | | | | | | | | | | | | | |
| Supplemental Data | | | | | | | | | | | | | | | | | | | | |
Net assets, end of year (000) | | $ | 34,213 | | | $ | 34,551 | | | $ | 43,377 | | | $ | 49,267 | | | $ | 59,934 | |
| | | | |
Portfolio turnover rate of the Portfolio | | | 40 | % | | | 30 | % | | | 32 | % | | | 40 | % | | | 147 | % |
| | | | |
| | 1 | | Based on average shares outstanding. |
| | 2 | | Distributions for annual periods determined in accordance with federal income tax regulations. |
| | 3 | | Where applicable, assumes the reinvestment of distributions. |
| | 4 | | Includes payment received from a settlement of litigation, through its investment in the Master Large Cap Value Portfolio, which impacted the Fund’s total return. Excluding the payment from a settlement of litigation, the Fund’s total return is 9.64%. |
| | 5 | | Includes the Fund’s share of the Portfolio’s allocated expenses and/or net investment income. |
| | 6 | | Includes the Fund’s share of the Portfolio’s allocated fees waived of less than 0.01%. |
See Notes to Financial Statements.
| | | | | | |
| | | BLACKROCK LARGE CAP SERIES FUNDS, INC. | | SEPTEMBER 30, 2016 | | 35 |
| | | | |
| Financial Highlights | | | BlackRock Large Cap Value Retirement Portfolio | |
| | | | | | | | | | | | | | | | | | | | |
| | | Institutional | |
| | | Year Ended September 30, | |
| | | 2016 | | | 2015 | | | 2014 | | | 2013 | | | 2012 | |
| | | | | | | | | | | | | | | | | | | | |
| Per Share Operating Performance | | | | | | | | | | | | | | | | | | | | |
Net asset value, beginning of year | | $ | 18.63 | | | $ | 21.39 | | | $ | 19.12 | | | $ | 15.93 | | | $ | 12.91 | |
| | | | |
Net investment income1 | | | 0.26 | | | | 0.24 | | | | 0.25 | | | | 0.25 | | | | 0.24 | |
Net realized and unrealized gain (loss) | | | 1.63 | | | | (0.54 | ) | | | 3.12 | | | | 3.30 | | | | 2.99 | |
| | | | |
Net increase (decrease) from investment operations | | | 1.89 | | | | (0.30 | ) | | | 3.37 | | | | 3.55 | | | | 3.23 | |
| | | | |
Distributions:2 | | | | | | | | | | | | | | | | | | | | |
From net investment income | | | (0.25 | ) | | | (0.25 | ) | | | (0.14 | ) | | | (0.36 | ) | | | (0.21 | ) |
From net realized gain | | | (1.07 | ) | | | (2.21 | ) | | | (0.96 | ) | | | — | | | | — | |
| | | | |
Total distributions | | | (1.32 | ) | | | (2.46 | ) | | | (1.10 | ) | | | (0.36 | ) | | | (0.21 | ) |
| | | | |
Net asset value, end of year | | $ | 19.20 | | | $ | 18.63 | | | $ | 21.39 | | | $ | 19.12 | | | $ | 15.93 | |
| | | | |
| | | | | | | | | | | | | | | | | | | | |
| Total Return3 | | | | | | | | | | | | | | | | | | | | |
Based on net asset value | | | 10.62 | %4 | | | (1.80 | )% | | | 18.23 | % | | | 22.71 | % | | | 25.23 | % |
| | | | |
| | | | | | | | | | | | | | | | | | | | |
| Ratios to Average Net Assets5 | | | | | | | | | | | | | | | | | | | | |
Total expenses | | | 0.68 | %6 | | | 0.71 | %6 | | | 0.68 | %6 | | | 0.68 | %6 | | | 0.67 | % |
| | | | |
Total expenses after reimbursement | | | 0.65 | %6 | | | 0.67 | %6 | | | 0.67 | %6 | | | 0.67 | %6 | | | 0.62 | % |
| | | | |
Net investment income | | | 1.41 | %6 | | | 1.19 | %6 | | | 1.24 | %6 | | | 1.42 | %6 | | | 1.63 | % |
| | | | |
| | | | | | | | | | | | | | | | | | | | |
| Supplemental Data | | | | | | | | | | | | | | | | | | | | |
Net assets, end of year (000) | | $ | 166,622 | | | $ | 155,323 | | | $ | 159,865 | | | $ | 133,921 | | | $ | 103,636 | |
| | | | |
Portfolio turnover rate of the Portfolio | | | 40 | % | | | 30 | % | | | 32 | % | | | 40 | % | | | 147 | % |
| | | | |
| | 1 | | Based on average shares outstanding. |
| | 2 | | Distributions for annual periods determined in accordance with federal income tax regulations. |
| | 3 | | Where applicable, assumes the reinvestment of distributions. |
| | 4 | | Includes proceeds received from a settlement of litigation, which had no impact on the Fund’s total return. |
| | 5 | | Includes the Fund’s share of the Portfolio’s allocated expenses and/or net investment income. |
| | 6 | | Includes the Fund’s share of the Portfolio’s allocated fees waived of less than 0.01%. |
See Notes to Financial Statements.
| | | | | | |
| 36 | | BLACKROCK LARGE CAP SERIES FUNDS, INC. | | SEPTEMBER 30, 2016 | | |
| | | | |
| Notes to Financial Statements | | | BlackRock Large Cap Series Funds, Inc. | |
1. Organization:
BlackRock Large Cap Series Funds, Inc. (the “Corporation”) is registered under the Investment Company Act of 1940, as amended (the “1940 Act”), as an open-end management investment company. The Corporation is organized as a Maryland corporation. The following are referred to herein collectively referred to as the “Funds” or individually, a “Fund”:
| | | | |
| Fund Name | | Herein Referred To As | | Diversification Classification |
BlackRock Large Cap Core Fund | | Large Cap Core | | Diversified |
BlackRock Large Cap Growth Fund | | Large Cap Growth | | Diversified |
BlackRock Large Cap Value Fund | | Large Cap Value | | Diversified |
BlackRock Large Cap Value Retirement Portfolio | | Large Cap Value Retirement | | Diversified |
The Funds seek to achieve their investment objectives by investing all of their assets in the corresponding master portfolios (individually, a “Portfolio” or collectively, the “Portfolios”) of Master Large Cap Series LLC (the “Master LLC”), an affiliate of the Funds. Large Cap Core invests all of its assets in Master Large Cap Core Portfolio. Large Cap Growth invests all of its assets in Master Large Cap Growth Portfolio. Large Cap Value and Large Cap Value Retirement invest all of their assets in Master Large Cap Value Portfolio. Each Portfolio has the same investment objective and strategies as the corresponding Fund. The value of a Fund’s investment in the applicable Portfolio reflects the Fund’s proportionate interest in the net assets of such Portfolio. The performance of a Fund is directly affected by the performance of the applicable Portfolio. At September 30, 2016, the percentage of Master Large Cap Core Portfolio owned by Large Cap Core was 73.4%; the percentage of Master Large Cap Growth Portfolio owned by Large Cap Growth was 98.8%; and the percentages of Master Large Cap Value Portfolio owned by Large Cap Value and Large Cap Value Retirement were 79.2% and 20.8%; respectively. As such, the financial statements of the Portfolios, including the Schedules of Investments, are included elsewhere in this report and should be read in conjunction with the Funds’ financial statements.
Large Cap Core, Large Cap Growth and Large Cap Value each offer multiple classes of shares. Large Cap Value Retirement offers only Institutional Shares. Institutional and Service Shares are sold only to certain eligible investors. Investor B Shares are only available through exchanges and dividend reinvestments by existing shareholders and for purchase by certain employer-sponsored retirement plans. Class R Shares are sold only to certain employer-sponsored retirement plans. Investor A and Class C Shares are generally available through financial intermediaries. All classes of shares have identical voting, dividend, liquidation and other rights and the same terms and conditions. Service, Investor A, Investor B, Investor C and Class R Shares bear certain expenses related to shareholder servicing of such shares, and Investor B, Investor C and Class R Shares also bear certain expenses related to the distribution of such shares. Each class has exclusive voting rights with respect to matters relating to its shareholder servicing and distribution expenditures (except that Investor B shareholders may vote on material changes to the Investor A distribution plan).
| | | | | | |
| Share Class | | Initial Sales Charge | | CDSC | | Conversion Privilege |
Institutional, Service and Class R Shares | | No | | No | | None |
Investor A Shares | | Yes | | No1 | | None |
Investor B Shares | | No | | Yes | | To Investor A Shares after approximately 8 years |
Investor C Shares | | No | | Yes | | None |
| | 1 | | Investor A Shares may be subject to a contingent deferred sales charge (“CDSC”) for certain redemptions where no initial sales charge was paid at the time of purchase. |
The Funds, together with certain other registered investment companies advised by BlackRock Advisors, LLC (the “Administrator”) or its affiliates, are included in a complex of open-end funds referred to as the Equity-Liquidity Complex.
2. Significant Accounting Policies:
The financial statements are prepared in conformity with accounting principles generally accepted in the United States of America (“U.S. GAAP”), which may require management to make estimates and assumptions that affect the reported amounts of assets and liabilities in the financial statements, disclosure of contingent assets and liabilities at the date of the financial statements and the reported amounts of increases and decreases in net assets from operations during the reporting period. Actual results could differ from those estimates. Each Fund is considered an investment company under U.S. GAAP and follows the accounting and reporting guidance applicable to investment companies. Below is a summary of significant accounting policies:
Investment Transactions and Investment Income: For financial reporting purposes, contributions to and withdrawals from the Portfolios are accounted for on a trade date basis. Each Fund records its proportionate share of the Portfolio’s income, expenses and realized and unrealized gains and losses on a daily basis. Realized and unrealized gains and losses are adjusted utilizing partnership tax allocation rules. In addition, each Fund accrues its own expenses. Income, expenses and realized and unrealized gains and losses are allocated daily to each class based on its relative net assets.
Distributions: Distributions paid by the Funds are recorded on the ex-dividend date. The character and timing of distributions are determined in accordance with federal income tax regulations, which may differ from U.S. GAAP.
| | | | | | |
| | | BLACKROCK LARGE CAP SERIES FUNDS, INC. | | SEPTEMBER 30, 2016 | | 37 |
| | | | |
| Notes to Financial Statements (continued) | | | BlackRock Large Cap Series Funds, Inc. | |
Indemnifications: In the normal course of business, a Fund enters into contracts that contain a variety of representations that provide general indemnification. A Fund’s maximum exposure under these arrangements is unknown because it involves future potential claims against the Fund, which cannot be predicted with any certainty.
Other: Expenses directly related to a Fund or its classes are charged to that Fund or the applicable class. Other operating expenses shared by several funds, including other funds managed by the Administrator, are prorated among those funds on the basis of relative net assets or other appropriate methods. Expenses directly related to a Fund and other shared expenses prorated to a Fund are allocated daily to each class based on its relative net assets or other appropriate methods.
3. Investment Valuation and Fair Value Measurements:
Each Fund’s policy is to value its financial instruments at fair value. Each Fund records its investment in the corresponding Portfolio at fair value based on the Fund’s proportionate interest in the net assets of the Portfolio. Valuation of securities held by the Portfolio is discussed in Note 3 of the Portfolios’ Notes to Financial Statements, which are included elsewhere in this report.
4. Administration Agreement and Other Transactions with Affiliates:
The PNC Financial Services Group, Inc. is the largest stockholder and an affiliate of BlackRock, Inc. (“BlackRock”) for 1940 Act purposes.
Administration: The Corporation, on behalf of the Funds, entered into an Administration Agreement with the Administrator, an indirect, wholly-owned subsidiary of BlackRock, to provide administrative services (other than investment advice and related portfolio activities). For such services, Large Cap Core, Large Cap Growth and Large Cap Value each pay the Administrator a monthly fee at an annual rate of 0.25% of the average daily net assets of the Funds. The Funds do not pay an investment advisory fee or investment management fee. With respect to Large Cap Value Retirement, the Administrator does not receive an administration fee.
Service and Distribution Fees: The Corporation, on behalf of Large Cap Core, Large Cap Growth and Large Cap Value, entered into a Distribution Agreement and Distribution Plans with BlackRock Investments, LLC (“BRIL”), an affiliate of the Administrator. Pursuant to the Distribution Plans and in accordance with Rule 12b-1 under the 1940 Act, each Fund pays BRIL ongoing service and distribution fees. The fees are accrued daily and paid monthly at annual rates based upon the average daily net assets of the relevant share class of each Fund as follows:
| | | | | | | | | | | | | | | | | | | | |
| | | Service | | | Investor A | | | Investor B | | | Investor C | | | Class R | |
Service Fee | | | 0.25% | | | | 0.25% | | | | 0.25% | | | | 0.25% | | | | 0.25% | |
Distribution Fee | | | — | | | | — | | | | 0.75% | | | | 0.75% | | | | 0.25% | |
BRIL and broker-dealers, pursuant to sub agreements with BRIL provide shareholder servicing and distribution services to the Funds. The ongoing service and/or distribution fee compensates BRIL and each broker-dealer for providing shareholder servicing and/or distribution related services to the shareholders.
For the year ended September 30, 2016, the following table shows the class specific service and distribution fees borne directly by each class of each Fund:
| | | | | | | | | | | | | | | | | | | | | | | | | | | | | | |
| | | Service | | Investor A | | Investor B | | Investor C | | Class R | | Total |
Large Cap Core | | | $ | 2,582 | | | | $ | 1,887,729 | | | | $ | 43,836 | | | | $ | 3,455,558 | | | | $ | 183,007 | | | | $ | 5,572,712 | |
Large Cap Growth | | | $ | 4,152 | | | | $ | 1,371,359 | | | | $ | 9,093 | | | | $ | 1,901,094 | | | | $ | 114,821 | | | | $ | 3,400,519 | |
Large Cap Value | | | $ | 29,772 | | | | $ | 737,404 | | | | $ | 18,750 | | | | $ | 1,693,374 | | | | $ | 177,973 | | | | $ | 2,657,273 | |
Transfer Agent: Pursuant to written agreements, certain financial intermediaries, some of which may be affiliates, provide the Funds with sub-accounting, recordkeeping, sub-transfer agency and other administrative services with respect to sub-accounts they service. For these services, these entities receive an asset-based fee or annual fee per shareholder account, which will vary depending on share class and/or net assets. For the year ended September 30, 2016, the Funds paid the following amounts to affiliates of BlackRock in return for these services, which are included in transfer agent — class specific in the Statements of Operations:
| | | | | | | | | | | | | | | | | | | | | | | | | |
| | | Institutional | | Service | | Investor A | | Investor C | | Total |
Large Cap Core | | | $ | 55,652 | | | | $ | 1,883 | | | | $ | 287 | | | | | — | | | | $ | 57,822 | |
Large Cap Growth | | | $ | 392,797 | | | | $ | 379 | | | | $ | 2,420 | | | | | — | | | | $ | 395,596 | |
Large Cap Value | | | $ | 6,085 | | | | $ | 1,111 | | | | $ | 2,775 | | | | $ | 99 | | | | $ | 10,070 | |
The Administrator maintains a call center that is responsible for providing certain shareholder services to the Funds. Shareholder services include responding to inquiries and processing subscriptions and redemptions based upon instructions from shareholders. For the year ended September 30,
| | | | | | |
| 38 | | BLACKROCK LARGE CAP SERIES FUNDS, INC. | | SEPTEMBER 30, 2016 | | |
| | | | |
| Notes to Financial Statements (continued) | | | BlackRock Large Cap Series Funds, Inc. | |
2016, the Funds reimbursed the Administrator the following amounts for costs incurred in running the call center, which are included in transfer agent — class specific in the Statements of Operations:
| | | | | | | | | | | | | | | | | | | | | | | | | | | | | | | | | | | |
| | | Institutional | | Service | | Investor A | | Investor B | | Investor C | | Class R | | Total |
Large Cap Core | | | $ | 26,925 | | | | $ | 28 | | | | $ | 181,050 | | | | $ | 8,349 | | | | $ | 5,720 | | | | $ | 262 | | | | $ | 222,334 | |
Large Cap Growth | | | $ | 1,371 | | | | $ | 569 | | | | $ | 11,115 | | | | $ | 246 | | | | $ | 2,647 | | | | $ | 54 | | | | $ | 16,002 | |
Large Cap Value | | | $ | 1,059 | | | | $ | 3,722 | | | | $ | 26,293 | | | | $ | 455 | | | | $ | 2,095 | | | | | — | | | | $ | 33,624 | |
Large Cap Value Retirement | | | $ | 395 | | | | | — | | | | | — | | | | | — | | | | | — | | | | | — | | | | $ | 395 | |
For the year ended September 30, 2016, the following table shows the class specific transfer agent fees borne directly by each class of each Fund:
| | | | | | | | | | | | | | | | | | | | | | | | | | | | | | | | | | | |
| | | Institutional | | Service | | Investor A | | Investor B | | Investor C | | Class R | | Total |
Large Cap Core | | | $ | 502,958 | | | | $ | 2,222 | | | | $ | 1,688,869 | | | | $ | 51,143 | | | | $ | 752,124 | | | | $ | 65,834 | | | | $ | 3,063,150 | |
Large Cap Growth | | | $ | 541,340 | | | | $ | 2,876 | | | | $ | 1,041,732 | | | | $ | 3,540 | | | | $ | 408,802 | | | | $ | 40,140 | | | | $ | 2,038,430 | |
Large Cap Value | | | $ | 182,988 | | | | $ | 20,599 | | | | $ | 468,026 | | | | $ | 5,623 | | | | $ | 293,186 | | | | | 64,050 | | | | $ | 1,034,472 | |
Large Cap Value Retirement | | | $ | 144,532 | | | | | — | | | | | — | | | | | — | | | | | — | | | | | — | | | | $ | 144,532 | |
Other Fees: For the year ended September 30, 2016, affiliates earned underwriting discounts, direct commissions and dealer concessions on sales of the Funds’ Investor A Shares as follows:
| | | | |
Large Cap Core | | $ | 24,908 | |
Large Cap Growth | | $ | 42,048 | |
Large Cap Value | | $ | 9,708 | |
For the year ended September 30, 2016, affiliates received the following CDSCs as follows:
| | | | | | | | | | | | | | | |
| | | Investor A | | Investor B | | Investor C |
Large Cap Core | | | $ | 6,556 | | | | $ | 234 | | | | $ | 17,816 | |
Large Cap Growth | | | $ | 7,358 | | | | | — | | | | $ | 21,843 | |
Large Cap Value | | | | — | | | | | — | | | | $ | 2,745 | |
Expense Limitations, Waivers and Reimbursements: With respect to Large Cap Core, Large Cap Growth and Large Cap Value Retirement, the Administrator contractually agreed to waive and/or reimburse fees or expenses in order to limit expenses, excluding interest expense, dividend expense, tax expense, acquired fund fees and expenses and certain other fund expenses, which constitute extraordinary expenses not incurred in the ordinary course of each Fund’s business (“expense limitations”). The expense limitations as a percentage of average daily net assets are as follows:
| | | | | | |
| | | Large Cap Core | | Large Cap Growth | | Large Cap Value Retirement |
Institutional | | N/A | | 0.84% | | 0.67% |
Service | | N/A | | 1.13% | | N/A |
Investor A | | 1.14% | | 1.13% | | N/A |
Investor B | | 1.97% | | 1.95% | | N/A |
Investor C | | N/A | | 1.95% | | N/A |
Class R | | N/A | | 1.38% | | N/A |
The Administrator has agreed not to reduce or discontinue these contractual expense limitations prior to February 1, 2018, unless approved by the Board of Directors of the Corporation (the “Board”), including a majority of the independent directors who are not “interested persons” of the Funds, as defined in the 1940 Act (“Independent Directors”) or by a vote of a majority of the outstanding voting securities of the Funds. For the year ended September 30, 2016 there were no fees waived and/or reimbursed by the Administrator.
These amounts waived and/or reimbursed, are shown as transfer agent fees reimbursed — class specific, in the Statements of Operations. Class specific expense reimbursements are as follows:
| | | | | | | | | | | | | | | | | | | | | | | | | | | | | | | | | | | |
| | | Institutional | | Service | | Investor A | | Investor B | | Investor C | | Class R | | Total |
Large Cap Core | | | | — | | | | | — | | | | $ | 746,344 | | | | $ | 42,219 | | | | | — | | | | | — | | | | $ | 788,563 | |
Large Cap Growth | | | $ | 387,525 | | | | $ | 1,511 | | | | $ | 591,662 | | | | $ | 2,278 | | | | $ | 121,615 | | | | $ | 21,276 | | | | $ | 1,125,867 | |
Large Cap Value Retirement | | | $ | 49,641 | | | | | — | | | | | — | | | | | — | | | | | — | | | | | — | | | | $ | 49,641 | |
Effective September 1, 2016, the Manager has voluntarily agreed to waive the investment advisory fee payable by each Fund with respect to any portion of such Fund’s assets estimated to be attributable to investments in other equity and fixed-income mutual funds and exchange-traded funds managed by the Manager or its affiliates that have a contractual management fee. This voluntary waiver may be reduced or discontinued at any time without notice.
| | | | | | |
| | | BLACKROCK LARGE CAP SERIES FUNDS, INC. | | SEPTEMBER 30, 2016 | | 39 |
| | | | |
| Notes to Financial Statements (continued) | | | BlackRock Large Cap Series Funds, Inc. | |
With respect to Large Cap Value, the Administrator voluntarily agreed to waive 0.05%, as a percentage of average daily net assets, of the administration fee payable. This voluntary waiver may be reduced or discontinued at any time without notice. This amount waived, if any, is shown as fees waived and/or reimbursed by the administrator, in the Statements of Operations.
Officers and Directors: Certain officers and/or directors of the Corporation are officers and/or directors of BlackRock or its affiliates. The Funds reimburse the Administrator for a portion of the compensation paid to the Corporation’s Chief Compliance Officer, which is included in Officer in the Statements of Operations.
5. Income Tax Information:
It is each Fund’s policy to comply with the requirements of the Internal Revenue Code of 1986, as amended, applicable to regulated investment companies, and to distribute substantially all of its taxable income to its shareholders. Therefore, no federal income tax provision is required.
Each Fund files U.S. federal and various state and local tax returns. No income tax returns are currently under examination. The statute of limitations on each Fund’s U.S. federal tax returns generally remains open for each of the four years ended September 30, 2016. The statutes of limitations on each Fund’s state and local tax returns may remain open for an additional year depending upon the jurisdiction.
Management has analyzed tax laws and regulations and their application to the Funds as of September 30, 2016, inclusive of the open tax return years, and does not believe that there are any uncertain tax positions that require recognition of a tax liability in the Funds’ financial statements.
U.S. GAAP requires that certain components of net assets be adjusted to reflect permanent, differences between financial and tax reporting. These reclassifications have no effect on net assets or net asset values per share. As of period end, the following permanent differences attributable to the income recognized from partnership interests were reclassified to the following accounts:
| | | | | | | | | | | | | | | | | | | | |
| | | Large Cap Core | | Large Cap Growth | | Large Cap Value | | Large Cap Value Retirement |
Undistributed (distribution in excess of) net investment income | | | $ | 369 | | | | $ | (536,979 | ) | | | | $ 1,064 | | | | | $ 250 | |
Accumulated net realized gain (loss) allocated from the Portfolio | | | $ | (369 | ) | | | $ | 536,979 | | | | | $(1,064 | ) | | | | $(250 | ) |
The tax character of distributions paid was as follows:
| | | | | | | | | | | | | | | | |
| | | Large Cap Core | | | Large Cap Growth | | | Large Cap Value | | | Large Cap Value Retirement | |
Ordinary income | | | | | | | | | | | | | | | | |
9/30/16 | | | $ 5,907,558 | | | | $ 1,272,876 | | | | $4,294,943 | | | | $ 2,100,002 | |
9/30/15 | | | $ 5,525,991 | | | | $ 23,370,936 | | | | $5,196,518 | | | | $ 3,259,845 | |
Long-term capital gains | | | | | | | | | | | | | | | | |
9/30/16 | | | $41,696,283 | | | | $ 55,500,547 | | | | — | | | | $ 8,933,243 | |
9/30/15 | | | — | | | | $115,481,660 | | | | — | | | | $15,261,718 | |
Total | | | | | | | | | | | | | | | | |
| | | | |
9/30/16 | | | $47,603,841 | | | | $ 56,773,423 | | | | $4,294,943 | | | | $11,033,245 | |
9/30/15 | | | $ 5,525,991 | | | | $138,852,596 | | | | $5,196,518 | | | | $18,521,563 | |
| | | | |
| | | | | | | | | | | | | | | | |
As of period end, the tax components of accumulated net earnings (losses) were as follows:
| | | | | | | | | | | | | | | | | | | | |
| | | Large Cap Core | | Large Cap
Growth | | Large Cap Value | | Large Cap
Value Retirement |
Undistributed ordinary income | | | | $ 7,986,907 | | | | | $ 3,159,599 | | | | | $ 5,033,875 | | | | | $ 1,790,499 | |
Undistributed long-term capital gains | | | | 77,334,939 | | | | | 62,785,332 | | | | | — | | | | | 4,658,014 | |
Capital loss carryforwards | | | | — | | | | | — | | | | | (499,303,125 | ) | | | | — | |
Qualified late-year losses1 | | | | — | | | | | — | | | | | (5,275,156 | ) | | | | — | |
Net unrealized gains (losses)2 | | | | 324,153,589 | | | | | 259,760,823 | | | | | 125,510,427 | | | | | 22,531,769 | |
Total | | | | $409,475,435 | | | | | $325,705,754 | | | | | $(374,033,979 | ) | | | | $28,980,282 | |
| | 1 | | The Funds have elected to defer certain qualified late-year losses and recognize such losses in the year next taxable year. |
| | 2 | | The difference between book-basis and tax-basis net unrealized gains was attributable primarily to the timing of income recognition on partnership interests. |
As of September 30, 2016, the Funds listed below had capital loss carryforwards available to offset future realized capital gains through the indicated expiration dates as follows:
| | | | |
| Expires September 30, | | Large Cap Value | |
2017 | | $ | 499,303,125 | |
| | | | | | |
| 40 | | BLACKROCK LARGE CAP SERIES FUNDS, INC. | | SEPTEMBER 30, 2016 | | |
| | | | |
| Notes to Financial Statements (continued) | | | BlackRock Large Cap Series Funds, Inc. | |
During the year ended September 30, 2016, the Funds listed below utilized the following amounts of their respective capital loss carryforward:
| | | | |
Large Cap Value | | $ | 44,101,698 | |
6. Capital Share Transactions:
Transactions in capital shares for each class were as follows:
| | | | | | | | | | | | | | | | | | | | |
| | | Year Ended
September 30, 2016 | | | | | | Year Ended
September 30, 2015 | |
| Large Cap Core | | Shares | | | Amount | | | | | | Shares | | | Amount | |
Institutional | | | | | | | | | | | | | | | | | | | | |
Shares sold | | | 2,828,926 | | | | $ 49,526,592 | | | | | | | | 3,773,841 | | | | $ 70,153,843 | |
Shares issued in reinvestment of distributions | | | 666,918 | | | | 11,804,435 | | | | | | | | 126,387 | | | | 2,258,546 | |
Shares redeemed | | | (5,598,540 | ) | | | (98,862,664 | ) | | | | | | | (5,938,890 | ) | | | (108,654,427 | ) |
| | | | | | | | | | | | |
Net decrease | | | (2,102,696 | ) | | | $(37,531,637 | ) | | | | | | | (2,038,662 | ) | | | $ (36,242,038 | ) |
| | | | | | | | | | | | |
| | | | | | | | | | | | | | | | | | | | |
Service | | | | | | | | | | | | | | | | | | | | |
Shares sold | | | 3,939 | | | | $ 68,447 | | | | | | | | 3,797 | | | | $ 70,013 | |
Shares issued in reinvestment of distributions | | | 1,782 | | | | 31,361 | | | | | | | | 174 | | | | 3,095 | |
Shares redeemed | | | (55,311 | ) | | | (1,015,924 | ) | | | | | | | (3,471 | ) | | | (64,052 | ) |
| | | | | | | | | | | | |
Net increase (decrease) | | | (49,590 | ) | | | $ (916,116 | ) | | | | | | | 500 | | | | $ 9,056 | |
| | | | | | | | | | | | |
| | | | | | | | | | | | | | | | | | | | |
Investor A | | | | | | | | | | | | | | | | | | | | |
Shares sold and automatic conversion of shares | | | 3,295,583 | | | | $ 56,953,320 | | | | | | | | 4,899,375 | | | | $ 87,706,303 | |
Shares issued in reinvestment of distributions | | | 1,169,925 | | | | 20,216,045 | | | | | | | | 142,959 | | | | 2,496,056 | |
Shares redeemed | | | (7,346,154 | ) | | | (127,415,555 | ) | | | | | | | (7,749,316 | ) | | | (138,830,844 | ) |
| | | | | | | | | | | | |
Net decrease | | | (2,880,646 | ) | | | $ (50,246,190 | ) | | | | | | | (2,706,982 | ) | | | $ (48,628,485 | ) |
| | | | | | | | | | | | |
| | | | | | | | | | | | | | | | | | | | |
Investor B | | | | | | | | | | | | | | | | | | | | |
Shares sold | | | 6,560 | | | | $ 99,945 | | | | | | | | 17,139 | | | | $ 282,900 | |
Shares issued in reinvestment of distributions | | | 9,191 | | | | 145,857 | | | | | | | | — | | | | — | |
Shares redeemed and automatic conversion of shares | | | (233,233 | ) | | | (3,663,536 | ) | | | | | | | (473,561 | ) | | | (7,833,466 | ) |
| | | | | | | | | | | | |
Net decrease | | | (217,482 | ) | | | $(3,417,734 | ) | | | | | | | (456,422 | ) | | | $(7,550,566 | ) |
| | | | | | | | | | | | |
| | | | | | | | | | | | | | | | | | | | |
Investor C | | | | | | | | | | | | | | | | | | | | |
Shares sold | | | 2,343,526 | | | | $ 36,620,038 | | | | | | | | 3,814,222 | | | | $ 62,064,414 | |
Shares issued in reinvestment of distributions | | | 536,403 | | | | 8,394,429 | | | | | | | | — | | | | 10 | |
Shares redeemed | | | (5,937,083 | ) | | | (92,891,706 | ) | | | | | | | (5,723,389 | ) | | | (93,139,848 | ) |
| | | | | | | | | | | | |
Net decrease | | | (3,057,154 | ) | | | $(47,877,239 | ) | | | | | | | (1,909,167 | ) | | | $(31,075,424 | ) |
| | | | | | | | | | | | |
| | | | | | | | | | | | | | | | | | | | |
Class R | | | | | | | | | | | | | | | | | | | | |
Shares sold | | | 582,915 | | | | $ 9,628,262 | | | | | | | | 635,301 | | | | $ 10,858,458 | |
Shares issued in reinvestment of distributions | | | 62,580 | | | | 1,035,061 | | | | | | | | — | | | | — | |
Shares redeemed | | | (809,634 | ) | | | (13,318,619 | ) | | | | | | | (992,712 | ) | | | (16,958,234 | ) |
| | | | | | | | | | | | |
Net decrease | | | (164,139 | ) | | | $ (2,655,296 | ) | | | | | | | (357,411 | ) | | | $ (6,099,776 | ) |
| | | | | | | | | | | | |
Total Net Decrease | | | (8,471,707 | ) | | | $(142,644,212 | ) | | | | | | | (7,468,144 | ) | | | $(129,587,233 | ) |
| | | | | | | | | | | | |
| | | | | | |
| | | BLACKROCK LARGE CAP SERIES FUNDS, INC. | | SEPTEMBER 30, 2016 | | 41 |
| | | | |
| Notes to Financial Statements (continued) | | | BlackRock Large Cap Series Funds, Inc. | |
| | | | | | | | | | | | | | | | | | | | |
| | | Year Ended
September 30, 2016 | | | | | | Year Ended
September 30, 2015 | |
| Large Cap Growth | | Shares | | | Amount | | | | | | Shares | | | Amount | |
Institutional | | | | | | | | | | | | | | | | | | | | |
Shares sold | | | 3,103,912 | | | | $ 43,443,015 | | | | | | | | 4,962,477 | | | | $ 71,239,064 | |
Shares issued in reinvestment of distributions | | | 1,193,477 | | | | 16,290,950 | | | | | | | | 2,755,379 | | | | 37,803,785 | |
Shares redeemed | | | (3,603,155 | ) | | | (51,015,614 | ) | | | | | | | (6,972,356 | ) | | | (99,821,062 | ) |
| | | | | | | | | | | | |
Net increase | | | 694,234 | | | | $ 8,718,351 | | | | | | | | 745,500 | | | | $ 9,221,787 | |
| | | | | | | | | | | | |
| | | | | | | | | | | | | | | | | | | | |
Service | | | | | | | | | | | | | | | | | | | | |
Shares sold | | | 4,066 | | | | $ 53,325 | | | | | | | | 5,135 | | | | $ 73,556 | |
Shares issued in reinvestment of distributions | | | 5,648 | | | | 76,816 | | | | | | | | 16,280 | | | | 222,707 | |
Shares redeemed | | | (7,855 | ) | | | (102,732 | ) | | | | | | | (31,432 | ) | | | (442,789 | ) |
| | | | | | | | | | | | |
Net increase (decrease) | | | 1,859 | | | | $ 27,409 | | | | | | | | (10,017 | ) | | | $(146,526 | ) |
| | | | | | | | | | | | |
| | | | | | | | | | | | | | | | | | | | |
Investor A | | | | | | | | | | | | | | | | | | | | |
Shares sold and automatic conversion of shares | | | 6,732,027 | | | | $ 88,961,369 | | | | | | | | 8,530,604 | | | | $ 118,056,683 | |
Shares issued in reinvestment of distributions | | | 2,014,303 | | | | 26,226,028 | | | | | | | | 4,716,368 | | | | 61,925,853 | |
Shares redeemed | | | (9,480,228 | ) | | | (124,606,897 | ) | | | | | | | (8,427,346 | ) | | | (116,214,363 | ) |
| | | | | | | | | | | | |
Net increase (decrease) | | | (733,898 | ) | | | $ (9,419,500 | ) | | | | | | | 4,819,626 | | | | $ 63,768,173 | |
| | | | | | | | | | | | |
| | | | | | | | | | | | | | | | | | | | |
Investor B | | | | | | | | | | | | | | | | | | | | |
Shares sold | | | 20,773 | | | | $ 240,357 | | | | | | | | 25,457 | | | | $ 308,186 | |
Shares issued in reinvestment of distributions | | | 5,600 | | | | 63,899 | | | | | | | | 28,424 | | | | 331,709 | |
Shares redeemed and automatic conversion of shares | | | (89,695 | ) | | | (1,028,533 | ) | | | | | | | (156,647 | ) | | | (1,915,916 | ) |
| | | | | | | | | | | | |
Net decrease | | | (63,322 | ) | | | $ (724,277 | ) | | | | | | | (102,766 | ) | | | $(1,276,021 | ) |
| | | | | | | | | | | | |
| | | | | | | | | | | | | | | | | | | | |
Investor C | | | | | | | | | | | | | | | | | | | | |
Shares sold | | | 3,012,680 | | | | $ 34,372,153 | | | | | | | | 4,355,063 | | | | $ 52,891,600 | |
Shares issued in reinvestment of distributions | | | 910,846 | | | | 10,274,160 | | | | | | | | 2,119,680 | | | | 24,482,215 | |
Shares redeemed | | | (6,023,883 | ) | | | (68,687,977 | ) | | | | | | | (4,366,776 | ) | | | (52,761,381 | ) |
| | | | | | | | | | | | |
Net increase (decrease) | | | (2,100,357 | ) | | | $(24,041,664 | ) | | | | | | | 2,107,967 | | | | $ 24,612,434 | |
| | | | | | | | | | | | |
| | | | | | | | | | | | | | | | | | | | |
Class R | | | | | | | | | | | | | | | | | | | | |
Shares sold | | | 660,481 | | | | $ 8,249,437 | | | | | | | | 459,276 | | | | $ 6,028,623 | |
Shares issued in reinvestment of distributions | | | 94,341 | | | | 1,158,507 | | | | | | | | 236,435 | | | | 2,941,251 | |
Shares redeemed | | | (674,872 | ) | | | (8,415,167 | ) | | | | | | | (641,011 | ) | | | (8,386,710 | ) |
| | | | | | | | | | | | |
Net increase | | | 79,950 | | | | $ 992,777 | | | | | | | | 54,700 | | | | $ 583,164 | |
| | | | | | | | | | | | |
Total Net Increase (Decrease) | | | (2,121,534 | ) | | | $(24,446,904 | ) | | | | | | | 7,615,010 | | | | $96,763,011 | |
| | | | | | | | | | | | |
| | | | | | | | | | | | | | | | | | | | |
| Large Cap Value | | | | | | | | | | | | | | | |
Institutional | | | | | | | | | | | | | | | | | | | | |
Shares sold | | | 1,088,181 | | | | $ 24,412,234 | | | | | | | | 1,205,013 | | | | $ 27,672,716 | |
Shares issued in reinvestment of distributions | | | 56,405 | | | | 1,255,014 | | | | | | | | 67,082 | | | | 1,503,310 | |
Shares redeemed | | | (2,597,739 | ) | | | (58,399,056 | ) | | | | | | | (2,048,036 | ) | | | (47,005,290 | ) |
| | | | | | | | | | | | |
Net decrease | | | (1,453,153 | ) | | | $(32,731,808 | ) | | | | | | | (775,941 | ) | | | $(17,829,264 | ) |
| | | | | | | | | | | | |
| | | | | | | | | | | | | | | | | | | | |
Service | | | | | | | | | | | | | | | | | | | | |
Shares sold | | | 2,245 | | | | $ 49,810 | | | | | | | | 4,315 | | | | $ 97,924 | |
Shares issued in reinvestment of distributions | | | 3,790 | | | | 83,833 | | | | | | | | 4,792 | | | | 106,765 | |
Shares redeemed | | | (42,542 | ) | | | (941,520 | ) | | | | | | | (93,099 | ) | | | (2,115,586 | ) |
| | | | | | | | | | | | |
Net decrease | | | (36,507 | ) | | | $(807,877 | ) | | | | | | | (83,992 | ) | | | $(1,910,897 | ) |
| | | | | | | | | | | | |
| | | | | | |
| 42 | | BLACKROCK LARGE CAP SERIES FUNDS, INC. | | SEPTEMBER 30, 2016 | | |
| | | | |
| Notes to Financial Statements (concluded) | | | BlackRock Large Cap Series Funds, Inc. | |
| | | | | | | | | | | | | | | | | | | | |
| | | Year Ended
September 30, 2016 | | | | | | Year Ended
September 30, 2015 | |
| Large Cap Value (concluded) | | Shares | | | Amount | | | | | | Shares | | | Amount | |
Investor A | | | | | | | | | | | | | | | | | | | | |
Shares sold and automatic conversion of shares | | | 1,989,036 | | | | $ 43,889,987 | | | | | | | | 1,997,033 | | | | $ 44,709,321 | |
Shares issued in reinvestment of distributions | | | 95,339 | | | | 2,083,144 | | | | | | | | 113,425 | | | | 2,496,477 | |
Shares redeemed | | | (3,747,165 | ) | | | (81,840,227 | ) | | | | | | | (4,192,798 | ) | | | (94,058,562 | ) |
| | | | | | | | | | | | |
Net decrease | | | (1,662,790 | ) | | | $(35,867,096 | ) | | | | | | | (2,082,340 | ) | | | $(46,852,764 | ) |
| | | | | | | | | | | | |
| | | | | | | | | | | | | | | | | | | | |
Investor B | | | | | | | | | | | | | | | | | | | | |
Shares sold | | | 3,636 | | | | $ 71,419 | | | | | | | | 4,468 | | | | $ 93,158 | |
Shares redeemed and automatic conversion of shares | | | (73,205 | ) | | | (1,491,356 | ) | | | | | | | (207,441 | ) | | | (4,374,077 | ) |
| | | | | | | | | | | | |
Net decrease | | | (69,569 | ) | | | $(1,419,937 | ) | | | | | | | (202,973 | ) | | | $(4,280,919 | ) |
| | | | | | | | | | | | |
| | | | | | | | | | | | | | | | | | | | |
Investor C | | | | | | | | | | | | | | | | | | | | |
Shares sold | | | 2,053,602 | | | | $ 42,436,273 | | | | | | | | 1,132,567 | | | | $ 23,559,890 | |
Shares issued in reinvestment of distributions | | | 2,540 | | | | 51,651 | | | | | | | | 6,486 | | | | 132,964 | |
Shares redeemed | | | (3,488,189 | ) | | | (69,667,653 | ) | | | | | | | (2,478,024 | ) | | | (51,550,779 | ) |
| | | | | | | | | | | | |
Net decrease | | | (1,432,047 | ) | | | $(27,179,729 | ) | | | | | | | (1,338,971 | ) | | | $(27,857,925 | ) |
| | | | | | | | | | | | |
| | | | | | | | | | | | | | | | | | | | |
Class R | | | | | | | | | | | | | | | | | | | | |
Shares sold | | | 431,881 | | | | $ 9,025,560 | | | | | | | | 420,516 | | | | $ 9,092,961 | |
Shares issued in reinvestment of distributions | | | 7,689 | | | | 161,931 | | | | | | | | 10,142 | | | | 215,130 | |
Shares redeemed | | | (598,441 | ) | | | (12,688,945 | ) | | | | | | | (800,942 | ) | | | (17,387,664 | ) |
| | | | | | | | | | | | |
Net decrease | | | (158,871 | ) | | | $ (3,501,454 | ) | | | | | | | (370,284 | ) | | | $ (8,079,573 | ) |
| | | | | | | | | | | | |
Total Net Decrease | | | (4,812,937 | ) | | | $(101,507,901 | ) | | | | | | | (4,854,501 | ) | | | $(106,811,342 | ) |
| | | | | | | | | | | | |
| | | | | | | | | | | | | | | | | | | | |
| Large Cap Value Retirement | | | | | | | | | | | | | | | |
Institutional | | | | | | | | | | | | | | | | | | | | |
Shares sold | | | 1,341,348 | | | | $ 24,647,395 | | | | | | | | 1,281,285 | | | | $ 25,875,935 | |
Shares issued in reinvestment of distributions | | | 607,655 | | | | 10,992,475 | | | | | | | | 953,992 | | | | 18,431,121 | |
Shares redeemed | | | (1,606,302 | ) | | | (29,702,292 | ) | | | | | | | (1,374,558 | ) | | | (27,741,211 | ) |
| | | | | | | | | | | | |
Net increase | | | 342,701 | | | | $ 5,937,578 | | | | | | | | 860,719 | | | | $ 16,565,845 | |
| | | | | | | | | | | | |
7. Subsequent Events:
Management has evaluated the impact of all subsequent events on the Funds through the date the financial statements were issued and has determined that there were no subsequent events requiring adjustment or additional disclosure in the financial statements.
| | | | | | |
| | | BLACKROCK LARGE CAP SERIES FUNDS, INC. | | SEPTEMBER 30, 2016 | | 43 |
| | | | |
| Report of Independent Registered Public Accounting Firm | | | BlackRock Large Cap Series Funds, Inc. | |
To the Board of Directors of BlackRock Large Cap Series Funds, Inc. and Shareholders of BlackRock Large Cap Core Fund, BlackRock Large Cap Growth Fund, BlackRock Large Cap Value Fund and BlackRock Large Cap Value Retirement Portfolio:
We have audited the accompanying statements of assets and liabilities of BlackRock Large Cap Core Fund, BlackRock Large Cap Growth Fund, BlackRock Large Cap Value Fund and BlackRock Large Cap Value Retirement Portfolio (collectively the “Funds”), each a series of BlackRock Large Cap Series Funds, Inc., as of September 30, 2016, and the related statements of operations for the year then ended, the statements of changes in net assets for each of the two years in the period then ended, and the financial highlights for each of the five years in the period then ended. These financial statements and financial highlights are the responsibility of the Funds’ management. Our responsibility is to express an opinion on these financial statements and financial highlights based on our audits.
We conducted our audits in accordance with the standards of the Public Company Accounting Oversight Board (United States). Those standards require that we plan and perform the audit to obtain reasonable assurance about whether the financial statements and financial highlights are free of material misstatement. The Funds are not required to have, nor were we engaged to perform, an audit of their internal control over financial reporting. Our audits included consideration of internal control over financial reporting as a basis for designing audit procedures that are appropriate in the circumstances, but not for the purpose of expressing an opinion on the effectiveness of the Funds’ internal control over financial reporting. Accordingly, we express no such opinion. An audit also includes examining, on a test basis, evidence supporting the amounts and disclosures in the financial statements, assessing the accounting principles used and significant estimates made by management, as well as evaluating the overall financial statement presentation. We believe that our audits provide a reasonable basis for our opinion.
In our opinion, such financial statements and financial highlights referred to above present fairly, in all material respects, the financial position of BlackRock Large Cap Core Fund, BlackRock Large Cap Growth Fund, BlackRock Large Cap Value Fund and BlackRock Large Cap Value Retirement Portfolio as of September 30, 2016, the results of their operations for the year then ended, the changes in their net assets for each of the two years in the period then ended, and the financial highlights for each of the five years in the period then ended, in conformity with accounting principles generally accepted in the United States of America.
Deloitte & Touche LLP
Philadelphia, Pennsylvania
November 23, 2016
| | | | |
| Important Tax Information (Unaudited) | | | | |
During the fiscal year ended September 30, 2016, the following information is provided with respect to the ordinary income distributions paid:
| | | | | | | | | | | | |
| | | Payable Date | | BlackRock
Large Cap
Core | | BlackRock
Large Cap
Growth | | BlackRock
Large Cap
Value | | BlackRock
Large Cap
Value
Retirement | |
Qualified Dividend Income for Individuals1 | | 12/14/2015 | | 100% | | 100% | | 100% | | | 67.24% | |
Dividends Qualifying for the Dividends Received Deduction for Corporations1 | | 12/14/2015 | | 100% | | 100% | | 100% | | | 64.69% | |
| 1 | | The Funds hereby designate the percentage indicated above or the maximum amount allowable by law. |
Additionally, BlackRock Large Cap Core Fund, BlackRock Large Cap Growth Fund and BlackRock Large Cap Value Retirement Portfolio distributed long-term capital gains of $0.439458, $0.653115 and $1.072874 per share, respectively, to shareholders of record on December 10, 2015.
| | | | | | |
| 44 | | BLACKROCK LARGE CAP SERIES FUNDS, INC. | | SEPTEMBER 30, 2016 | | |
| | | | |
| Portfolio Information as of September 30, 2016 | | | Master Large Cap Series LLC | |
| | |
| Ten Largest Holdings | | |
| Master Large Cap Core Portfolio | | Percent of Net Assets |
Apple Inc. | | 5% |
JPMorgan Chase & Co. | | 4 |
Microsoft Corp. | | 4 |
Comcast Corp., Class A | | 3 |
Bank of America Corp. | | 3 |
Cisco Systems, Inc. | | 3 |
U.S. Bancorp | | 2 |
Altria Group, Inc. | | 2 |
Activision Blizzard, Inc. | | 2 |
Aetna, Inc. | | 2 |
| Master Large Cap Growth Portfolio | | Percent of Net Assets |
Apple Inc. | | 7% |
Microsoft Corp. | | 5 |
Comcast Corp., Class A | | 4 |
Alphabet, Inc., Class A | | 3 |
Home Depot, Inc. | | 3 |
Alphabet, Inc., Class C | | 3 |
Amgen, Inc. | | 3 |
Altria Group, Inc. | | 3 |
Gilead Sciences, Inc. | | 3 |
Lowe’s Cos., Inc. | | 2 |
| Master Large Cap Value Portfolio | | Percent of Net Assets |
JPMorgan Chase & Co. | | 5% |
Bank of America Corp. | | 4 |
Cisco Systems, Inc. | | 4 |
U.S. Bancorp | | 3 |
Comcast Corp., Class A | | 3 |
Apple Inc. | | 2 |
Aetna, Inc. | | 2 |
Walgreens Boots Alliance, Inc. | | 2 |
Pfizer, Inc. | | 2 |
Carnival Corp. | | 2 |
| | |
| Sector Allocations | | |
| Master Large Cap Core Portfolio | | Percent of
Net Assets |
Information Technology | | 24% |
Health Care | | 16 |
Consumer Discretionary | | 16 |
Financials | | 15 |
Consumer Staples | | 9 |
Industrials | | 7 |
Energy | | 6 |
Materials | | 3 |
Utilities | | 1 |
Short-Term Securities | | 3 |
| Master Large Cap Growth Portfolio | | Percent of
Net Assets |
Information Technology | | 33% |
Health Care | | 19 |
Consumer Discretionary | | 19 |
Consumer Staples | | 9 |
Industrials | | 5 |
Financials | | 4 |
Materials | | 4 |
Energy | | 1 |
Short-Term Securities | | 6 |
| Master Large Cap Value Portfolio | | Percent of
Net Assets |
Financials | | 23% |
Health Care | | 18 |
Information Technology | | 16 |
Consumer Discretionary | | 11 |
Energy | | 11 |
Industrials | | 6 |
Consumer Staples | | 6 |
Materials | | 4 |
Utilities | | 2 |
Telecommunication Services | | 1 |
Short-Term Securities | | 2 |
For Portfolio compliance purposes, the Portfolios’ sector classifications refer to one or more of the sector sub-classifications used by one or more widely recognized market indexes or ratings group indexes, and/or as defined by the investment adviser. These definitions may not apply for purposes of this report, which may combine sector sub-classifications for reporting ease.
| | | | | | |
| | | BLACKROCK LARGE CAP SERIES FUNDS, INC. | | SEPTEMBER 30, 2016 | | 45 |
| | | | |
| Schedule of Investments September 30, 2016 | | | Master Large Cap Core Portfolio | |
| | | (Percentages shown are based on Net Assets) | |
| | | | | | | | |
| Common Stocks | | Shares | | | Value | |
Aerospace & Defense — 2.2% | | | | | | | | |
L-3 Communications Holdings, Inc. | | | 86,037 | | | $ | 12,968,357 | |
Raytheon Co. | | | 255,820 | | | | 34,824,777 | |
| | | | | | | | |
| | | | | | | | 47,793,134 | |
Airlines — 2.2% | | | | | | | | |
Delta Air Lines, Inc. | | | 417,400 | | | | 16,428,864 | |
Southwest Airlines Co. | | | 685,893 | | | | 26,674,379 | |
United Continental Holdings, Inc. (a) | | | 88,320 | | | | 4,634,150 | |
| | | | | | | | |
| | | | | | | | 47,737,393 | |
Auto Components — 2.7% | | | | | | | | |
Goodyear Tire & Rubber Co. | | | 556,600 | | | | 17,978,180 | |
Lear Corp. | | | 325,006 | | | | 39,397,227 | |
| | | | | | | | |
| | | | | | | | 57,375,407 | |
Banks — 11.3% | | | | | | | | |
Bank of America Corp. | | | 4,062,466 | | | | 63,577,593 | |
Citigroup, Inc. | | | 521,104 | | | | 24,611,742 | |
JPMorgan Chase & Co. | | | 1,131,824 | | | | 75,368,160 | |
SunTrust Banks, Inc. | | | 626,367 | | | | 27,434,875 | |
U.S. Bancorp | | | 1,172,625 | | | | 50,293,886 | |
| | | | | | | | |
| | | | | | | | 241,286,256 | |
Beverages — 1.4% | | | | | | | | |
Dr. Pepper Snapple Group, Inc. | | | 320,300 | | | | 29,246,593 | |
Biotechnology — 4.2% | | | | | | | | |
Amgen, Inc. | | | 112,770 | | | | 18,811,164 | |
Biogen, Inc. (a) | | | 97,300 | | | | 30,457,819 | |
Gilead Sciences, Inc. | | | 517,999 | | | | 40,984,081 | |
| | | | | | | | |
| | | | | | | | 90,253,064 | |
Building Products — 0.7% | | | | | | | | |
Owens Corning | | | 274,600 | | | | 14,660,894 | |
Capital Markets — 1.5% | | | | | | | | |
Goldman Sachs Group, Inc. | | | 191,279 | | | | 30,847,564 | |
Chemicals — 0.7% | | | | | | | | |
Dow Chemical Co. | | | 152,594 | | | | 7,908,947 | |
Eastman Chemical Co. | | | 115,100 | | | | 7,789,968 | |
| | | | | | | | |
| | | | | | | | 15,698,915 | |
Communications Equipment — 2.7% | | | | | | | | |
Cisco Systems, Inc. | | | 1,835,620 | | | | 58,225,866 | |
Construction & Engineering — 0.6% | | | | | | | | |
AECOM (a) | | | 245,438 | | | | 7,296,872 | |
EMCOR Group, Inc. | | | 103,000 | | | | 6,140,860 | |
| | | | | | | | |
| | | | | | | | 13,437,732 | |
Consumer Finance — 1.0% | | | | | | | | |
SLM Corp. (a) | | | 2,801,957 | | | | 20,930,619 | |
Containers & Packaging — 1.7% | | | | | | | | |
Avery Dennison Corp. | | | 149,900 | | | | 11,660,721 | |
| | | | | | | | |
| Common Stocks | | Shares | | | Value | |
Containers & Packaging (continued) | | | | | | | | |
Packaging Corp. of America | | | 305,013 | | | $ | 24,785,356 | |
| | | | | | | | |
| | | | | | | | 36,446,077 | |
Diversified Telecommunication Services — 0.2% | | | | | |
AT&T Inc. | | | 126,000 | | | | 5,116,860 | |
Electronic Equipment, Instruments & Components — 1.4% | | | | | |
CDW Corp. | | | 368,340 | | | | 16,844,188 | |
Flex Ltd. (a) | | | 894,900 | | | | 12,188,538 | |
| | | | | | | | |
| | | | | | | | 29,032,726 | |
Energy Equipment & Services — 0.3% | | | | | | | | |
Schlumberger Ltd. | | | 83,780 | | | | 6,588,459 | |
Food & Staples Retailing — 4.0% | | | | | | | | |
CVS Health Corp. | | | 466,207 | | | | 41,487,761 | |
Walgreens Boots Alliance, Inc. | | | 542,800 | | | | 43,760,536 | |
| | | | | | | | |
| | | | | | | | 85,248,297 | |
Food Products — 0.9% | | | | | | | | |
Tyson Foods, Inc., Class A | | | 253,640 | | | | 18,939,299 | |
Health Care Providers & Services — 7.3% | | | | | | | | |
Aetna, Inc. | | | 422,941 | | | | 48,828,538 | |
Centene Corp. (a) | | | 418,500 | | | | 28,022,760 | |
Cigna Corp. | | | 93,610 | | | | 12,199,255 | |
Humana, Inc. | | | 112,700 | | | | 19,935,503 | |
Laboratory Corp. of America Holdings (a) | | | 167,340 | | | | 23,005,903 | |
UnitedHealth Group, Inc. | | | 174,661 | | | | 24,452,540 | |
| | | | | | | | |
| | | | | | | | 156,444,499 | |
Hotels, Restaurants & Leisure — 2.6% | | | | | | | | |
Carnival Corp. | | | 904,638 | | | | 44,164,427 | |
Wyndham Worldwide Corp. | | | 174,023 | | | | 11,716,969 | |
| | | | | | | | |
| | | | | | | | 55,881,396 | |
Household Durables — 1.5% | | | | | | | | |
DR Horton, Inc. | | | 574,835 | | | | 17,360,017 | |
Lennar Corp., Class A | | | 198,536 | | | | 8,406,014 | |
NVR, Inc. (a) | | | 4,048 | | | | 6,638,194 | |
| | | | | | | | |
| | | | | | | | 32,404,225 | |
Insurance — 1.2% | | | | | | | | |
American International Group, Inc. | | | 318,752 | | | | 18,914,744 | |
Travelers Cos., Inc. | | | 62,860 | | | | 7,200,613 | |
| | | | | | | | |
| | | | | | | | 26,115,357 | |
Internet Software & Services — 4.8% | | | | | | | | |
Alphabet, Inc., Class A (a) | | | 54,537 | | | | 43,851,020 | |
Alphabet, Inc., Class C (a) | | | 58,242 | | | | 45,270,924 | |
Facebook, Inc., Class A (a) | | | 62,027 | | | | 7,956,203 | |
GoDaddy, Inc., Class A (a) | | | 133,100 | | | | 4,595,943 | |
| | | | | | | | |
| | | | | | | | 101,674,090 | |
| | |
| Portfolio Abbreviations |
| ADR | | American Depositary Receipts |
| S&P | | Standard & Poor’s |
See Notes to Financial Statements.
| | | | | | |
| 46 | | BLACKROCK LARGE CAP SERIES FUNDS, INC. | | SEPTEMBER 30, 2016 | | |
| | | | |
| Schedule of Investments (continued) | | | Master Large Cap Core Portfolio | |
| | | | |
| | | | | | | | |
| Common Stocks | | Shares | | | Value | |
IT Services — 1.6% | | | | | | | | |
Amdocs Ltd. | | | 298,779 | | | $ | 17,284,365 | |
Cognizant Technology Solutions Corp., Class A (a) | | | 354,600 | | | | 16,917,966 | |
| | | | | | | | |
| | | | | | | | 34,202,331 | |
Machinery — 0.5% | | | | | | | | |
WABCO Holdings, Inc. (a) | | | 84,258 | | | | 9,565,811 | |
Media — 3.9% | | | | | | | | |
Comcast Corp., Class A | | | 966,900 | | | | 64,144,146 | |
Omnicom Group, Inc. | | | 224,540 | | | | 19,085,900 | |
| | | | | | | | |
| | | | | | | | 83,230,046 | |
Metals & Mining — 0.8% | | | | | | | | |
Rio Tinto PLC — ADR | | | 478,433 | | | | 15,979,662 | |
Multiline Retail — 0.3% | | | | | | | | |
Dollar General Corp. | | | 74,108 | | | | 5,186,819 | |
Multi-Utilities — 0.6% | | | | | | | | |
Public Service Enterprise Group, Inc. | | | 290,465 | | | | 12,161,770 | |
Oil, Gas & Consumable Fuels — 5.7% | | | | | | | | |
Anadarko Petroleum Corp. | | | 124,780 | | | | 7,906,061 | |
BP PLC — ADR | | | 884,610 | | | | 31,102,888 | |
Chevron Corp. | | | 233,200 | | | | 24,000,944 | |
Hess Corp. | | | 181,332 | | | | 9,723,022 | |
Marathon Oil Corp. | | | 466,389 | | | | 7,373,610 | |
Statoil ASA — ADR (b) | | | 474,600 | | | | 7,973,280 | |
Suncor Energy, Inc. | | | 784,000 | | | | 21,779,520 | |
TOTAL SA — ADR | | | 112,002 | | | | 5,342,495 | |
Valero Energy Corp. | | | 115,500 | | | | 6,121,500 | |
| | | | | | | | |
| | | | | | | | 121,323,320 | |
Pharmaceuticals — 4.5% | | | | | | | | |
Allergan PLC (a) | | | 62,438 | | | | 14,380,096 | |
Johnson & Johnson | | | 78,695 | | | | 9,296,240 | |
Mallinckrodt PLC (a) | | | 232,098 | | | | 16,195,798 | |
Pfizer, Inc. | | | 958,356 | | | | 32,459,518 | |
Teva Pharmaceutical Industries Ltd. — ADR | | | 500,173 | | | | 23,012,960 | |
| | | | | | | | |
| | | | | | | | 95,344,612 | |
Road & Rail — 0.6% | | | | | | | | |
Norfolk Southern Corp. | | | 140,167 | | | | 13,604,609 | |
Semiconductors & Semiconductor Equipment — 3.0% | | | | | |
Intel Corp. | | | 305,370 | | | | 11,527,718 | |
| | | | | | | | |
| Common Stocks | | Shares | | | Value | |
Semiconductors & Semiconductor Equipment (continued) | | | | | |
Lam Research Corp. | | | 450,971 | | | $ | 42,711,463 | |
NVIDIA Corp. | | | 147,300 | | | | 10,092,996 | |
| | | | | | | | |
| | | | | | | | 64,332,177 | |
Software — 6.1% | | | | | | | | |
Activision Blizzard, Inc. | | | 1,106,890 | | | | 49,035,227 | |
Dell Technologies, Inc., Class V (a) | | | 119,626 | | | | 5,718,123 | |
Microsoft Corp. | | | 1,298,100 | | | | 74,770,560 | |
| | | | | | | | |
| | | | | | | | 129,523,910 | |
Specialty Retail — 4.7% | | | | | | | | |
GNC Holdings, Inc., Class A | | | 15,256 | | | | 311,528 | |
Home Depot, Inc. | | | 376,000 | | | | 48,383,680 | |
Lowe’s Cos., Inc. | | | 659,090 | | | | 47,592,889 | |
Ross Stores, Inc. | | | 73,958 | | | | 4,755,499 | |
| | | | | | | | |
| | | | | | | | 101,043,596 | |
Technology Hardware, Storage & Peripherals — 5.0% | | | | | |
Apple Inc. | | | 943,100 | | | | 106,617,455 | |
Tobacco — 2.3% | | | | | | | | |
Altria Group, Inc. | | | 787,007 | | | | 49,762,453 | |
Total Long-Term Investments (Cost — $1,595,947,902) — 96.7% | | | | | | | 2,063,263,293 | |
| | | | | | | | |
| Short-Term Securities | | | | | | |
BlackRock Liquidity Funds, T-Fund, Institutional Class, 0.20% (c)(d) | | | 73,479,703 | | | | 73,479,703 | |
| | | Beneficial
Interest
(000) | | | | |
BlackRock Liquidity Series, LLC, Money Market Series, 0.51% (c)(d)(e) | | | $ 5,155 | | | | 5,154,808 | |
Total Short-Term Securities (Cost — $78,634,511) — 3.7% | | | | | | | 78,634,511 | |
Total Investments (Cost — $1,674,582,413) — 100.4% | | | | 2,141,897,804 | |
Liabilities in Excess of Other Assets — (0.4)% | | | | (9,193,165 | ) |
| | | | | | | | |
Net Assets — 100.0% | | | | | | $ | 2,132,704,639 | |
| | | | | | | | |
|
| Notes to Schedule of Investments |
| (a) | Non-income producing security. |
| (b) | Security, or a portion of security, is on loan. |
| (c) | During the year ended September 30, 2016, investments in issuers considered to be affiliates of the Portfolio for purposes of Section 2(a)(3) of the Investment Company Act of 1940, as amended, were as follows: |
| | | | | | | | | | | | | | | | | | | | | | | | |
| Affiliate | | Shares/Beneficial
Interest Held at
September 30,
2015 | | | Net Activity | | | Shares/Beneficial
Interest Held at
September 30, 2016 | | | Value at
September 30,
2016 | | | Income | | | Realized
Gain | |
BlackRock Liquidity Funds, TempFund, Institutional Class | | | 29,818,476 | | | | (29,818,476 | ) | | | — | | | | — | | | $ | 133,852 | | | | $500 | |
BlackRock Liquidity Funds, T-Fund, Institutional Class | | | — | | | | 73,479,703 | | | | 73,479,703 | | | | $73,479,703 | | | | 12,126 | | | | — | |
BlackRock Liquidity Series, LLC, Money Market Series | | | — | | | | $ 5,154,808 | | | | $ 5,154,808 | | | | 5,154,808 | | | | 23,936 | 1 | | | — | |
Total | | | | | | | | | | | | | | | $78,634,511 | | | $ | 169,914 | | | | $500 | |
| 1 | Represents securities lending income earned from the reinvestment of cash collateral from loaned securities, net of fees and collateral investment expenses, and other payments to and from borrowers of securities. |
See Notes to Financial Statements.
| | | | | | |
| | | BLACKROCK LARGE CAP SERIES FUNDS, INC. | | SEPTEMBER 30, 2016 | | 47 |
| | | | |
| Schedule of Investments (concluded) | | | Master Large Cap Core Portfolio | |
| (d) | Current yield as of period end. |
| (e) | Security was purchased with the cash collateral from loaned securities. The Portfolio may withdraw up to 25% of its investment daily, although the manager of the BlackRock Liquidity Series, LLC, Money Market Series, in its sole discretion, may permit an investor to withdraw more than 25% on any one day. |
| • | | For Portfolio compliance purposes, the Portfolio’s industry classifications refer to one or more of the industry sub-classifications used by one or more widely recognized market indexes or ratings group indexes, and/or as defined by the investment adviser. These definitions may not apply for purposes of this report, which may combine such industry sub-classifications for reporting ease. |
|
| Derivative Financial Instruments Categorized by Risk Exposure |
For the year ended September 30, 2016, the effect of derivative financial instruments in the Statements of Operation was as follows:
| | | | | | | | | | | | | | | | | | | | | | | | | | | | |
| | | Commodity
Contracts | | | Credit
Contracts | | | Equity
Contracts | | | Foreign
Currency
Exchange
Contracts | | | Interest
Rate
Contracts | | | Other
Contracts | | | Total | |
| Net Realized Gain from: | | | | | | | | | | | | | | | | | | | | | |
Futures contracts | | | — | | | | — | | | $ | 4,978,523 | | | | — | | | | — | | | | — | | | $ | 4,978,523 | |
|
| Average Quarterly Balances of Outstanding Derivative Financial Instruments |
| | | | |
Futures contracts: | | | | |
Average notional value of contracts — long | | $ | 86,686,488 | 1 |
| | 1 | | Actual amounts for the period are shown due to limited outstanding derivative financial instruments as of each quarter end. |
For more information about the Portfolio’s investment risks regarding derivative financial instruments, refer to the Notes to Financial Statements
|
| Fair Value Hierarchy as of Period End |
Various inputs are used in determining the fair value of investments. For information about the Portfolio’s policy regarding valuation of investments, refer to the Notes to Financial Statements.
The following table summarizes the Portfolio’s investments categorized in the disclosure hierarchy:
| | | | | | | | | | | | | | | | |
| | | Level 1 | | | Level 2 | | | Level 3 | | | Total | |
Assets: | | | | | | | | | | | | | | | | |
Investments: | | | | | | | | | | | | | | | | |
Long-Term Investments: | | | | | | | | | | | | | | | | |
Common Stocks1 | | $ | 2,063,263,293 | | | | — | | | | — | | | $ | 2,063,263,293 | |
Short-Term Securities | | | 73,479,703 | | | | 5,154,808 | | | | — | | | | 78,634,511 | |
Total | | $ | 2,136,742,996 | | | | 5,154,808 | | | | — | | | $ | 2,141,897,804 | |
1 See above Schedule of Investments for values in each industry. | |
|
The Portfolio may hold assets and/or liabilities in which the fair value approximates the carrying amount for financial statement purposes. As of period end, such assets and/or liabilities are categorized within the disclosure hierarchy as follows: | |
| | | Level 1 | | | Level 2 | | | Level 3 | | | Total | |
Liabilities: | | | | | | | | | | | | | | | | |
Bank Overdraft | | | — | | | $ | (64,594 | ) | | | | | | $ | (64,594 | ) |
Collateral on securities loaned at value | | | — | | | | (5,154,808 | ) | | | — | | | | (5,154,808 | ) |
Total | | | — | | | $ | (5,219,402 | ) | | | — | | | $ | (5,219,402 | ) |
During the year ended September 30, 2016, there were no transfers between levels.
See Notes to Financial Statements.
| | | | | | |
| 48 | | BLACKROCK LARGE CAP SERIES FUNDS, INC. | | SEPTEMBER 30, 2016 | | |
| | | | |
| Schedule of Investments September 30, 2016 | | | Master Large Cap Growth Portfolio | |
| | | (Percentages shown are based on Net Assets) | |
| | | | | | | | |
| Common Stocks | | Shares | | | Value | |
Airlines — 3.4% | | | | | | | | |
Delta Air Lines, Inc. | | | 242,224 | | | $ | 9,533,937 | |
JetBlue Airways Corp. (a) | | | 186,833 | | | | 3,221,001 | |
Southwest Airlines Co. | | | 493,041 | | | | 19,174,364 | |
United Continental Holdings, Inc. (a) | | | 125,930 | | | | 6,607,547 | |
| | | | | | | | |
| | | | | | | | 38,536,849 | |
Auto Components — 2.7% | | | | | | | | |
Goodyear Tire & Rubber Co. | | | 257,829 | | | | 8,327,877 | |
Lear Corp. | | | 187,224 | | | | 22,695,293 | |
| | | | | | | | |
| | | | | | | | 31,023,170 | |
Banks — 2.4% | | | | | | | | |
U.S. Bancorp | | | 527,410 | | | | 22,620,615 | |
Wells Fargo & Co. | | | 102,300 | | | | 4,529,844 | |
| | | | | | | | |
| | | | | | | | 27,150,459 | |
Beverages — 2.0% | | | | | | | | |
Dr. Pepper Snapple Group, Inc. | | | 251,570 | | | | 22,970,857 | |
Biotechnology — 7.8% | | | | | | | | |
Amgen, Inc. | | | 216,220 | | | | 36,067,658 | |
Biogen, Inc. (a) | | | 76,618 | | | | 23,983,733 | |
Gilead Sciences, Inc. | | | 367,555 | | | | 29,080,952 | |
| | | | | | | | |
| | | | | | | | 89,132,343 | |
Capital Markets — 0.7% | | | | | | | | |
Goldman Sachs Group, Inc. | | | 52,819 | | | | 8,518,120 | |
Chemicals — 1.1% | | | | | | | | |
Dow Chemical Co. | | | 138,860 | | | | 7,197,114 | |
Eastman Chemical Co. | | | 72,722 | | | | 4,921,825 | |
| | | | | | | | |
| | | | | | | | 12,118,939 | |
Communications Equipment — 1.6% | | | | | | | | |
Cisco Systems, Inc. | | | 574,270 | | | | 18,215,844 | |
Construction & Engineering — 0.5% | | | | | | | | |
AECOM (a) | | | 195,503 | | | | 5,812,304 | |
Consumer Finance — 1.1% | | | | | | | | |
SLM Corp. (a) | | | 1,659,452 | | | | 12,396,106 | |
Containers & Packaging — 2.8% | | | | | | | | |
Avery Dennison Corp. | | | 194,324 | | | | 15,116,464 | |
Packaging Corp. of America | | | 202,474 | | | | 16,453,037 | |
| | | | | | | | |
| | | | | | | | 31,569,501 | |
Electronic Equipment, Instruments & Components — 1.7% | | | | | |
CDW Corp. | | | 420,110 | | | | 19,211,630 | |
Energy Equipment & Services — 0.5% | | | | | | | | |
Schlumberger Ltd. | | | 65,956 | | | | 5,186,780 | |
Food & Staples Retailing — 3.2% | | | | | | | | |
CVS Health Corp. | | | 164,915 | | | | 14,675,786 | |
Walgreens Boots Alliance, Inc. | | | 265,887 | | | | 21,435,810 | |
| | | | | | | | |
| | | | | | | | 36,111,596 | |
Food Products — 0.7% | | | | | | | | |
Tyson Foods, Inc., Class A | | | 113,626 | | | | 8,484,453 | |
Health Care Providers & Services — 8.4% | | | | | | | | |
Aetna, Inc. | | | 209,220 | | | | 24,154,449 | |
Centene Corp. (a) | | | 231,930 | | | | 15,530,033 | |
Humana, Inc. | | | 46,410 | | | | 8,209,465 | |
Laboratory Corp. of America Holdings (a) | | | 104,580 | | | | 14,377,658 | |
UnitedHealth Group, Inc. | | | 171,880 | | | | 24,063,200 | |
Universal Health Services, Inc., Class B | | | 82,856 | | | | 10,209,516 | |
| | | | | | | | |
| | | | | | | | 96,544,321 | |
| | | | | | | | |
| Common Stocks | | Shares | | | Value | |
Hotels, Restaurants & Leisure — 0.4% | | | | | | | | |
Wyndham Worldwide Corp. | | | 65,917 | | | $ | 4,438,192 | |
Household Durables — 1.9% | | | | | | | | |
DR Horton, Inc. | | | 379,008 | | | | 11,446,042 | |
Lennar Corp., Class A | | | 126,281 | | | | 5,346,738 | |
NVR, Inc. (a) | | | 3,322 | | | | 5,447,648 | |
| | | | | | | | |
| | | | | | | | 22,240,428 | |
Industrial Conglomerates — 0.7% | | | | | | | | |
3M Co. | | | 42,212 | | | | 7,439,021 | |
Internet & Direct Marketing Retail — 1.8% | | | | | | | | |
Priceline Group, Inc. (a) | | | 14,275 | | | | 21,005,520 | |
Internet Software & Services — 9.0% | | | | | | | | |
Alphabet, Inc., Class A (a) | | | 47,053 | | | | 37,833,435 | |
Alphabet, Inc., Class C (a) | | | 46,577 | | | | 36,203,836 | |
Facebook, Inc., Class A (a) | | | 200,282 | | | | 25,690,172 | |
GoDaddy, Inc., Class A (a) | | | 97,312 | | | | 3,360,183 | |
| | | | | | | | |
| | | | | | | | 103,087,626 | |
IT Services — 2.8% | | | | | | | | |
Amdocs Ltd. | | | 174,583 | | | | 10,099,627 | |
Cognizant Technology Solutions Corp., Class A (a) | | | 284,841 | | | | 13,589,764 | |
Total System Services, Inc. | | | 172,928 | | | | 8,153,555 | |
| | | | | | | | |
| | | | | | | | 31,842,946 | |
Machinery — 0.5% | | | | | | | | |
WABCO Holdings, Inc. (a) | | | 49,530 | | | | 5,623,141 | |
Media — 5.6% | | | | | | | | |
Comcast Corp., Class A | | | 620,800 | | | | 41,183,872 | |
Omnicom Group, Inc. | | | 262,895 | | | | 22,346,075 | |
| | | | | | | | |
| | | | | | | | 63,529,947 | |
Multiline Retail — 0.2% | | | | | | | | |
Dollar General Corp. | | | 31,931 | | | | 2,234,851 | |
Oil, Gas & Consumable Fuels — 0.2% | | | | | | | | |
TOTAL SA — ADR | | | 47,500 | | | | 2,265,750 | |
Pharmaceuticals — 3.3% | | | | | | | | |
Allergan PLC (a) | | | 61,629 | | | | 14,193,775 | |
Merck & Co., Inc. | | | 111,847 | | | | 6,980,371 | |
Pfizer, Inc. | | | 143,498 | | | | 4,860,277 | |
Teva Pharmaceutical Industries Ltd. — ADR | | | 246,462 | | | | 11,339,717 | |
| | | | | | | | |
| | | | | | | | 37,374,140 | |
Semiconductors & Semiconductor Equipment — 3.4% | | | | | |
Lam Research Corp. | | | 242,279 | | | | 22,946,244 | |
NVIDIA Corp. | | | 237,177 | | | | 16,251,368 | |
| | | | | | | | |
| | | | | | | | 39,197,612 | |
Software — 7.1% | | | | | | | | |
Activision Blizzard, Inc. | | | 568,643 | | | | 25,190,885 | |
Dell Technologies, Inc., Class V (a) | | | 52,073 | | | | 2,489,089 | |
Microsoft Corp. | | | 937,610 | | | | 54,006,336 | |
| | | | | | | | |
| | | | | | | | 81,686,310 | |
Specialty Retail — 6.8% | | | | | | | | |
GNC Holdings, Inc., Class A | | | 13,146 | | | | 268,441 | |
Home Depot, Inc. | | | 289,750 | | | | 37,285,030 | |
Lowe’s Cos., Inc. | | | 356,600 | | | | 25,750,086 | |
Ross Stores, Inc. | | | 226,225 | | | | 14,546,268 | |
| | | | | | | | |
| | | | | | | | 77,849,825 | |
See Notes to Financial Statements.
| | | | | | |
| | | BLACKROCK LARGE CAP SERIES FUNDS, INC. | | SEPTEMBER 30, 2016 | | 49 |
| | | | |
| Schedule of Investments (continued) | | | Master Large Cap Growth Portfolio | |
| | | | | | | | |
| Common Stocks | | Shares | | | Value | |
Technology Hardware, Storage & Peripherals — 7.3% | | | | | |
Apple Inc. | | | 738,684 | | | $ | 83,508,226 | |
Tobacco — 2.9% | | | | | | | | |
Altria Group, Inc. | | | 527,865 | | | | 33,376,904 | |
Total Long-Term Investments (Cost — $783,637,637) — 94.5% | | | | | | | 1,079,683,711 | |
| | | | | | | | |
| Short-Term Securities | | Shares | | | Value | |
BlackRock Liquidity Funds, T-Fund, Institutional Class, 0.20% (b)(c) | | | 66,261,026 | | | $ | 66,261,026 | |
Total Short-Term Securities (Cost — $66,261,026) — 5.8% | | | | | | | 66,261,026 | |
Total Investments (Cost — $849,898,663) — 100.3% | | | | 1,145,944,737 | |
Liabilities in Excess of Other Assets — (0.3)% | | | | | | | (3,236,734 | ) |
| | | | | | | | |
Net Assets — 100.0% | | | | | | $ | 1,142,708,003 | |
| | | | | | | | |
|
| Notes to Schedule of Investments |
| (a) | Non-income producing security. |
| (b) | During the year ended September 30, 2016, investments in issuers considered to be affiliates of the Portfolio for purposes of Section 2(a)(3) of the Investment Company Act of 1940, as amended, were as follows: |
| | | | | | | | | | | | | | | | | | | | | | | | |
| Affiliate | | Shares/Beneficial
Interest Held at
September 30,
2015 | | | Net Activity | | | Shares/Beneficial
Interest Held at
September 30, 2016 | | | Value at
September 30,
2016 | | | Income | | | Realized
Gain | |
BlackRock Liquidity Funds, TempFund, Institutional Class | | | 12,025,797 | | | | (12,025,797 | ) | | | — | | | | — | | | | $123,432 | | | | $712 | |
BlackRock Liquidity Funds, T-Fund, Institutional Class | | | — | | | | 66,261,026 | | | | 66,261,026 | | | | $66,261,026 | | | | 11,719 | | | | — | |
BlackRock Liquidity Series, LLC, Money Market Series | | | $ 5,520,537 | | | | $ (5,520,537 | ) | | | — | | | | — | | | | 137,347 | 1 | | | — | |
Total | | | | | | | | | | | | | | | $66,261,026 | | | | $272,498 | | | | $712 | |
| 1 | Represents securities lending income earned from the reinvestment of cash collateral from loaned securities, net of fees and collateral investment expense, and other payments to and from borrowers of securities. |
| (c) | Current yield as of period end. |
| • | For Portfolio compliance purposes, the Portfolio’s industry classifications refer to one or more of the industry sub-classifications used by one or more widely recognized market indexes or ratings group indexes, and/or as defined by the investment adviser. These definitions may not apply for purposes of this report, which may combine such industry sub-classifications for reporting ease. |
|
| Derivative Financial Instruments Outstanding as of Period End |
| | | | | | | | | | | | | | | | |
| Futures Contracts | |
Contracts
Long | | Issue | | Expiration | | Notional Value | | | Unrealized Appreciation | |
| 200 | | S&P 500 E-Mini Index | | December 2016 | | | USD | | | | $21,604,000 | | | | $383,779 | |
|
| Derivative Financial Instruments Categorized by Risk Exposure |
As of period end, the fair values of derivative financial instruments located in the Statements of Assets and Liabilities were as follows:
| | | | | | | | | | | | | | | | | | | | | | | | | | | | | | | | |
| | | Statements of Assets and
Liabilities Location | | | Commodity
Contracts | | | Credit
Contracts | | | Equity
Contracts | | | foreign
Currency
Exchange
Contracts | | | Interest
Rate
Contracts | | | Other
Contracts | | | Total | |
Assets — Derivative Financial Instruments | | | | | | | | | | | | | | | | | | | | | | | | | | | | | | | | |
Futures contracts | | | Net unrealized appreciation1 | | | | — | | | | — | | | | $383,779 | | | | — | | | | — | | | | — | | | | $383,779 | |
| | 1 | | Includes cumulative appreciation (depreciation) on futures contracts, if any, as reported in the Schedule of Investments. Only current day’s variation margin is reported within the Statements of Assets and Liabilities. |
See Notes to Financial Statements.
| | | | | | |
| 50 | | BLACKROCK LARGE CAP SERIES FUNDS, INC. | | SEPTEMBER 30, 2016 | | |
| | | | |
| Schedule of Investments (concluded) | | | Master Large Cap Growth Portfolio | |
For the year ended September 30, 2016, the effect of derivative financial instruments in the Statements of Operation was as follows:
| | | | | | | | | | | | | | | | |
| Net Realized Gain from: | | Commodity Contracts | | Credit Contracts | | Equity Contracts | | Foreign Currency Exchange Contracts | | Interest Rate Contracts | | Other Contracts | | Total | |
Futures contracts | | — | | — | | $2,078,335 | | — | | — | | — | | $ | 2,078,335 | |
| | | | | | | | | | | | | | | | |
| Net Change in Unrealized Appreciation (Depreciation) on: | | | | | | | | | | | | | | | |
Futures contracts | | — | | — | | $ 383,779 | | — | | — | | — | | $ | 383,779 | |
|
| Average Quarterly Balances of Outstanding Derivative Financial Instruments |
| | | | |
Futures contracts: | | | | |
Average notional value of contracts — long | | $ | 15,421,398 | |
For more information about the Portfolio’s investment risks regarding derivative financial instruments, refer to the Notes to Financial Statements.
|
| Derivative Financial Instruments — Offsetting as of Period End |
The Portfolio’s derivative assets and liabilities (by type) were as follows:
| | | | | | | | | | |
| Master Large Cap Growth Portfolio | | | | Assets | | | | | Liabilities |
Derivative Financial Instruments: | | | | | | | | | | |
Futures contracts | | | | $ | 119,000 | | | | | — |
Total derivative assets and liabilities in the Statement of Assets and Liabilities | | | | | 119,000 | | | | | — |
Derivatives not subject to a Master Netting Agreement or similar agreement (“MNA”) | | | | | (119,000 | ) | | | | — |
Total derivative assets and liabilities subject to a MNA | | | | | — | | | | | — |
|
| Fair Value Hierarchy as of Period End |
Various inputs are used in determining the fair value of investments and derivative instruments. For information about the Portfolio’s policy regarding valuation of investments and derivative instruments, refer to the Notes to Financial Statements.
The following tables summarize the Portfolio’s investments categorized in the disclosure hierarchy:
| | | | | | | | | | | | | | | | |
| | | Level 1 | | | Level 2 | | | Level 3 | | | Total | |
Assets: | | | | | | | | | | | | | | | | |
Investments: | | | | | | | | | | | | | | | | |
Long-Term Investments1 | | $ | 1,079,683,711 | | | | — | | | | — | | | $ | 1,079,683,711 | |
Short-Term Securities | | | 66,261,026 | | | | — | | | | — | | | | 66,261,026 | |
| | | | |
Total | | $ | 1,145,944,737 | | | | — | | | | — | | | $ | 1,145,944,737 | |
| | | | |
| | | | | | | | | | | | | | | | |
Derivative Financial Instruments2 | | | | | | | | | | | | | | | | |
Assets: | | | | | | | | | | | | | | | | |
Equity contracts | | $ | 383,779 | | | | — | | | | — | | | $ | 383,779 | |
| | | | |
| | 1 | See above Schedule of Investments for values in each industry. |
| | 2 | Derivative financial instruments are futures contracts which are valued at the unrealized appreciation (depreciation) on the instrument. |
The Portfolio may hold assets and/or liabilities in which the fair value approximates the carrying amount for financial statement purposes. As of period end, cash pledged for futures contracts of $841,000 is categorized as Level 1 within the disclosure hierarchy.
During the year ended September 30, 2016, there were no transfers between levels.
See Notes to Financial Statements.
| | | | | | |
| | | BLACKROCK LARGE CAP SERIES FUNDS, INC. | | SEPTEMBER 30, 2016 | | 51 |
| | | | |
| Schedule of Investments September 30, 2016 | | | Master Large Cap Value Portfolio | |
| | | (Percentages shown are based on Net Assets) | |
| | | | | | | | |
| Common Stocks | | Shares | | | Value | |
Aerospace & Defense — 1.5% | | | | | | | | |
Raytheon Co. | | | 89,789 | | | $ | 12,222,977 | |
Airlines — 1.2% | | | | | | | | |
JetBlue Airways Corp. (a) | | | 141,800 | | | | 2,444,632 | |
Southwest Airlines Co. | | | 79,724 | | | | 3,100,466 | |
United Continental Holdings, Inc. (a) | | | 79,200 | | | | 4,155,624 | |
| | | | | | | | |
| | | | | | | | 9,700,722 | |
Auto Components — 4.0% | | | | | | | | |
Goodyear Tire & Rubber Co. | | | 480,716 | | | | 15,527,127 | |
Lear Corp. | | | 139,708 | | | | 16,935,404 | |
| | | | | | | | |
| | | | | | | | 32,462,531 | |
Banks — 16.4% | | | | | | | | |
Bank of America Corp. | | | 1,892,078 | | | | 29,611,021 | |
Citigroup, Inc. | | | 324,226 | | | | 15,313,194 | |
JPMorgan Chase & Co. | | | 619,488 | | | | 41,251,706 | |
SunTrust Banks, Inc. | | | 353,436 | | | | 15,480,497 | |
U.S. Bancorp | | | 589,151 | | | | 25,268,686 | |
Wells Fargo & Co. | | | 98,559 | | | | 4,364,192 | |
| | | | | | | | |
| | | | | | | | 131,289,296 | |
Biotechnology — 1.9% | | | | | | | | |
Amgen, Inc. | | | 35,870 | | | | 5,983,475 | |
Gilead Sciences, Inc. | | | 113,019 | | | | 8,942,063 | |
| | | | | | | | |
| | | | | | | | 14,925,538 | |
Building Products — 1.2% | | | | | | | | |
Owens Corning | | | 182,828 | | | | 9,761,187 | |
Capital Markets — 2.1% | | | | | | | | |
Goldman Sachs Group, Inc. | | | 102,121 | | | | 16,469,054 | |
Chemicals — 1.4% | | | | | | | | |
Dow Chemical Co. | | | 134,229 | | | | 6,957,089 | |
Eastman Chemical Co. | | | 62,156 | | | | 4,206,718 | |
| | | | | | | | |
| | | | | | | | 11,163,807 | |
Communications Equipment — 3.7% | | | | | | | | |
Cisco Systems, Inc. | | | 931,652 | | | | 29,552,001 | |
Construction & Engineering — 0.6% | | | | | | | | |
AECOM (a) | | | 91,946 | | | | 2,733,556 | |
EMCOR Group, Inc. | | | 38,574 | | | | 2,299,782 | |
| | | | | | | | |
| | | | | | | | 5,033,338 | |
Consumer Finance — 1.1% | | | | | | | | |
SLM Corp. (a) | | | 1,137,310 | | | | 8,495,706 | |
Containers & Packaging — 1.2% | | | | | | | | |
Avery Dennison Corp. | | | 121,631 | | | | 9,461,675 | |
Diversified Financial Services — 1.0% | | | | | | | | |
Berkshire Hathaway, Inc., Class B (a) | | | 54,417 | | | | 7,861,624 | |
Diversified Telecommunication Services — 1.1% | | | | | |
AT&T Inc. | | | 226,200 | | | | 9,185,982 | |
Electric Utilities — 0.7% | | | | | | | | |
FirstEnergy Corp. | | | 160,058 | | | | 5,294,719 | |
Electrical Equipment — 0.2% | | | | | | | | |
Eaton Corp. PLC | | | 18,110 | | | | 1,190,008 | |
Electronic Equipment, Instruments & Components — 2.1% | | | | | |
CDW Corp. | | | 207,882 | | | | 9,506,444 | |
Flex Ltd. (a) | | | 529,210 | | | | 7,207,840 | |
| | | | | | | | |
| | | | | | | | 16,714,284 | |
Energy Equipment & Services — 1.5% | | | | | | | | |
Schlumberger Ltd. | | | 154,985 | | | | 12,188,020 | |
| | | | | | | | |
| Common Stocks | | Shares | | | Value | |
Food & Staples Retailing — 4.0% | | | | | | | | |
CVS Health Corp. | | | 130,710 | | | $ | 11,631,883 | |
Walgreens Boots Alliance, Inc. | | | 237,132 | | | | 19,117,582 | |
Wal-Mart Stores, Inc. | | | 22,040 | | | | 1,589,525 | |
| | | | | | | | |
| | | | | | | | 32,338,990 | |
Food Products — 0.9% | | | | | | | | |
Tyson Foods, Inc., Class A | | | 99,708 | | | | 7,445,196 | |
Health Care Providers & Services — 8.9% | | | | | | | | |
Aetna, Inc. | | | 165,594 | | | | 19,117,827 | |
Centene Corp. (a) | | | 120,108 | | | | 8,042,432 | |
Cigna Corp. | | | 36,399 | | | | 4,743,518 | |
Humana, Inc. | | | 58,964 | | | | 10,430,142 | |
Laboratory Corp. of America Holdings (a) | | | 74,803 | | | | 10,283,916 | |
UnitedHealth Group, Inc. | | | 75,774 | | | | 10,608,360 | |
Universal Health Services, Inc., Class B | | | 67,812 | | | | 8,355,795 | |
| | | | | | | | |
| | | | | | | | 71,581,990 | |
Hotels, Restaurants & Leisure — 2.3% | | | | | | | | |
Carnival Corp. | | | 369,641 | | | | 18,045,874 | |
Household Durables — 2.0% | | | | | | | | |
DR Horton, Inc. | | | 401,231 | | | | 12,117,176 | |
Lennar Corp., Class A | | | 94,754 | | | | 4,011,884 | |
| | | | | | | | |
| | | | | | | | 16,129,060 | |
Industrial Conglomerates — 0.8% | | | | | | | | |
General Electric Co. | | | 221,465 | | | | 6,559,793 | |
Insurance — 2.7% | | | | | | | | |
American International Group, Inc. | | | 208,560 | | | | 12,375,950 | |
Travelers Cos., Inc. | | | 78,706 | | | | 9,015,772 | |
| | | | | | | | |
| | | | | | | | 21,391,722 | |
IT Services — 1.1% | | | | | | | | |
Amdocs Ltd. | | | 144,698 | | | | 8,370,779 | |
Cognizant Technology Solutions Corp., Class A (a) | | | 7,488 | | | | 357,252 | |
| | | | | | | | |
| | | | | | | | 8,728,031 | |
Media — 2.5% | | | | | | | | |
Comcast Corp., Class A | | | 307,750 | | | | 20,416,135 | |
Metals & Mining — 0.9% | | | | | | | | |
Rio Tinto PLC — ADR | | | 220,622 | | | | 7,368,775 | |
Multiline Retail — 0.2% | | | | | | | | |
Dollar General Corp. | | | 22,335 | | | | 1,563,227 | |
Multi-Utilities — 1.1% | | | | | | | | |
Public Service Enterprise Group, Inc. | | | 153,034 | | | | 6,407,534 | |
SCANA Corp. | | | 35,167 | | | | 2,545,036 | |
| | | | | | | | |
| | | | | | | | 8,952,570 | |
Oil, Gas & Consumable Fuels — 9.5% | | | | | | | | |
Anadarko Petroleum Corp. | | | 48,213 | | | | 3,054,776 | |
BP PLC — ADR | | | 360,791 | | | | 12,685,412 | |
Chevron Corp. | | | 162,563 | | | | 16,730,984 | |
Exxon Mobil Corp. | | | 164,099 | | | | 14,322,561 | |
Hess Corp. | | | 54,342 | | | | 2,913,818 | |
Marathon Oil Corp. | | | 150,983 | | | | 2,387,041 | |
Statoil ASA — ADR (b) | | | 134,510 | | | | 2,259,768 | |
Suncor Energy, Inc. | | | 501,682 | | | | 13,936,726 | |
Tesoro Corp. | | | 37,227 | | | | 2,961,780 | |
TOTAL SA — ADR | | | 42,028 | | | | 2,004,736 | |
Valero Energy Corp. | | | 58,793 | | | | 3,116,029 | |
| | | | | | | | |
| | | | | | | | 76,373,631 | |
See Notes to Financial Statements.
| | | | | | |
| 52 | | BLACKROCK LARGE CAP SERIES FUNDS, INC. | | SEPTEMBER 30, 2016 | | |
| | | | |
| Schedule of Investments (continued) | | | Master Large Cap Value Portfolio | |
| | | | | | | | |
| Common Stocks | | Shares | | | Value | |
Pharmaceuticals — 6.7% | | | | | | | | |
Allergan PLC (a) | | | 23,428 | | | $ | 5,395,703 | |
Johnson & Johnson | | | 57,911 | | | | 6,841,026 | |
Mallinckrodt PLC (a) | | | 95,979 | | | | 6,697,415 | |
Merck & Co., Inc. | | | 94,476 | | | | 5,896,247 | |
Mylan NV (a) | | | 26,249 | | | | 1,000,612 | |
Pfizer, Inc. | | | 543,530 | | | | 18,409,361 | |
Teva Pharmaceutical Industries Ltd. — ADR | | | 208,353 | | | | 9,586,321 | |
| | | | | | | | |
| | | | | | | | 53,826,685 | |
Road & Rail — 0.9% | | | | | | | | |
Norfolk Southern Corp. | | | 72,566 | | | | 7,043,256 | |
Semiconductors & Semiconductor Equipment — 3.6% | | | | | | | | |
Intel Corp. | | | 185,525 | | | | 7,003,569 | |
Lam Research Corp. | | | 156,964 | | | | 14,866,060 | |
NVIDIA Corp. | | | 105,496 | | | | 7,228,586 | |
| | | | | | | | |
| | | | | | | | 29,098,215 | |
Software — 3.2% | | | | | | | | |
Activision Blizzard, Inc. | | | 292,476 | | | | 12,956,686 | |
Dell Technologies, Inc., Class V (a) | | | 52,845 | | | | 2,525,991 | |
Microsoft Corp. | | | 181,522 | | | | 10,455,667 | |
| | | | | | | | |
| | | | | | | | 25,938,344 | |
Specialty Retail — 0.2% | | | | | | | | |
GNC Holdings, Inc., Class A | | | 17,183 | | | | 350,877 | |
Lowe’s Cos., Inc. | | | 20,093 | | | | 1,450,915 | |
| | | | | | | | |
| | | | | | | | 1,801,792 | |
| | | | | | | | |
| Common Stocks | | Shares | | | Value | |
Technology Hardware, Storage & Peripherals — 2.7% | | | | | |
Apple Inc. | | | 172,488 | | | $ | 19,499,768 | |
Western Digital Corp. | | | 30,158 | | | | 1,763,338 | |
| | | | | | | | |
| | | | | | | | 21,263,106 | |
Tobacco — 1.5% | | | | | | | | |
Altria Group, Inc. | | | 184,213 | | | | 11,647,788 | |
Total Long-Term Investments (Cost — $629,648,598) — 98.6% | | | | | | | 790,486,649 | |
| | | | | | | | |
| Short-Term Securities | | | | | | |
BlackRock Liquidity Funds, T-Fund, Institutional Class, 0.20% (c)(d) | | | 12,807,791 | | | | 12,807,791 | |
| | | Beneficial Interest (000) | | | | |
BlackRock Liquidity Series, LLC, Money Market Series, 0.51% (d)(e) | | | $ 1,861 | | | | 1,861,398 | |
Total Short-Term Securities (Cost — $14,669,189) — 1.8% | | | | | | | 14,669,189 | |
Total Investments (Cost — $644,317,787) — 100.4% | | | | | | | 805,155,838 | |
Liabilities in Excess of Other Assets — (0.4)% | | | | | | | (3,192,448 | ) |
| | | | | | | | |
Net Assets — 100.0% | | | | | | $ | 801,963,390 | |
| | | | | | | | |
| | |
| Notes to Schedule of Investments |
| (a) | Non-income producing security. |
| (b) | Security, or a portion of security, is on loan. |
| (c) | During the year ended September 30, 2016, investments in issuers considered to be affiliates of the Portfolio for purposes of Section 2(a)(3) of the Investment Company Act of 1940, as amended, were as follows: |
| | | | | | | | | | | | | | | | | | | | | | | | |
| Affiliate | | Shares/Beneficial Interest Held at September 30, 2015 | | | Net Activity | | | Shares/Beneficial Interest Held at September 30, 2016 | | | Value at September 30, 2016 | | | Income | | | Realized Gain | |
BlackRock Liquidity Funds, TempFund, Institutional Class | | | 20,813,175 | | | | (20,813,175 | ) | | | — | | | | — | | | | $39,587 | | | | $1,314 | |
BlackRock Liquidity Funds, T-Fund, Institutional Class | | | — | | | | 12,807,791 | | | | 12,807,791 | | | | $12,807,791 | | | | 2,004 | | | | — | |
BlackRock Liquidity Series, LLC, Money Market Series | | | — | | | $ | 1,861,398 | | | | $ 1,861,398 | | | | 1,861,398 | | | | 23,194 | 1 | | | — | |
Total | | | | | | | | | | | | | | | $14,669,189 | | | | $64,785 | | | | $1,314 | |
| | | | | | | | | | | | | | | | |
| 1 | Represents securities lending income earned from the reinvestment of cash collateral from loaned securities, net of fees and collateral investment expenses, and other payments to and from borrowers of securities. |
| (d) | Current yield as of period end. |
| (e) | Security was purchased with the cash collateral from loaned securities. The Portfolio may withdraw up to 25% of its investment daily, although the manager of the BlackRock Liquidity Series, LLC, Money Market Series, in its sole discretion, may permit an investor to withdraw more than 25% on any one day. |
| • | | For Portfolio compliance purposes, the Portfolio’s industry classifications refer to one or more of the industry sub-classifications used by one or more widely recognized market indexes or ratings group indexes, and/or as defined by the investment adviser. These definitions may not apply for purposes of this report, which may combine such industry sub-classifications for reporting ease. |
|
| Derivative Financial Instruments Categorized by Risk Exposure |
For the year ended September 30, 2016, the effect of derivative financial instruments in the Statements of Operation was as follows:
| | | | | | | | | | | | | | | | | | | | | | | | | | | | |
| | | Commodity Contracts | | | Credit Contracts | | | Equity Contracts | | | Foreign Currency Exchange Contracts | | | Interest Rate Contracts | | | Other Contracts | | | Total | |
Net Realized Loss from: | | | | | | | | | | | | | | | | | | | | | | | | | | | | |
Futures contracts | | | — | | | | — | | | | $(1,226,249 | ) | | | — | | | | — | | | | — | | | | $(1,226,249 | ) |
See Notes to Financial Statements.
| | | | | | |
| | | BLACKROCK LARGE CAP SERIES FUNDS, INC. | | SEPTEMBER 30, 2016 | | 53 |
| | | | |
| Schedule of Investments (concluded) | | | Master Large Cap Value Portfolio | |
|
| Average Quarterly Balances of Outstanding Derivative Financial Instruments |
| | | | |
Futures contracts: | | | | |
Average notional value of contracts — long | | $ | 3,536,508 | |
For more information about the Portfolio’s investment risks regarding derivative financial instruments, refer to the Notes to Financial Statements.
|
| Fair Value Hierarchy as of Period End |
Various inputs are used in determining the fair value of investments. For information about the Portfolio’s policy regarding valuation of investments, refer to the Notes to Financial Statements.
The following table summarizes the Portfolio’s investments categorized in the disclosure hierarchy:
| | | | | | | | | | | | | | | | |
| | | Level 1 | | | Level 2 | | | Level 3 | | | Total | |
Assets: | | | | | | | | | | | | | | | | |
Investments: | | | | | | | | | | | | | | | | |
Long-Term Investments: | | | | | | | | | | | | | | | | |
Common Stocks1 | | | $790,486,649 | | | | — | | | | — | | | | $790,486,649 | |
Short-Term Securities | | | 12,807,791 | | | | 1,861,398 | | | | — | | | | 14,669,189 | |
| | | | |
Total | | | $803,294,440 | | | | 1,861,398 | | | | — | | | | $805,155,838 | |
| | | | |
1 See above Schedule of Investments for values in each industry. | |
|
| The Portfolio may hold assets and/or liabilities in which the fair value approximates the carrying amount for financial statement purposes. As of period end, such assets and/or liabilities are categorized within the disclosure hierarchy as follows: | |
| | | | | | | | | | | | | | | | |
| | | Level 1 | | | Level 2 | | | Level 3 | | | Total | |
Liabilities: | | | | | | | | | | | | | | | | |
Bank overdraft | | | — | | | | $ (20,856 | ) | | | — | | | | $ (20,856) | |
Collateral on securities loaned at value | | | — | | | | (1,861,398 | ) | | | — | | | | (1,861,398) | |
Total | | | — | | | | $ (1,882,254 | ) | | | — | | | | $ (1,882,254) | |
| | | | |
During the year ended September 30, 2016, there were no transfers between levels.
See Notes to Financial Statements.
| | | | | | |
| 54 | | BLACKROCK LARGE CAP SERIES FUNDS, INC. | | SEPTEMBER 30, 2016 | | |
| | | | |
| Statements of Assets and Liabilities | | | Master Large Cap Series LLC | |
| | | | | | | | | | | | |
| September 30, 2016 | | Master Large Cap Core Portfolio | | | Master Large Cap Growth Portfolio | | | Master Large Cap Value Portfolio | |
| | | | | | | | | | | | |
| Assets | | | | | | | | | | | | |
Investments at value — unaffiliated1,2 | | $ | 2,063,263,293 | | | $ | 1,079,683,711 | | | $ | 790,486,649 | |
Investments at value — affiliated3 | | | 78,634,511 | | | | 66,261,026 | | | | 14,669,189 | |
Cash pledged for futures contracts | | | — | | | | 841,000 | | | | — | |
Receivables: | | | | | | | | | | | | |
Investments sold | | | 5,593,616 | | | | 446,669 | | | | 584,940 | |
Securities lending income — affiliated | | | 10,768 | | | | — | | | | 5,111 | |
Contributions from investors | | | 1,232,168 | | | | 1,161,530 | | | | 449,203 | |
Dividends — affiliated | | | 11,542 | | | | 11,093 | | | | 1,976 | |
Dividends — unaffiliated | | | 1,608,921 | | | | 1,155,202 | | | | 642,233 | |
Variation margin on futures contracts | | | — | | | | 119,000 | | | | — | |
Prepaid expenses | | | 1,815 | | | | 955 | | | | 702 | |
Other assets | | | 1,615 | | | | 1,425 | | | | 1,743 | |
| | | | |
Total assets | | | 2,150,358,249 | | | | 1,149,681,611 | | | | 806,841,746 | |
| | | | |
| | | | | | | | | | | | |
| Liabilities | | | | | | | | | | | | |
Bank overdraft | | | 64,594 | | | | — | | | | 20,856 | |
Cash collateral on securities loaned at value | | | 5,154,808 | | | | — | | | | 1,861,398 | |
Payables: | | | | | | | | | | | | |
Investments purchased | | | 8,212,890 | | | | 4,099,386 | | | | 1,186,231 | |
Directors’ fees | | | 16,804 | | | | 9,819 | | | | 7,539 | |
Investment advisory fees | | | 825,712 | | | | 466,462 | | | | 328,855 | |
Other accrued expenses | | | 94,008 | | | | 78,620 | | | | 72,668 | |
Other affiliates | | | 18,639 | | | | 9,718 | | | | 7,352 | |
Withdrawals to investors | | | 3,266,155 | | | | 2,309,603 | | | | 1,393,457 | |
| | | | |
Total liabilities | | | 17,653,610 | | | | 6,973,608 | | | | 4,878,356 | |
| | | | |
Net Assets | | $ | 2,132,704,639 | | | $ | 1,142,708,003 | | | $ | 801,963,390 | |
| | | | |
| | | | | | | | | | | | |
| Net Assets Consist of | | | | | | | | | | | | |
Investors’ capital | | $ | 1,665,389,248 | | | $ | 846,278,150 | | | $ | 641,125,339 | |
Net unrealized appreciation (depreciation) | | | 467,315,391 | | | | 296,429,853 | | | | 160,838,051 | |
| | | | |
Net Assets | | $ | 2,132,704,639 | | | $ | 1,142,708,003 | | | $ | 801,963,390 | |
| | | | |
1 Investments at cost — unaffiliated | | $ | 1,595,947,902 | | | $ | 783,637,637 | | | $ | 629,648,598 | |
2 Securities loaned at value | | $ | 5,094,163 | | | | — | | | $ | 1,839,499 | |
3 Investments at cost — affiliated | | $ | 78,634,511 | | | $ | 66,261,026 | | | $ | 14,669,189 | |
See Notes to Financial Statements.
| | | | | | |
| | | BLACKROCK LARGE CAP SERIES FUNDS, INC. | | SEPTEMBER 30, 2016 | | 55 |
| | | | |
| Statements of Operations | | | Master Large Cap Series LLC | |
| | | | | | | | | | | | |
| Year Ended September 30, 2016 | | Master Large Cap Core Portfolio | | | Master Large Cap Growth Portfolio | | | Master Large Cap Value Portfolio | |
| | | | | | | | | | | | |
| Investment Income | | | | | | | | | | | | |
Dividends — affiliated | | $ | 145,978 | | | $ | 135,151 | | | $ | 41,591 | |
Dividends — unaffiliated | | | 38,182,875 | | | | 16,489,698 | | | | 17,251,673 | |
Securities lending — affiliated — net | | | 23,936 | | | | 137,347 | | | | 23,194 | |
Foreign taxes withheld | | | (290,667 | ) | | | (55,255 | ) | | | (138,572 | ) |
| | | | |
Total income | | | 38,062,122 | | | | 16,706,941 | | | | 17,177,886 | |
| | | | |
| | | | | | | | | | | | |
| Expenses | | | | | | | | | | | | |
Investment advisory | | | 10,271,831 | | | | 5,728,009 | | | | 4,192,377 | |
Accounting services | | | 361,995 | | | | 218,674 | | | | 169,294 | |
Directors | | | 71,386 | | | | 41,998 | | | | 33,141 | |
Custodian | | | 62,652 | | | | 33,642 | | | | 32,009 | |
Professional | | | 50,937 | | | | 52,407 | | | | 47,877 | |
Printing | | | 5,595 | | | | 4,427 | | | | 4,135 | |
Miscellaneous | | | 33,770 | | | | 22,932 | | | | 20,090 | |
| | | | |
Total expenses | | | 10,858,166 | | | | 6,102,089 | | | | 4,498,923 | |
Less fees waived by the Manager | | | (32,136 | ) | | | (28,594 | ) | | | (12,562 | ) |
| | | | |
Total expenses after fees waived | | | 10,826,030 | | | | 6,073,495 | | | | 4,486,361 | |
| | | | |
Net investment income | | | 27,236,092 | | | | 10,633,446 | | | | 12,691,525 | |
| | | | |
| | | | | | | | | | | | |
| Realized and Unrealized Gain (Loss) | | | | | | | | | | | | |
Net realized gain (loss) from: | | | | | | | | | | | | |
Capital gain distributions received from affiliated investment companies | | | 500 | | | | 712 | | | | 1,314 | |
Futures contracts | | | 4,978,523 | | | | 2,078,335 | | | | (1,226,249 | ) |
Investments | | | 98,521,645 | | | | 70,369,294 | | | | 54,508,492 | |
Litigation Proceeds | | | 218,621 | | | | 254,416 | | | | 569,057 | |
| | | | |
| | | 103,719,289 | | | | 72,702,757 | | | | 53,852,614 | |
| | | | |
Net change in unrealized appreciation (depreciation) on: | | | | | | | | | | | | |
Futures contracts | | | — | | | | 383,779 | | | | — | |
Investments | | | 86,807,504 | | | | 52,124,477 | | | | 14,707,040 | |
| | | | |
| | | 86,807,504 | | | | 52,508,256 | | | | 14,707,040 | |
| | | | |
Total realized and unrealized gain | | | 190,526,793 | | | | 125,211,013 | | | | 68,559,654 | |
| | | | |
Net Increase in Net Assets Resulting from Operations | | $ | 217,762,885 | | | $ | 135,844,459 | | | $ | 81,251,179 | |
| | | | |
See Notes to Financial Statements.
| | | | | | |
| 56 | | BLACKROCK LARGE CAP SERIES FUNDS, INC. | | SEPTEMBER 30, 2016 | | |
| | | | |
| Statements of Changes in Net Assets | | | Master Large Cap Series LLC | |
| | | | | | | | | | | | | | | | |
| | | Master Large Cap Core Portfolio | | | Master Large Cap Growth Portfolio | |
| | | Year Ended September 30, | | | Year Ended September 30, | |
| Increase (Decrease) in Net Assets: | | 2016 | | | 2015 | | | 2016 | | | 2015 | |
| | | | | | | | | | | | | | | | |
| Operations | | | | | | | | | | | | | | | | |
Net investment income | | $ | 27,236,092 | | | $ | 25,910,700 | | | $ | 10,633,446 | | | $ | 10,399,038 | |
Net realized gain | | | 103,719,289 | | | | 143,142,291 | | | | 72,702,757 | | | | 61,300,472 | |
Net change in unrealized appreciation (depreciation) | | | 86,807,504 | | | | (174,949,314 | ) | | | 52,508,256 | | | | (45,409,726 | ) |
| | | | | | | | |
Net increase (decrease) in net assets resulting from operations | | | 217,762,885 | | | | (5,896,323 | ) | | | 135,844,459 | | | | 26,289,784 | |
| | | | | | | | |
| | | | | | | | | | | | | | | | |
| Capital Transactions | | | | | | | | | | | | | | | | |
Proceeds from contributions | | | 202,368,749 | | | | 241,299,172 | | | | 177,941,140 | | | | 261,731,405 | |
Value of withdrawals | | | (440,758,156 | ) | | | (417,574,858 | ) | | | (270,301,887 | ) | | | (345,492,080 | ) |
| | | | | | | | |
Net decrease in net assets derived from capital transactions | | | (238,389,407 | ) | | | (176,275,686 | ) | | | (92,360,747 | ) | | | (83,760,675 | ) |
| | | | | | | | |
| | | | | | | | | | | | | | | | |
| Net Assets | | | | | | | | | | | | | | | | |
Total increase (decrease) in net assets | | | (20,626,522 | ) | | | (182,172,009 | ) | | | 43,483,712 | | | | (57,470,891 | ) |
Beginning of year | | | 2,153,331,161 | | | | 2,335,503,170 | | | | 1,099,224,291 | | | | 1,156,695,182 | |
| | | | | | | | |
End of year | | $ | 2,132,704,639 | | | $ | 2,153,331,161 | | | $ | 1,142,708,003 | | | $ | 1,099,224,291 | |
| | | | | | | | |
| | | | | | | | | | | | | | | | |
| | | | | | | | | Master Large Cap Value Portfolio | |
| | | | | | | | | Year Ended September 30, | |
| Increase (Decrease) in Net Assets: | | | | | | | | 2016 | | | 2015 | |
| | | | | | | | | | | | | | | | |
| Operations | | | | | | | | | | | | | | | | |
Net investment income | | | | | | | | | | $ | 12,691,525 | | | $ | 12,527,519 | |
Net realized gain | | | | | | | | | | | 53,852,614 | | | | 72,604,118 | |
Net change in unrealized appreciation (depreciation) | | | | | | | | | | | 14,707,040 | | | | (94,139,946 | ) |
| | | | | | | | | | | | |
Net increase (decrease) in net assets resulting from operations | | | | | | | | | | | 81,251,179 | | | | (9,008,309 | ) |
| | | | | | | | | | | | |
| | | | | | | | | | | | | | | | |
| Capital Transactions | | | | | | | | | | | | | | | | |
Proceeds from contributions | | | | | | | | | | | 144,600,084 | | | | 131,159,081 | |
Value of withdrawals | | | | | | | | | | | (260,953,241 | ) | | | (251,436,817 | ) |
| | | | | | | | | | | | |
Net decrease in net assets derived from capital transactions | | | | | | | | | | | (116,353,157 | ) | | | (120,277,736 | ) |
| | | | | | | | | | | | |
| | | | | | | | | | | | | | | | |
| Net Assets | | | | | | | | | | | | | | | | |
Total increase (decrease) in net assets | | | | | | | | | | | (35,101,978 | ) | | | (129,286,045 | ) |
Beginning of year | | | | | | | | | | | 837,065,368 | | | | 966,351,413 | |
| | | | | | | | | | | | |
End of year | | | | | | | | | | $ | 801,963,390 | | | $ | 837,065,368 | |
| | | | | | | | | | | | |
See Notes to Financial Statements.
| | | | | | |
| | | BLACKROCK LARGE CAP SERIES FUNDS, INC. | | SEPTEMBER 30, 2016 | | 57 |
| | | | |
| Financial Highlights | | | Master Large Cap Series LLC | |
| | | | | | | | | | | | | | | | | | | | |
| | | Master Large Cap Core Portfolio | |
| | | Year Ended September 30, | |
| | | 2016 | | | 2015 | | | 2014 | | | 2013 | | | 2012 | |
| | | | | | | | | | | | | | | | | | | | |
| Total Return | | | | | | | | | | | | | | | | | | | | |
Total return | | | 10.34 | %1 | | | (0.89 | )% | | | 19.44 | % | | | 20.39 | % | | | 29.97 | % |
| | | | |
| | | | | | | | | | | | | | | | | | | | |
| Ratios to Average Net Assets | | | | | | | | | | | | | | | | | | | | |
Total expenses | | | 0.50 | % | | | 0.50 | % | | | 0.50 | % | | | 0.50 | % | | | 0.50 | % |
| | | | |
Total expenses after fees waived | | | 0.50 | % | | | 0.50 | % | | | 0.50 | % | | | 0.50 | % | | | 0.50 | % |
| | | | |
Net investment income | | | 1.25 | % | | | 1.09 | % | | | 1.08 | % | | | 1.29 | % | | | 1.67 | % |
| | | | |
| | | | | | | | | | | | | | | | | | | | |
| Supplemental Data | | | | | | | | | | | | | | | | | | | | |
Net assets, end of year (000) | | $ | 2,132,705 | | | $ | 2,153,331 | | | $ | 2,335,503 | | | $ | 2,308,896 | | | $ | 2,318,851 | |
| | | | |
Portfolio turnover rate | | | 39 | % | | | 41 | % | | | 40 | % | | | 50 | % | | | 128 | % |
| | | | |
| | | | | | | | | | | | | | | | | | | | |
| | | Master Large Cap Growth Portfolio | |
| | | Year Ended September 30, | |
| | | 2016 | | | 2015 | | | 2014 | | | 2013 | | | 2012 | |
| | | | | | | | | | | | | | | | | | | | |
| Total Return | | | | | | | | | | | | | | | | | | | | |
Total return | | | 12.75 | %1 | | | 1.70 | % | | | 21.59 | % | | | 15.76 | % | | | 31.61 | % |
| | | | |
| | | | | | | | | | | | | | | | | | | | |
| Ratios to Average Net Assets | | | | | | | | | | | | | | | | | | | | |
Total expenses | | | 0.53 | %2 | | | 0.53 | % | | | 0.53 | % | | | 0.54 | % | | | 0.55 | % |
| | | | |
Total expenses after fees waived | | | 0.53 | %2 | | | 0.53 | % | | | 0.53 | % | | | 0.54 | % | | | 0.55 | % |
| | | | |
Net investment income | | | 0.93 | %2 | | | 0.85 | % | | | 0.90 | % | | | 1.25 | % | | | 1.61 | % |
| | | | |
| | | | | | | | | | | | | | | | | | | | |
| Supplemental Data | | | | | | | | | | | | | | | | | | | | |
Net assets, end of year (000) | | $ | 1,142,708 | | | $ | 1,099,224 | | | $ | 1,156,695 | | | $ | 1,005,008 | | | $ | 913,632 | |
| | | | |
Portfolio turnover rate | | | 32 | % | | | 41 | % | | | 49 | % | | | 54 | % | | | 132 | % |
| | | | |
| | | | | | | | | | | | | | | | | | | | |
| | | Master Large Cap Value Portfolio | |
| | | Year Ended September 30, | |
| | | 2016 | | | 2015 | | | 2014 | | | 2013 | | | 2012 | |
| | | | | | | | | | | | | | | | | | | | |
| Total Return | | | | | | | | | | | | | | | | | | | | |
Total return | | | 10.68 | %3 | | | (1.63 | )% | | | 18.35 | % | | | 22.80 | % | | | 25.26 | % |
| | | | |
| | | | | | | | | | | | | | | | | | | | |
| Ratios to Average Net Assets | | | | | | | | | | | | | | | | | | | | |
Total expenses | | | 0.54 | % | | | 0.54 | % | | | 0.54 | % | | | 0.54 | % | | | 0.54 | % |
| | | | |
Total expenses after fees waived | | | 0.54 | % | | | 0.54 | % | | | 0.54 | % | | | 0.54 | % | | | 0.54 | % |
| | | | |
Net investment income | | | 1.51 | % | | | 1.33 | % | | | 1.37 | % | | | 1.58 | % | | | 1.71 | % |
| | | | |
| | | | | | | | | | | | | | | | | | | | |
| Supplemental Data | | | | | | | | | | | | | | | | | | | | |
Net assets, end of year (000) | | | $801,963 | | | | $837,065 | | | | $966,351 | | | | $955,547 | | | $ | 1,063,824 | |
| | | | |
Portfolio turnover rate | | | 40 | % | | | 30 | % | | | 32 | % | | | 40 | % | | | 147 | % |
| | | | |
| | 1 | | Includes proceeds received from a settlement of litigation, which had no impact on the Portfolio’s total return. |
| | 2 | | Excludes expenses incurred indirectly as a result of investments in underlying funds is 0.01%. |
| | 3 | | Includes payment received from a settlement of litigation, which impacted the Portfolio’s total return. Excluding the payment from a settlement of litigation, the Portfolio’s total return is 10.58%. |
See Notes to Financial Statements.
| | | | | | |
| 58 | | BLACKROCK LARGE CAP SERIES FUNDS, INC. | | SEPTEMBER 30, 2016 | | |
| | | | |
| Notes to Financial Statements | | | Master Large Cap Series LLC | |
1. Organization:
Master Large Cap Core Portfolio, Master Large Cap Growth Portfolio and Master Large Cap Value Portfolio (collectively, the “Portfolios” or individually, a “Portfolio”) are each a series of Master Large Cap Series LLC (the “Master LLC”). The Master LLC is registered under the Investment Company Act of 1940, as amended (the “1940 Act”), as an open-end management investment company and is organized as a Delaware limited liability company. Each Portfolio is classified as diversified. The Limited Liability Company Agreement of the Master LLC permits the Board of Directors of the Master LLC (the “Board and the members are referred to as “Directors”) to issue non-transferable interests in the Master LLC, subject to certain limitations.
The Portfolios, together with certain other registered investment companies advised by BlackRock Advisors, LLC (the “Manager”) or its affiliates, are included in a complex of open-end funds referred to as the Equity-Liquidity Complex.
2. Significant Accounting Policies:
The financial statements are prepared in conformity with accounting principles generally accepted in the United States of America (“U.S. GAAP”), which may require management to make estimates and assumptions that affect the reported amounts of assets and liabilities in the financial statements, disclosure of contingent assets and liabilities at the date of the financial statements and the reported amounts of increases and decreases in net assets from operations during the reporting period. Actual results could differ from those estimates. Each Portfolio is considered an investment company under U.S. GAAP and follows the accounting and reporting guidance applicable to investment companies. Below is a summary of significant accounting policies:
Segregation and Collateralization: In cases where a Portfolio enters into certain investments (e.g., futures contracts) that would be treated as “senior securities” for 1940 Act purposes, the Portfolio may segregate or designate on its books and records cash or liquid assets having a market value at least equal to the amount of its future obligations under such investments. Doing so allows the investment to be excluded from treatment as a “senior security.” Furthermore, if required by an exchange or counterparty agreement, the Portfolio may be required to deliver/deposit cash and/or securities to/with an exchange, or broker-dealer or custodian as collateral for certain investments or obligations.
Investment Transactions and Investment Income: For financial reporting purposes, investment transactions are recorded on the dates the transactions are entered into (the trade dates). Realized gains and losses on investment transactions are determined on the identified cost basis. Dividend income is recorded on the ex-dividend date. Dividends from foreign securities where the ex-dividend date may have passed are subsequently recorded when the Portfolios are informed of the ex-dividend date. Under the applicable foreign tax laws, a withholding tax at various rates may be imposed on capital gains, dividends and interest. Upon notification from issuers, some of the dividend income received from a real estate investment trust may be redesignated as a reduction of cost of the related investment and/or realized gain.
Indemnifications: In the normal course of business, a Portfolio enters into contracts that contain a variety of representations that provide general indemnification. A Portfolio’s maximum exposure under these arrangements is unknown because it involves future potential claims against a Portfolio, which cannot be predicted with any certainty.
Other: Expenses directly related to a Portfolio are charged to that Portfolio. Other operating expenses shared by several funds, including other funds managed by the Manager, are prorated among those funds on the basis of relative net assets or other appropriate methods.
Each Portfolio has an arrangement with its custodian whereby credits are earned on uninvested cash balances, which could be used to reduce custody fees and/or overdraft charges. Each Portfolio may incur charges on certain uninvested cash balances and overdrafts, subject to certain conditions.
3. Investment Valuation and Fair Value Measurements:
Investment Valuation Policies: The Portfolios’ investments are valued at fair value (also referred to as “market value” within the financial statements) as of the close of trading on the New York Stock Exchange (“NYSE”) (generally 4:00 p.m., Eastern time). U.S. GAAP defines fair value as the price the Portfolios would receive to sell an asset or pay to transfer a liability in an orderly transaction between market participants at the measurement date. The Portfolios determine the fair values of their financial instruments using various independent dealers or pricing services under policies approved by the Board. The BlackRock Global Valuation Methodologies Committee (the “Global Valuation Committee”) is the committee formed by management to develop global pricing policies and procedures and to oversee the pricing function for all financial instruments.
Fair Value Inputs and Methodologies: The following methods and inputs are used to establish the fair value of each Portfolio’s assets and liabilities:
| | • | | Equity investments traded on a recognized securities exchange are valued at the official closing price each day, if available. For equity investments traded on more than one exchange, the official closing price on the exchange where the stock is primarily traded is used. Equity investments traded on a recognized exchange for which there were no sales on that day may be valued at the last available bid (long positions) or ask (short positions) price. |
| | • | | Investments in open-end U.S. mutual funds are valued at net asset value (“NAV”) each business day. |
| | | | | | |
| | | BLACKROCK LARGE CAP SERIES FUNDS, INC. | | SEPTEMBER 30, 2016 | | 59 |
| | | | |
| Notes to Financial Statements (continued) | | | Master Large Cap Series LLC | |
| | • | | The Portfolios value their investment in BlackRock Liquidity Series, LLC, Money Market Series (the “Money Market Series”) at fair value, which is ordinarily based upon their pro rata ownership in the underlying fund’s net assets. The Money Market Series seeks current income consistent with maintaining liquidity and preserving capital. Although the Money Market Series is not registered under the 1940 Act, its investments may follow the parameters of investments by a money market fund that is subject to Rule 2a-7 under the 1940 Act. The Portfolios may withdraw up to 25% of their investment daily, although the manager of the Money Market Series, in its sole discretion, may permit an investor to withdraw more than 25% on any one day. |
| | • | | Futures contracts traded on exchanges are valued at their last sale price. |
If events (e.g., a company announcement, market volatility or a natural disaster) occur that are expected to materially affect the value of such investments, or in the event that the application of these methods of valuation results in a price for an investment that is deemed not to be representative of the market value of such investments, or if a price is not available, the investment will be valued by the Global Valuation Committee, or its delegate, in accordance with a policy approved by the Board as reflecting fair value (“Fair Valued Investments”). When determining the price for Fair Valued Investments, the Global Valuation Committee, or its delegate, seeks to determine the price that each Portfolio might reasonably expect to receive or pay from the current sale or purchase of that asset or liability in an arm’s-length transaction. Fair value determinations shall be based upon all available factors that the Global Valuation Committee, or its delegate, deems relevant and consistent with the principles of fair value measurement. The pricing of all Fair Valued Investments is subsequently reported to the Board or a committee thereof on a quarterly basis.
Fair Value Hierarchy: Various inputs are used in determining the fair value of investments and derivative financial instruments. These inputs to valuation methodologies are categorized into a fair value hierarchy consisting of three broad levels for financial statement purposes as follows:
| | • | | Level 1 — unadjusted price quotations in active markets/exchanges for identical assets or liabilities that each Portfolio has the ability to access |
| | • | | Level 2 — other observable inputs (including, but not limited to, quoted prices for similar assets or liabilities in markets that are active, quoted prices for identical or similar assets or liabilities in markets that are not active, inputs other than quoted prices that are observable for the assets or liabilities (such as interest rates, yield curves, volatilities, prepayment speeds, loss severities, credit risks and default rates) or other market-corroborated inputs) |
| | • | | Level 3 — unobservable inputs based on the best information available in the circumstances, to the extent observable inputs are not available (including each Portfolio’s own assumptions used in determining the fair value of investments and derivative financial instruments) |
The hierarchy gives the highest priority to unadjusted quoted prices in active markets for identical assets or liabilities (Level 1 measurements) and the lowest priority to unobservable inputs (Level 3 measurements). Accordingly, the degree of judgment exercised in determining fair value is greatest for instruments categorized in Level 3. The inputs used to measure fair value may fall into different levels of the fair value hierarchy. In such cases, for disclosure purposes, the fair value hierarchy classification is determined based on the lowest level input that is significant to the fair value measurement in its entirety. Investments classified within Level 3 have significant unobservable inputs used by the Global Valuation Committee in determining the price for Fair Valued Investments. Level 3 Investments include equity or debt issued by privately-held companies. There may not be a secondary market, and/or there are a limited number of investors. Level 3 investments may also be adjusted to reflect illiquidity and/or non-transferability, with the amount of such discount estimated by the Global Valuation Committee in the absence of market information.
Changes in valuation methodologies may result in transfers into or out of an assigned level within the hierarchy. In accordance with each Portfolio’s policy, transfers between different levels of the fair value hierarchy are deemed to have occurred as of the beginning of the reporting period. The categorization of a value determined for investments and derivative financial instruments is based on the pricing transparency of the investments and derivative financial instruments and is not necessarily an indication of the risks associated with investing in those securities.
4. Securities and Other Investments:
Securities Lending: Each Portfolio may lend its securities to approved borrowers, such as brokers, dealers and other financial institutions. The borrower pledges and maintains with the Portfolios collateral consisting of cash, an irrevocable letter of credit issued by a bank, or securities issued or guaranteed by the U.S. Government. The initial collateral received by each Portfolio is required to have a value of at least 102% of the current value of the loaned securities for securities traded on U.S. exchanges and a value of at least 105% for all other securities. The collateral is maintained thereafter at a value equal to at least 100% of the current market value of the securities on loan. The market value of the loaned securities is determined at the close of each business day of the Portfolio and any additional required collateral is delivered to the Portfolio, or excess collateral returned by the Portfolio, on the next business day. During the term of the loan, each Portfolio is entitled to all distributions made on or in respect of the loaned securities but does not receive interest income on securities received as collateral. Loans of securities are terminable at any time and the borrower, after notice, is required to return borrowed securities within the standard time period for settlement of securities transactions.
The market value of any securities on loan, all of which were classified as common stocks in the Portfolios’ Schedules of Investments, and the value of any related collateral are shown separately in the Statements of Assets and Liabilities as a component of investments at value — unaffiliated, and
| | | | | | |
| 60 | | BLACKROCK LARGE CAP SERIES FUNDS, INC. | | SEPTEMBER 30, 2016 | | |
| | | | |
| Notes to Financial Statements (continued) | | | Master Large Cap Series LLC | |
collateral on securities loaned at value, respectively. As of period end, any securities on loan were collateralized by cash and/or U.S. Government obligations. Cash collateral invested by the securities lending agent, BlackRock Investment Management, LLC (“BIM”), if any, is disclosed in the Schedules of Investments.
Securities lending transactions are entered into by the Portfolios under Master Securities Lending Agreements (each, an “MSLA”), which provide the right, in the event of default (including bankruptcy or insolvency), for the non-defaulting party to liquidate the collateral and calculate a net exposure to the defaulting party or request additional collateral. In the event that a borrower defaults, the Portfolios, as lender, would offset the market value of the collateral received against the market value of the securities loaned. When the value of the collateral is greater than that of the market value of the securities loaned, the lender is left with a net amount payable to the defaulting party. However, bankruptcy or insolvency laws of a particular jurisdiction may impose restrictions on or prohibitions against such a right of offset in the event of an MSLA counterparty’s bankruptcy or insolvency. Under the MSLA, absent an event of default the borrower can resell or re-pledge the loaned securities, and a Portfolio can reinvest cash collateral received in connection with loaned securities. Upon an event of default, the parties’ obligations to return the securities or collateral to the other party are extinguished, and the parties can resell or re-pledge the loaned securities or the collateral received in connection with the loaned securities in order to satisfy the defaulting party’s net payment obligation for all transactions under the MSLA. The defaulting party remains liable for any deficiency.
As of period end, the following table is a summary of Master Large Cap Core Portfolio’s securities lending agreements by counterparty which are subject to offset under an MSLA:
| | | | | | | | | | | | | | | | | | | | |
| | | Securities Loaned at Value | | | | | | Cash Collateral
Received1 | | | | | | Net Amount | |
Master Large Cap Core Portfolio | | | | | | | | | | | | | | | | | | | | |
Counterparty | | | | | | | | | | | | | | | | | | | | |
Morgan Stanley | | | $5,094,163 | | | | | | | | $5,094,163 | | | | | | | | — | |
| | | | |
Total | | | $5,094,163 | | | | | | | | $5,094,163 | | | | | | | | — | |
| | | | |
| | 1 | | Collateral with a value of $5,154,808 has been received in connection with securities lending agreements. Collateral received in excess of the value of securities loaned from the individual counterparty is not shown for financial reporting purposes in the table above. |
As of period end, the following table is a summary of Master Large Cap Value Portfolio’s securities lending agreements by counterparty, which are subject to offset under an MSLA:
| | | | | | | | | | | | | | | | | | | | |
| | | Securities Loaned at Value | | | | | | Cash Collateral
Received1 | | | | | | Net Amount | |
Master Large Cap Value Portfolio | | | | | | | | | | | | | | | | | | | | |
Counterparty | | | | | | | | | | | | | | | | | | | | |
Morgan Stanley | | | $1,839,499 | | | | | | | | $1,839,499 | | | | | | | | — | |
| | | | |
Total | | | $1,839,499 | | | | | | | | $1,839,499 | | | | | | | | — | |
| | | | |
| | 1 | | Collateral with a value of $1,861,398 has been received in connection with securities lending agreements. Collateral received in excess of the value of securities loaned from the individual counterparty is not shown for financial reporting purposes in the table above. |
The risks of securities lending include the risk that the borrower may not provide additional collateral when required or may not return the securities when due. To mitigate these risks, the Portfolios benefit from a borrower default indemnity provided by BIM. BIM’s indemnity allows for full replacement of the securities loaned if the collateral received does not cover the value on the securities loaned in the event of borrower default. Each Portfolio could suffer a loss if the value of an investment purchased with cash collateral falls below the market value of loaned securities or if the value of an investment purchased with cash collateral falls below the value of the original cash collateral received.
5. Derivative Financial Instruments:
The Portfolios engage in various portfolio investment strategies using derivative contracts both to increase the returns of the Portfolios and/or to manage their exposure to certain risks such as credit risk, equity risk, interest rate risk, foreign currency exchange rate risk, commodity price risk or other risks (e.g., inflation risk). Derivative financial instruments categorized by risk exposure are included in the Schedules of Investments. These contracts may be transacted on an exchange or over-the-counter (“OTC”).
Futures Contracts: Certain Portfolios invest in long and/or short positions in futures and options on futures contracts to gain exposure to, or manage exposure to, changes in interest rates (interest rate risk), changes in the value of equity securities (equity risk) or foreign currencies (foreign currency exchange rate risk).
Futures contracts are agreements between the Portfolios and a counterparty to buy or sell a specific quantity of an underlying instrument at a specified price and on a specified date. Depending on the terms of a contract, it is settled either through physical delivery of the underlying instrument on the settlement date or by payment of a cash amount on the settlement date. Upon entering into a futures contract, the Portfolios are required to deposit
| | | | | | |
| | | BLACKROCK LARGE CAP SERIES FUNDS, INC. | | SEPTEMBER 30, 2016 | | 61 |
| | | | |
| Notes to Financial Statements (continued) | | | Master Large Cap Series LLC | |
initial margin with the broker in the form of cash or securities in an amount that varies depending on a contract’s size and risk profile. The initial margin deposit must then be maintained at an established level over the life of the contract.
Securities deposited as initial margin are designated in the Schedules of Investments and cash deposited, if any, is shown as cash pledged for futures contracts in the Statements of Assets and Liabilities. Pursuant to the contract, the Portfolios agree to receive from or pay to the broker an amount of cash equal to the daily fluctuation in market value of the contract (“variation margin”). Variation margin is recorded as unrealized appreciation (depreciation) and, if any, shown as variation margin receivable (or payable) on futures contracts in the Statements of Assets and Liabilities. When the contract is closed, a realized gain or loss is recorded in the Statements of Operations equal to the difference between the value of the contract at the time it was opened and the value at the time it was closed. The use of futures contracts involves the risk of an imperfect correlation in the movements in the price of futures contracts and interest, foreign currency exchange rates or underlying assets.
6. Investment Advisory Agreement and Other Transactions with Affiliates:
The PNC Financial Services Group, Inc. is the largest stockholder and an affiliate of BlackRock, Inc. (“BlackRock”) for 1940 Act purposes.
Investment Advisory: The Master LLC, on behalf of each Portfolio, entered into an Investment Advisory Agreement with the Manager, the Portfolios’ investment adviser, an indirect, wholly-owned subsidiary of BlackRock, to provide investment advisory and administration services. The Manager is responsible for the management of each Portfolio and provides the personnel, facilities, equipment and certain other services necessary to the operations of each Portfolio.
For such services, each Portfolio pays the Manager a monthly fee, which is determined by calculating a percentage of each Portfolio’s average daily net assets, based on the following annual rates:
Master Large Cap Core Portfolio
| | | | |
| Average Daily Net Assets | | Investment
Advisory Fee | |
Not exceeding $1 Billion | | | 0.50% | |
In excess of $1 Billion, but not exceeding $5 Billion | | | 0.45% | |
In excess of $5 Billion | | | 0.40% | |
Master Large Cap Growth Portfolio | | | | |
| Average Daily Net Assets | | Investment
Advisory Fee | |
Not exceeding $5 Billion | | | 0.50% | |
In excess of $5 Billion | | | 0.45% | |
Master Large Cap Value Portfolio | | | | |
| Average Daily Net Assets | | Investment
Advisory Fee | |
Not exceeding $3 Billion | | | 0.50% | |
In excess of $3 Billion | | | 0.45% | |
Expense Limitations, Waivers and Reimbursements: With respect to the Portfolios, the Manager voluntarily agreed to waive its investment advisory fees by the amount of investment advisory fees each Portfolio pays to the Manager indirectly through its investment in affiliated money market funds. These amounts are included in fees waived by the Manager in the Statements of Operations.
Effective September 1, 2016, the Manager has voluntarily agreed to waive the investment advisory fee payable by each Portfolio with respect to any portion of such Portfolio’s assets estimated to be attributable to investments in other equity and fixed-income mutual funds and exchange-traded funds managed by the Manager or its affiliates that have a contractual management fee. This voluntary waiver may be reduced or discontinued at any time without notice.
For the year ended September 30, 2016, the Portfolios reimbursed the Manager for certain accounting services, which is included in accounting services in the Statements of Operations. The reimbursements were as follows:
| | | | |
Master Large Cap Core Portfolio | | $ | 24,452 | |
Master Large Cap Growth Portfolio | | $ | 13,140 | |
Master Large Cap Value Portfolio | | $ | 9,480 | |
| | | | | | |
| 62 | | BLACKROCK LARGE CAP SERIES FUNDS, INC. | | SEPTEMBER 30, 2016 | | |
| | | | |
| Notes to Financial Statements (continued) | | | Master Large Cap Series LLC | |
Securities Lending: The U.S. Securities and Exchange Commission has issued an exemptive order which permits BIM, an affiliate of the Manager, to serve as securities lending agent for the Portfolios, subject to applicable conditions. As securities lending agent, BIM bears all operational costs directly related to securities lending. The Portfolios are responsible for expenses in connection with the investment of cash collateral received for securities on loan (the “collateral investment expenses”). The cash collateral is invested in a private investment company managed by the Manager or its affiliates. However, BIM has agreed to cap the collateral investment expenses of the private investment company to an annual rate of 0.04%. The investment adviser to the private investment company will not charge any advisory fees with respect to shares purchased by the Portfolios.
Securities lending income is equal to the total of income earned from the reinvestment of cash collateral, net of fees and other payments to and from borrowers of securities, and less the collateral investment expenses. Each Portfolio retains a portion of securities lending income and remits a remaining portion to BIM as compensation for its services as securities lending agent. Pursuant to a securities lending agreement, BIM may lend securities only when the difference between the borrower rebate rate and the risk free rate exceeds a certain level (such securities, the “specials only securities”).
Pursuant to such agreement, each Portfolio retains 80% of securities lending income. In addition, commencing the business day following the date that the aggregate securities lending income earned across certain funds in the Equity-Liquidity Complex in a calendar year exceeds a specified threshold, each Portfolio, pursuant to the securities lending agreement, will retain for the remainder of the calendar year securities lending income in an amount equal to 85% of securities lending income.
The share of securities lending income earned by each Portfolio is shown as securities lending — affiliated — net in the Statements of Operations. For the year ended September 30, 2016, each Portfolio paid BIM the following amounts for securities lending agent services:
| | | | |
Master Large Cap
Core Portfolio | | Master Large Cap
Growth Portfolio | | Master Large Cap
Value Portfolio |
| $5,962 | | $28,633 | | $5,779 |
Officers and Directors: Certain officers and/or directors of the Master LLC are officers and/or directors of BlackRock or its affiliates.
7. Purchases and Sales:
For the year ended September 30, 2016, purchases and sales of investments, excluding short-term securities, were as follows:
| | | | | | | | | | | | | | | | | | | | | | | | | |
| | | Master Large Cap
Core Portfolio | | | | Master Large Cap
Growth Portfolio | | | | Master Large Cap
Value Portfolio |
Purchases | | | $ | 824,552,716 | | | | | | | | | $ | 352,390,670 | | | | | | | | | $ | 331,676,399 | |
Sales | | | $ | 1,066,862,096 | | | | | | | | | $ | 481,987,917 | | | | | | | | | $ | 424,585,577 | |
The Portfolios received proceeds from settlement of litigation where they were able to recover a portion of investment losses previously realized by the Portfolios. This amount is shown as litigation proceeds in the Statement of Operations.
8. Income Tax Information:
The Portfolios are classified as a partnership for federal income tax purposes. As such, each investor in the Portfolios is treated as the owner of its proportionate share of net assets, income, expenses and realized and unrealized gains and losses of the Portfolios. Therefore, no federal income tax provision is required. It is intended that the Portfolios’ assets will be managed so an investor in the Portfolios can satisfy the requirements of Subchapter M of the Internal Revenue Code of 1986, as amended.
Each Portfolio files U.S. federal and various state and local tax returns. No income tax returns are currently under examination. The statute of limitations on each Portfolio’s U.S. federal tax returns generally remains open for each of the four years ended September 30, 2016. The statutes of limitations on each Portfolio’s state and local tax returns may remain open for an additional year depending upon the jurisdiction.
Management has analyzed tax laws and regulations and their application to the Portfolios as of September 30, 2016, inclusive of the open tax return years, and does not believe that there are any uncertain tax positions that require recognition of a tax liability in the Portfolios’ financial statements.
As of September 30, 2016, gross unrealized appreciation and depreciation based on cost for federal income tax purposes were as follows:
| | | | | | | | | | | | | | | | | | | | | | | | | |
| | | Master Large Cap
Core Portfolio | | | | Master Large Cap
Growth Portfolio | | | | Master Large Cap
Value Portfolio |
Tax cost | | | $ | 1,679,514,515 | | | | | | | | | $ | 850,535,444 | | | | | | | | | $ | 653,677,122 | |
| | | | | |
Gross unrealized appreciation | | | $ | 498,176,127 | | | | | | | | | $ | 314,877,993 | | | | | | | | | $ | 163,689,102 | |
Gross unrealized depreciation | | | | (35,792,838 | ) | | | | | | | | | (19,468,700 | ) | | | | | | | | | (12,210,386 | ) |
| | | | | |
Net unrealized appreciation | | | $ | 462,383,289 | | | | | | | | | $ | 295,409,293 | | | | | | | | | $ | 151,478,716 | |
| | | | | |
| | | | | | | | | | | | | | | | | | | | | | | | | | |
| | | | | | |
| | | BLACKROCK LARGE CAP SERIES FUNDS, INC. | | SEPTEMBER 30, 2016 | | 63 |
| | | | |
| Notes to Financial Statements (continued) | | | Master Large Cap Series LLC | |
9. Bank Borrowings:
The Master LLC, on behalf of the Portfolios, along with certain other funds managed by the Manager and its affiliates (“Participating Funds”), is a party to a 364-day, $2.1 billion credit agreement with a group of lenders. Under this agreement, the Portfolios may borrow to fund shareholder redemptions. Excluding commitments designated for certain individual funds, the Participating Funds, including the Portfolios, can borrow up to an aggregate commitment amount of $1.6 billion at any time outstanding, subject to asset coverage and other limitations as specified in the agreement. The credit agreement has the following terms: a fee of 0.12% per annum on unused commitment amounts and interest at a rate equal to the higher of (a) one-month LIBOR (but in any event, not less than 0.00%) on the date the loan is made plus 0.80% per annum or (b) the Fed Funds rate (but in any event, not less than 0.00%) in effect from time to time plus 0.80% per annum on amounts borrowed. The agreement expires in April 2017 unless extended or renewed. Prior to April 21, 2016, the credit agreement had a fee per annum of 0.06% on unused commitment amounts and interest at a rate equal to the higher of (a) one-month LIBOR (but in any event, not less than 0.00%) on the date the loan is made plus 0.80% per annum or (b) the Fed Funds rate (but in any event, not less than 0.00%) in effect from time to time plus 0.80% per annum on amounts borrowed. Participating Funds paid administration, legal and arrangement fees, which, if applicable, are included in miscellaneous expenses in the Statements of Operations. These fees were allocated among such funds based upon portions of the aggregate commitment available to them and relative net assets of Participating Funds. During the year ended September 30, 2016, the Portfolios did not borrow under the credit agreement.
10. Principal Risks:
In the normal course of business, certain Portfolios invest in securities and enters into transactions where risks exist due to fluctuations in the market (market risk) or failure of the issuer to meet all its obligations, including the ability to pay principal and interest when due (issuer credit risk). The value of securities held by the Portfolios may decline in response to certain events, including those directly involving the issuers of securities owned by the Portfolios. Changes arising from the general economy, the overall market and local, regional or global political and/or social instability, as well as currency, interest rate and price fluctuations, may also affect the securities’ value.
On October 11, 2016, BlackRock implemented certain changes required by amendments to Rule 2a-7 under the 1940 Act, which governs the operations of U.S. money market funds. The Portfolios may be exposed to additional risks when reinvesting cash collateral in money market funds that do not seek to maintain a stable NAV per share of $1.00 and which may be subject to redemption gates or liquidity fees under certain circumstances.
Valuation Risk: The market values of equities, such as common stocks and preferred securities or equity related investments, such as futures and options may decline due to general market conditions which are not specifically related to a particular company. They may also decline due to factors which affect a particular industry or industries. A Portfolio may invest in illiquid investments and may experience difficulty in selling those investments in a timely manner at the price that they believe the investments are worth. Prices may fluctuate widely over short or extended periods in response to company, market or economic news. Markets also tend to move in cycles, with periods of rising and falling prices. This volatility may cause each Portfolio’s NAV to experience significant increases or decreases over short periods of time. If there is a general decline in the securities and other markets, the NAV of a Portfolio may lose value, regardless of the individual results of the securities and other instruments in which the Portfolio invests.
Counterparty Credit Risk: Similar to issuer credit risk, the Portfolios may be exposed to counterparty credit risk, or the risk that an entity may fail to or be unable to perform on its commitments related to unsettled or open transactions. The Portfolios manage counterparty credit risk by entering into transactions only with counterparties that the Manager believes have the financial resources to honor their obligations and by monitoring the financial stability of those counterparties. Financial assets, which potentially expose the Portfolios to market, issuer and counterparty credit risks, consist principally of financial instruments and receivables due from counterparties. The extent of the Portfolios’ exposure to market, issuer and counterparty credit risks with respect to these financial assets is approximately their value recorded in the Statements of Assets and Liabilities, less any collateral held by the Portfolios.
A derivative contract may suffer a mark-to-market loss if the value of the contract decreases due to an unfavorable change in the market rates or values of the underlying instrument. Losses can also occur if the counterparty does not perform under the contract.
With futures, there is less counterparty credit risk to the Portfolios since the exchange or clearinghouse, as counterparty to such instruments, guarantees against a possible default. The clearinghouse stands between the buyer and the seller of the contract; therefore, credit risk is limited to failure of the clearinghouse. While offset rights may exist under applicable law, a Portfolio does not have a contractual right of offset against a clearing broker or clearinghouse in the event of a default (including the bankruptcy or insolvency). Additionally, credit risk exists in exchange-traded futures with respect to initial and variation margin that is held in a clearing broker’s customer accounts. While clearing brokers are required to segregate customer margin from their own assets, in the event that a clearing broker becomes insolvent or goes into bankruptcy and at that time there is a shortfall in the aggregate amount of margin held by the clearing broker for all its clients, typically the shortfall would be allocated on a pro rata basis across all the clearing broker’s customers, potentially resulting in losses to the Portfolios.
| | | | | | |
| 64 | | BLACKROCK LARGE CAP SERIES FUNDS, INC. | | SEPTEMBER 30, 2016 | | |
| | | | |
| Notes to Financial Statements (concluded) | | | Master Large Cap Series LLC | |
Concentration Risk: As of period end, Master Large Cap Growth Portfolio invested a significant portion of its assets in securities in the information technology sector. Changes in economic conditions affecting such sector would have a greater impact on the Portfolio and could affect the value, income and/or liquidity of positions in such securities.
11. Subsequent Events:
Management has evaluated the impact of all subsequent events on the Portfolios through the date the financial statements were issued and has determined that there were no subsequent events requiring adjustment or additional disclosure in the financial statements.
| | | | | | |
| | | BLACKROCK LARGE CAP SERIES FUNDS, INC. | | SEPTEMBER 30, 2016 | | 65 |
| | | | |
| Report of Independent Registered Public Accounting Firm | | | Master Large Cap Series LLC | |
To the Board of Directors and Investors of Master Large Cap Series LLC:
We have audited the accompanying statements of assets and liabilities, including the schedules of investments, of Master Large Cap Series LLC (the “Master LLC”), comprised of Master Large Cap Core Portfolio, Master Large Cap Growth Portfolio and Master Large Cap Value Portfolio as of September 30, 2016, and the related statements of operations for the year then ended, the statements of changes in net assets for each of the two years in the period then ended, and the financial highlights for each of the five years in the period then ended. These financial statements and financial highlights are the responsibility of the Master LLC’s management. Our responsibility is to express an opinion on these financial statements and financial highlights based on our audits.
We conducted our audits in accordance with the standards of the Public Company Accounting Oversight Board (United States). Those standards require that we plan and perform the audit to obtain reasonable assurance about whether the financial statements and financial highlights are free of material misstatement. The Master LLC is not required to have, nor were we engaged to perform, an audit of its internal control over financial reporting. Our audits included consideration of internal control over financial reporting as a basis for designing audit procedures that are appropriate in the circumstances, but not for the purpose of expressing an opinion on the effectiveness of the Master LLC’s internal control over financial reporting. Accordingly, we express no such opinion. An audit also includes examining, on a test basis, evidence supporting the amounts and disclosures in the financial statements, assessing the accounting principles used and significant estimates made by management, as well as evaluating the overall financial statement presentation. Our procedures included confirmation of securities owned as of September 30, 2016, by correspondence with the custodian and brokers; where replies were not received from brokers, we performed other auditing procedures. We believe that our audits provide a reasonable basis for our opinion.
In our opinion, such financial statements and financial highlights referred to above present fairly, in all material respects, the financial position of Master Large Cap Core Portfolio, Master Large Cap Growth Portfolio and Master Large Cap Value Portfolio as of September 30, 2016, the results of their operations for the year then ended, the changes in their net assets for each of the two years in the period then ended, and the financial highlights for each of the five years in the period then ended, in conformity with accounting principles generally accepted in the United States of America.
Deloitte & Touche LLP
Philadelphia, Pennsylvania
November 23, 2016
| | | | | | |
| 66 | | BLACKROCK LARGE CAP SERIES FUNDS, INC. | | SEPTEMBER 30, 2016 | | |
| | | | |
| Disclosure of Investment Advisory Agreement | | | | |
The Board of Directors of Master Large Cap Series LLC (the “Master LLC”) met in person on April 21, 2016 (the “April Meeting”) and May 18-20, 2016 (the “May Meeting”) to consider the approval of the investment advisory agreement (the “Agreement”) between the Master LLC, on behalf of Master Large Cap Core Portfolio, Master Large Cap Growth Portfolio and Master Large Cap Value Portfolio (each a “Master Portfolio,” and together, the “Master Portfolios”), each a series of the Master LLC, and BlackRock Advisors, LLC (the “Manager” or “BlackRock”), the Master LLC’s investment advisor. Each of BlackRock Large Cap Core Fund, BlackRock Large Cap Growth Fund, BlackRock Large Cap Value Fund and BlackRock Large Cap Value Retirement Portfolio (each, a “Fund,” and together, the “Funds”), each a series of BlackRock Large Cap Series Funds, Inc. (the “Corporation”), is a “feeder” fund that invests all of its investable assets in the corresponding Master Portfolio. Accordingly, the Board of Directors of the Corporation also considered the approval of the Agreement with respect to the Master Portfolios. For simplicity: (a) the Board of Directors of the Master LLC and the Board of Directors of the Corporation are referred to herein collectively as the “Board,” and the members are referred to as “Board Members;” and (b) the shareholders of the Funds and the interest holders of the Master Portfolios are referred to as “shareholders.”
Activities and Composition of the Board
On the date of the May Meeting, the Board consisted of fifteen individuals, thirteen of whom were not “interested persons” of the Master LLC or the Corporation as defined in the Investment Company Act of 1940, as amended (the “1940 Act”) (the “Independent Board Members”). The Board Members are responsible for the oversight of the operations of the Master LLC or the Corporation, as pertinent, and perform the various duties imposed on the directors of investment companies by the 1940 Act. The Independent Board Members have retained independent legal counsel to assist them in connection with their duties. The Chair of the Board is an Independent Board Member. The Board has established five standing committees: an Audit Committee, a Governance and Nominating Committee, a Compliance Committee, a Performance Oversight and Contract Committee and an Executive Committee, each of which is chaired by an Independent Board Member and composed of Independent Board Members (except for the Executive Committee, which also has one interested Board Member).
The Agreement
Pursuant to the 1940 Act, the Board is required to consider the continuation of the Agreement on an annual basis. The Board has four quarterly meetings per year, each extending over two days, a fifth one-day meeting to consider specific information surrounding the consideration of renewing the Agreement, and additional in-person and telephonic meetings as needed. In connection with this year-long deliberative process, the Board assessed, among other things, the nature, extent and quality of the services provided to the Master Portfolios and the Funds by BlackRock, BlackRock’s personnel and affiliates, including (as applicable) investment management; administrative and shareholder services; the oversight of fund service providers; marketing; risk oversight; compliance; and ability to meet applicable legal and regulatory requirements.
The Board, acting directly and through its committees, considers at each of its meetings, and from time to time as appropriate, factors that are relevant to its annual consideration of the renewal of the Agreement, including the services and support provided by BlackRock to the Master Portfolios, the Funds and their shareholders. BlackRock also furnished additional information to the Board in response to specific questions from the Board. This additional information is discussed further below in the section titled “Board Considerations in Approving the Agreement.” Among the matters the Board considered were: (a) investment performance for one-year, three-year, five-year, ten-year and/or since inception periods, as applicable, against peer funds, applicable benchmark, and performance metrics, as applicable, as well as senior management’s and portfolio managers’ analysis of the reasons for any over-performance or underperformance relative to its peers, benchmarks, and other performance metrics, as applicable; (b) fees, including advisory, administration, if applicable, and other amounts paid to BlackRock and its affiliates by the Master Portfolios and/or the Funds for services; (c) each Master Portfolio’s and/or Fund’s operating expenses and how BlackRock allocates expenses to the Master Portfolios and the Funds; (d) the resources devoted to, risk oversight of, and compliance reports relating to, implementation of each Master Portfolio’s and each Fund’s investment objective(s), policies and restrictions, and meeting regulatory requirements; (e) the Master LLC’s and the Corporation’s compliance with its respective compliance policies and procedures; (f) the nature, cost and character of non-investment management services provided by BlackRock and its affiliates; (g) BlackRock’s and other service providers’ internal controls and risk and compliance oversight mechanisms; (h) BlackRock’s implementation of the proxy voting policies approved by the Board; (i) the use of brokerage commissions and execution quality of portfolio transactions; (j) BlackRock’s implementation of the Master LLC’s and/or the Corporation’s valuation and liquidity procedures; (k) an analysis of management fees for products with similar investment mandates across the open-end fund, exchange-traded fund (“ETF”), closed-end fund and institutional account product channels, as applicable, and the similarities and differences between these products and the services provided as compared to the Master Portfolios and/or the Funds; (l) BlackRock’s compensation methodology for its investment professionals and the incentives and accountability it creates, along with investment professionals’ investments in the fund(s) they manage; and (m) periodic updates on BlackRock’s business.
Board Considerations in Approving the Agreement
The Approval Process: Prior to the April Meeting, the Board requested and received materials specifically relating to the Agreement. The Board is continuously engaged in a process with its independent legal counsel and BlackRock to review the nature and scope of the information provided to better assist its deliberations. The materials provided in connection with the April Meeting included (a) information independently compiled and prepared by Broadridge Financial Solutions, Inc. (“Broadridge”) on fees and expenses of each Master Portfolio and Fund, as applicable, as compared with a peer group of funds as determined by Broadridge (“Expense Peers”) and the investment performance of each Fund as compared with a peer group of funds
| | | | | | |
| | | BLACKROCK LARGE CAP SERIES FUNDS, INC. | | SEPTEMBER 30, 2016 | | 67 |
| | | | |
| Disclosure of Investment Advisory Agreement (continued) | | | | |
as determined by Broadridge1 and, with respect to BlackRock Large Cap Growth Fund, a customized peer group selected by BlackRock (“Customized Peer Group”); (b) information on the profits realized by BlackRock and its affiliates pursuant to the Agreement and a discussion of fall-out benefits to BlackRock and its affiliates; (c) a general analysis provided by BlackRock concerning investment management fees charged to other clients, such as institutional clients, sub-advised mutual funds, ETFs and closed-end funds, under similar investment mandates, as well as the performance of such other clients, as applicable; (d) review of non-management fees; (e) the existence, impact and sharing of potential economies of scale; (f) a summary of aggregate amounts paid by each Master Portfolio and/or Fund to BlackRock; and (g) sales and redemption data regarding each Fund’s shares.
At the April Meeting, the Board reviewed materials relating to its consideration of the Agreement. As a result of the discussions that occurred during the April Meeting, and as a culmination of the Board’s year-long deliberative process, the Board presented BlackRock with questions and requests for additional information. BlackRock responded to these requests with additional written information in advance of the May Meeting.
At the May Meeting, the Board of the Master LLC, including the Independent Board Members, approved the continuation of the Agreement between the Manager and the Master LLC with respect to each Master Portfolio for a one-year term ending June 30, 2017. The Board of the Corporation, including the Independent Board Members, also considered the continuation of the Agreement with respect to each Master Portfolio and found the Agreement to be satisfactory. In approving the continuation of the Agreement, the Board of the Master LLC considered: (a) the nature, extent and quality of the services provided by BlackRock; (b) the investment performance of each Master Portfolio and each Fund; (c) the advisory fee and the cost of the services and profits to be realized by BlackRock and its affiliates from their relationship with the Master Portfolios and the Funds; (d) each Fund’s costs to investors compared to the costs of Expense Peers and performance compared to the relevant performance metrics as previously discussed; (e) the sharing of potential economies of scale; (f) fall-out benefits to BlackRock and its affiliates as a result of its relationship with the Master Portfolios and the Funds; and (g) other factors deemed relevant by the Board Members.
The Board also considered other matters it deemed important to the approval process, such as other payments made to BlackRock or its affiliates, securities lending and cash management, services related to the valuation and pricing of portfolio holdings of each Master Portfolio, and advice from independent legal counsel with respect to the review process and materials submitted for the Board’s review. The Board noted the willingness of BlackRock personnel to engage in open, candid discussions with the Board. The Board did not identify any particular information as determinative, and each Board Member may have attributed different weights to the various items considered.
A. Nature, Extent and Quality of the Services Provided by BlackRock: The Board, including the Independent Board Members, reviewed the nature, extent and quality of services provided by BlackRock, including the investment advisory services and the resulting performance of each Fund. Throughout the year, the Board compared each Fund’s performance to the performance of a comparable group of mutual funds, relevant benchmark, and performance metrics, as applicable. The Board met with BlackRock’s senior management personnel responsible for investment activities, including the senior investment officers. The Board also reviewed the materials provided by each Master Portfolio’s portfolio management team discussing the Master Portfolio’s performance and the Master Portfolio’s investment objective(s), strategies and outlook.
The Board considered, among other factors, with respect to BlackRock: the number, education and experience of investment personnel generally and each Master Portfolio’s portfolio management team; BlackRock’s research capabilities; investments by portfolio managers in the funds they manage; portfolio trading capabilities; use of technology; commitment to compliance; credit analysis capabilities; risk analysis and oversight capabilities; and the approach to training and retaining portfolio managers and other research, advisory and management personnel. The Board engaged in a review of BlackRock’s compensation structure with respect to each Master Portfolio’s portfolio management team and BlackRock’s ability to attract and retain high-quality talent and create performance incentives.
In addition to investment advisory services, the Board considered the quality of the administrative and other non-investment advisory services provided to each Master Portfolio and Fund. BlackRock and its affiliates provide the Master Portfolios and the Funds with certain administrative, shareholder and other services (in addition to any such services provided to the Master Portfolios and the Funds by third parties) and officers and other personnel as are necessary for the operations of the Master Portfolios and the Funds. In particular, BlackRock and its affiliates provide the Master Portfolios and the Funds with administrative services including, among others: (i) preparing disclosure documents, such as the prospectus, the summary prospectus (as applicable), the statement of additional information and periodic shareholder reports; (ii) oversight of daily accounting and pricing; (iii) preparing periodic filings with regulators; (iv) overseeing and coordinating the activities of other service providers; (v) organizing Board meetings and preparing the materials for such Board meetings; (vi) providing legal and compliance support; (vii) furnishing analytical and other support to assist the Board in its consideration of strategic issues such as the merger, consolidation or repurposing of certain open-end funds; and (viii) performing other administrative functions necessary for the operation of the Master Portfolios and the Funds, such as tax reporting, fulfilling regulatory filing requirements and call center services. The Board reviewed the structure and duties of BlackRock’s fund administration, shareholder services, and legal & compliance departments and considered BlackRock’s policies and procedures for assuring compliance with applicable laws and regulations.
| 1 | | Funds are ranked by Broadridge in quartiles, ranging from first to fourth, where first is the most desirable quartile position and fourth is the least desirable. |
| | | | | | |
| 68 | | BLACKROCK LARGE CAP SERIES FUNDS, INC. | | SEPTEMBER 30, 2016 | | |
| | | | |
| Disclosure of Investment Advisory Agreement (continued) | | | | |
B. The Investment Performance of the Master Portfolios, the Funds and BlackRock: The Board, including the Independent Board Members, also reviewed and considered the performance history of each Master Portfolio and Fund, as applicable. The Board noted that each Fund’s investment results correspond directly to the investment results of the corresponding Master Portfolio. In preparation for the April Meeting, the Board was provided with reports independently prepared by Broadridge, which included a comprehensive analysis of each Fund’s performance. The Board also reviewed a narrative and statistical analysis of the Broadridge data that was prepared by BlackRock. In connection with its review, the Board received and reviewed information regarding the investment performance of each Fund as compared to other funds in its applicable Broadridge category and, with respect to BlackRock Large Cap Growth Fund, the Customized Peer Group. The Board was provided with a description of the methodology used by Broadridge to select peer funds and periodically meets with Broadridge representatives to review its methodology. The Board was provided with information on the composition of the Broadridge performance universes and expense universes. The Board and its Performance Oversight and Contract Committee regularly review, and meet with the management of each Master Portfolio to discuss, the performance of the Master Portfolio and corresponding Fund, as applicable, throughout the year.
In evaluating performance, the Board recognized that the performance data reflects a snapshot of a period as of a particular date and that selecting a different performance period could produce significantly different results. Further, the Board recognized that it is possible that long-term performance can be adversely affected by even one period of significant underperformance so that a single investment decision or theme has the ability to affect long-term performance disproportionately.
The Board noted that for the one-, three- and five-year periods reported, BlackRock Large Cap Retirement Fund ranked in the first, first and second quartiles, respectively, against its Broadridge Performance Universe.
The Board noted that for the one-, three- and five-year periods reported, BlackRock Large Cap Value Fund ranked in the first, first and third quartiles, respectively, against its Broadridge Performance Universe
The Board noted that for each of the one-, three- and five-year periods reported, BlackRock Large Cap Core Fund ranked in the second quartile, against its Broadridge Performance Universe.
The Board noted that for the one-, three- and five-year periods reported, BlackRock Large Cap Growth Fund ranked in the fourth, third and third quartiles, respectively, against its Customized Peer Group. BlackRock believes that the Customized Peer Group is an appropriate performance metric for the Fund. The Board and BlackRock reviewed and discussed the reasons for BlackRock Large Cap Growth Fund’s underperformance during these periods. The Board was informed that, among other things, underperformance was concentrated over the one-year period. Portfolio management’s decision to avoid high valuation stocks in 2015 proved to be a significant headwind for the Fund, as a narrow market was led by a handful of speculative high growth stocks that lacked the valuation support required by the Fund’s portfolio management team.
The Board and BlackRock discussed BlackRock’s strategy for improving the investment performance of Master Large Cap Growth Portfolio/BlackRock Large Cap Growth Fund. Discussions covered topics, for the Master Portfolio and Fund, as applicable, such as: investment risks undertaken; performance attribution; investment personnel; and the resources appropriate to support the investment processes. The Board and BlackRock also discussed BlackRock’s active equity platform, and it was noted that BlackRock has recruited a Head of Global Active Equity, and has appointed a Chief Performance Officer to provide analysis of investment performance to senior management and the Board.
C. Consideration of the Advisory/Management Fees and the Cost of the Services and Profits to be Realized by BlackRock and its Affiliates from their Relationship with the Master Portfolios and the Funds: The Board, including the Independent Board Members, reviewed each Master Portfolio’s/ Fund’s contractual management fee rate compared with the other funds in the Fund’s Broadridge category. The contractual management rate represents a combination of the advisory fee and any administrative fees, before taking into account any reimbursements or fee waivers. The Board also compared each Fund’s total expense ratio, as well as each Master Portfolio’s/Fund’s actual management fee rate, to those of other funds in the Fund’s Broadridge category. The total expense ratio represents a fund’s total net operating expenses, including any 12b-1 or non 12b-1 service fees. The total expense ratio gives effect to any expense reimbursements or fee waivers that benefit a fund, and the actual management fee rate gives effect to any management fee reimbursements or waivers that benefit a fund. The Board considered the services provided and the fees charged by BlackRock and its affiliates to other types of clients with similar investment mandates, as applicable, including institutional accounts and sub-advised mutual funds (including mutual funds sponsored by third parties).
The Board received and reviewed statements relating to BlackRock’s financial condition. The Board reviewed BlackRock’s profitability methodology and was also provided with a profitability analysis that detailed the revenues earned and the expenses incurred by BlackRock for services provided to the Master Portfolios and the Funds. The Board reviewed BlackRock’s profitability with respect to each Master Portfolio and Fund, as applicable, and other funds the Board currently oversees for the year ended December 31, 2015 compared to available aggregate profitability data provided for the prior two years. The Board reviewed BlackRock’s profitability with respect to certain other U.S. fund complexes managed by the Manager and/or its affiliates. The Board reviewed BlackRock’s assumptions and methodology of allocating expenses in the profitability analysis, noting the inherent limitations in allocating costs among various advisory products. The Board recognized that profitability may be affected by numerous factors including, among
| | | | | | |
| | | BLACKROCK LARGE CAP SERIES FUNDS, INC. | | SEPTEMBER 30, 2016 | | 69 |
| | | | |
| Disclosure of Investment Advisory Agreement (continued) | | | | |
other things, fee waivers and expense reimbursements by the Manager, the types of funds managed, precision of expense allocations and business mix. As a result, calculating and comparing profitability at individual fund levels is difficult.
The Board noted that, in general, individual fund or product line profitability of other advisors is not publicly available. The Board reviewed BlackRock’s overall operating margin, in general, compared to that of certain other publicly-traded asset management firms. The Board considered the differences between BlackRock and these other firms, including the contribution of technology at BlackRock, BlackRock’s expense management, and the relative product mix.
In addition, the Board considered the cost of the services provided to the Master Portfolios and the Funds by BlackRock, and BlackRock’s and its affiliates’ profits relating to the management and distribution of the Master Portfolios and the Funds and the other funds advised by BlackRock and its affiliates. As part of its analysis, the Board reviewed BlackRock’s methodology in allocating its costs of managing the Master Portfolios and the Funds, to each Master Portfolio or Fund, as pertinent. The Board may receive and review information from independent third parties as part of its annual evaluation. The Board considered whether BlackRock has the financial resources necessary to attract and retain high quality investment management personnel to perform its obligations under the Agreement and to continue to provide the high quality of services that is expected by the Board. The Board further considered factors including but not limited to BlackRock’s commitment of time, assumption of risk and liability profile in servicing the Master Portfolios and the Funds in contrast to what is required of BlackRock with respect to other products with similar investment mandates across the open-end fund, ETF, closed-end fund, sub-advised mutual fund and institutional account product channels, as applicable.
The Board noted that the contractual management fee rate of Master Large Cap Value Portfolio/BlackRock Large Cap Value Retirement Portfolio ranked in the first quartile, and that the actual management fee rate and the Fund’s total expense ratio ranked in the second and first quartiles, respectively, relative to the Fund’s Expense Peers. The Board further noted that BlackRock has contractually agreed to a cap on the Fund’s total expenses as a percentage of the Fund’s average daily net assets.
The Board noted that the contractual management fee rate of Master Large Cap Value Portfolio/BlackRock Large Cap Value Fund ranked in the third quartile, and that the actual management fee rate and the Fund’s total expense ratio each ranked in the third quartile, relative to the Fund’s Expense Peers. In addition, the Board noted that BlackRock had voluntarily agreed to waive a portion of the administration fee payable by the Fund. The waiver was implemented on June 1, 2012. After discussions between the Board, including the Independent Board Members, and BlackRock, the Board and BlackRock agreed to a continuation of the voluntary administration fee waiver.
The Board noted that the contractual management fee rate of Master Large Cap Growth Portfolio/BlackRock Large Cap Growth Fund ranked in the third quartile, and that the actual management fee rate and the Fund’s total expense ratio ranked in the fourth and second quartiles, respectively, relative to the Fund’s Expense Peers. In addition, the Board noted that BlackRock had contractually agreed to a cap on the Fund’s total expenses as a percentage of the Fund’s average daily net assets a class-by-class basis. This cap was implemented on June 1, 2015. After discussions between the Board, including the Independent Board Members, and BlackRock, the Board and BlackRock agreed to a continuation of the contractual caps.
The Board noted that the contractual management fee rate of Master Large Cap Core Portfolio/BlackRock Large Cap Core Fund ranked in the fourth quartile, and that the actual management fee rate and the Fund’s total expense ratio ranked in the third and fourth quartiles, respectively, relative to the Fund’s Expense Peers. The Board further noted that BlackRock has contractually agreed to a cap on the Fund’s total expenses as a percentage of the Fund’s average daily net assets on a class-by-class basis, as applicable.
The Board also noted that each Master Portfolio has an advisory fee arrangement that includes breakpoints that adjust the fee rate downward as the size of the Master Portfolio increases above certain contractually specified levels.
D. Economies of Scale: The Board, including the Independent Board Members, considered the extent to which economies of scale might be realized as the assets of the Master Portfolios and the Funds increase, as well as the existence of expense caps, as applicable. The Board also considered the extent to which the Master Portfolios and the Funds benefit from such economies in a variety of ways and whether there should be changes in the advisory fee rate or breakpoint structure in order to enable the Master Portfolios and the Funds to more fully participate in these economies of scale. The Board considered each Master Portfolio’s asset levels and whether the current fee schedule was appropriate. In their consideration, the Board Members took into account the existence of any expense caps and further considered the continuation and/or implementation, as applicable, of such caps.
E. Other Factors Deemed Relevant by the Board Members: The Board, including the Independent Board Members, also took into account other ancillary or “fall-out” benefits that BlackRock or its affiliates may derive from their respective relationships with the Master Portfolios and the Funds, both tangible and intangible, such as BlackRock’s ability to leverage its investment professionals who manage other portfolios and risk management personnel, an increase in BlackRock’s profile in the investment advisory community, and the engagement of BlackRock’s affiliates as service providers to the Master Portfolios and the Funds, including for administrative, distribution, securities lending and cash management services. The Board also considered BlackRock’s overall operations and its efforts to expand the scale of, and improve the quality of, its operations. The Board also noted that
| | | | | | |
| 70 | | BLACKROCK LARGE CAP SERIES FUNDS, INC. | | SEPTEMBER 30, 2016 | | |
| | | | |
| Disclosure of Investment Advisory Agreement (concluded) | | | | |
BlackRock may use and benefit from third party research obtained by soft dollars generated by certain registered fund transactions to assist in managing all or a number of its other client accounts. The Board further noted that it had considered the investment by BlackRock’s funds in affiliated ETFs without any offset against the management fees payable by the funds to BlackRock.
In connection with its consideration of the Agreement, the Board also received information regarding BlackRock’s brokerage and soft dollar practices. The Board received reports from BlackRock which included information on brokerage commissions and trade execution practices throughout the year.
The Board noted the competitive nature of the open-end fund marketplace, and that shareholders are able to redeem their Fund shares if they believe that the pertinent Fund’s and/or Master Portfolio’s fees and expenses are too high or if they are dissatisfied with the performance of the Fund.
Conclusion
The Board of the Master LLC, including the Independent Board Members, approved the continuation of the Agreement between the Manager and the Master LLC, with respect to each Master Portfolio, for a one-year term ending June 30, 2017. Based upon its evaluation of all of the aforementioned factors in their totality, as well as other information, the Board of the Master LLC, including the Independent Board Members, was satisfied that the terms of the Agreement were fair and reasonable and in the best interest of each Master Portfolio and its shareholders. The Board of the Corporation, including the Independent Board Members, also considered the continuation of the Agreement with respect to each Master Portfolio and found the Agreement to be satisfactory. In arriving at its decision to approve the Agreement, the Board of the Master LLC did not identify any single factor or group of factors as all-important or controlling, but considered all factors together, and different Board Members may have attributed different weights to the various factors considered. The Independent Board Members were also assisted by the advice of independent legal counsel in making this determination. The contractual fee arrangements for the Master Portfolios reflect the results of several years of review by the Board Members and predecessor Board Members, and discussions between such Board Members (and predecessor Board Members) and BlackRock. As a result, the Board Members’ conclusions may be based in part on their consideration of these arrangements in prior years.
| | | | | | |
| | | BLACKROCK LARGE CAP SERIES FUNDS, INC. | | SEPTEMBER 30, 2016 | | 71 |
| | | | | | | | | | |
Name, Address1, and Year of Birth | | Position(s)
Held with the
Corporation/
Master LLC | | Length
of Time
Served3 | | Principal Occupation(s) During Past Five Years | | Number of BlackRock-
Advised Registered
Investment Companies
(“RICs”) Consisting of
Investment Portfolios
(“Portfolios”) Overseen | | Public Company and
Other Investment
Company
Directorships Held
During Past
Five Years |
| Independent Directors2 |
Rodney D. Johnson 1941 | | Chair of the Board and Director | | Since 2007 | | President, Fairmount Capital Advisors, Inc. from 1987 to 2013; Member of the Archdiocesan Investment Committee of the Archdiocese of Philadelphia from 2004 to 2012; Director, The Committee of Seventy (civic) from 2006 to 2012; Director, Fox Chase Cancer Center from 2004 to 2011; Director, The Mainstay (non-profit) since 2016. | | 26 RICs consisting of 143 Portfolios | | None |
David O. Beim 1940 | | Director | | Since 2007 | | Professor of Professional Practice at the Columbia University Graduate School of Business from 1991 to 2014; Trustee, Phillips Exeter Academy from 2002 to 2012; Chairman, Wave Hill, Inc. (public garden and cultural center) from 1990 to 2006. | | 26 RICs consisting of 143 Portfolios | | None |
Susan J. Carter 1956 | | Director | | Since 2016 | | Director, Pacific Pension Institute since 2014; Advisory Board Member, Center for Private Equity and Entrepreneurship at Tuck School of Business since 1997; Senior Advisor, Commonfund Capital, Inc. (“CCI”) (investment adviser) in 2015; Chief Executive Officer, CCI from 2013 to 2014; President & Chief Executive Officer, CCI from 1997 to 2013; Advisory Board Member, Girls Who Invest since 2015; Advisory Board Member, Bridges Ventures since 2016. | | 26 RICs consisting of 143 Portfolios | | None |
Collette Chilton 1958 | | Director | | Since 2015 | | Chief Investment Officer, Williams College since 2006; Chief Investment Officer, Lucent Asset Management Corporation from 1998 to 2006. | | 26 RICs consisting of 143 Portfolios | | None |
Neil A. Cotty 1954 | | Director | | Since 2016 | | Bank of America Corporation from 1996 to 2015, serving in various senior finance leadership roles, including Chief Accounting Officer from 2009 to 2015, Chief Financial Officer of Global Banking, Markets and Wealth Management from 2008 to 2009, Chief Accounting Officer from 2004 to 2008, Chief Financial Officer of Consumer Bank from 2003 to 2004, Chief Financial Officer of Global Corporate Investment Bank from 1999 to 2002. | | 26 RICs consisting of 143 Portfolios | | None |
Dr. Matina S. Horner 1939 | | Director | | Since 2007 | | Executive Vice President, Teachers Insurance and Annuity Association and College Retirement Equities Fund from 1989 to 2003. | | 26 RICs consisting of 143 Portfolios | | NSTAR (electric and gas utility) |
Cynthia A. Montgomery 1952 | | Director | | Since 2007 | | Professor, Harvard Business School since 1989; Director, McLean Hospital from 2005 to 2012. | | 26 RICs consisting of 143 Portfolios | | Newell Rubbermaid, Inc. (manufacturing) |
Joseph P. Platt 1947 | | Director | | Since 2007 | | General Partner, Thorn Partners, LP (private investments) since 1998; Director, WQED Multi-Media (public broadcasting not-for- profit) since 2001; Chair, Basic Health International (non-profit) since 2015. | | 26 RICs consisting of 143 Portfolios | | Greenlight Capital Re, Ltd. (reinsurance company); Consol Energy Inc. |
Robert C. Robb, Jr. 1945 | | Director | | Since 2007 | | Partner, Lewis, Eckert, Robb and Company (management and financial consulting firm) since 1981 and Principal since 2010. | | 26 RICs consisting of 143 Portfolios | | None |
| | | | | | |
| 72 | | BLACKROCK LARGE CAP SERIES FUNDS, INC. | | SEPTEMBER 30, 2016 | | |
| | | | |
| Officers and Directors (continued) | | | | |
| | | | | | | | | | |
Name, Address1, and Year of Birth | | Position(s)
Held with the
Corporation/
Master LLC | | Length
of Time
Served3 | | Principal Occupation(s) During Past Five Years | | Number of BlackRock-
Advised Registered
Investment Companies
(“RICs”) Consisting of
Investment Portfolios
(“Portfolios”) Overseen | | Public Company and
Other Investment
Company
Directorships Held
During Past
Five Years |
| Independent Directors2 (concluded) |
Mark Stalnecker 1951 | | Director | | Since 2015 | | Chief Investment Officer, University of Delaware from 1999 to 2013; Trustee, Winterthur Museum and Country Estate from 2001 to 2015; Member of the Investment Committee, Delaware Public Employees’ Retirement System since 2002; Member of the Investment Committee, Christiana Care Health System since 2009; Member of the Investment Committee, Delaware Community Foundation from 2013 to 2014; Director, SEI Private Trust Co. from 2001 to 2014. | | 26 RICs consisting of 143 Portfolios | | None |
Kenneth L. Urish 1951 | | Director | | Since 2007 | | Managing Partner, Urish Popeck & Co., LLC (certified public accountants and consultants) since 1976; Past-Chairman of the Professional Ethics Committee of the Pennsylvania Institute of Certified Public Accountants and Committee Member thereof since 2007; Member of External Advisory Board, The Pennsylvania State University Accounting Department since founding in 2001; Principal, UP Strategic Wealth Investment Advisors, LLC since 2013; Trustee, The Holy Family Institute from 2001 to 2010; President and Trustee, Pittsburgh Catholic Publishing Associates from 2003 to 2008; Director, Inter-Tel from 2006 to 2007. | | 26 RICs consisting of 143 Portfolios | | None |
Claire A. Walton 1957 | | Director | | Since 2016 | | Chief Operating Officer and Chief Financial Officer of Liberty Square Asset Management, LP from 1998 to 2015; General Partner of Neon Liberty Capital Management, LLC since 2003; Director, Boston Hedge Fund Group since 2009; Director, Woodstock Ski Runners since 2013; Director, Massachusetts Council on Economic Education from 2013 to 2015. | | 26 RICs consisting of 143 Portfolios | | None |
Frederick W. Winter 1945 | | Director | | Since 2007 | | Director, Alkon Corporation since 1992; Dean Emeritus of the Joseph M. Katz School of Business, University of Pittsburgh, Dean and Professor from 1997 to 2005, Professor until 2013. | | 26 RICs consisting of 143 Portfolios | | None |
| Interested Directors4 |
Barbara G. Novick 1960 | | Director | | Since 2015 | | Vice Chairman of BlackRock, Inc. since 2006; Chair of BlackRock’s Government Relations Steering Committee since 2009; Head of the Global Client Group of BlackRock, Inc. from 1988 to 2008. | | 100 RICs consisting of 217 Portfolios | | None |
John M. Perlowski 1964 | | Director, President, and Chief Executive Officer | | Since 2015 (Director); Since 2010 (President and Chief Executive Officer) | | Managing Director of BlackRock, Inc. since 2009; Head of BlackRock Global Fund & Accounting Services since 2009; Managing Director and Chief Operating Officer of the Global Product Group at Goldman Sachs Asset Management, L.P. from 2003 to 2009; Treasurer of Goldman Sachs Mutual Funds from 2003 to 2009 and Senior Vice President thereof from 2007 to 2009; Director of Goldman Sachs Offshore Funds from 2002 to 2009; Director of Family Resource Network (charitable foundation) since 2009. | | 128 RICs consisting of 315 Portfolios | | None |
| | 1 The address of each Director is c/o BlackRock, Inc., 55 East 52nd Street, New York, NY 10055. 2 Independent Directors serve until their resignation, retirement, removal or death, or until December 31 of the year in which they turn 75. The Board has determined to extend the terms of Independent Directors on a case-by-case basis, as appropriate. The Board has unanimously approved extending the mandatory retirement age for David O. Beim and Dr. Matina S. Horner until December 31, 2016, which the Board believes is in the best interests of shareholders of the Funds. 3 Following the combination of Merrill Lynch Investment Managers, L.P. (“MLIM”) and BlackRock, Inc. (“BlackRock”) in September 2006, the various legacy MLIM and legacy BlackRock fund boards were realigned and consolidated into three new fund boards in 2007. As a result, although the chart shows certain Independent Directors as joining the Board in 2007, those Independent Directors first became members of the boards of other legacy MLIM or legacy BlackRock funds as follows: David O. Beim, 1998; Dr. Matina S. Horner, 2004; Rodney D. Johnson, 1995; Cynthia A. Montgomery, 1994; Joseph P. Platt, 1999; Robert C. Robb, Jr., 1999; Kenneth L. Urish, 1999; and Frederick W. Winter, 1999. 4 Ms. Novick and Mr. Perlowski are both “interested persons,” as defined in the 1940 Act, of the Corporation/Master LLC based on their positions with BlackRock and its affiliates. Mr. Perlowski and Ms. Novick are also board members of certain complexes of BlackRock registered open-end and closed-end funds. Mr. Perlowski is also a board member of the BlackRock Equity-Bond Complex and the BlackRock Closed-End Complex, and Ms. Novick is a board member of the BlackRock Closed-End Complex. |
| | | | | | |
| | | BLACKROCK LARGE CAP SERIES FUNDS, INC. | | SEPTEMBER 30, 2016 | | 73 |
| | | | |
| Officers and Directors (concluded) | | | | |
| | | | | | |
Name, Address1, and Year of Birth | | Position(s)
Held with the
Corporation/
Master LLC | | Length
of Time
Served as an Officer | | Principal Occupation(s) During Past Five Years |
| Officers Who Are Not Directors2 |
Jennifer McGovern 1977 | | Vice President | | Since 2014 | | Managing Director of BlackRock, Inc. since 2016; Director of BlackRock, Inc. from 2011 to 2015; Head of Product Structure and Oversight for BlackRock’s U.S. Wealth Advisory Group since 2013; Vice President of BlackRock, Inc. from 2008 to 2010. |
Neal J. Andrews 1966 | | Chief Financial Officer | | Since 2007 | | Managing Director of BlackRock, Inc. since 2006; Senior Vice President and Line of Business Head of Fund Accounting and Administration at PNC Global Investment Servicing (U.S.) Inc. from 1992 to 2006. |
Jay M. Fife 1970 | | Treasurer | | Since 2007 | | Managing Director of BlackRock, Inc. since 2007; Director of BlackRock, Inc. in 2006; Assistant Treasurer of the MLIM and Fund Asset Management, L.P. advised funds from 2005 to 2006; Director of MLIM Fund Services Group from 2001 to 2006. |
Charles Park 1967 | | Chief Compliance Officer | | Since 2014 | | Anti-Money Laundering Compliance Officer for the BlackRock-advised Funds in the Equity-Bond Complex, the Equity-Liquidity Complex and the Closed-End Complex from 2014 to 2015; Chief Compliance Officer of BlackRock Advisors, LLC and the BlackRock-advised Funds in the Equity-Bond Complex, the Equity-Liquidity Complex and the Closed-End Complex since 2014; Principal of and Chief Compliance Officer for iShares® Delaware Trust Sponsor LLC since 2012 and BlackRock Fund Advisors (“BFA”) since 2006; Chief Compliance Officer for the BFA-advised iShares® exchange traded funds since 2006; Chief Compliance Officer for BlackRock Asset Management International Inc. since 2012. |
Fernanda Piedra 1969 | | Anti-Money Laundering Compliance Officer | | Since 2015 | | Director of BlackRock, Inc. since 2014; Anti-Money Laundering Compliance Officer and Regional Head of Financial Crime for the Americas at BlackRock, Inc. since 2014; Head of Regulatory Changes and Remediation for the Asset Wealth Management Division of Deutsche Bank from 2010 to 2014; Vice President of Goldman Sachs (Anti-Money Laundering/Suspicious Activities Group) from 2004 to 2010. |
Benjamin Archibald 1975 | | Secretary | | Since 2012 | | Managing Director of BlackRock, Inc. since 2014; Director of BlackRock, Inc. from 2010 to 2013; Secretary of the iShares® exchange traded funds since 2015; Secretary of the BlackRock-advised mutual funds since 2012. |
| | 1 The address of each Officer is c/o BlackRock, Inc., 55 East 52nd Street, New York, NY 10055. 2 Officers of the Corporation/Master LLC serve at the pleasure of the Board. |
| | Further information about the Corporation/Master LLC’s Officers and Directors is available in the Corporation’s Statement of Additional Information, which can be obtained without charge by calling 1-800-441-7762. |
| | | | | | |
| | | | |
Investment Adviser and Administrator BlackRock Advisors, LLC Wilmington, DE 19809 | | Accounting Agent and Transfer Agent BNY Mellon Investment Servicing (US) Inc. Wilmington, DE 19809 | | Custodian Brown Brothers Harriman & Co. Boston, MA 02109 | | Address of the Corporation 100 Bellevue Parkway Wilmington, DE 19809 |
| | | | | | |
Legal Counsel Sidley Austin LLP New York, NY 10019 | | Independent Registered Public Accounting Firm Deloitte & Touche LLP Philadelphia, PA 19103 | | Distributor BlackRock Investments, LLC New York, NY 10022 | | |
| | | | | | |
| 74 | | BLACKROCK LARGE CAP SERIES FUNDS, INC. | | SEPTEMBER 30, 2016 | | |
Householding
The Funds will mail only one copy of shareholder documents, including annual and semi-annual reports and proxy statements, to shareholders with multiple accounts at the same address. This practice is commonly called “householding” and is intended to reduce expenses and eliminate duplicate mailings of shareholder documents. Mailings of your shareholder documents may be householded indefinitely unless you instruct us otherwise. If you do not want the mailing of these documents to be combined with those for other members of your household, please call the Fund at (800) 441-7762.
Availability of Quarterly Schedule of Investments
The Funds/Portfolios file their complete schedule of portfolio holdings with the Securities and Exchange Commission (“SEC”) for the first and third quarters of each fiscal year on Form N-Q. The Funds’/Portfolios’ Form N-Q is available on the SEC’s website at http://www.sec.gov and may also be reviewed and copied at the SEC’s Public Reference Room in Washington, D.C. Information on the operation of the Public Reference Room may be obtained by calling (800) SEC-0330. The Funds’/Portfolios’ Form N-Q may also be obtained upon request and without charge by calling (800) 441-7762.
Availability of Proxy Voting Policies and Procedures
A description of the policies and procedures that the Funds/Portfolios use to determine how to vote proxies relating to portfolio securities is available (1) without charge, upon request, by calling (800) 441-7762; (2) at http://www.blackrock.com; and (3) on the SEC’s website at http://www.sec.gov.
Availability of Proxy Voting Record
Information about how the Funds/Portfolios voted proxies relating to securities held in the Portfolios’ portfolios during the most recent 12-month period ended June 30 is available upon request and without charge (1) at http://www.blackrock.com or by calling (800) 441-7762 and (2) on the SEC’s website at http://www.sec.gov.
BlackRock’s Mutual Fund Family
BlackRock offers a diverse lineup of open-end mutual funds crossing all investment styles and managed by experts in equity, fixed income and tax-exempt investing. Visit BlackRock online at http://www.blackrock.com for more information.
Account Information
Call us at (800) 441-7762 from 8:00 AM to 6:00 PM ET on any business day to get information about your account balances, recent transactions and share prices. You can also reach us on the Web at http:// www.blackrock.com/funds.
Automatic Investment Plans
Investor Class shareholders who want to invest regularly can arrange to have $50 or more automatically deducted from their checking or savings account and invested in any of the BlackRock funds.
Systematic Withdrawal Plan
Investor Class shareholders can establish a systematic withdrawal plan and receive periodic payments of $50 or more from their BlackRock funds, as long as their account balance is at least $10,000.
Retirement Plans
Shareholders may make investments in conjunction with Traditional, Rollover, Roth, Coverdell, Simple IRAs, SEP IRAs and 403(b) Plans.
| | | | | | |
| | | BLACKROCK LARGE CAP SERIES FUNDS, INC. | | SEPTEMBER 30, 2016 | | 75 |
| | | | |
| Additional Information (concluded) | | | | |
|
| BlackRock Privacy Principles |
BlackRock is committed to maintaining the privacy of its current and former fund investors and individual clients (collectively, “Clients”) and to safeguarding their non-public personal information. The following information is provided to help you understand what personal information BlackRock collects, how we protect that information and why in certain cases we share such information with select parties.
If you are located in a jurisdiction where specific laws, rules or regulations require BlackRock to provide you with additional or different privacy-related rights beyond what is set forth below, then BlackRock will comply with those specific laws, rules or regulations.
BlackRock obtains or verifies personal non-public information from and about you from different sources, including the following: (i) information we receive from you or, if applicable, your financial intermediary, on applications, forms or other documents; (ii) information about your transactions with us, our affiliates, or others; (iii) information we receive from a consumer reporting agency; and (iv) from visits to our websites.
BlackRock does not sell or disclose to non-affiliated third parties any non-public personal information about its Clients, except as permitted by law or as is necessary to respond to regulatory requests or to service Client accounts. These non-affiliated third parties are required to protect the confidentiality and security of this information and to use it only for its intended purpose.
We may share information with our affiliates to service your account or to provide you with information about other BlackRock products or services that may be of interest to you. In addition, BlackRock restricts access to non-public personal information about its Clients to those BlackRock employees with a legitimate business need for the information. BlackRock maintains physical, electronic and procedural safeguards that are designed to protect the non-public personal information of its Clients, including procedures relating to the proper storage and disposal of such information.
| | | | | | |
| 76 | | BLACKROCK LARGE CAP SERIES FUNDS, INC. | | SEPTEMBER 30, 2016 | | |
This report is intended for current holders. It is not authorized for use as an offer of sale or a solicitation of an offer to buy shares of a Fund unless accompanied or preceded by that Fund’s current prospectus. Past performance results shown in this report should not be considered a representation of future performance. Investment returns and principal value of shares will fluctuate so that shares, when redeemed, may be worth more or less than their original cost. Statements and other information herein are as dated and are subject to change.

| | |
| |
CAPSERIES-9/16-AR | |  |
| | |
| Item 2 – | | Code of Ethics – Each registrant (or “Fund”) has adopted a code of ethics, as of the end of the period covered by this report, applicable to the registrant’s principal executive officer, principal financial officer, principal accounting officer or controller, or persons performing similar functions. During the period covered by this report, the code of ethics was amended to update certain information and to make other non-material changes. During the period covered by this report, there have been no waivers granted under the code of ethics. Each registrant undertakes to provide a copy of the code of ethics to any person upon request, without charge, by calling 1-800-441-7762. |
| |
| Item 3 – | | Audit Committee Financial Expert – Each registrant’s board of directors (the “board of directors”), has determined that (i) the registrant has the following audit committee financial expert serving on its audit committee and (ii) each audit committee financial expert is independent: |
| |
| | Kenneth L. Urish |
| |
| | Under applicable securities laws, a person determined to be an audit committee financial expert will not be deemed an “expert” for any purpose, including without limitation for the purposes of Section 11 of the Securities Act of 1933, as a result of being designated or identified as an audit committee financial expert. The designation or identification of a person as an audit committee financial expert does not impose on such person any duties, obligations, or liabilities greater than the duties, obligations, and liabilities imposed on such person as a member of the audit committee and board of directors in the absence of such designation or identification. |
| |
| Item 4 – | | Principal Accountant Fees and Services |
| |
| | The following table presents fees billed by Deloitte & Touche LLP (“D&T”) in each of the last two fiscal years for the services rendered to the Funds: |
| | | | | | | | | | | | | | | | |
| | | (a) Audit Fees | | (b) Audit-Related
Fees1 | | (c) Tax Fees2 | | (d) All Other Fees3 |
| Entity Name | | Current
Fiscal
Year End | | Previous
Fiscal
Year End | | Current
Fiscal
Year
End | | Previous
Fiscal
Year End | | Current
Fiscal
Year
End | | Previous
Fiscal
Year End | | Current
Fiscal
Year
End | | Previous
Fiscal
Year End |
| BlackRock Large Cap Core Fund | | $7,363 | | $7,363 | | $0 | | $0 | | $13,107 | | $13,107 | | $0 | | $0 |
| BlackRock Large Cap Growth Fund | | $7,363 | | $7,363 | | $0 | | $0 | | $13,107 | | $13,107 | | $0 | | $0 |
| BlackRock Large Cap Value Fund | | $7,363 | | $7,363 | | $0 | | $0 | | $13,107 | | $13,107 | | $0 | | $0 |
| BlackRock Large Cap Value Retirement Portfolio | | $7,363 | | $7,363 | | $0 | | $0 | | $13,107 | | $13,107 | | $0 | | $0 |
| Master Large Cap Core Portfolio | | $36,688 | | $36,688 | | $0 | | $0 | | $13,515 | | $13,515 | | $0 | | $0 |
| Master Large Cap Growth Portfolio | | $33,688 | | $33,688 | | $0 | | $0 | | $13,515 | | $13,515 | | $0 | | $0 |
| Master Large Cap Value Portfolio | | $33,688 | | $33,688 | | $0 | | $0 | | $13,515 | | $13,515 | | $0 | | $0 |
| | |
| | The following table presents fees billed by D&T that were required to be approved by each registrant’s audit committee (each a “Committee”) for services that relate directly to the operations or financial reporting of the Fund and that are rendered on behalf of BlackRock Advisors, LLC (“Investment Adviser” or “BlackRock”) and entities controlling, controlled by, or under common control with BlackRock (not including any sub-adviser whose role is primarily portfolio management and is subcontracted with or overseen by another investment adviser) that provide ongoing services to the Fund (“Fund Service Providers”): |
2
| | | | |
| | | Current Fiscal Year End | | Previous Fiscal Year End |
(b) Audit-Related Fees1 | | $0 | | $0 |
(c) Tax Fees2 | | $0 | | $0 |
(d) All Other Fees3 | | $2,129,000 | | $2,391,000 |
1 The nature of the services includes assurance and related services reasonably related to the performance of the audit of financial statements not included in Audit Fees.
2 The nature of the services includes tax compliance, tax advice and tax planning.
3 Aggregate fees borne by BlackRock in connection with the review of compliance procedures and attestation thereto performed by D&T with respect to all of the registered closed-end funds and some of the registered open-end funds advised by BlackRock.
(e)(1) Audit Committee Pre-Approval Policies and Procedures:
| | |
| | Each Committee has adopted policies and procedures with regard to the pre-approval of services. Audit, audit-related and tax compliance services provided to the registrant on an annual basis require specific pre-approval by the registrant’s Committee. The Committee also must approve other non-audit services provided to the registrant and those non-audit services provided to the Investment Adviser and Fund Service Providers that relate directly to the operations and the financial reporting of the registrant. Certain of these non-audit services that the Committee believes are (a) consistent with the SEC’s auditor independence rules and (b) routine and recurring services that will not impair the independence of the independent accountants may be approved by the Committee without consideration on a specific case-by-case basis (“general pre-approval”). The term of any general pre-approval is 12 months from the date of the pre-approval, unless the Committee provides for a different period. Tax or other non-audit services provided to the registrants which have a direct impact on the operations or financial reporting of the registrant will only be deemed pre-approved provided that any individual project does not exceed $10,000 attributable to the registrant or $50,000 per project. For this purpose, multiple projects will be aggregated to determine if they exceed the previously mentioned cost levels. |
| |
| | Any proposed services exceeding the pre-approved cost levels will require specific pre-approval by the registrant’s Committee, as will any other services not subject to general pre-approval (e.g., unanticipated but permissible services). The Committee is informed of each service approved subject to general pre-approval at the next regularly scheduled in-person board meeting. At this meeting, an analysis of such services is presented to the Committee for ratification. The Committee may delegate to the Committee Chairman the authority to approve the provision of and fees for any specific engagement of permitted non-audit services, including services exceeding pre-approved cost levels. |
| |
| | (e)(2) None of the services described in each of Items 4(b) through (d) were approved by either Committee pursuant to the de minimus exception in paragraph (c)(7)(i)(C) of Rule 2-01 of Regulation S-X. |
| |
| | (f) Not Applicable |
| |
| | (g) The aggregate non-audit fees paid to the accountant for services rendered by the accountant to the registrant, the Investment Adviser and the Fund Service Providers were: |
| | | | | | | | |
| | | Entity Name | | Current Fiscal Year End | | Previous Fiscal Year
End | | |
| | BlackRock Large Cap Core Fund | | $13,107 | | $13,107 | |
| | BlackRock Large Cap Growth Fund | | $13,107 | | $13,107 | |
| | BlackRock Large Cap Value Fund | | $13,107 | | $13,107 | |
| | BlackRock Large Cap Value Retirement Portfolio | | $13,107 | | $13,107 | |
| | Master Large Cap Core Portfolio | | $13,515 | | $13,515 | |
| | Master Large Cap Growth Portfolio | | $13,515 | | $13,515 | |
| | Master Large Cap Value Portfolio | | $13,515 | | $13,515 | |
3
| | |
| | | Additionally, SSAE 16 Review (Formerly, SAS No. 70) fees for the current and previous fiscal years of $2,129,000 and
$2,391,000, respectively, were billed by D&T to the Investment Adviser. |
| |
| | (h) Each Committee has considered and determined that the provision of non-audit services that were rendered to the Investment Adviser and the Fund Service Providers that were not pre-approved pursuant to paragraph (c)(7)(ii) of Rule 2-01 of Regulation S-X is compatible with maintaining the principal accountant’s independence. |
| |
| Item 5 – | | Audit Committee of Listed Registrants – Not Applicable |
| |
| Item 6 – | | Investments |
| | (a) The registrants’ Schedules of Investments are included as part of the Report to Stockholders filed under Item 1 of this Form. |
| |
| | (b) Not Applicable due to no such divestments during the semi-annual period covered since the previous Form N-CSR filing. |
| |
| Item 7 – | | Disclosure of Proxy Voting Policies and Procedures for Closed-End Management Investment Companies – Not Applicable |
| |
| Item 8 – | | Portfolio Managers of Closed-End Management Investment Companies – Not Applicable |
| |
| Item 9 – | | Purchases of Equity Securities by Closed-End Management Investment Company and Affiliated Purchasers – Not Applicable |
| |
| Item 10 – | | Submission of Matters to a Vote of Security Holders – There have been no material changes to these procedures. |
| |
| Item 11 – | | Controls and Procedures |
| |
| | (a) – The registrants’ principal executive and principal financial officers, or persons performing similar functions, have concluded that the registrants’ disclosure controls and procedures (as defined in Rule 30a-3(c) under the Investment Company Act of 1940, as amended (the “1940 Act”)) are effective as of a date within 90 days of the filing of this report based on the evaluation of these controls and procedures required by Rule 30a-3(b) under the 1940 Act and Rule 15(d)-15(b) under the Securities Exchange Act of 1934, as amended. |
| |
| | (b) – There were no changes in the registrants’ internal control over financial reporting (as defined in Rule 30a-3(d) under the 1940 Act) that occurred during the second fiscal quarter of the period covered by this report that have materially affected, or are reasonably likely to materially affect, the registrants’ internal control over financial reporting. |
| |
| Item 12 – | | Exhibits attached hereto |
| |
| | (a)(1) – Code of Ethics – See Item 2 |
| |
| | (a)(2) – Certifications – Attached hereto |
| |
| | (a)(3) – Not Applicable |
| |
| | (b) – Certifications – Attached hereto |
4
Pursuant to the requirements of the Securities Exchange Act of 1934 and the Investment Company Act of 1940, each registrant has duly caused this report to be signed on its behalf by the undersigned, thereunto duly authorized.
BlackRock Large Cap Series Funds, Inc. and Master Large Cap Series LLC
| | |
| By: | | /s/ John M. Perlowski |
| | John M. Perlowski |
| | Chief Executive Officer (principal executive officer) of |
| | BlackRock Large Cap Series Funds, Inc. and Master Large Cap Series LLC |
Date: December 2, 2016
Pursuant to the requirements of the Securities Exchange Act of 1934 and the Investment Company Act of 1940, this report has been signed below by the following persons on behalf of each registrant and in the capacities and on the dates indicated.
| | |
| By: | | /s/ John M. Perlowski |
| | John M. Perlowski |
| | Chief Executive Officer (principal executive officer) of |
| | BlackRock Large Cap Series Funds, Inc. and Master Large Cap Series LLC |
Date: December 2, 2016
| | |
| By: | | /s/ Neal J. Andrews |
| | Neal J. Andrews |
| | Chief Financial Officer (principal financial officer) of |
| | BlackRock Large Cap Series Funds, Inc. and Master Large Cap Series LLC |
Date: December 2, 2016
5