UNITED STATES
SECURITIES AND EXCHANGE COMMISSION
Washington, D.C. 20549
FORM N-CSR
CERTIFIED SHAREHOLDER REPORT OF REGISTERED MANAGEMENT INVESTMENT
COMPANIES
Investment Company Act file number: 811-09637
Name of Fund: BlackRock Large Cap Series Funds, Inc.
BlackRock Event Driven Equity Fund
Fund Address: 100 Bellevue Parkway, Wilmington, DE 19809
Name and address of agent for service: John M. Perlowski, Chief Executive Officer, BlackRock Large Cap Series Funds, Inc., 55 East 52nd Street, New York, NY 10055
Registrant’s telephone number, including area code: (800) 441-7762
Date of fiscal year end: 09/30/2017
Date of reporting period: 09/30/2017
Item 1 – Report to Stockholders
SEPTEMBER 30, 2017
BlackRock Event Driven Equity Fund
| | |
| Not FDIC Insured ◾ May Lose Value ◾ No Bank Guarantee | | |
Dear Shareholder,
In the 12 months ended September 30, 2017, risk assets, such as stocks and high-yield bonds, continued to deliver strong performance. These markets showed great resilience during a period with big surprises, including the aftermath of the U.K.’s vote to leave the European Union and the outcome of the U.S. presidential election, which brought only brief spikes in equity market volatility. These expressions of isolationism and discontent were countered by the closely watched and less surprising elections in France, the Netherlands, and Australia.
Interest rates rose, which worked against high-quality assets with more interest rate sensitivity. As a result, longer-term U.S. Treasuries posted negative returns, as rising energy prices, modest wage increases, and steady job growth led to expectations of higher inflation and anticipation of interest rate increases by the U.S. Federal Reserve (the “Fed”).
Market prices began to reflect reflationary expectations toward the end of 2016, as investors sensed that a global recovery was afoot. And those expectations have been largely realized in 2017, as many countries throughout the world experienced sustained and synchronized growth for the first time since the financial crisis. Growth rates and inflation are still relatively low, but they are finally rising together.
The Fed responded to these positive developments by increasing interest rates three times and setting expectations for additional interest rate increases. The Fed also announced its plan to begin reducing the vast balance sheet reserves that had accumulated in the wake of the financial crisis. The Fed will reduce its $4.5 trillion balance sheet by only $10 billion in October with further reductions expected in subsequent months.
By contrast, the European Central Bank and the Bank of Japan both continued to expand their balance sheets despite nascent signs of sustained economic growth. The Eurozone and Japan are both approaching the limits of central banks’ ownership share of debt issued by their respective governments, which means central bank bond purchasing plans may need to be reduced in 2018.
Emerging market growth also stabilized, as accelerating growth in China, the second largest economy in the world and the most influential of all developing economies, improved the outlook for corporate profits and economic growth across most developing nations. Chinese demand for commodities and other raw materials allayed concerns about the country’s banking system, leading to rising equity prices and foreign investment flows.
In recent months, financial markets have appeared less dependent on significant U.S. tax reform and infrastructure spending. Rising consumer confidence and improving business sentiment have generated momentum for the U.S. economy, even without the potential effects of major legislative changes. Escalating tensions with North Korea and our nation’s divided politics remain significant concerns; however, benign credit conditions, modest inflation, solid corporate earnings, and the positive outlook for growth in the world’s largest economies have kept markets relatively tranquil.
High valuations across most assets have laid the groundwork for muted returns going forward. At current valuation levels, potential equity gains will likely be closely tied to the pace of earnings growth, which has remained solid thus far in 2017, particularly in emerging markets. In this environment, investors need to think globally, extend their scope across a broad array of asset classes, and be nimble as market conditions change. We encourage you to talk with your financial advisor and visit blackrock.com for further insight about investing in today’s markets.
Sincerely,

Rob Kapito
President, BlackRock Advisors, LLC

Rob Kapito
President, BlackRock Advisors, LLC
| | | | | | | | |
| Total Returns as of September 30, 2017 | |
| | | 6-month | | | 12-month | |
U.S. large cap equities
(S&P 500® Index) | | | 7.71 | % | | | 18.61 | % |
U.S. small cap equities
(Russell 2000® Index) | | | 8.27 | | | | 20.74 | |
International equities
(MSCI Europe, Australasia, Far East Index) | | | 11.86 | | | | 19.10 | |
Emerging market equities
(MSCI Emerging Markets Index) | | | 14.66 | | | | 22.46 | |
3-month Treasury bills
(BofA Merrill Lynch 3-Month U.S. Treasury Bill Index) | | | 0.47 | | | | 0.66 | |
U.S. Treasury securities
(BofA Merrill Lynch 10- Year U.S. Treasury Index) | | | 1.57 | | | | (4.61 | ) |
U.S. investment grade bonds
(Bloomberg Barclays U.S. Aggregate Bond Index) | | | 2.31 | | | | 0.07 | |
Tax-exempt municipal bonds
(S&P Municipal Bond Index) | | | 2.82 | | | | 0.84 | |
U.S. high yield bonds
(Bloomberg Barclays U.S. Corporate High Yield 2% Issuer Capped Index) | | | 4.19 | | | | 8.87 | |
|
| Past performance is no guarantee of future results. Index performance is shown for illustrative purposes only. You cannot invest directly in an index. | |
| | | | | | |
| 2 | | THIS PAGE NOT PART OF YOUR FUND REPORT | | | | |
| | |

| | Shareholders can sign up for e-mail notifications of quarterly statements, annual and semi-annual shareholder reports and prospectuses by enrolling in the electronic delivery program. Electronic copies of shareholder reports and prospectuses are also available on BlackRock’s website. TO ENROLL IN ELECTRONIC DELIVERY: Shareholders Who Hold Accounts with Investment Advisors, Banks or Brokerages: Please contact your financial advisor. Please note that not all investment advisors, banks or brokerages may offer this service. Shareholders Who Hold Accounts Directly with BlackRock: 1. Access the BlackRock website at blackrock.com 2. Select "Access Your Account" 3. Next, select "eDelivery" in the "Related Resources" box and follow the sign-up instructions |
| | | | | | |
| | | BLACKROCK EVENT DRIVEN EQUITY FUND | | SEPTEMBER 30, 2017 | | 3 |
| | | | |
| Fund Summary as of September 30, 2017 | | | | |
BlackRock Event Driven Equity Fund’s (the “Fund”) investment objective is to seek long-term capital growth.
|
| Portfolio Management Commentary |
How did the Fund perform?
| • | | For the 12-month period ended September 30, 2017, the Fund outperformed the BofA Merrill Lynch 3-Month U.S. Treasury Bill Index, and underperformed the Russell 1000® Index. |
What factors influenced performance?
| • | | The Fund’s skew toward “hard catalyst” situations (i.e., investments in companies involved in publicly announced transactions or restructurings) allowed the Fund to take advantage of the opportunities in merger arbitrage. At period end, 79% of the Fund’s long market value was invested in hard catalyst situations. |
| • | | Top contributors included hard catalyst investments in Qualcomm’s acquisition of NXP Semiconductors, the merger of Canadian Imperial Bank and PrivateBancorp, the ChemChina acquisition of Syngenta, AT&T’s proposed acquisition of Time Warner, and the merger of Abbott Laboratories and St. Jude Medical. These investments strongly outpaced the Fund’s detractors, the largest of which was an investment in the Bass Pro Shops/Cabela’s merger. |
Describe recent portfolio activity.
| • | | During the 12-month reporting period, the Fund maintained a skew to hard catalyst, merger & acquisition (“M&A”) investments, and selectively increased exposure to soft catalyst (investments in companies that are expected to undergo a transformative corporate initiative that will likely impact the value of the company) and cross capital structure opportunities. |
| • | | The fundamentals driving the merger boom have remained intact, with 2017 on track to meet or exceed 2016 levels and the regulatory environment under the Trump Administration proving to be highly supportive of corporate consolidation. Simultaneously, security dispersion has started to return to global markets, creating opportunities to selectively initiate soft catalyst and cross capital structure investments at attractive levels. Merger spreads continue to offer outsized returns and the portfolio |
| | | continued to be skewed to these hard catalyst investments to capitalize on the opportunities. However, exposure to M&A declined from its peak in the past year of 91% of long market value to 79%, trending toward long term normalized levels, as exposure to soft catalyst and cross capital structure meaningfully increased from 6% to 16% of net asset value. |
| • | | Concurrently, the Fund maintained low exposure to broad markets in seeking to protect capital against the backdrop of rich equity valuations and the divergent combination of heightened geopolitical uncertainty and record low market volatility. The Fund’s focus on idiosyncratic events and low net, managed approach (focus on limiting market exposure) resulted in an approximately 0.2 realized beta (or market sensitivity, with 1.0 being full exposure) to the S&P 500® Index over the period. |
| • | | The Fund held derivatives through the use of swaps during the period as part of its investment strategy. Contracts for difference are used by the investment adviser as the primary instrument to gain exposure to merger arbitrage situations. As a result, cash and cash equivalents are not representative of unencumbered cash, and the portfolio was fully invested with a long market value of 105% as of September 30, 2017. The Fund’s use of derivatives had a positive impact on Fund performance. |
Describe portfolio positioning at period end.
| • | | At period end, the Fund was comprised of 62 investments, balanced across hard, soft and cross capital structure ideas. Given the current opportunities in M&A, the Fund’s exposure remained predominantly skewed to hard catalyst situations with cross capital structure opportunities and soft catalyst positions rounding out the portfolio. The Fund’s exposure was concentrated in the United States, which accounted for 89% of gross exposure, while developed Europe and developed Asia accounted for 9% and 1% of gross exposure, respectively. The Fund was diversified across sectors and market capitalizations. |
The views expressed reflect the opinions of BlackRock as of the date of this report and are subject to change based on changes in market, economic or other conditions. These views are not intended to be a forecast of future events and are no guarantee of future results.
| | | | | | | | | | | | |
| | | Percent of Total Investments1 | |
| Sector Allocation | | Long | | | Short | | | Total | |
Health Care | | | 20 | % | | | 3 | % | | | 23 | % |
Consumer Discretionary | | | 20 | | | | 1 | | | | 21 | |
Information Technology | | | 14 | | | | 2 | | | | 16 | |
Industrials | | | 12 | | | | 1 | | | | 13 | |
Telecommunication Services | | | 7 | | | | 4 | | | | 11 | |
Energy | | | 3 | | | | 2 | | | | 5 | |
Materials | | | 5 | | | | — | 2 | | | 5 | |
Investment Companies | | | 2 | | | | 1 | | | | 3 | |
Real Estate | | | 3 | | | | — | | | | 3 | |
Consumer Staples | | | — | 2 | | | — | 2 | | | — | 2 |
Financials | | | — | 2 | | | — | 2 | | | — | 2 |
Total | | | 86 | % | | | 14 | % | | | 100 | % |
| | 1 | | Total investments include the gross notional values of long and short equity securities of the underlying derivative contracts utilized by the Fund and exclude short-term securities. |
| | 2 | | Amount is less than 1%. |
| | | | | | |
| 4 | | BLACKROCK EVENT DRIVEN EQUITY FUND | | SEPTEMBER 30, 2017 | | |
|
| Total Return Based on a $10,000 Investment |
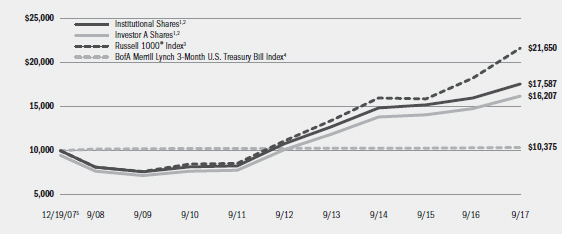
| | 1 | Assuming maximum sales charges, if any, transaction costs and other operating expenses, including investment advisory fees. Institutional Shares do not have a sales charge. |
| | 2 | Under normal circumstances, the Fund invests at least 80% of its net assets (plus any borrowings for investment purposes) in equity securities and related derivative instruments with similar economic characteristics. The Fund’s total returns prior to May 8, 2015 are the returns of the Fund when it utilized different investment strategies under the name BlackRock Large Cap Core Plus Fund. |
| | 3 | An index that measures the performance of the large cap segment of the U.S. equity universe. It is a subset of the Russell 3000® Index and includes approximately 1,000 of the largest securities based on a combination of their market capitalization and current index membership. The index represents approximately 92% of the total market capitalization of the Russell 3000® Index. |
| | 4 | An unmanaged index that tracks 3-month U.S. Treasury securities. |
| | 5 | Commencement of operations. |
| | | | | | | | | | | | | | | | | | | | | | | | | | | | | | | | | | | |
| Performance Summary for the Period Ended September 30, 2017 | | | | | | | | | | |
| | | | | Average Annual Total Returns2,6 |
| | | | | 1 Year | | 5 Years | | Since Inception7 |
| | | 6-Month
Total Returns | | w/o sales
charge | | w/ sales
charge | | w/o sales
charge | | w/ sales
charge | | w/o sales
charge | | w/ sales
charge |
Institutional | | | | 4.36 | % | | | | 10.08 | % | | | | N/A | | | | | 10.24 | % | | | | N/A | | | | | 5.94 | % | | | | N/A | |
Investor A | | | | 4.18 | | | | | 9.71 | | | | | 3.95 | % | | | | 9.92 | | | | | 8.74 | % | | | | 5.64 | | | | | 5.06 | % |
Investor C | | | | 3.85 | | | | | 8.84 | | | | | 7.84 | | | | | 9.14 | | | | | 9.14 | | | | | 4.88 | | | | | 4.88 | |
Russell 1000® Index | | | | 7.68 | | | | | 18.54 | | | | | N/A | | | | | 14.27 | | | | | N/A | | | | | 8.22 | | | | | N/A | |
BofA Merrill Lynch 3-Month U.S. Treasury Bill Index | | | | 0.47 | | | | | 0.66 | | | | | N/A | | | | | 0.22 | | | | | N/A | | | | | 0.38 | | | | | N/A | |
| | 6 | | Assuming maximum sales charges, if any. Average annual total returns with and without sales charges reflect reductions for distribution and service fees. See “About Fund Performance” on page 6 for a detailed description of share classes, including any related sales charges and fees. |
| | 7 | | The Fund commenced operations on December 19, 2007. |
| | | | N/A — Not applicable as share class and index do not have a sales charge. |
| | | | Past performance is not indicative of future results. |
| | | | Performance results may include adjustments made for financial reporting purposes in accordance with U.S. generally accepted accounting principles. |
| | | | | | |
| | | BLACKROCK EVENT DRIVEN EQUITY FUND | | SEPTEMBER 30, 2017 | | 5 |
| • | | Institutional Shares are not subject to any sales charge. These shares bear no ongoing distribution or service fees and are available only to certain eligible investors. |
| • | | Investor A Shares are subject to a maximum initial sales charge (front-end load) of 5.25% and a service fee of 0.25% per year (but no distribution fee). Certain redemptions of these shares may be subject to a contingent deferred sales charge (“CDSC”) where no initial sales charge was paid at the time of purchase. These shares are generally available through financial intermediaries. |
| • | | Investor C Shares are subject to a 1.00% CDSC if redeemed within one year of purchase. In addition, these shares are subject to a distribution fee of 0.75% per year and a service fee of 0.25% per year. These shares are generally available through financial intermediaries. |
Performance information reflects past performance and does not guarantee future results. Current performance may be lower or higher than the performance data quoted. Refer to www.blackrock.com to obtain performance data current to the most recent month end. Performance
results do not reflect the deduction of taxes that a shareholder would pay on fund distributions or the redemption of fund shares. Figures shown in the performance tables on the previous page assume reinvestment of all distributions, if any, at net asset value (“NAV”) on the ex-dividend date. Investment return and principal value of shares will fluctuate so that shares, when redeemed, may be worth more or less than their original cost. Distributions paid to each class of shares will vary because of the different levels of service, distribution and transfer agency fees applicable to each class, which are deducted from the income available to be paid to shareholders.
BlackRock Advisors, LLC (the “Manager”), the Fund’s investment adviser, has contractually agreed to waive and/or reimburse a portion of the Fund’s expenses. Without such waiver and/or reimbursement, the Fund’s performance would have been lower. The Manager is under no obligation to continue waiving and/or reimbursing its fees after the applicable termination date of such agreement. See Note 6 of the Notes to Financial Statements for additional information on waivers and/or reimbursements.
|
| Derivative Financial Instruments |
The Fund may invest in various derivative financial instruments. These instruments are used to obtain exposure to a security, commodity, index, market, and/or other assets without owning or taking physical custody of securities, commodities and/or other referenced assets to manage market, equity, credit, interest rate, foreign currency exchange rate, commodity and/or other risks. Derivative financial instruments may give rise to a form of economic leverage and involve risks, including the imperfect correlation between the value of a derivative financial instrument and the underlying asset, possible default of the counterparty to the transaction
or illiquidity of the instrument. The Fund’s successful use of a derivative financial instrument depends on the investment adviser’s ability to predict pertinent market movements accurately, which cannot be assured. The use of these instruments may result in losses greater than if they had not been used, may limit the amount of appreciation the Fund can realize on an investment and/or may result in lower distributions paid to shareholders. The Fund’s investments in these instruments, if any, are discussed in detail in the Notes to Financial Statements.
| | | | | | |
| 6 | | BLACKROCK EVENT DRIVEN EQUITY FUND | | SEPTEMBER 30, 2017 | | |
Shareholders of the Fund may incur the following charges: (a) transactional expenses, such as sales charges; and (b) operating expenses, including investment advisory fees, service and distribution fees, including 12b-1 fees, acquired fund fees and expenses, and other fund expenses. The expense example shown below (which is based on a hypothetical investment of $1,000 invested on April 1, 2017 and held through September 30, 2017) is intended to assist shareholders both in calculating expenses based on an investment in the Fund and in comparing these expenses with similar costs of investing in other mutual funds.
The expense example provides information about actual account values and actual expenses. In order to estimate the expenses a shareholder paid during the period covered by this report, shareholders can divide their account value by $1,000 and then multiply the result by the number corresponding to their share class under the heading entitled “Expenses Paid During the Period.”
The expense example also provides information about hypothetical account values and hypothetical expenses based on the Fund’s actual expense ratio and an assumed rate of return of 5% per year before expenses. In order to assist shareholders in comparing the ongoing expenses of investing in the Fund and other funds, compare the 5% hypothetical examples with the 5% hypothetical example that appear in shareholder reports of other funds.
The expenses shown in the expense example are intended to highlight shareholders’ ongoing costs only and do not reflect transactional expenses, such as sales charges, if any. Therefore, the hypothetical example is useful in comparing ongoing expenses only, and will not help shareholders determine the relative total expenses of owning different funds. If these transactional expenses were included, shareholder expenses would have been higher.
| | | | | | | | | | | | | | | | | | | | | | | | | | | | | | | | | | | | | | | | | | | | | |
| Expense Example | |
| | | Actual | | Hypothetical3 |
| | | | | | | Expenses Paid During the Period | | | | Including
Interest Expense | | Excluding
Interest Expense |
| | | Beginning
Account Value
April 1,
2017 | | Ending
Account Value
September 30,
2017 | | Including
Interest Expense1 | | Excluding
Interest Expense2 | | Beginning
Account Value
April 1,
2017 | | Ending
Account Value
September 30,
2017 | | Expenses
Paid During
the Period1 | | Ending
Account Value
September 30,
2017 | | Expenses
Paid During
the Period2 |
Institutional | | | $ | 1,000.00 | | | | $ | 1,043.60 | | | | $ | 7.25 | | | | $ | 7.07 | | | | $ | 1,000.00 | | | | $ | 1,017.97 | | | | $ | 7.16 | | | | $ | 1,018.15 | | | | $ | 6.98 | |
Investor A | | | $ | 1,000.00 | | | | $ | 1,042.90 | | | | $ | 8.63 | | | | $ | 8.44 | | | | $ | 1,000.00 | | | | $ | 1,016.62 | | | | $ | 8.52 | | | | $ | 1,016.81 | | | | $ | 8.33 | |
Investor C | | | $ | 1,000.00 | | | | $ | 1,038.50 | | | | $ | 12.41 | | | | $ | 12.21 | | | | $ | 1,000.00 | | | | $ | 1,012.90 | | | | $ | 12.25 | | | | $ | 1,013.09 | | | | $ | 12.06 | |
| | 1 | | For each class of the Fund, expenses are equal to the annualized expense ratio for the class (1.42% for Institutional, 1.68% for Investor A, and 2.43% for Investor C), multiplied by the average account value over the period, multiplied by 183/365 (to reflect the one-half year period shown). |
| | 2 | | For each class of the Fund, expenses are equal to the annualized expense ratio for the class (1.38% for Institutional, 1.65% for Investor A, and 2.39% for Investor C), multiplied by the average account value over the period, multiplied by 183/365 (to reflect the one-half year period shown). |
| | 3 | | Hypothetical 5% annual return before expenses is calculated by prorating the number of days in the most recent fiscal half year divided by 365. |
| | | | See “Disclosure of Expenses” above for further information on how expenses were calculated. |
| | | | | | |
| | | BLACKROCK EVENT DRIVEN EQUITY FUND | | SEPTEMBER 30, 2017 | | 7 |
| | | | |
| Schedule of Investments September 30, 2017 | | | (Percentages shown are based on Net Assets) | |
| | | | |
| | | | | | | | |
| Common Stocks | | Shares | | | Value | |
Aerospace & Defense — 0.5% | | | | | | | | |
Arconic, Inc. | | | 35,546 | | | $ | 884,384 | |
Banks — 0.1% | | | | | | | | |
Valley National Bancorp | | | 15,000 | | | | 180,750 | |
Chemicals — 0.4% | | | | | | | | |
Olin Corp. | | | 4,330 | | | | 148,302 | |
Sherwin-Williams Co. | | | 1,448 | | | | 518,442 | |
| | | | | | | | |
| | | | | | | | 666,744 | |
Equity Real Estate Investment Trusts (REITs) — 0.1% | | | | | | | | |
VEREIT, Inc. | | | 17,000 | | | | 140,930 | |
Food & Staples Retailing — 0.1% | | | | | | | | |
Walgreens Boots Alliance, Inc. | | | 3,256 | | | | 251,428 | |
Food Products — 0.1% | | | | | | | | |
Kraft Heinz Co. | | | 2,900 | | | | 224,895 | |
Health Care Equipment & Supplies — 0.3% | | | | | | | | |
Cooper Cos., Inc. | | | 850 | | | | 201,544 | |
Danaher Corp. | | | 3,570 | | | | 306,235 | |
| | | | | | | | |
| | | | | | | | 507,779 | |
Health Care Providers & Services — 0.3% | | | | | | | | |
Anthem, Inc. | | | 166 | | | | 31,520 | |
Brookdale Senior Living, Inc. (a) | | | 4,390 | | | | 46,534 | |
Cigna Corp. | | | 1,500 | | | | 280,410 | |
HCA Healthcare, Inc. (a) | | | 2,250 | | | | 179,077 | |
| | | | | | | | |
| | | | | | | | 537,541 | |
Household Products — 0.2% | | | | | | | | |
Reckitt Benckiser Group PLC | | | 3,599 | | | | 328,833 | |
Machinery — 0.0% | | | | | | | | |
Fortive Corp. | | | 1,158 | | | | 81,975 | |
Media — 0.6% | | | | | | | | |
Charter Communications, Inc., Class A (a) | | | 1,062 | | | | 385,952 | |
Discovery Communications, Inc., Class A (a) | | | 4,140 | | | | 88,141 | |
Scripps Networks Interactive, Inc., Class A | | | 7,201 | | | | 618,494 | |
| | | | | | | | |
| | | | | | | | 1,092,587 | |
Oil, Gas & Consumable Fuels — 0.3% | | | | | | | | |
Williams Cos., Inc. | | | 11,859 | | | | 355,889 | |
Williams Partners LP | | | 6,863 | | | | 266,971 | |
| | | | | | | | |
| | | | | | | | 622,860 | |
Personal Products — 0.1% | | | | | | | | |
Coty, Inc., Class A | | | 10,563 | | | | 174,606 | |
| | | | | | | | |
| Common Stocks | | Shares | | | Value | |
Pharmaceuticals — 0.2% | | | | | | | | |
Pfizer, Inc. | | | 8,500 | | | $ | 303,450 | |
Wireless Telecommunication Services — 0.2% | | | | | | | | |
T-Mobile U.S., Inc. (a) | | | 5,138 | | | | 316,809 | |
Total Common Stocks — 3.5% | | | | | | | 6,315,571 | |
| | | | | | | | |
| Corporate Bonds | | Par
(000) | | | | |
Aerospace & Defense — 0.5% | | | | | | | | |
Bombardier, Inc., 8.75%, 12/01/21 (b) | | USD | 890 | | | | 954,080 | |
Health Care Equipment & Supplies — 2.0% | | | | | | | | |
Alere, Inc., 6.38%, 7/01/23 (b) | | | 3,400 | | | | 3,663,500 | |
Health Care Providers & Services — 1.1% | | | | | | | | |
Tenet Healthcare Corp., 4.75%, 6/01/20 | | | 2,000 | | | | 2,065,400 | |
Hotels, Restaurants & Leisure — 0.1% | | | | | | | | |
Station Casinos LLC, 7.50%, 3/01/21 | | | 232 | | | | 240,700 | |
Internet Software & Services — 1.2% | | | | | | | | |
WebMD Health Corp., 2.50%, 1/31/18 (c) | | | 2,000 | | | | 2,135,800 | |
IT Services — 1.1% | | | | | | | | |
First Data Corp., 5.00%, 1/15/24 (b) | | | 2,000 | | | | 2,076,600 | |
Media — 4.0% | | | | | | | | |
Charter Communications Operating LLC/Charter Communications Operating Capital,
4.46%, 7/23/22 | | | 2,000 | | | | 2,116,053 | |
CSC Holdings LLC, 10.88%, 10/15/25 (b) | | | 147 | | | | 181,729 | |
DISH DBS Corp., 4.25%, 4/01/18 | | | 5,000 | | | | 5,037,500 | |
| | | | | | | | |
| | | | | | | | 7,335,282 | |
Wireless Telecommunication Services — 0.9% | | | | | | | | |
Sprint Corp., 7.63%, 2/15/25 | | | 1,415 | | | | 1,622,828 | |
Total Corporate Bonds — 10.9% | | | | | | | 20,094,190 | |
| | | | | | | | |
| Floating Rate Loan Interests | | | | | | |
Entertainment & Leisure — 1.6% | | | | | | | | |
UFC Holdings LLC: | | | | | | | | |
Term Loan (First Lien), (1 mo. LIBOR US + 3.25%, 1.00% Floor), 4.49%, 8/18/23 (d) | | | 2,125 | | | | 2,132,262 | |
Term Loan (Second Lien), (1 mo. LIBOR US + 7.50%, 1.00% Floor), 8.74%, 8/18/24 (d) | | | 855 | | | | 866,970 | |
| | | | | | | | |
| | | | | | | | 2,999,232 | |
| | | | | | | | | | |
| Portfolio Abbreviations |
| ADR | | American Depositary Receipts | | GBP | | British Pound | | S&P | | Standard & Poor’s |
| AKA | | Also Known As | | LIBOR | | London Interbank Offered Rate | | SPDR | | Standard & Poor’s Depositary Receipts |
| ETF | | Exchange-Traded Fund | | OTC | | Over-the-Counter | | USD | | U.S. Dollar |
See Notes to Financial Statements.
| | | | | | |
| 8 | | BLACKROCK EVENT DRIVEN EQUITY FUND | | SEPTEMBER 30, 2017 | | |
| | | | |
| Schedule of Investments (continued) | | | | |
| | | | |
| | | | | | | | |
| Floating Rate Loan Interests | | Par (000) | | | Value | |
Media — 2.6% | | | | | | | | |
Charter Communications Operating LLC (AKA CCO Safari LLC), Term I-1 Loan, (1 mo. LIBOR US + 2.25%), 3.49%, 1/15/24 (d) | | USD | 3,949 | | | $ | 3,963,734 | |
Entercom Radio LLC: | | | | | | | | |
Term B Loan, (1 mo. LIBOR US + 3.50%, 1.00% Floor), 4.73%, 11/01/23 (d) | | | 73 | | | | 73,480 | |
Term B Loan, (1 mo. LIBOR US + 3.50%, 1.00% Floor), 4.74%, 11/01/23 (d) | | | 811 | | | | 812,138 | |
| | | | | | | | |
| | | | | | | | 4,849,352 | |
Wireless Telecommunication Services — 0.5% | | | | | | | | |
Sprint Communications, Inc., Initial Term Loan (1 mo. LIBOR US + 2.50%, 0.75% Floor), 3.75%, 2/02/24 (d) | | | 826 | | | | 826,370 | |
Total Floating Rate Loan Interests — 4.7% | | | | | | | 8,674,954 | |
| | | | | | | | |
| Investment Companies | | Shares | | | | |
Altaba, Inc. (a) | | | 54,486 | | | | 3,609,153 | |
Total Investment Companies — 2.0% | | | | | | | 3,609,153 | |
Total Long-Term Investments (Cost — $38,188,199) — 21.1% | | | | | | | 38,693,868 | |
| | | | | | | | |
| | | | | | | | |
| Short-Term Securities | | Par
(000) | | | | |
Borrowed Bond Agreements — 1.1% | | | | | | | | |
Citigroup Global Markets, Inc., 1.18%
(Purchased on 6/30/17 to be repurchased at $2,011,564, collateralized by U.S. Treasury Notes, 1.75% due at 5/31/22, par and fair value of $2,013,000 and $1,999,868, respectively) | | USD | 2,005 | | | | 2,005,451 | |
| | | | | | | | |
| | |
Shares | | | Value | |
Money Market Funds — 80.1% | | | | | | | | |
BlackRock Liquidity Funds, T-Fund, Institutional Class, 0.91% (e)(f) | | | 147,158,282 | | | $ | 147,158,282 | |
| | | | | | | | |
| | | Par (000) | | | | |
Time Deposits — 0.0% | | | | | | | | |
Brown Brothers Harriman & Co., 0.05%, 10/02/17 | | GBP | 3 | | | | 4,165 | |
Brown Brothers Harriman & Co., 1.17%, 10/02/17 | | USD | 20 | | | | 19,967 | |
| | | | | | | | |
| | | | | | | | 24,132 | |
Total Short-Term Securities (Cost — $149,187,837) — 81.2% | | | | | | | 149,187,865 | |
| | | | | | | | |
Total Investments Before Borrowed Bonds (Cost — $187,376,036) — 102.3% | | | | | 187,881,733 | |
| | | | | | | | |
| Borrowed Bonds | | | | | | |
U.S. Treasury Obligations — (1.1)% | | | | | | | | |
U.S. Treasury Notes, 1.75%, 5/31/22 | | | 2,013 | | | | (1,999,868 | ) |
Total Borrowed Bonds (Proceeds — $2,004,979) — (1.1)% | | | | (1,999,868 | ) |
Total Investments Net of Borrowed Bonds — 101.2% | | | | 185,881,865 | |
Liabilities in Excess of Other Assets — (1.2)% | | | | | | | (2,131,766 | ) |
| | | | | | | | |
Net Assets — 100.0% | | | | | | $ | 183,750,099 | |
| | | | | | | | |
|
| Notes to Schedule of Investments |
| (a) | Non-income producing security. |
| (b) | Security exempt from registration pursuant to Rule 144A under the Securities Act of 1933, as amended. These securities may be resold in transactions exempt from registration to qualified institutional investors. |
| (d) | Variable rate security. Rate shown is the rate in effect as of period end. |
| (e) | Annualized 7-day yield as of period end. |
| (f) | During the year ended September 30, 2017, investments in issuers considered to be affiliates of the Fund for purposes of Section 2(a)(3) of the Investment Company Act of 1940, as amended, were as follows: |
| | | | | | | | | | | | | | | | | | | | | | | | | | | | |
| Affiliate | | Shares
Held at
September 30,
2016 | | | Net
Activity | | | Shares
Held at
September 30,
2017 | | | Value at
September 30, 2017 | | | Income | | | Net
Realized
Gain1 | | | Change in
Unrealized
Appreciation
(Depreciation) | |
BlackRock Liquidity Funds, T-Fund, Institutional Class | | | 107,122,068 | | | | 40,036,214 | | | | 147,158,282 | | | $ | 147,158,282 | | | $ | 670,364 | | | $ | 498 | | | | — | |
| | 1 | | Includes net capital gain distributions, if applicable. |
| • | | For Fund compliance purposes, the Fund’s industry classifications refer to one or more of the industry sub-classifications used by one or more widely recognized market indexes or ratings group indexes, and/or as defined by the investment adviser. These definitions may not apply for purposes of this report, which may combine such industry sub-classifications for reporting ease. |
See Notes to Financial Statements.
| | | | | | |
| | | BLACKROCK EVENT DRIVEN EQUITY FUND | | SEPTEMBER 30, 2017 | | 9 |
| | | | |
| Schedule of Investments (continued) | | | | |
|
| Derivative Financial Instruments Outstanding as of Period End |
|
|
Centrally Cleared Credit Default Swaps — Buy Protection |
| | | | | | | | | | | | | | | | | | | | | | | | | | | | | | | | | | | |
Reference Obligation | | |
| Financing
Rate
Paid by
the
Fund |
| | |
| Payment
Frequency |
| | |
| Termination
Date |
| | |
| Notional
Amount
(000) |
| | | | Value | | | |
| Upfront
Premium
Received |
| | |
| Unrealized
Depreciation |
|
CDX.NA.HY.29.V1 | | | | 5.00 | % | | | | Quarterly | | | | | 12/20/22 | | | | USD | 1,100 | | | | | $(85,867 | ) | | | | $(81,475 | ) | | | | $(4,392 | ) |
| | | | | | | | | | | | | | | | | | |
Reference Entity | | Counterparty | |
| Termination
Dates |
| |
| Net
Notional |
| |
| Unrealized
Appreciation
(Depreciation) |
| |
| Net Value of
Reference
Entity |
|
Equity Securities Long/Short | | Citibank N.A. | | | 7/06/18 | | | | $44,058,235 | | | | $946,1192 | | | | $45,138,782 | |
| | Citibank N.A. | | | 8/03/18 | | | | $(5,842,331 | ) | | | (111,375)3 | | | | (5,952,180 | ) |
| | Credit Suisse International | | | 4/12/18-9/17/18 | | | | $4,338,147 | | | | 193,0234 | | | | 4,532,842 | |
| | Goldman Sachs Bank USA | | | 10/05/17-3/20/19 | | | | $66,396,978 | | | | 625,8435 | | | | 67,406,081 | |
| | Goldman Sachs Bank USA | | | 8/30/18 | | | | $(1,211 | ) | | | (109)6 | | | | (1,329 | ) |
| | Morgan Stanley & Co. International PLC | | | 5/11/18-8/15/19 | | | | $14,205,316 | | | | 804,5037 | | | | 15,076,236 | |
| | | Morgan Stanley & Co. International PLC | | | 6/01/18-7/11/18 | | | | $199,817 | | | | 78,1248 | | | | 280,855 | |
| | | | | | | | | | | | | $2,536,128 | | | | $126,481,287 | |
| | | | | | | | | | | | | | |
| | 1 | | The Fund receives or pays the total return on a portfolio of long and short positions underlying the total return swap. In addition, the Fund pays or receives a variable rate of interest, based on a specified benchmark, plus or minus a spread in a range of 15-165 basis points. The benchmark and spread are determined based upon the country and/or currency of the individual underlying positions. The following are the specified benchmarks used in determining the variable rate of interest: |
| | | | Bank of Canada Overnight Repo Rate |
| | | | Canada Bankers Acceptances 1 Month |
| | | | Intercontinental Exchange LIBOR: |
| | | | USD Overnight Bank Funding Rate |
| | 2 | | Amount includes $(134,428) of net dividends and financing fees. |
| | 3 | | Amount includes $(1,526) of net dividends and financing fees. |
| | 4 | | Amount includes $(1,672) of net dividends and financing fees. |
| | 5 | | Amount includes $(383,260) of net dividends and financing fees. |
| | 6 | | Amount includes $9 of net dividends and financing fees. |
| | 7 | | Amount includes $(66,417) of net dividends and financing fees. |
| | 8 | | Amount includes $(2,914) of net dividends and financing fees. |
The following table represents the individual long and short positions and related values of equity securities underlying the total return swap with Citibank N.A., as of period end, termination date 7/06/18:
| | | | | | | | |
| Reference Entity — Long | | | | | | | | |
| Common Stocks | | Shares | | | Value | |
Chemicals | | | | | | | | |
Monsanto Co. | | | 72,364 | | | $ | 8,670,655 | |
Equity Real Estate Investment Trusts (REITs) | | | | | | | | |
Parkway, Inc. | | | 31,737 | | | | 730,903 | |
Health Care Equipment & Supplies | | | | | | | | |
Alere, Inc. | | | 53,578 | | | | 2,731,942 | |
Life Sciences Tools & Services | | | | | | | | |
PAREXEL International Corp. | | | 53,671 | | | | 4,727,342 | |
| | | | | | | | |
| Common Stocks | | Shares | | | Value | |
Media | | | | | | | | |
Time Warner, Inc. | | | 124,843 | | | $ | 12,790,165 | |
Semiconductors & Semiconductor Equipment | | | | | | | | |
NXP Semiconductors NV | | | 159,445 | | | | 18,031,635 | |
Thrifts & Mortgage Finance | | | | | | | | |
Astoria Financial Corp. | | | 14,684 | | | | 315,706 | |
| Total Reference Entity — Long | | | | | 47,998,348 | |
| | | | | | | | |
| Reference Entity — Short | | | | | | |
| Common Stocks | | | | | | |
Banks | | | | | | | | |
Sterling Bancorp | | | (12,849 | ) | | $ | (316,728 | ) |
See Notes to Financial Statements.
| | | | | | |
| 10 | | BLACKROCK EVENT DRIVEN EQUITY FUND | | SEPTEMBER 30, 2017 | | |
| | | | |
| Schedule of Investments (continued) | | | | |
| | | | |
| | | | | | | | |
| Common Stocks | | Shares | | | Value | |
Diversified Telecommunication Services | | | | | | | | |
AT&T Inc. | | | (64,918 | ) | | $ | (2,542,838 | ) |
Total Reference Entity — Short | | | | | | | (2,859,566 | ) |
Net Value of Reference Entity — Citibank N.A. | | | | | | $ | 45,138,782 | |
The following table represents the individual long and short positions and related values of equity securities underlying the total return swap with Citibank N.A., as of period end, termination date 8/03/18:
| | | | | | | | |
| Reference Entity — Long | | | | | | |
| Common Stocks | | Shares | | | Value | |
Health Care Equipment & Supplies | | | | | | | | |
Abbott Laboratories | | | 8,138 | | | $ | 434,244 | |
Health Care Providers & Services | | | | | | | | |
Anthem, Inc. | | | 1,433 | | | | 272,098 | |
Media | | | | | | | | |
CBS Corp., Class B, Non-Voting Shares | | | 4,859 | | | | 281,822 | |
Total Reference Entity — Long | | | | | | | 988,164 | |
| | | | | | | | |
| Reference Entity — Short | | | | | | |
| Common Stocks | | | | | | |
Banks | | | | | | | | |
Bank Of America Corp. | | | (1,631 | ) | | $ | (41,330 | ) |
JPMorgan Chase & Co. | | | (409 | ) | | | (39,064 | ) |
| | | | | | | | |
| | | | | | | | (80,394 | ) |
Beverages | | | | | | | | |
Coca-Cola Co. | | | (483 | ) | | | (21,740 | ) |
Pepsico, Inc. | | | (188 | ) | | | (20,949 | ) |
| | | | | | | | |
| | | | | | | | (42,689 | ) |
Containers & Packaging | | | | | | | | |
Ball Corp. | | | (515 | ) | | | (21,269 | ) |
Food & Staples Retailing | | | | | | | | |
Costco Wholesale Corp. | | | (137 | ) | | | (22,508 | ) |
Sysco Corp. | | | (439 | ) | | | (23,684 | ) |
Wal-Mart Stores, Inc. | | | (286 | ) | | | (22,348 | ) |
| | | | | | | | |
| | | | | | | | (68,540 | ) |
Food Products | | | | | | | | |
Archer-Daniels-Midland Co. | | | (532 | ) | | | (22,615 | ) |
Kellogg Co. | | | (312 | ) | | | (19,459 | ) |
| | | | | | | | |
| | | | | | | | (42,074 | ) |
Health Care Equipment & Supplies | | | | | | | | |
Boston Scientific Corp. | | | (2,109 | ) | | | (61,520 | ) |
Medtronic Plc | | | (661 | ) | | | (51,406 | ) |
| | | | | | | | |
| | | | | | | | (112,926 | ) |
Health Care Providers & Services | | | | | | | | |
UnitedHealth Group, Inc. | | | (1,808 | ) | | | (354,097 | ) |
Household Products | | | | | | | | |
Church & Dwight Co., Inc. | | | (416 | ) | | | (20,155 | ) |
Clorox Co. | | | (161 | ) | | | (21,237 | ) |
Kimberly-Clark Corp. | | | (166 | ) | | | (19,535 | ) |
Procter & Gamble Co. | | | (917 | ) | | | (83,429 | ) |
| | | | | | | | |
| | | | | | | | (144,356 | ) |
| | | | | | | | |
| Common Stocks | | Shares | | | Value | |
Internet Software & Services | | | | | | | | |
Alibaba Group Holding Ltd. — ADR | | | (16,345 | ) | | $ | (2,822,945 | ) |
Life Sciences Tools & Services | | | | | | | | |
Mettler-Toledo International, Inc. | | | (225 | ) | | | (140,886 | ) |
Waters Corp. | | | (629 | ) | | | (112,918 | ) |
| | | | | | | | |
| | | | | | | | (253,804 | ) |
Oil, Gas & Consumable Fuels | | | | | | | | |
Buckeye Partners LP | | | (393 | ) | | | (22,401 | ) |
Enbridge, Inc. | | | (1,125 | ) | | | (47,070 | ) |
Kinder Morgan, Inc. | | | (3,575 | ) | | | (68,568 | ) |
| | | | | | | | |
| | | | | | | | (138,039 | ) |
Personal Products | | | | | | | | |
Estee Lauder Cos., Inc., Class A | | | (226 | ) | | | (24,372 | ) |
Pharmaceuticals | | | | | | | | |
Johnson & Johnson | | | (844 | ) | | | (109,728 | ) |
Merck & Co., Inc. | | | (1,592 | ) | | | (101,936 | ) |
| | | | | | | | |
| | | | | | | | (211,664 | ) |
Tobacco | | | | | | | | |
Altria Group, Inc. | | | (289 | ) | | | (18,328 | ) |
Philip Morris International, Inc. | | | (184 | ) | | | (20,426 | ) |
| | | | | | | | |
| | | | | | | | (38,754 | ) |
Total Common Stocks | | | | | | | (4,355,923 | ) |
Investment Companies | | | | | | | | |
Alerian MLP ETF | | | (28,057 | ) | | | (314,800 | ) |
Consumer Staples Select Sector SPDR Fund | | | (9,156 | ) | | | (494,241 | ) |
Energy Select Sector SPDR Fund | | | (963 | ) | | | (65,946 | ) |
Industrial Select Sector SPDR Fund | | | (13,840 | ) | | | (982,640 | ) |
iShares U.S. Real Estate ETF | | | (29 | ) | | | (2,316 | ) |
SPDR S&P 500 ETF Trust | | | (2,738 | ) | | | (687,868 | ) |
SPDR S&P Regional Banking ETF | | | (645 | ) | | | (36,610 | ) |
| | | | | | | | |
| | | | | | | | (2,584,421 | ) |
Total Investment Companies | | | | | | | (2,584,421 | ) |
Total Reference Entity — Short | | | | | | | (6,940,344 | ) |
Net Value of Reference Entity — Citibank N.A. | | | | | | $ | (5,952,180 | ) |
The following table represents the individual long and short positions and related values of equity securities underlying the total return swap with Credit Suisse International, as of period end, termination dates 4/12/18-9/17/18:
| | | | | | | | |
| Reference Entity — Long | | | | | | |
| Common Stocks | | Shares | | | Value | |
Diversified Telecommunication Services | | | | | | | | |
Straight Path Communications, Inc. | | | 7,120 | | | $ | 1,286,370 | |
Equity Real Estate Investment Trusts (REITs) | | | | | | | | |
First Potomac Realty Trust | | | 138,943 | | | | 1,547,825 | |
Parkway, Inc. | | | 73,758 | | | | 1,698,647 | |
| | | | | | | | |
| | | | | | | | 3,246,472 | |
Total Reference Entity — Long | | | | | | | 4,532,842 | |
Net Value of Reference Entity — Credit Suisse International | | | | | | $ | 4,532,842 | |
See Notes to Financial Statements.
| | | | | | |
| | | BLACKROCK EVENT DRIVEN EQUITY FUND | | SEPTEMBER 30, 2017 | | 11 |
| | | | |
| Schedule of Investments (continued) | | | | |
The following table represents the individual long and short positions and related values of equity securities underlying the total return swap with Goldman Sachs Bank USA, as of period end, termination dates 10/05/17-3/20/19:
| | | | | | | | |
| Reference Entity — Long | | | | | | |
| Common Stocks | | Shares | | | Value | |
Aerospace & Defense | | | | | | | | |
Orbital ATK, Inc. | | | 54,600 | | | $ | 7,270,536 | |
Rockwell Collins, Inc. | | | 88,344 | | | | 11,547,444 | |
| | | | | | | | |
| | | | | | | | 18,817,980 | |
Biotechnology | | | | | | | | |
Kite Pharma, Inc. | | | 13,541 | | | | 2,434,807 | |
Chemicals | | | | | | | | |
Monsanto Co. | | | 5,464 | | | | 654,696 | |
Communications Equipment | | | | | | | | |
Brocade Communications Systems, Inc. | | | 438,827 | | | | 5,243,982 | |
Diversified Telecommunication Services | | | | | | | | |
Level 3 Communications, Inc. | | | 211,519 | | | | 11,271,848 | |
Equity Real Estate Investment Trusts (REITs) | | | | | | | | |
Parkway, Inc. | | | 85,334 | | | | 1,965,242 | |
Health Care Equipment & Supplies | | | | | | | | |
Alere, Inc. | | | 94,815 | | | | 4,834,617 | |
Health Care Providers & Services | | | | | | | | |
PharMerica Corp. | | | 28,711 | | | | 841,232 | |
Internet & Direct Marketing Retail | | | | | | | | |
HSN, Inc. | | | 12,018 | | | | 469,303 | |
IT Services | | | | | | | | |
Paysafe Group PLC | | | 231,718 | | | | 1,808,672 | |
Life Sciences Tools & Services | | | | | | | | |
VWR Corp. | | | 94,519 | | | | 3,129,524 | |
Media | | | | | | | | |
Scripps Networks Interactive, Inc., Class A | | | 123,374 | | | | 10,596,593 | |
Tribune Media Co., Class A | | | 92,099 | | | | 3,763,165 | |
| | | | | | | | |
| | | | | | | | 14,359,758 | |
Pharmaceuticals | | | | | | | | |
Akorn, Inc. | | | 142,810 | | | | 4,739,864 | |
Professional Services | | | | | | | | |
The Advisory Board Co. | | | 139,432 | | | | 7,477,041 | |
Semiconductors & Semiconductor Equipment | | | | | | | | |
IXYS Corp. | | | 110,475 | | | | 2,618,258 | |
Total Reference Entity — Long | | | | | | | 80,666,824 | |
| | | | | | | | |
| Reference Entity — Short | | | | | | |
| Common Stocks | | | | | | |
Aerospace & Defense | | | | | | | | |
United Technologies Corp. | | | (22,086 | ) | | $ | (2,563,743 | ) |
Diversified Telecommunication Services | | | | | | | | |
Centurylink, Inc. | | | (302,177 | ) | | | (5,711,145 | ) |
Electronic Equipment, Instruments & Components | | | | | | | | |
Littelfuse, Inc. | | | (6,988 | ) | | | (1,368,809 | ) |
Health Care Technology | | | | | | | | |
Evolent Health, Inc. | | | (12,841 | ) | | | (228,570 | ) |
Internet & Direct Marketing Retail | | | | | | | | |
Liberty Interactive Corp. QVC Group, Class A | | | (19,825 | ) | | | (467,275 | ) |
| | | | | | | | |
| Common Stocks | | Shares | | | Value | |
Media | | | | | | | | |
Discovery Communications, Inc., Class C | | | (110,685 | ) | | $ | (2,242,478 | ) |
Sinclair Broadcast Group, Inc., Class A | | | (21,177 | ) | | | (678,723 | ) |
| | | | | | | | |
| | | | | | | | (2,921,201 | ) |
Total Reference Entity — Short | | | | | | | (13,260,743 | ) |
Net Value of Reference Entity — Goldman Sachs & Co. | | | | | | $ | 67,406,081 | |
The following table represents the individual long and short positions and related values of equity securities underlying the total return swap with Goldman Sachs Bank USA, as of period end, termination date 8/30/18:
| | | | | | | | |
| Reference Entity — Long | | | | | | |
| Common Stocks | | Shares | | | Value | |
Banks | | | | | | | | |
Valley National Bancorp | | | 100 | | | $ | 1,205 | |
| | | | | | | | |
| Reference Entity — Short | | | | | | |
| Common Stocks | | | | | | |
Banks | | | | | | | | |
Bank Of America Corp. | | | (100 | ) | | $ | (2,534 | ) |
Net Value of Reference Entity — Goldman Sachs & Co. | | | | | | $ | (1,329 | ) |
The following table represents the individual long and short positions and related values of equity securities underlying the total return swap with Morgan Stanley & Co. International PLC, as of period end, termination dates 5/11/18-8/15/19:
| | | | | | | | |
| Reference Entity — Long | | | | | | |
| Common Stocks | | Shares | | | Value | |
Health Care Equipment & Supplies | | | | | | | | |
C R Bard, Inc. | | | 46,826 | | | $ | 15,007,733 | |
IT Services | | | | | | | | |
Worldpay Group PLC | | | 314,108 | | | | 1,714,439 | |
Media | | | | | | | | |
Time Warner, Inc. | | | 29,146 | | | | 2,986,008 | |
Oil, Gas & Consumable Fuels | | | | | | | | |
Veresen, Inc. | | | 410,153 | | | | 6,149,978 | |
Total Reference Entity — Long | | | | | | | 25,858,158 | |
| | | | | | | | |
Reference Entity — Short | | | | | | | | |
| Common Stocks | | | | | | |
Diversified Telecommunication Services | | | | | | | | |
AT&T Inc. | | | (15,156 | ) | | $ | (593,660 | ) |
Health Care Equipment & Supplies | | | | | | | | |
Becton Dickinson And Co. | | | (23,773 | ) | | | (4,658,319 | ) |
IT Services | | | | | | | | |
Vantiv, Inc., Class A | | | (21,108 | ) | | | (1,487,481 | ) |
See Notes to Financial Statements.
| | | | | | |
| 12 | | BLACKROCK EVENT DRIVEN EQUITY FUND | | SEPTEMBER 30, 2017 | | |
| | | | |
| Schedule of Investments (continued) | | | | |
| | | | |
| | | | | | | | |
| Common Stocks | | Shares | | | Value | |
Oil, Gas & Consumable Fuels | | | | | | | | |
Pembina Pipeline Corp. | | | (115,212 | ) | | $ | (4,042,462 | ) |
Total Reference Entity — Short | | | | | | | (10,781,922 | ) |
Net Value of Reference Entity — Morgan Stanley & Co. International PLC | | | | | | $ | 15,076,236 | |
The following table represents the individual long and short positions and related values of equity securities underlying the total return swap with Morgan Stanley & Co. International PLC, as of period end, termination dates 6/01/18-7/11/18:
| | | | | | | | |
Reference Entity — Long | | | | | | | | |
Common Stocks | | | Shares | | | | Value | |
Chemicals | | | | | | | | |
DowDuPont, Inc. | | | 9,150 | | | $ | 633,455 | |
Health Care Providers & Services | | | | | | | | |
Humana, Inc. | | | 1,493 | | | | 363,740 | |
Total Reference Entity — Long | | | | | | | 997,195 | |
| | | | | | | | |
| Reference Entity — Short | | | | | | |
Common Stocks | | | | | | | | |
Banks | | | | | | | | |
Citigroup, Inc. | | | (496 | ) | | $ | (36,079 | ) |
Chemicals | | | | | | | | |
Air Products & Chemicals, Inc. | | | (211 | ) | | | (31,907 | ) |
Albemarle Corp. | | | (275 | ) | | | (37,485 | ) |
Eastman Chemical Co. | | | (365 | ) | | | (33,029 | ) |
Ecolab, Inc. | | | (232 | ) | | | (29,838 | ) |
FMC Corp. | | | (392 | ) | | | (35,010 | ) |
International Flavors & Fragrances, Inc. | | | (223 | ) | | | (31,869 | ) |
LyondellBasell Industries NV, Class A | | | (355 | ) | | | (35,163 | ) |
Mosaic Co. | | | (1,389 | ) | | | (29,989 | ) |
PPG Industries, Inc. | | | (281 | ) | | | (30,533 | ) |
Praxair, Inc. | | | (230 | ) | | | (32,140 | ) |
Westlake Chemical Corp. | | | (143 | ) | | | (11,882 | ) |
| | | | | | | | |
| | | | | | | | (338,845 | ) |
| | | | | | | | |
| Common Stocks | | Shares | | | Value | |
Construction Materials | | | | | | | | |
Martin Marietta Materials, Inc. | | | (141 | ) | | $ | (29,078 | ) |
Vulcan Materials Co. | | | (246 | ) | | | (29,422 | ) |
| | | | | | | | |
| | | | | | | | (58,500 | ) |
Containers & Packaging | | | | | | | | |
Avery Dennison Corp. | | | (339 | ) | | | (33,337 | ) |
Ball Corp. | | | (735 | ) | | | (30,355 | ) |
International Paper Co. | | | (551 | ) | | | (31,308 | ) |
Sealed Air Corp. | | | (685 | ) | | | (29,263 | ) |
Westrock Co. | | | (541 | ) | | | (30,691 | ) |
| | | | | | | | |
| | | | | | | | (154,954 | ) |
Metals & Mining | | | | | | | | |
Freeport-McMoRan, Inc. | | | (2,452 | ) | | | (34,426 | ) |
Newmont Mining Corp. | | | (901 | ) | | | (33,797 | ) |
Nucor Corp. | | | (543 | ) | | | (30,430 | ) |
| | | | | | | | |
| | | | | | | | (98,653 | ) |
Total Common Stocks | | | | | | | (687,031 | ) |
Investment Companies | | | | | | | | |
Materials Select Sector SPDR Fund | | | (516 | ) | | | (29,309 | ) |
Total Investment Companies | | | | | | | (29,309 | ) |
Total Reference Entity — Short | | | | | | | (716,340 | ) |
Net Value of Reference Entity — Morgan Stanley & Co. International PLC | | | | | | $ | 280,855 | |
| | | | | | | | |
Balances reported in the Statement of Assets and Liabilities for Centrally Cleared Swaps and OTC Derivatives |
| | | | | | | | | | | | | | | | | | | | | | | | | | | | | | | | | | | |
| Affiliate | | Swap Premiums
Paid | | | | Swap Premiums
Received | | | | Unrealized
Appreciation | | | | Unrealized
Depreciation |
Centrally Cleared Swaps1 | | | | — | | | | | | | | | | $(81,475) | | | | | | | | | | — | | | | | | | | | | $ (4,392) | |
OTC Derivatives | | | | — | | | | | | | | | | — | | | | | | | | | | $2,647,612 | | | | | | | | | | $(111,484) | |
| | 1 | | Includes cumulative appreciation (depreciation) on centrally cleared swaps, as reported in the Schedule of Investments. Only current day’s variation margin is reported within the Statement of Assets and Liabilities and is net of any previously paid (received) swap premium amounts. |
See Notes to Financial Statements.
| | | | | | |
| | | BLACKROCK EVENT DRIVEN EQUITY FUND | | SEPTEMBER 30, 2017 | | 13 |
| | | | |
| Schedule of Investments (continued) | | | | |
| | | | | | | | | | | | | | | | | | | | | | | | | | | | |
| Derivative Financial Instruments Categorized by Risk Exposure |
|
| As of period end, the fair values of derivative financial instruments located in the Statement of Assets and Liabilities were as follows: |
| | | | | Commodity
Contracts | | | Credit
Contracts | | | Equity
Contracts | | | Foreign
Currency
Exchange
Contracts | | | Interest
Rate
Contracts | | | Other
Contacts | | | Total |
Assets - Derivative Financial Instruments | | | | | | | | | | | | | | | | | | | | | | | | | | |
Swaps - OTC | | Unrealized appreciation on OTC swaps | | | — | | | | — | | | $ | 2,647,612 | | | | — | | | | — | | | | — | | | $2,647,612 |
| | | | | | | | | | | | | | | | | | | | | | | | | | | | |
Liabilities - Derivative Financial Instruments | | | | | | | | | | | | | | | | | | | | | | | | | | |
Swaps - OTC | | Unrealized depreciation on OTC swaps | | | — | | | | — | | | $ | 111,484 | | | | — | | | | — | | | | — | | | $ 111,484 |
Swaps - centrally cleared | | Net unrealized depreciation1 | | | — | | | $ | 4,392 | | | | — | | | | — | | | | — | | | | — | | | 4,392 |
| | | | | |
Total | | | | | — | | | $ | 4,392 | | | $ | 111,484 | | | | — | | | | — | | | | — | | | $ 115,876 |
| | | | | |
| | 1 | | Includes cumulative appreciation (depreciation) on centrally cleared swaps, if any, as reported in the Schedule of Investments. Only current day’s variation margin is reported within the Statement of Assets and Liabilities. |
For the year ended September 30, 2017, the effect of derivative financial instruments in the Statement of Operations was as follows:
| | | | | | | | | | | | | | | | | | | | | | | | | | |
| | | Commodity
Contracts | | | Credit
Contracts | | | Equity
Contracts | | | Foreign Currency
Exchange Contracts | | | Interest Rate
Contracts | | | Other
Contacts | | | Total |
Net Realized Gain (Loss) from: | | | | | | | | | | | | | | | | | | | | | | | | | | |
Options purchased1 | | | — | | | | — | | | $ | (11,007 | ) | | | — | | | | — | | | | — | | | $ (11,007) |
Options written | | | — | | | | — | | | | 105,901 | | | | — | | | | — | | | | — | | | 105,901 |
Swaps | | | — | | | $ | (77,891 | ) | | | 9,627,046 | | | | — | | | | — | | | | — | | | 9,549,155 |
| | | |
Total | | | — | | | $ | (77,891 | ) | | $ | 9,721,940 | | | | — | | | | — | | | | — | | | $9,644,049 |
| | | |
1 Options purchased are included in net realized gain (loss) from investments. |
Net Change in Unrealized Appreciation
(Depreciation) on: | | | | | | | | | | | | | | | | | | | | | | | | | | |
Swaps | | | — | | | $ | 1,389 | | | $ | 1,477,926 | | | | — | | | | — | | | | — | | | $1,479,315 |
| | | |
Total | | | — | | | $ | 1,389 | | | $ | 1,477,926 | | | | — | | | | — | | | | — | | | $1,479,315 |
| | | |
| | 1 | | Options purchased are included in net realized gain (loss) from investments. |
| | | | |
| Average Quarterly Balances of Outstanding Derivative Financial Instruments | |
Options: | | | | |
Average value of option contracts purchased | | $ | 1,006 | |
Average value of option contracts written | | $ | 29,011 | |
Credit default swaps: | | | | |
Average notional value - buy protection | | $ | 1,100,000 | |
Total return swaps: | | | | |
Average notional value | | $ | 124,585,052 | |
For more information about the Fund’s investment risks regarding derivative financial instruments, refer to the Notes to Financial Statements.
|
| Derivative Financial Instruments - Offsetting as of Period End |
The Fund’s derivative assets and liabilities (by type) were as follows:
| | | | | | |
| | | Assets | | | Liabilities |
| Derivative Financial Instruments: | | | | | |
Swaps - Centrally cleared | | $ | 1,805 | | | — |
Swaps - OTC1 | | | 2,647,612 | | | $111,484 |
| | | |
Total derivative assets and liabilities in the Statement of Assets and Liabilities | | $ | 2,649,417 | | | $111,484 |
Derivatives not subject to a Master Netting Agreement or similar agreement (“MNA”) | | | (1,805 | ) | | — |
| | | |
Total derivative assets and liabilities subject to an MNA | | $ | 2,647,612 | | | $111,484 |
| | | |
| | 1 | | Includes unrealized appreciation (depreciation) on OTC swaps in the Statement of Assets and Liabilities. |
See Notes to Financial Statements.
| | | | | | |
| 14 | | BLACKROCK EVENT DRIVEN EQUITY FUND | | SEPTEMBER 30, 2017 | | |
| | | | |
| Schedule of Investments (concluded) | | | | |
The following table presents the Fund’s derivative assets and liabilities by counterparty net of amounts available for offset under an MNA and net of the related collateral received by the Fund:
| | | | | | | | | | | | | | | | | | |
| Counterparty | | Derivative Assets
Subject to an MNA by
Counterparty | | | Derivatives Available
for Offset1 | | | Non-cash
Collateral
Received | | Cash
Collateral
Received | | | Net Amount of
Derivative Assets2 | |
Citibank N.A. | | | $ 946,119 | | | | $(111,375) | | | — | | $ | (710,000 | ) | | $ | 124,744 | |
Credit Suisse International | | | 193,023 | | | | — | | | — | | | (193,023 | ) | | | — | |
Goldman Sachs Bank USA | | | 625,843 | | | | (109) | | | — | | | (590,000 | ) | | | 35,734 | |
Morgan Stanley & Co. International PLC | | | 882,627 | | | | — | | | — | | | (882,627 | ) | | | — | |
| | | | |
Total | | | $2,647,612 | | | | $(111,484) | | | — | | $ | (2,375,650 | ) | | | $160,478 | |
| | | | |
| | | | | | | | | | | | | | | | | | |
| Counterparty | | Derivative Liabilities
Subject to an MNA by
Counterparty | | | Derivatives Available
for Offset1 | | | Non-cash
Collateral
Pledged | | Cash
Collateral
Pledged | | | Net Amount of
Derivative Liabilities | |
Citibank N.A. | | | $111,375 | | | | $(111,375) | | | — | | | — | | | | — | |
Goldman Sachs Bank USA | | | 109 | | | | (109) | | | — | | | — | | | | — | |
| | | | |
Total | | | $111,484 | | | | $(111,484) | | | — | | | — | | | | — | |
| | | | |
| | 1 | | The amount of derivatives available for offset is limited to the amount of derivative assets and/or liabilities that are subject to an MNA. |
| | 2 | | Net amount represents the net amount receivable from the counterparty in the event of default. |
|
| Fair Value Hierarchy as of Period End |
Various inputs are used in determining the fair value of investments and derivative financial instruments. For information about the Fund’s policy regarding valuation of investments and derivative financial instruments, refer to the Notes to Financial Statements.
The following tables summarize the Fund’s investments and derivative financial instruments categorized in the disclosure hierarchy:
| | | | | | | | | | | | | | | | |
| | | Level 1 | | | Level 2 | | | Level 3 | | | Total | |
Assets: | | | | | | | | | | | | | | | | |
Investments: | | | | | | | | | | | | | | | | |
Long-Term Investments: | | | | | | | | | | | | | | | | |
Common Stocks1 | | $ | 5,986,738 | | | $ | 328,833 | | | | — | | | $ | 6,315,571 | |
Corporate Bonds1 | | | — | | | | 20,094,190 | | | | — | | | | 20,094,190 | |
Floating Rate Loan Interests1 | | | — | | | | 8,674,954 | | | | — | | | | 8,674,954 | |
Investment Companies | | | 3,609,153 | | | | — | | | | — | | | | 3,609,153 | |
Short-Term Securities: | | | | | | | | | | | | | | | | |
Borrowed Bond Agreements | | | — | | | | 2,005,451 | | | | — | | | | 2,005,451 | |
Money Market Funds | | | 147,158,282 | | | | — | | | | — | | | | 147,158,282 | |
Time Deposits | | | — | | | | 24,132 | | | | — | | | | 24,132 | |
Liabilities: | | | | | | | | | | | | | | | | |
Borrowed Bonds | | | — | | | | (1,999,868 | ) | | | — | | | | (1,999,868 | ) |
| | | | |
Total | | $ | 156,754,173 | | | $ | 29,127,692 | | | | — | | | $ | 185,881,865 | |
| | | | |
| | | | | | | | | | | | | | | | | |
Derivative Financial Instruments2 | | | | | | | | | | | | | | | | |
Assets: | | | | | | | | | | | | | | | | |
Equity contracts | | | — | | | $ | 2,647,612 | | | | — | | | $ | 2,647,612 | |
Liabilities: | | | | | | | | | | | | | | | | |
Credit contracts | | | — | | | | (4,392 | ) | | | — | | | | (4,392 | ) |
Equity contracts | | | — | | | | (111,484 | ) | | | — | | | | (111,484 | ) |
| | | | |
Total | | | — | | | $ | 2,531,736 | | | | — | | | $ | 2,531,736 | |
| | | | |
| | 1 | | See above Schedule of Investments for values in each industry. |
| | 2 | | Derivative financial instruments are swaps and options written. Swaps are valued at the unrealized appreciation (depreciation) on the instrument and options written are shown at value. |
During the year ended September 30, 2017, there were no transfers between levels.
See Notes to Financial Statements.
| | | | | | |
| | | BLACKROCK EVENT DRIVEN EQUITY FUND | | SEPTEMBER 30, 2017 | | 15 |
| | | | |
| Statement of Assets and Liabilities | | | | |
| | | | |
| September 30, 2017 | | | |
| | | | |
| Assets | |
Investments at value — unaffiliated (cost — $40,217,754) | | $ | 40,723,451 | |
Investments at value — affiliated (cost — $147,158,282) | | | 147,158,282 | |
Cash pledged for centrally cleared swaps | | | 41,000 | |
Foreign currency at value (cost — $1,658) | | | 1,711 | |
Receivables: | | | | |
Investments sold | | | 941,592 | |
Swaps | | | 758,941 | |
Capital shares sold | | | 227,649 | |
Dividends — affiliated | | | 110,030 | |
Dividends — unaffiliated | | | 4,487 | |
Interest — unaffiliated | | | 339,947 | |
Variation margin on centrally cleared swaps | | | 1,805 | |
From the Manager | | | 43,580 | |
Unrealized appreciation on OTC swaps | | | 2,647,612 | |
Prepaid expenses | | | 12,410 | |
| | | | |
Total assets | | | 193,012,497 | |
| | | | |
| | | | |
| Liabilities | | | | |
Cash received: | | | | |
Collateral — borrowed bond agreements | | | 21,000 | |
Collateral — OTC derivatives | | | 2,810,000 | |
Borrowed bonds at value (proceeds — $2,004,979) | | | 1,999,868 | |
Payables: | | | | |
Swaps | | | 467,863 | |
Investments purchased | | | 1,017,828 | |
Capital shares redeemed | | | 2,531,446 | |
Interest expense — unaffiliated | | | 11,839 | |
Investment advisory fees | | | 162,151 | |
Officer’s and Directors’ fees | | | 2,310 | |
Other accrued expenses | | | 114,164 | |
Other affiliates | | | 740 | |
Service and distribution fees | | | 11,705 | |
Unrealized depreciation on OTC swaps | | | 111,484 | |
| | | | |
Total liabilities | | | 9,262,398 | |
| | | | |
Net Assets | | $ | 183,750,099 | |
| | | | |
| | | | |
| Net Assets Consist of | | | | |
Paid-in capital | | $ | 171,598,091 | |
Undistributed net realized gain | | | 9,102,517 | |
Net unrealized appreciation (depreciation) | | | 3,049,491 | |
| | | | |
Net Assets | | $ | 183,750,099 | |
| | | | |
| | | | |
| Net Asset Value | | | | |
Institutional — Based on net assets of $145,557,316 and 15,194,857 shares outstanding, 400,000,000 shares authorized, $0.10 par value | | $ | 9.58 | |
| | | | |
Investor A — Based on net assets of $31,506,373 and 3,416,064 shares outstanding, 300,000,000 shares authorized, $0.10 par value | | $ | 9.22 | |
| | | | |
Investor C — Based on net assets of $6,686,410 and 798,673 shares outstanding, 400,000,000 shares authorized, $0.10 par value | | $ | 8.37 | |
| | | | |
See Notes to Financial Statements.
| | | | | | |
| 16 | | BLACKROCK EVENT DRIVEN EQUITY FUND | | SEPTEMBER 30, 2017 | | |
| | | | |
| Year Ended September 30, 2017 | | | |
| | | | |
| Investment Income | |
Interest — unaffiliated | | $ | 604,006 | |
Dividends — affiliated | | | 670,364 | |
Dividends — unaffiliated | | | 57,207 | |
Foreign taxes withheld | | | (70 | ) |
| | | | |
Total investment income | | | 1,331,507 | |
| | | | |
| | | | |
| Expenses | | | | |
Investment advisory | | | 1,568,352 | |
Service and distribution — class specific | | | 138,357 | |
Professional | | | 135,590 | |
Transfer agent — class specific | | | 129,945 | |
Registration | | | 60,499 | |
Printing | | | 45,317 | |
Accounting services | | | 31,940 | |
Officer and Directors | | | 10,892 | |
Custodian | | | 9,807 | |
Miscellaneous | | | 15,744 | |
| | | | |
Total expenses excluding interest expense | | | 2,146,443 | |
Interest expense — unaffiliated | | | 41,331 | |
| | | | |
Total expenses | | | 2,187,774 | |
| | | | |
Less: | | | | |
Fees waived by the Manager | | | (95,378 | ) |
Transfer agent fees waived and/or reimbursed — class specific | | | (102,603 | ) |
| | | | |
Total expenses after fees waived and/or reimbursed | | | 1,989,793 | |
| | | | |
Net investment loss | | | (658,286 | ) |
| | | | |
| | | | |
| Realized and Unrealized Gain (Loss) | | | | |
Net realized gain (loss) from: | | | | |
Investments — unaffiliated | | | 897,090 | |
Borrowed bonds | | | (440 | ) |
Capital gain distributions received from affiliated investment companies | | | 498 | |
Foreign currency transactions | | | (48,806 | ) |
Options written | | | 105,901 | |
Swaps | | | 9,549,155 | |
| | | | |
| | | 10,503,398 | |
| | | | |
Net change in unrealized appreciation (depreciation) on: | | | | |
Investments — unaffiliated | | | 310,629 | |
Borrowed bonds | | | 40,821 | |
Foreign currency translations | | | 10,198 | |
Swaps | | | 1,479,315 | |
| | | | |
| | | 1,840,963 | |
| | | | |
Total realized and unrealized gain | | | 12,344,361 | |
| | | | |
Net Increase in Net Assets Resulting from Operations | | $ | 11,686,075 | |
| | | | |
See Notes to Financial Statements.
| | | | | | |
| | | BLACKROCK EVENT DRIVEN EQUITY FUND | | SEPTEMBER 30, 2017 | | 17 |
| | | | |
| Statements of Changes in Net Assets | | | | |
| | | | | | | | |
| | | Year Ended
September 30, | |
| Increase (Decrease) in Net Assets: | | 2017 | | | 2016 | |
| | | | | | | | |
| Operations | | | | | | | | |
Net investment loss | | $ | (658,286 | ) | | $ | (626,079 | ) |
Net realized gain | | | 10,503,398 | | | | 1,481,343 | |
Net change in unrealized appreciation (depreciation) | | | 1,840,963 | | | | 1,974,861 | |
| | | | |
Net increase in net assets resulting from operations | | | 11,686,075 | | | | 2,830,125 | |
| | | | |
| | | | | | | | |
| Distributions to Shareholders1 | | | | | | | | |
From net realized gain: | | | | | | | | |
Institutional | | | (895,189 | ) | | | (485,623 | ) |
Investor A | | | (245,734 | ) | | | (672,433 | ) |
Investor C | | | — | | | | (427,844 | ) |
| | | | |
Decrease in net assets resulting from distributions to shareholders | | | (1,140,923 | ) | | | (1,585,900 | ) |
| | | | |
| | | | | | | | |
| Capital Share Transactions | | | | | �� | | | |
Net capital share transactions | | | 64,523,033 | | | | 82,940,951 | |
Capital contributions — affiliated2 | | | — | | | | 112,578 | |
| | | | |
Net increase in net assets derived from capital share transactions including capital contributions | | | 64,523,033 | | | | 83,053,529 | |
| | | | |
| | | | | | | | |
| Net Assets | | | | | | | | |
Total increase in net assets | | | 75,068,185 | | | | 84,297,754 | |
Beginning of year | | | 108,681,914 | | | | 24,384,160 | |
| | | | |
End of year | | $ | 183,750,099 | | | $ | 108,681,914 | |
| | | | |
| | 1 | | Distributions for annual periods determined in accordance with U.S. federal income tax regulations. |
| | 2 | | See Note 11 of the Notes to Financial Statements. |
See Notes to Financial Statements.
| | | | | | |
| 18 | | BLACKROCK EVENT DRIVEN EQUITY FUND | | SEPTEMBER 30, 2017 | | |
| | | | | | | | | | | | | | | | | | | | |
| | | Institutional | |
| | | Year Ended September 30, | |
| | | 2017 | | | 2016 | | | 2015 | | | 2014 | | | 2013 | |
| | | | | | | | | | | | | | | | | | | | |
| Per Share Operating Performance | | | | | | | | | | | | | | | | | | | | |
Net asset value, beginning of year | | $ | 8.80 | | | $ | 8.94 | | | $ | 14.55 | | | $ | 12.48 | | | $ | 10.58 | |
| | | | |
Net investment income (loss)1 | | | (0.04 | ) | | | (0.06 | ) | | | (0.04 | ) | | | (0.01 | ) | | | 0.01 | |
Net realized and unrealized gain | | | 0.92 | | | | 0.46 | | | | 0.60 | | | | 2.08 | | | | 1.90 | |
| | | | |
Net increase from investment operations | | | 0.88 | | | | 0.40 | | | | 0.56 | | | | 2.07 | | | | 1.91 | |
| | | | |
Distributions:2 | | | | | | | | | | | | | | | | | | | | |
From net investment income | | | — | | | | — | | | | — | | | | — | | | | (0.01 | ) |
From net realized gain | | | (0.10 | ) | | | (0.58 | ) | | | (6.17 | ) | | | — | | | | — | |
| | | | |
Total distributions | | | (0.10 | ) | | | (0.58 | ) | | | (6.17 | ) | | | — | | | | (0.01 | ) |
| | | | |
Capital contributions — affiliated3 | | | — | | | | 0.04 | | | | — | | | | — | | | | — | |
| | | | |
Net asset value, end of year | | $ | 9.58 | | | $ | 8.80 | | | $ | 8.94 | | | $ | 14.55 | | | $ | 12.48 | |
| | | | |
| | | | | | | | | | | | | | | | | | | | |
| Total Return4 | | | | | | | | | | | | | | | | | | | | |
Based on net asset value | | | 10.08 | % | | | 5.11 | %5 | | | 2.28 | % | | | 16.59 | % | | | 18.03 | % |
| | | | |
| | | | | | | | | | | | | | | | | | | | |
| Ratios to Average Net Assets6 | | | | | | | | | | | | | | | | | | | | |
Total expenses | | | 1.55 | % | | | 1.58 | % | | | 2.54 | % | | | 2.35 | % | | | 2.41 | % |
| | | | |
Total expenses after fees waived and/or reimbursed | | | 1.41 | % | | | 1.42 | % | | | 1.89 | % | | | 2.08 | % | | | 2.12 | % |
| | | | |
Total expenses after fees waived and/or reimbursed and excluding dividend expense | | | 1.41 | % | | | 1.42 | % | | | 1.65 | % | | | 1.66 | % | | | 1.72 | % |
| | | | |
Total expenses after fees waived and/or reimbursed and excluding dividend expense, stock loan fees and interest expense | | | 1.38 | % | | | 1.38 | % | | | 1.38 | % | | | 1.38 | % | | | 1.41 | % |
| | | | |
Net investment income (loss) | | | (0.39 | )% | | | (0.67 | )% | | | (0.26 | )% | | | (0.05 | )% | | | 0.07 | % |
| | | | |
| | | | | | | | | | | | | | | | | | | | |
| Supplemental Data | | | | | | | | | | | | | | | | | | | | |
Net assets, end of year (000) | | $ | 145,557 | | | $ | 76,046 | | | $ | 8,077 | | | $ | 15,497 | | | $ | 15,373 | |
| | | | |
Portfolio turnover rate | | | 199 | %7 | | | 233 | %7 | | | 81 | %7 | | | 44 | % | | | 65 | % |
| | | | |
| | 1 | | Based on average shares outstanding. |
| | 2 | | Distributions for annual periods determined in accordance with U.S. federal income tax regulations. |
| | 3 | | Payment received from affiliates related to certain shareholder transactions. |
| | 4 | | Where applicable, assumes the reinvestment of distributions. |
| | 5 | | Includes payment received from affiliates, which impacted the Fund’s total return. Excluding the payment from affiliates, the Fund’s total return is 4.64%. |
| | 6 | | Excludes expenses incurred indirectly as a result of investments in underlying funds as follows: |
| | | | | | | | | | | | | | | | | | | | |
| | | Year Ended September 30, | |
| | | 2017 | | | 2016 | | | 2015 | | | 2014 | | | 2013 | |
Investments in underlying funds | | | 0.15 | % | | | 0.16 | % | | | 0.04 | % | | | — | | | | — | |
| | 7 | | Excludes underlying investments in total return swaps. |
See Notes to Financial Statements.
| | | | | | |
| | | BLACKROCK EVENT DRIVEN EQUITY FUND | | SEPTEMBER 30, 2017 | | 19 |
| | | | |
| Financial Highlights (continued) | | | | |
| | | | | | | | | | | | | | | | | | | | |
| | | Investor A | |
| | | Year Ended September 30, | |
| | | 2017 | | | 2016 | | | 2015 | | | 2014 | | | 2013 | |
| | | | | | | | | | | | | | | | | | | | |
| Per Share Operating Performance | | | | | | | | | | | �� | | | | | | | | | |
Net asset value, beginning of year | | $ | 8.48 | | | $ | 8.65 | | | $ | 14.31 | | | $ | 12.30 | | | $ | 10.46 | |
| | | | |
Net investment loss1 | | | (0.06 | ) | | | (0.07 | ) | | | (0.07 | ) | | | (0.04 | ) | | | (0.03 | ) |
Net realized and unrealized gain | | | 0.88 | | | | 0.44 | | | | 0.58 | | | | 2.05 | | | | 1.87 | |
| | | | |
Net increase from investment operations | | | 0.82 | | | | 0.37 | | | | 0.51 | | | | 2.01 | | | | 1.84 | |
| | | | |
Distributions from net realized gain2 | | | (0.08 | ) | | | (0.58 | ) | | | (6.17 | ) | | | — | | | | — | |
| | | | |
Capital contributions — affiliated3 | | | — | | | | 0.04 | | | | — | | | | — | | | | — | |
| | | | |
Net asset value, end of year | | $ | 9.22 | | | $ | 8.48 | | | $ | 8.65 | | | $ | 14.31 | | | $ | 12.30 | |
| | | | |
| | | | | | | | | | | | | | | | | | | | |
| Total Return4 | | | | | | | | | | | | | | | | | | | | |
Based on net asset value | | | 9.71 | % | | | 4.92 | %5 | | | 1.91 | % | | | 16.34 | % | | | 17.59 | % |
| | | | |
| | | | | | | | | | | | | | | | | | | | |
| Ratios to Average Net Assets6 | | | | | | | | | | | | | | | | | | | | |
Total expenses | | | 1.86 | % | | | 1.92 | % | | | 2.85 | % | | | 2.64 | % | | | 2.65 | % |
| | | | |
Total expenses after fees waived and/or reimbursed | | | 1.68 | % | | | 1.70 | % | | | 2.12 | % | | | 2.35 | % | | | 2.42 | % |
| | | | |
Total expenses after fees waived and/or reimbursed and excluding dividend expense | | | 1.68 | % | | | 1.70 | % | | | 1.90 | % | | | 1.93 | % | | | 2.02 | % |
| | | | |
Total expenses after fees waived and/or reimbursed and excluding dividend expense, stock loan fees and interest expense | | | 1.65 | % | | | 1.65 | % | | | 1.65 | % | | | 1.65 | % | | | 1.71 | % |
| | | | |
Net investment loss | | | (0.69 | )% | | | (0.88 | )% | | | (0.55 | )% | | | (0.32 | )% | | | (0.24 | )% |
| | | | |
| | | | | | | | | | | | | | | | | | | | |
| Supplemental Data | | | | | | | | | | | | | | | | | | | | |
Net assets, end of year (000) | | $ | 31,506 | | | $ | 26,523 | | | $ | 10,143 | | | $ | 12,238 | | | $ | 17,792 | |
| | | | |
Portfolio turnover rate | | | 199 | %7 | | | 233 | %7 | | | 81 | %7 | | | 44 | % | | | 65 | % |
| | | | |
| | 1 | | Based on average shares outstanding. |
| | 2 | | Distributions for annual periods determined in accordance with U.S. federal income tax regulations. |
| | 3 | | Payment received from affiliates related to certain shareholder transactions. |
| | 4 | | Where applicable, excludes the effects of any sales charges and assumes the reinvestment of distributions. |
| | 5 | | Includes payment received from affiliates, which impacted the Fund’s total return. Excluding the payment from affiliates, the Fund’s total return is 4.43%. |
| | 6 | | Excludes expenses incurred indirectly as a result of investments in underlying funds as follows: |
| | | | | | | | | | | | | | | | | | | | |
| | | Year Ended September 30, | |
| | | 2017 | | | 2016 | | | 2015 | | | 2014 | | | 2013 | |
Investments in underlying funds | | | 0.15 | % | | | 0.16 | % | | | 0.04 | % | | | — | | | | — | |
| | 7 | | Excludes underlying investments in total return swaps. |
See Notes to Financial Statements.
| | | | | | |
| 20 | | BLACKROCK EVENT DRIVEN EQUITY FUND | | SEPTEMBER 30, 2017 | | |
| | | | |
| Financial Highlights (concluded) | | | | |
| | | | | | | | | | | | | | | | | | | | |
| | | Investor C | |
| | | Year Ended September 30, | |
| | | 2017 | | | 2016 | | | 2015 | | | 2014 | | | 2013 | |
| | | | | | | | | | | | | | | | | | | | |
| Per Share Operating Performance | | | | | | | | | | | | | | | | | | | | |
Net asset value, beginning of year | | $ | 7.69 | | | $ | 7.94 | | | $ | 13.70 | | | $ | 11.87 | | | $ | 10.16 | |
| | | | |
Net investment loss1 | | | (0.11 | ) | | | (0.12 | ) | | | (0.16 | ) | | | (0.14 | ) | | | (0.10 | ) |
Net realized and unrealized gain | | | 0.79 | | | | 0.41 | | | | 0.57 | | | | 1.97 | | | | 1.81 | |
| | | | |
Net increase from investment operations | | | 0.68 | | | | 0.29 | | | | 0.41 | | | | 1.83 | | | | 1.71 | |
| | | | |
Distributions from net realized gain2 | | | — | | | | (0.58 | ) | | | (6.17 | ) | | | — | | | | — | |
| | | | |
Capital contributions — affiliated3 | | | — | | | | 0.04 | | | | — | | | | — | | | | — | |
| | | | |
Net asset value, end of year | | $ | 8.37 | | | $ | 7.69 | | | $ | 7.94 | | | $ | 13.70 | | | $ | 11.87 | |
| | | | |
| | | | | | | | | | | | | | | | | | | | |
| Total Return4 | | | | | | | | | | | | | | | | | | | | |
Based on net asset value | | | 8.84 | % | | | 4.32 | %5 | | | 1.16 | % | | | 15.42 | % | | | 16.83 | % |
| | | | |
| | | | | | | | | | | | | | | | | | | | |
| Ratios to Average Net Assets6 | | | | | | | | | | | | | | | | | | | | |
Total expenses | | | 2.64 | % | | | 2.74 | % | | | 3.61 | % | | | 3.44 | % | | | 3.46 | % |
| | | | |
Total expenses after fees waived and/or reimbursed | | | 2.42 | % | | | 2.43 | % | | | 2.86 | % | | | 3.09 | % | | | 3.14 | % |
| | | | |
Total expenses after fees waived and/or reimbursed and excluding dividend expense | | | 2.42 | % | | | 2.43 | % | | | 2.64 | % | | | 2.67 | % | | | 2.74 | % |
| | | | |
Total expenses after fees waived and/or reimbursed and excluding dividend expense, stock loan fees and interest expense | | | 2.39 | % | | | 2.39 | % | | | 2.39 | % | | | 2.39 | % | | | 2.43 | % |
| | | | |
Net investment loss | | | (1.38 | )% | | | (1.57 | )% | | | (1.28 | )% | | | (1.06 | )% | | | (0.95 | )% |
| | | | |
| | | | | | | | | | | | | | | | | | | | |
| Supplemental Data | | | | | | | | | | | | | | | | | | | | |
Net assets, end of year (000) | | $ | 6,686 | | | $ | 6,112 | | | $ | 6,165 | | | $ | 7,636 | | | $ | 7,133 | |
| | | | |
Portfolio turnover rate | | | 199 | %7 | | | 233 | %7 | | | 81 | %7 | | | 44 | % | | | 65 | % |
| | | | |
| | 1 | | Based on average shares outstanding. |
| | 2 | | Distributions for annual periods determined in accordance with U.S. federal income tax regulations. |
| | 3 | | Payment received from affiliates related to certain shareholder transactions. |
| | 4 | | Where applicable, excludes the effects of any sales charges and assumes the reinvestment of distributions. |
| | 5 | | Includes payment received from affiliates, which impacted the Fund’s total return. Excluding the payment from affiliates, the Fund’s total return is 3.78%. |
| | 6 | | Excludes expenses incurred indirectly as a result of investments in underlying funds as follows: |
| | | | | | | | | | | | | | | | | | | | |
| | | Year Ended September 30, | |
| | | 2017 | | | 2016 | | | 2015 | | | 2014 | | | 2013 | |
Investments in underlying funds | | | 0.15 | % | | | 0.16 | % | | | 0.04 | % | | | — | | | | — | |
| | 7 | | Excludes underlying investments in total return swaps. |
See Notes to Financial Statements.
| | | | | | |
| | | BLACKROCK EVENT DRIVEN EQUITY FUND | | SEPTEMBER 30, 2017 | | 21 |
| | | | |
| Notes to Financial Statements | | | | |
1. Organization:
BlackRock Large Cap Series Funds, Inc. (the “Corporation”) is registered under the Investment Company Act of 1940, as amended (the “1940 Act”), The Corporation is registered as an open-end management investment company. The Corporation is organized as a Maryland corporation. BlackRock Event Driven Equity Fund (the “Fund”) is a series of the Corporation, although the Fund may invest in companies with any capitalization. The Fund is classified as diversified.
The Fund offers multiple classes of shares. All classes of shares have identical voting, dividend, liquidation and other rights and are subject to the same terms and conditions, except that certain classes bear expenses related to the shareholder servicing and distribution of such shares. Institutional Shares are sold only to certain eligible investors. Investor A and Investor C Shares are generally available through financial intermediaries. Each class has exclusive voting rights with respect to matters relating to its shareholder servicing and distribution expenditures.
| | | | | | | | | | |
| Share Class | | Initial Sales Charge | | | | CDSC | | | | Conversion
Privilege |
Institutional Shares | | No | | | | No | | | | None |
Investor A Shares | | Yes | | | | No1 | | | | None |
Investor C Shares | | No | | | | Yes | | | | None |
| | 1 | | Investor A Shares may be subject to a contingent deferred sales charge (“CDSC”) where no initial sales charge was paid at the time of purchase. |
The Fund, together with certain other registered investment companies advised by BlackRock Advisors, LLC (the “Manager”) or its affiliates, is included in a complex of open-end funds referred to as the Equity-Liquidity Complex.
2. Significant Accounting Policies:
The financial statements are prepared in conformity with accounting principles generally accepted in the United States of America (“U.S. GAAP”), which may require management to make estimates and assumptions that affect the reported amounts of assets and liabilities in the financial statements, disclosure of contingent assets and liabilities at the date of the financial statements and the reported amounts of increases and decreases in net assets from operations during the reporting period. Actual results could differ from those estimates. The Fund is considered an investment company under U.S. GAAP and follows the accounting and reporting guidance applicable to investment companies. Below is a summary of significant accounting policies:
Investment Transactions and Income Recognition: For financial reporting purposes, investment transactions are recorded on the dates the transactions are entered into (the “trade dates”). Realized gains and losses on investment transactions are determined on the identified cost basis. Dividend income is recorded on the ex-dividend date. Dividends from foreign securities where the ex-dividend date may have passed are subsequently recorded when the Fund is informed of the ex-dividend date. Under the applicable foreign tax laws, a withholding tax at various rates may be imposed on capital gains, dividends and interest. Upon notification from issuers, some of the dividend income received from a real estate investment trust may be redesignated as a reduction of cost of the related investment and/or realized gain. Interest income, including amortization and accretion of premiums and discounts on debt securities, and payment-in-kind interest are recognized on an accrual basis. Income, expenses and realized and unrealized gains and losses are allocated daily to each class based on its relative net assets.
Foreign Currency Translation: The Fund’s books and records are maintained in U.S. dollars. Securities and other assets and liabilities denominated in foreign currencies are translated into U.S. dollars using exchange rates determined as of the close of trading on the New York Stock Exchange (“NYSE”). Purchases and sales of investments are recorded at the rates of exchange prevailing on the respective dates of such transactions. Generally, when the U.S. dollar rises in value against a foreign currency, the investments denominated in that currency will lose value; the opposite effect occurs if the U.S. dollar falls in relative value.
The Fund does not isolate the portion of the results of operations arising as a result of changes in the exchange rates from the changes in the market prices of investments held or sold for financial reporting purposes. Accordingly, the effects of changes in exchange rates on investments are not segregated in the Statement of Operations from the effects of changes in market prices of those investments, but are included as a component of net realized and unrealized gain (loss) from investments. The Fund reports realized currency gains (losses) on foreign currency related transactions as components of net realized gain (loss) for financial reporting purposes, whereas such components are generally treated as ordinary income for U.S. federal income tax purposes.
Segregation and Collateralization: In cases where the Fund enters into certain investments (e.g., options written and swaps) that would be treated as “senior securities” for 1940 Act purposes, the Fund may segregate or designate on its books and records cash or liquid assets having a market value at least equal to the amount of its future obligations under such investments. Doing so allows the investment to be excluded from treatment as a “senior security.” Furthermore, if required by an exchange or counterparty agreement, the Fund may be required to deliver/deposit cash and/or securities to/with an exchange, or broker-dealer or custodian as collateral for certain investments or obligations.
| | | | | | |
| 22 | | BLACKROCK EVENT DRIVEN EQUITY FUND | | SEPTEMBER 30, 2017 | | |
| | | | |
| Notes to Financial Statements (continued) | | | | |
Distributions: Distributions paid by the Fund are recorded on the ex-dividend date. The character and timing of distributions are determined in accordance with U.S. federal income tax regulations, which may differ from U.S. GAAP.
Recent Accounting Standards: In November 2016, the Financial Accounting Standards Board issued Accounting Standards Update “Restricted Cash” which will require entities to include the total of cash, cash equivalents, restricted cash, and restricted cash equivalents in the beginning and ending cash balances in the Statement of Cash Flows. The guidance will be applied retrospectively and is effective for fiscal years beginning after December 15, 2017, and interim periods within those years. Management is evaluating the impact, if any, of this guidance on the Fund’s presentation in the Statement of Cash Flows.
In March 2017, the Financial Accounting Standards Board issued Accounting Standards Update “Premium Amortization of Purchased Callable Debt Securities” which amends the amortization period for certain purchased callable debt securities. Under the new guidance, the premium amortization of purchased callable debt securities that have explicit, non-contingent call features and are callable at fixed prices will be amortized to the earliest call date. The guidance will be applied on a modified retrospective basis and is effective for fiscal years, and their interim periods, beginning after December 15, 2018. Management is currently evaluating the impact of this guidance to the Fund.
Indemnifications: In the normal course of business, the Fund enters into contracts that contain a variety of representations that provide general indemnification. The Fund’s maximum exposure under these arrangements is unknown because it involves future potential claims against the Fund, which cannot be predicted with any certainty.
Other: Expenses directly related to the Fund or its classes are charged to the Fund or the applicable class. Other operating expenses shared by several funds, including other funds managed by the Manager, are prorated among those funds on the basis of relative net assets or other appropriate methods. Expenses directly related to the Fund and other shared expenses prorated to the Fund are allocated daily to each class based on its relative net assets or other appropriate methods.
The Fund has an arrangement with its custodian whereby credits are earned on uninvested cash balances, which could be used to reduce custody fees and/or overdraft charges. The Fund may incur charges on certain uninvested cash balances and overdrafts, subject to certain conditions.
3. Investment Valuation and Fair Value Measurements:
Investment Valuation Policies: The Fund’s investments are valued at fair value (also referred to as “market value” within the financial statements) as of the close of trading on NYSE (generally 4:00 p.m., Eastern time). U.S. GAAP defines fair value as the price the Fund would receive to sell an asset or pay to transfer a liability in an orderly transaction between market participants at the measurement date. The Fund determines the fair values of its financial instruments using various independent dealers or pricing services under policies approved by the Board of Directors of the Corporation (the “Board”). The BlackRock Global Valuation Methodologies Committee (the “Global Valuation Committee”) is the committee formed by management to develop global pricing policies and procedures and to oversee the pricing function for all financial instruments.
Fair Value Inputs and Methodologies: The following methods and inputs are used to establish the fair value of the Fund’s assets and liabilities:
| • | | Equity investments traded on a recognized securities exchange are valued at the official closing price each day, if available. For equity investments traded on more than one exchange, the official closing price on the exchange where the stock is primarily traded is used. Equity investments traded on a recognized exchange for which there were no sales on that day may be valued at the last available bid (long positions) or ask (short positions) price. |
| • | | Generally, trading in foreign instruments is substantially completed each day at various times prior to the close of trading on the NYSE. Occasionally, events affecting the values of such instruments may occur between the foreign market close and the close of trading on the NYSE that may not be reflected in the computation of the Fund’s net assets. Each business day, the Fund uses a pricing service to assist with the valuation of certain foreign exchange-traded equity securities and foreign exchange-traded and over-the-counter (“OTC”) options (the “Systematic Fair Value Price”). Using current market factors, the Systematic Fair Value Price is designed to value such foreign securities and foreign options at fair value as of the close of trading on the NYSE, which follows the close of the local markets. |
| • | | Fixed-income securities for which market quotations are readily available are generally valued using the last available bid prices or current market quotations provided by independent dealers or third party pricing services. Floating rate loan interests are valued at the mean of the bid prices from one or more independent brokers or dealers as obtained from a third party pricing service. Pricing services generally value fixed-income securities assuming orderly transactions of an institutional round lot size, but a fund may hold or transact in such securities in smaller, odd lot sizes. Odd lots often trade at lower prices than institutional round lots. The pricing services may use matrix pricing or valuation models that utilize certain inputs and assumptions to derive values, including transaction data (e.g., recent representative bids and offers), credit quality information, perceived market movements, news, and other relevant information. Certain fixed-income securities, including asset-backed and mortgage related securities may be valued based on valuation models that consider the estimated cash flows of each tranche of the entity, establish a benchmark yield and develop |
| | | | | | |
| | | BLACKROCK EVENT DRIVEN EQUITY FUND | | SEPTEMBER 30, 2017 | | 23 |
| | | | |
| Notes to Financial Statements (continued) | | | | |
| | an estimated tranche specific spread to the benchmark yield based on the unique attributes of the tranche. The amortized cost method of valuation may be used with respect to debt obligations with sixty days or less remaining to maturity unless the Manager determines such method does not represent fair value. |
| • | | Investments in open-end U.S. mutual funds are valued at net asset value (“NAV”) each business day. |
| • | | Exchange-traded options are valued at the mean between the last bid and ask prices at the close of the options market in which the options trade. An exchange-traded option for which there is no mean price is valued at the last bid (long positions) or ask (short positions) price. If no bid or ask price is available, the prior day’s price will be used, unless it is determined that the prior day’s price no longer reflects the fair value of the option. OTC options and options are valued by an independent pricing service using a mathematical model, which incorporates a number of market data factors, such as the trades and prices of the underlying instruments. |
| • | | Swap agreements are valued utilizing quotes received daily by the Fund’s pricing service or through brokers, which are derived using daily swap curves and models that incorporate a number of market data factors, such as discounted cash flows, trades and values of the underlying reference instruments. |
If events (e.g., a company announcement, market volatility or a natural disaster) occur that are expected to materially affect the value of such investments, or in the event that the application of these methods of valuation results in a price for an investment that is deemed not to be representative of the market value of such investment, or if a price is not available, the investment will be valued by the Global Valuation Committee, or its delegate, in accordance with a policy approved by the Board as reflecting fair value (“Fair Valued Investments”). The fair valuation approaches that may be used by the Global Valuation Committee include Market approach, Income approach and Cost approach. Valuation techniques such as discounted cash flow, use of market comparables and matrix pricing are types of valuation approaches and are typically used in determining fair value. When determining the price for Fair Valued Investments, the Global Valuation Committee, or its delegate, seeks to determine the price that the Fund might reasonably expect to receive or pay from the current sale or purchase of that asset or liability in an arm’s-length transaction. Fair value determinations shall be based upon all available factors that the Global Valuation Committee, or its delegate, deems relevant and consistent with the principles of fair value measurement. The pricing of all Fair Valued Investments is subsequently reported to the Board or a committee thereof on a quarterly basis.
Fair Value Hierarchy: Various inputs are used in determining the fair value of investments and derivative financial instruments. These inputs to valuation techniques are categorized into a fair value hierarchy consisting of three broad levels for financial statement purposes as follows:
| • | | Level 1 — Unadjusted price quotations in active markets/exchanges for identical assets or liabilities that the Fund has the ability to access |
| • | | Level 2 — Other observable inputs (including, but not limited to, quoted prices for similar assets or liabilities in markets that are active, quoted prices for identical or similar assets or liabilities in markets that are not active, inputs other than quoted prices that are observable for the assets or liabilities (such as interest rates, yield curves, volatilities, prepayment speeds, loss severities, credit risks and default rates) or other market–corroborated inputs) |
| • | | Level 3 — Unobservable inputs based on the best information available in the circumstances, to the extent observable inputs are not available (including the Fund’s own assumptions used in determining the fair value of investments and derivative financial instruments) |
The hierarchy gives the highest priority to unadjusted quoted prices in active markets for identical assets or liabilities (Level 1 measurements) and the lowest priority to unobservable inputs (Level 3 measurements). Accordingly, the degree of judgment exercised in determining fair value is greatest for instruments categorized in Level 3. The inputs used to measure fair value may fall into different levels of the fair value hierarchy. In such cases, for disclosure purposes, the fair value hierarchy classification is determined based on the lowest level input that is significant to the fair value measurement in its entirety. Investments classified within Level 3 have significant unobservable inputs used by the Global Valuation Committee in determining the price for Fair Valued Investments. Level 3 investments include equity or debt issued by privately-held companies or funds. There may not be a secondary market, and/or there are a limited number of investors. Level 3 investments may also be adjusted to reflect illiquidity and/or non-transferability, with the amount of such discount estimated by the Global Valuation Committee in the absence of market information.
Changes in valuation techniques may result in transfers into or out of an assigned level within the hierarchy. In accordance with the Fund’s policy, transfers between different levels of the fair value hierarchy are deemed to have occurred as of the beginning of the reporting period. The categorization of a value determined for investments and derivative financial instruments is based on the pricing transparency of the investments and derivative financial instruments and is not necessarily an indication of the risks associated with investing in those securities.
4. Securities and Other Investments:
Floating Rate Loan Interests: Floating rate loan interests are typically issued to companies (the “borrower”) by banks, other financial institutions, or privately and publicly offered corporations (the “lender”). Floating rate loan interests are generally non-investment grade, often involve borrowers whose
| | | | | | |
| 24 | | BLACKROCK EVENT DRIVEN EQUITY FUND | | SEPTEMBER 30, 2017 | | |
| | | | |
| Notes to Financial Statements (continued) | | | | |
financial condition is troubled or uncertain and companies that are highly leveraged or in bankruptcy proceedings. In addition, transactions in floating rate loan interests may settle on a delayed basis, which may result in proceeds from the sale not being readily available for a fund to make additional investments or meet its redemption obligations. Floating rate loan interests may include fully funded term loans or revolving lines of credit. Floating rate loan interests are typically senior in the corporate capital structure of the borrower. Floating rate loan interests generally pay interest at rates that are periodically determined by reference to a base lending rate plus a premium. Since the rates reset only periodically, changes in prevailing interest rates (and particularly sudden and significant changes) can be expected to cause some fluctuations in the NAV of a fund to the extent that it invests in floating rate loan interests. The base lending rates are generally the lending rate offered by one or more European banks, such as the London Interbank Offered Rate (“LIBOR”), the prime rate offered by one or more U.S. banks or the certificate of deposit rate. Floating rate loan interests may involve foreign borrowers, and investments may be denominated in foreign currencies. These investments are treated as investments in debt securities for purposes of a fund’s investment policies.
When a fund purchases a floating rate loan interest, it may receive a facility fee and when it sells a floating rate loan interest, it may pay a facility fee. On an ongoing basis, a fund may receive a commitment fee based on the undrawn portion of the underlying line of credit amount of a floating rate loan interest. Facility and commitment fees are typically amortized to income over the term of the loan or term of the commitment, respectively. Consent and amendment fees are recorded to income as earned. Prepayment penalty fees, which may be received by a fund upon the prepayment of a floating rate loan interest by a borrower, are recorded as realized gains. A fund may invest in multiple series or tranches of a loan. A different series or tranche may have varying terms and carry different associated risks.
Floating rate loan interests are usually freely callable at the borrower’s option. A fund may invest in such loans in the form of participations in loans (“Participations”) or assignments (“Assignments”) of all or a portion of loans from third parties. Participations typically will result in a fund having a contractual relationship only with the lender, not with the borrower. A fund has the right to receive payments of principal, interest and any fees to which it is entitled only from the lender selling the Participation and only upon receipt by the lender of the payments from the borrower. In connection with purchasing Participations, a fund generally will have no right to enforce compliance by the borrower with the terms of the loan agreement, nor any rights of offset against the borrower. A fund may not benefit directly from any collateral supporting the loan in which it has purchased the Participation. As a result, a fund assumes the credit risk of both the borrower and the lender that is selling the Participation. A fund’s investment in loan participation interests involves the risk of insolvency of the financial intermediaries who are parties to the transactions. In the event of the insolvency of the lender selling the Participation, a fund may be treated as a general creditor of the lender and may not benefit from any offset between the lender and the borrower. Assignments typically result in a fund having a direct contractual relationship with the borrower, and a fund may enforce compliance by the borrower with the terms of the loan agreement.
Borrowed Bond Agreements: Repurchase agreements may be referred to as borrowed bond agreements when entered into in connection with short sales of bonds. In a borrowed bond agreement, a fund borrows a bond from a counterparty in exchange for cash collateral. The agreement contains a commitment that the security and the cash will be returned to the counterparty and a fund at a mutually agreed upon date. Certain agreements have no stated maturity and can be terminated by either party at any time. Earnings on cash collateral and compensation to the lender of the bond are based on agreed upon rates between a fund and the counterparty. The value of the underlying cash collateral approximates the market value and accrued interest of the borrowed bond. To the extent that a borrowed bond transaction exceeds one business day, the value of the cash collateral in the possession of the counterparty is monitored on a daily basis to ensure the adequacy of the collateral. As the market value of the borrowed bond changes, the cash collateral is periodically increased or decreased with a frequency and in amounts prescribed in the borrowed bond agreement. A fund may also experience delays in gaining access to the collateral.
Borrowed bond agreements are entered into by a fund under Master Repurchase Agreements (each, an “MRA”), which permit a fund, under certain circumstances, including an event of default (such as bankruptcy or insolvency), to offset payables and/or receivables under the MRA with collateral held and/or posted to the counterparty and create one single net payment due to or from a fund. With borrowed bond agreements, typically a fund and counterparty under an MRA are permitted to sell, re-pledge, or use the collateral associated with the transaction. Bankruptcy or insolvency laws of a particular jurisdiction may impose restrictions on or prohibitions against such a right of offset in the event of the MRA counterparty’s bankruptcy or insolvency. Pursuant to the terms of the MRA, a fund receives or posts securities as collateral with a market value in excess of the repurchase price to be paid or received by a fund upon the maturity of the transaction. Upon a bankruptcy or insolvency of the MRA counterparty, a fund is considered an unsecured creditor with respect to excess collateral and, as such, the return of excess collateral may be delayed.
| | | | | | |
| | | BLACKROCK EVENT DRIVEN EQUITY FUND | | SEPTEMBER 30, 2017 | | 25 |
| | | | |
| Notes to Financial Statements (continued) | | | | |
As of period end, the following table is a summary of the Fund’s open borrowed bond agreements by counterparty which are subject to offset under an MRA on a net basis:
| | | | | | | | | | |
| Counterparty | | Borrowed
Bond
Agreements1 | | Borrowed Bonds
at Value
including
Accrued Interest2 | | Exposure
Due (to)/from
Counterparty
Before Collateral | | Cash
Collateral
Received | | Net Exposure
Due to
Counterparty3 |
Citigroup Global Markets, Inc. | | $2,005,451 | | $(2,011,707) | | $(6,256) | | — | | $(6,256) |
| | 1 | | Included in investments at value-unaffiliated in the Statement of Assets and Liabilities. |
| | 2 | | Includes accrued interest on borrowed bonds in the amount of $(11,839) which is included in interest expense payable in the Statement of Assets and Liabilities. |
| | 3 | | Net exposure represents the net receivable (payable) that would be due from/to the counterparty in the event of default. |
When a fund enters into MRA and International Swaps and Derivatives Association, Inc. (an “ISDA”) and/or Master Securities Lending Agreements (“MSLA”) with the same counterparty, the agreements may contain a set-off provision allowing a fund to offset a net amount payable with a net amount receivable upon default of the counterparty. Bankruptcy or insolvency laws of a particular jurisdiction may restrict or prohibit the right of offset in bankruptcy, insolvency or other events. For example, regardless of the contractual rights included in an MRA, such laws may prohibit a fund from setting off amounts owed to a defaulting counterparty under an MRA against amounts owed to a fund by affiliates of the defaulting counterparty. However, the insolvency regimes of many jurisdictions generally permit set-off of simultaneous payables and receivables with the same legal entity under certain types of financial contracts. These rules would apply upon a default of the legal entity, regardless of the existence of a contractual set-off right in those contracts.
In the event the counterparty of securities under an MRA files for bankruptcy or becomes insolvent, a fund’s use of the proceeds from the agreement may be restricted while the counterparty, or its trustee or receiver, determines whether or not to enforce a fund’s obligation to repurchase the securities.
Short Sale Transactions: In short sale transactions, a fund sells a security it does not hold in anticipation of a decline in the market price of that security. When a fund makes a short sale, it will borrow the security sold short (borrowed bond) and deliver the fixed-income security to the counterparty to which it sold the security short. An amount equal to the proceeds received by a fund is reflected as an asset and an equivalent liability. The amount of the liability is subsequently marked-to-market to reflect the market value of the short sale. A fund is required to repay the counterparty interest on the security sold short, which, if applicable, is shown as interest expense in the Statement of Operations. A fund is exposed to market risk based on the amount, if any, that the market value of the security increases beyond the market value at which the position was sold. Thus, a short sale of a security involves the risk that instead of declining, the price of the security sold short will rise. The short sale of securities involves the possibility of an unlimited loss since there is an unlimited potential for the market price of the security sold short to increase. A gain is limited to the price at which a fund sold the security short. A realized gain or loss is recognized upon the termination of a short sale if the market price is either less than or greater than the proceeds originally received. There is no assurance that a fund will be able to close out a short position at a particular time or at an acceptable price.
5. Derivative Financial Instruments:
The Fund engages in in various portfolio investment strategies using derivative contracts both to increase the returns of the Fund and/or to manage its exposure to certain risks such as credit risk, equity risk, interest rate risk, foreign currency exchange rate risk, commodity price risk or other risks (e.g., inflation risk). Derivative financial instruments categorized by risk exposure are included in the Schedule of Investments. These contracts may be transacted on an exchange or OTC.
Options: The Fund purchases and writes call and put options to increase or decrease its exposure to the risks of underlying instruments, including equity risk, interest rate risk and/or commodity price risk and/or, in the case of options written, to generate gains from options premiums.
A call option gives the purchaser (holder) of the option the right (but not the obligation) to buy, and obligates the seller (writer) to sell (when the option is exercised) the underlying instrument at the exercise or strike price at any time or at a specified time during the option period. A put option gives the holder the right to sell and obligates the writer to buy the underlying instrument at the exercise or strike price at any time or at a specified time during the option period.
Premiums paid on options purchased and premiums received on options written, as well as the daily fluctuation in market value, are included in investments at value — unaffiliated and options written at value, respectively, in the Statement of Assets and Liabilities. When an instrument is purchased or sold through the exercise of an option, the premium is offset against the cost or proceeds of the underlying instrument. When an option expires, a realized gain or loss is recorded in the Statement of Operations to the extent of the premiums received or paid. When an option is closed or sold, a gain or loss is recorded in the Statement of Operations to the extent the cost of the closing transaction exceeds the premiums received or paid. When the Fund writes a call option, such option is typically “covered,” meaning that it holds the underlying instrument subject to being called by the option counterparty. When the Fund writes a put option, such option is covered by cash in an amount sufficient to cover the obligation. The amount disclosed should be the value of the underlying that was subject to call.
| | | | | | |
| 26 | | BLACKROCK EVENT DRIVEN EQUITY FUND | | SEPTEMBER 30, 2017 | | |
| | | | |
| Notes to Financial Statements (continued) | | | | |
In purchasing and writing options, the Fund bears the risk of an unfavorable change in the value of the underlying instrument or the risk that it may not be able to enter into a closing transaction due to an illiquid market. Exercise of a written option could result in the Fund purchasing or selling a security when it otherwise would not, or at a price different from the current market value.
Swaps: Swap contracts are entered into to manage exposure to issuers, markets and securities. Such contracts are agreements between the Fund and a counterparty to make periodic net payments on a specified notional amount or a net payment upon termination. Swap agreements are privately negotiated in the OTC market and may be entered into as a bilateral contract (“OTC swaps”) or centrally cleared (“centrally cleared swaps”).
For OTC swaps, any upfront premiums paid and any upfront fees received are shown as swap premiums paid and swap premiums received, respectively, in the Statement of Assets and Liabilities and amortized over the term of the contract. The daily fluctuation in market value is recorded as unrealized appreciation (depreciation) on OTC Swaps in the Statement of Assets and Liabilities. Payments received or paid are recorded in the Statement of Operations as realized gains or losses, respectively. When an OTC swap is terminated, a realized gain or loss is recorded in the Statement of Operations equal to the difference between the proceeds from (or cost of) the closing transaction and the Fund’s basis in the contract, if any. Generally, the basis of the contract is the premium received or paid.
In a centrally cleared swap, immediately following execution of the swap contract, the swap contract is novated to a central counterparty (the “CCP”) and the Fund’s counterparty on the swap agreement becomes the CCP. The Fund is required to interface with the CCP through the broker. Upon entering into a centrally cleared swap, the Fund is required to deposit initial margin with the broker in the form of cash or securities in an amount that varies depending on the size and risk profile of the particular swap. Securities deposited as initial margin are designated in the Schedule of Investments and cash deposited is shown as cash pledged for centrally cleared swaps in the Statement of Assets and Liabilities. Pursuant to the contract, the Fund agrees to receive from or pay to the broker an amount of cash equal to the daily fluctuation in market value of the contract (“variation margin”). Variation margin is recorded as unrealized appreciation (depreciation) and shown as variation margin receivable (or payable) on centrally cleared swaps in the Statement of Assets and Liabilities. Payments received from (paid to) the counterparty, including at termination, are recorded as realized gains (losses) in the Statement of Operations.
| • | | Credit default swaps — Credit default swaps are entered into to manage exposure to the market or certain sectors of the market, to reduce risk exposure to defaults of corporate and/or sovereign issuers or to create exposure to corporate and/or sovereign issuers to which a fund is not otherwise exposed (credit risk). |
The Fund may either buy or sell (write) credit default swaps on single-name issuers (corporate or sovereign), a combination or basket of single-name issuers or traded indexes. Credit default swaps are agreements in which the protection buyer pays fixed periodic payments to the seller in consideration for a promise from the protection seller to make a specific payment should a negative credit event take place with respect to the referenced entity (e.g., bankruptcy, failure to pay, obligation acceleration, repudiation, moratorium or restructuring). As a buyer, if an underlying credit event occurs, the Fund will either (i) receive from the seller an amount equal to the notional amount of the swap and deliver the referenced security or underlying securities comprising the index, or (ii) receive a net settlement of cash equal to the notional amount of the swap less the recovery value of the security or underlying securities comprising the index. As a seller (writer), if an underlying credit event occurs, the Fund will either pay the buyer an amount equal to the notional amount of the swap and take delivery of the referenced security or underlying securities comprising the index or pay a net settlement of cash equal to the notional amount of the swap less the recovery value of the security or underlying securities comprising the index.
| • | | Total return swaps — Total return swaps are entered into to obtain exposure to a portfolio of long and short securities without owning such securities. |
Under the terms of a contract, the swap is designed to function as a portfolio of direct investments in long and short equity positions. This means that the Fund has the ability to trade in and out of these long and short positions within the swap and will receive the economic benefits and risks equivalent to direct investment in these positions, subject to certain adjustments due to events related to the counterparty. Benefits and risks include capital appreciation (depreciation), corporate actions and dividends received and paid, all of which are reflected in the swap’s market value. The market value also includes interest charges and credits (“financing fees”) related to the notional values of the long and short positions and cash balances within the swap. These interest charges and credits are based on a specified benchmark rate plus or minus a specified spread determined based upon the country and/or currency of the positions in the portfolio.
Positions within the swap and financing fees are reset periodically. During a reset, any unrealized appreciation (depreciation) on positions and accrued financing fees become available for cash settlement between the Fund and the counterparty. The amounts that are available for cash settlement are recorded as realized gains or losses in the Statement of Operations. Cash settlement in and out of the swap may occur at a reset date or any other date, at the discretion of the Fund and the counterparty, over the life of the agreement. Certain swaps have no stated expiration and can be terminated by either party at any time.
| | | | | | |
| | | BLACKROCK EVENT DRIVEN EQUITY FUND | | SEPTEMBER 30, 2017 | | 27 |
| | | | |
| Notes to Financial Statements (continued) | | | | |
Master Netting Arrangements: In order to define its contractual rights and to secure rights that will help it mitigate its counterparty risk, the Fund may enter into an International Swaps and Derivatives Association, Inc. Master Agreement (“ISDA Master Agreement”) or similar agreement with its counterparties. An ISDA Master Agreement is a bilateral agreement between the Fund and a counterparty that governs certain OTC derivatives and typically contains, among other things, collateral posting terms and netting provisions in the event of a default and/or termination event. Under an ISDA Master Agreement, the Fund may, under certain circumstances, offset with the counterparty certain derivative financial instruments’ payables and/or receivables with collateral held and/or posted and create one single net payment. The provisions of the ISDA Master Agreement typically permit a single net payment in the event of default including the bankruptcy or insolvency of the counterparty. Bankruptcy or insolvency laws of a particular jurisdiction may restrict or prohibit the right of offset in bankruptcy, insolvency or other events.
Collateral Requirements: For derivatives traded under an ISDA Master Agreement, the collateral requirements are typically calculated by netting the mark-to-market amount for each transaction under such agreement and comparing that amount to the value of any collateral currently pledged by the Fund and the counterparty.
Cash collateral that has been pledged to cover obligations of the Fund and cash collateral received from the counterparty, if any, is reported separately on the Statement of Assets and Liabilities as cash pledged as collateral and cash received as collateral, respectively. Non-cash collateral pledged by the Fund, if any, is noted in the Schedule of Investments. Generally, the amount of collateral due from or to a counterparty is subject to a certain minimum transfer amount threshold before a transfer is required, which is determined at the close of business of the Fund. Any additional required collateral is delivered to/pledged by the Fund on the next business day. Typically, the counterparty is not permitted to sell, re-pledge or use cash and non-cash collateral it receives. The Fund generally agrees not to use non-cash collateral that it receives but may, absent default or certain other circumstances defined in the underlying ISDA Master Agreement, be permitted to use cash collateral received. In such cases, interest may be paid pursuant to the collateral arrangement with the counterparty. To the extent amounts due to the Fund from its counterparties are not fully collateralized, it bears the risk of loss from counterparty non-performance. Likewise, to the extent the Fund has delivered collateral to a counterparty and stands ready to perform under the terms of its agreement with such counterparty, it bears the risk of loss from a counterparty in the amount of the value of the collateral in the event the counterparty fails to return such collateral. Based on the terms of agreements, collateral may not be required for all derivative contracts.
6. Investment Advisory Agreement and Other Transactions with Affiliates:
The PNC Financial Services Group, Inc. is the largest stockholder and an affiliate of BlackRock, Inc. (“BlackRock”) for 1940 Act purposes.
Investment Advisory: The Corporation, on behalf of the Fund, entered into an Investment Advisory Agreement with the Manager, the Fund’s investment adviser, an indirect, wholly-owned subsidiary of BlackRock, to provide investment advisory and administrative services. The Manager is responsible for the management of the Fund’s portfolio and provides the personnel, facilities, equipment and certain other services necessary to the operations of the Fund.
For such services, the Fund pays the Manager a monthly fee at an annual rate equal to the following percentage of the average daily value of the Fund’s net assets:
| | |
| Average Daily Net Assets | | Investment
Advisory
Fees |
First $1 Billion | | 1.20% |
$1 Billion - $3 Billion | | 1.13% |
$3 Billion - $5 Billion | | 1.08% |
$5 Billion - $10 Billion | | 1.04% |
Greater than $10 Billion | | 1.02% |
Service and Distribution Fees: The Corporation, on behalf of the Fund, entered into a Distribution Agreement and Distribution Plan with BlackRock Investments, LLC (“BRIL”), an affiliate of the Manager. Pursuant to the Distribution Plan and in accordance with Rule 12b-1 under the 1940 Act, the Fund pays BRIL ongoing service and distribution fees. The fees are accrued daily and paid monthly at annual rates based upon the average daily net assets of the relevant share class of the Fund as follows:
| | | | |
| | | Service
Fees | | Distribution
Fees |
Investor A | | 0.25% | | — |
Investor C | | 0.25% | | 0.75% |
BRIL and broker-dealers, pursuant to sub-agreements with BRIL, provide shareholder servicing and distribution services to the Fund. The ongoing service and/or distribution fee compensates BRIL and each broker-dealer for providing shareholder servicing and/or distribution related services to shareholders.
| | | | | | |
| 28 | | BLACKROCK EVENT DRIVEN EQUITY FUND | | SEPTEMBER 30, 2017 | | |
| | | | |
| Notes to Financial Statements (continued) | | | | |
For the year ended September 30, 2017, the following table shows the class specific service and distribution fees borne directly by each share class of the Fund:
| | | | | | |
| Investor A | | Investor C | | Total | |
$76,188 | | $62,169 | | $ | 138,357 | |
Transfer Agent: Pursuant to written agreements, certain financial intermediaries, some of which may be affiliates, provide the Fund with sub-accounting, recordkeeping, sub-transfer agency and other administrative services with respect to sub-accounts they service. For these services, these entities receive an asset-based fee or an annual fee per shareholder account, which will vary depending on share class and/or net assets. For the year ended September 30, 2017, the Fund’s Institutional Shares paid $385 to affiliates of BlackRock in return for these services, which are included in transfer agent — class specific in the Statement of Operations.
The Manager maintains a call center that is responsible for providing certain shareholder services to the Fund. Shareholder services include responding to inquiries and processing subscriptions and redemptions based upon instructions from shareholders. For the year ended September 30, 2017, the Fund reimbursed the Manager the following amounts for costs incurred in running the call center, which are included in transfer agent — class specific in the Statement of Operations:
| | | | | | |
| Institutional | | Investor A | | Investor C | | Total |
$402 | | $1,226 | | $572 | | $2,200 |
For the year ended September 30, 2017, the following table shows the class specific transfer agent fees borne directly by each class of the Fund:
| | | | | | |
| Institutional | | Investor A | | Investor C | | Total |
$74,694 | | $44,805 | | $10,446 | | $129,945 |
Other Fees: For the year ended September 30, 2017, affiliates earned underwriting discounts, direct commissions and dealer concessions on sales of the Fund’s Investor A Shares of $3,197.
For the year ended September 30, 2017, affiliates received CDSCs as follows:
| | | | |
| Investor A | | $ 390 | |
Investor C | | | $1,639 | |
Expense Limitations, Waivers and Reimbursements: With respect to the Fund, the Manager voluntarily agreed to waive its investment advisory fees by the amount of investment advisory fees the Fund pays to the Manager indirectly through its investment in affiliated money market funds (the “affiliated money market fund waiver”). The amount of waivers and/or reimbursements of fees and expenses made pursuant to the expense limitation caps, as applicable, will be reduced by the amount of the affiliated money market fund waiver. These amounts are included in fees waived by the Manager in the Statement of Operations. For the year ended September 30, 2017, the Manager waived $75,659.
The Manager voluntarily agreed to waive its investment advisory fee with respect to any portion of the Fund’s assets invested in affiliated equity and fixed-income mutual funds and affiliated exchange-traded funds that have a contractual management fee. Effective January 27, 2017, the waiver became contractual through January 31, 2018. This contractual agreement may be terminated upon 90 days’ notice by a majority of the Independent Directors or by a vote of a majority of the outstanding voting securities of the Fund. For the year ended September 30, 2017, there were no fees waived by the Manager.
With respect to the Fund, the Manager contractually agreed to waive and/or reimburse fees or expenses in order to limit expenses, excluding interest expense, dividend expense, tax expense, acquired fund fees and expenses, and certain other fund expenses, which constitute extraordinary expenses not incurred in the ordinary course of the Fund’s business (“expense limitation”). The expense limitations as a percentage of average daily net assets are as follows:
| | |
Institutional | | 1.38% |
Investor A | | 1.65% |
Investor C | | 2.39% |
The Manager has agreed not to reduce or discontinue this contractual expense limitation through January 31, 2018, unless approved by the Board, including a majority of the independent directors who are not “interested persons” of the Corporation, as defined in the 1940 Act (“Independent Directors”) or by a vote of a majority of the outstanding voting securities of the Fund. For the year ended September 30, 2017, the Manager waived and/or reimbursed $19,719, which is included in fees waived and/or reimbursed by the Manager in the Statement of Operations.
| | | | | | |
| | | BLACKROCK EVENT DRIVEN EQUITY FUND | | SEPTEMBER 30, 2017 | | 29 |
| | | | |
| Notes to Financial Statements (continued) | | | | |
Class specific expense waivers and/or reimbursements are as follows:
| | | | | | | | | | | | | | | | | | | | |
| | | Institutional | | Investor A | | Investor C | | Total |
Transfer agent fees waived and/or reimbursed | | | | $60,576 | | | | | $33,406 | | | | | $8,621 | | | | | $102,603 | |
For the year ended September 30, 2017, the Fund reimbursed the Manager $1,754 for certain accounting services, which is included in accounting services in the Statement of Operations.
Interfund Lending: In accordance with an exemptive order (the “Order”) from the U.S. Securities and Exchange Commission, the Fund may participate in a joint lending and borrowing facility for temporary purposes (the “Interfund Lending Program”), subject to compliance with the terms and conditions of the Order, and to the extent permitted by the Fund’s investment policies and restrictions. The Fund is currently permitted to borrow and lend under the Interfund Lending Program.
A lending BlackRock fund may lend in aggregate up to 15% of its net assets, but may not lend more than 5% of its net assets to any one borrowing fund through the Interfund Lending Program. A borrowing BlackRock fund may not borrow through the Interfund Lending Program or from any other source more than 33 1/3% of its total assets (or any lower threshold provided for by the fund’s investment restrictions). If a borrowing BlackRock fund’s total outstanding borrowings exceed 10% of its total assets, each of its outstanding interfund loans will be subject to collateralization of at least 102% of the outstanding principal value of the loan. All interfund loans are for temporary or emergency purposes and the interest rate to be charged will be the average of the highest current overnight repurchase agreement rate available to a lending fund and the bank loan rate, as calculated according to a formula established by the Board.
During the year ended September 30, 2017, the Fund did not participate in the Interfund Lending Program.
Officers and Directors: Certain officers and/or directors of the Corporation are officers and/or directors of BlackRock or its affiliates. The Fund reimburses the Manager for a portion of the compensation paid to the Corporation’s Chief Compliance Officer, which is included in Officer and Directors in the Statement of Operations.
7. Purchases and Sales:
For the year ended September 30, 2017, purchases and sales of investments, excluding short-term securities, were $56,777,256 and $35,916,491, respectively.
8. Income Tax Information:
It is the Fund’s policy to comply with the requirements of the Internal Revenue Code of 1986, as amended, applicable to regulated investment companies, and to distribute substantially all of its taxable income to its shareholders. Therefore, no U.S. federal income tax provision is required.
The Fund files U.S. federal and various state and local tax returns. No income tax returns are currently under examination. The statute of limitations on the Fund’s U.S. federal tax returns generally remains open for each of the four years ended September 30, 2017. The statutes of limitations on the Fund’s state and local tax returns may remain open for an additional year depending upon the jurisdiction.
Management has analyzed tax laws and regulations and their application to the Fund as of September 30, 2017, inclusive of the open tax return years, and does not believe that there are any uncertain tax positions that require recognition of a tax liability in the Fund’s financial statements.
U.S. GAAP requires that certain components of net assets be adjusted to reflect permanent differences between financial and tax reporting. These reclassifications have no effect on net assets or net asset values per share. As of period end, the following permanent differences attributable to the accounting for swap agreements, net operating losses, foreign currency transactions and the sale of stock of passive foreign investment companies were reclassified to the following accounts:
| | | | |
Undistributed net investment income | | | $ 658,286 | |
Undistributed net realized gain | | | $( 658,286) | |
The tax character of distributions paid was as follows:
| | | | | | | | |
| | | 9/30/17 | | | 9/30/16 | |
Ordinary income | | | $1,140,923 | | | | — | |
Long-term capital gains | | | — | | | | $1,585,900 | |
Total | | | $1,140,923 | | | | $1,585,900 | |
| | | | | | |
| 30 | | BLACKROCK EVENT DRIVEN EQUITY FUND | | SEPTEMBER 30, 2017 | | |
| | | | |
| Notes to Financial Statements (continued) | | | | |
As of period end, the tax components of accumulated net earnings (losses) were as follows:
| | | | |
Undistributed ordinary income | | $ | 9,718,854 | |
Undistributed long-term capital gains | | | 627,120 | |
Net unrealized gains1 | | | 1,806,034 | |
| | | | |
Total | | $ | 12,152,008 | |
| | | | |
| | 1 | | The difference between book-basis and tax-basis net unrealized gains was attributable primarily to the tax deferral of losses on wash sales and straddles, the accounting for swap agreements and the realization for tax purposes of unrealized gains on constructive sales. |
As of September 30, 2017, gross unrealized appreciation and depreciation based on cost for U.S. federal income tax purposes were as follows:
| | | | |
Tax cost | | $ | 188,571,694 | |
| | | | |
Gross unrealized appreciation | | $ | 2,326,435 | |
Gross unrealized depreciation | | | (479,549 | ) |
| | | | |
Net unrealized appreciation | | $ | 1,846,886 | |
| | | | |
9. Bank Borrowings:
The Corporation, on behalf of the Fund, along with certain other funds managed by the Manager and its affiliates (“Participating Funds”), is a party to a 364-day, $2.1 billion credit agreement with a group of lenders. Under this agreement, the Fund may borrow to fund shareholder redemptions. Excluding commitments designated for certain individual funds, the Participating Funds, including the Fund, can borrow up to an aggregate commitment amount of $1.6 billion at any time outstanding, subject to asset coverage and other limitations as specified in the agreement. The credit agreement has the following terms: a fee of 0.12% per annum on unused commitment amounts and interest at a rate equal to the higher of (a) one-month LIBOR (but, in any event, not less than 0.00%) on the date the loan is made plus 0.80% per annum or (b) the Fed Funds rate (but, in any event, not less than 0.00%) in effect from time to time plus 0.80% per annum on amounts borrowed. The agreement expires in April 2018 unless extended or renewed. Participating Funds paid administration, legal and arrangement fees, which, if applicable, are included in miscellaneous expenses in the Statement of Operations. These fees were allocated among such funds based upon portions of the aggregate commitment available to them and relative net assets of Participating Funds. During the year ended September 30, 2017, the Fund did not borrow under the credit agreement.
10. Principal Risks:
In the normal course of business, the Fund invests in securities or other instruments and may enter into certain transactions, and such activities subject the Fund to various risks, including among others, fluctuations in the market (market risk) or failure of an issuer to meet all of its obligations. The value of securities or other instruments may also be affected by various factors, including, without limitation: (i) general economy; (ii) overall market as well as local, regional or global political and/or social instability; (iii) regulation, taxation or international tax treaties between various countries; or (iv) currency, interest rate and price fluctuations. The Fund’s prospectus provides details of the risks to which the Fund is subject.
The Fund may be exposed to prepayment risk, which is the risk that borrowers may exercise their option to prepay principal earlier than scheduled during periods of declining interest rates, which would force the Fund to reinvest in lower yielding securities. The Fund may also be exposed to reinvestment risk, which is the risk that income from the Fund’s portfolio will decline if the Fund invests the proceeds from matured, traded or called fixed-income securities at market interest rates that are below the Fund portfolio’s current earnings rate.
Valuation Risk: The market values of equities, such as common stocks and preferred securities or equity related investments, such as futures and options, may decline due to general market conditions which are not specifically related to a particular company. They may also decline due to factors which affect a particular industry or industries. The Fund may invest in illiquid investments and may experience difficulty in selling those investments in a timely manner at the price that it believes the investments are worth. Prices may fluctuate widely over short or extended periods in response to company, market or economic news. Markets also tend to move in cycles, with periods of rising and falling prices. This volatility may cause the Fund’s NAV to experience significant increases or decreases over short periods of time. If there is a general decline in the securities and other markets, the NAV of the Fund may lose value, regardless of the individual results of the securities and other instruments in which the Fund invests.
Counterparty Credit Risk: Similar to issuer credit risk, the Fund may be exposed to counterparty credit risk, or the risk that an entity may fail to or be unable to perform on its commitments related to unsettled or open transactions. The Fund manages counterparty credit risk by entering into transactions only with counterparties that the Manager believes have the financial resources to honor their obligations and by monitoring the financial stability of those counterparties. Financial assets, which potentially expose the Fund to market, issuer and counterparty credit risks, consist principally of financial instruments and receivables due from counterparties. The extent of the Fund’s exposure to market, issuer and counterparty credit risks with respect to these financial assets is approximately their value recorded in the Statement of Assets and Liabilities, less any collateral held by the Fund.
A derivative contract may suffer a mark-to-market loss if the value of the contract decreases due to an unfavorable change in the market rates or values of the underlying instrument. Losses can also occur if the counterparty does not perform under the contract.
| | | | | | |
| | | BLACKROCK EVENT DRIVEN EQUITY FUND | | SEPTEMBER 30, 2017 | | 31 |
| | | | |
| Notes to Financial Statements (concluded) | | | | |
The Fund’s risk of loss from counterparty credit risk on OTC derivatives is generally limited to the aggregate unrealized gain less the value of any collateral held by the Fund.
For OTC options purchased, the Fund bears the risk of loss in the amount of the premiums paid plus the positive change in market values net of any collateral held by the Fund should the counterparty fail to perform under the contracts. Options written by the Fund do not typically give rise to counterparty credit risk, as options written generally obligate the Fund, and not the counterparty, to perform. The Fund may be exposed to counterparty credit risk with respect to options written to the extent the Fund deposits collateral with its counterparty to a written option.
With centrally cleared swaps, there is less counterparty credit risk to the Fund since the exchange or clearinghouse, as counterparty to such instruments, guarantees against a possible default. The clearinghouse stands between the buyer and the seller of the contract; therefore, credit risk is limited to failure of the clearinghouse. While offset rights may exist under applicable law, the Fund does not have a contractual right of offset against a clearing broker or clearinghouse in the event of a default (including the bankruptcy or insolvency). Additionally, credit risk exists in centrally cleared swaps with respect to initial and variation margin that is held in a clearing broker’s customer accounts. While clearing brokers are required to segregate customer margin from their own assets, in the event that a clearing broker becomes insolvent or goes into bankruptcy and at that time there is a shortfall in the aggregate amount of margin held by the clearing broker for all its clients, typically the shortfall would be allocated on a pro rata basis across all the clearing broker’s customers, potentially resulting in losses to the Fund.
11. Capital Share Transactions:
Transactions in capital shares for each class were as follows:
| | | | | | | | | | | | | | | | | | | | |
| | | Year Ended
September 30, 2017 | | | | | | Year Ended
September 30, 2016 | |
| | | Shares | | | Amount | | | | | | Shares | | | Amount | |
| Institutional | | | | | | | | | | | | | | | |
Shares sold | | | 9,579,630 | | | $ | 89,854,339 | | | | | | | | 13,361,386 | | | $ | 116,925,451 | |
Shares issued in reinvestment of distributions | | | 100,225 | | | | 884,991 | | | | | | | | 51,880 | | | | 441,493 | |
Shares redeemed | | | (3,125,005 | ) | | | (28,598,232 | ) | | | | | | | (5,676,980 | ) | | | (51,032,631 | ) |
| | | | | | | | | | | | |
Net increase | | | 6,554,850 | | | $ | 62,141,098 | | | | | | | | 7,736,286 | | | $ | 66,334,313 | |
| | | | | | | | | | | | |
| | | | | | | | | | | | | | | | | | | | |
Investor A | | | | | | | | | | | | | | | | | | | | |
Shares sold | | | 2,104,249 | | | $ | 18,322,842 | | | | | | | | 3,129,963 | | | $ | 26,427,621 | |
Shares issued in reinvestment of distributions | | | 28,058 | | | | 238,518 | | | | | | | | 80,512 | | | | 661,808 | |
Shares redeemed | | | (1,843,597 | ) | | | (16,220,084 | ) | | | | | | | (1,255,453 | ) | | | (10,603,835 | ) |
| | | | | | | | | | | | |
Net increase | | | 288,710 | | | $ | 2,341,276 | | | | | | | | 1,955,022 | | | $ | 16,485,594 | |
| | | | | | | | | | | | |
| | | | | | | | | | | | | | | | | | | | |
Investor C | | | | | | | | | | | | | | | | | | | | |
Shares sold | | | 458,561 | | | $ | 3,680,738 | | | | | | | | 376,431 | | | $ | 2,885,134 | |
Shares issued in reinvestment of distributions | | | — | | | | — | | | | | | | | 54,311 | | | | 406,786 | |
Shares redeemed | | | (455,160 | ) | | | (3,640,079 | ) | | | | | | | (411,385 | ) | | | (3,170,876 | ) |
| | | | | | | | | | | | |
Net increase | | | 3,401 | | | $ | 40,659 | | | | | | | | 19,357 | | | $ | 121,044 | |
| | | | | | | | | | | | |
Total Net Increase | | | 6,846,961 | | | $ | 64,523,033 | | | | | | | | 9,710,665 | | | $ | 82,940,951 | |
| | | | | | | | | | | | |
During the year ended September 30, 2016, the Fund received $112,578 from affiliates, reflected as capital contributions — affiliated in the Statements of Changes in Net Assets, to adjust paid-in capital related to certain shareholder transactions.
12. Subsequent Events:
Management has evaluated the impact of all subsequent events on the Fund through the date the financial statements were issued and has determined that there were no subsequent events requiring adjustment or additional disclosure in the financial statements.
| | | | | | |
| 32 | | BLACKROCK EVENT DRIVEN EQUITY FUND | | SEPTEMBER 30, 2017 | | |
| | | | |
| Report of Independent Registered Public Accounting Firm | | | | |
To the Board of Directors of BlackRock Large Cap Series Funds, Inc. and Shareholders of BlackRock Event Driven Equity Fund:
We have audited the accompanying statement of assets and liabilities, including the schedule of investments, of BlackRock Event Driven Equity Fund (the “Fund”), a series of BlackRock Large Cap Series Funds, Inc., as of September 30, 2017, and the related statement of operations for the year then ended, the statements of changes in net assets for each of the two years in the period then ended, and the financial highlights for each of the five years in the period then ended. These financial statements and financial highlights are the responsibility of the Fund’s management. Our responsibility is to express an opinion on these financial statements and financial highlights based on our audits.
We conducted our audits in accordance with the standards of the Public Company Accounting Oversight Board (United States). Those standards require that we plan and perform the audit to obtain reasonable assurance about whether the financial statements and financial highlights are free of material misstatement. The Fund is not required to have, nor were we engaged to perform, an audit of its internal control over financial reporting. Our audits included consideration of internal control over financial reporting as a basis for designing audit procedures that are appropriate in the circumstances, but not for the purpose of expressing an opinion on the effectiveness of the Fund’s internal control over financial reporting. Accordingly, we express no such opinion. An audit also includes examining, on a test basis, evidence supporting the amounts and disclosures in the financial statements, assessing the accounting principles used and significant estimates made by management, as well as evaluating the overall financial statement presentation. Our procedures included confirmation of securities owned as of September 30, 2017 by correspondence with the custodian and brokers; where replies were not received from brokers, we performed other auditing procedures. We believe that our audits provide a reasonable basis for our opinion.
In our opinion, such financial statements and financial highlights referred to above present fairly, in all material respects, the financial position of BlackRock Event Driven Equity Fund as of September 30, 2017, the results of its operations for the year then ended, the changes in its net assets for each of the two years in the period then ended, and the financial highlights for each of the five years in the period then ended, in conformity with accounting principles generally accepted in the United States of America.
Deloitte & Touche LLP
Philadelphia, Pennsylvania
November 22, 2017
|
| Important Tax Information (Unaudited) |
During the fiscal year ended September 30, 2017, the following information is provided with respect to the ordinary income distributions paid by the Fund:
| | | | | | | | | | | | | | |
| | | Payable Date | | | | | | | | | |
Qualified Dividend Income for Individuals1 | | | 12/16/2016 | | | | | | 3.23 | % | | | | |
Dividends Qualifying for the Dividends Received Deduction for Corporations1 | | | 12/16/2016 | | | | | | 3.29 | % | | | | |
Qualified Short-Term Capital Gains for non-U.S. Residents2 | | | 12/16/2016 | | | | | | 100.00 | % | | | | |
| | 1 | | The Fund hereby designates the percentage indicated above or the maximum amount allowable by law. |
| | 2 | | Represents the portion of the taxable ordinary income dividends eligible for exemption from U.S. withholding tax for nonresident aliens and foreign corporations. |
| | | | | | |
| | | BLACKROCK EVENT DRIVEN EQUITY FUND | | SEPTEMBER 30, 2017 | | 33 |
| | | | |
| Disclosure of Investment Advisory Agreement | | | | |
The Board of Directors (the “Board,” the members of which are referred to as “Board Members”) of BlackRock Large Cap Series Funds, Inc. (the “Corporation”) met in person on April 20, 2017 (the “April Meeting”) and May 24-25, 2017 (the “May Meeting”) to consider the approval of the investment advisory agreement (the “Agreement”) between the Corporation, on behalf of BlackRock Event Driven Equity Fund (the “Fund”), a series of the Corporation, and BlackRock Advisors, LLC (the “Manager” or “BlackRock”), the Corporation’s investment advisor.
Activities and Composition of the Board
On the date of the May Meeting, the Board consisted of thirteen individuals, eleven of whom were not “interested persons” of the Corporation as defined in the Investment Company Act of 1940, as amended (the “1940 Act”) (the “Independent Board Members”). The Board Members are responsible for the oversight of the operations of the Corporation and perform the various duties imposed on the directors of investment companies by the 1940 Act. The Independent Board Members have retained independent legal counsel to assist them in connection with their duties. The Chair of the Board is an Independent Board Member. The Board has established five standing committees: an Audit Committee, a Governance and Nominating Committee, a Compliance Committee, a Performance Oversight and Contract Committee and an Executive Committee, each of which is chaired by an Independent Board Member and composed of Independent Board Members (except for the Executive Committee, which also has one interested Board Member).
The Agreement
Pursuant to the 1940 Act, the Board is required to consider the continuation of the Agreement on an annual basis. The Board has four quarterly meetings per year, each extending over two days, a fifth one-day meeting to consider specific information surrounding the consideration of renewing the Agreement and additional in-person and telephonic meetings as needed. In connection with this year-long deliberative process, the Board assessed, among other things, the nature, extent and quality of the services provided to the Fund by BlackRock, BlackRock’s personnel and affiliates, including (as applicable): investment management; administrative and shareholder services; the oversight of fund service providers; marketing; risk oversight; compliance; and ability to meet applicable legal and regulatory requirements.
The Board, acting directly and through its committees, considers at each of its meetings, and from time to time as appropriate, factors that are relevant to its annual consideration of the renewal of the Agreement, including the services and support provided by BlackRock to the Fund and its shareholders. BlackRock also furnished additional information to the Board in response to specific questions from the Board. This additional information is discussed further below in the section titled “Board Considerations in Approving the Agreement.” Among the matters the Board considered were: (a) investment performance for one-year, three-year, five-year, ten-year, and/or since inception periods, as applicable, against peer funds, applicable benchmark, and performance metrics, as applicable, as well as senior management’s and portfolio managers’ analysis of the reasons for any over-performance or underperformance relative to its peers, benchmarks, and other performance metrics, as applicable; (b) fees, including advisory, administration, if applicable, and other amounts paid to BlackRock and its affiliates by the Fund for services; (c) Fund operating expenses and how BlackRock allocates expenses to the Fund; (d) the resources devoted to, risk oversight of, and compliance reports relating to, implementation of the Fund’s investment objective(s), policies and restrictions, and meeting regulatory requirements; (e) the Corporation’s adherence to its compliance policies and procedures; (f) the nature, cost and character of non-investment management services provided by BlackRock and its affiliates; (g) BlackRock’s and other service providers’ internal controls and risk and compliance oversight mechanisms; (h) BlackRock’s implementation of the proxy voting policies approved by the Board; (i) the use of brokerage commissions and execution quality of portfolio transactions; (j) BlackRock’s implementation of the Corporation’s valuation and liquidity procedures; (k) an analysis of management fees for products with similar investment mandates across the open-end fund, exchange-traded fund (“ETF”), closed-end fund, sub-advised mutual fund, separately managed account, collective investment trust, and institutional separate account product channels, as applicable, and the similarities and differences between these products and the services provided as compared to the Fund; (l) BlackRock’s compensation methodology for its investment professionals and the incentives and accountability it creates, along with investment professionals’ investments in the fund(s) they manage; and (m) periodic updates on BlackRock’s business.
Board Considerations in Approving the Agreement
The Approval Process: Prior to the April Meeting, the Board requested and received materials specifically relating to the Agreement. The Board is continuously engaged in a process with its independent legal counsel and BlackRock to review the nature and scope of the information provided to better assist its deliberations. The materials provided in connection with the April Meeting included (a) information independently compiled and prepared by Broadridge Financial Solutions, Inc. (“Broadridge”) on Fund fees and expenses as compared with a peer group of funds as determined by Broadridge (“Expense Peers”) and the investment performance of the Fund as compared with a peer group of funds as determined by Broadridge1 and certain performance metrics; (b) information on the profits realized by BlackRock and its affiliates pursuant to the Agreement and a discussion of fall-out benefits to BlackRock and its affiliates; (c) a general analysis provided by BlackRock concerning investment management fees charged to other clients, such as institutional clients, sub-advised mutual funds, ETFs, closed-end funds, and separately managed accounts under similar investment.
| 1 | Funds are ranked by Broadridge in quartiles, ranging from first to fourth, where first is the most desirable quartile position and fourth is the least desirable. |
| | | | | | |
| 34 | | BLACKROCK EVENT DRIVEN EQUITY FUND | | SEPTEMBER 30, 2017 | | |
| | | | |
| Disclosure of Investment Advisory Agreement (continued) | | | | |
mandates, as well as the performance of such other clients, as applicable;(d) review of non-management fees; (e) the existence, impact and sharing of potential economies of scale; (f) a summary of aggregate amounts paid by the Fund to BlackRock; and (g) sales and redemption data regarding the Fund’s shares.
At the April Meeting, the Board reviewed materials relating to its consideration of the Agreement. As a result of the discussions that occurred during the April Meeting, and as a culmination of the Board’s year-long deliberative process, the Board presented BlackRock with questions and requests for additional information. BlackRock responded to these requests with additional written information in advance of the May Meeting.
At the May Meeting, the Board, including the Independent Board Members, approved the continuation of the Agreement between the Manager and the Corporation with respect to the Fund for a one-year term ending June 30, 2018. In approving the continuation of the Agreement, the Board considered: (a) the nature, extent and quality of the services provided by BlackRock; (b) the investment performance of the Fund; (c) the advisory fee and the cost of the services and profits to be realized by BlackRock and its affiliates from their relationship with the Fund; (d) the Fund’s costs to investors compared to the costs of Expense Peers and performance compared to the relevant performance metrics as previously discussed; (e) the sharing of potential economies of scale; (f) fall-out benefits to BlackRock and its affiliates as a result of its relationship with the Fund; and (g) other factors deemed relevant by the Board Members.
The Board also considered other matters it deemed important to the approval process, such as other payments made to BlackRock or its affiliates, securities lending and cash management, services related to the valuation and pricing of Fund portfolio holdings, and advice from independent legal counsel with respect to the review process and materials submitted for the Board’s review. The Board noted the willingness of BlackRock personnel to engage in open, candid discussions with the Board. The Board did not identify any particular information as determinative, and each Board Member may have attributed different weights to the various items considered.
A. Nature, Extent and Quality of the Services Provided by BlackRock
The Board, including the Independent Board Members, reviewed the nature, extent and quality of services provided by BlackRock, including the investment advisory services and the resulting performance of the Fund. Throughout the year, the Board compared Fund performance to the performance of a comparable group of mutual funds, relevant benchmark, and performance metrics, as applicable. The Board met with BlackRock’s senior management personnel responsible for investment activities, including the senior investment officers. The Board also reviewed the materials provided by the Fund’s portfolio management team discussing the Fund’s performance and the Fund’s investment objective(s), strategies and outlook.
The Board considered, among other factors, with respect to BlackRock: the number, education and experience of investment personnel generally and the Fund’s portfolio management team; BlackRock’s research capabilities; investments by portfolio managers in the funds they manage; portfolio trading capabilities; use of technology; commitment to compliance; credit analysis capabilities; risk analysis and oversight capabilities; and the approach to training and retaining portfolio managers and other research, advisory and management personnel. The Board engaged in a review of BlackRock’s compensation structure with respect to the Fund’s portfolio management team and BlackRock’s ability to attract and retain high-quality talent and create performance incentives.
In addition to investment advisory services, the Board considered the quality of the administrative and other non-investment advisory services provided to the Fund. BlackRock and its affiliates provide the Fund with certain administrative, shareholder and other services (in addition to any such services provided to the Fund by third parties) and officers and other personnel as are necessary for the operations of the Fund. In particular, BlackRock and its affiliates provide the Fund with administrative services including, among others: (i) preparing disclosure documents, such as the prospectus, the summary prospectus (as applicable), the statement of additional information and periodic shareholder reports; (ii) oversight of daily accounting and pricing; (iii) preparing periodic filings with regulators; (iv) overseeing and coordinating the activities of other service providers; (v) organizing Board meetings and preparing the materials for such Board meetings; (vi) providing legal and compliance support; (vii) furnishing analytical and other support to assist the Board in its consideration of strategic issues such as the merger, consolidation or repurposing of certain open-end funds; and (viii) performing other administrative functions necessary for the operation of the Fund, such as tax reporting, fulfilling regulatory filing requirements and call center services. The Board reviewed the structure and duties of BlackRock’s fund administration, shareholder services, and legal & compliance departments and considered BlackRock’s policies and procedures for assuring compliance with applicable laws and regulations.
B: The Investment Performance of the Fund and BlackRock
The Board, including the Independent Board Members, also reviewed and considered the performance history of the Fund. In preparation for the April Meeting, the Board was provided with reports independently prepared by Broadridge, which included a comprehensive analysis of the Fund’s performance. The Board also reviewed a narrative and statistical analysis of the Broadridge data that was prepared by BlackRock. In connection with its review, the Board received and reviewed information regarding the investment performance of the Fund as compared to other funds in its applicable Broadridge category and certain performance metrics. With respect to the Fund, which pursues an alternative investment strategy, the Board has been engaged in an iterative process with BlackRock to identify the most appropriate performance benchmarks and metrics by which the Board should
| | | | | | |
| | | BLACKROCK EVENT DRIVEN EQUITY FUND | | SEPTEMBER 30, 2017 | | 35 |
| | | | |
| Disclosure of Investment Advisory Agreement (continued) | | | | |
measure the Fund’s performance. The Board was provided with a description of the methodology used by Broadridge to select peer funds and periodically meets with Broadridge representatives to review its methodology. The Board was provided with information on the composition of the Broadridge performance universes and expense universes. The Board and its Performance Oversight and Contract Committee regularly review, and meet with Fund management to discuss, the performance of the Fund throughout the year.
In evaluating performance, the Board recognized that the performance data reflects a snapshot of a period as of a particular date and that selecting a different performance period could produce significantly different results. Further, the Board recognized that it is possible that long-term performance can be adversely affected by even one period of significant underperformance so that a single investment decision or theme has the ability to affect long-term performance disproportionately.
The Board noted that for the one-, three- and five-year periods reported, the Fund ranked in the fourth, first and first quartile, respectively, against its Broadridge Performance Universe. The Board noted the Fund’s underperformance for the one-year period reported as compared to the Broadridge Performance Universe.
In light of the Fund’s outcome oriented objective, BlackRock believes that other performance metrics may be more appropriate than the Broadridge Performance Universe, and the Board was provided with a comparison of Fund performance relative to certain of these other metrics. Under these metrics, for the one-year and since strategy inception periods, the Fund underperformed its total return target, although the total return target is based on a three- to five-year time horizon. The overall risk of the Fund, as measured by the standard deviation of returns, was below its target range, and the Fund’s beta was below its target range for the periods.
C. Consideration of the Advisory/Management Fees and the Cost of the Services and Profits to be Realized by BlackRock and its Affiliates from their Relationship with the Fund
The Board, including the Independent Board Members, reviewed the Fund’s contractual management fee rate compared with the other funds in its Broadridge category. The contractual management fee rate represents a combination of the advisory fee and any administrative fees, before taking into account any reimbursements or fee waivers. The Board also compared the Fund’s total expense ratio, as well as its actual management fee rate, to those of other funds in its Broadridge category. The total expense ratio represents a fund’s total net operating expenses, including any 12b-1 or non 12b-1 service fees. The total expense ratio gives effect to any expense reimbursements or fee waivers that benefit a fund, and the actual management fee rate gives effect to any management fee reimbursements or waivers that benefit a fund. The Board considered the services provided and the fees charged by BlackRock and its affiliates to other types of clients with similar investment mandates, as applicable, including institutional accounts and sub-advised mutual funds (including mutual funds sponsored by third parties).
The Board received and reviewed statements relating to BlackRock’s financial condition. The Board reviewed BlackRock’s profitability methodology and was also provided with a profitability analysis that detailed the revenues earned and the expenses incurred by BlackRock for services provided to the Fund. The Board reviewed BlackRock’s profitability with respect to the Fund and other funds the Board currently oversees for the year ended December 31, 2016 compared to available aggregate profitability data provided for the prior two years. The Board reviewed BlackRock’s profitability with respect to certain other U.S. fund complexes managed by the Manager and/or its affiliates. The Board reviewed BlackRock’s assumptions and methodology of allocating expenses in the profitability analysis, noting the inherent limitations in allocating costs among various advisory products. The Board recognized that profitability may be affected by numerous factors including, among other things, fee waivers and expense reimbursements by the Manager, the types of funds managed, precision of expense allocations and business mix. As a result, calculating and comparing profitability at individual fund levels is difficult.
The Board noted that, in general, individual fund or product line profitability of other advisors is not publicly available. The Board reviewed BlackRock’s overall operating margin, in general, compared to that of certain other publicly-traded asset management firms. The Board considered the differences between BlackRock and these other firms, including the contribution of technology at BlackRock, BlackRock’s expense management, and the relative product mix.
In addition, the Board considered the cost of the services provided to the Fund by BlackRock, and BlackRock’s and its affiliates’ profits relating to the management and distribution of the Fund and the other funds advised by BlackRock and its affiliates. As part of its analysis, the Board reviewed BlackRock’s methodology in allocating its costs of managing the Fund, to the Fund. The Board may receive and review information from independent third parties as part of its annual evaluation. The Board considered whether BlackRock has the financial resources necessary to attract and retain high quality investment management personnel to perform its obligations under the Agreement and to continue to provide the high quality of services that is expected by the Board. The Board further considered factors including but not limited to BlackRock’s commitment of time, assumption of risk, and liability profile in servicing the Fund in contrast to what is required of BlackRock with respect to other products with similar investment mandates across the open-end fund, ETF, closed-end fund, sub-advised mutual fund, separately managed account, collective investment trust, and institutional separate account product channels, as applicable.
| | | | | | |
| 36 | | BLACKROCK EVENT DRIVEN EQUITY FUND | | SEPTEMBER 30, 2017 | | |
| | | | |
| Disclosure of Investment Advisory Agreement (concluded) | | | | |
The Board noted that the Fund’s contractual management fee rate ranked in the fourth quartile, and that the actual management fee rate and total expense ratio ranked in the fourth and first quartiles, respectively, relative to the Fund’s Expense Peers. The Board also noted that the Fund has an advisory fee arrangement that includes breakpoints that adjust the fee rate downward as the size of the Fund increases above certain contractually specified levels. The Board further noted that BlackRock has contractually agreed to a cap on the Fund’s total expenses as a percentage of the Fund’s average daily net assets on a class-by-class basis.
D. Economies of Scale
The Board, including the Independent Board Members, considered the extent to which economies of scale might be realized as the assets of the Fund increase, as well as the existence of expense caps, as applicable. The Board also considered the extent to which the Fund benefits from such economies in a variety of ways and whether there should be changes in the advisory fee rate or breakpoint structure in order to enable the Fund to more fully participate in these economies of scale. The Board considered the Fund’s asset levels and whether the current fee schedule was appropriate. In their consideration, the Board Members took into account the existence of any expense caps and further considered the continuation and/or implementation, as applicable, of such caps.
E. Other Factors Deemed Relevant by the Board Members
The Board, including the Independent Board Members, also took into account other ancillary or “fall-out” benefits that BlackRock or its affiliates may derive from their respective relationships with the Fund, both tangible and intangible, such as BlackRock’s ability to leverage its investment professionals who manage other portfolios and risk management personnel, an increase in BlackRock’s profile in the investment advisory community, and the engagement of BlackRock’s affiliates as service providers to the Fund, including for administrative, distribution, securities lending and cash management services. The Board also considered BlackRock’s overall operations and its efforts to expand the scale of, and improve the quality of, its operations. The Board also noted that BlackRock may use and benefit from third party research obtained by soft dollars generated by certain registered fund transactions to assist in managing all or a number of its other client accounts.
In connection with its consideration of the Agreement, the Board also received information regarding BlackRock’s brokerage and soft dollar practices. The Board received reports from BlackRock which included information on brokerage commissions and trade execution practices throughout the year.
The Board noted the competitive nature of the open-end fund marketplace, and that shareholders are able to redeem their Fund shares if they believe that the Fund’s fees and expenses are too high or if they are dissatisfied with the performance of the Fund.
Conclusion
The Board, including the Independent Board Members, approved the continuation of the Agreement between the Manager and the Corporation with respect to the Fund for a one-year term ending June 30, 2018. Based upon its evaluation of all of the aforementioned factors in their totality, as well as other information, the Board, including the Independent Board Members, was satisfied that the terms of the Agreement were fair and reasonable and in the best interest of the Fund and its shareholders. In arriving at its decision to approve the Agreement, the Board did not identify any single factor or group of factors as all-important or controlling, but considered all factors together, and different Board Members may have attributed different weights to the various factors considered. The Independent Board Members were also assisted by the advice of independent legal counsel in making this determination. The contractual fee arrangements for the Fund reflect the results of several years of review by the Board Members and predecessor Board Members, and discussions between such Board Members (and predecessor Board Members) and BlackRock. As a result, the Board Members’ conclusions may be based in part on their consideration of these arrangements in prior years.
| | | | | | |
| | | BLACKROCK EVENT DRIVEN EQUITY FUND | | SEPTEMBER 30, 2017 | | 37 |
| | | | |
| Director and Officer Information | | | | |
| | | | | | | | |
| | | | | Independent Directors(a) | | | | |
Name and
Year of Birth(b) | | Position(s)
Held
(Length of
Service)(c) | | Principal Occupation(s) During Past Five Years | | Number of BlackRock-
Advised Registered
Investment Companies
(“RICs”) Consisting of
Investment Portfolios
(“Portfolios”) Overseen | | Public
Directorships |
Rodney D. Johnson 1941 | | Chair of the Board and Director (Since 2007) | | President, Fairmount Capital Advisors, Inc. from 1987 to 2013; Member of the Archdiocesan Investment Committee of the Archdiocese of Philadelphia from 2004 to 2012; Director, The Committee of Seventy (civic) from 2006 to 2012; Director, Fox Chase Cancer Center from 2004 to 2011; Director, The Mainstay (non-profit) since 2016. | | 26 RICs consisting of 144 Portfolios | | None |
Susan J. Carter 1956 | | Director (Since 2016) | | Director, Pacific Pension Institute since 2014; Advisory Board Member, Center for Private Equity and Entrepreneurship at Tuck School of Business since 1997; Senior Advisor, Commonfund Capital, Inc. (“CCI”) (investment adviser) in 2015; Chief Executive Officer, CCI from 2013 to 2014; President & Chief Executive Officer, CCI from 1997 to 2013; Advisory Board Member, Girls Who Invest since 2015; Advisory Board Member, Bridges Ventures since 2016; Trustee, Financial Accounting Foundation since 2017. | | 26 RICs consisting of 144 Portfolios | | None |
Collette Chilton 1958 | | Director (Since 2015) | | Chief Investment Officer, Williams College since 2006; Chief Investment Officer, Lucent Asset Management Corporation from 1998 to 2006. | | 26 RICs consisting of 144 Portfolios | | None |
Neil A. Cotty 1954 | | Director (Since 2016) | | Bank of America Corporation from 1996 to 2015, serving in various senior finance leadership roles, including Chief Accounting Officer, from 2009 to 2015, Chief Financial Officer of Global Banking, Markets and Wealth Management from 2008 to 2009, Chief Accounting Officer from 2004 to 2008, Chief Financial Officer of Consumer Bank from 2003 to 2004, Chief Financial Officer of Global Corporate Investment Bank from 1999 to 2002. | | 26 RICs consisting of 144 Portfolios | | None |
Cynthia A. Montgomery 1952 | | Director (Since 2007) | | Professor, Harvard Business School since 1989; Director, McLean Hospital from 2005 to 2012. | | 26 RICs consisting of 144 Portfolios | | Newell Rubbermaid, Inc. (manufacturing) |
Joseph P. Platt 1947 | | Director (Since 2007) | | General Partner, Thorn Partners, LP (private investments) since 1998; Director, WQED Multi-Media (public broadcasting not-for-profit) since 2001; Chair, Basic Health International (non-profit) since 2015. | | 26 RICs consisting of 144 Portfolios | | Greenlight Capital Re, Ltd. (reinsurance company); Consol Energy, Inc. |
Robert C. Robb, Jr. 1945 | | Director (Since 2007) | | Partner, Lewis, Eckert, Robb and Company (management and financial consulting firm) since 1981 and Principal since 2010. | | 26 RICs consisting of 144 Portfolios | | None |
Mark Stalnecker 1951 | | Director (Since 2015) | | Chief Investment Officer, University of Delaware from 1999 to 2013; Trustee, Winterthur Museum and Country Estate from 2001 to 2015; Member of the Investment Committee, Delaware Public Employees’ Retirement System since 2002; Member of the Investment Committee, Christiana Care Health System since 2009; Member of the Investment Committee, Delaware Community Foundation from 2013 to 2014; Director, SEI Private Trust Co. from 2001 to 2014. | | 26 RICs consisting of 144 Portfolios | | None |
Kenneth L. Urish 1951 | | Director (Since 2007) | | Managing Partner, Urish Popeck & Co., LLC (certified public accountants and consultants) since 1976; Past-Chairman of the Professional Ethics Committee of the Pennsylvania Institute of Certified Public Accountants and Committee Member thereof since 2007; Member of External Advisory Board, The Pennsylvania State University Accounting Department since founding in 2001; Principal, UP Strategic Wealth Investment Advisors, LLC since 2013; Trustee, The Holy Family Institute from 2001 to 2010; President and Trustee, Pittsburgh Catholic Publishing Associates from 2003 to 2008; Director, Inter-Tel from 2006 to 2007. | | 26 RICs consisting of 144 Portfolios | | None |
Claire A. Walton 1957 | | Director (Since 2016) | | Chief Operating Officer and Chief Financial Officer of Liberty Square Asset Management, LP from 1998 to 2015; General Partner of Neon Liberty Capital Management, LLC since 2003; Director, Boston Hedge Fund Group since 2009; Director, Woodstock Ski Runners since 2013; Director, Massachusetts Council on Economic Education from 2013 to 2015. | | 26 RICs consisting of 144 Portfolios | | None |
Frederick W. Winter 1945 | | Director (Since 2007) | | Director, Alkon Corporation since 1992; Dean Emeritus of the Joseph M. Katz School of Business, University of Pittsburgh, Dean and Professor from 1997 to 2005, Professor until 2013. | | 26 RICs consisting of 144 Portfolios | | None |
| | | | | | |
| 38 | | BLACKROCK EVENT DRIVEN EQUITY FUND | | SEPTEMBER 30, 2017 | | |
| | | | |
| Director and Officer Information (continued) | | | | |
| | | | | | | | |
| | | | | Interested Directors(d) | | | | |
Name and
Year of Birth(b) | | Position(s)
Held
(Length of
Service)(c) | | Principal Occupation(s) During Past Five Years | | Number of BlackRock-
Advised Registered
Investment Companies
(“RICs”) Consisting of
Investment Portfolios
(“Portfolios”) Overseen | | Public
Directorships |
Barbara G. Novick 1960 | | Director (Since 2015) | | Vice Chairman of BlackRock, Inc. since 2006; Chair of BlackRock’s Government Relations Steering Committee since 2009; Head of the Global Client Group of BlackRock, Inc. from 1988 to 2008. | | 100 RICs consisting of 218 Portfolios | | None |
John M. Perlowski 1964 | | Director, President, and Chief Executive Officer (Since 2015) | | Managing Director of BlackRock, Inc. since 2009; Head of BlackRock Global Fund & Accounting Services since 2009; Managing Director and Chief Operating Officer of the Global Product Group at Goldman Sachs Asset Management, L.P. from 2003 to 2009; Treasurer of Goldman Sachs Mutual Funds from 2003 to 2009 and Senior Vice President thereof from 2007 to 2009; Director of Goldman Sachs Offshore Funds from 2002 to 2009; Advisory Director of Family Resource Network (charitable foundation) since 2009. | | 127 RICs consisting of 316 Portfolios | | None |
| | (a) The address of each Director is c/o BlackRock, Inc., 55 East 52nd Street, New York, NY 10055. (b) Independent Directors serve until their resignation, retirement, removal or death, or until December 31 of the year in which they turn 75. The Board may determine to extend the terms of Independent Directors on a case-by-case basis, as appropriate. (c) Following the combination of Merrill Lynch Investment Managers, L.P. (“MLIM”) and BlackRock, Inc. (“BlackRock”) in September 2006, the various legacy MLIM and legacy BlackRock fund boards were realigned and consolidated into three new fund boards in 2007. As a result, although the chart shows certain Independent Directors as joining the Board in 2007, those Independent Directors first became members of the boards of other legacy MLIM or legacy BlackRock funds as follows: Rodney D. Johnson, 1995; Cynthia A. Montgomery, 1994; Joseph P. Platt, 1999; Robert C. Robb, Jr., 1999; Kenneth L. Urish, 1999; and Frederick W. Winter, 1999. (d) Ms. Novick and Mr. Perlowski are both “interested persons,” as defined in the 1940 Act, of the Corporation based on their positions with BlackRock and its affiliates. Ms. Novick and Mr. Perlowski are also board members of certain complexes of BlackRock registered open-end and closed-end funds. Ms. Novick is a board member of the BlackRock Closed-End Complex and Mr. Perlowski is also a board member of the BlackRock Equity-Bond Complex and the BlackRock Closed-End Complex. |
| | | | | | |
| | | BLACKROCK EVENT DRIVEN EQUITY FUND | | SEPTEMBER 30, 2017 | | 39 |
| | | | |
| Director and Officer Information (concluded) | | | | |
| | | | |
| Officers Who Are Not Directors(a) |
Name
Year of Birth(b) | | Position(s) Held
(Length of Service) | | Principal Occupation(s) During Past Five Years |
Jennifer McGovern 1977 | | Vice President (Since 2014) | | Managing Director of BlackRock, Inc. since 2016; Director of BlackRock, Inc. from 2011 to 2015; Head of Product Structure and Oversight for BlackRock’s U.S. Wealth Advisory Group since 2013; Vice President of BlackRock, Inc. from 2008 to 2010. |
Neal J. Andrews 1966 | | Chief Financial Officer (Since 2007) | | Managing Director of BlackRock, Inc. since 2006; Senior Vice President and Line of Business Head of Fund Accounting and Administration at PNC Global Investment Servicing (U.S.) Inc. from 1992 to 2006. |
Jay M. Fife 1970 | | Treasurer (Since 2007) | | Managing Director of BlackRock, Inc. since 2007; Director of BlackRock, Inc. in 2006; Assistant Treasurer of the MLIM and Fund Asset Management, L.P. advised funds from 2005 to 2006; Director of MLIM Fund Services Group from 2001 to 2006. |
Charles Park 1967 | | Chief Compliance Officer (Since 2014) | | Anti-Money Laundering Compliance Officer for the BlackRock-advised Funds in the Equity-Bond Complex, the Equity-Liquidity Complex and the Closed-End Complex from 2014 to 2015; Chief Compliance Officer of BlackRock Advisors, LLC and the BlackRock-advised Funds in the Equity-Bond Complex, the Equity-Liquidity Complex and the Closed-End Complex since 2014; Principal of and Chief Compliance Officer for iShares® Delaware Trust Sponsor LLC since 2012 and BlackRock Fund Advisors (“BFA”) since 2006; Chief Compliance Officer for the BFA-advised iShares® exchange traded funds since 2006; Chief Compliance Officer for BlackRock Asset Management International Inc. since 2012. |
Fernanda Piedra 1969 | | Anti-Money Laundering Compliance Officer (Since 2015) | | Director of BlackRock, Inc. since 2014; Anti-Money Laundering Compliance Officer and Regional Head of Financial Crime for the Americas at BlackRock, Inc. since 2014; Head of Regulatory Changes and Remediation for the Asset Wealth Management Division of Deutsche Bank from 2010 to 2014; Vice President of Goldman Sachs (Anti-Money Laundering/Suspicious Activities Group) from 2004 to 2010. |
Benjamin Archibald 1975 | | Secretary (Since 2012) | | Managing Director of BlackRock, Inc. since 2014; Director of BlackRock, Inc. from 2010 to 2013; Secretary of the iShares® exchange traded funds since 2015; Secretary of the BlackRock-advised mutual funds since 2012. |
| | (a) The address of each Officer is c/o BlackRock, Inc., 55 East 52nd Street, New York, NY 10055. (b) Officers of the Corporation serve at the pleasure of the Board. |
| | Further information about the Corporation’s Officers and Directors is available in the Corporation’s Statement of Additional Information, which can be obtained without charge by calling 1-800-441-7762. |
| | | | | | |
| | | | |
Investment Adviser BlackRock Advisors, LLC Wilmington, DE 19809 | | Custodian Brown Brothers Harriman & Co. Boston, MA 02109 | | Distributor BlackRock Investments, LLC New York, NY 10022 | | Address of the Corporation 100 Bellevue Parkway Wilmington, DE 19809 |
| | | | | | |
Legal Counsel Sidley Austin LLP New York, NY 10019 | | Independent Registered Public Accounting Firm Deloitte & Touche LLP Philadelphia, PA 19103 | | Accounting Agent and Transfer Agent BNY Mellon Investment Servicing (US) Inc. Wilmington, DE 19809 | | |
| | | | | | |
| 40 | | BLACKROCK EVENT DRIVEN EQUITY FUND | | SEPTEMBER 30, 2017 | | |
Householding
The Fund will mail only one copy of shareholder documents, including prospectuses, annual and semi-annual reports and proxy statements, to shareholders with multiple accounts at the same address. This practice is commonly called “householding” and is intended to reduce expenses and eliminate duplicate mailings of shareholder documents. Mailings of your shareholder documents may be householded indefinitely unless you instruct us otherwise. If you do not want the mailing of these documents to be combined with those for other members of your household, please call the Fund at (800) 441-7762.
Availability of Quarterly Schedule of Investments
The Fund files its complete schedule of portfolio holdings with the Securities and Exchange Commission (“SEC”) for the first and third quarters of each fiscal year on Form N-Q. The Fund’s Form N-Q is available on the SEC’s website at http://www.sec.gov and may also be reviewed and copied at the SEC’s Public Reference Room in Washington, D.C. Information on how to access documents on the SEC’s website without charge may be obtained by calling (800) SEC-0330. The Fund’s Form N-Q may also be obtained upon request and without charge by calling (800) 441-7762.
Availability of Proxy Voting Policies and Procedures
A description of the policies and procedures that the Fund uses to determine how to vote proxies relating to portfolio securities is available upon request and without charge (1) by calling (800) 441-7762; (2) at http://www.blackrock.com; and (3) on the SEC’s website at http://www.sec.gov.
Availability of Proxy Voting Record
Information about how the Fund voted proxies relating to securities held in the Fund’s portfolio during the most recent 12-month period ended June 30 is available upon request and without charge (1) at http://www.blackrock.com; or by calling (800) 441-7762 and (2) on the SEC’s website at http://www.sec.gov.
BlackRock’s Mutual Fund Family
BlackRock offers a diverse lineup of open-end mutual funds crossing all investment styles and managed by experts in equity, fixed income and tax-exempt investing. Visit BlackRock online at http://www.blackrock.com for more information.
Account Information
Call us at (800) 441-7762 from 8:00 AM to 6:00 PM EST on any business day to get information about your account balances, recent transactions and share prices. You can also reach us on the Web at http://www.blackrock.com.
Automatic Investment Plans
Investor Class shareholders who want to invest regularly can arrange to have $50 or more automatically deducted from their checking or savings account and invested in any of the BlackRock funds.
Systematic Withdrawal Plan
Investor Class shareholders can establish a systematic withdrawal plan and receive periodic payments of $50 or more from their BlackRock funds, as long as their account balance is at least $10,000.
Retirement Plans
Shareholders may make investments in conjunction with Traditional, Rollover, Roth, Coverdell, Simple IRAs, SEP IRAs and 403(b) Plans.
| | | | | | |
| | | BLACKROCK EVENT DRIVEN EQUITY FUND | | SEPTEMBER 30, 2017 | | 41 |
| | | | |
| Additional Information (concluded) | | | | |
|
| BlackRock Privacy Principles |
BlackRock is committed to maintaining the privacy of its current and former fund investors and individual clients (collectively, “Clients”) and to safeguarding their non-public personal information. The following information is provided to help you understand what personal information BlackRock collects, how we protect that information and why in certain cases we share such information with select parties.
If you are located in a jurisdiction where specific laws, rules or regulations require BlackRock to provide you with additional or different privacy-related rights beyond what is set forth below, then BlackRock will comply with those specific laws, rules or regulations.
BlackRock obtains or verifies personal non-public information from and about you from different sources, including the following: (i) information we receive from you or, if applicable, your financial intermediary, on applications, forms or other documents; (ii) information about your transactions with us, our affiliates, or others; (iii) information we receive from a consumer reporting agency; and (iv) from visits to our websites.
BlackRock does not sell or disclose to non-affiliated third parties any non-public personal information about its Clients, except as permitted by law or as is necessary to respond to regulatory requests or to service Client accounts. These non-affiliated third parties are required to protect the confidentiality and security of this information and to use it only for its intended purpose.
We may share information with our affiliates to service your account or to provide you with information about other BlackRock products or services that may be of interest to you. In addition, BlackRock restricts access to non-public personal information about its Clients to those BlackRock employees with a legitimate business need for the information. BlackRock maintains physical, electronic and procedural safeguards that are designed to protect the non-public personal information of its Clients, including procedures relating to the proper storage and disposal of such information.
| | | | | | |
| 42 | | BLACKROCK EVENT DRIVEN EQUITY FUND | | SEPTEMBER 30, 2017 | | |
This report is intended for current holders. It is not authorized for use as an offer of sale or a solicitation of an offer to buy shares of the Fund unless preceded or accompanied by the Fund’s current prospectus. Past performance results shown in this report should not be considered a representation of future performance. Investment returns and principal value of shares will fluctuate so that shares, when redeemed, may be worth more or less than their original cost. Statements and other information herein are as dated and are subject to change.

| | |
| |
EDE-9/17-AR | |  |
| Item 2 – | Code of Ethics – The registrant (or the “Fund”) has adopted a code of ethics, as of the end of the period covered by this report, applicable to the registrant’s principal executive officer, principal financial officer, principal accounting officer or controller, or persons performing similar functions. During the period covered by this report, the code of ethics was amended to clarify an inconsistency as to whom persons covered by the code should report suspected violations of the code. The amendment clarifies that such reporting should be made to BlackRock’s General Counsel, and retains the alternative option of anonymous reporting following “whistleblower” policies. Other non-material changes were also made in connection with this amendment. During the period covered by this report, there have been no waivers granted under the code of ethics. The registrant undertakes to provide a copy of the code of ethics to any person upon request, without charge, who calls 1-800-441-7762. |
| Item 3 – | Audit Committee Financial Expert – The registrant’s board of directors (the “board of directors”), has determined that (i) the registrant has the following audit committee financial expert serving on its audit committee and (ii) each audit committee financial expert is independent: |
| | Under applicable securities laws, a person determined to be an audit committee financial expert will not be deemed an “expert” for any purpose, including without limitation for the purposes of Section 11 of the Securities Act of 1933, as a result of being designated or identified as an audit committee financial expert. The designation or identification of a person as an audit committee financial expert does not impose on such person any duties, obligations, or liabilities greater than the duties, obligations, and liabilities imposed on such person as a member of the audit committee and board of directors in the absence of such designation or identification. |
| Item 4 – | Principal Accountant Fees and Services |
| | The following table presents fees billed by Deloitte & Touche LLP (“D&T”) in each of the last two fiscal years for the services rendered to the Fund: |
| | | | | | | | | | | | | | | | |
| | (a) Audit Fees | | (b) Audit-Related Fees1 | | (c) Tax Fees2 | | (d) All Other Fees |
| Entity Name | | Current
Fiscal Year
End | | Previous
Fiscal Year
End | | Current
Fiscal Year
End | | Previous
Fiscal Year
End | | Current
Fiscal Year
End | | Previous
Fiscal Year
End | | Current
Fiscal Year
End | | Previous
Fiscal Year
End |
BlackRock Event Driven Equity Fund | | $29,325 | | $33,673 | | $0 | | $4,000 | | $13,107 | | $13,107 | | $0 | | $0 |
| | The following table presents fees billed by D&T that were required to be approved by the registrant’s audit committee (the “Committee”) for services that relate directly to the operations or financial reporting of the Fund and that are rendered on behalf of BlackRock Advisors, LLC (“Investment Adviser” or “BlackRock”) and entities controlling, controlled by, or under common control with BlackRock (not including any sub-adviser whose role is primarily portfolio management and is subcontracted with or overseen by another investment adviser) that provide ongoing services to the Fund (“Affiliated Service Providers”): |
| | | | |
| | | Current Fiscal Year End | | Previous Fiscal Year End |
(b) Audit-Related Fees1 | | $0 | | $0 |
(c) Tax Fees2 | | $0 | | $0 |
(d) All Other Fees3 | | $2,129,000 | | $2,154,000 |
2
1 The nature of the services includes assurance and related services reasonably related to the performance of the audit or review of financial statements not included in Audit Fees, including accounting consultations, agreed-upon procedure reports, attestation reports, comfort letters, out-of-pocket expenses and internal control reviews not required by regulators.
2 The nature of the services includes tax compliance and/or tax preparation, including services relating to the filing or amendment of federal, state or local income tax returns, regulated investment company qualification reviews, taxable income and tax distribution calculations.
3 Non-audit fees of $2,129,000 and $2,154,000 for the current fiscal year and previous fiscal year, respectively, were paid to the Fund’s principal accountant in their entirety by BlackRock, in connection with services provided to the Affiliated Service Providers of the Fund and of certain other funds sponsored and advised by BlackRock or its affiliates for a service organization review and an accounting research tool subscription. These amounts represent aggregate fees paid by BlackRock and were not allocated on a per fund basis.
(e)(1) Audit Committee Pre-Approval Policies and Procedures:
The Committee has adopted policies and procedures with regard to the pre-approval of services. Audit, audit-related and tax compliance services provided to the registrant on an annual basis require specific pre-approval by the Committee. The Committee also must approve other non-audit services provided to the registrant and those non-audit services provided to the Investment Adviser and Affiliated Service Providers that relate directly to the operations and the financial reporting of the registrant. Certain of these non-audit services that the Committee believes are (a) consistent with the SEC’s auditor independence rules and (b) routine and recurring services that will not impair the independence of the independent accountants may be approved by the Committee without consideration on a specific case-by-case basis (“general pre-approval”). The term of any general pre-approval is 12 months from the date of the pre-approval, unless the Committee provides for a different period. Tax or other non-audit services provided to the registrant which have a direct impact on the operations or financial reporting of the registrant will only be deemed pre-approved provided that any individual project does not exceed $10,000 attributable to the registrant or $50,000 per project. For this purpose, multiple projects will be aggregated to determine if they exceed the previously mentioned cost levels.
Any proposed services exceeding the pre-approved cost levels will require specific pre-approval by the Committee, as will any other services not subject to general pre-approval (e.g., unanticipated but permissible services). The Committee is informed of each service approved subject to general pre-approval at the next regularly scheduled in-person board meeting. At this meeting, an analysis of such services is presented to the Committee for ratification. The Committee may delegate to the Committee Chairman the authority to approve the provision of and fees for any specific engagement of permitted non-audit services, including services exceeding pre-approved cost levels.
(e)(2) None of the services described in each of Items 4(b) through (d) were approved by the Committee pursuant to the de minimus exception in paragraph (c)(7)(i)(C) of Rule 2-01 of Regulation S-X.
(f) Not Applicable
(g) The aggregate non-audit fees, defined as the sum of the fees shown under “Audit-Related Fees,” “Tax Fees” and “All Other Fees,” paid to the accountant for services rendered by the accountant to the registrant, the Investment Adviser and the Affiliated Service Providers were:
| | | | |
| Entity Name | | Current Fiscal Year End | | Previous Fiscal Year End |
BlackRock Event Driven Equity Fund | | $13,107 | | $17,107 |
3
Additionally, the amounts billed by D&T in connection with services provided to the Affiliated Service Providers of the Fund and of other funds sponsored and advised by BlackRock or its affiliates during the current and previous fiscal years for a service organization review and an accounting research tool subscription were:
| | |
Current Fiscal Year End | | Previous Fiscal Year End |
$2,129,000 | | $2,154,000 |
These amounts represent aggregate fees paid by BlackRock and were not allocated on a per fund basis.
(h) The Committee has considered and determined that the provision of non-audit services that were rendered to the Investment Adviser and the Affiliated Service Providers that were not pre-approved pursuant to paragraph (c)(7)(ii) of Rule 2-01 of Regulation S-X is compatible with maintaining the principal accountant’s independence.
| Item 5 – | Audit Committee of Listed Registrants – Not Applicable |
(a) The registrant’s Schedule of Investments is included as part of the Report to Stockholders filed under Item 1 of this Form.
(b) Not Applicable due to no such divestments during the semi-annual period covered since the previous Form N-CSR filing.
| Item 7 – | Disclosure of Proxy Voting Policies and Procedures for Closed-End Management Investment Companies – Not Applicable |
| Item 8 – | Portfolio Managers of Closed-End Management Investment Companies – Not Applicable |
| Item 9 – | Purchases of Equity Securities by Closed-End Management Investment Company and Affiliated Purchasers – Not Applicable |
| Item 10 – | Submission of Matters to a Vote of Security Holders – There have been no material changes to these procedures. |
| Item 11 – | Controls and Procedures |
(a) The registrant’s principal executive and principal financial officers, or persons performing similar functions, have concluded that the registrant’s disclosure controls and procedures (as defined in Rule 30a-3(c) under the Investment Company Act of 1940, as amended (the “1940 Act”)) are effective as of a date within 90 days of the filing of this report based on the evaluation of these controls and procedures required by Rule 30a-3(b) under the 1940 Act and Rule 15d-15(b) under the Securities Exchange Act of 1934, as amended.
(b) There were no changes in the registrant’s internal control over financial reporting (as defined in Rule 30a-3(d) under the 1940 Act) that occurred during the second fiscal quarter of the period covered by this report that have materially affected, or are reasonably likely to materially affect, the registrant’s internal control over financial reporting.
4
| Item 12 – | Disclosure of Securities Lending Activities for Closed-End Management Investment Companies – Not Applicable to the registrant |
| Item 13 – | Exhibits attached hereto |
(a)(1) Code of Ethics – See Item 2
(a)(2) Certifications – Attached hereto
(a)(3) Not Applicable
(a)(4) Not Applicable
(b) Certifications – Attached hereto
5
Pursuant to the requirements of the Securities Exchange Act of 1934 and the Investment Company Act of 1940, the registrant has duly caused this report to be signed on its behalf by the undersigned, thereunto duly authorized.
| | | | |
| | BlackRock Large Cap Series Funds, Inc. |
| | |
| | | By: | | /s/ John M. Perlowski |
| | | | John M. Perlowski |
| | | | Chief Executive Officer (principal executive officer) of |
| | | | BlackRock Large Cap Series Funds, Inc. |
| |
| | Date: December 5, 2017 |
| | | | |
| | Pursuant to the requirements of the Securities Exchange Act of 1934 and the Investment Company Act of 1940, this report has been signed below by the following persons on behalf of the registrant and in the capacities and on the dates indicated. |
| | | | |
| | | By: | | /s/ John M. Perlowski |
| | | | John M. Perlowski |
| | | | Chief Executive Officer (principal executive officer) of |
| | | | BlackRock Large Cap Series Funds, Inc. |
| |
| | Date: December 5, 2017 |
| | |
| | By: | | /s/ Neal J. Andrews |
| | | | Neal J. Andrews |
| | | | Chief Financial Officer (principal financial officer) of |
| | | | BlackRock Large Cap Series Funds, Inc. |
| |
| | Date: December 5, 2017 |
6