UNITED STATES
SECURITIES AND EXCHANGE COMMISSION
Washington, D.C. 20549
FORM N-CSR
CERTIFIED SHAREHOLDER REPORT OF REGISTERED MANAGEMENT INVESTMENT
COMPANIES
Investment Company Act file number: 811-09637
Name of Fund: BlackRock Large Cap Series Funds, Inc.
BlackRock Event Driven Equity Fund
Fund Address: 100 Bellevue Parkway, Wilmington, DE 19809
Name and address of agent for service: John M. Perlowski, Chief Executive Officer, BlackRock Large Cap Series Funds, Inc., 55 East 52nd Street, New York, NY 10055
Registrant’s telephone number, including area code: (800) 441-7762
Date of fiscal year end: 09/30/2018
Date of reporting period: 09/30/2018
Item 1 – Report to Stockholders
SEPTEMBER 30, 2018
| | |
ANNUAL REPORT | |  |
BlackRock Large Cap Series Funds, Inc.
| | ▶ | | BlackRock Event Driven Equity Fund |
| | |
| | | Not FDIC Insured § May Lose Value § No Bank Guarantee |
The Markets in Review
Dear Shareholder,
In the 12 months ended September 30, 2018, the strongest corporate profits in seven years drove the equity market higher, while rising interest rates constrained bond returns. Though the market’s appetite for risk remained healthy, risk-taking was tempered somewhat, as shorter-term, higher-quality securities led the bond market, and U.S. equities outperformed most international stock markets.
Volatility in emerging market stocks rose as U.S.-China trade relations and debt concerns adversely affected the Chinese stock market, while Turkey and Argentina became embroiled in currency crises, largely due to hyperinflation in both countries. An economic slowdown in Europe led to modest performance for European equities.
Short-term U.S. Treasury interest rates rose the fastest, while longer-term rates slightly increased, leading to a negative return for long-term U.S. Treasuries and a substantial flattening of the yield curve. Many investors are concerned with the flattening yield curve as a harbinger of recession, but given the extraordinary monetary measures in the last decade, we believe a more accurate barometer for the economy is the returns along the risk spectrums in stock and bond markets. Although the fundamentals in credit markets remained relatively solid, investment-grade bonds declined slightly, and high-yield bonds posted modest returns.
In response to rising growth and inflation, the U.S. Federal Reserve (the “Fed”) increased short-term interest rates four times during the reporting period. The Fed also continued to reduce its balance sheet during the reporting period, gradually reversing the unprecedented stimulus measures it enacted after the financial crisis. Meanwhile, the European Central Bank announced that its bond-purchasing program would conclude at the end of the year, while also expressing its commitment to low interest rates. In contrast, the Bank of Japan continued to expand its balance sheet through bond purchasing while lowering its expectations for inflation.
The U.S. economy continued to gain momentum despite the Fed’s modest reduction of economic stimulus; unemployment declined to 3.7%, the lowest rate of unemployment in almost 50 years. The number of job openings reached a record high of more than 7 million, which exceeded the total number of unemployed workers. Strong economic performance has justified the Fed’s somewhat faster pace of rate hikes, as the headline inflation rate and investors’ expectations for inflation have already surpassed the Fed’s target of 2.0%.
While markets have recently focused on the risk of rising long-term interest rates, we continue to believe the primary risk to economic expansion is trade protectionism that could lead to slower global trade and unintended consequences for the globalized supply chain. So far, U.S. tariffs have only had a modest negative impact on economic growth, but the fear of an escalating trade war has stifled market optimism somewhat, leading to higher volatility in risk assets. The outcome of trade negotiations between the United States and China is likely to influence the global growth trajectory and set the tone for free trade in many other nations. Any easing of tensions could lead to greater upside for markets, while additional tariffs could adversely affect investor sentiment.
In this environment, investors need to think globally, extend their scope across a broad array of asset classes, and be nimble as market conditions change. We encourage you to talk with your financial advisor and visit blackrock.com for further insight about investing in today’s markets.
Sincerely,

Rob Kapito
President, BlackRock Advisors, LLC

Rob Kapito
President, BlackRock Advisors, LLC
| | | | |
| Total Returns as of September 30, 2018 |
| | | 6-month | | 12-month |
U.S. large cap equities
(S&P 500® Index) | | 11.41% | | 17.91% |
U.S. small cap equities
(Russell 2000® Index) | | 11.61 | | 15.24 |
International equities
(MSCI Europe, Australasia, Far East Index) | | 0.10 | | 2.74 |
Emerging market equities
(MSCI Emerging Markets Index) | | (8.97) | | (0.81) |
3-month Treasury bills
(ICE BofAML 3-Month U.S. Treasury Bill Index) | | 0.95 | | 1.59 |
U.S. Treasury securities
(ICE BofAML 10-Year U.S. Treasury Index) | | (1.40) | | (4.02) |
U.S. investment grade
bonds (Bloomberg Barclays U.S. Aggregate Bond Index) | | (0.14) | | (1.22) |
Tax-exempt municipal
bonds (S&P Municipal
Bond Index) | | 0.77 | | 0.48 |
U.S. high yield bonds
(Bloomberg Barclays U.S. Corporate High Yield 2% Issuer Capped Index) | | 3.46 | | 3.05 |
| Past performance is no guarantee of future results. Index performance is shown for illustrative purposes only. You cannot invest directly in an index. |
| | |
| 2 | | T H I S P A G E I S N O T P A R T O F Y O U R F U N D R E P O R T |
Table of Contents

| | |
Fund Summary as of September 30, 2018 | | BlackRock Event Driven Equity Fund |
Investment Objective
BlackRock Event Driven Equity Fund’s (the “Fund”) investment objective is to seek long-term capital growth.
Portfolio Management Commentary
How did the Fund perform?
For the 12-month period ended September 30, 2018, the Fund outperformed the ICE BofAML 3-Month U.S. Treasury Bill Index and underperformed the Russell 1000® Index.
What factors influenced performance?
The Fund diversifies across hard catalyst (publicly announced transactions or restructurings), soft catalyst (companies undergoing meaningful corporate events expected to change their share prices) and credit opportunities.
The leading positive contributor to the Fund’s performance was positioning in Twenty-First Century Fox (“Fox”) and Sky PLC (“Sky”). After AT&T defeated the Department of Justice at trial and was allowed to complete its Time Warner acquisition, the investment adviser anticipated increased consolidation in the media space and increased competition for the few remaining scaled assets. Comcast and Disney subsequently entered into aggressive bidding wars for Fox and Sky during the period, and the Fund was well positioned to rapidly capitalize on the dynamics.
The primary detractor over the 12 months was an investment in the Qualcomm/NXP Semiconductors merger as trade tensions between the United States and China delayed approval by Chinese regulators. While the investment adviser strongly believed all parties were incentivized to ultimately push to a successful conclusion, the transaction was terminated in July.
Describe recent portfolio activity.
The Fund maintained its low beta return profile (beta measures the Fund’s sensitivity to market movements). The Fund’s realized beta to the S&P 500® Index since inception was 0.21 at the end of the period (1.00 indicates market-level sensitivity). Over the period, the Fund reduced exposure to hard catalyst and soft catalyst investments and increased exposure to credit opportunities.
The Fund held derivatives during the period as part of its investment strategy. Equity total return swaps were used by the investment adviser as the primary instrument to gain exposure to merger arbitrage situations. As a result, cash and cash equivalents are not representative of unencumbered cash, and the portfolio was fully invested with a gross exposure of 114% as of September 30, 2018. The Fund’s use of derivatives had a positive effect on Fund performance.
Describe portfolio positioning at period end.
At period end, the Fund was diversified across 71 hard catalyst, soft catalyst and credit investments. Given the current robust opportunity set in mergers, the Fund is invested predominantly in hard catalyst situations (78% of portfolio) with soft catalyst positions (9%) and credit investments (14%) rounding out the portfolio. The Fund’s exposure was skewed to the United States, with 87% of exposure in North America, 9% in developed Europe and 4% in developed Asia. The Fund was diversified across sectors and market capitalizations.
The views expressed reflect the opinions of BlackRock as of the date of this report and are subject to change based on changes in market, economic or other conditions. These views are not intended to be a forecast of future events and are no guarantee of future results.
Portfolio Information
| | | | | | | | | | | | |
| | | Percent of Total Investments(a) | |
| |
Sector Allocation | | | Long | | | | Short | | | | Total | |
| |
Health Care | | | 22% | | | | 8% | | | | 30% | |
Information Technology | | | 13 | | | | 3 | | | | 16 | |
Industrials | | | 9 | | | | 2 | | | | 11 | |
Financials | | | 6 | | | | 2 | | | | 8 | |
Real Estate | | | 8 | | | | — | | | | 8 | |
Energy | | | 4 | | | | 3 | | | | 7 | |
Consumer Discretionary | | | 6 | | | | 1 | | | | 7 | |
Consumer Staples | | | 5 | | | | 2 | | | | 7 | |
Investment Companies | | | 2 | | | | 1 | | | | 3 | |
Telecommunication Services | | | 3 | | | | — | | | | 3 | |
Materials | | | — | (b) | | | — | (b) | | | — | (b) |
| | | | | | | | | | | | |
| | | 78% | | | | 22% | | | | 100% | |
| | | | | | | | | | | | |
| |
| | (a) | Total investments include the gross notional values of long and short equity securities of the underlying derivative contracts utilized by the Fund and exclude short-term securities. | |
| | (b) | Amount is less than 1%. | |
| | |
| 4 | | 2 0 1 8 B L A C K R O C K A N N U A L R E P O R T T O S H A R E H O L D E R S |
| | |
| Fund Summary as of September 30, 2018 (continued) | | BlackRock Event Driven Equity Fund |
TOTAL RETURN BASED ON A $10,000 INVESTMENT
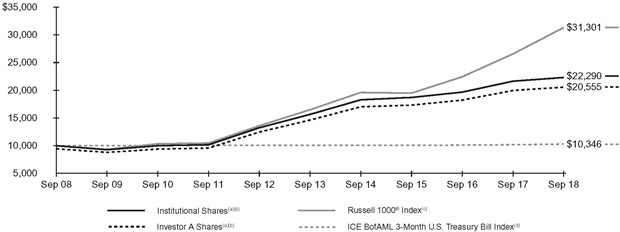
| (a) | Assuming maximum sales charges, if any, transaction costs and other operating expenses, including investment advisory fees. Institutional Shares do not have a sales charge. |
| (b) | Under normal circumstances, the Fund invests at least 80% of its net assets (plus any borrowings for investment purposes) in equity securities and related derivative instruments with similar economic characteristics. The Fund’s total returns prior to May 8, 2015 are the returns of the Fund when it utilized different investment strategies under the name BlackRock Large Cap Core Plus Fund. |
| (c) | An index that measures the performance of the large cap segment of the U.S. equity universe. It is a subset of the Russell 3000® Index and includes approximately 1,000 of the largest securities based on a combination of their market capitalization and current index membership. The index represents approximately 92% of the total market capitalization of the Russell 3000® Index. |
| (d) | An unmanaged index that tracks 3-month U.S. Treasury securities. |
Performance Summary for the Period Ended September 30, 2018
| | | | | | | | | | | | | | | | | | | | | | | | | | | | | | | | | | | | | | | | |
| | | | | | | | | Average Annual Total Returns(a)(b) | |
| | | | | | | | | 1 Year | | | | | | 5 Years | | | | | | 10 Years | |
| | | 6-Month
Total Returns | | | | | | w/o sales
charge | | | w/sales
charge | | | | | | w/o sales
charge | | | w/sales
charge | | | | | | w/o sales
charge | | | w/sales
charge | |
Institutional | | | 4.10% | | | | | | | | 3.04% | | | | N/A | | | | | | | | 7.29% | | | | N/A | | | | | | | | 8.35% | | | | N/A | |
Investor A | | | 4.03 | | | | | | | | 2.86 | | | | (2.54 | )% | | | | | | | 7.02 | | | | 5.87% | | | | | | | | 8.05 | | | | 7.47% | |
Investor C | | | 3.56 | | | | | | | | 2.06 | | | | 1.08 | | | | | | | | 6.23 | | | | 6.23 | | | | | | | | 7.27 | | | | 7.27 | |
Russell 1000® Index | | | 11.25 | | | | | | | | 17.76 | | | | N/A | | | | | | | | 13.67 | | | | N/A | | | | | | | | 12.09 | | | | N/A | |
ICE BofAML 3-Month U.S. Treasury Bill Index | | | 0.95 | | | | | | | | 1.59 | | | | N/A | | | | | | | | 0.52 | | | | N/A | | | | | | | | 0.34 | | | | N/A | |
| | (a) | Assuming maximum sales charges, if any. Average annual total returns with and without sales charges reflect reductions for distribution and service fees. See “About Fund Performance” on page 6 for a detailed description of share classes, including any related sales charges and fees. | |
| | (b) | Under normal circumstances, the Fund invests at least 80% of its net assets (plus any borrowings for investment purposes) in equity securities and related derivative instruments with similar economic characteristics. The Fund’s total returns prior to May 8, 2015 are the returns of the Fund when it utilized different investment strategies under the name BlackRock Large Cap Core Plus Fund. | |
N/A — Not applicable as share class and index do not have a sales charge.
Past performance is not indicative of future results.
Performance results may include adjustments made for financial reporting purposes in accordance with U.S. generally accepted accounting principles.
Expense Example
| | | | | | | | | | | | | | | | | | | | | | | | | | | | | | | | | | | | |
| | | Actual | | | | | Hypothetical(c) | |
| | | | | | | | | Expenses Paid During the Period | | | | | | | | Including
Interest Expense | | | Excluding
Interest Expense | |
| | | Beginning
Account Value
(04/01/18) | | | Ending
Account Value
(09/30/18) | | | Including
Interest Expense(a) | | Excluding
Interest Expense(b) | | | | | Beginning
Account Value
(04/01/18) | | | Ending
Account Value
(09/30/18) | | | Expenses
Paid During
the Period(a) | | | Ending
Account Value
(09/30/18) | | | Expenses
Paid During
the Period(b) | |
| |
Institutional | | | $1,000.00 | | | | $1,041.00 | | | $ 6.99 | | $ 6.66 | | | | | | | $1,000.00 | | | | $1,018.49 | | | | $ 6.91 | | | | $1,018.82 | | | | $ 6.58 | |
Investor A | | | 1,000.00 | | | | 1,040.30 | | | 8.13 | | 8.06 | | | | | | | 1,000.00 | | | | 1,017.38 | | | | 8.04 | | | | 1,017.44 | | | | 7.97 | |
Investor C | | | 1,000.00 | | | | 1,035.60 | | | 12.00 | | 11.81 | | | | | | | 1,000.00 | | | | 1,013.55 | | | | 11.87 | | | | 1,013.74 | | | | 11.68 | |
| | (a) | For each class of the Fund, expenses are equal to the annualized expense ratio for the class (1.35% for Institutional, 1.57% for Investor A, and 2.33% for Investor C), multiplied by the average account value over the period, multiplied by 183/365 (to reflect the one-half year period shown). | |
| | (b) | For each class of the Fund, expenses are equal to the annualized expense ratio for the class (1.29% for Institutional, 1.56% for Investor A, and 2.29% for Investor C), multiplied by the average account value over the period, multiplied by 183/365 (to reflect the one-half year period shown). | |
| | (c) | Hypothetical 5% annual return before expenses is calculated by prorating the number of days in the most recent fiscal half year divided by 365. | |
| See | “Disclosure of Expenses” on page 6 for further information on how expenses were calculated. | |
| | |
| About Fund Performance | | BlackRock Event Driven Equity Fund |
Institutional Shares are not subject to any sales charge. These shares bear no ongoing distribution or service fees and are available only to certain eligible investors.
Investor A Shares are subject to a maximum initial sales charge (front-end load) of 5.25% and a service fee of 0.25% per year (but no distribution fee). Certain redemptions of these shares may be subject to a contingent deferred sales charge (“CDSC”) where no initial sales charge was paid at the time of purchase. These shares are generally available through financial intermediaries.
Investor C Shares are subject to a 1.00% CDSC if redeemed within one year of purchase. In addition, these shares are subject to a distribution fee of 0.75% per year and a service fee of 0.25% per year. These shares are generally available through financial intermediaries. Effective November 8, 2018, the Fund will adopt an automatic conversion feature whereby Investor C Shares will be automatically converted into Investor A Shares after a conversion period of approximately ten years, and, thereafter, investors will be subject to lower ongoing fees.
Performance information reflects past performance and does not guarantee future results. Current performance may be lower or higher than the performance data quoted. Refer to www.blackrock.com to obtain performance data current to the most recent month-end. Performance results do not reflect the deduction of taxes that a shareholder would pay on fund distributions or the redemption of fund shares. Figures shown in the performance tables on the previous page assume reinvestment of all distributions, if any, at net asset value (“NAV”) on the ex-dividend date. Investment return and principal value of shares will fluctuate so that shares, when redeemed, may be worth more or less than their original cost. Distributions paid to each class of shares will vary because of the different levels of service, distribution and transfer agency fees applicable to each class, which are deducted from the income available to be paid to shareholders.
BlackRock Advisors, LLC (the “Manager”), the Fund’s investment adviser, has contractually agreed to waive and/or reimburse a portion of the Fund’s expenses. Without such waiver and/or reimbursement, the Fund’s performance would have been lower. The Manager is under no obligation to continue waiving and/or reimbursing its fees after the applicable termination date of such agreement. See Note 6 of the Notes to Financial Statements for additional information on waivers and/or reimbursements.
Disclosure of Expenses
Shareholders of the Fund may incur the following charges: (a) transactional expenses, such as sales charges; and (b) operating expenses, including investment advisory fees, service and distribution fees, including 12b-1 fees, acquired fund fees and expenses, and other fund expenses. The expense example shown on the previous page (which is based on a hypothetical investment of $1,000 invested on April 1, 2018 and held through September 30, 2018) is intended to assist shareholders both in calculating expenses based on an investment in the Fund and in comparing these expenses with similar costs of investing in other mutual funds.
The expense example provides information about actual account values and actual expenses. In order to estimate the expenses a shareholder paid during the period covered by this report, shareholders can divide their account value by $1,000 and then multiply the result by the number corresponding to their share class under the heading entitled “Expenses Paid During the Period.”
The expense example also provides information about hypothetical account values and hypothetical expenses based on the Fund’s actual expense ratio and an assumed rate of return of 5% per year before expenses. In order to assist shareholders in comparing the ongoing expenses of investing in the Fund and other funds, compare the 5% hypothetical examples with the 5% hypothetical examples that appear in shareholder reports of other funds.
The expenses shown in the expense example are intended to highlight shareholders’ ongoing costs only and do not reflect transactional expenses, such as sales charges, if any. Therefore, the hypothetical example is useful in comparing ongoing expenses only, and will not help shareholders determine the relative total expenses of owning different funds. If these transactional expenses were included, shareholder expenses would have been higher.
Derivative Financial Instruments
The Fund may invest in various derivative financial instruments. These instruments are used to obtain exposure to a security, commodity, index, market, and/or other assets without owning or taking physical custody of securities, commodities and/or other referenced assets or to manage market, equity, credit, interest rate, foreign currency exchange rate, commodity and/or other risks. Derivative financial instruments may give rise to a form of economic leverage and involve risks, including the imperfect correlation between the value of a derivative financial instrument and the underlying asset, possible default of the counterparty to the transaction or illiquidity of the instrument. The Fund’s successful use of a derivative financial instrument depends on the investment adviser’s ability to predict pertinent market movements accurately, which cannot be assured. The use of these instruments may result in losses greater than if they had not been used, may limit the amount of appreciation the Fund can realize on an investment and/or may result in lower distributions paid to shareholders. The Fund’s investments in these instruments, if any, are discussed in detail in the Notes to Financial Statements.
| | |
| 6 | | 2 0 1 8 B L A C K R O C K A N N U A L R E P O R T T O S H A R E H O L D E R S |
| | |
Schedule of Investments September 30, 2018 | | BlackRock Event Driven Equity Fund (Percentages shown are based on Net Assets) |
| | | | | | | | |
| Security | | Shares | | | Value | |
| Common Stocks — 3.0% | |
|
Aerospace & Defense — 0.6% | |
Arconic, Inc. | | | 206,929 | | | $ | 4,554,507 | |
Bombardier, Inc., Class B (a) | | | 25,000 | | | | 89,033 | |
| | | | | | | | |
| | | | | | | 4,643,540 | |
| Banks — 0.0% | |
Valley National Bancorp | | | 35,532 | | | | 399,735 | |
| | | | | | | | |
| Biotechnology — 0.0% | |
Sutro Biopharma, Inc. (a) | | | 25,781 | | | | 386,715 | |
| | | | | | | | |
| Chemicals — 0.2% | |
Akzo Nobel NV | | | 6,620 | | | | 619,256 | |
Axalta Coating Systems Ltd. (a) | | | 9,702 | | | | 282,910 | |
DowDuPont, Inc. | | | 2,199 | | | | 141,418 | |
Olin Corp. | | | 19,694 | | | | 505,742 | |
| | | | | | | | |
| | | | | | | 1,549,326 | |
| Diversified Telecommunication Services — 0.1% | |
Intelsat SA (a) | | | 20,000 | | | | 600,000 | |
| | | | | | | | |
| Equity Real Estate Investment Trusts (REITs) — 0.1% | |
VEREIT, Inc. | | | 46,089 | | | | 334,606 | |
VICI Properties, Inc. | | | 33,744 | | | | 729,545 | |
| | | | | | | | |
| | | | | | | 1,064,151 | |
| Food & Staples Retailing — 0.1% | |
Walgreens Boots Alliance, Inc. | | | 11,181 | | | | 815,095 | |
| | | | | | | | |
| Food Products — 0.0% | |
Kraft Heinz Co. | | | 7,118 | | | | 392,273 | |
| | | | | | | | |
| Health Care Equipment & Supplies — 0.2% | |
Cooper Cos., Inc. (b) | | | 1,941 | | | | 537,948 | |
Danaher Corp. | | | 7,936 | | | | 862,326 | |
| | | | | | | | |
| | | | | | | 1,400,274 | |
| Health Care Providers & Services — 0.1% | |
Anthem, Inc. | | | 166 | | | | 45,492 | |
Brookdale Senior Living, Inc. (a) | | | 9,889 | | | | 97,209 | |
Cigna Corp. | | | 3,656 | | | | 761,362 | |
| | | | | | | | |
| | | | | | | 904,063 | |
| Machinery — 0.0% | |
Fortive Corp. | | | 2,316 | | | | 195,007 | |
| | | | | | | | |
| Media — 0.2% | |
Charter Communications, Inc., Class A (a) | | | 3,280 | | | | 1,068,886 | |
Discovery, Inc., Class A (a) | | | 10,576 | | | | 338,432 | |
| | | | | | | | |
| | | | | | | 1,407,318 | |
| Oil, Gas & Consumable Fuels — 0.3% | |
Williams Cos., Inc. | | | 99,388 | | | | 2,702,360 | |
| | | | | | | | |
| Personal Products — 0.2% | |
Coty, Inc., Class A | | | 127,035 | | | | 1,595,560 | |
| | | | | | | | |
| Pharmaceuticals — 0.2% | |
Arvinas, Inc. (a) | | | 22,269 | | | | 375,678 | |
Pfizer, Inc. | | | 19,342 | | | | 852,402 | |
| | | | | | | | |
| | | | | | | 1,228,080 | |
| Semiconductors & Semiconductor Equipment — 0.6% | |
Broadcom, Inc. | | | 4,982 | | | | 1,229,209 | |
QUALCOMM, Inc. | | | 46,004 | | | | 3,313,668 | |
| | | | | | | | |
| | | | | | | 4,542,877 | |
| Wireless Telecommunication Services — 0.1% | |
T-Mobile U.S., Inc. (a) | | | 11,967 | | | | 839,844 | |
| | | | | | | | |
Total Common Stocks — 3.0%
(Cost: $23,349,291) | | | | 24,666,218 | |
| | | | | | | | |
| | | | | | | | |
| Security | | Par (000) | | | Value | |
| Corporate Bonds — 8.7% | |
|
Aerospace & Defense — 1.1% | |
Bombardier, Inc. : | |
7.75%, 03/15/20 (c) | | $ | 2,000 | | | $ | 2,091,250 | |
6.13%, 01/15/23 (c) | | | 1,330 | | | | 1,335,819 | |
7.50%, 03/15/25 (c) | | | 5,250 | | | | 5,414,063 | |
| | | | | | | | |
| | | | | | | 8,841,132 | |
| Banks — 0.3% | |
Comstock Escrow Corp., 9.75%, 08/15/26 (c) | | | 2,750 | | | | 2,743,950 | |
| | | | | | | | |
| Diversified Financial Services — 2.2% | |
Altice Finco SA, 8.13%, 01/15/24 (c) | | | 1,400 | | | | 1,412,250 | |
Intelsat Connect Finance SA, 9.50%, 02/15/23 (c) | | | 6,430 | | | | 6,397,850 | |
Intelsat Jackson Holdings SA, 8.50%, 10/15/24 (c) | | | 10,000 | | | | 10,110,000 | |
| | | | | | | | |
| | | | | | | 17,920,100 | |
| Diversified Telecommunication Services — 0.3% | |
Altice France SA/France, 8.13%, 02/01/27 (c) | | | 2,767 | | | | 2,850,010 | |
| | | | | | | | |
| Health Care Providers & Services — 1.7% | |
HCA, Inc., 6.50%, 02/15/20 | | | 2,500 | | | | 2,601,250 | |
LifePoint Health, Inc., 5.88%, 12/01/23 | | | 8,750 | | | | 9,132,813 | |
Tenet Healthcare Corp. : | | | | | | | | |
4.75%, 06/01/20 | | | 2,000 | | | | 2,022,500 | |
6.88%, 11/15/31 | | | 3 | | | | 2,686 | |
| | | | | | | | |
| | | | | | | 13,759,249 | |
| Hotels, Restaurants & Leisure — 0.1% | |
Pinnacle Entertainment, Inc., 5.63%, 05/01/24 | | | 930 | | | | 982,312 | |
| | | | | | | | |
| IT Services — 0.2% | |
First Data Corp., 5.00%, 01/15/24 (c) | | | 2,000 | | | | 2,012,500 | |
| | | | | | | | |
| Life Sciences Tools & Services — 0.2% | |
Avantor, Inc., 6.00%, 10/01/24 (c) | | | 1,570 | | | | 1,593,550 | |
| | | | | | | | |
| Media — 0.3% | |
Charter Communications Operating LLC/Charter Communications Operating Capital, 4.46%, 07/23/22 | | | 2,000 | | | | 2,033,487 | |
| | | | | | | | |
| Pharmaceuticals — 0.7% | |
Endo Dac/Endo Finance LLC/Endo Finco, Inc. : | | | | | | | | |
6.00%, 07/15/23 (c) | | | 3,500 | | | | 3,106,250 | |
6.00%, 02/01/25 (c) | | | 3,000 | | | | 2,586,000 | |
| | | | | | | | |
| | | | | | | 5,692,250 | |
| Specialty Retail — 0.9% | |
PetSmart, Inc., 7.13%, 03/15/23 (c) | | | 1,750 | | | | 1,257,813 | |
Rent-A-Center, Inc. : | | | | | | | | |
6.63%, 11/15/20 | | | 2,375 | | | | 2,369,062 | |
4.75%, 05/01/21 | | | 3,715 | | | | 3,696,425 | |
| | | | | | | | |
| | | | | | | 7,323,300 | |
| Wireless Telecommunication Services — 0.7% | |
Sprint Corp., 7.63%, 02/15/25 | | | 5,500 | | | | 5,832,750 | |
| | | | | | | | |
Total Corporate Bonds — 8.7%
(Cost: $71,024,851) | | | | 71,584,590 | |
| | | | | | | | |
|
Floating Rate Loan Interests — 2.9% | |
|
Diversified Telecommunication Services — 0.5% | |
Altice France SA, Incremental Term Loan, (1 mo. LIBOR + 4.00%, 0.00% Floor), 2.16% (d) | | | 4,163 | | | | 4,126,574 | |
| | | | | | | | |
| | | | |
| S C H E D U L E O F I N V E S T M E N T S | | | 7 | |
| | |
Schedule of Investments (continued) September 30, 2018 | | BlackRock Event Driven Equity Fund (Percentages shown are based on Net Assets) |
| | | | | | | | |
| Security | | Par (000) | | | Value | |
| Entertainment & Leisure — 1.0% | |
UFC Holdings LLC: | | | | | | | | |
Term Loan (First Lien), (1 mo. LIBOR US + 3.25%, 1.00% Floor), 5.50%, 08/18/23 (d) | | | 7,096 | | | $ | 7,133,528 | |
Term Loan (Second Lien), (1 mo. LIBOR US + 7.50%, 1.00% Floor), 9.74%, 08/18/24 (d) | | | 855 | | | | 863,020 | |
| | | | | | | | |
| | | | | | | 7,996,548 | |
| Multiline Retail — 0.4% | |
Neiman Marcus Group Ltd. LLC: | | | | | | | | |
Other Term Loan, 10/25/20 (e) | | | 2,500 | | | | 2,319,325 | |
Other Term Loan, (1 mo. LIBOR + 3.25%, 1.00% Floor), 5.37%, 10/25/20 (d) | | | 1,355 | | | | 1,256,608 | |
| | | | | | | | |
| | | | | | | 3,575,933 | |
| Wireless Telecommunication Services — 1.0% | |
Sprint Communications, Inc., Initial Term Loan (1 mo. LIBOR US + 2.50%, 0.75% Floor), 4.75%, 02/02/24 (d) | | | 8,693 | | | | 8,714,761 | |
| | | | | | | | |
Total Floating Rate Loan Interests — 2.9%
(Cost: $24,248,502) | | | | 24,413,816 | |
| | | | | | | | |
| | |
| | | Shares | | | | |
| Investment Companies — 2.5% | |
Altaba, Inc. (a) | | | 306,016 | | | | 20,845,810 | |
| | | | | | | | |
Total Investment Companies — 2.5%
(Cost: $21,637,429) | | | | 20,845,810 | |
| | | | | | | | |
Total Long-Term Investments — 17.1%
(Cost: $140,260,073) | | | | 141,510,434 | |
| | | | | | | | |
|
Short-Term Securities — 82.5% | |
| | |
| | | Par (000) | | | | |
| Borrowed Bond Agreements — 0.6%(f) | |
Citigroup Global Markets, Inc., 1.75% | | | | | |
(Purchased on 09/11/18 to be repurchased at $729,877, collateralized by Bombardier, Inc., 6.00% due at 10/15/22, par and fair value of $715,000 and $716,816, respectively), Open (g) | | | 729 | | | | 729,300 | |
Citigroup Global Markets, Inc., 1.85% | | | | | |
(Purchased on 08/20/18 to be repurchased at $1,540,302, collateralized by T-Mobile U.S., Inc., 5.13% due at 04/15/25, par and fair value of $1,500,000 and $1,511,250, respectively), Open (g) | | | 1,538 | | | | 1,537,500 | |
Citigroup Global Markets, Inc., 1.85% | | | | | |
(Purchased on 08/20/18 to be repurchased at $460,638, collateralized by Avantor, Inc., 9.00% due at 10/01/25, par and fair value of $440,000 and $454,300, respectively), Open (g) | | | 460 | | | | 459,800 | |
| | | | | | | | |
| Security | | Par (000) | | | Value | |
Citigroup Global Markets, Inc., 2.31% | | | | | |
(Purchased on 07/06/18 to be repurchased at $1,956,850, collateralized by U.S. Treasury Notes, 1.75% due at 05/31/22, par and fair value of $2,013,000 and $1,931,694, respectively), Open (g) | | | 1,948 | | | $ | 1,947,577 | |
| | | | | | | | |
Total Borrowed Bond Agreements — 0.6%
(Cost: $4,674,177) | | | | 4,674,177 | |
| | | | | | | | |
| | |
| | | Shares | | | | |
| Money Market Funds — 81.9% | | | | |
BlackRock Liquidity Funds, T-Fund, Institutional Class, 1.97% (h)(j) | | | 676,046,393 | | | | 676,046,393 | |
| | | | | | | | |
SL Liquidity Series, LLC, Money Market Series, 2.26% (h)(i)(j) | | | 251,600 | | | | 251,625 | |
| | | | | | | | |
Total Money Market Funds — 81.9%
(Cost: $676,298,005) | | | | 676,298,018 | |
| | | | | | | | |
Total Short-Term Securities — 82.5%
(Cost: $680,972,182) | | | | 680,972,195 | |
| | | | | | | | |
Total Investments Before Borrowed Bonds — 99.6%
(Cost: $821,232,255) | | | | 822,482,629 | |
| | | | | | | | |
| | |
| | | Par (000) | | | | |
| Borrowed Bonds — (0.6)% | |
|
Corporate Bonds — (0.3)% | |
| Aerospace & Defense — (0.1)% | |
Bombardier, Inc., 6.00%, 10/15/22 (c) | | | 715 | | | | (716,816 | ) |
| | | | | | | | |
| Life Sciences Tools & Services — (0.0)% | |
Avantor, Inc., 9.00%, 10/01/25 (c) | | | 440 | | | | (454,300 | ) |
| | | | | | | | |
| Wireless Telecommunication Services — (0.2)% | |
T-Mobile U.S., Inc., 5.13%, 04/15/25 | | | 1,500 | | | | (1,511,250 | ) |
| | | | | | | | |
Total Corporate Bonds — (0.3)%
(Proceeds — $2,648,306) | | | | (2,682,366 | ) |
| | | | | | | | |
U.S. Treasury Obligations — (0.3)% | |
U.S. Treasury Notes, 1.75%, 05/31/22 | | | 2,013 | | | | (1,931,694 | ) |
| | | | | | | | |
Total Borrowed Bonds — (0.6)%
(Proceeds — $4,653,285) | | | | (4,614,060 | ) |
| | | | | | | | |
Total Investments — 99.0%
(Cost: $816,578,970) | | | $ | 817,868,569 | |
Other Assets Less Liabilities — 1.0% | | | | 7,924,040 | |
| | | | | | | | |
Net Assets — 100.0% | | | $ | 825,792,609 | |
| | | | | | | | |
| (a) | Non-income producing security. |
| (b) | Security, or a portion of the security, is on loan. |
| (c) | Security exempt from registration pursuant to Rule 144A under the Securities Act of 1933, as amended. These securities may be resold in transactions exempt from registration to qualified institutional investors. |
| (d) | Variable rate security. Rate shown is the rate in effect as of period end. |
| (e) | Represents an unsettled loan commitment at period end. Certain details associated with this purchase are not known prior to the settlement date, including coupon rate. |
| (f) | Certain agreements have no stated maturity and can be terminated by either party at any time. |
| (g) | The amount to be repurchased assumes the maturity will be the day after the period end. |
| (h) | Annualized 7-day yield as of period end. |
| (i) | Security was purchased with the cash collateral from loaned securities. |
| (j) | During the period ended September 30, 2018, investments in issuers considered to be affiliates of the Fund for purposes of Section 2(a)(3) of the Investment Company Act of 1940, as amended, were as follows: |
| | |
| 8 | | 2 0 1 8 B L A C K R O C K A N N U A L R E P O R T T O S H A R E H O L D E R S |
| | |
Schedule of Investments (continued) September 30, 2018 | | BlackRock Event Driven Equity Fund |
| | | | | | | | | | | | | | | | | | | | | | | | | | | | |
| Affiliate | | Shares Held at 09/30/17 | | | Net Activity | | | Shares Held at 09/30/18 | | | Value at
09/30/18 | | | Income | | | Net Realized Gain (Loss)(a) | | | Change in Unrealized Appreciation (Depreciation) | |
BlackRock Liquidity Funds, T-Fund, Institutional Class | | | 147,158,282 | | | | 528,888,111 | | | | 676,046,393 | | | $ | 676,046,393 | | | $ | 5,510,563 | | | $ | 684 | | | $ | — | |
SL Liquidity Series, LLC, Money Market Series | | | — | | | | 251,600 | | | | 251,600 | | | | 251,625 | | | | 513 | (b) | | | 16 | | | | 13 | |
| | | | | | | | | | | | | | | | | | | | | | | | | | | | |
| | | | | | | | | | | | | | $ | 676,298,018 | | | $ | 5,511,076 | | | $ | 700 | | | $ | 13 | |
| | | | | | | | | | | | | | | | | | | | | | | | | | | | |
| (a) | Includes net capital gain distributions, if applicable. |
| (b) | Represents securities lending income earned from the reinvestment of cash collateral from loaned securities, net of fees and collateral investment expenses, and other payments to and from borrowers of securities. |
For Fund compliance purposes, the Fund’s industry classifications refer to one or more of the industry sub-classifications used by one or more widely recognized market indexes or ratings group indexes, and/or as defined by the investment adviser. These definitions may not apply for purposes of this report, which may combine such industry sub-classifications for reporting ease.
Derivative Financial Instruments Outstanding as of Period End
Centrally Cleared Credit Default Swaps — Sell Protection
| | | | | | | | | | | | | | | | | | | | | | | | | | | | |
| |
Reference Obligation | | Financing Rate Received by the Fund | | | Payment Frequency | | Termination Date | | Credit Rating(a) | | | Notional Amount (000)(b) | | | Value | | | Upfront Premium Paid (Received) | | | Unrealized Appreciation (Depreciation) | |
| |
CDX.NA.HY.31.V1 | | | 5.00% | | | Quarterly | | 12/20/23 | | | Not Rated | | | USD | (21,100 | ) | | $ | (1,575,384 | ) | | $ | (1,516,433 | ) | | | $(58,951 | ) |
| | | | | | | | | | | | | | | | | | | | | | | | | | | | |
OTC Total Return Swaps(a)
| | | | | | | | | | | | | | | | | | | | |
| Reference Entity | | Counterparty | | Termination Date | | Net Notional | | | Unrealized Appreciation (Depreciation) | | | Net Value of
Reference Entity | | | Gross Notional
Amount Net Asset Percentage | |
Equity Securities Long/Short | | Citibank N.A. | | 02/24/23 | | $ | 27,461,246 | | | $ | 228,478 | (b) | | $ | 27,608,855 | | | | 3.4% | |
| | Citibank N.A. | | 02/24/23 | | | (39,936,138 | ) | | | 2,998,269 | (c) | | | (36,927,469 | ) | | | 5.3 | |
| | Goldman Sachs Bank USA | | 03/07/19 - 02/07/23 | | | 171,901,020 | | | | 6,173,221 | (d) | | | 178,251,468 | | | | 36.0 | |
| | Goldman Sachs Bank USA | | 09/25/19 - 03/02/20 | | | (1,052,631 | ) | | | (28,711 | )(e) | | | (1,082,501 | ) | | | 0.1 | |
| | JPMorgan Chase Bank N.A. | | 02/08/23 | | | 89,752,836 | | | | 722,054 | (f) | | | 90,187,399 | | | | 10.9 | |
| | JPMorgan Chase Bank N.A. | | 02/08/23 | | | 14,207,731 | | | | (1,099,243 | )(g) | | | 13,093,213 | | | | 1.7 | |
| | Morgan Stanley & Co. International PLC | | 07/06/21 - 02/27/23 | | | 52,156,469 | | | | 2,270,337 | (h) | | | 54,711,253 | | | | 11.9 | |
| | Morgan Stanley & Co. International PLC | | 07/06/21 - 02/27/23 | | | 219,374 | | | | (6,859 | )(i) | | | 229,395 | | | | 0.8 | |
| | UBS AG | | 07/22/19 - 08/11/23 | | | 52,977,762 | | | | 3,598,956 | (j) | | | 56,773,704 | | | | 20.6 | |
| | | | | | | | | | | | | | | | | | | | |
| | | | | | | | | | $ | 14,856,502 | | | $ | 382,845,317 | | | | | |
| | | | | | | | | | | | | | | | | | | | |
| | (a) | The Fund receives or pays the total return on a portfolio of long and short positions underlying the total return swap. In addition, the Fund pays or receives a variable rate of interest, based on a specified benchmark, plus or minus a spread in a range of 18-539 basis points. The benchmark and spread are determined based upon the country and/or currency of the individual underlying positions. The following are the specified benchmarks used in determining the variable rate of interest: | |
Canadian Bankers Acceptances 1 Month
Intercontinental Exchange LIBOR:
GBP Overnight
GBP 1 Week
USD 1 Month
U.S. Federal Funds Effective Rate
USD Overnight Bank Funding Rate
| | (b) | Amount includes $80,869 of net dividends and financing fees. | |
| | (c) | Amount includes $(10,400) of net dividends and financing fees. | |
| | (d) | Amount includes $(177,227) of net dividends and financing fees. | |
| | (e) | Amount includes $1,159 of net dividends and financing fees. | |
| | (f) | Amount includes $287,491 of net dividends and financing fees. | |
| | (g) | Amount includes $15,275 of net dividends and financing fees. | |
| | (h) | Amount includes $(284,447) of net dividends and financing fees. | |
| | (i) | Amount includes $(16,880) of net dividends and financing fees. | |
| | (j) | Amount includes $(196,986) of net dividends and financing fees. | |
| | | | |
| S C H E D U L E O F I N V E S T M E N T S | | | 9 | |
| | |
Schedule of Investments (continued) September 30, 2018 | | BlackRock Event Driven Equity Fund |
The following table represents the individual long and short positions and related values of equity securities underlying the total return swap with Citibank N.A., as of period end, termination date 02/24/23:
| | | | | | | | | | | | |
| Reference Entity — Long | |
| |
| Common Stocks | | Shares | | | Value | | | % of
Basket Value | |
| |
| Diversified Consumer Services | |
Enercare, Inc. | | | 628,892 | | | $ | 14,090,608 | | | | 51.0% | |
| | | | | | | | | | | | |
| Food & Staples Retailing | |
SUPERVALU, Inc. | | | 151,618 | | | | 4,885,132 | | | | 17.7% | |
| | | | | | | | | | | | |
| Food Products | |
Pinnacle Foods, Inc. | | | 17,664 | | | | 1,144,804 | | | | 4.1% | |
| | | | | | | | | | | | |
| Insurance | |
Jardine Lloyd Thompson Group PLC | | | 318,784 | | | | 7,877,981 | | | | 28.5% | |
| | | | | | | | | | | | |
Total Reference Entity — Long | | | $ | 27,998,525 | | | | | |
| |
|
| Reference Entity — Short | |
| |
Common Stocks | | | | | | | | | | | | |
| |
| Food Products | | | | | | | | | |
Conagra Brands, Inc. | | | 11,471 | | | | $(389,670 | ) | | | (1.4)% | |
| | | | | | | | | | | | |
Net Value of Reference Entity — Citibank N.A. | | | $ | 27,608,855 | | | | | |
| |
The following table represents the individual long and short positions and related values of equity securities underlying the total return swap with Citibank N.A., as of period end, termination date 02/24/23:
| | | | | | | | | | | | |
| Reference Entity — Long | |
| |
| Common Stocks | | Shares | | | Value | | | % of
Basket Value | |
| |
| Health Care Providers & Services | |
Anthem, Inc. | | | 6,373 | | | $ | 1,746,521 | | | | (4.7)% | |
| | | | | | | | | | | | |
Media | | | | | | | | | | | | |
CBS Corp., Class B | | | 6,189 | | | | 355,558 | | | | (1.0)% | |
| | | | | | | | | | | | |
Total Reference Entity — Long | | | $ | 2,102,079 | | | | | |
| |
|
| Reference Entity — Short | |
| |
Common Stocks | |
| |
| Banks | | | | | | | | | |
Bank Of America Corp. | | | 2,041 | | | $ | (60,128 | ) | | | 0.2% | |
JPMorgan Chase & Co. | | | 524 | | | | (59,128 | ) | | | 0.2% | |
| | | | | | | | | | | | |
| | | | | | | (119,256 | ) | | | | |
| Chemicals | | | | | | | | | |
Air Products & Chemicals, Inc. | | | 22 | | | | (3,675 | ) | | | 0.0% | |
Albemarle Corp. | | | 37 | | | | (3,692 | ) | | | 0.0% | |
DowDuPont, Inc. | | | 46 | | | | (2,958 | ) | | | 0.0% | |
Eastman Chemical Co. | | | 33 | | | | (3,159 | ) | | | 0.0% | |
Ecolab, Inc. | | | 25 | | | | (3,919 | ) | | | 0.0% | |
FMC Corp. | | | 45 | | | | (3,923 | ) | | | 0.0% | |
International Flavors & Fragrances, Inc. | | | 25 | | | | (3,478 | ) | | | 0.0% | |
LyondellBasell Industries NV, Class A | | | 33 | | | | (3,383 | ) | | | 0.0% | |
Mosaic Co. | | | 141 | | | | (4,580 | ) | | | 0.0% | |
PPG Industries, Inc. | | | 31 | | | | (3,383 | ) | | | 0.0% | |
Praxair, Inc. | | | 24 | | | | (3,858 | ) | | | 0.0% | |
Westlake Chemical Corp. | | | 14 | | | | (1,164 | ) | | | 0.0% | |
| | | | | | | | | | | | |
| | | | | | | (41,172 | ) | | | | |
| | | | | | | | | | | | |
| Reference Entity — Short | |
| |
| Common Stocks | | Shares | | | Value | | | % of
Basket Value | |
| |
| Construction Materials | | | | |
Martin Marietta Materials, Inc. | | | 17 | | | $ | (3,093 | ) | | | 0.0% | |
Vulcan Materials Co. | | | 30 | | | | (3,336 | ) | | | 0.0% | |
| | | | | | | | | | | | |
| | | | | | | (6,429 | ) | | | | |
| Containers & Packaging | | | | |
Avery Dennison Corp. | | | 33 | | | | (3,575 | ) | | | 0.0% | |
Ball Corp. | | | 87 | | | | (3,827 | ) | | | 0.0% | |
International Paper Co. | | | 65 | | | | (3,195 | ) | | | 0.0% | |
Sealed Air Corp. | | | 81 | | | | (3,252 | ) | | | 0.0% | |
WestRock Co. | | | 54 | | | | (2,886 | ) | | | 0.0% | |
| | | | | | | | | | | | |
| | | | | | | (16,735 | ) | | | | |
| Health Care Providers & Services | |
UnitedHealth Group, Inc. | | | 4,383 | | | | (1,166,053 | ) | | | 3.2% | |
| | | | | | | | | | | | |
Internet Software & Services | |
Alibaba Group Holding Ltd. — ADR | | | 101,669 | | | | (16,750,984 | ) | | | 45.4% | |
| | | | | | | | | | | | |
| Life Sciences Tools & Services | |
Mettler-Toledo International, Inc. | | | 524 | | | | (319,106 | ) | | | 0.9% | |
Waters Corp. | | | 1,505 | | | | (292,993 | ) | | | 0.8% | |
| | | | | | | | | | | | |
| | | | | | | (612,099 | ) | | | | |
| Metals & Mining | | | | | | | | | |
Freeport-McMoRan, Inc. | | | 198 | | | | (2,756 | ) | | | 0.0% | |
Newmont Mining Corp. | | | 87 | | | | (2,627 | ) | | | 0.0% | |
Nucor Corp. | | | 57 | | | | (3,617 | ) | | | 0.0% | |
| | | | | | | | | | | | |
| | | | | | | (9,000 | ) | | | | |
| Oil, Gas & Consumable Fuels | |
Enbridge, Inc. | | | 6,320 | | | | (204,073 | ) | | | 0.6% | |
Kinder Morgan, Inc. | | | 19,182 | | | | (340,097 | ) | | | 0.9% | |
| | | | | | | | | | | | |
| | | | | | | (544,170 | ) | | | | |
| Pharmaceuticals | | | | | | | | | |
Johnson & Johnson | | | 1,214 | | | | (167,738 | ) | | | 0.5% | |
Merck & Co., Inc. | | | 2,465 | | | | (174,867 | ) | | | 0.5% | |
| | | | | | | | | | | | |
| | | | | | | (342,605 | ) | | | | |
| Semiconductors & Semiconductor Equipment | |
Advanced Micro Devices, Inc. | | | 27,665 | | | | (854,572 | ) | | | 2.3% | |
Analog Devices, Inc. | | | 9,597 | | | | (887,339 | ) | | | 2.4% | |
Applied Materials, Inc. | | | 16,728 | | | | (646,537 | ) | | | 1.8% | |
ASML Holding NV, Registered Shares | | | 2,717 | | | | (510,850 | ) | | | 1.4% | |
Cypress Semiconductor Corp. | | | 13,455 | | | | (194,963 | ) | | | 0.5% | |
Entegris, Inc. | | | 5,352 | | | | (154,940 | ) | | | 0.4% | |
KLA-Tencor Corp. | | | 6,470 | | | | (658,064 | ) | | | 1.8% | |
Lam Research Corp. | | | 4,925 | | | | (747,122 | ) | | | 2.0% | |
Marvell Technology Group Ltd. | | | 19,396 | | | | (374,343 | ) | | | 1.0% | |
Maxim Integrated Products, Inc. | | | 15,606 | | | | (880,022 | ) | | | 2.4% | |
Microchip Technology, Inc. | | | 10,027 | | | | (791,231 | ) | | | 2.1% | |
Micron Technology, Inc. | | | 16,294 | | | | (736,978 | ) | | | 2.0% | |
MKS Instruments, Inc. | | | 2,513 | | | | (201,417 | ) | | | 0.5% | |
Monolithic Power Systems, Inc. | | | 1,506 | | | | (189,048 | ) | | | 0.5% | |
ON Semiconductor Corp. | | | 16,845 | | | | (310,453 | ) | | | 0.8% | |
Qorvo, Inc. | | | 4,985 | | | | (383,297 | ) | | | 1.0% | |
Skyworks Solutions, Inc. | | | 7,310 | | | | (663,090 | ) | | | 1.8% | |
Taiwan Semiconductor Manufacturing Co. Ltd. — ADR | | | 18,176 | | | | (802,652 | ) | | | 2.2% | |
Teradyne, Inc. | | | 7,103 | | | | (262,669 | ) | | | 0.7% | |
Texas Instruments, Inc. | | | 8,211 | | | | (880,958 | ) | | | 2.4% | |
Xilinx, Inc. | | | 10,156 | | | | (814,207 | ) | | | 2.2% | |
| | | | | | | | | | | | |
| | | | | | | (11,944,752 | ) | | | | |
| | |
| 10 | | 2 0 1 8 B L A C K R O C K A N N U A L R E P O R T T O S H A R E H O L D E R S |
| | |
Schedule of Investments (continued) September 30, 2018 | | BlackRock Event Driven Equity Fund |
| | | | | | | | | | | | |
| Reference Entity — Short | | | | | | | |
| |
| Investment Companies | | Shares | | | Value | | | % of
Basket Value | |
| |
Alerian MLP ETF | | | 154,770 | | | $ | (1,652,944 | ) | | | 4.5% | |
Consumer Staples Select Sector SPDR Fund | | | 6,760 | | | | (364,567 | ) | | | 1.0% | |
Energy Select Sector SPDR Fund | | | 1,628 | | | | (123,305 | ) | | | 0.3% | |
Industrial Select Sector SPDR Fund | | | 57,511 | | | | (4,508,862 | ) | | | 12.2% | |
iShares U.S. Real Estate ETF | | | 296 | | | | (23,686 | ) | | | 0.1% | |
Materials Select Sector SPDR Fund | | | 91 | | | | (5,272 | ) | | | 0.0% | |
SPDR S&P 500 ETF Trust | | | 2,570 | | | | (747,150 | ) | | | 2.0% | |
SPDR S&P Regional Banking ETF | | | 850 | | | | (50,507 | ) | | | 0.1% | |
| | | | | | | | | | | | |
| | | | | | | (7,476,293 | ) | | | | |
| | | | | | | | | | | | |
Total Reference Entity — Short | | | | | | $ | (39,029,548 | ) | | | | |
| |
Net Value of Reference Entity — Citibank N.A. | | | | | | $ | (36,927,469 | ) | | | | |
| |
The following table represents the individual long and short positions and related values of equity securities underlying the total return swap with Goldman Sachs Bank USA, as of period end, termination dates 03/07/19 — 02/07/23:
| | | | | | | | | | | | |
| Reference Entity — Long | | | | | | | |
| |
| Common Stocks | | Shares | | | Value | | | % of
Basket Value | |
| |
| Aerospace & Defense | | | | | | | | | |
Rockwell Collins, Inc. | | | 392,515 | | | $ | 55,136,582 | | | | 30.9% | |
| | | | | | | | | | | | |
| Banks | | | | | | | | | |
FCB Financial Holdings, Inc., Class A | | | 138,810 | | | | 6,579,594 | | | | 3.7% | |
State Bank Financial Corp. | | | 54,476 | | | | 1,644,086 | | | | 0.9% | |
| | | | | | | | | | | | |
| | | | | | | 8,223,680 | | | | | |
| Equity Real Estate Investment Trusts (REITs) | |
Forest City Realty Trust, Inc. | | | 693,104 | | | | 17,389,979 | | | | 9.8% | |
Gramercy Property Trust | | | 1,426,337 | | | | 39,138,687 | | | | 22.0% | |
| | | | | | | | | | | | |
| | | | | | | 56,528,666 | | | | | |
| Food Products | | | | | | | | | |
Pinnacle Foods, Inc. | | | 327,741 | | | | 21,240,894 | | | | 11.9% | |
| | | | | | | | | | | | |
| Health Care Providers & Services | |
Envision Healthcare Corp. | | | 67,933 | | | | 3,106,576 | | | | 1.7% | |
Express Scripts Holding Co. | | | 475,561 | | | | 45,183,051 | | | | 25.3% | |
| | | | | | | | | | | | |
| | | | | | | 48,289,627 | | | | | |
| Household Durables | | | | | | | | | |
Sodastream International Ltd. | | | 25,307 | | | | 3,620,926 | | | | 2.0% | |
| | | | | | | | | | | | |
| Insurance | | | | | | | | | |
AmTrust Financial Services, Inc. | | | 12,617 | | | | 183,199 | | | | 0.1% | |
| | | | | | | | | | | | |
| Media | | | | | | | | | |
Twenty-First Century Fox, Inc., Class A | | | 361,375 | | | | 16,742,504 | | | | 9.4% | |
| | | | | | | | | | | | |
| Oil, Gas & Consumable Fuels | | | | | | | | | |
Energen Corp. | | | 32,656 | | | | 2,813,968 | | | | 1.6% | |
| | | | | | | | | | | | |
| Software | | | | | | | | | |
CA, Inc. | | | 402,237 | | | | 17,758,763 | | | | 10.0% | |
Dell Technologies, Inc., Class V | | | 134,809 | | | | 13,092,650 | | | | 7.3% | |
| | | | | | | | | | | | |
| | | | | | | 30,851,413 | | | | | |
| Thrifts & Mortgage Finance | | | | | | | | | |
Beneficial Bancorp, Inc. | | | 50,417 | | | | 852,047 | | | | 0.5% | |
| | | | | | | | | | | | |
Total Reference Entity — Long | | | | | | $ | 244,483,506 | | | | | |
| |
| | | | | | | | | | | | |
| Reference Entity — Short | | | | | | | |
| |
| Common Stocks | | Shares | | | Value | | | % of Basket
Value | |
| |
| Aerospace & Defense | | | | | | | | | |
United Technologies Corp. | | | 134,388 | | | | $(18,788,786 | ) | | | (10.5)% | |
| | | | | | | | | | | | |
| Banks | | | | | | | | | |
Cadence Bancorp | | | 62,943 | | | | (1,644,071 | ) | | | (0.9)% | |
Synovus Financial Corp. | | | 146,445 | | | | (6,705,717 | ) | | | (3.8)% | |
| | | | | | | | | | | | |
| | | | | | | (8,349,788 | ) | | | | |
| Food Products | | | | | | | | | |
Conagra Brands, Inc. | | | 212,834 | | | | (7,229,971 | ) | | | (4.1)% | |
| | | | | | | | | | | | |
| Health Care Providers & Services | |
Cigna Corp. | | | 115,765 | | | | (24,108,061 | ) | | | (13.5)% | |
| | | | | | | | | | | | |
| Media | | | | | | | | | |
Walt Disney Co. | | | 35,884 | | | | (4,196,275 | ) | | | (2.4)% | |
| | | | | | | | | | | | |
| Oil, Gas & Consumable Fuels | | | | | | | | | |
Diamondback Energy, Inc. | | | 21,038 | | | | (2,844,127 | ) | | | (1.6)% | |
| | | | | | | | | | | | |
| Thrifts & Mortgage Finance | | | | | | | | | |
WSFS Financial Corp. | | | 15,165 | | | | (715,030 | ) | | | (0.4)% | |
| | | | | | | | | | | | |
Total Reference Entity — Short | | | | | | | $(66,232,038 | ) | | | | |
| |
Net Value of Reference Entity — Goldman Sachs Bank USA | | | | | | | $178,251,468 | | | | | |
| |
The following table represents the individual long and short positions and related values of equity securities underlying the total return swap with Goldman Sachs Bank USA, as of period end, termination dates 09/25/19 — 03/02/20:
| | | | | | | | | | | | |
| Reference Entity — Long | | | | | | | |
| |
| Common Stocks | | Shares | | | Value | | | % of
Basket Value | |
| |
| Banks | | | | | | | | | |
Valley National Bancorp | | | 100 | | | | $1,125 | | | | (0.1)% | |
Total Reference Entity — Long | | | | | | | 1,125 | | | | | |
| |
| | |
Reference Entity — Short | | | | | | | | | |
| |
| Common Stocks | | | | | | | | | |
| |
| Banks | | | | | | | | | |
Bank Of America Corp. | | | 100 | | | $ | (2,946 | ) | | | 0.3% | |
| | | | | | | | | | | | |
| Investment Companies | | | | | | | | | |
| |
Vaneck Vectors Semiconductor ETF | | | 10,152 | | | | (1,080,680 | ) | | | 99.8% | |
| | | | | | | | | | | | |
Total Reference Entity — Short | | | | | | | (1,083,626 | ) | | | | |
| |
Net Value of Reference Entity — Goldman Sachs Bank USA | | | | | | $ | (1,082,501 | ) | | | | |
| |
The following table represents the individual long and short positions and related values of equity securities underlying the total return swap with JPMorgan Chase Bank N.A., as of period end, termination date 02/08/23:
| | | | | | | | | | | | |
| Reference Entity — Long | | | | | | | |
| |
| Common Stocks | | Shares | | | Value | | | % of
Basket Value | |
| |
| Equity Real Estate Investment Trusts (REITs) | |
Forest City Realty Trust, Inc. | | | 669,687 | | | $ | 16,802,447 | | | | 18.6% | |
| | | | | | | | | | | | |
| Professional Services | | | | | | | | | |
Dun & Bradstreet Corp. | | | 72,952 | | | | 10,396,389 | | | | 11.5% | |
| | | | | | | | | | | | |
| | | | |
| S C H E D U L E O F I N V E S T M E N T S | | | 11 | |
| | |
Schedule of Investments (continued) September 30, 2018 | | BlackRock Event Driven Equity Fund |
| | | | | | | | | | | | |
| Reference Entity — Long | |
| |
| Common Stocks | | Shares | | | Value | | | % of
Basket Value | |
| |
| Semiconductors & Semiconductor Equipment | |
Integrated Device Technology, Inc. | | | 265,896 | | | $ | 12,499,771 | | | | 13.9% | |
| | | | | | | | | | | | |
| Software | | | | | | | | | |
CA, Inc. | | | 1,143,574 | | | | 50,488,792 | | | | 56.0% | |
| | | | | | | | | | | | |
Total Reference Entity — Long | | | $ | 90,187,399 | | | | | |
| |
Net Value of Reference Entity —
JPMorgan Chase Bank N.A. | | | $ | 90,187,399 | | | | | |
| |
The following table represents the individual long and short positions and related values of equity securities underlying the total return swap with JPMorgan Chase Bank N.A., as of period end, termination date 02/08/23:
| | | | | | | | | | | | |
| Reference Entity — Long | |
| |
| Common Stocks | | Shares | | | Value | | | % of
Basket Value | |
| |
| Semiconductors & Semiconductor Equipment | |
NXP Semiconductors NV | | | 153,137 | | | $ | 13,093,213 | | | | 100.0% | |
| | | | | | | | | | | | |
Net Value of Reference Entity — JPMorgan Chase Bank N.A. | | | $ | 13,093,213 | | | | | |
| |
The following table represents the individual long and short positions and related values of equity securities underlying the total return swap with Morgan Stanley & Co. International PLC, as of period end, termination dates 07/06/21 — 02/27/23:
| | | | | | | | | | | | |
| Reference Entity — Long | |
| |
| Common Stocks | | Shares | | | Value | | | % of
Basket Value | |
| |
| Banks | | | | | | | | | |
MB Financial, Inc. | | | 85,969 | | | $ | 3,964,030 | | | | 7.2% | |
| | | | | | | | | | | | |
| Health Care Providers & Services | |
Aetna, Inc. | | | 330,774 | | | | 67,097,506 | | | | 122.6% | |
| | | | | | | | | | | | |
| IT Services | |
Syntel, Inc. | | | 1,041 | | | | 42,660 | | | | 0.1% | |
| | | | | | | | | | | | |
| Software | |
Dell Technologies, Inc., Class V | | | 91,663 | | | | 8,902,310 | | | | 16.3% | |
| | | | | | | | | | | | |
| Total Reference Entity — Long | | | $80,006,506 | | | | |
| |
|
| Reference Entity — Short | |
| |
Common Stocks | | | | | | | | | |
| |
| Banks | | | | | | | | | |
Fifth Third Bancorp | | | 124,655 | | | $ | (3,480,367 | ) | | | (6.4)% | |
| | | | | | | | | | | | |
| Health Care Providers & Services | |
CVS Health Corp. | | | 277,120 | | | | (21,814,886 | ) | | | (39.9)% | |
| | | | | | | | | | | | |
Total Reference Entity — Short | | | | $(25,295,253 | ) | | | | |
| |
Net Value of Reference Entity — Morgan Stanley & Co. International PLC | | | | $54,711,253 | | | | | |
| |
The following table represents the individual long and short positions and related values of equity securities underlying the total return swap with Morgan Stanley & Co. International PLC, as of period end, termination dates 07/06/21 — 02/27/23:
| | | | | | | | | | | | |
| Reference Entity — Long | |
| |
| Common Stocks | | Shares | | | Value | | | % of
Basket Value | |
| |
| Chemicals | | | | | | | | | |
DowDuPont, Inc. | | | 35,291 | | | | $2,269,564 | | | | 989.4% | |
| | | | | | | | | | | | |
| Health Care Providers & Services | |
Humana, Inc. | | | 3,128 | | | | 1,058,891 | | | | 461.6% | |
| | | | | | | | | | | | |
Total Reference Entity — Long | | | | $3,328,455 | | | | | |
| |
|
| Reference Entity — Short | |
| |
Common Stocks | | | | | | | | | |
| |
| Banks | | | | | | | | | |
Bank of America Corp. | | | 1,196 | | | $ | (35,234 | ) | | | (15.4)% | |
Citigroup, Inc. | | | 1,170 | | | | (83,936 | ) | | | (36.6)% | |
JPMorgan Chase & Co. | | | 323 | | | | (36,447 | ) | | | (15.9)% | |
| | | | | | | | | | | | |
| Chemicals | | | | | | | | | |
Air Products & Chemicals, Inc. | | | 720 | | | | (120,276 | ) | | | (52.4)% | |
Albemarle Corp. | | | 1,127 | | | | (112,452 | ) | | | (49.0)% | |
Eastman Chemical Co. | | | 1,170 | | | | (111,992 | ) | | | (48.8)% | |
Ecolab, Inc. | | | 814 | | | | (127,619 | ) | | | (55.6)% | |
FMC Corp. | | | 1,384 | | | | (120,657 | ) | | | (52.6)% | |
International Flavors & Fragrances, Inc. | | | 801 | | | | (111,435 | ) | | | (48.6)% | |
LyondellBasell Industries NV, Class A | | | 1,126 | | | | (115,426 | ) | | | (50.3)% | |
Mosaic Co. | | | 4,485 | | | | (145,673 | ) | | | (63.5)% | |
PPG Industries, Inc. | | | 1,055 | | | | (115,132 | ) | | | (50.2)% | |
Praxair, Inc. | | | 776 | | | | (124,726 | ) | | | (54.4)% | |
Westlake Chemical Corp. | | | 432 | | | | (35,904 | ) | | | (15.7)% | |
| | | | | | | | | | | | |
| | | | | | | (1,241,292 | ) | | | | |
| Construction Materials | |
Martin Marietta Materials, Inc. | | | 549 | | | | (99,891 | ) | | | (43.5)% | |
Vulcan Materials Co. | | | 953 | | | | (105,974 | ) | | | (46.2)% | |
| | | | | | | | | | | | |
| | | | | | | (205,865 | ) | | | | |
| Containers & Packaging | |
Avery Dennison Corp. | | | 1,115 | | | | (120,810 | ) | | | (52.7)% | |
Ball Corp. | | | 2,851 | | | | (125,415 | ) | | | (54.7)% | |
International Paper Co. | | | 2,106 | | | | (103,510 | ) | | | (45.1)% | |
Sealed Air Corp. | | | 2,591 | | | | (104,029 | ) | | | (45.3)% | |
Westrock Co. | | | 1,887 | | | | (100,841 | ) | | | (44.0)% | |
| | | | | | | | | | | | |
| | | | | | | (554,605 | ) | | | | |
| Metals & Mining | | | | | | | | | |
Freeport-McMoRan, Inc. | | | 7,552 | | | | (105,124 | ) | | | (45.8)% | |
Newmont Mining Corp. | | | 3,059 | | | | (92,382 | ) | | | (40.3)% | |
Nucor Corp. | | | 1,864 | | | | (118,271 | ) | | | (51.6)% | |
| | | | | | | | | | | | |
| | | | | | | (315,777 | ) | | | | |
| Investment Companies | | | | | | | |
| |
Consumer Staples Select Sector SPDR Fund | | | 110 | | | | (5,932 | ) | | | (2.6)% | |
iShares U.S. Real Estate ETF | | | 5,498 | | | | (439,950 | ) | | | (191.8)% | |
Materials Select Sector SPDR Fund | | | 2,281 | | | | (132,138 | ) | | | (57.6)% | |
SPDR S&P 500 ETF Trust | | | 48 | | | | (13,955 | ) | | | (6.1)% | |
SPDR S&P Regional Banking ETF | | | 571 | | | | (33,929 | ) | | | (14.8)% | |
| | | | | | | (625,904 | ) | | | | |
| | | | | | | | | | | | |
Total Reference Entity — Short | | | | $(3,099,060 | ) | | | | |
| |
Net Value of Reference Entity — Morgan Stanley & Co. International PLC | | | | $229,395 | | | | | |
| |
| | |
| 12 | | 2 0 1 8 B L A C K R O C K A N N U A L R E P O R T T O S H A R E H O L D E R S |
| | |
Schedule of Investments (continued) September 30, 2018 | | BlackRock Event Driven Equity Fund |
The following table represents the individual long and short positions and related values of equity securities underlying the total return swap with UBS AG, as of period end, termination dates 07/22/19 — 08/11/23:
| | | | | | | | | | | | |
| Reference Entity — Long | |
| |
| Common Stocks | | Shares | | | Value | | | % of
Basket Value | |
| |
| Banks | | | | | | | | | |
MB Financial, Inc. | | | 163,488 | | | $ | 7,538,432 | | | | 13.3% | |
| | | | | | | | | | | | |
| Biotechnology | | | | | | | | | |
Shire PLC | | | 167,827 | | | | 10,139,473 | | | | 17.9% | |
Shire PLC — ADR | | | 128,157 | | | | 23,231,019 | | | | 40.9% | |
| | | | | | | | | | | | |
| | | | | | | 33,370,492 | | | | | |
| | | |
| Food Products | | | | | | | | | |
Pinnacle Foods, Inc. | | | 252,399 | | | | 16,357,979 | | | | 28.8% | |
| | | | | | | | | | | | |
| | | |
| Health Care Providers & Services | | | | | | | | | |
Envision Healthcare Corp. | | | 462,320 | | | | 21,141,894 | | | | 37.2% | |
| | | | | | | | | | | | |
| Common Stocks | | Shares | | | Value | | | % of
Basket Value | |
| |
| Insurance | | | | | | | | | |
AmTrust Financial Services, Inc. | | | 148,007 | | | | 2,149,062 | | | | 3.8% | |
esure Group PLC | | | 999,513 | | | | 3,614,226 | | | | 6.4% | |
| | | | | | | | | | | | |
| | | | | | | 5,763,288 | | | | | |
| Oil, Gas & Consumable Fuels | |
Andeavor | | | 200,372 | | | | 30,757,102 | | | | 54.2% | |
| | | | | | | | | | | | |
Total Reference Entity — Long | | | $ | 114,929,187 | | | | | |
| |
| | | | | | | | | | | | |
| Reference Entity — Short | |
| |
| Common Stocks | | Shares | | | Value | | | % of
Basket Value | |
| |
| Banks | | | | | | | | | |
Fifth Third Bancorp | | | 237,035 | | | $ | (6,618,017 | ) | | | (11.7)% | |
| | | | | | | | | | | | |
| Food Products | | | | | | | | | |
Conagra Brands, Inc. | | | 163,908 | | | | (5,567,955 | ) | | | (9.8)% | |
| | | | | | | | | | | | |
| Oil, Gas & Consumable Fuels | |
Marathon Petroleum Corp. | | | 327,187 | | | | (26,165,144 | ) | | | (46.1)% | |
| | | | | | | | | | | | |
| Pharmaceuticals | | | | | | | | | |
Takeda Pharmaceutical Co. Ltd. | | | 140,739 | | | | (6,017,725 | ) | | | (10.6)% | |
Takeda Pharmaceutical Co. Ltd. — ADR | | | 645,140 | | | | (13,786,642 | ) | | | (24.3)% | |
| | | | | | | | | | | | |
| | | | | | | (19,804,367 | ) | | | | |
| | | | | | | | | | | | |
Total Reference Entity — Short | | | | $(58,155,483 | ) | | | | |
| |
Net Value of Reference Entity — UBS AG | | | | $56,773,704 | | | | | |
| |
Balances Reported in the Statement of Assets and Liabilities for Centrally Cleared Swaps and OTC Derivatives
| | | | | | | | | | | | | | | | | | | | | | | | | | | | | | | | | | | | |
| |
| | | Swap
Premiums
Paid | | | | | | Swap
Premiums
Received | | | | | | Unrealized
Appreciation | | | | | | Unrealized
Depreciation | | | | | | Value | |
| |
Centrally Cleared Swaps(a) | | | $— | | | | | | | | $(1,516,433 | ) | | | | | | | $ — | | | | | | | | $ (58,951 | ) | | | | | | | $— | |
OTC Derivatives | | | — | | | | | | | | — | | | | | | | | 15,991,315 | | | | | | | | (1,134,813 | ) | | | | | | | — | |
| |
| | (a) | Includes cumulative appreciation (depreciation) on centrally cleared swaps, as reported in the Schedule of Investments. Only current day’s variation margin is reported within the Statement of Assets and Liabilities and is net of any previously paid (received) swap premium amounts. | |
Derivative Financial Instruments Categorized by Risk Exposure
As of period end, the fair values of derivative financial instruments located in the Statement of Assets and Liabilities were as follows:
| | | | | | | | | | | | | | | | | | | | | | | | | | | | | | | | | | | | |
| | | | | | | |
| | | Assets — Derivative Financial Instruments | | Commodity
Contracts | | | Credit
Contracts | | | Equity
Contracts | | | Foreign
Currency
Exchange
Contracts | | | Interest
Rate
Contracts | | | Other
Contacts | | | Total | | | | |
| | | | | | | |
| | Swaps — OTC | | Unrealized appreciation on OTC swaps | | | $— | | | | $ — | | | $ | 15,991,315 | | | | $— | | | | $— | | | | $— | | | $ | 15,991,315 | | | | | |
| | | | | | | | | | | | | | | | | | | | | | | | | | | | | | | | | | | | |
| | | | | | |
| | | Liabilities — Derivative Financial Instruments | | | | | | | | | | | | | | | | |
| | | | | | | |
| | Swaps — centrally cleared | | Net unrealized depreciation(a) | | | $— | | | | $58,951 | | | $ | — | | | | $— | | | | $— | | | | $— | | | $ | 58,951 | | | | | |
| | Swaps — OTC | | Unrealized depreciation on OTC swaps | | | — | | | | — | | | | 1,134,813 | | | | — | | | | — | | | | — | | | | 1,134,813 | | | | | |
| | | | | | | | | | | | | | | | | | | | | | | | | | | | | | | | | | | | |
| | | | | | | $— | | | | $58,951 | | | $ | 1,134,813 | | | | $— | | | | $— | | | | $— | | | $ | 1,193,764 | | | | | |
| | | | | | | | | | | | | | | | | | | | | | | | | | | | | | | | | | | | |
| | (a) | Includes cumulative appreciation (depreciation) on centrally cleared swaps, if any, as reported in the Schedule of Investments. Only current day’s variation margin is reported within the Statement of Assets and Liabilities. | |
| | | | |
| S C H E D U L E O F I N V E S T M E N T S | | | 13 | |
| | |
Schedule of Investments (continued) September 30, 2018 | | BlackRock Event Driven Equity Fund |
For the year ended September 30, 2018, the effect of derivative financial instruments in the Statement of Operations was as follows:
| | | | | | | | | | | | | | | | | | | | | | | | | | | | | | | | | | |
| | | | | Commodity
Contracts | | | Credit
Contracts | | | Equity
Contracts | | | Foreign Currency
Exchange Contracts | | | Interest Rate
Contracts | | | Other
Contacts | | | Total | | | | |
| | | | | | | |
| | Net Realized Gain (Loss) from: | | | | | | | | | | | | | | | | | | | | | | | | | | | | | | | | |
| | | | | | | |
| | Options purchased(a) | | | $— | | | $ | — | | | $ | (278,954 | ) | | | $— | | | | $— | | | | $— | | | $ | (278,954 | ) | | | | |
| | Options written | | | — | | | | — | | | | 388,617 | | | | — | | | | — | | | | — | | | | 388,617 | | | | | |
| | Swaps | | | — | | | | (373,844 | ) | | | 3,585,271 | | | | — | | | | — | | | | — | | | | 3,211,427 | | | | | |
| | | | | | | | | | | | | | | | | | | | | | | | | | | | | | | | | | |
| | | | | $— | | | $ | (373,844 | ) | | $ | 3,694,934 | | | | $— | | | | $— | | | | $— | | | $ | 3,321,090 | | | | | |
| | | | | | | | | | | | | | | | | | | | | | | | | | | | | | | | | | |
| | Net Change in Unrealized Appreciation (Depreciation) on: | | | | | | | | | | | | | | | | | | | | | | | | | | | | | | | | |
| | | | | | | |
| | Swaps | | | $— | | | $ | (54,559 | ) | | $ | 12,320,374 | | | | $— | | | | $— | | | | $— | | | $ | 12,265,815 | | | | | |
| | | | | | | | | | | | | | | | | | | | | | | | | | | | | | | | | | |
| | (a) | Options purchased are included in net realized gain (loss) from investments. | |
Average Quarterly Balances of Outstanding Derivative Financial Instruments
| | | | |
| |
Options: | | | | |
Average value of option contracts purchased | | $ | 88,500 | |
Average value of option contracts written | | $ | 104,260 | |
Credit default swaps: | | | | |
Average notional value — buy protection | | $ | 1,575,000 | |
Average notional value — sell protection | | $ | 5,275,000 | |
Total return swaps: | | | | |
Average notional value | | $ | 263,762,714 | |
| | | | |
For more information about the Fund’s investment risks regarding derivative financial instruments, refer to the Notes to Financial Statements.
Derivative Financial Instruments — Offsetting as of Period End
The Fund’s derivative assets and liabilities (by type) were as follows:
| | | | | | | | |
| |
| | | Assets | | | | Liabilities | |
| |
Derivative Financial Instruments: | | | | | | | | |
Swaps — Centrally cleared | | $ | — | | | $ | 5,861 | |
Swaps — OTC(a) | | | 15,991,315 | | | | 1,134,813 | |
| | | | | | | | |
Total derivative assets and liabilities in the Statement of Assets and Liabilities | | $ | 15,991,315 | | | $ | 1,140,674 | |
Derivatives not subject to a Master Netting Agreement or similar agreement (“MNA”) | | | — | | | | (5,861 | ) |
| | | | | | | | |
Total derivative assets and liabilities subject to an MNA | | $ | 15,991,315 | | | $ | 1,134,813 | |
| | | | | | | | |
| | (a) | Includes unrealized appreciation (depreciation) on OTC swaps in the Statement of Assets and Liabilities. | |
The following table presents the Fund’s derivative assets and liabilities by counterparty net of amounts available for offset under an MNA and net of the related collateral received by the Fund:
| | | | | | | | | | | | | | | | | | | | | | | | | | | | | | | | | | | | |
| |
| Counterparty | | Derivative Assets Subject to
an MNA by
Counterparty | | | | | | Derivatives Available for Offset(a) | | | | | | Non-cash
Collateral
Received | | | | | | Cash Collateral Received(b)
| | | | | | Net
Amount of
Derivative
Assets(c) | |
| |
Citibank N.A. | | | $ 3,226,747 | | | | | | | | $ — | | | | | | | | $— | | | | | | | $ | (3,226,747 | ) | | | | | | $ | — | |
Goldman Sachs Bank USA | | | 6,173,221 | | | | | | | | (28,711 | ) | | | | | | | — | | | | | | | | (5,600,000 | ) | | | | | | | 544,510 | |
JPMorgan Chase Bank N.A. | | | 722,054 | | | | | | | | (722,054 | ) | | | | | | | — | | | | | | | | — | | | | | | | | — | |
Morgan Stanley & Co. International PLC | | | 2,270,337 | | | | | | | | (6,859 | ) | | | | | | | — | | | | | | | | (2,263,478 | ) | | | | | | | — | |
UBS AG | | | 3,598,956 | | | | | | | | — | | | | | | | | — | | | | | | | | — | | | | | | | | 3,598,956 | |
| | | | | | | | | | | | | | | | | | | | | | | | | | | | | | | | | | | | |
| | | $15,991,315 | | | | | | | | $(757,624 | ) | | | | | | | $— | | | | | | | $ | (11,090,225 | ) | | | | | | $ | 4,143,466 | |
| | | | | | | | | | | | | | | | | | | | | | | | | | | | | | | | | | | | |
| | | | | | | | | | | | | | | | | | | | | | | | | | | | | | | | | | | | |
| |
| Counterparty | | Derivative Liabilities Subject to an MNA by
Counterparty | | | | | | Derivatives Available for Offset(a) | | | | | | Non-cash
Collateral
Pledged | | | | | | Cash
Collateral
Pledged | | | | | | Net Amount of Derivative Liabilities(d) | |
| |
Goldman Sachs Bank USA | | | $ 28,711 | | | | | | | | $ (28,711 | ) | | | | | | | $— | | | | | | | | $— | | | | | | | | $ — | |
JPMorgan Chase Bank N.A. | | | 1,099,243 | | | | | | | | (722,054 | ) | | | | | | | — | | | | | | | | — | | | | | | | | 377,189 | |
Morgan Stanley & Co. International PLC | | | 6,859 | | | | | | | | (6,859 | ) | | | | | | | — | | | | | | | | — | | | | | | | | — | |
| | | | | | | | | | | | | | | | | | | | | | | | | | | | | | | | | | | | |
| | | $1,134,813 | | | | | | | | $(757,624 | ) | | | | | | | $— | | | | | | | | $— | | | | | | | | $377,189 | |
| | | | | | | | | | | | | | | | | | | | | | | | | | | | | | | | | | | | |
| | (a) | The amount of derivatives available for offset is limited to the amount of derivative assets and/or liabilities that are subject to an MNA. |
| | (b) | Excess of collateral received from the individual counterparty is not shown for financial reporting purposes. |
| | (c) | Net amount represents the net amount receivable from the counterparty in the event of default. |
| | (d) | Net amount represents the net amount payable due to the counterparty in the event of default. |
| | |
| 14 | | 2 0 1 8 B L A C K R O C K A N N U A L R E P O R T T O S H A R E H O L D E R S |
| | |
Schedule of Investments (continued) September 30, 2018 | | BlackRock Event Driven Equity Fund |
Fair Value Hierarchy as of Period End
Various inputs are used in determining the fair value of investments and derivative financial instruments. For information about the Fund’s policy regarding valuation of investments and derivative financial instruments, refer to the Notes to Financial Statements.
The following tables summarize the Fund’s investments and derivative financial instruments categorized in the disclosure hierarchy:
| | | | | | | | | | | | | | | | |
| |
| | | Level 1 | | | Level 2 | | | Level 3 | | | Total | |
| |
Assets: | | | | | | | | | | | | | | | | |
Investments: | | | | | | | | | | | | | | | | |
Long-Term Investments: | | | | | | | | | | | | | | | | |
Common Stocks(a) | | | 24,046,962 | | | | 619,256 | | | | — | | | | 24,666,218 | |
Corporate Bonds(a) | | | — | | | | 71,584,590 | | | | — | | | | 71,584,590 | |
Floating Rate Loan Interests(a) | | | — | | | | 24,413,816 | | | | — | | | | 24,413,816 | |
Investment Companies | | | 20,845,810 | | | | — | | | | — | | | | 20,845,810 | |
Short-Term Securities: | | | | | | | | | | | | | | | | |
Borrowed Bond Agreements | | | — | | | | 4,674,177 | | | | — | | | | 4,674,177 | |
Money Market Funds | | | 676,046,393 | | | | — | | | | — | | | | 676,046,393 | |
| Liabilities: | | | | | | | | | | | | | | | | |
Borrowed Bonds(a) | | | — | | | | (4,614,060 | ) | | | — | | | | (4,614,060 | ) |
| | | | | | | | | | | | | | | | |
| Subtotal | | $ | 720,939,165 | | | $ | 96,677,779 | | | $ | — | | | $ | 817,616,944 | |
| | | | | | | | | | | | | | | | |
| Investments Valued at NAV(b) | | | | | | | | | | | | | | | 251,625 | |
| | | | | | | | | | | | | | | | |
| Total Investments | | | | | | | | | | | | | | $ | 817,868,569 | |
| | | | | | | | | | | | | | | | |
| Derivative Financial Instruments(c) | | | | | | | | | | | | | | | | |
Assets: | | | | | | | | | | | | | | | | |
Equity contracts | | $ | — | | | $ | 15,991,315 | | | $ | — | | | $ | 15,991,315 | |
Liabilities: | | | | | | | | | | | | | | | | |
Credit contracts | | | — | | | | (58,951 | ) | | | — | | | | (58,951 | ) |
Equity contracts | | | — | | | | (1,134,813 | ) | | | — | | | | (1,134,813 | ) |
| | | | | | | | | | | | | | | | |
| | $ | — | | | $ | 14,797,551 | | | $ | — | | | $ | 14,797,551 | |
| | | | | | | | | | | | | | | | |
| | (a) | See above Schedule of Investments for values in each industry. | |
| | (b) | As of September 30, 2018, certain investments of the Fund were fair valued using NAV per share as no quoted market value is available and therefore have been excluded from the fair value hierarchy. | |
| | (c) | Derivative financial instruments are swaps, which are valued at the unrealized appreciation (depreciation) on the instrument. | |
During the year ended September 30, 2018, there were no transfers between levels.
See notes to financial statements.
| | | | |
| S C H E D U L E O F I N V E S T M E N T S | | | 15 | |
| | |
Statement of Assets and Liabilities September 30, 2018 | | |
| | | | |
| | | BlackRock Event
Driven Equity
Fund | |
| |
ASSETS | | | | |
| |
Investments at value — unaffiliated (including securities loaned at value of $248,326) (cost — $144,934,250) | | $ | 146,184,611 | |
Investments at value — affiliated (cost — $676,298,005) | | | 676,298,018 | |
Cash pledged: | | | | |
Collateral — OTC derivatives | | | 1,030,000 | |
Centrally cleared swaps | | | 676,000 | |
Receivables: | | | | |
Investments sold | | | 5,223,568 | |
Securities lending income — affiliated | | | 127 | |
Swaps | | | 11,175,716 | |
Capital shares sold | | | 9,901,686 | |
Dividends — affiliated | | | 973,324 | |
Dividends — unaffiliated | | | 21,095 | |
Interest — unaffiliated | | | 947,769 | |
From the Manager | | | 16,478 | |
Unrealized appreciation on OTC swaps | | | 15,991,315 | |
Prepaid expenses | | | 154,835 | |
| | | | |
Total assets | | | 868,594,542 | |
| | | | |
| |
LIABILITIES | | | | |
Bank overdraft | | | 54,419 | |
Foreign bank overdraft (cost — $1,134,369) | | | 1,134,369 | |
Cash received as collateral for OTC derivatives | | | 15,680,000 | |
Borrowed bonds at value (proceeds — $4,653,285) | | | 4,614,060 | |
Cash collateral on securities loaned at value | | | 251,629 | |
Payables: | | | | |
Swaps | | | 4,865,302 | |
Investments purchased | | | 13,167,264 | |
Board realignment and consolidation | | | 14,313 | |
Capital shares redeemed | | | 802,867 | |
Directors’ and Officer’s fees | | | 4,051 | |
Interest expense | | | 86,951 | |
Investment advisory fees | | | 730,253 | |
Other accrued expenses | | | 189,869 | |
Other affiliates | | | 53,262 | |
Service and distribution fees | | | 12,650 | |
Variation margin on centrally cleared swaps | | | 5,861 | |
Unrealized depreciation on OTC swaps | | | 1,134,813 | |
| | | | |
Total liabilities | | | 42,801,933 | |
| | | | |
NET ASSETS | | $ | 825,792,609 | |
| | | | |
| |
NET ASSETS CONSIST OF | | | | |
Paid-in capital | | $ | 802,534,896 | |
Undistributed net investment income | | | 4,067,807 | |
Accumulated net realized gain | | | 3,151,979 | |
Net unrealized appreciation (depreciation) | | | 16,037,927 | |
| | | | |
NET ASSETS | | $ | 825,792,609 | |
| | | | |
| |
NET ASSET VALUE | | | | |
Institutional — Based on net assets of $786,155,462 and 83,680,033 shares outstanding, 400,000,000 shares authorized, $0.10 par value | | $ | 9.39 | |
| | | | |
Investor A — Based on net assets of $31,321,113 and 3,468,788 shares outstanding, 300,000,000 shares authorized, $0.10 par value | | $ | 9.03 | |
| | | | |
Investor C — Based on net assets of $8,316,034 and 1,019,990 shares outstanding, 400,000,000 shares authorized, $0.10 par value | | $ | 8.15 | |
| | | | |
See notes to financial statements.
| | |
| 16 | | 2 0 1 8 B L A C K R O C K A N N U A L R E P O R T T O S H A R E H O L D E R S |
Statement of Operations
Year Ended September 30, 2018
| | | | |
| | | BlackRock Event
Driven Equity
Fund | |
| |
INVESTMENT INCOME | | | | |
Interest — unaffiliated | | $ | 2,994,411 | |
Dividends — affiliated | | | 5,510,563 | |
Dividends — unaffiliated | | | 418,753 | |
Securities lending income — affiliated — net | | | 513 | |
Foreign taxes withheld | | | (1,652 | ) |
| | | | |
Total investment income | | | 8,922,588 | |
| | | | |
| |
EXPENSES | | | | |
Investment advisory | | | 5,096,461 | |
Service and distribution — class specific | | | 147,170 | |
Transfer agent — class specific | | | 409,854 | |
Registration | | | 94,372 | |
Accounting services | | | 56,152 | |
Professional | | | 53,475 | |
Printing | | | 28,135 | |
Directors and Officer | | | 17,836 | |
Board realignment and consolidation | | | 14,313 | |
Custodian | | | 13,748 | |
Miscellaneous | | | 21,896 | |
| | | | |
Total expenses excluding interest expense | | | 5,953,412 | |
Interest expense — unaffiliated | | | 257,362 | |
| | | | |
Total expenses | | | 6,210,774 | |
| | | | |
Less: | | | | |
Fees waived and/or reimbursed by the Manager | | | (257,768 | ) |
Transfer agent fees waived and/or reimbursed — class specific | | | (4,747 | ) |
| | | | |
Total expenses after fees waived and/or reimbursed | | | 5,948,259 | |
| | | | |
Net investment income | | | 2,974,329 | |
| | | | |
| |
REALIZED AND UNREALIZED GAIN (LOSS) | | | | |
Net realized gain (loss) from: | | | | |
Investments — unaffiliated | | | 2,476,402 | |
Investments — affiliated | | | 16 | |
Borrowed bonds | | | 39,049 | |
Capital gain distributions received from investment companies — affiliated | | | 684 | |
Foreign currency transactions | | | 9,001 | |
Options written | | | 388,617 | |
Swaps | | | 3,211,427 | |
| | | | |
| | | 6,125,196 | |
| | | | |
Net change in unrealized appreciation (depreciation) on: | | | | |
Investments — unaffiliated | | | 744,664 | |
Investments — affiliated | | | 13 | |
Borrowed bonds | | | 34,114 | |
Foreign currency translations | | | (56,170 | ) |
Swaps | | | 12,265,815 | |
| | | | |
| | | 12,988,436 | |
| | | | |
Total realized and unrealized gain | | | 19,113,632 | �� |
| | | | |
NET INCREASE IN NET ASSETS RESULTING FROM OPERATIONS | | $ | 22,087,961 | |
| | | | |
See notes to financial statements.
| | | | |
| F I N A N C I A L S T A T E M E N T S | | | 17 | |
Statements of Changes in Net Assets
| | | | | | | | |
| | | BlackRock Event Driven Equity Fund | |
| | | Year Ended September 30, | |
| | | 2018 | | | 2017 | |
| | |
INCREASE (DECREASE) IN NET ASSETS | | | | | | | | |
| | |
OPERATIONS | | | | | | | | |
Net investment income (loss) | | $ | 2,974,329 | | | $ | (658,286 | ) |
Net realized gain | | | 6,125,196 | | | | 10,503,398 | |
Net change in unrealized appreciation (depreciation) | | | 12,988,436 | | | | 1,840,963 | |
| | | | | | | | |
Net increase in net assets resulting from operations | | | 22,087,961 | | | | 11,686,075 | |
| | | | | | | | |
| | |
DISTRIBUTIONS TO SHAREHOLDERS(a) | | | | | | | | |
From net realized gain: | | | | | | | | |
Institutional | | | (9,172,632 | ) | | | (895,189 | ) |
Investor A | | | (1,510,831 | ) | | | (245,734 | ) |
Investor C | | | (298,775 | ) | | | — | |
| | | | | | | | |
Decrease in net assets resulting from distributions to shareholders | | | (10,982,238 | ) | | | (1,140,923 | ) |
| | | | | | | | |
| | |
CAPITAL SHARE TRANSACTIONS | | | | | | | | |
Net increase in net assets derived from capital share transactions | | | 630,936,787 | | | | 64,523,033 | |
| | | | | | | | |
| | |
NET ASSETS | | | | | | | | |
Total increase in net assets | | | 642,042,510 | | | | 75,068,185 | |
Beginning of year | | | 183,750,099 | | | | 108,681,914 | |
| | | | | | | | |
End of year | | $ | 825,792,609 | | | $ | 183,750,099 | |
| | | | | | | | |
Undistributed net investment income, end of year | | $ | 4,067,807 | | | | — | |
| | | | | | | | |
| (a) | | Distributions for annual periods determined in accordance with U.S. federal income tax regulations. |
See notes to financial statements.
| | |
| 18 | | 2 0 1 8 B L A C K R O C K A N N U A L R E P O R T T O S H A R E H O L D E R S |
Financial Highlights
(For a share outstanding throughout each period)
| | | | | | | | | | | | | | | | | | | | | | | | | | | | |
| | | BlackRock Event Driven Equity Fund | |
| | | Institutional | |
| | | Year Ended September 30, | |
| | | | | | 2018 | | | 2017 | | | 2016 | | | 2015 | | | 2014 | | | | |
| |
Net asset value, beginning of year | | | | | | $ | 9.58 | | | $ | 8.80 | | | $ | 8.94 | | | $ | 14.55 | | | $ | 12.48 | | | | | |
| | | | | | | | | | | | | | | | | | | | | | | | | | | | |
Net investment income (loss)(a) | | | | | | | 0.07 | | | | (0.04 | ) | | | (0.06 | ) | | | (0.04 | ) | | | (0.01 | ) | | | | |
Net realized and unrealized gain | | | | | | | 0.20 | | | | 0.92 | | | | 0.46 | | | | 0.60 | | | | 2.08 | | | | | |
| | | | | | | | | | | | | | | | | | | | | | | | | | | | |
Net increase from investment operations | | | | | | | 0.27 | | | | 0.88 | | | | 0.40 | | | | 0.56 | | | | 2.07 | | | | | |
| | | | | | | | | | | | | | | | | | | | | | | | | | | | |
Distributions from net realized gain(b) | | | | | | | (0.46 | ) | | | (0.10 | ) | | | (0.58 | ) | | | (6.17 | ) | | | — | | | | | |
| | | | | | | | | | | | | | | | | | | | | | | | | | | | |
Capital contributions — affiliated(c) | | | | | | | — | | | | — | | | | 0.04 | | | | — | | | | — | | | | | |
| | | | | | | | | | | | | | | | | | | | | | | | | | | | |
Net asset value, end of year | | | | | | $ | 9.39 | | | $ | 9.58 | | | $ | 8.80 | | | $ | 8.94 | | | $ | 14.55 | | | | | |
| | | | | | | | | | | | | | | | | | | | | | | | | | | | |
| | | | | | | |
Total Return(d) | | | | | | | | | | | | | | | | | | | | | | | | | | | | |
Based on net asset value | | | | | | | 3.04 | % | | | 10.08 | % | | | 5.11 | %(e) | | | 2.28 | % | | | 16.59 | % | | | | |
| | | | | | | | | | | | | | | | | | | | | | | | | | | | |
| | | | | | | |
Ratios to Average Net Assets(f) | | | | | | | | | | | | | | | | | | | | | | | | | | | | |
Total expenses | | | | | | | 1.43 | % | | | 1.55 | % | | | 1.58 | % | | | 2.54 | % | | | 2.35 | % | | | | |
| | | | | | | | | | | | | | | | | | | | | | | | | | | | |
Total expenses after fees waived and/or reimbursed | | | | | | | 1.36 | % | | | 1.41 | % | | | 1.42 | % | | | 1.89 | % | | | 2.08 | % | | | | |
| | | | | | | | | | | | | | | | | | | | | | | | | | | | |
Total expenses after fees waived and/or reimbursed and excluding dividend expense | | | | | | | 1.36 | % | | | 1.41 | % | | | 1.42 | % | | | 1.65 | % | | | 1.66 | % | | | | |
| | | | | | | | | | | | | | | | | | | | | | | | | | | | |
Total expenses after fees waived and/or reimbursed and excluding dividend expense, stock loan fees and interest expense | | | | | | | 1.30 | % | | | 1.38 | % | | | 1.38 | % | | | 1.38 | % | | | 1.38 | % | | | | |
| | | | | | | | | | | | | | | | | | | | | | | | | | | | |
Net investment income (loss) | | | | | | | 0.75 | % | | | (0.39 | )% | | | (0.67 | )% | | | (0.26 | )% | | | (0.05 | )% | | | | |
| | | | | | | | | | | | | | | | | | | | | | | | | | | | |
| | | | | | | |
Supplemental Data | | | | | | | | | | | | | | | | | | | | | | | | | | | | |
Net assets, end of year (000) | | | | | | $ | 786,155 | | | $ | 145,557 | | | $ | 76,046 | | | $ | 8,077 | | | $ | 15,497 | | | | | |
| | | | | | | | | | | | | | | | | | | | | | | | | | | | |
Portfolio turnover rate | | | | | | | 135 | %(g) | | | 199 | %(g) | | | 233 | %(g) | | | 81 | %(g) | | | 44 | % | | | | |
| | | | | | | | | | | | | | | | | | | | | | | | | | | | |
| (a) | Based on average shares outstanding. |
| (b) | Distributions for annual periods determined in accordance with U.S. federal income tax regulations. |
| (c) | Payment received from affiliates related to certain shareholder transactions. |
| (d) | Where applicable, assumes the reinvestment of distributions. |
| (e) | Includes payment received from affiliates, which impacted the Fund’s total return. Excluding the payment from affiliates, the Fund’s total return is 4.64%. |
| (f) | Excludes expenses incurred indirectly as a result of investments in underlying funds as follows: |
| | | | | | | | | | | | | | | | | | | | | | | | | | | | | | | | | | | | | | | | | | | | |
| | | Year Ended September 30, | |
| | | | | | 2018 | | | | | | 2017 | | | | | | 2016 | | | | | | 2015 | | | | | | 2014 | | | | |
| |
Investments in underlying funds | | | | | | | 0.20 | % | | | | | | | 0.15 | % | | | | | | | 0.16 | % | | | | | | | 0.04 | % | | | | | | | — | | | | | |
| | | | | | | | | | | | | | | | | | | | | | | | | | | | | | | | | | | | | | | | | | | | |
| (g) | Excludes underlying investments in total return swaps. |
See notes to financial statements.
| | | | |
| F I N A N C I A L H I G H L I G H T S | | | 19 | |
Financial Highlights (continued)
(For a share outstanding throughout each period)
| | | | | | | | | | | | | | | | | | | | | | | | | | | | |
| | | BlackRock Event Driven Equity Fund (continued) | |
| | | Investor A | |
| | | Year Ended September 30, | |
| | | | | | 2018 | | | 2017 | | | 2016 | | | 2015 | | | 2014 | | | | |
| |
Net asset value, beginning of year | | | | | | $ | 9.22 | | | $ | 8.48 | | | $ | 8.65 | | | $ | 14.31 | | | $ | 12.30 | | | | | |
| | | | | | �� | | | | | | | | | | | | | | | | | | | | | | |
Net investment income (loss)(a) | | | | | | | 0.03 | | | | (0.06 | ) | | | (0.07 | ) | | | (0.07 | ) | | | (0.04 | ) | | | | |
Net realized and unrealized gain | | | | | | | 0.22 | | | | 0.88 | | | | 0.44 | | | | 0.58 | | | | 2.05 | | | | | |
| | | | | | | | | | | | | | | | | | | | | | | | | | | | |
Net increase from investment operations | | | | | | | 0.25 | | | | 0.82 | | | | 0.37 | | | | 0.51 | | | | 2.01 | | | | | |
| | | | | | | | | | | | | | | | | | | | | | | | | | | | |
Distributions from net realized gain(b) | | | | | | | (0.44 | ) | | | (0.08 | ) | | | (0.58 | ) | | | (6.17 | ) | | | — | | | | | |
| | | | | | | | | | | | | | | | | | | | | | | | | | | | |
Capital contributions — affiliated(c) | | | | | | | — | | | | — | | | | 0.04 | | | | — | | | | — | | | | | |
| | | | | | | | | | | | | | | | | | | | | | | | | | | | |
Net asset value, end of year | | | | | | $ | 9.03 | | | $ | 9.22 | | | $ | 8.48 | | | $ | 8.65 | | | $ | 14.31 | | | | | |
| | | | | | | | | | | | | | | | | | | | | | | | | | | | |
| | | | | | | |
Total Return(d) | | | | | | | | | | | | | | | | | | | | | | | | | | | | |
Based on net asset value | | | | | | | 2.86 | % | | | 9.71 | % | | | 4.92 | %(e) | | | 1.91 | % | | | 16.34 | % | | | | |
| | | | | | | |
Ratios to Average Net Assets(f) | | | | | | | | | | | | | | | | | | | | | | | | | | | | |
Total expenses | | | | | | | 1.69 | % | | | 1.86 | % | | | 1.92 | % | | | 2.85 | % | | | 2.64 | % | | | | |
Total expenses after fees waived and/or reimbursed | | | | | | | 1.63 | % | | | 1.68 | % | | | 1.70 | % | | | 2.12 | % | | | 2.35 | % | | | | |
| | | | | | | | | | | | | | | | | | | | | | | | | | | | |
Total expenses after fees waived and/or reimbursed and excluding dividend expense | | | | | | | 1.63 | % | | | 1.68 | % | | | 1.70 | % | | | 1.90 | % | | | 1.93 | % | | | | |
| | | | | | | | | | | | | | | | | | | | | | | | | | | | |
Total expenses after fees waived and/or reimbursed and excluding dividend expense, stock loan fees and interest expense | | | | | | | 1.59 | % | | | 1.65 | % | | | 1.65 | % | | | 1.65 | % | | | 1.65 | % | | | | |
| | | | | | | | | | | | | | | | | | | | | | | | | | | | |
Net investment income (loss) | | | | | | | 0.31 | % | | | (0.69 | )% | | | (0.88 | )% | | | (0.55 | )% | | | (0.32 | )% | | | | |
| | | | | | | | | | | | | | | | | | | | | | | | | | | | |
| | | | | | | |
Supplemental Data | | | | | | | | | | | | | | | | | | | | | | | | | | | | |
Net assets, end of year (000) | | | | | | $ | 31,321 | | | $ | 31,506 | | | $ | 26,523 | | | $ | 10,143 | | | $ | 12,238 | | | | | |
| | | | | | | | | | | | | | | | | | | | | | | | | | | | |
Portfolio turnover rate | | | | | | | 135 | %(g) | | | 199 | %(g) | | | 233 | %(g) | | | 81 | %(g) | | | 44 | % | | | | |
| | | | | | | | | | | | | | | | | | | | | | | | | | | | |
| (a) | Based on average shares outstanding. |
| (b) | Distributions for annual periods determined in accordance with U.S. federal income tax regulations. |
| (c) | Payment received from affiliates related to certain shareholder transactions. |
| (d) | Where applicable, excludes the effects of any sales charges and assumes the reinvestment of distributions. |
| (e) | Includes payment received from affiliates, which impacted the Fund’s total return. Excluding the payment from affiliates, the Fund’s total return is 4.43%. |
| (f) | Excludes expenses incurred indirectly as a result of investments in underlying funds as follows: |
| | | | | | | | | | | | | | | | | | | | | | | | | | | | | | | | | | | | | | | | | | | | |
| | | Year Ended September 30, | |
| | | | | | 2018 | | | | | | 2017 | | | | | | 2016 | | | | | | 2015 | | | | | | 2014 | | | | |
| |
Investments in underlying funds | | | | | | | 0.20 | % | | | | | | | 0.15 | % | | | | | | | 0.16 | % | | | | | | | 0.04 | % | | | | | | | — | | | | | |
| | | | | | | | | | | | | | | | | | | | | | | | | | | | | | | | | | | | | | | | | | | | |
| (g) | Excludes underlying investments in total return swaps. |
See notes to financial statements.
| | |
| 20 | | 2 0 1 8 B L A C K R O C K A N N U A L R E P O R T T O S H A R E H O L D E R S |
Financial Highlights (continued)
(For a share outstanding throughout each period)
| | | | | | | | | | | | | | | | | | | | | | | | | | |
| | | BlackRock Event Driven Equity Fund (continued) | |
| | | Investor C | |
| | | Year Ended September 30, | |
| | | | | 2018 | | | 2017 | | | 2016 | | | 2015 | | | 2014 | | | | |
| |
Net asset value, beginning of year | | | | $ | 8.37 | | | $ | 7.69 | | | $ | 7.94 | | | $ | 13.70 | | | $ | 11.87 | | | | | |
| | | | | | | | | | | | | | | | | | | | | | | | | | |
Net investment loss(a) | | | | | (0.03 | ) | | | (0.11 | ) | | | (0.12 | ) | | | (0.16 | ) | | | (0.14 | ) | | | | |
Net realized and unrealized gain | | | | | 0.19 | | | | 0.79 | | | | 0.41 | | | | 0.57 | | | | 1.97 | | | | | |
| | | | | | | | | | | | | | | | | | | | | | | | | | |
Net increase from investment operations | | | | | 0.16 | | | | 0.68 | | | | 0.29 | | | | 0.41 | | | | 1.83 | | | | | |
| | | | | | | | | | | | | | | | | | | | | | | | | | |
Distributions from net realized gain(b) | | | | | (0.38 | ) | | | — | | | | (0.58 | ) | | | (6.17 | ) | | | — | | | | | |
| | | | | | | | | | | | | | | | | | | | | | | | | | |
Capital contributions — affiliated(c) | | | | | — | | | | — | | | | 0.04 | | | | — | | | | — | | | | | |
| | | | | | | | | | | | | | | | | | | | | | | | | | |
Net asset value, end of year | | | | $ | 8.15 | | | $ | 8.37 | | | $ | 7.69 | | | $ | 7.94 | | | $ | 13.70 | | | | | |
| | | | | | | | | | | | | | | | | | | | | | | | | | |
| | | | | | | |
Total Return(d) | | | | | | | | | | | | | | | | | | | | | | | | | | |
Based on net asset value | | | | | 2.06 | % | | | 8.84 | % | | | 4.32 | %(e) | | | 1.16 | % | | | 15.42 | % | | | | |
| | | | | | | | | | | | | | | | | | | | | | | | | | |
| | | | | | | |
Ratios to Average Net Assets(f) | | | | | | | | | | | | | | | | | | | | | | | | | | |
Total expenses | | | | | 2.44 | % | | | 2.64 | % | | | 2.74 | % | | | 3.61 | % | | | 3.44 | % | | | | |
| | | | | | | | | | | | | | | | | | | | | | | | | | |
Total expenses after fees waived and/or reimbursed | | | | | 2.37 | % | | | 2.42 | % | | | 2.43 | % | | | 2.86 | % | | | 3.09 | % | | | | |
| | | | | | | | | | | | | | | | | | | | | | | | | | |
Total expenses after fees waived and/or reimbursed and excluding dividend expense | | | | | 2.37 | % | | | 2.42 | % | | | 2.43 | % | | | 2.64 | % | | | 2.67 | % | | | | |
| | | | | | | | | | | | | | | | | | | | | | | | | | |
Total expenses after fees waived and/or reimbursed and excluding dividend expense, stock loan fees and interest expense | | | | | 2.33 | % | | | 2.39 | % | | | 2.39 | % | | | 2.39 | % | | | 2.39 | % | | | | |
| | | | | | | | | | | | | | | | | | | | | | | | | | |
Net investment loss | | | | | (0.42 | )% | | | (1.38 | )% | | | (1.57 | )% | | | (1.28 | )% | | | (1.06 | )% | | | | |
| | | | | | | | | | | | | | | | | | | | | | | | | | |
| | | | | | | |
Supplemental Data | | | | | | | | | | | | | | | | | | | | | | | | | | |
Net assets, end of year (000) | | | | $ | 8,316 | | | $ | 6,686 | | | $ | 6,112 | | | $ | 6,165 | | | $ | 7,636 | | | | | |
| | | | | | | | | | | | | | | | | | | | | | | | | | |
Portfolio turnover rate | | | | | 135 | %(g) | | | 199 | %(g) | | | 233 | %(g) | | | 81 | %(g) | | | 44 | % | | | | |
| | | | | | | | | | | | | | | | | | | | | | | | | | |
| (a) | Based on average shares outstanding. |
| (b) | Distributions for annual periods determined in accordance with U.S. federal income tax regulations. |
| (c) | Payment received from affiliates related to certain shareholder transactions. |
| (d) | Where applicable, excludes the effects of any sales charges and assumes the reinvestment of distributions. |
| (e) | Includes payment received from affiliates, which impacted the Fund’s total return. Excluding the payment from affiliates, the Fund’s total return is 3.78%. |
| (f) | Excludes expenses incurred indirectly as a result of investments in underlying funds as follows: |
| | | | | | | | | | | | | | | | | | | | | | | | | | | | | | | | | | | | | | | | | | | | |
| | | Year Ended September 30, | |
| | | | | | 2018 | | | | | | 2017 | | | | | | 2016 | | | | | | 2015 | | | | | | 2014 | | | | |
| |
Investments in underlying funds | | | | | | | 0.20 | % | | | | | | | 0.15 | % | | | | | | | 0.16 | % | | | | | | | 0.04 | % | | | | | | | — | | | | | |
| | | | | | | | | | | | | | | | | | | | | | | | | | | | | | | | | | | | | | | | | | | | |
| (g) | Excludes underlying investments in total return swaps. |
See notes to financial statements.
| | | | |
| F I N A N C I A L H I G H L I G H T S | | | 21 | |
Notes to Financial Statements
BlackRock Large Cap Series Funds, Inc. (the “Corporation”) is registered under the Investment Company Act of 1940, as amended (the “1940 Act”), as an open-end management investment company. The Corporation is organized as a Maryland corporation. BlackRock Event Driven Equity Fund (the “Fund”) is a series of the Corporation. The Fund is classified as diversified.
The Fund offers multiple classes of shares. All classes of shares have identical voting, dividend, liquidation and other rights and are subject to the same terms and conditions, except that certain classes bear expenses related to the shareholder servicing and distribution of such shares. Institutional Shares are sold only to certain eligible investors. Investor A and Investor C Shares are generally available through financial intermediaries. Effective November 8, 2018, the Fund will adopt an automatic conversion feature whereby Investor C Shares will be automatically converted into Investor A Shares after a conversion period of approximately ten years, and, thereafter, investors will be subject to lower ongoing fees. Each class has exclusive voting rights with respect to matters relating to its shareholder servicing and distribution expenditures (except that Investor C shareholders may vote on material changes to the Investor A distribution and service plan).
| | | | | | | | |
| Share Class | | Initial Sales Charge | | CDSC | | | Conversion
Privilege |
Institutional Shares | | No | | | No | | | None |
Investor A Shares | | Yes | | | No | (a) | | None |
Investor C Shares | | No | | | Yes | (b) | | None |
| | (a) | Investor A Shares may be subject to a contingent deferred sales charge (“CDSC”) for certain redemptions where no initial sales charge was paid at the time of purchase. | |
| | (b) | There is no CDSC on Investor C Shares after one year. | |
The Fund, together with certain other registered investment companies advised by BlackRock Advisors, LLC (the “Manager”) or its affiliates, is included in a complex of open-end funds referred to as the Equity-Liquidity Complex.
| 2. | SIGNIFICANT ACCOUNTING POLICIES |
The financial statements are prepared in conformity with accounting principles generally accepted in the United States of America (“U.S. GAAP”), which may require management to make estimates and assumptions that affect the reported amounts of assets and liabilities in the financial statements, disclosure of contingent assets and liabilities at the date of the financial statements and the reported amounts of increases and decreases in net assets from operations during the reporting period. Actual results could differ from those estimates. The Fund is considered an investment company under U.S. GAAP and follows the accounting and reporting guidance applicable to investment companies. Below is a summary of significant accounting policies:
Investment Transactions and Income Recognition: For financial reporting purposes, investment transactions are recorded on the dates the transactions are entered into (the “trade dates”). Realized gains and losses on investment transactions are determined on the identified cost basis. Dividend income is recorded on the ex-dividend date. Dividends from foreign securities where the ex-dividend date may have passed are subsequently recorded when the Fund is informed of the ex-dividend date. Under the applicable foreign tax laws, a withholding tax at various rates may be imposed on capital gains, dividends and interest. Upon notification from issuers, a portion of the dividend income received from a real estate investment trust may be redesignated as a reduction of cost of the related investment and/or realized gain. Interest income, including amortization and accretion of premiums and discounts on debt securities, and payment-in-kind interest are recognized on an accrual basis. Income, expenses and realized and unrealized gains and losses are allocated daily to each class based on its relative net assets.
Foreign Currency Translation: The Fund’s books and records are maintained in U.S. dollars. Securities and other assets and liabilities denominated in foreign currencies are translated into U.S. dollars using exchange rates determined as of the close of trading on the New York Stock Exchange (“NYSE”). Purchases and sales of investments are recorded at the rates of exchange prevailing on the respective dates of such transactions. Generally, when the U.S. dollar rises in value against a foreign currency, the investments denominated in that currency will lose value; the opposite effect occurs if the U.S. dollar falls in relative value.
The Fund does not isolate the portion of the results of operations arising as a result of changes in the exchange rates from the changes in the market prices of investments held or sold for financial reporting purposes. Accordingly, the effects of changes in exchange rates on investments are not segregated in the Statement of Operations from the effects of changes in market prices of those investments, but are included as a component of net realized and unrealized gain (loss) from investments. The Fund reports realized currency gains (losses) on foreign currency related transactions as components of net realized gain (loss) for financial reporting purposes, whereas such components are generally treated as ordinary income for U.S. federal income tax purposes.
Defensive Positions: Investment policies may vary for temporary defensive purposes during periods in which the investment adviser believes that conditions in the securities markets or other economic, financial or political conditions warrant. Under such conditions, the Fund may invest up to 100% of its total assets in U.S. Government securities, certificates of deposit, repurchase agreements that involve purchases of debt securities, bankers’ acceptances and other bank obligations, commercial paper, money market funds and/or other debt securities, or may hold its assets in cash. The investment adviser applies this defensive posture as applicable and is consistent with the Fund’s investment policies.
Segregation and Collateralization: In cases where the Fund enters into certain investments (e.g., options written and swaps) that would be treated as “senior securities” for 1940 Act purposes, the Fund may segregate or designate on its books and records cash or liquid assets having a market value at least equal to the amount of its future obligations under such investments. Doing so allows the investment to be excluded from treatment as a “senior security.” Furthermore, if required by an exchange or counterparty agreement, the Fund may be required to deliver/deposit cash and/or securities to/with an exchange, or broker-dealer or custodian as collateral for certain investments or obligations.
Distributions: Distributions paid by the Fund are recorded on the ex-dividend date. Distributions of capital gains are recorded on the ex-dividend date and made at least annually. The character and timing of distributions are determined in accordance with U.S. federal income tax regulations, which may differ from U.S. GAAP.
| | |
| 22 | | 2 0 1 8 B L A C K R O C K A N N U A L R E P O R T T O S H A R E H O L D E R S |
Notes to Financial Statements (continued)
Recent Accounting Standards: In March 2017, the Financial Accounting Standards Board issued Accounting Standards Update “Premium Amortization of Purchased Callable Debt Securities” which amends the amortization period for certain purchased callable debt securities. Under the new guidance, the premium amortization of purchased callable debt securities that have explicit, non-contingent call features and are callable at fixed prices will be amortized to the earliest call date. The guidance will be applied on a modified retrospective basis and is effective for fiscal years, and their interim periods, beginning after December 15, 2018. Management is currently evaluating the impact of this guidance on the Fund.
In August 2018, the Financial Accounting Standards Board issued Accounting Standards Update 2018-13 “Changes to the Disclosure Requirements for Fair Value Measurement” which modifies disclosure requirements for fair value measurements. The guidance is effective for fiscal years beginning after December 15, 2019 and for interim periods within those fiscal years. Management is currently evaluating the impact of this guidance on the Fund.
Indemnifications: In the normal course of business, the Fund enters into contracts that contain a variety of representations that provide general indemnification. The Fund’s maximum exposure under these arrangements is unknown because it involves future potential claims against the Fund, which cannot be predicted with any certainty.
Other: Expenses directly related to the Fund or its classes are charged to the Fund or the applicable class. Other operating expenses shared by several funds, including other funds managed by the Manager, are prorated among those funds on the basis of relative net assets or other appropriate methods. Expenses directly related to the Fund and other shared expenses prorated to the Fund are allocated daily to each class based on its relative net assets or other appropriate methods.
The Fund has an arrangement with its custodian whereby credits are earned on uninvested cash balances, which could be used to reduce custody fees and/or overdraft charges. The Fund may incur charges on certain uninvested cash balances and overdrafts, subject to certain conditions.
| 3. | INVESTMENT VALUATION AND FAIR VALUE MEASUREMENTS |
Investment Valuation Policies: The Fund’s investments are valued at fair value (also referred to as “market value” within the financial statements) as of the close of trading on the NYSE (generally 4:00 p.m., Eastern time) (or if the reporting date falls on a day the NYSE is closed, investments are valued at fair value as of the period end). U.S. GAAP defines fair value as the price the Fund would receive to sell an asset or pay to transfer a liability in an orderly transaction between market participants at the measurement date. The Fund determines the fair values of its financial instruments using various independent dealers or pricing services under policies approved by the Board of Directors of the Corporation (the “Board”). The BlackRock Global Valuation Methodologies Committee (the “Global Valuation Committee”) is the committee formed by management to develop global pricing policies and procedures and to oversee the pricing function for all financial instruments.
Fair Value Inputs and Methodologies: The following methods and inputs are used to establish the fair value of the Fund’s assets and liabilities:
| | • | | Equity investments traded on a recognized securities exchange are valued at the official closing price each day, if available. For equity investments traded on more than one exchange, the official closing price on the exchange where the stock is primarily traded is used. Equity investments traded on a recognized exchange for which there were no sales on that day may be valued at the last available bid (long positions) or ask (short positions) price. |
Generally, trading in foreign instruments is substantially completed each day at various times prior to the close of trading on the NYSE. Occasionally, events affecting the values of such instruments may occur between the foreign market close and the close of trading on the NYSE that may not be reflected in the computation of the Fund’s net assets. Each business day, the Fund uses a pricing service to assist with the valuation of certain foreign exchange-traded equity securities and foreign exchange-traded and over-the-counter (“OTC”) options (the “Systematic Fair Value Price”). Using current market factors, the Systematic Fair Value Price is designed to value such foreign securities and foreign options at fair value as of the close of trading on the NYSE, which follows the close of the local markets.
| | • | | Fixed-income securities for which market quotations are readily available are generally valued using the last available bid prices or current market quotations provided by independent dealers or third party pricing services. Floating rate loan interests are valued at the mean of the bid prices from one or more independent brokers or dealers as obtained from a third party pricing service. Pricing services generally value fixed-income securities assuming orderly transactions of an institutional round lot size, but a fund may hold or transact in such securities in smaller, odd lot sizes. Odd lots may trade at lower prices than institutional round lots. The pricing services may use matrix pricing or valuation models that utilize certain inputs and assumptions to derive values, including transaction data (e.g., recent representative bids and offers), credit quality information, perceived market movements, news, and other relevant information. Certain fixed-income securities, including asset-backed and mortgage related securities may be valued based on valuation models that consider the estimated cash flows of each tranche of the entity, establish a benchmark yield and develop an estimated tranche specific spread to the benchmark yield based on the unique attributes of the tranche. The amortized cost method of valuation may be used with respect to debt obligations with sixty days or less remaining to maturity unless the Manager determines such method does not represent fair value. |
| | • | | Investments in open-end U.S. mutual funds are valued at net asset value (“NAV”) each business day. |
| | • | | The Fund values its investment in SL Liquidity Series, LLC, Money Market Series (the “Money Market Series”) at fair value, which is ordinarily based upon its pro rata ownership in the underlying fund’s net assets. The Money Market Series seeks current income consistent with maintaining liquidity and preserving capital. Although the Money Market Series is not registered under the 1940 Act, its investments may follow the parameters of investments by a money market fund that is subject to Rule 2a-7 under the 1940 Act. |
| | • | | Swap agreements are valued utilizing quotes received daily by the Fund’s pricing service or through brokers, which are derived using daily swap curves and models that incorporate a number of market data factors, such as discounted cash flows, trades and values of the underlying reference instruments. |
If events (e.g., a company announcement, market volatility or a natural disaster) occur that are expected to materially affect the value of such investments, or in the event that the application of these methods of valuation results in a price for an investment that is deemed not to be representative of the market value of such investment, or if a price is not available, the investment will be valued by the Global Valuation Committee, or its delegate, in accordance with a policy approved by the Board as reflecting fair value (“Fair Valued Investments”). The fair valuation approaches that may be used by the Global Valuation Committee will include market approach, income approach and cost approach. Valuation techniques such as discounted cash flow, use of market comparables and matrix pricing are types of valuation approaches and are typically used
| | | | |
| N O T E S T O F I N A N C I A L S T A T E M E N T S | | | 23 | |
Notes to Financial Statements (continued)
in determining fair value. When determining the price for Fair Valued Investments, the Global Valuation Committee, or its delegate, seeks to determine the price that the Fund might reasonably expect to receive or pay from the current sale or purchase of that asset or liability in an arm’s-length transaction. Fair value determinations shall be based upon all available factors that the Global Valuation Committee, or its delegate, deems relevant and consistent with the principles of fair value measurement. The pricing of all Fair Valued Investments is subsequently reported to the Board or a committee thereof on a quarterly basis.
Fair Value Hierarchy: Various inputs are used in determining the fair value of investments and derivative financial instruments. These inputs to valuation techniques are categorized into a fair value hierarchy consisting of three broad levels for financial statement purposes as follows:
| | • | | Level 1 — Unadjusted price quotations in active markets/exchanges for identical assets or liabilities that the Fund has the ability to access |
| | • | | Level 2 — Other observable inputs (including, but not limited to, quoted prices for similar assets or liabilities in markets that are active, quoted prices for identical or similar assets or liabilities in markets that are not active, inputs other than quoted prices that are observable for the assets or liabilities (such as interest rates, yield curves, volatilities, prepayment speeds, loss severities, credit risks and default rates) or other market–corroborated inputs) |
| | • | | Level 3 — Unobservable inputs based on the best information available in the circumstances, to the extent observable inputs are not available (including the Fund’s own assumptions used in determining the fair value of investments and derivative financial instruments) |
The hierarchy gives the highest priority to unadjusted quoted prices in active markets for identical assets or liabilities (Level 1 measurements) and the lowest priority to unobservable inputs (Level 3 measurements). Accordingly, the degree of judgment exercised in determining fair value is greatest for instruments categorized in Level 3. The inputs used to measure fair value may fall into different levels of the fair value hierarchy. In such cases, for disclosure purposes, the fair value hierarchy classification is determined based on the lowest level input that is significant to the fair value measurement in its entirety. Investments classified within Level 3 have significant unobservable inputs used by the Global Valuation Committee in determining the price for Fair Valued Investments. Level 3 investments include equity or debt issued by privately held companies or funds. There may not be a secondary market, and/or there are a limited number of investors. Level 3 investments may also be adjusted to reflect illiquidity and/or non-transferability, with the amount of such discount estimated by the Global Valuation Committee in the absence of market information.
Changes in valuation techniques may result in transfers into or out of an assigned level within the hierarchy. In accordance with the Fund’s policy, transfers between different levels of the fair value hierarchy are deemed to have occurred as of the beginning of the reporting period. The categorization of a value determined for investments and derivative financial instruments is based on the pricing transparency of the investments and derivative financial instruments and is not necessarily an indication of the risks associated with investing in those securities.
As of September 30, 2018, certain investments of the Fund were valued using net asset value per share NAV as no quoted market value is available and therefore have been excluded from the fair value hierarchy.
| 4. | SECURITIES AND OTHER INVESTMENTS |
Floating Rate Loan Interests: Floating rate loan interests are typically issued to companies (the “borrower”) by banks, other financial institutions, or privately and publicly offered corporations (the “lender”). Floating rate loan interests are generally non-investment grade, often involve borrowers whose financial condition is troubled or uncertain and companies that are highly leveraged or in bankruptcy proceedings. In addition, transactions in floating rate loan interests may settle on a delayed basis, which may result in proceeds from the sale not being readily available for a fund to make additional investments or meet its redemption obligations. Floating rate loan interests may include fully funded term loans or revolving lines of credit. Floating rate loan interests are typically senior in the corporate capital structure of the borrower. Floating rate loan interests generally pay interest at rates that are periodically determined by reference to a base lending rate plus a premium. Since the rates reset only periodically, changes in prevailing interest rates (and particularly sudden and significant changes) can be expected to cause some fluctuations in the NAV of a fund to the extent that it invests in floating rate loan interests. The base lending rates are generally the lending rate offered by one or more European banks, such as the London Interbank Offered Rate (“LIBOR”), the prime rate offered by one or more U.S. banks or the certificate of deposit rate. Floating rate loan interests may involve foreign borrowers, and investments may be denominated in foreign currencies. These investments are treated as investments in debt securities for purposes of a fund’s investment policies.
When a fund purchases a floating rate loan interest, it may receive a facility fee and when it sells a floating rate loan interest, it may pay a facility fee. On an ongoing basis, a fund may receive a commitment fee based on the undrawn portion of the underlying line of credit amount of a floating rate loan interest. Facility and commitment fees are typically amortized to income over the term of the loan or term of the commitment, respectively. Consent and amendment fees are recorded to income as earned. Prepayment penalty fees, which may be received by a fund upon the prepayment of a floating rate loan interest by a borrower, are recorded as realized gains. A fund may invest in multiple series or tranches of a loan. A different series or tranche may have varying terms and carry different associated risks.
Floating rate loan interests are usually freely callable at the borrower’s option. A fund may invest in such loans in the form of participations in loans (“Participations”) or assignments (“Assignments”) of all or a portion of loans from third parties. Participations typically will result in a fund having a contractual relationship only with the lender, not with the borrower. A fund has the right to receive payments of principal, interest and any fees to which it is entitled only from the lender selling the Participation and only upon receipt by the lender of the payments from the borrower. In connection with purchasing Participations, a fund generally will have no right to enforce compliance by the borrower with the terms of the loan agreement, nor any rights of offset against the borrower. A fund may not benefit directly from any collateral supporting the loan in which it has purchased the Participation. As a result, a fund assumes the credit risk of both the borrower and the lender that is selling the Participation. A fund’s investment in loan participation interests involves the risk of insolvency of the financial intermediaries who are parties to the transactions. In the event of the insolvency of the lender selling the Participation, a fund may be treated as a general creditor of the lender and may not benefit from any offset between the lender and the borrower. Assignments typically result in a fund having a direct contractual relationship with the borrower, and a fund may enforce compliance by the borrower with the terms of the loan agreement.
Borrowed Bond Agreements: Repurchase agreements may be referred to as borrowed bond agreements when entered into in connection with short sales of bonds. In a borrowed bond agreement, a fund borrows a bond from a counterparty in exchange for cash collateral. The agreement contains a commitment that the security and the cash will be returned to the counterparty and a fund at a mutually agreed upon date. Certain agreements have no stated maturity and can be terminated by either party at any time. Earnings on cash collateral and compensation to the lender of the bond are based on agreed upon rates between a fund and the counterparty. The value of the underlying cash collateral approximates the market value and accrued interest of the borrowed bond. To the extent that a borrowed bond transaction exceeds one business day,
| | |
| 24 | | 2 0 1 8 B L A C K R O C K A N N U A L R E P O R T T O S H A R E H O L D E R S |
Notes to Financial Statements (continued)
the value of the cash collateral in the possession of the counterparty is monitored on a daily basis to ensure the adequacy of the collateral. As the market value of the borrowed bond changes, the cash collateral is periodically increased or decreased with a frequency and in amounts prescribed in the borrowed bond agreement. A fund may also experience delays in gaining access to the collateral.
Borrowed bond agreements are entered into by a fund under Master Repurchase Agreements (each, an “MRA”), which permit a fund, under certain circumstances, including an event of default (such as bankruptcy or insolvency), to offset payables and/or receivables under the MRA with collateral held and/or posted to the counterparty and create one single net payment due to or from a fund. With borrowed bond agreements, typically a fund and counterparty under an MRA are permitted to sell, re-pledge, or use the collateral associated with the transaction. Bankruptcy or insolvency laws of a particular jurisdiction may impose restrictions on or prohibitions against such a right of offset in the event of the MRA counterparty’s bankruptcy or insolvency. Pursuant to the terms of the MRA, a fund receives or posts securities and cash as collateral with a market value in excess of the repurchase price to be paid or received by a fund upon the maturity of the transaction. Upon a bankruptcy or insolvency of the MRA counterparty, a fund is considered an unsecured creditor with respect to excess collateral and, as such, the return of excess collateral may be delayed.
As of period end, the following table is a summary of the Fund’s open borrowed bond agreements by counterparty which are subject to offset under an MRA on a net basis:
| | | | | | | | | | | | | | | | | | | | | | | | | | | | |
| |
| Counterparty | | Borrowed
Bond
Agreements(a) | | | Borrowed Bonds
at Value Including
Accrued Interest(b) | | | Exposure Due (to)/from
Counterparty
Before Collateral | | | Cash
Collateral
Received | | | Net Exposure
Due to
Counterparty(c) | |
| |
Citigroup Global Markets, Inc. | | | $4,674,177 | | | | $(4,701,012 | ) | | | | | | | $(26,835 | ) | | | $— | | | | | | | | $(26,835 | ) |
| | | | | | | | | | | | | | | | | | | | | | | | | | | | |
| | (a) | Included in investments at value-unaffiliated in the Statement of Assets and Liabilities. | |
| | (b) | Includes accrued interest on borrowed bonds in the amount of $89,951 which is included in interest expense payable in the Statement of Assets and Liabilities. | |
| | (c) | Net exposure represents the net receivable (payable) that would be due from/to the counterparty in the event of default. | |
When a fund enters into an MRA and International Swaps and Derivatives Association, Inc. (an “ISDA”) and/or Master Securities Lending Agreements (“MSLA”) with the same counterparty, the agreements may contain a set-off provision allowing a fund to offset a net amount payable with a net amount receivable upon default of the counterparty. Bankruptcy or insolvency laws of a particular jurisdiction may restrict or prohibit the right of offset in bankruptcy, insolvency or other events. For example, regardless of the contractual rights included in an MRA, such laws may prohibit a fund from setting off amounts owed to a defaulting counterparty under an MRA against amounts owed to a fund by affiliates of the defaulting counterparty. However, the insolvency regimes of many jurisdictions generally permit set-off of simultaneous payables and receivables with the same legal entity under certain types of financial contracts. These rules would apply upon a default of the legal entity, regardless of the existence of a contractual set-off right in those contracts.
In the event the counterparty of securities under an MRA files for bankruptcy or becomes insolvent, a fund’s use of the proceeds from the agreement may be restricted while the counterparty, or its trustee or receiver, determines whether or not to enforce a fund’s obligation to repurchase the securities.
Short Sale Transactions: In short sale transactions, a fund sells a security it does not hold in anticipation of a decline in the market price of that security. When a fund makes a short sale, it will borrow the security sold short (borrowed bond) and deliver the fixed-income security to the counterparty to which it sold the security short. An amount equal to the proceeds received by a fund is reflected as an asset and an equivalent liability. The amount of the liability is subsequently marked-to-market to reflect the market value of the short sale. A fund is required to repay the counterparty interest on the security sold short, which, if applicable, is included in interest expense in the Statement of Operations. A fund is exposed to market risk based on the amount, if any, that the market value of the security increases beyond the market value at which the position was sold. Thus, a short sale of a security involves the risk that instead of declining, the price of the security sold short will rise. The short sale of securities involves the possibility of an unlimited loss since there is an unlimited potential for the market price of the security sold short to increase. A gain is limited to the price at which a fund sold the security short. A realized gain or loss is recognized upon the termination of a short sale if the market price is either less than or greater than the proceeds originally received. There is no assurance that a fund will be able to close out a short position at a particular time or at an acceptable price.
Securities Lending: The Fund may lend its securities to approved borrowers, such as brokers, dealers and other financial institutions. The borrower pledges and maintains with the Fund collateral consisting of cash, an irrevocable letter of credit issued by a bank, or securities issued or guaranteed by the U.S. Government. The initial collateral received by the Fund is required to have a value of at least 102% of the current value of the loaned securities for securities traded on U.S. exchanges and a value of at least 105% for all other securities. The collateral is maintained thereafter at a value equal to at least 100% of the current market value of the securities on loan. The market value of the loaned securities is determined at the close of each business day of the Fund and any additional required collateral is delivered to the Fund, or excess collateral returned by the Fund, on the next business day. During the term of the loan, the Fund is entitled to all distributions made on or in respect of the loaned securities, but does not receive interest income on securities received as collateral. Loans of securities are terminable at any time and the borrower, after notice, is required to return borrowed securities within the standard time period for settlement of securities transactions.
The market value of any securities on loan, all of which were classified as common stocks in the Fund’s Schedule of Investments, and the value of any related collateral are shown separately in the Statement of Assets and Liabilities as a component of investments at value — unaffiliated, and collateral on securities loaned at value, respectively. As of period end, any securities on loan were collateralized by cash and/or U.S. Government obligations. Cash collateral invested by the securities lending agent, BlackRock Investment Management, LLC (“BIM”), if any, is disclosed in the Schedule of Investments.
Securities lending transactions are entered into by the Fund under Master Securities Lending Agreements (each, an “MSLA”), which provide the right, in the event of default (including bankruptcy or insolvency), for the non-defaulting party to liquidate the collateral and calculate a net exposure to the defaulting party or request additional collateral. In the event that a borrower defaults, the Fund, as lender, would offset the market value of the collateral received against the market value of the securities loaned. When the value of the collateral is greater than that of the market value of the securities loaned, the lender is left with a net amount payable to the defaulting party. However, bankruptcy or insolvency laws of a particular jurisdiction may impose restrictions on or prohibitions against such a right of offset in the event of an MSLA counterparty’s bankruptcy or insolvency. Under the MSLA, absent an event of default, the borrower can resell or re-pledge the loaned securities, and the Fund can reinvest cash collateral received in connection with loaned securities. Upon an event of default, the parties’ obligations to return the securities or collateral to the other party are extinguished, and the parties can resell or re-pledge the loaned securities or the collateral received in connection with the loaned securities in order to satisfy the defaulting party’s net payment obligation for all transactions under the MSLA. The defaulting party remains liable for any deficiency.
| | | | |
| N O T E S T O F I N A N C I A L S T A T E M E N T S | | | 25 | |
Notes to Financial Statements (continued)
As of period end, the following table is a summary of the Fund’s securities lending agreements by counterparty which are subject to offset under an MSLA:
| | | | | | | | | | | | |
| Counterparty | | Securities
Loaned
at Value | | | Cash
Collateral
Received(a) | | | Net
Amount | |
Citigroup Global Markets, Inc. | | $ | 248,326 | | | | $(248,326 | ) | | $ | — | |
| | | | | | | | | | | | |
| | (a) | Cash collateral with a value of $251,629 has been received in connection with securities lending agreements. Collateral received in excess of the value of securities loaned from the individual counterparty is not shown for financial reporting purposes in the table above. | |
The risks of securities lending include the risk that the borrower may not provide additional collateral when required or may not return the securities when due. To mitigate these risks, the Fund benefits from a borrower default indemnity provided by BIM. BIM’s indemnity allows for full replacement of the securities loaned if the collateral received does not cover the value on the securities loaned in the event of borrower default. The Fund could incur a loss if the value of an investment purchased with cash collateral falls below the market value of loaned securities or if the value of an investment purchased with cash collateral falls below the value of the original cash collateral received.
| 5. | DERIVATIVE FINANCIAL INSTRUMENTS |
The Fund engages in various portfolio investment strategies using derivative contracts both to increase the returns of the Fund and/or to manage its exposure to certain risks such as credit risk, equity risk, interest rate risk, foreign currency exchange rate risk, commodity price risk or other risks (e.g., inflation risk). Derivative financial instruments categorized by risk exposure are included in the Schedule of Investments. These contracts may be transacted on an exchange or OTC.
Options: The Fund purchases and writes call and put options to increase or decrease its exposure to the risks of underlying instruments, including equity risk, interest rate risk and/or commodity price risk and/or, in the case of options written, to generate gains from options premiums.
A call option gives the purchaser (holder) of the option the right (but not the obligation) to buy, and obligates the seller (writer) to sell (when the option is exercised) the underlying instrument at the exercise or strike price at any time or at a specified time during the option period. A put option gives the holder the right to sell and obligates the writer to buy the underlying instrument at the exercise or strike price at any time or at a specified time during the option period.
Premiums paid on options purchased and premiums received on options written, as well as the daily fluctuation in market value, are included in investments at value — unaffiliated and options written at value, respectively, in the Statement of Assets and Liabilities. When an instrument is purchased or sold through the exercise of an option, the premium is offset against the cost or proceeds of the underlying instrument. When an option expires, a realized gain or loss is recorded in the Statement of Operations to the extent of the premiums received or paid. When an option is closed or sold, a gain or loss is recorded in the Statement of Operations to the extent the cost of the closing transaction exceeds the premiums received or paid. When the Fund writes a call option, such option is typically “covered,” meaning that it holds the underlying instrument subject to being called by the option counterparty. When the Fund writes a put option, such option is covered by cash in an amount sufficient to cover the obligation. These amounts, which are considered restricted, are included in cash pledged as collateral for options written in the Statement of Assets and Liabilities.
In purchasing and writing options, the Fund bears the risk of an unfavorable change in the value of the underlying instrument or the risk that it may not be able to enter into a closing transaction due to an illiquid market. Exercise of a written option could result in the Fund purchasing or selling a security when it otherwise would not, or at a price different from the current market value.
Swaps: Swap contracts are entered into to manage exposure to issuers, markets and securities. Such contracts are agreements between the Fund and a counterparty to make periodic net payments on a specified notional amount or a net payment upon termination. Swap agreements are privately negotiated in the OTC market and may be entered into as a bilateral contract (“OTC swaps”) or centrally cleared (“centrally cleared swaps”).
For OTC swaps, any upfront premiums paid and any upfront fees received are shown as swap premiums paid and swap premiums received, respectively, in the Statement of Assets and Liabilities and amortized over the term of the contract. The daily fluctuation in market value is recorded as unrealized appreciation (depreciation) on OTC Swaps in the Statement of Assets and Liabilities. Payments received or paid are recorded in the Statement of Operations as realized gains or losses, respectively. When an OTC swap is terminated, a realized gain or loss is recorded in the Statement of Operations equal to the difference between the proceeds from (or cost of) the closing transaction and the Fund’s basis in the contract, if any. Generally, the basis of the contract is the premium received or paid.
In a centrally cleared swap, immediately following execution of the swap contract, the swap contract is novated to a central counterparty (the “CCP”) and the Fund’s counterparty on the swap agreement becomes the CCP. The Fund is required to interface with the CCP through the broker. Upon entering into a centrally cleared swap, the Fund is required to deposit initial margin with the broker in the form of cash or securities in an amount that varies depending on the size and risk profile of the particular swap. Securities deposited as initial margin are designated in the Schedule of Investments and cash deposited is shown as cash pledged for centrally cleared swaps in the Statement of Assets and Liabilities. Amounts pledged, which are considered restricted cash, are included in cash pledged for centrally cleared swaps in the Statement of Assets and Liabilities. Pursuant to the contract, the Fund agrees to receive from or pay to the broker an amount of cash equal to the daily fluctuation in market value of the contract (“variation margin”). Variation margin is recorded as unrealized appreciation (depreciation) and shown as variation margin receivable (or payable) on centrally cleared swaps in the Statement of Assets and Liabilities. Payments received from (paid to) the counterparty, including at termination, are recorded as realized gains (losses) in the Statement of Operations.
| | • | | Credit default swaps — Credit default swaps are entered into to manage exposure to the market or certain sectors of the market, to reduce risk exposure to defaults of corporate and/or sovereign issuers or to create exposure to corporate and/or sovereign issuers to which a fund is not otherwise exposed (credit risk). |
| | |
| 26 | | 2 0 1 8 B L A C K R O C K A N N U A L R E P O R T T O S H A R E H O L D E R S |
Notes to Financial Statements (continued)
| | The Fund may either buy or sell (write) credit default swaps on single-name issuers (corporate or sovereign), a combination or basket of single-name issuers or traded indexes. Credit default swaps are agreements in which the protection buyer pays fixed periodic payments to the seller in consideration for a promise from the protection seller to make a specific payment should a negative credit event take place with respect to the referenced entity (e.g., bankruptcy, failure to pay, obligation acceleration, repudiation, moratorium or restructuring). As a buyer, if an underlying credit event occurs, the Fund will either (i) receive from the seller an amount equal to the notional amount of the swap and deliver the referenced security or underlying securities comprising the index, or (ii) receive a net settlement of cash equal to the notional amount of the swap less the recovery value of the security or underlying securities comprising the index. As a seller (writer), if an underlying credit event occurs, the Fund will either pay the buyer an amount equal to the notional amount of the swap and take delivery of the referenced security or underlying securities comprising the index or pay a net settlement of cash equal to the notional amount of the swap less the recovery value of the security or underlying securities comprising the index. |
| | • | | Total return swaps — Total return swaps are entered into to obtain exposure to a security or market without owning such security or investing directly in such market or to exchange the risk/return of one market (e.g., fixed-income) with another market (e.g., equity or commodity prices) (equity risk, commodity price risk and/or interest rate risk). |
Total return swaps are agreements in which there is an exchange of cash flows whereby one party commits to make payments based on the total return (distributions plus capital gains/losses) of an underlying instrument, or basket or underlying instruments, in exchange for fixed or floating rate interest payments. If the total return of the instrument(s) or index underlying the transaction exceeds or falls short of the offsetting fixed or floating interest rate obligation, the Fund receives payment from or makes a payment to the counterparty.
Certain total return swaps are designed to function as a portfolio of direct investments in long and short equity positions. This means that the Fund has the ability to trade in and out of these long and short positions within the swap and will receive the economic benefits and risks equivalent to direct investment in these positions, subject to certain adjustments due to events related to the counterparty. Benefits and risks include capital appreciation (depreciation), corporate actions and dividends received and paid, all of which are reflected in the swap’s market value. The market value also includes interest charges and credits (“financing fees”) related to the notional values of the long and short positions and cash balances within the swap. These interest charges and credits are based on a specified benchmark rate plus or minus a specified spread determined based upon the country and/or currency of the positions in the portfolio.
Positions within the swap and financing fees are reset periodically. During a reset, any unrealized appreciation (depreciation) on positions and accrued financing fees become available for cash settlement between the Fund and the counterparty. The amounts that are available for cash settlement are recorded as realized gains or losses in the Statement of Operations. Cash settlement in and out of the swap may occur at a reset date or any other date, at the discretion of the Fund and the counterparty, over the life of the agreement. Certain swaps have no stated expiration and can be terminated by either party at any time.
Master Netting Arrangements: In order to define its contractual rights and to secure rights that will help it mitigate its counterparty risk, the Fund may enter into an International Swaps and Derivatives Association, Inc. Master Agreement (“ISDA Master Agreement”) or similar agreement with its counterparties. An ISDA Master Agreement is a bilateral agreement between the Fund and a counterparty that governs certain OTC derivatives and typically contains, among other things, collateral posting terms and netting provisions in the event of a default and/or termination event. Under an ISDA Master Agreement, the Fund may, under certain circumstances, offset with the counterparty certain derivative financial instruments’ payables and/or receivables with collateral held and/or posted and create one single net payment. The provisions of the ISDA Master Agreement typically permit a single net payment in the event of default including the bankruptcy or insolvency of the counterparty. Bankruptcy or insolvency laws of a particular jurisdiction may restrict or prohibit the right of offset in bankruptcy, insolvency or other events.
Collateral Requirements: For derivatives traded under an ISDA Master Agreement, the collateral requirements are typically calculated by netting the mark-to-market amount for each transaction under such agreement and comparing that amount to the value of any collateral currently pledged by the Fund and the counterparty.
Cash collateral that has been pledged to cover obligations of the Fund and cash collateral received from the counterparty, if any, is reported separately in the Statement of Assets and Liabilities as cash pledged as collateral and cash received as collateral, respectively. Non-cash collateral pledged by the Fund, if any, is noted in the Schedule of Investments. Generally, the amount of collateral due from or to a counterparty is subject to a certain minimum transfer amount threshold before a transfer is required, which is determined at the close of business of the Fund. Any additional required collateral is delivered to/pledged by the Fund on the next business day. Typically, the counterparty is not permitted to sell, re-pledge or use cash and non-cash collateral it receives. The Fund generally agrees not to use non-cash collateral that it receives but may, absent default or certain other circumstances defined in the underlying ISDA Master Agreement, be permitted to use cash collateral received. In such cases, interest may be paid pursuant to the collateral arrangement with the counterparty. To the extent amounts due to the Fund from its counterparties are not fully collateralized, it bears the risk of loss from counterparty non-performance. Likewise, to the extent the Fund has delivered collateral to a counterparty and stands ready to perform under the terms of its agreement with such counterparty, it bears the risk of loss from a counterparty in the amount of the value of the collateral in the event the counterparty fails to return such collateral. Based on the terms of agreements, collateral may not be required for all derivative contracts.
For financial reporting purposes, the Fund does not offset derivative assets and derivative liabilities that are subject to netting arrangements, if any, in the Statement of Assets and Liabilities.
| 6. | INVESTMENT ADVISORY AGREEMENT AND OTHER TRANSACTIONS WITH AFFILIATES |
The PNC Financial Services Group, Inc. is the largest stockholder and an affiliate of BlackRock, Inc. (“BlackRock”) for 1940 Act purposes.
Investment Advisory: The Corporation, on behalf of the Fund, entered into an Investment Advisory Agreement with the Manager, the Fund’s investment adviser and an indirect, wholly-owned subsidiary of BlackRock, to provide investment advisory and administrative services. The Manager is responsible for the management of the Fund’s portfolio and provides the personnel, facilities, equipment and certain other services necessary to the operations of the Fund.
| | | | |
| N O T E S T O F I N A N C I A L S T A T E M E N T S | | | 27 | |
Notes to Financial Statements (continued)
For such services, the Fund pays the Manager a monthly fee at an annual rate equal to the following percentages of the average daily value of the Fund’s net assets:
| | | | |
| |
| Average Daily Net Assets | | Investment
Advisory
Fees | |
| |
First $1 Billion | | | 1.20 | % |
$1 Billion — $3 Billion | | | 1.13 | |
$3 Billion — $5 Billion | | | 1.08 | |
$5 Billion — $10 Billion | | | 1.04 | |
Greater than $10 Billion | | | 1.02 | |
| |
Service and Distribution Fees: The Corporation, on behalf of the Fund, entered into a Distribution Agreement and Distribution Plan with BlackRock Investments, LLC (“BRIL”), an affiliate of the Manager. Pursuant to the Distribution Plan and in accordance with Rule 12b-1 under the 1940 Act, the Fund pays BRIL ongoing service and distribution fees. The fees are accrued daily and paid monthly at annual rates based upon the average daily net assets of the relevant share class of the Fund as follows:
| | | | | | | | |
| |
| | | Service
Fees | | | Distribution
Fees | |
| |
Investor A | | | 0.25 | % | | | — | % |
Investor C | | | 0.25 | | | | 0.75 | |
| |
BRIL and broker-dealers, pursuant to sub-agreements with BRIL, provide shareholder servicing and distribution services to the Fund. The ongoing service and/or distribution fee compensates BRIL and each broker-dealer for providing shareholder servicing and/or distribution related services to shareholders.
For the year ended September 30, 2018, the following table shows the class specific service and distribution fees borne directly by each share class of the Fund:
| | | | |
| Investor A | | Investor C | | Total |
|
$74,670 | | $72,500 | | $147,170 |
|
Transfer Agent: Pursuant to written agreements, certain financial intermediaries, some of which may be affiliates, provide the Fund with sub-accounting, recordkeeping, sub-transfer agency and other administrative services with respect to sub-accounts they service. For these services, these entities receive an asset-based fee or an annual fee per shareholder account, which will vary depending on share class and/or net assets. For the year ended September 30, 2018, the Fund’s Institutional Shares paid $132,074 to affiliates of BlackRock in return for these services, which are included in transfer agent — class specific in the Statement of Operations.
The Manager maintains a call center that is responsible for providing certain shareholder services to the Fund. Shareholder services include responding to inquiries and processing subscriptions and redemptions based upon instructions from shareholders. For the year ended September 30, 2018, the Fund reimbursed the Manager the following amounts for costs incurred in running the call center, which are included in transfer agent — class specific in the Statement of Operations:
| | | | | | |
| Institutional | | Investor A | | Investor C | | Total |
|
$868 | | $1,584 | | $666 | | $3,118 |
|
For the year ended September 30, 2018, the following table shows the class specific transfer agent fees borne directly by each share class of the Fund:
| | | | | | |
| Institutional | | Investor A | | Investor C | | Total |
|
$364,729 | | $36,878 | | $8,247 | | $409,854 |
|
Other Fees: For the year ended September 30, 2018, affiliates earned underwriting discounts, direct commissions and dealer concessions on sales of the Fund’s Investor A Shares of $3,382.
For the year ended September 30, 2018, affiliates received CDSCs as follows:
| | | | |
| |
Investor A | | $ | 1,363 | |
Investor C | | | 2,634 | |
| |
Expense Limitations, Waivers and Reimbursements: With respect to the Fund, the Manager voluntarily agreed to waive its investment advisory fees by the amount of investment advisory fees the Fund pays to the Manager indirectly through its investment in affiliated money market funds (the “affiliated money market fund waiver”). The amount of waivers and/or reimbursements of fees and expenses made pursuant to the expense limitation described below will be reduced by the amount of the affiliated money market fund waiver. This amount is included in fees waived and/or reimbursed by the Manager in the Statement of Operations. For the year ended September 30, 2018, the Manager waived $242,840.
The Manager has contractually agreed to waive its investment advisory fee with respect to any portion of the Fund’s assets invested in affiliated equity and fixed-income mutual funds and affiliated exchange-traded funds that have a contractual management fee through January 31, 2019. The contractual agreement may be terminated upon 90 days’ notice by a majority of the directors who are not “interested persons” of the Fund, as defined in the 1940 Act (“Independent Directors”), or by a vote of a majority of the outstanding voting securities of the Fund. This amount is included in fees waived and/or reimbursed by the Manager in the Statement of Operations. For the year ended September 30, 2018, there were no fees waived by the Manager.
| | |
| 28 | | 2 0 1 8 B L A C K R O C K A N N U A L R E P O R T T O S H A R E H O L D E R S |
Notes to Financial Statements (continued)
With respect to the Fund, the Manager contractually agreed to waive and/or reimburse fees or expenses in order to limit expenses, excluding interest expense, dividend expense, tax expense, acquired fund fees and expenses, and certain other fund expenses, which constitute extraordinary expenses not incurred in the ordinary course of the Fund’s business (“expense limitation”). The expense limitations as a percentage of average daily net assets are as follows:
| | | | |
| |
Institutional | | | 1.38 | % |
Investor A | | | 1.65 | |
Investor C | | | 2.39 | |
| |
The Manager has agreed not to reduce or discontinue this contractual expense limitation through January 31, 2019, unless approved by the Board, including a majority of the Independent Directors, or by a vote of a majority of the outstanding voting securities of the Fund. For the year ended September 30, 2018, the Manager waived and/or reimbursed $615, which is included in fees waived and/or reimbursed by the Manager in the Statement of Operations.
These amounts waived and/or reimbursed are included in transfer agent fees waived and/or reimbursed — class specific in the Statement of Operations. For the year ended September 30, 2018, class specific expense waivers and/or reimbursements are as follows:
| | | | | | | | | | | | | | | | |
| | | Institutional | | | Investor A | | | Investor C | | | Total | |
Transfer agent fees waived and/or reimbursed | | | $3,096 | | | | $1,130 | | | | $521 | | | | $4,747 | |
For the year ended September 30, 2018, the Fund reimbursed the Manager $3,100 for certain accounting services, which is included in accounting services in the Statement of Operations.
The Fund has begun to incur expenses in connection with a potential realignment and consolidation of the boards of directors of certain BlackRock-advised funds. The Manager has voluntarily agreed to reimburse the Fund for all or a portion of such expenses, which amounts are included in fees waived and/or reimbursed by the Manager in the Statement of Operations. For the year ended September 30, 2018, the amount reimbursed for the Fund was $14,313.
Securities Lending: The U.S. Securities and Exchange Commission (“SEC”) has issued an exemptive order which permits BIM, an affiliate of the Manager, to serve as securities lending agent for the Fund, subject to applicable conditions. As securities lending agent, BIM bears all operational costs directly related to securities lending. The Fund is responsible for expenses in connection with the investment of cash collateral received for securities on loan (the “collateral investment expenses”). The cash collateral is invested in a private investment company managed by the Manager or its affiliates. However, BIM has agreed to cap the collateral investment expenses of the private investment company to an annual rate of 0.04%. The investment adviser to the private investment company will not charge any advisory fees with respect to shares purchased by the Fund. The private investment company in which the cash collateral has been invested may, under certain circumstances, impose a liquidity fee of up to 2% of the value withdrawn or temporarily restrict withdrawals for up to 10 business days during a 90 day period, in the event that the private investment company’s weekly liquid assets fall below certain thresholds.
Securities lending income is equal to the total of income earned from the reinvestment of cash collateral, net of fees and other payments to and from borrowers of securities, and less the collateral investment expenses. The Fund retains a portion of securities lending income and remits a remaining portion to BIM as compensation for its services as securities lending agent.
Pursuant to the current securities lending agreement, effective on or about February 26, 2018: (i) the Fund retains 71.5% of securities lending income (which excludes collateral investment expenses); and (ii) this amount can never be less than 65% of the sum of securities lending income plus collateral investment expenses.
Under the securities lending program, the Fund is categorized into a specific asset class. The determination of the Fund’s asset class category (fixed-income, domestic equity, international equity or fund of funds), each of which may be subject to a different fee arrangement, is based on a methodology agreed to between the Corporation and BIM.
In addition, commencing the business day following the date that the aggregate securities lending income earned across certain funds in the Equity-Liquidity Complex in a calendar year exceeds a specified threshold, the Fund, pursuant to the current securities lending agreement, effective on or about February 26, 2018, will receive for the remainder of that calendar year securities lending income as follows: (i) 75% of securities lending income; and (ii) this amount can never be less than 65% of the sum of securities lending income plus collateral investment expenses.
Prior to February 26, 2018, the Fund had a different securities lending arrangement.
The share of securities lending income earned by the Fund is shown as securities lending income — affiliated — net in the Statement of Operations. For the year ended September 30, 2018, the Fund paid BIM $191 for securities lending agent services.
Interfund Lending: In accordance with an exemptive order (the “Order”) from the SEC, the Fund may participate in a joint lending and borrowing facility for temporary purposes (the “Interfund Lending Program”), subject to compliance with the terms and conditions of the Order, and to the extent permitted by the Fund’s investment policies and restrictions. The Fund is currently permitted to borrow and lend under the Interfund Lending Program.
A lending BlackRock fund may lend in aggregate up to 15% of its net assets, but may not lend more than 5% of its net assets to any one borrowing fund through the Interfund Lending Program. A borrowing BlackRock fund may not borrow through the Interfund Lending Program or from any other source more than 33 1/3% of its total assets (or any lower threshold provided for by the fund’s investment restrictions). If a borrowing BlackRock fund’s total outstanding borrowings exceed 10% of its total assets, each of its outstanding interfund loans will be subject to collateralization of at least 102% of the outstanding principal value of the loan. All interfund loans are for temporary or emergency purposes and the interest rate to be charged will be the average of the highest current overnight repurchase agreement rate available to a lending fund and the bank loan rate, as calculated according to a formula established by the Board.
During the year ended September 30, 2018, the Fund did not participate in the Interfund Lending Program.
| | | | |
| N O T E S T O F I N A N C I A L S T A T E M E N T S | | | 29 | |
Notes to Financial Statements (continued)
Directors and Officers: Certain directors and/or officers of the Fund are directors and/or officers of BlackRock or its affiliates. The Fund reimburses the Manager for a portion of the compensation paid to the Corporation’s Chief Compliance Officer, which is included in Directors and Officer in the Statement of Operations.
For the year ended September 30, 2018, purchases and sales of investments, excluding short-term securities, were $219,429,803 and $106,093,392, respectively.
It is the Fund’s policy to comply with the requirements of the Internal Revenue Code of 1986, as amended, applicable to regulated investment companies, and to distribute substantially all of its taxable income to its shareholders. Therefore, no U.S. federal income tax provision is required.
The Fund files U.S. federal and various state and local tax returns. No income tax returns are currently under examination. The statute of limitations on the Fund’s U.S. federal tax returns generally remains open for each of the four years ended September 30, 2018. The statutes of limitations on the Fund’s state and local tax returns may remain open for an additional year depending upon the jurisdiction.
Management has analyzed tax laws and regulations and their application to the Fund as of September 30, 2018, inclusive of the open tax return years, and does not believe that there are any uncertain tax positions that require recognition of a tax liability in the Fund’s financial statements.
U.S. GAAP requires that certain components of net assets be adjusted to reflect permanent differences between financial and tax reporting. These reclassifications have no effect on net assets or net asset values per share. As of period end, the following permanent differences attributable to the accounting for swap agreements, foreign currency transactions, income recognized from pass-through entities and the sale of stock of passive foreign investment companies were reclassified to the following accounts:
| | | | |
| |
Paid-in capital | | $ | 18 | |
Undistributed net investment income | | | 1,093,478 | |
Accumulated net realized gain | | | (1,093,496 | ) |
| |
The tax character of distributions paid was as follows:
| | | | | | | | |
| | | 09/30/18 | | | 09/30/17 | |
Ordinary income | | $ | 10,355,118 | | | $ | 1,140,923 | |
Long-term capital gain | | | 627,120 | | | | — | |
| | | | | | | | |
| | $ | 10,982,238 | | | $ | 1,140,923 | |
| | | | | | | | |
As of period end, the tax components of accumulated net earnings (losses) were as follows:
| | | | |
Undistributed ordinary income | | $ | 14,184,826 | |
Net unrealized gains(a) | | | 9,072,887 | |
| | | | |
| | $ | 23,257,713 | |
| | | | |
| | (a) | The difference between book-basis and tax-basis net unrealized gains was attributable primarily to the tax deferral of losses on wash sales and straddles, the accounting for swap agreements and the realization for tax purposes of unrealized gains on constructive sales. | |
As of September 30, 2018, gross unrealized appreciation and depreciation for investments and derivatives based on cost for U.S. federal income tax purposes were as follows:
| | | | |
Tax cost | | $ | 827,960,700 | |
| | | | |
Gross unrealized appreciation | | $ | 12,648,091 | |
Gross unrealized depreciation | | | (3,257,151 | ) |
| | | | |
Net unrealized appreciation | | $ | 9,390,940 | |
| | | | |
The Corporation, on behalf of the Fund, along with certain other funds managed by the Manager and its affiliates (“Participating Funds”), is a party to a 364-day, $2.25 billion credit agreement with a group of lenders. Under this agreement, the Fund may borrow to fund shareholder redemptions. Excluding commitments designated for certain individual funds, the Participating Funds, including the Fund, can borrow up to an aggregate commitment amount of $1.75 billion at any time outstanding, subject to asset coverage and other limitations as specified in the agreement. The credit agreement has the following terms: a fee of 0.10% per annum on unused commitment amounts and interest at a rate equal to the higher of (a) one-month LIBOR (but, in any event, not less than 0.00%) on the date the loan is made plus 0.80% per annum or (b) the Fed Funds rate (but, in any event, not less than 0.00%) in effect from time to time plus 0.80% per annum on amounts borrowed. The agreement expires in April 2019 unless extended or renewed. Prior to April 19, 2018, the aggregate commitment amount was $2.1 billion and the fee was 0.12% per annum. Participating Funds paid an upfront commitment fee of 0.02% on the total commitment amounts, in addition to administration, legal and arrangement fees, which are included in miscellaneous expenses in the Statement of Operations. These fees were allocated among such funds based upon portions of the aggregate commitment available to them and relative net assets of Participating Funds. During the year ended September 30, 2018, the Fund did not borrow under the credit agreement.
| | |
| 30 | | 2 0 1 8 B L A C K R O C K A N N U A L R E P O R T T O S H A R E H O L D E R S |
Notes to Financial Statements (continued)
In the normal course of business, the Fund invests in securities or other instruments and may enter into certain transactions, and such activities subject the Fund to various risks, including among others, fluctuations in the market (market risk) or failure of an issuer to meet all of its obligations. The value of securities or other instruments may also be affected by various factors, including, without limitation: (i) the general economy; (ii) the overall market as well as local, regional or global political and/or social instability; (iii) regulation, taxation or international tax treaties between various countries; or (iv) currency, interest rate and price fluctuations. The Fund’s prospectus provides details of the risks to which the Fund is subject.
The Fund may be exposed to prepayment risk, which is the risk that borrowers may exercise their option to prepay principal earlier than scheduled during periods of declining interest rates, which would force the Fund to reinvest in lower yielding securities. The Fund may also be exposed to reinvestment risk, which is the risk that income from the Fund’s portfolio will decline if the Fund invests the proceeds from matured, traded or called fixed-income securities at market interest rates that are below the Fund portfolio’s current earnings rate.
The Fund may be exposed to additional risks when reinvesting cash collateral in money market funds that do not seek to maintain a stable NAV per share of $1.00, which may be subject to redemption gates or liquidity fees under certain circumstances.
Valuation Risk: The market values of equities, such as common stocks and preferred securities or equity related investments, such as futures and options, may decline due to general market conditions which are not specifically related to a particular company. They may also decline due to factors which affect a particular industry or industries. The Fund may invest in illiquid investments and may experience difficulty in selling those investments in a timely manner at the price that it believes the investments are worth. Prices may fluctuate widely over short or extended periods in response to company, market or economic news. Markets also tend to move in cycles, with periods of rising and falling prices. This volatility may cause the Fund’s NAV to experience significant increases or decreases over short periods of time. If there is a general decline in the securities and other markets, the NAV of the Fund may lose value, regardless of the individual results of the securities and other instruments in which the Fund invests.
Counterparty Credit Risk: The Fund may be exposed to counterparty credit risk, or the risk that an entity may fail to or be unable to perform on its commitments related to unsettled or open transactions. The Fund manages counterparty credit risk by entering into transactions only with counterparties that the Manager believes have the financial resources to honor their obligations and by monitoring the financial stability of those counterparties. Financial assets, which potentially expose the Fund to market, issuer and counterparty credit risks, consist principally of financial instruments and receivables due from counterparties. The extent of the Fund’s exposure to market, issuer and counterparty credit risks with respect to these financial assets is approximately their value recorded in the Statement of Assets and Liabilities, less any collateral held by the Fund.
A derivative contract may suffer a mark-to-market loss if the value of the contract decreases due to an unfavorable change in the market rates or values of the underlying instrument. Losses can also occur if the counterparty does not perform under the contract.
The Fund’s risk of loss from counterparty credit risk on OTC derivatives is generally limited to the aggregate unrealized gain less the value of any collateral held by the Fund.
For OTC options purchased, the Fund bears the risk of loss in the amount of the premiums paid plus the positive change in market values net of any collateral held by the Fund should the counterparty fail to perform under the contracts. Options written by the Fund do not typically give rise to counterparty credit risk, as options written generally obligate the Fund, and not the counterparty, to perform. The Fund may be exposed to counterparty credit risk with respect to options written to the extent the Fund deposits collateral with its counterparty to a written option.
With centrally cleared swaps, there is less counterparty credit risk to the Fund since the exchange or clearinghouse, as counterparty to such instruments, guarantees against a possible default. The clearinghouse stands between the buyer and the seller of the contract; therefore, credit risk is limited to failure of the clearinghouse. While offset rights may exist under applicable law, the Fund does not have a contractual right of offset against a clearing broker or clearinghouse in the event of a default (including the bankruptcy or insolvency). Additionally, credit risk exists in centrally cleared swaps with respect to initial and variation margin that is held in a clearing broker’s customer accounts. While clearing brokers are required to segregate customer margin from their own assets, in the event that a clearing broker becomes insolvent or goes into bankruptcy and at that time there is a shortfall in the aggregate amount of margin held by the clearing broker for all its clients, typically the shortfall would be allocated on a pro rata basis across all the clearing broker’s customers, potentially resulting in losses to the Fund.
| 11. | CAPITAL SHARE TRANSACTIONS |
Transactions in capital shares for each class were as follows:
| | | | | | | | | | | | | | | | | | | | | | | | | | | | |
| | | Year Ended 09/30/18 | | | Year Ended 09/30/17 | |
| | | Shares | | | | | | Amount | | | | | | Shares | | | | | | Amount | |
Institutional | | | | | | | | | | | | | | | | | | | | | | | | | | | | |
Shares sold | | | 81,169,298 | | | | | | | $ | 746,245,154 | | | | | | | | 9,579,630 | | | | | | | $ | 89,854,339 | |
Shares issued in reinvestment of distributions | | | 990,341 | | | | | | | | 8,932,873 | | | | | | | | 100,225 | | | | | | | | 884,991 | |
Shares redeemed | | | (13,674,463 | ) | | | | | | | (126,546,800 | ) | | | | | | | (3,125,005 | ) | | | | | | | (28,598,232 | ) |
| | | | | | | | | | | | | | | | | | | | | | | | | | | | |
Net increase | | | 68,485,176 | | | | | | | $ | 628,631,227 | | | | | | | | 6,554,850 | | | | | | | $ | 62,141,098 | |
| | | | | | | | | | | | | | | | | | | | | | | | | | | | |
| | | | |
| N O T E S T O F I N A N C I A L S T A T E M E N T S | | | 31 | |
Notes to Financial Statements (continued)
| | | | | | | | | | | | | | | | | | | | | | | | | | | | |
| | | Year Ended 09/30/18 | | | Year Ended 09/30/17 | |
| | | Shares | | | | | | Amount | | | | | | Shares | | | | | | Amount | |
Investor A | | | | | | | | | | | | | | | | | | | | | | | | | | | | |
Shares sold | | | 2,456,882 | | | | | | | $ | 21,769,106 | | | | | | | | 2,104,249 | | | | | | | $ | 18,322,842 | |
Shares issued in reinvestment of distributions | | | 167,023 | | | | | | | | 1,451,431 | | | | | | | | 28,058 | | | | | | | | 238,518 | |
Shares redeemed | | | (2,571,181 | ) | | | | | | | (22,669,604 | ) | | | | | | | (1,843,597 | ) | | | | | | | (16,220,084 | ) |
| | | | | | | | | | | | | | | | | | | | | | | | | | | | |
Net increase | | | 52,724 | | | | | | | $ | 550,933 | | | | | | | | 288,710 | | | | | | | $ | 2,341,276 | |
| | | | | | | | | | | | | | | | | | | | | | | | | | | | |
| | | | | | | |
Investor C | | | | | | | | | | | | | | | | | | | | | | | | | | | | |
Shares sold | | | 367,721 | | | | | | | $ | 2,942,319 | | | | | | | | 458,561 | | | | | | | $ | 3,680,738 | |
Shares issued in reinvestment of distributions | | | 37,684 | | | | | | | | 297,325 | | | | | | | | — | | | | | | | | — | |
Shares redeemed | | | (184,088 | ) | | | | | | | (1,485,017 | ) | | | | | | | (455,160 | ) | | | | | | | (3,640,079 | ) |
| | | | | | | | | | | | | | | | | | | | | | | | | | | | |
Net increase | | | 221,317 | | | | | | | $ | 1,754,627 | | | | | | | | 3,401 | | | | | | | $ | 40,659 | |
| | | | | | | | | | | | | | | | | | | | | | | | | | | | |
Total Net Increase | | | 68,759,217 | | | | | | | $ | 630,936,787 | | | | | | | | 6,846,961 | | | | | | | $ | 64,523,033 | |
| | | | | | | | | | | | | | | | | | | | | | | | | | | | |
Management has evaluated the impact of all subsequent events on the Fund through the date the financial statements were issued and has determined that there were no subsequent events requiring adjustment or additional disclosure in the financial statements.
| | |
| 32 | | 2 0 1 8 B L A C K R O C K A N N U A L R E P O R T T O S H A R E H O L D E R S |
Report of Independent Registered Public Accounting Firm
To the Shareholders of BlackRock Event Driven Equity Fund and the Board of Directors of BlackRock Large Cap Series Funds, Inc.:
Opinion on the Financial Statements and Financial Highlights
We have audited the accompanying statement of assets and liabilities of BlackRock Event Driven Equity Fund of BlackRock Large Cap Series Funds, Inc. (the “Fund”), including the schedule of investments, as of September 30, 2018, the related statement of operations for the year then ended, the statements of changes in net assets for each of the two years in the period then ended, the financial highlights for each of the five years in the period then ended, and the related notes. In our opinion, the financial statements and financial highlights present fairly, in all material respects, the financial position of the Fund as of September 30, 2018, and the results of its operations for the year then ended, the changes in its net assets for each of the two years in the period then ended, and the financial highlights for each of the five years in the period then ended, in conformity with accounting principles generally accepted in the United States of America.
Basis for Opinion
These financial statements and financial highlights are the responsibility of the Fund’s management. Our responsibility is to express an opinion on the Fund’s financial statements and financial highlights based on our audits. We are a public accounting firm registered with the Public Company Accounting Oversight Board (United States) (PCAOB) and are required to be independent with respect to the Fund in accordance with the U.S. federal securities laws and the applicable rules and regulations of the Securities and Exchange Commission and the PCAOB.
We conducted our audits in accordance with the standards of the PCAOB. Those standards require that we plan and perform the audit to obtain reasonable assurance about whether the financial statements and financial highlights are free of material misstatement, whether due to error or fraud. The Fund is not required to have, nor were we engaged to perform, an audit of its internal control over financial reporting. As part of our audits we are required to obtain an understanding of internal control over financial reporting but not for the purpose of expressing an opinion on the effectiveness of the Fund’s internal control over financial reporting. Accordingly, we express no such opinion.
Our audits included performing procedures to assess the risks of material misstatement of the financial statements and financial highlights, whether due to error or fraud, and performing procedures that respond to those risks. Such procedures included examining, on a test basis, evidence regarding the amounts and disclosures in the financial statements and financial highlights. Our audits also included evaluating the accounting principles used and significant estimates made by management, as well as evaluating the overall presentation of the financial statements and financial highlights. Our procedures included confirmation of securities owned as of September 30, 2018, by correspondence with the custodian, agent banks and brokers; when replies were not received from brokers or agent banks, we performed other auditing procedures. We believe that our audits provide a reasonable basis for our opinion.
Deloitte & Touche LLP
Boston, Massachusetts
November 26, 2018
We have served as the auditor of one or more BlackRock investment companies since 1992.
Important Tax Information (unaudited)
The following information is provided with respect to the ordinary income distributions paid by the Fund during the fiscal year ended September 30, 2018:
| | | | | | |
| | | Payable Date | | | Event Driven
Equity |
Qualified Short-Term Capital Gains for non-U.S. Residents(a) | | | 12/22/17 | | | 100.00% |
| | (a) | Represents the portion of the taxable ordinary income dividends eligible for exemption from U.S. withholding tax for nonresident aliens and foreign corporations. | |
Additionally, the Fund distributed long-term capital gains of $0.027173 per share to shareholders of record on December 20, 2017.
��
| | | | |
| I M P O R T A N T T A X I N F O R M A T I O N | | | 33 | |
Disclosure of Investment Advisory Agreement
The Board of Directors (the “Board,” the members of which are referred to as “Board Members”) of BlackRock Large Cap Series Funds, Inc. (the “Corporation”) met in person on April 19, 2018 (the “April Meeting”) and May 17-18, 2018 (the “May Meeting”) to consider the approval of the investment advisory agreement (the “Agreement”) between the Corporation, on behalf of BlackRock Event Driven Equity Fund (the “Fund”), a series of the Corporation, and BlackRock Advisors, LLC (the “Manager” or “BlackRock”), the Corporation’s investment advisor.
Activities and Composition of the Board
On the date of the May Meeting, the Board consisted of thirteen individuals, eleven of whom were not “interested persons” of the Corporation as defined in the Investment Company Act of 1940, as amended (the “1940 Act”) (the “Independent Board Members”). The Board Members are responsible for the oversight of the operations of the Corporation and perform the various duties imposed on the directors of investment companies by the 1940 Act. The Independent Board Members have retained independent legal counsel to assist them in connection with their duties. The Chair of the Board is an Independent Board Member. The Board has established five standing committees: an Audit Committee, a Governance and Nominating Committee, a Compliance Committee, a Performance Oversight and Contract Committee and an Executive Committee, each of which is chaired by an Independent Board Member and composed of Independent Board Members (except for the Executive Committee, which also has one interested Board Member).
The Agreement
Pursuant to the 1940 Act, the Board is required to consider the continuation of the Agreement on an annual basis. The Board has four quarterly meetings per year, each typically extending for two days, and additional in-person and telephonic meetings throughout the year, as needed. The Board also has a fifth one-day meeting to consider specific information surrounding the consideration of renewing the Agreement. The Board’s consideration of the Agreement is a year-long deliberative process, during which the Board assessed, among other things, the nature, extent and quality of the services provided to the Fund by BlackRock, BlackRock’s personnel and affiliates, including (as applicable): investment management; accounting, administrative and shareholder services; oversight of the Fund’s service providers; marketing and promotional services; risk management and oversight; legal and compliance services; and ability to meet applicable legal and regulatory requirements.
The Board, acting directly and through its committees, considers at each of its meetings, and from time to time as appropriate, factors that are relevant to its annual consideration of the renewal of the Agreement, including the services and support provided by BlackRock to the Fund and its shareholders. BlackRock also furnished additional information to the Board in response to specific questions from the Board. This additional information is discussed further below in the section titled “Board Considerations in Approving the Agreement.” Among the matters the Board considered were: (a) investment performance for one-year, three-year, five-year, ten-year, and/or since inception periods, as applicable, against peer funds, applicable benchmark, and performance metrics, as applicable, as well as senior management’s and portfolio managers’ analysis of the reasons for any over-performance or underperformance relative to its peers, benchmarks, and other performance metrics, as applicable; (b) fees, including advisory, administration, if applicable, and other amounts paid to BlackRock and its affiliates by the Fund for services; (c) Fund operating expenses and how BlackRock allocates expenses to the Fund; (d) the resources devoted to, risk oversight of, and compliance reports relating to, implementation of the Fund’s investment objective(s), policies and restrictions, and meeting regulatory requirements; (e) the Corporation’s adherence to its compliance policies and procedures; (f) the nature, character and scope of non-investment management services provided by BlackRock and its affiliates and the estimated cost of such services; (g) BlackRock’s and other service providers’ internal controls and risk and compliance oversight mechanisms; (h) BlackRock’s implementation of the proxy voting policies approved by the Board; (i) the use of brokerage commissions and execution quality of portfolio transactions; (j) BlackRock’s implementation of the Corporation’s valuation and liquidity procedures; (k) an analysis of management fees for products with similar investment mandates across the open-end fund, exchange-traded fund (“ETF”), closed-end fund, sub-advised mutual fund, separately managed account, collective investment trust, and institutional separate account product channels, as applicable, and the similarities and differences between these products and the services provided as compared to the Fund; (l) BlackRock’s compensation methodology for its investment professionals and the incentives and accountability it creates, along with investment professionals’ investments in the fund(s) they manage; and (m) periodic updates on BlackRock’s business.
Board Considerations in Approving the Agreement
The Approval Process: Prior to the April Meeting, the Board requested and received materials specifically relating to the Agreement. The Board is continuously engaged in a process with its independent legal counsel and BlackRock to review the nature and scope of the information provided to better assist its deliberations. The materials provided in connection with the April Meeting included, among other things: (a) information independently compiled and prepared by Broadridge Financial Solutions, Inc. (“Broadridge”), based on either a Lipper classification or Morningstar category, regarding the Fund’s fees and expenses as compared with a peer group of funds as determined by Broadridge (“Expense Peers”) and the investment performance of the Fund as compared with a peer group of funds (“Performance Peers”) and other metrics, as applicable; (b) information on the composition of the Expense Peers and Performance Peers, and a description of Broadridge’s methodology; (c) information on the estimated profits realized by BlackRock and its affiliates pursuant to the Agreement and a discussion of fall-out benefits to BlackRock and its affiliates; (d) a general analysis provided by BlackRock concerning investment management fees received in connection with other types of investment products, such as institutional accounts, sub-advised mutual funds, ETFs, closed-end funds, open-end funds, and separately managed accounts under similar investment mandates, as well as the performance of such other products, as applicable; (e) review of non-management fees; (f) the existence and impact of potential economies of scale, if any, and the sharing of potential economies of scale with the Fund; (g) a summary of aggregate amounts paid by the Fund to BlackRock; (h) sales and redemption data regarding the Fund’s shares; and (i) various additional information requested by the Board as appropriate regarding BlackRock’s and the Fund’s operations.
At the April Meeting, the Board reviewed materials relating to its consideration of the Agreement. As a result of the discussions that occurred during the April Meeting, and as a culmination of the Board’s year-long deliberative process, the Board presented BlackRock with questions and requests for additional information. BlackRock responded to these requests with additional written information in advance of the May Meeting.
At the May Meeting, the Board considered, among other things: (a) the nature, extent and quality of the services provided by BlackRock; (b) the investment performance of the Fund as compared with its Performance Peers and other metrics, as applicable; (c) the advisory fee and the estimated cost of the services and estimated profits realized by BlackRock and its affiliates from their relationship with the Fund; (d) the Fund’s fees and expenses compared to its Expense Peers; (e) the sharing of potential economies of scale; (f) fall-out benefits to BlackRock and its affiliates as a result of BlackRock’s relationship with the Fund; and (g) other factors deemed relevant by the Board Members.
| | |
| 34 | | 2 0 1 8 B L A C K R O C K A N N U A L R E P O R T T O S H A R E H O L D E R S |
Disclosure of Investment Advisory Agreement (continued)
The Board also considered other matters it deemed important to the approval process, such as other payments made to BlackRock or its affiliates, securities lending and cash management, services related to the valuation and pricing of Fund portfolio holdings, and advice from independent legal counsel with respect to the review process and materials submitted for the Board’s review. The Board noted the willingness of BlackRock personnel to engage in open, candid discussions with the Board. The Board did not identify any particular information as determinative, and each Board Member may have attributed different weights to the various items considered.
A. Nature, Extent and Quality of the Services Provided by BlackRock: The Board, including the Independent Board Members, reviewed the nature, extent and quality of services provided by BlackRock, including the investment advisory services and the resulting performance of the Fund. Throughout the year, the Board compared Fund performance to the performance of a comparable group of mutual funds, relevant benchmark, and performance metrics, as applicable. The Board met with BlackRock’s senior management personnel responsible for investment activities, including the senior investment officers. The Board also reviewed the materials provided by the Fund’s portfolio management team discussing the Fund’s performance and the Fund’s investment objective(s), strategies and outlook.
The Board considered, among other factors, with respect to BlackRock: the number, education and experience of investment personnel generally and the Fund’s portfolio management team; BlackRock’s research capabilities; investments by portfolio managers in the funds they manage; portfolio trading capabilities; use of technology; commitment to compliance; credit analysis capabilities; risk analysis and oversight capabilities; and the approach to training and retaining portfolio managers and other research, advisory and management personnel. The Board also considered BlackRock’s overall risk management program, including the continued efforts of BlackRock and its affiliates to address cybersecurity risks and the role of BlackRock’s Risk & Quantitative Analysis Group. The Board engaged in a review of BlackRock’s compensation structure with respect to the Fund’s portfolio management team and BlackRock’s ability to attract and retain high-quality talent and create performance incentives.
In addition to investment advisory services, the Board considered the quality of the administrative and other non-investment advisory services provided to the Fund. BlackRock and its affiliates provide the Fund with certain administrative, shareholder and other services (in addition to any such services provided to the Fund by third parties) and officers and other personnel as are necessary for the operations of the Fund. In particular, BlackRock and its affiliates provide the Fund with administrative services including, among others: (i) responsibility for disclosure documents, such as the prospectus, the summary prospectus (as applicable), the statement of additional information and periodic shareholder reports; (ii) oversight of daily accounting and pricing; (iii) responsibility for periodic filings with regulators; (iv) overseeing and coordinating the activities of other service providers, including, among others, the Fund’s custodian, fund accountant, transfer agent, and auditor; (v) organizing Board meetings and preparing the materials for such Board meetings; (vi) providing legal and compliance support; (vii) furnishing analytical and other support to assist the Board in its consideration of strategic issues such as the merger, consolidation or repurposing of certain open-end funds; and (viii) performing administrative functions necessary for the operation of the Fund, such as tax reporting, expense management, fulfilling regulatory filing requirements, overseeing the Fund’s distribution partners, and shareholder call center and other services. The Board reviewed the structure and duties of BlackRock’s fund administration, shareholder services, and legal & compliance departments and considered BlackRock’s policies and procedures for assuring compliance with applicable laws and regulations.
B: The Investment Performance of the Fund and BlackRock: The Board, including the Independent Board Members, also reviewed and considered the performance history of the Fund. In preparation for the April Meeting, the Board was provided with reports independently prepared by Broadridge, which included a comprehensive analysis of the Fund’s performance as of December 31, 2017. Broadridge ranks funds in quartiles, ranging from first to fourth, where first is the most desirable quartile position and fourth is the least desirable. In connection with its review, the Board received and reviewed information regarding the investment performance of the Fund as compared to its Performance Peers and certain performance metrics. With respect to the Fund, which pursues an alternative investment strategy, the Board has been engaged in an iterative process with BlackRock to identify the most appropriate performance benchmarks and metrics by which the Board should measure the Fund’s performance. The Board and its Performance Oversight and Contract Committee regularly review, and meet with Fund management to discuss, the performance of the Fund throughout the year.
In evaluating performance, the Board recognized that the performance data reflects a snapshot of a period as of a particular date and that selecting a different performance period could produce significantly different results. Further, the Board recognized that it is possible that long-term performance can be impacted by even one period of significant outperformance or underperformance, so that a single investment theme has the ability to affect long-term performance disproportionately.
The Board noted that for the one-, three- and five-year periods reported, the Fund ranked in the first, second and first quartiles, respectively, against its Performance Peers.
In light of the Fund’s outcome oriented objective, BlackRock believes that certain other performance metrics may be more appropriate than the Performance Peers, and the Board was provided with a comparison of Fund performance relative to these metrics. Under these metrics, for the one-year period the Fund outperformed its total return target, but for the since strategy inception period, the Fund underperformed its total return target. The total return target is designed to be based on a three- to five-year time horizon, but in this case is being viewed over a shorter time horizon. The overall risk of the Fund, as measured by the standard deviation of returns, was below its target range, and the Fund’s beta was below its target range for each of the periods.
C. Consideration of the Advisory/Management Fees and the Estimated Cost of the Services and Estimated Profits Realized by BlackRock and its Affiliates from their Relationship with the Fund: The Board, including the Independent Board Members, reviewed the Fund’s contractual management fee rate compared with those of its Expense Peers. The contractual management fee rate represents a combination of the advisory fee and any administrative fees, before taking into account any reimbursements or fee waivers. The Board also compared the Fund’s total expense ratio, as well as its actual management fee rate, to those of its Expense Peers. The total expense ratio represents a fund’s total net operating expenses, including any 12b-1 or non 12b-1 service fees. The total expense ratio gives effect to any expense reimbursements or fee waivers that benefit a fund, and the actual management fee rate gives effect to any management fee reimbursements or waivers that benefit a fund. The Board considered the services provided and the fees charged by BlackRock and its affiliates to other types of clients with similar investment mandates, as applicable, including institutional accounts and sub-advised mutual funds (including mutual funds sponsored by third parties).
The Board received and reviewed statements relating to BlackRock’s financial condition. The Board reviewed BlackRock’s profitability methodology and was also provided with an estimated profitability analysis that detailed the revenues earned and the expenses incurred by BlackRock for services provided to the Fund. The Board reviewed
| | | | |
| D I S C L O S U R E O F I N V E S T M E N T A D V I S O R Y A G R E E M E N T | | | 35 | |
Disclosure of Investment Advisory Agreement (continued)
BlackRock’s estimated profitability with respect to the Fund and other funds the Board currently oversees for the year ended December 31, 2017 compared to available aggregate estimated profitability data provided for the prior two years. The Board reviewed BlackRock’s estimated profitability with respect to certain other U.S. fund complexes managed by the Manager and/or its affiliates. The Board reviewed BlackRock’s assumptions and methodology of allocating expenses in the estimated profitability analysis, noting the inherent limitations in allocating costs among various advisory products. The Board recognized that profitability may be affected by numerous factors including, among other things, fee waivers and expense reimbursements by the Manager, the types of funds managed, precision of expense allocations and business mix. As a result, calculating and comparing profitability at individual fund levels is difficult.
The Board noted that, in general, individual fund or product line profitability of other advisors is not publicly available. The Board reviewed BlackRock’s overall operating margin, in general, compared to that of certain other publicly-traded asset management firms. The Board considered the differences between BlackRock and these other firms, including the contribution of technology at BlackRock, BlackRock’s expense management, and the relative product mix.
In addition, the Board considered the estimated cost of the services provided to the Fund by BlackRock, and BlackRock’s and its affiliates’ estimated profits relating to the management and distribution of the Fund and the other funds advised by BlackRock and its affiliates. As part of its analysis, the Board reviewed BlackRock’s methodology in allocating its costs of managing the Fund, to the Fund. The Board considered whether BlackRock has the financial resources necessary to attract and retain high quality investment management personnel to perform its obligations under the Agreement and to continue to provide the high quality of services that is expected by the Board. The Board further considered factors including but not limited to BlackRock’s commitment of time, assumption of risk, and liability profile in servicing the Fund in contrast to what is required of BlackRock with respect to other products with similar investment mandates across the open-end fund, ETF, closed-end fund, sub-advised mutual fund, separately managed account, collective investment trust, and institutional separate account product channels, as applicable.
The Board noted that the Fund’s contractual management fee rate ranked in the third quartile, and that the actual management fee rate and total expense ratio ranked in the third and first quartiles, respectively, relative to the Fund’s Expense Peers. The Board also noted that the Fund has an advisory fee arrangement that includes breakpoints that adjust the fee rate downward as the size of the Fund increases above certain contractually specified levels. The Board further noted that BlackRock and the Board have contractually agreed to a cap on the Fund’s total expenses as a percentage of the Fund’s average daily net assets on a class-by-class basis.
D. Economies of Scale: The Board, including the Independent Board Members, considered the extent to which economies of scale might be realized as the assets of the Fund increase, including the existence of fee waivers and/or expense caps, as applicable, noting that any contractual fee waivers and expense caps had been approved by the Board. The Board also considered the extent to which the Fund benefits from such economies in a variety of ways and whether there should be changes in the advisory fee rate or breakpoint structure in order to enable the Fund to more fully participate in these economies of scale. The Board considered the Fund’s asset levels and whether the current fee schedule was appropriate. In their consideration, the Board Members took into account the existence of any expense caps and further considered the continuation and/or implementation, as applicable, of such caps.
E. Other Factors Deemed Relevant by the Board Members: The Board, including the Independent Board Members, also took into account other ancillary or “fall-out” benefits that BlackRock or its affiliates may derive from BlackRock’s respective relationships with the Fund, both tangible and intangible, such as BlackRock’s ability to leverage its investment professionals who manage other portfolios and risk management personnel, an increase in BlackRock’s profile in the investment advisory community, and the engagement of BlackRock’s affiliates as service providers to the Fund, including for administrative, distribution, securities lending and cash management services. The Board also considered BlackRock’s overall operations and its efforts to expand the scale of, and improve the quality of, its operations. The Board also noted that, subject to applicable law, BlackRock may use and benefit from third party research obtained by soft dollars generated by certain registered fund transactions to assist in managing all or a number of its other client accounts.
In connection with its consideration of the Agreement, the Board also received information regarding BlackRock’s brokerage and soft dollar practices. The Board received reports from BlackRock which included information on brokerage commissions and trade execution practices throughout the year.
The Board noted the competitive nature of the open-end fund marketplace, and that shareholders are able to redeem their Fund shares if they believe that the Fund’s fees and expenses are too high or if they are dissatisfied with the performance of the Fund.
Conclusion
The Board, including the Independent Board Members, approved the continuation of the Agreement between the Manager and the Corporation with respect to the Fund for a one-year term ending June 30, 2019. Based upon its evaluation of all of the aforementioned factors in their totality, as well as other information, the Board, including the Independent Board Members, was satisfied that the terms of the Agreement were fair and reasonable and in the best interest of the Fund and its shareholders. In arriving at its decision to approve the Agreement, the Board did not identify any single factor or group of factors as all-important or controlling, but considered all factors together, and different Board Members may have attributed different weights to the various factors considered. The Independent Board Members were also assisted by the advice of independent legal counsel in making this determination.
| | |
| 36 | | 2 0 1 8 B L A C K R O C K A N N U A L R E P O R T T O S H A R E H O L D E R S |
Director and Officer Information
| | | | | | | | |
| Independent Directors(a) |
| | | | | |
Name Year of Birth(b) | | Position(s) Held
(Length of
Service)(c) | | Principal Occupation(s) During Past Five Years | | Number of BlackRock-Advised
Registered Investment Companies
(“RICs”) Consisting of Investment
Portfolios (“Portfolios”) Overseen | | Public Company
and Other
Investment
Company
Directorships Held
During Past Five
Years |
Rodney D. Johnson 1941 | | Chair of the
Board(d) and
Director
(Since 2007) | | President, Fairmount Capital Advisors, Inc. from 1987 to 2013; Member of the Archdiocesan Investment Committee of the Archdiocese of Philadelphia from 2004 to 2012; Director, The Committee of Seventy (civic) from 2006 to 2012; Director, Fox Chase Cancer Center from 2004 to 2011; Director, The Mainstay (non-profit) since 2016. | | 28 RICs consisting of 140 Portfolios | | None |
Mark Stalnecker 1951 | | Chair Elect of the Board
(Since 2018)(d)
and Director
(Since 2015) | | Chief Investment Officer, University of Delaware from 1999 to 2013; Trustee and Chair of the Finance and Investment Committees, Winterthur Museum and Country Estate from 2005 to 2016; Member of the Investment Committee, Delaware Public Employees’ Retirement System since 2002; Member of the Investment Committee, Christiana Care Health System from 2009 to 2017; Member of the Investment Committee, Delaware Community Foundation from 2013 to 2014; Director and Chair of the Audit Committee, SEI Private Trust Co. from 2001 to 2014. | | 28 RICs consisting of 140 Portfolios | | None |
Susan J. Carter 1956 | | Director (Since 2016) | | Director, Pacific Pension Institute from 2014 to 2018; Advisory Board Member, Center for Private Equity and Entrepreneurship at Tuck School of Business since 1997; Senior Advisor, Commonfund Capital, Inc. (“CCI”) (investment adviser) in 2015; Chief Executive Officer, CCI from 2013 to 2014; President & Chief Executive Officer, CCI from 1997 to 2013; Advisory Board Member, Girls Who Invest from 2015 to 2018 and Board Member thereof since 2018; Advisory Board Member, Bridges Fund Management since 2016; Trustee, Financial Accounting Foundation since 2017; Practitioner Advisory Board Member, Private Capital Research Institute (PCRI) since 2017. | | 28 RICs consisting of 140 Portfolios | | None |
Collette Chilton 1958 | | Director (Since 2015) | | Chief Investment Officer, Williams College since 2006; Chief Investment Officer, Lucent Asset Management Corporation from 1998 to 2006. | | 28 RICs consisting of 140 Portfolios | | None |
Neil A. Cotty 1954 | | Director (Since 2016) | | Bank of America Corporation from 1996 to 2015, serving in various senior finance leadership roles, including Chief Accounting Officer, from 2009 to 2015, Chief Financial Officer of Global Banking, Markets and Wealth Management from 2008 to 2009, Chief Accounting Officer from 2004 to 2008, Chief Financial Officer of Consumer Bank from 2003 to 2004, Chief Financial Officer of Global Corporate Investment Bank from 1999 to 2002. | | 28 RICs consisting of 140 Portfolios | | None |
Cynthia A. Montgomery 1952 | | Director (Since 2007) | | Professor, Harvard Business School since 1989; Director, McLean Hospital from 2005 to 2012. | | 28 RICs consisting of 140 Portfolios | | Newell Rubbermaid, Inc. (manufacturing) |
Joseph P. Platt 1947 | | Director (Since 2007) | | General Partner, Thorn Partners, LP (private investments) since 1998; Director, WQED Multi-Media (public broadcasting not-for-profit) since 2001; Chair, Basic Health International (non-profit) since 2015. | | 28 RICs consisting of 140 Portfolios | | Greenlight Capital Re, Ltd. (reinsurance company); Consol Energy Inc. |
Robert C. Robb, Jr. 1945 | | Director (Since 2007) | | Partner, Lewis, Eckert, Robb and Company (management and financial consulting firm) since 1981 and Principal since 2010. | | 28 RICs consisting of 140 Portfolios | | None |
Kenneth L. Urish 1951 | | Director (Since 2007) | | Managing Partner, Urish Popeck & Co., LLC (certified public accountants and consultants) since 1976; Past-Chairman of the Professional Ethics Committee of the Pennsylvania Institute of Certified Public Accountants and Committee Member thereof since 2007; Member of External Advisory Board, The Pennsylvania State University Accounting Department since founding in 2001; Principal, UP Strategic Wealth Investment Advisors, LLC since 2013; Trustee, The Holy Family Institute from 2001 to 2010; President and Trustee, Pittsburgh Catholic Publishing Associates from 2003 to 2008; Director, Inter-Tel from 2006 to 2007. | | 28 RICs consisting of 140 Portfolios | | None |
| | | | |
| D I R E C T O R A N D O F F I C E R I N F O R M A T I O N | | | 37 | |
Director and Officer Information (continued)
| | | | | | | | |
| Independent Directors(a) |
| | | | | |
Name Year of Birth(b) | | Position(s) Held
(Length of
Service)(c) | | Principal Occupation(s) During Past Five Years | | Number of BlackRock-Advised
Registered Investment Companies
(“RICs”) Consisting of Investment
Portfolios (“Portfolios”) Overseen | | Public Company
and Other
Investment
Company
Directorships Held
During Past Five
Years |
Claire A. Walton 1957 | | Director (Since 2016) | | Chief Operating Officer and Chief Financial Officer of Liberty Square Asset Management, LP from 1998 to 2015; General Partner of Neon Liberty Capital Management, LLC since 2003; Director, Boston Hedge Fund Group from 2009 to 2018; Director, Woodstock Ski Runners since 2013; Director, Massachusetts Council on Economic Education from 2013 to 2015. | | 28 RICs consisting of 140 Portfolios | | None |
Frederick W. Winter 1945 | | Director (Since 2007) | | Director, Alkon Corporation since 1992; Dean Emeritus of the Joseph M. Katz School of Business, University of Pittsburgh, Dean and Professor from 1997 to 2005, Professor until 2013. | | 28 RICs consisting of 140 Portfolios | | None |
|
| Interested Directors(a)(e) |
| | | | | |
Name Year of Birth(b) | | Position(s) Held
(Length of
Service)(c) | | Principal Occupation(s) During Past Five Years | | Number of BlackRock-Advised
Registered Investment Companies
(“RICs”) Consisting of Investment
Portfolios (“Portfolios”) Overseen | | Public Company
and Other
Investment
Company
Directorships Held
During Past Five
Years |
Robert Fairbairn 1965 | | Director (Since 2018) | | Senior Managing Director of BlackRock, Inc. since 2010; oversees BlackRock’s Strategic Partner Program and Strategic Product Management Group; Member of BlackRock’s Global Executive and Global Operating Committees; Co-Chair of BlackRock’s Human Capital Committee; Global Head of BlackRock’s Retail and iShares® businesses from 2012 to 2016. | | 133 RICs consisting of 308 Portfolios | | None |
John M. Perlowski 1964 | | Director (Since 2015) and President, and Chief Executive Officer (Since 2010) | | Managing Director of BlackRock, Inc. since 2009; Head of BlackRock Global Accounting and Product Services since 2009; Advisory Director of Family Resource Network (charitable foundation) since 2009. | | 133 RICs consisting of 308 Portfolios | | None |
| (a) | The address of each Director is c/o BlackRock, Inc., 55 East 52nd Street, New York, NY 10055. |
| (b) | Independent Directors serve until their resignation, retirement, removal or death, or until December 31 of the year in which they turn 75. The Board may determine to extend the terms of Independent Directors on a case-by-case basis, as appropriate. The Board has approved extending the mandatory retirement age for Rodney D. Johnson until December 31, 2018. |
| (c) | Following the combination of Merrill Lynch Investment Managers, L.P. (“MLIM”) and BlackRock, Inc. (“BlackRock”) in September 2006, the various legacy MLIM and legacy BlackRock fund boards were realigned and consolidated into three new fund boards in 2007. As a result, although the chart shows certain Independent Directors as joining the Board in 2007, those Independent Directors first became members of the boards of other legacy MLIM or legacy BlackRock funds as follows: Rodney D. Johnson, 1995; Cynthia A. Montgomery, 1994; Joseph P. Platt, 1999; Robert C. Robb, Jr., 1999; Kenneth L. Urish, 1999; and Frederick W. Winter, 1999. |
| (d) | Mr. Stalnecker was approved as Chair Elect of the Board effective January 1, 2018. It is expected that, effective January 1, 2019, Mr. Stalnecker will assume the position of Chair of the Board and Mr. Johnson will retire as Chair of the Board. |
| (e) | Mr. Fairbairn and Mr. Perlowski are both “interested persons,” as defined in the 1940 Act, of the Corporation based on their positions with BlackRock and its affiliates. Mr. Fairbairn and Mr. Perlowski are also board members of the BlackRock Equity-Bond Complex and the BlackRock Closed-End Complex. |
| | |
| 38 | | 2 0 1 8 B L A C K R O C K A N N U A L R E P O R T T O S H A R E H O L D E R S |
Director and Officer Information (continued)
| | | | |
| Officers Who Are Not Directors(a) |
| | | |
Name
Year of Birth(b) | | Position(s) Held
(Length of
Service) | | Principal Occupation(s) During Past Five Years |
Jennifer McGovern 1977 | | Vice President
(Since 2014) | | Managing Director of BlackRock, Inc. since 2016; Director of BlackRock, Inc. from 2011 to 2015; Head of Product Structure and Oversight for BlackRock’s U.S. Wealth Advisory Group since 2013. |
Neal J. Andrews 1966 | | Chief Financial
Officer (Since 2007) | | Managing Director of BlackRock, Inc. since 2006. |
Jay M. Fife 1970 | | Treasurer
(Since 2007) | | Managing Director of BlackRock, Inc. since 2007. |
Charles Park 1967 | | Chief Compliance Officer
(Since 2014) | | Anti-Money Laundering Compliance Officer for the BlackRock-advised Funds in the Equity-Bond Complex, the Equity-Liquidity Complex and the Closed-End Complex from 2014 to 2015; Chief Compliance Officer of BlackRock Advisors, LLC and the BlackRock-advised Funds in the Equity-Bond Complex, the Equity-Liquidity Complex and the Closed-End Complex since 2014; Principal of and Chief Compliance Officer for iShares® Delaware Trust Sponsor LLC since 2012 and BlackRock Fund Advisors (“BFA”) since 2006; Chief Compliance Officer for the BFA-advised iShares® exchange traded funds since 2006; Chief Compliance Officer for BlackRock Asset Management International Inc. since 2012. |
John MacKessy 1972 | | Anti-Money Laundering Compliance Officer
(Since 2018) | | Director of BlackRock, Inc. since 2017; Global Head of Anti-Money Laundering at BlackRock, Inc. since 2017; Director of AML Monitoring and Investigations Group of Citibank from 2015 to 2017; Global Anti-Money Laundering and Economic Sanctions Officer for MasterCard from 2011 to 2015. |
Benjamin Archibald 1975 | | Secretary
(Since 2012) | | Managing Director of BlackRock, Inc. since 2014; Director of BlackRock, Inc. from 2010 to 2013; Secretary of the iShares® exchange traded funds since 2015; Secretary of the BlackRock-advised mutual funds since 2012. |
(a) The address of each Officer is c/o BlackRock, Inc., 55 East 52nd Street, New York, NY 10055. |
(b) Officers of the Corporation serve at the pleasure of the Board. |
Further information about the Corporation’s Directors and Officers is available in the Corporation’s Statement of Additional Information, which can be obtained without charge by calling 1-800-441-7762.
Investment Adviser
BlackRock Advisors, LLC
Wilmington, DE 19809
Accounting Agent and Transfer Agent
BNY Mellon Investment Servicing (US) Inc.
Wilmington, DE 19809
Custodian
Brown Brothers Harriman & Co.
Boston, MA 02109
Independent Registered Public Accounting Firm
Deloitte & Touche LLP
Boston, MA 02116
Distributor
BlackRock Investments, LLC
New York, NY 10022
Legal Counsel
Sidley Austin LLP
New York, NY 10019
Address of the Corporation
100 Bellevue Parkway
Wilmington, DE 19809
| | | | |
| D I R E C T O R A N D O F F I C E R I N F O R M A T I O N | | | 39 | |
Additional Information
General Information
Householding
The Fund will mail only one copy of shareholder documents, including prospectuses, annual and semi-annual reports and proxy statements, to shareholders with multiple accounts at the same address. This practice is commonly called “householding” and is intended to reduce expenses and eliminate duplicate mailings of shareholder documents. Mailings of your shareholder documents may be householded indefinitely unless you instruct us otherwise. If you do not want the mailing of these documents to be combined with those for other members of your household, please call the Fund at (800) 441-7762.
Availability of Quarterly Schedule of Investments
The Fund files its complete schedule of portfolio holdings with the Securities and Exchange Commission (“SEC”) for the first and third quarters of each fiscal year on Form N-Q. The Fund’s Form N-Q is available on the SEC’s website at http://www.sec.gov and may also be reviewed and copied at the SEC’s Public Reference Room in Washington, D.C. Information on the operation of the Public Reference Room or how to access documents on the SEC’s website without charge may be obtained by calling (800) SEC-0330. The Fund’s Form N-Q may also be obtained upon request and without charge by calling (800) 441-7762.
Availability of Proxy Voting Policies and Procedures
A description of the policies and procedures that the Fund uses to determine how to vote proxies relating to portfolio securities is available upon request and without charge (1) by calling (800) 441-7762; (2) at http://www.blackrock.com; and (3) on the SEC’s website at http://www.sec.gov.
Availability of Proxy Voting Record
Information about how the Fund voted proxies relating to securities held in the Fund’s portfolio during the most recent 12-month period ended June 30 is available upon request and without charge (1) at http://www.blackrock.com; or by calling (800) 441-7762 and (2) on the SEC’s website at http://www.sec.gov.
BlackRock’s Mutual Fund Family
BlackRock offers a diverse lineup of open-end mutual funds crossing all investment styles and managed by experts in equity, fixed-income and tax-exempt investing. Visit http://www.blackrock.com for more information.
Shareholder Privileges
Account Information
Call us at (800) 441-7762 from 8:00 AM to 6:00 PM EST on any business day to get information about your account balances, recent transactions and share prices. You can also reach us on the Web at http://www.blackrock.com.
Automatic Investment Plans
Investor Class shareholders who want to invest regularly can arrange to have $50 or more automatically deducted from their checking or savings account and invested in any of the BlackRock funds.
Systematic Withdrawal Plan
Investor Class shareholders can establish a systematic withdrawal plan and receive periodic payments of $50 or more from their BlackRock funds, as long as their account balance is at least $10,000.
Retirement Plans
Shareholders may make investments in conjunction with Traditional, Rollover, Roth, Coverdell, Simple IRAs, SEP IRAs and 403(b) Plans.
| | |
| 40 | | 2 0 1 8 B L A C K R O C K A N N U A L R E P O R T T O S H A R E H O L D E R S |
Additional Information (continued)
BlackRock Privacy Principles
BlackRock is committed to maintaining the privacy of its current and former fund investors and individual clients (collectively, “Clients”) and to safeguarding their non-public personal information. The following information is provided to help you understand what personal information BlackRock collects, how we protect that information and why in certain cases we share such information with select parties.
If you are located in a jurisdiction where specific laws, rules or regulations require BlackRock to provide you with additional or different privacy-related rights beyond what is set forth below, then BlackRock will comply with those specific laws, rules or regulations.
BlackRock obtains or verifies personal non-public information from and about you from different sources, including the following: (i) information we receive from you or, if applicable, your financial intermediary, on applications, forms or other documents; (ii) information about your transactions with us, our affiliates, or others; (iii) information we receive from a consumer reporting agency; and (iv) from visits to our websites.
BlackRock does not sell or disclose to non-affiliated third parties any non-public personal information about its Clients, except as permitted by law or as is necessary to respond to regulatory requests or to service Client accounts. These non-affiliated third parties are required to protect the confidentiality and security of this information and to use it only for its intended purpose.
We may share information with our affiliates to service your account or to provide you with information about other BlackRock products or services that may be of interest to you. In addition, BlackRock restricts access to non-public personal information about its Clients to those BlackRock employees with a legitimate business need for the information. BlackRock maintains physical, electronic and procedural safeguards that are designed to protect the non-public personal information of its Clients, including procedures relating to the proper storage and disposal of such information.
Glossary of Terms Used in this Report
| | |
| Currency |
| |
| CHF | | Swiss Franc |
| EUR | | Euro |
| GBP | | British Pound |
| USD | | U.S. Dollar |
|
| Portfolio Abbreviations |
| |
| GDR | | Global Depositary Receipts |
| | | | |
| A D D I T I O N A L I N F O R M A T I O N A N D G L O S S A R Y O F T E R M S U S E D I N T H I S R E P O R T | | | 41 | |
This report is intended for current holders. It is not authorized for use as an offer of sale or a solicitation of an offer to buy shares of the Fund unless preceded or accompanied by the Fund’s current prospectus. Past performance results shown in this report should not be considered a representation of future performance. Investment returns and principal value of shares will fluctuate so that shares, when redeemed, may be worth more or less than their original cost. Statements and other information herein are as dated and are subject to change.

| | |
| EDE-9/18-AR | |  |
| Item 2 – | Code of Ethics – The registrant (or the “Fund”) has adopted a code of ethics, as of the end of the period covered by this report, applicable to the registrant’s principal executive officer, principal financial officer, principal accounting officer or controller, or persons performing similar functions. During the period covered by this report, the code of ethics was amended to update certain information and to make other non-material changes. During the period covered by this report, there have been no waivers granted under the code of ethics. The registrant undertakes to provide a copy of the code of ethics to any person upon request, without charge, who calls 1-800-441-7762. |
| Item 3 – | Audit Committee Financial Expert – The registrant’s board of directors (the “board of directors”), has determined that (i) the registrant has the following audit committee financial expert serving on its audit committee and (ii) each audit committee financial expert is independent: |
Kenneth L. Urish
Under applicable securities laws, a person determined to be an audit committee financial expert will not be deemed an “expert” for any purpose, including without limitation for the purposes of Section 11 of the Securities Act of 1933, as a result of being designated or identified as an audit committee financial expert. The designation or identification of a person as an audit committee financial expert does not impose on such person any duties, obligations, or liabilities greater than the duties, obligations, and liabilities imposed on such person as a member of the audit committee and board of directors in the absence of such designation or identification.
| Item 4 – | Principal Accountant Fees and Services |
The following table presents fees billed by Deloitte & Touche LLP (“D&T”) in each of the last two fiscal years for the services rendered to the Fund:
| | | | | | | | | | | | | | | | |
| | | (a) Audit Fees | | (b) Audit-Related Fees1 | | (c) Tax Fees2 | | (d) All Other Fees |
| Entity Name | | Current Fiscal Year End | | Previous Fiscal Year End | | Current Fiscal Year End | | Previous
Fiscal Year End | | Current Fiscal Year End | | Previous Fiscal Year End | | Current Fiscal Year End | | Previous Fiscal Year End |
| BlackRock Event Driven Equity Fund | | $29,376 | | $29,325 | | $0 | | $0 | | $13,100 | | $13,107 | | $0 | | $0 |
The following table presents fees billed by D&T that were required to be approved by the registrant’s audit committee (the “Committee”) for services that relate directly to the operations or financial reporting of the Fund and that are rendered on behalf of BlackRock Advisors, LLC (“Investment Adviser” or “BlackRock”) and entities controlling, controlled by, or under common control with BlackRock (not including any sub-adviser whose role is primarily portfolio management and is subcontracted with or overseen by another investment adviser) that provide ongoing services to the Fund (“Affiliated Service Providers”):
| | | | |
| | | Current Fiscal Year End | | Previous Fiscal Year End |
(b) Audit-Related Fees1 | | $0 | | $0 |
(c) Tax Fees2 | | $0 | | $0 |
(d) All Other Fees3 | | $2,274,000 | | $2,129,000 |
1 The nature of the services includes assurance and related services reasonably related to the performance of the audit or review of financial statements not included in Audit Fees, including accounting consultations, agreed-upon procedure reports, attestation reports, comfort letters, out-of-pocket expenses and internal control reviews not required by regulators.
2 The nature of the services includes tax compliance and/or tax preparation, including services relating to the filing or amendment of federal, state or local income tax returns, regulated investment company qualification reviews, taxable income and tax distribution calculations.
2
3 Non-audit fees of $2,274,000 and $2,129,000 for the current fiscal year and previous fiscal year, respectively, were paid to the Fund’s principal accountant in their entirety by BlackRock, in connection with services provided to the Affiliated Service Providers of the Fund and of certain other funds sponsored and advised by BlackRock or its affiliates for a service organization review and an accounting research tool subscription. These amounts represent aggregate fees paid by BlackRock and were not allocated on a per fund basis.
(e)(1) Audit Committee Pre-Approval Policies and Procedures:
The Committee has adopted policies and procedures with regard to the pre-approval of services. Audit, audit-related and tax compliance services provided to the registrant on an annual basis require specific pre-approval by the Committee. The Committee also must approve other non-audit services provided to the registrant and those non-audit services provided to the Investment Adviser and Affiliated Service Providers that relate directly to the operations and the financial reporting of the registrant. Certain of these non-audit services that the Committee believes are (a) consistent with the SEC’s auditor independence rules and (b) routine and recurring services that will not impair the independence of the independent accountants may be approved by the Committee without consideration on a specific case-by-case basis (“general pre-approval”). The term of any general pre-approval is 12 months from the date of the pre-approval, unless the Committee provides for a different period. Tax or other non-audit services provided to the registrant which have a direct impact on the operations or financial reporting of the registrant will only be deemed pre-approved provided that any individual project does not exceed $10,000 attributable to the registrant or $50,000 per project. For this purpose, multiple projects will be aggregated to determine if they exceed the previously mentioned cost levels.
Any proposed services exceeding the pre-approved cost levels will require specific pre-approval by the Committee, as will any other services not subject to general pre-approval (e.g., unanticipated but permissible services). The Committee is informed of each service approved subject to general pre-approval at the next regularly scheduled in-person board meeting. At this meeting, an analysis of such services is presented to the Committee for ratification. The Committee may delegate to the Committee Chairman the authority to approve the provision of and fees for any specific engagement of permitted non-audit services, including services exceeding pre-approved cost levels.
(e)(2) None of the services described in each of Items 4(b) through (d) were approved by the Committee pursuant to the de minimus exception in paragraph (c)(7)(i)(C) of Rule 2-01 of Regulation S-X.
(f) Not Applicable
(g) The aggregate non-audit fees, defined as the sum of the fees shown under “Audit-Related Fees,” “Tax Fees” and “All Other Fees,” paid to the accountant for services rendered by the accountant to the registrant, the Investment Adviser and the Affiliated Service Providers were:
| | | | | | |
| | | Entity Name | | Current Fiscal Year
End | | Previous Fiscal Year
End |
| | BlackRock Event Driven Equity Fund | | $13,100 | | $13,107 |
Additionally, the amounts billed by D&T in connection with services provided to the Affiliated Service Providers of the Fund and of other funds sponsored and advised by BlackRock or its affiliates during the current and previous fiscal years for a service organization review and an accounting research tool subscription were:
3
| | |
Current Fiscal Year
End | | Previous Fiscal Year
End |
$2,274,000 | | $2,129,000 |
These amounts represent aggregate fees paid by BlackRock and were not allocated on a per fund basis.
(h) The Committee has considered and determined that the provision of non-audit services that were rendered to the Investment Adviser and the Affiliated Service Providers that were not pre-approved pursuant to paragraph (c)(7)(ii) of Rule 2-01 of Regulation S-X is compatible with maintaining the principal accountant’s independence.
| Item 5 – | Audit Committee of Listed Registrants – Not Applicable |
(a) The registrant’s Schedule of Investments is included as part of the Report to Stockholders filed under Item 1 of this Form.
(b) Not Applicable due to no such divestments during the semi-annual period covered since the previous Form N-CSR filing.
| Item 7 – | Disclosure of Proxy Voting Policies and Procedures for Closed-End Management Investment Companies – Not Applicable |
| Item 8 – | Portfolio Managers of Closed-End Management Investment Companies – Not Applicable |
| Item 9 – | Purchases of Equity Securities by Closed-End Management Investment Company and Affiliated Purchasers – Not Applicable |
| Item 10 – | Submission of Matters to a Vote of Security Holders – There have been no material changes to these procedures. |
| Item 11 – | Controls and Procedures |
(a) The registrant’s principal executive and principal financial officers, or persons performing similar functions, have concluded that the registrant’s disclosure controls and procedures (as defined in Rule 30a-3(c) under the Investment Company Act of 1940, as amended (the “1940 Act”)) are effective as of a date within 90 days of the filing of this report based on the evaluation of these controls and procedures required by Rule 30a-3(b) under the 1940 Act and Rule 15d-15(b) under the Securities Exchange Act of 1934, as amended.
(b) There were no changes in the registrant’s internal control over financial reporting (as defined in Rule 30a-3(d) under the 1940 Act) that occurred during the second fiscal quarter of the period covered by this report that have materially affected, or are reasonably likely to materially affect, the registrant’s internal control over financial reporting.
| Item 12 – | Disclosure of Securities Lending Activities for Closed-End Management Investment Companies – Not Applicable to the registrant |
| Item 13 – | Exhibits attached hereto |
4
(a)(1) Code of Ethics – See Item 2
(a)(2) Certifications – Attached hereto
(a)(3) Not Applicable
(a)(4) Not Applicable
(b) Certifications – Attached hereto
5
Pursuant to the requirements of the Securities Exchange Act of 1934 and the Investment Company Act of 1940, the registrant has duly caused this report to be signed on its behalf by the undersigned, thereunto duly authorized.
BlackRock Large Cap Series Funds, Inc.
| | |
| |
| By: | | /s/ John M. Perlowski |
| | John M. Perlowski |
| | Chief Executive Officer (principal executive officer) of |
| | BlackRock Large Cap Series Funds, Inc. |
|
| Date: December 4, 2018 |
Pursuant to the requirements of the Securities Exchange Act of 1934 and the Investment Company Act of 1940, this report has been signed below by the following persons on behalf of the registrant and in the capacities and on the dates indicated.
| | |
| By: | | /s/ John M. Perlowski |
| | John M. Perlowski |
| | Chief Executive Officer (principal executive officer) of |
| | BlackRock Large Cap Series Funds, Inc. |
|
| Date: December 4, 2018 |
| |
| By: | | /s/ Neal J. Andrews |
| | Neal J. Andrews |
| | Chief Financial Officer (principal financial officer) of |
| | BlackRock Large Cap Series Funds, Inc. |
|
| Date: December 4, 2018 |
6