UNITED STATES
SECURITIES AND EXCHANGE COMMISSION
FORM N-CSR
CERTIFIED SHAREHOLDER REPORT OF REGISTERED MANAGEMENT INVESTMENT COMPANIES
Investment Company Act file number811-09645
Columbia Funds Series Trust
(Exact name of registrant as specified in charter)
225 Franklin Street
Boston, Massachusetts 02110
(Address of principal executive offices) (Zip code)
Christopher O. Petersen, Esq.
c/o Columbia Management Investment Advisers, LLC
225 Franklin Street
Boston, Massachusetts 02110
Ryan C. Larrenaga, Esq.
c/o Columbia Management Investment Advisers, LLC
225 Franklin Street
Boston, MA 02110
(Name and address of agent for service)
Registrant's telephone number, including area code: (800) 345-6611
Date of fiscal year end: January 31
Date of reporting period: January 31, 2020
Form N-CSR is to be used by management investment companies to file reports with the Commission not later than 10 days after the transmission to stockholders of any report that is required to be transmitted to stockholders under Rule 30e-1 under the Investment Company Act of 1940 (17 CFR 270.30e-1). The Commission may use the information provided on Form N-CSR in its regulatory, disclosure review, inspection, and policymaking roles.
A registrant is required to disclose the information specified by Form N-CSR, and the Commission will make this information public. A registrant is not required to respond to the collection of information contained in Form N-CSR unless the Form displays a currently valid Office of Management and Budget ("OMB") control number. Please direct comments concerning the accuracy of the information collection burden estimate and any suggestions for reducing the burden to Secretary, Securities and Exchange Commission, 100 F Street, NE, Washington, DC 20549. The OMB has reviewed this collection of information under the clearance requirements of 44 U.S.C. § 3507.
Item 1. Reports to Stockholders.

Annual Report
January 31, 2020
Columbia Capital Allocation Portfolios
Columbia Capital Allocation Conservative Portfolio
Columbia Capital Allocation Moderate Conservative Portfolio
Columbia Capital Allocation Moderate Portfolio
Columbia Capital Allocation Moderate Aggressive Portfolio
Columbia Capital Allocation Aggressive Portfolio
Beginning on January 1, 2021, as permitted by regulations adopted by the Securities and Exchange Commission, paper copies of the Funds’ annual and semiannual shareholder reports like this one will no longer be sent by mail, unless you specifically request paper copies of the reports. Instead, the reports will be made available on the Funds’ website (columbiathreadneedleus.com/investor/), and each time a report is posted you will be notified by mail and provided with a website address to access the report.
If you have already elected to receive shareholder reports electronically, you will not be affected by this change and you need not take any action. You may elect to receive shareholder reports and other communications from the Funds electronically at any time by contacting your financial intermediary (such as a broker-dealer or bank) or, for Fund shares held directly with the Funds, by calling 800.345.6611 or by enrolling in “eDelivery” by logging into your account at columbiathreadneedleus.com/investor/.
You may elect to receive all future reports in paper free of charge. If you invest through a financial intermediary, you can contact your financial intermediary to request that you continue receiving paper copies of your shareholder reports. If you invest directly with the Funds, you can call 800.345.6611 to let the Funds know you wish to continue receiving paper copies of your shareholder reports. Your election to receive paper reports will apply to all Columbia Funds held in your account if you invest through a financial intermediary or all Columbia Funds held with the fund complex if you invest directly with the Funds.
Not FDIC Insured • No bank guarantee • May lose value
| 3 |
| 5 |
| 7 |
| 9 |
| 11 |
| 13 |
| 16 |
| 18 |
| 84 |
| 88 |
| 92 |
| 98 |
| 118 |
| 143 |
| 145 |
| 146 |
Columbia Capital Allocation Portfolios | Annual Report 2020
Fund at a Glance
Columbia Capital Allocation Conservative Portfolio
Investment objective
Columbia Capital Allocation Conservative Portfolio (the Fund) is designed for investors seeking the highest level of total return that is consistent with a conservative level of risk.
Portfolio management
Anwiti Bahuguna, Ph.D.
Lead Portfolio Manager
Managed Fund since 2010
Dan Boncarosky, CFA
Portfolio Manager
Managed Fund since 2017
| Average annual total returns (%) (for the period ended January 31, 2020) |
| | | Inception | 1 Year | 5 Years | 10 Years |
| Class A | Excluding sales charges | 03/04/04 | 8.91 | 3.69 | 4.78 |
| | Including sales charges | | 3.71 | 2.69 | 4.27 |
| Advisor Class* | 06/13/13 | 9.14 | 3.95 | 4.94 |
| Class C | Excluding sales charges | 03/04/04 | 8.05 | 2.91 | 4.00 |
| | Including sales charges | | 7.05 | 2.91 | 4.00 |
| Institutional Class* | 09/27/10 | 9.08 | 3.93 | 5.02 |
| Institutional 2 Class* | 06/13/13 | 9.17 | 3.98 | 4.98 |
| Institutional 3 Class* | 06/13/13 | 9.24 | 4.04 | 5.01 |
| Class R* | 09/27/10 | 8.54 | 3.41 | 4.52 |
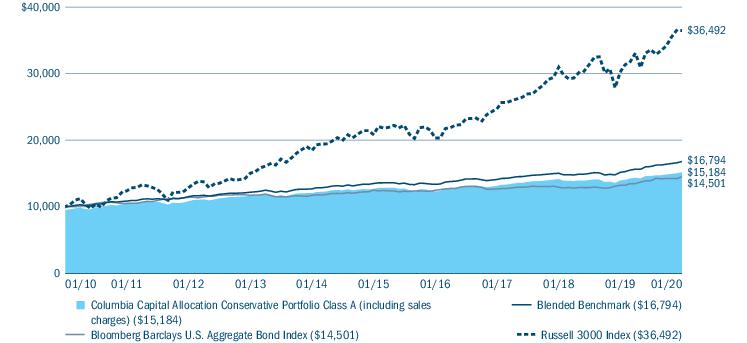
| Blended Benchmark | | 10.71 | 4.47 | 5.32 |
| Bloomberg Barclays U.S. Aggregate Bond Index | | 9.64 | 3.01 | 3.79 |
| Russell 3000 Index | | 20.53 | 11.85 | 13.82 |
Returns for Class A shares are shown with and without the maximum initial sales charge of 4.75%. Returns for Class C shares are shown with and without the 1.00% contingent deferred sales charge for the first year only. The Fund’s other share classes are not subject to sales charges and have limited eligibility. Please see the Fund’s prospectus for details. Performance for different share classes will vary based on differences in sales charges and fees associated with each share class. All results shown assume reinvestment of distributions during the period. Returns do not reflect the deduction of taxes that a shareholder may pay on Fund distributions or on the redemption of Fund shares. Performance results reflect the effect of any fee waivers or reimbursements of Fund expenses by Columbia Management Investment Advisers, LLC and/or any of its affiliates. Absent these fee waivers or expense reimbursement arrangements, performance results would have been lower.
The performance information shown represents past performance and is not a guarantee of future results. The investment return and principal value of your investment will fluctuate so that your shares, when redeemed, may be worth more or less than their original cost. Current performance may be lower or higher than the performance information shown. You may obtain performance information current to the most recent month-end by contacting your financial intermediary, visiting columbiathreadneedleus.com/investor/ or calling 800.345.6611.
| * | The returns shown for periods prior to the share class inception date (including returns for the Life of the Fund, if shown, which are since Fund inception) include the returns of the Fund’s oldest share class. Since the Fund launched more than one share class at its inception, Class A shares were used. These returns are adjusted to reflect any higher class-related operating expenses of the newer share classes, as applicable. Please visit columbiathreadneedleus.com/investor/investment-products/mutual-funds/appended-performance for more information. |
The Blended Benchmark consists of 66% Bloomberg Barclays U.S. Aggregate Bond Index, 15% Russell 3000 Index, 10% FTSE Three-Month U.S. Treasury Bill Index, 5% MSCI EAFE Index (Net) and 4% Bloomberg Barclays U.S. Corporate High-Yield Index. The FTSE Three-Month U.S. Treasury Bill Index, an unmanaged index, is representative of the performance of three-month Treasury bills. The MSCI EAFE Index (Net) is a free float-adjusted market capitalization index that is designed to measure the equity market performance of developed markets, excluding the U.S. and Canada. The Bloomberg Barclays U.S. Corporate High-Yield Index is a market value-weighted index, which covers the U.S. non-investment-grade fixed-rate debt market.
The Bloomberg Barclays U.S. Aggregate Bond Index is a broad-based benchmark that measures the investment-grade, U.S. dollar-denominated, fixed-rate taxable bond market, including Treasuries, government-related and corporate securities, mortgage-backed securities (agency fixed-rate and hybrid adjustable-rate mortgage passthroughs), asset-backed securities, and commercial mortgage-backed securities.
The Russell 3000 Index, an unmanaged index, measures the performance of the 3,000 largest U.S. companies based on total market capitalization, which represents approximately 98% of the investable U.S. equity market.
Indices are not available for investment, are not professionally managed and do not reflect sales charges, fees, brokerage commissions, taxes (except the MSCI EAFE Index (Net), which reflects reinvested dividends net of withholding taxes) or other expenses of investing. Securities in the Fund may not match those in an index.
Columbia Capital Allocation Portfolios | Annual Report 2020
| 3 |
Fund at a Glance (continued)
Columbia Capital Allocation Conservative Portfolio
Performance of a hypothetical $10,000 investment (January 31, 2010 — January 31, 2020)
The chart above shows the change in value of a hypothetical $10,000 investment in Class A shares of Columbia Capital Allocation Conservative Portfolio during the stated time period, and does not reflect the deduction of taxes that a shareholder may pay on Fund distributions or on the redemption of Fund shares.
| Portfolio breakdown (%) (at January 31, 2020) |
| Alternative Strategies Funds | 5.5 |
| Common Stocks | 4.3 |
| Equity Funds | 16.9 |
| Fixed Income Funds | 59.8 |
| Money Market Funds | 13.5 |
| Total | 100.0 |
Percentages indicated are based upon total investments excluding investments in derivatives, if any. The Fund’s portfolio composition is subject to change.
| 4 | Columbia Capital Allocation Portfolios | Annual Report 2020 |
Fund at a Glance
Columbia Capital Allocation Moderate Conservative Portfolio
Investment objective
Columbia Capital Allocation Moderate Conservative Portfolio (the Fund) is designed for investors seeking the highest level of total return that is consistent with a moderate conservative level of risk.
Portfolio management
Anwiti Bahuguna, Ph.D.
Lead Portfolio Manager
Managed Fund since 2009
Dan Boncarosky, CFA
Portfolio Manager
Managed Fund since 2017
| Average annual total returns (%) (for the period ended January 31, 2020) |
| | | Inception | 1 Year | 5 Years | 10 Years |
| Class A | Excluding sales charges | 10/15/96 | 10.52 | 4.88 | 6.32 |
| | Including sales charges | | 4.18 | 3.64 | 5.70 |
| Advisor Class* | 11/08/12 | 10.80 | 5.15 | 6.51 |
| Class C | Excluding sales charges | 10/15/96 | 9.65 | 4.09 | 5.52 |
| | Including sales charges | | 8.65 | 4.09 | 5.52 |
| Institutional Class | 10/15/96 | 10.76 | 5.13 | 6.58 |
| Institutional 2 Class* | 11/08/12 | 10.83 | 5.19 | 6.56 |
| Institutional 3 Class* | 06/13/13 | 10.94 | 5.23 | 6.57 |
| Class R | 01/23/06 | 10.23 | 4.63 | 6.05 |
| Blended Benchmark | | 12.42 | 5.68 | 6.73 |
| Bloomberg Barclays U.S. Aggregate Bond Index | | 9.64 | 3.01 | 3.79 |
| Russell 3000 Index | | 20.53 | 11.85 | 13.82 |
Returns for Class A shares are shown with and without the maximum initial sales charge of 5.75%. Returns for Class C shares are shown with and without the 1.00% contingent deferred sales charge for the first year only. The Fund’s other share classes are not subject to sales charges and have limited eligibility. Please see the Fund’s prospectus for details. Performance for different share classes will vary based on differences in sales charges and fees associated with each share class. All results shown assume reinvestment of distributions during the period. Returns do not reflect the deduction of taxes that a shareholder may pay on Fund distributions or on the redemption of Fund shares. Performance results reflect the effect of any fee waivers or reimbursements of Fund expenses by Columbia Management Investment Advisers, LLC and/or any of its affiliates. Absent these fee waivers or expense reimbursement arrangements, performance results would have been lower.
The performance information shown represents past performance and is not a guarantee of future results. The investment return and principal value of your investment will fluctuate so that your shares, when redeemed, may be worth more or less than their original cost. Current performance may be lower or higher than the performance information shown. You may obtain performance information current to the most recent month-end by contacting your financial intermediary, visiting columbiathreadneedleus.com/investor/ or calling 800.345.6611.
| * | The returns shown for periods prior to the share class inception date (including returns for the Life of the Fund, if shown, which are since Fund inception) include the returns of the Fund’s oldest share class. Since the Fund launched more than one share class at its inception, Class A shares were used. These returns are adjusted to reflect any higher class-related operating expenses of the newer share classes, as applicable. Please visit columbiathreadneedleus.com/investor/investment-products/mutual-funds/appended-performance for more information. |
The Blended Benchmark consists of 55.5% Bloomberg Barclays U.S. Aggregate Bond Index, 26% Russell 3000 Index, 9% MSCI EAFE Index (Net), 5% FTSE Three-Month U.S. Treasury Bill Index and 4.5% Bloomberg Barclays U.S. Corporate High-Yield Index. The MSCI EAFE Index (Net) is a free float-adjusted market capitalization index that is designed to measure the equity market performance of developed markets, excluding the U.S. and Canada. The FTSE Three-Month U.S. Treasury Bill Index, an unmanaged index, is representative of the performance of three-month Treasury bills. The Bloomberg Barclays U.S. Corporate High-Yield Index is a market value-weighted index, which covers the U.S. non-investment-grade fixed-rate debt market.
The Bloomberg Barclays U.S. Aggregate Bond Index is a broad-based benchmark that measures the investment-grade, U.S. dollar-denominated, fixed-rate taxable bond market, including Treasuries, government-related and corporate securities, mortgage-backed securities (agency fixed-rate and hybrid adjustable-rate mortgage passthroughs), asset-backed securities, and commercial mortgage-backed securities.
The Russell 3000 Index, an unmanaged index, measures the performance of the 3,000 largest U.S. companies based on total market capitalization, which represents approximately 98% of the investable U.S. equity market.
Indices are not available for investment, are not professionally managed and do not reflect sales charges, fees, brokerage commissions, taxes (except the MSCI EAFE Index (Net), which reflects reinvested dividends net of withholding taxes) or other expenses of investing. Securities in the Fund may not match those in an index.
Columbia Capital Allocation Portfolios | Annual Report 2020
| 5 |
Fund at a Glance (continued)
Columbia Capital Allocation Moderate Conservative Portfolio
Performance of a hypothetical $10,000 investment (January 31, 2010 — January 31, 2020)
The chart above shows the change in value of a hypothetical $10,000 investment in Class A shares of Columbia Capital Allocation Moderate Conservative Portfolio during the stated time period, and does not reflect the deduction of taxes that a shareholder may pay on Fund distributions or on the redemption of Fund shares.
| Portfolio breakdown (%) (at January 31, 2020) |
| Alternative Strategies Funds | 5.3 |
| Common Stocks | 3.0 |
| Equity Funds | 29.2 |
| Fixed Income Funds | 49.9 |
| Money Market Funds | 12.6 |
| Total | 100.0 |
Percentages indicated are based upon total investments excluding investments in derivatives, if any. The Fund’s portfolio composition is subject to change.
| 6 | Columbia Capital Allocation Portfolios | Annual Report 2020 |
Fund at a Glance
Columbia Capital Allocation Moderate Portfolio
Investment objective
Columbia Capital Allocation Moderate Portfolio (the Fund) is designed for investors seeking the highest level of total return that is consistent with a moderate level of risk.
Portfolio management
Anwiti Bahuguna, Ph.D.
Lead Portfolio Manager
Managed Fund since 2010
Dan Boncarosky, CFA
Portfolio Manager
Managed Fund since 2017
| Average annual total returns (%) (for the period ended January 31, 2020) |
| | | Inception | 1 Year | 5 Years | 10 Years |
| Class A | Excluding sales charges | 03/04/04 | 12.26 | 6.23 | 7.66 |
| | Including sales charges | | 5.83 | 4.98 | 7.02 |
| Advisor Class* | 06/13/13 | 12.51 | 6.50 | 7.84 |
| Class C | Excluding sales charges | 03/04/04 | 11.34 | 5.44 | 6.85 |
| | Including sales charges | | 10.34 | 5.44 | 6.85 |
| Institutional Class* | 09/27/10 | 12.55 | 6.50 | 7.91 |
| Institutional 2 Class* | 06/13/13 | 12.53 | 6.52 | 7.88 |
| Institutional 3 Class* | 06/13/13 | 12.68 | 6.62 | 7.93 |
| Class R* | 09/27/10 | 11.92 | 5.96 | 7.38 |
| Blended Benchmark | | 13.95 | 6.93 | 8.17 |
| Russell 3000 Index | | 20.53 | 11.85 | 13.82 |
| Bloomberg Barclays U.S. Aggregate Bond Index | | 9.64 | 3.01 | 3.79 |
Returns for Class A shares are shown with and without the maximum initial sales charge of 5.75%. Returns for Class C shares are shown with and without the 1.00% contingent deferred sales charge for the first year only. The Fund’s other share classes are not subject to sales charges and have limited eligibility. Please see the Fund’s prospectus for details. Performance for different share classes will vary based on differences in sales charges and fees associated with each share class. All results shown assume reinvestment of distributions during the period. Returns do not reflect the deduction of taxes that a shareholder may pay on Fund distributions or on the redemption of Fund shares. Performance results reflect the effect of any fee waivers or reimbursements of Fund expenses by Columbia Management Investment Advisers, LLC and/or any of its affiliates. Absent these fee waivers or expense reimbursement arrangements, performance results would have been lower.
The performance information shown represents past performance and is not a guarantee of future results. The investment return and principal value of your investment will fluctuate so that your shares, when redeemed, may be worth more or less than their original cost. Current performance may be lower or higher than the performance information shown. You may obtain performance information current to the most recent month-end by contacting your financial intermediary, visiting columbiathreadneedleus.com/investor/ or calling 800.345.6611.
| * | The returns shown for periods prior to the share class inception date (including returns for the Life of the Fund, if shown, which are since Fund inception) include the returns of the Fund’s oldest share class. Since the Fund launched more than one share class at its inception, Class A shares were used. These returns are adjusted to reflect any higher class-related operating expenses of the newer share classes, as applicable. Please visit columbiathreadneedleus.com/investor/investment-products/mutual-funds/appended-performance for more information. |
The Blended Benchmark consists of 42.5% Bloomberg Barclays U.S. Aggregate Bond Index, 37% Russell 3000 Index, 11% MSCI EAFE Index (Net), 7.5% Bloomberg Barclays U.S. Corporate High-Yield Index and 2% MSCI Emerging Markets Index (Net). The MSCI EAFE Index (Net) is a free float-adjusted market capitalization index that is designed to measure the equity market performance of developed markets, excluding the U.S. and Canada. The Bloomberg Barclays U.S. Corporate High-Yield Index is a market value-weighted index, which covers the U.S. non-investment-grade fixed-rate debt market. The MSCI Emerging Markets Index (Net) is a free float-adjusted market capitalization index that is designed to measure equity market performance of emerging markets.
The Russell 3000 Index, an unmanaged index, measures the performance of the 3,000 largest U.S. companies based on total market capitalization, which represents approximately 98% of the investable U.S. equity market.
The Bloomberg Barclays U.S. Aggregate Bond Index is a broad-based benchmark that measures the investment-grade, U.S. dollar-denominated, fixed-rate taxable bond market, including Treasuries, government-related and corporate securities, mortgage-backed securities (agency fixed-rate and hybrid adjustable-rate mortgage passthroughs), asset-backed securities, and commercial mortgage-backed securities.
Indices are not available for investment, are not professionally managed and do not reflect sales charges, fees, brokerage commissions, taxes (except the MSCI EAFE Index (Net) and the MSCI Emerging Markets Index (Net), which reflect reinvested dividends net of withholding taxes) or other expenses of investing. Securities in the Fund may not match those in an index.
Columbia Capital Allocation Portfolios | Annual Report 2020
| 7 |
Fund at a Glance (continued)
Columbia Capital Allocation Moderate Portfolio
Performance of a hypothetical $10,000 investment (January 31, 2010 — January 31, 2020)
The chart above shows the change in value of a hypothetical $10,000 investment in Class A shares of Columbia Capital Allocation Moderate Portfolio during the stated time period, and does not reflect the deduction of taxes that a shareholder may pay on Fund distributions or on the redemption of Fund shares.
| Portfolio breakdown (%) (at January 31, 2020) |
| Alternative Strategies Funds | 3.9 |
| Common Stocks | 2.3 |
| Equity Funds | 40.9 |
| Fixed Income Funds | 43.9 |
| Money Market Funds | 9.0 |
| Preferred Stocks | 0.0(a) |
| Total | 100.0 |
Percentages indicated are based upon total investments excluding investments in derivatives, if any. The Fund’s portfolio composition is subject to change.
| 8 | Columbia Capital Allocation Portfolios | Annual Report 2020 |
Fund at a Glance
Columbia Capital Allocation Moderate Aggressive Portfolio
Investment objective
Columbia Capital Allocation Moderate Aggressive Portfolio (the Fund) is designed for investors seeking the highest level of total return that is consistent with a moderate aggressive level of risk.
Portfolio management
Anwiti Bahuguna, Ph.D.
Lead Portfolio Manager
Managed Fund since 2009
Dan Boncarosky, CFA
Portfolio Manager
Managed Fund since 2017
| Average annual total returns (%) (for the period ended January 31, 2020) |
| | | Inception | 1 Year | 5 Years | 10 Years |
| Class A | Excluding sales charges | 10/15/96 | 13.51 | 7.24 | 8.62 |
| | Including sales charges | | 6.99 | 5.98 | 7.98 |
| Advisor Class* | 11/08/12 | 13.75 | 7.50 | 8.82 |
| Class C | Excluding sales charges | 10/15/96 | 12.55 | 6.43 | 7.80 |
| | Including sales charges | | 11.55 | 6.43 | 7.80 |
| Institutional Class | 10/15/96 | 13.73 | 7.49 | 8.89 |
| Institutional 2 Class* | 11/08/12 | 13.72 | 7.57 | 8.87 |
| Institutional 3 Class* | 06/13/13 | 13.87 | 7.61 | 8.89 |
| Class R | 01/23/06 | 13.15 | 6.96 | 8.35 |
| Class V* | Excluding sales charges | 03/07/11 | 13.51 | 7.24 | 8.59 |
| | Including sales charges | | 6.99 | 5.98 | 7.95 |
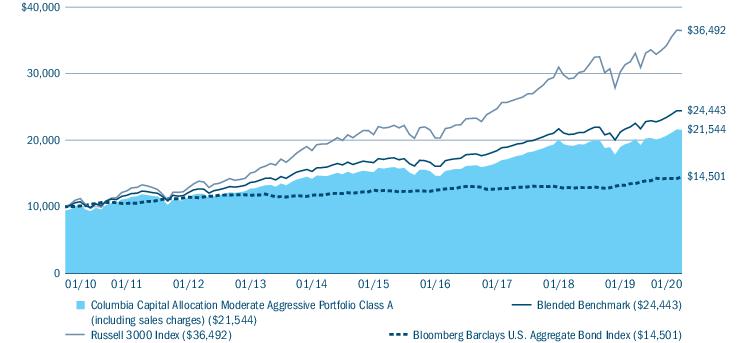
| Blended Benchmark | | 15.13 | 8.01 | 9.35 |
| Russell 3000 Index | | 20.53 | 11.85 | 13.82 |
| Bloomberg Barclays U.S. Aggregate Bond Index | | 9.64 | 3.01 | 3.79 |
Returns for Class A and Class V shares are shown with and without the maximum initial sales charge of 5.75%. Returns for Class C shares are shown with and without the 1.00% contingent deferred sales charge for the first year only. The Fund’s other share classes are not subject to sales charges and have limited eligibility. Please see the Fund’s prospectus for details. Performance for different share classes will vary based on differences in sales charges and fees associated with each share class. All results shown assume reinvestment of distributions during the period. Returns do not reflect the deduction of taxes that a shareholder may pay on Fund distributions or on the redemption of Fund shares. Performance results reflect the effect of any fee waivers or reimbursements of Fund expenses by Columbia Management Investment Advisers, LLC and/or any of its affiliates. Absent these fee waivers or expense reimbursement arrangements, performance results would have been lower.
The performance information shown represents past performance and is not a guarantee of future results. The investment return and principal value of your investment will fluctuate so that your shares, when redeemed, may be worth more or less than their original cost. Current performance may be lower or higher than the performance information shown. You may obtain performance information current to the most recent month-end by contacting your financial intermediary, visiting columbiathreadneedleus.com/investor/ or calling 800.345.6611.
| * | The returns shown for periods prior to the share class inception date (including returns for the Life of the Fund, if shown, which are since Fund inception) include the returns of the Fund’s oldest share class. Since the Fund launched more than one share class at its inception, Class A shares were used. These returns are adjusted to reflect any higher class-related operating expenses of the newer share classes, as applicable. Please visit columbiathreadneedleus.com/investor/investment-products/mutual-funds/appended-performance for more information. |
The Blended Benchmark consists of 49% Russell 3000 Index, 28.5% Bloomberg Barclays U.S. Aggregate Bond Index, 12% MSCI EAFE Index (Net), 6.5% Bloomberg Barclays U.S. Corporate High-Yield Index and 4% MSCI Emerging Markets Index (Net). The MSCI EAFE Index (Net) is a free float-adjusted market capitalization index that is designed to measure the equity market performance of developed markets, excluding the U.S. and Canada. The Bloomberg Barclays U.S. Corporate High-Yield Index is a market value-weighted index, which covers the U.S. non-investment-grade fixed-rate debt market. The MSCI Emerging Markets Index (Net) is a free float-adjusted market capitalization index that is designed to measure equity market performance of emerging markets.
The Russell 3000 Index, an unmanaged index, measures the performance of the 3,000 largest U.S. companies based on total market capitalization, which represents approximately 98% of the investable U.S. equity market.
The Bloomberg Barclays U.S. Aggregate Bond Index is a broad-based benchmark that measures the investment-grade, U.S. dollar-denominated, fixed-rate taxable bond market, including Treasuries, government-related and corporate securities, mortgage-backed securities (agency fixed-rate and hybrid adjustable-rate mortgage passthroughs), asset-backed securities, and commercial mortgage-backed securities.
Indices are not available for investment, are not professionally managed and do not reflect sales charges, fees, brokerage commissions, taxes (except the MSCI EAFE Index (Net) and the MSCI Emerging Markets Index (Net), which reflect reinvested dividends net of withholding taxes) or other expenses of investing. Securities in the Fund may not match those in an index.
Columbia Capital Allocation Portfolios | Annual Report 2020
| 9 |
Fund at a Glance (continued)
Columbia Capital Allocation Moderate Aggressive Portfolio
Performance of a hypothetical $10,000 investment (January 31, 2010 — January 31, 2020)
The chart above shows the change in value of a hypothetical $10,000 investment in Class A shares of Columbia Capital Allocation Moderate Aggressive Portfolio during the stated time period, and does not reflect the deduction of taxes that a shareholder may pay on Fund distributions or on the redemption of Fund shares.
| Portfolio breakdown (%) (at January 31, 2020) |
| Alternative Strategies Funds | 4.0 |
| Common Stocks | 1.7 |
| Equity Funds | 52.5 |
| Fixed Income Funds | 24.8 |
| Money Market Funds | 17.0 |
| Preferred Stocks | 0.0(a) |
| Total | 100.0 |
Percentages indicated are based upon total investments excluding investments in derivatives, if any. The Fund’s portfolio composition is subject to change.
| 10 | Columbia Capital Allocation Portfolios | Annual Report 2020 |
Fund at a Glance
Columbia Capital Allocation Aggressive Portfolio
Investment objective
Columbia Capital Allocation Aggressive Portfolio (the Fund) is designed for investors seeking the highest level of total return that is consistent with an aggressive level of risk.
Portfolio management
Anwiti Bahuguna, Ph.D.
Lead Portfolio Manager
Managed Fund since 2010
Dan Boncarosky, CFA
Portfolio Manager
Managed Fund since 2017
| Average annual total returns (%) (for the period ended January 31, 2020) |
| | | Inception | 1 Year | 5 Years | 10 Years |
| Class A | Excluding sales charges | 03/04/04 | 14.00 | 8.02 | 9.62 |
| | Including sales charges | | 7.41 | 6.74 | 8.97 |
| Advisor Class* | 06/13/13 | 14.33 | 8.29 | 9.80 |
| Class C | Excluding sales charges | 03/04/04 | 13.21 | 7.22 | 8.82 |
| | Including sales charges | | 12.21 | 7.22 | 8.82 |
| Institutional Class* | 09/27/10 | 14.34 | 8.30 | 9.89 |
| Institutional 2 Class* | 06/13/13 | 14.35 | 8.36 | 9.86 |
| Institutional 3 Class* | 06/13/13 | 14.42 | 8.41 | 9.89 |
| Class R* | 09/27/10 | 13.77 | 7.77 | 9.37 |
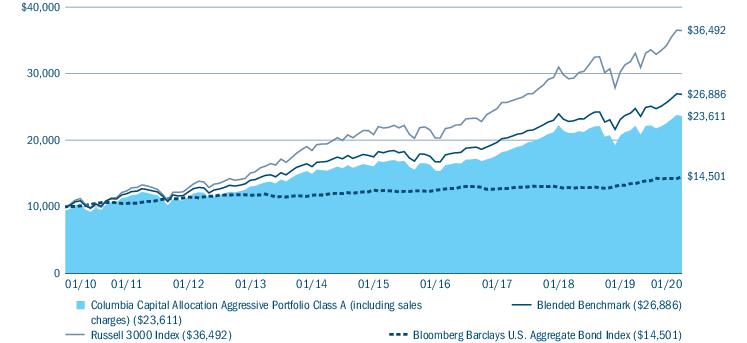
| Blended Benchmark | | 16.21 | 8.97 | 10.40 |
| Russell 3000 Index | | 20.53 | 11.85 | 13.82 |
| Bloomberg Barclays U.S. Aggregate Bond Index | | 9.64 | 3.01 | 3.79 |
Returns for Class A shares are shown with and without the maximum initial sales charge of 5.75%. Returns for Class C shares are shown with and without the 1.00% contingent deferred sales charge for the first year only. The Fund’s other share classes are not subject to sales charges and have limited eligibility. Please see the Fund’s prospectus for details. Performance for different share classes will vary based on differences in sales charges and fees associated with each share class. All results shown assume reinvestment of distributions during the period. Returns do not reflect the deduction of taxes that a shareholder may pay on Fund distributions or on the redemption of Fund shares. Performance results reflect the effect of any fee waivers or reimbursements of Fund expenses by Columbia Management Investment Advisers, LLC and/or any of its affiliates. Absent these fee waivers or expense reimbursement arrangements, performance results would have been lower.
The performance information shown represents past performance and is not a guarantee of future results. The investment return and principal value of your investment will fluctuate so that your shares, when redeemed, may be worth more or less than their original cost. Current performance may be lower or higher than the performance information shown. You may obtain performance information current to the most recent month-end by contacting your financial intermediary, visiting columbiathreadneedleus.com/investor/ or calling 800.345.6611.
| * | The returns shown for periods prior to the share class inception date (including returns for the Life of the Fund, if shown, which are since Fund inception) include the returns of the Fund’s oldest share class. Since the Fund launched more than one share class at its inception, Class A shares were used. These returns are adjusted to reflect any higher class-related operating expenses of the newer share classes, as applicable. Please visit columbiathreadneedleus.com/investor/investment-products/mutual-funds/appended-performance for more information. |
The Blended Benchmark consists of 60% Russell 3000 Index, 15% Bloomberg Barclays U.S. Aggregate Bond Index, 14% MSCI EAFE Index (Net), 6% MSCI Emerging Markets Index (Net) and 5% Bloomberg Barclays U.S. Corporate High-Yield Index. The MSCI EAFE Index (Net) is a free float-adjusted market capitalization index that is designed to measure the equity market performance of developed markets, excluding the U.S. and Canada. The MSCI Emerging Markets Index (Net) is a free float-adjusted market capitalization index that is designed to measure equity market performance of emerging markets. The Bloomberg Barclays U.S. Corporate High-Yield Index is a market value-weighted index, which covers the U.S. non-investment-grade fixed-rate debt market.
The Russell 3000 Index, an unmanaged index, measures the performance of the 3,000 largest U.S. companies based on total market capitalization, which represents approximately 98% of the investable U.S. equity market.
The Bloomberg Barclays U.S. Aggregate Bond Index is a broad-based benchmark that measures the investment-grade, U.S. dollar-denominated, fixed-rate taxable bond market, including Treasuries, government-related and corporate securities, mortgage-backed securities (agency fixed-rate and hybrid adjustable-rate mortgage passthroughs), asset-backed securities, and commercial mortgage-backed securities.
Indices are not available for investment, are not professionally managed and do not reflect sales charges, fees, brokerage commissions, taxes (except the MSCI EAFE Index (Net) and the MSCI Emerging Markets Index (Net), which reflect reinvested dividends net of withholding taxes) or other expenses of investing. Securities in the Fund may not match those in an index.
Columbia Capital Allocation Portfolios | Annual Report 2020
| 11 |
Fund at a Glance (continued)
Columbia Capital Allocation Aggressive Portfolio
Performance of a hypothetical $10,000 investment (January 31, 2010 — January 31, 2020)
The chart above shows the change in value of a hypothetical $10,000 investment in Class A shares of Columbia Capital Allocation Aggressive Portfolio during the stated time period, and does not reflect the deduction of taxes that a shareholder may pay on Fund distributions or on the redemption of Fund shares.
| Portfolio breakdown (%) (at January 31, 2020) |
| Alternative Strategies Funds | 4.0 |
| Common Stocks | 2.8 |
| Equity Funds | 70.6 |
| Fixed Income Funds | 12.8 |
| Money Market Funds | 9.8 |
| Preferred Stocks | 0.0(a) |
| Total | 100.0 |
Percentages indicated are based upon total investments excluding investments in derivatives, if any. The Fund’s portfolio composition is subject to change.
| 12 | Columbia Capital Allocation Portfolios | Annual Report 2020 |
Manager Discussion of Fund Performance
All Fund returns listed below are for Class A shares excluding sales charges for the 12-month period that ended January 31, 2020. Though each posted strong absolute gains, we attribute the Funds’ relative underperformance to disappointing results from underlying fund performance overall.
| • | Columbia Capital Allocation Conservative Portfolio returned 8.91%, underperforming its Blended Benchmark, which returned 10.71%. |
| • | Columbia Capital Allocation Moderate Conservative Portfolio returned 10.52% underperforming its Blended Benchmark, which returned 12.42%. |
| • | Columbia Capital Allocation Moderate Portfolio returned 12.26% underperforming its Blended Benchmark, which returned 13.95%. |
| • | Columbia Capital Allocation Moderate Aggressive Portfolio returned 13.51% underperforming its Blended Benchmark, which returned 15.13%. |
| • | Columbia Capital Allocation Aggressive Portfolio returned 14.00% underperforming its Blended Benchmark, which returned 16.21%. |
During the same time frame, the Russell 3000 Index, which measures domestic equities, returned 20.53%; the Bloomberg Barclays U.S. Aggregate Bond Index, which measures the U.S. fixed-income market, returned 9.64%; the Bloomberg Barclays U.S. Corporate High-Yield Index, which measures the U.S. high-yield corporate bond market, returned 9.40%; the MSCI EAFE Index (Net), which measures international equities, returned 12.10%; the MSCI Emerging Markets Index (Net), which measures emerging market equities, returned 3.81%; and the FTSE Three-Month U.S. Treasury Bill Index advanced 2.18% for the period.
Global capital markets enjoyed notable strength during annual period
As the annual period began in February 2019, investor optimism prevailed, as positive global economic conditions, the impact of broad U.S. corporate tax cuts, a strong U.S. labor market and moves to reduce regulations in a number of industries buoyed confidence. As the calendar year progressed, U.S. economic growth slowed from 3.1% in the first quarter of 2019 to an estimated 2.1% for 2019 overall, as manufacturing activity edged lower. European economies similarly transitioned to a slower pace of growth, struggling with rising interest rates, trade tensions and uncertainty surrounding the U.K.’s departure from the European Union. At the same time, China’s economic conditions weakened, and emerging markets came under pressure, driven by trade and tariff concerns.
Despite these global uncertainties, the U.S. stock market rose strongly in 2019, as the U.S. Federal Reserve (Fed) cut short-term interest rates three times during the second half of the calendar year and then announced at its December 2019 meeting it would hold the targeted federal funds rate at 1.50%-1.75% for the near term, judging its current monetary policy as appropriate to support economic expansion, a strong labor market and inflation approximating its 2.0% target. Central banks in major international economies followed the Fed’s lead with stimulus efforts. As we entered 2020, the coronavirus provided a challenge to riskier asset classes, especially emerging markets equities and commodities. At the end of the annual period, it was still too early to assess the extent and ramifications of the coronavirus outbreak.
Still, for the annual period overall, it was remarkably strong for the global capital markets, with nearly all asset class indices posting positive absolute returns. The Russell 3000 Index, a broad proxy for U.S. equities, generated a 20.53% return, and the S&P 500 Index, another proxy for broad-based domestic equities, rose 21.68%. Within the U.S. equity market segment, large-cap equities outperformed small-cap equities, and growth-oriented stocks significantly outpaced value-oriented stocks across the capitalization spectrum. The MSCI EAFE Index (Net), measuring international developed market equities, returned 12.10%. Emerging markets equities, as measured by the MSCI Emerging Markets Index (Net), returned a more modest 3.81%, as the greater impact of U.S.-China trade tensions and then, in January 2020, the coronavirus weighed on investor sentiment. U.S. bond markets also experienced a strong annual period, with the Bloomberg Barclays U.S. Aggregate Bond Index rising 9.64%, and the ICE BofA U.S. High Yield Constrained Index up 9.39%. The Bloomberg Barclays Global Aggregate Index returned 6.58%. Commodities were the only major asset class to generate a negative return for the annual period, attributable almost entirely to January 2020 when oil prices fell after a U.S. government report showed a significant jump in
Columbia Capital Allocation Portfolios | Annual Report 2020
| 13 |
Manager Discussion of Fund Performance (continued)
U.S. crude stockpiles and the specter of excess supply loomed over the market after the coronavirus outbreak hit demand in China, the world’s largest oil importer. Following an especially strong calendar year 2019, the Bloomberg Commodity Index returned -5.38% for the annual period ended January 31, 2020.
Underlying fund performance dampened relative results
Absolute returns in all five Funds of the Columbia Capital Allocation Portfolios were positive, but all five underperformed their respective Blended Benchmark. Underlying fund performance overall was the primary detractor from returns in all five Funds. Asset allocation decisions as a whole contributed positively to relative performance in all but the most aggressive Fund, Columbia Capital Allocation Aggressive Portfolio.
U.S. large-cap equities as an asset class posted strong double-digit gains during the annual period. As such, having an overweight allocation across all five Funds benefited relative performance. However, disappointing returns from the Funds’ underlying U.S. large-cap equity funds offset the positive allocation effect and accounted for a significant portion of the Funds’ underperformance versus their respective Blended Benchmarks. The market’s strong preference for growth over value stocks affected managers with valuation-sensitive approaches to stock selection, especially those using quantitative-driven strategies. Conversely, underlying fund selection boosted relative results within international equities in all five Funds, more than offsetting the detracting effect of being slightly underweight the strongly performing market segment. On the fixed-income side, positions in high-yield bonds contributed positively to relative returns in all five Funds, as both underlying fund performance and style positioning were strong. However, an out-of-benchmark allocation to emerging markets debt and manager selection within core fixed income detracted in all five Funds. In the aggregate, the fixed-income asset class detracted from performance across the three more conservative Funds but contributed positively in the two more aggressive Funds. The more conservative Funds had more exposure to shorter duration bonds, which underperformed longer duration bonds overall during the annual period. Out-of-benchmark positions in absolute return strategies detracted from relative returns in all five Funds, as they were not able to keep pace with the strong returns of the equity and fixed-income markets. In all five Funds, out-of-benchmark positions in commodities, which posted negative absolute returns, also detracted from results.
Shifting market conditions drove Fund changes
During the annual period, we increased the Funds’ allocation to equities, primarily via an increased exposure to U.S. large-cap equities, bringing each Fund to a moderate overweight relative to its respective Blended Benchmark. We slightly decreased allocations to international equities. We increased the Funds’ fixed-income allocations, adding exposure to emerging markets debt and high-yield bonds. At the end of the annual period, the three most conservative Funds had a modest overweight to fixed income overall relative to their respective Blended Benchmarks, and the two more aggressive Funds were positioned rather neutrally in fixed income relative to their respective Blended Benchmarks. The Funds maintained, but had modestly reduced their exposure to, alternative investment strategies. As our views on the economy evolved during the annual period, we decreased the Funds’ allocations to cash.
Derivative positions
During the annual period, the use of derivatives positions on equity indices, fixed-income indices and currencies was implemented via an overlay to the Funds to efficiently allocate capital across the Funds and to allow greater flexibility in establishing exposure to a given market than might otherwise be possible. Futures, options and credit default swaps were used, as they can offer both a liquid and cost-efficient means of establishing exposure in a given market and can be used to hedge duration and/or to reduce, or hedge, exposure to risk. The use of these instruments is integral to the Funds’ investment strategy, which, overall realized positive absolute returns during the annual period. Also, some of the underlying funds used derivatives during the annual period to attempt to enhance portfolio return and for hedging purposes as market conditions warranted.
Market risk may affect a single issuer, sector of the economy, industry or the market as a whole. The Funds’ investment in underlying funds subject them to the investment performance (positive or negative), risks and expenses of these underlying funds. There are risks associated with fixed-income investments, including credit risk, interest rate risk, and prepayment and extension risk. In general, bond prices rise when interest rates fall and vice versa. This effect is usually more pronounced for longer term securities. Foreign investments subject the Funds to risks, including political, economic, market, social and others within a particular country, as well as to currency instabilities and less stringent financial and accounting standards generally applicable to U.S. issuers.
| 14 | Columbia Capital Allocation Portfolios | Annual Report 2020 |
Manager Discussion of Fund Performance (continued)
Investing in derivatives is a specialized activity that involves special risks that subject the Funds to significant loss potential, including when used as leverage, and may result in greater fluctuation in fund value. Asset allocation does not assure a profit or protect against loss. See the Funds’ prospectus for more information on these and other risks.
The views expressed in this report reflect the current views of the respective parties. These views are not guarantees of future performance and involve certain risks, uncertainties and assumptions that are difficult to predict, so actual outcomes and results may differ significantly from the views expressed. These views are subject to change at any time based upon economic, market or other conditions and the respective parties disclaim any responsibility to update such views. These views may not be relied on as investment advice and, because investment decisions for a Columbia fund are based on numerous factors, may not be relied on as an indication of trading intent on behalf of any particular Columbia fund. References to specific securities should not be construed as a recommendation or investment advice.
Columbia Capital Allocation Portfolios | Annual Report 2020
| 15 |
Understanding Your Fund’s Expenses
(Unaudited)
As an investor, you incur two types of costs. There are shareholder transaction costs, which generally include sales charges on purchases and may include redemption fees. There are also ongoing fund costs, which generally include management fees, distribution and/or service fees, and other fund expenses. The following information is intended to help you understand your ongoing costs (in dollars) of investing in the Fund and to help you compare these costs with the ongoing costs of investing in other mutual funds.
Analyzing your Fund’s expenses
To illustrate these ongoing costs, we have provided examples and calculated the expenses paid by investors in each share class of the Fund during the period. The actual and hypothetical information in the table is based on an initial investment of $1,000 at the beginning of the period indicated and held for the entire period. Expense information is calculated two ways and each method provides you with different information. The amount listed in the “Actual” column is calculated using the Fund’s actual operating expenses and total return for the period. You may use the Actual information, together with the amount invested, to estimate the expenses that you paid over the period. Simply divide your account value by $1,000 (for example, an $8,600 account value divided by $1,000 = 8.6), then multiply the results by the expenses paid during the period under the “Actual” column. The amount listed in the “Hypothetical” column assumes a 5% annual rate of return before expenses (which is not the Fund’s actual return) and then applies the Fund’s actual expense ratio for the period to the hypothetical return. You should not use the hypothetical account values and expenses to estimate either your actual account balance at the end of the period or the expenses you paid during the period. See “Compare with other funds” below for details on how to use the hypothetical data.
In addition to the ongoing expenses which the Fund bears directly, the Fund’s shareholders indirectly bear the Fund’s allocable share of the costs and expenses of each underlying fund in which the Fund invests. You can also estimate the effective expenses paid during the period, which includes the indirect fees associated with investing in the underlying funds, by using the amounts listed in the “Effective expenses paid during the period” column.
Compare with other funds
Since all mutual funds are required to include the same hypothetical calculations about expenses in shareholder reports, you can use this information to compare the ongoing cost of investing in the Fund with other funds. To do so, compare the hypothetical example with the 5% hypothetical examples that appear in the shareholder reports of other funds. As you compare hypothetical examples of other funds, it is important to note that hypothetical examples are meant to highlight the ongoing costs of investing in a fund only and do not reflect any transaction costs, such as sales charges, or redemption or exchange fees. Therefore, the hypothetical calculations are useful in comparing ongoing costs only, and will not help you determine the relative total costs of owning different funds. If transaction costs were included in these calculations, your costs would be higher.
| August 1, 2019 — January 31, 2020 |
| | Account value at the
beginning of the
period ($) | Account value at the
end of the
period ($) | Expenses paid during
the period ($) | Fund’s annualized
expense ratio (%) | Effective expenses
paid during the
period ($) | Fund’s effective
annualized
expense ratio (%) |
| | Actual | Hypothetical | Actual | Hypothetical | Actual | Hypothetical | Actual | Actual | Hypothetical | Actual |
| Columbia Capital Allocation Conservative Portfolio |
| Class A | 1,000.00 | 1,000.00 | 1,038.70 | 1,022.33 | 2.93 | 2.91 | 0.57 | 4.98 | 4.94 | 0.97 |
| Advisor Class | 1,000.00 | 1,000.00 | 1,039.20 | 1,023.59 | 1.64 | 1.63 | 0.32 | 3.70 | 3.67 | 0.72 |
| Class C | 1,000.00 | 1,000.00 | 1,035.00 | 1,018.55 | 6.77 | 6.72 | 1.32 | 8.82 | 8.75 | 1.72 |
| Institutional Class | 1,000.00 | 1,000.00 | 1,039.00 | 1,023.59 | 1.64 | 1.63 | 0.32 | 3.70 | 3.67 | 0.72 |
| Institutional 2 Class | 1,000.00 | 1,000.00 | 1,039.40 | 1,023.69 | 1.54 | 1.53 | 0.30 | 3.60 | 3.57 | 0.70 |
| Institutional 3 Class | 1,000.00 | 1,000.00 | 1,039.70 | 1,023.95 | 1.29 | 1.28 | 0.25 | 3.34 | 3.32 | 0.65 |
| Class R | 1,000.00 | 1,000.00 | 1,036.40 | 1,021.07 | 4.21 | 4.18 | 0.82 | 6.26 | 6.21 | 1.22 |
| 16 | Columbia Capital Allocation Portfolios | Annual Report 2020 |
Understanding Your Fund’s Expenses (continued)
(Unaudited)
| August 1, 2019 — January 31, 2020 |
| | Account value at the
beginning of the
period ($) | Account value at the
end of the
period ($) | Expenses paid during
the period ($) | Fund’s annualized
expense ratio (%) | Effective expenses
paid during the
period ($) | Fund’s effective
annualized
expense ratio (%) |
| | Actual | Hypothetical | Actual | Hypothetical | Actual | Hypothetical | Actual | Actual | Hypothetical | Actual |
| Columbia Capital Allocation Moderate Conservative Portfolio |
| Class A | 1,000.00 | 1,000.00 | 1,045.90 | 1,022.74 | 2.53 | 2.50 | 0.49 | 4.85 | 4.79 | 0.94 |
| Advisor Class | 1,000.00 | 1,000.00 | 1,046.70 | 1,024.00 | 1.24 | 1.22 | 0.24 | 3.56 | 3.52 | 0.69 |
| Class C | 1,000.00 | 1,000.00 | 1,042.70 | 1,018.95 | 6.38 | 6.31 | 1.24 | 8.70 | 8.60 | 1.69 |
| Institutional Class | 1,000.00 | 1,000.00 | 1,047.00 | 1,024.00 | 1.24 | 1.22 | 0.24 | 3.56 | 3.52 | 0.69 |
| Institutional 2 Class | 1,000.00 | 1,000.00 | 1,047.90 | 1,024.10 | 1.14 | 1.12 | 0.22 | 3.46 | 3.42 | 0.67 |
| Institutional 3 Class | 1,000.00 | 1,000.00 | 1,047.80 | 1,024.30 | 0.93 | 0.92 | 0.18 | 3.25 | 3.21 | 0.63 |
| Class R | 1,000.00 | 1,000.00 | 1,044.60 | 1,021.48 | 3.81 | 3.77 | 0.74 | 6.13 | 6.06 | 1.19 |
| Columbia Capital Allocation Moderate Portfolio |
| Class A | 1,000.00 | 1,000.00 | 1,053.70 | 1,023.04 | 2.23 | 2.19 | 0.43 | 4.92 | 4.84 | 0.95 |
| Advisor Class | 1,000.00 | 1,000.00 | 1,054.80 | 1,024.30 | 0.93 | 0.92 | 0.18 | 3.63 | 3.57 | 0.70 |
| Class C | 1,000.00 | 1,000.00 | 1,049.30 | 1,019.26 | 6.10 | 6.01 | 1.18 | 8.78 | 8.65 | 1.70 |
| Institutional Class | 1,000.00 | 1,000.00 | 1,055.10 | 1,024.30 | 0.93 | 0.92 | 0.18 | 3.63 | 3.57 | 0.70 |
| Institutional 2 Class | 1,000.00 | 1,000.00 | 1,054.90 | 1,024.35 | 0.88 | 0.87 | 0.17 | 3.57 | 3.52 | 0.69 |
| Institutional 3 Class | 1,000.00 | 1,000.00 | 1,056.10 | 1,024.55 | 0.67 | 0.66 | 0.13 | 3.37 | 3.32 | 0.65 |
| Class R | 1,000.00 | 1,000.00 | 1,051.60 | 1,021.78 | 3.52 | 3.47 | 0.68 | 6.21 | 6.12 | 1.20 |
| Columbia Capital Allocation Moderate Aggressive Portfolio |
| Class A | 1,000.00 | 1,000.00 | 1,059.50 | 1,022.74 | 2.54 | 2.50 | 0.49 | 5.35 | 5.25 | 1.03 |
| Advisor Class | 1,000.00 | 1,000.00 | 1,060.20 | 1,024.00 | 1.25 | 1.22 | 0.24 | 4.05 | 3.98 | 0.78 |
| Class C | 1,000.00 | 1,000.00 | 1,054.60 | 1,018.95 | 6.42 | 6.31 | 1.24 | 9.22 | 9.06 | 1.78 |
| Institutional Class | 1,000.00 | 1,000.00 | 1,060.10 | 1,024.00 | 1.25 | 1.22 | 0.24 | 4.05 | 3.98 | 0.78 |
| Institutional 2 Class | 1,000.00 | 1,000.00 | 1,060.50 | 1,024.20 | 1.04 | 1.02 | 0.20 | 3.84 | 3.78 | 0.74 |
| Institutional 3 Class | 1,000.00 | 1,000.00 | 1,060.60 | 1,024.45 | 0.78 | 0.77 | 0.15 | 3.58 | 3.52 | 0.69 |
| Class R | 1,000.00 | 1,000.00 | 1,057.40 | 1,021.48 | 3.84 | 3.77 | 0.74 | 6.64 | 6.52 | 1.28 |
| Class V | 1,000.00 | 1,000.00 | 1,059.50 | 1,022.74 | 2.54 | 2.50 | 0.49 | 5.35 | 5.25 | 1.03 |
| Columbia Capital Allocation Aggressive Portfolio |
| Class A | 1,000.00 | 1,000.00 | 1,062.80 | 1,022.84 | 2.44 | 2.40 | 0.47 | 5.62 | 5.51 | 1.08 |
| Advisor Class | 1,000.00 | 1,000.00 | 1,063.90 | 1,024.10 | 1.14 | 1.12 | 0.22 | 4.32 | 4.23 | 0.83 |
| Class C | 1,000.00 | 1,000.00 | 1,059.30 | 1,019.06 | 6.33 | 6.21 | 1.22 | 9.50 | 9.31 | 1.83 |
| Institutional Class | 1,000.00 | 1,000.00 | 1,064.50 | 1,024.10 | 1.14 | 1.12 | 0.22 | 4.32 | 4.23 | 0.83 |
| Institutional 2 Class | 1,000.00 | 1,000.00 | 1,065.10 | 1,024.25 | 0.99 | 0.97 | 0.19 | 4.16 | 4.08 | 0.80 |
| Institutional 3 Class | 1,000.00 | 1,000.00 | 1,064.70 | 1,024.45 | 0.78 | 0.77 | 0.15 | 3.96 | 3.88 | 0.76 |
| Class R | 1,000.00 | 1,000.00 | 1,061.90 | 1,021.58 | 3.74 | 3.67 | 0.72 | 6.91 | 6.78 | 1.33 |
Expenses paid during the period are equal to the annualized expense ratio for each class as indicated above, multiplied by the average account value over the period and then multiplied by the number of days in the Fund’s most recent fiscal half year and divided by 365.
Effective expenses paid during the period and the Fund’s effective annualized expense ratio include expenses borne directly to the class plus the Fund’s pro rata portion of the ongoing expenses charged by the underlying funds using the expense ratio of each class of the underlying funds as of the underlying fund’s most recent shareholder report.
Columbia Capital Allocation Portfolios | Annual Report 2020
| 17 |
Portfolio of Investments
Columbia Capital Allocation Conservative Portfolio, January 31, 2020
(Percentages represent value of investments compared to net assets)
Investments in securities
| Alternative Strategies Funds 5.5% |
| | Shares | Value ($) |
| Columbia Commodity Strategy Fund, Institutional 3 Class(a) | 142,121 | 589,800 |
| Columbia Multi Strategy Alternatives Fund, Institutional 3 Class(a),(b) | 240,131 | 1,767,365 |
| Columbia Multi-Asset Income Fund, Institutional 3 Class(a) | 1,026,332 | 9,934,893 |
Total Alternative Strategies Funds
(Cost $13,150,174) | 12,292,058 |
|
| Common Stocks 4.3% |
| Issuer | Shares | Value ($) |
| Communication Services 0.2% |
| Diversified Telecommunication Services 0.0% |
| Nippon Telegraph & Telephone Corp. | 2,600 | 66,292 |
| Entertainment 0.1% |
| Nintendo Co., Ltd. | 200 | 73,571 |
| Square Enix Holdings Co., Ltd. | 1,700 | 83,452 |
| Toho Co., Ltd. | 800 | 29,471 |
| Total | | 186,494 |
| Interactive Media & Services 0.0% |
| DHI Group, Inc.(b) | 2,400 | 6,720 |
| Meet Group, Inc. (The)(b) | 3,250 | 17,323 |
| Yelp, Inc.(b) | 55 | 1,793 |
| Total | | 25,836 |
| Media 0.1% |
| Gray Television, Inc.(b) | 370 | 7,504 |
| National CineMedia, Inc. | 890 | 6,568 |
| TechTarget, Inc.(b) | 595 | 15,107 |
| Telenet Group Holding NV | 641 | 29,804 |
| WPP PLC | 7,330 | 91,138 |
| Total | | 150,121 |
| Wireless Telecommunication Services 0.0% |
| Gogo(b) | 950 | 4,997 |
| Total Communication Services | 433,740 |
| Common Stocks (continued) |
| Issuer | Shares | Value ($) |
| Consumer Discretionary 0.5% |
| Auto Components 0.0% |
| Dana, Inc. | 250 | 3,852 |
| Modine Manufacturing Co.(b) | 760 | 5,343 |
| Valeo SA | 751 | 22,306 |
| Total | | 31,501 |
| Automobiles 0.1% |
| Fiat Chrysler Automobiles NV | 6,623 | 86,280 |
| Peugeot SA | 3,802 | 78,284 |
| Total | | 164,564 |
| Distributors 0.0% |
| Funko, Inc., Class A(b) | 745 | 11,197 |
| Diversified Consumer Services 0.0% |
| Collectors Universe, Inc. | 545 | 13,385 |
| K12, Inc.(b) | 550 | 8,877 |
| Perdoceo Education Corp.(b) | 570 | 10,135 |
| Total | | 32,397 |
| Hotels, Restaurants & Leisure 0.0% |
| Boyd Gaming Corp. | 70 | 2,090 |
| Brinker International, Inc. | 213 | 9,093 |
| Dine Brands Global, Inc. | 198 | 16,879 |
| Everi Holdings, Inc.(b) | 1,400 | 17,500 |
| Marriott Vacations Worldwide Corp. | 126 | 15,150 |
| SeaWorld Entertainment, Inc.(b) | 565 | 19,470 |
| Total | | 80,182 |
| Household Durables 0.2% |
| Berkeley Group Holdings PLC | 1,849 | 127,940 |
| M/I Homes, Inc.(b) | 285 | 12,651 |
| Sekisui House Ltd. | 4,200 | 90,309 |
| Sony Corp. | 1,100 | 76,920 |
| Taylor Morrison Home Corp., Class A(b) | 785 | 20,316 |
| Total | | 328,136 |
| Internet & Direct Marketing Retail 0.0% |
| Stamps.com, Inc.(b) | 135 | 10,056 |
The accompanying Notes to Financial Statements are an integral part of this statement.
| 18 | Columbia Capital Allocation Portfolios | Annual Report 2020 |
Portfolio of Investments (continued)
Columbia Capital Allocation Conservative Portfolio, January 31, 2020
| Common Stocks (continued) |
| Issuer | Shares | Value ($) |
| Leisure Products 0.0% |
| Bandai Namco Holdings, Inc. | 300 | 17,432 |
| Malibu Boats, Inc., Class A(b) | 440 | 19,268 |
| MasterCraft Boat Holdings, Inc.(b) | 345 | 6,062 |
| Sankyo Co., Ltd. | 900 | 30,236 |
| Sturm Ruger & Co., Inc. | 173 | 8,567 |
| Total | | 81,565 |
| Specialty Retail 0.1% |
| Genesco, Inc.(b) | 285 | 11,206 |
| GNC Holdings, Inc., Class A(b) | 2,500 | 5,350 |
| Hibbett Sports, Inc.(b) | 510 | 12,638 |
| Lithia Motors, Inc., Class A | 111 | 15,056 |
| Rent-A-Center, Inc. | 345 | 10,050 |
| Restoration Hardware Holdings, Inc.(b) | 39 | 8,141 |
| Sleep Number Corp.(b) | 252 | 13,001 |
| Sportsman’s Warehouse Holdings, Inc.(b) | 1,600 | 10,368 |
| Tilly’s, Inc. | 240 | 2,040 |
| Zumiez, Inc.(b) | 335 | 10,442 |
| Total | | 98,292 |
| Textiles, Apparel & Luxury Goods 0.1% |
| Adidas AG | 350 | 110,640 |
| Burberry Group PLC | 955 | 24,487 |
| Deckers Outdoor Corp.(b) | 109 | 20,809 |
| Kering SA | 113 | 69,045 |
| Pandora A/S | 735 | 38,114 |
| Total | | 263,095 |
| Total Consumer Discretionary | 1,100,985 |
| Consumer Staples 0.4% |
| Beverages 0.1% |
| Carlsberg A/S, Class B | 649 | 94,776 |
| Coca-Cola European Partners PLC | 1,788 | 94,067 |
| Total | | 188,843 |
| Food & Staples Retailing 0.1% |
| Coles Group Ltd. | 9,024 | 99,021 |
| Ingles Markets, Inc., Class A | 355 | 14,800 |
| Koninklijke Ahold Delhaize NV | 2,660 | 65,280 |
| Metro AG | 4,992 | 69,459 |
| Common Stocks (continued) |
| Issuer | Shares | Value ($) |
| SpartanNash Co. | 940 | 11,449 |
| Welcia Holdings Co., Ltd. | 600 | 32,948 |
| Total | | 292,957 |
| Food Products 0.1% |
| John B. Sanfilippo & Son, Inc. | 180 | 15,174 |
| Nestlé SA, Registered Shares | 778 | 85,808 |
| Total | | 100,982 |
| Household Products 0.0% |
| Essity AB, Class B | 738 | 23,428 |
| Personal Products 0.0% |
| Edgewell Personal Care Co.(b) | 295 | 7,617 |
| Medifast, Inc. | 136 | 13,142 |
| Usana Health Sciences, Inc.(b) | 165 | 10,180 |
| Total | | 30,939 |
| Tobacco 0.1% |
| British American Tobacco PLC | 3,071 | 135,416 |
| Swedish Match AB | 1,877 | 106,122 |
| Vector Group Ltd. | 315 | 4,139 |
| Total | | 245,677 |
| Total Consumer Staples | 882,826 |
| Energy 0.2% |
| Energy Equipment & Services 0.0% |
| DMC Global Inc | 115 | 4,811 |
| Liberty Oilfield Services, Inc., Class A | 440 | 3,731 |
| Matrix Service Co.(b) | 740 | 14,889 |
| NexTier Oilfield Solutions, Inc.(b) | 2,715 | 13,982 |
| Total | | 37,413 |
| Oil, Gas & Consumable Fuels 0.2% |
| Aker BP ASA | 877 | 24,703 |
| California Resources Corp.(b) | 635 | 4,661 |
| CVR Energy, Inc. | 445 | 15,401 |
| Delek U.S. Holdings, Inc. | 350 | 9,611 |
| Denbury Resources, Inc.(b) | 825 | 812 |
| Dorian LPG Ltd.(b) | 150 | 1,968 |
| ENI SpA | 2,064 | 28,912 |
| OMV AG | 174 | 8,647 |
| Royal Dutch Shell PLC, Class B | 6,825 | 179,338 |
| Santos Ltd. | 9,434 | 54,145 |
The accompanying Notes to Financial Statements are an integral part of this statement.
Columbia Capital Allocation Portfolios | Annual Report 2020
| 19 |
Portfolio of Investments (continued)
Columbia Capital Allocation Conservative Portfolio, January 31, 2020
| Common Stocks (continued) |
| Issuer | Shares | Value ($) |
| Southwestern Energy Co.(b) | 1,525 | 2,394 |
| W&T Offshore, Inc.(b) | 620 | 2,567 |
| World Fuel Services Corp. | 240 | 9,389 |
| Total | | 342,548 |
| Total Energy | 379,961 |
| Financials 0.8% |
| Banks 0.3% |
| Atlantic Capital Bancshares, Inc.(b) | 120 | 2,264 |
| Banco Bilbao Vizcaya Argentaria SA | 16,246 | 84,099 |
| Bancorp, Inc. (The)(b) | 1,470 | 17,390 |
| Bank Leumi Le-Israel BM | 7,494 | 53,881 |
| BNP Paribas SA | 2,035 | 107,992 |
| Cathay General Bancorp | 515 | 18,571 |
| Commerzbank AG | 1,933 | 11,092 |
| ConnectOne Bancorp, Inc. | 635 | 14,992 |
| Customers Bancorp, Inc.(b) | 689 | 14,731 |
| DBS Group Holdings Ltd. | 2,500 | 46,053 |
| First BanCorp | 1,670 | 15,481 |
| Fulton Financial Corp. | 760 | 12,517 |
| Great Southern Bancorp, Inc. | 237 | 13,488 |
| Hilltop Holdings, Inc. | 695 | 15,735 |
| Independent Bank Group, Inc. | 334 | 17,876 |
| International Bancshares Corp. | 445 | 17,533 |
| Investors Bancorp, Inc. | 420 | 5,076 |
| Israel Discount Bank Ltd. | 1,506 | 6,831 |
| Mediobanca Banca di Credito Finanziario SpA | 5,953 | 59,385 |
| Metropolitan Bank Holding Corp.(b) | 45 | 2,212 |
| Midland States Bancorp, Inc. | 325 | 8,586 |
| Nicolet Bankshares, Inc.(b) | 111 | 7,842 |
| OFG Bancorp | 760 | 14,980 |
| Preferred Bank | 211 | 12,683 |
| Raiffeisen Bank International AG | 1,652 | 37,631 |
| Sumitomo Mitsui Trust Holdings, Inc. | 1,900 | 70,053 |
| United Community Banks, Inc. | 325 | 9,074 |
| United Overseas Bank Ltd. | 300 | 5,596 |
| Total | | 703,644 |
| Common Stocks (continued) |
| Issuer | Shares | Value ($) |
| Capital Markets 0.1% |
| 3i Group PLC | 6,671 | 97,042 |
| Cohen & Steers, Inc. | 278 | 20,566 |
| Federated Hermes, Inc., Class B | 595 | 21,557 |
| Natixis SA | 19,611 | 82,815 |
| Singapore Exchange | 7,400 | 46,948 |
| Waddell & Reed Financial, Inc., Class A | 315 | 5,034 |
| Total | | 273,962 |
| Consumer Finance 0.0% |
| Encore Capital Group, Inc.(b) | 455 | 15,447 |
| Enova International, Inc.(b) | 610 | 15,287 |
| Nelnet, Inc., Class A | 105 | 6,012 |
| Regional Management Corp.(b) | 535 | 14,739 |
| Total | | 51,485 |
| Insurance 0.3% |
| Ageas | 788 | 43,452 |
| Allianz SE, Registered Shares | 645 | 153,990 |
| American Equity Investment Life Holding Co. | 485 | 12,809 |
| Assicurazioni Generali SpA | 5,098 | 99,338 |
| AXA SA | 1,644 | 43,717 |
| CNP Assurances | 4,301 | 77,419 |
| Dai-ichi Life Holdings, Inc. | 2,300 | 34,135 |
| Employers Holdings, Inc. | 390 | 16,633 |
| Genworth Financial, Inc., Class A(b) | 1,725 | 7,072 |
| Selective Insurance Group, Inc. | 45 | 2,981 |
| Swiss Life Holding AG, Registered Shares | 190 | 95,508 |
| Universal Insurance Holdings, Inc. | 243 | 5,915 |
| Total | | 592,969 |
| Mortgage Real Estate Investment Trusts (REITS) 0.0% |
| Ares Commercial Real Estate Corp. | 400 | 6,536 |
| Ellington Financial, Inc. | 790 | 14,433 |
| PennyMac Mortgage Investment Trust | 120 | 2,790 |
| Total | | 23,759 |
| Thrifts & Mortgage Finance 0.1% |
| Essent Group Ltd. | 447 | 22,176 |
| Federal Agricultural Mortgage Corp. | 201 | 15,336 |
| Flagstar Bancorp, Inc. | 430 | 15,153 |
| Meta Financial Group, Inc. | 460 | 17,121 |
The accompanying Notes to Financial Statements are an integral part of this statement.
| 20 | Columbia Capital Allocation Portfolios | Annual Report 2020 |
Portfolio of Investments (continued)
Columbia Capital Allocation Conservative Portfolio, January 31, 2020
| Common Stocks (continued) |
| Issuer | Shares | Value ($) |
| NMI Holdings, Inc., Class A(b) | 600 | 19,152 |
| Radian Group, Inc. | 945 | 23,143 |
| Total | | 112,081 |
| Total Financials | 1,757,900 |
| Health Care 0.6% |
| Biotechnology 0.1% |
| ACADIA Pharmaceuticals, Inc.(b) | 360 | 14,378 |
| Acceleron Pharma, Inc.(b) | 65 | 5,901 |
| Arcutis Biotherapeutics, Inc.(b) | 405 | 8,829 |
| Arena Pharmaceuticals, Inc.(b) | 320 | 14,621 |
| Arrowhead Pharmaceuticals, Inc.(b) | 130 | 5,448 |
| Atara Biotherapeutics, Inc.(b) | 270 | 3,572 |
| BeiGene Ltd., ADR(b) | 119 | 18,131 |
| Black Diamond Therapeutics, Inc.(b) | 247 | 9,263 |
| bluebird bio, Inc.(b) | 101 | 8,049 |
| Blueprint Medicines Corp.(b) | 120 | 7,614 |
| CSL Ltd. | 107 | 22,007 |
| Dynavax Technologies Corp.(b) | 1,225 | 6,186 |
| Fate Therapeutics, Inc.(b) | 290 | 7,354 |
| Global Blood Therapeutics, Inc.(b) | 80 | 5,221 |
| Gossamer Bio, Inc.(b) | 256 | 3,400 |
| Immunomedics, Inc.(b) | 830 | 15,413 |
| Insmed, Inc.(b) | 443 | 9,099 |
| Karuna Therapeutics, Inc.(b) | 25 | 2,373 |
| Mirati Therapeutics, Inc.(b) | 105 | 9,117 |
| Precision BioSciences, Inc.(b) | 477 | 3,859 |
| Rubius Therapeutics, Inc.(b) | 380 | 2,964 |
| Sage Therapeutics, Inc.(b) | 166 | 11,002 |
| Sarepta Therapeutics, Inc.(b) | 69 | 8,001 |
| SpringWorks Therapeutics, Inc.(b) | 359 | 11,301 |
| TCR2 Therapeutics, Inc.(b) | 480 | 7,046 |
| Turning Point Therapeutics, Inc.(b) | 180 | 10,530 |
| Ultragenyx Pharmaceutical, Inc.(b) | 70 | 3,679 |
| uniQure NV(b) | 142 | 8,174 |
| Total | | 242,532 |
| Common Stocks (continued) |
| Issuer | Shares | Value ($) |
| Health Care Equipment & Supplies 0.1% |
| Angiodynamics, Inc.(b) | 810 | 11,154 |
| CryoLife, Inc.(b) | 300 | 8,922 |
| Hoya Corp. | 600 | 57,423 |
| Integer Holdings Corp.(b) | 228 | 19,471 |
| Lantheus Holdings, Inc.(b) | 855 | 14,971 |
| Meridian Bioscience, Inc. | 880 | 8,659 |
| Natus Medical, Inc.(b) | 490 | 15,332 |
| NuVasive, Inc.(b) | 120 | 9,255 |
| Quidel Corp.(b) | 150 | 11,520 |
| Varex Imaging Corp.(b) | 475 | 13,134 |
| Total | | 169,841 |
| Health Care Providers & Services 0.0% |
| Corvel Corp.(b) | 129 | 11,813 |
| Cross Country Healthcare, Inc.(b) | 780 | 7,722 |
| Magellan Health, Inc.(b) | 246 | 18,010 |
| Medipal Holdings Corp. | 2,500 | 52,975 |
| Owens & Minor, Inc. | 425 | 2,660 |
| Tenet Healthcare Corp.(b) | 160 | 5,062 |
| Total | | 98,242 |
| Health Care Technology 0.0% |
| HealthStream, Inc.(b) | 580 | 14,819 |
| Omnicell, Inc.(b) | 241 | 19,588 |
| Total | | 34,407 |
| Life Sciences Tools & Services 0.0% |
| Medpace Holdings, Inc.(b) | 226 | 19,334 |
| Syneos Health, Inc.(b) | 370 | 22,703 |
| Total | | 42,037 |
| Pharmaceuticals 0.4% |
| Aerie Pharmaceuticals, Inc.(b) | 235 | 4,813 |
| Amphastar Pharmaceuticals, Inc.(b) | 690 | 13,048 |
| Astellas Pharma, Inc. | 7,300 | 128,992 |
| Dainippon Sumitomo Pharma Co., Ltd. | 2,600 | 44,632 |
| GlaxoSmithKline PLC | 5,748 | 134,960 |
| GW Pharmaceuticals PLC, ADR(b) | 98 | 11,322 |
| Horizon Therapeutics PLC(b) | 170 | 5,863 |
| Novartis AG, Registered Shares | 1,950 | 184,213 |
| Odonate Therapeutics, Inc.(b) | 300 | 8,760 |
The accompanying Notes to Financial Statements are an integral part of this statement.
Columbia Capital Allocation Portfolios | Annual Report 2020
| 21 |
Portfolio of Investments (continued)
Columbia Capital Allocation Conservative Portfolio, January 31, 2020
| Common Stocks (continued) |
| Issuer | Shares | Value ($) |
| Prestige Consumer Healthcare, Inc.(b) | 430 | 17,441 |
| Reata Pharmaceuticals, Inc., Class A(b) | 86 | 18,816 |
| Roche Holding AG, Genusschein Shares | 695 | 233,151 |
| Supernus Pharmaceuticals, Inc.(b) | 190 | 4,345 |
| Total | | 810,356 |
| Total Health Care | 1,397,415 |
| Industrials 0.6% |
| Air Freight & Logistics 0.0% |
| Echo Global Logistics, Inc.(b) | 415 | 8,043 |
| Radiant Logistics, Inc.(b) | 1,650 | 7,969 |
| Total | | 16,012 |
| Airlines 0.0% |
| Skywest, Inc. | 142 | 7,834 |
| Building Products 0.1% |
| American Woodmark Corp.(b) | 184 | 20,176 |
| Builders FirstSource, Inc.(b) | 820 | 20,332 |
| Caesarstone Ltd. | 700 | 9,156 |
| CSW Industrials, Inc. | 230 | 17,452 |
| Gibraltar Industries, Inc.(b) | 360 | 19,627 |
| Quanex Building Products Corp. | 920 | 16,302 |
| Total | | 103,045 |
| Commercial Services & Supplies 0.0% |
| Brady Corp., Class A | 205 | 11,351 |
| Deluxe Corp. | 181 | 8,724 |
| Herman Miller, Inc. | 395 | 15,267 |
| HNI Corp. | 400 | 14,388 |
| Total | | 49,730 |
| Construction & Engineering 0.2% |
| ACS Actividades de Construccion y Servicios SA | 2,561 | 85,146 |
| CIMIC Group Ltd. | 3,028 | 58,589 |
| Eiffage SA | 426 | 49,379 |
| EMCOR Group, Inc. | 238 | 19,556 |
| Great Lakes Dredge & Dock Corp.(b) | 1,510 | 15,810 |
| MasTec, Inc.(b) | 311 | 17,960 |
| Obayashi Corp. | 1,000 | 10,967 |
| Shimizu Corp. | 8,700 | 89,235 |
| Skanska AB, Class B | 4,772 | 110,456 |
| Total | | 457,098 |
| Common Stocks (continued) |
| Issuer | Shares | Value ($) |
| Electrical Equipment 0.1% |
| Atkore International Group, Inc.(b) | 490 | 19,453 |
| Schneider Electric SE | 1,180 | 117,677 |
| Total | | 137,130 |
| Machinery 0.1% |
| GEA Group AG | 347 | 10,390 |
| KONE OYJ, Class B | 285 | 18,415 |
| Lydall, Inc.(b) | 530 | 10,833 |
| Mitsubishi Heavy Industries Ltd. | 2,200 | 80,251 |
| Mueller Industries, Inc. | 560 | 16,335 |
| Rexnord Corp.(b) | 315 | 10,285 |
| SKF AB, Class B | 2,860 | 52,351 |
| SPX Corp.(b) | 331 | 16,242 |
| Total | | 215,102 |
| Marine 0.0% |
| Costamare, Inc. | 1,745 | 13,838 |
| Professional Services 0.1% |
| Adecco Group AG, Registered Shares | 1,515 | 88,761 |
| Barrett Business Services, Inc. | 171 | 14,164 |
| FTI Consulting, Inc.(b) | 74 | 8,885 |
| Heidrick & Struggles International, Inc. | 465 | 13,215 |
| Kforce, Inc. | 460 | 17,043 |
| Wolters Kluwer NV | 1,313 | 98,661 |
| Total | | 240,729 |
| Road & Rail 0.0% |
| ArcBest Corp. | 272 | 6,068 |
| Aurizon Holdings Ltd. | 24,785 | 88,842 |
| Total | | 94,910 |
| Trading Companies & Distributors 0.0% |
| BMC Stock Holdings, Inc.(b) | 670 | 19,554 |
| Foundation Building Materials, Inc.(b) | 725 | 12,927 |
| GMS, Inc.(b) | 610 | 16,299 |
| MRC Global, Inc.(b) | 1,240 | 13,962 |
| Veritiv Corp.(b) | 960 | 13,517 |
| Total | | 76,259 |
| Transportation Infrastructure 0.0% |
| Kamigumi Co., Ltd. | 3,400 | 72,650 |
| Total Industrials | 1,484,337 |
The accompanying Notes to Financial Statements are an integral part of this statement.
| 22 | Columbia Capital Allocation Portfolios | Annual Report 2020 |
Portfolio of Investments (continued)
Columbia Capital Allocation Conservative Portfolio, January 31, 2020
| Common Stocks (continued) |
| Issuer | Shares | Value ($) |
| Information Technology 0.4% |
| Communications Equipment 0.0% |
| ADTRAN, Inc. | 700 | 6,335 |
| Comtech Telecommunications Corp. | 340 | 9,829 |
| Total | | 16,164 |
| Electronic Equipment, Instruments & Components 0.1% |
| Badger Meter, Inc. | 37 | 2,185 |
| Benchmark Electronics, Inc. | 525 | 16,159 |
| Hitachi High-Technologies Corp. | 300 | 21,450 |
| Ingenico Group SA | 64 | 7,443 |
| Methode Electronics, Inc. | 440 | 14,410 |
| Rogers Corp.(b) | 144 | 16,956 |
| Sanmina Corp.(b) | 570 | 18,149 |
| Venture Corp., Ltd. | 3,300 | 38,968 |
| Vishay Intertechnology, Inc. | 960 | 19,478 |
| Vishay Precision Group, Inc.(b) | 455 | 15,716 |
| Total | | 170,914 |
| IT Services 0.1% |
| Capgemini SE | 112 | 13,909 |
| Cardtronics PLC, Class A(b) | 440 | 19,800 |
| Cass Information Systems, Inc. | 62 | 3,349 |
| EVERTEC, Inc. | 520 | 17,456 |
| Hackett Group | 250 | 3,864 |
| KBR, Inc. | 590 | 16,048 |
| MAXIMUS, Inc. | 107 | 7,677 |
| NEC Corp. | 200 | 8,903 |
| NIC, Inc. | 745 | 14,699 |
| Nomura Research Institute Ltd. | 1,000 | 22,006 |
| Perspecta, Inc. | 730 | 20,491 |
| TTEC Holdings, Inc. | 332 | 13,187 |
| Total | | 161,389 |
| Semiconductors & Semiconductor Equipment 0.1% |
| Advantest Corp. | 1,300 | 67,822 |
| Amkor Technology, Inc.(b) | 1,364 | 15,345 |
| Cirrus Logic, Inc.(b) | 27 | 2,074 |
| NXP Semiconductors NV | 362 | 45,923 |
| Sumco Corp. | 400 | 6,117 |
| Synaptics, Inc.(b) | 300 | 20,007 |
| Common Stocks (continued) |
| Issuer | Shares | Value ($) |
| Tokyo Electron Ltd. | 500 | 109,973 |
| Ultra Clean Holdings, Inc.(b) | 700 | 16,107 |
| Xperi Corp. | 880 | 14,159 |
| Total | | 297,527 |
| Software 0.1% |
| Check Point Software Technologies Ltd.(b) | 208 | 23,777 |
| CommVault Systems, Inc.(b) | 393 | 17,693 |
| j2 Global, Inc. | 237 | 22,719 |
| Progress Software Corp. | 425 | 19,180 |
| Qualys, Inc.(b) | 227 | 19,463 |
| SPS Commerce, Inc.(b) | 298 | 16,935 |
| Total | | 119,767 |
| Technology Hardware, Storage & Peripherals 0.0% |
| FUJIFILM Holdings Corp. | 2,100 | 104,296 |
| Total Information Technology | 870,057 |
| Materials 0.2% |
| Chemicals 0.0% |
| Chase Corp. | 56 | 5,150 |
| Covestro AG | 1,395 | 58,789 |
| Innospec, Inc. | 142 | 14,304 |
| Koppers Holdings, Inc.(b) | 110 | 3,452 |
| Mitsubishi Chemical Holdings Corp. | 1,400 | 10,118 |
| Showa Denko KK | 300 | 7,174 |
| Total | | 98,987 |
| Construction Materials 0.0% |
| U.S. Concrete, Inc.(b) | 382 | 13,595 |
| Metals & Mining 0.2% |
| Anglo American PLC | 2,084 | 54,380 |
| BHP Group Ltd. | 4,718 | 120,988 |
| Commercial Metals Co. | 480 | 9,864 |
| Fortescue Metals Group Ltd. | 9,422 | 69,797 |
| Materion Corp. | 266 | 14,444 |
| Rio Tinto PLC | 2,373 | 126,894 |
| Schnitzer Steel Industries, Inc., Class A | 685 | 11,015 |
| Total | | 407,382 |
The accompanying Notes to Financial Statements are an integral part of this statement.
Columbia Capital Allocation Portfolios | Annual Report 2020
| 23 |
Portfolio of Investments (continued)
Columbia Capital Allocation Conservative Portfolio, January 31, 2020
| Common Stocks (continued) |
| Issuer | Shares | Value ($) |
| Paper & Forest Products 0.0% |
| Schweitzer-Mauduit International, Inc. | 445 | 15,588 |
| Verso Corp., Class A(b) | 975 | 16,429 |
| Total | | 32,017 |
| Total Materials | 551,981 |
| Real Estate 0.2% |
| Equity Real Estate Investment Trusts (REITS) 0.1% |
| Alexander’s, Inc. | 6 | 1,936 |
| American Assets Trust, Inc. | 345 | 15,718 |
| Ashford Hospitality Trust, Inc. | 4,000 | 9,840 |
| CoreCivic, Inc. | 840 | 13,398 |
| CorEnergy Infrastructure Trust, Inc. | 348 | 15,869 |
| EastGroup Properties, Inc. | 166 | 22,588 |
| GEO Group, Inc. (The) | 400 | 6,320 |
| Independence Realty Trust, Inc. | 640 | 9,389 |
| Investors Real Estate Trust | 232 | 17,098 |
| Lexington Realty Trust | 1,670 | 18,487 |
| PS Business Parks, Inc. | 118 | 19,772 |
| Retail Value, Inc. | 455 | 14,956 |
| Ryman Hospitality Properties, Inc. | 47 | 3,996 |
| Uniti Group, Inc. | 1,890 | 11,964 |
| Washington Prime Group, Inc. | 1,175 | 3,537 |
| Xenia Hotels & Resorts, Inc. | 580 | 10,840 |
| Total | | 195,708 |
| Real Estate Management & Development 0.1% |
| CK Asset Holdings Ltd. | 500 | 3,194 |
| Henderson Land Development Co., Ltd. | 18,000 | 80,814 |
| Kerry Properties Ltd. | 2,000 | 5,579 |
| Nomura Real Estate Holdings, Inc. | 1,600 | 39,402 |
| RE/MAX Holdings, Inc., Class A | 55 | 2,105 |
| RMR Group, Inc. (The), Class A | 315 | 14,512 |
| Sumitomo Realty & Development Co., Ltd. | 1,800 | 66,268 |
| Swire Pacific Ltd., Class A | 2,500 | 21,952 |
| Total | | 233,826 |
| Total Real Estate | 429,534 |
| Common Stocks (continued) |
| Issuer | Shares | Value ($) |
| Utilities 0.2% |
| Electric Utilities 0.0% |
| Endesa SA | 891 | 24,465 |
| Enel SpA | 1,036 | 9,030 |
| Otter Tail Corp. | 34 | 1,821 |
| Portland General Electric Co. | 394 | 24,231 |
| Total | | 59,547 |
| Gas Utilities 0.1% |
| Chesapeake Utilities Corp. | 172 | 16,548 |
| Enagas SA | 760 | 20,477 |
| Naturgy Energy Group SA | 3,581 | 94,448 |
| Southwest Gas Holdings, Inc. | 237 | 17,896 |
| Total | | 149,369 |
| Independent Power and Renewable Electricity Producers 0.0% |
| Meridian Energy Ltd. | 14,190 | 48,763 |
| Multi-Utilities 0.1% |
| AGL Energy Ltd. | 6,339 | 84,126 |
| Avista Corp. | 363 | 18,459 |
| NorthWestern Corp. | 225 | 17,318 |
| Unitil Corp. | 125 | 7,711 |
| Total | | 127,614 |
| Total Utilities | 385,293 |
Total Common Stocks
(Cost $9,108,159) | 9,674,029 |
|
| Equity Funds 16.8% |
| | Shares | Value ($) |
| International 3.0% |
| Columbia Contrarian Europe Fund, Institutional 3 Class(a) | 137,376 | 954,762 |
| Columbia Emerging Markets Fund, Institutional 3 Class(a) | 173,927 | 2,424,546 |
| Columbia Overseas Core Fund, Institutional 3 Class(a) | 257,682 | 2,522,703 |
| Columbia Overseas Value Fund, Institutional 3 Class(a) | 92,414 | 864,999 |
| Total | 6,767,010 |
The accompanying Notes to Financial Statements are an integral part of this statement.
| 24 | Columbia Capital Allocation Portfolios | Annual Report 2020 |
Portfolio of Investments (continued)
Columbia Capital Allocation Conservative Portfolio, January 31, 2020
| Equity Funds (continued) |
| | Shares | Value ($) |
| U.S. Large Cap 13.7% |
| Columbia Contrarian Core Fund, Institutional 3 Class(a) | 126,515 | 3,474,101 |
| Columbia Disciplined Core Fund, Institutional 3 Class(a) | 724,073 | 8,667,152 |
| Columbia Disciplined Growth Fund, Institutional 3 Class(a) | 625,902 | 5,964,849 |
| Columbia Disciplined Value Fund, Institutional 3 Class(a) | 692,679 | 6,324,160 |
| Columbia Select Large Cap Equity Fund, Institutional 3 Class(a) | 426,372 | 6,412,639 |
| Total | 30,842,901 |
| U.S. Small Cap 0.1% |
| Columbia Small Cap Index Fund, Institutional 3 Class(a) | 7,431 | 163,695 |
Total Equity Funds
(Cost $34,546,681) | 37,773,606 |
|
| Fixed Income Funds 59.4% |
| | |
| Emerging Markets 1.2% |
| Columbia Emerging Markets Bond Fund, Institutional 3 Class(a) | 244,630 | 2,813,243 |
| High Yield 2.7% |
| Columbia High Yield Bond Fund, Institutional 3 Class(a) | 566,524 | 1,682,577 |
| Columbia Income Opportunities Fund, Institutional 3 Class(a) | 438,360 | 4,405,522 |
| Total | 6,088,099 |
| Inflation Protected Securities 2.0% |
| Columbia Inflation Protected Securities Fund, Institutional 3 Class(a),(b) | 445,335 | 4,462,253 |
| Fixed Income Funds (continued) |
| | Shares | Value ($) |
| Investment Grade 53.5% |
| Columbia Corporate Income Fund, Institutional 3 Class(a) | 1,420,919 | 15,516,441 |
| Columbia Limited Duration Credit Fund, Institutional 3 Class(a) | 1,028,589 | 10,440,178 |
| Columbia Mortgage Opportunities Fund, Institutional 3 Class(a) | 300,559 | 3,053,685 |
| Columbia Quality Income Fund, Institutional 3 Class(a) | 5,761,087 | 32,262,087 |
| Columbia Short Term Bond Fund, Institutional 3 Class(a) | 1,565,322 | 15,715,831 |
| Columbia Total Return Bond Fund, Institutional 3 Class(a) | 1,433,388 | 13,430,843 |
| Columbia U.S. Treasury Index Fund, Institutional 3 Class(a) | 2,531,402 | 29,617,399 |
| Total | 120,036,464 |
Total Fixed Income Funds
(Cost $128,999,396) | 133,400,059 |
|
| Money Market Funds 13.5% |
| | |
| Columbia Government Money Market Fund, Institutional 3 Class, 1.151%(a),(c) | 294,114 | 294,114 |
| Columbia Short-Term Cash Fund, 1.648%(a),(c) | 29,872,121 | 29,872,121 |
Total Money Market Funds
(Cost $30,165,265) | 30,166,235 |
Total Investments in Securities
(Cost: $215,969,675) | 223,305,987 |
| Other Assets & Liabilities, Net | | 1,135,897 |
| Net Assets | 224,441,884 |
At January 31, 2020, securities and/or cash totaling $1,257,651 were pledged as collateral.
Investments in derivatives
| Forward foreign currency exchange contracts |
Currency to
be sold | Currency to
be purchased | Counterparty | Settlement
date | Unrealized
appreciation ($) | Unrealized
depreciation ($) |
| 146,000 AUD | 98,592 USD | JPMorgan | 03/26/2020 | 766 | — |
| 121,000 ILS | 35,154 USD | JPMorgan | 03/26/2020 | 9 | — |
| 538,000 SEK | 56,016 USD | JPMorgan | 03/26/2020 | — | (6) |
| 126,413 USD | 97,000 GBP | JPMorgan | 03/26/2020 | 1,855 | — |
| Total | | | | 2,630 | (6) |
The accompanying Notes to Financial Statements are an integral part of this statement.
Columbia Capital Allocation Portfolios | Annual Report 2020
| 25 |
Portfolio of Investments (continued)
Columbia Capital Allocation Conservative Portfolio, January 31, 2020
| Long futures contracts |
| Description | Number of
contracts | Expiration
date | Trading
currency | Notional
amount | Value/Unrealized
appreciation ($) | Value/Unrealized
depreciation ($) |
| EURO STOXX 50 Index | 29 | 03/2020 | EUR | 1,055,310 | — | (39,730) |
| FTSE 100 Index | 23 | 03/2020 | GBP | 1,660,025 | — | (100,659) |
| FTSE/MIB Index | 5 | 03/2020 | EUR | 580,475 | — | (20,611) |
| Russell 2000 Index E-mini | 1 | 03/2020 | USD | 80,735 | — | (1,105) |
| S&P 500 Index E-mini | 17 | 03/2020 | USD | 2,740,400 | 66,300 | — |
| U.S. Treasury 10-Year Note | 198 | 03/2020 | USD | 26,067,938 | 423,448 | — |
| U.S. Ultra Treasury Bond | 35 | 03/2020 | USD | 6,779,063 | 243,095 | — |
| Total | | | | | 732,843 | (162,105) |
| Short futures contracts |
| Description | Number of
contracts | Expiration
date | Trading
currency | Notional
amount | Value/Unrealized
appreciation ($) | Value/Unrealized
depreciation ($) |
| MSCI EAFE Index | (4) | 03/2020 | USD | (395,300) | 4,808 | — |
| MSCI Emerging Markets Index | (49) | 03/2020 | USD | (2,572,745) | 80,290 | — |
| TOPIX Index | (11) | 03/2020 | JPY | (184,690,000) | 41,767 | — |
| Total | | | | | 126,865 | — |
| Cleared credit default swap contracts - sell protection |
Reference
entity | Counterparty | Maturity
date | Receive
fixed
rate
(%) | Payment
frequency | Implied
credit
spread
(%)* | Notional
currency | Notional
amount | Value
($) | Upfront
payments
($) | Upfront
receipts
($) | Unrealized
appreciation
($) | Unrealized
depreciation
($) |
| Markit CDX Emerging Markets Index, Series 32 | Morgan Stanley | 12/20/2024 | 1.000 | Quarterly | 1.972 | USD | 2,323,000 | 11,041 | — | — | 11,041 | — |
| * | Implied credit spreads, represented in absolute terms, utilized in determining the market value of credit default swap agreements on corporate or sovereign issues as of period end serve as an indicator of the current status of the payment/performance risk and represent the likelihood or risk of default for the credit derivative. The implied credit spread of a particular referenced entity reflects the cost of buying/selling protection and may include upfront payments required to be made to enter into the agreement. Wider credit spreads represent a deterioration of the referenced entity’s credit soundness and a greater likelihood or risk of default or other credit event occurring as defined under the terms of the agreement. |
Notes to Portfolio of Investments
| (a) | As defined in the Investment Company Act of 1940, an affiliated company is one in which the Fund owns 5% or more of the company’s outstanding voting securities, or a company which is under common ownership or control with the Fund. Holdings and transactions in these affiliated companies during the year ended January 31, 2020 are as follows: |
| Issuer | Beginning
shares | Shares
purchased | Shares
sold | Ending
shares | Capital gain
distributions —
affiliated
issuers ($) | Realized gain
(loss) —
affiliated
issuers ($) | Net change in
unrealized
appreciation
(depreciation) —
affiliated
issuers ($) | Dividends —
affiliated
issuers ($) | Value —
affiliated
issuers
at end of
period ($) |
| Columbia Commodity Strategy Fund, Institutional 3 Class |
| | 186,681 | 55,290 | (99,850) | 142,121 | — | (101,490) | 68,054 | 9,317 | 589,800 |
| Columbia Contrarian Core Fund, Institutional 3 Class |
| | 151,391 | 17,208 | (42,084) | 126,515 | 155,180 | 275,471 | 265,291 | 39,113 | 3,474,101 |
| Columbia Contrarian Europe Fund, Institutional 3 Class |
| | 181,857 | 23,803 | (68,284) | 137,376 | — | 59,158 | 93,838 | 23,340 | 954,762 |
| Columbia Corporate Income Fund, Institutional 3 Class |
| | 1,584,004 | 78,572 | (241,657) | 1,420,919 | — | 49,098 | 1,513,603 | 519,515 | 15,516,441 |
| Columbia Disciplined Core Fund, Institutional 3 Class |
| | 800,782 | 128,407 | (205,116) | 724,073 | 740,874 | 642,375 | (185,502) | 135,346 | 8,667,152 |
| Columbia Disciplined Growth Fund, Institutional 3 Class |
| | 714,084 | 132,935 | (221,117) | 625,902 | 421,517 | 57,198 | 552,086 | 45,899 | 5,964,849 |
The accompanying Notes to Financial Statements are an integral part of this statement.
| 26 | Columbia Capital Allocation Portfolios | Annual Report 2020 |
Portfolio of Investments (continued)
Columbia Capital Allocation Conservative Portfolio, January 31, 2020
Notes to Portfolio of Investments (continued)
| Issuer | Beginning
shares | Shares
purchased | Shares
sold | Ending
shares | Capital gain
distributions —
affiliated
issuers ($) | Realized gain
(loss) —
affiliated
issuers ($) | Net change in
unrealized
appreciation
(depreciation) —
affiliated
issuers ($) | Dividends —
affiliated
issuers ($) | Value —
affiliated
issuers
at end of
period ($) |
| Columbia Disciplined Value Fund, Institutional 3 Class |
| | 722,928 | 203,995 | (234,244) | 692,679 | 516,756 | 156,386 | (194,593) | 131,752 | 6,324,160 |
| Columbia Emerging Markets Bond Fund, Institutional 3 Class |
| | 263,079 | 22,279 | (40,728) | 244,630 | — | (3,274) | 129,793 | 108,839 | 2,813,243 |
| Columbia Emerging Markets Fund, Institutional 3 Class |
| | 223,639 | 21,062 | (70,774) | 173,927 | — | 280,233 | 126,835 | 13,721 | 2,424,546 |
| Columbia Government Money Market Fund, Institutional 3 Class, 1.151% |
| | 844,570 | 462,172 | (1,012,628) | 294,114 | 190 | — | — | 12,948 | 294,114 |
| Columbia High Yield Bond Fund, Institutional 3 Class |
| | — | 566,524 | — | 566,524 | — | — | (5,665) | 241 | 1,682,577 |
| Columbia Income Opportunities Fund, Institutional 3 Class |
| | 467,329 | 42,383 | (71,352) | 438,360 | — | (553) | 244,686 | 224,565 | 4,405,522 |
| Columbia Inflation Protected Securities Fund, Institutional 3 Class |
| | 489,002 | 20,107 | (63,774) | 445,335 | — | (57,547) | 446,681 | — | 4,462,253 |
| Columbia Limited Duration Credit Fund, Institutional 3 Class |
| | 1,083,059 | 60,277 | (114,747) | 1,028,589 | — | (11,199) | 474,692 | 273,652 | 10,440,178 |
| Columbia Mortgage Opportunities Fund, Institutional 3 Class |
| | 310,880 | 29,587 | (39,908) | 300,559 | 24,981 | 4,644 | 57,669 | 108,175 | 3,053,685 |
| Columbia Multi Strategy Alternatives Fund, Institutional 3 Class |
| | 468,857 | — | (228,726) | 240,131 | — | (592,425) | 320,373 | — | 1,767,365 |
| Columbia Multi-Asset Income Fund, Institutional 3 Class |
| | 966,411 | 59,921 | — | 1,026,332 | — | — | 587,160 | 563,060 | 9,934,893 |
| Columbia Overseas Core Fund, Institutional 3 Class |
| | 289,432 | 36,115 | (67,865) | 257,682 | 10,109 | (27,528) | 224,908 | 96,356 | 2,522,703 |
| Columbia Overseas Value Fund, Institutional 3 Class |
| | 122,955 | 22,193 | (52,734) | 92,414 | 1,720 | 54,629 | 11,385 | 32,778 | 864,999 |
| Columbia Quality Income Fund, Institutional 3 Class |
| | 6,053,323 | 329,276 | (621,512) | 5,761,087 | — | 7,122 | 1,292,774 | 986,685 | 32,262,087 |
| Columbia Select Large Cap Equity Fund, Institutional 3 Class |
| | 509,436 | 59,549 | (142,613) | 426,372 | 283,519 | 342,742 | 548,429 | 79,800 | 6,412,639 |
| Columbia Short Term Bond Fund, Institutional 3 Class |
| | 1,605,559 | 114,804 | (155,041) | 1,565,322 | — | 26,732 | 211,262 | 580,637 | 15,715,831 |
| Columbia Short-Term Cash Fund, 1.648% |
| | 28,626,985 | 13,119,052 | (11,873,916) | 29,872,121 | — | (212) | 3,138 | 640,659 | 29,872,121 |
| Columbia Small Cap Index Fund, Institutional 3 Class |
| | 6,955 | 476 | — | 7,431 | 8,487 | — | (700) | 2,133 | 163,695 |
| Columbia Total Return Bond Fund, Institutional 3 Class |
| | 1,507,411 | 98,674 | (172,697) | 1,433,388 | 176,084 | 9,843 | 626,279 | 454,095 | 13,430,843 |
| Columbia U.S. Treasury Index Fund, Institutional 3 Class |
| | 2,703,849 | 116,331 | (288,778) | 2,531,402 | — | (10,880) | 1,887,554 | 615,720 | 29,617,399 |
| Total | | | | | 2,339,417 | 1,160,523 | 9,300,030 | 5,698,346 | 213,631,958 |
The accompanying Notes to Financial Statements are an integral part of this statement.
Columbia Capital Allocation Portfolios | Annual Report 2020
| 27 |
Portfolio of Investments (continued)
Columbia Capital Allocation Conservative Portfolio, January 31, 2020
Notes to Portfolio of Investments (continued)
| (b) | Non-income producing investment. |
| (c) | The rate shown is the seven-day current annualized yield at January 31, 2020. |
Abbreviation Legend
| ADR | American Depositary Receipt |
Currency Legend
| AUD | Australian Dollar |
| EUR | Euro |
| GBP | British Pound |
| ILS | New Israeli Sheqel |
| JPY | Japanese Yen |
| SEK | Swedish Krona |
| USD | US Dollar |
Fair value measurements
The Fund categorizes its fair value measurements according to a three-level hierarchy that maximizes the use of observable inputs and minimizes the use of unobservable inputs by prioritizing that the most observable input be used when available. Observable inputs are those that market participants would use in pricing an investment based on market data obtained from sources independent of the reporting entity. Unobservable inputs are those that reflect the Fund’s assumptions about the information market participants would use in pricing an investment. An investment’s level within the fair value hierarchy is based on the lowest level of any input that is deemed significant to the asset’s or liability’s fair value measurement. The input levels are not necessarily an indication of the risk or liquidity associated with investments at that level. For example, certain U.S. government securities are generally high quality and liquid, however, they are reflected as Level 2 because the inputs used to determine fair value may not always be quoted prices in an active market.
Fair value inputs are summarized in the three broad levels listed below:
| ■ | Level 1 — Valuations based on quoted prices for investments in active markets that the Fund has the ability to access at the measurement date. Valuation adjustments are not applied to Level 1 investments. |
| ■ | Level 2 — Valuations based on other significant observable inputs (including quoted prices for similar securities, interest rates, prepayment speeds, credit risks, etc.). |
| ■ | Level 3 — Valuations based on significant unobservable inputs (including the Fund’s own assumptions and judgment in determining the fair value of investments). |
Inputs that are used in determining fair value of an investment may include price information, credit data, volatility statistics, and other factors. These inputs can be either observable or unobservable. The availability of observable inputs can vary between investments, and is affected by various factors such as the type of investment, and the volume and level of activity for that investment or similar investments in the marketplace. The inputs will be considered by the Investment Manager, along with any other relevant factors in the calculation of an investment’s fair value. The Fund uses prices and inputs that are current as of the measurement date, which may include periods of market dislocations. During these periods, the availability of prices and inputs may be reduced for many investments. This condition could cause an investment to be reclassified between the various levels within the hierarchy.
Foreign equity securities actively traded in markets where there is a significant delay in the local close relative to the New York Stock Exchange are classified as Level 2. The values of these securities may include an adjustment to reflect the impact of market movements following the close of local trading, as described in Note 2 to the financial statements – Security valuation.
Investments falling into the Level 3 category are primarily supported by quoted prices from brokers and dealers participating in the market for those investments. However, these may be classified as Level 3 investments due to lack of market transparency and corroboration to support these quoted prices. Additionally, valuation models may be used as the pricing source for any remaining investments classified as Level 3. These models may rely on one or more significant unobservable inputs and/or significant assumptions by the Investment Manager. Inputs used in valuations may include, but are not limited to, financial statement analysis, capital account balances, discount rates and estimated cash flows, and comparable company data.
Under the direction of the Fund’s Board of Trustees (the Board), the Investment Manager’s Valuation Committee (the Committee) is responsible for overseeing the valuation procedures approved by the Board. The Committee consists of voting and non-voting members from various groups within the Investment Manager’s organization, including operations and accounting, trading and investments, compliance, risk management and legal.
The Committee meets at least monthly to review and approve valuation matters, which may include a description of specific valuation determinations, data regarding pricing information received from approved pricing vendors and brokers and the results of Board-approved valuation control policies and procedures (the Policies). The Policies address, among other things, instances when market quotations are or are not readily available, including recommendations of third party pricing vendors and a determination of appropriate pricing methodologies; events that require specific valuation determinations and assessment of fair value techniques; securities with a potential for stale pricing, including those that are illiquid, restricted, or in default; and the effectiveness of third party pricing vendors, including periodic reviews of vendors. The Committee meets more frequently, as needed, to discuss additional valuation matters, which may include the need to review back-testing results, review time-sensitive information or approve related valuation actions. The Committee reports to the Board, with members of the Committee meeting with the Board at each of its regularly scheduled meetings to discuss valuation matters and actions during the period, similar to those described earlier.
The accompanying Notes to Financial Statements are an integral part of this statement.
| 28 | Columbia Capital Allocation Portfolios | Annual Report 2020 |
Portfolio of Investments (continued)
Columbia Capital Allocation Conservative Portfolio, January 31, 2020
Fair value measurements (continued)
The following table is a summary of the inputs used to value the Fund’s investments at January 31, 2020:
| | Level 1 ($) | Level 2 ($) | Level 3 ($) | Total ($) |
| Investments in Securities | | | | |
| Alternative Strategies Funds | 12,292,058 | — | — | 12,292,058 |
| Common Stocks | | | | |
| Communication Services | 60,012 | 373,728 | — | 433,740 |
| Consumer Discretionary | 328,992 | 771,993 | — | 1,100,985 |
| Consumer Staples | 170,568 | 712,258 | — | 882,826 |
| Energy | 84,216 | 295,745 | — | 379,961 |
| Financials | 500,923 | 1,256,977 | — | 1,757,900 |
| Health Care | 539,062 | 858,353 | — | 1,397,415 |
| Industrials | 452,567 | 1,031,770 | — | 1,484,337 |
| Information Technology | 469,170 | 400,887 | — | 870,057 |
| Materials | 103,841 | 448,140 | — | 551,981 |
| Real Estate | 212,325 | 217,209 | — | 429,534 |
| Utilities | 103,984 | 281,309 | — | 385,293 |
| Total Common Stocks | 3,025,660 | 6,648,369 | — | 9,674,029 |
| Equity Funds | 37,773,606 | — | — | 37,773,606 |
| Fixed Income Funds | 133,400,059 | — | — | 133,400,059 |
| Money Market Funds | 30,166,235 | — | — | 30,166,235 |
| Total Investments in Securities | 216,657,618 | 6,648,369 | — | 223,305,987 |
| Investments in Derivatives | | | | |
| Asset | | | | |
| Forward Foreign Currency Exchange Contracts | — | 2,630 | — | 2,630 |
| Futures Contracts | 859,708 | — | — | 859,708 |
| Swap Contracts | — | 11,041 | — | 11,041 |
| Liability | | | | |
| Forward Foreign Currency Exchange Contracts | — | (6) | — | (6) |
| Futures Contracts | (162,105) | — | — | (162,105) |
| Total | 217,355,221 | 6,662,034 | — | 224,017,255 |
See the Portfolio of Investments for all investment classifications not indicated in the table.
The Fund’s assets assigned to the Level 2 input category are generally valued using the market approach, in which a security’s value is determined through reference to prices and information from market transactions for similar or identical assets. These assets include certain foreign securities for which a third party statistical pricing service may be employed for purposes of fair market valuation. The model utilized by such third party statistical pricing service takes into account a security’s correlation to available market data including, but not limited to, intraday index, ADR, and exchange-traded fund movements.
Derivative instruments are valued at unrealized appreciation (depreciation).
The accompanying Notes to Financial Statements are an integral part of this statement.
Columbia Capital Allocation Portfolios | Annual Report 2020
| 29 |
Portfolio of Investments
Columbia Capital Allocation Moderate Conservative Portfolio, January 31, 2020
(Percentages represent value of investments compared to net assets)
Investments in securities
| Alternative Strategies Funds 5.3% |
| | Shares | Value ($) |
| Columbia Commodity Strategy Fund, Institutional 3 Class(a) | 438,167 | 1,818,392 |
| Columbia Multi Strategy Alternatives Fund, Institutional 3 Class(a),(b) | 468,857 | 3,450,790 |
| Columbia Multi-Asset Income Fund, Institutional 3 Class(a) | 2,273,778 | 22,010,164 |
Total Alternative Strategies Funds
(Cost $29,290,913) | 27,279,346 |
|
| Common Stocks 2.9% |
| Issuer | Shares | Value ($) |
| Communication Services 0.1% |
| Diversified Telecommunication Services 0.0% |
| Nippon Telegraph & Telephone Corp. | 4,000 | 101,988 |
| Entertainment 0.1% |
| Nintendo Co., Ltd. | 300 | 110,357 |
| Square Enix Holdings Co., Ltd. | 2,600 | 127,633 |
| Toho Co., Ltd. | 1,200 | 44,206 |
| Total | | 282,196 |
| Interactive Media & Services 0.0% |
| DHI Group, Inc.(b) | 3,950 | 11,060 |
| Meet Group, Inc. (The)(b) | 5,400 | 28,782 |
| Yelp, Inc.(b) | 95 | 3,097 |
| Total | | 42,939 |
| Media 0.0% |
| Gray Television, Inc.(b) | 620 | 12,574 |
| National CineMedia, Inc. | 1,475 | 10,885 |
| TechTarget, Inc.(b) | 990 | 25,136 |
| Telenet Group Holding NV | 981 | 45,613 |
| WPP PLC | 11,215 | 139,442 |
| Total | | 233,650 |
| Wireless Telecommunication Services 0.0% |
| Gogo(b) | 1,550 | 8,153 |
| Total Communication Services | 668,926 |
| Common Stocks (continued) |
| Issuer | Shares | Value ($) |
| Consumer Discretionary 0.3% |
| Auto Components 0.0% |
| Dana, Inc. | 420 | 6,472 |
| Modine Manufacturing Co.(b) | 1,275 | 8,963 |
| Valeo SA | 1,149 | 34,127 |
| Total | | 49,562 |
| Automobiles 0.1% |
| Fiat Chrysler Automobiles NV | 10,133 | 132,005 |
| Peugeot SA | 5,818 | 119,794 |
| Total | | 251,799 |
| Distributors 0.0% |
| Funko, Inc., Class A(b) | 1,240 | 18,637 |
| Diversified Consumer Services 0.0% |
| Collectors Universe, Inc. | 910 | 22,350 |
| K12, Inc.(b) | 915 | 14,768 |
| Perdoceo Education Corp.(b) | 940 | 16,713 |
| Total | | 53,831 |
| Hotels, Restaurants & Leisure 0.0% |
| Boyd Gaming Corp. | 120 | 3,582 |
| Brinker International, Inc. | 350 | 14,942 |
| Dine Brands Global, Inc. | 329 | 28,047 |
| Everi Holdings, Inc.(b) | 2,325 | 29,062 |
| Marriott Vacations Worldwide Corp. | 211 | 25,371 |
| SeaWorld Entertainment, Inc.(b) | 935 | 32,220 |
| Total | | 133,224 |
| Household Durables 0.1% |
| Berkeley Group Holdings PLC | 2,829 | 195,750 |
| M/I Homes, Inc.(b) | 475 | 21,085 |
| Sekisui House Ltd. | 6,400 | 137,614 |
| Sony Corp. | 1,700 | 118,876 |
| Taylor Morrison Home Corp., Class A(b) | 1,310 | 33,903 |
| Total | | 507,228 |
| Internet & Direct Marketing Retail 0.0% |
| Stamps.com, Inc.(b) | 225 | 16,760 |
The accompanying Notes to Financial Statements are an integral part of this statement.
| 30 | Columbia Capital Allocation Portfolios | Annual Report 2020 |
Portfolio of Investments (continued)
Columbia Capital Allocation Moderate Conservative Portfolio, January 31, 2020
| Common Stocks (continued) |
| Issuer | Shares | Value ($) |
| Leisure Products 0.0% |
| Bandai Namco Holdings, Inc. | 500 | 29,054 |
| Malibu Boats, Inc., Class A(b) | 735 | 32,186 |
| MasterCraft Boat Holdings, Inc.(b) | 570 | 10,015 |
| Sankyo Co., Ltd. | 1,400 | 47,035 |
| Sturm Ruger & Co., Inc. | 285 | 14,113 |
| Total | | 132,403 |
| Specialty Retail 0.0% |
| Genesco, Inc.(b) | 475 | 18,677 |
| GNC Holdings, Inc., Class A(b) | 4,200 | 8,988 |
| Hibbett Sports, Inc.(b) | 850 | 21,063 |
| Lithia Motors, Inc., Class A | 185 | 25,094 |
| Rent-A-Center, Inc. | 580 | 16,895 |
| Restoration Hardware Holdings, Inc.(b) | 65 | 13,569 |
| Sleep Number Corp.(b) | 415 | 21,410 |
| Sportsman’s Warehouse Holdings, Inc.(b) | 2,650 | 17,172 |
| Tilly’s, Inc. | 400 | 3,400 |
| Zumiez, Inc.(b) | 555 | 17,299 |
| Total | | 163,567 |
| Textiles, Apparel & Luxury Goods 0.1% |
| Adidas AG | 536 | 169,437 |
| Burberry Group PLC | 1,461 | 37,461 |
| Deckers Outdoor Corp.(b) | 181 | 34,555 |
| Kering SA | 173 | 105,706 |
| Pandora A/S | 1,126 | 58,390 |
| Total | | 405,549 |
| Total Consumer Discretionary | 1,732,560 |
| Consumer Staples 0.3% |
| Beverages 0.1% |
| Carlsberg A/S, Class B | 994 | 145,158 |
| Coca-Cola European Partners PLC | 2,737 | 143,993 |
| Total | | 289,151 |
| Food & Staples Retailing 0.1% |
| Coles Group Ltd. | 13,807 | 151,505 |
| Ingles Markets, Inc., Class A | 595 | 24,805 |
| Koninklijke Ahold Delhaize NV | 4,070 | 99,884 |
| Metro AG | 7,638 | 106,275 |
| Common Stocks (continued) |
| Issuer | Shares | Value ($) |
| SpartanNash Co. | 1,570 | 19,123 |
| Welcia Holdings Co., Ltd. | 900 | 49,422 |
| Total | | 451,014 |
| Food Products 0.0% |
| John B. Sanfilippo & Son, Inc. | 300 | 25,290 |
| Nestlé SA, Registered Shares | 1,190 | 131,249 |
| Total | | 156,539 |
| Household Products 0.0% |
| Essity AB, Class B | 1,129 | 35,841 |
| Personal Products 0.0% |
| Edgewell Personal Care Co.(b) | 490 | 12,652 |
| Medifast, Inc. | 227 | 21,935 |
| Usana Health Sciences, Inc.(b) | 275 | 16,967 |
| Total | | 51,554 |
| Tobacco 0.1% |
| British American Tobacco PLC | 4,691 | 206,849 |
| Swedish Match AB | 2,879 | 162,773 |
| Vector Group Ltd. | 525 | 6,899 |
| Total | | 376,521 |
| Total Consumer Staples | 1,360,620 |
| Energy 0.1% |
| Energy Equipment & Services 0.0% |
| DMC Global Inc | 190 | 7,948 |
| Liberty Oilfield Services, Inc., Class A | 735 | 6,233 |
| Matrix Service Co.(b) | 1,230 | 24,747 |
| NexTier Oilfield Solutions, Inc.(b) | 4,550 | 23,432 |
| Total | | 62,360 |
| Oil, Gas & Consumable Fuels 0.1% |
| Aker BP ASA | 1,342 | 37,801 |
| California Resources Corp.(b) | 1,055 | 7,744 |
| CVR Energy, Inc. | 745 | 25,784 |
| Delek U.S. Holdings, Inc. | 590 | 16,201 |
| Denbury Resources, Inc.(b) | 1,300 | 1,281 |
| Dorian LPG Ltd.(b) | 240 | 3,149 |
| ENI SpA | 3,158 | 44,236 |
| OMV AG | 266 | 13,219 |
| Royal Dutch Shell PLC, Class B | 10,443 | 274,407 |
| Santos Ltd. | 14,436 | 82,854 |
The accompanying Notes to Financial Statements are an integral part of this statement.
Columbia Capital Allocation Portfolios | Annual Report 2020
| 31 |
Portfolio of Investments (continued)
Columbia Capital Allocation Moderate Conservative Portfolio, January 31, 2020
| Common Stocks (continued) |
| Issuer | Shares | Value ($) |
| Southwestern Energy Co.(b) | 2,550 | 4,003 |
| W&T Offshore, Inc.(b) | 1,050 | 4,347 |
| World Fuel Services Corp. | 395 | 15,452 |
| Total | | 530,478 |
| Total Energy | 592,838 |
| Financials 0.5% |
| Banks 0.2% |
| Atlantic Capital Bancshares, Inc.(b) | 200 | 3,774 |
| Banco Bilbao Vizcaya Argentaria SA | 24,815 | 128,457 |
| Bancorp, Inc. (The)(b) | 2,450 | 28,983 |
| Bank Leumi Le-Israel BM | 11,468 | 82,454 |
| BNP Paribas SA | 3,116 | 165,358 |
| Cathay General Bancorp | 860 | 31,012 |
| Commerzbank AG | 2,960 | 16,986 |
| ConnectOne Bancorp, Inc. | 1,060 | 25,027 |
| Customers Bancorp, Inc.(b) | 1,151 | 24,608 |
| DBS Group Holdings Ltd. | 3,800 | 70,000 |
| First BanCorp | 2,775 | 25,724 |
| Fulton Financial Corp. | 1,260 | 20,752 |
| Great Southern Bancorp, Inc. | 395 | 22,479 |
| Hilltop Holdings, Inc. | 1,160 | 26,262 |
| Independent Bank Group, Inc. | 555 | 29,704 |
| International Bancshares Corp. | 745 | 29,353 |
| Investors Bancorp, Inc. | 700 | 8,460 |
| Israel Discount Bank Ltd. | 2,305 | 10,455 |
| Mediobanca Banca di Credito Finanziario SpA | 9,109 | 90,868 |
| Metropolitan Bank Holding Corp.(b) | 75 | 3,686 |
| Midland States Bancorp, Inc. | 540 | 14,267 |
| Nicolet Bankshares, Inc.(b) | 185 | 13,070 |
| OFG Bancorp | 1,260 | 24,835 |
| Preferred Bank | 350 | 21,039 |
| Raiffeisen Bank International AG | 2,529 | 57,608 |
| Sumitomo Mitsui Trust Holdings, Inc. | 2,900 | 106,923 |
| United Community Banks, Inc. | 540 | 15,077 |
| United Overseas Bank Ltd. | 500 | 9,326 |
| Total | | 1,106,547 |
| Common Stocks (continued) |
| Issuer | Shares | Value ($) |
| Capital Markets 0.1% |
| 3i Group PLC | 10,207 | 148,479 |
| Cohen & Steers, Inc. | 465 | 34,401 |
| Federated Hermes, Inc., Class B | 990 | 35,868 |
| Natixis SA | 30,005 | 126,707 |
| Singapore Exchange | 11,300 | 71,691 |
| Waddell & Reed Financial, Inc., Class A | 520 | 8,310 |
| Total | | 425,456 |
| Consumer Finance 0.0% |
| Encore Capital Group, Inc.(b) | 755 | 25,632 |
| Enova International, Inc.(b) | 1,020 | 25,561 |
| Nelnet, Inc., Class A | 175 | 10,021 |
| Regional Management Corp.(b) | 895 | 24,657 |
| Total | | 85,871 |
| Insurance 0.2% |
| Ageas | 1,206 | 66,501 |
| Allianz SE, Registered Shares | 986 | 235,401 |
| American Equity Investment Life Holding Co. | 810 | 21,392 |
| Assicurazioni Generali SpA | 7,818 | 152,339 |
| AXA SA | 2,515 | 66,878 |
| CNP Assurances | 6,569 | 118,244 |
| Dai-ichi Life Holdings, Inc. | 3,500 | 51,944 |
| Employers Holdings, Inc. | 650 | 27,723 |
| Genworth Financial, Inc., Class A(b) | 2,850 | 11,685 |
| Selective Insurance Group, Inc. | 75 | 4,969 |
| Swiss Life Holding AG, Registered Shares | 291 | 146,278 |
| Universal Insurance Holdings, Inc. | 401 | 9,760 |
| Total | | 913,114 |
| Mortgage Real Estate Investment Trusts (REITS) 0.0% |
| Ares Commercial Real Estate Corp. | 670 | 10,948 |
| Ellington Financial, Inc. | 1,310 | 23,933 |
| PennyMac Mortgage Investment Trust | 200 | 4,650 |
| Total | | 39,531 |
| Thrifts & Mortgage Finance 0.0% |
| Essent Group Ltd. | 745 | 36,960 |
| Federal Agricultural Mortgage Corp. | 334 | 25,484 |
| Flagstar Bancorp, Inc. | 720 | 25,373 |
| Meta Financial Group, Inc. | 765 | 28,473 |
The accompanying Notes to Financial Statements are an integral part of this statement.
| 32 | Columbia Capital Allocation Portfolios | Annual Report 2020 |
Portfolio of Investments (continued)
Columbia Capital Allocation Moderate Conservative Portfolio, January 31, 2020
| Common Stocks (continued) |
| Issuer | Shares | Value ($) |
| NMI Holdings, Inc., Class A(b) | 1,000 | 31,920 |
| Radian Group, Inc. | 1,570 | 38,449 |
| Total | | 186,659 |
| Total Financials | 2,757,178 |
| Health Care 0.4% |
| Biotechnology 0.1% |
| ACADIA Pharmaceuticals, Inc.(b) | 600 | 23,964 |
| Acceleron Pharma, Inc.(b) | 110 | 9,986 |
| Arcutis Biotherapeutics, Inc.(b) | 676 | 14,737 |
| Arena Pharmaceuticals, Inc.(b) | 540 | 24,673 |
| Arrowhead Pharmaceuticals, Inc.(b) | 220 | 9,220 |
| Atara Biotherapeutics, Inc.(b) | 440 | 5,821 |
| BeiGene Ltd., ADR(b) | 182 | 27,729 |
| Black Diamond Therapeutics, Inc.(b) | 412 | 15,450 |
| bluebird bio, Inc.(b) | 168 | 13,388 |
| Blueprint Medicines Corp.(b) | 200 | 12,690 |
| CSL Ltd. | 164 | 33,730 |
| Dynavax Technologies Corp.(b) | 2,030 | 10,251 |
| Fate Therapeutics, Inc.(b) | 480 | 12,173 |
| Global Blood Therapeutics, Inc.(b) | 135 | 8,810 |
| Gossamer Bio, Inc.(b) | 420 | 5,578 |
| Immunomedics, Inc.(b) | 1,380 | 25,627 |
| Insmed, Inc.(b) | 738 | 15,158 |
| Karuna Therapeutics, Inc.(b) | 45 | 4,271 |
| Mirati Therapeutics, Inc.(b) | 175 | 15,195 |
| Precision BioSciences, Inc.(b) | 796 | 6,440 |
| Rubius Therapeutics, Inc.(b) | 630 | 4,914 |
| Sage Therapeutics, Inc.(b) | 286 | 18,956 |
| Sarepta Therapeutics, Inc.(b) | 117 | 13,567 |
| SpringWorks Therapeutics, Inc.(b) | 602 | 18,951 |
| TCR2 Therapeutics, Inc.(b) | 790 | 11,597 |
| Turning Point Therapeutics, Inc.(b) | 300 | 17,550 |
| Ultragenyx Pharmaceutical, Inc.(b) | 120 | 6,306 |
| uniQure NV(b) | 235 | 13,527 |
| Total | | 400,259 |
| Common Stocks (continued) |
| Issuer | Shares | Value ($) |
| Health Care Equipment & Supplies 0.1% |
| Angiodynamics, Inc.(b) | 1,350 | 18,590 |
| CryoLife, Inc.(b) | 500 | 14,870 |
| Hoya Corp. | 900 | 86,135 |
| Integer Holdings Corp.(b) | 380 | 32,452 |
| Lantheus Holdings, Inc.(b) | 1,430 | 25,039 |
| Meridian Bioscience, Inc. | 1,450 | 14,268 |
| Natus Medical, Inc.(b) | 820 | 25,658 |
| NuVasive, Inc.(b) | 200 | 15,424 |
| Quidel Corp.(b) | 250 | 19,200 |
| Varex Imaging Corp.(b) | 790 | 21,843 |
| Total | | 273,479 |
| Health Care Providers & Services 0.0% |
| Corvel Corp.(b) | 214 | 19,596 |
| Cross Country Healthcare, Inc.(b) | 1,300 | 12,870 |
| Magellan Health, Inc.(b) | 410 | 30,016 |
| Medipal Holdings Corp. | 3,800 | 80,522 |
| Owens & Minor, Inc. | 700 | 4,382 |
| Tenet Healthcare Corp.(b) | 270 | 8,543 |
| Total | | 155,929 |
| Health Care Technology 0.0% |
| HealthStream, Inc.(b) | 960 | 24,528 |
| Omnicell, Inc.(b) | 400 | 32,512 |
| Total | | 57,040 |
| Life Sciences Tools & Services 0.0% |
| Medpace Holdings, Inc.(b) | 376 | 32,167 |
| Syneos Health, Inc.(b) | 615 | 37,736 |
| Total | | 69,903 |
| Pharmaceuticals 0.2% |
| Aerie Pharmaceuticals, Inc.(b) | 390 | 7,987 |
| Amphastar Pharmaceuticals, Inc.(b) | 1,150 | 21,747 |
| Astellas Pharma, Inc. | 11,200 | 197,905 |
| Dainippon Sumitomo Pharma Co., Ltd. | 4,000 | 68,665 |
| GlaxoSmithKline PLC | 8,795 | 206,502 |
| GW Pharmaceuticals PLC, ADR(b) | 163 | 18,831 |
| Horizon Therapeutics PLC(b) | 290 | 10,002 |
| Novartis AG, Registered Shares | 2,985 | 281,988 |
| Odonate Therapeutics, Inc.(b) | 475 | 13,870 |
The accompanying Notes to Financial Statements are an integral part of this statement.
Columbia Capital Allocation Portfolios | Annual Report 2020
| 33 |
Portfolio of Investments (continued)
Columbia Capital Allocation Moderate Conservative Portfolio, January 31, 2020
| Common Stocks (continued) |
| Issuer | Shares | Value ($) |
| Prestige Consumer Healthcare, Inc.(b) | 715 | 29,000 |
| Reata Pharmaceuticals, Inc., Class A(b) | 144 | 31,506 |
| Roche Holding AG, Genusschein Shares | 1,063 | 356,603 |
| Supernus Pharmaceuticals, Inc.(b) | 325 | 7,433 |
| Total | | 1,252,039 |
| Total Health Care | 2,208,649 |
| Industrials 0.5% |
| Air Freight & Logistics 0.0% |
| Echo Global Logistics, Inc.(b) | 690 | 13,372 |
| Radiant Logistics, Inc.(b) | 2,750 | 13,283 |
| Total | | 26,655 |
| Airlines 0.0% |
| Skywest, Inc. | 235 | 12,965 |
| Building Products 0.0% |
| American Woodmark Corp.(b) | 306 | 33,553 |
| Builders FirstSource, Inc.(b) | 1,360 | 33,721 |
| Caesarstone Ltd. | 1,170 | 15,304 |
| CSW Industrials, Inc. | 380 | 28,834 |
| Gibraltar Industries, Inc.(b) | 595 | 32,439 |
| Quanex Building Products Corp. | 1,525 | 27,023 |
| Total | | 170,874 |
| Commercial Services & Supplies 0.0% |
| Brady Corp., Class A | 340 | 18,826 |
| Deluxe Corp. | 300 | 14,460 |
| Herman Miller, Inc. | 655 | 25,316 |
| HNI Corp. | 665 | 23,920 |
| Total | | 82,522 |
| Construction & Engineering 0.2% |
| ACS Actividades de Construccion y Servicios SA | 3,919 | 130,295 |
| CIMIC Group Ltd. | 4,634 | 89,664 |
| Eiffage SA | 652 | 75,576 |
| EMCOR Group, Inc. | 396 | 32,539 |
| Great Lakes Dredge & Dock Corp.(b) | 2,520 | 26,384 |
| MasTec, Inc.(b) | 520 | 30,030 |
| Obayashi Corp. | 1,500 | 16,451 |
| Shimizu Corp. | 13,300 | 136,416 |
| Skanska AB, Class B | 7,304 | 169,064 |
| Total | | 706,419 |
| Common Stocks (continued) |
| Issuer | Shares | Value ($) |
| Electrical Equipment 0.1% |
| Atkore International Group, Inc.(b) | 815 | 32,356 |
| Schneider Electric SE | 1,806 | 180,106 |
| Total | | 212,462 |
| Machinery 0.1% |
| GEA Group AG | 531 | 15,900 |
| KONE OYJ, Class B | 436 | 28,171 |
| Lydall, Inc.(b) | 870 | 17,783 |
| Mitsubishi Heavy Industries Ltd. | 3,400 | 124,023 |
| Mueller Industries, Inc. | 930 | 27,128 |
| Rexnord Corp.(b) | 520 | 16,978 |
| SKF AB, Class B | 4,376 | 80,101 |
| SPX Corp.(b) | 550 | 26,988 |
| Total | | 337,072 |
| Marine 0.0% |
| Costamare, Inc. | 2,900 | 22,997 |
| Professional Services 0.1% |
| Adecco Group AG, Registered Shares | 2,318 | 135,807 |
| Barrett Business Services, Inc. | 285 | 23,607 |
| FTI Consulting, Inc.(b) | 123 | 14,767 |
| Heidrick & Struggles International, Inc. | 770 | 21,884 |
| Kforce, Inc. | 765 | 28,343 |
| Wolters Kluwer NV | 2,009 | 150,959 |
| Total | | 375,367 |
| Road & Rail 0.0% |
| ArcBest Corp. | 460 | 10,263 |
| Aurizon Holdings Ltd. | 37,921 | 135,928 |
| Total | | 146,191 |
| Trading Companies & Distributors 0.0% |
| BMC Stock Holdings, Inc.(b) | 1,120 | 32,687 |
| Foundation Building Materials, Inc.(b) | 1,210 | 21,574 |
| GMS, Inc.(b) | 1,015 | 27,121 |
| MRC Global, Inc.(b) | 2,055 | 23,139 |
| Veritiv Corp.(b) | 1,610 | 22,669 |
| Total | | 127,190 |
| Transportation Infrastructure 0.0% |
| Kamigumi Co., Ltd. | 5,200 | 111,112 |
| Total Industrials | 2,331,826 |
The accompanying Notes to Financial Statements are an integral part of this statement.
| 34 | Columbia Capital Allocation Portfolios | Annual Report 2020 |
Portfolio of Investments (continued)
Columbia Capital Allocation Moderate Conservative Portfolio, January 31, 2020
| Common Stocks (continued) |
| Issuer | Shares | Value ($) |
| Information Technology 0.3% |
| Communications Equipment 0.0% |
| ADTRAN, Inc. | 1,170 | 10,589 |
| Comtech Telecommunications Corp. | 565 | 16,334 |
| Total | | 26,923 |
| Electronic Equipment, Instruments & Components 0.1% |
| Badger Meter, Inc. | 60 | 3,544 |
| Benchmark Electronics, Inc. | 880 | 27,086 |
| Hitachi High-Technologies Corp. | 500 | 35,750 |
| Ingenico Group SA | 98 | 11,397 |
| Methode Electronics, Inc. | 730 | 23,907 |
| Rogers Corp.(b) | 239 | 28,142 |
| Sanmina Corp.(b) | 950 | 30,248 |
| Venture Corp., Ltd. | 5,100 | 60,223 |
| Vishay Intertechnology, Inc. | 1,600 | 32,464 |
| Vishay Precision Group, Inc.(b) | 755 | 26,078 |
| Total | | 278,839 |
| IT Services 0.1% |
| Capgemini SE | 171 | 21,237 |
| Cardtronics PLC, Class A(b) | 735 | 33,075 |
| Cass Information Systems, Inc. | 102 | 5,510 |
| EVERTEC, Inc. | 865 | 29,038 |
| Hackett Group | 420 | 6,491 |
| KBR, Inc. | 980 | 26,656 |
| MAXIMUS, Inc. | 180 | 12,915 |
| NEC Corp. | 300 | 13,354 |
| NIC, Inc. | 1,240 | 24,465 |
| Nomura Research Institute Ltd. | 1,500 | 33,009 |
| Perspecta, Inc. | 1,220 | 34,245 |
| TTEC Holdings, Inc. | 555 | 22,045 |
| Total | | 262,040 |
| Semiconductors & Semiconductor Equipment 0.1% |
| Advantest Corp. | 2,000 | 104,342 |
| Amkor Technology, Inc.(b) | 2,270 | 25,538 |
| Cirrus Logic, Inc.(b) | 45 | 3,456 |
| NXP Semiconductors NV | 554 | 70,280 |
| Sumco Corp. | 600 | 9,175 |
| Synaptics, Inc.(b) | 500 | 33,345 |
| Common Stocks (continued) |
| Issuer | Shares | Value ($) |
| Tokyo Electron Ltd. | 800 | 175,957 |
| Ultra Clean Holdings, Inc.(b) | 1,160 | 26,692 |
| Xperi Corp. | 1,470 | 23,652 |
| Total | | 472,437 |
| Software 0.0% |
| Check Point Software Technologies Ltd.(b) | 318 | 36,351 |
| CommVault Systems, Inc.(b) | 655 | 29,488 |
| j2 Global, Inc. | 394 | 37,769 |
| Progress Software Corp. | 735 | 33,170 |
| Qualys, Inc.(b) | 378 | 32,410 |
| SPS Commerce, Inc.(b) | 498 | 28,301 |
| Total | | 197,489 |
| Technology Hardware, Storage & Peripherals 0.0% |
| FUJIFILM Holdings Corp. | 3,200 | 158,926 |
| Total Information Technology | 1,396,654 |
| Materials 0.2% |
| Chemicals 0.1% |
| Chase Corp. | 93 | 8,553 |
| Covestro AG | 2,136 | 90,017 |
| Innospec, Inc. | 237 | 23,873 |
| Koppers Holdings, Inc.(b) | 185 | 5,805 |
| Mitsubishi Chemical Holdings Corp. | 2,100 | 15,177 |
| Showa Denko KK | 500 | 11,956 |
| Total | | 155,381 |
| Construction Materials 0.0% |
| U.S. Concrete, Inc.(b) | 635 | 22,600 |
| Metals & Mining 0.1% |
| Anglo American PLC | 3,191 | 83,266 |
| BHP Group Ltd. | 7,223 | 185,226 |
| Commercial Metals Co. | 800 | 16,440 |
| Fortescue Metals Group Ltd. | 14,429 | 106,888 |
| Materion Corp. | 440 | 23,892 |
| Rio Tinto PLC | 3,639 | 194,593 |
| Schnitzer Steel Industries, Inc., Class A | 1,140 | 18,331 |
| Total | | 628,636 |
The accompanying Notes to Financial Statements are an integral part of this statement.
Columbia Capital Allocation Portfolios | Annual Report 2020
| 35 |
Portfolio of Investments (continued)
Columbia Capital Allocation Moderate Conservative Portfolio, January 31, 2020
| Common Stocks (continued) |
| Issuer | Shares | Value ($) |
| Paper & Forest Products 0.0% |
| Schweitzer-Mauduit International, Inc. | 740 | 25,922 |
| Verso Corp., Class A(b) | 1,620 | 27,297 |
| Total | | 53,219 |
| Total Materials | 859,836 |
| Real Estate 0.1% |
| Equity Real Estate Investment Trusts (REITS) 0.0% |
| Alexander’s, Inc. | 10 | 3,227 |
| American Assets Trust, Inc. | 575 | 26,197 |
| Ashford Hospitality Trust, Inc. | 6,700 | 16,482 |
| CoreCivic, Inc. | 1,400 | 22,330 |
| CorEnergy Infrastructure Trust, Inc. | 583 | 26,585 |
| EastGroup Properties, Inc. | 276 | 37,555 |
| GEO Group, Inc. (The) | 670 | 10,586 |
| Independence Realty Trust, Inc. | 1,060 | 15,550 |
| Investors Real Estate Trust | 384 | 28,301 |
| Lexington Realty Trust | 2,775 | 30,719 |
| PS Business Parks, Inc. | 197 | 33,009 |
| Retail Value, Inc. | 760 | 24,981 |
| Ryman Hospitality Properties, Inc. | 75 | 6,377 |
| Uniti Group, Inc. | 3,150 | 19,940 |
| Washington Prime Group, Inc. | 1,975 | 5,945 |
| Xenia Hotels & Resorts, Inc. | 960 | 17,943 |
| Total | | 325,727 |
| Real Estate Management & Development 0.1% |
| CK Asset Holdings Ltd. | 1,000 | 6,389 |
| Henderson Land Development Co., Ltd. | 27,000 | 121,221 |
| Kerry Properties Ltd. | 3,000 | 8,368 |
| Nomura Real Estate Holdings, Inc. | 2,400 | 59,102 |
| RE/MAX Holdings, Inc., Class A | 95 | 3,637 |
| RMR Group, Inc. (The), Class A | 526 | 24,233 |
| Sumitomo Realty & Development Co., Ltd. | 2,800 | 103,083 |
| Swire Pacific Ltd., Class A | 4,000 | 35,123 |
| Total | | 361,156 |
| Total Real Estate | 686,883 |
| Common Stocks (continued) |
| Issuer | Shares | Value ($) |
| Utilities 0.1% |
| Electric Utilities 0.0% |
| Endesa SA | 1,363 | 37,424 |
| Enel SpA | 1,582 | 13,789 |
| Otter Tail Corp. | 55 | 2,946 |
| Portland General Electric Co. | 656 | 40,344 |
| Total | | 94,503 |
| Gas Utilities 0.1% |
| Chesapeake Utilities Corp. | 285 | 27,420 |
| Enagas SA | 1,164 | 31,363 |
| Naturgy Energy Group SA | 5,480 | 144,534 |
| Southwest Gas Holdings, Inc. | 395 | 29,826 |
| Total | | 233,143 |
| Independent Power and Renewable Electricity Producers 0.0% |
| Meridian Energy Ltd. | 21,674 | 74,481 |
| Multi-Utilities 0.0% |
| AGL Energy Ltd. | 9,698 | 128,704 |
| Avista Corp. | 605 | 30,764 |
| NorthWestern Corp. | 375 | 28,864 |
| Unitil Corp. | 210 | 12,955 |
| Total | | 201,287 |
| Total Utilities | 603,414 |
Total Common Stocks
(Cost $14,337,408) | 15,199,384 |
|
| Equity Funds 29.0% |
| | Shares | Value ($) |
| International 6.9% |
| Columbia Contrarian Europe Fund, Institutional 3 Class(a) | 1,580,642 | 10,985,462 |
| Columbia Emerging Markets Fund, Institutional 3 Class(a) | 452,667 | 6,310,174 |
| Columbia Overseas Core Fund, Institutional 3 Class(a) | 1,174,247 | 11,495,880 |
| Columbia Overseas Value Fund, Institutional 3 Class(a) | 627,708 | 5,875,351 |
| Columbia Pacific/Asia Fund, Institutional 3 Class(a) | 106,050 | 1,066,864 |
| Total | 35,733,731 |
The accompanying Notes to Financial Statements are an integral part of this statement.
| 36 | Columbia Capital Allocation Portfolios | Annual Report 2020 |
Portfolio of Investments (continued)
Columbia Capital Allocation Moderate Conservative Portfolio, January 31, 2020
| Equity Funds (continued) |
| | Shares | Value ($) |
| U.S. Large Cap 21.0% |
| Columbia Contrarian Core Fund, Institutional 3 Class(a) | 550,264 | 15,110,258 |
| Columbia Disciplined Core Fund, Institutional 3 Class(a) | 2,227,395 | 26,661,915 |
| Columbia Disciplined Growth Fund, Institutional 3 Class(a) | 1,367,022 | 13,027,718 |
| Columbia Disciplined Value Fund, Institutional 3 Class(a) | 2,683,966 | 24,504,610 |
| Columbia Large Cap Growth Fund, Institutional 3 Class(a),(b) | 186,455 | 8,785,740 |
| Columbia Select Large Cap Equity Fund, Institutional 3 Class(a) | 1,329,806 | 20,000,287 |
| Total | 108,090,528 |
| U.S. Small Cap 1.1% |
| Columbia Small Cap Index Fund, Institutional 3 Class(a) | 256,808 | 5,657,477 |
Total Equity Funds
(Cost $137,596,610) | 149,481,736 |
|
| Fixed Income Funds 49.6% |
| | |
| Emerging Markets 1.9% |
| Columbia Emerging Markets Bond Fund, Institutional 3 Class(a) | 856,091 | 9,845,044 |
| High Yield 3.6% |
| Columbia Income Opportunities Fund, Institutional 3 Class(a) | 1,835,156 | 18,443,318 |
| Inflation Protected Securities 1.0% |
| Columbia Inflation Protected Securities Fund, Institutional 3 Class(a),(b) | 513,693 | 5,147,202 |
| Fixed Income Funds (continued) |
| | Shares | Value ($) |
| Investment Grade 43.1% |
| Columbia Corporate Income Fund, Institutional 3 Class(a) | 2,271,223 | 24,801,760 |
| Columbia Limited Duration Credit Fund, Institutional 3 Class(a) | 1,160,992 | 11,784,069 |
| Columbia Mortgage Opportunities Fund, Institutional 3 Class(a) | 752,800 | 7,648,451 |
| Columbia Quality Income Fund, Institutional 3 Class(a) | 12,511,634 | 70,065,148 |
| Columbia Short Term Bond Fund, Institutional 3 Class(a) | 2,551,298 | 25,615,032 |
| Columbia Total Return Bond Fund, Institutional 3 Class(a) | 2,830,573 | 26,522,469 |
| Columbia U.S. Treasury Index Fund, Institutional 3 Class(a) | 4,755,667 | 55,641,306 |
| Total | 222,078,235 |
Total Fixed Income Funds
(Cost $247,497,538) | 255,513,799 |
|
| Money Market Funds 12.6% |
| | |
| Columbia Government Money Market Fund, Institutional 3 Class, 1.151%(a),(c) | 1,026,952 | 1,026,952 |
| Columbia Short-Term Cash Fund, 1.648%(a),(c) | 63,837,700 | 63,837,700 |
Total Money Market Funds
(Cost $64,861,527) | 64,864,652 |
Total Investments in Securities
(Cost: $493,583,996) | 512,338,917 |
| Other Assets & Liabilities, Net | | 3,058,619 |
| Net Assets | 515,397,536 |
At January 31, 2020, securities and/or cash totaling $3,626,431 were pledged as collateral.
Investments in derivatives
| Forward foreign currency exchange contracts |
Currency to
be sold | Currency to
be purchased | Counterparty | Settlement
date | Unrealized
appreciation ($) | Unrealized
depreciation ($) |
| 223,000 AUD | 150,589 USD | JPMorgan | 03/26/2020 | 1,170 | — |
| 185,000 ILS | 53,747 USD | JPMorgan | 03/26/2020 | 14 | — |
| 824,000 SEK | 85,795 USD | JPMorgan | 03/26/2020 | — | (10) |
| 11,038 USD | 10,000 EUR | JPMorgan | 03/26/2020 | 88 | — |
| 192,877 USD | 148,000 GBP | JPMorgan | 03/26/2020 | 2,829 | — |
| Total | | | | 4,101 | (10) |
The accompanying Notes to Financial Statements are an integral part of this statement.
Columbia Capital Allocation Portfolios | Annual Report 2020
| 37 |
Portfolio of Investments (continued)
Columbia Capital Allocation Moderate Conservative Portfolio, January 31, 2020
| Long futures contracts |
| Description | Number of
contracts | Expiration
date | Trading
currency | Notional
amount | Value/Unrealized
appreciation ($) | Value/Unrealized
depreciation ($) |
| EURO STOXX 50 Index | 139 | 03/2020 | EUR | 5,058,210 | — | (190,432) |
| FTSE 100 Index | 53 | 03/2020 | GBP | 3,825,275 | — | (231,954) |
| FTSE/MIB Index | 16 | 03/2020 | EUR | 1,857,520 | — | (65,954) |
| MSCI EAFE Index Future | 2 | 03/2020 | USD | 197,650 | — | (2,531) |
| Russell 2000 Index E-mini | 1 | 03/2020 | USD | 80,735 | — | (1,703) |
| Russell 2000 Index E-mini | 8 | 03/2020 | USD | 645,880 | — | (8,840) |
| S&P 500 Index E-mini | 134 | 03/2020 | USD | 21,600,800 | 522,603 | — |
| U.S. Treasury 10-Year Note | 350 | 03/2020 | USD | 46,079,688 | 748,519 | — |
| U.S. Treasury 5-Year Note | 94 | 03/2020 | USD | 11,310,109 | 125,399 | — |
| U.S. Ultra Treasury Bond | 69 | 03/2020 | USD | 13,364,438 | 481,572 | — |
| Total | | | | | 1,878,093 | (501,414) |
| Short futures contracts |
| Description | Number of
contracts | Expiration
date | Trading
currency | Notional
amount | Value/Unrealized
appreciation ($) | Value/Unrealized
depreciation ($) |
| MSCI Emerging Markets Index | (140) | 03/2020 | USD | (7,350,700) | 229,400 | — |
| TOPIX Index | (4) | 03/2020 | JPY | (67,160,000) | 15,188 | — |
| Total | | | | | 244,588 | — |
| Cleared credit default swap contracts - sell protection |
Reference
entity | Counterparty | Maturity
date | Receive
fixed
rate
(%) | Payment
frequency | Implied
credit
spread
(%)* | Notional
currency | Notional
amount | Value
($) | Upfront
payments
($) | Upfront
receipts
($) | Unrealized
appreciation
($) | Unrealized
depreciation
($) |
| Markit CDX Emerging Markets Index, Series 32 | Morgan Stanley | 12/20/2024 | 1.000 | Quarterly | 1.972 | USD | 5,385,000 | 25,595 | — | — | 25,595 | — |
| * | Implied credit spreads, represented in absolute terms, utilized in determining the market value of credit default swap agreements on corporate or sovereign issues as of period end serve as an indicator of the current status of the payment/performance risk and represent the likelihood or risk of default for the credit derivative. The implied credit spread of a particular referenced entity reflects the cost of buying/selling protection and may include upfront payments required to be made to enter into the agreement. Wider credit spreads represent a deterioration of the referenced entity’s credit soundness and a greater likelihood or risk of default or other credit event occurring as defined under the terms of the agreement. |
Notes to Portfolio of Investments
| (a) | As defined in the Investment Company Act of 1940, an affiliated company is one in which the Fund owns 5% or more of the company’s outstanding voting securities, or a company which is under common ownership or control with the Fund. Holdings and transactions in these affiliated companies during the year ended January 31, 2020 are as follows: |
| Issuer | Beginning
shares | Shares
purchased | Shares
sold | Ending
shares | Capital gain
distributions —
affiliated
issuers ($) | Realized gain
(loss) —
affiliated
issuers ($) | Net change in
unrealized
appreciation
(depreciation) —
affiliated
issuers ($) | Dividends —
affiliated
issuers ($) | Value —
affiliated
issuers
at end of
period ($) |
| Columbia Commodity Strategy Fund, Institutional 3 Class |
| | 570,509 | 27,712 | (160,054) | 438,167 | — | (219,318) | 94,114 | 25,024 | 1,818,392 |
| Columbia Contrarian Core Fund, Institutional 3 Class |
| | 685,648 | 38,543 | (173,927) | 550,264 | 733,057 | 1,735,446 | 698,065 | 184,765 | 15,110,258 |
| Columbia Contrarian Europe Fund, Institutional 3 Class |
| | 1,865,982 | 74,585 | (359,925) | 1,580,642 | — | (137,187) | 1,621,668 | 268,104 | 10,985,462 |
| Columbia Corporate Income Fund, Institutional 3 Class |
| | 2,561,473 | 94,959 | (385,209) | 2,271,223 | — | 67,748 | 2,453,627 | 835,817 | 24,801,760 |
| Columbia Disciplined Core Fund, Institutional 3 Class |
| | 2,473,254 | 248,754 | (494,613) | 2,227,395 | 2,268,900 | 1,678,158 | (312,986) | 414,491 | 26,661,915 |
The accompanying Notes to Financial Statements are an integral part of this statement.
| 38 | Columbia Capital Allocation Portfolios | Annual Report 2020 |
Portfolio of Investments (continued)
Columbia Capital Allocation Moderate Conservative Portfolio, January 31, 2020
Notes to Portfolio of Investments (continued)
| Issuer | Beginning
shares | Shares
purchased | Shares
sold | Ending
shares | Capital gain
distributions —
affiliated
issuers ($) | Realized gain
(loss) —
affiliated
issuers ($) | Net change in
unrealized
appreciation
(depreciation) —
affiliated
issuers ($) | Dividends —
affiliated
issuers ($) | Value —
affiliated
issuers
at end of
period ($) |
| Columbia Disciplined Growth Fund, Institutional 3 Class |
| | 1,589,903 | 438,951 | (661,832) | 1,367,022 | 928,722 | 78,441 | 1,265,243 | 101,129 | 13,027,718 |
| Columbia Disciplined Value Fund, Institutional 3 Class |
| | 2,975,816 | 525,045 | (816,895) | 2,683,966 | 2,216,739 | 397,981 | (701,731) | 565,180 | 24,504,610 |
| Columbia Emerging Markets Bond Fund, Institutional 3 Class |
| | 937,923 | 39,752 | (121,584) | 856,091 | — | (59,783) | 512,429 | 385,364 | 9,845,044 |
| Columbia Emerging Markets Fund, Institutional 3 Class |
| | 567,521 | 9,865 | (124,719) | 452,667 | — | 494,914 | 517,545 | 34,638 | 6,310,174 |
| Columbia Government Money Market Fund, Institutional 3 Class, 1.151% |
| | 2,568,342 | 172,621 | (1,714,011) | 1,026,952 | 438 | — | — | 40,417 | 1,026,952 |
| Columbia Income Opportunities Fund, Institutional 3 Class |
| | 1,969,497 | 98,952 | (233,293) | 1,835,156 | — | (52,915) | 1,071,678 | 943,407 | 18,443,318 |
| Columbia Inflation Protected Securities Fund, Institutional 3 Class |
| | 565,167 | 2,080 | (53,554) | 513,693 | — | 5,199 | 445,199 | — | 5,147,202 |
| Columbia Large Cap Growth Fund, Institutional 3 Class |
| | 228,932 | 16,921 | (59,398) | 186,455 | 674,671 | 704,637 | 815,465 | — | 8,785,740 |
| Columbia Limited Duration Credit Fund, Institutional 3 Class |
| | 1,229,048 | 34,167 | (102,223) | 1,160,992 | — | (10,321) | 539,582 | 310,752 | 11,784,069 |
| Columbia Mortgage Opportunities Fund, Institutional 3 Class |
| | 779,685 | 36,380 | (63,265) | 752,800 | 62,371 | 10,725 | 149,204 | 270,428 | 7,648,451 |
| Columbia Multi Strategy Alternatives Fund, Institutional 3 Class |
| | 468,857 | — | — | 468,857 | — | — | (276,627) | — | 3,450,790 |
| Columbia Multi-Asset Income Fund, Institutional 3 Class |
| | 2,141,025 | 132,753 | — | 2,273,778 | — | — | 1,300,819 | 1,247,425 | 22,010,164 |
| Columbia Overseas Core Fund, Institutional 3 Class |
| | 1,316,936 | 61,371 | (204,060) | 1,174,247 | 45,604 | (84,705) | 943,764 | 424,990 | 11,495,880 |
| Columbia Overseas Value Fund, Institutional 3 Class |
| | 697,151 | 32,936 | (102,379) | 627,708 | 12,124 | 114,380 | 162,330 | 229,682 | 5,875,351 |
| Columbia Pacific/Asia Fund, Institutional 3 Class |
| | 160,013 | 14,315 | (68,278) | 106,050 | 72,840 | 69,044 | 60,571 | 36,779 | 1,066,864 |
| Columbia Quality Income Fund, Institutional 3 Class |
| | 13,145,834 | 443,579 | (1,077,779) | 12,511,634 | — | 42,390 | 2,813,173 | 2,143,917 | 70,065,148 |
| Columbia Select Large Cap Equity Fund, Institutional 3 Class |
| | 1,580,894 | 96,755 | (347,843) | 1,329,806 | 892,253 | 950,792 | 1,754,209 | 250,408 | 20,000,287 |
| Columbia Short Term Bond Fund, Institutional 3 Class |
| | 2,611,334 | 105,053 | (165,089) | 2,551,298 | — | 32,506 | 359,430 | 947,228 | 25,615,032 |
| Columbia Short-Term Cash Fund, 1.648% |
| | 58,297,720 | 32,539,856 | (26,999,876) | 63,837,700 | — | (779) | 6,952 | 1,338,746 | 63,837,700 |
| Columbia Small Cap Index Fund, Institutional 3 Class |
| | 240,373 | 16,435 | — | 256,808 | 293,305 | — | (24,200) | 73,729 | 5,657,477 |
| Columbia Total Return Bond Fund, Institutional 3 Class |
| | 2,994,592 | 147,282 | (311,301) | 2,830,573 | 344,409 | 34,469 | 1,243,560 | 897,471 | 26,522,469 |
The accompanying Notes to Financial Statements are an integral part of this statement.
Columbia Capital Allocation Portfolios | Annual Report 2020
| 39 |
Portfolio of Investments (continued)
Columbia Capital Allocation Moderate Conservative Portfolio, January 31, 2020
Notes to Portfolio of Investments (continued)
| Issuer | Beginning
shares | Shares
purchased | Shares
sold | Ending
shares | Capital gain
distributions —
affiliated
issuers ($) | Realized gain
(loss) —
affiliated
issuers ($) | Net change in
unrealized
appreciation
(depreciation) —
affiliated
issuers ($) | Dividends —
affiliated
issuers ($) | Value —
affiliated
issuers
at end of
period ($) |
| Columbia U.S. Treasury Index Fund, Institutional 3 Class |
| | 5,124,759 | 129,159 | (498,251) | 4,755,667 | — | 79,226 | 3,493,420 | 1,164,457 | 55,641,306 |
| Total | | | | | 8,545,433 | 5,931,048 | 21,006,503 | 13,134,348 | 497,139,533 |
| (b) | Non-income producing investment. |
| (c) | The rate shown is the seven-day current annualized yield at January 31, 2020. |
Abbreviation Legend
| ADR | American Depositary Receipt |
Currency Legend
| AUD | Australian Dollar |
| EUR | Euro |
| GBP | British Pound |
| ILS | New Israeli Sheqel |
| JPY | Japanese Yen |
| SEK | Swedish Krona |
| USD | US Dollar |
Fair value measurements
The Fund categorizes its fair value measurements according to a three-level hierarchy that maximizes the use of observable inputs and minimizes the use of unobservable inputs by prioritizing that the most observable input be used when available. Observable inputs are those that market participants would use in pricing an investment based on market data obtained from sources independent of the reporting entity. Unobservable inputs are those that reflect the Fund’s assumptions about the information market participants would use in pricing an investment. An investment’s level within the fair value hierarchy is based on the lowest level of any input that is deemed significant to the asset’s or liability’s fair value measurement. The input levels are not necessarily an indication of the risk or liquidity associated with investments at that level. For example, certain U.S. government securities are generally high quality and liquid, however, they are reflected as Level 2 because the inputs used to determine fair value may not always be quoted prices in an active market.
Fair value inputs are summarized in the three broad levels listed below:
| ■ | Level 1 — Valuations based on quoted prices for investments in active markets that the Fund has the ability to access at the measurement date. Valuation adjustments are not applied to Level 1 investments. |
| ■ | Level 2 — Valuations based on other significant observable inputs (including quoted prices for similar securities, interest rates, prepayment speeds, credit risks, etc.). |
| ■ | Level 3 — Valuations based on significant unobservable inputs (including the Fund’s own assumptions and judgment in determining the fair value of investments). |
Inputs that are used in determining fair value of an investment may include price information, credit data, volatility statistics, and other factors. These inputs can be either observable or unobservable. The availability of observable inputs can vary between investments, and is affected by various factors such as the type of investment, and the volume and level of activity for that investment or similar investments in the marketplace. The inputs will be considered by the Investment Manager, along with any other relevant factors in the calculation of an investment’s fair value. The Fund uses prices and inputs that are current as of the measurement date, which may include periods of market dislocations. During these periods, the availability of prices and inputs may be reduced for many investments. This condition could cause an investment to be reclassified between the various levels within the hierarchy.
Foreign equity securities actively traded in markets where there is a significant delay in the local close relative to the New York Stock Exchange are classified as Level 2. The values of these securities may include an adjustment to reflect the impact of market movements following the close of local trading, as described in Note 2 to the financial statements – Security valuation.
Investments falling into the Level 3 category are primarily supported by quoted prices from brokers and dealers participating in the market for those investments. However, these may be classified as Level 3 investments due to lack of market transparency and corroboration to support these quoted prices. Additionally, valuation models may be used as the pricing source for any remaining investments classified as Level 3. These models may rely on one or more significant unobservable inputs and/or significant assumptions by the Investment Manager. Inputs used in valuations may include, but are not limited to, financial statement analysis, capital account balances, discount rates and estimated cash flows, and comparable company data.
Under the direction of the Fund’s Board of Trustees (the Board), the Investment Manager’s Valuation Committee (the Committee) is responsible for overseeing the valuation procedures approved by the Board. The Committee consists of voting and non-voting members from various groups within the Investment Manager’s organization, including operations and accounting, trading and investments, compliance, risk management and legal.
The accompanying Notes to Financial Statements are an integral part of this statement.
| 40 | Columbia Capital Allocation Portfolios | Annual Report 2020 |
Portfolio of Investments (continued)
Columbia Capital Allocation Moderate Conservative Portfolio, January 31, 2020
Fair value measurements (continued)
The Committee meets at least monthly to review and approve valuation matters, which may include a description of specific valuation determinations, data regarding pricing information received from approved pricing vendors and brokers and the results of Board-approved valuation control policies and procedures (the Policies). The Policies address, among other things, instances when market quotations are or are not readily available, including recommendations of third party pricing vendors and a determination of appropriate pricing methodologies; events that require specific valuation determinations and assessment of fair value techniques; securities with a potential for stale pricing, including those that are illiquid, restricted, or in default; and the effectiveness of third party pricing vendors, including periodic reviews of vendors. The Committee meets more frequently, as needed, to discuss additional valuation matters, which may include the need to review back-testing results, review time-sensitive information or approve related valuation actions. The Committee reports to the Board, with members of the Committee meeting with the Board at each of its regularly scheduled meetings to discuss valuation matters and actions during the period, similar to those described earlier.
The following table is a summary of the inputs used to value the Fund’s investments at January 31, 2020:
| | Level 1 ($) | Level 2 ($) | Level 3 ($) | Total ($) |
| Investments in Securities | | | | |
| Alternative Strategies Funds | 27,279,346 | — | — | 27,279,346 |
| Common Stocks | | | | |
| Communication Services | 99,687 | 569,239 | — | 668,926 |
| Consumer Discretionary | 547,311 | 1,185,249 | — | 1,732,560 |
| Consumer Staples | 271,664 | 1,088,956 | — | 1,360,620 |
| Energy | 140,321 | 452,517 | — | 592,838 |
| Financials | 834,281 | 1,922,897 | — | 2,757,178 |
| Health Care | 896,599 | 1,312,050 | — | 2,208,649 |
| Industrials | 752,253 | 1,579,573 | — | 2,331,826 |
| Information Technology | 773,284 | 623,370 | — | 1,396,654 |
| Materials | 172,713 | 687,123 | — | 859,836 |
| Real Estate | 353,597 | 333,286 | — | 686,883 |
| Utilities | 173,119 | 430,295 | — | 603,414 |
| Total Common Stocks | 5,014,829 | 10,184,555 | — | 15,199,384 |
| Equity Funds | 149,481,736 | — | — | 149,481,736 |
| Fixed Income Funds | 255,513,799 | — | — | 255,513,799 |
| Money Market Funds | 64,864,652 | — | — | 64,864,652 |
| Total Investments in Securities | 502,154,362 | 10,184,555 | — | 512,338,917 |
| Investments in Derivatives | | | | |
| Asset | | | | |
| Forward Foreign Currency Exchange Contracts | — | 4,101 | — | 4,101 |
| Futures Contracts | 2,122,681 | — | — | 2,122,681 |
| Swap Contracts | — | 25,595 | — | 25,595 |
| Liability | | | | |
| Forward Foreign Currency Exchange Contracts | — | (10) | — | (10) |
| Futures Contracts | (501,414) | — | — | (501,414) |
| Total | 503,775,629 | 10,214,241 | — | 513,989,870 |
See the Portfolio of Investments for all investment classifications not indicated in the table.
The Fund’s assets assigned to the Level 2 input category are generally valued using the market approach, in which a security’s value is determined through reference to prices and information from market transactions for similar or identical assets. These assets include certain foreign securities for which a third party statistical pricing service may be employed for purposes of fair market valuation. The model utilized by such third party statistical pricing service takes into account a security’s correlation to available market data including, but not limited to, intraday index, ADR, and exchange-traded fund movements.
Derivative instruments are valued at unrealized appreciation (depreciation).
The accompanying Notes to Financial Statements are an integral part of this statement.
Columbia Capital Allocation Portfolios | Annual Report 2020
| 41 |
Portfolio of Investments
Columbia Capital Allocation Moderate Portfolio, January 31, 2020
(Percentages represent value of investments compared to net assets)
Investments in securities
| Alternative Strategies Funds 3.9% |
| | Shares | Value ($) |
| Columbia Commodity Strategy Fund, Institutional 3 Class(a) | 3,112,256 | 12,915,862 |
| Columbia Multi Strategy Alternatives Fund, Institutional 3 Class(a),(b) | 468,858 | 3,450,790 |
| Columbia Multi-Asset Income Fund, Institutional 3 Class(a) | 4,337,011 | 41,982,257 |
Total Alternative Strategies Funds
(Cost $64,017,410) | 58,348,909 |
|
| Common Stocks 2.3% |
| Issuer | Shares | Value ($) |
| Communication Services 0.1% |
| Diversified Telecommunication Services 0.0% |
| Hellenic Telecommunications Organization SA | 2,931 | 43,773 |
| Nippon Telegraph & Telephone Corp. | 6,900 | 175,930 |
| Telekom Malaysia Bhd | 58,200 | 54,655 |
| Total | | 274,358 |
| Entertainment 0.0% |
| Square Enix Holdings Co., Ltd. | 600 | 29,454 |
| Toho Co., Ltd. | 1,600 | 58,942 |
| Total | | 88,396 |
| Interactive Media & Services 0.0% |
| Auto Trader Group PLC | 5,126 | 37,824 |
| DHI Group, Inc.(b) | 19,600 | 54,880 |
| Meet Group, Inc. (The)(b) | 26,700 | 142,311 |
| Momo, Inc., ADR | 1,837 | 56,212 |
| Tencent Holdings Ltd. | 700 | 33,383 |
| Yelp, Inc.(b) | 475 | 15,485 |
| Total | | 340,095 |
| Media 0.1% |
| Gray Television, Inc.(b) | 3,050 | 61,854 |
| Informa PLC | 3,403 | 34,762 |
| National CineMedia, Inc. | 7,300 | 53,874 |
| TechTarget, Inc.(b) | 4,900 | 124,411 |
| WPP PLC | 8,281 | 102,962 |
| Total | | 377,863 |
| Common Stocks (continued) |
| Issuer | Shares | Value ($) |
| Wireless Telecommunication Services 0.0% |
| Advanced Info Service PCL | 6,700 | 43,559 |
| Gogo(b) | 7,800 | 41,028 |
| Total | | 84,587 |
| Total Communication Services | 1,165,299 |
| Consumer Discretionary 0.3% |
| Auto Components 0.0% |
| Dana, Inc. | 2,050 | 31,590 |
| Hyundai Mobis Co., Ltd. | 52 | 9,944 |
| Magna International, Inc. | 3,272 | 165,875 |
| Modine Manufacturing Co.(b) | 6,250 | 43,937 |
| Total | | 251,346 |
| Automobiles 0.0% |
| BAIC Motor Corp., Ltd., Class H(c) | 144,000 | 70,977 |
| Fiat Chrysler Automobiles NV | 1,084 | 14,122 |
| Peugeot SA | 5,866 | 120,782 |
| Total | | 205,881 |
| Distributors 0.0% |
| Funko, Inc., Class A(b) | 6,100 | 91,683 |
| Diversified Consumer Services 0.0% |
| Collectors Universe, Inc. | 4,500 | 110,520 |
| K12, Inc.(b) | 4,500 | 72,630 |
| Perdoceo Education Corp.(b) | 4,650 | 82,677 |
| Total | | 265,827 |
| Hotels, Restaurants & Leisure 0.1% |
| Boyd Gaming Corp. | 600 | 17,910 |
| Brinker International, Inc. | 1,725 | 73,640 |
| Dine Brands Global, Inc. | 1,620 | 138,105 |
| Everi Holdings, Inc.(b) | 11,500 | 143,750 |
| Marriott Vacations Worldwide Corp. | 1,040 | 125,050 |
| SeaWorld Entertainment, Inc.(b) | 4,625 | 159,377 |
| Total | | 657,832 |
The accompanying Notes to Financial Statements are an integral part of this statement.
| 42 | Columbia Capital Allocation Portfolios | Annual Report 2020 |
Portfolio of Investments (continued)
Columbia Capital Allocation Moderate Portfolio, January 31, 2020
| Common Stocks (continued) |
| Issuer | Shares | Value ($) |
| Household Durables 0.1% |
| Berkeley Group Holdings PLC | 914 | 63,243 |
| M/I Homes, Inc.(b) | 2,325 | 103,207 |
| Sekisui House Ltd. | 6,700 | 144,065 |
| Sony Corp. | 3,000 | 209,781 |
| Taylor Morrison Home Corp., Class A(b) | 6,450 | 166,926 |
| Total | | 687,222 |
| Internet & Direct Marketing Retail 0.0% |
| Alibaba Group Holding Ltd., ADR(b) | 337 | 69,621 |
| Stamps.com, Inc.(b) | 1,110 | 82,684 |
| Total | | 152,305 |
| Leisure Products 0.0% |
| Malibu Boats, Inc., Class A(b) | 3,625 | 158,739 |
| MasterCraft Boat Holdings, Inc.(b) | 2,850 | 50,074 |
| Sturm Ruger & Co., Inc. | 1,400 | 69,328 |
| Total | | 278,141 |
| Specialty Retail 0.1% |
| Genesco, Inc.(b) | 2,350 | 92,402 |
| GNC Holdings, Inc., Class A(b) | 20,500 | 43,870 |
| Hibbett Sports, Inc.(b) | 4,200 | 104,076 |
| Lithia Motors, Inc., Class A | 910 | 123,432 |
| Petrobras Distribuidora SA | 2,900 | 19,529 |
| Rent-A-Center, Inc. | 2,820 | 82,147 |
| Restoration Hardware Holdings, Inc.(b) | 320 | 66,800 |
| Sleep Number Corp.(b) | 2,050 | 105,759 |
| Sportsman’s Warehouse Holdings, Inc.(b) | 13,100 | 84,888 |
| Tilly’s, Inc. | 2,000 | 17,000 |
| Zumiez, Inc.(b) | 2,750 | 85,718 |
| Total | | 825,621 |
| Textiles, Apparel & Luxury Goods 0.0% |
| Adidas AG | 131 | 41,411 |
| Burberry Group PLC | 2,868 | 73,536 |
| Deckers Outdoor Corp.(b) | 890 | 169,910 |
| Kering SA | 274 | 167,420 |
| Pandora A/S | 257 | 13,327 |
| Total | | 465,604 |
| Total Consumer Discretionary | 3,881,462 |
| Common Stocks (continued) |
| Issuer | Shares | Value ($) |
| Consumer Staples 0.1% |
| Beverages 0.0% |
| Coca-Cola European Partners PLC | 2,505 | 131,788 |
| Food & Staples Retailing 0.1% |
| Coles Group Ltd. | 5,591 | 61,350 |
| Ingles Markets, Inc., Class A | 2,925 | 121,943 |
| Koninklijke Ahold Delhaize NV | 6,953 | 170,637 |
| Loblaw Companies Ltd. | 100 | 5,232 |
| SpartanNash Co. | 7,700 | 93,786 |
| Welcia Holdings Co., Ltd. | 700 | 38,440 |
| Total | | 491,388 |
| Food Products 0.0% |
| JBS SA | 17,200 | 110,728 |
| John B. Sanfilippo & Son, Inc. | 1,480 | 124,764 |
| Nestlé SA, Registered Shares | 198 | 21,838 |
| Tingyi Cayman Islands Holding Corp. | 8,000 | 13,496 |
| Uni-President Enterprises Corp. | 29,000 | 69,092 |
| Total | | 339,918 |
| Household Products 0.0% |
| Kimberly-Clark de Mexico SAB de CV(b) | 9,226 | 19,086 |
| Personal Products 0.0% |
| Edgewell Personal Care Co.(b) | 2,425 | 62,613 |
| Medifast, Inc. | 1,120 | 108,226 |
| Usana Health Sciences, Inc.(b) | 1,360 | 83,912 |
| Total | | 254,751 |
| Tobacco 0.0% |
| British American Tobacco PLC | 4,083 | 180,040 |
| PT Gudang Garam Tbk | 7,500 | 30,559 |
| Swedish Match AB | 3,076 | 173,911 |
| Vector Group Ltd. | 2,625 | 34,492 |
| Total | | 419,002 |
| Total Consumer Staples | 1,655,933 |
The accompanying Notes to Financial Statements are an integral part of this statement.
Columbia Capital Allocation Portfolios | Annual Report 2020
| 43 |
Portfolio of Investments (continued)
Columbia Capital Allocation Moderate Portfolio, January 31, 2020
| Common Stocks (continued) |
| Issuer | Shares | Value ($) |
| Energy 0.1% |
| Energy Equipment & Services 0.0% |
| DMC Global Inc | 925 | 38,693 |
| Liberty Oilfield Services, Inc., Class A | 3,600 | 30,528 |
| Matrix Service Co.(b) | 6,100 | 122,732 |
| NexTier Oilfield Solutions, Inc.(b) | 22,300 | 114,845 |
| Total | | 306,798 |
| Oil, Gas & Consumable Fuels 0.1% |
| California Resources Corp.(b) | 5,200 | 38,168 |
| Canadian Natural Resources Ltd. | 2,000 | 56,249 |
| Cenovus Energy, Inc. | 4,000 | 34,819 |
| China Coal Energy Co., Ltd., Class H | 40,000 | 13,608 |
| Coal India Ltd. | 32,668 | 82,909 |
| CVR Energy, Inc. | 3,675 | 127,192 |
| Delek U.S. Holdings, Inc. | 2,900 | 79,634 |
| Denbury Resources, Inc.(b) | 6,600 | 6,501 |
| Dorian LPG Ltd.(b) | 1,200 | 15,744 |
| ENI SpA | 5,148 | 72,111 |
| Lukoil PJSC | 303 | 30,976 |
| Lundin Petroleum AB | 485 | 14,751 |
| Motor Oil Hellas Corinth Refineries SA | 1,256 | 26,670 |
| OMV AG | 660 | 32,798 |
| PT Bukit Asam Tbk | 53,500 | 8,595 |
| Royal Dutch Shell PLC, Class B | 358 | 9,407 |
| Southwestern Energy Co.(b) | 12,600 | 19,782 |
| Suncor Energy, Inc. | 5,000 | 152,826 |
| W&T Offshore, Inc.(b) | 5,200 | 21,528 |
| World Fuel Services Corp. | 1,950 | 76,284 |
| Yanzhou Coal Mining Co., Ltd., Class H | 100,000 | 73,784 |
| Total | | 994,336 |
| Total Energy | 1,301,134 |
| Financials 0.4% |
| Banks 0.2% |
| Atlantic Capital Bancshares, Inc.(b) | 1,000 | 18,870 |
| Bancorp, Inc. (The)(b) | 12,100 | 143,143 |
| Bank Leumi Le-Israel BM | 10,493 | 75,444 |
| BNP Paribas SA | 3,077 | 163,289 |
| Cathay General Bancorp | 4,250 | 153,255 |
| Common Stocks (continued) |
| Issuer | Shares | Value ($) |
| China Merchants Bank Co., Ltd., Class H | 7,000 | 33,751 |
| ConnectOne Bancorp, Inc. | 5,200 | 122,772 |
| Customers Bancorp, Inc.(b) | 5,650 | 120,797 |
| First BanCorp | 13,700 | 126,999 |
| Fulton Financial Corp. | 6,250 | 102,937 |
| Great Southern Bancorp, Inc. | 1,950 | 110,974 |
| Grupo Financiero Banorte SAB de CV, Class O | 21,027 | 129,586 |
| Hilltop Holdings, Inc. | 5,750 | 130,180 |
| Independent Bank Group, Inc. | 2,750 | 147,180 |
| International Bancshares Corp. | 3,665 | 144,401 |
| Investors Bancorp, Inc. | 3,500 | 42,298 |
| Israel Discount Bank Ltd. | 13,430 | 60,914 |
| Mediobanca Banca di Credito Finanziario SpA | 7,014 | 69,969 |
| Metropolitan Bank Holding Corp.(b) | 375 | 18,431 |
| Midland States Bancorp, Inc. | 2,650 | 70,013 |
| National Bank of Canada | 2,000 | 110,972 |
| Nicolet Bankshares, Inc.(b) | 910 | 64,292 |
| OFG Bancorp | 6,250 | 123,187 |
| Postal Savings Bank of China Co., Ltd.(c) | 125,000 | 77,781 |
| Powszechna Kasa Oszczednosci Bank Polski SA | 6,146 | 54,164 |
| Preferred Bank | 1,725 | 103,690 |
| Raiffeisen Bank International AG | 1,701 | 38,747 |
| RHB Bank Bhd | 74,400 | 103,303 |
| Shinhan Financial Group Co., Ltd. | 426 | 13,902 |
| Standard Bank Group Ltd. | 12,703 | 132,502 |
| Sumitomo Mitsui Financial Group, Inc. | 1,000 | 35,159 |
| Sumitomo Mitsui Trust Holdings, Inc. | 400 | 14,748 |
| United Community Banks, Inc. | 2,650 | 73,988 |
| Total | | 2,931,638 |
| Capital Markets 0.0% |
| Cohen & Steers, Inc. | 2,275 | 168,304 |
| Federated Hermes, Inc., Class B | 4,900 | 177,527 |
| Korea Investment Holdings Co., Ltd.(b) | 1,701 | 93,556 |
| Samsung Securities Co., Ltd. | 3,330 | 97,283 |
| Singapore Exchange | 1,600 | 10,151 |
| Waddell & Reed Financial, Inc., Class A | 2,550 | 40,749 |
| Total | | 587,570 |
The accompanying Notes to Financial Statements are an integral part of this statement.
| 44 | Columbia Capital Allocation Portfolios | Annual Report 2020 |
Portfolio of Investments (continued)
Columbia Capital Allocation Moderate Portfolio, January 31, 2020
| Common Stocks (continued) |
| Issuer | Shares | Value ($) |
| Consumer Finance 0.0% |
| Encore Capital Group, Inc.(b) | 3,725 | 126,464 |
| Enova International, Inc.(b) | 5,000 | 125,300 |
| Nelnet, Inc., Class A | 870 | 49,816 |
| Regional Management Corp.(b) | 4,425 | 121,909 |
| Total | | 423,489 |
| Insurance 0.1% |
| Ageas | 1,617 | 89,164 |
| Allianz SE, Registered Shares | 903 | 215,586 |
| American Equity Investment Life Holding Co. | 4,000 | 105,640 |
| Assicurazioni Generali SpA | 8,712 | 169,759 |
| AXA SA | 2,915 | 77,514 |
| CNP Assurances | 4,040 | 72,721 |
| Dai-ichi Life Holdings, Inc. | 1,400 | 20,778 |
| Employers Holdings, Inc. | 3,225 | 137,546 |
| Genworth Financial, Inc., Class A(b) | 14,100 | 57,810 |
| iA Financial Corp., Inc. | 400 | 22,013 |
| Manulife Financial Corp. | 600 | 11,688 |
| Selective Insurance Group, Inc. | 375 | 24,844 |
| Swiss Life Holding AG, Registered Shares | 297 | 149,294 |
| Universal Insurance Holdings, Inc. | 1,992 | 48,485 |
| Total | | 1,202,842 |
| Mortgage Real Estate Investment Trusts (REITS) 0.0% |
| Ares Commercial Real Estate Corp. | 3,300 | 53,922 |
| Ellington Financial, Inc. | 6,450 | 117,841 |
| PennyMac Mortgage Investment Trust | 1,000 | 23,250 |
| Total | | 195,013 |
| Thrifts & Mortgage Finance 0.1% |
| Essent Group Ltd. | 3,675 | 182,317 |
| Federal Agricultural Mortgage Corp. | 1,650 | 125,895 |
| Flagstar Bancorp, Inc. | 3,550 | 125,102 |
| Meta Financial Group, Inc. | 3,775 | 140,506 |
| NMI Holdings, Inc., Class A(b) | 4,950 | 158,004 |
| Radian Group, Inc. | 7,750 | 189,797 |
| Total | | 921,621 |
| Total Financials | 6,262,173 |
| Common Stocks (continued) |
| Issuer | Shares | Value ($) |
| Health Care 0.4% |
| Biotechnology 0.1% |
| ACADIA Pharmaceuticals, Inc.(b) | 2,940 | 117,424 |
| Acceleron Pharma, Inc.(b) | 550 | 49,929 |
| Arcutis Biotherapeutics, Inc.(b) | 3,330 | 72,594 |
| Arena Pharmaceuticals, Inc.(b) | 2,640 | 120,622 |
| Arrowhead Pharmaceuticals, Inc.(b) | 1,100 | 46,101 |
| Atara Biotherapeutics, Inc.(b) | 2,190 | 28,974 |
| BeiGene Ltd., ADR(b) | 175 | 26,663 |
| Black Diamond Therapeutics, Inc.(b) | 2,031 | 76,162 |
| bluebird bio, Inc.(b) | 830 | 66,143 |
| Blueprint Medicines Corp.(b) | 990 | 62,815 |
| CSL Ltd. | 153 | 31,467 |
| Dynavax Technologies Corp.(b) | 10,035 | 50,677 |
| Fate Therapeutics, Inc.(b) | 2,350 | 59,596 |
| Global Blood Therapeutics, Inc.(b) | 670 | 43,724 |
| Gossamer Bio, Inc.(b) | 2,067 | 27,450 |
| Immunomedics, Inc.(b) | 6,830 | 126,833 |
| Insmed, Inc.(b) | 3,630 | 74,560 |
| Karuna Therapeutics, Inc.(b) | 210 | 19,931 |
| Mirati Therapeutics, Inc.(b) | 885 | 76,845 |
| Precision BioSciences, Inc.(b) | 3,924 | 31,745 |
| Rubius Therapeutics, Inc.(b) | 3,100 | 24,180 |
| Sage Therapeutics, Inc.(b) | 1,385 | 91,798 |
| Sarepta Therapeutics, Inc.(b) | 575 | 66,677 |
| SpringWorks Therapeutics, Inc.(b) | 2,983 | 93,905 |
| TCR2 Therapeutics, Inc.(b) | 3,910 | 57,399 |
| Turning Point Therapeutics, Inc.(b) | 1,477 | 86,404 |
| Ultragenyx Pharmaceutical, Inc.(b) | 590 | 31,004 |
| uniQure NV(b) | 1,180 | 67,921 |
| Total | | 1,729,543 |
| Health Care Equipment & Supplies 0.1% |
| Angiodynamics, Inc.(b) | 6,700 | 92,259 |
| CryoLife, Inc.(b) | 2,475 | 73,607 |
| Integer Holdings Corp.(b) | 1,870 | 159,698 |
| Lantheus Holdings, Inc.(b) | 7,050 | 123,445 |
| Meridian Bioscience, Inc. | 7,200 | 70,848 |
| Natus Medical, Inc.(b) | 4,025 | 125,942 |
| NuVasive, Inc.(b) | 990 | 76,349 |
The accompanying Notes to Financial Statements are an integral part of this statement.
Columbia Capital Allocation Portfolios | Annual Report 2020
| 45 |
Portfolio of Investments (continued)
Columbia Capital Allocation Moderate Portfolio, January 31, 2020
| Common Stocks (continued) |
| Issuer | Shares | Value ($) |
| Quidel Corp.(b) | 1,235 | 94,848 |
| Varex Imaging Corp.(b) | 3,900 | 107,835 |
| Total | | 924,831 |
| Health Care Providers & Services 0.1% |
| Corvel Corp.(b) | 1,060 | 97,064 |
| Cross Country Healthcare, Inc.(b) | 6,400 | 63,360 |
| Magellan Health, Inc.(b) | 2,020 | 147,885 |
| Owens & Minor, Inc. | 3,500 | 21,910 |
| Tenet Healthcare Corp.(b) | 1,325 | 41,923 |
| Total | | 372,142 |
| Health Care Technology 0.0% |
| HealthStream, Inc.(b) | 4,750 | 121,363 |
| Omnicell, Inc.(b) | 1,980 | 160,934 |
| Total | | 282,297 |
| Life Sciences Tools & Services 0.0% |
| Medpace Holdings, Inc.(b) | 1,855 | 158,695 |
| Syneos Health, Inc.(b) | 3,050 | 187,148 |
| Total | | 345,843 |
| Pharmaceuticals 0.1% |
| Aerie Pharmaceuticals, Inc.(b) | 1,940 | 39,731 |
| Amphastar Pharmaceuticals, Inc.(b) | 5,650 | 106,842 |
| Astellas Pharma, Inc. | 10,600 | 187,303 |
| GlaxoSmithKline PLC | 9,028 | 211,972 |
| GW Pharmaceuticals PLC, ADR(b) | 810 | 93,579 |
| Horizon Therapeutics PLC(b) | 1,410 | 48,631 |
| Novartis AG, Registered Shares | 2,486 | 234,848 |
| Novo Nordisk A/S, Class B | 260 | 15,827 |
| Odonate Therapeutics, Inc.(b) | 2,400 | 70,080 |
| Prestige Consumer Healthcare, Inc.(b) | 3,525 | 142,974 |
| Reata Pharmaceuticals, Inc., Class A(b) | 710 | 155,341 |
| Roche Holding AG, Genusschein Shares | 879 | 294,877 |
| Supernus Pharmaceuticals, Inc.(b) | 1,575 | 36,020 |
| Total | | 1,638,025 |
| Total Health Care | 5,292,681 |
| Industrials 0.3% |
| Aerospace & Defense 0.0% |
| Safran SA | 80 | 12,899 |
| Common Stocks (continued) |
| Issuer | Shares | Value ($) |
| Air Freight & Logistics 0.0% |
| Echo Global Logistics, Inc.(b) | 3,400 | 65,892 |
| Radiant Logistics, Inc.(b) | 13,500 | 65,205 |
| Total | | 131,097 |
| Airlines 0.0% |
| Air Canada(b) | 3,900 | 130,638 |
| Qantas Airways Ltd. | 8,854 | 37,539 |
| Skywest, Inc. | 1,175 | 64,825 |
| Total | | 233,002 |
| Building Products 0.1% |
| American Woodmark Corp.(b) | 1,510 | 165,571 |
| Builders FirstSource, Inc.(b) | 6,750 | 167,366 |
| Caesarstone Ltd. | 5,800 | 75,864 |
| CSW Industrials, Inc. | 1,885 | 143,034 |
| Gibraltar Industries, Inc.(b) | 2,940 | 160,289 |
| Quanex Building Products Corp. | 7,550 | 133,786 |
| Total | | 845,910 |
| Commercial Services & Supplies 0.0% |
| Brady Corp., Class A | 1,675 | 92,745 |
| Deluxe Corp. | 1,475 | 71,095 |
| Herman Miller, Inc. | 3,250 | 125,612 |
| HNI Corp. | 3,275 | 117,802 |
| Total | | 407,254 |
| Construction & Engineering 0.1% |
| ACS Actividades de Construccion y Servicios SA | 3,449 | 114,669 |
| CIMIC Group Ltd. | 4,582 | 88,658 |
| EMCOR Group, Inc. | 1,950 | 160,231 |
| Great Lakes Dredge & Dock Corp.(b) | 12,420 | 130,037 |
| MasTec, Inc.(b) | 2,550 | 147,263 |
| Samsung Engineering Co., Ltd.(b) | 5,115 | 72,771 |
| Shimizu Corp. | 14,100 | 144,621 |
| Skanska AB, Class B | 654 | 15,138 |
| Total | | 873,388 |
| Electrical Equipment 0.0% |
| Atkore International Group, Inc.(b) | 4,025 | 159,793 |
| Industrial Conglomerates 0.0% |
| CITIC Ltd. | 73,000 | 82,547 |
The accompanying Notes to Financial Statements are an integral part of this statement.
| 46 | Columbia Capital Allocation Portfolios | Annual Report 2020 |
Portfolio of Investments (continued)
Columbia Capital Allocation Moderate Portfolio, January 31, 2020
| Common Stocks (continued) |
| Issuer | Shares | Value ($) |
| Machinery 0.1% |
| GEA Group AG | 1,145 | 34,284 |
| Lydall, Inc.(b) | 4,300 | 87,892 |
| Mitsubishi Heavy Industries Ltd. | 3,400 | 124,023 |
| Mueller Industries, Inc. | 4,600 | 134,182 |
| Rexnord Corp.(b) | 2,600 | 84,890 |
| Sinotruk Hong Kong Ltd. | 28,500 | 48,936 |
| SPX Corp.(b) | 2,725 | 133,716 |
| Weichai Power Co., Ltd., Class H | 52,000 | 91,038 |
| Total | | 738,961 |
| Marine 0.0% |
| Costamare, Inc. | 14,400 | 114,192 |
| Professional Services 0.0% |
| Adecco Group AG, Registered Shares | 691 | 40,484 |
| Barrett Business Services, Inc. | 1,400 | 115,962 |
| FTI Consulting, Inc.(b) | 610 | 73,237 |
| Heidrick & Struggles International, Inc. | 3,800 | 107,996 |
| Kforce, Inc. | 3,775 | 139,864 |
| Wolters Kluwer NV | 319 | 23,970 |
| Total | | 501,513 |
| Road & Rail 0.0% |
| ArcBest Corp. | 2,245 | 50,086 |
| Aurizon Holdings Ltd. | 17,717 | 63,507 |
| Total | | 113,593 |
| Trading Companies & Distributors 0.0% |
| BMC Stock Holdings, Inc.(b) | 5,500 | 160,518 |
| Foundation Building Materials, Inc.(b) | 6,000 | 106,980 |
| GMS, Inc.(b) | 5,025 | 134,268 |
| MRC Global, Inc.(b) | 10,200 | 114,852 |
| Veritiv Corp.(b) | 7,950 | 111,936 |
| Total | | 628,554 |
| Transportation Infrastructure 0.0% |
| International Container Terminal Services, Inc. | 19,280 | 49,153 |
| Kamigumi Co., Ltd. | 3,400 | 72,650 |
| Total | | 121,803 |
| Total Industrials | 4,964,506 |
| Common Stocks (continued) |
| Issuer | Shares | Value ($) |
| Information Technology 0.3% |
| Communications Equipment 0.0% |
| ADTRAN, Inc. | 5,750 | 52,037 |
| Comtech Telecommunications Corp. | 2,775 | 80,225 |
| Telefonaktiebolaget LM Ericsson, Class B | 1,094 | 8,602 |
| Total | | 140,864 |
| Electronic Equipment, Instruments & Components 0.1% |
| Badger Meter, Inc. | 300 | 17,718 |
| Benchmark Electronics, Inc. | 4,325 | 133,123 |
| Methode Electronics, Inc. | 3,600 | 117,900 |
| Rogers Corp.(b) | 1,180 | 138,945 |
| Sanmina Corp.(b) | 4,700 | 149,648 |
| Vishay Intertechnology, Inc. | 7,900 | 160,291 |
| Vishay Precision Group, Inc.(b) | 3,725 | 128,662 |
| Zhen Ding Technology Holding Ltd. | 10,000 | 38,676 |
| Total | | 884,963 |
| IT Services 0.1% |
| Cardtronics PLC, Class A(b) | 3,625 | 163,125 |
| Cass Information Systems, Inc. | 510 | 27,550 |
| EVERTEC, Inc. | 4,250 | 142,673 |
| Hackett Group | 2,050 | 31,683 |
| KBR, Inc. | 4,850 | 131,920 |
| MAXIMUS, Inc. | 880 | 63,140 |
| NIC, Inc. | 6,100 | 120,353 |
| Otsuka Corp. | 900 | 35,095 |
| Perspecta, Inc. | 6,000 | 168,420 |
| TTEC Holdings, Inc. | 2,725 | 108,237 |
| Wipro Ltd. | 13,481 | 44,840 |
| Total | | 1,037,036 |
| Semiconductors & Semiconductor Equipment 0.1% |
| Advantest Corp. | 300 | 15,651 |
| Amkor Technology, Inc.(b) | 11,170 | 125,663 |
| Cirrus Logic, Inc.(b) | 220 | 16,898 |
| GlobalWafers Co., Ltd. | 4,000 | 51,597 |
| Novatek Microelectronics | 14,000 | 98,716 |
| Realtek Semiconductor Corp. | 10,000 | 80,345 |
| Synaptics, Inc.(b) | 2,460 | 164,057 |
| Tokyo Electron Ltd. | 900 | 197,952 |
The accompanying Notes to Financial Statements are an integral part of this statement.
Columbia Capital Allocation Portfolios | Annual Report 2020
| 47 |
Portfolio of Investments (continued)
Columbia Capital Allocation Moderate Portfolio, January 31, 2020
| Common Stocks (continued) |
| Issuer | Shares | Value ($) |
| Ultra Clean Holdings, Inc.(b) | 5,750 | 132,307 |
| Xperi Corp. | 7,250 | 116,653 |
| Total | | 999,839 |
| Software 0.0% |
| CommVault Systems, Inc.(b) | 3,225 | 145,189 |
| j2 Global, Inc. | 1,945 | 186,448 |
| Progress Software Corp. | 3,475 | 156,827 |
| Qualys, Inc.(b) | 1,860 | 159,476 |
| SPS Commerce, Inc.(b) | 2,460 | 139,802 |
| Total | | 787,742 |
| Technology Hardware, Storage & Peripherals 0.0% |
| Chicony Electronics Co., Ltd. | 36,000 | 101,366 |
| FUJIFILM Holdings Corp. | 300 | 14,899 |
| Lenovo Group Ltd. | 100,000 | 65,250 |
| Lite-On Technology Corp. | 30,000 | 46,476 |
| Samsung Electronics Co., Ltd. | 4,816 | 223,140 |
| Total | | 451,131 |
| Total Information Technology | 4,301,575 |
| Materials 0.1% |
| Chemicals 0.0% |
| Chase Corp. | 460 | 42,306 |
| Covestro AG | 1,160 | 48,886 |
| Innospec, Inc. | 1,170 | 117,854 |
| Koppers Holdings, Inc.(b) | 925 | 29,027 |
| Solvay SA | 250 | 25,910 |
| Total | | 263,983 |
| Construction Materials 0.0% |
| Anhui Conch Cement Co., Ltd., Class H | 10,000 | 63,827 |
| Asia Cement Corp. | 23,000 | 34,211 |
| U.S. Concrete, Inc.(b) | 3,125 | 111,219 |
| Total | | 209,257 |
| Metals & Mining 0.1% |
| Anglo American PLC | 1,046 | 27,294 |
| BHP Group Ltd. | 6,889 | 176,661 |
| Commercial Metals Co. | 3,950 | 81,173 |
| Fortescue Metals Group Ltd. | 12,969 | 96,072 |
| Kirkland Lake Gold Ltd. | 400 | 16,403 |
| Materion Corp. | 2,180 | 118,374 |
| Common Stocks (continued) |
| Issuer | Shares | Value ($) |
| MMC Norilsk Nickel PJSC | 191 | 61,921 |
| Rio Tinto PLC | 3,339 | 178,551 |
| Schnitzer Steel Industries, Inc., Class A | 5,600 | 90,048 |
| Vale SA | 900 | 10,587 |
| Total | | 857,084 |
| Paper & Forest Products 0.0% |
| Schweitzer-Mauduit International, Inc. | 3,650 | 127,859 |
| Verso Corp., Class A(b) | 8,000 | 134,800 |
| Total | | 262,659 |
| Total Materials | 1,592,983 |
| Real Estate 0.1% |
| Equity Real Estate Investment Trusts (REITS) 0.1% |
| Alexander’s, Inc. | 50 | 16,134 |
| American Assets Trust, Inc. | 2,850 | 129,846 |
| Ashford Hospitality Trust, Inc. | 32,900 | 80,934 |
| CoreCivic, Inc. | 6,900 | 110,055 |
| CorEnergy Infrastructure Trust, Inc. | 2,866 | 130,690 |
| EastGroup Properties, Inc. | 1,360 | 185,055 |
| Fortress REIT Ltd., Class A | 65,781 | 80,865 |
| GEO Group, Inc. (The) | 3,250 | 51,350 |
| Independence Realty Trust, Inc. | 5,200 | 76,284 |
| Investors Real Estate Trust | 1,903 | 140,251 |
| Klepierre | 1,338 | 45,481 |
| Lexington Realty Trust | 13,800 | 152,766 |
| PS Business Parks, Inc. | 973 | 163,036 |
| Retail Value, Inc. | 3,753 | 123,361 |
| Ryman Hospitality Properties, Inc. | 380 | 32,311 |
| Uniti Group, Inc. | 15,500 | 98,115 |
| Washington Prime Group, Inc. | 9,600 | 28,896 |
| Xenia Hotels & Resorts, Inc. | 4,750 | 88,778 |
| Total | | 1,734,208 |
| Real Estate Management & Development 0.0% |
| Aldar Properties PJSC | 33,269 | 20,096 |
| China Aoyuan Group Ltd. | 17,000 | 22,655 |
| Daito Trust Construction Co., Ltd. | 100 | 11,780 |
| Emaar Properties PJSC | 49,489 | 54,002 |
| Logan Property Holdings Co., Ltd. | 28,000 | 42,324 |
The accompanying Notes to Financial Statements are an integral part of this statement.
| 48 | Columbia Capital Allocation Portfolios | Annual Report 2020 |
Portfolio of Investments (continued)
Columbia Capital Allocation Moderate Portfolio, January 31, 2020
| Common Stocks (continued) |
| Issuer | Shares | Value ($) |
| RE/MAX Holdings, Inc., Class A | 450 | 17,226 |
| RMR Group, Inc. (The), Class A | 2,600 | 119,782 |
| Total | | 287,865 |
| Total Real Estate | 2,022,073 |
| Utilities 0.1% |
| Electric Utilities 0.0% |
| Endesa SA | 1,154 | 31,686 |
| Enel SpA | 5,100 | 44,453 |
| Manila Electric Co. | 3,980 | 20,045 |
| Otter Tail Corp. | 275 | 14,729 |
| Portland General Electric Co. | 3,235 | 198,952 |
| Total | | 309,865 |
| Gas Utilities 0.1% |
| Chesapeake Utilities Corp. | 1,410 | 135,656 |
| Naturgy Energy Group SA | 5,591 | 147,461 |
| PT Perusahaan Gas Negara Persero Tbk | 636,900 | 78,936 |
| Southwest Gas Holdings, Inc. | 1,950 | 147,245 |
| Total | | 509,298 |
| Independent Power and Renewable Electricity Producers 0.0% |
| Colbun SA | 315,957 | 45,994 |
| Multi-Utilities 0.0% |
| Avista Corp. | 2,975 | 151,279 |
| NorthWestern Corp. | 1,855 | 142,780 |
| Unitil Corp. | 1,025 | 63,232 |
| Total | | 357,291 |
| Total Utilities | 1,222,448 |
Total Common Stocks
(Cost $32,070,241) | 33,662,267 |
|
| Equity Funds 40.6% |
| | Shares | Value ($) |
| International 11.0% |
| Columbia Contrarian Europe Fund, Institutional 3 Class(a) | 6,044,726 | 42,010,847 |
| Columbia Emerging Markets Fund, Institutional 3 Class(a) | 2,559,923 | 35,685,319 |
| Columbia Overseas Core Fund, Institutional 3 Class(a) | 3,334,736 | 32,647,070 |
| Columbia Overseas Value Fund, Institutional 3 Class(a) | 1,980,857 | 18,540,820 |
| Equity Funds (continued) |
| | Shares | Value ($) |
| Columbia Pacific/Asia Fund, Institutional 3 Class(a) | 3,561,733 | 35,831,036 |
| Total | 164,715,092 |
| U.S. Large Cap 28.2% |
| Columbia Contrarian Core Fund, Institutional 3 Class(a) | 2,408,985 | 66,150,725 |
| Columbia Disciplined Core Fund, Institutional 3 Class(a) | 5,205,619 | 62,311,255 |
| Columbia Disciplined Growth Fund, Institutional 3 Class(a) | 6,326,962 | 60,295,947 |
| Columbia Disciplined Value Fund, Institutional 3 Class(a) | 9,409,345 | 85,907,321 |
| Columbia Large Cap Growth Fund, Institutional 3 Class(a),(b) | 462,515 | 21,793,693 |
| Columbia Select Large Cap Equity Fund, Institutional 3 Class(a) | 3,994,903 | 60,083,348 |
| Columbia Select Large Cap Growth Fund, Institutional 3 Class(a),(b) | 2,435,485 | 34,267,279 |
| Columbia Select Large Cap Value Fund, Institutional 3 Class(a) | 1,138,655 | 29,775,830 |
| Total | 420,585,398 |
| U.S. Small Cap 1.4% |
| Columbia Small Cap Index Fund, Institutional 3 Class(a) | 964,290 | 21,243,313 |
Total Equity Funds
(Cost $537,574,818) | 606,543,803 |
|
| Fixed Income Funds 43.5% |
| | |
| Emerging Markets 1.6% |
| Columbia Emerging Markets Bond Fund, Institutional 3 Class(a) | 2,070,031 | 23,805,356 |
| High Yield 7.0% |
| Columbia High Yield Bond Fund, Institutional 3 Class(a) | 2,373,641 | 7,049,713 |
| Columbia Income Opportunities Fund, Institutional 3 Class(a) | 9,683,066 | 97,314,815 |
| Total | 104,364,528 |
| Inflation Protected Securities 1.0% |
| Columbia Inflation Protected Securities Fund, Institutional 3 Class(a),(b) | 1,476,692 | 14,796,451 |
The accompanying Notes to Financial Statements are an integral part of this statement.
Columbia Capital Allocation Portfolios | Annual Report 2020
| 49 |
Portfolio of Investments (continued)
Columbia Capital Allocation Moderate Portfolio, January 31, 2020
| Fixed Income Funds (continued) |
| | Shares | Value ($) |
| Investment Grade 33.9% |
| Columbia Corporate Income Fund, Institutional 3 Class(a) | 5,693,909 | 62,177,484 |
| Columbia Limited Duration Credit Fund, Institutional 3 Class(a) | 3,328,118 | 33,780,404 |
| Columbia Mortgage Opportunities Fund, Institutional 3 Class(a) | 2,369,716 | 24,076,313 |
| Columbia Quality Income Fund, Institutional 3 Class(a) | 11,510,486 | 64,458,721 |
| Columbia Short Term Bond Fund, Institutional 3 Class(a) | 6,262,653 | 62,877,039 |
| Columbia Total Return Bond Fund, Institutional 3 Class(a) | 20,089,529 | 188,238,886 |
| Columbia U.S. Treasury Index Fund, Institutional 3 Class(a) | 6,095,590 | 71,318,406 |
| Total | 506,927,253 |
Total Fixed Income Funds
(Cost $634,843,973) | 649,893,588 |
| Preferred Stocks 0.0% |
| Issuer | | Shares | Value ($) |
| Utilities 0.0% |
| Electric Utilities 0.0% |
| Cia Energetica de Minas Gerais | | 4,300 | 15,021 |
| Total Utilities | 15,021 |
Total Preferred Stocks
(Cost $14,823) | 15,021 |
| Money Market Funds 9.0% |
| | Shares | Value ($) |
| Columbia Government Money Market Fund, Institutional 3 Class, 1.151%(a),(d) | 12,497,298 | 12,497,298 |
| Columbia Short-Term Cash Fund, 1.648%(a),(d) | 121,408,505 | 121,408,505 |
Total Money Market Funds
(Cost $133,896,135) | 133,905,803 |
Total Investments in Securities
(Cost: $1,402,417,400) | 1,482,369,391 |
| Other Assets & Liabilities, Net | | 10,612,105 |
| Net Assets | 1,492,981,496 |
At January 31, 2020, securities and/or cash totaling $13,436,621 were pledged as collateral.
Investments in derivatives
| Forward foreign currency exchange contracts |
Currency to
be sold | Currency to
be purchased | Counterparty | Settlement
date | Unrealized
appreciation ($) | Unrealized
depreciation ($) |
| 127,000 AUD | 85,785 USD | Morgan Stanley | 03/26/2020 | 691 | — |
| 49,000 EUR | 54,109 USD | Morgan Stanley | 03/26/2020 | — | (409) |
| 351,000 ILS | 101,947 USD | Morgan Stanley | 03/26/2020 | — | (2) |
| 252,515,000 KRW | 214,252 USD | Morgan Stanley | 03/26/2020 | 2,975 | — |
| 810,000 MXN | 42,983 USD | Morgan Stanley | 03/26/2020 | 441 | — |
| 394,000 MYR | 96,254 USD | Morgan Stanley | 03/26/2020 | 431 | — |
| 5,628,000 TWD | 187,643 USD | Morgan Stanley | 03/26/2020 | 1,896 | — |
| 64,015 USD | 271,000 BRL | Morgan Stanley | 03/26/2020 | — | (908) |
| 53,664 USD | 363,000 DKK | Morgan Stanley | 03/26/2020 | 404 | — |
| 160,397 USD | 123,000 GBP | Morgan Stanley | 03/26/2020 | 2,250 | — |
| 107,247 USD | 7,689,000 INR | Morgan Stanley | 03/26/2020 | — | (538) |
| 32,183 USD | 295,000 NOK | Morgan Stanley | 03/26/2020 | — | (104) |
The accompanying Notes to Financial Statements are an integral part of this statement.
| 50 | Columbia Capital Allocation Portfolios | Annual Report 2020 |
Portfolio of Investments (continued)
Columbia Capital Allocation Moderate Portfolio, January 31, 2020
| Forward foreign currency exchange contracts (continued) |
Currency to
be sold | Currency to
be purchased | Counterparty | Settlement
date | Unrealized
appreciation ($) | Unrealized
depreciation ($) |
| 86,010 USD | 117,000 SGD | Morgan Stanley | 03/26/2020 | — | (258) |
| 1,261,000 ZAR | 85,588 USD | Morgan Stanley | 03/26/2020 | 2,143 | — |
| Total | | | | 11,231 | (2,219) |
| Long futures contracts |
| Description | Number of
contracts | Expiration
date | Trading
currency | Notional
amount | Value/Unrealized
appreciation ($) | Value/Unrealized
depreciation ($) |
| CAC40 Index | 72 | 02/2020 | EUR | 4,178,880 | — | (178,996) |
| EURO STOXX 50 Index | 292 | 03/2020 | EUR | 10,625,880 | — | (400,044) |
| FTSE 100 Index | 150 | 03/2020 | GBP | 10,826,250 | — | (656,474) |
| FTSE/MIB Index | 72 | 03/2020 | EUR | 8,358,840 | — | (195,320) |
| MSCI EAFE Index Future | 353 | 03/2020 | USD | 34,885,225 | — | (446,757) |
| Russell 2000 Index E-mini | 2 | 03/2020 | USD | 161,470 | — | (3,405) |
| S&P 500 Index E-mini | 713 | 03/2020 | USD | 114,935,600 | 2,780,714 | — |
| U.S. Treasury 10-Year Note | 401 | 03/2020 | USD | 52,794,156 | 857,589 | — |
| U.S. Treasury 5-Year Note | 399 | 03/2020 | USD | 48,007,805 | 532,281 | — |
| U.S. Ultra Treasury Bond | 159 | 03/2020 | USD | 30,796,313 | 1,129,830 | — |
| Total | | | | | 5,300,414 | (1,880,996) |
| Short futures contracts |
| Description | Number of
contracts | Expiration
date | Trading
currency | Notional
amount | Value/Unrealized
appreciation ($) | Value/Unrealized
depreciation ($) |
| MSCI Emerging Markets Index | (469) | 03/2020 | USD | (24,624,845) | 768,490 | — |
| Russell 2000 Index E-mini | (32) | 03/2020 | USD | (2,583,520) | 35,201 | — |
| TOPIX Index | (90) | 03/2020 | JPY | (1,511,100,000) | 341,733 | — |
| Total | | | | | 1,145,424 | — |
| Cleared credit default swap contracts - sell protection |
Reference
entity | Counterparty | Maturity
date | Receive
fixed
rate
(%) | Payment
frequency | Implied
credit
spread
(%)* | Notional
currency | Notional
amount | Value
($) | Upfront
payments
($) | Upfront
receipts
($) | Unrealized
appreciation
($) | Unrealized
depreciation
($) |
| Markit CDX Emerging Markets Index, Series 32 | Morgan Stanley | 12/20/2024 | 1.000 | Quarterly | 1.972 | USD | 22,965,000 | 78,506 | — | — | 78,506 | — |
| * | Implied credit spreads, represented in absolute terms, utilized in determining the market value of credit default swap agreements on corporate or sovereign issues as of period end serve as an indicator of the current status of the payment/performance risk and represent the likelihood or risk of default for the credit derivative. The implied credit spread of a particular referenced entity reflects the cost of buying/selling protection and may include upfront payments required to be made to enter into the agreement. Wider credit spreads represent a deterioration of the referenced entity’s credit soundness and a greater likelihood or risk of default or other credit event occurring as defined under the terms of the agreement. |
Notes to Portfolio of Investments
| (a) | As defined in the Investment Company Act of 1940, an affiliated company is one in which the Fund owns 5% or more of the company’s outstanding voting securities, or a company which is under common ownership or control with the Fund. Holdings and transactions in these affiliated companies during the year ended January 31, 2020 are as follows: |
| Issuer | Beginning
shares | Shares
purchased | Shares
sold | Ending
shares | Capital gain
distributions —
affiliated
issuers ($) | Realized gain
(loss) —
affiliated
issuers ($) | Net change in
unrealized
appreciation
(depreciation) —
affiliated
issuers ($) | Dividends —
affiliated
issuers ($) | Value —
affiliated
issuers
at end of
period ($) |
| Columbia Commodity Strategy Fund, Institutional 3 Class |
| | 3,124,092 | 102,181 | (114,017) | 3,112,256 | — | (156,992) | (689,882) | 168,023 | 12,915,862 |
| Columbia Contrarian Core Fund, Institutional 3 Class |
| | 2,769,016 | 146,178 | (506,209) | 2,408,985 | 3,041,098 | 3,299,818 | 6,662,837 | 766,499 | 66,150,725 |
The accompanying Notes to Financial Statements are an integral part of this statement.
Columbia Capital Allocation Portfolios | Annual Report 2020
| 51 |
Portfolio of Investments (continued)
Columbia Capital Allocation Moderate Portfolio, January 31, 2020
Notes to Portfolio of Investments (continued)
| Issuer | Beginning
shares | Shares
purchased | Shares
sold | Ending
shares | Capital gain
distributions —
affiliated
issuers ($) | Realized gain
(loss) —
affiliated
issuers ($) | Net change in
unrealized
appreciation
(depreciation) —
affiliated
issuers ($) | Dividends —
affiliated
issuers ($) | Value —
affiliated
issuers
at end of
period ($) |
| Columbia Contrarian Europe Fund, Institutional 3 Class |
| | 6,898,163 | 159,608 | (1,013,045) | 6,044,726 | — | 1,222,308 | 4,384,163 | 1,037,957 | 42,010,847 |
| Columbia Corporate Income Fund, Institutional 3 Class |
| | 6,181,014 | 227,884 | (714,989) | 5,693,909 | — | 170,900 | 6,022,839 | 2,046,775 | 62,177,484 |
| Columbia Disciplined Core Fund, Institutional 3 Class |
| | 5,442,297 | 518,907 | (755,585) | 5,205,619 | 5,111,318 | 4,748,389 | (1,810,678) | 933,755 | 62,311,255 |
| Columbia Disciplined Growth Fund, Institutional 3 Class |
| | 6,999,353 | 1,287,537 | (1,959,928) | 6,326,962 | 3,744,261 | (550,574) | 5,756,123 | 407,715 | 60,295,947 |
| Columbia Disciplined Value Fund, Institutional 3 Class |
| | 9,806,640 | 2,684,019 | (3,081,314) | 9,409,345 | 7,490,926 | 1,853,461 | (2,900,530) | 1,909,887 | 85,907,321 |
| Columbia Emerging Markets Bond Fund, Institutional 3 Class |
| | 2,168,043 | 103,729 | (201,741) | 2,070,031 | — | 83,495 | 985,841 | 888,749 | 23,805,356 |
| Columbia Emerging Markets Fund, Institutional 3 Class |
| | 3,061,939 | 19,947 | (521,963) | 2,559,923 | — | 2,010,229 | 3,477,136 | 190,951 | 35,685,319 |
| Columbia Government Money Market Fund, Institutional 3 Class, 1.151% |
| | 13,145,286 | 479,948 | (1,127,936) | 12,497,298 | 4,076 | — | — | 239,432 | 12,497,298 |
| Columbia High Yield Bond Fund, Institutional 3 Class |
| | 2,582,894 | 159,546 | (368,799) | 2,373,641 | — | (8,716) | 389,004 | 379,068 | 7,049,713 |
| Columbia Income Opportunities Fund, Institutional 3 Class |
| | 10,095,885 | 534,130 | (946,949) | 9,683,066 | — | 147,780 | 5,113,179 | 4,901,806 | 97,314,815 |
| Columbia Inflation Protected Securities Fund, Institutional 3 Class |
| | 1,576,694 | 9,506 | (109,508) | 1,476,692 | — | (58,134) | 1,331,390 | — | 14,796,451 |
| Columbia Large Cap Growth Fund, Institutional 3 Class |
| | 541,001 | 38,567 | (117,053) | 462,515 | 1,681,707 | 2,854,701 | 812,805 | — | 21,793,693 |
| Columbia Limited Duration Credit Fund, Institutional 3 Class |
| | 3,427,134 | 110,910 | (209,926) | 3,328,118 | — | 37,330 | 1,456,564 | 876,205 | 33,780,404 |
| Columbia Mortgage Opportunities Fund, Institutional 3 Class |
| | 2,381,862 | 120,150 | (132,296) | 2,369,716 | 194,744 | 25,945 | 463,735 | 838,537 | 24,076,313 |
| Columbia Multi Strategy Alternatives Fund, Institutional 3 Class |
| | 468,858 | — | — | 468,858 | — | — | (276,625) | — | 3,450,790 |
| Columbia Multi-Asset Income Fund, Institutional 3 Class |
| | 4,083,799 | 253,212 | — | 4,337,011 | — | — | 2,481,187 | 2,379,342 | 41,982,257 |
| Columbia Overseas Core Fund, Institutional 3 Class |
| | 3,610,483 | 142,182 | (417,929) | 3,334,736 | 126,903 | (187,547) | 2,523,002 | 1,196,585 | 32,647,070 |
| Columbia Overseas Value Fund, Institutional 3 Class |
| | 2,118,039 | 84,778 | (221,960) | 1,980,857 | 37,786 | 125,104 | 704,684 | 715,681 | 18,540,820 |
| Columbia Pacific/Asia Fund, Institutional 3 Class |
| | 3,938,288 | 267,427 | (643,982) | 3,561,733 | 1,738,028 | 1,314,516 | 1,578,828 | 879,405 | 35,831,036 |
| Columbia Quality Income Fund, Institutional 3 Class |
| | 11,817,020 | 441,281 | (747,815) | 11,510,486 | — | 7,113 | 2,582,050 | 1,946,105 | 64,458,721 |
| Columbia Select Large Cap Equity Fund, Institutional 3 Class |
| | 4,550,296 | 242,264 | (797,657) | 3,994,903 | 2,606,927 | 1,863,119 | 6,069,149 | 738,602 | 60,083,348 |
The accompanying Notes to Financial Statements are an integral part of this statement.
| 52 | Columbia Capital Allocation Portfolios | Annual Report 2020 |
Portfolio of Investments (continued)
Columbia Capital Allocation Moderate Portfolio, January 31, 2020
Notes to Portfolio of Investments (continued)
| Issuer | Beginning
shares | Shares
purchased | Shares
sold | Ending
shares | Capital gain
distributions —
affiliated
issuers ($) | Realized gain
(loss) —
affiliated
issuers ($) | Net change in
unrealized
appreciation
(depreciation) —
affiliated
issuers ($) | Dividends —
affiliated
issuers ($) | Value —
affiliated
issuers
at end of
period ($) |
| Columbia Select Large Cap Growth Fund, Institutional 3 Class |
| | 2,233,285 | 674,338 | (472,138) | 2,435,485 | 9,272,126 | 776,020 | (3,346,360) | — | 34,267,279 |
| Columbia Select Large Cap Value Fund, Institutional 3 Class |
| | 1,210,948 | 80,422 | (152,715) | 1,138,655 | 1,463,357 | 2,088,916 | (1,001,834) | 596,911 | 29,775,830 |
| Columbia Short Term Bond Fund, Institutional 3 Class |
| | 6,038,199 | 224,454 | — | 6,262,653 | — | — | 913,843 | 2,245,410 | 62,877,039 |
| Columbia Short-Term Cash Fund, 1.648% |
| | 101,586,963 | 118,952,009 | (99,130,467) | 121,408,505 | — | (909) | 12,222 | 2,437,747 | 121,408,505 |
| Columbia Small Cap Index Fund, Institutional 3 Class |
| | 902,578 | 61,712 | — | 964,290 | 1,101,333 | — | (90,868) | 276,844 | 21,243,313 |
| Columbia Total Return Bond Fund, Institutional 3 Class |
| | 20,774,287 | 1,102,021 | (1,786,779) | 20,089,529 | 2,425,228 | 312,786 | 8,664,742 | 6,301,001 | 188,238,886 |
| Columbia U.S. Treasury Index Fund, Institutional 3 Class |
| | 6,424,786 | 195,674 | (524,870) | 6,095,590 | — | 199,803 | 4,333,464 | 1,471,566 | 71,318,406 |
| Total | | | | | 40,039,818 | 22,178,861 | 56,602,010 | 36,770,558 | 1,448,692,103 |
| (b) | Non-income producing investment. |
| (c) | Represents privately placed and other securities and instruments exempt from Securities and Exchange Commission registration (collectively, private placements), such as Section 4(a)(2) and Rule 144A eligible securities, which are often sold only to qualified institutional buyers. The Fund may invest in private placements determined to be liquid as well as those determined to be illiquid. Private placements may be determined to be liquid under guidelines established by the Fund’s Board of Trustees. At January 31, 2020, the total value of these securities amounted to $148,758, which represents 0.01% of total net assets. |
| (d) | The rate shown is the seven-day current annualized yield at January 31, 2020. |
Abbreviation Legend
| ADR | American Depositary Receipt |
Currency Legend
| AUD | Australian Dollar |
| BRL | Brazilian Real |
| DKK | Danish Krone |
| EUR | Euro |
| GBP | British Pound |
| ILS | New Israeli Sheqel |
| INR | Indian Rupee |
| JPY | Japanese Yen |
| KRW | South Korean Won |
| MXN | Mexican Peso |
| MYR | Malaysian Ringgit |
| NOK | Norwegian Krone |
| SGD | Singapore Dollar |
| TWD | New Taiwan Dollar |
| USD | US Dollar |
| ZAR | South African Rand |
The accompanying Notes to Financial Statements are an integral part of this statement.
Columbia Capital Allocation Portfolios | Annual Report 2020
| 53 |
Portfolio of Investments (continued)
Columbia Capital Allocation Moderate Portfolio, January 31, 2020
Fair value measurements
The Fund categorizes its fair value measurements according to a three-level hierarchy that maximizes the use of observable inputs and minimizes the use of unobservable inputs by prioritizing that the most observable input be used when available. Observable inputs are those that market participants would use in pricing an investment based on market data obtained from sources independent of the reporting entity. Unobservable inputs are those that reflect the Fund’s assumptions about the information market participants would use in pricing an investment. An investment’s level within the fair value hierarchy is based on the lowest level of any input that is deemed significant to the asset’s or liability’s fair value measurement. The input levels are not necessarily an indication of the risk or liquidity associated with investments at that level. For example, certain U.S. government securities are generally high quality and liquid, however, they are reflected as Level 2 because the inputs used to determine fair value may not always be quoted prices in an active market.
Fair value inputs are summarized in the three broad levels listed below:
| ■ | Level 1 — Valuations based on quoted prices for investments in active markets that the Fund has the ability to access at the measurement date. Valuation adjustments are not applied to Level 1 investments. |
| ■ | Level 2 — Valuations based on other significant observable inputs (including quoted prices for similar securities, interest rates, prepayment speeds, credit risks, etc.). |
| ■ | Level 3 — Valuations based on significant unobservable inputs (including the Fund’s own assumptions and judgment in determining the fair value of investments). |
Inputs that are used in determining fair value of an investment may include price information, credit data, volatility statistics, and other factors. These inputs can be either observable or unobservable. The availability of observable inputs can vary between investments, and is affected by various factors such as the type of investment, and the volume and level of activity for that investment or similar investments in the marketplace. The inputs will be considered by the Investment Manager, along with any other relevant factors in the calculation of an investment’s fair value. The Fund uses prices and inputs that are current as of the measurement date, which may include periods of market dislocations. During these periods, the availability of prices and inputs may be reduced for many investments. This condition could cause an investment to be reclassified between the various levels within the hierarchy.
Foreign equity securities actively traded in markets where there is a significant delay in the local close relative to the New York Stock Exchange are classified as Level 2. The values of these securities may include an adjustment to reflect the impact of market movements following the close of local trading, as described in Note 2 to the financial statements – Security valuation.
Investments falling into the Level 3 category are primarily supported by quoted prices from brokers and dealers participating in the market for those investments. However, these may be classified as Level 3 investments due to lack of market transparency and corroboration to support these quoted prices. Additionally, valuation models may be used as the pricing source for any remaining investments classified as Level 3. These models may rely on one or more significant unobservable inputs and/or significant assumptions by the Investment Manager. Inputs used in valuations may include, but are not limited to, financial statement analysis, capital account balances, discount rates and estimated cash flows, and comparable company data.
Under the direction of the Fund’s Board of Trustees (the Board), the Investment Manager’s Valuation Committee (the Committee) is responsible for overseeing the valuation procedures approved by the Board. The Committee consists of voting and non-voting members from various groups within the Investment Manager’s organization, including operations and accounting, trading and investments, compliance, risk management and legal.
The Committee meets at least monthly to review and approve valuation matters, which may include a description of specific valuation determinations, data regarding pricing information received from approved pricing vendors and brokers and the results of Board-approved valuation control policies and procedures (the Policies). The Policies address, among other things, instances when market quotations are or are not readily available, including recommendations of third party pricing vendors and a determination of appropriate pricing methodologies; events that require specific valuation determinations and assessment of fair value techniques; securities with a potential for stale pricing, including those that are illiquid, restricted, or in default; and the effectiveness of third party pricing vendors, including periodic reviews of vendors. The Committee meets more frequently, as needed, to discuss additional valuation matters, which may include the need to review back-testing results, review time-sensitive information or approve related valuation actions. The Committee reports to the Board, with members of the Committee meeting with the Board at each of its regularly scheduled meetings to discuss valuation matters and actions during the period, similar to those described earlier.
The following table is a summary of the inputs used to value the Fund’s investments at January 31, 2020:
| | Level 1 ($) | Level 2 ($) | Level 3 ($) | Total ($) |
| Investments in Securities | | | | |
| Alternative Strategies Funds | 58,348,909 | — | — | 58,348,909 |
| Common Stocks | | | | |
| Communication Services | 550,055 | 615,244 | — | 1,165,299 |
| Consumer Discretionary | 2,952,854 | 928,608 | — | 3,881,462 |
| Consumer Staples | 896,570 | 759,363 | — | 1,655,933 |
| Energy | 935,525 | 365,609 | — | 1,301,134 |
| Financials | 4,392,694 | 1,869,479 | — | 6,262,173 |
| Health Care | 4,316,387 | 976,294 | — | 5,292,681 |
| Industrials | 3,847,619 | 1,116,887 | — | 4,964,506 |
| Information Technology | 3,278,970 | 1,022,605 | — | 4,301,575 |
| Materials | 879,650 | 713,333 | — | 1,592,983 |
| Real Estate | 1,744,870 | 277,203 | — | 2,022,073 |
| Utilities | 899,867 | 322,581 | — | 1,222,448 |
| Total Common Stocks | 24,695,061 | 8,967,206 | — | 33,662,267 |
| Equity Funds | 606,543,803 | — | — | 606,543,803 |
| Fixed Income Funds | 649,893,588 | — | — | 649,893,588 |
The accompanying Notes to Financial Statements are an integral part of this statement.
| 54 | Columbia Capital Allocation Portfolios | Annual Report 2020 |
Portfolio of Investments (continued)
Columbia Capital Allocation Moderate Portfolio, January 31, 2020
Fair value measurements (continued)
| | Level 1 ($) | Level 2 ($) | Level 3 ($) | Total ($) |
| Preferred Stocks | | | | |
| Utilities | 15,021 | — | — | 15,021 |
| Total Preferred Stocks | 15,021 | — | — | 15,021 |
| Money Market Funds | 133,905,803 | — | — | 133,905,803 |
| Total Investments in Securities | 1,473,402,185 | 8,967,206 | — | 1,482,369,391 |
| Investments in Derivatives | | | | |
| Asset | | | | |
| Forward Foreign Currency Exchange Contracts | — | 11,231 | — | 11,231 |
| Futures Contracts | 6,445,838 | — | — | 6,445,838 |
| Swap Contracts | — | 78,506 | — | 78,506 |
| Liability | | | | |
| Forward Foreign Currency Exchange Contracts | — | (2,219) | — | (2,219) |
| Futures Contracts | (1,880,996) | — | — | (1,880,996) |
| Total | 1,477,967,027 | 9,054,724 | — | 1,487,021,751 |
See the Portfolio of Investments for all investment classifications not indicated in the table.
The Fund’s assets assigned to the Level 2 input category are generally valued using the market approach, in which a security’s value is determined through reference to prices and information from market transactions for similar or identical assets. These assets include certain foreign securities for which a third party statistical pricing service may be employed for purposes of fair market valuation. The model utilized by such third party statistical pricing service takes into account a security’s correlation to available market data including, but not limited to, intraday index, ADR, and exchange-traded fund movements.
Derivative instruments are valued at unrealized appreciation (depreciation).
Forward foreign currency exchange contracts, futures contracts and swap contracts are valued at unrealized appreciation (depreciation).
The accompanying Notes to Financial Statements are an integral part of this statement.
Columbia Capital Allocation Portfolios | Annual Report 2020
| 55 |
Portfolio of Investments
Columbia Capital Allocation Moderate Aggressive Portfolio, January 31, 2020
(Percentages represent value of investments compared to net assets)
Investments in securities
| Alternative Strategies Funds 3.9% |
| | Shares | Value ($) |
| Columbia Commodity Strategy Fund, Institutional 3 Class(a) | 4,610,900 | 19,135,237 |
| Columbia Multi Strategy Alternatives Fund, Institutional 3 Class(a),(b) | 468,857 | 3,450,790 |
| Columbia Multi-Asset Income Fund, Institutional 3 Class(a) | 5,879,855 | 56,916,993 |
Total Alternative Strategies Funds
(Cost $87,336,123) | 79,503,020 |
|
| Common Stocks 1.7% |
| Issuer | Shares | Value ($) |
| Communication Services 0.0% |
| Diversified Telecommunication Services 0.0% |
| Hellenic Telecommunications Organization SA | 2,044 | 30,526 |
| Nippon Telegraph & Telephone Corp. | 4,800 | 122,386 |
| Telekom Malaysia Bhd | 40,500 | 38,033 |
| Total | | 190,945 |
| Entertainment 0.0% |
| Square Enix Holdings Co., Ltd. | 400 | 19,636 |
| Toho Co., Ltd. | 1,100 | 40,523 |
| Total | | 60,159 |
| Interactive Media & Services 0.0% |
| Auto Trader Group PLC | 3,569 | 26,335 |
| DHI Group, Inc.(b) | 21,700 | 60,760 |
| Meet Group, Inc. (The)(b) | 29,700 | 158,301 |
| Momo, Inc., ADR | 1,281 | 39,199 |
| Tencent Holdings Ltd. | 500 | 23,845 |
| Yelp, Inc.(b) | 500 | 16,300 |
| Total | | 324,740 |
| Media 0.0% |
| Gray Television, Inc.(b) | 3,400 | 68,952 |
| Informa PLC | 2,373 | 24,240 |
| National CineMedia, Inc. | 8,100 | 59,778 |
| TechTarget, Inc.(b) | 5,450 | 138,376 |
| WPP PLC | 5,774 | 71,791 |
| Total | | 363,137 |
| Common Stocks (continued) |
| Issuer | Shares | Value ($) |
| Wireless Telecommunication Services 0.0% |
| Advanced Info Service PCL | 4,700 | 30,556 |
| Gogo(b) | 8,600 | 45,236 |
| Total | | 75,792 |
| Total Communication Services | 1,014,773 |
| Consumer Discretionary 0.2% |
| Auto Components 0.0% |
| Dana, Inc. | 2,300 | 35,443 |
| Hyundai Mobis Co., Ltd. | 36 | 6,884 |
| Magna International, Inc. | 2,278 | 115,484 |
| Modine Manufacturing Co.(b) | 6,900 | 48,507 |
| Total | | 206,318 |
| Automobiles 0.0% |
| BAIC Motor Corp., Ltd., Class H(c) | 100,500 | 49,536 |
| Fiat Chrysler Automobiles NV | 755 | 9,835 |
| Peugeot SA | 4,091 | 84,235 |
| Total | | 143,606 |
| Distributors 0.0% |
| Funko, Inc., Class A(b) | 6,750 | 101,453 |
| Diversified Consumer Services 0.0% |
| Collectors Universe, Inc. | 4,950 | 121,572 |
| K12, Inc.(b) | 5,000 | 80,700 |
| Perdoceo Education Corp.(b) | 5,200 | 92,456 |
| Total | | 294,728 |
| Hotels, Restaurants & Leisure 0.1% |
| Boyd Gaming Corp. | 650 | 19,403 |
| Brinker International, Inc. | 1,925 | 82,178 |
| Dine Brands Global, Inc. | 1,800 | 153,450 |
| Everi Holdings, Inc.(b) | 12,800 | 160,000 |
| Marriott Vacations Worldwide Corp. | 1,150 | 138,276 |
| SeaWorld Entertainment, Inc.(b) | 5,150 | 177,469 |
| Total | | 730,776 |
The accompanying Notes to Financial Statements are an integral part of this statement.
| 56 | Columbia Capital Allocation Portfolios | Annual Report 2020 |
Portfolio of Investments (continued)
Columbia Capital Allocation Moderate Aggressive Portfolio, January 31, 2020
| Common Stocks (continued) |
| Issuer | Shares | Value ($) |
| Household Durables 0.0% |
| Berkeley Group Holdings PLC | 637 | 44,077 |
| M/I Homes, Inc.(b) | 2,600 | 115,414 |
| Sekisui House Ltd. | 4,700 | 101,060 |
| Sony Corp. | 2,100 | 146,846 |
| Taylor Morrison Home Corp., Class A(b) | 7,150 | 185,042 |
| Total | | 592,439 |
| Internet & Direct Marketing Retail 0.0% |
| Alibaba Group Holding Ltd., ADR(b) | 235 | 48,548 |
| Stamps.com, Inc.(b) | 1,230 | 91,623 |
| Total | | 140,171 |
| Leisure Products 0.0% |
| Malibu Boats, Inc., Class A(b) | 4,025 | 176,255 |
| MasterCraft Boat Holdings, Inc.(b) | 3,150 | 55,345 |
| Sturm Ruger & Co., Inc. | 1,550 | 76,756 |
| Total | | 308,356 |
| Specialty Retail 0.1% |
| Genesco, Inc.(b) | 2,625 | 103,215 |
| GNC Holdings, Inc., Class A(b) | 22,800 | 48,792 |
| Hibbett Sports, Inc.(b) | 4,650 | 115,227 |
| Lithia Motors, Inc., Class A | 1,010 | 136,996 |
| Petrobras Distribuidora SA | 2,000 | 13,469 |
| Rent-A-Center, Inc. | 3,130 | 91,177 |
| Restoration Hardware Holdings, Inc.(b) | 355 | 74,106 |
| Sleep Number Corp.(b) | 2,275 | 117,367 |
| Sportsman’s Warehouse Holdings, Inc.(b) | 14,500 | 93,960 |
| Tilly’s, Inc. | 2,200 | 18,700 |
| Zumiez, Inc.(b) | 3,050 | 95,069 |
| Total | | 908,078 |
| Textiles, Apparel & Luxury Goods 0.0% |
| Adidas AG | 91 | 28,767 |
| Burberry Group PLC | 1,999 | 51,255 |
| Deckers Outdoor Corp.(b) | 990 | 189,001 |
| Kering SA | 191 | 116,705 |
| Pandora A/S | 179 | 9,282 |
| Total | | 395,010 |
| Total Consumer Discretionary | 3,820,935 |
| Common Stocks (continued) |
| Issuer | Shares | Value ($) |
| Consumer Staples 0.1% |
| Beverages 0.0% |
| Coca-Cola European Partners PLC | 1,746 | 91,857 |
| Food & Staples Retailing 0.1% |
| Coles Group Ltd. | 3,897 | 42,762 |
| Ingles Markets, Inc., Class A | 3,250 | 135,492 |
| Koninklijke Ahold Delhaize NV | 4,850 | 119,026 |
| Loblaw Companies Ltd. | 100 | 5,232 |
| SpartanNash Co. | 8,600 | 104,748 |
| Welcia Holdings Co., Ltd. | 500 | 27,457 |
| Total | | 434,717 |
| Food Products 0.0% |
| China Milk Products Group Ltd.(b),(d),(e) | 322,000 | 0 |
| JBS SA | 12,000 | 77,252 |
| John B. Sanfilippo & Son, Inc. | 1,640 | 138,252 |
| Nestlé SA, Registered Shares | 138 | 15,220 |
| Tingyi Cayman Islands Holding Corp. | 6,000 | 10,122 |
| Uni-President Enterprises Corp. | 20,000 | 47,650 |
| Total | | 288,496 |
| Household Products 0.0% |
| Kimberly-Clark de Mexico SAB de CV(b) | 6,423 | 13,288 |
| Personal Products 0.0% |
| Edgewell Personal Care Co.(b) | 2,700 | 69,714 |
| Medifast, Inc. | 1,240 | 119,821 |
| Usana Health Sciences, Inc.(b) | 1,505 | 92,859 |
| Total | | 282,394 |
| Tobacco 0.0% |
| British American Tobacco PLC | 2,847 | 125,538 |
| PT Gudang Garam Tbk | 5,200 | 21,187 |
| Swedish Match AB | 2,145 | 121,274 |
| Vector Group Ltd. | 2,940 | 38,632 |
| Total | | 306,631 |
| Total Consumer Staples | 1,417,383 |
The accompanying Notes to Financial Statements are an integral part of this statement.
Columbia Capital Allocation Portfolios | Annual Report 2020
| 57 |
Portfolio of Investments (continued)
Columbia Capital Allocation Moderate Aggressive Portfolio, January 31, 2020
| Common Stocks (continued) |
| Issuer | Shares | Value ($) |
| Energy 0.1% |
| Energy Equipment & Services 0.0% |
| DMC Global Inc | 1,025 | 42,876 |
| Liberty Oilfield Services, Inc., Class A | 4,000 | 33,920 |
| Matrix Service Co.(b) | 6,750 | 135,810 |
| NexTier Oilfield Solutions, Inc.(b) | 24,800 | 127,720 |
| Total | | 340,326 |
| Oil, Gas & Consumable Fuels 0.1% |
| California Resources Corp.(b) | 5,775 | 42,388 |
| Canadian Natural Resources Ltd. | 1,400 | 39,374 |
| Cenovus Energy, Inc. | 2,800 | 24,374 |
| China Coal Energy Co., Ltd., Class H | 28,000 | 9,526 |
| Coal India Ltd. | 22,783 | 57,822 |
| CVR Energy, Inc. | 4,075 | 141,036 |
| Delek U.S. Holdings, Inc. | 3,200 | 87,872 |
| Denbury Resources, Inc.(b) | 7,300 | 7,191 |
| Dorian LPG Ltd.(b) | 1,300 | 17,056 |
| ENI SpA | 3,588 | 50,259 |
| Lukoil PJSC | 211 | 21,570 |
| Lundin Petroleum AB | 338 | 10,280 |
| Motor Oil Hellas Corinth Refineries SA | 876 | 18,601 |
| OMV AG | 460 | 22,859 |
| PT Bukit Asam Tbk | 37,300 | 5,993 |
| Royal Dutch Shell PLC, Class B | 250 | 6,569 |
| Southwestern Energy Co.(b) | 13,900 | 21,823 |
| Suncor Energy, Inc. | 3,500 | 106,978 |
| W&T Offshore, Inc.(b) | 5,700 | 23,598 |
| World Fuel Services Corp. | 2,175 | 85,086 |
| Yanzhou Coal Mining Co., Ltd., Class H | 70,000 | 51,649 |
| Total | | 851,904 |
| Total Energy | 1,192,230 |
| Financials 0.3% |
| Banks 0.1% |
| Atlantic Capital Bancshares, Inc.(b) | 1,100 | 20,757 |
| Bancorp, Inc. (The)(b) | 13,400 | 158,522 |
| Bank Leumi Le-Israel BM | 7,318 | 52,616 |
| BNP Paribas SA | 2,145 | 113,830 |
| Cathay General Bancorp | 4,700 | 169,482 |
| Common Stocks (continued) |
| Issuer | Shares | Value ($) |
| China Merchants Bank Co., Ltd., Class H | 5,000 | 24,108 |
| ConnectOne Bancorp, Inc. | 5,800 | 136,938 |
| Customers Bancorp, Inc.(b) | 6,290 | 134,480 |
| First BanCorp | 15,300 | 141,831 |
| Fulton Financial Corp. | 6,900 | 113,643 |
| Great Southern Bancorp, Inc. | 2,150 | 122,356 |
| Grupo Financiero Banorte SAB de CV, Class O | 14,639 | 90,218 |
| Hilltop Holdings, Inc. | 6,350 | 143,764 |
| Independent Bank Group, Inc. | 3,050 | 163,236 |
| International Bancshares Corp. | 4,065 | 160,161 |
| Investors Bancorp, Inc. | 3,900 | 47,131 |
| Israel Discount Bank Ltd. | 9,368 | 42,490 |
| Mediobanca Banca di Credito Finanziario SpA | 4,889 | 48,771 |
| Metropolitan Bank Holding Corp.(b) | 400 | 19,660 |
| Midland States Bancorp, Inc. | 2,950 | 77,939 |
| National Bank of Canada | 1,400 | 77,680 |
| Nicolet Bankshares, Inc.(b) | 1,000 | 70,650 |
| OFG Bancorp | 6,900 | 135,999 |
| Postal Savings Bank of China Co., Ltd.(c) | 87,000 | 54,135 |
| Powszechna Kasa Oszczednosci Bank Polski SA | 4,279 | 37,710 |
| Preferred Bank | 1,925 | 115,712 |
| Raiffeisen Bank International AG | 1,186 | 27,016 |
| RHB Bank Bhd | 51,800 | 71,923 |
| Shinhan Financial Group Co., Ltd. | 297 | 9,692 |
| Standard Bank Group Ltd. | 8,853 | 92,344 |
| Sumitomo Mitsui Financial Group, Inc. | 700 | 24,612 |
| Sumitomo Mitsui Trust Holdings, Inc. | 300 | 11,061 |
| United Community Banks, Inc. | 2,950 | 82,364 |
| Total | | 2,792,831 |
| Capital Markets 0.0% |
| Cohen & Steers, Inc. | 2,525 | 186,799 |
| Federated Hermes, Inc., Class B | 5,425 | 196,548 |
| Korea Investment Holdings Co., Ltd.(b) | 1,186 | 65,231 |
| Samsung Securities Co., Ltd. | 2,322 | 67,835 |
| Singapore Exchange | 1,100 | 6,979 |
| Waddell & Reed Financial, Inc., Class A | 2,800 | 44,744 |
| Total | | 568,136 |
The accompanying Notes to Financial Statements are an integral part of this statement.
| 58 | Columbia Capital Allocation Portfolios | Annual Report 2020 |
Portfolio of Investments (continued)
Columbia Capital Allocation Moderate Aggressive Portfolio, January 31, 2020
| Common Stocks (continued) |
| Issuer | Shares | Value ($) |
| Consumer Finance 0.0% |
| Encore Capital Group, Inc.(b) | 4,125 | 140,044 |
| Enova International, Inc.(b) | 5,550 | 139,083 |
| Nelnet, Inc., Class A | 950 | 54,397 |
| Regional Management Corp.(b) | 4,900 | 134,995 |
| Total | | 468,519 |
| Insurance 0.1% |
| Ageas | 1,127 | 62,144 |
| Allianz SE, Registered Shares | 630 | 150,408 |
| American Equity Investment Life Holding Co. | 4,400 | 116,204 |
| Assicurazioni Generali SpA | 6,059 | 118,064 |
| AXA SA | 2,032 | 54,034 |
| CNP Assurances | 2,817 | 50,707 |
| Dai-ichi Life Holdings, Inc. | 1,000 | 14,841 |
| Employers Holdings, Inc. | 3,575 | 152,474 |
| Genworth Financial, Inc., Class A(b) | 15,700 | 64,370 |
| iA Financial Corp., Inc. | 300 | 16,510 |
| Manulife Financial Corp. | 400 | 7,792 |
| Selective Insurance Group, Inc. | 400 | 26,500 |
| Swiss Life Holding AG, Registered Shares | 207 | 104,054 |
| Universal Insurance Holdings, Inc. | 2,173 | 52,891 |
| Total | | 990,993 |
| Mortgage Real Estate Investment Trusts (REITS) 0.0% |
| Ares Commercial Real Estate Corp. | 3,700 | 60,458 |
| Ellington Financial, Inc. | 7,150 | 130,630 |
| PennyMac Mortgage Investment Trust | 1,100 | 25,575 |
| Total | | 216,663 |
| Thrifts & Mortgage Finance 0.1% |
| Essent Group Ltd. | 4,075 | 202,161 |
| Federal Agricultural Mortgage Corp. | 1,830 | 139,629 |
| Flagstar Bancorp, Inc. | 3,950 | 139,198 |
| Meta Financial Group, Inc. | 4,175 | 155,393 |
| NMI Holdings, Inc., Class A(b) | 5,500 | 175,560 |
| Radian Group, Inc. | 8,600 | 210,614 |
| Total | | 1,022,555 |
| Total Financials | 6,059,697 |
| Common Stocks (continued) |
| Issuer | Shares | Value ($) |
| Health Care 0.3% |
| Biotechnology 0.1% |
| ACADIA Pharmaceuticals, Inc.(b) | 3,260 | 130,204 |
| Acceleron Pharma, Inc.(b) | 610 | 55,376 |
| Arcutis Biotherapeutics, Inc.(b) | 3,696 | 80,573 |
| Arena Pharmaceuticals, Inc.(b) | 2,940 | 134,329 |
| Arrowhead Pharmaceuticals, Inc.(b) | 1,220 | 51,130 |
| Atara Biotherapeutics, Inc.(b) | 2,430 | 32,149 |
| BeiGene Ltd., ADR(b) | 122 | 18,588 |
| Black Diamond Therapeutics, Inc.(b) | 2,255 | 84,562 |
| bluebird bio, Inc.(b) | 920 | 73,315 |
| Blueprint Medicines Corp.(b) | 1,090 | 69,160 |
| CSL Ltd. | 107 | 22,006 |
| Dynavax Technologies Corp.(b) | 11,145 | 56,282 |
| Fate Therapeutics, Inc.(b) | 2,610 | 66,190 |
| Global Blood Therapeutics, Inc.(b) | 740 | 48,292 |
| Gossamer Bio, Inc.(b) | 2,294 | 30,464 |
| Immunomedics, Inc.(b) | 7,580 | 140,761 |
| Insmed, Inc.(b) | 4,029 | 82,756 |
| Karuna Therapeutics, Inc.(b) | 240 | 22,778 |
| Mirati Therapeutics, Inc.(b) | 990 | 85,962 |
| Precision BioSciences, Inc.(b) | 4,356 | 35,240 |
| Rubius Therapeutics, Inc.(b) | 3,440 | 26,832 |
| Sage Therapeutics, Inc.(b) | 1,540 | 102,071 |
| Sarepta Therapeutics, Inc.(b) | 635 | 73,635 |
| SpringWorks Therapeutics, Inc.(b) | 3,314 | 104,325 |
| TCR2 Therapeutics, Inc.(b) | 4,340 | 63,711 |
| Turning Point Therapeutics, Inc.(b) | 1,638 | 95,823 |
| Ultragenyx Pharmaceutical, Inc.(b) | 660 | 34,683 |
| uniQure NV(b) | 1,305 | 75,116 |
| Total | | 1,896,313 |
| Health Care Equipment & Supplies 0.1% |
| Angiodynamics, Inc.(b) | 7,400 | 101,898 |
| CryoLife, Inc.(b) | 2,750 | 81,785 |
| Integer Holdings Corp.(b) | 2,075 | 177,205 |
| Lantheus Holdings, Inc.(b) | 7,800 | 136,578 |
| Meridian Bioscience, Inc. | 8,000 | 78,720 |
| Natus Medical, Inc.(b) | 4,500 | 140,805 |
| NuVasive, Inc.(b) | 1,100 | 84,832 |
The accompanying Notes to Financial Statements are an integral part of this statement.
Columbia Capital Allocation Portfolios | Annual Report 2020
| 59 |
Portfolio of Investments (continued)
Columbia Capital Allocation Moderate Aggressive Portfolio, January 31, 2020
| Common Stocks (continued) |
| Issuer | Shares | Value ($) |
| Quidel Corp.(b) | 1,375 | 105,600 |
| Varex Imaging Corp.(b) | 4,350 | 120,278 |
| Total | | 1,027,701 |
| Health Care Providers & Services 0.0% |
| Corvel Corp.(b) | 1,170 | 107,137 |
| Cross Country Healthcare, Inc.(b) | 7,100 | 70,290 |
| Magellan Health, Inc.(b) | 2,245 | 164,356 |
| Owens & Minor, Inc. | 3,800 | 23,788 |
| Tenet Healthcare Corp.(b) | 1,475 | 46,669 |
| Total | | 412,240 |
| Health Care Technology 0.0% |
| HealthStream, Inc.(b) | 5,300 | 135,415 |
| Omnicell, Inc.(b) | 2,200 | 178,816 |
| Total | | 314,231 |
| Life Sciences Tools & Services 0.0% |
| Medpace Holdings, Inc.(b) | 2,060 | 176,233 |
| Syneos Health, Inc.(b) | 3,375 | 207,090 |
| Total | | 383,323 |
| Pharmaceuticals 0.1% |
| Aerie Pharmaceuticals, Inc.(b) | 2,140 | 43,827 |
| Amphastar Pharmaceuticals, Inc.(b) | 6,300 | 119,133 |
| Astellas Pharma, Inc. | 7,400 | 130,759 |
| GlaxoSmithKline PLC | 6,296 | 147,827 |
| GW Pharmaceuticals PLC, ADR(b) | 900 | 103,977 |
| Horizon Therapeutics PLC(b) | 1,570 | 54,149 |
| Novartis AG, Registered Shares | 1,733 | 163,713 |
| Novo Nordisk A/S, Class B | 181 | 11,018 |
| Odonate Therapeutics, Inc.(b) | 2,700 | 78,840 |
| Prestige Consumer Healthcare, Inc.(b) | 3,925 | 159,198 |
| Reata Pharmaceuticals, Inc., Class A(b) | 790 | 172,844 |
| Roche Holding AG, Genusschein Shares | 613 | 205,642 |
| Supernus Pharmaceuticals, Inc.(b) | 1,720 | 39,337 |
| Total | | 1,430,264 |
| Total Health Care | 5,464,072 |
| Industrials 0.2% |
| Aerospace & Defense 0.0% |
| Safran SA | 56 | 9,029 |
| Common Stocks (continued) |
| Issuer | Shares | Value ($) |
| Air Freight & Logistics 0.0% |
| Echo Global Logistics, Inc.(b) | 3,800 | 73,644 |
| Radiant Logistics, Inc.(b) | 15,000 | 72,450 |
| Total | | 146,094 |
| Airlines 0.0% |
| Air Canada(b) | 2,700 | 90,442 |
| Qantas Airways Ltd. | 6,171 | 26,164 |
| Skywest, Inc. | 1,300 | 71,721 |
| Total | | 188,327 |
| Building Products 0.1% |
| American Woodmark Corp.(b) | 1,680 | 184,212 |
| Builders FirstSource, Inc.(b) | 7,450 | 184,723 |
| Caesarstone Ltd. | 6,450 | 84,366 |
| CSW Industrials, Inc. | 2,100 | 159,348 |
| Gibraltar Industries, Inc.(b) | 3,275 | 178,553 |
| Quanex Building Products Corp. | 8,400 | 148,848 |
| Total | | 940,050 |
| Commercial Services & Supplies 0.0% |
| Brady Corp., Class A | 1,875 | 103,819 |
| Deluxe Corp. | 1,650 | 79,530 |
| Herman Miller, Inc. | 3,600 | 139,140 |
| HNI Corp. | 3,625 | 130,391 |
| Total | | 452,880 |
| Construction & Engineering 0.1% |
| ACS Actividades de Construccion y Servicios SA | 2,405 | 79,959 |
| CIMIC Group Ltd. | 3,194 | 61,801 |
| EMCOR Group, Inc. | 2,170 | 178,309 |
| Great Lakes Dredge & Dock Corp.(b) | 13,760 | 144,067 |
| MasTec, Inc.(b) | 2,850 | 164,588 |
| Samsung Engineering Co., Ltd.(b) | 3,565 | 50,719 |
| Shimizu Corp. | 9,800 | 100,517 |
| Skanska AB, Class B | 456 | 10,555 |
| Total | | 790,515 |
| Electrical Equipment 0.0% |
| Atkore International Group, Inc.(b) | 4,475 | 177,657 |
| Industrial Conglomerates 0.0% |
| CITIC Ltd. | 51,000 | 57,670 |
The accompanying Notes to Financial Statements are an integral part of this statement.
| 60 | Columbia Capital Allocation Portfolios | Annual Report 2020 |
Portfolio of Investments (continued)
Columbia Capital Allocation Moderate Aggressive Portfolio, January 31, 2020
| Common Stocks (continued) |
| Issuer | Shares | Value ($) |
| Machinery 0.0% |
| GEA Group AG | 797 | 23,864 |
| Lydall, Inc.(b) | 4,800 | 98,112 |
| Mitsubishi Heavy Industries Ltd. | 2,400 | 87,546 |
| Mueller Industries, Inc. | 5,100 | 148,767 |
| Rexnord Corp.(b) | 2,850 | 93,053 |
| Sinotruk Hong Kong Ltd. | 20,000 | 34,341 |
| SPX Corp.(b) | 3,025 | 148,437 |
| Weichai Power Co., Ltd., Class H | 36,000 | 63,026 |
| Total | | 697,146 |
| Marine 0.0% |
| Costamare, Inc. | 15,900 | 126,087 |
| Professional Services 0.0% |
| Adecco Group AG, Registered Shares | 482 | 28,240 |
| Barrett Business Services, Inc. | 1,560 | 129,215 |
| FTI Consulting, Inc.(b) | 670 | 80,440 |
| Heidrick & Struggles International, Inc. | 4,200 | 119,364 |
| Kforce, Inc. | 4,200 | 155,610 |
| Wolters Kluwer NV | 222 | 16,681 |
| Total | | 529,550 |
| Road & Rail 0.0% |
| ArcBest Corp. | 2,515 | 56,110 |
| Aurizon Holdings Ltd. | 12,355 | 44,286 |
| Total | | 100,396 |
| Trading Companies & Distributors 0.0% |
| BMC Stock Holdings, Inc.(b) | 6,100 | 178,028 |
| Foundation Building Materials, Inc.(b) | 6,600 | 117,678 |
| GMS, Inc.(b) | 5,550 | 148,296 |
| MRC Global, Inc.(b) | 11,300 | 127,238 |
| Veritiv Corp.(b) | 8,850 | 124,608 |
| Total | | 695,848 |
| Transportation Infrastructure 0.0% |
| International Container Terminal Services, Inc. | 13,430 | 34,239 |
| Kamigumi Co., Ltd. | 2,400 | 51,282 |
| Total | | 85,521 |
| Total Industrials | 4,996,770 |
| Common Stocks (continued) |
| Issuer | Shares | Value ($) |
| Information Technology 0.2% |
| Communications Equipment 0.0% |
| ADTRAN, Inc. | 6,390 | 57,830 |
| Comtech Telecommunications Corp. | 3,100 | 89,621 |
| Telefonaktiebolaget LM Ericsson, Class B | 763 | 5,999 |
| Total | | 153,450 |
| Electronic Equipment, Instruments & Components 0.1% |
| Badger Meter, Inc. | 325 | 19,195 |
| Benchmark Electronics, Inc. | 4,800 | 147,744 |
| Methode Electronics, Inc. | 4,000 | 131,000 |
| Rogers Corp.(b) | 1,310 | 154,253 |
| Sanmina Corp.(b) | 5,200 | 165,568 |
| Vishay Intertechnology, Inc. | 8,750 | 177,537 |
| Vishay Precision Group, Inc.(b) | 4,100 | 141,614 |
| Zhen Ding Technology Holding Ltd. | 7,000 | 27,073 |
| Total | | 963,984 |
| IT Services 0.1% |
| Cardtronics PLC, Class A(b) | 4,025 | 181,125 |
| Cass Information Systems, Inc. | 565 | 30,521 |
| EVERTEC, Inc. | 4,725 | 158,618 |
| Hackett Group | 2,300 | 35,547 |
| KBR, Inc. | 5,400 | 146,880 |
| MAXIMUS, Inc. | 985 | 70,674 |
| NIC, Inc. | 6,800 | 134,164 |
| Otsuka Corp. | 600 | 23,397 |
| Perspecta, Inc. | 6,650 | 186,665 |
| TTEC Holdings, Inc. | 3,025 | 120,153 |
| Wipro Ltd. | 9,400 | 31,266 |
| Total | | 1,119,010 |
| Semiconductors & Semiconductor Equipment 0.0% |
| Advantest Corp. | 200 | 10,434 |
| Amkor Technology, Inc.(b) | 12,445 | 140,006 |
| Cirrus Logic, Inc.(b) | 250 | 19,203 |
| GlobalWafers Co., Ltd. | 3,000 | 38,697 |
| Novatek Microelectronics | 10,000 | 70,512 |
| Realtek Semiconductor Corp. | 7,000 | 56,242 |
| Synaptics, Inc.(b) | 2,725 | 181,730 |
| Tokyo Electron Ltd. | 600 | 131,968 |
The accompanying Notes to Financial Statements are an integral part of this statement.
Columbia Capital Allocation Portfolios | Annual Report 2020
| 61 |
Portfolio of Investments (continued)
Columbia Capital Allocation Moderate Aggressive Portfolio, January 31, 2020
| Common Stocks (continued) |
| Issuer | Shares | Value ($) |
| Ultra Clean Holdings, Inc.(b) | 6,350 | 146,113 |
| Xperi Corp. | 8,050 | 129,525 |
| Total | | 924,430 |
| Software 0.0% |
| CommVault Systems, Inc.(b) | 3,600 | 162,072 |
| j2 Global, Inc. | 2,155 | 206,578 |
| Progress Software Corp. | 3,875 | 174,879 |
| Qualys, Inc.(b) | 2,070 | 177,482 |
| SPS Commerce, Inc.(b) | 2,720 | 154,577 |
| Total | | 875,588 |
| Technology Hardware, Storage & Peripherals 0.0% |
| Chicony Electronics Co., Ltd. | 25,000 | 70,393 |
| FUJIFILM Holdings Corp. | 200 | 9,933 |
| Lenovo Group Ltd. | 70,000 | 45,675 |
| Lite-On Technology Corp. | 21,000 | 32,533 |
| Samsung Electronics Co., Ltd. | 3,357 | 155,540 |
| Total | | 314,074 |
| Total Information Technology | 4,350,536 |
| Materials 0.1% |
| Chemicals 0.0% |
| Chase Corp. | 510 | 46,905 |
| Covestro AG | 809 | 34,094 |
| Innospec, Inc. | 1,300 | 130,949 |
| Koppers Holdings, Inc.(b) | 1,000 | 31,380 |
| Solvay SA | 174 | 18,033 |
| Total | | 261,361 |
| Construction Materials 0.0% |
| Anhui Conch Cement Co., Ltd., Class H | 7,000 | 44,679 |
| Asia Cement Corp. | 16,000 | 23,799 |
| U.S. Concrete, Inc.(b) | 3,475 | 123,675 |
| Total | | 192,153 |
| Metals & Mining 0.1% |
| Anglo American PLC | 729 | 19,023 |
| BHP Group Ltd. | 4,801 | 123,117 |
| Commercial Metals Co. | 4,400 | 90,420 |
| Fortescue Metals Group Ltd. | 9,039 | 66,959 |
| Kirkland Lake Gold Ltd. | 300 | 12,302 |
| Materion Corp. | 2,430 | 131,949 |
| Common Stocks (continued) |
| Issuer | Shares | Value ($) |
| MMC Norilsk Nickel PJSC | 133 | 43,118 |
| Rio Tinto PLC | 2,328 | 124,488 |
| Schnitzer Steel Industries, Inc., Class A | 6,250 | 100,500 |
| Vale SA | 600 | 7,058 |
| Total | | 718,934 |
| Paper & Forest Products 0.0% |
| Schweitzer-Mauduit International, Inc. | 4,050 | 141,871 |
| Verso Corp., Class A(b) | 8,900 | 149,965 |
| Total | | 291,836 |
| Total Materials | 1,464,284 |
| Real Estate 0.1% |
| Equity Real Estate Investment Trusts (REITS) 0.1% |
| Alexander’s, Inc. | 55 | 17,747 |
| American Assets Trust, Inc. | 3,150 | 143,514 |
| Ashford Hospitality Trust, Inc. | 36,500 | 89,790 |
| CoreCivic, Inc. | 7,700 | 122,815 |
| CorEnergy Infrastructure Trust, Inc. | 3,193 | 145,601 |
| EastGroup Properties, Inc. | 1,510 | 205,466 |
| Fortress REIT Ltd., Class A | 45,872 | 56,391 |
| GEO Group, Inc. (The) | 3,700 | 58,460 |
| Independence Realty Trust, Inc. | 5,800 | 85,086 |
| Investors Real Estate Trust | 2,119 | 156,170 |
| Klepierre | 933 | 31,714 |
| Lexington Realty Trust | 15,300 | 169,371 |
| PS Business Parks, Inc. | 1,076 | 180,295 |
| Retail Value, Inc. | 4,167 | 136,969 |
| Ryman Hospitality Properties, Inc. | 420 | 35,713 |
| Uniti Group, Inc. | 17,300 | 109,509 |
| Washington Prime Group, Inc. | 10,700 | 32,207 |
| Xenia Hotels & Resorts, Inc. | 5,300 | 99,057 |
| Total | | 1,875,875 |
| Real Estate Management & Development 0.0% |
| Aldar Properties PJSC | 23,200 | 14,014 |
| China Aoyuan Group Ltd. | 12,000 | 15,992 |
| Daito Trust Construction Co., Ltd. | 100 | 11,779 |
| Emaar Properties PJSC | 34,511 | 37,658 |
| Logan Property Holdings Co., Ltd. | 20,000 | 30,232 |
The accompanying Notes to Financial Statements are an integral part of this statement.
| 62 | Columbia Capital Allocation Portfolios | Annual Report 2020 |
Portfolio of Investments (continued)
Columbia Capital Allocation Moderate Aggressive Portfolio, January 31, 2020
| Common Stocks (continued) |
| Issuer | Shares | Value ($) |
| RE/MAX Holdings, Inc., Class A | 525 | 20,097 |
| RMR Group, Inc. (The), Class A | 2,875 | 132,451 |
| Total | | 262,223 |
| Total Real Estate | 2,138,098 |
| Utilities 0.1% |
| Electric Utilities 0.0% |
| Endesa SA | 804 | 22,076 |
| Enel SpA | 3,557 | 31,004 |
| Manila Electric Co. | 2,780 | 14,001 |
| Otter Tail Corp. | 300 | 16,068 |
| Portland General Electric Co. | 3,595 | 221,092 |
| Total | | 304,241 |
| Gas Utilities 0.1% |
| Chesapeake Utilities Corp. | 1,565 | 150,569 |
| Naturgy Energy Group SA | 3,897 | 102,782 |
| PT Perusahaan Gas Negara Persero Tbk | 444,100 | 55,041 |
| Southwest Gas Holdings, Inc. | 2,160 | 163,102 |
| Total | | 471,494 |
| Independent Power and Renewable Electricity Producers 0.0% |
| Colbun SA | 220,332 | 32,074 |
| Multi-Utilities 0.0% |
| Avista Corp. | 3,300 | 167,805 |
| NorthWestern Corp. | 2,050 | 157,788 |
| Unitil Corp. | 1,150 | 70,944 |
| Total | | 396,537 |
| Total Utilities | 1,204,346 |
Total Common Stocks
(Cost $31,841,410) | 33,123,124 |
|
| Equity Funds 52.0% |
| | Shares | Value ($) |
| International 14.4% |
| Columbia Contrarian Europe Fund, Institutional 3 Class(a) | 7,963,875 | 55,348,931 |
| Columbia Emerging Markets Fund, Institutional 3 Class(a) | 6,178,927 | 86,134,237 |
| Columbia Overseas Core Fund, Institutional 3 Class(a) | 6,038,162 | 59,113,609 |
| Columbia Overseas Value Fund, Institutional 3 Class(a) | 2,909,822 | 27,235,937 |
| Equity Funds (continued) |
| | Shares | Value ($) |
| Columbia Pacific/Asia Fund, Institutional 3 Class(a) | 6,287,244 | 63,249,669 |
| Total | 291,082,383 |
| U.S. Large Cap 36.4% |
| Columbia Contrarian Core Fund, Institutional 3 Class(a) | 4,112,890 | 112,939,960 |
| Columbia Disciplined Core Fund, Institutional 3 Class(a) | 9,405,924 | 112,588,912 |
| Columbia Disciplined Growth Fund, Institutional 3 Class(a) | 8,386,910 | 79,927,252 |
| Columbia Disciplined Value Fund, Institutional 3 Class(a) | 15,935,176 | 145,488,159 |
| Columbia Large Cap Growth Fund, Institutional 3 Class(a),(b) | 1,276,109 | 60,130,242 |
| Columbia Select Large Cap Equity Fund, Institutional 3 Class(a) | 6,604,031 | 99,324,633 |
| Columbia Select Large Cap Growth Fund, Institutional 3 Class(a),(b) | 4,654,820 | 65,493,318 |
| Columbia Select Large Cap Value Fund, Institutional 3 Class(a) | 2,222,738 | 58,124,594 |
| Total | 734,017,070 |
| U.S. Small Cap 1.2% |
| Columbia Select Small Cap Value Fund, Institutional 3 Class(a) | 235,141 | 4,862,712 |
| Columbia Small Cap Growth Fund I, Institutional 3 Class(a),(b) | 454,929 | 9,776,416 |
| Columbia Small Cap Index Fund, Institutional 3 Class(a) | 485,595 | 10,697,660 |
| Total | 25,336,788 |
Total Equity Funds
(Cost $923,073,668) | 1,050,436,241 |
|
| Fixed Income Funds 24.6% |
| | |
| Emerging Markets 1.1% |
| Columbia Emerging Markets Bond Fund, Institutional 3 Class(a) | 1,986,064 | 22,839,736 |
| High Yield 7.1% |
| Columbia High Yield Bond Fund, Institutional 3 Class(a) | 18,204,282 | 54,066,718 |
| Columbia Income Opportunities Fund, Institutional 3 Class(a) | 8,805,227 | 88,492,532 |
| Total | 142,559,250 |
| Inflation Protected Securities 0.5% |
| Columbia Inflation Protected Securities Fund, Institutional 3 Class(a),(b) | 981,895 | 9,838,585 |
The accompanying Notes to Financial Statements are an integral part of this statement.
Columbia Capital Allocation Portfolios | Annual Report 2020
| 63 |
Portfolio of Investments (continued)
Columbia Capital Allocation Moderate Aggressive Portfolio, January 31, 2020
| Fixed Income Funds (continued) |
| | Shares | Value ($) |
| Investment Grade 15.9% |
| Columbia Corporate Income Fund, Institutional 3 Class(a) | 9,069,849 | 99,042,754 |
| Columbia Mortgage Opportunities Fund, Institutional 3 Class(a) | 1,915,621 | 19,462,712 |
| Columbia Quality Income Fund, Institutional 3 Class(a) | 19,530,485 | 109,370,718 |
| Columbia Short Term Bond Fund, Institutional 3 Class(a) | 4,695,364 | 47,141,451 |
| Columbia U.S. Treasury Index Fund, Institutional 3 Class(a) | 3,979,456 | 46,559,629 |
| Total | 321,577,264 |
Total Fixed Income Funds
(Cost $481,171,184) | 496,814,835 |
| Preferred Stocks 0.0% |
| Issuer | | Shares | Value ($) |
| Utilities 0.0% |
| Electric Utilities 0.0% |
| Cia Energetica de Minas Gerais | | 3,000 | 10,479 |
| Total Utilities | 10,479 |
Total Preferred Stocks
(Cost $10,341) | 10,479 |
| Money Market Funds 16.8% |
| | Shares | Value ($) |
| Columbia Government Money Market Fund, Institutional 3 Class, 1.151%(a),(f) | 17,774,508 | 17,774,508 |
| Columbia Short-Term Cash Fund, 1.648%(a),(f) | 321,600,347 | 321,600,347 |
Total Money Market Funds
(Cost $339,347,378) | 339,374,855 |
Total Investments in Securities
(Cost: $1,862,780,104) | 1,999,262,554 |
| Other Assets & Liabilities, Net | | 19,681,713 |
| Net Assets | 2,018,944,267 |
At January 31, 2020, securities and/or cash totaling $25,744,339 were pledged as collateral.
Investments in derivatives
| Forward foreign currency exchange contracts |
Currency to
be sold | Currency to
be purchased | Counterparty | Settlement
date | Unrealized
appreciation ($) | Unrealized
depreciation ($) |
| 89,000 AUD | 60,117 USD | Morgan Stanley | 03/26/2020 | 484 | — |
| 34,000 EUR | 37,545 USD | Morgan Stanley | 03/26/2020 | — | (284) |
| 245,000 ILS | 71,160 USD | Morgan Stanley | 03/26/2020 | — | (1) |
| 167,265,000 KRW | 141,919 USD | Morgan Stanley | 03/26/2020 | 1,971 | — |
| 565,000 MXN | 29,982 USD | Morgan Stanley | 03/26/2020 | 307 | — |
| 275,000 MYR | 67,183 USD | Morgan Stanley | 03/26/2020 | 301 | — |
| 4,036,000 TWD | 134,564 USD | Morgan Stanley | 03/26/2020 | 1,359 | — |
| 44,645 USD | 189,000 BRL | Morgan Stanley | 03/26/2020 | — | (633) |
| 37,402 USD | 253,000 DKK | Morgan Stanley | 03/26/2020 | 282 | — |
| 112,148 USD | 86,000 GBP | Morgan Stanley | 03/26/2020 | 1,574 | — |
| 74,776 USD | 5,361,000 INR | Morgan Stanley | 03/26/2020 | — | (375) |
| 22,364 USD | 205,000 NOK | Morgan Stanley | 03/26/2020 | — | (72) |
| 59,545 USD | 81,000 SGD | Morgan Stanley | 03/26/2020 | — | (179) |
| 880,000 ZAR | 59,728 USD | Morgan Stanley | 03/26/2020 | 1,495 | — |
| Total | | | | 7,773 | (1,544) |
The accompanying Notes to Financial Statements are an integral part of this statement.
| 64 | Columbia Capital Allocation Portfolios | Annual Report 2020 |
Portfolio of Investments (continued)
Columbia Capital Allocation Moderate Aggressive Portfolio, January 31, 2020
| Long futures contracts |
| Description | Number of
contracts | Expiration
date | Trading
currency | Notional
amount | Value/Unrealized
appreciation ($) | Value/Unrealized
depreciation ($) |
| CAC40 Index | 119 | 02/2020 | EUR | 6,906,760 | — | (295,840) |
| EURO STOXX 50 Index | 667 | 03/2020 | EUR | 24,272,130 | — | (913,799) |
| FTSE 100 Index | 233 | 03/2020 | GBP | 16,816,775 | — | (1,019,722) |
| FTSE/MIB Index | 119 | 03/2020 | EUR | 13,815,305 | — | (321,411) |
| MSCI EAFE Index Future | 440 | 03/2020 | USD | 43,483,000 | — | (556,864) |
| Russell 2000 Index E-mini | 3 | 03/2020 | USD | 242,205 | — | (5,107) |
| Russell 2000 Index E-mini | 277 | 03/2020 | USD | 22,363,595 | — | (306,079) |
| S&P 500 Index E-mini | 1,382 | 03/2020 | USD | 222,778,400 | 5,389,827 | — |
| U.S. Treasury 10-Year Note | 847 | 03/2020 | USD | 111,512,844 | 1,811,415 | — |
| U.S. Ultra Treasury Bond | 193 | 03/2020 | USD | 37,381,688 | 1,353,891 | — |
| Total | | | | | 8,555,133 | (3,418,822) |
| Short futures contracts |
| Description | Number of
contracts | Expiration
date | Trading
currency | Notional
amount | Value/Unrealized
appreciation ($) | Value/Unrealized
depreciation ($) |
| MSCI Emerging Markets Index | (662) | 03/2020 | USD | (34,758,310) | 1,084,734 | — |
| TOPIX Index | (188) | 03/2020 | JPY | (3,156,520,000) | 713,842 | — |
| Total | | | | | 1,798,576 | — |
| Cleared credit default swap contracts - sell protection |
Reference
entity | Counterparty | Maturity
date | Receive
fixed
rate
(%) | Payment
frequency | Implied
credit
spread
(%)* | Notional
currency | Notional
amount | Value
($) | Upfront
payments
($) | Upfront
receipts
($) | Unrealized
appreciation
($) | Unrealized
depreciation
($) |
| Markit CDX Emerging Markets Index, Series 32 | Morgan Stanley | 12/20/2024 | 1.000 | Quarterly | 1.972 | USD | 50,055,000 | 121,280 | — | — | 121,280 | — |
| * | Implied credit spreads, represented in absolute terms, utilized in determining the market value of credit default swap agreements on corporate or sovereign issues as of period end serve as an indicator of the current status of the payment/performance risk and represent the likelihood or risk of default for the credit derivative. The implied credit spread of a particular referenced entity reflects the cost of buying/selling protection and may include upfront payments required to be made to enter into the agreement. Wider credit spreads represent a deterioration of the referenced entity’s credit soundness and a greater likelihood or risk of default or other credit event occurring as defined under the terms of the agreement. |
Notes to Portfolio of Investments
| (a) | As defined in the Investment Company Act of 1940, an affiliated company is one in which the Fund owns 5% or more of the company’s outstanding voting securities, or a company which is under common ownership or control with the Fund. Holdings and transactions in these affiliated companies during the year ended January 31, 2020 are as follows: |
| Issuer | Beginning
shares | Shares
purchased | Shares
sold | Ending
shares | Capital gain
distributions —
affiliated
issuers ($) | Realized gain
(loss) —
affiliated
issuers ($) | Net change in
unrealized
appreciation
(depreciation) —
affiliated
issuers ($) | Dividends —
affiliated
issuers ($) | Value —
affiliated
issuers
at end of
period ($) |
| Columbia Commodity Strategy Fund, Institutional 3 Class |
| | 4,760,594 | 71,708 | (221,402) | 4,610,900 | — | (302,314) | (951,280) | 252,596 | 19,135,237 |
| Columbia Contrarian Core Fund, Institutional 3 Class |
| | 4,707,575 | 245,700 | (840,385) | 4,112,890 | 5,173,452 | 6,855,794 | 10,068,461 | 1,303,953 | 112,939,960 |
| Columbia Contrarian Europe Fund, Institutional 3 Class |
| | 9,073,446 | 194,694 | (1,304,265) | 7,963,875 | — | (629,722) | 7,921,861 | 1,358,701 | 55,348,931 |
| Columbia Corporate Income Fund, Institutional 3 Class |
| | 10,022,245 | 325,042 | (1,277,438) | 9,069,849 | — | 295,508 | 9,667,912 | 3,290,485 | 99,042,754 |
| Columbia Disciplined Core Fund, Institutional 3 Class |
| | 9,710,054 | 929,566 | (1,233,696) | 9,405,924 | 9,215,704 | 7,625,841 | (2,412,584) | 1,683,560 | 112,588,912 |
The accompanying Notes to Financial Statements are an integral part of this statement.
Columbia Capital Allocation Portfolios | Annual Report 2020
| 65 |
Portfolio of Investments (continued)
Columbia Capital Allocation Moderate Aggressive Portfolio, January 31, 2020
Notes to Portfolio of Investments (continued)
| Issuer | Beginning
shares | Shares
purchased | Shares
sold | Ending
shares | Capital gain
distributions —
affiliated
issuers ($) | Realized gain
(loss) —
affiliated
issuers ($) | Net change in
unrealized
appreciation
(depreciation) —
affiliated
issuers ($) | Dividends —
affiliated
issuers ($) | Value —
affiliated
issuers
at end of
period ($) |
| Columbia Disciplined Growth Fund, Institutional 3 Class |
| | 9,132,526 | 2,119,588 | (2,865,204) | 8,386,910 | 4,750,784 | (2,522,166) | 9,366,440 | 517,317 | 79,927,252 |
| Columbia Disciplined Value Fund, Institutional 3 Class |
| | 17,014,753 | 3,907,875 | (4,987,452) | 15,935,176 | 13,011,196 | 2,742,209 | (4,672,531) | 3,317,336 | 145,488,159 |
| Columbia Emerging Markets Bond Fund, Institutional 3 Class |
| | 2,068,454 | 78,585 | (160,975) | 1,986,064 | — | 45,604 | 961,226 | 851,896 | 22,839,736 |
| Columbia Emerging Markets Fund, Institutional 3 Class |
| | 7,293,895 | 36,433 | (1,151,401) | 6,178,927 | — | 3,855,119 | 9,312,193 | 459,521 | 86,134,237 |
| Columbia Government Money Market Fund, Institutional 3 Class, 1.151% |
| | 21,338,771 | 479,283 | (4,043,546) | 17,774,508 | 6,065 | — | — | 380,667 | 17,774,508 |
| Columbia High Yield Bond Fund, Institutional 3 Class |
| | 19,338,632 | 999,746 | (2,134,096) | 18,204,282 | — | (142,137) | 2,965,309 | 2,862,344 | 54,066,718 |
| Columbia Income Opportunities Fund, Institutional 3 Class |
| | 9,365,260 | 465,413 | (1,025,446) | 8,805,227 | — | (96,299) | 4,924,052 | 4,502,658 | 88,492,532 |
| Columbia Inflation Protected Securities Fund, Institutional 3 Class |
| | 1,068,117 | 1,313 | (87,535) | 981,895 | — | 26,580 | 829,854 | — | 9,838,585 |
| Columbia Large Cap Growth Fund, Institutional 3 Class |
| | 1,469,881 | 103,143 | (296,915) | 1,276,109 | 4,549,043 | 6,020,937 | 3,845,255 | — | 60,130,242 |
| Columbia Mortgage Opportunities Fund, Institutional 3 Class |
| | 1,890,465 | 84,821 | (59,665) | 1,915,621 | 158,512 | 14,189 | 371,589 | 675,085 | 19,462,712 |
| Columbia Multi Strategy Alternatives Fund, Institutional 3 Class |
| | 468,857 | — | — | 468,857 | — | — | (276,625) | — | 3,450,790 |
| Columbia Multi-Asset Income Fund, Institutional 3 Class |
| | 5,536,566 | 343,289 | — | 5,879,855 | — | — | 3,363,841 | 3,225,767 | 56,916,993 |
| Columbia Overseas Core Fund, Institutional 3 Class |
| | 6,497,291 | 246,145 | (705,274) | 6,038,162 | 230,356 | (274,883) | 4,451,685 | 2,153,351 | 59,113,609 |
| Columbia Overseas Value Fund, Institutional 3 Class |
| | 3,088,383 | 115,288 | (293,849) | 2,909,822 | 55,086 | 155,820 | 1,032,039 | 1,043,462 | 27,235,937 |
| Columbia Pacific/Asia Fund, Institutional 3 Class |
| | 6,895,140 | 467,466 | (1,075,362) | 6,287,244 | 3,058,077 | 2,081,681 | 2,993,956 | 1,549,434 | 63,249,669 |
| Columbia Quality Income Fund, Institutional 3 Class |
| | 20,391,774 | 630,221 | (1,491,510) | 19,530,485 | — | 72,395 | 4,374,908 | 3,334,434 | 109,370,718 |
| Columbia Select Large Cap Equity Fund, Institutional 3 Class |
| | 7,465,774 | 397,555 | (1,259,298) | 6,604,031 | 4,311,255 | 3,364,019 | 9,613,582 | 1,211,479 | 99,324,633 |
| Columbia Select Large Cap Growth Fund, Institutional 3 Class |
| | 4,181,318 | 1,283,063 | (809,561) | 4,654,820 | 17,715,906 | 1,619,880 | (6,594,189) | — | 65,493,318 |
| Columbia Select Large Cap Value Fund, Institutional 3 Class |
| | 2,340,806 | 151,185 | (269,253) | 2,222,738 | 2,835,426 | 2,953,451 | (908,577) | 1,156,585 | 58,124,594 |
| Columbia Select Small Cap Value Fund, Institutional 3 Class |
| | 250,726 | 1,310 | (16,895) | 235,141 | 984 | (82,204) | 321,458 | 19,970 | 4,862,712 |
| Columbia Short Term Bond Fund, Institutional 3 Class |
| | 4,766,689 | 179,498 | (250,823) | 4,695,364 | — | 52,719 | 666,452 | 1,733,583 | 47,141,451 |
The accompanying Notes to Financial Statements are an integral part of this statement.
| 66 | Columbia Capital Allocation Portfolios | Annual Report 2020 |
Portfolio of Investments (continued)
Columbia Capital Allocation Moderate Aggressive Portfolio, January 31, 2020
Notes to Portfolio of Investments (continued)
| Issuer | Beginning
shares | Shares
purchased | Shares
sold | Ending
shares | Capital gain
distributions —
affiliated
issuers ($) | Realized gain
(loss) —
affiliated
issuers ($) | Net change in
unrealized
appreciation
(depreciation) —
affiliated
issuers ($) | Dividends —
affiliated
issuers ($) | Value —
affiliated
issuers
at end of
period ($) |
| Columbia Short-Term Cash Fund, 1.648% |
| | 277,191,878 | 244,476,836 | (200,068,367) | 321,600,347 | — | (5,625) | 36,135 | 6,554,225 | 321,600,347 |
| Columbia Small Cap Growth Fund I, Institutional 3 Class |
| | 527,194 | 38,030 | (110,295) | 454,929 | 776,458 | (79,109) | 1,503,840 | — | 9,776,416 |
| Columbia Small Cap Index Fund, Institutional 3 Class |
| | 454,518 | 31,077 | — | 485,595 | 554,607 | — | (45,758) | 139,413 | 10,697,660 |
| Columbia U.S. Treasury Index Fund, Institutional 3 Class |
| | 4,261,525 | 91,680 | (373,749) | 3,979,456 | — | 174,720 | 2,815,572 | 970,262 | 46,559,629 |
| Total | | | | | 66,402,911 | 33,822,007 | 75,546,076 | 44,548,084 | 1,966,128,951 |
| (b) | Non-income producing investment. |
| (c) | Represents privately placed and other securities and instruments exempt from Securities and Exchange Commission registration (collectively, private placements), such as Section 4(a)(2) and Rule 144A eligible securities, which are often sold only to qualified institutional buyers. The Fund may invest in private placements determined to be liquid as well as those determined to be illiquid. Private placements may be determined to be liquid under guidelines established by the Fund’s Board of Trustees. At January 31, 2020, the total value of these securities amounted to $103,671, which represents 0.01% of total net assets. |
| (d) | Represents fair value as determined in good faith under procedures approved by the Board of Trustees. At January 31, 2020, the total value of these securities amounted to $0, which represents less than 0.01% of total net assets. |
| (e) | Valuation based on significant unobservable inputs. |
| (f) | The rate shown is the seven-day current annualized yield at January 31, 2020. |
Abbreviation Legend
| ADR | American Depositary Receipt |
Currency Legend
| AUD | Australian Dollar |
| BRL | Brazilian Real |
| DKK | Danish Krone |
| EUR | Euro |
| GBP | British Pound |
| ILS | New Israeli Sheqel |
| INR | Indian Rupee |
| JPY | Japanese Yen |
| KRW | South Korean Won |
| MXN | Mexican Peso |
| MYR | Malaysian Ringgit |
| NOK | Norwegian Krone |
| SGD | Singapore Dollar |
| TWD | New Taiwan Dollar |
| USD | US Dollar |
| ZAR | South African Rand |
Fair value measurements
The Fund categorizes its fair value measurements according to a three-level hierarchy that maximizes the use of observable inputs and minimizes the use of unobservable inputs by prioritizing that the most observable input be used when available. Observable inputs are those that market participants would use in pricing an investment based on market data obtained from sources independent of the reporting entity. Unobservable inputs are those that reflect the Fund’s assumptions about the information market participants would use in
The accompanying Notes to Financial Statements are an integral part of this statement.
Columbia Capital Allocation Portfolios | Annual Report 2020
| 67 |
Portfolio of Investments (continued)
Columbia Capital Allocation Moderate Aggressive Portfolio, January 31, 2020
Fair value measurements (continued)
pricing an investment. An investment’s level within the fair value hierarchy is based on the lowest level of any input that is deemed significant to the asset’s or liability’s fair value measurement. The input levels are not necessarily an indication of the risk or liquidity associated with investments at that level. For example, certain U.S. government securities are generally high quality and liquid, however, they are reflected as Level 2 because the inputs used to determine fair value may not always be quoted prices in an active market.
Fair value inputs are summarized in the three broad levels listed below:
| ■ | Level 1 — Valuations based on quoted prices for investments in active markets that the Fund has the ability to access at the measurement date. Valuation adjustments are not applied to Level 1 investments. |
| ■ | Level 2 — Valuations based on other significant observable inputs (including quoted prices for similar securities, interest rates, prepayment speeds, credit risks, etc.). |
| ■ | Level 3 — Valuations based on significant unobservable inputs (including the Fund’s own assumptions and judgment in determining the fair value of investments). |
Inputs that are used in determining fair value of an investment may include price information, credit data, volatility statistics, and other factors. These inputs can be either observable or unobservable. The availability of observable inputs can vary between investments, and is affected by various factors such as the type of investment, and the volume and level of activity for that investment or similar investments in the marketplace. The inputs will be considered by the Investment Manager, along with any other relevant factors in the calculation of an investment’s fair value. The Fund uses prices and inputs that are current as of the measurement date, which may include periods of market dislocations. During these periods, the availability of prices and inputs may be reduced for many investments. This condition could cause an investment to be reclassified between the various levels within the hierarchy.
Foreign equity securities actively traded in markets where there is a significant delay in the local close relative to the New York Stock Exchange are classified as Level 2. The values of these securities may include an adjustment to reflect the impact of market movements following the close of local trading, as described in Note 2 to the financial statements – Security valuation.
Investments falling into the Level 3 category are primarily supported by quoted prices from brokers and dealers participating in the market for those investments. However, these may be classified as Level 3 investments due to lack of market transparency and corroboration to support these quoted prices. Additionally, valuation models may be used as the pricing source for any remaining investments classified as Level 3. These models may rely on one or more significant unobservable inputs and/or significant assumptions by the Investment Manager. Inputs used in valuations may include, but are not limited to, financial statement analysis, capital account balances, discount rates and estimated cash flows, and comparable company data.
Under the direction of the Fund’s Board of Trustees (the Board), the Investment Manager’s Valuation Committee (the Committee) is responsible for overseeing the valuation procedures approved by the Board. The Committee consists of voting and non-voting members from various groups within the Investment Manager’s organization, including operations and accounting, trading and investments, compliance, risk management and legal.
The Committee meets at least monthly to review and approve valuation matters, which may include a description of specific valuation determinations, data regarding pricing information received from approved pricing vendors and brokers and the results of Board-approved valuation control policies and procedures (the Policies). The Policies address, among other things, instances when market quotations are or are not readily available, including recommendations of third party pricing vendors and a determination of appropriate pricing methodologies; events that require specific valuation determinations and assessment of fair value techniques; securities with a potential for stale pricing, including those that are illiquid, restricted, or in default; and the effectiveness of third party pricing vendors, including periodic reviews of vendors. The Committee meets more frequently, as needed, to discuss additional valuation matters, which may include the need to review back-testing results, review time-sensitive information or approve related valuation actions. The Committee reports to the Board, with members of the Committee meeting with the Board at each of its regularly scheduled meetings to discuss valuation matters and actions during the period, similar to those described earlier.
The following table is a summary of the inputs used to value the Fund’s investments at January 31, 2020:
| | Level 1 ($) | Level 2 ($) | Level 3 ($) | Total ($) |
| Investments in Securities | | | | |
| Alternative Strategies Funds | 79,503,020 | — | — | 79,503,020 |
| Common Stocks | | | | |
| Communication Services | 586,902 | 427,871 | — | 1,014,773 |
| Consumer Discretionary | 3,172,453 | 648,482 | — | 3,820,935 |
| Consumer Staples | 887,147 | 530,236 | 0* | 1,417,383 |
| Energy | 937,102 | 255,128 | — | 1,192,230 |
| Financials | 4,755,092 | 1,304,605 | — | 6,059,697 |
| Health Care | 4,783,107 | 680,965 | — | 5,464,072 |
| Industrials | 4,216,851 | 779,919 | — | 4,996,770 |
| Information Technology | 3,640,874 | 709,662 | — | 4,350,536 |
| Materials | 966,974 | 497,310 | — | 1,464,284 |
| Real Estate | 1,940,318 | 197,780 | — | 2,138,098 |
| Utilities | 979,442 | 224,904 | — | 1,204,346 |
| Total Common Stocks | 26,866,262 | 6,256,862 | 0* | 33,123,124 |
| Equity Funds | 1,050,436,241 | — | — | 1,050,436,241 |
| Fixed Income Funds | 496,814,835 | — | — | 496,814,835 |
| Preferred Stocks | | | | |
| Utilities | 10,479 | — | — | 10,479 |
| Total Preferred Stocks | 10,479 | — | — | 10,479 |
| Money Market Funds | 339,374,855 | — | — | 339,374,855 |
| Total Investments in Securities | 1,993,005,692 | 6,256,862 | 0* | 1,999,262,554 |
| Investments in Derivatives | | | | |
The accompanying Notes to Financial Statements are an integral part of this statement.
| 68 | Columbia Capital Allocation Portfolios | Annual Report 2020 |
Portfolio of Investments (continued)
Columbia Capital Allocation Moderate Aggressive Portfolio, January 31, 2020
Fair value measurements (continued)
| | Level 1 ($) | Level 2 ($) | Level 3 ($) | Total ($) |
| Asset | | | | |
| Forward Foreign Currency Exchange Contracts | — | 7,773 | — | 7,773 |
| Futures Contracts | 10,353,709 | — | — | 10,353,709 |
| Swap Contracts | — | 121,280 | — | 121,280 |
| Liability | | | | |
| Forward Foreign Currency Exchange Contracts | — | (1,544) | — | (1,544) |
| Futures Contracts | (3,418,822) | — | — | (3,418,822) |
| Total | 1,999,940,579 | 6,384,371 | 0* | 2,006,324,950 |
See the Portfolio of Investments for all investment classifications not indicated in the table.
The Fund’s assets assigned to the Level 2 input category are generally valued using the market approach, in which a security’s value is determined through reference to prices and information from market transactions for similar or identical assets. These assets include certain foreign securities for which a third party statistical pricing service may be employed for purposes of fair market valuation. The model utilized by such third party statistical pricing service takes into account a security’s correlation to available market data including, but not limited to, intraday index, ADR, and exchange-traded fund movements.
Derivative instruments are valued at unrealized appreciation (depreciation).
The Fund does not hold any significant investments (greater than one percent of net assets) categorized as Level 3.
The accompanying Notes to Financial Statements are an integral part of this statement.
Columbia Capital Allocation Portfolios | Annual Report 2020
| 69 |
Portfolio of Investments
Columbia Capital Allocation Aggressive Portfolio, January 31, 2020
(Percentages represent value of investments compared to net assets)
Investments in securities
| Alternative Strategies Funds 4.0% |
| | Shares | Value ($) |
| Columbia Commodity Strategy Fund, Institutional 3 Class(a) | 2,194,940 | 9,109,001 |
| Columbia Multi Strategy Alternatives Fund, Institutional 3 Class(a),(b) | 468,857 | 3,450,790 |
| Columbia Multi-Asset Income Fund, Institutional 3 Class(a) | 1,695,275 | 16,410,264 |
Total Alternative Strategies Funds
(Cost $33,103,058) | 28,970,055 |
|
| Common Stocks 2.7% |
| Issuer | Shares | Value ($) |
| Communication Services 0.1% |
| Diversified Telecommunication Services 0.0% |
| Hellenic Telecommunications Organization SA | 2,422 | 36,172 |
| Nippon Telegraph & Telephone Corp. | 5,700 | 145,333 |
| Telekom Malaysia Bhd | 48,100 | 45,170 |
| Total | | 226,675 |
| Entertainment 0.0% |
| Square Enix Holdings Co., Ltd. | 500 | 24,545 |
| Toho Co., Ltd. | 1,300 | 47,890 |
| Total | | 72,435 |
| Interactive Media & Services 0.0% |
| Auto Trader Group PLC | 4,235 | 31,249 |
| DHI Group, Inc.(b) | 9,700 | 27,160 |
| Meet Group, Inc. (The)(b) | 13,200 | 70,356 |
| Momo, Inc., ADR | 1,517 | 46,420 |
| Tencent Holdings Ltd. | 600 | 28,614 |
| Yelp, Inc.(b) | 230 | 7,498 |
| Total | | 211,297 |
| Media 0.1% |
| Gray Television, Inc.(b) | 1,500 | 30,420 |
| Informa PLC | 2,812 | 28,725 |
| National CineMedia, Inc. | 3,550 | 26,199 |
| TechTarget, Inc.(b) | 2,425 | 61,571 |
| WPP PLC | 6,842 | 85,070 |
| Total | | 231,985 |
| Common Stocks (continued) |
| Issuer | Shares | Value ($) |
| Wireless Telecommunication Services 0.0% |
| Advanced Info Service PCL | 5,600 | 36,408 |
| Gogo(b) | 3,800 | 19,988 |
| Total | | 56,396 |
| Total Communication Services | 798,788 |
| Consumer Discretionary 0.3% |
| Auto Components 0.0% |
| Dana, Inc. | 1,025 | 15,795 |
| Hyundai Mobis Co., Ltd. | 43 | 8,223 |
| Magna International, Inc. | 2,703 | 137,029 |
| Modine Manufacturing Co.(b) | 3,075 | 21,617 |
| Total | | 182,664 |
| Automobiles 0.0% |
| BAIC Motor Corp., Ltd., Class H(c) | 119,000 | 58,655 |
| Fiat Chrysler Automobiles NV | 896 | 11,672 |
| Peugeot SA | 4,847 | 99,801 |
| Total | | 170,128 |
| Distributors 0.0% |
| Funko, Inc., Class A(b) | 3,025 | 45,466 |
| Diversified Consumer Services 0.0% |
| Collectors Universe, Inc. | 2,200 | 54,032 |
| K12, Inc.(b) | 2,225 | 35,912 |
| Perdoceo Education Corp.(b) | 2,300 | 40,894 |
| Total | | 130,838 |
| Hotels, Restaurants & Leisure 0.0% |
| Boyd Gaming Corp. | 275 | 8,209 |
| Brinker International, Inc. | 860 | 36,713 |
| Dine Brands Global, Inc. | 800 | 68,200 |
| Everi Holdings, Inc.(b) | 5,700 | 71,250 |
| Marriott Vacations Worldwide Corp. | 515 | 61,924 |
| SeaWorld Entertainment, Inc.(b) | 2,280 | 78,569 |
| Total | | 324,865 |
The accompanying Notes to Financial Statements are an integral part of this statement.
| 70 | Columbia Capital Allocation Portfolios | Annual Report 2020 |
Portfolio of Investments (continued)
Columbia Capital Allocation Aggressive Portfolio, January 31, 2020
| Common Stocks (continued) |
| Issuer | Shares | Value ($) |
| Household Durables 0.1% |
| Berkeley Group Holdings PLC | 755 | 52,242 |
| M/I Homes, Inc.(b) | 1,155 | 51,270 |
| Sekisui House Ltd. | 5,600 | 120,412 |
| Sony Corp. | 2,500 | 174,817 |
| Taylor Morrison Home Corp., Class A(b) | 3,175 | 82,169 |
| Total | | 480,910 |
| Internet & Direct Marketing Retail 0.0% |
| Alibaba Group Holding Ltd., ADR(b) | 279 | 57,639 |
| Stamps.com, Inc.(b) | 550 | 40,969 |
| Total | | 98,608 |
| Leisure Products 0.0% |
| Malibu Boats, Inc., Class A(b) | 1,785 | 78,165 |
| MasterCraft Boat Holdings, Inc.(b) | 1,400 | 24,598 |
| Sturm Ruger & Co., Inc. | 690 | 34,169 |
| Total | | 136,932 |
| Specialty Retail 0.1% |
| Genesco, Inc.(b) | 1,160 | 45,611 |
| GNC Holdings, Inc., Class A(b) | 10,100 | 21,614 |
| Hibbett Sports, Inc.(b) | 2,075 | 51,418 |
| Lithia Motors, Inc., Class A | 450 | 61,038 |
| Petrobras Distribuidora SA | 2,400 | 16,162 |
| Rent-A-Center, Inc. | 1,400 | 40,782 |
| Restoration Hardware Holdings, Inc.(b) | 159 | 33,191 |
| Sleep Number Corp.(b) | 1,010 | 52,106 |
| Sportsman’s Warehouse Holdings, Inc.(b) | 6,400 | 41,472 |
| Tilly’s, Inc. | 1,000 | 8,500 |
| Zumiez, Inc.(b) | 1,350 | 42,080 |
| Total | | 413,974 |
| Textiles, Apparel & Luxury Goods 0.1% |
| Adidas AG | 108 | 34,140 |
| Burberry Group PLC | 2,370 | 60,768 |
| Deckers Outdoor Corp.(b) | 440 | 84,000 |
| Kering SA | 226 | 138,091 |
| Pandora A/S | 212 | 10,994 |
| Total | | 327,993 |
| Total Consumer Discretionary | 2,312,378 |
| Common Stocks (continued) |
| Issuer | Shares | Value ($) |
| Consumer Staples 0.2% |
| Beverages 0.0% |
| Coca-Cola European Partners PLC | 2,070 | 108,903 |
| Food & Staples Retailing 0.1% |
| Coles Group Ltd. | 4,619 | 50,684 |
| Ingles Markets, Inc., Class A | 1,440 | 60,034 |
| Koninklijke Ahold Delhaize NV | 5,746 | 141,015 |
| Loblaw Companies Ltd. | 100 | 5,232 |
| SpartanNash Co. | 3,800 | 46,284 |
| Welcia Holdings Co., Ltd. | 600 | 32,948 |
| Total | | 336,197 |
| Food Products 0.0% |
| JBS SA | 14,200 | 91,415 |
| John B. Sanfilippo & Son, Inc. | 730 | 61,539 |
| Nestlé SA, Registered Shares | 164 | 18,088 |
| Tingyi Cayman Islands Holding Corp. | 8,000 | 13,497 |
| Uni-President Enterprises Corp. | 24,000 | 57,179 |
| Total | | 241,718 |
| Household Products 0.0% |
| Kimberly-Clark de Mexico SAB de CV(b) | 7,622 | 15,768 |
| Personal Products 0.0% |
| Edgewell Personal Care Co.(b) | 1,200 | 30,984 |
| Medifast, Inc. | 555 | 53,630 |
| Usana Health Sciences, Inc.(b) | 665 | 41,030 |
| Total | | 125,644 |
| Tobacco 0.1% |
| British American Tobacco PLC | 3,373 | 148,732 |
| PT Gudang Garam Tbk | 6,200 | 25,262 |
| Swedish Match AB | 2,541 | 143,663 |
| Vector Group Ltd. | 1,312 | 17,240 |
| Total | | 334,897 |
| Total Consumer Staples | 1,163,127 |
The accompanying Notes to Financial Statements are an integral part of this statement.
Columbia Capital Allocation Portfolios | Annual Report 2020
| 71 |
Portfolio of Investments (continued)
Columbia Capital Allocation Aggressive Portfolio, January 31, 2020
| Common Stocks (continued) |
| Issuer | Shares | Value ($) |
| Energy 0.1% |
| Energy Equipment & Services 0.0% |
| DMC Global Inc | 460 | 19,242 |
| Liberty Oilfield Services, Inc., Class A | 1,800 | 15,264 |
| Matrix Service Co.(b) | 3,000 | 60,360 |
| NexTier Oilfield Solutions, Inc.(b) | 11,000 | 56,650 |
| Total | | 151,516 |
| Oil, Gas & Consumable Fuels 0.1% |
| California Resources Corp.(b) | 2,570 | 18,864 |
| Canadian Natural Resources Ltd. | 1,700 | 47,812 |
| Cenovus Energy, Inc. | 3,300 | 28,726 |
| China Coal Energy Co., Ltd., Class H | 33,000 | 11,226 |
| Coal India Ltd. | 26,986 | 68,489 |
| CVR Energy, Inc. | 1,805 | 62,471 |
| Delek U.S. Holdings, Inc. | 1,430 | 39,268 |
| Denbury Resources, Inc.(b) | 3,200 | 3,152 |
| Dorian LPG Ltd.(b) | 600 | 7,872 |
| ENI SpA | 4,253 | 59,574 |
| Lukoil PJSC | 250 | 25,557 |
| Lundin Petroleum AB | 400 | 12,166 |
| Motor Oil Hellas Corinth Refineries SA | 1,038 | 22,041 |
| OMV AG | 545 | 27,083 |
| PT Bukit Asam Tbk | 44,200 | 7,101 |
| Royal Dutch Shell PLC, Class B | 296 | 7,778 |
| Southwestern Energy Co.(b) | 6,200 | 9,734 |
| Suncor Energy, Inc. | 4,200 | 128,374 |
| W&T Offshore, Inc.(b) | 2,500 | 10,350 |
| World Fuel Services Corp. | 960 | 37,555 |
| Yanzhou Coal Mining Co., Ltd., Class H | 82,000 | 60,503 |
| Total | | 695,696 |
| Total Energy | 847,212 |
| Financials 0.5% |
| Banks 0.3% |
| Atlantic Capital Bancshares, Inc.(b) | 475 | 8,963 |
| Bancorp, Inc. (The)(b) | 5,950 | 70,388 |
| Bank Leumi Le-Israel BM | 8,670 | 62,337 |
| BNP Paribas SA | 2,543 | 134,951 |
| Cathay General Bancorp | 2,095 | 75,546 |
| Common Stocks (continued) |
| Issuer | Shares | Value ($) |
| China Merchants Bank Co., Ltd., Class H | 6,000 | 28,929 |
| ConnectOne Bancorp, Inc. | 2,575 | 60,796 |
| Customers Bancorp, Inc.(b) | 2,791 | 59,672 |
| First BanCorp | 6,800 | 63,036 |
| Fulton Financial Corp. | 3,075 | 50,645 |
| Great Southern Bancorp, Inc. | 960 | 54,634 |
| Grupo Financiero Banorte SAB de CV, Class O | 17,372 | 107,061 |
| Hilltop Holdings, Inc. | 2,825 | 63,958 |
| Independent Bank Group, Inc. | 1,350 | 72,252 |
| International Bancshares Corp. | 1,815 | 71,511 |
| Investors Bancorp, Inc. | 1,700 | 20,544 |
| Israel Discount Bank Ltd. | 11,097 | 50,332 |
| Mediobanca Banca di Credito Finanziario SpA | 5,795 | 57,809 |
| Metropolitan Bank Holding Corp.(b) | 180 | 8,847 |
| Midland States Bancorp, Inc. | 1,300 | 34,346 |
| National Bank of Canada | 1,700 | 94,326 |
| Nicolet Bankshares, Inc.(b) | 450 | 31,792 |
| OFG Bancorp | 3,075 | 60,608 |
| Postal Savings Bank of China Co., Ltd.(c) | 103,000 | 64,091 |
| Powszechna Kasa Oszczednosci Bank Polski SA | 5,078 | 44,752 |
| Preferred Bank | 850 | 51,093 |
| Raiffeisen Bank International AG | 1,405 | 32,005 |
| RHB Bank Bhd | 61,400 | 85,253 |
| Shinhan Financial Group Co., Ltd. | 352 | 11,487 |
| Standard Bank Group Ltd. | 10,496 | 109,481 |
| Sumitomo Mitsui Financial Group, Inc. | 800 | 28,128 |
| Sumitomo Mitsui Trust Holdings, Inc. | 400 | 14,748 |
| United Community Banks, Inc. | 1,325 | 36,994 |
| Total | | 1,821,315 |
| Capital Markets 0.0% |
| Cohen & Steers, Inc. | 1,130 | 83,597 |
| Federated Hermes, Inc., Class B | 2,415 | 87,495 |
| Korea Investment Holdings Co., Ltd.(b) | 1,405 | 77,276 |
| Samsung Securities Co., Ltd. | 2,751 | 80,368 |
| Singapore Exchange | 1,300 | 8,248 |
| Waddell & Reed Financial, Inc., Class A | 1,250 | 19,975 |
| Total | | 356,959 |
The accompanying Notes to Financial Statements are an integral part of this statement.
| 72 | Columbia Capital Allocation Portfolios | Annual Report 2020 |
Portfolio of Investments (continued)
Columbia Capital Allocation Aggressive Portfolio, January 31, 2020
| Common Stocks (continued) |
| Issuer | Shares | Value ($) |
| Consumer Finance 0.0% |
| Encore Capital Group, Inc.(b) | 1,840 | 62,468 |
| Enova International, Inc.(b) | 2,475 | 62,023 |
| Nelnet, Inc., Class A | 425 | 24,336 |
| Regional Management Corp.(b) | 2,175 | 59,921 |
| Total | | 208,748 |
| Insurance 0.1% |
| Ageas | 1,336 | 73,669 |
| Allianz SE, Registered Shares | 746 | 178,103 |
| American Equity Investment Life Holding Co. | 1,960 | 51,764 |
| Assicurazioni Generali SpA | 7,198 | 140,258 |
| AXA SA | 2,409 | 64,059 |
| CNP Assurances | 3,337 | 60,067 |
| Dai-ichi Life Holdings, Inc. | 1,200 | 17,809 |
| Employers Holdings, Inc. | 1,590 | 67,813 |
| Genworth Financial, Inc., Class A(b) | 7,000 | 28,700 |
| iA Financial Corp., Inc. | 400 | 22,013 |
| Manulife Financial Corp. | 500 | 9,740 |
| Selective Insurance Group, Inc. | 180 | 11,925 |
| Swiss Life Holding AG, Registered Shares | 245 | 123,155 |
| Universal Insurance Holdings, Inc. | 981 | 23,878 |
| Total | | 872,953 |
| Mortgage Real Estate Investment Trusts (REITS) 0.0% |
| Ares Commercial Real Estate Corp. | 1,625 | 26,553 |
| Ellington Financial, Inc. | 3,175 | 58,007 |
| PennyMac Mortgage Investment Trust | 475 | 11,044 |
| Total | | 95,604 |
| Thrifts & Mortgage Finance 0.1% |
| Essent Group Ltd. | 1,810 | 89,794 |
| Federal Agricultural Mortgage Corp. | 810 | 61,803 |
| Flagstar Bancorp, Inc. | 1,750 | 61,670 |
| Meta Financial Group, Inc. | 1,860 | 69,229 |
| NMI Holdings, Inc., Class A(b) | 2,450 | 78,204 |
| Radian Group, Inc. | 3,825 | 93,675 |
| Total | | 454,375 |
| Total Financials | 3,809,954 |
| Common Stocks (continued) |
| Issuer | Shares | Value ($) |
| Health Care 0.4% |
| Biotechnology 0.1% |
| ACADIA Pharmaceuticals, Inc.(b) | 1,450 | 57,913 |
| Acceleron Pharma, Inc.(b) | 270 | 24,511 |
| Arcutis Biotherapeutics, Inc.(b) | 1,641 | 35,774 |
| Arena Pharmaceuticals, Inc.(b) | 1,310 | 59,854 |
| Arrowhead Pharmaceuticals, Inc.(b) | 540 | 22,631 |
| Atara Biotherapeutics, Inc.(b) | 1,080 | 14,288 |
| BeiGene Ltd., ADR(b) | 145 | 22,092 |
| Black Diamond Therapeutics, Inc.(b) | 1,003 | 37,612 |
| bluebird bio, Inc.(b) | 410 | 32,673 |
| Blueprint Medicines Corp.(b) | 490 | 31,090 |
| CSL Ltd. | 127 | 26,120 |
| Dynavax Technologies Corp.(b) | 4,950 | 24,998 |
| Fate Therapeutics, Inc.(b) | 1,160 | 29,418 |
| Global Blood Therapeutics, Inc.(b) | 330 | 21,536 |
| Gossamer Bio, Inc.(b) | 1,019 | 13,532 |
| Immunomedics, Inc.(b) | 3,370 | 62,581 |
| Insmed, Inc.(b) | 1,795 | 36,869 |
| Karuna Therapeutics, Inc.(b) | 105 | 9,966 |
| Mirati Therapeutics, Inc.(b) | 440 | 38,205 |
| Precision BioSciences, Inc.(b) | 1,937 | 15,670 |
| Rubius Therapeutics, Inc.(b) | 1,530 | 11,934 |
| Sage Therapeutics, Inc.(b) | 685 | 45,402 |
| Sarepta Therapeutics, Inc.(b) | 285 | 33,049 |
| SpringWorks Therapeutics, Inc.(b) | 1,471 | 46,307 |
| TCR2 Therapeutics, Inc.(b) | 1,930 | 28,332 |
| Turning Point Therapeutics, Inc.(b) | 731 | 42,763 |
| Ultragenyx Pharmaceutical, Inc.(b) | 290 | 15,240 |
| uniQure NV(b) | 585 | 33,673 |
| Total | | 874,033 |
| Health Care Equipment & Supplies 0.1% |
| Angiodynamics, Inc.(b) | 3,300 | 45,441 |
| CryoLife, Inc.(b) | 1,225 | 36,432 |
| Integer Holdings Corp.(b) | 920 | 78,568 |
| Lantheus Holdings, Inc.(b) | 3,475 | 60,847 |
| Meridian Bioscience, Inc. | 3,550 | 34,932 |
| Natus Medical, Inc.(b) | 2,000 | 62,580 |
| NuVasive, Inc.(b) | 490 | 37,789 |
The accompanying Notes to Financial Statements are an integral part of this statement.
Columbia Capital Allocation Portfolios | Annual Report 2020
| 73 |
Portfolio of Investments (continued)
Columbia Capital Allocation Aggressive Portfolio, January 31, 2020
| Common Stocks (continued) |
| Issuer | Shares | Value ($) |
| Quidel Corp.(b) | 610 | 46,848 |
| Varex Imaging Corp.(b) | 1,925 | 53,226 |
| Total | | 456,663 |
| Health Care Providers & Services 0.0% |
| Corvel Corp.(b) | 520 | 47,616 |
| Cross Country Healthcare, Inc.(b) | 3,150 | 31,185 |
| Magellan Health, Inc.(b) | 1,000 | 73,210 |
| Owens & Minor, Inc. | 1,700 | 10,642 |
| Tenet Healthcare Corp.(b) | 650 | 20,566 |
| Total | | 183,219 |
| Health Care Technology 0.0% |
| HealthStream, Inc.(b) | 2,350 | 60,043 |
| Omnicell, Inc.(b) | 980 | 79,654 |
| Total | | 139,697 |
| Life Sciences Tools & Services 0.0% |
| Medpace Holdings, Inc.(b) | 915 | 78,278 |
| Syneos Health, Inc.(b) | 1,500 | 92,040 |
| Total | | 170,318 |
| Pharmaceuticals 0.2% |
| Aerie Pharmaceuticals, Inc.(b) | 950 | 19,456 |
| Amphastar Pharmaceuticals, Inc.(b) | 2,800 | 52,948 |
| Astellas Pharma, Inc. | 8,800 | 155,497 |
| GlaxoSmithKline PLC | 7,459 | 175,133 |
| GW Pharmaceuticals PLC, ADR(b) | 395 | 45,634 |
| Horizon Therapeutics PLC(b) | 700 | 24,143 |
| Novartis AG, Registered Shares | 2,054 | 194,038 |
| Novo Nordisk A/S, Class B | 214 | 13,027 |
| Odonate Therapeutics, Inc.(b) | 1,200 | 35,040 |
| Prestige Consumer Healthcare, Inc.(b) | 1,750 | 70,980 |
| Reata Pharmaceuticals, Inc., Class A(b) | 350 | 76,576 |
| Roche Holding AG, Genusschein Shares | 727 | 243,886 |
| Supernus Pharmaceuticals, Inc.(b) | 775 | 17,724 |
| Total | | 1,124,082 |
| Total Health Care | 2,948,012 |
| Industrials 0.4% |
| Aerospace & Defense 0.0% |
| Safran SA | 66 | 10,642 |
| Common Stocks (continued) |
| Issuer | Shares | Value ($) |
| Air Freight & Logistics 0.0% |
| Echo Global Logistics, Inc.(b) | 1,675 | 32,461 |
| Radiant Logistics, Inc.(b) | 6,700 | 32,361 |
| Total | | 64,822 |
| Airlines 0.0% |
| Air Canada(b) | 3,200 | 107,190 |
| Qantas Airways Ltd. | 7,315 | 31,014 |
| Skywest, Inc. | 580 | 31,999 |
| Total | | 170,203 |
| Building Products 0.1% |
| American Woodmark Corp.(b) | 745 | 81,689 |
| Builders FirstSource, Inc.(b) | 3,325 | 82,443 |
| Caesarstone Ltd. | 2,875 | 37,605 |
| CSW Industrials, Inc. | 930 | 70,569 |
| Gibraltar Industries, Inc.(b) | 1,450 | 79,054 |
| Quanex Building Products Corp. | 3,725 | 66,007 |
| Total | | 417,367 |
| Commercial Services & Supplies 0.0% |
| Brady Corp., Class A | 830 | 45,957 |
| Deluxe Corp. | 730 | 35,186 |
| Herman Miller, Inc. | 1,600 | 61,840 |
| HNI Corp. | 1,620 | 58,271 |
| Total | | 201,254 |
| Construction & Engineering 0.1% |
| ACS Actividades de Construccion y Servicios SA | 2,850 | 94,754 |
| CIMIC Group Ltd. | 3,786 | 73,256 |
| EMCOR Group, Inc. | 965 | 79,294 |
| Great Lakes Dredge & Dock Corp.(b) | 6,130 | 64,181 |
| MasTec, Inc.(b) | 1,260 | 72,765 |
| Samsung Engineering Co., Ltd.(b) | 4,226 | 60,123 |
| Shimizu Corp. | 11,600 | 118,980 |
| Skanska AB, Class B | 540 | 12,499 |
| Total | | 575,852 |
| Electrical Equipment 0.0% |
| Atkore International Group, Inc.(b) | 1,990 | 79,003 |
| Industrial Conglomerates 0.0% |
| CITIC Ltd. | 60,000 | 67,847 |
The accompanying Notes to Financial Statements are an integral part of this statement.
| 74 | Columbia Capital Allocation Portfolios | Annual Report 2020 |
Portfolio of Investments (continued)
Columbia Capital Allocation Aggressive Portfolio, January 31, 2020
| Common Stocks (continued) |
| Issuer | Shares | Value ($) |
| Machinery 0.1% |
| GEA Group AG | 946 | 28,326 |
| Lydall, Inc.(b) | 2,125 | 43,435 |
| Mitsubishi Heavy Industries Ltd. | 2,800 | 102,137 |
| Mueller Industries, Inc. | 2,250 | 65,632 |
| Rexnord Corp.(b) | 1,275 | 41,629 |
| Sinotruk Hong Kong Ltd. | 23,500 | 40,350 |
| SPX Corp.(b) | 1,340 | 65,754 |
| Weichai Power Co., Ltd., Class H | 43,000 | 75,281 |
| Total | | 462,544 |
| Marine 0.0% |
| Costamare, Inc. | 7,100 | 56,303 |
| Professional Services 0.0% |
| Adecco Group AG, Registered Shares | 571 | 33,454 |
| Barrett Business Services, Inc. | 695 | 57,567 |
| FTI Consulting, Inc.(b) | 300 | 36,018 |
| Heidrick & Struggles International, Inc. | 1,880 | 53,430 |
| Kforce, Inc. | 1,860 | 68,913 |
| Wolters Kluwer NV | 263 | 19,762 |
| Total | | 269,144 |
| Road & Rail 0.0% |
| ArcBest Corp. | 1,120 | 24,987 |
| Aurizon Holdings Ltd. | 14,639 | 52,474 |
| Total | | 77,461 |
| Trading Companies & Distributors 0.1% |
| BMC Stock Holdings, Inc.(b) | 2,725 | 79,529 |
| Foundation Building Materials, Inc.(b) | 2,950 | 52,599 |
| GMS, Inc.(b) | 2,475 | 66,132 |
| MRC Global, Inc.(b) | 5,000 | 56,300 |
| Veritiv Corp.(b) | 3,925 | 55,264 |
| Total | | 309,824 |
| Transportation Infrastructure 0.0% |
| International Container Terminal Services, Inc. | 15,930 | 40,613 |
| Kamigumi Co., Ltd. | 2,800 | 59,829 |
| Total | | 100,442 |
| Total Industrials | 2,862,708 |
| Common Stocks (continued) |
| Issuer | Shares | Value ($) |
| Information Technology 0.3% |
| Communications Equipment 0.0% |
| ADTRAN, Inc. | 2,845 | 25,747 |
| Comtech Telecommunications Corp. | 1,370 | 39,607 |
| Telefonaktiebolaget LM Ericsson, Class B | 904 | 7,108 |
| Total | | 72,462 |
| Electronic Equipment, Instruments & Components 0.1% |
| Badger Meter, Inc. | 150 | 8,859 |
| Benchmark Electronics, Inc. | 2,140 | 65,869 |
| Methode Electronics, Inc. | 1,780 | 58,295 |
| Rogers Corp.(b) | 585 | 68,884 |
| Sanmina Corp.(b) | 2,300 | 73,232 |
| Vishay Intertechnology, Inc. | 3,900 | 79,131 |
| Vishay Precision Group, Inc.(b) | 1,835 | 63,381 |
| Zhen Ding Technology Holding Ltd. | 8,000 | 30,941 |
| Total | | 448,592 |
| IT Services 0.1% |
| Cardtronics PLC, Class A(b) | 1,790 | 80,550 |
| Cass Information Systems, Inc. | 248 | 13,397 |
| EVERTEC, Inc. | 2,100 | 70,497 |
| Hackett Group | 1,025 | 15,841 |
| KBR, Inc. | 2,400 | 65,280 |
| MAXIMUS, Inc. | 430 | 30,853 |
| NIC, Inc. | 3,025 | 59,683 |
| Otsuka Corp. | 700 | 27,296 |
| Perspecta, Inc. | 2,950 | 82,807 |
| TTEC Holdings, Inc. | 1,350 | 53,622 |
| Wipro Ltd. | 11,139 | 37,050 |
| Total | | 536,876 |
| Semiconductors & Semiconductor Equipment 0.1% |
| Advantest Corp. | 200 | 10,434 |
| Amkor Technology, Inc.(b) | 5,520 | 62,100 |
| Cirrus Logic, Inc.(b) | 110 | 8,449 |
| GlobalWafers Co., Ltd. | 4,000 | 51,597 |
| Novatek Microelectronics | 12,000 | 84,614 |
| Realtek Semiconductor Corp. | 8,000 | 64,276 |
| Synaptics, Inc.(b) | 1,220 | 81,362 |
| Tokyo Electron Ltd. | 700 | 153,962 |
The accompanying Notes to Financial Statements are an integral part of this statement.
Columbia Capital Allocation Portfolios | Annual Report 2020
| 75 |
Portfolio of Investments (continued)
Columbia Capital Allocation Aggressive Portfolio, January 31, 2020
| Common Stocks (continued) |
| Issuer | Shares | Value ($) |
| Ultra Clean Holdings, Inc.(b) | 2,825 | 65,003 |
| Xperi Corp. | 3,575 | 57,522 |
| Total | | 639,319 |
| Software 0.0% |
| CommVault Systems, Inc.(b) | 1,600 | 72,032 |
| j2 Global, Inc. | 958 | 91,834 |
| Progress Software Corp. | 1,795 | 81,008 |
| Qualys, Inc.(b) | 920 | 78,881 |
| SPS Commerce, Inc.(b) | 1,210 | 68,764 |
| Total | | 392,519 |
| Technology Hardware, Storage & Peripherals 0.0% |
| Chicony Electronics Co., Ltd. | 30,000 | 84,471 |
| FUJIFILM Holdings Corp. | 200 | 9,933 |
| Lenovo Group Ltd. | 82,000 | 53,505 |
| Lite-On Technology Corp. | 25,000 | 38,730 |
| Samsung Electronics Co., Ltd. | 3,979 | 184,359 |
| Total | | 370,998 |
| Total Information Technology | 2,460,766 |
| Materials 0.1% |
| Chemicals 0.0% |
| Chase Corp. | 225 | 20,693 |
| Covestro AG | 959 | 40,415 |
| Innospec, Inc. | 575 | 57,920 |
| Koppers Holdings, Inc.(b) | 450 | 14,121 |
| Solvay SA | 206 | 21,350 |
| Total | | 154,499 |
| Construction Materials 0.0% |
| Anhui Conch Cement Co., Ltd., Class H | 8,500 | 54,253 |
| Asia Cement Corp. | 19,000 | 28,261 |
| U.S. Concrete, Inc.(b) | 1,540 | 54,809 |
| Total | | 137,323 |
| Metals & Mining 0.1% |
| Anglo American PLC | 864 | 22,545 |
| BHP Group Ltd. | 5,692 | 145,965 |
| Commercial Metals Co. | 1,950 | 40,073 |
| Fortescue Metals Group Ltd. | 10,714 | 79,367 |
| Kirkland Lake Gold Ltd. | 400 | 16,403 |
| Materion Corp. | 1,080 | 58,644 |
| Common Stocks (continued) |
| Issuer | Shares | Value ($) |
| MMC Norilsk Nickel PJSC | 158 | 51,223 |
| Rio Tinto PLC | 2,759 | 147,535 |
| Schnitzer Steel Industries, Inc., Class A | 2,775 | 44,622 |
| Vale SA | 700 | 8,235 |
| Total | | 614,612 |
| Paper & Forest Products 0.0% |
| Schweitzer-Mauduit International, Inc. | 1,800 | 63,054 |
| Verso Corp., Class A(b) | 3,950 | 66,557 |
| Total | | 129,611 |
| Total Materials | 1,036,045 |
| Real Estate 0.2% |
| Equity Real Estate Investment Trusts (REITS) 0.1% |
| Alexander’s, Inc. | 24 | 7,744 |
| American Assets Trust, Inc. | 1,400 | 63,784 |
| Ashford Hospitality Trust, Inc. | 16,200 | 39,852 |
| CoreCivic, Inc. | 3,400 | 54,230 |
| CorEnergy Infrastructure Trust, Inc. | 1,418 | 64,661 |
| EastGroup Properties, Inc. | 670 | 91,167 |
| Fortress REIT Ltd., Class A | 54,351 | 66,814 |
| GEO Group, Inc. (The) | 1,650 | 26,070 |
| Independence Realty Trust, Inc. | 2,600 | 38,142 |
| Investors Real Estate Trust | 939 | 69,204 |
| Klepierre | 1,106 | 37,595 |
| Lexington Realty Trust | 6,800 | 75,276 |
| PS Business Parks, Inc. | 482 | 80,764 |
| Retail Value, Inc. | 1,843 | 60,579 |
| Ryman Hospitality Properties, Inc. | 185 | 15,731 |
| Uniti Group, Inc. | 7,650 | 48,424 |
| Washington Prime Group, Inc. | 4,800 | 14,448 |
| Xenia Hotels & Resorts, Inc. | 2,350 | 43,922 |
| Total | | 898,407 |
| Real Estate Management & Development 0.1% |
| Aldar Properties PJSC | 27,488 | 16,604 |
| China Aoyuan Group Ltd. | 14,000 | 18,657 |
| Daito Trust Construction Co., Ltd. | 100 | 11,780 |
| Emaar Properties PJSC | 40,890 | 44,619 |
| Logan Property Holdings Co., Ltd. | 24,000 | 36,278 |
The accompanying Notes to Financial Statements are an integral part of this statement.
| 76 | Columbia Capital Allocation Portfolios | Annual Report 2020 |
Portfolio of Investments (continued)
Columbia Capital Allocation Aggressive Portfolio, January 31, 2020
| Common Stocks (continued) |
| Issuer | Shares | Value ($) |
| RE/MAX Holdings, Inc., Class A | 230 | 8,804 |
| RMR Group, Inc. (The), Class A | 1,280 | 58,970 |
| Total | | 195,712 |
| Total Real Estate | 1,094,119 |
| Utilities 0.1% |
| Electric Utilities 0.0% |
| Endesa SA | 953 | 26,167 |
| Enel SpA | 4,214 | 36,731 |
| Manila Electric Co. | 3,290 | 16,570 |
| Otter Tail Corp. | 140 | 7,498 |
| Portland General Electric Co. | 1,589 | 97,723 |
| Total | | 184,689 |
| Gas Utilities 0.1% |
| Chesapeake Utilities Corp. | 695 | 66,866 |
| Naturgy Energy Group SA | 4,619 | 121,825 |
| PT Perusahaan Gas Negara Persero Tbk | 526,200 | 65,216 |
| Southwest Gas Holdings, Inc. | 960 | 72,490 |
| Total | | 326,397 |
| Independent Power and Renewable Electricity Producers 0.0% |
| Colbun SA | 261,058 | 38,002 |
| Multi-Utilities 0.0% |
| Avista Corp. | 1,470 | 74,750 |
| NorthWestern Corp. | 920 | 70,812 |
| Unitil Corp. | 510 | 31,462 |
| Total | | 177,024 |
| Total Utilities | 726,112 |
Total Common Stocks
(Cost $19,190,859) | 20,059,221 |
|
| Equity Funds 69.9% |
| | Shares | Value ($) |
| International 18.1% |
| Columbia Contrarian Europe Fund, Institutional 3 Class(a) | 2,887,944 | 20,071,212 |
| Columbia Emerging Markets Fund, Institutional 3 Class(a) | 3,279,894 | 45,721,727 |
| Columbia Overseas Core Fund, Institutional 3 Class(a) | 2,368,454 | 23,187,169 |
| Columbia Overseas Value Fund, Institutional 3 Class(a) | 1,640,352 | 15,353,690 |
| Columbia Pacific/Asia Fund, Institutional 3 Class(a) | 2,789,138 | 28,058,727 |
| Total | 132,392,525 |
| Equity Funds (continued) |
| | Shares | Value ($) |
| U.S. Large Cap 48.5% |
| Columbia Contrarian Core Fund, Institutional 3 Class(a) | 1,921,553 | 52,765,841 |
| Columbia Disciplined Core Fund, Institutional 3 Class(a) | 4,166,459 | 49,872,512 |
| Columbia Disciplined Growth Fund, Institutional 3 Class(a) | 4,561,741 | 43,473,391 |
| Columbia Disciplined Value Fund, Institutional 3 Class(a) | 7,912,404 | 72,240,247 |
| Columbia Large Cap Growth Fund, Institutional 3 Class(a),(b) | 475,871 | 22,423,045 |
| Columbia Select Large Cap Equity Fund, Institutional 3 Class(a) | 3,458,973 | 52,022,964 |
| Columbia Select Large Cap Growth Fund, Institutional 3 Class(a),(b) | 2,493,260 | 35,080,163 |
| Columbia Select Large Cap Value Fund, Institutional 3 Class(a) | 1,005,384 | 26,290,793 |
| Total | 354,168,956 |
| U.S. Small Cap 3.3% |
| Columbia Select Small Cap Value Fund, Institutional 3 Class(a) | 404,497 | 8,365,011 |
| Columbia Small Cap Growth Fund I, Institutional 3 Class(a),(b) | 172,478 | 3,706,551 |
| Columbia Small Cap Index Fund, Institutional 3 Class(a) | 527,094 | 11,611,874 |
| Total | 23,683,436 |
Total Equity Funds
(Cost $453,095,958) | 510,244,917 |
|
| Fixed Income Funds 12.7% |
| | |
| Emerging Markets 0.5% |
| Columbia Emerging Markets Bond Fund, Institutional 3 Class(a) | 315,946 | 3,633,379 |
| High Yield 5.4% |
| Columbia High Yield Bond Fund, Institutional 3 Class(a) | 8,133,162 | 24,155,491 |
| Columbia Income Opportunities Fund, Institutional 3 Class(a) | 1,542,999 | 15,507,138 |
| Total | 39,662,629 |
The accompanying Notes to Financial Statements are an integral part of this statement.
Columbia Capital Allocation Portfolios | Annual Report 2020
| 77 |
Portfolio of Investments (continued)
Columbia Capital Allocation Aggressive Portfolio, January 31, 2020
| Fixed Income Funds (continued) |
| | Shares | Value ($) |
| Investment Grade 6.8% |
| Columbia Corporate Income Fund, Institutional 3 Class(a) | 2,528,421 | 27,610,354 |
| Columbia Mortgage Opportunities Fund, Institutional 3 Class(a) | 419,216 | 4,259,240 |
| Columbia Quality Income Fund, Institutional 3 Class(a) | 1,593,558 | 8,923,924 |
| Columbia U.S. Treasury Index Fund, Institutional 3 Class(a) | 730,517 | 8,547,050 |
| Total | 49,340,568 |
Total Fixed Income Funds
(Cost $88,684,153) | 92,636,576 |
| Preferred Stocks 0.0% |
| Issuer | | Shares | Value ($) |
| Utilities 0.0% |
| Electric Utilities 0.0% |
| Cia Energetica de Minas Gerais | | 3,600 | 12,576 |
| Total Utilities | 12,576 |
Total Preferred Stocks
(Cost $12,410) | 12,576 |
| Money Market Funds 9.7% |
| | Shares | Value ($) |
| Columbia Government Money Market Fund, Institutional 3 Class, 1.151%(a),(d) | 9,442,368 | 9,442,368 |
| Columbia Short-Term Cash Fund, 1.648%(a),(d) | 61,462,818 | 61,462,818 |
Total Money Market Funds
(Cost $70,900,275) | 70,905,186 |
Total Investments in Securities
(Cost: $664,986,713) | 722,828,531 |
| Other Assets & Liabilities, Net | | 7,600,122 |
| Net Assets | 730,428,653 |
At January 31, 2020, securities and/or cash totaling $9,795,618 were pledged as collateral.
Investments in derivatives
| Forward foreign currency exchange contracts |
Currency to
be sold | Currency to
be purchased | Counterparty | Settlement
date | Unrealized
appreciation ($) | Unrealized
depreciation ($) |
| 98,000 AUD | 66,197 USD | Morgan Stanley | 03/26/2020 | 533 | — |
| 36,000 EUR | 39,753 USD | Morgan Stanley | 03/26/2020 | — | (301) |
| 290,000 ILS | 84,230 USD | Morgan Stanley | 03/26/2020 | — | (1) |
| 198,186,000 KRW | 168,155 USD | Morgan Stanley | 03/26/2020 | 2,335 | — |
| 669,000 MXN | 35,501 USD | Morgan Stanley | 03/26/2020 | 364 | — |
| 325,000 MYR | 79,397 USD | Morgan Stanley | 03/26/2020 | 356 | — |
| 4,915,000 TWD | 163,871 USD | Morgan Stanley | 03/26/2020 | 1,655 | — |
| 52,913 USD | 224,000 BRL | Morgan Stanley | 03/26/2020 | — | (751) |
| 44,350 USD | 300,000 DKK | Morgan Stanley | 03/26/2020 | 334 | — |
| 133,012 USD | 102,000 GBP | Morgan Stanley | 03/26/2020 | 1,866 | — |
| 88,599 USD | 6,352,000 INR | Morgan Stanley | 03/26/2020 | — | (444) |
| 26,510 USD | 243,000 NOK | Morgan Stanley | 03/26/2020 | — | (85) |
| 70,572 USD | 96,000 SGD | Morgan Stanley | 03/26/2020 | — | (212) |
| 1,042,000 ZAR | 70,724 USD | Morgan Stanley | 03/26/2020 | 1,771 | — |
| Total | | | | 9,214 | (1,794) |
The accompanying Notes to Financial Statements are an integral part of this statement.
| 78 | Columbia Capital Allocation Portfolios | Annual Report 2020 |
Portfolio of Investments (continued)
Columbia Capital Allocation Aggressive Portfolio, January 31, 2020
| Long futures contracts |
| Description | Number of
contracts | Expiration
date | Trading
currency | Notional
amount | Value/Unrealized
appreciation ($) | Value/Unrealized
depreciation ($) |
| CAC40 Index | 75 | 02/2020 | EUR | 4,353,000 | — | (186,454) |
| EURO STOXX 50 Index | 189 | 03/2020 | EUR | 6,877,710 | — | (258,932) |
| FTSE 100 Index | 93 | 03/2020 | GBP | 6,712,275 | — | (407,014) |
| FTSE/MIB Index | 76 | 03/2020 | EUR | 8,823,220 | — | (206,171) |
| MSCI EAFE Index Future | 125 | 03/2020 | USD | 12,353,125 | — | (158,200) |
| Russell 2000 Index E-mini | 1 | 03/2020 | USD | 80,735 | — | (1,703) |
| S&P 500 Index E-mini | 447 | 03/2020 | USD | 72,056,400 | 1,743,309 | — |
| U.S. Treasury 10-Year Note | 74 | 03/2020 | USD | 9,742,563 | 158,258 | — |
| U.S. Treasury 5-Year Note | 19 | 03/2020 | USD | 2,286,086 | 25,347 | — |
| U.S. Ultra Treasury Bond | 52 | 03/2020 | USD | 10,071,750 | 370,390 | — |
| Total | | | | | 2,297,304 | (1,218,474) |
| Short futures contracts |
| Description | Number of
contracts | Expiration
date | Trading
currency | Notional
amount | Value/Unrealized
appreciation ($) | Value/Unrealized
depreciation ($) |
| MSCI Emerging Markets Index | (313) | 03/2020 | USD | (16,434,065) | 512,872 | — |
| Russell 2000 Index E-mini | (35) | 03/2020 | USD | (2,825,725) | 38,501 | — |
| TOPIX Index | (82) | 03/2020 | JPY | (1,376,780,000) | 311,357 | — |
| Total | | | | | 862,730 | — |
| Cleared credit default swap contracts - sell protection |
Reference
entity | Counterparty | Maturity
date | Receive
fixed
rate
(%) | Payment
frequency | Implied
credit
spread
(%)* | Notional
currency | Notional
amount | Value
($) | Upfront
payments
($) | Upfront
receipts
($) | Unrealized
appreciation
($) | Unrealized
depreciation
($) |
| Markit CDX Emerging Markets Index, Series 32 | Morgan Stanley | 12/20/2024 | 1.000 | Quarterly | 1.972 | USD | 26,154,000 | 49,504 | — | — | 49,504 | — |
| * | Implied credit spreads, represented in absolute terms, utilized in determining the market value of credit default swap agreements on corporate or sovereign issues as of period end serve as an indicator of the current status of the payment/performance risk and represent the likelihood or risk of default for the credit derivative. The implied credit spread of a particular referenced entity reflects the cost of buying/selling protection and may include upfront payments required to be made to enter into the agreement. Wider credit spreads represent a deterioration of the referenced entity’s credit soundness and a greater likelihood or risk of default or other credit event occurring as defined under the terms of the agreement. |
Notes to Portfolio of Investments
| (a) | As defined in the Investment Company Act of 1940, an affiliated company is one in which the Fund owns 5% or more of the company’s outstanding voting securities, or a company which is under common ownership or control with the Fund. Holdings and transactions in these affiliated companies during the year ended January 31, 2020 are as follows: |
| Issuer | Beginning
shares | Shares
purchased | Shares
sold | Ending
shares | Capital gain
distributions —
affiliated
issuers ($) | Realized gain
(loss) —
affiliated
issuers ($) | Net change in
unrealized
appreciation
(depreciation) —
affiliated
issuers ($) | Dividends —
affiliated
issuers ($) | Value —
affiliated
issuers
at end of
period ($) |
| Columbia Commodity Strategy Fund, Institutional 3 Class |
| | 2,114,936 | 80,094 | (90) | 2,194,940 | — | (112) | (592,221) | 117,855 | 9,109,001 |
| Columbia Contrarian Core Fund, Institutional 3 Class |
| | 2,099,771 | 113,222 | (291,440) | 1,921,553 | 2,388,235 | 2,984,023 | 4,647,744 | 601,947 | 52,765,841 |
| Columbia Contrarian Europe Fund, Institutional 3 Class |
| | 3,126,243 | 70,946 | (309,245) | 2,887,944 | — | 371,621 | 2,194,149 | 490,188 | 20,071,212 |
| Columbia Corporate Income Fund, Institutional 3 Class |
| | 2,659,607 | 107,868 | (239,054) | 2,528,421 | — | 150,225 | 2,579,233 | 898,642 | 27,610,354 |
| Columbia Disciplined Core Fund, Institutional 3 Class |
| | 4,124,865 | 408,244 | (366,650) | 4,166,459 | 4,049,008 | 2,827,721 | (670,597) | 739,688 | 49,872,512 |
The accompanying Notes to Financial Statements are an integral part of this statement.
Columbia Capital Allocation Portfolios | Annual Report 2020
| 79 |
Portfolio of Investments (continued)
Columbia Capital Allocation Aggressive Portfolio, January 31, 2020
Notes to Portfolio of Investments (continued)
| Issuer | Beginning
shares | Shares
purchased | Shares
sold | Ending
shares | Capital gain
distributions —
affiliated
issuers ($) | Realized gain
(loss) —
affiliated
issuers ($) | Net change in
unrealized
appreciation
(depreciation) —
affiliated
issuers ($) | Dividends —
affiliated
issuers ($) | Value —
affiliated
issuers
at end of
period ($) |
| Columbia Disciplined Growth Fund, Institutional 3 Class |
| | 5,487,051 | 676,363 | (1,601,673) | 4,561,741 | 2,870,269 | (1,439,480) | 5,043,767 | 312,546 | 43,473,391 |
| Columbia Disciplined Value Fund, Institutional 3 Class |
| | 7,413,740 | 2,298,955 | (1,800,291) | 7,912,404 | 5,915,231 | 1,215,279 | (2,032,885) | 1,508,148 | 72,240,247 |
| Columbia Emerging Markets Bond Fund, Institutional 3 Class |
| | 313,564 | 14,588 | (12,206) | 315,946 | — | 2,149 | 152,970 | 132,419 | 3,633,379 |
| Columbia Emerging Markets Fund, Institutional 3 Class |
| | 3,683,148 | 17,771 | (421,025) | 3,279,894 | — | 1,361,189 | 5,359,020 | 240,506 | 45,721,727 |
| Columbia Government Money Market Fund, Institutional 3 Class, 1.151% |
| | 9,107,990 | 349,634 | (15,256) | 9,442,368 | 2,981 | — | — | 169,253 | 9,442,368 |
| Columbia High Yield Bond Fund, Institutional 3 Class |
| | 8,189,532 | 480,745 | (537,115) | 8,133,162 | — | (36,167) | 1,258,468 | 1,248,242 | 24,155,491 |
| Columbia Income Opportunities Fund, Institutional 3 Class |
| | 1,554,387 | 88,490 | (99,878) | 1,542,999 | — | 29,395 | 790,363 | 769,282 | 15,507,138 |
| Columbia Large Cap Growth Fund, Institutional 3 Class |
| | 522,971 | 37,985 | (85,085) | 475,871 | 1,677,614 | 2,530,977 | 1,035,661 | — | 22,423,045 |
| Columbia Mortgage Opportunities Fund, Institutional 3 Class |
| | 409,968 | 23,590 | (14,342) | 419,216 | 34,311 | 3,715 | 80,548 | 146,108 | 4,259,240 |
| Columbia Multi Strategy Alternatives Fund, Institutional 3 Class |
| | 468,857 | — | — | 468,857 | — | — | (276,625) | — | 3,450,790 |
| Columbia Multi-Asset Income Fund, Institutional 3 Class |
| | 1,596,299 | 98,976 | — | 1,695,275 | — | — | 969,860 | 930,051 | 16,410,264 |
| Columbia Overseas Core Fund, Institutional 3 Class |
| | 2,453,845 | 96,333 | (181,724) | 2,368,454 | 87,701 | (86,685) | 1,679,901 | 840,360 | 23,187,169 |
| Columbia Overseas Value Fund, Institutional 3 Class |
| | 1,666,059 | 67,706 | (93,413) | 1,640,352 | 30,918 | 58,773 | 590,718 | 585,319 | 15,353,690 |
| Columbia Pacific/Asia Fund, Institutional 3 Class |
| | 2,919,950 | 202,857 | (333,669) | 2,789,138 | 1,333,484 | 684,580 | 1,458,589 | 676,667 | 28,058,727 |
| Columbia Quality Income Fund, Institutional 3 Class |
| | 1,586,383 | 68,755 | (61,580) | 1,593,558 | — | (2,229) | 353,940 | 264,522 | 8,923,924 |
| Columbia Select Large Cap Equity Fund, Institutional 3 Class |
| | 3,692,949 | 201,065 | (435,041) | 3,458,973 | 2,190,962 | 492,367 | 6,031,428 | 622,391 | 52,022,964 |
| Columbia Select Large Cap Growth Fund, Institutional 3 Class |
| | 2,158,640 | 681,402 | (346,782) | 2,493,260 | 9,378,561 | 655,310 | (3,360,297) | — | 35,080,163 |
| Columbia Select Large Cap Value Fund, Institutional 3 Class |
| | 1,015,121 | 68,761 | (78,498) | 1,005,384 | 1,278,459 | 891,984 | (27,119) | 521,490 | 26,290,793 |
| Columbia Select Small Cap Value Fund, Institutional 3 Class |
| | 407,738 | 3,076 | (6,317) | 404,497 | 1,676 | 40,061 | 360,355 | 34,005 | 8,365,011 |
| Columbia Short-Term Cash Fund, 1.648% |
| | 54,617,720 | 58,046,974 | (51,201,876) | 61,462,818 | — | (428) | 6,152 | 1,289,439 | 61,462,818 |
| Columbia Small Cap Growth Fund I, Institutional 3 Class |
| | 188,796 | 14,706 | (31,024) | 172,478 | 297,187 | (87,174) | 609,425 | — | 3,706,551 |
The accompanying Notes to Financial Statements are an integral part of this statement.
| 80 | Columbia Capital Allocation Portfolios | Annual Report 2020 |
Portfolio of Investments (continued)
Columbia Capital Allocation Aggressive Portfolio, January 31, 2020
Notes to Portfolio of Investments (continued)
| Issuer | Beginning
shares | Shares
purchased | Shares
sold | Ending
shares | Capital gain
distributions —
affiliated
issuers ($) | Realized gain
(loss) —
affiliated
issuers ($) | Net change in
unrealized
appreciation
(depreciation) —
affiliated
issuers ($) | Dividends —
affiliated
issuers ($) | Value —
affiliated
issuers
at end of
period ($) |
| Columbia Small Cap Index Fund, Institutional 3 Class |
| | 493,361 | 33,733 | — | 527,094 | 602,003 | — | (49,670) | 151,327 | 11,611,874 |
| Columbia U.S. Treasury Index Fund, Institutional 3 Class |
| | 743,359 | 26,613 | (39,455) | 730,517 | — | 32,520 | 500,545 | 172,937 | 8,547,050 |
| Total | | | | | 32,138,600 | 12,679,614 | 28,693,422 | 13,463,332 | 702,756,734 |
| (b) | Non-income producing investment. |
| (c) | Represents privately placed and other securities and instruments exempt from Securities and Exchange Commission registration (collectively, private placements), such as Section 4(a)(2) and Rule 144A eligible securities, which are often sold only to qualified institutional buyers. The Fund may invest in private placements determined to be liquid as well as those determined to be illiquid. Private placements may be determined to be liquid under guidelines established by the Fund’s Board of Trustees. At January 31, 2020, the total value of these securities amounted to $122,746, which represents 0.02% of total net assets. |
| (d) | The rate shown is the seven-day current annualized yield at January 31, 2020. |
Abbreviation Legend
| ADR | American Depositary Receipt |
Currency Legend
| AUD | Australian Dollar |
| BRL | Brazilian Real |
| DKK | Danish Krone |
| EUR | Euro |
| GBP | British Pound |
| ILS | New Israeli Sheqel |
| INR | Indian Rupee |
| JPY | Japanese Yen |
| KRW | South Korean Won |
| MXN | Mexican Peso |
| MYR | Malaysian Ringgit |
| NOK | Norwegian Krone |
| SGD | Singapore Dollar |
| TWD | New Taiwan Dollar |
| USD | US Dollar |
| ZAR | South African Rand |
Fair value measurements
The Fund categorizes its fair value measurements according to a three-level hierarchy that maximizes the use of observable inputs and minimizes the use of unobservable inputs by prioritizing that the most observable input be used when available. Observable inputs are those that market participants would use in pricing an investment based on market data obtained from sources independent of the reporting entity. Unobservable inputs are those that reflect the Fund’s assumptions about the information market participants would use in pricing an investment. An investment’s level within the fair value hierarchy is based on the lowest level of any input that is deemed significant to the asset’s or liability’s fair value measurement. The input levels are not necessarily an indication of the risk or liquidity associated with investments at that level. For example, certain U.S. government securities are generally high quality and liquid, however, they are reflected as Level 2 because the inputs used to determine fair value may not always be quoted prices in an active market.
Fair value inputs are summarized in the three broad levels listed below:
| ■ | Level 1 — Valuations based on quoted prices for investments in active markets that the Fund has the ability to access at the measurement date. Valuation adjustments are not applied to Level 1 investments. |
| ■ | Level 2 — Valuations based on other significant observable inputs (including quoted prices for similar securities, interest rates, prepayment speeds, credit risks, etc.). |
| ■ | Level 3 — Valuations based on significant unobservable inputs (including the Fund’s own assumptions and judgment in determining the fair value of investments). |
The accompanying Notes to Financial Statements are an integral part of this statement.
Columbia Capital Allocation Portfolios | Annual Report 2020
| 81 |
Portfolio of Investments (continued)
Columbia Capital Allocation Aggressive Portfolio, January 31, 2020
Fair value measurements (continued)
Inputs that are used in determining fair value of an investment may include price information, credit data, volatility statistics, and other factors. These inputs can be either observable or unobservable. The availability of observable inputs can vary between investments, and is affected by various factors such as the type of investment, and the volume and level of activity for that investment or similar investments in the marketplace. The inputs will be considered by the Investment Manager, along with any other relevant factors in the calculation of an investment’s fair value. The Fund uses prices and inputs that are current as of the measurement date, which may include periods of market dislocations. During these periods, the availability of prices and inputs may be reduced for many investments. This condition could cause an investment to be reclassified between the various levels within the hierarchy.
Foreign equity securities actively traded in markets where there is a significant delay in the local close relative to the New York Stock Exchange are classified as Level 2. The values of these securities may include an adjustment to reflect the impact of market movements following the close of local trading, as described in Note 2 to the financial statements – Security valuation.
Investments falling into the Level 3 category are primarily supported by quoted prices from brokers and dealers participating in the market for those investments. However, these may be classified as Level 3 investments due to lack of market transparency and corroboration to support these quoted prices. Additionally, valuation models may be used as the pricing source for any remaining investments classified as Level 3. These models may rely on one or more significant unobservable inputs and/or significant assumptions by the Investment Manager. Inputs used in valuations may include, but are not limited to, financial statement analysis, capital account balances, discount rates and estimated cash flows, and comparable company data.
Under the direction of the Fund’s Board of Trustees (the Board), the Investment Manager’s Valuation Committee (the Committee) is responsible for overseeing the valuation procedures approved by the Board. The Committee consists of voting and non-voting members from various groups within the Investment Manager’s organization, including operations and accounting, trading and investments, compliance, risk management and legal.
The Committee meets at least monthly to review and approve valuation matters, which may include a description of specific valuation determinations, data regarding pricing information received from approved pricing vendors and brokers and the results of Board-approved valuation control policies and procedures (the Policies). The Policies address, among other things, instances when market quotations are or are not readily available, including recommendations of third party pricing vendors and a determination of appropriate pricing methodologies; events that require specific valuation determinations and assessment of fair value techniques; securities with a potential for stale pricing, including those that are illiquid, restricted, or in default; and the effectiveness of third party pricing vendors, including periodic reviews of vendors. The Committee meets more frequently, as needed, to discuss additional valuation matters, which may include the need to review back-testing results, review time-sensitive information or approve related valuation actions. The Committee reports to the Board, with members of the Committee meeting with the Board at each of its regularly scheduled meetings to discuss valuation matters and actions during the period, similar to those described earlier.
The following table is a summary of the inputs used to value the Fund’s investments at January 31, 2020:
| | Level 1 ($) | Level 2 ($) | Level 3 ($) | Total ($) |
| Investments in Securities | | | | |
| Alternative Strategies Funds | 28,970,055 | — | — | 28,970,055 |
| Common Stocks | | | | |
| Communication Services | 289,612 | 509,176 | — | 798,788 |
| Consumer Discretionary | 1,542,563 | 769,815 | — | 2,312,378 |
| Consumer Staples | 532,059 | 631,068 | — | 1,163,127 |
| Energy | 545,694 | 301,518 | — | 847,212 |
| Financials | 2,262,639 | 1,547,315 | — | 3,809,954 |
| Health Care | 2,140,311 | 807,701 | — | 2,948,012 |
| Industrials | 1,941,367 | 921,341 | — | 2,862,708 |
| Information Technology | 1,622,490 | 838,276 | — | 2,460,766 |
| Materials | 445,131 | 590,914 | — | 1,036,045 |
| Real Estate | 861,772 | 232,347 | — | 1,094,119 |
| Utilities | 459,603 | 266,509 | — | 726,112 |
| Total Common Stocks | 12,643,241 | 7,415,980 | — | 20,059,221 |
| Equity Funds | 510,244,917 | — | — | 510,244,917 |
| Fixed Income Funds | 92,636,576 | — | — | 92,636,576 |
| Preferred Stocks | | | | |
| Utilities | 12,576 | — | — | 12,576 |
| Total Preferred Stocks | 12,576 | — | — | 12,576 |
| Money Market Funds | 70,905,186 | — | — | 70,905,186 |
| Total Investments in Securities | 715,412,551 | 7,415,980 | — | 722,828,531 |
| Investments in Derivatives | | | | |
| Asset | | | | |
| Forward Foreign Currency Exchange Contracts | — | 9,214 | — | 9,214 |
| Futures Contracts | 3,160,034 | — | — | 3,160,034 |
| Swap Contracts | — | 49,504 | — | 49,504 |
| Liability | | | | |
| Forward Foreign Currency Exchange Contracts | — | (1,794) | — | (1,794) |
| Futures Contracts | (1,218,474) | — | — | (1,218,474) |
| Total | 717,354,111 | 7,472,904 | — | 724,827,015 |
The accompanying Notes to Financial Statements are an integral part of this statement.
| 82 | Columbia Capital Allocation Portfolios | Annual Report 2020 |
Portfolio of Investments (continued)
Columbia Capital Allocation Aggressive Portfolio, January 31, 2020
Fair value measurements (continued)
See the Portfolio of Investments for all investment classifications not indicated in the table.
The Fund’s assets assigned to the Level 2 input category are generally valued using the market approach, in which a security’s value is determined through reference to prices and information from market transactions for similar or identical assets. These assets include certain foreign securities for which a third party statistical pricing service may be employed for purposes of fair market valuation. The model utilized by such third party statistical pricing service takes into account a security’s correlation to available market data including, but not limited to, intraday index, ADR, and exchange-traded fund movements.
Derivative instruments are valued at unrealized appreciation (depreciation).
The accompanying Notes to Financial Statements are an integral part of this statement.
Columbia Capital Allocation Portfolios | Annual Report 2020
| 83 |
Statement of Assets and Liabilities
January 31, 2020
| | Columbia
Capital
Allocation
Conservative
Portfolio | Columbia
Capital
Allocation
Moderate
Conservative
Portfolio | Columbia
Capital
Allocation
Moderate
Portfolio |
| Assets | | | |
| Investments in securities, at value | | | |
| Unaffiliated issuers (cost $9,108,159, $14,337,408, $32,085,064, respectively) | $9,674,029 | $15,199,384 | $33,677,288 |
| Affiliated issuers (cost $206,861,516, $479,246,588, $1,370,332,336, respectively) | 213,631,958 | 497,139,533 | 1,448,692,103 |
| Cash | — | 5,574 | — |
| Foreign currency (cost $—, $—, $19,772, respectively) | — | — | 19,771 |
| Margin deposits on: | | | |
| Futures contracts | 935,654 | 2,880,002 | 10,253,383 |
| Swap contracts | 321,997 | 746,429 | 3,183,238 |
| Unrealized appreciation on forward foreign currency exchange contracts | 2,630 | 4,101 | 11,231 |
| Receivable for: | | | |
| Investments sold | 119,090 | 506,714 | 752,511 |
| Capital shares sold | 336,242 | 455,338 | 1,044,662 |
| Dividends | 312,780 | 624,109 | 1,708,448 |
| Foreign tax reclaims | 16,692 | 26,589 | 16,754 |
| Variation margin for futures contracts | 142,094 | 323,191 | 860,067 |
| Prepaid expenses | 1,715 | 2,222 | 3,828 |
| Total assets | 225,494,881 | 517,913,186 | 1,500,223,284 |
| Liabilities | | | |
| Unrealized depreciation on forward foreign currency exchange contracts | 6 | 10 | 2,219 |
| Payable for: | | | |
| Investments purchased | 285,669 | 559,924 | 1,693,058 |
| Capital shares purchased | 490,255 | 1,156,196 | 1,687,142 |
| Variation margin for futures contracts | 119,960 | 639,228 | 3,543,707 |
| Variation margin for swap contracts | 3,888 | 9,014 | 38,441 |
| Management services fees | 738 | 1,528 | 3,378 |
| Distribution and/or service fees | 1,930 | 4,517 | 13,104 |
| Transfer agent fees | 16,371 | 35,024 | 89,428 |
| Compensation of board members | 85,840 | 50,815 | 72,740 |
| Compensation of chief compliance officer | 51 | 117 | 329 |
| Other expenses | 48,289 | 59,277 | 98,242 |
| Total liabilities | 1,052,997 | 2,515,650 | 7,241,788 |
| Net assets applicable to outstanding capital stock | $224,441,884 | $515,397,536 | $1,492,981,496 |
| Represented by | | | |
| Paid in capital | 215,539,161 | 485,308,058 | 1,368,980,097 |
| Total distributable earnings (loss) | 8,902,723 | 30,089,478 | 124,001,399 |
| Total - representing net assets applicable to outstanding capital stock | $224,441,884 | $515,397,536 | $1,492,981,496 |
The accompanying Notes to Financial Statements are an integral part of this statement.
| 84 | Columbia Capital Allocation Portfolios | Annual Report 2020 |
Statement of Assets and Liabilities (continued)
January 31, 2020
| | Columbia
Capital
Allocation
Conservative
Portfolio | Columbia
Capital
Allocation
Moderate
Conservative
Portfolio | Columbia
Capital
Allocation
Moderate
Portfolio |
| Class A | | | |
| Net assets | $180,337,984 | $425,705,974 | $1,280,252,725 |
| Shares outstanding | 17,492,993 | 38,805,724 | 113,082,736 |
| Net asset value per share | $10.31 | $10.97 | $11.32 |
| Maximum sales charge | 4.75% | 5.75% | 5.75% |
| Maximum offering price per share (calculated by dividing the net asset value per share by 1.0 minus the maximum sales charge for Class A shares) | $10.82 | $11.64 | $12.01 |
| Advisor Class | | | |
| Net assets | $6,012,429 | $5,319,471 | $3,051,272 |
| Shares outstanding | 587,355 | 489,693 | 273,247 |
| Net asset value per share | $10.24 | $10.86 | $11.17 |
| Class C | | | |
| Net assets | $24,949,422 | $57,071,986 | $153,545,290 |
| Shares outstanding | 2,435,136 | 5,285,109 | 13,691,066 |
| Net asset value per share | $10.25 | $10.80 | $11.21 |
| Institutional Class | | | |
| Net assets | $9,128,298 | $16,489,789 | $37,111,784 |
| Shares outstanding | 885,851 | 1,526,459 | 3,282,552 |
| Net asset value per share | $10.30 | $10.80 | $11.31 |
| Institutional 2 Class | | | |
| Net assets | $966,377 | $3,682,582 | $5,447,108 |
| Shares outstanding | 94,412 | 339,252 | 488,128 |
| Net asset value per share | $10.24 | $10.86 | $11.16 |
| Institutional 3 Class | | | |
| Net assets | $2,535,446 | $5,951,105 | $11,042,230 |
| Shares outstanding | 248,054 | 556,367 | 988,974 |
| Net asset value per share | $10.22 | $10.70 | $11.17 |
| Class R | | | |
| Net assets | $511,928 | $1,176,629 | $2,531,087 |
| Shares outstanding | 49,686 | 107,084 | 224,303 |
| Net asset value per share | $10.30 | $10.99 | $11.28 |
The accompanying Notes to Financial Statements are an integral part of this statement.
Columbia Capital Allocation Portfolios | Annual Report 2020
| 85 |
Statement of Assets and Liabilities (continued)
January 31, 2020
| | Columbia
Capital
Allocation
Moderate
Aggressive
Portfolio | Columbia
Capital
Allocation
Aggressive
Portfolio |
| Assets | | |
| Investments in securities, at value | | |
| Unaffiliated issuers (cost $31,851,751, $19,203,269, respectively) | $33,133,603 | $20,071,797 |
| Affiliated issuers (cost $1,830,928,353, $645,783,444, respectively) | 1,966,128,951 | 702,756,734 |
| Foreign currency (cost $15,022, $16,947, respectively) | 15,020 | 16,947 |
| Margin deposits on: | | |
| Futures contracts | 18,806,087 | 6,170,345 |
| Swap contracts | 6,938,252 | 3,625,273 |
| Unrealized appreciation on forward foreign currency exchange contracts | 7,773 | 9,214 |
| Receivable for: | | |
| Investments sold | 612,186 | 398,771 |
| Capital shares sold | 763,728 | 466,778 |
| Dividends | 1,739,925 | 379,323 |
| Foreign tax reclaims | 13,372 | 15,214 |
| Variation margin for futures contracts | 1,073,415 | 441,646 |
| Prepaid expenses | 4,717 | 2,527 |
| Total assets | 2,029,237,029 | 734,354,569 |
| Liabilities | | |
| Unrealized depreciation on forward foreign currency exchange contracts | 1,544 | 1,794 |
| Payable for: | | |
| Investments purchased | 1,454,921 | 375,231 |
| Capital shares purchased | 1,405,481 | 1,131,599 |
| Variation margin for futures contracts | 6,847,324 | 2,193,333 |
| Variation margin for swap contracts | 83,786 | 43,779 |
| Management services fees | 6,846 | 1,783 |
| Distribution and/or service fees | 16,121 | 6,439 |
| Transfer agent fees | 140,690 | 49,314 |
| Compensation of board members | 218,126 | 47,475 |
| Compensation of chief compliance officer | 446 | 158 |
| Other expenses | 117,477 | 75,011 |
| Total liabilities | 10,292,762 | 3,925,916 |
| Net assets applicable to outstanding capital stock | $2,018,944,267 | $730,428,653 |
| Represented by | | |
| Paid in capital | 1,809,684,150 | 642,637,108 |
| Total distributable earnings (loss) | 209,260,117 | 87,791,545 |
| Total - representing net assets applicable to outstanding capital stock | $2,018,944,267 | $730,428,653 |
The accompanying Notes to Financial Statements are an integral part of this statement.
| 86 | Columbia Capital Allocation Portfolios | Annual Report 2020 |
Statement of Assets and Liabilities (continued)
January 31, 2020
| | Columbia
Capital
Allocation
Moderate
Aggressive
Portfolio | Columbia
Capital
Allocation
Aggressive
Portfolio |
| Class A | | |
| Net assets | $1,645,912,894 | $623,971,315 |
| Shares outstanding | 134,083,466 | 49,593,400 |
| Net asset value per share | $12.28 | $12.58 |
| Maximum sales charge | 5.75% | 5.75% |
| Maximum offering price per share (calculated by dividing the net asset value per share by 1.0 minus the maximum sales charge for Class A shares) | $13.03 | $13.35 |
| Advisor Class | | |
| Net assets | $7,779,498 | $1,610,987 |
| Shares outstanding | 627,596 | 131,039 |
| Net asset value per share | $12.40 | $12.29 |
| Class C | | |
| Net assets | $148,134,499 | $74,297,050 |
| Shares outstanding | 12,041,208 | 6,069,730 |
| Net asset value per share | $12.30 | $12.24 |
| Institutional Class | | |
| Net assets | $107,496,732 | $11,920,267 |
| Shares outstanding | 8,776,535 | 951,936 |
| Net asset value per share | $12.25 | $12.52 |
| Institutional 2 Class | | |
| Net assets | $9,890,289 | $5,079,111 |
| Shares outstanding | 798,622 | 413,354 |
| Net asset value per share | $12.38 | $12.29 |
| Institutional 3 Class | | |
| Net assets | $13,770,724 | $10,622,767 |
| Shares outstanding | 1,141,777 | 865,195 |
| Net asset value per share | $12.06 | $12.28 |
| Class R | | |
| Net assets | $4,822,740 | $2,927,156 |
| Shares outstanding | 393,234 | 234,783 |
| Net asset value per share | $12.26 | $12.47 |
| Class V | | |
| Net assets | $81,136,891 | $— |
| Shares outstanding | 6,609,781 | — |
| Net asset value per share | $12.28 | $— |
| Maximum sales charge | 5.75% | — |
| Maximum offering price per share (calculated by dividing the net asset value per share by 1.0 minus the maximum sales charge for Class V shares) | $13.03 | $— |
The accompanying Notes to Financial Statements are an integral part of this statement.
Columbia Capital Allocation Portfolios | Annual Report 2020
| 87 |
Statement of Operations
Year Ended January 31, 2020
| | Columbia
Capital
Allocation
Conservative
Portfolio | Columbia
Capital
Allocation
Moderate
Conservative
Portfolio | Columbia
Capital
Allocation
Moderate
Portfolio |
| Net investment income | | | |
| Income: | | | |
| Dividends — unaffiliated issuers | $314,859 | $488,106 | $799,045 |
| Dividends — affiliated issuers | 5,698,346 | 13,134,348 | 36,770,558 |
| Other Income | 12,329 | 34,501 | 139,964 |
| Foreign taxes withheld | (21,601) | (33,010) | (43,450) |
| Total income | 6,003,933 | 13,623,945 | 37,666,117 |
| Expenses: | | | |
| Management services fees | 262,717 | 537,654 | 1,145,529 |
| Distribution and/or service fees | | | |
| Class A | 446,380 | 1,071,830 | 3,163,943 |
| Class C | 261,305 | 586,644 | 1,568,568 |
| Class R | 2,500 | 6,824 | 14,924 |
| Transfer agent fees | | | |
| Class A | 166,962 | 362,132 | 971,412 |
| Advisor Class | 8,050 | 5,264 | 2,011 |
| Class C | 24,458 | 49,568 | 120,464 |
| Institutional Class | 8,072 | 14,144 | 27,348 |
| Institutional 2 Class | 560 | 2,756 | 3,347 |
| Institutional 3 Class | 533 | 1,161 | 1,954 |
| Class R | 466 | 1,155 | 2,295 |
| Compensation of board members | 29,911 | 26,107 | 42,104 |
| Custodian fees | 48,822 | 55,347 | 68,189 |
| Printing and postage fees | 28,884 | 53,470 | 139,267 |
| Registration fees | 96,058 | 93,510 | 110,429 |
| Audit fees | 20,461 | 20,461 | 22,811 |
| Legal fees | 9,514 | 12,289 | 21,200 |
| Compensation of chief compliance officer | 48 | 112 | 314 |
| Other | 11,472 | 15,379 | 27,389 |
| Total expenses | 1,427,173 | 2,915,807 | 7,453,498 |
| Expense reduction | (20) | (80) | (100) |
| Total net expenses | 1,427,153 | 2,915,727 | 7,453,398 |
| Net investment income | 4,576,780 | 10,708,218 | 30,212,719 |
The accompanying Notes to Financial Statements are an integral part of this statement.
| 88 | Columbia Capital Allocation Portfolios | Annual Report 2020 |
Statement of Operations (continued)
Year Ended January 31, 2020
| | Columbia
Capital
Allocation
Conservative
Portfolio | Columbia
Capital
Allocation
Moderate
Conservative
Portfolio | Columbia
Capital
Allocation
Moderate
Portfolio |
| Realized and unrealized gain (loss) — net | | | |
| Net realized gain (loss) on: | | | |
| Investments — unaffiliated issuers | $(207,986) | $(357,317) | $(1,211,350) |
| Investments — affiliated issuers | 1,160,523 | 5,931,048 | 22,178,861 |
| Capital gain distributions from underlying affiliated funds | 2,339,417 | 8,545,433 | 40,039,818 |
| Foreign currency translations | 3,377 | 5,471 | 17,123 |
| Forward foreign currency exchange contracts | 5,746 | 8,717 | 17,711 |
| Futures contracts | 615,971 | 4,297,990 | 19,976,880 |
| Options purchased | (37,350) | (129,479) | (493,016) |
| Swap contracts | (95,038) | (307,046) | (929,769) |
| Net realized gain | 3,784,660 | 17,994,817 | 79,596,258 |
| Net change in unrealized appreciation (depreciation) on: | | | |
| Investments — unaffiliated issuers | 490,076 | 793,927 | 1,483,349 |
| Investments — affiliated issuers | 9,300,030 | 21,006,503 | 56,602,010 |
| Foreign currency translations | (1,518) | (6,689) | (6,510) |
| Forward foreign currency exchange contracts | 5,066 | 7,830 | 16,201 |
| Futures contracts | 792,158 | 1,160,046 | 1,220,441 |
| Swap contracts | 65,084 | 219,214 | 557,587 |
| Net change in unrealized appreciation (depreciation) | 10,650,896 | 23,180,831 | 59,873,078 |
| Net realized and unrealized gain | 14,435,556 | 41,175,648 | 139,469,336 |
| Net increase in net assets resulting from operations | $19,012,336 | $51,883,866 | $169,682,055 |
The accompanying Notes to Financial Statements are an integral part of this statement.
Columbia Capital Allocation Portfolios | Annual Report 2020
| 89 |
Statement of Operations (continued)
Year Ended January 31, 2020
| | Columbia
Capital
Allocation
Moderate
Aggressive
Portfolio | Columbia
Capital
Allocation
Aggressive
Portfolio |
| Net investment income | | |
| Income: | | |
| Dividends — unaffiliated issuers | $706,937 | $539,892 |
| Dividends — affiliated issuers | 44,548,084 | 13,463,332 |
| Other Income | 274,840 | 79,551 |
| Foreign taxes withheld | (30,884) | (35,724) |
| Total income | 45,498,977 | 14,047,051 |
| Expenses: | | |
| Management services fees | 2,335,770 | 606,356 |
| Distribution and/or service fees | | |
| Class A | 4,070,104 | 1,532,560 |
| Class C | 1,500,128 | 721,415 |
| Class R | 26,043 | 14,616 |
| Class V | 201,326 | — |
| Transfer agent fees | | |
| Class A | 1,674,824 | 539,063 |
| Advisor Class | 13,788 | 1,619 |
| Class C | 154,426 | 63,424 |
| Institutional Class | 110,812 | 9,552 |
| Institutional 2 Class | 5,631 | 2,744 |
| Institutional 3 Class | 1,432 | 1,817 |
| Class R | 5,360 | 2,571 |
| Class V | 82,842 | — |
| Compensation of board members | 78,833 | 27,651 |
| Custodian fees | 65,790 | 67,159 |
| Printing and postage fees | 197,117 | 81,432 |
| Registration fees | 126,035 | 110,653 |
| Audit fees | 23,004 | 22,810 |
| Legal fees | 26,121 | 14,035 |
| Compensation of chief compliance officer | 425 | 151 |
| Other | 27,967 | 17,973 |
| Total expenses | 10,727,778 | 3,837,601 |
| Expense reduction | (7,992) | (80) |
| Total net expenses | 10,719,786 | 3,837,521 |
| Net investment income | 34,779,191 | 10,209,530 |
The accompanying Notes to Financial Statements are an integral part of this statement.
| 90 | Columbia Capital Allocation Portfolios | Annual Report 2020 |
Statement of Operations (continued)
Year Ended January 31, 2020
| | Columbia
Capital
Allocation
Moderate
Aggressive
Portfolio | Columbia
Capital
Allocation
Aggressive
Portfolio |
| Realized and unrealized gain (loss) — net | | |
| Net realized gain (loss) on: | | |
| Investments — unaffiliated issuers | $(1,152,989) | $(724,381) |
| Investments — affiliated issuers | 33,822,007 | 12,679,614 |
| Capital gain distributions from underlying affiliated funds | 66,402,911 | 32,138,600 |
| Foreign currency translations | 14,737 | 10,855 |
| Forward foreign currency exchange contracts | 12,112 | 14,419 |
| Futures contracts | 45,534,835 | 9,892,799 |
| Options purchased | (839,123) | (358,557) |
| Swap contracts | (1,198,498) | (230,110) |
| Net realized gain | 142,595,992 | 53,423,239 |
| Net change in unrealized appreciation (depreciation) on: | | |
| Investments — unaffiliated issuers | 1,615,587 | 784,894 |
| Investments — affiliated issuers | 75,546,076 | 28,693,422 |
| Foreign currency translations | (17,625) | (8,563) |
| Forward foreign currency exchange contracts | 11,276 | 13,378 |
| Futures contracts | (3,030,511) | 43,741 |
| Swap contracts | 698,894 | 142,471 |
| Net change in unrealized appreciation (depreciation) | 74,823,697 | 29,669,343 |
| Net realized and unrealized gain | 217,419,689 | 83,092,582 |
| Net increase in net assets resulting from operations | $252,198,880 | $93,302,112 |
The accompanying Notes to Financial Statements are an integral part of this statement.
Columbia Capital Allocation Portfolios | Annual Report 2020
| 91 |
Statement of Changes in Net Assets
| | Columbia Capital Allocation
Conservative Portfolio | Columbia Capital Allocation
Moderate Conservative Portfolio |
| | Year Ended
January 31, 2020 | Year Ended
January 31, 2019 | Year Ended
January 31, 2020 | Year Ended
January 31, 2019 |
| Operations | | | | |
| Net investment income | $4,576,780 | $4,631,581 | $10,708,218 | $10,411,380 |
| Net realized gain | 3,784,660 | 1,861,918 | 17,994,817 | 14,364,236 |
| Net change in unrealized appreciation (depreciation) | 10,650,896 | (10,744,631) | 23,180,831 | (40,840,274) |
| Net increase (decrease) in net assets resulting from operations | 19,012,336 | (4,251,132) | 51,883,866 | (16,064,658) |
| Distributions to shareholders | | | | |
| Net investment income and net realized gains | | | | |
| Class A | (5,446,173) | (8,261,195) | (17,862,482) | (29,538,220) |
| Advisor Class | (258,774) | (383,044) | (297,227) | (377,451) |
| Class C | (592,274) | (1,130,024) | (2,012,711) | (3,950,678) |
| Institutional Class | (286,291) | (414,020) | (753,668) | (1,273,084) |
| Institutional 2 Class | (29,737) | (32,378) | (202,906) | (279,105) |
| Institutional 3 Class | (94,427) | (89,671) | (265,530) | (216,346) |
| Class R | (14,216) | (20,707) | (49,708) | (87,364) |
| Total distributions to shareholders | (6,721,892) | (10,331,039) | (21,444,232) | (35,722,248) |
| Decrease in net assets from capital stock activity | (13,057,084) | (15,880,534) | (36,379,760) | (34,244,493) |
| Total decrease in net assets | (766,640) | (30,462,705) | (5,940,126) | (86,031,399) |
| Net assets at beginning of year | 225,208,524 | 255,671,229 | 521,337,662 | 607,369,061 |
| Net assets at end of year | $224,441,884 | $225,208,524 | $515,397,536 | $521,337,662 |
The accompanying Notes to Financial Statements are an integral part of this statement.
| 92 | Columbia Capital Allocation Portfolios | Annual Report 2020 |
Statement of Changes in Net Assets (continued)
| | Columbia Capital Allocation
Moderate Portfolio | Columbia Capital Allocation
Moderate Aggressive Portfolio |
| | Year Ended
January 31, 2020 | Year Ended
January 31, 2019 | Year Ended
January 31, 2020 | Year Ended
January 31, 2019 |
| Operations | | | | |
| Net investment income | $30,212,719 | $28,678,571 | $34,779,191 | $32,735,108 |
| Net realized gain | 79,596,258 | 50,200,317 | 142,595,992 | 107,671,001 |
| Net change in unrealized appreciation (depreciation) | 59,873,078 | (147,683,696) | 74,823,697 | (265,536,500) |
| Net increase (decrease) in net assets resulting from operations | 169,682,055 | (68,804,808) | 252,198,880 | (125,130,391) |
| Distributions to shareholders | | | | |
| Net investment income and net realized gains | | | | |
| Class A | (74,840,167) | (89,117,711) | (118,914,773) | (144,693,187) |
| Advisor Class | (191,637) | (94,726) | (889,289) | (1,309,324) |
| Class C | (8,050,971) | (10,693,917) | (9,716,011) | (13,511,746) |
| Institutional Class | (2,226,696) | (2,949,952) | (8,062,453) | (10,786,404) |
| Institutional 2 Class | (327,946) | (324,102) | (738,812) | (771,015) |
| Institutional 3 Class | (617,731) | (555,591) | (1,039,197) | (1,751,958) |
| Class R | (155,842) | (212,103) | (351,556) | (399,660) |
| Class V | — | — | (5,892,134) | (7,290,987) |
| Total distributions to shareholders | (86,410,990) | (103,948,102) | (145,604,225) | (180,514,281) |
| Decrease in net assets from capital stock activity | (54,422,634) | (16,356,493) | (70,159,753) | (29,544,063) |
| Total increase (decrease) in net assets | 28,848,431 | (189,109,403) | 36,434,902 | (335,188,735) |
| Net assets at beginning of year | 1,464,133,065 | 1,653,242,468 | 1,982,509,365 | 2,317,698,100 |
| Net assets at end of year | $1,492,981,496 | $1,464,133,065 | $2,018,944,267 | $1,982,509,365 |
The accompanying Notes to Financial Statements are an integral part of this statement.
Columbia Capital Allocation Portfolios | Annual Report 2020
| 93 |
Statement of Changes in Net Assets (continued)
| | Columbia Capital Allocation
Aggressive Portfolio |
| | Year Ended
January 31, 2020 | Year Ended
January 31, 2019 |
| Operations | | |
| Net investment income | $10,209,530 | $8,994,122 |
| Net realized gain | 53,423,239 | 47,097,163 |
| Net change in unrealized appreciation (depreciation) | 29,669,343 | (110,763,205) |
| Net increase (decrease) in net assets resulting from operations | 93,302,112 | (54,671,920) |
| Distributions to shareholders | | |
| Net investment income and net realized gains | | |
| Class A | (46,221,383) | (56,249,800) |
| Advisor Class | (136,034) | (149,902) |
| Class C | (5,078,937) | (6,569,773) |
| Institutional Class | (867,085) | (1,505,982) |
| Institutional 2 Class | (375,237) | (299,479) |
| Institutional 3 Class | (815,179) | (702,519) |
| Class R | (214,374) | (237,487) |
| Total distributions to shareholders | (53,708,229) | (65,714,942) |
| Increase (decrease) in net assets from capital stock activity | (5,645,135) | 25,804,766 |
| Total increase (decrease) in net assets | 33,948,748 | (94,582,096) |
| Net assets at beginning of year | 696,479,905 | 791,062,001 |
| Net assets at end of year | $730,428,653 | $696,479,905 |
The accompanying Notes to Financial Statements are an integral part of this statement.
| 94 | Columbia Capital Allocation Portfolios | Annual Report 2020 |
Statement of Changes in Net Assets (continued)
| | Columbia Capital Allocation
Conservative Portfolio | Columbia Capital Allocation
Moderate Conservative Portfolio |
| | Year Ended | Year Ended | Year Ended | Year Ended |
| | January 31, 2020 | January 31, 2019 | January 31, 2020 | January 31, 2019 |
| | Shares | Dollars ($) | Shares | Dollars ($) | Shares | Dollars ($) | Shares | Dollars ($) |
| Capital stock activity |
| Class A | | | | | | | | |
| Subscriptions | 1,814,947 | 18,387,449 | 1,969,256 | 19,700,851 | 3,381,584 | 36,343,555 | 3,983,309 | 43,154,491 |
| Distributions reinvested | 512,163 | 5,187,891 | 805,147 | 7,855,218 | 1,536,844 | 16,562,580 | 2,635,117 | 27,266,934 |
| Redemptions | (3,025,448) | (30,572,456) | (3,710,672) | (36,975,160) | (7,413,128) | (79,752,841) | (8,070,396) | (87,125,279) |
| Net decrease | (698,338) | (6,997,116) | (936,269) | (9,419,091) | (2,494,700) | (26,846,706) | (1,451,970) | (16,703,854) |
| Advisor Class | | | | | | | | |
| Subscriptions | 412,673 | 4,122,463 | 540,153 | 5,403,612 | 220,957 | 2,338,631 | 243,425 | 2,642,501 |
| Distributions reinvested | 16,848 | 169,495 | 21,054 | 204,051 | 21,669 | 231,265 | 33,420 | 343,736 |
| Redemptions | (707,849) | (7,151,977) | (283,621) | (2,819,520) | (234,994) | (2,540,093) | (201,937) | (2,178,627) |
| Net increase (decrease) | (278,328) | (2,860,019) | 277,586 | 2,788,143 | 7,632 | 29,803 | 74,908 | 807,610 |
| Class C | | | | | | | | |
| Subscriptions | 379,130 | 3,812,696 | 426,852 | 4,222,140 | 660,220 | 6,981,468 | 1,204,927 | 12,638,220 |
| Distributions reinvested | 56,981 | 574,910 | 113,057 | 1,096,189 | 185,067 | 1,967,605 | 378,201 | 3,850,604 |
| Redemptions | (870,413) | (8,726,388) | (1,428,294) | (14,263,130) | (1,544,833) | (16,317,840) | (2,927,297) | (31,245,355) |
| Net decrease | (434,302) | (4,338,782) | (888,385) | (8,944,801) | (699,546) | (7,368,767) | (1,344,169) | (14,756,531) |
| Institutional Class | | | | | | | | |
| Subscriptions | 434,843 | 4,400,453 | 367,094 | 3,645,442 | 1,018,160 | 10,794,860 | 854,018 | 9,088,685 |
| Distributions reinvested | 22,122 | 223,969 | 33,224 | 324,410 | 58,475 | 620,435 | 100,869 | 1,027,804 |
| Redemptions | (410,348) | (4,148,104) | (482,748) | (4,793,120) | (1,229,677) | (13,031,711) | (1,841,270) | (19,880,711) |
| Net increase (decrease) | 46,617 | 476,318 | (82,430) | (823,268) | (153,042) | (1,616,416) | (886,383) | (9,764,222) |
| Institutional 2 Class | | | | | | | | |
| Subscriptions | 55,957 | 561,649 | 30,996 | 310,939 | 97,162 | 1,031,298 | 204,983 | 2,218,158 |
| Distributions reinvested | 2,947 | 29,657 | 3,328 | 32,265 | 18,965 | 202,229 | 27,310 | 278,941 |
| Redemptions | (30,691) | (306,661) | (23,551) | (229,256) | (143,697) | (1,546,972) | (101,049) | (1,052,849) |
| Net increase (decrease) | 28,213 | 284,645 | 10,773 | 113,948 | (27,570) | (313,445) | 131,244 | 1,444,250 |
| Institutional 3 Class | | | | | | | | |
| Subscriptions | 131,302 | 1,305,060 | 85,632 | 852,028 | 76,690 | 806,856 | 554,580 | 5,925,134 |
| Distributions reinvested | 9,392 | 94,346 | 9,268 | 89,558 | 25,256 | 265,389 | 22,100 | 216,180 |
| Redemptions | (105,465) | (1,059,252) | (16,589) | (165,008) | (94,961) | (999,521) | (99,270) | (1,059,132) |
| Net increase | 35,229 | 340,154 | 78,311 | 776,578 | 6,985 | 72,724 | 477,410 | 5,082,182 |
| Class K | | | | | | | | |
| Subscriptions | — | — | 6 | 61 | — | — | — | — |
| Redemptions | — | — | (10,643) | (107,736) | — | — | (236) | (2,605) |
| Net decrease | — | — | (10,637) | (107,675) | — | — | (236) | (2,605) |
| Class R | | | | | | | | |
| Subscriptions | 18,822 | 188,188 | 20,656 | 208,934 | 26,241 | 281,131 | 51,985 | 565,419 |
| Distributions reinvested | 1,311 | 13,293 | 1,753 | 17,113 | 4,337 | 46,822 | 7,136 | 73,586 |
| Redemptions | (16,247) | (163,765) | (48,664) | (490,415) | (61,484) | (664,906) | (89,968) | (990,328) |
| Net increase (decrease) | 3,886 | 37,716 | (26,255) | (264,368) | (30,906) | (336,953) | (30,847) | (351,323) |
| Total net decrease | (1,297,023) | (13,057,084) | (1,577,306) | (15,880,534) | (3,391,147) | (36,379,760) | (3,030,043) | (34,244,493) |
The accompanying Notes to Financial Statements are an integral part of this statement.
Columbia Capital Allocation Portfolios | Annual Report 2020
| 95 |
Statement of Changes in Net Assets (continued)
| | Columbia Capital Allocation
Moderate Portfolio | Columbia Capital Allocation
Moderate Aggressive Portfolio |
| | Year Ended | Year Ended | Year Ended | Year Ended |
| | January 31, 2020 | January 31, 2019 | January 31, 2020 | January 31, 2019 |
| | Shares | Dollars ($) | Shares | Dollars ($) | Shares | Dollars ($) | Shares | Dollars ($) |
| Capital stock activity |
| Class A | | | | | | | | |
| Subscriptions | 7,770,857 | 86,848,307 | 11,750,122 | 133,498,609 | 6,591,990 | 80,203,469 | 11,248,709 | 140,329,336 |
| Distributions reinvested | 6,609,194 | 73,935,602 | 8,266,442 | 88,209,837 | 8,547,119 | 103,892,937 | 10,871,035 | 125,984,632 |
| Redemptions | (17,881,498) | (199,499,927) | (19,373,912) | (217,676,712) | (18,822,491) | (228,495,471) | (19,684,913) | (245,279,306) |
| Net increase (decrease) | (3,501,447) | (38,716,018) | 642,652 | 4,031,734 | (3,683,382) | (44,399,065) | 2,434,831 | 21,034,662 |
| Advisor Class | | | | | | | | |
| Subscriptions | 267,614 | 2,936,595 | 52,528 | 600,385 | 383,803 | 4,678,944 | 733,335 | 9,261,358 |
| Distributions reinvested | 15,788 | 174,260 | 8,992 | 94,557 | 38,486 | 472,004 | 50,910 | 595,896 |
| Redemptions | (124,889) | (1,379,683) | (33,017) | (358,028) | (1,039,202) | (12,762,541) | (363,849) | (4,505,924) |
| Net increase (decrease) | 158,513 | 1,731,172 | 28,503 | 336,914 | (616,913) | (7,611,593) | 420,396 | 5,351,330 |
| Class C | | | | | | | | |
| Subscriptions | 1,712,804 | 18,924,475 | 2,898,350 | 32,490,522 | 1,406,398 | 17,131,647 | 2,305,893 | 29,040,559 |
| Distributions reinvested | 718,929 | 7,980,580 | 1,005,685 | 10,629,670 | 770,798 | 9,406,558 | 1,117,567 | 13,001,345 |
| Redemptions | (3,840,091) | (42,446,094) | (6,255,831) | (70,409,206) | (3,113,177) | (37,908,324) | (6,367,714) | (80,784,645) |
| Net decrease | (1,408,358) | (15,541,039) | (2,351,796) | (27,289,014) | (935,981) | (11,370,119) | (2,944,254) | (38,742,741) |
| Institutional Class | | | | | | | | |
| Subscriptions | 2,086,219 | 23,258,059 | 3,295,275 | 37,169,963 | 2,171,768 | 26,265,451 | 2,877,774 | 35,814,422 |
| Distributions reinvested | 177,260 | 1,979,087 | 231,307 | 2,458,864 | 545,863 | 6,619,591 | 699,076 | 8,076,612 |
| Redemptions | (2,538,686) | (28,146,212) | (3,299,175) | (36,642,064) | (3,278,526) | (39,619,244) | (4,389,684) | (54,421,368) |
| Net increase (decrease) | (275,207) | (2,909,066) | 227,407 | 2,986,763 | (560,895) | (6,734,202) | (812,834) | (10,530,334) |
| Institutional 2 Class | | | | | | | | |
| Subscriptions | 148,047 | 1,625,895 | 177,082 | 1,927,393 | 267,805 | 3,261,250 | 178,285 | 2,277,859 |
| Distributions reinvested | 29,718 | 327,798 | 30,693 | 323,769 | 60,212 | 738,640 | 65,869 | 770,808 |
| Redemptions | (120,972) | (1,336,117) | (394,922) | (4,459,124) | (207,536) | (2,558,894) | (218,971) | (2,695,107) |
| Net increase (decrease) | 56,793 | 617,576 | (187,147) | (2,207,962) | 120,481 | 1,440,996 | 25,183 | 353,560 |
| Institutional 3 Class | | | | | | | | |
| Subscriptions | 262,753 | 2,916,365 | 621,696 | 6,924,013 | 223,153 | 2,669,957 | 433,207 | 5,348,203 |
| Distributions reinvested | 55,986 | 617,582 | 53,346 | 555,420 | 56,612 | 676,438 | 45,306 | 514,771 |
| Redemptions | (212,027) | (2,335,413) | (209,358) | (2,276,268) | (137,360) | (1,639,628) | (1,041,109) | (12,373,242) |
| Net increase (decrease) | 106,712 | 1,198,534 | 465,684 | 5,203,165 | 142,405 | 1,706,767 | (562,596) | (6,510,268) |
| Class K | | | | | | | | |
| Subscriptions | — | — | 122 | 1,415 | — | — | — | — |
| Redemptions | — | — | (11,636) | (137,079) | — | — | (199) | (2,633) |
| Net decrease | — | — | (11,514) | (135,664) | — | — | (199) | (2,633) |
| Class R | | | | | | | | |
| Subscriptions | 44,258 | 489,001 | 86,681 | 992,081 | 62,261 | 752,519 | 106,046 | 1,323,685 |
| Distributions reinvested | 13,715 | 152,901 | 16,107 | 170,998 | 28,601 | 347,366 | 32,648 | 375,524 |
| Redemptions | (129,471) | (1,445,695) | (40,127) | (445,508) | (123,805) | (1,514,271) | (69,672) | (877,430) |
| Net increase (decrease) | (71,498) | (803,793) | 62,661 | 717,571 | (32,943) | (414,386) | 69,022 | 821,779 |
| Class V | | | | | | | | |
| Subscriptions | — | — | — | — | 24,762 | 301,127 | 38,987 | 472,633 |
| Distributions reinvested | — | — | — | — | 404,112 | 4,912,497 | 519,085 | 6,019,954 |
| Redemptions | — | — | — | — | (658,385) | (7,991,775) | (629,306) | (7,812,005) |
| Net decrease | — | — | — | — | (229,511) | (2,778,151) | (71,234) | (1,319,418) |
| Total net decrease | (4,934,492) | (54,422,634) | (1,123,550) | (16,356,493) | (5,796,739) | (70,159,753) | (1,441,685) | (29,544,063) |
The accompanying Notes to Financial Statements are an integral part of this statement.
| 96 | Columbia Capital Allocation Portfolios | Annual Report 2020 |
Statement of Changes in Net Assets (continued)
| | Columbia Capital Allocation
Aggressive Portfolio |
| | Year Ended | Year Ended |
| | January 31, 2020 | January 31, 2019 |
| | Shares | Dollars ($) | Shares | Dollars ($) |
| Capital stock activity |
| Class A | | | | |
| Subscriptions | 3,021,609 | 37,621,161 | 4,630,370 | 60,253,380 |
| Distributions reinvested | 3,682,467 | 45,842,524 | 4,760,807 | 55,785,726 |
| Redemptions | (7,476,908) | (92,951,138) | (6,602,201) | (85,151,573) |
| Net increase (decrease) | (772,832) | (9,487,453) | 2,788,976 | 30,887,533 |
| Advisor Class | | | | |
| Subscriptions | 33,592 | 409,507 | 93,054 | 1,142,139 |
| Distributions reinvested | 10,768 | 130,771 | 13,105 | 149,457 |
| Redemptions | (82,140) | (987,863) | (57,535) | (735,347) |
| Net increase (decrease) | (37,780) | (447,585) | 48,624 | 556,249 |
| Class C | | | | |
| Subscriptions | 895,538 | 10,838,392 | 1,515,936 | 19,324,228 |
| Distributions reinvested | 417,636 | 5,052,464 | 565,785 | 6,533,861 |
| Redemptions | (1,321,941) | (15,986,874) | (2,447,052) | (31,204,277) |
| Net decrease | (8,767) | (96,018) | (365,331) | (5,346,188) |
| Institutional Class | | | | |
| Subscriptions | 1,031,205 | 12,782,549 | 1,000,934 | 12,950,040 |
| Distributions reinvested | 66,691 | 827,351 | 118,482 | 1,417,684 |
| Redemptions | (1,022,643) | (12,639,925) | (1,721,146) | (21,768,162) |
| Net increase (decrease) | 75,253 | 969,975 | (601,730) | (7,400,438) |
| Institutional 2 Class | | | | |
| Subscriptions | 219,986 | 2,684,611 | 120,461 | 1,558,606 |
| Distributions reinvested | 30,769 | 375,042 | 26,039 | 299,240 |
| Redemptions | (93,328) | (1,139,963) | (81,709) | (1,017,610) |
| Net increase | 157,427 | 1,919,690 | 64,791 | 840,236 |
| Institutional 3 Class | | | | |
| Subscriptions | 211,297 | 2,577,035 | 498,407 | 6,231,360 |
| Distributions reinvested | 66,969 | 814,984 | 61,551 | 702,279 |
| Redemptions | (158,469) | (1,923,612) | (83,936) | (1,062,873) |
| Net increase | 119,797 | 1,468,407 | 476,022 | 5,870,766 |
| Class K | | | | |
| Subscriptions | — | — | 30 | 408 |
| Redemptions | — | — | (7,175) | (99,818) |
| Net decrease | — | — | (7,145) | (99,410) |
| Class R | | | | |
| Subscriptions | 27,956 | 343,652 | 55,857 | 703,425 |
| Distributions reinvested | 16,939 | 208,823 | 18,975 | 219,809 |
| Redemptions | (43,238) | (524,626) | (32,686) | (427,216) |
| Net increase | 1,657 | 27,849 | 42,146 | 496,018 |
| Total net increase (decrease) | (465,245) | (5,645,135) | 2,446,353 | 25,804,766 |
The accompanying Notes to Financial Statements are an integral part of this statement.
Columbia Capital Allocation Portfolios | Annual Report 2020
| 97 |
Financial Highlights
Columbia Capital Allocation Conservative Portfolio
The following tables are intended to help you understand the Funds’ financial performance. Certain information reflects financial results for a single share of a class held for the periods shown. Per share net investment income (loss) amounts are calculated based on average shares outstanding during the period. Total return assumes reinvestment of all dividends and distributions, if any. Total return does not reflect payment of sales charges, if any. Total return and portfolio turnover are not annualized for periods of less than one year. The portfolio turnover rate is calculated without regard to purchase and sales transactions of short-term instruments and certain derivatives, if any. If such transactions were included, a fund’s portfolio turnover rate may be higher.
| | Net asset value,
beginning of
period | Net
investment
income | Net
realized
and
unrealized
gain (loss) | Total from
investment
operations | Distributions
from net
investment
income | Distributions
from net
realized
gains | Total
distributions to
shareholders |
| Class A |
| Year Ended 1/31/2020 | $9.76 | 0.21 | 0.65 | 0.86 | (0.21) | (0.10) | (0.31) |
| Year Ended 1/31/2019 | $10.38 | 0.20 | (0.37) | (0.17) | (0.22) | (0.23) | (0.45) |
| Year Ended 1/31/2018 | $9.84 | 0.18 | 0.59 | 0.77 | (0.22) | (0.01) | (0.23) |
| Year Ended 1/31/2017 | $9.45 | 0.15 | 0.48 | 0.63 | (0.15) | (0.09) | (0.24) |
| Year Ended 1/31/2016 | $10.10 | 0.18 | (0.46) | (0.28) | (0.19) | (0.18) | (0.37) |
| Advisor Class |
| Year Ended 1/31/2020 | $9.70 | 0.23 | 0.65 | 0.88 | (0.24) | (0.10) | (0.34) |
| Year Ended 1/31/2019 | $10.31 | 0.23 | (0.37) | (0.14) | (0.24) | (0.23) | (0.47) |
| Year Ended 1/31/2018 | $9.78 | 0.21 | 0.58 | 0.79 | (0.25) | (0.01) | (0.26) |
| Year Ended 1/31/2017 | $9.39 | 0.17 | 0.48 | 0.65 | (0.17) | (0.09) | (0.26) |
| Year Ended 1/31/2016 | $10.04 | 0.20 | (0.45) | (0.25) | (0.22) | (0.18) | (0.40) |
| Class C |
| Year Ended 1/31/2020 | $9.71 | 0.13 | 0.65 | 0.78 | (0.14) | (0.10) | (0.24) |
| Year Ended 1/31/2019 | $10.32 | 0.12 | (0.36) | (0.24) | (0.14) | (0.23) | (0.37) |
| Year Ended 1/31/2018 | $9.78 | 0.10 | 0.59 | 0.69 | (0.14) | (0.01) | (0.15) |
| Year Ended 1/31/2017 | $9.40 | 0.07 | 0.47 | 0.54 | (0.07) | (0.09) | (0.16) |
| Year Ended 1/31/2016 | $10.05 | 0.11 | (0.46) | (0.35) | (0.12) | (0.18) | (0.30) |
| Institutional Class |
| Year Ended 1/31/2020 | $9.76 | 0.24 | 0.64 | 0.88 | (0.24) | (0.10) | (0.34) |
| Year Ended 1/31/2019 | $10.37 | 0.23 | (0.37) | (0.14) | (0.24) | (0.23) | (0.47) |
| Year Ended 1/31/2018 | $9.84 | 0.21 | 0.58 | 0.79 | (0.25) | (0.01) | (0.26) |
| Year Ended 1/31/2017 | $9.45 | 0.18 | 0.47 | 0.65 | (0.17) | (0.09) | (0.26) |
| Year Ended 1/31/2016 | $10.10 | 0.21 | (0.46) | (0.25) | (0.22) | (0.18) | (0.40) |
| Institutional 2 Class |
| Year Ended 1/31/2020 | $9.70 | 0.24 | 0.64 | 0.88 | (0.24) | (0.10) | (0.34) |
| Year Ended 1/31/2019 | $10.31 | 0.23 | (0.37) | (0.14) | (0.24) | (0.23) | (0.47) |
| Year Ended 1/31/2018 | $9.78 | 0.20 | 0.59 | 0.79 | (0.25) | (0.01) | (0.26) |
| Year Ended 1/31/2017 | $9.39 | 0.18 | 0.48 | 0.66 | (0.18) | (0.09) | (0.27) |
| Year Ended 1/31/2016 | $10.05 | 0.25 | (0.50) | (0.25) | (0.23) | (0.18) | (0.41) |
The accompanying Notes to Financial Statements are an integral part of this statement.
| 98 | Columbia Capital Allocation Portfolios | Annual Report 2020 |
Financial Highlights (continued)
Columbia Capital Allocation Conservative Portfolio
| | Net
asset
value,
end of
period | Total
return | Total gross
expense
ratio to
average
net assets(a) | Total net
expense
ratio to
average
net assets(a),(b) | Net investment
income
ratio to
average
net assets | Portfolio
turnover | Net
assets,
end of
period
(000’s) |
| Class A |
| Year Ended 1/31/2020 | $10.31 | 8.91% | 0.57% | 0.57%(c) | 2.09% | 13% | $180,338 |
| Year Ended 1/31/2019 | $9.76 | (1.61%) | 0.55% | 0.55% | 2.02% | 21% | $177,622 |
| Year Ended 1/31/2018 | $10.38 | 7.90% | 0.56% | 0.56% | 1.72% | 12% | $198,471 |
| Year Ended 1/31/2017 | $9.84 | 6.67% | 0.55% | 0.55% | 1.51% | 24% | $213,725 |
| Year Ended 1/31/2016 | $9.45 | (2.81%) | 0.52% | 0.52%(c) | 1.83% | 24% | $216,423 |
| Advisor Class |
| Year Ended 1/31/2020 | $10.24 | 9.14% | 0.32% | 0.32%(c) | 2.31% | 13% | $6,012 |
| Year Ended 1/31/2019 | $9.70 | (1.28%) | 0.30% | 0.30% | 2.30% | 21% | $8,396 |
| Year Ended 1/31/2018 | $10.31 | 8.11% | 0.30% | 0.30% | 2.13% | 12% | $6,063 |
| Year Ended 1/31/2017 | $9.78 | 6.98% | 0.31% | 0.31% | 1.76% | 24% | $903 |
| Year Ended 1/31/2016 | $9.39 | (2.57%) | 0.27% | 0.27%(c) | 2.06% | 24% | $145 |
| Class C |
| Year Ended 1/31/2020 | $10.25 | 8.05% | 1.32% | 1.32%(c) | 1.34% | 13% | $24,949 |
| Year Ended 1/31/2019 | $9.71 | (2.27%) | 1.30% | 1.30% | 1.23% | 21% | $27,850 |
| Year Ended 1/31/2018 | $10.32 | 7.14% | 1.31% | 1.31% | 0.97% | 12% | $38,765 |
| Year Ended 1/31/2017 | $9.78 | 5.80% | 1.30% | 1.30% | 0.76% | 24% | $42,286 |
| Year Ended 1/31/2016 | $9.40 | (3.56%) | 1.27% | 1.27%(c) | 1.08% | 24% | $43,719 |
| Institutional Class |
| Year Ended 1/31/2020 | $10.30 | 9.08% | 0.32% | 0.32%(c) | 2.34% | 13% | $9,128 |
| Year Ended 1/31/2019 | $9.76 | (1.27%) | 0.30% | 0.30% | 2.26% | 21% | $8,191 |
| Year Ended 1/31/2018 | $10.37 | 8.06% | 0.31% | 0.31% | 2.03% | 12% | $9,559 |
| Year Ended 1/31/2017 | $9.84 | 6.94% | 0.30% | 0.30% | 1.79% | 24% | $3,974 |
| Year Ended 1/31/2016 | $9.45 | (2.56%) | 0.27% | 0.27%(c) | 2.09% | 24% | $3,046 |
| Institutional 2 Class |
| Year Ended 1/31/2020 | $10.24 | 9.17% | 0.30% | 0.30% | 2.38% | 13% | $966 |
| Year Ended 1/31/2019 | $9.70 | (1.25%) | 0.28% | 0.28% | 2.35% | 21% | $642 |
| Year Ended 1/31/2018 | $10.31 | 8.15% | 0.28% | 0.28% | 2.02% | 12% | $571 |
| Year Ended 1/31/2017 | $9.78 | 7.05% | 0.24% | 0.24% | 1.84% | 24% | $417 |
| Year Ended 1/31/2016 | $9.39 | (2.60%) | 0.21% | 0.21% | 2.66% | 24% | $322 |
The accompanying Notes to Financial Statements are an integral part of this statement.
Columbia Capital Allocation Portfolios | Annual Report 2020
| 99 |
Financial Highlights (continued)
Columbia Capital Allocation Conservative Portfolio
| | Net asset value,
beginning of
period | Net
investment
income | Net
realized
and
unrealized
gain (loss) | Total from
investment
operations | Distributions
from net
investment
income | Distributions
from net
realized
gains | Total
distributions to
shareholders |
| Institutional 3 Class |
| Year Ended 1/31/2020 | $9.68 | 0.24 | 0.64 | 0.88 | (0.24) | (0.10) | (0.34) |
| Year Ended 1/31/2019 | $10.30 | 0.24 | (0.38) | (0.14) | (0.25) | (0.23) | (0.48) |
| Year Ended 1/31/2018 | $9.77 | 0.23 | 0.56 | 0.79 | (0.25) | (0.01) | (0.26) |
| Year Ended 1/31/2017 | $9.39 | 0.18 | 0.47 | 0.65 | (0.18) | (0.09) | (0.27) |
| Year Ended 1/31/2016 | $10.04 | 0.20 | (0.43) | (0.23) | (0.24) | (0.18) | (0.42) |
| Class R |
| Year Ended 1/31/2020 | $9.76 | 0.19 | 0.64 | 0.83 | (0.19) | (0.10) | (0.29) |
| Year Ended 1/31/2019 | $10.37 | 0.17 | (0.36) | (0.19) | (0.19) | (0.23) | (0.42) |
| Year Ended 1/31/2018 | $9.84 | 0.16 | 0.58 | 0.74 | (0.20) | (0.01) | (0.21) |
| Year Ended 1/31/2017 | $9.45 | 0.12 | 0.48 | 0.60 | (0.12) | (0.09) | (0.21) |
| Year Ended 1/31/2016 | $10.10 | 0.17 | (0.47) | (0.30) | (0.17) | (0.18) | (0.35) |
| Notes to Financial Highlights |
| (a) | In addition to the fees and expenses that the Fund bears directly, the Fund indirectly bears a pro rata share of the fees and expenses of any other funds in which it invests. Such indirect expenses are not included in the Fund’s reported expense ratios. |
| (b) | Total net expenses include the impact of certain fee waivers/expense reimbursements made by the Investment Manager and certain of its affiliates, if applicable. |
| (c) | The benefits derived from expense reductions had an impact of less than 0.01%. |
The accompanying Notes to Financial Statements are an integral part of this statement.
| 100 | Columbia Capital Allocation Portfolios | Annual Report 2020 |
Financial Highlights (continued)
Columbia Capital Allocation Conservative Portfolio
| | Net
asset
value,
end of
period | Total
return | Total gross
expense
ratio to
average
net assets(a) | Total net
expense
ratio to
average
net assets(a),(b) | Net investment
income
ratio to
average
net assets | Portfolio
turnover | Net
assets,
end of
period
(000’s) |
| Institutional 3 Class |
| Year Ended 1/31/2020 | $10.22 | 9.24% | 0.24% | 0.24% | 2.43% | 13% | $2,535 |
| Year Ended 1/31/2019 | $9.68 | (1.30%) | 0.23% | 0.23% | 2.38% | 21% | $2,061 |
| Year Ended 1/31/2018 | $10.30 | 8.22% | 0.23% | 0.23% | 2.27% | 12% | $1,385 |
| Year Ended 1/31/2017 | $9.77 | 6.99% | 0.20% | 0.20% | 1.86% | 24% | $595 |
| Year Ended 1/31/2016 | $9.39 | (2.37%) | 0.15% | 0.15% | 2.13% | 24% | $166 |
| Class R |
| Year Ended 1/31/2020 | $10.30 | 8.54% | 0.82% | 0.82%(c) | 1.92% | 13% | $512 |
| Year Ended 1/31/2019 | $9.76 | (1.77%) | 0.80% | 0.80% | 1.68% | 21% | $447 |
| Year Ended 1/31/2018 | $10.37 | 7.53% | 0.81% | 0.81% | 1.54% | 12% | $747 |
| Year Ended 1/31/2017 | $9.84 | 6.41% | 0.80% | 0.80% | 1.19% | 24% | $355 |
| Year Ended 1/31/2016 | $9.45 | (3.05%) | 0.77% | 0.77%(c) | 1.72% | 24% | $490 |
The accompanying Notes to Financial Statements are an integral part of this statement.
Columbia Capital Allocation Portfolios | Annual Report 2020
| 101 |
Financial Highlights
Columbia Capital Allocation Moderate Conservative Portfolio
| | Net asset value,
beginning of
period | Net
investment
income | Net
realized
and
unrealized
gain (loss) | Total from
investment
operations | Distributions
from net
investment
income | Distributions
from net
realized
gains | Total
distributions to
shareholders |
| Class A |
| Year Ended 1/31/2020 | $10.35 | 0.23 | 0.84 | 1.07 | (0.24) | (0.21) | (0.45) |
| Year Ended 1/31/2019 | $11.38 | 0.21 | (0.52) | (0.31) | (0.24) | (0.48) | (0.72) |
| Year Ended 1/31/2018 | $10.62 | 0.19 | 1.04 | 1.23 | (0.24) | (0.23) | (0.47) |
| Year Ended 1/31/2017 | $10.14 | 0.17 | 0.68 | 0.85 | (0.16) | (0.21) | (0.37) |
| Year Ended 1/31/2016 | $10.98 | 0.20 | (0.49) | (0.29) | (0.22) | (0.33) | (0.55) |
| Advisor Class |
| Year Ended 1/31/2020 | $10.25 | 0.26 | 0.83 | 1.09 | (0.27) | (0.21) | (0.48) |
| Year Ended 1/31/2019 | $11.28 | 0.23 | (0.52) | (0.29) | (0.26) | (0.48) | (0.74) |
| Year Ended 1/31/2018 | $10.53 | 0.23 | 1.02 | 1.25 | (0.27) | (0.23) | (0.50) |
| Year Ended 1/31/2017 | $10.06 | 0.24 | 0.62 | 0.86 | (0.18) | (0.21) | (0.39) |
| Year Ended 1/31/2016 | $10.89 | 0.23 | (0.48) | (0.25) | (0.25) | (0.33) | (0.58) |
| Class C |
| Year Ended 1/31/2020 | $10.20 | 0.14 | 0.83 | 0.97 | (0.16) | (0.21) | (0.37) |
| Year Ended 1/31/2019 | $11.21 | 0.12 | (0.50) | (0.38) | (0.15) | (0.48) | (0.63) |
| Year Ended 1/31/2018 | $10.47 | 0.10 | 1.03 | 1.13 | (0.16) | (0.23) | (0.39) |
| Year Ended 1/31/2017 | $10.00 | 0.09 | 0.67 | 0.76 | (0.08) | (0.21) | (0.29) |
| Year Ended 1/31/2016 | $10.84 | 0.12 | (0.49) | (0.37) | (0.14) | (0.33) | (0.47) |
| Institutional Class |
| Year Ended 1/31/2020 | $10.20 | 0.25 | 0.83 | 1.08 | (0.27) | (0.21) | (0.48) |
| Year Ended 1/31/2019 | $11.22 | 0.22 | (0.50) | (0.28) | (0.26) | (0.48) | (0.74) |
| Year Ended 1/31/2018 | $10.48 | 0.22 | 1.02 | 1.24 | (0.27) | (0.23) | (0.50) |
| Year Ended 1/31/2017 | $10.01 | 0.19 | 0.67 | 0.86 | (0.18) | (0.21) | (0.39) |
| Year Ended 1/31/2016 | $10.85 | 0.23 | (0.49) | (0.26) | (0.25) | (0.33) | (0.58) |
| Institutional 2 Class |
| Year Ended 1/31/2020 | $10.25 | 0.26 | 0.83 | 1.09 | (0.27) | (0.21) | (0.48) |
| Year Ended 1/31/2019 | $11.27 | 0.25 | (0.52) | (0.27) | (0.27) | (0.48) | (0.75) |
| Year Ended 1/31/2018 | $10.52 | 0.22 | 1.03 | 1.25 | (0.27) | (0.23) | (0.50) |
| Year Ended 1/31/2017 | $10.05 | 0.20 | 0.67 | 0.87 | (0.19) | (0.21) | (0.40) |
| Year Ended 1/31/2016 | $10.89 | 0.30 | (0.55) | (0.25) | (0.26) | (0.33) | (0.59) |
| Institutional 3 Class |
| Year Ended 1/31/2020 | $10.10 | 0.25 | 0.84 | 1.09 | (0.28) | (0.21) | (0.49) |
| Year Ended 1/31/2019 | $11.13 | 0.30 | (0.58) | (0.28) | (0.27) | (0.48) | (0.75) |
| Year Ended 1/31/2018 | $10.40 | 0.23 | 1.01 | 1.24 | (0.28) | (0.23) | (0.51) |
| Year Ended 1/31/2017 | $9.94 | 0.19 | 0.67 | 0.86 | (0.19) | (0.21) | (0.40) |
| Year Ended 1/31/2016 | $10.77 | 0.26 | (0.50) | (0.24) | (0.26) | (0.33) | (0.59) |
The accompanying Notes to Financial Statements are an integral part of this statement.
| 102 | Columbia Capital Allocation Portfolios | Annual Report 2020 |
Financial Highlights (continued)
Columbia Capital Allocation Moderate Conservative Portfolio
| | Net
asset
value,
end of
period | Total
return | Total gross
expense
ratio to
average
net assets(a) | Total net
expense
ratio to
average
net assets(a),(b) | Net investment
income
ratio to
average
net assets | Portfolio
turnover | Net
assets,
end of
period
(000’s) |
| Class A |
| Year Ended 1/31/2020 | $10.97 | 10.52% | 0.49% | 0.49%(c) | 2.12% | 9% | $425,706 |
| Year Ended 1/31/2019 | $10.35 | (2.62%) | 0.48% | 0.48%(c) | 1.96% | 21% | $427,506 |
| Year Ended 1/31/2018 | $11.38 | 11.79% | 0.48% | 0.48%(c) | 1.71% | 9% | $486,408 |
| Year Ended 1/31/2017 | $10.62 | 8.47% | 0.49% | 0.49%(c) | 1.57% | 18% | $494,948 |
| Year Ended 1/31/2016 | $10.14 | (2.78%) | 0.48% | 0.48%(c) | 1.86% | 21% | $495,849 |
| Advisor Class |
| Year Ended 1/31/2020 | $10.86 | 10.80% | 0.24% | 0.24%(c) | 2.42% | 9% | $5,319 |
| Year Ended 1/31/2019 | $10.25 | (2.40%) | 0.23% | 0.23%(c) | 2.17% | 21% | $4,943 |
| Year Ended 1/31/2018 | $11.28 | 12.07% | 0.23% | 0.23%(c) | 2.09% | 9% | $4,592 |
| Year Ended 1/31/2017 | $10.53 | 8.71% | 0.24% | 0.24%(c) | 2.28% | 18% | $2,705 |
| Year Ended 1/31/2016 | $10.06 | (2.46%) | 0.23% | 0.23%(c) | 2.15% | 21% | $1,082 |
| Class C |
| Year Ended 1/31/2020 | $10.80 | 9.65% | 1.24% | 1.24%(c) | 1.36% | 9% | $57,072 |
| Year Ended 1/31/2019 | $10.20 | (3.23%) | 1.23% | 1.23%(c) | 1.14% | 21% | $61,019 |
| Year Ended 1/31/2018 | $11.21 | 10.92% | 1.23% | 1.23%(c) | 0.95% | 9% | $82,192 |
| Year Ended 1/31/2017 | $10.47 | 7.67% | 1.24% | 1.24%(c) | 0.83% | 18% | $87,493 |
| Year Ended 1/31/2016 | $10.00 | (3.56%) | 1.23% | 1.23%(c) | 1.12% | 21% | $85,097 |
| Institutional Class |
| Year Ended 1/31/2020 | $10.80 | 10.76% | 0.24% | 0.24%(c) | 2.38% | 9% | $16,490 |
| Year Ended 1/31/2019 | $10.20 | (2.32%) | 0.23% | 0.23%(c) | 2.10% | 21% | $17,131 |
| Year Ended 1/31/2018 | $11.22 | 12.03% | 0.23% | 0.23%(c) | 2.00% | 9% | $28,796 |
| Year Ended 1/31/2017 | $10.48 | 8.75% | 0.24% | 0.24%(c) | 1.78% | 18% | $20,476 |
| Year Ended 1/31/2016 | $10.01 | (2.56%) | 0.23% | 0.23%(c) | 2.11% | 21% | $24,108 |
| Institutional 2 Class |
| Year Ended 1/31/2020 | $10.86 | 10.83% | 0.22% | 0.22% | 2.43% | 9% | $3,683 |
| Year Ended 1/31/2019 | $10.25 | (2.28%) | 0.21% | 0.21% | 2.34% | 21% | $3,758 |
| Year Ended 1/31/2018 | $11.27 | 12.12% | 0.21% | 0.21% | 2.01% | 9% | $2,655 |
| Year Ended 1/31/2017 | $10.52 | 8.78% | 0.18% | 0.18% | 1.93% | 18% | $2,084 |
| Year Ended 1/31/2016 | $10.05 | (2.48%) | 0.16% | 0.16% | 2.89% | 21% | $686 |
| Institutional 3 Class |
| Year Ended 1/31/2020 | $10.70 | 10.94% | 0.18% | 0.18% | 2.42% | 9% | $5,951 |
| Year Ended 1/31/2019 | $10.10 | (2.36%) | 0.17% | 0.17% | 2.96% | 21% | $5,551 |
| Year Ended 1/31/2018 | $11.13 | 12.12% | 0.16% | 0.16% | 2.15% | 9% | $801 |
| Year Ended 1/31/2017 | $10.40 | 8.84% | 0.13% | 0.13% | 1.83% | 18% | $409 |
| Year Ended 1/31/2016 | $9.94 | (2.38%) | 0.12% | 0.12% | 2.48% | 21% | $10 |
The accompanying Notes to Financial Statements are an integral part of this statement.
Columbia Capital Allocation Portfolios | Annual Report 2020
| 103 |
Financial Highlights (continued)
Columbia Capital Allocation Moderate Conservative Portfolio
| | Net asset value,
beginning of
period | Net
investment
income | Net
realized
and
unrealized
gain (loss) | Total from
investment
operations | Distributions
from net
investment
income | Distributions
from net
realized
gains | Total
distributions to
shareholders |
| Class R |
| Year Ended 1/31/2020 | $10.37 | 0.19 | 0.86 | 1.05 | (0.22) | (0.21) | (0.43) |
| Year Ended 1/31/2019 | $11.39 | 0.18 | (0.51) | (0.33) | (0.21) | (0.48) | (0.69) |
| Year Ended 1/31/2018 | $10.63 | 0.15 | 1.05 | 1.20 | (0.21) | (0.23) | (0.44) |
| Year Ended 1/31/2017 | $10.16 | 0.14 | 0.67 | 0.81 | (0.13) | (0.21) | (0.34) |
| Year Ended 1/31/2016 | $10.99 | 0.21 | (0.52) | (0.31) | (0.19) | (0.33) | (0.52) |
| Notes to Financial Highlights |
| (a) | In addition to the fees and expenses that the Fund bears directly, the Fund indirectly bears a pro rata share of the fees and expenses of any other funds in which it invests. Such indirect expenses are not included in the Fund’s reported expense ratios. |
| (b) | Total net expenses include the impact of certain fee waivers/expense reimbursements made by the Investment Manager and certain of its affiliates, if applicable. |
| (c) | The benefits derived from expense reductions had an impact of less than 0.01%. |
The accompanying Notes to Financial Statements are an integral part of this statement.
| 104 | Columbia Capital Allocation Portfolios | Annual Report 2020 |
Financial Highlights (continued)
Columbia Capital Allocation Moderate Conservative Portfolio
| | Net
asset
value,
end of
period | Total
return | Total gross
expense
ratio to
average
net assets(a) | Total net
expense
ratio to
average
net assets(a),(b) | Net investment
income
ratio to
average
net assets | Portfolio
turnover | Net
assets,
end of
period
(000’s) |
| Class R |
| Year Ended 1/31/2020 | $10.99 | 10.23% | 0.74% | 0.74%(c) | 1.80% | 9% | $1,177 |
| Year Ended 1/31/2019 | $10.37 | (2.78%) | 0.73% | 0.73%(c) | 1.71% | 21% | $1,431 |
| Year Ended 1/31/2018 | $11.39 | 11.50% | 0.73% | 0.73%(c) | 1.40% | 9% | $1,924 |
| Year Ended 1/31/2017 | $10.63 | 8.09% | 0.73% | 0.73%(c) | 1.30% | 18% | $2,549 |
| Year Ended 1/31/2016 | $10.16 | (2.93%) | 0.73% | 0.73%(c) | 1.92% | 21% | $5,007 |
The accompanying Notes to Financial Statements are an integral part of this statement.
Columbia Capital Allocation Portfolios | Annual Report 2020
| 105 |
Financial Highlights
Columbia Capital Allocation Moderate Portfolio
| | Net asset value,
beginning of
period | Net
investment
income | Net
realized
and
unrealized
gain (loss) | Total from
investment
operations | Distributions
from net
investment
income | Distributions
from net
realized
gains | Total
distributions to
shareholders |
| Class A |
| Year Ended 1/31/2020 | $10.70 | 0.24 | 1.05 | 1.29 | (0.25) | (0.42) | (0.67) |
| Year Ended 1/31/2019 | $11.99 | 0.22 | (0.73) | (0.51) | (0.25) | (0.53) | (0.78) |
| Year Ended 1/31/2018 | $10.99 | 0.19 | 1.56 | 1.75 | (0.23) | (0.52) | (0.75) |
| Year Ended 1/31/2017 | $10.34 | 0.18 | 0.95 | 1.13 | (0.21) | (0.27) | (0.48) |
| Year Ended 1/31/2016 | $11.50 | 0.19 | (0.49) | (0.30) | (0.22) | (0.64) | (0.86) |
| Advisor Class |
| Year Ended 1/31/2020 | $10.57 | 0.28 | 1.02 | 1.30 | (0.28) | (0.42) | (0.70) |
| Year Ended 1/31/2019 | $11.85 | 0.25 | (0.72) | (0.47) | (0.28) | (0.53) | (0.81) |
| Year Ended 1/31/2018 | $10.87 | 0.30 | 1.46 | 1.76 | (0.26) | (0.52) | (0.78) |
| Year Ended 1/31/2017 | $10.24 | 0.21 | 0.93 | 1.14 | (0.24) | (0.27) | (0.51) |
| Year Ended 1/31/2016 | $11.39 | 0.28 | (0.54) | (0.26) | (0.25) | (0.64) | (0.89) |
| Class C |
| Year Ended 1/31/2020 | $10.61 | 0.15 | 1.04 | 1.19 | (0.17) | (0.42) | (0.59) |
| Year Ended 1/31/2019 | $11.89 | 0.13 | (0.72) | (0.59) | (0.16) | (0.53) | (0.69) |
| Year Ended 1/31/2018 | $10.91 | 0.11 | 1.54 | 1.65 | (0.15) | (0.52) | (0.67) |
| Year Ended 1/31/2017 | $10.27 | 0.10 | 0.94 | 1.04 | (0.13) | (0.27) | (0.40) |
| Year Ended 1/31/2016 | $11.41 | 0.11 | (0.47) | (0.36) | (0.14) | (0.64) | (0.78) |
| Institutional Class |
| Year Ended 1/31/2020 | $10.69 | 0.26 | 1.06 | 1.32 | (0.28) | (0.42) | (0.70) |
| Year Ended 1/31/2019 | $11.97 | 0.25 | (0.72) | (0.47) | (0.28) | (0.53) | (0.81) |
| Year Ended 1/31/2018 | $10.98 | 0.24 | 1.53 | 1.77 | (0.26) | (0.52) | (0.78) |
| Year Ended 1/31/2017 | $10.33 | 0.22 | 0.94 | 1.16 | (0.24) | (0.27) | (0.51) |
| Year Ended 1/31/2016 | $11.49 | 0.22 | (0.49) | (0.27) | (0.25) | (0.64) | (0.89) |
| Institutional 2 Class |
| Year Ended 1/31/2020 | $10.56 | 0.27 | 1.03 | 1.30 | (0.28) | (0.42) | (0.70) |
| Year Ended 1/31/2019 | $11.84 | 0.23 | (0.70) | (0.47) | (0.28) | (0.53) | (0.81) |
| Year Ended 1/31/2018 | $10.87 | 0.22 | 1.54 | 1.76 | (0.27) | (0.52) | (0.79) |
| Year Ended 1/31/2017 | $10.23 | 0.21 | 0.94 | 1.15 | (0.24) | (0.27) | (0.51) |
| Year Ended 1/31/2016 | $11.39 | 0.51 | (0.77) | (0.26) | (0.26) | (0.64) | (0.90) |
| Institutional 3 Class |
| Year Ended 1/31/2020 | $10.56 | 0.27 | 1.05 | 1.32 | (0.29) | (0.42) | (0.71) |
| Year Ended 1/31/2019 | $11.84 | 0.27 | (0.74) | (0.47) | (0.28) | (0.53) | (0.81) |
| Year Ended 1/31/2018 | $10.87 | 0.24 | 1.52 | 1.76 | (0.27) | (0.52) | (0.79) |
| Year Ended 1/31/2017 | $10.23 | 0.23 | 0.93 | 1.16 | (0.25) | (0.27) | (0.52) |
| Year Ended 1/31/2016 | $11.38 | 0.16 | (0.40) | (0.24) | (0.27) | (0.64) | (0.91) |
The accompanying Notes to Financial Statements are an integral part of this statement.
| 106 | Columbia Capital Allocation Portfolios | Annual Report 2020 |
Financial Highlights (continued)
Columbia Capital Allocation Moderate Portfolio
| | Net
asset
value,
end of
period | Total
return | Total gross
expense
ratio to
average
net assets(a) | Total net
expense
ratio to
average
net assets(a),(b) | Net investment
income
ratio to
average
net assets | Portfolio
turnover | Net
assets,
end of
period
(000’s) |
| Class A |
| Year Ended 1/31/2020 | $11.32 | 12.26% | 0.43% | 0.43%(c) | 2.11% | 10% | $1,280,253 |
| Year Ended 1/31/2019 | $10.70 | (4.13%) | 0.43% | 0.43%(c) | 1.94% | 20% | $1,247,694 |
| Year Ended 1/31/2018 | $11.99 | 16.39% | 0.44% | 0.44%(c) | 1.68% | 9% | $1,389,747 |
| Year Ended 1/31/2017 | $10.99 | 11.19% | 0.44% | 0.44%(c) | 1.64% | 10% | $1,309,998 |
| Year Ended 1/31/2016 | $10.34 | (2.89%) | 0.46% | 0.46%(c) | 1.68% | 17% | $1,295,482 |
| Advisor Class |
| Year Ended 1/31/2020 | $11.17 | 12.51% | 0.18% | 0.18%(c) | 2.50% | 10% | $3,051 |
| Year Ended 1/31/2019 | $10.57 | (3.84%) | 0.18% | 0.18%(c) | 2.28% | 20% | $1,212 |
| Year Ended 1/31/2018 | $11.85 | 16.68% | 0.18% | 0.18%(c) | 2.60% | 9% | $1,021 |
| Year Ended 1/31/2017 | $10.87 | 11.39% | 0.19% | 0.19%(c) | 1.98% | 10% | $355 |
| Year Ended 1/31/2016 | $10.24 | (2.58%) | 0.21% | 0.21%(c) | 2.61% | 17% | $202 |
| Class C |
| Year Ended 1/31/2020 | $11.21 | 11.34% | 1.18% | 1.18%(c) | 1.35% | 10% | $153,545 |
| Year Ended 1/31/2019 | $10.61 | (4.82%) | 1.18% | 1.18%(c) | 1.15% | 20% | $160,172 |
| Year Ended 1/31/2018 | $11.89 | 15.46% | 1.19% | 1.19%(c) | 0.95% | 9% | $207,421 |
| Year Ended 1/31/2017 | $10.91 | 10.34% | 1.19% | 1.19%(c) | 0.90% | 10% | $186,170 |
| Year Ended 1/31/2016 | $10.27 | (3.48%) | 1.21% | 1.21%(c) | 0.95% | 17% | $178,548 |
| Institutional Class |
| Year Ended 1/31/2020 | $11.31 | 12.55% | 0.18% | 0.18%(c) | 2.37% | 10% | $37,112 |
| Year Ended 1/31/2019 | $10.69 | (3.80%) | 0.18% | 0.18%(c) | 2.19% | 20% | $38,025 |
| Year Ended 1/31/2018 | $11.97 | 16.60% | 0.19% | 0.19%(c) | 2.09% | 9% | $39,872 |
| Year Ended 1/31/2017 | $10.98 | 11.48% | 0.19% | 0.19%(c) | 2.02% | 10% | $4,598 |
| Year Ended 1/31/2016 | $10.33 | (2.65%) | 0.21% | 0.21%(c) | 1.92% | 17% | $2,443 |
| Institutional 2 Class |
| Year Ended 1/31/2020 | $11.16 | 12.53% | 0.17% | 0.17% | 2.42% | 10% | $5,447 |
| Year Ended 1/31/2019 | $10.56 | (3.83%) | 0.17% | 0.17% | 2.08% | 20% | $4,554 |
| Year Ended 1/31/2018 | $11.84 | 16.62% | 0.16% | 0.16% | 1.95% | 9% | $7,323 |
| Year Ended 1/31/2017 | $10.87 | 11.55% | 0.14% | 0.14% | 1.94% | 10% | $5,521 |
| Year Ended 1/31/2016 | $10.23 | (2.61%) | 0.15% | 0.15% | 4.80% | 17% | $3,803 |
| Institutional 3 Class |
| Year Ended 1/31/2020 | $11.17 | 12.68% | 0.13% | 0.13% | 2.42% | 10% | $11,042 |
| Year Ended 1/31/2019 | $10.56 | (3.79%) | 0.13% | 0.13% | 2.45% | 20% | $9,319 |
| Year Ended 1/31/2018 | $11.84 | 16.68% | 0.12% | 0.12% | 2.11% | 9% | $4,933 |
| Year Ended 1/31/2017 | $10.87 | 11.61% | 0.09% | 0.09% | 2.15% | 10% | $3,459 |
| Year Ended 1/31/2016 | $10.23 | (2.42%) | 0.09% | 0.09% | 1.59% | 17% | $368 |
The accompanying Notes to Financial Statements are an integral part of this statement.
Columbia Capital Allocation Portfolios | Annual Report 2020
| 107 |
Financial Highlights (continued)
Columbia Capital Allocation Moderate Portfolio
| | Net asset value,
beginning of
period | Net
investment
income | Net
realized
and
unrealized
gain (loss) | Total from
investment
operations | Distributions
from net
investment
income | Distributions
from net
realized
gains | Total
distributions to
shareholders |
| Class R |
| Year Ended 1/31/2020 | $10.67 | 0.20 | 1.05 | 1.25 | (0.22) | (0.42) | (0.64) |
| Year Ended 1/31/2019 | $11.95 | 0.19 | (0.72) | (0.53) | (0.22) | (0.53) | (0.75) |
| Year Ended 1/31/2018 | $10.96 | 0.17 | 1.55 | 1.72 | (0.21) | (0.52) | (0.73) |
| Year Ended 1/31/2017 | $10.32 | 0.16 | 0.93 | 1.09 | (0.18) | (0.27) | (0.45) |
| Year Ended 1/31/2016 | $11.47 | 0.16 | (0.47) | (0.31) | (0.20) | (0.64) | (0.84) |
| Notes to Financial Highlights |
| (a) | In addition to the fees and expenses that the Fund bears directly, the Fund indirectly bears a pro rata share of the fees and expenses of any other funds in which it invests. Such indirect expenses are not included in the Fund’s reported expense ratios. |
| (b) | Total net expenses include the impact of certain fee waivers/expense reimbursements made by the Investment Manager and certain of its affiliates, if applicable. |
| (c) | The benefits derived from expense reductions had an impact of less than 0.01%. |
The accompanying Notes to Financial Statements are an integral part of this statement.
| 108 | Columbia Capital Allocation Portfolios | Annual Report 2020 |
Financial Highlights (continued)
Columbia Capital Allocation Moderate Portfolio
| | Net
asset
value,
end of
period | Total
return | Total gross
expense
ratio to
average
net assets(a) | Total net
expense
ratio to
average
net assets(a),(b) | Net investment
income
ratio to
average
net assets | Portfolio
turnover | Net
assets,
end of
period
(000’s) |
| Class R |
| Year Ended 1/31/2020 | $11.28 | 11.92% | 0.68% | 0.68%(c) | 1.79% | 10% | $2,531 |
| Year Ended 1/31/2019 | $10.67 | (4.30%) | 0.68% | 0.68%(c) | 1.72% | 20% | $3,156 |
| Year Ended 1/31/2018 | $11.95 | 16.05% | 0.69% | 0.69%(c) | 1.46% | 9% | $2,786 |
| Year Ended 1/31/2017 | $10.96 | 10.84% | 0.69% | 0.69%(c) | 1.48% | 10% | $2,282 |
| Year Ended 1/31/2016 | $10.32 | (3.06%) | 0.71% | 0.71%(c) | 1.37% | 17% | $1,342 |
The accompanying Notes to Financial Statements are an integral part of this statement.
Columbia Capital Allocation Portfolios | Annual Report 2020
| 109 |
Financial Highlights
Columbia Capital Allocation Moderate Aggressive Portfolio
| | Net asset value,
beginning of
period | Net
investment
income | Net
realized
and
unrealized
gain (loss) | Total from
investment
operations | Distributions
from net
investment
income | Distributions
from net
realized
gains | Total
distributions to
shareholders |
| Class A |
| Year Ended 1/31/2020 | $11.64 | 0.22 | 1.33 | 1.55 | (0.24) | (0.67) | (0.91) |
| Year Ended 1/31/2019 | $13.50 | 0.20 | (0.97) | (0.77) | (0.24) | (0.85) | (1.09) |
| Year Ended 1/31/2018 | $12.00 | 0.17 | 2.27 | 2.44 | (0.21) | (0.73) | (0.94) |
| Year Ended 1/31/2017 | $11.15 | 0.15 | 1.30 | 1.45 | (0.16) | (0.44) | (0.60) |
| Year Ended 1/31/2016 | $12.45 | 0.18 | (0.55) | (0.37) | (0.22) | (0.71) | (0.93) |
| Advisor Class |
| Year Ended 1/31/2020 | $11.75 | 0.22 | 1.37 | 1.59 | (0.27) | (0.67) | (0.94) |
| Year Ended 1/31/2019 | $13.61 | 0.24 | (0.98) | (0.74) | (0.27) | (0.85) | (1.12) |
| Year Ended 1/31/2018 | $12.10 | 0.24 | 2.24 | 2.48 | (0.24) | (0.73) | (0.97) |
| Year Ended 1/31/2017 | $11.23 | 0.19 | 1.30 | 1.49 | (0.18) | (0.44) | (0.62) |
| Year Ended 1/31/2016 | $12.54 | 0.21 | (0.56) | (0.35) | (0.25) | (0.71) | (0.96) |
| Class C |
| Year Ended 1/31/2020 | $11.67 | 0.12 | 1.33 | 1.45 | (0.15) | (0.67) | (0.82) |
| Year Ended 1/31/2019 | $13.52 | 0.10 | (0.96) | (0.86) | (0.14) | (0.85) | (0.99) |
| Year Ended 1/31/2018 | $12.04 | 0.08 | 2.26 | 2.34 | (0.13) | (0.73) | (0.86) |
| Year Ended 1/31/2017 | $11.21 | 0.07 | 1.29 | 1.36 | (0.09) | (0.44) | (0.53) |
| Year Ended 1/31/2016 | $12.51 | 0.09 | (0.55) | (0.46) | (0.13) | (0.71) | (0.84) |
| Institutional Class |
| Year Ended 1/31/2020 | $11.62 | 0.24 | 1.33 | 1.57 | (0.27) | (0.67) | (0.94) |
| Year Ended 1/31/2019 | $13.47 | 0.23 | (0.96) | (0.73) | (0.27) | (0.85) | (1.12) |
| Year Ended 1/31/2018 | $11.98 | 0.20 | 2.26 | 2.46 | (0.24) | (0.73) | (0.97) |
| Year Ended 1/31/2017 | $11.13 | 0.18 | 1.29 | 1.47 | (0.18) | (0.44) | (0.62) |
| Year Ended 1/31/2016 | $12.44 | 0.21 | (0.56) | (0.35) | (0.25) | (0.71) | (0.96) |
| Institutional 2 Class |
| Year Ended 1/31/2020 | $11.74 | 0.26 | 1.32 | 1.58 | (0.27) | (0.67) | (0.94) |
| Year Ended 1/31/2019 | $13.60 | 0.24 | (0.97) | (0.73) | (0.28) | (0.85) | (1.13) |
| Year Ended 1/31/2018 | $12.09 | 0.23 | 2.26 | 2.49 | (0.25) | (0.73) | (0.98) |
| Year Ended 1/31/2017 | $11.23 | 0.20 | 1.30 | 1.50 | (0.20) | (0.44) | (0.64) |
| Year Ended 1/31/2016 | $12.53 | 0.38 | (0.71) | (0.33) | (0.26) | (0.71) | (0.97) |
| Institutional 3 Class |
| Year Ended 1/31/2020 | $11.45 | 0.26 | 1.30 | 1.56 | (0.28) | (0.67) | (0.95) |
| Year Ended 1/31/2019 | $13.30 | 0.22 | (0.94) | (0.72) | (0.28) | (0.85) | (1.13) |
| Year Ended 1/31/2018 | $11.84 | 0.31 | 2.13 | 2.44 | (0.25) | (0.73) | (0.98) |
| Year Ended 1/31/2017 | $11.01 | 0.21 | 1.26 | 1.47 | (0.20) | (0.44) | (0.64) |
| Year Ended 1/31/2016 | $12.31 | 0.13 | (0.45) | (0.32) | (0.27) | (0.71) | (0.98) |
The accompanying Notes to Financial Statements are an integral part of this statement.
| 110 | Columbia Capital Allocation Portfolios | Annual Report 2020 |
Financial Highlights (continued)
Columbia Capital Allocation Moderate Aggressive Portfolio
| | Net
asset
value,
end of
period | Total
return | Total gross
expense
ratio to
average
net assets(a) | Total net
expense
ratio to
average
net assets(a),(b) | Net investment
income
ratio to
average
net assets | Portfolio
turnover | Net
assets,
end of
period
(000’s) |
| Class A |
| Year Ended 1/31/2020 | $12.28 | 13.51% | 0.50% | 0.50%(c) | 1.77% | 10% | $1,645,913 |
| Year Ended 1/31/2019 | $11.64 | (5.48%) | 0.49% | 0.49%(c) | 1.59% | 18% | $1,603,992 |
| Year Ended 1/31/2018 | $13.50 | 20.88% | 0.49% | 0.49%(c) | 1.35% | 9% | $1,826,698 |
| Year Ended 1/31/2017 | $12.00 | 13.24% | 0.47%(d) | 0.47%(c),(d) | 1.30% | 9% | $1,671,442 |
| Year Ended 1/31/2016 | $11.15 | (3.42%) | 0.52% | 0.52%(c) | 1.42% | 16% | $1,646,276 |
| Advisor Class |
| Year Ended 1/31/2020 | $12.40 | 13.75% | 0.25% | 0.25%(c) | 1.80% | 10% | $7,779 |
| Year Ended 1/31/2019 | $11.75 | (5.19%) | 0.24% | 0.24%(c) | 1.90% | 18% | $14,622 |
| Year Ended 1/31/2018 | $13.61 | 21.09% | 0.24% | 0.24%(c) | 1.86% | 9% | $11,216 |
| Year Ended 1/31/2017 | $12.10 | 13.61% | 0.22%(d) | 0.22%(c),(d) | 1.62% | 9% | $2,128 |
| Year Ended 1/31/2016 | $11.23 | (3.23%) | 0.27% | 0.27%(c) | 1.72% | 16% | $1,119 |
| Class C |
| Year Ended 1/31/2020 | $12.30 | 12.55% | 1.25% | 1.25%(c) | 1.01% | 10% | $148,134 |
| Year Ended 1/31/2019 | $11.67 | (6.12%) | 1.24% | 1.24%(c) | 0.77% | 18% | $151,414 |
| Year Ended 1/31/2018 | $13.52 | 19.91% | 1.24% | 1.24%(c) | 0.59% | 9% | $215,268 |
| Year Ended 1/31/2017 | $12.04 | 12.36% | 1.22%(d) | 1.22%(c),(d) | 0.55% | 9% | $216,271 |
| Year Ended 1/31/2016 | $11.21 | (4.08%) | 1.27% | 1.27%(c) | 0.69% | 16% | $206,181 |
| Institutional Class |
| Year Ended 1/31/2020 | $12.25 | 13.73% | 0.25% | 0.25%(c) | 2.01% | 10% | $107,497 |
| Year Ended 1/31/2019 | $11.62 | (5.17%) | 0.24% | 0.24%(c) | 1.83% | 18% | $108,487 |
| Year Ended 1/31/2018 | $13.47 | 21.13% | 0.24% | 0.24%(c) | 1.59% | 9% | $136,761 |
| Year Ended 1/31/2017 | $11.98 | 13.55% | 0.22%(d) | 0.22%(c),(d) | 1.55% | 9% | $119,833 |
| Year Ended 1/31/2016 | $11.13 | (3.26%) | 0.27% | 0.27%(c) | 1.67% | 16% | $113,846 |
| Institutional 2 Class |
| Year Ended 1/31/2020 | $12.38 | 13.72% | 0.20% | 0.20% | 2.13% | 10% | $9,890 |
| Year Ended 1/31/2019 | $11.74 | (5.15%) | 0.19% | 0.19% | 1.89% | 18% | $7,961 |
| Year Ended 1/31/2018 | $13.60 | 21.18% | 0.19% | 0.19% | 1.80% | 9% | $8,881 |
| Year Ended 1/31/2017 | $12.09 | 13.63% | 0.13%(d) | 0.13%(d) | 1.68% | 9% | $5,706 |
| Year Ended 1/31/2016 | $11.23 | (3.05%) | 0.17% | 0.17% | 3.15% | 16% | $3,537 |
| Institutional 3 Class |
| Year Ended 1/31/2020 | $12.06 | 13.87% | 0.15% | 0.15% | 2.15% | 10% | $13,771 |
| Year Ended 1/31/2019 | $11.45 | (5.14%) | 0.14% | 0.14% | 1.80% | 18% | $11,447 |
| Year Ended 1/31/2018 | $13.30 | 21.26% | 0.14% | 0.14% | 2.47% | 9% | $20,776 |
| Year Ended 1/31/2017 | $11.84 | 13.68% | 0.07%(d) | 0.07%(d) | 1.81% | 9% | $1,128 |
| Year Ended 1/31/2016 | $11.01 | (3.09%) | 0.12% | 0.12% | 1.16% | 16% | $379 |
The accompanying Notes to Financial Statements are an integral part of this statement.
Columbia Capital Allocation Portfolios | Annual Report 2020
| 111 |
Financial Highlights (continued)
Columbia Capital Allocation Moderate Aggressive Portfolio
| | Net asset value,
beginning of
period | Net
investment
income | Net
realized
and
unrealized
gain (loss) | Total from
investment
operations | Distributions
from net
investment
income | Distributions
from net
realized
gains | Total
distributions to
shareholders |
| Class R |
| Year Ended 1/31/2020 | $11.63 | 0.18 | 1.33 | 1.51 | (0.21) | (0.67) | (0.88) |
| Year Ended 1/31/2019 | $13.48 | 0.17 | (0.96) | (0.79) | (0.21) | (0.85) | (1.06) |
| Year Ended 1/31/2018 | $11.99 | 0.15 | 2.24 | 2.39 | (0.17) | (0.73) | (0.90) |
| Year Ended 1/31/2017 | $11.14 | 0.13 | 1.29 | 1.42 | (0.13) | (0.44) | (0.57) |
| Year Ended 1/31/2016 | $12.44 | 0.14 | (0.54) | (0.40) | (0.19) | (0.71) | (0.90) |
| Class V |
| Year Ended 1/31/2020 | $11.64 | 0.22 | 1.33 | 1.55 | (0.24) | (0.67) | (0.91) |
| Year Ended 1/31/2019 | $13.50 | 0.20 | (0.97) | (0.77) | (0.24) | (0.85) | (1.09) |
| Year Ended 1/31/2018 | $12.00 | 0.17 | 2.27 | 2.44 | (0.21) | (0.73) | (0.94) |
| Year Ended 1/31/2017 | $11.15 | 0.15 | 1.30 | 1.45 | (0.16) | (0.44) | (0.60) |
| Year Ended 1/31/2016 | $12.45 | 0.18 | (0.55) | (0.37) | (0.22) | (0.71) | (0.93) |
| Notes to Financial Highlights |
| (a) | In addition to the fees and expenses that the Fund bears directly, the Fund indirectly bears a pro rata share of the fees and expenses of any other funds in which it invests. Such indirect expenses are not included in the Fund’s reported expense ratios. |
| (b) | Total net expenses include the impact of certain fee waivers/expense reimbursements made by the Investment Manager and certain of its affiliates, if applicable. |
| (c) | The benefits derived from expense reductions had an impact of less than 0.01%. |
| (d) | Expenses have been reduced due to a reimbursement of expenses overbilled by a third party. If the reimbursement had been excluded, the expense ratios would have been higher by the percentages shown for each class in the table below. All fee waivers and expense reimbursements by the Investment Manager and its affiliates were applied before giving effect to this third party reimbursement. |
| Year Ended | Class A | Advisor
Class | Class C | Institutional
Class | Institutional 2
Class | Institutional 3
Class | Class R | Class V |
| 01/31/2017 | 0.04% | 0.04% | 0.04% | 0.04% | 0.04% | 0.05% | 0.04% | 0.04% |
The accompanying Notes to Financial Statements are an integral part of this statement.
| 112 | Columbia Capital Allocation Portfolios | Annual Report 2020 |
Financial Highlights (continued)
Columbia Capital Allocation Moderate Aggressive Portfolio
| | Net
asset
value,
end of
period | Total
return | Total gross
expense
ratio to
average
net assets(a) | Total net
expense
ratio to
average
net assets(a),(b) | Net investment
income
ratio to
average
net assets | Portfolio
turnover | Net
assets,
end of
period
(000’s) |
| Class R |
| Year Ended 1/31/2020 | $12.26 | 13.15% | 0.75% | 0.75%(c) | 1.46% | 10% | $4,823 |
| Year Ended 1/31/2019 | $11.63 | (5.66%) | 0.74% | 0.74%(c) | 1.37% | 18% | $4,957 |
| Year Ended 1/31/2018 | $13.48 | 20.51% | 0.74% | 0.74%(c) | 1.14% | 9% | $4,816 |
| Year Ended 1/31/2017 | $11.99 | 12.97% | 0.72%(d) | 0.72%(c),(d) | 1.10% | 9% | $3,743 |
| Year Ended 1/31/2016 | $11.14 | (3.67%) | 0.77% | 0.77%(c) | 1.11% | 16% | $3,556 |
| Class V |
| Year Ended 1/31/2020 | $12.28 | 13.51% | 0.50% | 0.50%(c) | 1.78% | 10% | $81,137 |
| Year Ended 1/31/2019 | $11.64 | (5.48%) | 0.49% | 0.49%(c) | 1.58% | 18% | $79,629 |
| Year Ended 1/31/2018 | $13.50 | 20.88% | 0.49% | 0.49%(c) | 1.35% | 9% | $93,279 |
| Year Ended 1/31/2017 | $12.00 | 13.24% | 0.47%(d) | 0.47%(c),(d) | 1.30% | 9% | $86,404 |
| Year Ended 1/31/2016 | $11.15 | (3.42%) | 0.52% | 0.52%(c) | 1.42% | 16% | $85,135 |
The accompanying Notes to Financial Statements are an integral part of this statement.
Columbia Capital Allocation Portfolios | Annual Report 2020
| 113 |
Financial Highlights
Columbia Capital Allocation Aggressive Portfolio
| | Net asset value,
beginning of
period | Net
investment
income | Net
realized
and
unrealized
gain (loss) | Total from
investment
operations | Distributions
from net
investment
income | Distributions
from net
realized
gains | Total
distributions to
shareholders |
| Class A |
| Year Ended 1/31/2020 | $11.90 | 0.19 | 1.45 | 1.64 | (0.19) | (0.77) | (0.96) |
| Year Ended 1/31/2019 | $14.10 | 0.17 | (1.19) | (1.02) | (0.23) | (0.95) | (1.18) |
| Year Ended 1/31/2018 | $12.11 | 0.14 | 2.85 | 2.99 | (0.20) | (0.80) | (1.00) |
| Year Ended 1/31/2017 | $11.08 | 0.13 | 1.49 | 1.62 | (0.14) | (0.45) | (0.59) |
| Year Ended 1/31/2016 | $12.54 | 0.15 | (0.57) | (0.42) | (0.19) | (0.85) | (1.04) |
| Advisor Class |
| Year Ended 1/31/2020 | $11.64 | 0.19 | 1.45 | 1.64 | (0.22) | (0.77) | (0.99) |
| Year Ended 1/31/2019 | $13.83 | 0.20 | (1.18) | (0.98) | (0.26) | (0.95) | (1.21) |
| Year Ended 1/31/2018 | $11.89 | 0.14 | 2.83 | 2.97 | (0.23) | (0.80) | (1.03) |
| Year Ended 1/31/2017 | $10.89 | 0.15 | 1.46 | 1.61 | (0.16) | (0.45) | (0.61) |
| Year Ended 1/31/2016 | $12.34 | 0.24 | (0.61) | (0.37) | (0.23) | (0.85) | (1.08) |
| Class C |
| Year Ended 1/31/2020 | $11.60 | 0.09 | 1.42 | 1.51 | (0.10) | (0.77) | (0.87) |
| Year Ended 1/31/2019 | $13.77 | 0.07 | (1.16) | (1.09) | (0.13) | (0.95) | (1.08) |
| Year Ended 1/31/2018 | $11.85 | 0.04 | 2.79 | 2.83 | (0.11) | (0.80) | (0.91) |
| Year Ended 1/31/2017 | $10.87 | 0.04 | 1.45 | 1.49 | (0.06) | (0.45) | (0.51) |
| Year Ended 1/31/2016 | $12.32 | 0.06 | (0.55) | (0.49) | (0.11) | (0.85) | (0.96) |
| Institutional Class |
| Year Ended 1/31/2020 | $11.84 | 0.22 | 1.45 | 1.67 | (0.22) | (0.77) | (0.99) |
| Year Ended 1/31/2019 | $14.04 | 0.15 | (1.13) | (0.98) | (0.27) | (0.95) | (1.22) |
| Year Ended 1/31/2018 | $12.06 | 0.22 | 2.79 | 3.01 | (0.23) | (0.80) | (1.03) |
| Year Ended 1/31/2017 | $11.03 | 0.16 | 1.48 | 1.64 | (0.16) | (0.45) | (0.61) |
| Year Ended 1/31/2016 | $12.49 | 0.19 | (0.58) | (0.39) | (0.22) | (0.85) | (1.07) |
| Institutional 2 Class |
| Year Ended 1/31/2020 | $11.64 | 0.23 | 1.41 | 1.64 | (0.22) | (0.77) | (0.99) |
| Year Ended 1/31/2019 | $13.82 | 0.20 | (1.16) | (0.96) | (0.27) | (0.95) | (1.22) |
| Year Ended 1/31/2018 | $11.88 | 0.19 | 2.79 | 2.98 | (0.24) | (0.80) | (1.04) |
| Year Ended 1/31/2017 | $10.88 | 0.17 | 1.45 | 1.62 | (0.17) | (0.45) | (0.62) |
| Year Ended 1/31/2016 | $12.33 | 0.31 | (0.68) | (0.37) | (0.23) | (0.85) | (1.08) |
| Institutional 3 Class |
| Year Ended 1/31/2020 | $11.63 | 0.23 | 1.42 | 1.65 | (0.23) | (0.77) | (1.00) |
| Year Ended 1/31/2019 | $13.82 | 0.22 | (1.19) | (0.97) | (0.27) | (0.95) | (1.22) |
| Year Ended 1/31/2018 | $11.88 | 0.18 | 2.80 | 2.98 | (0.24) | (0.80) | (1.04) |
| Year Ended 1/31/2017 | $10.87 | 0.19 | 1.45 | 1.64 | (0.18) | (0.45) | (0.63) |
| Year Ended 1/31/2016 | $12.32 | 0.08 | (0.44) | (0.36) | (0.24) | (0.85) | (1.09) |
The accompanying Notes to Financial Statements are an integral part of this statement.
| 114 | Columbia Capital Allocation Portfolios | Annual Report 2020 |
Financial Highlights (continued)
Columbia Capital Allocation Aggressive Portfolio
| | Net
asset
value,
end of
period | Total
return | Total gross
expense
ratio to
average
net assets(a) | Total net
expense
ratio to
average
net assets(a),(b) | Net investment
income
ratio to
average
net assets | Portfolio
turnover | Net
assets,
end of
period
(000’s) |
| Class A |
| Year Ended 1/31/2020 | $12.58 | 14.00% | 0.47% | 0.47%(c) | 1.49% | 12% | $623,971 |
| Year Ended 1/31/2019 | $11.90 | (6.90%) | 0.47% | 0.47%(c) | 1.30% | 20% | $599,211 |
| Year Ended 1/31/2018 | $14.10 | 25.45% | 0.49% | 0.49%(c) | 1.08% | 13% | $670,783 |
| Year Ended 1/31/2017 | $12.11 | 14.95% | 0.50% | 0.50%(c) | 1.06% | 12% | $582,182 |
| Year Ended 1/31/2016 | $11.08 | (3.92%) | 0.51% | 0.51%(c) | 1.18% | 12% | $549,678 |
| Advisor Class |
| Year Ended 1/31/2020 | $12.29 | 14.33% | 0.22% | 0.22%(c) | 1.60% | 12% | $1,611 |
| Year Ended 1/31/2019 | $11.64 | (6.69%) | 0.22% | 0.22%(c) | 1.58% | 20% | $1,965 |
| Year Ended 1/31/2018 | $13.83 | 25.76% | 0.23% | 0.23%(c) | 1.10% | 13% | $1,662 |
| Year Ended 1/31/2017 | $11.89 | 15.20% | 0.25% | 0.25%(c) | 1.27% | 12% | $1,242 |
| Year Ended 1/31/2016 | $10.89 | (3.65%) | 0.26% | 0.26%(c) | 1.97% | 12% | $779 |
| Class C |
| Year Ended 1/31/2020 | $12.24 | 13.21% | 1.22% | 1.22%(c) | 0.75% | 12% | $74,297 |
| Year Ended 1/31/2019 | $11.60 | (7.64%) | 1.22% | 1.22%(c) | 0.52% | 20% | $70,524 |
| Year Ended 1/31/2018 | $13.77 | 24.61% | 1.24% | 1.24%(c) | 0.34% | 13% | $88,717 |
| Year Ended 1/31/2017 | $11.85 | 14.01% | 1.25% | 1.25%(c) | 0.33% | 12% | $75,648 |
| Year Ended 1/31/2016 | $10.87 | (4.60%) | 1.25% | 1.25%(c) | 0.46% | 12% | $66,938 |
| Institutional Class |
| Year Ended 1/31/2020 | $12.52 | 14.34% | 0.22% | 0.22%(c) | 1.76% | 12% | $11,920 |
| Year Ended 1/31/2019 | $11.84 | (6.65%) | 0.22% | 0.22%(c) | 1.17% | 20% | $10,382 |
| Year Ended 1/31/2018 | $14.04 | 25.73% | 0.23% | 0.23%(c) | 1.67% | 13% | $20,763 |
| Year Ended 1/31/2017 | $12.06 | 15.27% | 0.25% | 0.25%(c) | 1.39% | 12% | $3,329 |
| Year Ended 1/31/2016 | $11.03 | (3.69%) | 0.26% | 0.26%(c) | 1.55% | 12% | $1,809 |
| Institutional 2 Class |
| Year Ended 1/31/2020 | $12.29 | 14.35% | 0.20% | 0.20% | 1.92% | 12% | $5,079 |
| Year Ended 1/31/2019 | $11.64 | (6.60%) | 0.20% | 0.20% | 1.56% | 20% | $2,978 |
| Year Ended 1/31/2018 | $13.82 | 25.83% | 0.20% | 0.20% | 1.44% | 13% | $2,642 |
| Year Ended 1/31/2017 | $11.88 | 15.28% | 0.18% | 0.18% | 1.49% | 12% | $1,638 |
| Year Ended 1/31/2016 | $10.88 | (3.58%) | 0.18% | 0.18% | 2.61% | 12% | $1,041 |
| Institutional 3 Class |
| Year Ended 1/31/2020 | $12.28 | 14.42% | 0.15% | 0.15% | 1.86% | 12% | $10,623 |
| Year Ended 1/31/2019 | $11.63 | (6.62%) | 0.15% | 0.15% | 1.75% | 20% | $8,668 |
| Year Ended 1/31/2018 | $13.82 | 25.89% | 0.14% | 0.14% | 1.40% | 13% | $3,722 |
| Year Ended 1/31/2017 | $11.88 | 15.44% | 0.13% | 0.13% | 1.66% | 12% | $2,111 |
| Year Ended 1/31/2016 | $10.87 | (3.54%) | 0.15% | 0.15% | 0.69% | 12% | $214 |
The accompanying Notes to Financial Statements are an integral part of this statement.
Columbia Capital Allocation Portfolios | Annual Report 2020
| 115 |
Financial Highlights (continued)
Columbia Capital Allocation Aggressive Portfolio
| | Net asset value,
beginning of
period | Net
investment
income | Net
realized
and
unrealized
gain (loss) | Total from
investment
operations | Distributions
from net
investment
income | Distributions
from net
realized
gains | Total
distributions to
shareholders |
| Class R |
| Year Ended 1/31/2020 | $11.80 | 0.15 | 1.45 | 1.60 | (0.16) | (0.77) | (0.93) |
| Year Ended 1/31/2019 | $13.99 | 0.14 | (1.18) | (1.04) | (0.20) | (0.95) | (1.15) |
| Year Ended 1/31/2018 | $12.02 | 0.11 | 2.83 | 2.94 | (0.17) | (0.80) | (0.97) |
| Year Ended 1/31/2017 | $11.01 | 0.14 | 1.43 | 1.57 | (0.11) | (0.45) | (0.56) |
| Year Ended 1/31/2016 | $12.46 | 0.12 | (0.56) | (0.44) | (0.16) | (0.85) | (1.01) |
| Notes to Financial Highlights |
| (a) | In addition to the fees and expenses that the Fund bears directly, the Fund indirectly bears a pro rata share of the fees and expenses of any other funds in which it invests. Such indirect expenses are not included in the Fund’s reported expense ratios. |
| (b) | Total net expenses include the impact of certain fee waivers/expense reimbursements made by the Investment Manager and certain of its affiliates, if applicable. |
| (c) | The benefits derived from expense reductions had an impact of less than 0.01%. |
The accompanying Notes to Financial Statements are an integral part of this statement.
| 116 | Columbia Capital Allocation Portfolios | Annual Report 2020 |
Financial Highlights (continued)
Columbia Capital Allocation Aggressive Portfolio
| | Net
asset
value,
end of
period | Total
return | Total gross
expense
ratio to
average
net assets(a) | Total net
expense
ratio to
average
net assets(a),(b) | Net investment
income
ratio to
average
net assets | Portfolio
turnover | Net
assets,
end of
period
(000’s) |
| Class R |
| Year Ended 1/31/2020 | $12.47 | 13.77% | 0.72% | 0.72%(c) | 1.21% | 12% | $2,927 |
| Year Ended 1/31/2019 | $11.80 | (7.15%) | 0.72% | 0.72%(c) | 1.09% | 20% | $2,750 |
| Year Ended 1/31/2018 | $13.99 | 25.21% | 0.73% | 0.73%(c) | 0.83% | 13% | $2,671 |
| Year Ended 1/31/2017 | $12.02 | 14.61% | 0.75% | 0.75%(c) | 1.22% | 12% | $2,099 |
| Year Ended 1/31/2016 | $11.01 | (4.09%) | 0.76% | 0.76%(c) | 0.97% | 12% | $1,029 |
The accompanying Notes to Financial Statements are an integral part of this statement.
Columbia Capital Allocation Portfolios | Annual Report 2020
| 117 |
Notes to Financial Statements
January 31, 2020
Note 1. Organization
Columbia Funds Series Trust and Columbia Funds Series Trust II (each, a Trust and collectively, the Trusts), are registered under the Investment Company Act of 1940, as amended (the 1940 Act), as open-end management investment companies. Columbia Funds Series Trust is organized as a Delaware statutory trust and Columbia Funds Series Trust II is organized as a Massachusetts business trust.
Information presented in these financial statements pertains to the following series of the Trusts (each, a Fund and collectively, the Funds): Columbia Capital Allocation Moderate Conservative Portfolio and Columbia Capital Allocation Moderate Aggressive Portfolio, each a series of Columbia Funds Series Trust, and Columbia Capital Allocation Conservative Portfolio, Columbia Capital Allocation Moderate Portfolio and Columbia Capital Allocation Aggressive Portfolio, each a series of Columbia Funds Series Trust II. Each Fund currently operates as a diversified fund.
Each Fund is a “fund-of-funds”, investing significantly in affiliated funds managed by Columbia Management Investment Advisers, LLC (the Investment Manager), a wholly-owned subsidiary of Ameriprise Financial, Inc. (Ameriprise Financial), or its affiliates, as well as third-party advised (unaffiliated) funds, including exchange-traded funds (collectively, Underlying Funds). Each Fund is exposed to the same risks as the Underlying Funds in direct proportion to the allocation of its assets among the Underlying Funds. For information on the investment strategies and risks of the Underlying Funds, please refer to the Fund’s current prospectus and the prospectuses of the Underlying Funds, which are available, free of charge, from the Securities and Exchange Commission website at www.sec.gov.
Fund shares
Each Trust may issue an unlimited number of shares (without par value) that can be allocated among the separate series as designated by the Board of Trustees.
Columbia Capital Allocation Conservative Portfolio, Columbia Capital Allocation Moderate Conservative Portfolio, Columbia Capital Allocation Moderate Portfolio, Columbia Capital Allocation Moderate Aggressive Portfolio and Columbia Capital Allocation Aggressive Portfolio offer each of the share classes listed in the Statement of Assets and Liabilities. Although all share classes generally have identical voting, dividend and liquidation rights, each share class votes separately when required by the Trusts’ organizational documents or by law. Different share classes pay different distribution amounts to the extent the expenses of such share classes differ, and distributions in liquidation will be proportional to the net asset value of each share class. Each share class has its own expense structure and sales charges.
Class A and Class C shares are offered to the general public for investment. Advisor Class, Institutional Class, Institutional 2 Class, Institutional 3 Class and Class R shares are available through authorized investment professionals, to omnibus retirement plans or to institutional and certain other investors as described in the Fund’s prospectus. Class C shares automatically convert to Class A shares after 10 years. Class V shares are available only to investors who received (and who continuously held) Class V shares in connection with previous fund reorganizations.
Note 2. Summary of significant accounting policies
Basis of preparation
Each Fund is an investment company that applies the accounting and reporting guidance in the Financial Accounting Standards Board (FASB) Accounting Standards Codification Topic 946, Financial Services - Investment Companies (ASC 946). The financial statements are prepared in accordance with U.S. generally accepted accounting principles (GAAP), which requires management to make certain estimates and assumptions that affect the reported amounts of assets and liabilities, the disclosure of contingent assets and liabilities at the date of the financial statements and the reported amounts of income and expenses during the reporting period. Actual results could differ from those estimates.
The following is a summary of significant accounting policies followed by the Funds in the preparation of their financial statements.
| 118 | Columbia Capital Allocation Portfolios | Annual Report 2020 |
Notes to Financial Statements (continued)
January 31, 2020
Security valuation
All equity securities are valued at the close of business of the New York Stock Exchange. Equity securities are valued at the official closing price on the principal exchange or market on which they trade. Unlisted securities or listed securities for which there were no sales during the day are valued at the mean of the latest quoted bid and ask prices on such exchanges or markets.
Foreign equity securities are valued based on the closing price on the foreign exchange in which such securities are primarily traded. If any foreign equity security closing prices are not readily available, the securities are valued at the mean of the latest quoted bid and ask prices on such exchanges or markets. Foreign currency exchange rates are determined at the scheduled closing time of the New York Stock Exchange. Many securities markets and exchanges outside the U.S. close prior to the close of the New York Stock Exchange; therefore, the closing prices for securities in such markets or on such exchanges may not fully reflect events that occur after such close but before the close of the New York Stock Exchange. In those situations, foreign securities will be fair valued pursuant to a policy adopted by the Board of Trustees. Under the policy, the Fund may utilize a third-party pricing service to determine these fair values. The third-party pricing service takes into account multiple factors, including, but not limited to, movements in the U.S. securities markets, certain depositary receipts, futures contracts and foreign exchange rates that have occurred subsequent to the close of the foreign exchange or market, to determine a good faith estimate that reasonably reflects the current market conditions as of the close of the New York Stock Exchange. The fair value of a security is likely to be different from the quoted or published price, if available.
Investments in the Underlying Funds, with the exception of exchange-traded funds, are valued at the net asset value of the applicable class of the Underlying Fund determined as of the close of the New York Stock Exchange on the valuation date.
Forward foreign currency exchange contracts are marked-to-market based upon foreign currency exchange rates provided by a pricing service.
Futures and options on futures contracts are valued based upon the settlement price at the close of regular trading on their principal exchanges or, in the absence of transactions, at the mean of the latest quoted bid and ask prices.
Swap transactions are valued through an independent pricing service or broker, or if neither is available, through an internal model based upon observable inputs.
Investments for which market quotations are not readily available, or that have quotations which management believes are not reflective of market value or reliable, are valued at fair value as determined in good faith under procedures approved by and under the general supervision of the Board of Trustees. If a security or class of securities (such as foreign securities) is valued at fair value, such value is likely to be different from the quoted or published price for the security, if available.
The determination of fair value often requires significant judgment. To determine fair value, management may use assumptions including but not limited to future cash flows and estimated risk premiums. Multiple inputs from various sources may be used to determine fair value.
GAAP requires disclosure regarding the inputs and valuation techniques used to measure fair value and any changes in valuation inputs or techniques. In addition, investments shall be disclosed by major category. This information is disclosed following the Funds’ Portfolio of Investments.
Foreign currency transactions and translations
The values of all assets and liabilities denominated in foreign currencies are generally translated into U.S. dollars at exchange rates determined at the close of regular trading on the New York Stock Exchange. Net realized and unrealized gains (losses) on foreign currency transactions and translations include gains (losses) arising from the fluctuation in exchange rates between trade and settlement dates on securities transactions, gains (losses) arising from the disposition of foreign currency and currency gains (losses) between the accrual and payment dates on dividends, interest income and foreign withholding taxes.
Columbia Capital Allocation Portfolios | Annual Report 2020
| 119 |
Notes to Financial Statements (continued)
January 31, 2020
For financial statement purposes, the Funds do not distinguish that portion of gains (losses) on investments which is due to changes in foreign exchange rates from that which is due to changes in market prices of the investments. Such fluctuations are included with the net realized and unrealized gains (losses) on investments in the Statement of Operations.
Derivative instruments
Certain Funds invest in certain derivative instruments, as detailed below, to meet its investment objectives. Derivatives are instruments whose values depend on, or are derived from, in whole or in part, the value of one or more securities, currencies, commodities, indices, or other assets or instruments. Derivatives may be used to increase investment flexibility (including to maintain cash reserves while maintaining desired exposure to certain assets), for risk management (hedging) purposes, to facilitate trading, to reduce transaction costs and to pursue higher investment returns. The Fund may also use derivative instruments to mitigate certain investment risks, such as foreign currency exchange rate risk, interest rate risk and credit risk. Derivatives may involve various risks, including the potential inability of the counterparty to fulfill its obligations under the terms of the contract, the potential for an illiquid secondary market (making it difficult for the Fund to sell or terminate, including at favorable prices) and the potential for market movements which may expose the Fund to gains or losses in excess of the amount shown in the Statement of Assets and Liabilities. The notional amounts of derivative instruments, if applicable, are not recorded in the financial statements.
A derivative instrument may suffer a marked-to-market loss if the value of the contract decreases due to an unfavorable change in the market rates or values of the underlying instrument. Losses can also occur if the counterparty does not perform its obligations under the contract. The Fund’s risk of loss from counterparty credit risk on over-the-counter derivatives is generally limited to the aggregate unrealized gain netted against any collateral held by the Fund and the amount of any variation margin held by the counterparty, plus any replacement costs or related amounts. With exchange-traded or centrally cleared derivatives, there is reduced counterparty credit risk to the Fund since the clearinghouse or central counterparty (CCP) provides some protection in the case of clearing member default. The clearinghouse or CCP stands between the buyer and the seller of the contract; therefore, additional counterparty credit risk is failure of the clearinghouse or CCP. However, credit risk still exists in exchange-traded or centrally cleared derivatives with respect to initial and variation margin that is held in a broker’s customer account. While brokers are required to segregate customer margin from their own assets, in the event that a broker becomes insolvent or goes into bankruptcy and at that time there is a shortfall in the aggregate amount of margin held by the broker for all its clients, U.S. bankruptcy laws will typically allocate that shortfall on a pro-rata basis across all the broker’s customers (including the Fund), potentially resulting in losses to the Fund.
In order to better define its contractual rights and to secure rights that will help the Fund mitigate its counterparty risk, the Fund may enter into an International Swaps and Derivatives Association, Inc. Master Agreement (ISDA Master Agreement) or similar agreement with its derivatives contract counterparties. An ISDA Master Agreement is an agreement between the Fund and a counterparty that governs over-the-counter derivatives and typically contains, among other things, collateral posting terms and netting provisions in the event of a default and/or termination event. Under an ISDA Master Agreement, the Fund may, under certain circumstances, offset with the counterparty certain derivative instrument’s payables and/or receivables with collateral held and/or posted and create one single net payment. The provisions of the ISDA Master Agreement typically permit a single net payment in the event of default (close-out netting), including the bankruptcy or insolvency of the counterparty. Note, however, that bankruptcy or insolvency laws of a particular jurisdiction may impose restrictions on or prohibitions against the right of offset or netting in bankruptcy, insolvency or other events.
Collateral (margin) requirements differ by type of derivative. Margin requirements are established by the clearinghouse or CCP for exchange-traded and centrally cleared derivatives. Brokers can ask for margin in excess of the minimum in certain circumstances. Collateral terms are contract specific for over-the-counter derivatives. For over-the-counter derivatives traded under an ISDA Master Agreement, the collateral requirements are typically calculated by netting the marked-to-market amount for each transaction under such agreement and comparing that amount to the value of any variation margin currently pledged by the Fund and/or the counterparty. Generally, the amount of collateral due from or to a party has to exceed a minimum transfer amount threshold (e.g., $250,000) before a transfer has to be made. To the extent amounts due to the Fund from its counterparties are not fully collateralized, contractually or otherwise, the Fund bears the risk of loss from counterparty nonperformance. The Fund may also pay interest expense on cash collateral received from the broker. Any interest expense
| 120 | Columbia Capital Allocation Portfolios | Annual Report 2020 |
Notes to Financial Statements (continued)
January 31, 2020
paid by the Fund is shown on the Statement of Operations. The Fund attempts to mitigate counterparty risk by only entering into agreements with counterparties that it believes have the financial resources to honor their obligations and by monitoring the financial stability of those counterparties.
Certain ISDA Master Agreements allow counterparties of over-the-counter derivatives transactions to terminate derivatives contracts prior to maturity in the event the Fund’s net asset value declines by a stated percentage over a specified time period or if the Fund fails to meet certain terms of the ISDA Master Agreement, which would cause the Fund to accelerate payment of any net liability owed to the counterparty. The Fund also has termination rights if the counterparty fails to meet certain terms of the ISDA Master Agreement. In determining whether to exercise such termination rights, the Fund would consider, in addition to counterparty credit risk, whether termination would result in a net liability owed from the counterparty.
For financial reporting purposes, the Fund does not offset derivative assets and derivative liabilities that are subject to netting arrangements in the Statement of Assets and Liabilities.
Forward foreign currency exchange contracts
Forward foreign currency exchange contracts are over-the-counter agreements between two parties to buy and sell a currency at a set price on a future date. Each Fund utilized forward foreign currency exchange contracts to hedge the currency exposure associated with some or all of the Fund’s securities, to shift foreign currency exposure back to U.S. dollars, to shift investment exposure from one currency to another, to shift U.S. dollar exposure to achieve a representative weighted mix of major currencies in its benchmark and to recover an underweight country exposure in its portfolio. These instruments may be used for other purposes in future periods.
The values of forward foreign currency exchange contracts fluctuate daily with changes in foreign currency exchange rates. Changes in the value of these contracts are recorded as unrealized appreciation or depreciation until the contract is exercised or has expired. The Fund will realize a gain or loss when the forward foreign currency exchange contract is closed or expires. Non-deliverable forward foreign currency exchange contracts are settled with the counterparty in U.S. dollars without delivery of foreign currency.
The use of forward foreign currency exchange contracts does not eliminate fluctuations in the prices of the Fund’s portfolio securities. The risks of forward foreign currency exchange contracts include movement in the values of the foreign currencies relative to the U.S. dollar (or other foreign currencies) and the possibility that counterparties will not complete their contractual obligations, which may be in excess of the amount reflected, if any, in the Statement of Assets and Liabilities.
Futures contracts
Futures contracts are exchange-traded and represent commitments for the future purchase or sale of an asset at a specified price on a specified date. Each Fund bought and sold futures contracts to produce incremental earnings, to manage the duration and yield curve exposure of the Fund versus the benchmark, to manage exposure to movements in interest rates, to manage exposure to the securities market and to maintain appropriate equity market exposure while keeping sufficient cash to accommodate daily redemptions. These instruments may be used for other purposes in future periods. Upon entering into futures contracts, the Fund bears risks that it may not achieve the anticipated benefits of the futures contracts and may realize a loss. Additional risks include counterparty credit risk, the possibility of an illiquid market, and that a change in the value of the contract or option may not correlate with changes in the value of the underlying asset.
Upon entering into a futures contract, the Fund deposits cash or securities with the broker, known as a futures commission merchant (FCM), in an amount sufficient to meet the initial margin requirement. The initial margin deposit must be maintained at an established level over the life of the contract. Cash deposited as initial margin is recorded in the Statement of Assets and Liabilities as margin deposits. Securities deposited as initial margin are designated in the Portfolio of Investments. Subsequent payments (variation margin) are made or received by the Fund each day. The variation margin payments are equal to the daily change in the contract value and are recorded as variation margin receivable or payable and are offset in unrealized gains or losses. The Fund recognizes a realized gain or loss when the contract is closed or expires. Futures contracts involve, to varying degrees, risk of loss in excess of the variation margin disclosed in the Statement of Assets and Liabilities.
Columbia Capital Allocation Portfolios | Annual Report 2020
| 121 |
Notes to Financial Statements (continued)
January 31, 2020
Options contracts
Options are contracts which entitle the holder to purchase or sell securities or other identified assets at a specified price, or in the case of index option contracts, to receive or pay the difference between the index value and the strike price of the index option contract. Option contracts can be either exchange-traded or over-the-counter. The Fund purchased option contracts to protect gains. These instruments may be used for other purposes in future periods. Completion of transactions for option contracts traded in the over-the-counter market depends upon the performance of the other party. Cash collateral may be collected or posted by the Fund to secure certain over-the-counter option contract trades. Cash collateral held or posted by the Fund for such option contract trades must be returned to the broker or the Fund upon closure, exercise or expiration of the contract.
Options contracts purchased are recorded as investments. When the Fund writes an options contract, the premium received is recorded as an asset and an amount equivalent to the premium is recorded as a liability in the Statement of Assets and Liabilities and is subsequently adjusted to reflect the current fair value of the option written. Changes in the fair value of the written option are recorded as unrealized appreciation or depreciation until the contract is exercised or has expired. The Fund will realize a gain or loss when the option contract is closed or expires. When option contracts are exercised, the proceeds on sales for a written call or purchased put option contract, or the purchase cost for a written put or purchased call option contract, is adjusted by the amount of premium received or paid.
For over-the-counter options purchased, the Fund bears the risk of loss of the amount of the premiums paid plus the positive change in market values net of any collateral held by the Fund should the counterparty fail to perform under the contracts. Option contracts written by the Fund do not typically give rise to significant counterparty credit risk, as options written generally obligate the Fund and not the counterparty to perform. The risk in writing a call option contract is that the Fund gives up the opportunity for profit if the market price of the security increases above the strike price and the option contract is exercised. The risk in writing a put option contract is that the Fund may incur a loss if the market price of the security decreases below the strike price and the option contract is exercised. Exercise of a written option could result in the Fund purchasing or selling a security or foreign currency when it otherwise would not, or at a price different from the current market value. In purchasing and writing options, the Fund bears the risk of an unfavorable change in the value of the underlying instrument or the risk that the Fund may not be able to enter into a closing transaction due to an illiquid market.
Swap contracts
Swap contracts are negotiated in the over-the-counter market and may be entered into as a bilateral contract or centrally cleared (centrally cleared swap contract). In a centrally cleared swap contract, immediately following execution of the swap contract with a broker, the swap contract is novated to a central counterparty (the CCP) and the CCP becomes the Fund’s counterparty to the centrally cleared swap contract. The Fund is required to deposit initial margin with the futures commission merchant (FCM), which pledges it through to the CCP in the form of cash or securities in an amount that varies depending on the size and risk profile of the particular swap contract. Securities deposited as initial margin are designated in the Portfolio of Investments and cash deposited is recorded in the Statement of Assets and Liabilities as margin deposits. Unlike a bilateral swap contract, for centrally cleared swap contracts, the Fund has minimal credit exposure to the FCM because the CCP stands between the Fund and the relevant buyer/seller on the other side of the contract. Swap contracts are marked-to-market daily and changes in value are recorded as unrealized appreciation (depreciation). The daily change in valuation of centrally cleared swap contracts, if any, is recorded as a receivable or payable for variation margin in the Statement of Assets and Liabilities.
Entering into these contracts involves, to varying degrees, elements of interest, liquidity and counterparty credit risk in excess of the amounts recognized in the Statement of Assets and Liabilities. Such risks involve the possibility that there may be unfavorable changes in interest rates, market conditions or other conditions, that it may be difficult to initiate a swap transaction or liquidate a position at an advantageous time or price which may result in significant losses, and that the FCM or CCP may not fulfill its obligation under the contract.
Credit default swap contracts
Certain Funds entered into credit default swap contracts to increase or decrease its credit exposure to an index increase or decrease its credit exposure to a specific debt security or a basket of debt securities, as a protection buyer to reduce overall credit exposure. These instruments may be used for other purposes in future periods. Credit default swap contracts are
| 122 | Columbia Capital Allocation Portfolios | Annual Report 2020 |
Notes to Financial Statements (continued)
January 31, 2020
agreements in which one party pays fixed periodic payments to a counterparty in consideration for an agreement from the counterparty to make a specific payment should a specified credit event(s) take place. Although specified credit events are contract specific, credit events are generally defined as bankruptcy, failure to pay, restructuring, obligation acceleration, obligation default, or repudiation/moratorium.
As the purchaser of a credit default swap contract, the Fund purchases protection by paying a periodic interest rate on the notional amount to the counterparty. The interest amount is accrued daily as a component of unrealized appreciation (depreciation) and is recorded as a realized loss upon payment. If a credit event as specified in the contract occurs, the Fund may have the option either to deliver the reference obligation to the seller in exchange for a cash payment of its par amount, or to receive a net cash settlement equal to the par amount less an agreed-upon value of the reference obligation as of the date of the credit event. The difference between the value of the obligation or cash delivered and the notional amount received will be recorded as a realized gain (loss).
As the seller of a credit default swap contract, the Fund sells protection to a buyer and will generally receive a periodic interest rate on a notional amount. The interest amount is accrued daily as a component of unrealized appreciation (depreciation) and is recorded as a realized gain upon receipt of the payment. If a credit event as specified in the contract with the counterparty occurs, the Fund may either be required to accept the reference obligation from the buyer in exchange for a cash payment of its notional amount, or to pay the buyer a net cash settlement equal to the notional amount less an agreed-upon value of the reference obligation (recovery value) as of the date of the credit event. The difference between the value of the obligation or cash received and the notional amount paid will be recorded as a realized gain (loss). The maximum potential amount of undiscounted future payments the Fund could be required to make as the seller of protection under a credit default swap contract is equal to the notional amount of the reference obligation. These potential amounts may be partially offset by any recovery values of the respective reference obligations or upfront receipts upon entering into the agreement. The notional amounts and market values of all credit default swap contracts in which the Fund is the seller of protection, if any, are disclosed in the Credit Default Swap Contracts Outstanding schedule following the Portfolio of Investments.
As a protection seller, the Fund bears the risk of loss from the credit events specified in the contract with the counterparty. For credit default swap contracts on credit indices, quoted market prices and resulting market values serve as an indicator of the current status of the payment/performance risk. Increasing market values, in absolute terms when compared to the notional amount of the swap, represent a deterioration of the reference entity’s credit soundness and a greater likelihood or risk of default or other credit event occurring as defined under the terms of the contract.
Any upfront payments or receipts by the Fund upon entering into a credit default swap contract is recorded as an asset or liability, respectively, and amortized daily as a component of realized gain (loss) in the Statement of Operations. Credit default swap contracts are valued daily, and the change in value is recorded as unrealized appreciation (depreciation) until the termination of the swap, at which time a realized gain (loss) is recorded.
Credit default swap contracts can involve greater risks than if a fund had invested in the reference obligation directly since, in addition to general market risks, credit default swaps are subject to counterparty credit risk, leverage risk, hedging risk, correlation risk and liquidity risk.
Effects of derivative transactions in the financial statements
The following tables are intended to provide additional information about the effect of derivatives on the financial statements of the Funds, including: the fair value of derivatives by risk category and the location of those fair values in the Statements of Assets and Liabilities; and the impact of derivative transactions over the period in the Statements of Operations, including realized gains or losses and unrealized gains or losses. The derivative schedules following the Portfolio of Investments present additional information regarding derivative instruments outstanding at the end of the period, if any.
Columbia Capital Allocation Portfolios | Annual Report 2020
| 123 |
Notes to Financial Statements (continued)
January 31, 2020
Columbia Capital Allocation Conservative Portfolio
The following table is a summary of the fair value of derivative instruments (not considered to be hedging instruments for accounting disclosure purposes) at January 31, 2020:
| | Asset derivatives | |
Risk exposure
category | Statement
of assets and liabilities
location | Fair value ($) |
| Credit risk | Component of total distributable earnings (loss) — unrealized appreciation on swap contracts | 11,041* |
| Equity risk | Component of total distributable earnings (loss) — unrealized appreciation on futures contracts | 193,165* |
| Foreign exchange risk | Unrealized appreciation on forward foreign currency exchange contracts | 2,630 |
| Interest rate risk | Component of total distributable earnings (loss) — unrealized appreciation on futures contracts | 666,543* |
| Total | | 873,379 |
| | Liability derivatives | |
Risk exposure
category | Statement
of assets and liabilities
location | Fair value ($) |
| Equity risk | Component of total distributable earnings (loss) — unrealized depreciation on futures contracts | 162,105* |
| Foreign exchange risk | Unrealized depreciation on forward foreign currency exchange contracts | 6 |
| Total | | 162,111 |
| * | Includes cumulative appreciation (depreciation) as reported in the tables following the Portfolio of Investments. Only the current day’s variation margin is reported in receivables or payables in the Statement of Assets and Liabilities. |
The following table indicates the effect of derivative instruments (not considered to be hedging instruments for accounting disclosure purposes) in the Statement of Operations for the year ended January 31, 2020:
| Amount of realized gain (loss) on derivatives recognized in income |
| Risk exposure category | Forward
foreign
currency
exchange
contracts
($) | Futures
contracts
($) | Options
contracts
purchased
($) | Swap
contracts
($) | Total
($) |
| Credit risk | — | — | — | (95,038) | (95,038) |
| Equity risk | — | (536,475) | (37,350) | — | (573,825) |
| Foreign exchange risk | 5,746 | — | — | — | 5,746 |
| Interest rate risk | — | 1,152,446 | — | — | 1,152,446 |
| Total | 5,746 | 615,971 | (37,350) | (95,038) | 489,329 |
| Change in unrealized appreciation (depreciation) on derivatives recognized in income |
| Risk exposure category | Forward
foreign
currency
exchange
contracts
($) | Futures
contracts
($) | Swap
contracts
($) | Total
($) |
| Credit risk | — | — | 65,084 | 65,084 |
| Equity risk | — | 330,443 | — | 330,443 |
| Foreign exchange risk | 5,066 | — | — | 5,066 |
| Interest rate risk | — | 461,715 | — | 461,715 |
| Total | 5,066 | 792,158 | 65,084 | 862,308 |
| 124 | Columbia Capital Allocation Portfolios | Annual Report 2020 |
Notes to Financial Statements (continued)
January 31, 2020
The following table is a summary of the average outstanding volume by derivative instrument for the year ended January 31, 2020:
| Derivative instrument | Average notional
amounts ($)* |
| Futures contracts — long | 29,074,272 |
| Futures contracts — short | 5,445,265 |
| Credit default swap contracts — sell protection | 1,684,220 |
| Derivative instrument | Average
value ($)** |
| Options contracts — purchased | 9,401 |
| Derivative instrument | Average unrealized
appreciation ($)* | Average unrealized
depreciation ($)* |
| Forward foreign currency exchange contracts | 1,937 | (1,005) |
| * | Based on the ending quarterly outstanding amounts for the year ended January 31, 2020. |
| ** | Based on the ending daily outstanding amounts for the year ended January 31, 2020. |
Columbia Capital Allocation Moderate Conservative Portfolio
The following table is a summary of the fair value of derivative instruments (not considered to be hedging instruments for accounting disclosure purposes) at January 31, 2020:
| | Asset derivatives | |
Risk exposure
category | Statement
of assets and liabilities
location | Fair value ($) |
| Credit risk | Component of total distributable earnings (loss) — unrealized appreciation on swap contracts | 25,595* |
| Equity risk | Component of total distributable earnings (loss) — unrealized appreciation on futures contracts | 767,191* |
| Foreign exchange risk | Unrealized appreciation on forward foreign currency exchange contracts | 4,101 |
| Interest rate risk | Component of total distributable earnings (loss) — unrealized appreciation on futures contracts | 1,355,490* |
| Total | | 2,152,377 |
| | Liability derivatives | |
Risk exposure
category | Statement
of assets and liabilities
location | Fair value ($) |
| Equity risk | Component of total distributable earnings (loss) — unrealized depreciation on futures contracts | 501,414* |
| Foreign exchange risk | Unrealized depreciation on forward foreign currency exchange contracts | 10 |
| Total | | 501,424 |
| * | Includes cumulative appreciation (depreciation) as reported in the tables following the Portfolio of Investments. Only the current day’s variation margin is reported in receivables or payables in the Statement of Assets and Liabilities. |
Columbia Capital Allocation Portfolios | Annual Report 2020
| 125 |
Notes to Financial Statements (continued)
January 31, 2020
The following table indicates the effect of derivative instruments (not considered to be hedging instruments for accounting disclosure purposes) in the Statement of Operations for the year ended January 31, 2020:
| Amount of realized gain (loss) on derivatives recognized in income |
| Risk exposure category | Forward
foreign
currency
exchange
contracts
($) | Futures
contracts
($) | Options
contracts
purchased
($) | Swap
contracts
($) | Total
($) |
| Credit risk | — | — | — | (307,046) | (307,046) |
| Equity risk | — | 2,459,108 | (129,479) | — | 2,329,629 |
| Foreign exchange risk | 8,717 | — | — | — | 8,717 |
| Interest rate risk | — | 1,838,882 | — | — | 1,838,882 |
| Total | 8,717 | 4,297,990 | (129,479) | (307,046) | 3,870,182 |
| Change in unrealized appreciation (depreciation) on derivatives recognized in income |
| Risk exposure category | Forward
foreign
currency
exchange
contracts
($) | Futures
contracts
($) | Swap
contracts
($) | Total
($) |
| Credit risk | — | — | 219,214 | 219,214 |
| Equity risk | — | 107,702 | — | 107,702 |
| Foreign exchange risk | 7,830 | — | — | 7,830 |
| Interest rate risk | — | 1,052,344 | — | 1,052,344 |
| Total | 7,830 | 1,160,046 | 219,214 | 1,387,090 |
The following table is a summary of the average outstanding volume by derivative instrument for the year ended January 31, 2020:
| Derivative instrument | Average notional
amounts ($)* |
| Futures contracts — long | 81,877,216 |
| Futures contracts — short | 11,347,219 |
| Credit default swap contracts — sell protection | 3,904,013 |
| Derivative instrument | Average
value ($)** |
| Options contracts — purchased | 53,387 |
| Derivative instrument | Average unrealized
appreciation ($)* | Average unrealized
depreciation ($)* |
| Forward foreign currency exchange contracts | 2,987 | (1,540) |
| * | Based on the ending quarterly outstanding amounts for the year ended January 31, 2020. |
| ** | Based on the ending daily outstanding amounts for the year ended January 31, 2020. |
| 126 | Columbia Capital Allocation Portfolios | Annual Report 2020 |
Notes to Financial Statements (continued)
January 31, 2020
Columbia Capital Allocation Moderate Portfolio
The following table is a summary of the fair value of derivative instruments (not considered to be hedging instruments for accounting disclosure purposes) at January 31, 2020:
| | Asset derivatives | |
Risk exposure
category | Statement
of assets and liabilities
location | Fair value ($) |
| Credit risk | Component of total distributable earnings (loss) — unrealized appreciation on swap contracts | 78,506* |
| Equity risk | Component of total distributable earnings (loss) — unrealized appreciation on futures contracts | 3,926,138* |
| Foreign exchange risk | Unrealized appreciation on forward foreign currency exchange contracts | 11,231 |
| Interest rate risk | Component of total distributable earnings (loss) — unrealized appreciation on futures contracts | 2,519,700* |
| Total | | 6,535,575 |
| | Liability derivatives | |
Risk exposure
category | Statement
of assets and liabilities
location | Fair value ($) |
| Equity risk | Component of total distributable earnings (loss) — unrealized depreciation on futures contracts | 1,880,996* |
| Foreign exchange risk | Unrealized depreciation on forward foreign currency exchange contracts | 2,219 |
| Total | | 1,883,215 |
| * | Includes cumulative appreciation (depreciation) as reported in the tables following the Portfolio of Investments. Only the current day’s variation margin is reported in receivables or payables in the Statement of Assets and Liabilities. |
The following table indicates the effect of derivative instruments (not considered to be hedging instruments for accounting disclosure purposes) in the Statement of Operations for the year ended January 31, 2020:
| Amount of realized gain (loss) on derivatives recognized in income |
| Risk exposure category | Forward
foreign
currency
exchange
contracts
($) | Futures
contracts
($) | Options
contracts
purchased
($) | Swap
contracts
($) | Total
($) |
| Credit risk | — | — | — | (929,769) | (929,769) |
| Equity risk | — | 18,855,051 | (493,016) | — | 18,362,035 |
| Foreign exchange risk | 17,711 | — | — | — | 17,711 |
| Interest rate risk | — | 1,121,829 | — | — | 1,121,829 |
| Total | 17,711 | 19,976,880 | (493,016) | (929,769) | 18,571,806 |
| Change in unrealized appreciation (depreciation) on derivatives recognized in income |
| Risk exposure category | Forward
foreign
currency
exchange
contracts
($) | Futures
contracts
($) | Swap
contracts
($) | Total
($) |
| Credit risk | — | — | 557,587 | 557,587 |
| Equity risk | — | (1,674,105) | — | (1,674,105) |
| Foreign exchange risk | 16,201 | — | — | 16,201 |
| Interest rate risk | — | 2,894,546 | — | 2,894,546 |
| Total | 16,201 | 1,220,441 | 557,587 | 1,794,229 |
Columbia Capital Allocation Portfolios | Annual Report 2020
| 127 |
Notes to Financial Statements (continued)
January 31, 2020
The following table is a summary of the average outstanding volume by derivative instrument for the year ended January 31, 2020:
| Derivative instrument | Average notional
amounts ($) |
| Futures contracts — long | 253,544,132* |
| Futures contracts — short | 47,669,470* |
| Credit default swap contracts — buy protection | 7,043,625** |
| Credit default swap contracts — sell protection | 13,002,010* |
| Derivative instrument | Average
value ($)** |
| Options contracts — purchased | 124,089 |
| Derivative instrument | Average unrealized
appreciation ($)* | Average unrealized
depreciation ($)* |
| Forward foreign currency exchange contracts | 6,193 | (2,757) |
| * | Based on the ending quarterly outstanding amounts for the year ended January 31, 2020. |
| ** | Based on the ending daily outstanding amounts for the year ended January 31, 2020. |
Columbia Capital Allocation Moderate Aggressive Portfolio
The following table is a summary of the fair value of derivative instruments (not considered to be hedging instruments for accounting disclosure purposes) at January 31, 2020:
| | Asset derivatives | |
Risk exposure
category | Statement
of assets and liabilities
location | Fair value ($) |
| Credit risk | Component of total distributable earnings (loss) — unrealized appreciation on swap contracts | 121,280* |
| Equity risk | Component of total distributable earnings (loss) — unrealized appreciation on futures contracts | 7,188,403* |
| Foreign exchange risk | Unrealized appreciation on forward foreign currency exchange contracts | 7,773 |
| Interest rate risk | Component of total distributable earnings (loss) — unrealized appreciation on futures contracts | 3,165,306* |
| Total | | 10,482,762 |
| | Liability derivatives | |
Risk exposure
category | Statement
of assets and liabilities
location | Fair value ($) |
| Equity risk | Component of total distributable earnings (loss) — unrealized depreciation on futures contracts | 3,418,822* |
| Foreign exchange risk | Unrealized depreciation on forward foreign currency exchange contracts | 1,544 |
| Total | | 3,420,366 |
| * | Includes cumulative appreciation (depreciation) as reported in the tables following the Portfolio of Investments. Only the current day’s variation margin is reported in receivables or payables in the Statement of Assets and Liabilities. |
| 128 | Columbia Capital Allocation Portfolios | Annual Report 2020 |
Notes to Financial Statements (continued)
January 31, 2020
The following table indicates the effect of derivative instruments (not considered to be hedging instruments for accounting disclosure purposes) in the Statement of Operations for the year ended January 31, 2020:
| Amount of realized gain (loss) on derivatives recognized in income |
| Risk exposure category | Forward
foreign
currency
exchange
contracts
($) | Futures
contracts
($) | Options
contracts
purchased
($) | Swap
contracts
($) | Total
($) |
| Credit risk | — | — | — | (1,198,498) | (1,198,498) |
| Equity risk | — | 39,304,887 | (839,123) | — | 38,465,764 |
| Foreign exchange risk | 12,112 | — | — | — | 12,112 |
| Interest rate risk | — | 6,229,948 | — | — | 6,229,948 |
| Total | 12,112 | 45,534,835 | (839,123) | (1,198,498) | 43,509,326 |
| Change in unrealized appreciation (depreciation) on derivatives recognized in income |
| Risk exposure category | Forward
foreign
currency
exchange
contracts
($) | Futures
contracts
($) | Swap
contracts
($) | Total
($) |
| Credit risk | — | — | 698,894 | 698,894 |
| Equity risk | — | (5,864,352) | — | (5,864,352) |
| Foreign exchange risk | 11,276 | — | — | 11,276 |
| Interest rate risk | — | 2,833,841 | — | 2,833,841 |
| Total | 11,276 | (3,030,511) | 698,894 | (2,320,341) |
The following table is a summary of the average outstanding volume by derivative instrument for the year ended January 31, 2020:
| Derivative instrument | Average notional
amounts ($) |
| Futures contracts — long | 450,545,161* |
| Futures contracts — short | 68,620,270* |
| Credit default swap contracts — buy protection | 9,861,012** |
| Credit default swap contracts — sell protection | 22,408,160* |
| Derivative instrument | Average
value ($)** |
| Options contracts — purchased | 211,202 |
| Derivative instrument | Average unrealized
appreciation ($)* | Average unrealized
depreciation ($)* |
| Forward foreign currency exchange contracts | 4,297 | (1,925) |
| * | Based on the ending quarterly outstanding amounts for the year ended January 31, 2020. |
| ** | Based on the ending daily outstanding amounts for the year ended January 31, 2020. |
Columbia Capital Allocation Portfolios | Annual Report 2020
| 129 |
Notes to Financial Statements (continued)
January 31, 2020
Columbia Capital Allocation Aggressive Portfolio
The following table is a summary of the fair value of derivative instruments (not considered to be hedging instruments for accounting disclosure purposes) at January 31, 2020:
| | Asset derivatives | |
Risk exposure
category | Statement
of assets and liabilities
location | Fair value ($) |
| Credit risk | Component of total distributable earnings (loss) — unrealized appreciation on swap contracts | 49,504* |
| Equity risk | Component of total distributable earnings (loss) — unrealized appreciation on futures contracts | 2,606,039* |
| Foreign exchange risk | Unrealized appreciation on forward foreign currency exchange contracts | 9,214 |
| Interest rate risk | Component of total distributable earnings (loss) — unrealized appreciation on futures contracts | 553,995* |
| Total | | 3,218,752 |
| | Liability derivatives | |
Risk exposure
category | Statement
of assets and liabilities
location | Fair value ($) |
| Equity risk | Component of total distributable earnings (loss) — unrealized depreciation on futures contracts | 1,218,474* |
| Foreign exchange risk | Unrealized depreciation on forward foreign currency exchange contracts | 1,794 |
| Total | | 1,220,268 |
| * | Includes cumulative appreciation (depreciation) as reported in the tables following the Portfolio of Investments. Only the current day’s variation margin is reported in receivables or payables in the Statement of Assets and Liabilities. |
The following table indicates the effect of derivative instruments (not considered to be hedging instruments for accounting disclosure purposes) in the Statement of Operations for the year ended January 31, 2020:
| Amount of realized gain (loss) on derivatives recognized in income |
| Risk exposure category | | Forward
foreign
currency
exchange
contracts
($) | Futures
contracts
($) | Options
contracts
purchased
($) | Swap
contracts
($) | Total
($) |
| Credit risk | | — | — | — | (230,110) | (230,110) |
| Equity risk | | — | 9,204,098 | (358,557) | — | 8,845,541 |
| Foreign exchange risk | | 14,419 | — | — | — | 14,419 |
| Interest rate risk | | — | 688,701 | — | — | 688,701 |
| Total | | 14,419 | 9,892,799 | (358,557) | (230,110) | 9,318,551 |
| |
| Change in unrealized appreciation (depreciation) on derivatives recognized in income |
| Risk exposure category | | | Forward
foreign
currency
exchange
contracts
($) | Futures
contracts
($) | Swap
contracts
($) | Total
($) |
| Credit risk | | | — | — | 142,471 | 142,471 |
| Equity risk | | | — | (507,337) | — | (507,337) |
| Foreign exchange risk | | | 13,378 | — | — | 13,378 |
| Interest rate risk | | | — | 551,078 | — | 551,078 |
| Total | | | 13,378 | 43,741 | 142,471 | 199,590 |
| 130 | Columbia Capital Allocation Portfolios | Annual Report 2020 |
Notes to Financial Statements (continued)
January 31, 2020
The following table is a summary of the average outstanding volume by derivative instrument for the year ended January 31, 2020:
| Derivative instrument | Average notional
amounts ($) |
| Futures contracts — long | 116,326,820* |
| Futures contracts — short | 31,966,924* |
| Credit default swap contracts — buy protection | 2,520,176** |
| Credit default swap contracts — sell protection | 10,058,160* |
| Derivative instrument | Average
value ($)** |
| Options contracts — purchased | 90,247 |
| Derivative instrument | Average unrealized
appreciation ($)* | Average unrealized
depreciation ($)* |
| Forward foreign currency exchange contracts | 5,109 | (2,273) |
| * | Based on the ending quarterly outstanding amounts for the year ended January 31, 2020. |
| ** | Based on the ending daily outstanding amounts for the year ended January 31, 2020. |
Offsetting of assets and liabilities
The following table presents the Fund’s gross and net amount of assets and liabilities available for offset under netting arrangements as well as any related collateral received or pledged by the Fund as of January 31, 2020:
Columbia Capital Allocation Conservative Portfolio
| | JPMorgan ($) | Morgan
Stanley ($) | Total ($) |
| Assets | | | |
| Forward foreign currency exchange contracts | 2,630 | - | 2,630 |
| Total assets | 2,630 | - | 2,630 |
| Liabilities | | | |
| Centrally cleared credit default swap contracts (a) | - | 3,888 | 3,888 |
| Forward foreign currency exchange contracts | 6 | - | 6 |
| Total liabilities | 6 | 3,888 | 3,894 |
| Total financial and derivative net assets | 2,624 | (3,888) | (1,264) |
| Total collateral received (pledged) (b) | - | (3,888) | (3,888) |
| Net amount (c) | 2,624 | - | 2,624 |
| (a) | Centrally cleared swaps are included within payable/receivable for variation margin on the Statement of Assets and Liabilities. |
| (b) | In some instances, the actual collateral received and/or pledged may be more than the amount shown due to overcollateralization. |
| (c) | Represents the net amount due from/(to) counterparties in the event of default. |
Columbia Capital Allocation Portfolios | Annual Report 2020
| 131 |
Notes to Financial Statements (continued)
January 31, 2020
Columbia Capital Allocation Moderate Conservative Portfolio
| | JPMorgan ($) | Morgan
Stanley ($) | Total ($) |
| Assets | | | |
| Forward foreign currency exchange contracts | 4,101 | - | 4,101 |
| Total assets | 4,101 | - | 4,101 |
| Liabilities | | | |
| Centrally cleared credit default swap contracts (a) | - | 9,014 | 9,014 |
| Forward foreign currency exchange contracts | 10 | - | 10 |
| Total liabilities | 10 | 9,014 | 9,024 |
| Total financial and derivative net assets | 4,091 | (9,014) | (4,923) |
| Total collateral received (pledged) (b) | - | (9,014) | (9,014) |
| Net amount (c) | 4,091 | - | 4,091 |
| (a) | Centrally cleared swaps are included within payable/receivable for variation margin on the Statement of Assets and Liabilities. |
| (b) | In some instances, the actual collateral received and/or pledged may be more than the amount shown due to overcollateralization. |
| (c) | Represents the net amount due from/(to) counterparties in the event of default. |
Columbia Capital Allocation Moderate Portfolio
| | | Morgan
Stanley ($)(a) | Morgan
Stanley ($)(a) | Total ($) |
| Assets | | | | |
| Forward foreign currency exchange contracts | | 11,231 | - | 11,231 |
| Total assets | | 11,231 | - | 11,231 |
| Liabilities | | | | |
| Centrally cleared credit default swap contracts (b) | | - | 38,441 | 38,441 |
| Forward foreign currency exchange contracts | | 2,219 | - | 2,219 |
| Total liabilities | | 2,219 | 38,441 | 40,660 |
| Total financial and derivative net assets | | 9,012 | (38,441) | (29,429) |
| Total collateral received (pledged) (c) | | - | (38,441) | (38,441) |
| Net amount (d) | | 9,012 | - | 9,012 |
| (a) | Exposure can only be netted across transactions governed under the same master agreement with the same legal entity. |
| (b) | Centrally cleared swaps are included within payable/receivable for variation margin on the Statement of Assets and Liabilities. |
| (c) | In some instances, the actual collateral received and/or pledged may be more than the amount shown due to overcollateralization. |
| (d) | Represents the net amount due from/(to) counterparties in the event of default. |
Columbia Capital Allocation Moderate Aggressive Portfolio
| | Morgan
Stanley ($) (a) | Morgan
Stanley ($) (a) | Total ($) |
| Assets | | | |
| Forward foreign currency exchange contracts | 7,773 | - | 7,773 |
| Total assets | 7,773 | - | 7,773 |
| Liabilities | | | |
| Centrally cleared credit default swap contracts (b) | - | 83,786 | 83,786 |
| Forward foreign currency exchange contracts | 1,544 | - | 1,544 |
| Total liabilities | 1,544 | 83,786 | 85,330 |
| Total financial and derivative net assets | 6,229 | (83,786) | (77,557) |
| Total collateral received (pledged) (c) | - | (83,786) | (83,786) |
| Net amount (d) | 6,229 | - | 6,229 |
| 132 | Columbia Capital Allocation Portfolios | Annual Report 2020 |
Notes to Financial Statements (continued)
January 31, 2020
| (a) | Exposure can only be netted across transactions governed under the same master agreement with the same legal entity. |
| (b) | Centrally cleared swaps are included within payable/receivable for variation margin on the Statement of Assets and Liabilities. |
| (c) | In some instances, the actual collateral received and/or pledged may be more than the amount shown due to overcollateralization. |
| (d) | Represents the net amount due from/(to) counterparties in the event of default. |
Columbia Capital Allocation Aggressive Portfolio
| | Morgan
Stanley ($)(a) | Morgan
Stanley ($)(a) | Total ($) |
| Assets | | | |
| Forward foreign currency exchange contracts | 9,214 | - | 9,214 |
| Total assets | 9,214 | - | 9,214 |
| Liabilities | | | |
| Centrally cleared credit default swap contracts (b) | - | 43,779 | 43,779 |
| Forward foreign currency exchange contracts | 1,794 | - | 1,794 |
| Total liabilities | 1,794 | 43,779 | 45,573 |
| Total financial and derivative net assets | 7,420 | (43,779) | (36,359) |
| Total collateral received (pledged) (c) | - | (43,779) | (43,779) |
| Net amount (d) | 7,420 | - | 7,420 |
| (a) | Exposure can only be netted across transactions governed under the same master agreement with the same legal entity. |
| (b) | Centrally cleared swaps are included within payable/receivable for variation margin on the Statement of Assets and Liabilities. |
| (c) | In some instances, the actual collateral received and/or pledged may be more than the amount shown due to overcollateralization. |
| (d) | Represents the net amount due from/(to) counterparties in the event of default. |
Security transactions
Security transactions are accounted for on the trade date. Cost is determined and gains (losses) are based upon the specific identification method for both financial statement and federal income tax purposes.
Income recognition
Corporate actions and dividend income are generally recorded net of any non-reclaimable tax withholdings, on the ex-dividend date or upon receipt of ex-dividend notification in the case of certain foreign securities.
The Funds may receive distributions from holdings in equity securities, business development companies (BDCs), exchange-traded funds (ETFs), limited partnerships (LPs), other regulated investment companies (RICs), and real estate investment trusts (REITs), which report information as to the tax character of their distributions annually. These distributions are allocated to dividend income, capital gain and return of capital based on actual information reported. Return of capital is recorded as a reduction of the cost basis of securities held. If the Fund no longer owns the applicable securities, return of capital is recorded as a realized gain. With respect to REITs, to the extent actual information has not yet been reported, estimates for return of capital are made by Columbia Management Investment Advisers, LLC (the Investment Manager), a wholly-owned subsidiary of Ameriprise Financial, Inc. (Ameriprise Financial). The Investment Manager’s estimates are subsequently adjusted when the actual character of the distributions is disclosed by the REITs, which could result in a proportionate change in return of capital to shareholders.
Awards from class action litigation are recorded as a reduction of cost basis if the Fund still owns the applicable securities on the payment date. If the Fund no longer owns the applicable securities on the payment date, the proceeds are recorded as realized gains.
Income and capital gain distributions from the Underlying Funds, if any, are recorded on the ex-dividend date.
Expenses
General expenses of the Trusts are allocated to the Funds and other funds of the Trusts based upon relative net assets or other expense allocation methodologies determined by the nature of the expense. Expenses directly attributable to a Fund are charged to that Fund. Expenses directly attributable to a specific class of shares are charged to that share class.
Columbia Capital Allocation Portfolios | Annual Report 2020
| 133 |
Notes to Financial Statements (continued)
January 31, 2020
Determination of class net asset value
All income, expenses (other than class-specific expenses which are charged directly to that share class, as shown in the Statement of Operations) and realized and unrealized gains (losses) are allocated to each class of a Fund on a daily basis, based on the relative net assets of each class, for purposes of determining the net asset value of each class.
Federal income tax status
For federal income tax purposes, each Fund is treated as a separate entity. The Funds intend to qualify each year as separate regulated investment companies under Subchapter M of the Internal Revenue Code, as amended, and will distribute substantially all of their investment company taxable income and net capital gain, if any, for their tax year, and as such will not be subject to federal income taxes. In addition, the Funds intend to distribute in each calendar year substantially all of their ordinary income, capital gain net income and certain other amounts, if any, such that the Funds should not be subject to federal excise tax. Therefore, no federal income or excise tax provisions are recorded.
Foreign taxes
The Funds may be subject to foreign taxes on income, gains on investments or currency repatriation, a portion of which may be recoverable. The Fund will accrue such taxes and recoveries, as applicable, based upon its current interpretation of tax rules and regulations that exist in the markets in which it invests.
Realized gains in certain countries may be subject to foreign taxes at the Fund level, based on statutory rates. The Fund accrues for such foreign taxes on realized and unrealized gains at the appropriate rate for each jurisdiction, as applicable. The amount, if any, is disclosed as a liability on the Statement of Assets and Liabilities.
Distributions to shareholders
Distributions from net investment income, if any, are declared and paid quarterly for Columbia Capital Allocation Conservative Portfolio, Columbia Capital Allocation Moderate Conservative Portfolio, Columbia Capital Allocation Moderate Portfolio and Columbia Capital Allocation Moderate Aggressive Portfolio. Distributions from net investment income, if any, are declared and paid annually for Columbia Capital Allocation Aggressive Portfolio. Net realized capital gains, if any, are distributed at least annually. Income distributions and capital gain distributions are determined in accordance with federal income tax regulations, which may differ from GAAP.
Guarantees and indemnifications
Under the Trusts’ organizational documents and, in some cases, by contract, its officers and trustees are indemnified against certain liabilities arising out of the performance of their duties to the Trusts or its funds. In addition, certain of the Funds’ contracts with their service providers contain general indemnification clauses. The Funds’ maximum exposure under these arrangements is unknown since the amount of any future claims that may be made against the Funds cannot be determined, and the Funds have no historical basis for predicting the likelihood of any such claims.
Note 3. Fees and other transactions with affiliates
Management services fees and underlying fund fees
The Funds have entered into a Management Agreement with Columbia Management Investment Advisers, LLC (the Investment Manager). Under the Management Agreement, the Investment Manager provides the Fund with investment research and advice, as well as administrative and accounting services. The management services fee is an annual fee that is a blend of (i) 0.02% on assets invested in Columbia proprietary funds (excluding any underlying funds that do not pay a management services fee (or investment advisory services fee, as applicable) to the Investment Manager), (ii) 0.12% on assets invested in non-exchange-traded third-party advised mutual funds and (iii) 0.57% on assets invested in all other securities, including other funds advised by the Investment Manager that do not pay a management services fee (or investment advisory services fee, as applicable), exchange-traded funds, derivatives and individual securities.
| 134 | Columbia Capital Allocation Portfolios | Annual Report 2020 |
Notes to Financial Statements (continued)
January 31, 2020
The effective management services fee rates, based on each Fund’s average daily net assets for the year ended January 31, 2020 were as follows:
| | Effective management services fee rate (%) |
| Columbia Capital Allocation Conservative Portfolio | 0.12 |
| Columbia Capital Allocation Moderate Conservative Portfolio | 0.10 |
| Columbia Capital Allocation Moderate Portfolio | 0.08 |
| Columbia Capital Allocation Moderate Aggressive Portfolio | 0.12 |
| Columbia Capital Allocation Aggressive Portfolio | 0.08 |
In addition to the fees and expenses which the Funds bear directly, the Funds indirectly bear a pro rata share of the fees and expenses of the Underlying Funds in which the Funds invest. Because the Underlying Funds have varied expense and fee levels and the Funds may own different proportions of Underlying Funds at different times, the amount of fees and expenses incurred indirectly by the Funds will vary. These expenses are not reflected in the expenses shown in Statement of Operations and are not included in the ratios to average net assets shown in the Financial Highlights.
Compensation of board members
Members of the Board of Trustees who are not officers or employees of the Investment Manager or Ameriprise Financial are compensated for their services to the Funds as disclosed in the Statement of Operations. Under a Deferred Compensation Plan (the Deferred Plan), these members of the Board of Trustees may elect to defer payment of up to 100% of their compensation. Deferred amounts are treated as though equivalent dollar amounts had been invested in shares of certain funds managed by the Investment Manager. Each Fund’s liability for these amounts is adjusted for market value changes and remains in the Funds until distributed in accordance with the Deferred Plan. All amounts payable under the Deferred Plan constitute a general unsecured obligation of the Funds.
Compensation of Chief Compliance Officer
The Board of Trustees has appointed a Chief Compliance Officer for the Funds in accordance with federal securities regulations. As disclosed in the Statement of Operations, a portion of the Chief Compliance Officer’s total compensation is allocated to the Funds, along with other allocations to affiliated registered investment companies managed by the Investment Manager and its affiliates, based on relative net assets.
Transactions with affiliates
For the year ended January 31, 2020, certain Funds engaged in purchase and/or sale transactions with affiliates and/or accounts that have a common investment manager (or affiliated investment managers), common directors/trustees, and/or common officers. Those purchase and sale transactions complied with provisions of Rule 17a-7 under the 1940 Act for the following Funds aggregated to:
| Fund | Purchases ($) | Sales ($) | Realized
gain/(loss)
from sale
transactions ($) |
| Columbia Capital Allocation Conservative Portfolio | — | 1,769 | (3,282) |
| Columbia Capital Allocation Moderate Conservative Portfolio | — | 2,995 | (5,543) |
| Columbia Capital Allocation Moderate Portfolio | — | 14,704 | (27,208) |
| Columbia Capital Allocation Moderate Aggressive Portfolio | — | 16,339 | (30,237) |
| Columbia Capital Allocation Aggressive Portfolio | — | 7,216 | (13,370) |
Transfer agency fees
Under a Transfer and Dividend Disbursing Agent Agreement, Columbia Management Investment Services Corp. (the Transfer Agent), an affiliate of the Investment Manager and a wholly-owned subsidiary of Ameriprise Financial, is responsible for providing transfer agency services to the Fund. The Transfer Agent has contracted with DST Asset Manager Solutions, Inc. (DST) to serve as sub-transfer agent. The Transfer Agent pays the fees of DST for services as sub-transfer agent and DST is not entitled to reimbursement for such fees from the Fund (with the exception of out-of-pocket fees).
Columbia Capital Allocation Portfolios | Annual Report 2020
| 135 |
Notes to Financial Statements (continued)
January 31, 2020
The Fund pays the Transfer Agent a monthly transfer agency fee based on the number or the average value of accounts, depending on the type of account. In addition, the Fund pays the Transfer Agent a fee for shareholder services based on the number of accounts or on a percentage of the average aggregate value of the Fund’s shares maintained in omnibus accounts up to the lesser of the amount charged by the financial intermediary or a cap established by the Board of Trustees from time to time.
The Transfer Agent also receives compensation from the Fund for various shareholder services and reimbursements for certain out-of-pocket fees. Total transfer agency fees for Institutional 2 Class and Institutional 3 Class shares are subject to an annual limitation of not more than 0.07% and 0.02%, respectively, of the average daily net assets attributable to each share class.
For the year ended January 31, 2020, the Funds’ effective transfer agency fee rates as a percentage of average daily net assets of each class were as follows:
| Fund | Class A
(%) | Advisor
Class (%) | Class C
(%) | Institutional
Class (%) | Institutional 2
Class (%) | Institutional 3
Class (%) | Class R
(%) | Class V
(%) |
| Columbia Capital Allocation Conservative Portfolio | 0.09 | 0.09 | 0.09 | 0.09 | 0.07 | 0.02 | 0.09 | N/A |
| Columbia Capital Allocation Moderate Conservative Portfolio | 0.08 | 0.08 | 0.08 | 0.08 | 0.06 | 0.02 | 0.08 | N/A |
| Columbia Capital Allocation Moderate Portfolio | 0.08 | 0.08 | 0.08 | 0.08 | 0.07 | 0.02 | 0.08 | N/A |
| Columbia Capital Allocation Moderate Aggressive Portfolio | 0.10 | 0.10 | 0.10 | 0.10 | 0.06 | 0.01 | 0.10 | 0.10 |
| Columbia Capital Allocation Aggressive Portfolio | 0.09 | 0.09 | 0.09 | 0.09 | 0.07 | 0.02 | 0.09 | N/A |
An annual minimum account balance fee of $20 may apply to certain accounts with a value below the applicable share class’s initial minimum investment requirements to reduce the impact of small accounts on transfer agency fees. These minimum account balance fees are remitted to the Funds and recorded as part of expense reductions in the Statement of Operations.
For the year ended January 31, 2020, these minimum account balance fees reduced total expenses as follows:
| Fund | Amount ($) |
| Columbia Capital Allocation Conservative Portfolio | 20 |
| Columbia Capital Allocation Moderate Conservative Portfolio | 80 |
| Columbia Capital Allocation Moderate Portfolio | 100 |
| Columbia Capital Allocation Moderate Aggressive Portfolio | 7,992 |
| Columbia Capital Allocation Aggressive Portfolio | 80 |
Distribution and service fees
The Funds have entered into an agreement with Columbia Management Investment Distributors, Inc. (the Distributor), an affiliate of the Investment Manager and a wholly-owned subsidiary of Ameriprise Financial, for distribution and shareholder services. The Board of Trustees has approved and the Fund has adopted, distribution and shareholder service plans (the Plans) applicable to certain share classes, which set the distribution and service fees for the Fund. These fees are calculated daily and are intended to compensate the Distributor and/or eligible selling and/or servicing agents for selling shares of the Funds and providing services to investors.
Under the Plans, each Fund pays a monthly fee to the Distributor at the annual rates of up to 0.25% of each Fund’s average daily net assets attributable to Class A shares, up to 1.00% of each Fund’s average daily net assets attributable to Class C shares and up to 0.50% of each Fund’s average daily net assets attributable to Class R shares (of which up to 0.25% may be used for shareholder services for Columbia Capital Allocation Conservative Portfolio, Columbia Capital Allocation Moderate Portfolio and Columbia Capital Allocation Aggressive Portfolio).
For Class C shares of the Funds, of 1.00% fee, up to 0.75% is reimbursed for distribution expenses.
| 136 | Columbia Capital Allocation Portfolios | Annual Report 2020 |
Notes to Financial Statements (continued)
January 31, 2020
The amount of distribution expenses incurred by the Distributor and not yet reimbursed (unreimbursed expense) for each Fund was approximately as follows:
| Fund | Class C ($) |
| Columbia Capital Allocation Conservative Portfolio | 295,000 |
| Columbia Capital Allocation Moderate Conservative Portfolio | 494,000 |
| Columbia Capital Allocation Moderate Portfolio | 1,632,000 |
| Columbia Capital Allocation Moderate Aggressive Portfolio | 1,154,000 |
| Columbia Capital Allocation Aggressive Portfolio | 185,000 |
These amounts are based on the most recent information available as of December 31, 2019, and may be recovered from future payments under the distribution plan or CDSCs. To the extent the unreimbursed expense has been fully recovered, the distribution fee is reduced.
Shareholder services fees
Columbia Capital Allocation Moderate Aggressive Portfolio has adopted a shareholder services plan that permits it to pay for certain services provided to Class V shareholders by their selling and/or servicing agents. The Fund may pay shareholder servicing fees up to an aggregate annual rate of 0.50% of the Fund’s average daily net assets attributable to Class V shares (comprised of up to 0.25% for shareholder liaison services and up to 0.25% for administrative support services). These fees are currently limited to an aggregate annual rate of not more than 0.25% of the Fund’s average daily net assets attributable to Class V shares.
Sales charges (unaudited)
Sales charges, including front-end and CDSCs, received by the Distributor for distributing each Fund’s shares for the year ended January 31, 2020, if any, are as follows:
| | Front End (%) | CDSC (%) | Amount ($) |
| Fund | Class A | Class C | Class V | Class A | Class C | Class V | Class A | Class C | Class V |
| Columbia Capital Allocation Conservative Portfolio | 4.75 | — | N/A | 0.50 - 1.00(a) | 1.00(b) | N/A | 102,559 | 2,343 | N/A |
| Columbia Capital Allocation Moderate Conservative Portfolio | 5.75 | — | N/A | 0.50 - 1.00(a) | 1.00(b) | N/A | 351,270 | 3,410 | N/A |
| Columbia Capital Allocation Moderate Portfolio | 5.75 | — | N/A | 0.50 - 1.00(a) | 1.00(b) | N/A | 1,102,340 | 13,500 | N/A |
| Columbia Capital Allocation Moderate Aggressive Portfolio | 5.75 | — | 5.75 | 0.50 - 1.00(a) | 1.00(b) | 0.50 - 1.00(a) | 1,366,730 | 10,788 | 4,640 |
| Columbia Capital Allocation Aggressive Portfolio | 5.75 | — | N/A | 0.50 - 1.00(a) | 1.00(b) | N/A | 867,983 | 8,007 | N/A |
| (a) | This charge is imposed on certain investments of between $1 million and $50 million redeemed within 18 months after purchase, as follows: 1.00% if redeemed within 12 months after purchase, and 0.50% if redeemed more than 12, but less than 18, months after purchase, with certain limited exceptions. |
| (b) | This charge applies to redemptions within 12 months after purchase, with certain limited exceptions. |
The Fund’s other share classes are not subject to sales charges.
Columbia Capital Allocation Portfolios | Annual Report 2020
| 137 |
Notes to Financial Statements (continued)
January 31, 2020
Expenses waived/reimbursed by the Investment Manager and its affiliates
The Investment Manager and certain of its affiliates have contractually agreed to waive fees and/or reimburse expenses (excluding certain fees and expenses described below) for the period(s) disclosed below, unless sooner terminated at the sole discretion of the Board of Trustees, so that each Fund’s net operating expenses, after giving effect to fees waived/expenses reimbursed and any balance credits and/or overdraft charges from the Funds’ custodian, do not exceed the following annual rate(s) as a percentage of the class’ average daily net assets:
| | Contractual expense caps July 1, 2019 through May 31, 2020 |
| Fund | Class A
(%) | Advisor
Class (%) | Class C
(%) | Institutional
Class (%) | Institutional 2
Class (%) | Institutional 3
Class (%) | Class R
(%) | Class V
(%) |
| Columbia Capital Allocation Moderate Conservative Portfolio | 0.52 | 0.27 | 1.27 | 0.27 | 0.24 | 0.20 | 0.77 | N/A |
| Columbia Capital Allocation Moderate Aggressive Portfolio | 0.50 | 0.25 | 1.25 | 0.25 | 0.20 | 0.15 | 0.75 | 0.50 |
| Columbia Capital Allocation Aggressive Portfolio | 0.51 | 0.26 | 1.26 | 0.26 | 0.24 | 0.19 | 0.76 | N/A |
| | Voluntary expense caps June 1, 2019 through June 30, 2019 |
| Fund | Class A
(%) | Advisor
Class (%) | Class C
(%) | Institutional
Class (%) | Institutional 2
Class (%) | Institutional 3
Class (%) | Class R
(%) | Class V
(%) |
| Columbia Capital Allocation Moderate Conservative Portfolio | 0.50 | 0.25 | 1.25 | 0.25 | 0.24 | 0.19 | 0.75 | N/A |
| Columbia Capital Allocation Moderate Aggressive Portfolio | 0.50 | 0.25 | 1.25 | 0.25 | 0.21 | 0.16 | 0.75 | 0.50 |
| Columbia Capital Allocation Aggressive Portfolio | 0.50 | 0.25 | 1.25 | 0.25 | 0.24 | 0.18 | 0.75 | N/A |
| | Contractual expense caps June 1, 2019 through May 31, 2020 |
| Fund | Class A
(%) | Advisor
Class (%) | Class C
(%) | Institutional
Class (%) | Institutional 2
Class (%) | Institutional 3
Class (%) | Class R
(%) |
| Columbia Capital Allocation Conservative Portfolio | 0.49 | 0.24 | 1.24 | 0.24 | 0.21 | 0.16 | 0.74 |
| Columbia Capital Allocation Moderate Portfolio | 0.47 | 0.22 | 1.22 | 0.22 | 0.21 | 0.16 | 0.72 |
| | Contractual expense caps prior to June 1, 2019 |
| Fund | Class A
(%) | Advisor
Class (%) | Class C
(%) | Institutional
Class (%) | Institutional 2
Class (%) | Institutional 3
Class (%) | Class R
(%) | Class V
(%) |
| Columbia Capital Allocation Conservative Portfolio | 0.49 | 0.24 | 1.24 | 0.24 | 0.22 | 0.17 | 0.74 | N/A |
| Columbia Capital Allocation Moderate Conservative Portfolio | 0.50 | 0.25 | 1.25 | 0.25 | 0.24 | 0.19 | 0.75 | N/A |
| Columbia Capital Allocation Moderate Portfolio | 0.47 | 0.22 | 1.22 | 0.22 | 0.21 | 0.17 | 0.72 | N/A |
| Columbia Capital Allocation Moderate Aggressive Portfolio | 0.50 | 0.25 | 1.25 | 0.25 | 0.21 | 0.16 | 0.75 | 0.50 |
| Columbia Capital Allocation Aggressive Portfolio | 0.50 | 0.25 | 1.25 | 0.25 | 0.24 | 0.18 | 0.75 | N/A |
Under the agreement governing these fee waivers and/or expense reimbursement arrangements, the following fees and expenses are excluded from the waiver/reimbursement commitment, and therefore will be paid by the Fund, if applicable: taxes (including foreign transaction taxes), expenses associated with investments in affiliated and non-affiliated pooled investment vehicles (including mutual funds and exchange-traded funds), transaction costs and brokerage commissions, costs related to any securities lending program, dividend expenses associated with securities sold short, inverse floater program fees and expenses, transaction charges and interest on borrowed money, interest, infrequent and/or unusual expenses and any other expenses the exclusion of which is specifically approved by the Board of Trustees. Each Fund’s management services fee is also excluded from the waiver/reimbursement commitment and is therefore paid by the Funds. This agreement may be modified or amended only with approval from the Investment Manager, certain of its affiliates and the Fund. Any fees waived and/or expenses reimbursed under the expense reimbursement arrangements described above are not recoverable by the Investment Manager or its affiliates in future periods.
Note 4. Federal tax information
The timing and character of income and capital gain distributions are determined in accordance with income tax regulations, which may differ from GAAP because of temporary or permanent book to tax differences.
| 138 | Columbia Capital Allocation Portfolios | Annual Report 2020 |
Notes to Financial Statements (continued)
January 31, 2020
At January 31, 2020, these differences were primarily due to differing treatment for deferral/reversal of wash sale losses, trustees’ deferred compensation, derivative investments, re-characterization of distributions for investments, foreign currency transactions, and passive foreign investment company (PFIC) holdings. To the extent these differences were permanent, reclassifications were made among the components of the Fund’s net assets. Temporary differences do not require reclassifications.
The following reclassifications were made:
| Fund | Undistributed net
investment
income ($) | Accumulated
net realized
gain (loss) ($) | Paid in capital
decrease ($) |
| Columbia Capital Allocation Conservative Portfolio | 180,072 | (180,072) | — |
| Columbia Capital Allocation Moderate Conservative Portfolio | 392,417 | (392,417) | — |
| Columbia Capital Allocation Moderate Portfolio | 2,071,478 | (2,071,478) | — |
| Columbia Capital Allocation Moderate Aggressive Portfolio | 866,463 | (866,462) | (1) |
| Columbia Capital Allocation Aggressive Portfolio | 359,523 | (359,523) | — |
Net investment income (loss) and net realized gains (losses), as disclosed in the Statement of Operations, and net assets were not affected by these reclassifications.
The tax character of distributions paid during the years indicated was as follows:
| | Year Ended January 31, 2020 | Year Ended January 31, 2019 |
| Fund | Ordinary
income ($) | Long-term
capital gains ($) | Total ($) | Ordinary
income ($) | Long-term
capital gains ($) | Total ($) |
| Columbia Capital Allocation Conservative Portfolio | 4,766,476 | 1,955,416 | 6,721,892 | 5,114,129 | 5,216,910 | 10,331,039 |
| Columbia Capital Allocation Moderate Conservative Portfolio | 11,926,091 | 9,518,141 | 21,444,232 | 13,307,649 | 22,414,599 | 35,722,248 |
| Columbia Capital Allocation Moderate Portfolio | 35,404,017 | 51,006,973 | 86,410,990 | 39,275,629 | 64,672,473 | 103,948,102 |
| Columbia Capital Allocation Moderate Aggressive Portfolio | 45,701,665 | 99,902,560 | 145,604,225 | 52,808,296 | 127,705,985 | 180,514,281 |
| Columbia Capital Allocation Aggressive Portfolio | 11,757,724 | 41,950,505 | 53,708,229 | 17,121,047 | 48,593,896 | 65,714,943 |
Short-term capital gain distributions, if any, are considered ordinary income distributions for tax purposes.
At January 31, 2020, the components of distributable earnings on a tax basis were as follows:
| Fund | Undistributed
ordinary
income ($) | Undistributed
long-term
capital gains ($) | Capital loss
carryforwards ($) | Net unrealized
appreciation ($) |
| Columbia Capital Allocation Conservative Portfolio | 254,325 | 2,428,724 | — | 6,303,809 |
| Columbia Capital Allocation Moderate Conservative Portfolio | 1,233,530 | 11,185,137 | — | 17,719,478 |
| Columbia Capital Allocation Moderate Portfolio | 4,168,681 | 41,252,156 | — | 78,631,619 |
| Columbia Capital Allocation Moderate Aggressive Portfolio | 4,866,818 | 69,735,031 | — | 134,855,863 |
| Columbia Capital Allocation Aggressive Portfolio | 1,800,837 | 30,282,549 | — | 55,746,934 |
At January 31, 2020, the cost of all investments for federal income tax purposes along with the aggregate gross unrealized appreciation and depreciation based on that cost was:
| Fund | Tax cost ($) | Gross
unrealized
appreciation ($) | Gross
unrealized
(depreciation) ($) | Net unrealized
appreciation ($) |
| Columbia Capital Allocation Conservative Portfolio | 217,713,446 | 8,150,359 | (1,846,550) | 6,303,809 |
| Columbia Capital Allocation Moderate Conservative Portfolio | 496,270,392 | 22,869,428 | (5,149,950) | 17,719,478 |
| Columbia Capital Allocation Moderate Portfolio | 1,408,390,132 | 98,147,495 | (19,515,876) | 78,631,619 |
| Columbia Capital Allocation Moderate Aggressive Portfolio | 1,871,469,087 | 162,921,246 | (28,065,383) | 134,855,863 |
| Columbia Capital Allocation Aggressive Portfolio | 669,080,081 | 70,627,165 | (14,880,231) | 55,746,934 |
Columbia Capital Allocation Portfolios | Annual Report 2020
| 139 |
Notes to Financial Statements (continued)
January 31, 2020
Tax cost of investments and unrealized appreciation/(depreciation) may also include timing differences that do not constitute adjustments to tax basis.
Management of the Funds has concluded that there are no significant uncertain tax positions in the Funds that would require recognition in the financial statements. However, management’s conclusion may be subject to review and adjustment at a later date based on factors including, but not limited to, new tax laws, regulations, and administrative interpretations (including relevant court decisions). Generally, the Funds’ federal tax returns for the prior three fiscal years remain subject to examination by the Internal Revenue Service.
Note 5. Portfolio information
For the year ended January 31, 2020, the cost of purchases and proceeds from sales of securities, excluding short-term investments and derivatives, if any, for each Fund aggregated to:
| | Purchases
($) | Proceeds
from sales
($) |
| Columbia Capital Allocation Conservative Portfolio | 24,788,896 | 37,698,936 |
| Columbia Capital Allocation Moderate Conservative Portfolio | 39,779,519 | 78,200,210 |
| Columbia Capital Allocation Moderate Portfolio | 130,661,084 | 203,278,528 |
| Columbia Capital Allocation Moderate Aggressive Portfolio | 166,910,748 | 284,491,989 |
| Columbia Capital Allocation Aggressive Portfolio | 78,925,137 | 97,474,929 |
The amount of purchase and sale activity impacts the portfolio turnover rate reported in the Financial Highlights.
Note 6. Affiliated money market fund
Each Fund may invest in Columbia Short-Term Cash Fund, an affiliated money market fund established for the exclusive use by each Fund and other affiliated funds (the Affiliated MMF). The income earned by the Funds from such investments is included as Dividends - affiliated issuers in the Statement of Operations. As an investing fund, each Fund indirectly bears its proportionate share of the expenses of the Affiliated MMF. The Affiliated MMF prices its shares with a floating net asset value. In addition, the Board of Trustees of the Affiliated MMF may impose a fee on redemptions (sometimes referred to as a liquidity fee) or temporarily suspend redemptions (sometimes referred to as imposing a redemption gate) in the event its liquidity falls below regulatory limits.
Note 7. Interfund lending
Pursuant to an exemptive order granted by the Securities and Exchange Commission, each Fund participates in a program (the Interfund Program) allowing each participating Columbia Fund (each, a Participating Fund) to lend money directly to and, except for closed-end funds and money market funds, borrow money directly from other Participating Funds for temporary purposes. The amounts eligible for borrowing and lending under the Interfund Program are subject to certain restrictions.
Interfund loans are subject to the risk that the borrowing fund could be unable to repay the loan when due, and a delay in repayment to the lending fund could result in lost opportunities and/or additional lending costs. The exemptive order is subject to conditions intended to mitigate conflicts of interest arising from the Investment Manager’s relationship with each Participating Fund.
The Funds did not borrow or lend money under the Interfund Program during the year ended January 31, 2020.
Note 8. Line of credit
Each Fund has access to a revolving credit facility with a syndicate of banks led by Citibank, N.A., HSBC Bank USA, N.A. and JPMorgan Chase Bank, N.A. whereby the Funds may borrow for the temporary funding of shareholder redemptions or for other temporary or emergency purposes. The credit facility, which is a collective agreement between the Fund and certain other funds managed by the Investment Manager or an affiliated investment manager, severally and not jointly, permits collective borrowings up to $1 billion. Interest is charged to each participating fund based on its borrowings at a rate equal to the
| 140 | Columbia Capital Allocation Portfolios | Annual Report 2020 |
Notes to Financial Statements (continued)
January 31, 2020
higher of (i) the federal funds effective rate, (ii) the one-month LIBOR rate and (iii) the overnight bank funding rate, plus in each case, 1.00%. Each borrowing under the credit facility matures no later than 60 days after the date of borrowing. The Fund also pays a commitment fee equal to its pro rata share of the unused amount of the credit facility at a rate of 0.15% per annum. The commitment fee is included in other expenses in the Statement of Operations. This agreement expires annually in December unless extended or renewed.
No Fund had borrowings during the year ended January 31, 2020.
Note 9. Significant risks
Derivatives risk
Columbia Capital Allocation Moderate Conservative Portfolio, Columbia Capital Allocation Moderate Portfolio, Columbia Capital Allocation Moderate Aggressive Portfolio and Columbia Capital Allocation Aggressive Portfolio may be more susceptible to derivatives risk. Losses involving derivative instruments may be substantial, because a relatively small movement in the underlying reference (which is generally the price, rate or other economic indicator associated with a security(ies), commodity, currency or index or other instrument or asset) may result in a substantial loss for the Fund. In addition to the potential for increased losses, the use of derivative instruments may lead to increased volatility within the Fund. Derivatives will typically increase the Fund’s exposure to principal risks to which it is otherwise exposed, and may expose the Fund to additional risks, including correlation risk, counterparty risk, hedging risk, leverage risk, liquidity risk and pricing risk.
Market risk
The market values of securities or other investments that the Funds hold may fall, sometimes rapidly or unpredictably, or fail to rise for various reasons including changes or potential or perceived changes in U.S. or foreign economies, financial markets, interest rates, the liquidity of investments and other factors including terrorism, war, natural disasters and disease/virus epidemics. From time to time, certain market segments (such as equity or fixed income), investment styles (such as growth or value), or other investment categories, may fall out of favor which may impair the value of an investment in the Funds. An investment in the Funds could lose money over short or even long periods.
Shareholder concentration risk
At January 31, 2020, certain shareholder accounts owned more than 10% of the outstanding shares of one or more of the Funds. For unaffiliated shareholder accounts, the Funds have no knowledge about whether any portion of those shares were owned beneficially. Subscription and redemption activity of these accounts may have a significant effect on the operations of the Funds. In the case of a large redemption, the Fund may be forced to sell investments at inopportune times, including its liquid positions, which may result in Fund losses and the Fund holding a higher percentage of less liquid positions. Large redemptions could result in decreased economies of scale and increased operating expenses for non-redeeming Fund shareholders.
The number of accounts and aggregate percentages of shares outstanding held therein were as follows:
| Fund | Number of
unaffiliated
accounts | Percentage of
shares
outstanding
held —
unaffiliated (%) | Percentage of
shares
outstanding
held —
affiliated (%) |
| Columbia Capital Allocation Conservative Portfolio | — | — | 77.3 |
| Columbia Capital Allocation Moderate Conservative Portfolio | — | — | 79.0 |
| Columbia Capital Allocation Moderate Portfolio | — | — | 88.1 |
| Columbia Capital Allocation Moderate Aggressive Portfolio | 1 | 12.0 | 58.6 |
| Columbia Capital Allocation Aggressive Portfolio | — | — | 87.0 |
Note 10. Subsequent events
Management has evaluated the events and transactions that have occurred through the date the financial statements were issued and noted no items requiring adjustment of the financial statements or additional disclosure.
Columbia Capital Allocation Portfolios | Annual Report 2020
| 141 |
Notes to Financial Statements (continued)
January 31, 2020
Note 11. Information regarding pending and settled legal proceedings
Ameriprise Financial and certain of its affiliates have historically been involved in a number of legal, arbitration and regulatory proceedings, including routine litigation, class actions, and governmental actions, concerning matters arising in connection with the conduct of their business activities. Ameriprise Financial believes that the Funds are not currently the subject of, and that neither Ameriprise Financial nor any of its affiliates are the subject of, any pending legal, arbitration or regulatory proceedings that are likely to have a material adverse effect on the Funds or the ability of Ameriprise Financial or its affiliates to perform under their contracts with the Funds. Ameriprise Financial is required to make quarterly (10-Q), annual (10-K) and, as necessary, 8-K filings with the Securities and Exchange Commission (SEC) on legal and regulatory matters that relate to Ameriprise Financial and its affiliates. Copies of these filings may be obtained by accessing the SEC website at www.sec.gov.
There can be no assurance that these matters, or the adverse publicity associated with them, will not result in increased Fund redemptions, reduced sale of Fund shares or other adverse consequences to the Funds. Further, although we believe proceedings are not likely to have a material adverse effect on the Funds or the ability of Ameriprise Financial or its affiliates to perform under their contracts with the Funds, these proceedings are subject to uncertainties and, as such, we are unable to estimate the possible loss or range of loss that may result. An adverse outcome in one or more of these proceedings could result in adverse judgments, settlements, fines, penalties or other relief that could have a material adverse effect on the consolidated financial condition or results of operations of Ameriprise Financial.
| 142 | Columbia Capital Allocation Portfolios | Annual Report 2020 |
Report of Independent Registered Public Accounting Firm
To the Trustees of Columbia Funds Series Trust II and Shareholders of Columbia Capital Allocation Conservative Portfolio, Columbia Capital Allocation Moderate Portfolio and Columbia Capital Allocation Aggressive Portfolio
Opinions on the Financial Statements
We have audited the accompanying statements of assets and liabilities, including the portfolios of investments, of Columbia Capital Allocation Conservative Portfolio, Columbia Capital Allocation Moderate Portfolio and Columbia Capital Allocation Aggressive Portfolio (three of the funds constituting Columbia Funds Series Trust II, hereafter collectively referred to as the "Funds") as of January 31, 2020, the related statements of operations for the year ended January 31, 2020, the statements of changes in net assets for each of the two years in the period ended January 31, 2020, including the related notes, and the financial highlights for each of the five years in the period ended January 31, 2020 (collectively referred to as the “financial statements”). In our opinion, the financial statements present fairly, in all material respects, the financial position of each of the Funds as of January 31, 2020, the results of each of their operations for the year then ended, the changes in each of their net assets for each of the two years in the period ended January 31, 2020 and each of the financial highlights for each of the five years in the period ended January 31, 2020 in conformity with accounting principles generally accepted in the United States of America.
Basis for Opinions
These financial statements are the responsibility of the Funds’ management. Our responsibility is to express an opinion on the Funds’ financial statements based on our audits. We are a public accounting firm registered with the Public Company Accounting Oversight Board (United States) (PCAOB) and are required to be independent with respect to the Funds in accordance with the U.S. federal securities laws and the applicable rules and regulations of the Securities and Exchange Commission and the PCAOB.
We conducted our audits of these financial statements in accordance with the standards of the PCAOB. Those standards require that we plan and perform the audit to obtain reasonable assurance about whether the financial statements are free of material misstatement, whether due to error or fraud.
Our audits included performing procedures to assess the risks of material misstatement of the financial statements, whether due to error or fraud, and performing procedures that respond to those risks. Such procedures included examining, on a test basis, evidence regarding the amounts and disclosures in the financial statements. Our audits also included evaluating the accounting principles used and significant estimates made by management, as well as evaluating the overall presentation of the financial statements. Our procedures included confirmation of securities owned as of January 31, 2020 by correspondence with the custodian, transfer agent and brokers; when replies were not received from brokers, we performed other auditing procedures. We believe that our audits provide a reasonable basis for our opinions.
/s/PricewaterhouseCoopers LLP
Minneapolis, Minnesota
March 24, 2020
We have served as the auditor of one or more investment companies within the Columbia Funds Complex since 1977.
Columbia Capital Allocation Portfolios | Annual Report 2020
| 143 |
Report of Independent Registered Public Accounting Firm (continued)
To the Trustees of Columbia Funds Series Trust and Shareholders of Columbia Capital Allocation Moderate Conservative Portfolio and Columbia Capital Allocation Moderate Aggressive Portfolio
Opinions on the Financial Statements
We have audited the accompanying statements of assets and liabilities, including the portfolios of investments, of Columbia Capital Allocation Moderate Conservative Portfolio and Columbia Capital Allocation Moderate Aggressive Portfolio (two of the funds constituting Columbia Funds Series Trust, hereafter collectively referred to as the "Funds") as of January 31, 2020, the related statements of operations for the year ended January 31, 2020, the statements of changes in net assets for each of the two years in the period ended January 31, 2020, including the related notes, and the financial highlights for each of the five years in the period ended January 31, 2020 (collectively referred to as the “financial statements”). In our opinion, the financial statements present fairly, in all material respects, the financial position of each of the Funds as of January 31, 2020, the results of each of their operations for the year then ended, the changes in each of their net assets for each of the two years in the period ended January 31, 2020 and each of the financial highlights for each of the five years in the period ended January 31, 2020 in conformity with accounting principles generally accepted in the United States of America.
Basis for Opinions
These financial statements are the responsibility of the Funds’ management. Our responsibility is to express an opinion on the Funds’ financial statements based on our audits. We are a public accounting firm registered with the Public Company Accounting Oversight Board (United States) (PCAOB) and are required to be independent with respect to the Funds in accordance with the U.S. federal securities laws and the applicable rules and regulations of the Securities and Exchange Commission and the PCAOB.
We conducted our audits of these financial statements in accordance with the standards of the PCAOB. Those standards require that we plan and perform the audit to obtain reasonable assurance about whether the financial statements are free of material misstatement, whether due to error or fraud.
Our audits included performing procedures to assess the risks of material misstatement of the financial statements, whether due to error or fraud, and performing procedures that respond to those risks. Such procedures included examining, on a test basis, evidence regarding the amounts and disclosures in the financial statements. Our audits also included evaluating the accounting principles used and significant estimates made by management, as well as evaluating the overall presentation of the financial statements. Our procedures included confirmation of securities owned as of January 31, 2020 by correspondence with the custodian, transfer agent and brokers; when replies were not received from brokers, we performed other auditing procedures. We believe that our audits provide a reasonable basis for our opinions.
/s/PricewaterhouseCoopers LLP
Minneapolis, Minnesota
March 24, 2020
We have served as the auditor of one or more investment companies within the Columbia Funds Complex since 1977.
| 144 | Columbia Capital Allocation Portfolios | Annual Report 2020 |
Federal Income Tax Information
(Unaudited)
The Funds hereby designate the following tax attributes for the fiscal year ended January 31, 2020. Shareholders will be notified in early 2021 of the amounts for use in preparing 2020 income tax returns.
| | Qualified
dividend
income | Dividends
received
deduction | Capital
gain
dividend | Foreign
taxes paid
to foreign
countries | Foreign
taxes paid
per share
to foreign
countries | Foreign
source
income | Foreign
source
income per
share |
| Columbia Capital Allocation Conservative Portfolio | 18.83% | 10.30% | $4,447,067 | $42,538 | $0.0020 | $551,616 | $0.03 |
| Columbia Capital Allocation Moderate Conservative Portfolio | 25.47% | 14.30% | $17,943,048 | $141,420 | $0.0030 | $1,816,474 | $0.04 |
| Columbia Capital Allocation Moderate Portfolio | 28.49% | 17.09% | $75,873,602 | $472,359 | $0.0036 | $5,396,086 | $0.04 |
| Columbia Capital Allocation Moderate Aggressive Portfolio | 35.24% | 21.64% | $131,200,658 | $758,046 | $0.0046 | $7,816,725 | $0.05 |
| Columbia Capital Allocation Aggressive Portfolio | 63.44% | 39.52% | $51,985,332 | $354,936 | $0.0061 | $3,363,817 | $0.06 |
Qualified dividend income. For taxable, non-corporate shareholders, the percentage of ordinary income distributed during the fiscal year that represents qualified dividend income subject to reduced tax rates.
Dividends received deduction. The percentage of ordinary income distributed during the fiscal year that qualifies for the corporate dividends received deduction.
Capital gain dividend. The Fund designates as a capital gain dividend the amount reflected above, or if subsequently determined to be different, the net capital gain of such fiscal period.
Foreign taxes. The Fund makes the election to pass through to shareholders the foreign taxes paid. Eligible shareholders may claim a foreign tax credit. These taxes, and the corresponding foreign source income, are provided.
Columbia Capital Allocation Portfolios | Annual Report 2020
| 145 |
Shareholders elect the Board that oversees the Funds’ operations. The Board appoints officers who are responsible for day-to-day business decisions based on policies set by the Board. The following table provides basic biographical information about the Funds’ Trustees as of the printing of this report, including their principal occupations during the past five years, although specific titles for individuals may have varied over the period. Under current Board policy, Trustees not affiliated with the Investment Manager generally may serve through the end of the calendar year in which they reach the mandatory retirement age established by the Board.
Independent trustees
Name,
address,
year of birth | Position held
with the Trust and
length of service | Principal occupation(s)
during past five years
and other relevant
professional experience | Number of
Funds in the
Columbia Funds
Complex
overseen | Other directorships
held by Trustee
during the past
five years |
George S. Batejan
c/o Columbia Management
Investment Advisers, LLC
225 Franklin Street
Mail Drop BX32 05228
Boston, MA 02110
1953 | Trustee since 1/17 | Executive Vice President, Global Head of Technology and Operations, Janus Capital Group, Inc., 2010-2016 | 121 | Former Chairman of the Board, NICSA (National Investment Company Services Association) (Executive Committee, Nominating Committee and Governance Committee), 2014-2016; former Director, Intech Investment Management, 2011-2016; former Board Member, Metro Denver Chamber of Commerce, 2015-2016; former Advisory Board Member, University of Colorado Business School, 2015-2018 |
Kathleen Blatz
c/o Columbia Management
Investment Advisers, LLC
225 Franklin Street
Mail Drop BX32 05228
Boston, MA 02110
1954 | Trustee since 1/06 for RiverSource Funds and since 6/11 for Nations Funds | Attorney; specializing in arbitration and mediation; Chief Justice, Minnesota Supreme Court, 1998-2006; Associate Justice, Minnesota Supreme Court, 1996-1998; Fourth Judicial District Court Judge, Hennepin County, 1994-1996; Attorney in private practice and public service, 1984-1993; State Representative, Minnesota House of Representatives, 1979-1993, which included service on the Tax and Financial Institutions and Insurance Committees; Member and Interim Chair, Minnesota Sports Facilities Authority, January 2017-July 2017; Interim President and Chief Executive Officer, Blue Cross and Blue Shield of Minnesota (health care insurance), February-July 2018 | 121 | Trustee, BlueCross BlueShield of Minnesota since 2009 (Chair of the Business Development Committee, 2014-2017; Chair of the Governance Committee since 2017); Chair of the Robina Foundation since August 2013; former Member and Chair of the Board, Minnesota Sports Facilities Authority, January 2017-July 2017 |
Pamela G. Carlton
c/o Columbia Management
Investment Advisers, LLC
225 Franklin Street
Mail Drop BX32 05228
Boston, MA 02110
1954 | Trustee since 7/07 for RiverSource Funds and since 6/11 for Nations Funds | President, Springboard — Partners in Cross Cultural Leadership (consulting company) since 2003; Managing Director of US Equity Research, JP Morgan Chase, 1999-2003; Director of US Equity Research, Chase Asset Management, 1996-1999; Co-Director Latin America Research, 1993-1996, COO Global Research, 1992-1996, Co-Director of US Research, 1991-1992, Investment Banker, Morgan Stanley, 1982-1991 | 121 | Trustee, New York Presbyterian Hospital Board (Executive Committee and Chair of Human Resources Committee) since 1996; Director, DR Bank (Audit Committee) since 2017; Director, Evercore Inc. (Audit Committee, Nominating and Governance Committee) since 2019 |
| 146 | Columbia Capital Allocation Portfolios | Annual Report 2020 |
TRUSTEES AND OFFICERS (continued)
Independent trustees (continued)
Name,
address,
year of birth | Position held
with the Trust and
length of service | Principal occupation(s)
during past five years
and other relevant
professional experience | Number of
Funds in the
Columbia Funds
Complex
overseen | Other directorships
held by Trustee
during the past
five years |
Patricia M. Flynn
c/o Columbia Management
Investment Advisers, LLC
225 Franklin Street
Mail Drop BX32 05228
Boston, MA 02110
1950 | Trustee since 11/04 for RiverSource Funds and since 6/11 for Nations Funds | Trustee Professor of Economics and Management, Bentley University since 1976 (also teaches and conducts research on corporate governance); Dean, McCallum Graduate School of Business, Bentley University, 1992-2002 | 121 | Trustee, MA Taxpayers Foundation since 1997; Board of Governors, Innovation Institute, MA Technology Collaborative since 2010; Board of Directors, The MA Business Roundtable 2003-2019 |
Brian J. Gallagher
c/o Columbia Management
Investment Advisers, LLC
225 Franklin Street
Mail Drop BX32 05228
Boston, MA 02110
1954 | Trustee since 12/17 | Retired; Partner with Deloitte & Touche LLP and its predecessors, 1977-2016 | 121 | Trustee, Catholic Schools Foundation since 2004 |
Catherine James Paglia
c/o Columbia Management
Investment Advisers, LLC
225 Franklin Street
Mail Drop BX32 05228
Boston, MA 02110
1952 | Chair of the Board since 1/20; Trustee since 11/04 for RiverSource Funds and since 6/11 for Nations Funds | Director, Enterprise Asset Management, Inc. (private real estate and asset management company) since September 1998; Managing Director and Partner, Interlaken Capital, Inc., 1989-1997; Managing Director, Morgan Stanley, 1982-1989; Vice President, Investment Banking, 1980-1982, Associate, Investment Banking, 1976-1980, Dean Witter Reynolds, Inc. | 121 | Director, Valmont Industries, Inc. (irrigation systems manufacturer) since 2012; Trustee, Carleton College (on the Investment Committee); Trustee, Carnegie Endowment for International Peace (on the Investment Committee) |
Anthony M. Santomero
c/o Columbia Management
Investment Advisers, LLC
225 Franklin Street
Mail Drop BX32 05228
Boston, MA 02110
1946 | Trustee since 6/11 for RiverSource Funds and since 1/08 for Nations Funds | Richard K. Mellon Professor Emeritus of Finance, The Wharton School, University of Pennsylvania, since 2002; Senior Advisor, McKinsey & Company (consulting), 2006-2008; President, Federal Reserve Bank of Philadelphia, 2000- 2006; Professor of Finance, The Wharton School, University of Pennsylvania, 1972-2002 | 121 | Trustee, Penn Mutual Life Insurance Company since March 2008; Director, Renaissance Reinsurance Ltd. since May 2008; former Director, Citigroup Inc. and Citibank, N.A., 2009-2019; former Trustee, BofA Funds Series Trust (11 funds), 2008-2011 |
Minor M. Shaw
c/o Columbia Management
Investment Advisers, LLC
225 Franklin Street
Mail Drop BX32 05228
Boston, MA 02110
1947 | Trustee since 6/11 for RiverSource Funds and since 2003 for Nations Funds | President, Micco LLC (private investments) since 2011; President, Micco Corp. (family investment business), 1998-2011 | 121 | Director, BlueCross BlueShield of South Carolina since April 2008; Trustee, Hollingsworth Funds since 2016 (previously Board Chair from 2016-2019); Advisory Board member, Duke Energy Corp. since October 2016; Chair of the Duke Endowment; Chair of Greenville – Spartanburg Airport Commission; former Trustee, BofA Funds Series Trust (11 funds), 2003-2011; former Director, Piedmont Natural Gas, 2004-2016; former Director, National Association of Corporate Directors, Carolinas Chapter, 2013-2018 |
Columbia Capital Allocation Portfolios | Annual Report 2020
| 147 |
TRUSTEES AND OFFICERS (continued)
Independent trustees (continued)
Name,
address,
year of birth | Position held
with the Trust and
length of service | Principal occupation(s)
during past five years
and other relevant
professional experience | Number of
Funds in the
Columbia Funds
Complex
overseen | Other directorships
held by Trustee
during the past
five years |
Sandra Yeager
c/o Columbia Management
Investment Advisers, LLC
225 Franklin Street
Mail Drop BX32 05228
Boston, MA 02110
1964 | Trustee since 12/17 | Retired; President and founder, Hanoverian Capital, LLC (SEC registered investment advisor firm), 2008-2016; Managing Director, DuPont Capital, 2006-2008; Managing Director, Morgan Stanley Investment Management, 2004-2006; Senior Vice President, Alliance Bernstein, 1990-2004 | 119 | Director, NAPE Education Foundation since October 2016 |
Interested trustee affiliated with Investment Manager*
Name,
address,
year of birth | Position held with the Trust and length of service | Principal occupation(s) during the
past five years and other relevant
professional experience | Number of
Funds in the
Columbia Funds
Complex overseen | Other directorships
held by Trustee
during the past
five years |
William F. Truscott
c/o Columbia Management
Investment Advisers, LLC
225 Franklin St.
Boston, MA 02110
1960 | Trustee since 11/01 for RiverSource Funds and since 6/11 for Nations Funds; Senior Vice President since 2002 for RiverSource Funds and since 5/10 for Nations Funds | Chairman of the Board and President, Columbia Management Investment Advisers, LLC since May 2010 and February 2012, respectively; Chief Executive Officer, Global Asset Management, Ameriprise Financial, Inc. since September 2012 (previously Chief Executive Officer, U.S. Asset Management & President, Annuities, May 2010 - September 2012); Director and Chief Executive Officer, Columbia Management Investment Distributors, Inc. since May 2010 and February 2012, respectively; Chairman of the Board and Chief Executive Officer, RiverSource Distributors, Inc. since 2006; Director, Threadneedle Asset Management Holdings, SARL since 2014; President and Chief Executive Officer, Ameriprise Certificate Company, 2006 - August 2012. | 192 | Chairman of the Board, Columbia Management Investment Advisers, LLC since May 2010; Director, Columbia Management Investment Distributors, Inc. since May 2010; former Director, Ameriprise Certificate Company, August 2006-January 2013 |
| * | Interested person (as defined under the 1940 Act) by reason of being an officer, director, security holder and/or employee of the Investment Manager or Ameriprise Financial. |
Nations Funds refer to the Funds within the Columbia Funds Complex that historically bore the Nations brand and includes series of Columbia Funds Series Trust. RiverSource Funds refer to the Funds within the Columbia Funds Complex that historically bore the RiverSource brand and includes series of Columbia Funds Series Trust II.
The Statement of Additional Information has additional information about the Funds’ Board members and is available, without charge, upon request by calling 800.345.6611, visiting columbiathreadneedleus.com/investor/ or contacting your financial intermediary.
| 148 | Columbia Capital Allocation Portfolios | Annual Report 2020 |
TRUSTEES AND OFFICERS (continued)
The Board has appointed officers who are responsible for day-to-day business decisions based on policies it has established. The officers serve at the pleasure of the Board. The following table provides basic information about the Officers of the Funds as of the printing of this report, including principal occupations during the past five years, although their specific titles may have varied over the period. In addition to Mr. Truscott, who is Senior Vice President, the Funds’ other officers are:
Fund officers
Name,
address and
year of birth | Position and year
first appointed to
position for any Fund
in the Columbia
Funds Complex or a
predecessor thereof | Principal occupation(s) during past five years |
Christopher O. Petersen
5228 Ameriprise
Financial Center
Minneapolis, MN 55474
Born 1970 | President and Principal Executive Officer (2015) | Vice President and Lead Chief Counsel, Ameriprise Financial, Inc. since January 2015 (previously Vice President and Chief Counsel, January 2010 - December 2014); officer of Columbia Funds and affiliated funds since 2007. |
Michael G. Clarke
225 Franklin Street
Boston, MA 02110
Born 1969 | Chief Financial Officer, Principal Financial Officer (2009), and Senior Vice President (2019) | Vice President, Head of North American Operations, and Co-Head of Global Operations, – Accounting and Tax, Columbia Management Investment Advisers, LLC, since June 2019 (previously Vice President – Accounting and Tax, May 2010 – May 2019); senior officer of Columbia Funds and affiliated funds since 2002 (previously, Treasurer and Chief Accounting Officer, January 2009 – January 2019 and December 2015 – January 2019, respectively). |
Joseph Beranek
5890 Ameriprise
Financial Center
Minneapolis, MN 55474
Born 1965 | Treasurer, Chief Accounting Officer (Principal Accounting Officer) (2019), and Principal Financial Officer (2020) | Vice President — Mutual Fund Accounting and Financial Reporting, Columbia Management Investment Advisers, LLC, since December 2018 and March 2017, respectively (previously Vice President — Pricing and Corporate Actions, May 2010 - March 2017). |
Paul B. Goucher
485 Lexington Avenue
New York, NY 10017
Born 1968 | Senior Vice President (2011) and Assistant Secretary (2008) | Senior Vice President and Assistant General Counsel, Ameriprise Financial, Inc. since January 2017 (previously Vice President and Lead Chief Counsel, November 2008 - January 2017 and January 2013 - January 2017, respectively); Vice President, Chief Legal Officer and Assistant Secretary, Columbia Management Investment Advisers, LLC since March 2015 (previously Vice President and Assistant Secretary, May 2010 – March 2015). |
Thomas P. McGuire
225 Franklin Street
Boston, MA 02110
Born 1972 | Senior Vice President and Chief Compliance Officer (2012) | Vice President — Asset Management Compliance, Ameriprise Financial, Inc., since May 2010; Chief Compliance Officer, Ameriprise Certificate Company since September 2010; Chief Compliance Officer, Columbia Acorn/Wanger Funds since December 2015. |
Colin Moore
225 Franklin Street
Boston, MA 02110
Born 1958 | Senior Vice President (2010) | Executive Vice President and Global Chief Investment Officer, Ameriprise Financial, Inc., since July 2013; Executive Vice President and Global Chief Investment Officer, Columbia Management Investment Advisers, LLC since July 2013. |
Ryan C. Larrenaga
225 Franklin Street
Boston, MA 02110
Born 1970 | Senior Vice President (2017), Chief Legal Officer (2017), and Secretary (2015) | Vice President and Chief Counsel, Ameriprise Financial, Inc. since August 2018 (previously Vice President and Group Counsel, August 2011 - August 2018); officer of Columbia Funds and affiliated funds since 2005. |
Daniel J. Beckman
225 Franklin Street
Boston, MA 02110
Born 1962 | Senior Vice President (2020) | Vice President – Head of North America Product, Columbia Management Investment Advisers, LLC (since April 2015); previously, Senior Vice President of Investment Product Management, Fidelity Financial Advisor Solutions, a division of Fidelity Investments (January 2012 – March 2015). |
Michael E. DeFao
225 Franklin Street
Boston, MA 02110
Born 1968 | Vice President (2011) and Assistant Secretary (2010) | Vice President and Chief Counsel, Ameriprise Financial, Inc. since May 2010. |
Columbia Capital Allocation Portfolios | Annual Report 2020
| 149 |
TRUSTEES AND OFFICERS (continued)
Fund officers (continued)
Name,
address and
year of birth | Position and year
first appointed to
position for any Fund
in the Columbia
Funds Complex or a
predecessor thereof | Principal occupation(s) during past five years |
Lyn Kephart-Strong
5228 Ameriprise
Financial Center
Minneapolis, MN 55474
Born 1960 | Vice President (2015) | President, Columbia Management Investment Services Corp. since October 2014; Vice President & Resolution Officer, Ameriprise Trust Company since August 2009. |
| 150 | Columbia Capital Allocation Portfolios | Annual Report 2020 |
The Funds mail one shareholder report to each shareholder address, unless such shareholder elected to receive shareholder reports from the Fund electronically. If you would like more than one report, please call shareholder services at 800.345.6611 and additional reports will be sent to you.
Proxy voting policies and procedures
The policy of the Board of Trustees is to vote the proxies of the companies in which the Funds hold investments consistent with the procedures as stated in the Statement of Additional Information (SAI). You may obtain a copy of the SAI without charge by calling 800.345.6611; contacting your financial intermediary; visiting columbiathreadneedleus.com/investor/; or searching the website of the Securities and Exchange Commission (SEC) at sec.gov. Information regarding how the Funds voted proxies relating to portfolio securities is filed with the SEC by August 31st for the most recent 12-month period ending June 30th of that year, and is available without charge by visiting columbiathreadneedleus.com/investor/, or searching the website of the SEC at sec.gov.
Quarterly schedule of investments
The Funds file a complete schedule of portfolio holdings with the SEC for the first and third quarters of each fiscal year on Form N-PORT, and for reporting periods ended prior to March 31, 2019, on Form N-Q. The Funds’ Form N-Q and Form N-PORT filings are available on the SEC’s website at sec.gov. The Funds’ complete schedule of portfolio holdings, as filed on Form N-Q or Form N-PORT, can also be obtained without charge, upon request, by calling 800.345.6611.
Additional Fund information
For more information about the Funds, please visit columbiathreadneedleus.com/investor/ or call 800.345.6611. Customer Service Representatives are available to answer your questions Monday through Friday from 8 a.m. to 7 p.m. Eastern time.
Fund investment manager
Columbia Management Investment Advisers, LLC
225 Franklin Street
Boston, MA 02110
Fund distributor
Columbia Management Investment Distributors, Inc.
225 Franklin Street
Boston, MA 02110
Fund transfer agent
Columbia Management Investment Services Corp.
P.O. Box 219104
Kansas City, MO 64121-9104
Columbia Capital Allocation Portfolios | Annual Report 2020
| 151 |
Columbia Capital Allocation Portfolios
P.O. Box 219104
Kansas City, MO 64121-9104
Please read and consider the investment objectives, risks, charges and expenses for any fund carefully before investing. For a prospectus and summary prospectus, which contains this and other important information about the Funds, go to
columbiathreadneedleus.com/investor/. The Funds are distributed by Columbia Management Investment Distributors, Inc., member FINRA, and managed by Columbia Management Investment Advisers, LLC.
Columbia Threadneedle Investments (Columbia Threadneedle) is the global brand name of the Columbia and Threadneedle group of companies. All rights reserved.
© 2020 Columbia Management Investment Advisers, LLC.
columbiathreadneedleus.com/investor/

Annual Report
January 31, 2020
Columbia Global Strategic Equity Fund
Beginning on January 1, 2021, as permitted by regulations adopted by the Securities and Exchange Commission, paper copies of the Fund’s annual and semiannual shareholder reports like this one will no longer be sent by mail, unless you specifically request paper copies of the reports. Instead, the reports will be made available on the Fund’s website (columbiathreadneedleus.com/investor/), and each time a report is posted you will be notified by mail and provided with a website address to access the report.
If you have already elected to receive shareholder reports electronically, you will not be affected by this change and you need not take any action. You may elect to receive shareholder reports and other communications from the Fund electronically at any time by contacting your financial intermediary (such as a broker-dealer or bank) or, for Fund shares held directly with the Fund, by calling 800.345.6611 or by enrolling in “eDelivery” by logging into your account at columbiathreadneedleus.com/investor/.
You may elect to receive all future reports in paper free of charge. If you invest through a financial intermediary, you can contact your financial intermediary to request that you continue receiving paper copies of your shareholder reports. If you invest directly with the Fund, you can call 800.345.6611 to let the Fund know you wish to continue receiving paper copies of your shareholder reports. Your election to receive paper reports will apply to all Columbia Funds held in your account if you invest through a financial intermediary or all Columbia Funds held with the fund complex if you invest directly with the Fund.
Not FDIC Insured • No bank guarantee • May lose value
Columbia Global Strategic Equity Fund (the Fund) mails one shareholder report to each shareholder address, unless such shareholder elected to receive shareholder reports from the Fund electronically. If you would like more than one report, please call shareholder services at 800.345.6611 and additional reports will be sent to you.
Proxy voting policies and procedures
The policy of the Board of Trustees is to vote the proxies of the companies in which the Fund holds investments consistent with the procedures as stated in the Statement of Additional Information (SAI). You may obtain a copy of the SAI without charge by calling 800.345.6611; contacting your financial intermediary; visiting columbiathreadneedleus.com/investor/; or searching the website of the Securities and Exchange Commission (SEC) at sec.gov. Information regarding how the Fund voted proxies relating to portfolio securities is filed with the SEC by August 31st for the most recent 12-month period ending June 30th of that year, and is available without charge by visiting columbiathreadneedleus.com/investor/, or searching the website of the SEC at sec.gov.
Quarterly schedule of investments
The Fund files a complete schedule of portfolio holdings with the SEC for the first and third quarters of each fiscal year on Form N-PORT, and for reporting periods ended prior to March 31, 2019, on Form N-Q. The Fund’s Form N-Q and Form N-PORT filings are available on the SEC’s website at sec.gov. The Fund’s complete schedule of portfolio holdings, as filed on Form N-Q or Form N-PORT, can also be obtained without charge, upon request, by calling 800.345.6611.
Additional Fund information
For more information about the Fund, please visit columbiathreadneedleus.com/investor/ or call 800.345.6611. Customer Service Representatives are available to answer your questions Monday through Friday from 8 a.m. to 7 p.m. Eastern time.
Fund investment manager
Columbia Management Investment Advisers, LLC (the Investment Manager)
225 Franklin Street
Boston, MA 02110
Fund distributor
Columbia Management Investment Distributors, Inc.
225 Franklin Street
Boston, MA 02110
Fund transfer agent
Columbia Management Investment Services Corp.
P.O. Box 219104
Kansas City, MO 64121-9104
Columbia Global Strategic Equity Fund | Annual Report 2020
Investment objective
The Fund seeks capital appreciation.
Portfolio management
Melda Mergen, CFA, CAIA
Co-Portfolio Manager
Managed Fund since 2016
William Davies
Co-Portfolio Manager
Managed Fund since September 2019
Morningstar style boxTM
The Morningstar Style Box is based on a fund’s portfolio holdings. For equity funds, the vertical axis shows the market capitalization of the stocks owned, and the horizontal axis shows investment style (value, blend, or growth). Information shown is based on the most recent data provided by Morningstar.
© 2020 Morningstar, Inc. All rights reserved. The Morningstar information contained herein: (1) is proprietary to Morningstar and/or its content providers; (2) may not be copied or distributed; and (3) is not warranted to be accurate, complete or timely. Neither Morningstar nor its content providers are responsible for any damages or losses arising from any use of this information.
| Average annual total returns (%) (for the period ended January 31, 2020) |
| | | Inception | 1 Year | 5 Years | 10 Years |
| Class A | Excluding sales charges | 10/15/96 | 16.90 | 8.55 | 10.51 |
| | Including sales charges | | 10.21 | 7.27 | 9.87 |
| Advisor Class* | 11/08/12 | 17.29 | 8.82 | 10.72 |
| Class C | Excluding sales charges | 10/15/96 | 16.11 | 7.74 | 9.70 |
| | Including sales charges | | 15.11 | 7.74 | 9.70 |
| Institutional Class | 10/15/96 | 17.23 | 8.82 | 10.80 |
| Institutional 2 Class* | 11/08/12 | 17.29 | 8.90 | 10.79 |
| Institutional 3 Class* | 03/01/17 | 17.34 | 8.78 | 10.63 |
| Class R | 01/23/06 | 16.64 | 8.28 | 10.24 |
| MSCI ACWI (Net) | | 16.04 | 8.51 | 9.15 |
Returns for Class A shares are shown with and without the maximum initial sales charge of 5.75%. Returns for Class C shares are shown with and without the 1.00% contingent deferred sales charge for the first year only. The Fund’s other share classes are not subject to sales charges and have limited eligibility. Please see the Fund’s prospectus for details. Performance for different share classes will vary based on differences in sales charges and fees associated with each share class. All results shown assume reinvestment of distributions during the period. Returns do not reflect the deduction of taxes that a shareholder may pay on Fund distributions or on the redemption of Fund shares. Performance results reflect the effect of any fee waivers or reimbursements of Fund expenses by Columbia Management Investment Advisers, LLC and/or any of its affiliates. Absent these fee waivers or expense reimbursement arrangements, performance results would have been lower.
The Fund’s performance prior to June 2, 2015 reflects returns achieved pursuant to different principal investment strategies. If the Fund’s current strategies had been in place for the prior periods, results shown may have been different.
The performance information shown represents past performance and is not a guarantee of future results. The investment return and principal value of your investment will fluctuate so that your shares, when redeemed, may be worth more or less than their original cost. Current performance may be lower or higher than the performance information shown. You may obtain performance information current to the most recent month-end by contacting your financial intermediary, visiting columbiathreadneedleus.com/investor/ or calling 800.345.6611.
| * | The returns shown for periods prior to the share class inception date (including returns for the Life of the Fund, if shown, which are since Fund inception) include the returns of the Fund’s oldest share class. Since the Fund launched more than one share class at its inception, Class A shares were used. These returns are adjusted to reflect any higher class-related operating expenses of the newer share classes, as applicable. Please visit columbiathreadneedleus.com/investor/investment-products/mutual-funds/appended-performance for more information. |
The MSCI ACWI (Net) is a free float-adjusted market capitalization weighted index that is designed to measure the equity market performance of developed and emerging markets. The index consists of 45 country indices comprising 24 developed and 21 emerging market country indices.
Indices are not available for investment, are not professionally managed and do not reflect sales charges, fees, brokerage commissions, taxes (except the MSCI ACWI (Net), which reflects reinvested dividends net of withholding taxes) or other expenses of investing. Securities in the Fund may not match those in an index.
Columbia Global Strategic Equity Fund | Annual Report 2020
| 3 |
Fund at a Glance (continued)
Performance of a hypothetical $10,000 investment (January 31, 2010 — January 31, 2020)
The chart above shows the change in value of a hypothetical $10,000 investment in Class A shares of Columbia Global Strategic Equity Fund during the stated time period, and does not reflect the deduction of taxes that a shareholder may pay on Fund distributions or on the redemption of Fund shares.
| Portfolio breakdown (%) (at January 31, 2020) |
| Common Stocks | 9.2 |
| Equity Funds | 84.8 |
| Exchange-Traded Equity Funds | 2.0 |
| Fixed Income Funds | 3.7 |
| Money Market Funds | 0.3 |
| Preferred Stocks | 0.0(a) |
| Total | 100.0 |
Percentages indicated are based upon total investments excluding investments in derivatives, if any. The Fund’s portfolio composition is subject to change.
| 4 | Columbia Global Strategic Equity Fund | Annual Report 2020 |
Manager Discussion of Fund Performance
For the 12-month period that ended January 31, 2020, the Fund’s Class A shares returned 16.90% excluding sales charges and outperformed its benchmark, the MSCI ACWI (Net), which returned 16.04% during the same time period. We attribute the portfolio’s outperformance of the benchmark primarily to underlying fund selection overall and, to a lesser extent, asset allocation. This more than offset the modest detracting effect of style allocation as a whole.
Global equity markets enjoyed notable strength during annual period
As the annual period began in February 2019, investor optimism prevailed, as positive global economic conditions, the impact of broad U.S. corporate tax cuts, a strong U.S. labor market and moves to reduce regulations in a number of industries buoyed confidence. As the calendar year progressed, U.S. economic growth slowed from 3.1% in the first quarter of 2019 to an estimated 2.1% for 2019 overall, as manufacturing activity edged lower. European economies similarly transitioned to a slower pace of growth, struggling with rising interest rates, trade tensions and uncertainty surrounding the U.K.’s departure from the European Union. At the same time, China’s economic conditions weakened, and emerging markets came under pressure, driven by trade and tariff concerns.
Despite these global uncertainties, the U.S. stock market rose strongly in 2019, as the U.S. Federal Reserve (Fed) cut short-term interest rates three times during the second half of the calendar year and then announced at its December 2019 meeting it would hold the targeted federal funds rate at 1.50%-1.75% for the near term, judging its current monetary policy as appropriate to support economic expansion, a strong labor market and inflation approximating its 2.0% target. Central banks in major international economies followed the Fed’s lead with stimulus efforts. As we entered 2020, the novel coronavirus provided a challenge to the global equity markets, leading to a jittery January 2020, especially emerging markets equities. At the end of the annual period, it was still too early to assess the extent and ramifications of the viral outbreak.
All told, for the annual period overall, the broad global equity market, as measured by MSCI ACWI (Net), posted solid double-digit absolute gains but underperformed the broad U.S. equity market, as measured by the S&P 500 Index, which returned 21.68%. Within the U.S. equity market segment, large-cap equities outperformed small-cap equities, and growth-oriented stocks significantly outpaced value-oriented stocks across the capitalization spectrum. As measured by the MSCI EAFE Index (Net) and the MSCI Emerging Markets Index (Net), international developed market equities and emerging market equities returned 12.10% and 3.81%, respectively. Emerging market equities were impacted to a greater degree than their developed counterparts by U.S.-China trade tensions and then, in January 2020, by the coronavirus weighing on investor sentiment.
Positioning in international and growth-oriented U.S. equities boosted relative results
Underlying fund selection overall was the primary driver of the Fund’s performance during the annual period. Most underlying funds outperformed their respective benchmarks during the annual period, attributable primarily to effective stock selection as the underlying funds are generally factor and sector neutral. From regional and style perspectives, positive contributors included international equities, both developed and emerging markets, and growth-oriented U.S. equities, both large-cap and small-cap, via positions in underlying funds. Having an underweight to emerging market international equities and out-of-benchmark exposures to growth-oriented technology equities and global infrastructure equities also added value during the annual period. Positions in Columbia Emerging Markets Fund, Columbia Select Global Equity Fund, Columbia Contrarian Europe Fund, Columbia Small Cap Growth Fund I, Columbia Select Large Cap Growth Fund, Columbia Large Cap Growth Fund, Columbia Global Technology Growth Fund and Columbia Global Infrastructure Fund especially boosted relative results.
Conversely, via underlying funds, selection in non-growth-oriented U.S. equities and global technology equities detracted from relative results. Value exposure via quantitative strategies detracted the most from a style allocation perspective. Having an overweight to developed market international equities, an underweight to U.S. equities and exposure to commodity equities, the latter of which lagged the MSCI ACWI (Net) during the annual period, also were negative factors. Positions in Columbia Disciplined Value Fund, Columbia Global Energy and Natural Resources Fund, Columbia Select Large Cap Equity Fund and Columbia Dividend Income Fund detracted from the Fund’s relative results during the annual period.
Columbia Global Strategic Equity Fund | Annual Report 2020
| 5 |
Manager Discussion of Fund Performance (continued)
Portfolio changes were marginal
Changes within the Fund’s portfolio can be driven by active trading, by directing allocations to select market segments or by market appreciation or depreciation within a given market segment, all via investments in underlying funds. That said, during the annual period, we made no significant changes to the Fund’s asset allocation, style allocation or underlying fund positions, only marginal adjustments as market conditions shifted.
Market risk may affect a single issuer, sector of the economy, industry or the market as a whole. Asset allocation does not assure a profit or protect against loss. The Fund’s investment in other funds subjects it to the investment performance (positive or negative), risks and expenses of these underlying funds. ETFs may trade at a discount to NAV, are subject to tracking/correlation risk and shareholders bear additional ETF expenses. Investment products, including shares of mutual funds, are not federally or FDIC-insured, are not deposits or obligations of, or guaranteed by any financial institution. The Fund may invest significantly in issuers within a particular sector, which may be negatively affected by market, economic or other conditions, making the Fund more vulnerable to unfavorable developments in the sector. International investing involves certain risks and volatility due to potential political, economic or currency instabilities and different financial and accounting standards. Risks are enhanced for emerging market issuers. Investment in or exposure to foreign currencies subjects the Fund to currency fluctuation and risk of loss. Investing in derivatives is a specialized activity that involves special risks, which may result in significant losses or limited gains. See the Fund’s prospectus for more information on these and other risks.
The views expressed in this report reflect the current views of the respective parties. These views are not guarantees of future performance and involve certain risks, uncertainties and assumptions that are difficult to predict, so actual outcomes and results may differ significantly from the views expressed. These views are subject to change at any time based upon economic, market or other conditions and the respective parties disclaim any responsibility to update such views. These views may not be relied on as investment advice and, because investment decisions for a Columbia fund are based on numerous factors, may not be relied on as an indication of trading intent on behalf of any particular Columbia fund. References to specific securities should not be construed as a recommendation or investment advice.
| 6 | Columbia Global Strategic Equity Fund | Annual Report 2020 |
Understanding Your Fund’s Expenses
(Unaudited)
As an investor, you incur two types of costs. There are shareholder transaction costs, which generally include sales charges on purchases and may include redemption fees. There are also ongoing fund costs, which generally include management fees, distribution and/or service fees, and other fund expenses. The following information is intended to help you understand your ongoing costs (in dollars) of investing in the Fund and to help you compare these costs with the ongoing costs of investing in other mutual funds.
Analyzing your Fund’s expenses
To illustrate these ongoing costs, we have provided examples and calculated the expenses paid by investors in each share class of the Fund during the period. The actual and hypothetical information in the table is based on an initial investment of $1,000 at the beginning of the period indicated and held for the entire period. Expense information is calculated two ways and each method provides you with different information. The amount listed in the “Actual” column is calculated using the Fund’s actual operating expenses and total return for the period. You may use the Actual information, together with the amount invested, to estimate the expenses that you paid over the period. Simply divide your account value by $1,000 (for example, an $8,600 account value divided by $1,000 = 8.6), then multiply the results by the expenses paid during the period under the “Actual” column. The amount listed in the “Hypothetical” column assumes a 5% annual rate of return before expenses (which is not the Fund’s actual return) and then applies the Fund’s actual expense ratio for the period to the hypothetical return. You should not use the hypothetical account values and expenses to estimate either your actual account balance at the end of the period or the expenses you paid during the period. See “Compare with other funds” below for details on how to use the hypothetical data.
In addition to the ongoing expenses which the Fund bears directly, the Fund’s shareholders indirectly bear the Fund’s allocable share of the costs and expenses of each underlying fund in which the Fund invests. You can also estimate the effective expenses paid during the period, which includes the indirect fees associated with investing in the underlying funds, by using the amounts listed in the “Effective expenses paid during the period” column.
Compare with other funds
Since all mutual funds are required to include the same hypothetical calculations about expenses in shareholder reports, you can use this information to compare the ongoing cost of investing in the Fund with other funds. To do so, compare the hypothetical example with the 5% hypothetical examples that appear in the shareholder reports of other funds. As you compare hypothetical examples of other funds, it is important to note that hypothetical examples are meant to highlight the ongoing costs of investing in a fund only and do not reflect any transaction costs, such as sales charges, or redemption or exchange fees. Therefore, the hypothetical calculations are useful in comparing ongoing costs only, and will not help you determine the relative total costs of owning different funds. If transaction costs were included in these calculations, your costs would be higher.
| August 1, 2019 — January 31, 2020 |
| | Account value at the
beginning of the
period ($) | Account value at the
end of the
period ($) | Expenses paid during
the period ($) | Fund’s annualized
expense ratio (%) | Effective expenses
paid during the
period ($) | Fund’s effective
annualized
expense ratio (%) |
| | Actual | Hypothetical | Actual | Hypothetical | Actual | Hypothetical | Actual | Actual | Hypothetical | Actual |
| Class A | 1,000.00 | 1,000.00 | 1,076.70 | 1,022.89 | 2.41 | 2.35 | 0.46 | 6.18 | 6.02 | 1.18 |
| Advisor Class | 1,000.00 | 1,000.00 | 1,078.90 | 1,024.10 | 1.15 | 1.12 | 0.22 | 4.93 | 4.80 | 0.94 |
| Class C | 1,000.00 | 1,000.00 | 1,073.90 | 1,019.11 | 6.33 | 6.16 | 1.21 | 10.09 | 9.82 | 1.93 |
| Institutional Class | 1,000.00 | 1,000.00 | 1,078.30 | 1,024.15 | 1.10 | 1.07 | 0.21 | 4.87 | 4.74 | 0.93 |
| Institutional 2 Class | 1,000.00 | 1,000.00 | 1,078.80 | 1,024.35 | 0.89 | 0.87 | 0.17 | 4.66 | 4.54 | 0.89 |
| Institutional 3 Class | 1,000.00 | 1,000.00 | 1,079.40 | 1,024.60 | 0.63 | 0.61 | 0.12 | 4.40 | 4.29 | 0.84 |
| Class R | 1,000.00 | 1,000.00 | 1,076.20 | 1,021.63 | 3.72 | 3.62 | 0.71 | 7.48 | 7.29 | 1.43 |
Expenses paid during the period are equal to the annualized expense ratio for each class as indicated above, multiplied by the average account value over the period and then multiplied by the number of days in the Fund’s most recent fiscal half year and divided by 365.
Effective expenses paid during the period and the Fund’s effective annualized expense ratio include expenses borne directly to the class plus the Fund’s pro rata portion of the ongoing expenses charged by the underlying funds using the expense ratio of each class of the underlying funds as of the underlying fund’s most recent shareholder report.
Columbia Global Strategic Equity Fund | Annual Report 2020
| 7 |
Portfolio of Investments
January 31, 2020
(Percentages represent value of investments compared to net assets)
Investments in securities
| Common Stocks 9.2% |
| Issuer | Shares | Value ($) |
| Communication Services 0.9% |
| Diversified Telecommunication Services 0.3% |
| Hellenic Telecommunications Organization SA | 4,138 | 61,799 |
| Nippon Telegraph & Telephone Corp. | 75,800 | 1,932,676 |
| Verizon Communications, Inc. | 1,879 | 111,688 |
| Total | | 2,106,163 |
| Entertainment 0.2% |
| Nintendo Co., Ltd. | 2,900 | 1,066,781 |
| Take-Two Interactive Software, Inc.(a) | 1,184 | 147,574 |
| Toho Co., Ltd. | 800 | 29,471 |
| Total | | 1,243,826 |
| Interactive Media & Services 0.2% |
| Alphabet, Inc., Class A(a) | 339 | 485,712 |
| Facebook, Inc., Class A(a) | 1,688 | 340,824 |
| Kakaku.com, Inc. | 16,100 | 420,603 |
| Total | | 1,247,139 |
| Media 0.1% |
| Cyfrowy Polsat SA | 9,406 | 65,930 |
| ValueCommerce Co., Ltd. | 28,700 | 667,817 |
| Total | | 733,747 |
| Wireless Telecommunication Services 0.1% |
| Advanced Info Service PCL | 8,800 | 57,212 |
| SoftBank Group Corp. | 14,100 | 569,281 |
| Total | | 626,493 |
| Total Communication Services | 5,957,368 |
| Consumer Discretionary 1.3% |
| Auto Components 0.2% |
| Koito Manufacturing Co., Ltd. | 8,800 | 381,889 |
| Shoei Co., Ltd. | 11,400 | 518,464 |
| Total | | 900,353 |
| Automobiles 0.4% |
| Fiat Chrysler Automobiles NV | 5,826 | 75,897 |
| Peugeot SA | 5,871 | 120,885 |
| Toyota Motor Corp. | 35,200 | 2,447,375 |
| Total | | 2,644,157 |
| Common Stocks (continued) |
| Issuer | Shares | Value ($) |
| Distributors 0.0% |
| LKQ Corp.(a) | 5,663 | 185,095 |
| Hotels, Restaurants & Leisure 0.1% |
| Koshidaka Holdings Co., Ltd. | 23,400 | 330,291 |
| Starbucks Corp. | 1,242 | 105,359 |
| Total | | 435,650 |
| Household Durables 0.4% |
| Sekisui House Ltd. | 8,800 | 189,219 |
| Sony Corp. | 32,800 | 2,293,603 |
| Total | | 2,482,822 |
| Internet & Direct Marketing Retail 0.1% |
| Amazon.com, Inc.(a) | 15 | 30,131 |
| eBay, Inc. | 5,667 | 190,184 |
| Total | | 220,315 |
| Leisure Products 0.1% |
| Bandai Namco Holdings, Inc. | 13,800 | 801,897 |
| Multiline Retail 0.0% |
| Target Corp. | 1,671 | 185,047 |
| Specialty Retail 0.0% |
| AutoZone, Inc.(a) | 164 | 173,505 |
| Textiles, Apparel & Luxury Goods 0.0% |
| Pandora A/S | 498 | 25,824 |
| Under Armour, Inc., Class A(a) | 1,618 | 32,651 |
| Total | | 58,475 |
| Total Consumer Discretionary | 8,087,316 |
| Consumer Staples 0.7% |
| Beverages 0.1% |
| Kirin Holdings Co., Ltd. | 19,200 | 421,680 |
| Food & Staples Retailing 0.1% |
| Koninklijke Ahold Delhaize NV | 7,827 | 192,086 |
| Walgreens Boots Alliance, Inc. | 2,798 | 142,278 |
| Walmart, Inc. | 1,614 | 184,787 |
| Total | | 519,151 |
The accompanying Notes to Financial Statements are an integral part of this statement.
| 8 | Columbia Global Strategic Equity Fund | Annual Report 2020 |
Portfolio of Investments (continued)
January 31, 2020
| Common Stocks (continued) |
| Issuer | Shares | Value ($) |
| Food Products 0.0% |
| JBS SA | 16,400 | 105,578 |
| Uni-President Enterprises Corp. | 27,000 | 64,327 |
| Total | | 169,905 |
| Household Products 0.0% |
| Kimberly-Clark Corp. | 474 | 67,896 |
| Personal Products 0.4% |
| Kao Corp. | 27,000 | 2,153,444 |
| Milbon Co., Ltd. | 8,800 | 492,451 |
| Total | | 2,645,895 |
| Tobacco 0.1% |
| Altria Group, Inc. | 1,335 | 63,452 |
| British American Tobacco PLC | 5,666 | 249,842 |
| Philip Morris International, Inc. | 298 | 24,645 |
| Total | | 337,939 |
| Total Consumer Staples | 4,162,466 |
| Energy 0.1% |
| Oil, Gas & Consumable Fuels 0.1% |
| Canadian Natural Resources Ltd. | 2,800 | 78,748 |
| Cenovus Energy, Inc. | 9,100 | 79,214 |
| China Coal Energy Co., Ltd., Class H | 91,000 | 30,958 |
| ConocoPhillips Co. | 2,774 | 164,859 |
| HollyFrontier Corp. | 1,165 | 52,332 |
| Husky Energy, Inc. | 14,400 | 93,686 |
| Imperial Oil Ltd. | 4,100 | 97,218 |
| Motor Oil Hellas Corinth Refineries SA | 602 | 12,783 |
| Yanzhou Coal Mining Co., Ltd., Class H | 44,000 | 32,465 |
| Total | | 642,263 |
| Total Energy | 642,263 |
| Financials 0.9% |
| Banks 0.3% |
| Banco do Brasil SA | 8,800 | 99,248 |
| Bank Leumi Le-Israel BM | 14,389 | 103,456 |
| BNP Paribas SA | 3,343 | 177,405 |
| Citigroup, Inc. | 3,327 | 247,562 |
| Mediobanca Banca di Credito Finanziario SpA | 1,736 | 17,318 |
| Common Stocks (continued) |
| Issuer | Shares | Value ($) |
| Mitsubishi UFJ Financial Group, Inc. | 193,500 | 993,548 |
| Postal Savings Bank of China Co., Ltd.(b) | 163,000 | 101,426 |
| Total | | 1,739,963 |
| Consumer Finance 0.0% |
| Ally Financial, Inc. | 6,403 | 205,088 |
| Capital One Financial Corp. | 435 | 43,413 |
| Discover Financial Services | 1,419 | 106,609 |
| Synchrony Financial | 2,077 | 67,316 |
| Total | | 422,426 |
| Diversified Financial Services 0.2% |
| Equitable Holdings, Inc. | 8,369 | 201,024 |
| ORIX Corp. | 59,700 | 1,008,480 |
| Voya Financial, Inc. | 556 | 33,210 |
| Total | | 1,242,714 |
| Insurance 0.4% |
| Ageas | 1,250 | 68,927 |
| Allianz SE, Registered Shares | 883 | 210,811 |
| Assicurazioni Generali SpA | 7,094 | 138,231 |
| Dai-ichi Life Holdings, Inc. | 63,100 | 936,479 |
| PICC Property & Casualty Co., Ltd., Class H | 54,000 | 57,750 |
| Power Corp. of Canada | 5,600 | 139,725 |
| Prudential Financial, Inc. | 453 | 41,250 |
| Swiss Life Holding AG, Registered Shares | 380 | 191,016 |
| Tokio Marine Holdings, Inc. | 12,600 | 683,944 |
| Total | | 2,468,133 |
| Total Financials | 5,873,236 |
| Health Care 1.0% |
| Biotechnology 0.1% |
| Alexion Pharmaceuticals, Inc.(a) | 350 | 34,787 |
| BioMarin Pharmaceutical, Inc.(a) | 350 | 29,225 |
| Gilead Sciences, Inc. | 728 | 46,010 |
| PeptiDream, Inc.(a) | 12,100 | 572,785 |
| Vertex Pharmaceuticals, Inc.(a) | 350 | 79,467 |
| Total | | 762,274 |
The accompanying Notes to Financial Statements are an integral part of this statement.
Columbia Global Strategic Equity Fund | Annual Report 2020
| 9 |
Portfolio of Investments (continued)
January 31, 2020
| Common Stocks (continued) |
| Issuer | Shares | Value ($) |
| Health Care Equipment & Supplies 0.4% |
| Asahi Intecc Co., Ltd. | 14,400 | 396,758 |
| Hoya Corp. | 17,900 | 1,713,127 |
| Medtronic PLC | 154 | 17,778 |
| Nakanishi, Inc. | 17,700 | 315,739 |
| Total | | 2,443,402 |
| Health Care Providers & Services 0.0% |
| Cardinal Health, Inc. | 1,149 | 58,840 |
| DaVita, Inc.(a) | 193 | 15,415 |
| McKesson Corp. | 528 | 75,298 |
| Medipal Holdings Corp. | 700 | 14,833 |
| Total | | 164,386 |
| Pharmaceuticals 0.5% |
| Astellas Pharma, Inc. | 11,700 | 206,741 |
| Bausch Health Companies, Inc.(a) | 2,800 | 76,823 |
| Daiichi Sankyo Co., Ltd. | 17,800 | 1,202,872 |
| Johnson & Johnson | 2,008 | 298,931 |
| Merck & Co., Inc. | 991 | 84,671 |
| Novartis AG, Registered Shares | 1,829 | 172,782 |
| Roche Holding AG, Genusschein Shares | 887 | 297,561 |
| Takeda Pharmaceutical Co., Ltd. | 25,000 | 960,085 |
| Total | | 3,300,466 |
| Total Health Care | 6,670,528 |
| Industrials 1.9% |
| Aerospace & Defense 0.0% |
| Lockheed Martin Corp. | 374 | 160,117 |
| Airlines 0.1% |
| Southwest Airlines Co. | 3,355 | 184,458 |
| Building Products 0.3% |
| Daikin Industries Ltd. | 14,600 | 2,057,247 |
| Construction & Engineering 0.2% |
| ACS Actividades de Construccion y Servicios SA | 3,788 | 125,940 |
| Eiffage SA | 139 | 16,112 |
| Kinden Corp. | 57,000 | 971,275 |
| Samsung Engineering Co., Ltd.(a) | 6,120 | 87,069 |
| Total | | 1,200,396 |
| Common Stocks (continued) |
| Issuer | Shares | Value ($) |
| Electrical Equipment 0.1% |
| Acuity Brands, Inc. | 554 | 65,300 |
| Eaton Corp. PLC | 806 | 76,143 |
| Nidec Corp. | 5,300 | 666,585 |
| Total | | 808,028 |
| Industrial Conglomerates 0.0% |
| CITIC Ltd. | 97,000 | 109,687 |
| Machinery 0.3% |
| Cummins, Inc. | 1,185 | 189,564 |
| Sinotruk Hong Kong Ltd. | 26,500 | 45,502 |
| Takuma Co., Ltd. | 106,100 | 1,156,742 |
| Weichai Power Co., Ltd., Class H | 47,000 | 82,284 |
| Zoomlion Heavy Industry Science and Technology Co., Ltd. | 83,800 | 61,526 |
| Total | | 1,535,618 |
| Professional Services 0.4% |
| Meitec Corp. | 5,800 | 329,705 |
| Nihon M&A Center, Inc. | 23,800 | 680,857 |
| Recruit Holdings Co., Ltd. | 40,000 | 1,559,052 |
| Wolters Kluwer NV | 654 | 49,142 |
| Total | | 2,618,756 |
| Road & Rail 0.0% |
| Aurizon Holdings Ltd. | 28,462 | 102,022 |
| Trading Companies & Distributors 0.5% |
| ITOCHU Corp. | 94,600 | 2,209,948 |
| Mitsubishi Corp. | 33,100 | 848,540 |
| Total | | 3,058,488 |
| Transportation Infrastructure 0.0% |
| Grupo Aeroportuario del Pacifico SAB de CV | 5,598 | 69,316 |
| International Container Terminal Services, Inc. | 7,670 | 19,554 |
| Total | | 88,870 |
| Total Industrials | 11,923,687 |
| Information Technology 1.8% |
| Communications Equipment 0.1% |
| Cisco Systems, Inc. | 5,307 | 243,963 |
| F5 Networks, Inc.(a) | 1,081 | 132,012 |
| Total | | 375,975 |
The accompanying Notes to Financial Statements are an integral part of this statement.
| 10 | Columbia Global Strategic Equity Fund | Annual Report 2020 |
Portfolio of Investments (continued)
January 31, 2020
| Common Stocks (continued) |
| Issuer | Shares | Value ($) |
| Electronic Equipment, Instruments & Components 0.6% |
| Amano Corp. | 19,000 | 548,701 |
| Keyence Corp. | 7,100 | 2,386,715 |
| Murata Manufacturing Co., Ltd. | 16,300 | 922,821 |
| Zhen Ding Technology Holding Ltd. | 29,000 | 112,162 |
| Total | | 3,970,399 |
| IT Services 0.2% |
| Comture Corp. | 15,900 | 309,100 |
| MasterCard, Inc., Class A | 705 | 222,738 |
| Obic Co., Ltd. | 4,000 | 545,046 |
| VeriSign, Inc.(a) | 1,005 | 209,181 |
| Total | | 1,286,065 |
| Semiconductors & Semiconductor Equipment 0.2% |
| Lam Research Corp. | 734 | 218,886 |
| Lasertec Corp. | 9,500 | 465,084 |
| Qorvo, Inc.(a) | 214 | 22,654 |
| Rohm Co., Ltd. | 7,300 | 525,129 |
| Shinko Electric Industries Co., Ltd. | 12,600 | 147,901 |
| Total | | 1,379,654 |
| Software 0.3% |
| Fortinet, Inc.(a) | 1,792 | 206,725 |
| Freee KK(a) | 10,000 | 289,327 |
| JustSystems Corp. | 10,900 | 593,258 |
| Microsoft Corp. | 2,460 | 418,766 |
| Total | | 1,508,076 |
| Technology Hardware, Storage & Peripherals 0.4% |
| Apple, Inc. | 527 | 163,112 |
| Chicony Electronics Co., Ltd. | 37,000 | 104,181 |
| Elecom Co., Ltd. | 31,100 | 1,253,883 |
| HP, Inc. | 9,300 | 198,276 |
| Lenovo Group Ltd. | 16,000 | 10,440 |
| Lite-On Technology Corp. | 64,000 | 99,149 |
| Ricoh Co., Ltd. | 62,600 | 710,287 |
| Samsung Electronics Co., Ltd. | 1,603 | 74,272 |
| Wistron Corp. | 93,000 | 82,882 |
| Total | | 2,696,482 |
| Total Information Technology | 11,216,651 |
| Common Stocks (continued) |
| Issuer | Shares | Value ($) |
| Materials 0.4% |
| Chemicals 0.3% |
| Celanese Corp., Class A | 339 | 35,087 |
| JCU Corp. | 15,700 | 445,427 |
| LyondellBasell Industries NV, Class A | 87 | 6,774 |
| Shin-Etsu Chemical Co., Ltd. | 13,700 | 1,566,783 |
| Total | | 2,054,071 |
| Construction Materials 0.0% |
| Anhui Conch Cement Co., Ltd., Class H | 15,000 | 95,741 |
| China National Building Material Co., Ltd., Class H | 30,000 | 28,678 |
| Total | | 124,419 |
| Metals & Mining 0.1% |
| BHP Group Ltd. | 7,589 | 194,612 |
| Fortescue Metals Group Ltd. | 18,475 | 136,859 |
| Rio Tinto PLC | 3,001 | 160,476 |
| Total | | 491,947 |
| Total Materials | 2,670,437 |
| Real Estate 0.1% |
| Equity Real Estate Investment Trusts (REITS) 0.1% |
| American Tower Corp. | 1,009 | 233,826 |
| Essex Property Trust, Inc. | 78 | 24,161 |
| ORIX JREIT, Inc. | 203 | 428,904 |
| Total | | 686,891 |
| Real Estate Management & Development 0.0% |
| Emaar Properties PJSC | 65,244 | 71,194 |
| Logan Property Holdings Co., Ltd. | 58,000 | 87,672 |
| Total | | 158,866 |
| Total Real Estate | 845,757 |
| Utilities 0.1% |
| Electric Utilities 0.0% |
| Inter RAO UES PJSC | 263,000 | 23,726 |
| Manila Electric Co. | 9,140 | 46,033 |
| Total | | 69,759 |
| Gas Utilities 0.0% |
| PT Perusahaan Gas Negara Persero Tbk | 473,000 | 58,623 |
The accompanying Notes to Financial Statements are an integral part of this statement.
Columbia Global Strategic Equity Fund | Annual Report 2020
| 11 |
Portfolio of Investments (continued)
January 31, 2020
| Common Stocks (continued) |
| Issuer | Shares | Value ($) |
| Independent Power and Renewable Electricity Producers 0.1% |
| AES Corp. (The) | 11,242 | 223,266 |
| Vistra Energy Corp | 2,082 | 46,887 |
| Total | | 270,153 |
| Multi-Utilities 0.0% |
| Atco Ltd., Class I | 1,500 | 58,508 |
| Total Utilities | 457,043 |
Total Common Stocks
(Cost $52,066,383) | 58,506,752 |
|
| Equity Funds 84.8% |
| | Shares | Value ($) |
| Dividend Income 8.5% |
| Columbia Dividend Income Fund, Institutional 3 Class(c) | 1,406,021 | 34,742,766 |
| Columbia Global Dividend Opportunity Fund, Institutional 3 Class(c) | 1,006,087 | 18,914,444 |
| Total | 53,657,210 |
| International 46.9% |
| Columbia Contrarian Asia Pacific Fund, Institutional 3 Class(c) | 1,062,778 | 13,008,406 |
| Columbia Contrarian Europe Fund, Institutional 3 Class(c) | 7,054,053 | 49,025,667 |
| Columbia Emerging Markets Fund, Institutional 3 Class(c) | 3,666,915 | 51,116,792 |
| Columbia Global Energy and Natural Resources Fund, Institutional 3 Class(c) | 916,492 | 14,572,212 |
| Columbia Global Infrastructure Fund, Institutional 3 Class(c) | 1,805,363 | 24,643,206 |
| Columbia Global Technology Growth Fund, Institutional 3 Class(a),(c) | 846,675 | 36,821,906 |
| Columbia Overseas Value Fund, Institutional 3 Class(c) | 5,834,584 | 54,611,704 |
| Columbia Select Global Equity Fund, Institutional 3 Class(a),(c) | 3,471,827 | 53,153,672 |
| Total | 296,953,565 |
| U.S. Large Cap 25.6% |
| Columbia Disciplined Value Fund, Institutional 3 Class(c) | 6,898,540 | 62,983,668 |
| Columbia Large Cap Growth Fund, Institutional 3 Class(a),(c) | 512,946 | 24,170,022 |
| Columbia Select Large Cap Equity Fund, Institutional 3 Class(c) | 4,283,078 | 64,417,494 |
| Columbia Select Large Cap Growth Fund, Institutional 3 Class(a),(c) | 745,762 | 10,492,875 |
| Total | 162,064,059 |
| Equity Funds (continued) |
| | Shares | Value ($) |
| U.S. Small Cap 3.8% |
| Columbia Small Cap Growth Fund I, Institutional 3 Class(a),(c) | 1,101,581 | 23,672,981 |
Total Equity Funds
(Cost $456,269,506) | 536,347,815 |
|
| Exchange-Traded Equity Funds 2.0% |
| | |
| International Mid Large Cap 2.0% |
| Columbia Sustainable Global Equity Income ETF(c) | 473,280 | 12,848,889 |
Total Exchange-Traded Equity Funds
(Cost $12,433,066) | 12,848,889 |
|
| Fixed Income Funds 3.7% |
| | |
| Convertible 3.7% |
| Columbia Convertible Securities Fund, Institutional 3 Class(c) | 1,000,344 | 23,258,007 |
Total Fixed Income Funds
(Cost $16,275,786) | 23,258,007 |
| Preferred Stocks 0.0% |
| Issuer | | Shares | Value ($) |
| Utilities 0.0% |
| Electric Utilities 0.0% |
| Cia Energetica de Minas Gerais | | 11,600 | 40,521 |
| Total Utilities | 40,521 |
Total Preferred Stocks
(Cost $42,716) | 40,521 |
| Money Market Funds 0.3% |
| | Shares | Value ($) |
| Columbia Short-Term Cash Fund, 1.648%(c),(d) | 1,579,887 | 1,579,887 |
Total Money Market Funds
(Cost $1,579,837) | 1,579,887 |
Total Investments in Securities
(Cost: $538,667,294) | 632,581,871 |
| Other Assets & Liabilities, Net | | 315,846 |
| Net Assets | 632,897,717 |
The accompanying Notes to Financial Statements are an integral part of this statement.
| 12 | Columbia Global Strategic Equity Fund | Annual Report 2020 |
Portfolio of Investments (continued)
January 31, 2020
Investments in derivatives
| Forward foreign currency exchange contracts |
Currency to
be sold | Currency to
be purchased | Counterparty | Settlement
date | Unrealized
appreciation ($) | Unrealized
depreciation ($) |
| 248,000 AUD | 167,518 USD | Morgan Stanley | 03/26/2020 | 1,349 | — |
| 400,000 BRL | 94,487 USD | Morgan Stanley | 03/26/2020 | 1,341 | — |
| 250,000 CAD | 189,347 USD | Morgan Stanley | 03/26/2020 | 446 | — |
| 71,000 CHF | 73,132 USD | Morgan Stanley | 03/26/2020 | — | (850) |
| 302,000 ILS | 87,715 USD | Morgan Stanley | 03/26/2020 | — | (1) |
| 8,311,000 TWD | 277,097 USD | Morgan Stanley | 03/26/2020 | 2,799 | — |
| 43,759 USD | 296,000 DKK | Morgan Stanley | 03/26/2020 | 330 | — |
| 233,424 USD | 179,000 GBP | Morgan Stanley | 03/26/2020 | 3,275 | — |
| 145,884 USD | 10,459,000 INR | Morgan Stanley | 03/26/2020 | — | (732) |
| 43,894 USD | 2,764,000 RUB | Morgan Stanley | 03/26/2020 | — | (902) |
| 58,075 USD | 79,000 SGD | Morgan Stanley | 03/26/2020 | — | (174) |
| 58,235 USD | 858,000 ZAR | Morgan Stanley | 03/26/2020 | — | (1,458) |
| Total | | | | 9,540 | (4,117) |
Notes to Portfolio of Investments
| (a) | Non-income producing investment. |
| (b) | Represents privately placed and other securities and instruments exempt from Securities and Exchange Commission registration (collectively, private placements), such as Section 4(a)(2) and Rule 144A eligible securities, which are often sold only to qualified institutional buyers. The Fund may invest in private placements determined to be liquid as well as those determined to be illiquid. Private placements may be determined to be liquid under guidelines established by the Fund’s Board of Trustees. At January 31, 2020, the total value of these securities amounted to $101,426, which represents 0.02% of total net assets. |
| (c) | As defined in the Investment Company Act of 1940, an affiliated company is one in which the Fund owns 5% or more of the company’s outstanding voting securities, or a company which is under common ownership or control with the Fund. Holdings and transactions in these affiliated companies during the year ended January 31, 2020 are as follows: |
| Issuer | Beginning
shares | Shares
purchased | Shares
sold | Ending
shares | Capital gain
distributions —
affiliated
issuers ($) | Realized gain
(loss) —
affiliated
issuers ($) | Net change in
unrealized
appreciation
(depreciation) —
affiliated
issuers ($) | Dividends —
affiliated
issuers ($) | Value —
affiliated
issuers
at end of
period ($) |
| Columbia Contrarian Asia Pacific Fund, Institutional 3 Class |
| | 1,103,729 | 24,261 | (65,212) | 1,062,778 | — | (101,836) | 664,345 | 267,165 | 13,008,406 |
| Columbia Contrarian Europe Fund, Institutional 3 Class |
| | 7,627,255 | 170,214 | (743,416) | 7,054,053 | — | (279,822) | 6,511,427 | 1,198,305 | 49,025,667 |
| Columbia Convertible Securities Fund, Institutional 3 Class |
| | 1,036,909 | 67,325 | (103,890) | 1,000,344 | 885,781 | 385,446 | 2,260,808 | 578,326 | 23,258,007 |
| Columbia Disciplined Value Fund, Institutional 3 Class |
| | 6,576,026 | 708,959 | (386,445) | 6,898,540 | 5,155,560 | 340,828 | (1,301,936) | 1,314,462 | 62,983,668 |
| Columbia Dividend Income Fund, Institutional 3 Class |
| | 1,542,717 | 45,243 | (181,939) | 1,406,021 | 366,619 | 881,239 | 4,314,099 | 698,785 | 34,742,766 |
| Columbia Emerging Markets Fund, Institutional 3 Class |
| | 2,107,519 | 2,077,354 | (517,958) | 3,666,915 | — | 1,609,586 | 5,935,451 | 267,824 | 51,116,792 |
| Columbia Global Dividend Opportunity Fund, Institutional 3 Class |
| | 2,058,933 | 38,854 | (1,091,700) | 1,006,087 | 147,346 | (505,968) | 2,408,149 | 570,982 | 18,914,444 |
| Columbia Global Energy and Natural Resources Fund, Institutional 3 Class |
| | 891,142 | 41,028 | (15,678) | 916,492 | — | (77,461) | (1,171,143) | 477,258 | 14,572,212 |
| Columbia Global Infrastructure Fund, Institutional 3 Class |
| | 1,906,023 | 141,607 | (242,267) | 1,805,363 | 1,349,654 | (1,720,749) | 4,617,336 | 494,505 | 24,643,206 |
| Columbia Global Technology Growth Fund, Institutional 3 Class |
| | 1,024,649 | 12,844 | (190,818) | 846,675 | 435,193 | 3,317,420 | 6,798,229 | — | 36,821,906 |
The accompanying Notes to Financial Statements are an integral part of this statement.
Columbia Global Strategic Equity Fund | Annual Report 2020
| 13 |
Portfolio of Investments (continued)
January 31, 2020
Notes to Portfolio of Investments (continued)
| Issuer | Beginning
shares | Shares
purchased | Shares
sold | Ending
shares | Capital gain
distributions —
affiliated
issuers ($) | Realized gain
(loss) —
affiliated
issuers ($) | Net change in
unrealized
appreciation
(depreciation) —
affiliated
issuers ($) | Dividends —
affiliated
issuers ($) | Value —
affiliated
issuers
at end of
period ($) |
| Columbia Large Cap Growth Fund, Institutional 3 Class |
| | 552,317 | 40,706 | (80,077) | 512,946 | 1,794,950 | 583,061 | 3,215,740 | — | 24,170,022 |
| Columbia Overseas Value Fund, Institutional 3 Class |
| | 6,016,420 | 229,237 | (411,073) | 5,834,584 | 110,017 | 575,445 | 1,748,414 | 2,082,956 | 54,611,704 |
| Columbia Select Global Equity Fund, Institutional 3 Class |
| | 4,013,071 | 108,048 | (649,292) | 3,471,827 | 1,594,813 | 2,612,475 | 8,961,331 | — | 53,153,672 |
| Columbia Select Large Cap Equity Fund, Institutional 3 Class |
| | 4,536,175 | 251,884 | (504,981) | 4,283,078 | 2,740,509 | 1,351,816 | 6,648,482 | 769,397 | 64,417,494 |
| Columbia Select Large Cap Growth Fund, Institutional 3 Class |
| | 630,914 | 203,061 | (88,213) | 745,762 | 2,804,763 | 108,640 | (954,778) | — | 10,492,875 |
| Columbia Short-Term Cash Fund, 1.648% |
| | 2,135,321 | 17,393,059 | (17,948,493) | 1,579,887 | — | 68 | 50 | 35,926 | 1,579,887 |
| Columbia Small Cap Growth Fund I, Institutional 3 Class |
| | 1,175,214 | 91,957 | (165,590) | 1,101,581 | 1,894,374 | 1,114,625 | 2,146,204 | — | 23,672,981 |
| Columbia Sustainable Global Equity Income ETF |
| | — | 473,280 | — | 473,280 | — | — | 415,823 | 373,077 | 12,848,889 |
| Total | | | | | 19,279,579 | 10,194,813 | 53,218,031 | 9,128,968 | 574,034,598 |
| (d) | The rate shown is the seven-day current annualized yield at January 31, 2020. |
Currency Legend
| AUD | Australian Dollar |
| BRL | Brazilian Real |
| CAD | Canada Dollar |
| CHF | Swiss Franc |
| DKK | Danish Krone |
| GBP | British Pound |
| ILS | New Israeli Sheqel |
| INR | Indian Rupee |
| RUB | Russian Ruble |
| SGD | Singapore Dollar |
| TWD | New Taiwan Dollar |
| USD | US Dollar |
| ZAR | South African Rand |
Fair value measurements
The Fund categorizes its fair value measurements according to a three-level hierarchy that maximizes the use of observable inputs and minimizes the use of unobservable inputs by prioritizing that the most observable input be used when available. Observable inputs are those that market participants would use in pricing an investment based on market data obtained from sources independent of the reporting entity. Unobservable inputs are those that reflect the Fund’s assumptions about the information market participants would use in pricing an investment. An investment’s level within the fair value hierarchy is based on the lowest level of any input that is deemed significant to the asset’s or liability’s fair value measurement. The input levels are not necessarily an indication of the risk or liquidity associated with investments at that level. For example, certain U.S. government securities are generally high quality and liquid, however, they are reflected as Level 2 because the inputs used to determine fair value may not always be quoted prices in an active market.
Fair value inputs are summarized in the three broad levels listed below:
| ■ | Level 1 — Valuations based on quoted prices for investments in active markets that the Fund has the ability to access at the measurement date. Valuation adjustments are not applied to Level 1 investments. |
The accompanying Notes to Financial Statements are an integral part of this statement.
| 14 | Columbia Global Strategic Equity Fund | Annual Report 2020 |
Portfolio of Investments (continued)
January 31, 2020
Fair value measurements (continued)
| ■ | Level 2 — Valuations based on other significant observable inputs (including quoted prices for similar securities, interest rates, prepayment speeds, credit risks, etc.). |
| ■ | Level 3 — Valuations based on significant unobservable inputs (including the Fund’s own assumptions and judgment in determining the fair value of investments). |
Inputs that are used in determining fair value of an investment may include price information, credit data, volatility statistics, and other factors. These inputs can be either observable or unobservable. The availability of observable inputs can vary between investments, and is affected by various factors such as the type of investment, and the volume and level of activity for that investment or similar investments in the marketplace. The inputs will be considered by the Investment Manager, along with any other relevant factors in the calculation of an investment’s fair value. The Fund uses prices and inputs that are current as of the measurement date, which may include periods of market dislocations. During these periods, the availability of prices and inputs may be reduced for many investments. This condition could cause an investment to be reclassified between the various levels within the hierarchy.
Foreign equity securities actively traded in markets where there is a significant delay in the local close relative to the New York Stock Exchange are classified as Level 2. The values of these securities may include an adjustment to reflect the impact of market movements following the close of local trading, as described in Note 2 to the financial statements – Security valuation.
Investments falling into the Level 3 category are primarily supported by quoted prices from brokers and dealers participating in the market for those investments. However, these may be classified as Level 3 investments due to lack of market transparency and corroboration to support these quoted prices. Additionally, valuation models may be used as the pricing source for any remaining investments classified as Level 3. These models may rely on one or more significant unobservable inputs and/or significant assumptions by the Investment Manager. Inputs used in valuations may include, but are not limited to, financial statement analysis, capital account balances, discount rates and estimated cash flows, and comparable company data.
Under the direction of the Fund’s Board of Trustees (the Board), the Investment Manager’s Valuation Committee (the Committee) is responsible for overseeing the valuation procedures approved by the Board. The Committee consists of voting and non-voting members from various groups within the Investment Manager’s organization, including operations and accounting, trading and investments, compliance, risk management and legal.
The Committee meets at least monthly to review and approve valuation matters, which may include a description of specific valuation determinations, data regarding pricing information received from approved pricing vendors and brokers and the results of Board-approved valuation control policies and procedures (the Policies). The Policies address, among other things, instances when market quotations are or are not readily available, including recommendations of third party pricing vendors and a determination of appropriate pricing methodologies; events that require specific valuation determinations and assessment of fair value techniques; securities with a potential for stale pricing, including those that are illiquid, restricted, or in default; and the effectiveness of third party pricing vendors, including periodic reviews of vendors. The Committee meets more frequently, as needed, to discuss additional valuation matters, which may include the need to review back-testing results, review time-sensitive information or approve related valuation actions. The Committee reports to the Board, with members of the Committee meeting with the Board at each of its regularly scheduled meetings to discuss valuation matters and actions during the period, similar to those described earlier.
The following table is a summary of the inputs used to value the Fund’s investments at January 31, 2020:
| | Level 1 ($) | Level 2 ($) | Level 3 ($) | Total ($) |
| Investments in Securities | | | | |
| Common Stocks | | | | |
| Communication Services | 1,085,798 | 4,871,570 | — | 5,957,368 |
| Consumer Discretionary | 901,972 | 7,185,344 | — | 8,087,316 |
| Consumer Staples | 588,636 | 3,573,830 | — | 4,162,466 |
| Energy | 566,057 | 76,206 | — | 642,263 |
| Financials | 1,184,445 | 4,688,791 | — | 5,873,236 |
| Health Care | 817,245 | 5,853,283 | — | 6,670,528 |
| Industrials | 744,898 | 11,178,789 | — | 11,923,687 |
| Information Technology | 2,036,313 | 9,180,338 | — | 11,216,651 |
| Materials | 41,861 | 2,628,576 | — | 2,670,437 |
| Real Estate | 257,987 | 587,770 | — | 845,757 |
| Utilities | 328,661 | 128,382 | — | 457,043 |
| Total Common Stocks | 8,553,873 | 49,952,879 | — | 58,506,752 |
| Equity Funds | 536,347,815 | — | — | 536,347,815 |
| Exchange-Traded Equity Funds | 12,848,889 | — | — | 12,848,889 |
| Fixed Income Funds | 23,258,007 | — | — | 23,258,007 |
| Preferred Stocks | | | | |
| Utilities | 40,521 | — | — | 40,521 |
| Total Preferred Stocks | 40,521 | — | — | 40,521 |
| Money Market Funds | 1,579,887 | — | — | 1,579,887 |
| Total Investments in Securities | 582,628,992 | 49,952,879 | — | 632,581,871 |
| Investments in Derivatives | | | | |
| Asset | | | | |
| Forward Foreign Currency Exchange Contracts | — | 9,540 | — | 9,540 |
| Liability | | | | |
| Forward Foreign Currency Exchange Contracts | — | (4,117) | — | (4,117) |
| Total | 582,628,992 | 49,958,302 | — | 632,587,294 |
The accompanying Notes to Financial Statements are an integral part of this statement.
Columbia Global Strategic Equity Fund | Annual Report 2020
| 15 |
Portfolio of Investments (continued)
January 31, 2020
Fair value measurements (continued)
See the Portfolio of Investments for all investment classifications not indicated in the table.
The Fund’s assets assigned to the Level 2 input category are generally valued using the market approach, in which a security’s value is determined through reference to prices and information from market transactions for similar or identical assets. These assets include certain foreign securities for which a third party statistical pricing service may be employed for purposes of fair market valuation. The model utilized by such third party statistical pricing service takes into account a security’s correlation to available market data including, but not limited to, intraday index, ADR, and exchange-traded fund movements.
Derivative instruments are valued at unrealized appreciation (depreciation).
The accompanying Notes to Financial Statements are an integral part of this statement.
| 16 | Columbia Global Strategic Equity Fund | Annual Report 2020 |
Statement of Assets and Liabilities
January 31, 2020
| Assets | |
| Investments in securities, at value | |
| Unaffiliated issuers (cost $52,109,099) | $58,547,273 |
| Affiliated issuers (cost $486,558,195) | 574,034,598 |
| Unrealized appreciation on forward foreign currency exchange contracts | 9,540 |
| Receivable for: | |
| Investments sold | 827,475 |
| Capital shares sold | 136,016 |
| Dividends | 46,847 |
| Foreign tax reclaims | 69,371 |
| Prepaid expenses | 2,383 |
| Total assets | 633,673,503 |
| Liabilities | |
| Unrealized depreciation on forward foreign currency exchange contracts | 4,117 |
| Payable for: | |
| Investments purchased | 56,845 |
| Capital shares purchased | 551,544 |
| Management services fees | 1,277 |
| Distribution and/or service fees | 4,792 |
| Transfer agent fees | 50,677 |
| Compensation of board members | 48,378 |
| Compensation of chief compliance officer | 139 |
| Other expenses | 58,017 |
| Total liabilities | 775,786 |
| Net assets applicable to outstanding capital stock | $632,897,717 |
| Represented by | |
| Paid in capital | 524,370,095 |
| Total distributable earnings (loss) | 108,527,622 |
| Total - representing net assets applicable to outstanding capital stock | $632,897,717 |
The accompanying Notes to Financial Statements are an integral part of this statement.
Columbia Global Strategic Equity Fund | Annual Report 2020
| 17 |
Statement of Assets and Liabilities (continued)
January 31, 2020
| Class A | |
| Net assets | $560,843,469 |
| Shares outstanding | 36,983,979 |
| Net asset value per share | $15.16 |
| Maximum sales charge | 5.75% |
| Maximum offering price per share (calculated by dividing the net asset value per share by 1.0 minus the maximum sales charge for Class A shares) | $16.08 |
| Advisor Class | |
| Net assets | $6,472,015 |
| Shares outstanding | 405,257 |
| Net asset value per share | $15.97 |
| Class C | |
| Net assets | $31,970,422 |
| Shares outstanding | 2,541,779 |
| Net asset value per share | $12.58 |
| Institutional Class | |
| Net assets | $29,115,180 |
| Shares outstanding | 1,856,546 |
| Net asset value per share | $15.68 |
| Institutional 2 Class | |
| Net assets | $2,023,327 |
| Shares outstanding | 126,438 |
| Net asset value per share | $16.00 |
| Institutional 3 Class | |
| Net assets | $2,090,196 |
| Shares outstanding | 132,373 |
| Net asset value per share | $15.79 |
| Class R | |
| Net assets | $383,108 |
| Shares outstanding | 25,795 |
| Net asset value per share | $14.85 |
The accompanying Notes to Financial Statements are an integral part of this statement.
| 18 | Columbia Global Strategic Equity Fund | Annual Report 2020 |
Statement of Operations
Year Ended January 31, 2020
| Net investment income | |
| Income: | |
| Dividends — unaffiliated issuers | $1,259,350 |
| Dividends — affiliated issuers | 9,128,968 |
| Foreign taxes withheld | (109,544) |
| Total income | 10,278,774 |
| Expenses: | |
| Management services fees | 457,542 |
| Distribution and/or service fees | |
| Class A | 1,372,656 |
| Class C | 333,205 |
| Class R | 1,671 |
| Transfer agent fees | |
| Class A | 578,280 |
| Advisor Class | 10,505 |
| Class C | 35,172 |
| Institutional Class | 29,802 |
| Institutional 2 Class | 1,248 |
| Institutional 3 Class | 231 |
| Class R | 352 |
| Compensation of board members | 26,761 |
| Custodian fees | 55,814 |
| Printing and postage fees | 63,656 |
| Registration fees | 97,107 |
| Audit fees | 18,637 |
| Legal fees | 13,200 |
| Compensation of chief compliance officer | 132 |
| Other | 16,843 |
| Total expenses | 3,112,814 |
| Expense reduction | (520) |
| Total net expenses | 3,112,294 |
| Net investment income | 7,166,480 |
| Realized and unrealized gain (loss) — net | |
| Net realized gain (loss) on: | |
| Investments — unaffiliated issuers | 2,843,710 |
| Investments — affiliated issuers | 10,194,813 |
| Capital gain distributions from underlying affiliated funds | 19,279,579 |
| Foreign currency translations | (23,375) |
| Forward foreign currency exchange contracts | 16,998 |
| Net realized gain | 32,311,725 |
| Net change in unrealized appreciation (depreciation) on: | |
| Investments — unaffiliated issuers | 4,851,950 |
| Investments — affiliated issuers | 53,218,031 |
| Foreign currency translations | 1,392 |
| Forward foreign currency exchange contracts | 7,392 |
| Net change in unrealized appreciation (depreciation) | 58,078,765 |
| Net realized and unrealized gain | 90,390,490 |
| Net increase in net assets resulting from operations | $97,556,970 |
The accompanying Notes to Financial Statements are an integral part of this statement.
Columbia Global Strategic Equity Fund | Annual Report 2020
| 19 |
Statement of Changes in Net Assets
| | Year Ended
January 31, 2020 | Year Ended
January 31, 2019 |
| Operations | | |
| Net investment income | $7,166,480 | $5,573,580 |
| Net realized gain | 32,311,725 | 45,613,551 |
| Net change in unrealized appreciation (depreciation) | 58,078,765 | (112,103,298) |
| Net increase (decrease) in net assets resulting from operations | 97,556,970 | (60,916,167) |
| Distributions to shareholders | | |
| Net investment income and net realized gains | | |
| Class A | (35,940,334) | (40,837,131) |
| Advisor Class | (595,553) | (703,290) |
| Class C | (2,363,959) | (3,691,124) |
| Institutional Class | (1,852,587) | (2,251,894) |
| Institutional 2 Class | (130,760) | (158,003) |
| Institutional 3 Class | (139,815) | (154,834) |
| Class R | (23,440) | (19,813) |
| Total distributions to shareholders | (41,046,448) | (47,816,089) |
| Decrease in net assets from capital stock activity | (33,935,975) | (14,632,616) |
| Total increase (decrease) in net assets | 22,574,547 | (123,364,872) |
| Net assets at beginning of year | 610,323,170 | 733,688,042 |
| Net assets at end of year | $632,897,717 | $610,323,170 |
The accompanying Notes to Financial Statements are an integral part of this statement.
| 20 | Columbia Global Strategic Equity Fund | Annual Report 2020 |
Statement of Changes in Net Assets (continued)
| | Year Ended | Year Ended |
| | January 31, 2020 | January 31, 2019 |
| | Shares | Dollars ($) | Shares | Dollars ($) |
| Capital stock activity |
| Class A | | | | |
| Subscriptions | 1,720,698 | 25,306,120 | 3,741,438 | 56,181,458 |
| Distributions reinvested | 1,952,589 | 28,963,472 | 2,468,909 | 32,889,866 |
| Redemptions | (5,077,676) | (74,514,390) | (5,093,557) | (76,597,436) |
| Net increase (decrease) | (1,404,389) | (20,244,798) | 1,116,790 | 12,473,888 |
| Advisor Class | | | | |
| Subscriptions | 238,973 | 3,668,053 | 466,836 | 7,098,843 |
| Distributions reinvested | 13,025 | 203,215 | 10,882 | 151,981 |
| Redemptions | (609,039) | (9,328,890) | (198,378) | (3,070,792) |
| Net increase (decrease) | (357,041) | (5,457,622) | 279,340 | 4,180,032 |
| Class C | | | | |
| Subscriptions | 275,485 | 3,390,669 | 369,791 | 4,716,682 |
| Distributions reinvested | 169,036 | 2,089,000 | 285,977 | 3,296,328 |
| Redemptions | (951,785) | (11,682,065) | (2,665,798) | (34,784,691) |
| Net decrease | (507,264) | (6,202,396) | (2,010,030) | (26,771,681) |
| Institutional Class | | | | |
| Subscriptions | 595,692 | 9,023,520 | 849,171 | 13,021,154 |
| Distributions reinvested | 72,293 | 1,106,795 | 91,657 | 1,256,458 |
| Redemptions | (795,975) | (11,983,661) | (1,350,486) | (21,224,986) |
| Net decrease | (127,990) | (1,853,346) | (409,658) | (6,947,374) |
| Institutional 2 Class | | | | |
| Subscriptions | 31,073 | 479,216 | 134,710 | 2,164,926 |
| Distributions reinvested | 8,363 | 130,599 | 11,518 | 157,820 |
| Redemptions | (38,376) | (590,479) | (55,964) | (799,941) |
| Net increase | 1,060 | 19,336 | 90,264 | 1,522,805 |
| Institutional 3 Class | | | | |
| Subscriptions | 26,592 | 406,154 | 97,337 | 1,538,441 |
| Distributions reinvested | 9,063 | 139,628 | 11,251 | 154,624 |
| Redemptions | (51,099) | (778,862) | (51,286) | (790,520) |
| Net increase (decrease) | (15,444) | (233,080) | 57,302 | 902,545 |
| Class K | | | | |
| Redemptions | — | — | (8,015) | (132,372) |
| Net decrease | — | — | (8,015) | (132,372) |
| Class R | | | | |
| Subscriptions | 8,506 | 122,574 | 12,630 | 178,441 |
| Distributions reinvested | 1,613 | 23,440 | 1,553 | 19,813 |
| Redemptions | (7,586) | (110,083) | (3,904) | (58,713) |
| Net increase | 2,533 | 35,931 | 10,279 | 139,541 |
| Total net decrease | (2,408,535) | (33,935,975) | (873,728) | (14,632,616) |
The accompanying Notes to Financial Statements are an integral part of this statement.
Columbia Global Strategic Equity Fund | Annual Report 2020
| 21 |
The following table is intended to help you understand the Fund’s financial performance. Certain information reflects financial results for a single share of a class held for the periods shown. Per share net investment income (loss) amounts are calculated based on average shares outstanding during the period. Total return assumes reinvestment of all dividends and distributions, if any. Total return does not reflect payment of sales charges, if any. Total return and portfolio turnover are not annualized for periods of less than one year. The portfolio turnover rate is calculated without regard to purchase and sales transactions of short-term instruments and certain derivatives, if any. If such transactions were included, the Fund’s portfolio turnover rate may be higher.
| | Net asset value,
beginning of
period | Net
investment
income | Net
realized
and
unrealized
gain (loss) | Total from
investment
operations | Distributions
from net
investment
income | Distributions
from net
realized
gains | Total
distributions to
shareholders |
| Class A |
| Year Ended 1/31/2020 | $13.84 | 0.17 | 2.13 | 2.30 | (0.21) | (0.77) | (0.98) |
| Year Ended 1/31/2019 | $16.41 | 0.14 | (1.60) | (1.46) | (0.38) | (0.73) | (1.11) |
| Year Ended 1/31/2018 | $12.75 | 0.14 | 3.72 | 3.86 | (0.20) | — | (0.20) |
| Year Ended 1/31/2017 | $11.35 | 0.13 | 1.61 | 1.74 | (0.02) | (0.32) | (0.34) |
| Year Ended 1/31/2016 | $15.35 | 0.24 | (1.00) | (0.76) | (0.33) | (2.91) | (3.24) |
| Advisor Class |
| Year Ended 1/31/2020 | $14.51 | 0.15 | 2.32 | 2.47 | (0.24) | (0.77) | (1.01) |
| Year Ended 1/31/2019 | $17.14 | 0.19 | (1.68) | (1.49) | (0.41) | (0.73) | (1.14) |
| Year Ended 1/31/2018 | $13.31 | 0.24 | 3.82 | 4.06 | (0.23) | — | (0.23) |
| Year Ended 1/31/2017 | $11.81 | 0.19 | 1.66 | 1.85 | (0.03) | (0.32) | (0.35) |
| Year Ended 1/31/2016 | $15.85 | 0.39 | (1.16) | (0.77) | (0.36) | (2.91) | (3.27) |
| Class C |
| Year Ended 1/31/2020 | $11.66 | 0.05 | 1.80 | 1.85 | (0.16) | (0.77) | (0.93) |
| Year Ended 1/31/2019 | $14.04 | 0.00(d) | (1.35) | (1.35) | (0.30) | (0.73) | (1.03) |
| Year Ended 1/31/2018 | $10.95 | 0.02 | 3.18 | 3.20 | (0.11) | — | (0.11) |
| Year Ended 1/31/2017 | $9.85 | 0.03 | 1.39 | 1.42 | — | (0.32) | (0.32) |
| Year Ended 1/31/2016 | $13.76 | 0.12 | (0.87) | (0.75) | (0.25) | (2.91) | (3.16) |
| Institutional Class |
| Year Ended 1/31/2020 | $14.27 | 0.22 | 2.20 | 2.42 | (0.24) | (0.77) | (1.01) |
| Year Ended 1/31/2019 | $16.87 | 0.17 | (1.63) | (1.46) | (0.41) | (0.73) | (1.14) |
| Year Ended 1/31/2018 | $13.11 | 0.18 | 3.81 | 3.99 | (0.23) | — | (0.23) |
| Year Ended 1/31/2017 | $11.64 | 0.16 | 1.66 | 1.82 | (0.03) | (0.32) | (0.35) |
| Year Ended 1/31/2016 | $15.66 | 0.26 | (1.01) | (0.75) | (0.36) | (2.91) | (3.27) |
| Institutional 2 Class |
| Year Ended 1/31/2020 | $14.54 | 0.23 | 2.24 | 2.47 | (0.24) | (0.77) | (1.01) |
| Year Ended 1/31/2019 | $17.16 | 0.22 | (1.70) | (1.48) | (0.41) | (0.73) | (1.14) |
| Year Ended 1/31/2018 | $13.33 | 0.19 | 3.88 | 4.07 | (0.24) | — | (0.24) |
| Year Ended 1/31/2017 | $11.83 | 0.19 | 1.67 | 1.86 | (0.04) | (0.32) | (0.36) |
| Year Ended 1/31/2016 | $15.85 | 0.32 | (1.06) | (0.74) | (0.37) | (2.91) | (3.28) |
The accompanying Notes to Financial Statements are an integral part of this statement.
| 22 | Columbia Global Strategic Equity Fund | Annual Report 2020 |
Financial Highlights (continued)
| | Net
asset
value,
end of
period | Total
return | Total gross
expense
ratio to
average
net assets(a) | Total net
expense
ratio to
average
net assets(a),(b) | Net investment
income
ratio to
average
net assets | Portfolio
turnover | Net
assets,
end of
period
(000’s) |
| Class A |
| Year Ended 1/31/2020 | $15.16 | 16.90% | 0.48% | 0.48%(c) | 1.18% | 17% | $560,843 |
| Year Ended 1/31/2019 | $13.84 | (8.49%) | 0.50% | 0.50%(c) | 0.90% | 17% | $531,131 |
| Year Ended 1/31/2018 | $16.41 | 30.57% | 0.50% | 0.50%(c) | 0.95% | 18% | $611,508 |
| Year Ended 1/31/2017 | $12.75 | 15.63% | 0.52% | 0.52%(c) | 1.05% | 54% | $515,290 |
| Year Ended 1/31/2016 | $11.35 | (6.66%) | 0.50% | 0.50%(c) | 1.66% | 75% | $522,769 |
| Advisor Class |
| Year Ended 1/31/2020 | $15.97 | 17.29% | 0.23% | 0.23%(c) | 0.97% | 17% | $6,472 |
| Year Ended 1/31/2019 | $14.51 | (8.31%) | 0.26% | 0.26%(c) | 1.20% | 17% | $11,064 |
| Year Ended 1/31/2018 | $17.14 | 30.86% | 0.25% | 0.25%(c) | 1.58% | 18% | $8,277 |
| Year Ended 1/31/2017 | $13.31 | 16.01% | 0.27% | 0.27%(c) | 1.52% | 54% | $284 |
| Year Ended 1/31/2016 | $11.81 | (6.55%) | 0.27% | 0.27%(c) | 2.73% | 75% | $71 |
| Class C |
| Year Ended 1/31/2020 | $12.58 | 16.11% | 1.23% | 1.23%(c) | 0.37% | 17% | $31,970 |
| Year Ended 1/31/2019 | $11.66 | (9.19%) | 1.25% | 1.25%(c) | 0.00% | 17% | $35,551 |
| Year Ended 1/31/2018 | $14.04 | 29.48% | 1.25% | 1.25%(c) | 0.14% | 18% | $71,030 |
| Year Ended 1/31/2017 | $10.95 | 14.81% | 1.27% | 1.27%(c) | 0.28% | 54% | $74,057 |
| Year Ended 1/31/2016 | $9.85 | (7.38%) | 1.25% | 1.25%(c) | 0.90% | 75% | $80,104 |
| Institutional Class |
| Year Ended 1/31/2020 | $15.68 | 17.23% | 0.23% | 0.23%(c) | 1.43% | 17% | $29,115 |
| Year Ended 1/31/2019 | $14.27 | (8.26%) | 0.25% | 0.25%(c) | 1.10% | 17% | $28,316 |
| Year Ended 1/31/2018 | $16.87 | 30.79% | 0.26% | 0.26%(c) | 1.23% | 18% | $40,391 |
| Year Ended 1/31/2017 | $13.11 | 15.98% | 0.27% | 0.27%(c) | 1.27% | 54% | $22,765 |
| Year Ended 1/31/2016 | $11.64 | (6.48%) | 0.24% | 0.24%(c) | 1.73% | 75% | $24,809 |
| Institutional 2 Class |
| Year Ended 1/31/2020 | $16.00 | 17.29% | 0.18% | 0.18% | 1.48% | 17% | $2,023 |
| Year Ended 1/31/2019 | $14.54 | (8.21%) | 0.21% | 0.21% | 1.38% | 17% | $1,823 |
| Year Ended 1/31/2018 | $17.16 | 30.88% | 0.21% | 0.21% | 1.27% | 18% | $603 |
| Year Ended 1/31/2017 | $13.33 | 16.04% | 0.18% | 0.18% | 1.53% | 54% | $607 |
| Year Ended 1/31/2016 | $11.83 | (6.32%) | 0.14% | 0.14% | 2.15% | 75% | $340 |
The accompanying Notes to Financial Statements are an integral part of this statement.
Columbia Global Strategic Equity Fund | Annual Report 2020
| 23 |
Financial Highlights (continued)
| | Net asset value,
beginning of
period | Net
investment
income | Net
realized
and
unrealized
gain (loss) | Total from
investment
operations | Distributions
from net
investment
income | Distributions
from net
realized
gains | Total
distributions to
shareholders |
| Institutional 3 Class |
| Year Ended 1/31/2020 | $14.36 | 0.23 | 2.22 | 2.45 | (0.25) | (0.77) | (1.02) |
| Year Ended 1/31/2019 | $16.96 | 0.20 | (1.65) | (1.45) | (0.42) | (0.73) | (1.15) |
| Year Ended 1/31/2018(e) | $13.64 | 0.36 | 3.21 | 3.57 | (0.25) | — | (0.25) |
| Class R |
| Year Ended 1/31/2020 | $13.58 | 0.14 | 2.08 | 2.22 | (0.18) | (0.77) | (0.95) |
| Year Ended 1/31/2019 | $16.13 | 0.13 | (1.60) | (1.47) | (0.35) | (0.73) | (1.08) |
| Year Ended 1/31/2018 | $12.54 | 0.08 | 3.68 | 3.76 | (0.17) | — | (0.17) |
| Year Ended 1/31/2017 | $11.19 | 0.08 | 1.60 | 1.68 | (0.01) | (0.32) | (0.33) |
| Year Ended 1/31/2016 | $15.19 | 0.19 | (0.98) | (0.79) | (0.30) | (2.91) | (3.21) |
| Notes to Financial Highlights |
| (a) | In addition to the fees and expenses that the Fund bears directly, the Fund indirectly bears a pro rata share of the fees and expenses of any other funds in which it invests. Such indirect expenses are not included in the Fund’s reported expense ratios. |
| (b) | Total net expenses include the impact of certain fee waivers/expense reimbursements made by the Investment Manager and certain of its affiliates, if applicable. |
| (c) | The benefits derived from expense reductions had an impact of less than 0.01%. |
| (d) | Rounds to zero. |
| (e) | Institutional 3 Class shares commenced operations on March 1, 2017. Per share data and total return reflect activity from that date. |
| (f) | Annualized. |
The accompanying Notes to Financial Statements are an integral part of this statement.
| 24 | Columbia Global Strategic Equity Fund | Annual Report 2020 |
Financial Highlights (continued)
| | Net
asset
value,
end of
period | Total
return | Total gross
expense
ratio to
average
net assets(a) | Total net
expense
ratio to
average
net assets(a),(b) | Net investment
income
ratio to
average
net assets | Portfolio
turnover | Net
assets,
end of
period
(000’s) |
| Institutional 3 Class |
| Year Ended 1/31/2020 | $15.79 | 17.34% | 0.13% | 0.13% | 1.51% | 17% | $2,090 |
| Year Ended 1/31/2019 | $14.36 | (8.16%) | 0.16% | 0.16% | 1.32% | 17% | $2,122 |
| Year Ended 1/31/2018(e) | $16.96 | 26.47% | 0.17%(f) | 0.17%(f) | 2.52%(f) | 18% | $1,535 |
| Class R |
| Year Ended 1/31/2020 | $14.85 | 16.64% | 0.72% | 0.72%(c) | 0.98% | 17% | $383 |
| Year Ended 1/31/2019 | $13.58 | (8.70%) | 0.76% | 0.76%(c) | 0.89% | 17% | $316 |
| Year Ended 1/31/2018 | $16.13 | 30.21% | 0.76% | 0.76%(c) | 0.56% | 18% | $209 |
| Year Ended 1/31/2017 | $12.54 | 15.30% | 0.77% | 0.77%(c) | 0.68% | 54% | $872 |
| Year Ended 1/31/2016 | $11.19 | (6.91%) | 0.75% | 0.75%(c) | 1.35% | 75% | $2,254 |
The accompanying Notes to Financial Statements are an integral part of this statement.
Columbia Global Strategic Equity Fund | Annual Report 2020
| 25 |
Notes to Financial Statements
January 31, 2020
Note 1. Organization
Columbia Global Strategic Equity Fund (the Fund), a series of Columbia Funds Series Trust (the Trust), is a diversified fund. The Trust is registered under the Investment Company Act of 1940, as amended (the 1940 Act), as an open-end management investment company organized as a Delaware statutory trust.
The Fund is a “fund-of-funds”, investing significantly in affiliated funds managed by Columbia Management Investment Advisers, LLC (the Investment Manager), a wholly-owned subsidiary of Ameriprise Financial, Inc. (Ameriprise Financial), its affiliates, or third-party advised (unaffiliated) funds, including exchange-traded funds (collectively, Underlying Funds). The Fund is exposed to the same risks as the Underlying Funds in direct proportion to the allocation of its assets among the Underlying Funds. For information on the investment strategies and risks of the Underlying Funds, please refer to the Fund’s current prospectus and the prospectuses of the Underlying Funds, which are available, free of charge, from the Securities and Exchange Commission website at www.sec.gov.
Fund shares
The Trust may issue an unlimited number of shares (without par value). The Fund offers each of the share classes listed in the Statement of Assets and Liabilities. Although all share classes generally have identical voting, dividend and liquidation rights, each share class votes separately when required by the Trust’s organizational documents or by law. Each share class has its own expense and sales charge structure. Different share classes may have different minimum initial investment amounts and pay different distribution amounts to the extent the expenses of distributing such share classes vary. Distributions to shareholders in a liquidation will be proportional to the net asset value of each share class.
As described in the Fund’s prospectus, Class A and Class C shares are offered to the general public for investment. Class C shares automatically convert to Class A shares after 10 years. Advisor Class, Institutional Class, Institutional 2 Class, Institutional 3 Class and Class R shares are available for purchase through authorized investment professionals to omnibus retirement plans or to institutional investors and to certain other investors as also described in the Fund’s prospectus.
Note 2. Summary of significant accounting policies
Basis of preparation
The Fund is an investment company that applies the accounting and reporting guidance in the Financial Accounting Standards Board (FASB) Accounting Standards Codification Topic 946, Financial Services - Investment Companies (ASC 946). The financial statements are prepared in accordance with U.S. generally accepted accounting principles (GAAP), which requires management to make certain estimates and assumptions that affect the reported amounts of assets and liabilities, the disclosure of contingent assets and liabilities at the date of the financial statements and the reported amounts of income and expenses during the reporting period. Actual results could differ from those estimates.
The following is a summary of significant accounting policies followed by the Fund in the preparation of its financial statements.
Security valuation
All equity securities and exchange-traded funds are valued at the close of business of the New York Stock Exchange. Equity securities and exchange-traded funds are valued at the official closing price on the principal exchange or market on which they trade. Unlisted securities or listed securities for which there were no sales during the day are valued at the mean of the latest quoted bid and ask prices on such exchanges or markets.
Foreign equity securities are valued based on the closing price on the foreign exchange in which such securities are primarily traded. If any foreign equity security closing prices are not readily available, the securities are valued at the mean of the latest quoted bid and ask prices on such exchanges or markets. Foreign currency exchange rates are determined at the scheduled closing time of the New York Stock Exchange. Many securities markets and exchanges outside the U.S. close prior to the close of the New York Stock Exchange; therefore, the closing prices for securities in such markets or on such exchanges may not fully reflect events that occur after such close but before the close of the New York Stock Exchange. In those situations, foreign securities will be fair valued pursuant to a policy adopted by the Board of Trustees. Under the policy, the Fund may utilize a third-party pricing service to determine these fair values. The third-party pricing service takes into account multiple
| 26 | Columbia Global Strategic Equity Fund | Annual Report 2020 |
Notes to Financial Statements (continued)
January 31, 2020
factors, including, but not limited to, movements in the U.S. securities markets, certain depositary receipts, futures contracts and foreign exchange rates that have occurred subsequent to the close of the foreign exchange or market, to determine a good faith estimate that reasonably reflects the current market conditions as of the close of the New York Stock Exchange. The fair value of a security is likely to be different from the quoted or published price, if available.
Investments in the Underlying Funds, with the exception of exchange-traded funds, are valued at the net asset value of the applicable class of the Underlying Fund determined as of the close of the New York Stock Exchange on the valuation date.
Forward foreign currency exchange contracts are marked-to-market based upon foreign currency exchange rates provided by a pricing service.
Investments for which market quotations are not readily available, or that have quotations which management believes are not reflective of market value or reliable, are valued at fair value as determined in good faith under procedures approved by and under the general supervision of the Board of Trustees. If a security or class of securities (such as foreign securities) is valued at fair value, such value is likely to be different from the quoted or published price for the security, if available.
The determination of fair value often requires significant judgment. To determine fair value, management may use assumptions including but not limited to future cash flows and estimated risk premiums. Multiple inputs from various sources may be used to determine fair value.
GAAP requires disclosure regarding the inputs and valuation techniques used to measure fair value and any changes in valuation inputs or techniques. In addition, investments shall be disclosed by major category. This information is disclosed following the Fund’s Portfolio of Investments.
Foreign currency transactions and translations
The values of all assets and liabilities denominated in foreign currencies are generally translated into U.S. dollars at exchange rates determined at the close of regular trading on the New York Stock Exchange. Net realized and unrealized gains (losses) on foreign currency transactions and translations include gains (losses) arising from the fluctuation in exchange rates between trade and settlement dates on securities transactions, gains (losses) arising from the disposition of foreign currency and currency gains (losses) between the accrual and payment dates on dividends, interest income and foreign withholding taxes.
For financial statement purposes, the Fund does not distinguish that portion of gains (losses) on investments which is due to changes in foreign exchange rates from that which is due to changes in market prices of the investments. Such fluctuations are included with the net realized and unrealized gains (losses) on investments in the Statement of Operations.
Derivative instruments
The Fund invests in certain derivative instruments, as detailed below, to meet its investment objectives. Derivatives are instruments whose values depend on, or are derived from, in whole or in part, the value of one or more securities, currencies, commodities, indices, or other assets or instruments. Derivatives may be used to increase investment flexibility (including to maintain cash reserves while maintaining desired exposure to certain assets), for risk management (hedging) purposes, to facilitate trading, to reduce transaction costs and to pursue higher investment returns. The Fund may also use derivative instruments to mitigate certain investment risks, such as foreign currency exchange rate risk, interest rate risk and credit risk. Derivatives may involve various risks, including the potential inability of the counterparty to fulfill its obligations under the terms of the contract, the potential for an illiquid secondary market (making it difficult for the Fund to sell or terminate, including at favorable prices) and the potential for market movements which may expose the Fund to gains or losses in excess of the amount shown in the Statement of Assets and Liabilities. The notional amounts of derivative instruments, if applicable, are not recorded in the financial statements.
A derivative instrument may suffer a marked-to-market loss if the value of the contract decreases due to an unfavorable change in the market rates or values of the underlying instrument. Losses can also occur if the counterparty does not perform its obligations under the contract. The Fund’s risk of loss from counterparty credit risk on over-the-counter derivatives is generally limited to the aggregate unrealized gain netted against any collateral held by the Fund and the amount of any variation margin held by the counterparty, plus any replacement costs or related amounts. With exchange-traded or centrally
Columbia Global Strategic Equity Fund | Annual Report 2020
| 27 |
Notes to Financial Statements (continued)
January 31, 2020
cleared derivatives, there is reduced counterparty credit risk to the Fund since the clearinghouse or central counterparty (CCP) provides some protection in the case of clearing member default. The clearinghouse or CCP stands between the buyer and the seller of the contract; therefore, additional counterparty credit risk is failure of the clearinghouse or CCP. However, credit risk still exists in exchange-traded or centrally cleared derivatives with respect to initial and variation margin that is held in a broker’s customer account. While brokers are required to segregate customer margin from their own assets, in the event that a broker becomes insolvent or goes into bankruptcy and at that time there is a shortfall in the aggregate amount of margin held by the broker for all its clients, U.S. bankruptcy laws will typically allocate that shortfall on a pro-rata basis across all the broker’s customers (including the Fund), potentially resulting in losses to the Fund.
In order to better define its contractual rights and to secure rights that will help the Fund mitigate its counterparty risk, the Fund may enter into an International Swaps and Derivatives Association, Inc. Master Agreement (ISDA Master Agreement) or similar agreement with its derivatives contract counterparties. An ISDA Master Agreement is an agreement between the Fund and a counterparty that governs over-the-counter derivatives and typically contains, among other things, collateral posting terms and netting provisions in the event of a default and/or termination event. Under an ISDA Master Agreement, the Fund may, under certain circumstances, offset with the counterparty certain derivative instrument’s payables and/or receivables with collateral held and/or posted and create one single net payment. The provisions of the ISDA Master Agreement typically permit a single net payment in the event of default (close-out netting), including the bankruptcy or insolvency of the counterparty. Note, however, that bankruptcy or insolvency laws of a particular jurisdiction may impose restrictions on or prohibitions against the right of offset or netting in bankruptcy, insolvency or other events.
Collateral (margin) requirements differ by type of derivative. Margin requirements are established by the clearinghouse or CCP for exchange-traded and centrally cleared derivatives. Brokers can ask for margin in excess of the minimum in certain circumstances. Collateral terms are contract specific for over-the-counter derivatives. For over-the-counter derivatives traded under an ISDA Master Agreement, the collateral requirements are typically calculated by netting the marked-to-market amount for each transaction under such agreement and comparing that amount to the value of any variation margin currently pledged by the Fund and/or the counterparty. Generally, the amount of collateral due from or to a party has to exceed a minimum transfer amount threshold (e.g., $250,000) before a transfer has to be made. To the extent amounts due to the Fund from its counterparties are not fully collateralized, contractually or otherwise, the Fund bears the risk of loss from counterparty nonperformance. The Fund may also pay interest expense on cash collateral received from the broker. Any interest expense paid by the Fund is shown on the Statement of Operations. The Fund attempts to mitigate counterparty risk by only entering into agreements with counterparties that it believes have the financial resources to honor their obligations and by monitoring the financial stability of those counterparties.
Certain ISDA Master Agreements allow counterparties of over-the-counter derivatives transactions to terminate derivatives contracts prior to maturity in the event the Fund’s net asset value declines by a stated percentage over a specified time period or if the Fund fails to meet certain terms of the ISDA Master Agreement, which would cause the Fund to accelerate payment of any net liability owed to the counterparty. The Fund also has termination rights if the counterparty fails to meet certain terms of the ISDA Master Agreement. In determining whether to exercise such termination rights, the Fund would consider, in addition to counterparty credit risk, whether termination would result in a net liability owed from the counterparty.
For financial reporting purposes, the Fund does not offset derivative assets and derivative liabilities that are subject to netting arrangements in the Statement of Assets and Liabilities.
Forward foreign currency exchange contracts
Forward foreign currency exchange contracts are over-the-counter agreements between two parties to buy and sell a currency at a set price on a future date. The Fund utilized forward foreign currency exchange contracts to hedge the currency exposure associated with some or all of the Fund’s securities, to shift investment exposure from one currency to another, to shift U.S. dollar exposure to achieve a representative weighted mix of major currencies in its benchmark and to recover an underweight country exposure in its portfolio. These instruments may be used for other purposes in future periods.
| 28 | Columbia Global Strategic Equity Fund | Annual Report 2020 |
Notes to Financial Statements (continued)
January 31, 2020
The values of forward foreign currency exchange contracts fluctuate daily with changes in foreign currency exchange rates. Changes in the value of these contracts are recorded as unrealized appreciation or depreciation until the contract is exercised or has expired. The Fund will realize a gain or loss when the forward foreign currency exchange contract is closed or expires. Non-deliverable forward foreign currency exchange contracts are settled with the counterparty in U.S. dollars without delivery of foreign currency.
The use of forward foreign currency exchange contracts does not eliminate fluctuations in the prices of the Fund’s portfolio securities. The risks of forward foreign currency exchange contracts include movement in the values of the foreign currencies relative to the U.S. dollar (or other foreign currencies) and the possibility that counterparties will not complete their contractual obligations, which may be in excess of the amount reflected, if any, in the Statement of Assets and Liabilities.
Effects of derivative transactions in the financial statements
The following tables are intended to provide additional information about the effect of derivatives on the financial statements of the Fund, including: the fair value of derivatives by risk category and the location of those fair values in the Statement of Assets and Liabilities; and the impact of derivative transactions over the period in the Statement of Operations, including realized and unrealized gains (losses). The derivative instrument schedules following the Portfolio of Investments present additional information regarding derivative instruments outstanding at the end of the period, if any.
The following table is a summary of the fair value of derivative instruments (not considered to be hedging instruments for accounting disclosure purposes) at January 31, 2020:
| | Asset derivatives | |
Risk exposure
category | Statement
of assets and liabilities
location | Fair value ($) |
| Foreign exchange risk | Unrealized appreciation on forward foreign currency exchange contracts | 9,540 |
| | Liability derivatives | |
Risk exposure
category | Statement
of assets and liabilities
location | Fair value ($) |
| Foreign exchange risk | Unrealized depreciation on forward foreign currency exchange contracts | 4,117 |
The following table indicates the effect of derivative instruments (not considered to be hedging instruments for accounting disclosure purposes) in the Statement of Operations for the year ended January 31, 2020:
| Amount of realized gain (loss) on derivatives recognized in income |
| Risk exposure category | Forward
foreign
currency
exchange
contracts
($) |
| Foreign exchange risk | 16,998 |
| |
| Change in unrealized appreciation (depreciation) on derivatives recognized in income |
| Risk exposure category | Forward
foreign
currency
exchange
contracts
($) |
| Foreign exchange risk | 7,392 |
Columbia Global Strategic Equity Fund | Annual Report 2020
| 29 |
Notes to Financial Statements (continued)
January 31, 2020
The following table is a summary of the average outstanding volume by derivative instrument for the year ended January 31, 2020:
| Derivative instrument | Average unrealized
appreciation ($)* | Average unrealized
depreciation ($)* |
| Forward foreign currency exchange contracts | 4,887 | (3,556) |
| * | Based on the ending quarterly outstanding amounts for the year ended January 31, 2020. |
Offsetting of assets and liabilities
The following table presents the Fund’s gross and net amount of assets and liabilities available for offset under netting arrangements as well as any related collateral received or pledged by the Fund as of January 31, 2020:
| | Morgan
Stanley ($) |
| Assets | |
| Forward foreign currency exchange contracts | 9,540 |
| Liabilities | |
| Forward foreign currency exchange contracts | 4,117 |
| Total financial and derivative net assets | 5,423 |
| Total collateral received (pledged) (a) | - |
| Net amount (b) | 5,423 |
| (a) | In some instances, the actual collateral received and/or pledged may be more than the amount shown due to overcollateralization. |
| (b) | Represents the net amount due from/(to) counterparties in the event of default. |
Security transactions
Security transactions are accounted for on the trade date. Cost is determined and gains (losses) are based upon the specific identification method for both financial statement and federal income tax purposes.
Income recognition
Corporate actions and dividend income are generally recorded net of any non-reclaimable tax withholdings, on the ex-dividend date or upon receipt of ex-dividend notification in the case of certain foreign securities.
The Fund may receive distributions from holdings in equity securities, business development companies (BDCs), exchange-traded funds (ETFs), limited partnerships (LPs), other regulated investment companies (RICs), and real estate investment trusts (REITs), which report information as to the tax character of their distributions annually. These distributions are allocated to dividend income, capital gain and return of capital based on actual information reported. Return of capital is recorded as a reduction of the cost basis of securities held. If the Fund no longer owns the applicable securities, return of capital is recorded as a realized gain. With respect to REITs, to the extent actual information has not yet been reported, estimates for return of capital are made by Columbia Management Investment Advisers, LLC (the Investment Manager), a wholly-owned subsidiary of Ameriprise Financial, Inc. (Ameriprise Financial). The Investment Manager’s estimates are subsequently adjusted when the actual character of the distributions is disclosed by the REITs, which could result in a proportionate change in return of capital to shareholders.
Awards from class action litigation are recorded as a reduction of cost basis if the Fund still owns the applicable securities on the payment date. If the Fund no longer owns the applicable securities on the payment date, the proceeds are recorded as realized gains.
Income and capital gain distributions from the Underlying Funds, if any, are recorded on the ex-dividend date.
Expenses
General expenses of the Trust are allocated to the Fund and other funds of the Trust based upon relative net assets or other expense allocation methodologies determined by the nature of the expense. Expenses directly attributable to the Fund are charged to the Fund. Expenses directly attributable to a specific class of shares are charged to that share class.
| 30 | Columbia Global Strategic Equity Fund | Annual Report 2020 |
Notes to Financial Statements (continued)
January 31, 2020
Determination of class net asset value
All income, expenses (other than class-specific expenses, which are charged to that share class, as shown in the Statement of Operations) and realized and unrealized gains (losses) are allocated to each class of the Fund on a daily basis, based on the relative net assets of each class, for purposes of determining the net asset value of each class.
Federal income tax status
The Fund intends to qualify each year as a regulated investment company under Subchapter M of the Internal Revenue Code, as amended, and will distribute substantially all of its investment company taxable income and net capital gain, if any, for its tax year, and as such will not be subject to federal income taxes. In addition, the Fund intends to distribute in each calendar year substantially all of its ordinary income, capital gain net income and certain other amounts, if any, such that the Fund should not be subject to federal excise tax. Therefore, no federal income or excise tax provision is recorded.
Foreign taxes
The Fund may be subject to foreign taxes on income, gains on investments or currency repatriation, a portion of which may be recoverable. The Fund will accrue such taxes and recoveries, as applicable, based upon its current interpretation of tax rules and regulations that exist in the markets in which it invests.
Realized gains in certain countries may be subject to foreign taxes at the Fund level, based on statutory rates. The Fund accrues for such foreign taxes on realized and unrealized gains at the appropriate rate for each jurisdiction, as applicable. The amount, if any, is disclosed as a liability on the Statement of Assets and Liabilities.
Distributions to shareholders
Distributions from net investment income, if any, are declared and paid each calendar quarter. Net realized capital gains, if any, are distributed at least annually. Income distributions and capital gain distributions are determined in accordance with federal income tax regulations, which may differ from GAAP.
Guarantees and indemnifications
Under the Trust’s organizational documents and, in some cases, by contract, its officers and trustees are indemnified against certain liabilities arising out of the performance of their duties to the Trust or its funds. In addition, certain of the Fund’s contracts with its service providers contain general indemnification clauses. The Fund’s maximum exposure under these arrangements is unknown since the amount of any future claims that may be made against the Fund cannot be determined, and the Fund has no historical basis for predicting the likelihood of any such claims.
Note 3. Fees and other transactions with affiliates
Management services fees and underlying fund fees
The Fund has entered into a Management Agreement with Columbia Management Investment Advisers, LLC (the Investment Manager). Under the Management Agreement, the Investment Manager provides the Fund with investment research and advice, as well as administrative and accounting services. The management services fee is an annual fee that is a blend of (i) 0.02% on net assets invested in Columbia proprietary funds (excluding any underlying funds that do not pay a management services fee (or investment advisory services fee, as applicable) to the Investment Manager), (ii) 0.12% on net assets invested in non-exchange-traded third-party advised mutual funds and (iii) 0.57% on net assets invested in all other securities, instruments and other assets not described above, including other funds advised by the Investment Manager that do not pay a management services fee (or investment advisory services fee, as applicable), exchange-traded funds, derivatives and individual securities. The effective management services fee rate for the year ended January 31, 2020 was 0.07% of the Fund’s average daily net assets.
In addition to the fees and expenses which the Fund bears directly, the Fund indirectly bears a pro rata share of the fees and expenses of the Underlying Funds in which the Fund invests. Because the Underlying Funds have varied expense and fee levels and the Fund may own different proportions of Underlying Funds at different times, the amount of fees and expenses incurred indirectly by the Fund will vary. These expenses are not reflected in the expenses shown in Statement of Operations and are not included in the ratios to average net assets shown in the Financial Highlights.
Columbia Global Strategic Equity Fund | Annual Report 2020
| 31 |
Notes to Financial Statements (continued)
January 31, 2020
Participating Affiliates
The Investment Manager and its investment advisory affiliates (Participating Affiliates) around the world may coordinate in providing services to their clients. From time to time the Investment Manager (or any affiliated investment subadviser to the Fund, as the case may be) may engage its Participating Affiliates to provide a variety of services such as investment research, investment monitoring, trading and discretionary investment management (including portfolio management) to certain accounts managed by the Investment Manager, including the Fund. These Participating Affiliates provide services to the Investment Manager (or any affiliated investment subadviser to the Fund as the case may be) either pursuant to subadvisory agreements, personnel-sharing agreements or similar inter-company arrangements and the Fund pays no additional fees and expenses as a result of any such arrangements.
These Participating Affiliates, like the Investment Manager, are direct or indirect subsidiaries of Ameriprise Financial and are registered, as appropriate, with respective regulators in their home jurisdictions and, where required, the Securities and Exchange Commission and the Commodity Futures Trading Commission in the United States.
Pursuant to some of these arrangements, certain employees of these Participating Affiliates may serve as "associated persons" of the Investment Manager and, in this capacity, subject to the oversight and supervision of the Investment Manager and consistent with the investment objectives, policies and limitations set forth in the Fund’s prospectus and Statement of Additional Information (SAI), may provide such services to the Fund on behalf of the Investment Manager.
Compensation of board members
Members of the Board of Trustees who are not officers or employees of the Investment Manager or Ameriprise Financial are compensated for their services to the Fund as disclosed in the Statement of Operations. Under a Deferred Compensation Plan (the Deferred Plan), these members of the Board of Trustees may elect to defer payment of up to 100% of their compensation. Deferred amounts are treated as though equivalent dollar amounts had been invested in shares of certain funds managed by the Investment Manager. The Fund’s liability for these amounts is adjusted for market value changes and remains in the Fund until distributed in accordance with the Deferred Plan. All amounts payable under the Deferred Plan constitute a general unsecured obligation of the Fund.
Compensation of Chief Compliance Officer
The Board of Trustees has appointed a Chief Compliance Officer for the Fund in accordance with federal securities regulations. As disclosed in the Statement of Operations, a portion of the Chief Compliance Officer’s total compensation is allocated to the Fund, along with other allocations to affiliated registered investment companies managed by the Investment Manager and its affiliates, based on relative net assets.
Transfer agency fees
Under a Transfer and Dividend Disbursing Agent Agreement, Columbia Management Investment Services Corp. (the Transfer Agent), an affiliate of the Investment Manager and a wholly-owned subsidiary of Ameriprise Financial, is responsible for providing transfer agency services to the Fund. The Transfer Agent has contracted with DST Asset Manager Solutions, Inc. (DST) to serve as sub-transfer agent. The Transfer Agent pays the fees of DST for services as sub-transfer agent and DST is not entitled to reimbursement for such fees from the Fund (with the exception of out-of-pocket fees).
The Fund pays the Transfer Agent a monthly transfer agency fee based on the number or the average value of accounts, depending on the type of account. In addition, the Fund pays the Transfer Agent a fee for shareholder services based on the number of accounts or on a percentage of the average aggregate value of the Fund’s shares maintained in omnibus accounts up to the lesser of the amount charged by the financial intermediary or a cap established by the Board of Trustees from time to time.
The Transfer Agent also receives compensation from the Fund for various shareholder services and reimbursements for certain out-of-pocket fees. Total transfer agency fees for Institutional 2 Class and Institutional 3 Class shares are subject to an annual limitation of not more than 0.07% and 0.02%, respectively, of the average daily net assets attributable to each share class.
| 32 | Columbia Global Strategic Equity Fund | Annual Report 2020 |
Notes to Financial Statements (continued)
January 31, 2020
For the year ended January 31, 2020, the Fund’s effective transfer agency fee rates as a percentage of average daily net assets of each class were as follows:
| | Effective rate (%) |
| Class A | 0.11 |
| Advisor Class | 0.11 |
| Class C | 0.11 |
| Institutional Class | 0.11 |
| Institutional 2 Class | 0.06 |
| Institutional 3 Class | 0.01 |
| Class R | 0.11 |
An annual minimum account balance fee of $20 may apply to certain accounts with a value below the applicable share class’s initial minimum investment requirements to reduce the impact of small accounts on transfer agency fees. These minimum account balance fees are remitted to the Fund and recorded as part of expense reductions in the Statement of Operations. For the year ended January 31, 2020, these minimum account balance fees reduced total expenses of the Fund by $520.
Distribution and service fees
The Fund has entered into an agreement with Columbia Management Investment Distributors, Inc. (the Distributor), an affiliate of the Investment Manager and a wholly-owned subsidiary of Ameriprise Financial, for distribution and shareholder services. The Board of Trustees has approved, and the Fund has adopted, distribution and shareholder service plans (the Plans) applicable to certain share classes, which set the distribution and service fees for the Fund. These fees are calculated daily and are intended to compensate the Distributor and/or eligible selling and/or servicing agents for selling shares of the Fund and providing services to investors.
Under the Plans, the Fund pays a monthly combined distribution and service fee to the Distributor at the maximum annual rate of 0.25% of the average daily net assets attributable to Class A shares of the Fund. Also under the Plans, the Fund pays a monthly service fee to the Distributor at the maximum annual rate of 0.25% of the average daily net assets attributable to Class C shares of the Fund and a monthly distribution fee to the Distributor at the maximum annual rates of 0.75% and 0.50% of the average daily net assets attributable to Class C and Class R shares of the Fund, respectively.
Sales charges (unaudited)
Sales charges, including front-end charges and contingent deferred sales charges (CDSCs), received by the Distributor for distributing Fund shares for the year ended January 31, 2020, if any, are listed below:
| | Front End (%) | CDSC (%) | Amount ($) |
| Class A | 5.75 | 0.50 - 1.00(a) | 274,367 |
| Class C | — | 1.00(b) | 2,704 |
| (a) | This charge is imposed on certain investments of between $1 million and $50 million redeemed within 18 months after purchase, as follows: 1.00% if redeemed within 12 months after purchase, and 0.50% if redeemed more than 12, but less than 18, months after purchase, with certain limited exceptions. |
| (b) | This charge applies to redemptions within 12 months after purchase, with certain limited exceptions. |
The Fund’s other share classes are not subject to sales charges.
Columbia Global Strategic Equity Fund | Annual Report 2020
| 33 |
Notes to Financial Statements (continued)
January 31, 2020
Expenses waived/reimbursed by the Investment Manager and its affiliates
The Investment Manager and certain of its affiliates have contractually agreed to waive fees and/or reimburse expenses (excluding certain fees and expenses described below) for the period(s) disclosed below, unless sooner terminated at the sole discretion of the Board of Trustees, so that the Fund’s net operating expenses, after giving effect to fees waived/expenses reimbursed and any balance credits and/or overdraft charges from the Fund’s custodian, do not exceed the following annual rate(s) as a percentage of the class’ average daily net assets:
| | Contractual
expense cap
July 1, 2019
through
May 31, 2020 | Voluntary
expense cap
June 1, 2019
through
June 30, 2019 | Contractual
expense cap
prior to
June 1, 2019 |
| Class A | 0.50% | 0.50% | 0.50% |
| Advisor Class | 0.25 | 0.25 | 0.25 |
| Class C | 1.25 | 1.25 | 1.25 |
| Institutional Class | 0.25 | 0.25 | 0.25 |
| Institutional 2 Class | 0.20 | 0.22 | 0.22 |
| Institutional 3 Class | 0.15 | 0.16 | 0.16 |
| Class R | 0.75 | 0.75 | 0.75 |
Under the agreement governing these fee waivers and/or expense reimbursement arrangements, the following fees and expenses are excluded from the waiver/reimbursement commitment, and therefore will be paid by the Fund, if applicable: taxes (including foreign transaction taxes), expenses associated with investments in affiliated and non-affiliated pooled investment vehicles (including mutual funds and exchange-traded funds), transaction costs and brokerage commissions, costs related to any securities lending program, dividend expenses associated with securities sold short, inverse floater program fees and expenses, transaction charges and interest on borrowed money, interest, infrequent and/or unusual expenses and any other expenses the exclusion of which is specifically approved by the Board of Trustees. This agreement may be modified or amended only with approval from the Investment Manager, certain of its affiliates and the Fund. The Fund’s management services fee is also excluded from the waiver/reimbursement commitment and is therefore paid by the Fund. Any fees waived and/or expenses reimbursed under the expense reimbursement arrangements described above are not recoverable by the Investment Manager or its affiliates in future periods.
Note 4. Federal tax information
The timing and character of income and capital gain distributions are determined in accordance with income tax regulations, which may differ from GAAP because of temporary or permanent book to tax differences.
At January 31, 2020, these differences were primarily due to differing treatment for deferral/reversal of wash sale losses, trustees’ deferred compensation, derivative investments, re-characterization of distributions for investments, foreign currency transactions, and passive foreign investment company (PFIC) holdings. To the extent these differences were permanent, reclassifications were made among the components of the Fund’s net assets. Temporary differences do not require reclassifications.
The following reclassifications were made:
Undistributed net
investment
income ($) | Accumulated
net realized
gain ($) | Paid in
capital ($) |
| 1,623,368 | (1,623,367) | (1) |
Net investment income (loss) and net realized gains (losses), as disclosed in the Statement of Operations, and net assets were not affected by this reclassification.
| 34 | Columbia Global Strategic Equity Fund | Annual Report 2020 |
Notes to Financial Statements (continued)
January 31, 2020
The tax character of distributions paid during the years indicated was as follows:
| Year Ended January 31, 2020 | Year Ended January 31, 2019 |
Ordinary
income ($) | Long-term
capital gains ($) | Total ($) | Ordinary
income ($) | Long-term
capital gains ($) | Total ($) |
| 8,680,968 | 32,365,480 | 41,046,448 | 16,684,893 | 31,131,196 | 47,816,089 |
Short-term capital gain distributions, if any, are considered ordinary income distributions for tax purposes.
At January 31, 2020, the components of distributable earnings on a tax basis were as follows:
Undistributed
ordinary income ($) | Undistributed
long-term
capital gains ($) | Capital loss
carryforwards ($) | Net unrealized
appreciation ($) |
| 708,075 | 17,341,716 | — | 90,522,506 |
At January 31, 2020, the cost of all investments for federal income tax purposes along with the aggregate gross unrealized appreciation and depreciation based on that cost was:
Federal
tax cost ($) | Gross unrealized
appreciation ($) | Gross unrealized
(depreciation) ($) | Net unrealized
appreciation ($) |
| 542,064,788 | 95,057,797 | (4,535,291) | 90,522,506 |
Tax cost of investments and unrealized appreciation/(depreciation) may also include timing differences that do not constitute adjustments to tax basis.
Management of the Fund has concluded that there are no significant uncertain tax positions in the Fund that would require recognition in the financial statements. However, management’s conclusion may be subject to review and adjustment at a later date based on factors including, but not limited to, new tax laws, regulations, and administrative interpretations (including relevant court decisions). Generally, the Fund’s federal tax returns for the prior three fiscal years remain subject to examination by the Internal Revenue Service.
Note 5. Portfolio information
The cost of purchases and proceeds from sales of securities, excluding short-term investments and derivatives, if any, aggregated to $103,007,132 and $151,413,806, respectively, for the year ended January 31, 2020. The amount of purchase and sale activity impacts the portfolio turnover rate reported in the Financial Highlights.
Note 6. Affiliated money market fund
The Fund invests in Columbia Short-Term Cash Fund, an affiliated money market fund established for the exclusive use by the Fund and other affiliated funds (the Affiliated MMF). The income earned by the Fund from such investments is included as Dividends - affiliated issuers in the Statement of Operations. As an investing fund, the Fund indirectly bears its proportionate share of the expenses of the Affiliated MMF. The Affiliated MMF prices its shares with a floating net asset value. In addition, the Board of Trustees of the Affiliated MMF may impose a fee on redemptions (sometimes referred to as a liquidity fee) or temporarily suspend redemptions (sometimes referred to as imposing a redemption gate) in the event its liquidity falls below regulatory limits.
Note 7. Interfund lending
Pursuant to an exemptive order granted by the Securities and Exchange Commission, the Fund participates in a program (the Interfund Program) allowing each participating Columbia Fund (each, a Participating Fund) to lend money directly to and, except for closed-end funds and money market funds, borrow money directly from other Participating Funds for temporary purposes. The amounts eligible for borrowing and lending under the Interfund Program are subject to certain restrictions.
Columbia Global Strategic Equity Fund | Annual Report 2020
| 35 |
Notes to Financial Statements (continued)
January 31, 2020
Interfund loans are subject to the risk that the borrowing fund could be unable to repay the loan when due, and a delay in repayment to the lending fund could result in lost opportunities and/or additional lending costs. The exemptive order is subject to conditions intended to mitigate conflicts of interest arising from the Investment Manager’s relationship with each Participating Fund.
The Fund did not borrow or lend money under the Interfund Program during the year ended January 31, 2020.
Note 8. Line of credit
The Fund has access to a revolving credit facility with a syndicate of banks led by Citibank, N.A., HSBC Bank USA, N.A. and JPMorgan Chase Bank, N.A. whereby the Fund may borrow for the temporary funding of shareholder redemptions or for other temporary or emergency purposes. The credit facility, which is a collective agreement between the Fund and certain other funds managed by the Investment Manager or an affiliated investment manager, severally and not jointly, permits collective borrowings up to $1 billion. Interest is charged to each participating fund based on its borrowings at a rate equal to the higher of (i) the federal funds effective rate, (ii) the one-month LIBOR rate and (iii) the overnight bank funding rate, plus in each case, 1.00%. Each borrowing under the credit facility matures no later than 60 days after the date of borrowing. The Fund also pays a commitment fee equal to its pro rata share of the unused amount of the credit facility at a rate of 0.15% per annum. The commitment fee is included in other expenses in the Statement of Operations. This agreement expires annually in December unless extended or renewed.
The Fund had no borrowings during the year ended January 31, 2020.
Note 9. Significant risks
Market risk
The market values of securities or other investments that the Fund holds may fall, sometimes rapidly or unpredictably, or fail to rise for various reasons including changes or potential or perceived changes in U.S. or foreign economies, financial markets, interest rates, the liquidity of investments and other factors including terrorism, war, natural disasters and disease/virus epidemics. From time to time, certain market segments (such as equity or fixed income), investment styles (such as growth or value), or other investment categories, may fall out of favor which may impair the value of an investment in the Fund. An investment in the Fund could lose money over short or even long periods.
Shareholder concentration risk
At January 31, 2020, one unaffiliated shareholder of record owned 20.0% of the outstanding shares of the Fund in one or more accounts. The Fund has no knowledge about whether any portion of those shares was owned beneficially. Affiliated shareholders of record owned 58.3% of the outstanding shares of the Fund in one or more accounts. Subscription and redemption activity by concentrated accounts may have a significant effect on the operations of the Fund. In the case of a large redemption, the Fund may be forced to sell investments at inopportune times, including its liquid positions, which may result in Fund losses and the Fund holding a higher percentage of less liquid positions. Large redemptions could result in decreased economies of scale and increased operating expenses for non-redeeming Fund shareholders.
Note 10. Subsequent events
Management has evaluated the events and transactions that have occurred through the date the financial statements were issued. Other than as noted below, there were no items requiring adjustment of the financial statements or additional disclosure.
In February 2020, the Board of Trustees approved an Agreement and Plan of Reorganization to reorganize Columbia Global Strategic Equity Fund with and into Columbia Capital Allocation Aggressive Portfolio. Pursuant to applicable law (including the 1940 Act) the reorganization may be implemented without shareholder approval. The reorganization is expected to occur in the third quarter of 2020 and are expected to be a tax-free reorganization for U.S. federal income tax purposes.
| 36 | Columbia Global Strategic Equity Fund | Annual Report 2020 |
Notes to Financial Statements (continued)
January 31, 2020
Note 11. Information regarding pending and settled legal proceedings
Ameriprise Financial and certain of its affiliates have historically been involved in a number of legal, arbitration and regulatory proceedings, including routine litigation, class actions, and governmental actions, concerning matters arising in connection with the conduct of their business activities. Ameriprise Financial believes that the Fund is not currently the subject of, and that neither Ameriprise Financial nor any of its affiliates are the subject of, any pending legal, arbitration or regulatory proceedings that are likely to have a material adverse effect on the Fund or the ability of Ameriprise Financial or its affiliates to perform under their contracts with the Fund. Ameriprise Financial is required to make quarterly (10-Q), annual (10-K) and, as necessary, 8-K filings with the Securities and Exchange Commission (SEC) on legal and regulatory matters that relate to Ameriprise Financial and its affiliates. Copies of these filings may be obtained by accessing the SEC website at www.sec.gov.
There can be no assurance that these matters, or the adverse publicity associated with them, will not result in increased Fund redemptions, reduced sale of Fund shares or other adverse consequences to the Fund. Further, although we believe proceedings are not likely to have a material adverse effect on the Fund or the ability of Ameriprise Financial or its affiliates to perform under their contracts with the Fund, these proceedings are subject to uncertainties and, as such, we are unable to estimate the possible loss or range of loss that may result. An adverse outcome in one or more of these proceedings could result in adverse judgments, settlements, fines, penalties or other relief that could have a material adverse effect on the consolidated financial condition or results of operations of Ameriprise Financial.
Columbia Global Strategic Equity Fund | Annual Report 2020
| 37 |
Report of Independent Registered Public Accounting Firm
To the Board of Trustees of Columbia Funds Series Trust and Shareholders of Columbia Global Strategic Equity Fund
Opinion on the Financial Statements
We have audited the accompanying statement of assets and liabilities, including the portfolio of investments, of Columbia Global Strategic Equity Fund (one of the funds constituting Columbia Funds Series Trust, referred to hereafter as the "Fund") as of January 31, 2020, the related statement of operations for the year ended January 31, 2020, the statement of changes in net assets for each of the two years in the period ended January 31, 2020, including the related notes, and the financial highlights for each of the periods indicated therein (collectively referred to as the “financial statements”). In our opinion, the financial statements present fairly, in all material respects, the financial position of the Fund as of January 31, 2020, the results of its operations for the year then ended, the changes in its net assets for each of the two years in the period ended January 31, 2020 and the financial highlights for each of the periods indicated therein in conformity with accounting principles generally accepted in the United States of America.
Basis for Opinion
These financial statements are the responsibility of the Fund’s management. Our responsibility is to express an opinion on the Fund’s financial statements based on our audits. We are a public accounting firm registered with the Public Company Accounting Oversight Board (United States) (PCAOB) and are required to be independent with respect to the Fund in accordance with the U.S. federal securities laws and the applicable rules and regulations of the Securities and Exchange Commission and the PCAOB.
We conducted our audits of these financial statements in accordance with the standards of the PCAOB. Those standards require that we plan and perform the audit to obtain reasonable assurance about whether the financial statements are free of material misstatement, whether due to error or fraud.
Our audits included performing procedures to assess the risks of material misstatement of the financial statements, whether due to error or fraud, and performing procedures that respond to those risks. Such procedures included examining, on a test basis, evidence regarding the amounts and disclosures in the financial statements. Our audits also included evaluating the accounting principles used and significant estimates made by management, as well as evaluating the overall presentation of the financial statements. Our procedures included confirmation of securities owned as of January 31, 2020 by correspondence with the custodian, transfer agent and brokers; when replies were not received from brokers, we performed other auditing procedures. We believe that our audits provide a reasonable basis for our opinion.
/s/PricewaterhouseCoopers LLP
Minneapolis, Minnesota
March 24, 2020
We have served as the auditor of one or more investment companies within the Columbia Funds Complex since 1977.
| 38 | Columbia Global Strategic Equity Fund | Annual Report 2020 |
Federal Income Tax Information
(Unaudited)
The Fund hereby designates the following tax attributes for the fiscal year ended January 31, 2020. Shareholders will be notified in early 2021 of the amounts for use in preparing 2020 income tax returns.
Qualified
dividend
income | Dividends
received
deduction | Capital
gain
dividend | Foreign
taxes paid
to foreign
countries | Foreign
taxes paid
per share
to foreign
countries | Foreign
source
income | Foreign
source
income per
share |
| 100.00% | 42.48% | $32,020,156 | $595,591 | $0.01 | $5,523,270 | $0.13 |
Qualified dividend income. For taxable, non-corporate shareholders, the percentage of ordinary income distributed during the fiscal year that represents qualified dividend income subject to reduced tax rates.
Dividends received deduction. The percentage of ordinary income distributed during the fiscal year that qualifies for the corporate dividends received deduction.
Capital gain dividend. The Fund designates as a capital gain dividend the amount reflected above, or if subsequently determined to be different, the net capital gain of such fiscal period.
Foreign taxes. The Fund makes the election to pass through to shareholders the foreign taxes paid. Eligible shareholders may claim a foreign tax credit. These taxes, and the corresponding foreign source income, are provided.
TRUSTEES AND OFFICERS
The Board oversees the Fund’s operations and appoints officers who are responsible for day-to-day business decisions based on policies set by the Board. The following table provides basic biographical information about the Fund’s Trustees as of the printing of this report, including their principal occupations during the past five years, although specific titles for individuals may have varied over the period. Under current Board policy, Trustees not affiliated with the Investment Manager generally may serve through the end of the calendar year in which they reach the mandatory retirement age established by the Board.
Independent trustees
Name,
address,
year of birth | Position held
with the Trust and
length of service | Principal occupation(s)
during past five years
and other relevant
professional experience | Number of
Funds in the
Columbia Funds
Complex
overseen | Other directorships
held by Trustee
during the past
five years |
George S. Batejan
c/o Columbia Management
Investment Advisers, LLC
225 Franklin Street
Mail Drop BX32 05228
Boston, MA 02110
1953 | Trustee since 1/17 | Executive Vice President, Global Head of Technology and Operations, Janus Capital Group, Inc., 2010-2016 | 121 | Former Chairman of the Board, NICSA (National Investment Company Services Association) (Executive Committee, Nominating Committee and Governance Committee), 2014-2016; former Director, Intech Investment Management, 2011-2016; former Board Member, Metro Denver Chamber of Commerce, 2015-2016; former Advisory Board Member, University of Colorado Business School, 2015-2018 |
Columbia Global Strategic Equity Fund | Annual Report 2020
| 39 |
TRUSTEES AND OFFICERS (continued)
Independent trustees (continued)
Name,
address,
year of birth | Position held
with the Trust and
length of service | Principal occupation(s)
during past five years
and other relevant
professional experience | Number of
Funds in the
Columbia Funds
Complex
overseen | Other directorships
held by Trustee
during the past
five years |
Kathleen Blatz
c/o Columbia Management
Investment Advisers, LLC
225 Franklin Street
Mail Drop BX32 05228
Boston, MA 02110
1954 | Trustee since 1/06 for RiverSource Funds and since 6/11 for Nations Funds | Attorney; specializing in arbitration and mediation; Chief Justice, Minnesota Supreme Court, 1998-2006; Associate Justice, Minnesota Supreme Court, 1996-1998; Fourth Judicial District Court Judge, Hennepin County, 1994-1996; Attorney in private practice and public service, 1984-1993; State Representative, Minnesota House of Representatives, 1979-1993, which included service on the Tax and Financial Institutions and Insurance Committees; Member and Interim Chair, Minnesota Sports Facilities Authority, January 2017-July 2017; Interim President and Chief Executive Officer, Blue Cross and Blue Shield of Minnesota (health care insurance), February-July 2018 | 121 | Trustee, BlueCross BlueShield of Minnesota since 2009 (Chair of the Business Development Committee, 2014-2017; Chair of the Governance Committee since 2017); Chair of the Robina Foundation since August 2013; former Member and Chair of the Board, Minnesota Sports Facilities Authority, January 2017-July 2017 |
Pamela G. Carlton
c/o Columbia Management
Investment Advisers, LLC
225 Franklin Street
Mail Drop BX32 05228
Boston, MA 02110
1954 | Trustee since 7/07 for RiverSource Funds and since 6/11 for Nations Funds | President, Springboard — Partners in Cross Cultural Leadership (consulting company) since 2003; Managing Director of US Equity Research, JP Morgan Chase, 1999-2003; Director of US Equity Research, Chase Asset Management, 1996-1999; Co-Director Latin America Research, 1993-1996, COO Global Research, 1992-1996, Co-Director of US Research, 1991-1992, Investment Banker, Morgan Stanley, 1982-1991 | 121 | Trustee, New York Presbyterian Hospital Board (Executive Committee and Chair of Human Resources Committee) since 1996; Director, DR Bank (Audit Committee) since 2017; Director, Evercore Inc. (Audit Committee, Nominating and Governance Committee) since 2019 |
Patricia M. Flynn
c/o Columbia Management
Investment Advisers, LLC
225 Franklin Street
Mail Drop BX32 05228
Boston, MA 02110
1950 | Trustee since 11/04 for RiverSource Funds and since 6/11 for Nations Funds | Trustee Professor of Economics and Management, Bentley University since 1976 (also teaches and conducts research on corporate governance); Dean, McCallum Graduate School of Business, Bentley University, 1992-2002 | 121 | Trustee, MA Taxpayers Foundation since 1997; Board of Governors, Innovation Institute, MA Technology Collaborative since 2010; Board of Directors, The MA Business Roundtable 2003-2019 |
Brian J. Gallagher
c/o Columbia Management
Investment Advisers, LLC
225 Franklin Street
Mail Drop BX32 05228
Boston, MA 02110
1954 | Trustee since 12/17 | Retired; Partner with Deloitte & Touche LLP and its predecessors, 1977-2016 | 121 | Trustee, Catholic Schools Foundation since 2004 |
Catherine James Paglia
c/o Columbia Management
Investment Advisers, LLC
225 Franklin Street
Mail Drop BX32 05228
Boston, MA 02110
1952 | Chair of the Board since 1/20; Trustee since 11/04 for RiverSource Funds and since 6/11 for Nations Funds | Director, Enterprise Asset Management, Inc. (private real estate and asset management company) since September 1998; Managing Director and Partner, Interlaken Capital, Inc., 1989-1997; Managing Director, Morgan Stanley, 1982-1989; Vice President, Investment Banking, 1980-1982, Associate, Investment Banking, 1976-1980, Dean Witter Reynolds, Inc. | 121 | Director, Valmont Industries, Inc. (irrigation systems manufacturer) since 2012; Trustee, Carleton College (on the Investment Committee); Trustee, Carnegie Endowment for International Peace (on the Investment Committee) |
| 40 | Columbia Global Strategic Equity Fund | Annual Report 2020 |
TRUSTEES AND OFFICERS (continued)
Independent trustees (continued)
Name,
address,
year of birth | Position held
with the Trust and
length of service | Principal occupation(s)
during past five years
and other relevant
professional experience | Number of
Funds in the
Columbia Funds
Complex
overseen | Other directorships
held by Trustee
during the past
five years |
Anthony M. Santomero
c/o Columbia Management
Investment Advisers, LLC
225 Franklin Street
Mail Drop BX32 05228
Boston, MA 02110
1946 | Trustee since 6/11 for RiverSource Funds and since 1/08 for Nations Funds | Richard K. Mellon Professor Emeritus of Finance, The Wharton School, University of Pennsylvania, since 2002; Senior Advisor, McKinsey & Company (consulting), 2006-2008; President, Federal Reserve Bank of Philadelphia, 2000- 2006; Professor of Finance, The Wharton School, University of Pennsylvania, 1972-2002 | 121 | Trustee, Penn Mutual Life Insurance Company since March 2008; Director, Renaissance Reinsurance Ltd. since May 2008; former Director, Citigroup Inc. and Citibank, N.A., 2009-2019; former Trustee, BofA Funds Series Trust (11 funds), 2008-2011 |
Minor M. Shaw
c/o Columbia Management
Investment Advisers, LLC
225 Franklin Street
Mail Drop BX32 05228
Boston, MA 02110
1947 | Trustee since 6/11 for RiverSource Funds and since 2003 for Nations Funds | President, Micco LLC (private investments) since 2011; President, Micco Corp. (family investment business), 1998-2011 | 121 | Director, BlueCross BlueShield of South Carolina since April 2008; Trustee, Hollingsworth Funds since 2016 (previously Board Chair from 2016-2019); Advisory Board member, Duke Energy Corp. since October 2016; Chair of the Duke Endowment; Chair of Greenville – Spartanburg Airport Commission; former Trustee, BofA Funds Series Trust (11 funds), 2003-2011; former Director, Piedmont Natural Gas, 2004-2016; former Director, National Association of Corporate Directors, Carolinas Chapter, 2013-2018 |
Sandra Yeager
c/o Columbia Management
Investment Advisers, LLC
225 Franklin Street
Mail Drop BX32 05228
Boston, MA 02110
1964 | Trustee since 12/17 | Retired; President and founder, Hanoverian Capital, LLC (SEC registered investment advisor firm), 2008-2016; Managing Director, DuPont Capital, 2006-2008; Managing Director, Morgan Stanley Investment Management, 2004-2006; Senior Vice President, Alliance Bernstein, 1990-2004 | 119 | Director, NAPE Education Foundation since October 2016 |
Columbia Global Strategic Equity Fund | Annual Report 2020
| 41 |
TRUSTEES AND OFFICERS (continued)
Interested trustee affiliated with Investment Manager*
Name,
address,
year of birth | Position held with the Trust and length of service | Principal occupation(s) during the
past five years and other relevant
professional experience | Number of
Funds in the
Columbia Funds
Complex overseen | Other directorships
held by Trustee
during the past
five years |
William F. Truscott
c/o Columbia Management
Investment Advisers, LLC
225 Franklin St.
Boston, MA 02110
1960 | Trustee since 11/01 for RiverSource Funds and since 6/11 for Nations Funds; Senior Vice President since 2002 for RiverSource Funds and since 5/10 for Nations Funds | Chairman of the Board and President, Columbia Management Investment Advisers, LLC since May 2010 and February 2012, respectively; Chief Executive Officer, Global Asset Management, Ameriprise Financial, Inc. since September 2012 (previously Chief Executive Officer, U.S. Asset Management & President, Annuities, May 2010 - September 2012); Director and Chief Executive Officer, Columbia Management Investment Distributors, Inc. since May 2010 and February 2012, respectively; Chairman of the Board and Chief Executive Officer, RiverSource Distributors, Inc. since 2006; Director, Threadneedle Asset Management Holdings, SARL since 2014; President and Chief Executive Officer, Ameriprise Certificate Company, 2006 - August 2012. | 192 | Chairman of the Board, Columbia Management Investment Advisers, LLC since May 2010; Director, Columbia Management Investment Distributors, Inc. since May 2010; former Director, Ameriprise Certificate Company, August 2006-January 2013 |
| * | Interested person (as defined under the 1940 Act) by reason of being an officer, director, security holder and/or employee of the Investment Manager or Ameriprise Financial. |
Nations Funds refer to the Funds within the Columbia Funds Complex that historically bore the Nations brand and includes series of Columbia Funds Series Trust. RiverSource Funds refer to the Funds within the Columbia Funds Complex that historically bore the RiverSource brand and includes series of Columbia Funds Series Trust II.
The Statement of Additional Information has additional information about the Fund’s Board members and is available, without charge, upon request by calling 800.345.6611, visiting columbiathreadneedleus.com/investor/ or contacting your financial intermediary.
The Board has appointed officers who are responsible for day-to-day business decisions based on policies it has established. The officers serve at the pleasure of the Board. The following table provides basic information about the Officers of the Fund as of the printing of this report, including principal occupations during the past five years, although their specific titles may have varied over the period. In addition to Mr. Truscott, who is Senior Vice President, the Fund’s other officers are:
Fund officers
Name,
address and
year of birth | Position and year
first appointed to
position for any Fund
in the Columbia
Funds Complex or a
predecessor thereof | Principal occupation(s) during past five years |
Christopher O. Petersen
5228 Ameriprise
Financial Center
Minneapolis, MN 55474
Born 1970 | President and Principal Executive Officer (2015) | Vice President and Lead Chief Counsel, Ameriprise Financial, Inc. since January 2015 (previously Vice President and Chief Counsel, January 2010 - December 2014); officer of Columbia Funds and affiliated funds since 2007. |
Michael G. Clarke
225 Franklin Street
Boston, MA 02110
Born 1969 | Chief Financial Officer, Principal Financial Officer (2009), and Senior Vice President (2019) | Vice President, Head of North American Operations, and Co-Head of Global Operations, – Accounting and Tax, Columbia Management Investment Advisers, LLC, since June 2019 (previously Vice President – Accounting and Tax, May 2010 – May 2019); senior officer of Columbia Funds and affiliated funds since 2002 (previously, Treasurer and Chief Accounting Officer, January 2009 – January 2019 and December 2015 – January 2019, respectively). |
| 42 | Columbia Global Strategic Equity Fund | Annual Report 2020 |
TRUSTEES AND OFFICERS (continued)
Fund officers (continued)
Name,
address and
year of birth | Position and year
first appointed to
position for any Fund
in the Columbia
Funds Complex or a
predecessor thereof | Principal occupation(s) during past five years |
Joseph Beranek
5890 Ameriprise
Financial Center
Minneapolis, MN 55474
Born 1965 | Treasurer, Chief Accounting Officer (Principal Accounting Officer) (2019), and Principal Financial Officer (2020) | Vice President — Mutual Fund Accounting and Financial Reporting, Columbia Management Investment Advisers, LLC, since December 2018 and March 2017, respectively (previously Vice President — Pricing and Corporate Actions, May 2010 - March 2017). |
Paul B. Goucher
485 Lexington Avenue
New York, NY 10017
Born 1968 | Senior Vice President (2011) and Assistant Secretary (2008) | Senior Vice President and Assistant General Counsel, Ameriprise Financial, Inc. since January 2017 (previously Vice President and Lead Chief Counsel, November 2008 - January 2017 and January 2013 - January 2017, respectively); Vice President, Chief Legal Officer and Assistant Secretary, Columbia Management Investment Advisers, LLC since March 2015 (previously Vice President and Assistant Secretary, May 2010 – March 2015). |
Thomas P. McGuire
225 Franklin Street
Boston, MA 02110
Born 1972 | Senior Vice President and Chief Compliance Officer (2012) | Vice President — Asset Management Compliance, Ameriprise Financial, Inc., since May 2010; Chief Compliance Officer, Ameriprise Certificate Company since September 2010; Chief Compliance Officer, Columbia Acorn/Wanger Funds since December 2015. |
Colin Moore
225 Franklin Street
Boston, MA 02110
Born 1958 | Senior Vice President (2010) | Executive Vice President and Global Chief Investment Officer, Ameriprise Financial, Inc., since July 2013; Executive Vice President and Global Chief Investment Officer, Columbia Management Investment Advisers, LLC since July 2013. |
Ryan C. Larrenaga
225 Franklin Street
Boston, MA 02110
Born 1970 | Senior Vice President (2017), Chief Legal Officer (2017), and Secretary (2015) | Vice President and Chief Counsel, Ameriprise Financial, Inc. since August 2018 (previously Vice President and Group Counsel, August 2011 - August 2018); officer of Columbia Funds and affiliated funds since 2005. |
Daniel J. Beckman
225 Franklin Street
Boston, MA 02110
Born 1962 | Senior Vice President (2020) | Vice President – Head of North America Product, Columbia Management Investment Advisers, LLC (since April 2015); previously, Senior Vice President of Investment Product Management, Fidelity Financial Advisor Solutions, a division of Fidelity Investments (January 2012 – March 2015). |
Michael E. DeFao
225 Franklin Street
Boston, MA 02110
Born 1968 | Vice President (2011) and Assistant Secretary (2010) | Vice President and Chief Counsel, Ameriprise Financial, Inc. since May 2010. |
Lyn Kephart-Strong
5228 Ameriprise
Financial Center
Minneapolis, MN 55474
Born 1960 | Vice President (2015) | President, Columbia Management Investment Services Corp. since October 2014; Vice President & Resolution Officer, Ameriprise Trust Company since August 2009. |
Columbia Global Strategic Equity Fund | Annual Report 2020
| 43 |
Columbia Global Strategic Equity Fund
P.O. Box 219104
Kansas City, MO 64121-9104
Please read and consider the investment objectives, risks, charges and expenses for any fund carefully before investing. For a prospectus and summary prospectus, which contains this and other important information about the Fund, go to
columbiathreadneedleus.com/investor/. The Fund is distributed by Columbia Management Investment Distributors, Inc., member FINRA, and managed by Columbia Management Investment Advisers, LLC.
Columbia Threadneedle Investments (Columbia Threadneedle) is the global brand name of the Columbia and Threadneedle group of companies. All rights reserved.
© 2020 Columbia Management Investment Advisers, LLC.
columbiathreadneedleus.com/investor/
Item 2. Code of Ethics.
(a)The registrant has adopted a code of ethics that applies to the registrant's principal executive officer, principal financial officer, principal accounting officer or controller, or persons performing similar functions, regardless of whether these individuals are employed by the registrant or a third party.
(b)During the period covered by this report, there were not any amendments to a provision of the code of ethics that applies to the registrant's principal executive officer, principal financial officer, principal accounting officer or controller, or persons performing similar functions, regardless of whether these individuals are employed by the registrant or a third party, and that relates to any element of the code of ethics definition enumerated in paragraph (b) of this Item.
(c)During the period covered by this report, there were no waivers, including any implicit waivers, from a provision of the code of ethics to the registrant's principal executive officer, principal financial officer, principal accounting officer or controller, or persons performing similar functions, regardless of whether these individuals are employed by the registrant or a third party that relates to one or more of the items set forth in paragraph (b) of this Item.
Item 3. Audit Committee Financial Expert.
The registrant's Board of Trustees has determined that Brian J. Gallagher, Pamela G. Carlton, Anthony M. Santomero, and Sandra L. Yeager, each of whom are members of the registrant's Board of Trustees and Audit Committee, each qualify as an audit committee financial expert. Mr. Gallagher, Ms. Carlton, Mr. Santomero, and Ms. Yeager are each independent trustees, as defined in paragraph (a)(2) of this item's instructions.
Item 4. Principal Accountant Fees and Services.
Fee information below is disclosed for the three series of the registrant whose reports to stockholders are included in this annual filing.
(a)Audit Fees. Aggregate Audit Fees billed by the principal accountant for professional services rendered during the fiscal years ended January 31, 2020 and January 31, 2019 are approximately as follows:
20202019
$60,000 $55,000
Audit Fees include amounts related to the audit of the registrant's annual financial statements or services that are normally provided by the accountant in connection with statutory and regulatory filings or engagements for those fiscal years.
(b)Audit-Related Fees. Aggregate Audit-Related Fees billed to the registrant by the principal accountant for professional services rendered during the fiscal years ended January 31, 2020 and January 31, 2019 are approximately as follows:
Audit-Related Fees include amounts for assurance and related services by the principal accountant that are reasonably related to the performance of the audit of the registrant's financial statements and are not reported in Audit Fees above.
During the fiscal years ended January 31, 2020 and January 31, 2019, there were no Audit-Related Fees billed by the registrant's principal accountant to the registrant's investment adviser (not including any sub-adviser whose role is primarily portfolio management and is subcontracted with or overseen by another investment adviser) and any entity controlling, controlled by, or under common control with the adviser that provides ongoing services to the registrant for an engagement that related directly to the operations and financial reporting of the registrant.
(c)Tax Fees. Aggregate Tax Fees billed by the principal accountant to the registrant for professional services rendered during the fiscal years ended January 31, 2020 and January 31, 2019 are approximately as follows:
Tax Fees include amounts for the review of annual tax returns, the review of required shareholder distribution calculations and typically include amounts for professional services by the principal accountant for tax compliance, tax advice and tax planning.
During the fiscal years ended January 31, 2020 and January 31, 2019, there were no Tax Fees billed by the registrant's principal accountant to the registrant's investment adviser (not including any sub-adviser whose role is primarily portfolio management and is subcontracted with or overseen by another investment adviser) and any entity controlling, controlled by, or under common control with the adviser that provides ongoing services to the registrant for an engagement that related directly to the operations and financial reporting of the registrant.
(d)All Other Fees. Aggregate All Other Fees billed by the principal accountant to the registrant for professional services rendered during the fiscal years ended January 31,
2020 and January 31, 2019 are approximately as follows:
All Other Fees include amounts for products and services provided by the principal accountant, other than the services reported in paragraphs (a) through (c) above.
Aggregate All Other Fees billed by the registrant's principal accountant to the registrant's investment adviser (not including any sub-adviser whose role is primarily portfolio management and is subcontracted with or overseen by another investment adviser) and any entity controlling, controlled by, or under common control with the adviser that provides ongoing services to the registrant for an engagement that related directly to the operations and financial reporting of the registrant during the fiscal years ended January 31, 2020 and January 31, 2019 are approximately as follows:
20202019
$225,000 $225,000
In fiscal years 2020 and 2019, All Other Fees primarily consists of fees billed for internal control examinations of the registrant's transfer agent and investment adviser.
(e)(1) Audit Committee Pre-Approval Policies and Procedures
The registrant's Audit Committee is required to pre-approve the engagement of the
registrant's independent auditors to provide audit and non-audit services to the registrant and non-audit services to its investment adviser (excluding any sub-adviser whose role is primarily portfolio management and is sub-contracted or overseen by another investment adviser (the "Adviser") or any entity controlling, controlled by or under common control with the Adviser that provides ongoing services to the Fund (a "Control Affiliate") if the engagement relates directly to the operations and financial reporting of the registrant.
The Audit Committee has adopted a Policy for Engagement of Independent Auditors for Audit and Non-Audit Services (the "Policy"). The Policy sets forth the understanding of the Audit Committee regarding the engagement of the registrant's independent accountants to provide (i) audit and permissible audit-related, tax and other services to the registrant ("Fund Services"); (ii) non-audit services to the registrant's Adviser and any Control Affiliates, that relates directly to the operations and financial reporting of a Fund ("Fund-related Adviser Services"); and (iii) certain other audit and non-audit services to the registrant's Adviser and its Control Affiliates. A service will require specific pre-approval by the Audit Committee if it is to be provided by the Fund's independent auditor; provided, however, that pre-approval of non-audit services to the Fund, the Adviser or Control Affiliates may be waived if certain de minimis requirements set forth in the SEC's rules are met.
Under the Policy, the Audit Committee may delegate pre-approval authority to any pre- designated member or members who are independent board members. The member(s) to whom such authority is delegated must report, for informational purposes only, any pre- approval decisions to the Audit Committee at its next regular meeting. The Audit Committee's responsibilities with respect to the pre-approval of services performed by the independent auditor may not be delegated to management.
On an annual basis, at a regularly scheduled Audit Committee meeting, the Fund's Treasurer or other Fund officer shall submit to the Audit Committee a schedule of the types of Fund Services and Fund-related Adviser Services that are subject to specific pre- approval. This schedule will provide a description of each type of service that is subject to specific pre-approval, along with total projected fees for each service. The pre- approval will generally cover a one-year period. The Audit Committee will review and approve the types of services and the projected fees for the next one-year period and may add to, or subtract from, the list of pre-approved services from time to time, based on subsequent determinations. This specific approval acknowledges that the Audit Committee is in agreement with the specific types of services that the independent auditor will be permitted to perform and the projected fees for each service.
The Fund's Treasurer or other Fund officer shall report to the Audit Committee at each of its regular meetings regarding all Fund Services or Fund-related Adviser Services provided since the last such report was rendered, including a description of the services, by category, with forecasted fees for the annual reporting period, proposed changes requiring specific pre-approval and a description of services provided by the independent auditor, by category, with actual fees during the current reporting period.
*****
(e)(2) 100% of the services performed for items (b) through (d) above during 2020 and 2019 were pre-approved by the registrant's Audit Committee.
(f)Not applicable.
(g)The aggregate non-audit fees billed by the registrant's accountant for services rendered to the registrant, and rendered to the registrant's investment adviser (not including any sub-adviser whose role is primarily portfolio management and is subcontracted with or overseen by another investment adviser), and any entity controlling, controlled by, or under common control with the adviser that provides ongoing services to the registrant for the fiscal years ended January 31, 2020 and January 31, 2019 are approximately as follows:
20202019
$225,000 $239,700
(h)The registrant's Audit Committee of the Board of Directors has considered whether the provision of non-audit services that were rendered to the registrant's adviser (not including any sub-adviser whose role is primarily portfolio management and is subcontracted with or overseen by another investment adviser), and any entity controlling, controlled by, or under common control with the investment adviser that provides ongoing services to the registrant that were not pre-approved pursuant to paragraph (c)(7)(ii) of Rule 2-01 of Regulation S-X, is compatible with maintaining the principal accountant's independence.
Item 5. Audit Committee of Listed Registrants.
Not applicable.
Item 6. Investments
(a)The registrant's "Schedule I – Investments in securities of unaffiliated issuers" (as set forth in 17 CFR 210.12-12) is included in Item 1 of this Form N-CSR.
(b)Not applicable.
Item 7. Disclosure of Proxy Voting Policies and Procedures for Closed-End Management Investment Companies.
Not applicable.
Item 8. Portfolio Managers of Closed-End Management Investment Companies.
Not applicable.
Item 9. Purchases of Equity Securities by Closed-End Management Investment Company and Affiliated Purchasers.
Not applicable.
Item 10. Submission of Matters to a Vote of Security Holders.
There were no material changes to the procedures by which shareholders may recommend nominees to the registrant's board of directors.
Item 11. Controls and Procedures.
(a)The registrant's principal executive officer and principal financial officer, based on their evaluation of the registrant's disclosure controls and procedures as of a date within 90 days of the filing of this report, have concluded that such controls and procedures are adequately designed to ensure that information required to be disclosed by the registrant in Form N-CSR is accumulated and communicated to the registrant's management, including the principal executive officer and principal financial officer, or persons performing similar functions, as appropriate to allow timely decisions regarding required disclosure.
(b)There was no change in the registrant's internal control over financial reporting that occurred during the period covered by this report that has materially affected, or is reasonably likely to materially affect, the registrant's internal control over financial reporting.
Item 12. Disclosure of Securities Lending Activities for Closed-End Management Investment Companies
Not applicable.
Item 13. Exhibits.
(a)(1) Code of ethics required to be disclosed under Item 2 of Form N-CSR attached hereto as Exhibit 99.CODE ETH.
(a)(2) Certifications pursuant to Rule 30a-2(a) under the Investment Company Act of 1940 (17 CFR 270.30a-2(a)) attached hereto as Exhibit 99.CERT.
(a)(3) Not applicable.
(b)Certification pursuant to Rule 30a-2(b) under the Investment Company Act of 1940
(17 CFR 270.30a-2(b)) attached hereto as Exhibit 99.906CERT.
SIGNATURES
Pursuant to the requirements of the Securities Exchange Act of 1934 and the Investment Company Act of 1940, the registrant has duly caused this report to be signed on its behalf by the undersigned, thereunto duly
authorized. | | |
(registrant) | | Columbia Funds Series Trust | |
By (Signature and Title) | /s/ Christopher O. Petersen |
| | | Christopher O. Petersen, President and Principal Executive Officer |
Date | | March 24, 2020 |
Pursuant to the requirements of the Securities Exchange Act of 1934 and the Investment Company Act of 1940, this report has been signed below by the following persons on behalf of the registrant and in the capacities and on the dates indicated.
By (Signature and Title) | /s/ Christopher O. Petersen |
| | Christopher O. Petersen, President and Principal Executive Officer |
Date | | March 24, 2020 | |
By (Signature and Title) | /s/ Michael G. Clarke |
| | Michael G. Clarke, Chief Financial Officer, Principal Financial Officer |
| | and Senior Vice President |
Date | | March 24, 2020 | |
By (Signature and Title) | /s/ Joseph Beranek |
| | Joseph Beranek, Treasurer, Chief Accounting Officer and Principal |
| | Financial Officer |
Date | | March 24, 2020 | |