UNITED STATES
SECURITIES AND EXCHANGE COMMISSION
Washington, D.C. 20549
FORMN-CSR
CERTIFIED SHAREHOLDER REPORT OF REGISTERED
MANAGEMENT INVESTMENT COMPANIES
Investment Company Act file number811-09645
Columbia Funds Series Trust
(Exact name of registrant as specified in charter)
225 Franklin Street
Boston, Massachusetts 02110
(Address of principal executive offices) (Zip code)
Christopher O. Petersen, Esq.
c/o Columbia Management Investment Advisers, LLC
225 Franklin Street
Boston, Massachusetts 02110
Ryan C. Larrenaga, Esq.
c/o Columbia Management Investment Advisers, LLC
225 Franklin Street
Boston, MA 02110
(Name and address of agent for service)
Registrant’s telephone number, including area code: (800)345-6611
Date of fiscal year end: February 28
Date of reporting period: February 28, 2019
FormN-CSR is to be used by management investment companies to file reports with the Commission not later than 10 days after the transmission to stockholders of any report that is required to be transmitted to stockholders under Rule30e-1 under the Investment Company Act of 1940 (17 CFR270.30e-1). The Commission may use the information provided on FormN-CSR in its regulatory, disclosure review, inspection, and policymaking roles.
A registrant is required to disclose the information specified by FormN-CSR, and the Commission will make this information public. A registrant is not required to respond to the collection of information contained in FormN-CSR unless the Form displays a currently valid Office of Management and Budget (“OMB”) control number. Please direct comments concerning the accuracy of the information collection burden estimate and any suggestions for reducing the burden to Secretary, Securities and Exchange Commission, 100 F Street, NE, Washington, DC 20549. The OMB has reviewed this collection of information under the clearance requirements of 44 U.S.C. § 3507.
Item 1. Reports to Stockholders.

Annual Report
February 28, 2019
Columbia Convertible Securities Fund
Beginning on January 1, 2021, as permitted by regulations adopted by the Securities and Exchange Commission, paper copies of the Fund’s annual and semiannual shareholder reports like this one will no longer be sent by mail, unless you specifically request paper copies of the reports. Instead, the reports will be made available on the Fund’s website (columbiathreadneedleus.com/investor/), and each time a report is posted you will be notified by mail and provided with a website address to access the report.
If you have already elected to receive shareholder reports electronically, you will not be affected by this change and you need not take any action. You may elect to receive shareholder reports and other communications from the Fund electronically at any time by contacting your financial intermediary (such as a broker-dealer or bank) or, for Fund shares held directly with the Fund, by calling 800.345.6611 or by enrolling in “eDelivery” by logging into your account at columbiathreadneedleus.com/investor/.
You may elect to receive all future reports in paper free of charge. If you invest through a financial intermediary, you can contact your financial intermediary to request that you continue receiving paper copies of your shareholder reports. If you invest directly with the Fund, you can call 800.345.6611 to let the Fund know you wish to continue receiving paper copies of your shareholder reports. Your election to receive paper reports will apply to all Columbia Funds held in your account if you invest through a financial intermediary or all Columbia Funds held with the fund complex if you invest directly with the Fund.
Not FDIC Insured • No bank guarantee • May lose value
Dear Shareholders,
Volatility exists in financial markets and this is not a comfortable fact of life. How investors deal with this reality, including how they react to short term spikes in volatility as well as to longer periods of increased or decreased volatility, may have a significant impact on their overall investing success.
Too often, investors change their investment strategy based on something that’s happening at a moment in time rather than thinking about how that change in strategy might affect their ability to achieve their longer term financial goals. Emotion replaces logic and reasoning. Investors may sell in reaction to a market drop (fear or panic), locking in low returns which means they won’t be invested when the market returns, or they invest more at a market peak (greed or conviction), essentially when it is expensive to do so. In both cases, selling and buying at the exact wrong time.
We believe the best outcomes come from a consistent approach to investing. Here are five areas where advisors can help us overcome the tendency to react emotionally as we struggle to make the right choices with our investments:
Long-term focus
The further away long-term goals, aspirations and objectives are, the easier it is to stray away from the goals and priorities that we set out. Advisors help us stay focused on what we want to accomplish.
Discipline through up-and-down markets
Advisors help set rules to prevent us from making rash decisions that we may regret later. Knowing ahead of time what you should do in case of certain situations will help you get through volatile markets and not make emotional decisions.
Tax-awareness
Taxes are one of the biggest drags on investment returns and are critical attributes of investing. Yet few of us take the necessary steps to ease the corrosive effect of taxes. Advisors have tools and knowledge that may help us to manage portfolios more tax-efficiently and keep more of what we earn.
Emotional objectivity
Our emotions are very hard to manage and making investment decisions in an emotional state can lead to exceedingly bad outcomes. An objective advisor can help prevent some of the reactionary mistakes emotions often lead us to.
Education and guidance
The role of the advisor is to teach and guide us toward achieving our financial goals. In terms of working through emotions, guidance is by far the most important component.
By understanding our own behaviors and biases, we can prepare for future challenges. Your success is our priority. Talk to your advisor about how working with Columbia Threadneedle Investments may help you stay the course and position your portfolio for consistent, sustainable outcomes, regardless of market conditions.
Sincerely,
Christopher O. Petersen
President, Columbia Funds
Columbia Funds are distributed by Columbia Management Investment Distributors, Inc., member FINRA, and managed by Columbia Management Investment Advisers, LLC.
© 2019 Columbia Management Investment Advisers, LLC. All rights reserved.
Columbia Convertible Securities Fund | Annual Report 2019
Columbia Convertible Securities Fund | Annual Report 2019
Investment objective
Columbia Convertible Securities Fund (the Fund) seeks total return, consisting of capital appreciation and current income.
Portfolio management
David King, CFA
Lead Portfolio Manager
Managed Fund since 2010
Yan Jin
Portfolio Manager
Managed Fund since 2006
| Average annual total returns (%) (for the period ended February 28, 2019) |
| | | Inception | 1 Year | 5 Years | 10 Years |
| Class A | Excluding sales charges | 09/25/87 | 7.70 | 6.70 | 11.98 |
| | Including sales charges | | 1.48 | 5.45 | 11.31 |
| Advisor Class* | 11/08/12 | 7.99 | 6.98 | 12.17 |
| Class C | Excluding sales charges | 10/21/96 | 6.92 | 5.90 | 11.14 |
| | Including sales charges | | 5.92 | 5.90 | 11.14 |
| Institutional Class | 05/21/99 | 8.00 | 6.97 | 12.26 |
| Institutional 2 Class* | 11/08/12 | 8.07 | 7.07 | 12.23 |
| Institutional 3 Class* | 10/01/14 | 8.11 | 7.06 | 12.17 |
| Class R* | 11/16/11 | 7.44 | 6.43 | 11.65 |
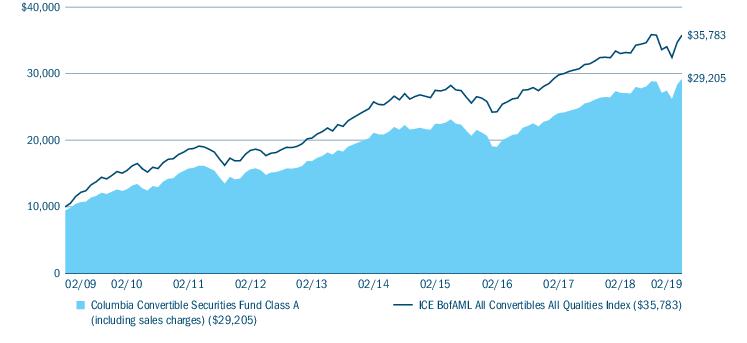
| ICE BofAML All Convertibles All Qualities Index | | 8.33 | 6.79 | 13.60 |
Returns for Class A shares are shown with and without the maximum initial sales charge of 5.75%. Returns for Class C shares are shown with and without the 1.00% contingent deferred sales charge for the first year only. The Fund’s other share classes are not subject to sales charges and have limited eligibility. Please see the Fund’s prospectus for details. Performance for different share classes will vary based on differences in sales charges and fees associated with each share class. All results shown assume reinvestment of distributions during the period. Returns do not reflect the deduction of taxes that a shareholder may pay on Fund distributions or on the redemption of Fund shares. Performance results reflect the effect of any fee waivers or reimbursements of Fund expenses by Columbia Management Investment Advisers, LLC and/or any of its affiliates. Absent these fee waivers or expense reimbursement arrangements, performance results would have been lower.
The performance information shown represents past performance and is not a guarantee of future results. The investment return and principal value of your investment will fluctuate so that your shares, when redeemed, may be worth more or less than their original cost. Current performance may be lower or higher than the performance information shown. You may obtain performance information current to the most recent month-end by contacting your financial intermediary, visiting columbiathreadneedleus.com/investor/ or calling 800.345.6611.
| * | The returns shown for periods prior to the share class inception date (including returns for the Life of the Fund, if shown, which are since Fund inception) include the returns of the Fund’s oldest share class. These returns are adjusted to reflect any higher class-related operating expenses of the newer share classes, as applicable. Please visit columbiathreadneedleus.com/investor/investment-products/mutual-funds/appended-performance for more information. |
The ICE BofAML All Convertibles All Qualities Index measures the performance of U.S. dollar-denominated convertible securities not currently in bankruptcy with a total market value greater than $50 million at issuance.
Indices are not available for investment, are not professionally managed and do not reflect sales charges, fees, brokerage commissions, taxes or other expenses of investing. Securities in the Fund may not match those in an index.
| 2 | Columbia Convertible Securities Fund | Annual Report 2019 |
Fund at a Glance (continued)
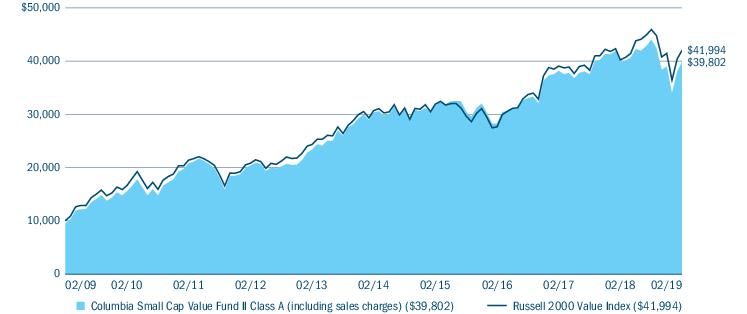
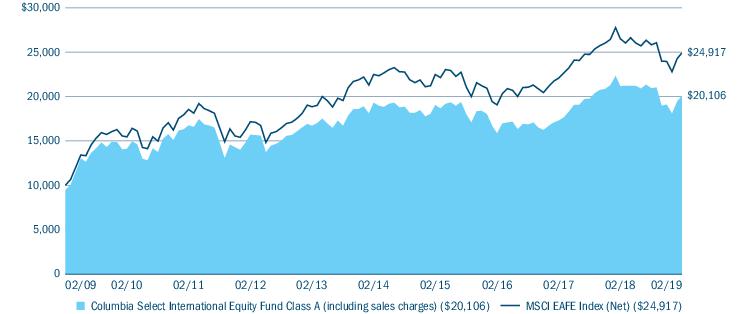
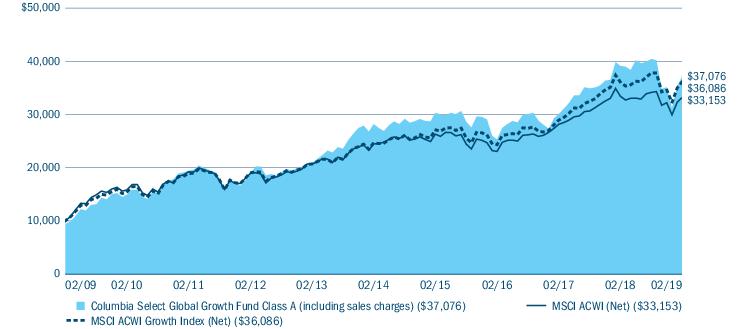
Performance of a hypothetical $10,000 investment (February 28, 2009 — February 28, 2019)
The chart above shows the change in value of a hypothetical $10,000 investment in Class A shares of Columbia Convertible Securities Fund during the stated time period, and does not reflect the deduction of taxes that a shareholder may pay on Fund distributions or on the redemption of Fund shares.
| Top 10 holdings (%) (at February 28, 2019) |
Bank of America Corp.
12/31/2049 7.250% | 2.8 |
DISH Network Corp.
03/15/2024 2.375% | 2.6 |
Palo Alto Networks, Inc.
07/01/2023 0.750% | 2.3 |
Square, Inc.
05/15/2023 0.500% | 2.1 |
Becton Dickinson and Co.
05/01/2020 6.125% | 1.9 |
Microchip Technology, Inc.
02/15/2027 1.625% | 1.8 |
Microchip Technology, Inc.
02/15/2037 2.250% | 1.8 |
Danaher Corp.
04/15/2022 4.750% | 1.6 |
Crown Castle International Corp.
08/01/2020 6.875% | 1.6 |
Fortive Corp.
07/01/2021 5.000% | 1.6 |
Percentages indicated are based upon total investments excluding Money Market Funds and investments in derivatives, if any.
For further detail about these holdings, please refer to the section entitled “Portfolio of Investments.”
Fund holdings are as of the date given, are subject to change at any time, and are not recommendations to buy or sell any security.
| Portfolio breakdown (%) (at February 28, 2019) |
| Common Stocks | 3.5 |
| Convertible Bonds | 72.7 |
| Convertible Preferred Stocks | 18.4 |
| Equity-Linked Notes | 0.8 |
| Money Market Funds | 4.6 |
| Total | 100.0 |
Percentages indicated are based upon total investments excluding investments in derivatives, if any. The Fund’s portfolio composition is subject to change.
Columbia Convertible Securities Fund | Annual Report 2019
| 3 |
Manager Discussion of Fund Performance
For the 12-month period ended February 28, 2019, the Fund’s Class A shares returned 7.70% excluding sales charges. The Fund modestly lagged its benchmark, the ICE BofAML All Convertibles All Qualities Index, which returned 8.33% for the same time period. Convertible securities outperformed broad measures of the stock and bond markets.
Financial markets advanced despite year-end equity sell-off
Investors kicked off the 12-month period ended February 28, 2019 with soaring optimism. Positive global economic conditions, broad corporate tax cuts and moves to reduce regulation in a number of industries buoyed confidence. The pace of economic growth averaged more than 3.0%, as the labor markets added an average of 209,000 jobs per month, wages increased on the order of 3.0% and manufacturing activity remained solid. Unemployment rose modestly in December and January, but even that was a net positive, as it reflected an increase in the number of Americans seeking employment. Weak job creation in February drove unemployment back down to 3.8%.
As 2018 progressed, the rosy global picture dimmed. European economies transitioned to a slower pace, struggling with rising interest rates, trade tensions and uncertainty surrounding Brexit (the U.K.’s departure from the European Union). At the same time, China’s economic conditions weakened and emerging markets came under pressure, driven by trade concerns and a rising U.S dollar. In December, the Federal Reserve (the Fed) rattled investors when it raised the target range of its key short-term interest rate, the federal funds rate, to 2.25%-2.50%, the fourth such increase for the year. However, the Fed maintained this rate in its January 2019 meeting and announced that it would be patient moving forward.
As uncertainties rose late in 2018, investors backed away from riskier assets. Technology stocks, which had been global market leaders, stumbled in the third quarter of 2018 and triggered a broader market sell-off of stocks and high-yield bonds in the fourth quarter. However, stocks rebounded early in 2019 as a patient Fed and hopes for progress on the trade front inspired confidence. The S&P 500 Index, a broad measure of U.S. stock returns, gained 4.68% for the 12-month period, with dividends reinvested. Investment-grade bonds, as measured by the Bloomberg Barclays U.S. Aggregate Bond Index, returned 3.17%.
Contributors and detractors
In a year that was more volatile month to month than overall market returns suggest, the Fund’s top performers came from a broad range of sectors, including technology, health care and communication services. In technology, the Fund was positioned to benefit from trending themes, such as alternative communications and messaging and all forms of security — data, personal and computing. The convertible securities of cybersecurity company Palo Alto Networks and Okta, a cloud-based provider of enterprise identity and security solutions, both posted solid gains for the period. Twilio, a cloud-based communications platform-as-a-service company, and innovative payment processor Square were also strong performers. A position in Western Digital Corp. stock partially offset some of these gains within technology, as its shares fell with the sector in the fourth quarter and did not rebound.
In health care, Exact Sciences Corp., Tesaro and Teledoc Health, Inc. were solid performers. Exact Sciences targets people who are candidates for routine colonoscopies but do not get them because of cost or inconvenience. Exact Sciences rose materially as the company benefited from a sales and marketing partnership with pharmaceutical giant Pfizer. Biotechnology company Tesaro gained ground after the announcement that GlaxoSmithKline would pay a hefty premium to acquire the company. Teledoc, which uses telephone and videoconferencing technology to provide on-demand remote medical care, rebounded after a weak fourth quarter. By contrast, Novavax convertibles came down dramatically late in the period after the developmental-stage vaccine company reported that its respiratory virus vaccine failed yet again in a pivotal trial.
In the communication services sector, World Wrestling Entertainment convertible securities had a strong run as the company signed longer term contracts at higher prices and increased its online presence. We trimmed the Fund’s position, but it remained overweight at period’s end. A position in Caesars Entertainment Corp. convertibles was the biggest detractor for the period. Weakness in the gaming industry weighed on the company, one of the largest owners of casinos in the United States.
In the energy sector, Bristow Group and Nabors Industries, whose businesses are closely tied to the price of oil, were major detractors from returns. Both companies suffered as crude prices fell sharply during the year. And both companies were doubly exposed, as they have elevated balance-sheet leverage, which put off investors.
| 4 | Columbia Convertible Securities Fund | Annual Report 2019 |
Manager Discussion of Fund Performance (continued)
At period’s end
We do not believe the period’s volatility had a lasting impact on the Fund’s long-term prospects. At the end of the period, we believed conditions in the convertibles market were orderly in terms of transactions and attractive in terms of new issuance. We continue to use bottom-up security selection to target convertibles and other income-generating securities that have the potential for both price appreciation and high current income. We believe the Fund continues to offer long-term investors a solid building block for diversification.
Marketrisk may affect a single issuer, sector of the economy, industry or the market as a whole.Convertible securities are subject toissuer default risk. A rise ininterest rates may result in a price decline of fixed-income instruments held by the Fund, negatively impacting its performance and NAV. Falling rates may result in the Fund investing in lower yielding debt instruments, lowering the Fund’s income and yield. These risks may be heightened for longer maturity and duration securities. The Fund may also be forced to convert a convertible security at an inopportune time, which may decrease the Fund’s return.Non-investment-grade (high-yield or junk) securities present greater price volatility and more risk to principal and income than higher rated securities.Foreigninvestments subject the Fund to risks, including political, economic, market, social and others within a particular country, as well as to currency instabilities and less stringent financial and accounting standards generally applicable to U.S. issuers.Short positions (where the underlying asset is not owned) can create unlimited risk. Market or other (e.g., interest rate) environments may adversely affect theliquidityof Fund investments, negatively impacting their price. Generally, the less liquid the market at the time the Fund sells a holding, the greater the risk of loss or decline of value to the Fund.
The views expressed in this report reflect the current views of the respective parties. These views are not guarantees of future performance and involve certain risks, uncertainties and assumptions that are difficult to predict, so actual outcomes and results may differ significantly from the views expressed. These views are subject to change at any time based upon economic, market or other conditions and the respective parties disclaim any responsibility to update such views. These views may not be relied on as investment advice and, because investment decisions for a Columbia fund are based on numerous factors, may not be relied on as an indication of trading intent on behalf of any particular Columbia fund. References to specific securities should not be construed as a recommendation or investment advice.
Columbia Convertible Securities Fund | Annual Report 2019
| 5 |
Understanding Your Fund’s Expenses
(Unaudited)
As an investor, you incur two types of costs. There are shareholder transaction costs, which generally include sales charges on purchases and may include redemption fees. There are also ongoing fund costs, which generally include management fees, distribution and/or service fees, and other fund expenses. The following information is intended to help you understand your ongoing costs (in dollars) of investing in the Fund and to help you compare these costs with the ongoing costs of investing in other mutual funds.
Analyzing your Fund’s expenses
To illustrate these ongoing costs, we have provided examples and calculated the expenses paid by investors in each share class of the Fund during the period. The actual and hypothetical information in the table is based on an initial investment of $1,000 at the beginning of the period indicated and held for the entire period. Expense information is calculated two ways and each method provides you with different information. The amount listed in the “Actual” column is calculated using the Fund’s actual operating expenses and total return for the period. You may use the Actual information, together with the amount invested, to estimate the expenses that you paid over the period. Simply divide your account value by $1,000 (for example, an $8,600 account value divided by $1,000 = 8.6), then multiply the results by the expenses paid during the period under the “Actual” column. The amount listed in the “Hypothetical” column assumes a 5% annual rate of return before expenses (which is not the Fund’s actual return) and then applies the Fund’s actual expense ratio for the period to the hypothetical return. You should not use the hypothetical account values and expenses to estimate either your actual account balance at the end of the period or the expenses you paid during the period. See “Compare with other funds” below for details on how to use the hypothetical data.
Compare with other funds
Since all mutual funds are required to include the same hypothetical calculations about expenses in shareholder reports, you can use this information to compare the ongoing cost of investing in the Fund with other funds. To do so, compare the hypothetical example with the 5% hypothetical examples that appear in the shareholder reports of other funds. As you compare hypothetical examples of other funds, it is important to note that hypothetical examples are meant to highlight the ongoing costs of investing in a fund only and do not reflect any transaction costs, such as sales charges, or redemption or exchange fees. Therefore, the hypothetical calculations are useful in comparing ongoing costs only, and will not help you determine the relative total costs of owning different funds. If transaction costs were included in these calculations, your costs would be higher.
| September 1, 2018 — February 28, 2019 |
| | Account value at the
beginning of the
period ($) | Account value at the
end of the
period ($) | Expenses paid during
the period ($) | Fund’s annualized
expense ratio (%) |
| | Actual | Hypothetical | Actual | Hypothetical | Actual | Hypothetical | Actual |
| Class A | 1,000.00 | 1,000.00 | 1,012.40 | 1,019.19 | 5.64 | 5.66 | 1.13 |
| Advisor Class | 1,000.00 | 1,000.00 | 1,014.00 | 1,020.43 | 4.39 | 4.41 | 0.88 |
| Class C | 1,000.00 | 1,000.00 | 1,009.00 | 1,015.47 | 9.36 | 9.39 | 1.88 |
| Institutional Class | 1,000.00 | 1,000.00 | 1,013.70 | 1,020.43 | 4.39 | 4.41 | 0.88 |
| Institutional 2 Class | 1,000.00 | 1,000.00 | 1,014.40 | 1,020.78 | 4.05 | 4.06 | 0.81 |
| Institutional 3 Class | 1,000.00 | 1,000.00 | 1,014.10 | 1,021.03 | 3.80 | 3.81 | 0.76 |
| Class R | 1,000.00 | 1,000.00 | 1,011.10 | 1,017.95 | 6.88 | 6.90 | 1.38 |
Expenses paid during the period are equal to the annualized expense ratio for each class as indicated above, multiplied by the average account value over the period and then multiplied by the number of days in the Fund’s most recent fiscal half year and divided by 365.
Expenses do not include fees and expenses incurred indirectly by the Fund from its investment in underlying funds, including affiliated and non-affiliated pooled investment vehicles, such as mutual funds and exchange-traded funds.
Had Columbia Management Investment Advisers, LLC and/or certain of its affiliates not waived/reimbursed certain fees and expenses, account value at the end of the period would have been reduced.
| 6 | Columbia Convertible Securities Fund | Annual Report 2019 |
Portfolio of Investments
February 28, 2019
(Percentages represent value of investments compared to net assets)
Investments in securities
| Common Stocks 3.6% |
| Issuer | Shares | Value ($) |
| Consumer Discretionary 0.4% |
| Internet & Direct Marketing Retail 0.4% |
| Expedia Group, Inc. | 35,000 | 4,315,850 |
| Total Consumer Discretionary | 4,315,850 |
| Energy 0.2% |
| Oil, Gas & Consumable Fuels 0.2% |
| Ascent Resources, Class B(a),(b),(c) | 10,248,729 | 2,295,715 |
| Total Energy | 2,295,715 |
| Health Care 1.5% |
| Health Care Equipment & Supplies 0.5% |
| Danaher Corp. | 45,000 | 5,715,900 |
| Health Care Providers & Services 1.0% |
| Anthem, Inc. | 35,000 | 10,525,550 |
| Total Health Care | 16,241,450 |
| Information Technology 1.5% |
| Semiconductors & Semiconductor Equipment 1.3% |
| Lam Research Corp. | 53,000 | 9,332,770 |
| NXP Semiconductors NV | 57,000 | 5,205,240 |
| Total | | 14,538,010 |
| Technology Hardware, Storage & Peripherals 0.2% |
| Western Digital Corp. | 45,000 | 2,263,500 |
| Total Information Technology | 16,801,510 |
Total Common Stocks
(Cost $29,503,712) | 39,654,525 |
| Convertible Bonds(d) 73.4% |
| Issuer | Coupon
Rate | | Principal
Amount ($) | Value ($) |
| Aerospace & Defense 0.5% |
| Aerojet Rocketdyne Holdings, Inc. |
| 12/15/2023 | 2.250% | | 3,500,000 | 5,390,032 |
| Airlines 0.7% |
| Air Transport Services Group, Inc. |
| 10/15/2024 | 1.125% | | 7,500,000 | 7,518,007 |
| Cable and Satellite 2.5% |
| DISH Network Corp. |
| 03/15/2024 | 2.375% | | 34,000,000 | 28,176,174 |
| Convertible Bonds(d) (continued) |
| Issuer | Coupon
Rate | | Principal
Amount ($) | Value ($) |
| Consumer Cyclical Services 0.7% |
| Booking Holdings, Inc. |
| 06/15/2020 | 0.350% | | 6,000,000 | 7,953,468 |
| Electric 0.7% |
| NRG Energy, Inc.(e) |
| 06/01/2048 | 2.750% | | 7,000,000 | 7,813,155 |
| Finance Companies 1.0% |
| Encore Capital Europe Finance Ltd. |
| 09/01/2023 | 4.500% | | 6,000,000 | 5,932,458 |
| iStar, Inc. |
| 09/15/2022 | 3.125% | | 6,000,000 | 5,459,556 |
| Total | 11,392,014 |
| Gaming 1.2% |
| Caesars Entertainment Corp. |
| 10/01/2024 | 5.000% | | 9,000,000 | 12,811,581 |
| Health Care 3.4% |
| DexCom, Inc.(e) |
| 12/01/2023 | 0.750% | | 10,000,000 | 10,993,280 |
| Insulet Corp.(e) |
| 11/15/2024 | 1.375% | | 7,000,000 | 8,414,056 |
| Invacare Corp. |
| 02/15/2021 | 5.000% | | 5,000,000 | 4,768,750 |
| Novavax, Inc. |
| 02/01/2023 | 3.750% | | 9,700,000 | 3,042,172 |
| Teladoc Health, Inc.(e) |
| 05/15/2025 | 1.375% | | 7,500,000 | 10,680,450 |
| Total | 37,898,708 |
| Home Construction 0.6% |
| SunPower Corp. |
| 01/15/2023 | 4.000% | | 8,030,000 | 6,430,625 |
| Independent Energy 1.5% |
| Chesapeake Energy Corp. |
| 09/15/2026 | 5.500% | | 12,500,000 | 11,449,075 |
| PDC Energy, Inc. |
| 09/15/2021 | 1.125% | | 6,000,000 | 5,618,136 |
| Total | 17,067,211 |
| Leisure 0.5% |
| World Wrestling Entertainment, Inc.(e) |
| 12/15/2023 | 3.375% | | 1,600,000 | 5,441,901 |
The accompanying Notes to Financial Statements are an integral part of this statement.
Columbia Convertible Securities Fund | Annual Report 2019
| 7 |
Portfolio of Investments (continued)
February 28, 2019
| Convertible Bonds(d) (continued) |
| Issuer | Coupon
Rate | | Principal
Amount ($) | Value ($) |
| Life Insurance 0.6% |
| AXA SA(e) |
| 05/15/2021 | 7.250% | | 7,200,000 | 6,915,305 |
| Lodging 0.6% |
| Marriott Vacations Worldwide Corp. |
| 09/15/2022 | 1.500% | | 7,000,000 | 6,650,574 |
| Media and Entertainment 1.7% |
| Liberty Media Corp.(e) |
| 03/31/2048 | 2.125% | | 11,000,000 | 10,786,875 |
| 12/01/2048 | 2.250% | | 7,500,000 | 7,921,530 |
| Total | 18,708,405 |
| Metals and Mining 0.5% |
| Endeavour Mining Corp.(e) |
| 02/15/2023 | 3.000% | | 5,700,000 | 5,308,410 |
| Midstream 0.4% |
| Scorpio Tankers, Inc.(e) |
| 07/01/2019 | 2.375% | | 4,790,000 | 4,706,103 |
| Other Financial Institutions 1.5% |
| Euronet Worldwide, Inc. |
| 10/01/2044 | 1.500% | | 5,500,000 | 10,223,125 |
| LendingTree, Inc. |
| 06/01/2022 | 0.625% | | 3,600,000 | 5,846,450 |
| Total | 16,069,575 |
| Other Industry 0.7% |
| Green Plains, Inc. |
| 09/01/2022 | 4.125% | | 7,700,000 | 7,165,813 |
| Other REIT 2.7% |
| Apollo Commercial Real Estate Finance, Inc. |
| 08/23/2022 | 4.750% | | 7,000,000 | 6,794,375 |
| Blackstone Mortgage Trust, Inc. |
| 05/05/2022 | 4.375% | | 7,800,000 | 7,813,377 |
| IH Merger Sub LLC |
| 01/15/2022 | 3.500% | | 10,000,000 | 11,144,370 |
| New York Mortgage Trust, Inc. |
| 01/15/2022 | 6.250% | | 4,700,000 | 4,626,562 |
| Total | 30,378,684 |
| Pharmaceuticals 13.1% |
| Acorda Therapeutics, Inc. |
| 06/15/2021 | 1.750% | | 6,500,000 | 5,732,194 |
| Aegerion Pharmaceuticals, Inc. |
| 08/15/2019 | 2.000% | | 4,460,000 | 3,336,638 |
| Convertible Bonds(d) (continued) |
| Issuer | Coupon
Rate | | Principal
Amount ($) | Value ($) |
| Alder Biopharmaceuticals, Inc. |
| 02/01/2025 | 2.500% | | 8,700,000 | 8,042,063 |
| Array BioPharma, Inc.(e) |
| 12/01/2024 | 2.625% | | 4,000,000 | 6,740,000 |
| BioMarin Pharmaceutical, Inc. |
| 08/01/2024 | 0.599% | | 11,500,000 | 11,995,937 |
| Canopy Growth Corp.(e) |
| 07/15/2023 | 4.250% | CAD | 3,000,000 | 3,291,348 |
| Clovis Oncology, Inc. |
| 05/01/2025 | 1.250% | | 14,500,000 | 11,607,714 |
| Dermira, Inc. |
| 05/15/2022 | 3.000% | | 9,300,000 | 7,259,813 |
| Illumina, Inc. |
| 06/15/2021 | 0.500% | | 9,500,000 | 12,950,257 |
| ImmunoGen, Inc. |
| 07/01/2021 | 4.500% | | 1,000,000 | 1,315,481 |
| Innoviva, Inc. |
| Subordinated |
| 01/15/2023 | 2.125% | | 5,000,000 | 5,257,340 |
| Insmed, Inc. |
| 01/15/2025 | 1.750% | | 13,000,000 | 13,065,000 |
| Intercept Pharmaceuticals, Inc. |
| 07/01/2023 | 3.250% | | 10,200,000 | 9,537,622 |
| Medicines Co. (The)(e) |
| 01/15/2024 | 3.500% | | 7,000,000 | 8,165,381 |
| PTC Therapeutics, Inc. |
| 08/15/2022 | 3.000% | | 7,000,000 | 7,091,938 |
| Radius Health, Inc. |
| 09/01/2024 | 3.000% | | 10,400,000 | 8,481,824 |
| Sarepta Therapeutics, Inc. |
| 11/15/2024 | 1.500% | | 4,000,000 | 8,395,000 |
| Supernus Pharmaceuticals, Inc.(e) |
| 04/01/2023 | 0.625% | | 8,000,000 | 8,067,152 |
| Tilray, Inc.(e) |
| 10/01/2023 | 5.000% | | 6,250,000 | 5,378,906 |
| Total | 145,711,608 |
| Property & Casualty 1.2% |
| Heritage Insurance Holdings, Inc. |
| 08/01/2037 | 5.875% | | 4,200,000 | 5,036,212 |
| MGIC Investment Corp.(e),(f) |
| Junior Subordinated |
| 04/01/2063 | 9.000% | | 6,070,000 | 7,779,785 |
| Total | 12,815,997 |
The accompanying Notes to Financial Statements are an integral part of this statement.
| 8 | Columbia Convertible Securities Fund | Annual Report 2019 |
Portfolio of Investments (continued)
February 28, 2019
| Convertible Bonds(d) (continued) |
| Issuer | Coupon
Rate | | Principal
Amount ($) | Value ($) |
| Retailers 1.2% |
| GNC Holdings, Inc. |
| 08/15/2020 | 1.500% | | 6,000,000 | 4,591,482 |
| Restoration Hardware, Inc.(e),(g) |
| 06/15/2023 | 0.000% | | 8,500,000 | 8,612,336 |
| Total | 13,203,818 |
| Technology 33.1% |
| Akamai Technologies, Inc.(e) |
| 05/01/2025 | 0.125% | | 10,500,000 | 10,368,551 |
| Atlassian, Inc.(e) |
| 05/01/2023 | 0.625% | | 6,500,000 | 9,343,750 |
| Boingo Wireless, Inc.(e) |
| 10/01/2023 | 1.000% | | 9,000,000 | 7,888,086 |
| Coupa Software, Inc.(e) |
| 01/15/2023 | 0.375% | | 3,500,000 | 7,546,074 |
| CSG Systems International, Inc. |
| 03/15/2036 | 4.250% | | 5,500,000 | 5,741,703 |
| DocuSign, Inc.(e) |
| 09/15/2023 | 0.500% | | 9,000,000 | 9,585,000 |
| Electronics for Imaging, Inc.(e) |
| 11/15/2023 | 2.250% | | 6,000,000 | 6,124,680 |
| Exact Sciences Corp. |
| 01/15/2025 | 1.000% | | 8,000,000 | 11,140,480 |
| Guidewire Software, Inc. |
| 03/15/2025 | 1.250% | | 8,000,000 | 8,466,888 |
| IAC FinanceCo, Inc.(e) |
| 10/01/2022 | 0.875% | | 5,300,000 | 7,861,055 |
| Intel Corp. |
| Junior Subordinated |
| 08/01/2039 | 3.250% | | 5,300,000 | 13,703,680 |
| MercadoLibre, Inc.(e) |
| 08/15/2028 | 2.000% | | 8,000,000 | 9,762,816 |
| Microchip Technology, Inc. |
| 02/15/2027 | 1.625% | | 17,000,000 | 19,536,043 |
| Junior Subordinated |
| 02/15/2037 | 2.250% | | 16,500,000 | 19,179,699 |
| Micron Technology, Inc. |
| 11/15/2043 | 3.000% | | 8,500,000 | 11,910,939 |
| MongoDB, Inc.(e) |
| 06/15/2024 | 0.750% | | 3,500,000 | 5,599,314 |
| New Relic, Inc.(e) |
| 05/01/2023 | 0.500% | | 8,000,000 | 9,279,368 |
| Okta, Inc. |
| 02/15/2023 | 0.250% | | 4,500,000 | 8,339,081 |
| Convertible Bonds(d) (continued) |
| Issuer | Coupon
Rate | | Principal
Amount ($) | Value ($) |
| ON Semiconductor Corp. |
| 10/15/2023 | 1.625% | | 8,300,000 | 10,472,118 |
| Palo Alto Networks, Inc.(e) |
| 07/01/2023 | 0.750% | | 22,000,000 | 24,467,696 |
| Pure Storage, Inc.(e) |
| 04/15/2023 | 0.125% | | 7,500,000 | 7,772,250 |
| Rapid7, Inc.(e) |
| 08/01/2023 | 1.250% | | 5,000,000 | 6,370,525 |
| Red Hat, Inc. |
| 10/01/2019 | 0.250% | | 4,000,000 | 9,894,696 |
| ServiceNow, Inc.(g) |
| 06/01/2022 | 0.000% | | 8,000,000 | 14,417,528 |
| Silicon Laboratories, Inc. |
| 03/01/2022 | 1.375% | | 7,500,000 | 8,106,960 |
| Splunk, Inc.(e) |
| 09/15/2025 | 1.125% | | 14,500,000 | 16,413,985 |
| Square, Inc.(e) |
| 05/15/2023 | 0.500% | | 18,000,000 | 22,818,600 |
| Tabula Rasa HealthCare, Inc.(e) |
| 02/15/2026 | 1.750% | | 5,500,000 | 5,750,910 |
| Teradyne, Inc. |
| 12/15/2023 | 1.250% | | 6,200,000 | 8,800,125 |
| Twilio, Inc.(e) |
| 06/01/2023 | 0.250% | | 6,000,000 | 10,731,000 |
| Veeco Instruments, Inc. |
| 01/15/2023 | 2.700% | | 6,500,000 | 5,506,644 |
| Verastem, Inc. |
| 11/01/2048 | 5.000% | | 6,500,000 | 5,136,203 |
| Vishay Intertechnology, Inc.(e) |
| 06/15/2025 | 2.250% | | 10,000,000 | 9,843,320 |
| Workday, Inc. |
| 10/01/2022 | 0.250% | | 7,500,000 | 10,793,520 |
| Zendesk, Inc.(e) |
| 03/15/2023 | 0.250% | | 6,000,000 | 8,277,432 |
| Total | 366,950,719 |
| Tobacco 0.4% |
| Vector Group Ltd.(f) |
| 04/15/2020 | 1.750% | | 4,720,000 | 4,802,600 |
| Wireless 0.5% |
| Gogo, Inc.(e) |
| 05/15/2022 | 6.000% | | 5,500,000 | 5,259,711 |
| Wirelines 1.9% |
| GCI Liberty, Inc.(e) |
| 09/30/2046 | 1.750% | | 12,500,000 | 13,655,875 |
The accompanying Notes to Financial Statements are an integral part of this statement.
Columbia Convertible Securities Fund | Annual Report 2019
| 9 |
Portfolio of Investments (continued)
February 28, 2019
| Convertible Bonds(d) (continued) |
| Issuer | Coupon
Rate | | Principal
Amount ($) | Value ($) |
| RingCentral, Inc.(e),(g) |
| 03/15/2023 | 0.000% | | 5,000,000 | 6,994,445 |
| Total | 20,650,320 |
Total Convertible Bonds
(Cost $742,787,891) | 813,190,518 |
| Convertible Preferred Stocks 18.5% |
| Issuer | | Shares | Value ($) |
| Consumer Staples 1.5% |
| Food Products 1.0% |
| Bunge Ltd. | 4.875% | 115,000 | 11,106,021 |
| Household Products 0.5% |
| Energizer Holdings, Inc. | 7.500% | 55,000 | 5,531,290 |
| Total Consumer Staples | 16,637,311 |
| Energy 0.4% |
| Energy Equipment & Services 0.4% |
| Nabors Industries Ltd. | 6.000% | 180,000 | 4,603,896 |
| Total Energy | 4,603,896 |
| Financials 3.7% |
| Banks 2.7% |
| Bank of America Corp. | 7.250% | 23,000 | 29,849,860 |
| Capital Markets 0.5% |
| Cowen, Inc. | 5.625% | 6,200 | 5,288,538 |
| Insurance 0.5% |
| Assurant, Inc. | 6.500% | 52,500 | 5,715,439 |
| Total Financials | 40,853,837 |
| Health Care 3.3% |
| Health Care Equipment & Supplies 3.3% |
| Becton Dickinson and Co. | 6.125% | 320,000 | 19,744,000 |
| Danaher Corp. | 4.750% | 17,000 | 17,373,320 |
| Total | | | 37,117,320 |
| Total Health Care | 37,117,320 |
| Convertible Preferred Stocks (continued) |
| Issuer | | Shares | Value ($) |
| Industrials 2.5% |
| Machinery 2.5% |
| Colfax Corp. | 5.750% | 45,000 | 5,474,326 |
| Fortive Corp. | 5.000% | 16,000 | 16,634,997 |
| Rexnord Corp. | 5.750% | 90,000 | 5,058,495 |
| Total | | | 27,167,818 |
| Total Industrials | 27,167,818 |
| Information Technology 0.6% |
| Electronic Equipment, Instruments & Components 0.6% |
| Belden, Inc. | 6.750% | 85,000 | 7,074,550 |
| Total Information Technology | 7,074,550 |
| Materials 0.7% |
| Chemicals 0.7% |
| International Flavors & Fragrances, Inc. | 6.000% | 160,000 | 7,926,400 |
| Total Materials | 7,926,400 |
| Real Estate 2.3% |
| Equity Real Estate Investment Trusts (REITS) 2.3% |
| Crown Castle International Corp. | 6.875% | 15,500 | 17,198,489 |
| QTS Realty Trust, Inc. | | 80,000 | 8,345,840 |
| Total | | | 25,544,329 |
| Total Real Estate | 25,544,329 |
| Utilities 3.5% |
| Electric Utilities 1.1% |
| NextEra Energy, Inc. | 6.123% | 200,000 | 12,183,940 |
| Multi-Utilities 2.4% |
| CenterPoint Energy, Inc. | 7.000% | 250,000 | 13,074,325 |
| DTE Energy Co. | 6.500% | 235,000 | 13,024,946 |
| Total | | | 26,099,271 |
| Total Utilities | 38,283,211 |
Total Convertible Preferred Stocks
(Cost $199,656,725) | 205,208,672 |
|
| Equity-Linked Notes 0.8% |
| Issuer | Coupon
Rate | Shares | Value ($) |
| Credit Suisse AG(e) |
| (linked to common stock of Stanley Black & Decker, Inc.) |
| 05/15/2020 | 6.000% | 69,050 | 9,042,699 |
Total Equity-Linked Notes
(Cost $10,002,583) | 9,042,699 |
The accompanying Notes to Financial Statements are an integral part of this statement.
| 10 | Columbia Convertible Securities Fund | Annual Report 2019 |
Portfolio of Investments (continued)
February 28, 2019
| Money Market Funds 4.6% |
| | Shares | Value ($) |
| Columbia Short-Term Cash Fund, 2.523%(h),(i) | 51,277,519 | 51,272,392 |
Total Money Market Funds
(Cost $51,272,392) | 51,272,392 |
Total Investments in Securities
(Cost: $1,033,223,303) | 1,118,368,806 |
| Other Assets & Liabilities, Net | | (9,786,293) |
| Net Assets | 1,108,582,513 |
Notes to Portfolio of Investments
| (a) | Represents fair value as determined in good faith under procedures approved by the Board of Trustees. At February 28, 2019, the total value of these securities amounted to $2,295,715, which represents 0.21% of total net assets. |
| (b) | Non-income producing investment. |
| (c) | Valuation based on significant unobservable inputs. |
| (d) | Principal amounts are denominated in United States Dollars unless otherwise noted. |
| (e) | Represents privately placed and other securities and instruments exempt from SEC registration (collectively, private placements), such as Section 4(a)(2) and Rule 144A eligible securities, which are often sold only to qualified institutional buyers. The Fund may invest in private placements determined to be liquid as well as those determined to be illiquid. Private placements may be determined to be liquid under guidelines established by the Fund’s Board of Trustees. At February 28, 2019, the total value of these securities amounted to $357,773,115, which represents 32.27% of total net assets. |
| (f) | Represents a variable rate security with a step coupon where the rate adjusts according to a schedule for a series of periods, typically lower for an initial period and then increasing to a higher coupon rate thereafter. The interest rate shown was the current rate as of February 28, 2019. |
| (g) | Zero coupon bond. |
| (h) | The rate shown is the seven-day current annualized yield at February 28, 2019. |
| (i) | As defined in the Investment Company Act of 1940, an affiliated company is one in which the Fund owns 5% or more of the company’s outstanding voting securities, or a company which is under common ownership or control with the Fund. Holdings and transactions in these affiliated companies during the year ended February 28, 2019 are as follows: |
| Issuer | Beginning
shares | Shares
purchased | Shares
sold | Ending
shares | Realized gain
(loss) —
affiliated
issuers ($) | Net change in
unrealized
appreciation
(depreciation) —
affiliated
issuers ($) | Dividends —
affiliated
issuers ($) | Value —
affiliated
issuers
at end of
period ($) |
| Columbia Short-Term Cash Fund, 2.523% |
| | 41,182,650 | 475,189,101 | (465,094,232) | 51,277,519 | (1,011) | 957 | 789,678 | 51,272,392 |
Currency Legend
Fair value measurements
The Fund categorizes its fair value measurements according to a three-level hierarchy that maximizes the use of observable inputs and minimizes the use of unobservable inputs by prioritizing that the most observable input be used when available. Observable inputs are those that market participants would use in pricing an investment based on market data obtained from sources independent of the reporting entity. Unobservable inputs are those that reflect the Fund’s assumptions about the information market participants would use in pricing an investment. An investment’s level within the fair value hierarchy is based on the lowest level of any input that is deemed significant to the asset’s or liability’s fair value measurement. The input levels are not necessarily an indication of the risk or liquidity associated with investments at that level. For example, certain U.S. government securities are generally high quality and liquid, however, they are reflected as Level 2 because the inputs used to determine fair value may not always be quoted prices in an active market.
Fair value inputs are summarized in the three broad levels listed below:
| ■ | Level 1 — Valuations based on quoted prices for investments in active markets that the Fund has the ability to access at the measurement date. Valuation adjustments are not applied to Level 1 investments. |
| ■ | Level 2 — Valuations based on other significant observable inputs (including quoted prices for similar securities, interest rates, prepayment speeds, credit risks, etc.). |
| ■ | Level 3 — Valuations based on significant unobservable inputs (including the Fund’s own assumptions and judgment in determining the fair value of investments). |
The accompanying Notes to Financial Statements are an integral part of this statement.
Columbia Convertible Securities Fund | Annual Report 2019
| 11 |
Portfolio of Investments (continued)
February 28, 2019
Fair value measurements (continued)
Inputs that are used in determining fair value of an investment may include price information, credit data, volatility statistics, and other factors. These inputs can be either observable or unobservable. The availability of observable inputs can vary between investments, and is affected by various factors such as the type of investment, and the volume and level of activity for that investment or similar investments in the marketplace. The inputs will be considered by the Investment Manager, along with any other relevant factors in the calculation of an investment’s fair value. The Fund uses prices and inputs that are current as of the measurement date, which may include periods of market dislocations. During these periods, the availability of prices and inputs may be reduced for many investments. This condition could cause an investment to be reclassified between the various levels within the hierarchy.
Certain investments that have been measured at fair value using the net asset value (NAV) per share (or its equivalent) are not categorized in the fair value hierarchy. The fair value amounts presented in the table are intended to reconcile the fair value hierarchy to the amounts presented in the Portfolio of Investments. The Columbia Short-Term Cash Fund seeks to provide shareholders with maximum current income consistent with liquidity and stability of principal. Columbia Short-Term Cash Fund prices its shares with a floating NAV and no longer seeks to maintain a stable NAV.
Investments falling into the Level 3 category are primarily supported by quoted prices from brokers and dealers participating in the market for those investments. However, these may be classified as Level 3 investments due to lack of market transparency and corroboration to support these quoted prices. Additionally, valuation models may be used as the pricing source for any remaining investments classified as Level 3. These models may rely on one or more significant unobservable inputs and/or significant assumptions by the Investment Manager. Inputs used in valuations may include, but are not limited to, financial statement analysis, capital account balances, discount rates and estimated cash flows, and comparable company data.
Under the direction of the Fund’s Board of Trustees (the Board), the Investment Manager’s Valuation Committee (the Committee) is responsible for overseeing the valuation procedures approved by the Board. The Committee consists of voting and non-voting members from various groups within the Investment Manager’s organization, including operations and accounting, trading and investments, compliance, risk management and legal.
The Committee meets at least monthly to review and approve valuation matters, which may include a description of specific valuation determinations, data regarding pricing information received from approved pricing vendors and brokers and the results of Board-approved valuation control policies and procedures (the Policies). The Policies address, among other things, instances when market quotations are or are not readily available, including recommendations of third party pricing vendors and a determination of appropriate pricing methodologies; events that require specific valuation determinations and assessment of fair value techniques; securities with a potential for stale pricing, including those that are illiquid, restricted, or in default; and the effectiveness of third party pricing vendors, including periodic reviews of vendors. The Committee meets more frequently, as needed, to discuss additional valuation matters, which may include the need to review back-testing results, review time-sensitive information or approve related valuation actions. The Committee reports to the Board, with members of the Committee meeting with the Board at each of its regularly scheduled meetings to discuss valuation matters and actions during the period, similar to those described earlier.
For investments categorized as Level 3, the Committee monitors information similar to that described above, which may include: (i) data specific to the issuer or comparable issuers, (ii) general market or specific sector news and (iii) quoted prices and specific or similar security transactions. The Committee considers this data and any changes from prior periods in order to assess the reasonableness of observable and unobservable inputs, any assumptions or internal models used to value those securities and changes in fair value. This data is also used to corroborate, when available, information received from approved pricing vendors and brokers. Various factors impact the frequency of monitoring this information (which may occur as often as daily). However, the Committee may determine that changes to inputs, assumptions and models are not required as a result of the monitoring procedures performed.
The following table is a summary of the inputs used to value the Fund’s investments at February 28, 2019:
| | Level 1
quoted prices
in active
markets for
identical
assets ($) | Level 2
other
significant
observable
inputs ($) | Level 3
significant
unobservable
inputs ($) | Investments
measured at
net asset
value ($) | Total ($) |
| Investments in Securities | | | | | |
| Common Stocks | | | | | |
| Consumer Discretionary | 4,315,850 | — | — | — | 4,315,850 |
| Energy | — | — | 2,295,715 | — | 2,295,715 |
| Health Care | 16,241,450 | — | — | — | 16,241,450 |
| Information Technology | 16,801,510 | — | — | — | 16,801,510 |
| Total Common Stocks | 37,358,810 | — | 2,295,715 | — | 39,654,525 |
| Convertible Bonds | — | 813,190,518 | — | — | 813,190,518 |
| Convertible Preferred Stocks | | | | | |
| Consumer Staples | — | 16,637,311 | — | — | 16,637,311 |
| Energy | — | 4,603,896 | — | — | 4,603,896 |
| Financials | 29,849,860 | 11,003,977 | — | — | 40,853,837 |
| Health Care | — | 37,117,320 | — | — | 37,117,320 |
| Industrials | — | 27,167,818 | — | — | 27,167,818 |
| Information Technology | — | 7,074,550 | — | — | 7,074,550 |
| Materials | — | 7,926,400 | — | — | 7,926,400 |
| Real Estate | — | 25,544,329 | — | — | 25,544,329 |
| Utilities | — | 38,283,211 | — | — | 38,283,211 |
| Total Convertible Preferred Stocks | 29,849,860 | 175,358,812 | — | — | 205,208,672 |
The accompanying Notes to Financial Statements are an integral part of this statement.
| 12 | Columbia Convertible Securities Fund | Annual Report 2019 |
Portfolio of Investments (continued)
February 28, 2019
Fair value measurements (continued)
| | Level 1
quoted prices
in active
markets for
identical
assets ($) | Level 2
other
significant
observable
inputs ($) | Level 3
significant
unobservable
inputs ($) | Investments
measured at
net asset
value ($) | Total ($) |
| Equity-Linked Notes | — | 9,042,699 | — | — | 9,042,699 |
| Money Market Funds | — | — | — | 51,272,392 | 51,272,392 |
| Total Investments in Securities | 67,208,670 | 997,592,029 | 2,295,715 | 51,272,392 | 1,118,368,806 |
See the Portfolio of Investments for all investment classifications not indicated in the table.
The Fund’s assets assigned to the Level 2 input category are generally valued using the market approach, in which a security’s value is determined through reference to prices and information from market transactions for similar or identical assets.
There were no transfers of financial assets between Levels 2 and 3 during the period.
Financial assets were transferred from Level 1 to Level 2 as the market for these assets was deemed not to be active and fair values were consequently obtained using observable market inputs rather than quoted prices for identical assets as of period end.
Transfers between levels are determined based on the fair value at the beginning of the period for security positions held throughout the period.
The following table(s) show(s) transfers between levels of the fair value hierarchy:
| Transfers In | Transfers Out |
| Level 1 ($) | Level 2 ($) | Level 1 ($) | Level 2 ($) |
| — | 58,872,715 | 58,872,715 | — |
The Fund does not hold any significant investments (greater than one percent of net assets) categorized as Level 3.
The Fund’s assets assigned to the Level 3 category are valued utilizing the valuation technique deemed the most appropriate in the circumstances. Certain common stocks classified as Level 3 are valued using a market approach. To determine fair value for these securities, management considered various factors which may have included, but were not limited to, the Fund’s pro-rata interest in the company’s capital balance, estimated earnings of the respective company, and the position of the security within the respective company’s capital structure. Significant increases (decreases) to any of these inputs would result in a significantly higher (lower) fair value measurement. Generally, a change in the fund’s pro-rata interest would result in a change to the company’s capital balance.
The accompanying Notes to Financial Statements are an integral part of this statement.
Columbia Convertible Securities Fund | Annual Report 2019
| 13 |
Statement of Assets and Liabilities
February 28, 2019
| Assets | |
| Investments in securities, at value | |
| Unaffiliated issuers (cost $981,950,911) | $1,067,096,414 |
| Affiliated issuers (cost $51,272,392) | 51,272,392 |
| Receivable for: | |
| Investments sold | 1,377,262 |
| Capital shares sold | 1,952,744 |
| Dividends | 695,291 |
| Interest | 4,203,784 |
| Expense reimbursement due from Investment Manager | 2,240 |
| Prepaid expenses | 2,226 |
| Total assets | 1,126,602,353 |
| Liabilities | |
| Payable for: | |
| Investments purchased | 17,000,000 |
| Capital shares purchased | 705,351 |
| Management services fees | 23,995 |
| Distribution and/or service fees | 3,209 |
| Transfer agent fees | 94,381 |
| Compensation of board members | 124,661 |
| Compensation of chief compliance officer | 14 |
| Other expenses | 68,229 |
| Total liabilities | 18,019,840 |
| Net assets applicable to outstanding capital stock | $1,108,582,513 |
| Represented by | |
| Paid in capital | 1,015,258,320 |
| Total distributable earnings (loss) (Note 2) | 93,324,193 |
| Total - representing net assets applicable to outstanding capital stock | $1,108,582,513 |
The accompanying Notes to Financial Statements are an integral part of this statement.
| 14 | Columbia Convertible Securities Fund | Annual Report 2019 |
Statement of Assets and Liabilities (continued)
February 28, 2019
| Class A | |
| Net assets | $286,075,238 |
| Shares outstanding | 13,675,526 |
| Net asset value per share | $20.92 |
| Maximum sales charge | 5.75% |
| Maximum offering price per share (calculated by dividing the net asset value per share by 1.0 minus the maximum sales charge for Class A shares) | $22.20 |
| Advisor Class | |
| Net assets | $51,486,594 |
| Shares outstanding | 2,435,864 |
| Net asset value per share | $21.14 |
| Class C | |
| Net assets | $44,034,953 |
| Shares outstanding | 2,113,237 |
| Net asset value per share | $20.84 |
| Institutional Class | |
| Net assets | $544,139,714 |
| Shares outstanding | 25,963,959 |
| Net asset value per share | $20.96 |
| Institutional 2 Class | |
| Net assets | $80,366,609 |
| Shares outstanding | 3,805,974 |
| Net asset value per share | $21.12 |
| Institutional 3 Class | |
| Net assets | $100,142,167 |
| Shares outstanding | 4,705,437 |
| Net asset value per share | $21.28 |
| Class R | |
| Net assets | $2,337,238 |
| Shares outstanding | 111,849 |
| Net asset value per share | $20.90 |
The accompanying Notes to Financial Statements are an integral part of this statement.
Columbia Convertible Securities Fund | Annual Report 2019
| 15 |
Statement of Operations
Year Ended February 28, 2019
| Net investment income | |
| Income: | |
| Dividends — unaffiliated issuers | $10,972,186 |
| Dividends — affiliated issuers | 789,678 |
| Interest | 17,071,712 |
| Interfund lending | 2,062 |
| Total income | 28,835,638 |
| Expenses: | |
| Management services fees | 7,620,759 |
| Distribution and/or service fees | |
| Class A | 652,663 |
| Class C | 404,600 |
| Class R | 13,751 |
| Class T | 76 |
| Transfer agent fees | |
| Class A | 312,806 |
| Advisor Class | 35,861 |
| Class C | 48,516 |
| Institutional Class | 560,988 |
| Institutional 2 Class | 37,009 |
| Institutional 3 Class | 7,113 |
| Class R | 3,293 |
| Class T | 36 |
| Compensation of board members | 19,366 |
| Custodian fees | 10,135 |
| Printing and postage fees | 70,060 |
| Registration fees | 153,689 |
| Audit fees | 37,975 |
| Legal fees | 14,986 |
| Interest on interfund lending | 66 |
| Compensation of chief compliance officer | 198 |
| Other | 30,185 |
| Total expenses | 10,034,131 |
| Fees waived or expenses reimbursed by Investment Manager and its affiliates | (711,529) |
| Fees waived by transfer agent | |
| Institutional 2 Class | (3,262) |
| Institutional 3 Class | (4,833) |
| Expense reduction | (700) |
| Total net expenses | 9,313,807 |
| Net investment income | 19,521,831 |
| Realized and unrealized gain (loss) — net | |
| Net realized gain (loss) on: | |
| Investments — unaffiliated issuers | 49,822,983 |
| Investments — affiliated issuers | (1,011) |
| Foreign currency translations | (4,996) |
| Net realized gain | 49,816,976 |
| Net change in unrealized appreciation (depreciation) on: | |
| Investments — unaffiliated issuers | (146,683) |
| Investments — affiliated issuers | 957 |
| Foreign currency translations | 59 |
| Net change in unrealized appreciation (depreciation) | (145,667) |
| Net realized and unrealized gain | 49,671,309 |
| Net increase in net assets resulting from operations | $69,193,140 |
The accompanying Notes to Financial Statements are an integral part of this statement.
| 16 | Columbia Convertible Securities Fund | Annual Report 2019 |
Statement of Changes in Net Assets
| | Year Ended
February 28, 2019 | Year Ended
February 28, 2018 |
| Operations | | |
| Net investment income | $19,521,831 | $18,476,329 |
| Net realized gain | 49,816,976 | 39,351,154 |
| Net change in unrealized appreciation (depreciation) | (145,667) | 36,635,827 |
| Net increase in net assets resulting from operations | 69,193,140 | 94,463,310 |
| Distributions to shareholders | | |
| Net investment income and net realized gains | | |
| Class A | (12,738,952) | |
| Advisor Class | (1,481,568) | |
| Class C | (1,662,746) | |
| Institutional Class | (24,982,005) | |
| Institutional 2 Class | (3,368,780) | |
| Institutional 3 Class | (4,841,333) | |
| Class R | (118,214) | |
| Class T | (1,687) | |
| Net investment income | | |
| Class A | | (6,739,140) |
| Advisor Class | | (465,367) |
| Class B | | (1,037) |
| Class C | | (817,792) |
| Class I | | (667,656) |
| Institutional Class | | (9,821,119) |
| Institutional 2 Class | | (2,196,731) |
| Institutional 3 Class | | (2,150,013) |
| Class R | | (83,251) |
| Class T | | (1,375) |
| Total distributions to shareholders (Note 2) | (49,195,285) | (22,943,481) |
| Increase in net assets from capital stock activity | 245,000,419 | 44,429,491 |
| Total increase in net assets | 264,998,274 | 115,949,320 |
| Net assets at beginning of year | 843,584,239 | 727,634,919 |
| Net assets at end of year | $1,108,582,513 | $843,584,239 |
| Undistributed (excess of distributions over) net investment income | $303,321 | $(2,525,569) |
The accompanying Notes to Financial Statements are an integral part of this statement.
Columbia Convertible Securities Fund | Annual Report 2019
| 17 |
Statement of Changes in Net Assets (continued)
| | Year Ended | Year Ended |
| | February 28, 2019 | February 28, 2018 |
| | Shares | Dollars ($) | Shares | Dollars ($) |
| Capital stock activity |
| Class A | | | | |
| Subscriptions | 4,172,480 | 85,945,217 | 2,884,158 | 55,952,259 |
| Distributions reinvested | 431,159 | 8,523,504 | 217,367 | 4,175,959 |
| Redemptions | (3,082,744) | (62,933,185) | (6,461,623) | (122,715,632) |
| Net increase (decrease) | 1,520,895 | 31,535,536 | (3,360,098) | (62,587,414) |
| Advisor Class | | | | |
| Subscriptions | 2,549,520 | 52,499,070 | 563,583 | 11,111,339 |
| Distributions reinvested | 73,988 | 1,481,424 | 23,907 | 465,285 |
| Redemptions | (1,081,929) | (22,255,559) | (319,576) | (6,361,222) |
| Net increase | 1,541,579 | 31,724,935 | 267,914 | 5,215,402 |
| Class B | | | | |
| Subscriptions | — | — | 14 | 240 |
| Distributions reinvested | — | — | 43 | 772 |
| Redemptions | — | — | (8,944) | (166,122) |
| Net decrease | — | — | (8,887) | (165,110) |
| Class C | | | | |
| Subscriptions | 683,086 | 14,015,683 | 401,508 | 7,796,904 |
| Distributions reinvested | 72,090 | 1,413,721 | 35,785 | 685,998 |
| Redemptions | (629,862) | (13,016,084) | (719,242) | (13,767,086) |
| Net increase (decrease) | 125,314 | 2,413,320 | (281,949) | (5,284,184) |
| Class I | | | | |
| Distributions reinvested | — | — | 36,463 | 667,718 |
| Redemptions | — | — | (4,598,386) | (84,470,170) |
| Net decrease | — | — | (4,561,923) | (83,802,452) |
| Institutional Class | | | | |
| Subscriptions | 15,114,824 | 312,133,611 | 11,573,656 | 223,546,403 |
| Distributions reinvested | 916,774 | 18,154,010 | 333,051 | 6,413,438 |
| Redemptions | (9,303,311) | (186,562,038) | (4,941,695) | (96,252,519) |
| Net increase | 6,728,287 | 143,725,583 | 6,965,012 | 133,707,322 |
| Institutional 2 Class | | | | |
| Subscriptions | 2,622,930 | 54,101,373 | 1,032,319 | 20,162,601 |
| Distributions reinvested | 168,798 | 3,368,633 | 113,394 | 2,196,647 |
| Redemptions | (1,400,041) | (27,998,257) | (2,203,774) | (44,150,364) |
| Net increase (decrease) | 1,391,687 | 29,471,749 | (1,058,061) | (21,791,116) |
| Institutional 3 Class | | | | |
| Subscriptions | 833,390 | 17,415,288 | 4,856,182 | 90,806,162 |
| Distributions reinvested | 240,177 | 4,840,196 | 108,478 | 2,148,481 |
| Redemptions | (738,309) | (15,321,230) | (661,453) | (13,271,495) |
| Net increase | 335,258 | 6,934,254 | 4,303,207 | 79,683,148 |
| Class R | | | | |
| Subscriptions | 24,847 | 507,976 | 41,970 | 821,414 |
| Distributions reinvested | 1,340 | 26,465 | 1,006 | 19,252 |
| Redemptions | (63,010) | (1,295,811) | (68,275) | (1,345,147) |
| Net decrease | (36,823) | (761,370) | (25,299) | (504,481) |
| Class T | | | | |
| Distributions reinvested | 78 | 1,548 | 68 | 1,299 |
| Redemptions | (2,311) | (45,136) | (2,298) | (42,923) |
| Net decrease | (2,233) | (43,588) | (2,230) | (41,624) |
| Total net increase | 11,603,964 | 245,000,419 | 2,237,686 | 44,429,491 |
The accompanying Notes to Financial Statements are an integral part of this statement.
| 18 | Columbia Convertible Securities Fund | Annual Report 2019 |
[THIS PAGE INTENTIONALLY LEFT BLANK]
Columbia Convertible Securities Fund | Annual Report 2019
| 19 |
The following table is intended to help you understand the Fund’s financial performance. Certain information reflects financial results for a single share of a class held for the periods shown. Per share net investment income (loss) amounts are calculated based on average shares outstanding during the period. Total return assumes reinvestment of all dividends and distributions, if any. Total return does not reflect payment of sales charges, if any. Total return and portfolio turnover are not annualized for periods of less than one year. The portfolio turnover rate is calculated without regard to purchase and sales transactions of short-term instruments and certain derivatives, if any. If such transactions were included, the Fund’s portfolio turnover rate may be higher.
| | Net asset value,
beginning of
period | Net
investment
income | Net
realized
and
unrealized
gain (loss) | Total from
investment
operations | Distributions
from net
investment
income | Distributions
from net
realized
gains | Total
distributions to
shareholders |
| Class A |
| Year Ended 2/28/2019 | $20.41 | 0.39 | 1.11 | 1.50 | (0.40) | (0.59) | (0.99) |
| Year Ended 2/28/2018 | $18.64 | 0.43 | 1.89 | 2.32 | (0.55) | — | (0.55) |
| Year Ended 2/28/2017 | $15.07 | 0.47 | 3.52 | 3.99 | (0.42) | — | (0.42) |
| Year Ended 2/29/2016 | $19.53 | 0.38 | (3.25) | (2.87) | (0.75) | (0.87) | (1.62) |
| Year Ended 2/28/2015 | $19.22 | 0.28 | 0.92 | 1.20 | (0.43) | (0.46) | (0.89) |
| Advisor Class |
| Year Ended 2/28/2019 | $20.61 | 0.44 | 1.13 | 1.57 | (0.45) | (0.59) | (1.04) |
| Year Ended 2/28/2018 | $18.82 | 0.48 | 1.90 | 2.38 | (0.59) | — | (0.59) |
| Year Ended 2/28/2017 | $15.21 | 0.50 | 3.57 | 4.07 | (0.46) | — | (0.46) |
| Year Ended 2/29/2016 | $19.69 | 0.45 | (3.29) | (2.84) | (0.80) | (0.87) | (1.67) |
| Year Ended 2/28/2015 | $19.37 | 0.33 | 0.93 | 1.26 | (0.48) | (0.46) | (0.94) |
| Class C |
| Year Ended 2/28/2019 | $20.33 | 0.23 | 1.12 | 1.35 | (0.25) | (0.59) | (0.84) |
| Year Ended 2/28/2018 | $18.57 | 0.29 | 1.87 | 2.16 | (0.40) | — | (0.40) |
| Year Ended 2/28/2017 | $15.02 | 0.34 | 3.50 | 3.84 | (0.29) | — | (0.29) |
| Year Ended 2/29/2016 | $19.46 | 0.25 | (3.24) | (2.99) | (0.61) | (0.87) | (1.48) |
| Year Ended 2/28/2015 | $19.16 | 0.14 | 0.91 | 1.05 | (0.29) | (0.46) | (0.75) |
| Institutional Class |
| Year Ended 2/28/2019 | $20.44 | 0.44 | 1.12 | 1.56 | (0.45) | (0.59) | (1.04) |
| Year Ended 2/28/2018 | $18.67 | 0.48 | 1.88 | 2.36 | (0.59) | — | (0.59) |
| Year Ended 2/28/2017 | $15.10 | 0.51 | 3.52 | 4.03 | (0.46) | — | (0.46) |
| Year Ended 2/29/2016 | $19.56 | 0.42 | (3.24) | (2.82) | (0.80) | (0.87) | (1.67) |
| Year Ended 2/28/2015 | $19.25 | 0.33 | 0.92 | 1.25 | (0.48) | (0.46) | (0.94) |
| Institutional 2 Class |
| Year Ended 2/28/2019 | $20.59 | 0.45 | 1.14 | 1.59 | (0.47) | (0.59) | (1.06) |
| Year Ended 2/28/2018 | $18.80 | 0.50 | 1.90 | 2.40 | (0.61) | — | (0.61) |
| Year Ended 2/28/2017 | $15.20 | 0.52 | 3.55 | 4.07 | (0.47) | — | (0.47) |
| Year Ended 2/29/2016 | $19.68 | 0.45 | (3.27) | (2.82) | (0.82) | (0.87) | (1.69) |
| Year Ended 2/28/2015 | $19.37 | 0.35 | 0.92 | 1.27 | (0.50) | (0.46) | (0.96) |
The accompanying Notes to Financial Statements are an integral part of this statement.
| 20 | Columbia Convertible Securities Fund | Annual Report 2019 |
Financial Highlights (continued)
| | Proceeds from
regulatory
settlements | Net
asset
value,
end of
period | Total
return | Total gross
expense
ratio to
average
net assets(a) | Total net
expense
ratio to
average
net assets(a),(b) | Net investment
income
ratio to
average
net assets | Portfolio
turnover | Net
assets,
end of
period
(000’s) |
| Class A |
| Year Ended 2/28/2019 | — | $20.92 | 7.70% | 1.20%(c) | 1.13%(c),(d) | 1.88% | 60% | $286,075 |
| Year Ended 2/28/2018 | — | $20.41 | 12.65% | 1.22% | 1.12%(d) | 2.21% | 67% | $248,052 |
| Year Ended 2/28/2017 | — | $18.64 | 26.68% | 1.25% | 1.13%(d) | 2.73% | 72% | $289,232 |
| Year Ended 2/29/2016 | 0.03 | $15.07 | (15.46%)(e) | 1.23%(f) | 1.11%(d),(f) | 2.11% | 71% | $287,364 |
| Year Ended 2/28/2015 | — | $19.53 | 6.44% | 1.30%(f) | 1.10%(d),(f) | 1.49% | 78% | $386,856 |
| Advisor Class |
| Year Ended 2/28/2019 | — | $21.14 | 7.99% | 0.95%(c) | 0.88%(c),(d) | 2.15% | 60% | $51,487 |
| Year Ended 2/28/2018 | — | $20.61 | 12.91% | 0.97% | 0.87%(d) | 2.43% | 67% | $18,432 |
| Year Ended 2/28/2017 | — | $18.82 | 27.00% | 1.00% | 0.88%(d) | 2.95% | 72% | $11,789 |
| Year Ended 2/29/2016 | 0.03 | $15.21 | (15.21%)(e) | 1.00%(f) | 0.87%(d),(f) | 2.59% | 71% | $14,556 |
| Year Ended 2/28/2015 | — | $19.69 | 6.71% | 1.05%(f) | 0.85%(d),(f) | 1.74% | 78% | $3,027 |
| Class C |
| Year Ended 2/28/2019 | — | $20.84 | 6.92% | 1.95%(c) | 1.88%(c),(d) | 1.14% | 60% | $44,035 |
| Year Ended 2/28/2018 | — | $20.33 | 11.80% | 1.97% | 1.87%(d) | 1.47% | 67% | $40,419 |
| Year Ended 2/28/2017 | — | $18.57 | 25.70% | 2.00% | 1.88%(d) | 1.98% | 72% | $42,161 |
| Year Ended 2/29/2016 | 0.03 | $15.02 | (16.06%)(e) | 1.99%(f) | 1.87%(d),(f) | 1.38% | 71% | $47,322 |
| Year Ended 2/28/2015 | — | $19.46 | 5.62% | 2.05%(f) | 1.85%(d),(f) | 0.74% | 78% | $54,655 |
| Institutional Class |
| Year Ended 2/28/2019 | — | $20.96 | 8.00% | 0.95%(c) | 0.88%(c),(d) | 2.13% | 60% | $544,140 |
| Year Ended 2/28/2018 | — | $20.44 | 12.91% | 0.97% | 0.87%(d) | 2.49% | 67% | $393,240 |
| Year Ended 2/28/2017 | — | $18.67 | 26.94% | 1.00% | 0.88%(d) | 2.97% | 72% | $229,113 |
| Year Ended 2/29/2016 | 0.03 | $15.10 | (15.21%)(e) | 0.98%(f) | 0.86%(d),(f) | 2.27% | 71% | $203,574 |
| Year Ended 2/28/2015 | — | $19.56 | 6.70% | 1.05%(f) | 0.85%(d),(f) | 1.74% | 78% | $816,941 |
| Institutional 2 Class |
| Year Ended 2/28/2019 | — | $21.12 | 8.07% | 0.89%(c) | 0.81%(c) | 2.19% | 60% | $80,367 |
| Year Ended 2/28/2018 | — | $20.59 | 13.02% | 0.90% | 0.80% | 2.54% | 67% | $49,709 |
| Year Ended 2/28/2017 | — | $18.80 | 27.08% | 0.90% | 0.79% | 3.02% | 72% | $65,291 |
| Year Ended 2/29/2016 | 0.03 | $15.20 | (15.13%)(e) | 0.87%(f) | 0.76%(f) | 2.48% | 71% | $38,717 |
| Year Ended 2/28/2015 | — | $19.68 | 6.80% | 0.86%(f) | 0.73%(f) | 1.86% | 78% | $35,859 |
The accompanying Notes to Financial Statements are an integral part of this statement.
Columbia Convertible Securities Fund | Annual Report 2019
| 21 |
Financial Highlights (continued)
| | Net asset value,
beginning of
period | Net
investment
income | Net
realized
and
unrealized
gain (loss) | Total from
investment
operations | Distributions
from net
investment
income | Distributions
from net
realized
gains | Total
distributions to
shareholders |
| Institutional 3 Class |
| Year Ended 2/28/2019 | $20.74 | 0.47 | 1.14 | 1.61 | (0.48) | (0.59) | (1.07) |
| Year Ended 2/28/2018 | $18.94 | 0.51 | 1.91 | 2.42 | (0.62) | — | (0.62) |
| Year Ended 2/28/2017 | $15.31 | 0.53 | 3.58 | 4.11 | (0.48) | — | (0.48) |
| Year Ended 2/29/2016 | $19.81 | 0.51 | (3.34) | (2.83) | (0.83) | (0.87) | (1.70) |
| Year Ended 2/28/2015(g) | $19.21 | 0.13 | 0.90 | 1.03 | (0.13) | (0.30) | (0.43) |
| Class R |
| Year Ended 2/28/2019 | $20.39 | 0.33 | 1.12 | 1.45 | (0.35) | (0.59) | (0.94) |
| Year Ended 2/28/2018 | $18.62 | 0.38 | 1.89 | 2.27 | (0.50) | — | (0.50) |
| Year Ended 2/28/2017 | $15.06 | 0.42 | 3.51 | 3.93 | (0.37) | — | (0.37) |
| Year Ended 2/29/2016 | $19.51 | 0.34 | (3.24) | (2.90) | (0.71) | (0.87) | (1.58) |
| Year Ended 2/28/2015 | $19.21 | 0.24 | 0.90 | 1.14 | (0.38) | (0.46) | (0.84) |
| Notes to Financial Highlights |
| (a) | In addition to the fees and expenses that the Fund bears directly, the Fund indirectly bears a pro rata share of the fees and expenses of any other funds in which it invests. Such indirect expenses are not included in the Fund’s reported expense ratios. |
| (b) | Total net expenses include the impact of certain fee waivers/expense reimbursements made by the Investment Manager and certain of its affiliates, if applicable. |
| (c) | Ratios include interfund lending expense which is less than 0.01%. |
| (d) | The benefits derived from expense reductions had an impact of less than 0.01%. |
| (e) | The Fund received proceeds from regulatory settlements. Had the Fund not received these proceeds, the total return would have been lower by 0.14%. |
| (f) | Ratios include line of credit interest expense which is less than 0.01%. |
| (g) | Institutional 3 Class shares commenced operations on October 1, 2014. Per share data and total return reflect activity from that date. |
| (h) | Annualized. |
The accompanying Notes to Financial Statements are an integral part of this statement.
| 22 | Columbia Convertible Securities Fund | Annual Report 2019 |
Financial Highlights (continued)
| | Proceeds from
regulatory
settlements | Net
asset
value,
end of
period | Total
return | Total gross
expense
ratio to
average
net assets(a) | Total net
expense
ratio to
average
net assets(a),(b) | Net investment
income
ratio to
average
net assets | Portfolio
turnover | Net
assets,
end of
period
(000’s) |
| Institutional 3 Class |
| Year Ended 2/28/2019 | — | $21.28 | 8.11% | 0.84%(c) | 0.76%(c) | 2.25% | 60% | $100,142 |
| Year Ended 2/28/2018 | — | $20.74 | 13.03% | 0.85% | 0.75% | 2.58% | 67% | $90,655 |
| Year Ended 2/28/2017 | — | $18.94 | 27.14% | 0.85% | 0.74% | 3.06% | 72% | $1,269 |
| Year Ended 2/29/2016 | 0.03 | $15.31 | (15.09%)(e) | 0.84%(f) | 0.72%(f) | 3.01% | 71% | $812 |
| Year Ended 2/28/2015(g) | — | $19.81 | 5.48% | 0.81%(f),(h) | 0.69%(f),(h) | 1.88%(h) | 78% | $61 |
| Class R |
| Year Ended 2/28/2019 | — | $20.90 | 7.44% | 1.45%(c) | 1.38%(c),(d) | 1.63% | 60% | $2,337 |
| Year Ended 2/28/2018 | — | $20.39 | 12.38% | 1.47% | 1.37%(d) | 1.97% | 67% | $3,031 |
| Year Ended 2/28/2017 | — | $18.62 | 26.32% | 1.50% | 1.38%(d) | 2.44% | 72% | $3,240 |
| Year Ended 2/29/2016 | 0.03 | $15.06 | (15.63%)(e) | 1.49%(f) | 1.37%(d),(f) | 1.91% | 71% | $2,429 |
| Year Ended 2/28/2015 | — | $19.51 | 6.13% | 1.55%(f) | 1.35%(d),(f) | 1.24% | 78% | $2,412 |
The accompanying Notes to Financial Statements are an integral part of this statement.
Columbia Convertible Securities Fund | Annual Report 2019
| 23 |
Notes to Financial Statements
February 28, 2019
Note 1. Organization
Columbia Convertible Securities Fund (the Fund), a series of Columbia Funds Series Trust (the Trust), is a diversified fund. The Trust is registered under the Investment Company Act of 1940, as amended (the 1940 Act), as an open-end management investment company organized as a Delaware statutory trust.
Fund shares
The Trust may issue an unlimited number of shares (without par value). Although all share classes generally have identical voting, dividend and liquidation rights, each share class votes separately when required by the Trust’s organizational documents or by law. Different share classes pay different distribution amounts to the extent the expenses of such share classes differ, and distributions in liquidation will be proportional to the net asset value of each share class. Each share class has its own expense and sales charge structure. The Fund offers each of the share classes identified below.
Class A shares are subject to a maximum front-end sales charge of 5.75% based on the initial investment amount. Class A shares purchased without an initial sales charge in accounts aggregating $1 million to $50 million at the time of purchase are subject to a contingent deferred sales charge (CDSC) if the shares are sold within 18 months after purchase, charged as follows: 1.00% CDSC if redeemed within 12 months after purchase, and 0.50% CDSC if redeemed more than 12, but less than 18, months after purchase.
Advisor Class shares are not subject to sales charges and are generally available only to omnibus retirement plans and certain investors as described in the Fund’s prospectus.
Class C shares are subject to a 1.00% CDSC on shares redeemed within 12 months after purchase. Effective July 1, 2018, Class C shares automatically convert to Class A shares of the same Fund in the month of or the month following the 10-year anniversary of the Class C shares purchase date.
Institutional Class shares are not subject to sales charges and are generally available only to eligible investors, which are subject to different investment minimums as described in the Fund’s prospectus.
Institutional 2 Class shares are not subject to sales charges and are generally available only to investors purchasing through authorized investment professionals and omnibus retirement plans as described in the Fund’s prospectus.
Institutional 3 Class shares are not subject to sales charges and are available to institutional and certain other investors as described in the Fund’s prospectus.
Class R shares are not subject to sales charges and are generally available only to certain retirement plans and other investors as described in the Fund’s prospectus.
Class T shares were subject to a maximum front-end sales charge of 2.50% per transaction and were required to be purchased through financial intermediaries that, by written agreement with Columbia Management Investment Distributors, Inc., were specifically authorized to sell Class T shares. Effective at the close of business on December 14, 2018, Class T shares merged, in a tax-free transaction, into Class A shares of the Fund and are no longer offered for sale.
Note 2. Summary of significant accounting policies
Basis of preparation
The Fund is an investment company that applies the accounting and reporting guidance in the Financial Accounting Standards Board (FASB) Accounting Standards Codification Topic 946,Financial Services - Investment Companies (ASC 946). The financial statements are prepared in accordance with U.S. generally accepted accounting principles (GAAP), which requires management to make certain estimates and assumptions that affect the reported amounts of assets and liabilities, the disclosure of contingent assets and liabilities at the date of the financial statements and the reported amounts of income and expenses during the reporting period. Actual results could differ from those estimates.
The following is a summary of significant accounting policies followed by the Fund in the preparation of its financial statements.
| 24 | Columbia Convertible Securities Fund | Annual Report 2019 |
Notes to Financial Statements (continued)
February 28, 2019
Security valuation
All equity securities are valued at the close of business of the New York Stock Exchange. Equity securities are valued at the last quoted sales price on the principal exchange or market on which they trade, except for securities traded on the NASDAQ Stock Market, which are valued at the NASDAQ official close price. Unlisted securities or listed securities for which there were no sales during the day are valued at the mean of the latest quoted bid and ask prices on such exchanges or markets.
Debt securities generally are valued by pricing services approved by the Board of Trustees based upon market transactions for normal, institutional-size trading units of similar securities. The services may use various pricing techniques that take into account, as applicable, factors such as yield, quality, coupon rate, maturity, type of issue, trading characteristics and other data, as well as approved independent broker-dealer quotes. Debt securities for which quotations are not readily available or not believed to be reflective of market value may also be valued based upon a bid quote from an approved independent broker-dealer. Debt securities maturing in 60 days or less are valued primarily at amortized cost value, unless this method results in a valuation that management believes does not approximate market value.
Foreign equity securities are valued based on the closing price on the foreign exchange in which such securities are primarily traded. If any foreign equity security closing prices are not readily available, the securities are valued at the mean of the latest quoted bid and ask prices on such exchanges or markets. Foreign currency exchange rates are generally determined at 4:00 p.m. Eastern (U.S.) time. Many securities markets and exchanges outside the U.S. close prior to the close of the New York Stock Exchange; therefore, the closing prices for securities in such markets or on such exchanges may not fully reflect events that occur after such close but before the close of the New York Stock Exchange. In those situations, foreign securities will be fair valued pursuant to a policy adopted by the Board of Trustees, including, if available, utilizing a third party pricing service to determine these fair values. The third party pricing service takes into account multiple factors, including, but not limited to, movements in the U.S. securities markets, certain depositary receipts, futures contracts and foreign exchange rates that have occurred subsequent to the close of the foreign exchange or market, to determine a good faith estimate that reasonably reflects the current market conditions as of the close of the New York Stock Exchange. The fair value of a security is likely to be different from the quoted or published price, if available.
Investments in open-end investment companies, including money market funds, are valued at their latest net asset value.
Investments for which market quotations are not readily available, or that have quotations which management believes are not reflective of market value or reliable, are valued at fair value as determined in good faith under procedures approved by and under the general supervision of the Board of Trustees. If a security or class of securities (such as foreign securities) is valued at fair value, such value is likely to be different from the quoted or published price for the security.
The determination of fair value often requires significant judgment. To determine fair value, management may use assumptions including but not limited to future cash flows and estimated risk premiums. Multiple inputs from various sources may be used to determine fair value.
GAAP requires disclosure regarding the inputs and valuation techniques used to measure fair value and any changes in valuation inputs or techniques. In addition, investments shall be disclosed by major category. This information is disclosed following the Fund’s Portfolio of Investments.
Foreign currency transactions and translations
The values of all assets and liabilities denominated in foreign currencies are generally translated into U.S. dollars at exchange rates determined at the close of regular trading on the New York Stock Exchange. Net realized and unrealized gains (losses) on foreign currency transactions and translations include gains (losses) arising from the fluctuation in exchange rates between trade and settlement dates on securities transactions, gains (losses) arising from the disposition of foreign currency and currency gains (losses) between the accrual and payment dates on dividends, interest income and foreign withholding taxes.
For financial statement purposes, the Fund does not distinguish that portion of gains (losses) on investments which is due to changes in foreign exchange rates from that which is due to changes in market prices of the investments. Such fluctuations are included with the net realized and unrealized gains (losses) on investments in the Statement of Operations.
Columbia Convertible Securities Fund | Annual Report 2019
| 25 |
Notes to Financial Statements (continued)
February 28, 2019
Equity-linked notes
The Fund may invest in equity-linked notes (ELNs). An ELN is a debt instrument, generally valued based on a quotation received from a counterparty, which is based on the value of a single equity security, basket of equity securities or an index of equity securities (each, an Underlying Equity). An ELN typically provides interest income, thereby offering a yield advantage over investing directly in an Underlying Equity. However, the holder of an ELN may have limited or no benefit from any appreciation in the Underlying Equity, but is exposed to various risks, including, without limitation, volatility, issuer and market risk. The Fund may purchase ELNs that trade on a securities exchange or those that trade on the over-the-counter markets, including securities offered and sold under Rule 144A of the Securities Act of 1933, as amended. The Fund may also purchase an ELN in a privately negotiated transaction with the issuer of the ELN (or its broker-dealer affiliate).
Security transactions
Security transactions are accounted for on the trade date. Cost is determined and gains (losses) are based upon the specific identification method for both financial statement and federal income tax purposes.
Income recognition
Interest income is recorded on an accrual basis. Market premiums and discounts, including original issue discounts, are amortized and accreted, respectively, over the expected life of the security on all debt securities, unless otherwise noted. For convertible securities, premiums attributable to the conversion feature are not amortized.
The Fund may place a debt security on non-accrual status and reduce related interest income when it becomes probable that the interest will not be collected and the amount of uncollectible interest can be reasonably estimated. A defaulted debt security is removed from non-accrual status when the issuer resumes interest payments or when collectibility of interest is reasonably assured.
Corporate actions and dividend income are recorded on the ex-dividend date.
The Fund may receive distributions from holdings in equity securities, business development companies (BDCs), exchange-traded funds (ETFs), limited partnerships (LPs), other regulated investment companies (RICs), and real estate investment trusts (REITs), which report information on the tax character of their distributions annually. These distributions are allocated to dividend income, capital gain and return of capital based on actual information reported. Return of capital is recorded as a reduction of the cost basis of securities held. If the Fund no longer owns the applicable securities, return of capital is recorded as a realized gain. With respect to REITs, to the extent actual information has not yet been reported, estimates for return of capital are made by the Fund’s management. Management’s estimates are subsequently adjusted when the actual character of the distributions is disclosed by the REITs, which could result in a proportionate change in return of capital to shareholders.
Awards from class action litigation are recorded as a reduction of cost basis if the Fund still owns the applicable securities on the payment date. If the Fund no longer owns the applicable securities, the proceeds are recorded as realized gains.
Expenses
General expenses of the Trust are allocated to the Fund and other funds of the Trust based upon relative net assets or other expense allocation methodologies determined by the nature of the expense. Expenses directly attributable to the Fund are charged to the Fund. Expenses directly attributable to a specific class of shares are charged to that share class.
Determination of class net asset value
All income, expenses (other than class-specific expenses, which are charged to that share class, as shown in the Statement of Operations) and realized and unrealized gains (losses) are allocated to each class of the Fund on a daily basis, based on the relative net assets of each class, for purposes of determining the net asset value of each class.
| 26 | Columbia Convertible Securities Fund | Annual Report 2019 |
Notes to Financial Statements (continued)
February 28, 2019
Federal income tax status
The Fund intends to qualify each year as a regulated investment company under Subchapter M of the Internal Revenue Code, as amended, and will distribute substantially all of its investment company taxable income and net capital gain, if any, for its tax year, and as such will not be subject to federal income taxes. In addition, the Fund intends to distribute in each calendar year substantially all of its ordinary income, capital gain net income and certain other amounts, if any, such that the Fund should not be subject to federal excise tax. Therefore, no federal income or excise tax provision is recorded.
Distributions to shareholders
Distributions from net investment income, if any, are declared and paid each calendar quarter. Net realized capital gains, if any, are distributed at least annually. Income distributions and capital gain distributions are determined in accordance with federal income tax regulations, which may differ from GAAP.
Guarantees and indemnifications
Under the Trust’s organizational documents and, in some cases, by contract, its officers and trustees are indemnified against certain liabilities arising out of the performance of their duties to the Trust or its funds. In addition, certain of the Fund’s contracts with its service providers contain general indemnification clauses. The Fund’s maximum exposure under these arrangements is unknown since the amount of any future claims that may be made against the Fund cannot be determined, and the Fund has no historical basis for predicting the likelihood of any such claims.
Recent accounting pronouncements
Accounting Standards Update 2017-08 Premium Amortization on Purchased Callable Debt Securities
In March 2017, the Financial Accounting Standards Board issued Accounting Standards Update (ASU) No. 2017-08 Premium Amortization on Purchased Callable Debt Securities. ASU No. 2017-08 updates the accounting standards to shorten the amortization period for certain purchased callable debt securities, held at a premium, to be amortized to the earliest call date. The update applies to securities with explicit, noncontingent call features that are callable at fixed prices and on preset dates. The standard is effective for annual periods beginning after December 15, 2018 and interim periods within those fiscal years. Management does not expect the implementation of this guidance to have a material impact on the financial statement amounts and footnote disclosures.
Accounting Standards Update 2018-13 Disclosure Framework - Changes to the Disclosure Requirements for Fair Value Measurement
In August 2018, the Financial Accounting Standards Board issued Accounting Standards Update (ASU) No. 2018-13 Disclosure Framework - Changes to the Disclosure Requirements for Fair Value Measurement. ASU No. 2018-13, in addition to other modifications and additions, removes the requirement to disclose the amount and reasons for transfers between Level 1 and Level 2 of the fair value hierarchy and the policy for the timing of transfers between levels. The standard is effective for annual periods beginning after December 15, 2019 and interim periods within those fiscal years. At this time, management is evaluating the implication of this guidance and the impact it will have on the financial statement disclosures, if any.
Disclosure Update and Simplification
In September 2018, the Securities and Exchange Commission (SEC) released Final Rule 33-10532, Disclosure Update and Simplification, which amends certain financial statement disclosure requirements that the SEC determined to be redundant, outdated, or superseded in light of other SEC disclosure requirements, GAAP, or changes in the information environment. As a result of the amendments, management implemented disclosure changes which included removing the components of distributable earnings presented on the Statement of Assets and Liabilities and combining income and gain distributions paid to shareholders as presented on the Statement of Changes in Net Assets. Any values presented to meet prior year requirements were left unchanged. The amendments had no effect on the Fund’s net assets or results of operation.
Columbia Convertible Securities Fund | Annual Report 2019
| 27 |
Notes to Financial Statements (continued)
February 28, 2019
Note 3. Fees and other transactions with affiliates
Management services fees
The Fund has entered into a Management Agreement with Columbia Management Investment Advisers, LLC (the Investment Manager), a wholly-owned subsidiary of Ameriprise Financial, Inc. (Ameriprise Financial). Under the Management Agreement, the Investment Manager provides the Fund with investment research and advice, as well as administrative and accounting services. The management services fee is an annual fee that is equal to a percentage of the Fund’s daily net assets that declines from 0.82% to 0.67% as the Fund’s net assets increase. The effective management services fee rate for the year ended February 28, 2019 was 0.80% of the Fund’s average daily net assets.
Compensation of board members
Members of the Board of Trustees who are not officers or employees of the Investment Manager or Ameriprise Financial are compensated for their services to the Fund as disclosed in the Statement of Operations. Under a Deferred Compensation Plan (the Deferred Plan), these members of the Board of Trustees may elect to defer payment of up to 100% of their compensation. Deferred amounts are treated as though equivalent dollar amounts had been invested in shares of certain funds managed by the Investment Manager. The Fund’s liability for these amounts is adjusted for market value changes and remains in the Fund until distributed in accordance with the Deferred Plan. All amounts payable under the Deferred Plan constitute a general unsecured obligation of the Fund.
Compensation of Chief Compliance Officer
The Board of Trustees has appointed a Chief Compliance Officer to the Fund in accordance with federal securities regulations. As disclosed in the Statement of Operations, a portion of the Chief Compliance Officer’s total compensation is allocated to the Fund, along with other allocations to affiliated registered investment companies managed by the Investment Manager and its affiliates, based on relative net assets.
Transfer agency fees
Under a Transfer and Dividend Disbursing Agent Agreement, Columbia Management Investment Services Corp. (the Transfer Agent), an affiliate of the Investment Manager and a wholly-owned subsidiary of Ameriprise Financial, is responsible for providing transfer agency services to the Fund. The Transfer Agent has contracted with DST Asset Manager Solutions, Inc. (DST) to serve as sub-transfer agent. The Transfer Agent pays the fees of DST for services as sub-transfer agent and DST is not entitled to reimbursement for such fees from the Fund (with the exception of out-of-pocket fees).
The Fund pays the Transfer Agent a monthly transfer agency fee based on the number or the average value of accounts, depending on the type of account. In addition, the Fund pays the Transfer Agent a fee for shareholder services based on the number of accounts or on a percentage of the average aggregate value of the Fund’s shares maintained in omnibus accounts up to the lesser of the amount charged by the financial intermediary or a cap established by the Board of Trustees from time to time.
The Transfer Agent also receives compensation from the Fund for various shareholder services and reimbursements for certain out-of-pocket fees. Total transfer agency fees for Institutional 2 Class and Institutional 3 Class shares are subject to an annual limitation of not more than 0.07% and 0.02%, respectively, of the average daily net assets attributable to each share class. Effective July 1, 2018 through June 30, 2019, Institutional 2 Class shares are subject to a contractual transfer agency fee annual limitation of not more than 0.05% and Institutional 3 Class shares are subject to a contractual transfer agency fee annual limitation of not more than 0.00% of the average daily net assets attributable to each share class.
| 28 | Columbia Convertible Securities Fund | Annual Report 2019 |
Notes to Financial Statements (continued)
February 28, 2019
For the year ended February 28, 2019, the Fund’s effective transfer agency fee rates as a percentage of average daily net assets of each class were as follows:
| | Effective rate (%) |
| Class A | 0.12 |
| Advisor Class | 0.12 |
| Class C | 0.12 |
| Institutional Class | 0.12 |
| Institutional 2 Class | 0.05 |
| Institutional 3 Class | 0.00 |
| Class R | 0.12 |
| Class T | 0.09(a) |
An annual minimum account balance fee of $20 may apply to certain accounts with a value below the applicable share class’s initial minimum investment requirements to reduce the impact of small accounts on transfer agency fees. These minimum account balance fees are remitted to the Fund and recorded as part of expense reductions in the Statement of Operations. For the year ended February 28, 2019, these minimum account balance fees reduced total expenses of the Fund by $700.
Distribution and service fees
The Fund has entered into an agreement with Columbia Management Investment Distributors, Inc. (the Distributor), an affiliate of the Investment Manager and a wholly-owned subsidiary of Ameriprise Financial, for distribution and shareholder services. The Board of Trustees has approved, and the Fund has adopted, distribution and shareholder service plans (the Plans) applicable to certain share classes, which set the distribution and service fees for the Fund. These fees are calculated daily and are intended to compensate the Distributor and/or eligible selling and/or servicing agents for selling shares of the Fund and providing services to investors.
Under the Plans, the Fund pays a monthly combined distribution and service fee to the Distributor at the maximum annual rate of 0.25% of the average daily net assets attributable to Class A shares of the Fund. Also under the Plans, the Fund pays a monthly service fee to the Distributor at the maximum annual rate of 0.25% of the average daily net assets attributable to Class C and Class T shares of the Fund and a monthly distribution fee to the Distributor at the maximum annual rates of 0.75%, 0.50% and 0.25% of the average daily net assets attributable to Class C, Class R and Class T shares of the Fund, respectively. As a result of all Class T shares of the Fund being redeemed or converted to Class A shares, December 14, 2018 was the last day the Fund paid a service fee or distribution fee for Class T shares.
Although the Fund may pay a distribution fee up to 0.25% of the Fund’s average daily net assets attributable to Class T shares and a service fee of up to 0.25% of the Fund’s average daily net assets attributable to Class T shares, the aggregate fee shall not exceed 0.25% of the Fund’s average daily net assets attributable to Class T shares.
Sales charges (unaudited)
Sales charges, including front-end charges and CDSCs, received by the Distributor for distributing Fund shares for the year ended February 28, 2019, if any, are listed below:
| | Amount ($) |
| Class A | 502,360 |
| Class C | 6,781 |
Columbia Convertible Securities Fund | Annual Report 2019
| 29 |
Notes to Financial Statements (continued)
February 28, 2019
Expenses waived/reimbursed by the Investment Manager and its affiliates
The Investment Manager and certain of its affiliates have contractually agreed to waive fees and/or reimburse expenses (excluding certain fees and expenses described below) for the period(s) disclosed below, unless sooner terminated at the sole discretion of the Board of Trustees, so that the Fund’s net operating expenses, after giving effect to fees waived/expenses reimbursed and any balance credits and/or overdraft charges from the Fund’s custodian, do not exceed the following annual rate(s) as a percentage of the class’ average daily net assets:
| | July 1, 2018
through
June 30, 2019 | Prior to
July 1, 2018 |
| Class A | 1.13% | 1.13% |
| Advisor Class | 0.88 | 0.88 |
| Class C | 1.88 | 1.88 |
| Institutional Class | 0.88 | 0.88 |
| Institutional 2 Class | 0.81 | 0.80 |
| Institutional 3 Class | 0.76 | 0.75 |
| Class R | 1.38 | 1.38 |
Under the agreement governing these fee waivers and/or expense reimbursement arrangements, the following fees and expenses are excluded from the waiver/reimbursement commitment, and therefore will be paid by the Fund, if applicable: taxes (including foreign transaction taxes), expenses associated with investments in affiliated and non-affiliated pooled investment vehicles (including mutual funds and exchange-traded funds), transaction costs and brokerage commissions, costs related to any securities lending program, dividend expenses associated with securities sold short, inverse floater program fees and expenses, transaction charges and interest on borrowed money, interest, infrequent and/or unusual expenses and any other expenses the exclusion of which is specifically approved by the Board of Trustees. This agreement may be modified or amended only with approval from the Investment Manager, certain of its affiliates and the Fund. Reflected in the contractual cap commitment, effective July 1, 2018 through June 30, 2019, is the Transfer Agent’s contractual agreement to limit total transfer agency fees to an annual rate of not more than 0.05% for Institutional 2 Class and 0.00% for Institutional 3 Class of the average daily net assets attributable to each share class, unless sooner terminated at the sole discretion of the Board of Trustees. Any fees waived and/or expenses reimbursed under the expense reimbursement arrangements described above are not recoverable by the Investment Manager or its affiliates in future periods.
Note 4. Federal tax information
The timing and character of income and capital gain distributions are determined in accordance with income tax regulations, which may differ from GAAP because of temporary or permanent book to tax differences.
At February 28, 2019, these differences were primarily due to differing treatment for deferral/reversal of wash sale losses, re-characterization of distributions for investments, trustees’ deferred compensation, principal and/or interest from fixed income securities, foreign currency transactions, non-deductible expenses, deemed distributions and amortization/accretion on certain convertible securities. To the extent these differences were permanent, reclassifications were made among the components of the Fund’s net assets. Temporary differences do not require reclassifications.
The following reclassifications were made:
Undistributed net
investment
income ($) | Accumulated
net realized
gain ($) | Paid in
capital ($) |
| 3,325,688 | (3,317,375) | (8,313) |
Net investment income (loss) and net realized gains (losses), as disclosed in the Statement of Operations, and net assets were not affected by this reclassification.
| 30 | Columbia Convertible Securities Fund | Annual Report 2019 |
Notes to Financial Statements (continued)
February 28, 2019
The tax character of distributions paid during the years indicated was as follows:
| Year Ended February 28, 2019 | Year Ended February 28, 2018 |
Ordinary
income ($) | Long-term
capital gains ($) | Total ($) | Ordinary
income ($) | Long-term
capital gains ($) | Total ($) |
| 20,534,084 | 28,661,201 | 49,195,285 | 22,943,481 | — | 22,943,481 |
Short-term capital gain distributions, if any, are considered ordinary income distributions for tax purposes.
At February 28, 2019, the components of distributable earnings on a tax basis were as follows:
Undistributed
ordinary income ($) | Undistributed
long-term
capital gains ($) | Capital loss
carryforwards ($) | Net unrealized
appreciation ($) |
| 5,236,551 | 9,253,585 | — | 78,956,904 |
At February 28, 2019, the cost of all investments for federal income tax purposes along with the aggregate gross unrealized appreciation and depreciation based on that cost was:
Federal
tax cost ($) | Gross unrealized
appreciation ($) | Gross unrealized
(depreciation) ($) | Net unrealized
appreciation ($) |
| 1,039,411,902 | 114,717,477 | (35,760,573) | 78,956,904 |
Tax cost of investments and unrealized appreciation/(depreciation) may also include timing differences that do not constitute adjustments to tax basis.
The following capital loss carryforwards, determined at February 28, 2019, may be available to reduce taxable income arising from future net realized gains on investments, if any, to the extent permitted by the Internal Revenue Code. Capital loss carryforwards with no expiration are required to be utilized prior to any capital losses which carry an expiration date. As a result of this ordering rule, capital loss carryforwards which carry an expiration date may be more likely to expire unused. In addition, for the year ended February 28, 2019, capital loss carryforwards utilized and expired unused, if any, were as follows:
No expiration
short-term ($) | No expiration
long-term ($) | Total ($) | Utilized ($) | Expired ($) |
| — | — | — | 8,850,076 | — |
Management of the Fund has concluded that there are no significant uncertain tax positions in the Fund that would require recognition in the financial statements. However, management’s conclusion may be subject to review and adjustment at a later date based on factors including, but not limited to, new tax laws, regulations, and administrative interpretations (including relevant court decisions). Generally, the Fund’s federal tax returns for the prior three fiscal years remain subject to examination by the Internal Revenue Service.
Note 5. Portfolio information
The cost of purchases and proceeds from sales of securities, excluding short-term investments and derivatives, if any, aggregated to $767,551,425 and $552,290,839, respectively, for the year ended February 28, 2019. The amount of purchase and sale activity impacts the portfolio turnover rate reported in the Financial Highlights.
Note 6. Affiliated money market fund
The Fund invests in Columbia Short-Term Cash Fund, an affiliated money market fund established for the exclusive use by the Fund and other affiliated funds (the Affiliated MMF). The income earned by the Fund from such investments is included as Dividends - affiliated issuers in the Statement of Operations. As an investing fund, the Fund indirectly bears its proportionate share of the expenses of the Affiliated MMF. The Affiliated MMF prices its shares with a floating net asset value. In addition, the Board of Trustees of the Affiliated MMF may impose a fee on redemptions (sometimes referred to as a liquidity fee) or temporarily suspend redemptions (sometimes referred to as imposing a redemption gate) in the event its liquidity falls below regulatory limits.
Columbia Convertible Securities Fund | Annual Report 2019
| 31 |
Notes to Financial Statements (continued)
February 28, 2019
Note 7. Interfund lending
Pursuant to an exemptive order granted by the Securities and Exchange Commission, the Fund participates in a program (the Interfund Program) allowing each participating Columbia Fund (each, a Participating Fund) to lend money directly to and, except for closed-end funds and money market funds, borrow money directly from other Participating Funds for temporary purposes. The amounts eligible for borrowing and lending under the Interfund Program are subject to certain restrictions.
Interfund loans are subject to the risk that the borrowing fund could be unable to repay the loan when due, and a delay in repayment to the lending fund could result in lost opportunities and/or additional lending costs. The exemptive order is subject to conditions intended to mitigate conflicts of interest arising from the Investment Manager’s relationship with each Participating Fund.
The Fund’s activity in the Interfund Program during the year ended February 28, 2019 was as follows:
| Borrower or lender | Average loan
balance ($) | Weighted average
interest rate (%) | Days
outstanding |
| Borrower | 400,000 | 2.95 | 2 |
| Lender | 3,144,444 | 2.69 | 9 |
Interest income earned by the Fund is recorded as Interfund lending in the Statement of Operations. The Fund had no outstanding interfund loans at February 28, 2019.
Note 8. Line of credit
The Fund has access to a revolving credit facility with a syndicate of banks led by Citibank, N.A., HSBC Bank USA, N.A. and JPMorgan Chase Bank, N.A. whereby the Fund may borrow for the temporary funding of shareholder redemptions or for other temporary or emergency purposes. The credit facility, which is a collective agreement between the Fund and certain other funds managed by the Investment Manager or an affiliated investment manager, severally and not jointly, permits collective borrowings up to $1 billion. Interest is charged to each participating fund based on its borrowings at a rate equal to the higher of (i) the federal funds effective rate, (ii) the one-month LIBOR rate and (iii) the overnight bank funding rate, plus in each case, 1.00%. Each borrowing under the credit facility matures no later than 60 days after the date of borrowing. The Fund also pays a commitment fee equal to its pro rata share of the unused amount of the credit facility at a rate of 0.15% per annum. The commitment fee is included in other expenses in the Statement of Operations. This agreement expires annually in December unless extended or renewed.
The Fund had no borrowings during the year ended February 28, 2019.
Note 9. Significant risks
Convertible securities risk
Convertible debt securities are subject to the usual risks associated with debt securities, such as interest rate risk and credit risk. Convertible securities also react to changes in the value of the common stock into which they convert, and are thus subject to market risk. The Fund may also be forced to convert a convertible security at an inopportune time, which may decrease the Fund’s return.
Credit risk
Credit risk is the risk that the value of debt securities in the Fund’s portfolio may decline because the issuer may default and fail to pay interest or repay principal when due. Rating agencies assign credit ratings to debt securities to indicate their credit risk. Lower rated or unrated debt securities held by the Fund may present increased credit risk as compared to higher-rated debt securities.
| 32 | Columbia Convertible Securities Fund | Annual Report 2019 |
Notes to Financial Statements (continued)
February 28, 2019
Interest rate risk
Interest rate risk is the risk of losses attributable to changes in interest rates. In general, if prevailing interest rates rise, the values of debt securities tend to fall, and if interest rates fall, the values of debt securities tend to rise. Actions by governments and central banking authorities can result in increases in interest rates. Increasing interest rates may negatively affect the value of debt securities held by the Fund, resulting in a negative impact on the Fund’s performance and net asset value per share. In general, the longer the maturity or duration of a debt security, the greater its sensitivity to changes in interest rates.
Liquidity risk
Liquidity risk is the risk associated with a lack of marketability of investments which may make it difficult to sell the investment at a desirable time or price. Changing regulatory, market or other conditions or environments (for example, the interest rate or credit environments) may adversely affect the liquidity of the Fund’s investments. The Fund may have to accept a lower selling price for the holding, sell other investments, or forego another, more appealing investment opportunity. Generally, the less liquid the market at the time the Fund sells a portfolio investment, the greater the risk of loss or decline of value to the Fund. A less liquid market can lead to an increase in Fund redemptions, which may negatively impact Fund performance and net asset value per share, including, for example, if the Fund is forced to sell securities in a down market.
Shareholder concentration risk
At February 28, 2019, one unaffiliated shareholder of record owned 21.2% of the outstanding shares of the Fund in one or more accounts. The Fund has no knowledge about whether any portion of those shares was owned beneficially. Affiliated shareholders of record owned 28.2% of the outstanding shares of the Fund in one or more accounts. Subscription and redemption activity by concentrated accounts may have a significant effect on the operations of the Fund. In the case of a large redemption, the Fund may be forced to sell investments at inopportune times, including its liquid positions, which may result in Fund losses and the Fund holding a higher percentage of less liquid positions. Large redemptions could result in decreased economies of scale and increased operating expenses for non-redeeming Fund shareholders.
Note 10. Subsequent events
Management has evaluated the events and transactions that have occurred through the date the financial statements were issued and noted no items requiring adjustment of the financial statements or additional disclosure.
Note 11. Information regarding pending and settled legal proceedings
Ameriprise Financial and certain of its affiliates have historically been involved in a number of legal, arbitration and regulatory proceedings, including routine litigation, class actions, and governmental actions, concerning matters arising in connection with the conduct of their business activities. Ameriprise Financial believes that the Fund is not currently the subject of, and that neither Ameriprise Financial nor any of its affiliates are the subject of, any pending legal, arbitration or regulatory proceedings that are likely to have a material adverse effect on the Fund or the ability of Ameriprise Financial or its affiliates to perform under their contracts with the Fund. Ameriprise Financial is required to make quarterly (10-Q), annual (10-K) and, as necessary, 8-K filings with the Securities and Exchange Commission (SEC) on legal and regulatory matters that relate to Ameriprise Financial and its affiliates. Copies of these filings may be obtained by accessing the SEC website at www.sec.gov.
There can be no assurance that these matters, or the adverse publicity associated with them, will not result in increased Fund redemptions, reduced sale of Fund shares or other adverse consequences to the Fund. Further, although we believe proceedings are not likely to have a material adverse effect on the Fund or the ability of Ameriprise Financial or its affiliates to perform under their contracts with the Fund, these proceedings are subject to uncertainties and, as such, we are unable to estimate the possible loss or range of loss that may result. An adverse outcome in one or more of these proceedings could result in adverse judgments, settlements, fines, penalties or other relief that could have a material adverse effect on the consolidated financial condition or results of operations of Ameriprise Financial.
Columbia Convertible Securities Fund | Annual Report 2019
| 33 |
Report of Independent Registered Public Accounting Firm
To the Board of Trustees of Columbia Funds Series Trust and Shareholders of Columbia Convertible Securities Fund
Opinion on the Financial Statements
We have audited the accompanying statement of assets and liabilities, including the portfolio of investments, of Columbia Convertible Securities Fund (one of the funds constituting Columbia Funds Series Trust, referred to hereafter as the "Fund") as of February 28, 2019, the related statement of operations for the year ended February 28, 2019, the statement of changes in net assets for each of the two years in the period ended February 28, 2019, including the related notes, and the financial highlights for each of the five years in the period ended February 28, 2019 (collectively referred to as the “financial statements”). In our opinion, the financial statements present fairly, in all material respects, the financial position of the Fund as of February 28, 2019, the results of its operations for the year then ended, the changes in its net assets for each of the two years in the period ended February 28, 2019 and the financial highlights for each of the five years in the period ended February 28, 2019 in conformity with accounting principles generally accepted in the United States of America.
Basis for Opinion
These financial statements are the responsibility of the Fund’s management. Our responsibility is to express an opinion on the Fund’s financial statements based on our audits. We are a public accounting firm registered with the Public Company Accounting Oversight Board (United States) (PCAOB) and are required to be independent with respect to the Fund in accordance with the U.S. federal securities laws and the applicable rules and regulations of the Securities and Exchange Commission and the PCAOB.
We conducted our audits of these financial statements in accordance with the standards of the PCAOB. Those standards require that we plan and perform the audit to obtain reasonable assurance about whether the financial statements are free of material misstatement, whether due to error or fraud.
Our audits included performing procedures to assess the risks of material misstatement of the financial statements, whether due to error or fraud, and performing procedures that respond to those risks. Such procedures included examining, on a test basis, evidence regarding the amounts and disclosures in the financial statements. Our audits also included evaluating the accounting principles used and significant estimates made by management, as well as evaluating the overall presentation of the financial statements. Our procedures included confirmation of securities owned as of February 28, 2019 by correspondence with the custodian, transfer agent and brokers; when replies were not received from brokers, we performed other auditing procedures. We believe that our audits provide a reasonable basis for our opinion.
/s/PricewaterhouseCoopers LLP
Minneapolis, Minnesota
April 22, 2019
We have served as the auditor of one or more investment companies within the Columbia Funds Complex since 1977.
| 34 | Columbia Convertible Securities Fund | Annual Report 2019 |
Federal Income Tax Information
(Unaudited)
The Fund hereby designates the following tax attributes for the fiscal year ended February 28, 2019. Shareholders will be notified in early 2020 of the amounts for use in preparing 2019 income tax returns.
Qualified
dividend
income | Dividends
received
deduction | Capital
gain
dividend |
| 28.39% | 27.60% | $39,810,525 |
Qualified dividend income. For taxable, non-corporate shareholders, the percentage of ordinary income distributed during the fiscal year that represents qualified dividend income subject to reduced tax rates.
Dividends received deduction. The percentage of ordinary income distributed during the fiscal year that qualifies for the corporate dividends received deduction.
Capital gain dividend. The Fund designates as a capital gain dividend the amount reflected above, or if subsequently determined to be different, the net capital gain of such fiscal period.
Columbia Convertible Securities Fund | Annual Report 2019
| 35 |
Shareholders elect the Board that oversees the Fund’s operations. The Board appoints officers who are responsible for day-to-day business decisions based on policies set by the Board. The following table provides basic biographical information about the Fund’s Trustees as of the printing of this report, including their principal occupations during the past five years, although specific titles for individuals may have varied over the period. Under current Board policy, Trustees not affiliated with the Investment Manager generally may serve through the end of the calendar year in which they reach the mandatory retirement age established by the Board.
Independent trustees
Name,
address,
year of birth | Position held
with the Trust and
length of service | Principal occupation(s)
during past five years
and other relevant
professional experience | Number of
Funds in the
Columbia Funds
complex
overseen | Other directorships
held by Trustee
during the past
five years |
George S. Batejan
c/o Columbia Management
Investment Advisers, LLC
225 Franklin Street
Mail Drop BX32 05228
Boston, MA 02110
1953 | Trustee since 1/17 | Executive Vice President, Global Head of Technology and Operations, Janus Capital Group, Inc., 2010-2016 | 123 | Former Chairman of the Board, NICSA (National Investment Company Services Association) (Executive Committee, Nominating Committee and Governance Committee), 2014-2016; former Director, Intech Investment Management, 2011-2016; former Board Member, Metro Denver Chamber of Commerce, 2015-2016; former Advisory Board Member, University of Colorado Business School, 2015-2018 |
Kathleen Blatz
c/o Columbia Management
Investment Advisers, LLC
225 Franklin Street
Mail Drop BX32 05228
Boston, MA 02110
1954 | Trustee since 1/06 for RiverSource Funds and since 6/11 for Nations Funds | Attorney; specializing in arbitration and mediation; Chief Justice, Minnesota Supreme Court, 1998-2006; Associate Justice, Minnesota Supreme Court, 1996-1998; Fourth Judicial District Court Judge, Hennepin County, 1994-1996; Attorney in private practice and public service, 1984-1993; State Representative, Minnesota House of Representatives, 1979-1993, which included service on the Tax and Financial Institutions and Insurance Committees; Member and Interim Chair, Minnesota Sports Facilities Authority, January 2017-July 2017; Interim President and Chief Executive Officer, Blue Cross and Blue Shield of Minnesota (health care insurance), February-July 2018 | 123 | Trustee, BlueCross BlueShield of Minnesota since 2009 (Chair of the Business Development Committee, 2014-2017; Chair of the Governance Committee since 2017); Chair of the Robina Foundation since August 2013; former Member and Chair of the Board, Minnesota Sports Facilities Authority, January 2017-July 2017 |
Edward J. Boudreau, Jr.
c/o Columbia Management
Investment Advisers, LLC
225 Franklin Street
Mail Drop BX32 05228
Boston, MA 02110
1944 | Chair of the Board since 1/18; Trustee since 6/11 for RiverSource Funds and since 1/05 for Nations Funds | Managing Director, E.J. Boudreau & Associates (consulting) since 2000; FINRA Industry Arbitrator, 2002-present; Chairman and Chief Executive Officer, John Hancock Investments (asset management), Chairman and Interested Trustee for open-end and closed-end funds offered by John Hancock, 1989-2000; John Hancock Mutual Life Insurance Company, including Senior Vice President and Treasurer and Senior Vice President Information Technology, 1968-1988 | 123 | Former Trustee, Boston Museum of Science (Chair of Finance Committee) 1985-2013; former Trustee, BofA Funds Series Trust (11 funds), 2005-2011 |
| 36 | Columbia Convertible Securities Fund | Annual Report 2019 |
TRUSTEES AND OFFICERS (continued)
Independent trustees (continued)
Name,
address,
year of birth | Position held
with the Trust and
length of service | Principal occupation(s)
during past five years
and other relevant
professional experience | Number of
Funds in the
Columbia Funds
complex
overseen | Other directorships
held by Trustee
during the past
five years |
Pamela G. Carlton
c/o Columbia Management
Investment Advisers, LLC
225 Franklin Street
Mail Drop BX32 05228
Boston, MA 02110
1954 | Trustee since 7/07 for RiverSource Funds and since 6/11 for Nations Funds | President, Springboard — Partners in Cross Cultural Leadership (consulting company) since 2003; Managing Director of US Equity Research, JP Morgan Chase, 1999-2003; Director of US Equity Research, Chase Asset Management, 1996-1999; Co-Director Latin America Research, 1993-1996, COO Global Research, 1992-1996, Co-Director of US Research, 1991-1992, Investment Banker, Morgan Stanley, 1982-1991 | 123 | Trustee, New York Presbyterian Hospital Board (Executive Committee and Chair of Human Resources Committee) since 1996; Director, Laurel Road Bank (Audit Committee) since 2017 |
Patricia M. Flynn
c/o Columbia Management
Investment Advisers, LLC
225 Franklin Street
Mail Drop BX32 05228
Boston, MA 02110
1950 | Trustee since 11/04 for RiverSource Funds and since 6/11 for Nations Funds | Trustee Professor of Economics and Management, Bentley University since 1976 (also teaches and conducts research on corporate governance); Dean, McCallum Graduate School of Business, Bentley University, 1992-2002 | 123 | Trustee, MA Taxpayers Foundation since 1997; Board of Directors, The MA Business Roundtable since 2003; Board of Governors, Innovation Institute, MA Technology Collaborative since 2010 |
Brian J. Gallagher
c/o Columbia Management
Investment Advisers, LLC
225 Franklin Street
Mail Drop BX32 05228
Boston, MA 02110
1954 | Trustee since 12/17 | Retired; Partner with Deloitte & Touche LLP and its predecessors, 1977-2016 | 121 | Trustee, Catholic Schools Foundation since 2004 |
Catherine James Paglia
c/o Columbia Management
Investment Advisers, LLC
225 Franklin Street
Mail Drop BX32 05228
Boston, MA 02110
1952 | Trustee since 11/04 for RiverSource Funds and since 6/11 for Nations Funds | Director, Enterprise Asset Management, Inc. (private real estate and asset management company) since September 1998; Managing Director and Partner, Interlaken Capital, Inc., 1989-1997; Managing Director, Morgan Stanley, 1982-1989; Vice President, Investment Banking, 1980-1982, Associate, Investment Banking, 1976-1980, Dean Witter Reynolds, Inc. | 123 | Director, Valmont Industries, Inc. (irrigation systems manufacturer) since 2012; Trustee, Carleton College (on the Investment Committee); Trustee, Carnegie Endowment for International Peace (on the Investment Committee) |
Anthony M. Santomero
c/o Columbia Management
Investment Advisers, LLC
225 Franklin Street
Mail Drop BX32 05228
Boston, MA 02110
1946 | Trustee since 6/11 for RiverSource Funds and since 1/08 for Nations Funds | Richard K. Mellon Professor Emeritus of Finance, The Wharton School, University of Pennsylvania, since 2002; Senior Advisor, McKinsey & Company (consulting), 2006-2008; President, Federal Reserve Bank of Philadelphia, 2000- 2006; Professor of Finance, The Wharton School, University of Pennsylvania, 1972-2002 | 123 | Trustee, Penn Mutual Life Insurance Company since March 2008; Director, Renaissance Reinsurance Ltd. since May 2008; former Trustee, BofA Funds Series Trust (11 funds), 2008-2011; former Director, Citigroup Inc. and Citibank, N.A., 2009-2019 |
Columbia Convertible Securities Fund | Annual Report 2019
| 37 |
TRUSTEES AND OFFICERS (continued)
Independent trustees (continued)
Name,
address,
year of birth | Position held
with the Trust and
length of service | Principal occupation(s)
during past five years
and other relevant
professional experience | Number of
Funds in the
Columbia Funds
complex
overseen | Other directorships
held by Trustee
during the past
five years |
Minor M. Shaw
c/o Columbia Management
Investment Advisers, LLC
225 Franklin Street
Mail Drop BX32 05228
Boston, MA 02110
1947 | Trustee since 6/11 for RiverSource Funds and since 2003 for Nations Funds | President, Micco LLC (private investments) since 2011; President, Micco Corp. (family investment business), 1998-2011 | 123 | Director, BlueCross BlueShield of South Carolina since April 2008; Board Chair, Hollingsworth Funds since 2016; Advisory Board member, Duke Energy Corp. since October 2016; Chair of the Duke Endowment; Chair of Greenville – Spartanburg Airport Commission; former Trustee, BofA Funds Series Trust (11 funds), 2003-2011; former Director, Piedmont Natural Gas, 2004-2016; former Director, National Association of Corporate Directors, Carolinas Chapter, 2013-2018 |
Sandra Yeager
c/o Columbia Management
Investment Advisers, LLC
225 Franklin Street
Mail Drop BX32 05228
Boston, MA 02110
1964 | Trustee since 12/17 | Retired; President and founder, Hanoverian Capital, LLC (SEC registered investment advisor firm), 2008-2016; Managing Director, DuPont Capital, 2006-2008; Managing Director, Morgan Stanley Investment Management, 2004-2006; Senior Vice President, Alliance Bernstein, 1990-2004 | 121 | Director, NAPE Education Foundation since October 2016 |
Interested trustee affiliated with Investment Manager*
Name,
address,
year of birth | Position held with the Trust and length of service | Principal occupation(s) during the
past five years and other relevant
professional experience | Number of
Funds in the
Columbia Funds
complex overseen | Other directorships
held by Trustee
during the past
five years |
William F. Truscott
c/o Columbia Management
Investment Advisers, LLC
225 Franklin St.
Boston, MA 02110
1960 | Trustee since 11/01 for RiverSource Funds and since 6/11 for Nations Funds; Senior Vice President since 2002 for RiverSource Funds and since 5/10 for Nations Funds | Chairman of the Board and President, Columbia Management Investment Advisers, LLC since May 2010 and February 2012, respectively; Chief Executive Officer, Global Asset Management, Ameriprise Financial, Inc. since September 2012 (previously Chief Executive Officer, U.S. Asset Management & President, Annuities, May 2010 - September 2012); Director and Chief Executive Officer, Columbia Management Investment Distributors, Inc. since May 2010 and February 2012, respectively; Chairman of the Board and Chief Executive Officer, RiverSource Distributors, Inc. since 2006; Director, Threadneedle Asset Management Holdings, SARL since 2014; President and Chief Executive Officer, Ameriprise Certificate Company, 2006 - August 2012. | 192 | Chairman of the Board, Columbia Management Investment Advisers, LLC since May 2010; Director, Columbia Management Investment Distributors, Inc. since May 2010; former Director, Ameriprise Certificate Company, 2006-January 2013 |
| * | Interested person (as defined under the 1940 Act) by reason of being an officer, director, security holder and/or employee of the Investment Manager or Ameriprise Financial. |
| 38 | Columbia Convertible Securities Fund | Annual Report 2019 |
TRUSTEES AND OFFICERS (continued)
Nations Funds refer to the Funds within the Columbia Funds Complex that historically bore the Nations brand and includes series of Columbia Funds Series Trust. RiverSource Funds refer to the Funds within the Columbia Funds Complex that historically bore the RiverSource brand and includes series of Columbia Funds Series Trust II.
The Statement of Additional Information has additional information about the Fund’s Board members and is available, without charge, upon request by calling 800.345.6611, visiting columbiathreadneedleus.com/investor/ or contacting your financial intermediary.
Columbia Convertible Securities Fund | Annual Report 2019
| 39 |
TRUSTEES AND OFFICERS (continued)
The Board has appointed officers who are responsible for day-to-day business decisions based on policies it has established. The officers serve at the pleasure of the Board. The following table provides basic information about the Officers of the Fund as of the printing of this report, including principal occupations during the past five years, although their specific titles may have varied over the period. In addition to Mr. Truscott, who is Senior Vice President, the Fund’s other officers are:
Fund officers
Name,
address and
year of birth | Position and year
first appointed to
position for any Fund
in the Columbia
Funds complex or a
predecessor thereof | Principal occupation(s) during past five years |
Christopher O. Petersen
5228 Ameriprise
Financial Center
Minneapolis, MN 55474
Born 1970 | President and Principal Executive Officer (2015) | Vice President and Lead Chief Counsel, Ameriprise Financial, Inc. since January 2015 (previously, Vice President and Chief Counsel, January 2010 - December 2014; officer of Columbia Funds and affiliated funds since 2007. |
Michael G. Clarke
225 Franklin Street
Boston, MA 02110
Born 1969 | Chief Financial Officer (Principal Financial Officer) (2009) and Senior Vice President (2019) | Vice President — Accounting and Tax, Columbia Management Investment Advisers, LLC, since May 2010; senior officer of Columbia Funds and affiliated funds since 2002 (previously, Treasurer and Chief Accounting Officer, January 2009-January 2019 and December 2015-January 2019, respectively). |
Joseph Beranek
5890 Ameriprise
Financial Center
Minneapolis, MN 55474
Born 1965 | Treasurer and Chief Accounting Officer (Principal Accounting Officer) (2019) | Vice President — Mutual Fund Accounting and Financial Reporting, Columbia Management Investment Advisers, LLC, since December 2018 and March 2017, respectively (previously, Vice President — Pricing and Corporate Actions, May 2010-March 2017). |
Paul B. Goucher
485 Lexington Avenue
New York, NY 10017
Born 1968 | Senior Vice President (2011) and Assistant Secretary (2008) | Senior Vice President and Assistant General Counsel, Ameriprise Financial, Inc. since January 2017 (previously, Vice President and Lead Chief Counsel, November 2008 - January 2017 and January 2013 - January 2017, respectively); Vice President, Chief Legal Officer and Assistant Secretary, Columbia Management Investment Advisers, LLC since March 2015 (previously Vice President and Assistant Secretary, May 2010 – March 2015). |
Thomas P. McGuire
225 Franklin Street
Boston, MA 02110
Born 1972 | Senior Vice President and Chief Compliance Officer (2012) | Vice President — Asset Management Compliance, Ameriprise Financial, Inc., since May 2010; Chief Compliance Officer, Ameriprise Certificate Company since September 2010. |
Colin Moore
225 Franklin Street
Boston, MA 02110
Born 1958 | Senior Vice President (2010) | Executive Vice President and Global Chief Investment Officer, Ameriprise Financial, Inc., since July 2013; Executive Vice President and Global Chief Investment Officer, Columbia Management Investment Advisers, LLC since July 2013. |
Ryan C. Larrenaga
225 Franklin Street
Boston, MA 02110
Born 1970 | Senior Vice President (2017), Chief Legal Officer (2017), and Secretary (2015) | Vice President and Chief Counsel, Ameriprise Financial, Inc. since August 2018 (previously, Vice President and Group Counsel, August 2011 - August 2018); officer of Columbia Funds and affiliated funds since 2005. |
Michael E. DeFao
225 Franklin Street
Boston, MA 02110
Born 1968 | Vice President (2011) and Assistant Secretary (2010) | Vice President and Chief Counsel, Ameriprise Financial, Inc. since May 2010. |
Amy Johnson
5228 Ameriprise
Financial Center
Minneapolis, MN 55474
Born 1965 | Vice President (2006) | Managing Director and Global Head of Operations, Columbia Management Investment Advisers, LLC since April 2016 (previously Managing Director and Chief Operating Officer, 2010 - 2016). |
| 40 | Columbia Convertible Securities Fund | Annual Report 2019 |
TRUSTEES AND OFFICERS (continued)
Fund officers (continued)
Name,
address and
year of birth | Position and year
first appointed to
position for any Fund
in the Columbia
Funds complex or a
predecessor thereof | Principal occupation(s) during past five years |
Lyn Kephart-Strong
5228 Ameriprise
Financial Center
Minneapolis, MN 55474
Born 1960 | Vice President (2015) | President, Columbia Management Investment Services Corp. since October 2014; Vice President & Resolution Officer, Ameriprise Trust Company since August 2009. |
Columbia Convertible Securities Fund | Annual Report 2019
| 41 |
The Fund mails one shareholder report to each shareholder address, unless such shareholder elected to receive shareholder reports from the Fund electronically. If you would like more than one report, please call shareholder services at 800.345.6611 and additional reports will be sent to you.
Proxy voting policies and procedures
The policy of the Board of Trustees is to vote the proxies of the companies in which the Fund holds investments consistent with the procedures as stated in the Statement of Additional Information (SAI). You may obtain a copy of the SAI without charge by calling 800.345.6611; contacting your financial intermediary; visiting columbiathreadneedleus.com/investor/; or searching the website of the Securities and Exchange Commission (SEC) at sec.gov. Information regarding how the Fund voted proxies relating to portfolio securities is filed with the SEC by August 31st for the most recent 12-month period ending June 30th of that year, and is available without charge by visiting columbiathreadneedleus.com/investor/, or searching the website of the SEC at sec.gov.
Quarterly schedule of investments
The Fund files a complete schedule of portfolio holdings with the SEC for the first and third quarters of each fiscal year on Form N-Q or Form N-PORT (available for filings after March 31, 2019). The Fund’s Form N-Q or Form N-PORT is available on the SEC’s website at sec.gov. The Fund’s complete schedule of portfolio holdings, as filed on Form N-Q or Form N-PORT, can also be obtained without charge, upon request, by calling 800.345.6611.
Additional Fund information
For more information about the Fund, please visit columbiathreadneedleus.com/investor/ or call 800.345.6611. Customer Service Representatives are available to answer your questions Monday through Friday from 8 a.m. to 7 p.m. Eastern time.
Fund investment manager
Columbia Management Investment Advisers, LLC
225 Franklin Street
Boston, MA 02110
Fund distributor
Columbia Management Investment Distributors, Inc.
225 Franklin Street
Boston, MA 02110
Fund transfer agent
Columbia Management Investment Services Corp.
P.O. Box 219104
Kansas City, MO 64121-9104
| 42 | Columbia Convertible Securities Fund | Annual Report 2019 |
[THIS PAGE INTENTIONALLY LEFT BLANK]
[THIS PAGE INTENTIONALLY LEFT BLANK]
[THIS PAGE INTENTIONALLY LEFT BLANK]
Columbia Convertible Securities Fund
P.O. Box 219104
Kansas City, MO 64121-9104
Please read and consider the investment objectives, risks, charges and expenses for any fund carefully before investing. For a prospectus and summary prospectus, which contains this and other important information about the Fund, go to
columbiathreadneedleus.com/investor/. The Fund is distributed by Columbia Management Investment Distributors, Inc., member FINRA, and managed by Columbia Management Investment Advisers, LLC.
Columbia Threadneedle Investments (Columbia Threadneedle) is the global brand name of the Columbia and Threadneedle group of companies. All rights reserved.
© 2019 Columbia Management Investment Advisers, LLC.
columbiathreadneedleus.com/investor/

Annual Report
February 28, 2019
Columbia Select Large Cap Equity Fund
Beginning on January 1, 2021, as permitted by regulations adopted by the Securities and Exchange Commission, paper copies of the Fund’s annual and semiannual shareholder reports like this one will no longer be sent by mail, unless you specifically request paper copies of the reports. Instead, the reports will be made available on the Fund’s website (columbiathreadneedleus.com/investor/), and each time a report is posted you will be notified by mail and provided with a website address to access the report.
If you have already elected to receive shareholder reports electronically, you will not be affected by this change and you need not take any action. You may elect to receive shareholder reports and other communications from the Fund electronically at any time by contacting your financial intermediary (such as a broker-dealer or bank) or, for Fund shares held directly with the Fund, by calling 800.345.6611 or by enrolling in “eDelivery” by logging into your account at columbiathreadneedleus.com/investor/.
You may elect to receive all future reports in paper free of charge. If you invest through a financial intermediary, you can contact your financial intermediary to request that you continue receiving paper copies of your shareholder reports. If you invest directly with the Fund, you can call 800.345.6611 to let the Fund know you wish to continue receiving paper copies of your shareholder reports. Your election to receive paper reports will apply to all Columbia Funds held in your account if you invest through a financial intermediary or all Columbia Funds held with the fund complex if you invest directly with the Fund.
Not FDIC Insured • No bank guarantee • May lose value
Dear Shareholders,
Volatility exists in financial markets and this is not a comfortable fact of life. How investors deal with this reality, including how they react to short term spikes in volatility as well as to longer periods of increased or decreased volatility, may have a significant impact on their overall investing success.
Too often, investors change their investment strategy based on something that’s happening at a moment in time rather than thinking about how that change in strategy might affect their ability to achieve their longer term financial goals. Emotion replaces logic and reasoning. Investors may sell in reaction to a market drop (fear or panic), locking in low returns which means they won’t be invested when the market returns, or they invest more at a market peak (greed or conviction), essentially when it is expensive to do so. In both cases, selling and buying at the exact wrong time.
We believe the best outcomes come from a consistent approach to investing. Here are five areas where advisors can help us overcome the tendency to react emotionally as we struggle to make the right choices with our investments:
Long-term focus
The further away long-term goals, aspirations and objectives are, the easier it is to stray away from the goals and priorities that we set out. Advisors help us stay focused on what we want to accomplish.
Discipline through up-and-down markets
Advisors help set rules to prevent us from making rash decisions that we may regret later. Knowing ahead of time what you should do in case of certain situations will help you get through volatile markets and not make emotional decisions.
Tax-awareness
Taxes are one of the biggest drags on investment returns and are critical attributes of investing. Yet few of us take the necessary steps to ease the corrosive effect of taxes. Advisors have tools and knowledge that may help us to manage portfolios more tax-efficiently and keep more of what we earn.
Emotional objectivity
Our emotions are very hard to manage and making investment decisions in an emotional state can lead to exceedingly bad outcomes. An objective advisor can help prevent some of the reactionary mistakes emotions often lead us to.
Education and guidance
The role of the advisor is to teach and guide us toward achieving our financial goals. In terms of working through emotions, guidance is by far the most important component.
By understanding our own behaviors and biases, we can prepare for future challenges. Your success is our priority. Talk to your advisor about how working with Columbia Threadneedle Investments may help you stay the course and position your portfolio for consistent, sustainable outcomes, regardless of market conditions.
Sincerely,
Christopher O. Petersen
President, Columbia Funds
Columbia Funds are distributed by Columbia Management Investment Distributors, Inc., member FINRA, and managed by Columbia Management Investment Advisers, LLC.
© 2019 Columbia Management Investment Advisers, LLC. All rights reserved.
Columbia Select Large Cap Equity Fund | Annual Report 2019
Columbia Select Large Cap Equity Fund | Annual Report 2019
Investment objective
Columbia Select Large Cap Equity Fund (the Fund) seeks long-term capital appreciation.
Portfolio management
Peter Santoro, CFA
Co-Portfolio Manager
Managed Fund since 2004
Melda Mergen, CFA, CAIA
Co-Portfolio Manager
Managed Fund since 2014
Morningstar style boxTM
The Morningstar Style Box is based on a fund’s portfolio holdings. For equity funds, the vertical axis shows the market capitalization of the stocks owned, and the horizontal axis shows investment style (value, blend, or growth). Information shown is based on the most recent data provided by Morningstar.
© 2019 Morningstar, Inc. All rights reserved. The Morningstar information contained herein: (1) is proprietary to Morningstar and/or its content providers; (2) may not be copied or distributed; and (3) is not warranted to be accurate, complete or timely. Neither Morningstar nor its content providers are responsible for any damages or losses arising from any use of this information.
| Average annual total returns (%) (for the period ended February 28, 2019) |
| | | Inception | 1 Year | 5 Years | 10 Years |
| Class A | Excluding sales charges | 08/02/99 | 3.61 | 10.49 | 15.37 |
| | Including sales charges | | -2.32 | 9.19 | 14.68 |
| Advisor Class* | 07/05/17 | 3.88 | 10.76 | 15.64 |
| Class C | Excluding sales charges | 08/02/99 | 2.85 | 9.66 | 14.50 |
| | Including sales charges | | 1.91 | 9.66 | 14.50 |
| Institutional Class | 10/02/98 | 3.90 | 10.77 | 15.64 |
| Institutional 2 Class* | 11/08/12 | 4.01 | 10.86 | 15.71 |
| Institutional 3 Class* | 03/01/17 | 4.02 | 10.82 | 15.67 |
| S&P 500 Index | | 4.68 | 10.67 | 16.67 |
Returns for Class A shares are shown with and without the maximum initial sales charge of 5.75%. Returns for Class C shares are shown with and without the 1.00% contingent deferred sales charge for the first year only. The Fund’s other share classes are not subject to sales charges and have limited eligibility. Please see the Fund’s prospectus for details. Performance for different share classes will vary based on differences in sales charges and fees associated with each share class. All results shown assume reinvestment of distributions during the period. Returns do not reflect the deduction of taxes that a shareholder may pay on Fund distributions or on the redemption of Fund shares. Performance results reflect the effect of any fee waivers or reimbursements of Fund expenses by Columbia Management Investment Advisers, LLC and/or any of its affiliates. Absent these fee waivers or expense reimbursement arrangements, performance results would have been lower.
The performance information shown represents past performance and is not a guarantee of future results. The investment return and principal value of your investment will fluctuate so that your shares, when redeemed, may be worth more or less than their original cost. Current performance may be lower or higher than the performance information shown. You may obtain performance information current to the most recent month-end by contacting your financial intermediary, visiting columbiathreadneedleus.com/investor/ or calling 800.345.6611.
| * | The returns shown for periods prior to the share class inception date (including returns for the Life of the Fund, if shown, which are since Fund inception) include the returns of the Fund’s oldest share class. These returns are adjusted to reflect any higher class-related operating expenses of the newer share classes, as applicable. Please visit columbiathreadneedleus.com/investor/investment-products/mutual-funds/appended-performance for more information. |
The S&P 500 Index, an unmanaged index, measures the performance of 500 widely held, large-capitalization U.S. stocks and is frequently used as a general measure of market performance.
Indices are not available for investment, are not professionally managed and do not reflect sales charges, fees, brokerage commissions, taxes or other expenses of investing. Securities in the Fund may not match those in an index.
| 2 | Columbia Select Large Cap Equity Fund | Annual Report 2019 |
Fund at a Glance (continued)
Performance of a hypothetical $10,000 investment (February 28, 2009 — February 28, 2019)
The chart above shows the change in value of a hypothetical $10,000 investment in Class A shares of Columbia Select Large Cap Equity Fund during the stated time period, and does not reflect the deduction of taxes that a shareholder may pay on Fund distributions or on the redemption of Fund shares.
| Top 10 holdings (%) (at February 28, 2019) |
| Microsoft Corp. | 4.8 |
| Amazon.com, Inc. | 3.9 |
| Berkshire Hathaway, Inc., Class B | 3.5 |
| Alphabet, Inc., Class C | 3.4 |
| Bank of America Corp. | 3.2 |
| Johnson & Johnson | 3.1 |
| Pfizer, Inc. | 2.7 |
| Home Depot, Inc. (The) | 2.7 |
| JPMorgan Chase & Co. | 2.6 |
| Cisco Systems, Inc. | 2.3 |
Percentages indicated are based upon total investments excluding Money Market Funds and investments in derivatives, if any.
For further detail about these holdings, please refer to the section entitled “Portfolio of Investments.”
Fund holdings are as of the date given, are subject to change at any time, and are not recommendations to buy or sell any security.
| Portfolio breakdown (%) (at February 28, 2019) |
| Common Stocks | 98.1 |
| Money Market Funds | 1.9 |
| Total | 100.0 |
Percentages indicated are based upon total investments excluding investments in derivatives, if any. The Fund’s portfolio composition is subject to change.
| Equity sector breakdown (%) (at February 28, 2019) |
| Communication Services | 9.3 |
| Consumer Discretionary | 10.0 |
| Consumer Staples | 5.9 |
| Energy | 5.5 |
| Financials | 14.4 |
| Health Care | 14.6 |
| Industrials | 8.9 |
| Information Technology | 20.1 |
| Materials | 3.4 |
| Real Estate | 4.0 |
| Utilities | 3.9 |
| Total | 100.0 |
Percentages indicated are based upon total equity investments. The Fund’s portfolio composition is subject to change.
Columbia Select Large Cap Equity Fund | Annual Report 2019
| 3 |
Manager Discussion of Fund Performance
For the 12-month period that ended February 28, 2019, the Fund’s Class A shares returned 3.61% excluding sales charges. The S&P 500 Index returned 4.68%. Management fees, which the Fund pays but the index does not, generally accounted for the shortfall between the Fund and the index.
Stocks advanced despite year-end sell-off
Investors kicked off the 12-month period ended February 28, 2019 with soaring optimism. Positive global economic conditions, broad corporate tax cuts and moves to reduce regulation in a number of industries buoyed confidence. The pace of economic growth averaged more than 3.0% as the labor markets added an average of 209,000 jobs monthly, wages increased on the order of 3.0% and manufacturing activity remained solid. Unemployment rose modestly in December and January, but even that was a net positive as it reflected an increase in the number of Americans seeking employment. A weak February for job creation drove unemployment back down to 3.8% in February.
However, as 2018 progressed, the rosy global outlook dimmed. European economies transitioned to a slower pace, struggling with rising interest rates, trade tensions and uncertainty surrounding Brexit (the U.K.’s departure from the European Union). At the same time, China’s economic conditions weakened and emerging markets came under pressure, driven by trade concerns and a rising U.S. dollar. In December, the Federal Reserve (the Fed) rattled investors when it raised the target range of its key short-term interest rate, the federal funds rate, to 2.25%-2.50%, the fourth such increase for the year. However, the Fed maintained this rate in its January 2019 meeting and announced that it would be patient moving forward.
As uncertainties rose late in 2018, investors backed away from riskier assets. Technology stocks, which had been global market leaders, stumbled in the third quarter of 2018 and triggered a broader market sell-off of stocks and high-yield bonds in the fourth quarter. However, stocks rebounded early in 2019 as a patient Fed and hopes for progress on the trade front inspired confidence. The S&P 500 Index, a broad measure of U.S. stock returns, gained 4.68% for the 12-month period, with dividends reinvested. Investment-grade bonds, as measured by the Bloomberg Barclays U.S. Aggregate Bond Index, returned 3.17%.
Contributors and detractors
The Fund’s gains were driven by stock selection in the industrials, technology, health care and utilities sectors. Within industrials, Norfolk Southern and Ingersoll Rand were top contributors to Fund results. Norfolk Southern benefited from strength in both intermodal and merchandise freight traffic, where volume and pricing trends have been better than expected. Ingersoll Rand shares were rewarded for the company’s solid execution. The company’s end markets were strong, and HVAC (heat, ventilation and air conditioning) units gained market share from competitors.
In technology, it was another good year for Microsoft and MasterCard. Microsoft continued to benefit from the transition to products and services that generate recurring revenue, including its cloud-based Azure and Office 365. The company exceeded revenue and earnings expectations and offered a solid outlook. MasterCard was another strong technology holding for the Fund. The company has accelerated across all metrics. We believe MasterCard has the potential for durable long-term growth as consumers continue to move away from cash and checks. The Fund also enjoyed solid gains in the health care sector, where Pfizer rose strongly for the period. Pfizer management gave an upbeat view on the company’s product pipeline, and investors responded with enthusiasm.
Elsewhere in the portfolio, Canada Goose, a top outerwear and leisurewear company, was a top performer. The company raised its earnings guidance. Investors also took a positive view of an announced new venture in China. In the utilities sector, Ameren and American Electric Power, which are regulated domestic utilities, were strong contributors to Fund gains. Their visibility on earnings and dividend growth were appreciated — and rewarded — by the market.
Individual detractors from Fund performance were not sector specific. Facebook lost ground as it faced scrutiny over a significant data breach. It is unclear how much it will take to address these privacy problems as well as what impact this could have on advertising going forward, so we sold the stock. Shares of DISH Networks continued to decline as the company reported disappointing results from its satellite business and fell short of earnings expectations. We held onto
| 4 | Columbia Select Large Cap Equity Fund | Annual Report 2019 |
Manager Discussion of Fund Performance (continued)
DISH. In the materials sector, Dow Dupont and Eastman were weighed down by trade issues, lower energy prices and soft demand in China. In the financials sector, BlackRock faced challenging market conditions. Competitor Fidelity’s announcement that it was introducing selected no-fee products hurt all asset managers, including BlackRock. We sold BlackRock in the period.
At period’s end
The Fund aims to deliver long-term capital growth by focusing on individual stock selection. We believe a combination of certain factors outperforms throughout a market cycle. We emphasize companies that have strong free cash flow generation potential, improving revenue and earnings trends, high or rising returns on invested capital, and sound or improving balance sheets. We remain comfortable with this approach in any market environment.
Market risk may affect a single issuer, sector of the economy, industry or the market as a whole.Growth securities, at times, may not perform as well as value securities or the stock market in general and may be out of favor with investors.Value securities may be unprofitable if the market fails to recognize their intrinsic worth or the portfolio manager misgauged that worth.Foreign investments subject the Fund to risks, including political, economic, market, social and others within a particular country, as well as to currency instabilities and less stringent financial and accounting standards generally applicable to U.S. issuers. Investments in alimited number of companies or sectors subject the Fund to greater risk of loss. The Fund may invest significantly in issuers within a particular sector, which may be negatively affected by market, economic or other conditions, making the Fund more vulnerable to unfavorable developments in the sector. Investing inderivatives is a specialized activity that involves special risks, which may result in significant losses. See the Fund’s prospectus for more information on these and other risks.
The views expressed in this report reflect the current views of the respective parties. These views are not guarantees of future performance and involve certain risks, uncertainties and assumptions that are difficult to predict, so actual outcomes and results may differ significantly from the views expressed. These views are subject to change at any time based upon economic, market or other conditions and the respective parties disclaim any responsibility to update such views. These views may not be relied on as investment advice and, because investment decisions for a Columbia fund are based on numerous factors, may not be relied on as an indication of trading intent on behalf of any particular Columbia fund. References to specific securities should not be construed as a recommendation or investment advice.
Columbia Select Large Cap Equity Fund | Annual Report 2019
| 5 |
Understanding Your Fund’s Expenses
(Unaudited)
As an investor, you incur two types of costs. There are shareholder transaction costs, which generally include sales charges on purchases and may include redemption fees. There are also ongoing fund costs, which generally include management fees, distribution and/or service fees, and other fund expenses. The following information is intended to help you understand your ongoing costs (in dollars) of investing in the Fund and to help you compare these costs with the ongoing costs of investing in other mutual funds.
Analyzing your Fund’s expenses
To illustrate these ongoing costs, we have provided examples and calculated the expenses paid by investors in each share class of the Fund during the period. The actual and hypothetical information in the table is based on an initial investment of $1,000 at the beginning of the period indicated and held for the entire period. Expense information is calculated two ways and each method provides you with different information. The amount listed in the “Actual” column is calculated using the Fund’s actual operating expenses and total return for the period. You may use the Actual information, together with the amount invested, to estimate the expenses that you paid over the period. Simply divide your account value by $1,000 (for example, an $8,600 account value divided by $1,000 = 8.6), then multiply the results by the expenses paid during the period under the “Actual” column. The amount listed in the “Hypothetical” column assumes a 5% annual rate of return before expenses (which is not the Fund’s actual return) and then applies the Fund’s actual expense ratio for the period to the hypothetical return. You should not use the hypothetical account values and expenses to estimate either your actual account balance at the end of the period or the expenses you paid during the period. See “Compare with other funds” below for details on how to use the hypothetical data.
Compare with other funds
Since all mutual funds are required to include the same hypothetical calculations about expenses in shareholder reports, you can use this information to compare the ongoing cost of investing in the Fund with other funds. To do so, compare the hypothetical example with the 5% hypothetical examples that appear in the shareholder reports of other funds. As you compare hypothetical examples of other funds, it is important to note that hypothetical examples are meant to highlight the ongoing costs of investing in a fund only and do not reflect any transaction costs, such as sales charges, or redemption or exchange fees. Therefore, the hypothetical calculations are useful in comparing ongoing costs only, and will not help you determine the relative total costs of owning different funds. If transaction costs were included in these calculations, your costs would be higher.
| September 1, 2018 — February 28, 2019 |
| | Account value at the
beginning of the
period ($) | Account value at the
end of the
period ($) | Expenses paid during
the period ($) | Fund’s annualized
expense ratio (%) |
| | Actual | Hypothetical | Actual | Hypothetical | Actual | Hypothetical | Actual |
| Class A | 1,000.00 | 1,000.00 | 966.30 | 1,020.83 | 3.90 | 4.01 | 0.80 |
| Advisor Class | 1,000.00 | 1,000.00 | 967.40 | 1,022.07 | 2.68 | 2.76 | 0.55 |
| Class C | 1,000.00 | 1,000.00 | 962.70 | 1,017.11 | 7.54 | 7.75 | 1.55 |
| Institutional Class | 1,000.00 | 1,000.00 | 967.50 | 1,022.07 | 2.68 | 2.76 | 0.55 |
| Institutional 2 Class | 1,000.00 | 1,000.00 | 967.80 | 1,022.56 | 2.20 | 2.26 | 0.45 |
| Institutional 3 Class | 1,000.00 | 1,000.00 | 968.10 | 1,022.66 | 2.10 | 2.16 | 0.43 |
Expenses paid during the period are equal to the annualized expense ratio for each class as indicated above, multiplied by the average account value over the period and then multiplied by the number of days in the Fund’s most recent fiscal half year and divided by 365.
Expenses do not include fees and expenses incurred indirectly by the Fund from its investment in underlying funds, including affiliated and non-affiliated pooled investment vehicles, such as mutual funds and exchange-traded funds.
Had Columbia Management Investment Advisers, LLC and/or certain of its affiliates not waived/reimbursed certain fees and expenses, account value at the end of the period would have been reduced.
| 6 | Columbia Select Large Cap Equity Fund | Annual Report 2019 |
Portfolio of Investments
February 28, 2019
(Percentages represent value of investments compared to net assets)
Investments in securities
| Common Stocks 97.9% |
| Issuer | Shares | Value ($) |
| Communication Services 9.1% |
| Entertainment 1.3% |
| Electronic Arts, Inc.(a) | 90,066 | 8,626,521 |
| Interactive Media & Services 4.5% |
| Alphabet, Inc., Class A(a) | 7,214 | 8,126,932 |
| Alphabet, Inc., Class C(a) | 20,313 | 22,748,935 |
| Total | | 30,875,867 |
| Media 1.9% |
| Discovery, Inc., Class A(a) | 301,078 | 8,701,154 |
| DISH Network Corp., Class A(a) | 128,566 | 4,179,681 |
| Total | | 12,880,835 |
| Wireless Telecommunication Services 1.4% |
| T-Mobile U.S.A., Inc.(a) | 133,280 | 9,624,149 |
| Total Communication Services | 62,007,372 |
| Consumer Discretionary 9.8% |
| Automobiles 1.5% |
| General Motors Co. | 266,130 | 10,506,812 |
| Internet & Direct Marketing Retail 3.9% |
| Amazon.com, Inc.(a) | 16,001 | 26,238,920 |
| Specialty Retail 2.6% |
| Home Depot, Inc. (The) | 95,443 | 17,670,317 |
| Textiles, Apparel & Luxury Goods 1.8% |
| Canada Goose Holdings, Inc.(a) | 63,615 | 3,620,330 |
| Capri Holdings Ltd.(a) | 78,458 | 3,577,685 |
| Tapestry, Inc. | 140,794 | 4,919,342 |
| Total | | 12,117,357 |
| Total Consumer Discretionary | 66,533,406 |
| Consumer Staples 5.8% |
| Beverages 1.9% |
| PepsiCo, Inc. | 112,709 | 13,033,669 |
| Food Products 1.7% |
| Mondelez International, Inc., Class A | 244,098 | 11,511,661 |
| Tobacco 2.2% |
| Philip Morris International, Inc. | 172,048 | 14,957,853 |
| Total Consumer Staples | 39,503,183 |
| Common Stocks (continued) |
| Issuer | Shares | Value ($) |
| Energy 5.4% |
| Energy Equipment & Services 0.5% |
| Helmerich & Payne, Inc. | 62,336 | 3,378,611 |
| Oil, Gas & Consumable Fuels 4.9% |
| Cimarex Energy Co. | 59,648 | 4,289,288 |
| EOG Resources, Inc. | 90,961 | 8,550,334 |
| Suncor Energy, Inc. | 296,796 | 10,227,590 |
| Valero Energy Corp. | 127,942 | 10,434,950 |
| Total | | 33,502,162 |
| Total Energy | 36,880,773 |
| Financials 14.2% |
| Banks 7.5% |
| Bank of America Corp. | 724,080 | 21,056,247 |
| Citigroup, Inc. | 195,031 | 12,478,083 |
| JPMorgan Chase & Co. | 165,411 | 17,262,292 |
| Total | | 50,796,622 |
| Diversified Financial Services 3.4% |
| Berkshire Hathaway, Inc., Class B(a) | 115,422 | 23,234,448 |
| Insurance 3.3% |
| Allstate Corp. (The) | 122,691 | 11,579,577 |
| Prudential Financial, Inc. | 112,919 | 10,823,286 |
| Total | | 22,402,863 |
| Total Financials | 96,433,933 |
| Health Care 14.3% |
| Biotechnology 3.7% |
| Alexion Pharmaceuticals, Inc.(a) | 49,028 | 6,634,959 |
| Biogen, Inc.(a) | 17,104 | 5,610,283 |
| BioMarin Pharmaceutical, Inc.(a) | 53,460 | 4,985,680 |
| Exact Sciences Corp.(a) | 29,078 | 2,646,098 |
| Vertex Pharmaceuticals, Inc.(a) | 26,655 | 5,031,131 |
| Total | | 24,908,151 |
| Health Care Equipment & Supplies 1.8% |
| Baxter International, Inc. | 163,260 | 12,200,420 |
| Life Sciences Tools & Services 1.2% |
| Agilent Technologies, Inc. | 107,799 | 8,563,553 |
The accompanying Notes to Financial Statements are an integral part of this statement.
Columbia Select Large Cap Equity Fund | Annual Report 2019
| 7 |
Portfolio of Investments (continued)
February 28, 2019
| Common Stocks (continued) |
| Issuer | Shares | Value ($) |
| Pharmaceuticals 7.6% |
| Allergan PLC | 45,128 | 6,214,577 |
| Bristol-Myers Squibb Co. | 121,758 | 6,290,018 |
| Johnson & Johnson | 153,404 | 20,961,122 |
| Pfizer, Inc. | 420,079 | 18,210,425 |
| Total | | 51,676,142 |
| Total Health Care | 97,348,266 |
| Industrials 8.7% |
| Aerospace & Defense 3.6% |
| L3 Technologies, Inc. | 59,415 | 12,581,126 |
| Northrop Grumman Corp. | 41,533 | 12,042,909 |
| Total | | 24,624,035 |
| Airlines 1.7% |
| Delta Air Lines, Inc. | 228,555 | 11,331,757 |
| Machinery 1.6% |
| Ingersoll-Rand PLC | 106,459 | 11,237,812 |
| Road & Rail 1.8% |
| Norfolk Southern Corp. | 67,217 | 12,052,008 |
| Total Industrials | 59,245,612 |
| Information Technology 19.6% |
| Communications Equipment 2.2% |
| Cisco Systems, Inc. | 297,881 | 15,421,299 |
| IT Services 3.8% |
| International Business Machines Corp. | 82,604 | 11,410,091 |
| MasterCard, Inc., Class A | 63,574 | 14,289,528 |
| Total | | 25,699,619 |
| Semiconductors & Semiconductor Equipment 3.9% |
| Broadcom, Inc. | 49,059 | 13,508,886 |
| NVIDIA Corp. | 40,775 | 6,289,952 |
| NXP Semiconductors NV | 72,750 | 6,643,530 |
| Total | | 26,442,368 |
| Software 7.6% |
| Adobe, Inc.(a) | 43,578 | 11,439,225 |
| Microsoft Corp. | 287,148 | 32,169,190 |
| Palo Alto Networks, Inc.(a) | 33,959 | 8,363,083 |
| Total | | 51,971,498 |
| Common Stocks (continued) |
| Issuer | Shares | Value ($) |
| Technology Hardware, Storage & Peripherals 2.1% |
| Apple, Inc.(b) | 82,727 | 14,324,180 |
| Total Information Technology | 133,858,964 |
| Materials 3.3% |
| Chemicals 2.8% |
| DowDuPont, Inc. | 212,050 | 11,287,421 |
| Eastman Chemical Co. | 94,265 | 7,794,773 |
| Total | | 19,082,194 |
| Metals & Mining 0.5% |
| Steel Dynamics, Inc. | 100,527 | 3,751,668 |
| Total Materials | 22,833,862 |
| Real Estate 3.9% |
| Equity Real Estate Investment Trusts (REITS) 3.9% |
| American Tower Corp. | 55,054 | 9,697,762 |
| Equity LifeStyle Properties, Inc. | 76,933 | 8,358,001 |
| Host Hotels & Resorts, Inc. | 430,255 | 8,437,301 |
| Total | | 26,493,064 |
| Total Real Estate | 26,493,064 |
| Utilities 3.8% |
| Electric Utilities 2.6% |
| American Electric Power Co., Inc. | 107,892 | 8,755,436 |
| Xcel Energy, Inc. | 164,063 | 9,000,496 |
| Total | | 17,755,932 |
| Multi-Utilities 1.2% |
| Ameren Corp. | 112,702 | 8,028,890 |
| Total Utilities | 25,784,822 |
Total Common Stocks
(Cost $505,517,567) | 666,923,257 |
|
| Money Market Funds 1.9% |
| | Shares | Value ($) |
| Columbia Short-Term Cash Fund, 2.523%(c),(d) | 12,897,378 | 12,896,089 |
Total Money Market Funds
(Cost $12,896,089) | 12,896,089 |
Total Investments in Securities
(Cost: $518,413,656) | 679,819,346 |
| Other Assets & Liabilities, Net | | 1,092,592 |
| Net Assets | 680,911,938 |
At February 28, 2019, securities and/or cash totaling $969,640 were pledged as collateral.
The accompanying Notes to Financial Statements are an integral part of this statement.
| 8 | Columbia Select Large Cap Equity Fund | Annual Report 2019 |
Portfolio of Investments (continued)
February 28, 2019
Investments in derivatives
| Long futures contracts |
| Description | Number of
contracts | Expiration
date | Trading
currency | Notional
amount | Value/Unrealized
appreciation ($) | Value/Unrealized
depreciation ($) |
| S&P 500 E-mini | 91 | 03/2019 | USD | 12,670,385 | 1,088,472 | — |
Notes to Portfolio of Investments
| (a) | Non-income producing investment. |
| (b) | This security or a portion of this security has been pledged as collateral in connection with derivative contracts. |
| (c) | The rate shown is the seven-day current annualized yield at February 28, 2019. |
| (d) | As defined in the Investment Company Act of 1940, an affiliated company is one in which the Fund owns 5% or more of the company’s outstanding voting securities, or a company which is under common ownership or control with the Fund. Holdings and transactions in these affiliated companies during the year ended February 28, 2019 are as follows: |
| Issuer | Beginning
shares | Shares
purchased | Shares
sold | Ending
shares | Realized gain
(loss) —
affiliated
issuers ($) | Net change in
unrealized
appreciation
(depreciation) —
affiliated
issuers ($) | Dividends —
affiliated
issuers ($) | Value —
affiliated
issuers
at end of
period ($) |
| Columbia Short-Term Cash Fund, 2.523% |
| | 18,828,776 | 186,677,533 | (192,608,931) | 12,897,378 | 615 | 375 | 335,666 | 12,896,089 |
Currency Legend
Fair value measurements
The Fund categorizes its fair value measurements according to a three-level hierarchy that maximizes the use of observable inputs and minimizes the use of unobservable inputs by prioritizing that the most observable input be used when available. Observable inputs are those that market participants would use in pricing an investment based on market data obtained from sources independent of the reporting entity. Unobservable inputs are those that reflect the Fund’s assumptions about the information market participants would use in pricing an investment. An investment’s level within the fair value hierarchy is based on the lowest level of any input that is deemed significant to the asset’s or liability’s fair value measurement. The input levels are not necessarily an indication of the risk or liquidity associated with investments at that level. For example, certain U.S. government securities are generally high quality and liquid, however, they are reflected as Level 2 because the inputs used to determine fair value may not always be quoted prices in an active market.
Fair value inputs are summarized in the three broad levels listed below:
| ■ | Level 1 — Valuations based on quoted prices for investments in active markets that the Fund has the ability to access at the measurement date. Valuation adjustments are not applied to Level 1 investments. |
| ■ | Level 2 — Valuations based on other significant observable inputs (including quoted prices for similar securities, interest rates, prepayment speeds, credit risks, etc.). |
| ■ | Level 3 — Valuations based on significant unobservable inputs (including the Fund’s own assumptions and judgment in determining the fair value of investments). |
Inputs that are used in determining fair value of an investment may include price information, credit data, volatility statistics, and other factors. These inputs can be either observable or unobservable. The availability of observable inputs can vary between investments, and is affected by various factors such as the type of investment, and the volume and level of activity for that investment or similar investments in the marketplace. The inputs will be considered by the Investment Manager, along with any other relevant factors in the calculation of an investment’s fair value. The Fund uses prices and inputs that are current as of the measurement date, which may include periods of market dislocations. During these periods, the availability of prices and inputs may be reduced for many investments. This condition could cause an investment to be reclassified between the various levels within the hierarchy.
Certain investments that have been measured at fair value using the net asset value (NAV) per share (or its equivalent) are not categorized in the fair value hierarchy. The fair value amounts presented in the table are intended to reconcile the fair value hierarchy to the amounts presented in the Portfolio of Investments. The Columbia Short-Term Cash Fund seeks to provide shareholders with maximum current income consistent with liquidity and stability of principal. Columbia Short-Term Cash Fund prices its shares with a floating NAV and no longer seeks to maintain a stable NAV.
Investments falling into the Level 3 category are primarily supported by quoted prices from brokers and dealers participating in the market for those investments. However, these may be classified as Level 3 investments due to lack of market transparency and corroboration to support these quoted prices. Additionally, valuation models may be used as the pricing source for any remaining investments classified as Level 3. These models may rely on one or more significant unobservable inputs and/or significant assumptions by the Investment Manager. Inputs used in valuations may include, but are not limited to, financial statement analysis, capital account balances, discount rates and estimated cash flows, and comparable company data.
Under the direction of the Fund’s Board of Trustees (the Board), the Investment Manager’s Valuation Committee (the Committee) is responsible for overseeing the valuation procedures approved by the Board. The Committee consists of voting and non-voting members from various groups within the Investment Manager’s organization, including operations and accounting, trading and investments, compliance, risk management and legal.
The accompanying Notes to Financial Statements are an integral part of this statement.
Columbia Select Large Cap Equity Fund | Annual Report 2019
| 9 |
Portfolio of Investments (continued)
February 28, 2019
Fair value measurements (continued)
The Committee meets at least monthly to review and approve valuation matters, which may include a description of specific valuation determinations, data regarding pricing information received from approved pricing vendors and brokers and the results of Board-approved valuation control policies and procedures (the Policies). The Policies address, among other things, instances when market quotations are or are not readily available, including recommendations of third party pricing vendors and a determination of appropriate pricing methodologies; events that require specific valuation determinations and assessment of fair value techniques; securities with a potential for stale pricing, including those that are illiquid, restricted, or in default; and the effectiveness of third party pricing vendors, including periodic reviews of vendors. The Committee meets more frequently, as needed, to discuss additional valuation matters, which may include the need to review back-testing results, review time-sensitive information or approve related valuation actions. The Committee reports to the Board, with members of the Committee meeting with the Board at each of its regularly scheduled meetings to discuss valuation matters and actions during the period, similar to those described earlier.
For investments categorized as Level 3, the Committee monitors information similar to that described above, which may include: (i) data specific to the issuer or comparable issuers, (ii) general market or specific sector news and (iii) quoted prices and specific or similar security transactions. The Committee considers this data and any changes from prior periods in order to assess the reasonableness of observable and unobservable inputs, any assumptions or internal models used to value those securities and changes in fair value. This data is also used to corroborate, when available, information received from approved pricing vendors and brokers. Various factors impact the frequency of monitoring this information (which may occur as often as daily). However, the Committee may determine that changes to inputs, assumptions and models are not required as a result of the monitoring procedures performed.
The following table is a summary of the inputs used to value the Fund’s investments at February 28, 2019:
| | Level 1
quoted prices
in active
markets for
identical
assets ($) | Level 2
other
significant
observable
inputs ($) | Level 3
significant
unobservable
inputs ($) | Investments
measured at
net asset
value ($) | Total ($) |
| Investments in Securities | | | | | |
| Common Stocks | | | | | |
| Communication Services | 62,007,372 | — | — | — | 62,007,372 |
| Consumer Discretionary | 66,533,406 | — | — | — | 66,533,406 |
| Consumer Staples | 39,503,183 | — | — | — | 39,503,183 |
| Energy | 36,880,773 | — | — | — | 36,880,773 |
| Financials | 96,433,933 | — | — | — | 96,433,933 |
| Health Care | 97,348,266 | — | — | — | 97,348,266 |
| Industrials | 59,245,612 | — | — | — | 59,245,612 |
| Information Technology | 133,858,964 | — | — | — | 133,858,964 |
| Materials | 22,833,862 | — | — | — | 22,833,862 |
| Real Estate | 26,493,064 | — | — | — | 26,493,064 |
| Utilities | 25,784,822 | — | — | — | 25,784,822 |
| Total Common Stocks | 666,923,257 | — | — | — | 666,923,257 |
| Money Market Funds | — | — | — | 12,896,089 | 12,896,089 |
| Total Investments in Securities | 666,923,257 | — | — | 12,896,089 | 679,819,346 |
| Investments in Derivatives | | | | | |
| Asset | | | | | |
| Futures Contracts | 1,088,472 | — | — | — | 1,088,472 |
| Total | 668,011,729 | — | — | 12,896,089 | 680,907,818 |
See the Portfolio of Investments for all investment classifications not indicated in the table.
Derivative instruments are valued at unrealized appreciation (depreciation).
There were no transfers of financial assets between levels during the period.
The accompanying Notes to Financial Statements are an integral part of this statement.
| 10 | Columbia Select Large Cap Equity Fund | Annual Report 2019 |
Statement of Assets and Liabilities
February 28, 2019
| Assets | |
| Investments in securities, at value | |
| Unaffiliated issuers (cost $505,517,567) | $666,923,257 |
| Affiliated issuers (cost $12,896,089) | 12,896,089 |
| Receivable for: | |
| Investments sold | 538,854 |
| Capital shares sold | 57,574 |
| Dividends | 1,663,056 |
| Foreign tax reclaims | 6,679 |
| Variation margin for futures contracts | 1,500 |
| Expense reimbursement due from Investment Manager | 7,172 |
| Prepaid expenses | 1,851 |
| Total assets | 682,096,032 |
| Liabilities | |
| Payable for: | |
| Capital shares purchased | 903,655 |
| Variation margin for futures contracts | 49,920 |
| Management services fees | 14,163 |
| Distribution and/or service fees | 1,256 |
| Transfer agent fees | 34,706 |
| Compensation of board members | 134,990 |
| Compensation of chief compliance officer | 6 |
| Other expenses | 45,398 |
| Total liabilities | 1,184,094 |
| Net assets applicable to outstanding capital stock | $680,911,938 |
| Represented by | |
| Paid in capital | 500,155,998 |
| Total distributable earnings (loss) (Note 2) | 180,755,940 |
| Total - representing net assets applicable to outstanding capital stock | $680,911,938 |
| Class A | |
| Net assets | $151,703,311 |
| Shares outstanding | 10,872,913 |
| Net asset value per share | $13.95 |
| Maximum sales charge | 5.75% |
| Maximum offering price per share (calculated by dividing the net asset value per share by 1.0 minus the maximum sales charge for Class A shares) | $14.80 |
| Advisor Class | |
| Net assets | $3,142,759 |
| Shares outstanding | 228,015 |
| Net asset value per share | $13.78 |
| Class C | |
| Net assets | $7,782,749 |
| Shares outstanding | 610,739 |
| Net asset value per share | $12.74 |
| Institutional Class | |
| Net assets | $158,057,263 |
| Shares outstanding | 11,419,503 |
| Net asset value per share | $13.84 |
| Institutional 2 Class | |
| Net assets | $19,466,007 |
| Shares outstanding | 1,364,793 |
| Net asset value per share | $14.26 |
| Institutional 3 Class | |
| Net assets | $340,759,849 |
| Shares outstanding | 24,991,931 |
| Net asset value per share | $13.63 |
The accompanying Notes to Financial Statements are an integral part of this statement.
Columbia Select Large Cap Equity Fund | Annual Report 2019
| 11 |
Statement of Operations
Year Ended February 28, 2019
| Net investment income | |
| Income: | |
| Dividends — unaffiliated issuers | $12,099,870 |
| Dividends — affiliated issuers | 335,666 |
| Interfund lending | 531 |
| Foreign taxes withheld | (37,300) |
| Total income | 12,398,767 |
| Expenses: | |
| Management services fees | 4,941,980 |
| Distribution and/or service fees | |
| Class A | 371,943 |
| Class C | 77,181 |
| Class T | 6 |
| Transfer agent fees | |
| Class A | 214,226 |
| Advisor Class | 2,132 |
| Class C | 11,122 |
| Institutional Class | 235,184 |
| Institutional 2 Class | 2,898 |
| Institutional 3 Class | 23,133 |
| Class T | 3 |
| Compensation of board members | 14,981 |
| Custodian fees | 9,378 |
| Printing and postage fees | 32,434 |
| Registration fees | 113,853 |
| Audit fees | 30,551 |
| Legal fees | 12,450 |
| Compensation of chief compliance officer | 135 |
| Other | 23,924 |
| Total expenses | 6,117,514 |
| Fees waived or expenses reimbursed by Investment Manager and its affiliates | (2,485,978) |
| Expense reduction | (1,660) |
| Total net expenses | 3,629,876 |
| Net investment income | 8,768,891 |
| Realized and unrealized gain (loss) — net | |
| Net realized gain (loss) on: | |
| Investments — unaffiliated issuers | 48,058,454 |
| Investments — affiliated issuers | 615 |
| Foreign currency translations | (2,471) |
| Futures contracts | (1,508,484) |
| Options purchased | (28,312) |
| Options contracts written | (701,480) |
| Net realized gain | 45,818,322 |
| Net change in unrealized appreciation (depreciation) on: | |
| Investments — unaffiliated issuers | (29,354,553) |
| Investments — affiliated issuers | 375 |
| Futures contracts | 1,088,472 |
| Net change in unrealized appreciation (depreciation) | (28,265,706) |
| Net realized and unrealized gain | 17,552,616 |
| Net increase in net assets resulting from operations | $26,321,507 |
The accompanying Notes to Financial Statements are an integral part of this statement.
| 12 | Columbia Select Large Cap Equity Fund | Annual Report 2019 |
Statement of Changes in Net Assets
| | Year Ended
February 28, 2019 | Year Ended
February 28, 2018(a),(b) |
| Operations | | |
| Net investment income | $8,768,891 | $5,507,546 |
| Net realized gain | 45,818,322 | 53,265,099 |
| Net change in unrealized appreciation (depreciation) | (28,265,706) | 54,649,119 |
| Net increase in net assets resulting from operations | 26,321,507 | 113,421,764 |
| Distributions to shareholders | | |
| Net investment income and net realized gains | | |
| Class A | (13,958,703) | |
| Advisor Class | (139,047) | |
| Class C | (716,858) | |
| Institutional Class | (15,805,690) | |
| Institutional 2 Class | (421,522) | |
| Institutional 3 Class | (32,264,321) | |
| Class T | (258) | |
| Net investment income | | |
| Class A | | (801,525) |
| Advisor Class | | (167) |
| Institutional Class | | (1,344,319) |
| Institutional 2 Class | | (86,368) |
| Institutional 3 Class | | (2,945,134) |
| Class T | | (16) |
| Net realized gains | | |
| Class A | | (6,926,613) |
| Advisor Class | | (961) |
| Class B | | (575) |
| Class C | | (380,541) |
| Institutional Class | | (8,214,462) |
| Institutional 2 Class | | (489,290) |
| Institutional 3 Class | | (15,743,846) |
| Class T | | (133) |
| Total distributions to shareholders (Note 2) | (63,306,399) | (36,933,950) |
| Increase (decrease) in net assets from capital stock activity | 48,484,123 | (12,862,070) |
| Total increase in net assets | 11,499,231 | 63,625,744 |
| Net assets at beginning of year | 669,412,707 | 605,786,963 |
| Net assets at end of year | $680,911,938 | $669,412,707 |
| Undistributed net investment income | $1,281,249 | $775,898 |
| (a) | Advisor Class shares are based on operations from July 5, 2017 (commencement of operations) through the stated period end. |
| (b) | Institutional 3 Class shares are based on operations from March 1, 2017 (commencement of operations) through the stated period end. |
The accompanying Notes to Financial Statements are an integral part of this statement.
Columbia Select Large Cap Equity Fund | Annual Report 2019
| 13 |
Statement of Changes in Net Assets (continued)
| | Year Ended | Year Ended |
| | February 28, 2019 | February 28, 2018(a),(b) |
| | Shares | Dollars ($) | Shares | Dollars ($) |
| Capital stock activity |
| Class A | | | | |
| Subscriptions | 1,722,849 | 24,297,972 | 1,158,222 | 16,477,376 |
| Distributions reinvested | 327,491 | 4,539,237 | 157,792 | 2,256,706 |
| Redemptions | (1,267,527) | (18,043,220) | (1,607,372) | (22,500,825) |
| Net increase (decrease) | 782,813 | 10,793,989 | (291,358) | (3,766,743) |
| Advisor Class | | | | |
| Subscriptions | 362,240 | 5,115,795 | 16,293 | 244,523 |
| Distributions reinvested | 10,342 | 138,788 | 70 | 1,001 |
| Redemptions | (160,927) | (2,350,125) | (3) | (40) |
| Net increase | 211,655 | 2,904,458 | 16,360 | 245,484 |
| Class B | | | | |
| Subscriptions | — | — | 5 | 62 |
| Distributions reinvested | — | — | 38 | 488 |
| Redemptions | — | — | (9,001) | (114,088) |
| Net decrease | — | — | (8,958) | (113,538) |
| Class C | | | | |
| Subscriptions | 238,221 | 2,999,930 | 307,336 | 4,022,730 |
| Distributions reinvested | 50,872 | 648,448 | 25,865 | 341,429 |
| Redemptions | (279,518) | (3,687,068) | (199,221) | (2,588,503) |
| Net increase (decrease) | 9,575 | (38,690) | 133,980 | 1,775,656 |
| Class I | | | | |
| Subscriptions | — | — | 32,752 | 408,575 |
| Redemptions | — | — | (23,277,026) | (303,501,028) |
| Net decrease | — | — | (23,244,274) | (303,092,453) |
| Institutional Class | | | | |
| Subscriptions | 1,060,395 | 14,613,282 | 1,052,609 | 14,741,755 |
| Distributions reinvested | 751,916 | 10,340,006 | 405,366 | 5,750,228 |
| Redemptions | (1,977,365) | (27,630,441) | (2,058,740) | (29,109,319) |
| Net decrease | (165,054) | (2,677,153) | (600,765) | (8,617,336) |
| Institutional 2 Class | | | | |
| Subscriptions | 1,215,011 | 16,522,712 | 1,080,548 | 15,409,873 |
| Distributions reinvested | 29,817 | 421,257 | 39,488 | 575,502 |
| Redemptions | (593,073) | (8,837,909) | (427,042) | (6,232,531) |
| Net increase | 651,755 | 8,106,060 | 692,994 | 9,752,844 |
| Institutional 3 Class | | | | |
| Subscriptions | 5,053,174 | 72,022,667 | 25,681,224 | 331,789,288 |
| Distributions reinvested | 2,236,881 | 30,308,418 | 1,336,438 | 18,688,820 |
| Redemptions | (5,060,529) | (72,933,175) | (4,255,257) | (59,524,092) |
| Net increase | 2,229,526 | 29,397,910 | 22,762,405 | 290,954,016 |
| Class T | | | | |
| Redemptions | (189) | (2,451) | — | — |
| Net decrease | (189) | (2,451) | — | — |
| Total net increase (decrease) | 3,720,081 | 48,484,123 | (539,616) | (12,862,070) |
| (a) | Advisor Class shares are based on operations from July 5, 2017 (commencement of operations) through the stated period end. |
| (b) | Institutional 3 Class shares are based on operations from March 1, 2017 (commencement of operations) through the stated period end. |
The accompanying Notes to Financial Statements are an integral part of this statement.
| 14 | Columbia Select Large Cap Equity Fund | Annual Report 2019 |
[THIS PAGE INTENTIONALLY LEFT BLANK]
Columbia Select Large Cap Equity Fund | Annual Report 2019
| 15 |
The following table is intended to help you understand the Fund’s financial performance. Certain information reflects financial results for a single share of a class held for the periods shown. Per share net investment income (loss) amounts are calculated based on average shares outstanding during the period. Total return assumes reinvestment of all dividends and distributions, if any. Total return does not reflect payment of sales charges, if any. Total return and portfolio turnover are not annualized for periods of less than one year. The portfolio turnover rate is calculated without regard to purchase and sales transactions of short-term instruments and certain derivatives, if any. If such transactions were included, the Fund’s portfolio turnover rate may be higher.
| | Net asset value,
beginning of
period | Net
investment
income
(loss) | Net
realized
and
unrealized
gain (loss) | Total from
investment
operations | Distributions
from net
investment
income | Distributions
from net
realized
gains | Total
distributions to
shareholders |
| Class A |
| Year Ended 2/28/2019 | $14.82 | 0.16 | 0.33 | 0.49 | (0.14) | (1.22) | (1.36) |
| Year Ended 2/28/2018 | $13.16 | 0.09 | 2.36 | 2.45 | (0.08) | (0.71) | (0.79) |
| Year Ended 2/28/2017 | $10.85 | 0.12 | 2.43 | 2.55 | (0.12) | (0.12) | (0.24) |
| Year Ended 2/29/2016 | $12.86 | 0.05 | (0.62) | (0.57) | (0.20) | (1.24) | (1.44) |
| Year Ended 2/28/2015 | $13.10 | 0.23 | 1.53 | 1.76 | (0.10) | (1.90) | (2.00) |
| Advisor Class |
| Year Ended 2/28/2019 | $14.66 | 0.20 | 0.33 | 0.53 | (0.19) | (1.22) | (1.41) |
| Year Ended 2/28/2018(f) | $13.61 | 0.11 | 1.63 | 1.74 | (0.10) | (0.59) | (0.69) |
| Class C |
| Year Ended 2/28/2019 | $13.64 | 0.05 | 0.31 | 0.36 | (0.04) | (1.22) | (1.26) |
| Year Ended 2/28/2018 | $12.18 | (0.02) | 2.19 | 2.17 | — | (0.71) | (0.71) |
| Year Ended 2/28/2017 | $10.07 | 0.03 | 2.24 | 2.27 | (0.04) | (0.12) | (0.16) |
| Year Ended 2/29/2016 | $12.04 | (0.04) | (0.57) | (0.61) | (0.12) | (1.24) | (1.36) |
| Year Ended 2/28/2015 | $12.39 | 0.14 | 1.42 | 1.56 | (0.01) | (1.90) | (1.91) |
| Institutional Class |
| Year Ended 2/28/2019 | $14.71 | 0.19 | 0.34 | 0.53 | (0.18) | (1.22) | (1.40) |
| Year Ended 2/28/2018 | $13.06 | 0.12 | 2.35 | 2.47 | (0.11) | (0.71) | (0.82) |
| Year Ended 2/28/2017 | $10.78 | 0.15 | 2.40 | 2.55 | (0.15) | (0.12) | (0.27) |
| Year Ended 2/29/2016 | $12.78 | 0.07 | (0.60) | (0.53) | (0.23) | (1.24) | (1.47) |
| Year Ended 2/28/2015 | $13.03 | 0.25 | 1.53 | 1.78 | (0.13) | (1.90) | (2.03) |
| Institutional 2 Class |
| Year Ended 2/28/2019 | $15.11 | 0.22 | 0.34 | 0.56 | (0.19) | (1.22) | (1.41) |
| Year Ended 2/28/2018 | $13.41 | 0.13 | 2.40 | 2.53 | (0.12) | (0.71) | (0.83) |
| Year Ended 2/28/2017 | $11.05 | 0.15 | 2.49 | 2.64 | (0.16) | (0.12) | (0.28) |
| Year Ended 2/29/2016 | $13.07 | 0.06 | (0.60) | (0.54) | (0.24) | (1.24) | (1.48) |
| Year Ended 2/28/2015 | $13.28 | 0.39 | 1.44 | 1.83 | (0.14) | (1.90) | (2.04) |
The accompanying Notes to Financial Statements are an integral part of this statement.
| 16 | Columbia Select Large Cap Equity Fund | Annual Report 2019 |
Financial Highlights (continued)
| | Proceeds from
regulatory
settlements | Net
asset
value,
end of
period | Total
return | Total gross
expense
ratio to
average
net assets(a) | Total net
expense
ratio to
average
net assets(a),(b) | Net investment
income (loss)
ratio to
average
net assets | Portfolio
turnover | Net
assets,
end of
period
(000’s) |
| Class A |
| Year Ended 2/28/2019 | — | $13.95 | 3.61% | 1.19% | 0.80%(c) | 1.10% | 62% | $151,703 |
| Year Ended 2/28/2018 | — | $14.82 | 18.87% | 1.19% | 1.13%(c) | 0.61% | 45% | $149,489 |
| Year Ended 2/28/2017 | — | $13.16 | 23.66% | 1.22% | 1.17%(c) | 0.98% | 67% | $136,584 |
| Year Ended 2/29/2016 | 0.00(d) | $10.85 | (5.38%)(e) | 1.25% | 1.18%(c) | 0.41% | 102% | $119,928 |
| Year Ended 2/28/2015 | — | $12.86 | 14.26% | 1.25% | 1.18%(c) | 1.79% | 150% | $139,311 |
| Advisor Class |
| Year Ended 2/28/2019 | — | $13.78 | 3.88% | 0.94% | 0.55%(c) | 1.45% | 62% | $3,143 |
| Year Ended 2/28/2018(f) | — | $14.66 | 12.96% | 0.97%(g) | 0.69%(c),(g) | 1.17%(g) | 45% | $240 |
| Class C |
| Year Ended 2/28/2019 | — | $12.74 | 2.85% | 1.94% | 1.55%(c) | 0.34% | 62% | $7,783 |
| Year Ended 2/28/2018 | — | $13.64 | 18.03% | 1.94% | 1.87%(c) | (0.15%) | 45% | $8,199 |
| Year Ended 2/28/2017 | — | $12.18 | 22.66% | 1.97% | 1.92%(c) | 0.23% | 67% | $5,692 |
| Year Ended 2/29/2016 | 0.00(d) | $10.07 | (6.05%)(e) | 2.00% | 1.93%(c) | (0.35%) | 102% | $4,739 |
| Year Ended 2/28/2015 | — | $12.04 | 13.38% | 2.00% | 1.93%(c) | 1.16% | 150% | $5,772 |
| Institutional Class |
| Year Ended 2/28/2019 | — | $13.84 | 3.90% | 0.94% | 0.55%(c) | 1.34% | 62% | $158,057 |
| Year Ended 2/28/2018 | — | $14.71 | 19.21% | 0.94% | 0.88%(c) | 0.86% | 45% | $170,394 |
| Year Ended 2/28/2017 | — | $13.06 | 23.83% | 0.97% | 0.92%(c) | 1.23% | 67% | $159,193 |
| Year Ended 2/29/2016 | 0.00(d) | $10.78 | (5.09%)(e) | 1.00% | 0.93%(c) | 0.55% | 102% | $149,765 |
| Year Ended 2/28/2015 | — | $12.78 | 14.54% | 1.00% | 0.93%(c) | 1.92% | 150% | $209,909 |
| Institutional 2 Class |
| Year Ended 2/28/2019 | — | $14.26 | 4.01% | 0.84% | 0.46% | 1.53% | 62% | $19,466 |
| Year Ended 2/28/2018 | — | $15.11 | 19.15% | 0.86% | 0.80% | 0.90% | 45% | $10,777 |
| Year Ended 2/28/2017 | — | $13.41 | 24.09% | 0.86% | 0.83% | 1.21% | 67% | $269 |
| Year Ended 2/29/2016 | 0.00(d) | $11.05 | (5.05%)(e) | 0.86% | 0.84% | 0.47% | 102% | $153 |
| Year Ended 2/28/2015 | — | $13.07 | 14.67% | 0.86% | 0.85% | 2.98% | 150% | $143 |
The accompanying Notes to Financial Statements are an integral part of this statement.
Columbia Select Large Cap Equity Fund | Annual Report 2019
| 17 |
Financial Highlights (continued)
| | Net asset value,
beginning of
period | Net
investment
income
(loss) | Net
realized
and
unrealized
gain (loss) | Total from
investment
operations | Distributions
from net
investment
income | Distributions
from net
realized
gains | Total
distributions to
shareholders |
| Institutional 3 Class |
| Year Ended 2/28/2019 | $14.51 | 0.21 | 0.33 | 0.54 | (0.20) | (1.22) | (1.42) |
| Year Ended 2/28/2018(h) | $13.08 | 0.14 | 2.13 | 2.27 | (0.13) | (0.71) | (0.84) |
| Notes to Financial Highlights |
| (a) | In addition to the fees and expenses that the Fund bears directly, the Fund indirectly bears a pro rata share of the fees and expenses of any other funds in which it invests. Such indirect expenses are not included in the Fund’s reported expense ratios. |
| (b) | Total net expenses include the impact of certain fee waivers/expense reimbursements made by the Investment Manager and certain of its affiliates, if applicable. |
| (c) | The benefits derived from expense reductions had an impact of less than 0.01%. |
| (d) | Rounds to zero. |
| (e) | The Fund received proceeds from regulatory settlements. Had the Fund not received these proceeds, the total return would have been lower by 0.07%. |
| (f) | Advisor Class shares commenced operations on July 5, 2017. Per share data and total return reflect activity from that date. |
| (g) | Annualized. |
| (h) | Institutional 3 Class shares commenced operations on March 1, 2017. Per share data and total return reflect activity from that date. |
The accompanying Notes to Financial Statements are an integral part of this statement.
| 18 | Columbia Select Large Cap Equity Fund | Annual Report 2019 |
Financial Highlights (continued)
| | Proceeds from
regulatory
settlements | Net
asset
value,
end of
period | Total
return | Total gross
expense
ratio to
average
net assets(a) | Total net
expense
ratio to
average
net assets(a),(b) | Net investment
income (loss)
ratio to
average
net assets | Portfolio
turnover | Net
assets,
end of
period
(000’s) |
| Institutional 3 Class |
| Year Ended 2/28/2019 | — | $13.63 | 4.02% | 0.80% | 0.43% | 1.48% | 62% | $340,760 |
| Year Ended 2/28/2018(h) | — | $14.51 | 17.63% | 0.81% | 0.76% | 0.98% | 45% | $330,311 |
The accompanying Notes to Financial Statements are an integral part of this statement.
Columbia Select Large Cap Equity Fund | Annual Report 2019
| 19 |
Notes to Financial Statements
February 28, 2019
Note 1. Organization
Columbia Select Large Cap Equity Fund (the Fund), a series of Columbia Funds Series Trust (the Trust), is a diversified fund. The Trust is registered under the Investment Company Act of 1940, as amended (the 1940 Act), as an open-end management investment company organized as a Delaware statutory trust.
Fund shares
The Trust may issue an unlimited number of shares (without par value). Although all share classes generally have identical voting, dividend and liquidation rights, each share class votes separately when required by the Trust’s organizational documents or by law. Different share classes pay different distribution amounts to the extent the expenses of such share classes differ, and distributions in liquidation will be proportional to the net asset value of each share class. Each share class has its own expense and sales charge structure. The Fund offers each of the share classes identified below.
Class A shares are subject to a maximum front-end sales charge of 5.75% based on the initial investment amount. Class A shares purchased without an initial sales charge in accounts aggregating $1 million to $50 million at the time of purchase are subject to a contingent deferred sales charge (CDSC) if the shares are sold within 18 months after purchase, charged as follows: 1.00% CDSC if redeemed within 12 months after purchase, and 0.50% CDSC if redeemed more than 12, but less than 18, months after purchase.
Advisor Class shares are not subject to sales charges and are generally available only to omnibus retirement plans and certain investors as described in the Fund’s prospectus.
Class C shares are subject to a 1.00% CDSC on shares redeemed within 12 months after purchase. Effective July 1, 2018, Class C shares automatically convert to Class A shares of the same Fund in the month of or the month following the 10-year anniversary of the Class C shares purchase date.
Institutional Class shares are not subject to sales charges and are generally available only to eligible investors, which are subject to different investment minimums as described in the Fund’s prospectus.
Institutional 2 Class shares are not subject to sales charges and are generally available only to investors purchasing through authorized investment professionals and omnibus retirement plans as described in the Fund’s prospectus.
Institutional 3 Class shares are not subject to sales charges and are available to institutional and certain other investors as described in the Fund’s prospectus.
Class T shares were subject to a maximum front-end sales charge of 2.50% per transaction and were required to be purchased through financial intermediaries that, by written agreement with Columbia Management Investment Distributors, Inc., were specifically authorized to sell Class T shares. Effective at the close of business on December 14, 2018, Class T shares merged, in a tax-free transaction, into Class A shares of the Fund and are no longer offered for sale.
Note 2. Summary of significant accounting policies
Basis of preparation
The Fund is an investment company that applies the accounting and reporting guidance in the Financial Accounting Standards Board (FASB) Accounting Standards Codification Topic 946,Financial Services - Investment Companies (ASC 946). The financial statements are prepared in accordance with U.S. generally accepted accounting principles (GAAP), which requires management to make certain estimates and assumptions that affect the reported amounts of assets and liabilities, the disclosure of contingent assets and liabilities at the date of the financial statements and the reported amounts of income and expenses during the reporting period. Actual results could differ from those estimates.
The following is a summary of significant accounting policies followed by the Fund in the preparation of its financial statements.
| 20 | Columbia Select Large Cap Equity Fund | Annual Report 2019 |
Notes to Financial Statements (continued)
February 28, 2019
Security valuation
All equity securities are valued at the close of business of the New York Stock Exchange. Equity securities are valued at the last quoted sales price on the principal exchange or market on which they trade, except for securities traded on the NASDAQ Stock Market, which are valued at the NASDAQ official close price. Unlisted securities or listed securities for which there were no sales during the day are valued at the mean of the latest quoted bid and ask prices on such exchanges or markets.
Foreign equity securities are valued based on the closing price on the foreign exchange in which such securities are primarily traded. If any foreign equity security closing prices are not readily available, the securities are valued at the mean of the latest quoted bid and ask prices on such exchanges or markets. Foreign currency exchange rates are generally determined at 4:00 p.m. Eastern (U.S.) time. Many securities markets and exchanges outside the U.S. close prior to the close of the New York Stock Exchange; therefore, the closing prices for securities in such markets or on such exchanges may not fully reflect events that occur after such close but before the close of the New York Stock Exchange. In those situations, foreign securities will be fair valued pursuant to a policy adopted by the Board of Trustees, including, if available, utilizing a third party pricing service to determine these fair values. The third party pricing service takes into account multiple factors, including, but not limited to, movements in the U.S. securities markets, certain depositary receipts, futures contracts and foreign exchange rates that have occurred subsequent to the close of the foreign exchange or market, to determine a good faith estimate that reasonably reflects the current market conditions as of the close of the New York Stock Exchange. The fair value of a security is likely to be different from the quoted or published price, if available.
Investments in open-end investment companies, including money market funds, are valued at their latest net asset value.
Futures and options on futures contracts are valued based upon the settlement price at the close of regular trading on their principal exchanges or, in the absence of transactions, at the mean of the latest quoted bid and ask prices.
Investments for which market quotations are not readily available, or that have quotations which management believes are not reflective of market value or reliable, are valued at fair value as determined in good faith under procedures approved by and under the general supervision of the Board of Trustees. If a security or class of securities (such as foreign securities) is valued at fair value, such value is likely to be different from the quoted or published price for the security.
The determination of fair value often requires significant judgment. To determine fair value, management may use assumptions including but not limited to future cash flows and estimated risk premiums. Multiple inputs from various sources may be used to determine fair value.
GAAP requires disclosure regarding the inputs and valuation techniques used to measure fair value and any changes in valuation inputs or techniques. In addition, investments shall be disclosed by major category. This information is disclosed following the Fund’s Portfolio of Investments.
Foreign currency transactions and translations
The values of all assets and liabilities denominated in foreign currencies are generally translated into U.S. dollars at exchange rates determined at the close of regular trading on the New York Stock Exchange. Net realized and unrealized gains (losses) on foreign currency transactions and translations include gains (losses) arising from the fluctuation in exchange rates between trade and settlement dates on securities transactions, gains (losses) arising from the disposition of foreign currency and currency gains (losses) between the accrual and payment dates on dividends, interest income and foreign withholding taxes.
For financial statement purposes, the Fund does not distinguish that portion of gains (losses) on investments which is due to changes in foreign exchange rates from that which is due to changes in market prices of the investments. Such fluctuations are included with the net realized and unrealized gains (losses) on investments in the Statement of Operations.
Derivative instruments
The Fund invests in certain derivative instruments, as detailed below, to meet its investment objectives. Derivatives are instruments whose values depend on, or are derived from, in whole or in part, the value of one or more securities, currencies, commodities, indices, or other assets or instruments. Derivatives may be used to increase investment flexibility (including to maintain cash reserves while maintaining desired exposure to certain assets), for risk management (hedging)
Columbia Select Large Cap Equity Fund | Annual Report 2019
| 21 |
Notes to Financial Statements (continued)
February 28, 2019
purposes, to facilitate trading, to reduce transaction costs and to pursue higher investment returns. The Fund may also use derivative instruments to mitigate certain investment risks, such as foreign currency exchange rate risk, interest rate risk and credit risk. Derivatives may involve various risks, including the potential inability of the counterparty to fulfill its obligations under the terms of the contract, the potential for an illiquid secondary market (making it difficult for the Fund to sell or terminate, including at favorable prices) and the potential for market movements which may expose the Fund to gains or losses in excess of the amount shown in the Statement of Assets and Liabilities. The notional amounts of derivative instruments, if applicable, are not recorded in the financial statements.
A derivative instrument may suffer a marked-to-market loss if the value of the contract decreases due to an unfavorable change in the market rates or values of the underlying instrument. Losses can also occur if the counterparty does not perform its obligations under the contract. The Fund’s risk of loss from counterparty credit risk on over-the-counter derivatives is generally limited to the aggregate unrealized gain netted against any collateral held by the Fund and the amount of any variation margin held by the counterparty, plus any replacement costs or related amounts. With exchange-traded or centrally cleared derivatives, there is reduced counterparty credit risk to the Fund since the clearinghouse or central counterparty (CCP) provides some protection in the case of clearing member default. The clearinghouse or CCP stands between the buyer and the seller of the contract; therefore, additional counterparty credit risk is failure of the clearinghouse or CCP. However, credit risk still exists in exchange-traded or centrally cleared derivatives with respect to initial and variation margin that is held in a broker’s customer account. While brokers are required to segregate customer margin from their own assets, in the event that a broker becomes insolvent or goes into bankruptcy and at that time there is a shortfall in the aggregate amount of margin held by the broker for all its clients, U.S. bankruptcy laws will typically allocate that shortfall on a pro-rata basis across all the broker’s customers (including the Fund), potentially resulting in losses to the Fund.
In order to better define its contractual rights and to secure rights that will help the Fund mitigate its counterparty risk, the Fund may enter into an International Swaps and Derivatives Association, Inc. Master Agreement (ISDA Master Agreement) or similar agreement with its derivatives contract counterparties. An ISDA Master Agreement is an agreement between the Fund and a counterparty that governs over-the-counter derivatives and typically contains, among other things, collateral posting terms and netting provisions in the event of a default and/or termination event. Under an ISDA Master Agreement, the Fund may, under certain circumstances, offset with the counterparty certain derivative instrument’s payables and/or receivables with collateral held and/or posted and create one single net payment. The provisions of the ISDA Master Agreement typically permit a single net payment in the event of default (close-out netting), including the bankruptcy or insolvency of the counterparty. Note, however, that bankruptcy or insolvency laws of a particular jurisdiction may impose restrictions on or prohibitions against the right of offset or netting in bankruptcy, insolvency or other events.
Collateral (margin) requirements differ by type of derivative. Margin requirements are established by the clearinghouse or CCP for exchange-traded and centrally cleared derivatives. Brokers can ask for margin in excess of the minimum in certain circumstances. Collateral terms are contract specific for over-the-counter derivatives. For over-the-counter derivatives traded under an ISDA Master Agreement, the collateral requirements are typically calculated by netting the marked-to-market amount for each transaction under such agreement and comparing that amount to the value of any variation margin currently pledged by the Fund and/or the counterparty. Generally, the amount of collateral due from or to a party has to exceed a minimum transfer amount threshold (e.g., $250,000) before a transfer has to be made. To the extent amounts due to the Fund from its counterparties are not fully collateralized, contractually or otherwise, the Fund bears the risk of loss from counterparty nonperformance. The Fund may also pay interest expense on cash collateral received from the broker. Any interest expense paid by the Fund is shown on the Statement of Operations. The Fund attempts to mitigate counterparty risk by only entering into agreements with counterparties that it believes have the financial resources to honor their obligations and by monitoring the financial stability of those counterparties.
Certain ISDA Master Agreements allow counterparties of over-the-counter derivatives transactions to terminate derivatives contracts prior to maturity in the event the Fund’s net asset value declines by a stated percentage over a specified time period or if the Fund fails to meet certain terms of the ISDA Master Agreement, which would cause the Fund to accelerate payment of any net liability owed to the counterparty. The Fund also has termination rights if the counterparty fails to meet certain terms of the ISDA Master Agreement. In determining whether to exercise such termination rights, the Fund would consider, in addition to counterparty credit risk, whether termination would result in a net liability owed from the counterparty.
| 22 | Columbia Select Large Cap Equity Fund | Annual Report 2019 |
Notes to Financial Statements (continued)
February 28, 2019
For financial reporting purposes, the Fund does not offset derivative assets and derivative liabilities that are subject to netting arrangements in the Statement of Assets and Liabilities.
Futures contracts
Futures contracts are exchange-traded and represent commitments for the future purchase or sale of an asset at a specified price on a specified date. The Fund bought and sold futures contracts and to maintain appropriate equity market exposure while keeping sufficient cash to accommodate daily redemptions. These instruments may be used for other purposes in future periods. Upon entering into futures contracts, the Fund bears risks that it may not achieve the anticipated benefits of the futures contracts and may realize a loss. Additional risks include counterparty credit risk, the possibility of an illiquid market, and that a change in the value of the contract or option may not correlate with changes in the value of the underlying asset.
Upon entering into a futures contract, the Fund deposits cash or securities with the broker, known as a futures commission merchant (FCM), in an amount sufficient to meet the initial margin requirement. The initial margin deposit must be maintained at an established level over the life of the contract. Cash deposited as initial margin is recorded in the Statement of Assets and Liabilities as margin deposits. Securities deposited as initial margin are designated in the Portfolio of Investments. Subsequent payments (variation margin) are made or received by the Fund each day. The variation margin payments are equal to the daily change in the contract value and are recorded as variation margin receivable or payable and are offset in unrealized gains or losses. The Fund recognizes a realized gain or loss when the contract is closed or expires. Futures contracts involve, to varying degrees, risk of loss in excess of the variation margin disclosed in the Statement of Assets and Liabilities.
Options contracts
Options are contracts which entitle the holder to purchase or sell securities or other identified assets at a specified price, or in the case of index option contracts, to receive or pay the difference between the index value and the strike price of the index option contract. Option contracts can be either exchange-traded or over-the-counter. The Fund purchased and wrote option contracts to decrease the Fund’s exposure to equity market risk and to increase return on investments. These instruments may be used for other purposes in future periods. Completion of transactions for option contracts traded in the over-the-counter market depends upon the performance of the other party. Cash collateral may be collected or posted by the Fund to secure certain over-the-counter option contract trades. Cash collateral held or posted by the Fund for such option contract trades must be returned to the broker or the Fund upon closure, exercise or expiration of the contract.
Options contracts purchased are recorded as investments. When the Fund writes an options contract, the premium received is recorded as an asset and an amount equivalent to the premium is recorded as a liability in the Statement of Assets and Liabilities and is subsequently adjusted to reflect the current fair value of the option written. Changes in the fair value of the written option are recorded as unrealized appreciation or depreciation until the contract is exercised or has expired. The Fund will realize a gain or loss when the option contract is closed or expires. When option contracts are exercised, the proceeds on sales for a written call or purchased put option contract, or the purchase cost for a written put or purchased call option contract, is adjusted by the amount of premium received or paid.
For over-the-counter options purchased, the Fund bears the risk of loss of the amount of the premiums paid plus the positive change in market values net of any collateral held by the Fund should the counterparty fail to perform under the contracts. Option contracts written by the Fund do not typically give rise to significant counterparty credit risk, as options written generally obligate the Fund and not the counterparty to perform. The risk in writing a call option contract is that the Fund gives up the opportunity for profit if the market price of the security increases above the strike price and the option contract is exercised. The risk in writing a put option contract is that the Fund may incur a loss if the market price of the security decreases below the strike price and the option contract is exercised. Exercise of a written option could result in the Fund purchasing or selling a security or foreign currency when it otherwise would not, or at a price different from the current market value. In purchasing and writing options, the Fund bears the risk of an unfavorable change in the value of the underlying instrument or the risk that the Fund may not be able to enter into a closing transaction due to an illiquid market.
Columbia Select Large Cap Equity Fund | Annual Report 2019
| 23 |
Notes to Financial Statements (continued)
February 28, 2019
Effects of derivative transactions in the financial statements
The following tables are intended to provide additional information about the effect of derivatives on the financial statements of the Fund, including: the fair value of derivatives by risk category and the location of those fair values in the Statement of Assets and Liabilities; and the impact of derivative transactions over the period in the Statement of Operations, including realized and unrealized gains (losses). The derivative instrument schedules following the Portfolio of Investments present additional information regarding derivative instruments outstanding at the end of the period, if any.
The following table is a summary of the fair value of derivative instruments (not considered to be hedging instruments for accounting disclosure purposes) at February 28, 2019:
| | Asset derivatives | |
Risk exposure
category | Statement
of assets and liabilities
location | Fair value ($) |
| Equity risk | Component of total distributable earnings (loss) — unrealized appreciation on futures contracts | 1,088,472* |
| * | Includes cumulative appreciation (depreciation) as reported in the tables following the Portfolio of Investments. Only the current day’s variation margin is reported in receivables or payables in the Statement of Assets and Liabilities. |
The following table indicates the effect of derivative instruments (not considered to be hedging instruments for accounting disclosure purposes) in the Statement of Operations for the year ended February 28, 2019:
| Amount of realized gain (loss) on derivatives recognized in income |
| Risk exposure category | | | Futures
contracts
($) | Options
contracts
written
($) | Options
contracts
purchased
($) | Total
($) |
| Equity risk | | | (1,508,484) | (701,480) | (28,312) | (2,238,276) |
| Total | | | (1,508,484) | (701,480) | (28,312) | (2,238,276) |
| |
| Change in unrealized appreciation (depreciation) on derivatives recognized in income |
| Risk exposure category | | | | | | Futures
contracts
($) |
| Equity risk | | | | | | 1,088,472 |
The following table is a summary of the average outstanding volume by derivative instrument for the year ended February 28, 2019:
| Derivative instrument | Average notional
amounts ($)* |
| Futures contracts — long | 6,753,386 |
| Derivative instrument | Average
value ($)** |
| Options contracts — purchased | 34,486 |
| Options contracts — written | (103,666) |
| * | Based on the ending quarterly outstanding amounts for the year ended February 28, 2019. |
| ** | Based on the ending daily outstanding amounts for the year ended February 28, 2019. |
Security transactions
Security transactions are accounted for on the trade date. Cost is determined and gains (losses) are based upon the specific identification method for both financial statement and federal income tax purposes.
| 24 | Columbia Select Large Cap Equity Fund | Annual Report 2019 |
Notes to Financial Statements (continued)
February 28, 2019
Income recognition
Corporate actions and dividend income are generally recorded net of any non-reclaimable tax withholdings, on the ex-dividend date or upon receipt of ex-dividend notification in the case of certain foreign securities.
The Fund may receive distributions from holdings in equity securities, business development companies (BDCs), exchange-traded funds (ETFs), limited partnerships (LPs), other regulated investment companies (RICs), and real estate investment trusts (REITs), which report information on the tax character of their distributions annually. These distributions are allocated to dividend income, capital gain and return of capital based on actual information reported. Return of capital is recorded as a reduction of the cost basis of securities held. If the Fund no longer owns the applicable securities, return of capital is recorded as a realized gain. With respect to REITs, to the extent actual information has not yet been reported, estimates for return of capital are made by the Fund’s management. Management’s estimates are subsequently adjusted when the actual character of the distributions is disclosed by the REITs, which could result in a proportionate change in return of capital to shareholders.
Awards from class action litigation are recorded as a reduction of cost basis if the Fund still owns the applicable securities on the payment date. If the Fund no longer owns the applicable securities, the proceeds are recorded as realized gains.
Expenses
General expenses of the Trust are allocated to the Fund and other funds of the Trust based upon relative net assets or other expense allocation methodologies determined by the nature of the expense. Expenses directly attributable to the Fund are charged to the Fund. Expenses directly attributable to a specific class of shares are charged to that share class.
Determination of class net asset value
All income, expenses (other than class-specific expenses, which are charged to that share class, as shown in the Statement of Operations) and realized and unrealized gains (losses) are allocated to each class of the Fund on a daily basis, based on the relative net assets of each class, for purposes of determining the net asset value of each class.
Federal income tax status
The Fund intends to qualify each year as a regulated investment company under Subchapter M of the Internal Revenue Code, as amended, and will distribute substantially all of its investment company taxable income and net capital gain, if any, for its tax year, and as such will not be subject to federal income taxes. In addition, the Fund intends to distribute in each calendar year substantially all of its ordinary income, capital gain net income and certain other amounts, if any, such that the Fund should not be subject to federal excise tax. Therefore, no federal income or excise tax provision is recorded.
Foreign taxes
The Fund may be subject to foreign taxes on income, gains on investments or currency repatriation, a portion of which may be recoverable. The Fund will accrue such taxes and recoveries, as applicable, based upon its current interpretation of tax rules and regulations that exist in the markets in which it invests.
Realized gains in certain countries may be subject to foreign taxes at the Fund level, based on statutory rates. The Fund accrues for such foreign taxes on realized and unrealized gains at the appropriate rate for each jurisdiction, as applicable. The amount, if any, is disclosed as a liability on the Statement of Assets and Liabilities.
Distributions to shareholders
Distributions from net investment income, if any, are declared and paid semi-annually. Net realized capital gains, if any, are distributed at least annually. Income distributions and capital gain distributions are determined in accordance with federal income tax regulations, which may differ from GAAP.
Columbia Select Large Cap Equity Fund | Annual Report 2019
| 25 |
Notes to Financial Statements (continued)
February 28, 2019
Guarantees and indemnifications
Under the Trust’s organizational documents and, in some cases, by contract, its officers and trustees are indemnified against certain liabilities arising out of the performance of their duties to the Trust or its funds. In addition, certain of the Fund’s contracts with its service providers contain general indemnification clauses. The Fund’s maximum exposure under these arrangements is unknown since the amount of any future claims that may be made against the Fund cannot be determined, and the Fund has no historical basis for predicting the likelihood of any such claims.
Recent accounting pronouncements
Accounting Standards Update 2017-08 Premium Amortization on Purchased Callable Debt Securities
In March 2017, the Financial Accounting Standards Board issued Accounting Standards Update (ASU) No. 2017-08 Premium Amortization on Purchased Callable Debt Securities. ASU No. 2017-08 updates the accounting standards to shorten the amortization period for certain purchased callable debt securities, held at a premium, to be amortized to the earliest call date. The update applies to securities with explicit, noncontingent call features that are callable at fixed prices and on preset dates. The standard is effective for annual periods beginning after December 15, 2018 and interim periods within those fiscal years. Management does not expect the implementation of this guidance to have a material impact on the financial statement amounts and footnote disclosures.
Accounting Standards Update 2018-13 Disclosure Framework - Changes to the Disclosure Requirements for Fair Value Measurement
In August 2018, the Financial Accounting Standards Board issued Accounting Standards Update (ASU) No. 2018-13 Disclosure Framework - Changes to the Disclosure Requirements for Fair Value Measurement. ASU No. 2018-13, in addition to other modifications and additions, removes the requirement to disclose the amount and reasons for transfers between Level 1 and Level 2 of the fair value hierarchy and the policy for the timing of transfers between levels. The standard is effective for annual periods beginning after December 15, 2019 and interim periods within those fiscal years. At this time, management is evaluating the implication of this guidance and the impact it will have on the financial statement disclosures, if any.
Disclosure Update and Simplification
In September 2018, the Securities and Exchange Commission (SEC) released Final Rule 33-10532, Disclosure Update and Simplification, which amends certain financial statement disclosure requirements that the SEC determined to be redundant, outdated, or superseded in light of other SEC disclosure requirements, GAAP, or changes in the information environment. As a result of the amendments, management implemented disclosure changes which included removing the components of distributable earnings presented on the Statement of Assets and Liabilities and combining income and gain distributions paid to shareholders as presented on the Statement of Changes in Net Assets. Any values presented to meet prior year requirements were left unchanged. The amendments had no effect on the Fund’s net assets or results of operation.
Note 3. Fees and other transactions with affiliates
Management services fees
The Fund has entered into a Management Agreement with Columbia Management Investment Advisers, LLC (the Investment Manager), a wholly-owned subsidiary of Ameriprise Financial, Inc. (Ameriprise Financial). Under the Management Agreement, the Investment Manager provides the Fund with investment research and advice, as well as administrative and accounting services. The management services fee is an annual fee that is equal to a percentage of the Fund’s daily net assets that declines from 0.77% to 0.57% as the Fund’s net assets increase. The effective management services fee rate for the year ended February 28, 2019 was 0.76% of the Fund’s average daily net assets.
Compensation of board members
Members of the Board of Trustees who are not officers or employees of the Investment Manager or Ameriprise Financial are compensated for their services to the Fund as disclosed in the Statement of Operations. Under a Deferred Compensation Plan (the Deferred Plan), these members of the Board of Trustees may elect to defer payment of up to 100% of their
| 26 | Columbia Select Large Cap Equity Fund | Annual Report 2019 |
Notes to Financial Statements (continued)
February 28, 2019
compensation. Deferred amounts are treated as though equivalent dollar amounts had been invested in shares of certain funds managed by the Investment Manager. The Fund’s liability for these amounts is adjusted for market value changes and remains in the Fund until distributed in accordance with the Deferred Plan. All amounts payable under the Deferred Plan constitute a general unsecured obligation of the Fund.
Compensation of Chief Compliance Officer
The Board of Trustees has appointed a Chief Compliance Officer to the Fund in accordance with federal securities regulations. As disclosed in the Statement of Operations, a portion of the Chief Compliance Officer’s total compensation is allocated to the Fund, along with other allocations to affiliated registered investment companies managed by the Investment Manager and its affiliates, based on relative net assets.
Transactions with affiliates
For the year ended February 28, 2019, the Fund engaged in purchase and/or sale transactions with affiliates and/or accounts that have a common investment manager (or affiliated investment managers), common directors/trustees, and/or common officers. Those purchase and sale transactions complied with provisions of Rule 17a-7 under the 1940 Act and were $15,433,054 and $0, respectively.
Transfer agency fees
Under a Transfer and Dividend Disbursing Agent Agreement, Columbia Management Investment Services Corp. (the Transfer Agent), an affiliate of the Investment Manager and a wholly-owned subsidiary of Ameriprise Financial, is responsible for providing transfer agency services to the Fund. The Transfer Agent has contracted with DST Asset Manager Solutions, Inc. (DST) to serve as sub-transfer agent. The Transfer Agent pays the fees of DST for services as sub-transfer agent and DST is not entitled to reimbursement for such fees from the Fund (with the exception of out-of-pocket fees).
The Fund pays the Transfer Agent a monthly transfer agency fee based on the number or the average value of accounts, depending on the type of account. In addition, the Fund pays the Transfer Agent a fee for shareholder services based on the number of accounts or on a percentage of the average aggregate value of the Fund’s shares maintained in omnibus accounts up to the lesser of the amount charged by the financial intermediary or a cap established by the Board of Trustees from time to time.
The Transfer Agent also receives compensation from the Fund for various shareholder services and reimbursements for certain out-of-pocket fees. Total transfer agency fees for Institutional 2 Class and Institutional 3 Class shares are subject to an annual limitation of not more than 0.07% and 0.02%, respectively, of the average daily net assets attributable to each share class.
For the year ended February 28, 2019, the Fund’s effective transfer agency fee rates as a percentage of average daily net assets of each class were as follows:
| | Effective rate (%) |
| Class A | 0.14 |
| Advisor Class | 0.14 |
| Class C | 0.14 |
| Institutional Class | 0.14 |
| Institutional 2 Class | 0.04 |
| Institutional 3 Class | 0.01 |
| Class T | 0.11(a) |
An annual minimum account balance fee of $20 may apply to certain accounts with a value below the applicable share class’s initial minimum investment requirements to reduce the impact of small accounts on transfer agency fees. These minimum account balance fees are remitted to the Fund and recorded as part of expense reductions in the Statement of Operations. For the year ended February 28, 2019, these minimum account balance fees reduced total expenses of the Fund by $1,660.
Columbia Select Large Cap Equity Fund | Annual Report 2019
| 27 |
Notes to Financial Statements (continued)
February 28, 2019
Distribution and service fees
The Fund has entered into an agreement with Columbia Management Investment Distributors, Inc. (the Distributor), an affiliate of the Investment Manager and a wholly-owned subsidiary of Ameriprise Financial, for distribution and shareholder services. The Board of Trustees has approved, and the Fund has adopted, distribution and shareholder service plans (the Plans) applicable to certain share classes, which set the distribution and service fees for the Fund. These fees are calculated daily and are intended to compensate the Distributor and/or eligible selling and/or servicing agents for selling shares of the Fund and providing services to investors.
Under the Plans, the Fund pays a monthly combined distribution and service fee to the Distributor at the maximum annual rate of 0.25% of the average daily net assets attributable to Class A shares of the Fund. Also under the Plans, the Fund pays a monthly service fee to the Distributor at the maximum annual rate of 0.25% of the average daily net assets attributable to Class C and Class T shares of the Fund and a monthly distribution fee to the Distributor at the maximum annual rates of 0.75% and 0.25% of the average daily net assets attributable to Class C and Class T shares of the Fund, respectively. As a result of all Class T shares of the Fund being redeemed or converted to Class A shares, December 14, 2018 was the last day the Fund paid a distribution and shareholder services fee for Class T shares.
Although the Fund may pay a distribution fee up to 0.25% of the Fund’s average daily net assets attributable to Class T shares and a service fee of up to 0.25% of the Fund’s average daily net assets attributable to Class T shares, the aggregate fee shall not exceed 0.25% of the Fund’s average daily net assets attributable to Class T shares.
Sales charges (unaudited)
Sales charges, including front-end charges and CDSCs, received by the Distributor for distributing Fund shares for the year ended February 28, 2019, if any, are listed below:
| | Amount ($) |
| Class A | 65,516 |
| Class C | 1,941 |
Expenses waived/reimbursed by the Investment Manager and its affiliates
The Investment Manager and certain of its affiliates have contractually agreed to waive fees and/or reimburse expenses (excluding certain fees and expenses described below) for the period(s) disclosed below, unless sooner terminated at the sole discretion of the Board of Trustees, so that the Fund’s net operating expenses, after giving effect to fees waived/expenses reimbursed and any balance credits and/or overdraft charges from the Fund’s custodian, do not exceed the following annual rate(s) as a percentage of the class’ average daily net assets:
| | Fee rate(s) contractual
through
June 30, 2019 |
| Class A | 0.80% |
| Advisor Class | 0.55 |
| Class C | 1.55 |
| Institutional Class | 0.55 |
| Institutional 2 Class | 0.49 |
| Institutional 3 Class | 0.43 |
Under the agreement governing these fee waivers and/or expense reimbursement arrangements, the following fees and expenses are excluded from the waiver/reimbursement commitment, and therefore will be paid by the Fund, if applicable: taxes (including foreign transaction taxes), expenses associated with investments in affiliated and non-affiliated pooled investment vehicles (including mutual funds and exchange-traded funds), transaction costs and brokerage commissions, costs related to any securities lending program, dividend expenses associated with securities sold short, inverse floater program fees and expenses, transaction charges and interest on borrowed money, interest, infrequent and/or unusual expenses and any other expenses the exclusion of which is specifically approved by the Board of Trustees. This agreement may be modified or amended only with approval from the Investment Manager, certain of its affiliates and the
| 28 | Columbia Select Large Cap Equity Fund | Annual Report 2019 |
Notes to Financial Statements (continued)
February 28, 2019
Fund. In addition to the contractual agreement, the Investment Manager and certain of its affiliates have voluntarily agreed to waive fees and/or reimburse Fund expenses (excluding certain fees and expenses described above) so that Fund level expenses (expenses directly attributable to the Fund and not to a specific share class) are waived proportionately across all share classes, but the Fund’s net operating expenses shall not exceed the contractual annual rates listed in the table above. This arrangement may be revised or discontinued at any time. Any fees waived and/or expenses reimbursed under the expense reimbursement arrangements described above are not recoverable by the Investment Manager or its affiliates in future periods.
Note 4. Federal tax information
The timing and character of income and capital gain distributions are determined in accordance with income tax regulations, which may differ from GAAP because of temporary or permanent book to tax differences.
At February 28, 2019, these differences were primarily due to differing treatment for deferral/reversal of wash sale losses, derivative investments, post-October capital losses, trustees’ deferred compensation and foreign currency transactions. To the extent these differences were permanent, reclassifications were made among the components of the Fund’s net assets. Temporary differences do not require reclassifications.
The following reclassifications were made:
Undistributed net
investment
income ($) | Accumulated
net realized
gain ($) | Paid in
capital ($) |
| (2,471) | 2,471 | — |
Net investment income (loss) and net realized gains (losses), as disclosed in the Statement of Operations, and net assets were not affected by this reclassification.
The tax character of distributions paid during the years indicated was as follows:
| Year Ended February 28, 2019 | Year Ended February 28, 2018 |
Ordinary
income ($) | Long-term
capital gains ($) | Total ($) | Ordinary
income ($) | Long-term
capital gains ($) | Total ($) |
| 10,865,951 | 52,440,448 | 63,306,399 | 10,239,222 | 26,694,728 | 36,933,950 |
Short-term capital gain distributions, if any, are considered ordinary income distributions for tax purposes.
At February 28, 2019, the components of distributable earnings on a tax basis were as follows:
Undistributed
ordinary income ($) | Undistributed
long-term
capital gains ($) | Capital loss
carryforwards ($) | Net unrealized
appreciation ($) |
| 1,414,830 | 21,998,277 | — | 160,969,788 |
At February 28, 2019, the cost of all investments for federal income tax purposes along with the aggregate gross unrealized appreciation and depreciation based on that cost was:
Federal
tax cost ($) | Gross unrealized
appreciation ($) | Gross unrealized
(depreciation) ($) | Net unrealized
appreciation ($) |
| 519,938,031 | 170,965,881 | (9,996,093) | 160,969,788 |
Tax cost of investments and unrealized appreciation/(depreciation) may also include timing differences that do not constitute adjustments to tax basis.
Columbia Select Large Cap Equity Fund | Annual Report 2019
| 29 |
Notes to Financial Statements (continued)
February 28, 2019
Under current tax rules, regulated investment companies can elect to treat certain late-year ordinary losses incurred and post-October capital losses (capital losses realized after October 31) as arising on the first day of the following taxable year. As of February 28, 2019, the Fund will elect to treat the following late-year ordinary losses and post-October capital losses as arising on March 1, 2019.
Late year
ordinary losses ($) | Post-October
capital losses ($) |
| — | 3,493,372 |
Management of the Fund has concluded that there are no significant uncertain tax positions in the Fund that would require recognition in the financial statements. However, management’s conclusion may be subject to review and adjustment at a later date based on factors including, but not limited to, new tax laws, regulations, and administrative interpretations (including relevant court decisions). Generally, the Fund’s federal tax returns for the prior three fiscal years remain subject to examination by the Internal Revenue Service.
Note 5. Portfolio information
The cost of purchases and proceeds from sales of securities, excluding short-term investments and derivatives, if any, aggregated to $393,995,690 and $395,400,472, respectively, for the year ended February 28, 2019. The amount of purchase and sale activity impacts the portfolio turnover rate reported in the Financial Highlights.
Note 6. Affiliated money market fund
The Fund invests in Columbia Short-Term Cash Fund, an affiliated money market fund established for the exclusive use by the Fund and other affiliated funds (the Affiliated MMF). The income earned by the Fund from such investments is included as Dividends - affiliated issuers in the Statement of Operations. As an investing fund, the Fund indirectly bears its proportionate share of the expenses of the Affiliated MMF. The Affiliated MMF prices its shares with a floating net asset value. In addition, the Board of Trustees of the Affiliated MMF may impose a fee on redemptions (sometimes referred to as a liquidity fee) or temporarily suspend redemptions (sometimes referred to as imposing a redemption gate) in the event its liquidity falls below regulatory limits.
Note 7. Interfund lending
Pursuant to an exemptive order granted by the Securities and Exchange Commission, the Fund participates in a program (the Interfund Program) allowing each participating Columbia Fund (each, a Participating Fund) to lend money directly to and, except for closed-end funds and money market funds, borrow money directly from other Participating Funds for temporary purposes. The amounts eligible for borrowing and lending under the Interfund Program are subject to certain restrictions.
Interfund loans are subject to the risk that the borrowing fund could be unable to repay the loan when due, and a delay in repayment to the lending fund could result in lost opportunities and/or additional lending costs. The exemptive order is subject to conditions intended to mitigate conflicts of interest arising from the Investment Manager’s relationship with each Participating Fund.
The Fund’s activity in the Interfund Program during the year ended February 28, 2019 was as follows:
| Borrower or lender | Average loan
balance ($) | Weighted average
interest rate (%) | Days
outstanding |
| Lender | 3,400,000 | 2.81 | 2 |
Note 8. Line of credit
The Fund has access to a revolving credit facility with a syndicate of banks led by Citibank, N.A., HSBC Bank USA, N.A. and JPMorgan Chase Bank, N.A. whereby the Fund may borrow for the temporary funding of shareholder redemptions or for other temporary or emergency purposes. The credit facility, which is a collective agreement between the Fund and certain other funds managed by the Investment Manager or an affiliated investment manager, severally and not jointly, permits collective borrowings up to $1 billion. Interest is charged to each participating fund based on its borrowings at a rate equal to the
| 30 | Columbia Select Large Cap Equity Fund | Annual Report 2019 |
Notes to Financial Statements (continued)
February 28, 2019
higher of (i) the federal funds effective rate, (ii) the one-month LIBOR rate and (iii) the overnight bank funding rate, plus in each case, 1.00%. Each borrowing under the credit facility matures no later than 60 days after the date of borrowing. The Fund also pays a commitment fee equal to its pro rata share of the unused amount of the credit facility at a rate of 0.15% per annum. The commitment fee is included in other expenses in the Statement of Operations. This agreement expires annually in December unless extended or renewed.
The Fund had no borrowings during the year ended February 28, 2019.
Note 9. Significant risks
Shareholder concentration risk
At February 28, 2019, one unaffiliated shareholder of record owned 27.2% of the outstanding shares of the Fund in one or more accounts. The Fund has no knowledge about whether any portion of those shares was owned beneficially. Affiliated shareholders of record owned 47.7% of the outstanding shares of the Fund in one or more accounts. Subscription and redemption activity by concentrated accounts may have a significant effect on the operations of the Fund. In the case of a large redemption, the Fund may be forced to sell investments at inopportune times, including its liquid positions, which may result in Fund losses and the Fund holding a higher percentage of less liquid positions. Large redemptions could result in decreased economies of scale and increased operating expenses for non-redeeming Fund shareholders.
Note 10. Subsequent events
Management has evaluated the events and transactions that have occurred through the date the financial statements were issued and noted no items requiring adjustment of the financial statements or additional disclosure.
Note 11. Information regarding pending and settled legal proceedings
Ameriprise Financial and certain of its affiliates have historically been involved in a number of legal, arbitration and regulatory proceedings, including routine litigation, class actions, and governmental actions, concerning matters arising in connection with the conduct of their business activities. Ameriprise Financial believes that the Fund is not currently the subject of, and that neither Ameriprise Financial nor any of its affiliates are the subject of, any pending legal, arbitration or regulatory proceedings that are likely to have a material adverse effect on the Fund or the ability of Ameriprise Financial or its affiliates to perform under their contracts with the Fund. Ameriprise Financial is required to make quarterly (10-Q), annual (10-K) and, as necessary, 8-K filings with the Securities and Exchange Commission (SEC) on legal and regulatory matters that relate to Ameriprise Financial and its affiliates. Copies of these filings may be obtained by accessing the SEC website at www.sec.gov.
There can be no assurance that these matters, or the adverse publicity associated with them, will not result in increased Fund redemptions, reduced sale of Fund shares or other adverse consequences to the Fund. Further, although we believe proceedings are not likely to have a material adverse effect on the Fund or the ability of Ameriprise Financial or its affiliates to perform under their contracts with the Fund, these proceedings are subject to uncertainties and, as such, we are unable to estimate the possible loss or range of loss that may result. An adverse outcome in one or more of these proceedings could result in adverse judgments, settlements, fines, penalties or other relief that could have a material adverse effect on the consolidated financial condition or results of operations of Ameriprise Financial.
Columbia Select Large Cap Equity Fund | Annual Report 2019
| 31 |
Report of Independent Registered Public Accounting Firm
To the Board of Trustees of Columbia Funds Series Trust and Shareholders of Columbia Select Large Cap Equity Fund
Opinion on the Financial Statements
We have audited the accompanying statement of assets and liabilities, including the portfolio of investments, of Columbia Select Large Cap Equity Fund (one of the funds constituting Columbia Funds Series Trust, referred to hereafter as the "Fund") as of February 28, 2019, the related statement of operations for the year ended February 28, 2019, the statement of changes in net assets for each of the two years in the period ended February 28, 2019, including the related notes, and the financial highlights for each of the periods indicated therein (collectively referred to as the “financial statements”). In our opinion, the financial statements present fairly, in all material respects, the financial position of the Fund as of February 28, 2019, the results of its operations for the year then ended, the changes in its net assets for each of the two years in the period ended February 28, 2019 and the financial highlights for each of the periods indicated therein in conformity with accounting principles generally accepted in the United States of America.
Basis for Opinion
These financial statements are the responsibility of the Fund’s management. Our responsibility is to express an opinion on the Fund’s financial statements based on our audits. We are a public accounting firm registered with the Public Company Accounting Oversight Board (United States) (PCAOB) and are required to be independent with respect to the Fund in accordance with the U.S. federal securities laws and the applicable rules and regulations of the Securities and Exchange Commission and the PCAOB.
We conducted our audits of these financial statements in accordance with the standards of the PCAOB. Those standards require that we plan and perform the audit to obtain reasonable assurance about whether the financial statements are free of material misstatement, whether due to error or fraud.
Our audits included performing procedures to assess the risks of material misstatement of the financial statements, whether due to error or fraud, and performing procedures that respond to those risks. Such procedures included examining, on a test basis, evidence regarding the amounts and disclosures in the financial statements. Our audits also included evaluating the accounting principles used and significant estimates made by management, as well as evaluating the overall presentation of the financial statements. Our procedures included confirmation of securities owned as of February 28, 2019 by correspondence with the custodian, transfer agent and brokers; when replies were not received from brokers, we performed other auditing procedures. We believe that our audits provide a reasonable basis for our opinion.
/s/PricewaterhouseCoopers LLP
Minneapolis, Minnesota
April 22, 2019
We have served as the auditor of one or more investment companies within the Columbia Funds Complex since 1977.
| 32 | Columbia Select Large Cap Equity Fund | Annual Report 2019 |
Federal Income Tax Information
(Unaudited)
The Fund hereby designates the following tax attributes for the fiscal year ended February 28, 2019. Shareholders will be notified in early 2020 of the amounts for use in preparing 2019 income tax returns.
Qualified
dividend
income | Dividends
received
deduction | Capital
gain
dividend |
| 92.92% | 91.93% | $52,909,145 |
Qualified dividend income. For taxable, non-corporate shareholders, the percentage of ordinary income distributed during the fiscal year that represents qualified dividend income subject to reduced tax rates.
Dividends received deduction. The percentage of ordinary income distributed during the fiscal year that qualifies for the corporate dividends received deduction.
Capital gain dividend. The Fund designates as a capital gain dividend the amount reflected above, or if subsequently determined to be different, the net capital gain of such fiscal period.
Columbia Select Large Cap Equity Fund | Annual Report 2019
| 33 |
Shareholders elect the Board that oversees the Fund’s operations. The Board appoints officers who are responsible for day-to-day business decisions based on policies set by the Board. The following table provides basic biographical information about the Fund’s Trustees as of the printing of this report, including their principal occupations during the past five years, although specific titles for individuals may have varied over the period. Under current Board policy, Trustees not affiliated with the Investment Manager generally may serve through the end of the calendar year in which they reach the mandatory retirement age established by the Board.
Independent trustees
Name,
address,
year of birth | Position held
with the Trust and
length of service | Principal occupation(s)
during past five years
and other relevant
professional experience | Number of
Funds in the
Columbia Funds
complex
overseen | Other directorships
held by Trustee
during the past
five years |
George S. Batejan
c/o Columbia Management
Investment Advisers, LLC
225 Franklin Street
Mail Drop BX32 05228
Boston, MA 02110
1953 | Trustee since 1/17 | Executive Vice President, Global Head of Technology and Operations, Janus Capital Group, Inc., 2010-2016 | 123 | Former Chairman of the Board, NICSA (National Investment Company Services Association) (Executive Committee, Nominating Committee and Governance Committee), 2014-2016; former Director, Intech Investment Management, 2011-2016; former Board Member, Metro Denver Chamber of Commerce, 2015-2016; former Advisory Board Member, University of Colorado Business School, 2015-2018 |
Kathleen Blatz
c/o Columbia Management
Investment Advisers, LLC
225 Franklin Street
Mail Drop BX32 05228
Boston, MA 02110
1954 | Trustee since 1/06 for RiverSource Funds and since 6/11 for Nations Funds | Attorney; specializing in arbitration and mediation; Chief Justice, Minnesota Supreme Court, 1998-2006; Associate Justice, Minnesota Supreme Court, 1996-1998; Fourth Judicial District Court Judge, Hennepin County, 1994-1996; Attorney in private practice and public service, 1984-1993; State Representative, Minnesota House of Representatives, 1979-1993, which included service on the Tax and Financial Institutions and Insurance Committees; Member and Interim Chair, Minnesota Sports Facilities Authority, January 2017-July 2017; Interim President and Chief Executive Officer, Blue Cross and Blue Shield of Minnesota (health care insurance), February-July 2018 | 123 | Trustee, BlueCross BlueShield of Minnesota since 2009 (Chair of the Business Development Committee, 2014-2017; Chair of the Governance Committee since 2017); Chair of the Robina Foundation since August 2013; former Member and Chair of the Board, Minnesota Sports Facilities Authority, January 2017-July 2017 |
Edward J. Boudreau, Jr.
c/o Columbia Management
Investment Advisers, LLC
225 Franklin Street
Mail Drop BX32 05228
Boston, MA 02110
1944 | Chair of the Board since 1/18; Trustee since 6/11 for RiverSource Funds and since 1/05 for Nations Funds | Managing Director, E.J. Boudreau & Associates (consulting) since 2000; FINRA Industry Arbitrator, 2002-present; Chairman and Chief Executive Officer, John Hancock Investments (asset management), Chairman and Interested Trustee for open-end and closed-end funds offered by John Hancock, 1989-2000; John Hancock Mutual Life Insurance Company, including Senior Vice President and Treasurer and Senior Vice President Information Technology, 1968-1988 | 123 | Former Trustee, Boston Museum of Science (Chair of Finance Committee) 1985-2013; former Trustee, BofA Funds Series Trust (11 funds), 2005-2011 |
| 34 | Columbia Select Large Cap Equity Fund | Annual Report 2019 |
TRUSTEES AND OFFICERS (continued)
Independent trustees (continued)
Name,
address,
year of birth | Position held
with the Trust and
length of service | Principal occupation(s)
during past five years
and other relevant
professional experience | Number of
Funds in the
Columbia Funds
complex
overseen | Other directorships
held by Trustee
during the past
five years |
Pamela G. Carlton
c/o Columbia Management
Investment Advisers, LLC
225 Franklin Street
Mail Drop BX32 05228
Boston, MA 02110
1954 | Trustee since 7/07 for RiverSource Funds and since 6/11 for Nations Funds | President, Springboard — Partners in Cross Cultural Leadership (consulting company) since 2003; Managing Director of US Equity Research, JP Morgan Chase, 1999-2003; Director of US Equity Research, Chase Asset Management, 1996-1999; Co-Director Latin America Research, 1993-1996, COO Global Research, 1992-1996, Co-Director of US Research, 1991-1992, Investment Banker, Morgan Stanley, 1982-1991 | 123 | Trustee, New York Presbyterian Hospital Board (Executive Committee and Chair of Human Resources Committee) since 1996; Director, Laurel Road Bank (Audit Committee) since 2017 |
Patricia M. Flynn
c/o Columbia Management
Investment Advisers, LLC
225 Franklin Street
Mail Drop BX32 05228
Boston, MA 02110
1950 | Trustee since 11/04 for RiverSource Funds and since 6/11 for Nations Funds | Trustee Professor of Economics and Management, Bentley University since 1976 (also teaches and conducts research on corporate governance); Dean, McCallum Graduate School of Business, Bentley University, 1992-2002 | 123 | Trustee, MA Taxpayers Foundation since 1997; Board of Directors, The MA Business Roundtable since 2003; Board of Governors, Innovation Institute, MA Technology Collaborative since 2010 |
Brian J. Gallagher
c/o Columbia Management
Investment Advisers, LLC
225 Franklin Street
Mail Drop BX32 05228
Boston, MA 02110
1954 | Trustee since 12/17 | Retired; Partner with Deloitte & Touche LLP and its predecessors, 1977-2016 | 121 | Trustee, Catholic Schools Foundation since 2004 |
Catherine James Paglia
c/o Columbia Management
Investment Advisers, LLC
225 Franklin Street
Mail Drop BX32 05228
Boston, MA 02110
1952 | Trustee since 11/04 for RiverSource Funds and since 6/11 for Nations Funds | Director, Enterprise Asset Management, Inc. (private real estate and asset management company) since September 1998; Managing Director and Partner, Interlaken Capital, Inc., 1989-1997; Managing Director, Morgan Stanley, 1982-1989; Vice President, Investment Banking, 1980-1982, Associate, Investment Banking, 1976-1980, Dean Witter Reynolds, Inc. | 123 | Director, Valmont Industries, Inc. (irrigation systems manufacturer) since 2012; Trustee, Carleton College (on the Investment Committee); Trustee, Carnegie Endowment for International Peace (on the Investment Committee) |
Anthony M. Santomero
c/o Columbia Management
Investment Advisers, LLC
225 Franklin Street
Mail Drop BX32 05228
Boston, MA 02110
1946 | Trustee since 6/11 for RiverSource Funds and since 1/08 for Nations Funds | Richard K. Mellon Professor Emeritus of Finance, The Wharton School, University of Pennsylvania, since 2002; Senior Advisor, McKinsey & Company (consulting), 2006-2008; President, Federal Reserve Bank of Philadelphia, 2000- 2006; Professor of Finance, The Wharton School, University of Pennsylvania, 1972-2002 | 123 | Trustee, Penn Mutual Life Insurance Company since March 2008; Director, Renaissance Reinsurance Ltd. since May 2008; former Trustee, BofA Funds Series Trust (11 funds), 2008-2011; former Director, Citigroup Inc. and Citibank, N.A., 2009-2019 |
Columbia Select Large Cap Equity Fund | Annual Report 2019
| 35 |
TRUSTEES AND OFFICERS (continued)
Independent trustees (continued)
Name,
address,
year of birth | Position held
with the Trust and
length of service | Principal occupation(s)
during past five years
and other relevant
professional experience | Number of
Funds in the
Columbia Funds
complex
overseen | Other directorships
held by Trustee
during the past
five years |
Minor M. Shaw
c/o Columbia Management
Investment Advisers, LLC
225 Franklin Street
Mail Drop BX32 05228
Boston, MA 02110
1947 | Trustee since 6/11 for RiverSource Funds and since 2003 for Nations Funds | President, Micco LLC (private investments) since 2011; President, Micco Corp. (family investment business), 1998-2011 | 123 | Director, BlueCross BlueShield of South Carolina since April 2008; Board Chair, Hollingsworth Funds since 2016; Advisory Board member, Duke Energy Corp. since October 2016; Chair of the Duke Endowment; Chair of Greenville – Spartanburg Airport Commission; former Trustee, BofA Funds Series Trust (11 funds), 2003-2011; former Director, Piedmont Natural Gas, 2004-2016; former Director, National Association of Corporate Directors, Carolinas Chapter, 2013-2018 |
Sandra Yeager
c/o Columbia Management
Investment Advisers, LLC
225 Franklin Street
Mail Drop BX32 05228
Boston, MA 02110
1964 | Trustee since 12/17 | Retired; President and founder, Hanoverian Capital, LLC (SEC registered investment advisor firm), 2008-2016; Managing Director, DuPont Capital, 2006-2008; Managing Director, Morgan Stanley Investment Management, 2004-2006; Senior Vice President, Alliance Bernstein, 1990-2004 | 121 | Director, NAPE Education Foundation since October 2016 |
Interested trustee affiliated with Investment Manager*
Name,
address,
year of birth | Position held with the Trust and length of service | Principal occupation(s) during the
past five years and other relevant
professional experience | Number of
Funds in the
Columbia Funds
complex overseen | Other directorships
held by Trustee
during the past
five years |
William F. Truscott
c/o Columbia Management
Investment Advisers, LLC
225 Franklin St.
Boston, MA 02110
1960 | Trustee since 11/01 for RiverSource Funds and since 6/11 for Nations Funds; Senior Vice President since 2002 for RiverSource Funds and since 5/10 for Nations Funds | Chairman of the Board and President, Columbia Management Investment Advisers, LLC since May 2010 and February 2012, respectively; Chief Executive Officer, Global Asset Management, Ameriprise Financial, Inc. since September 2012 (previously Chief Executive Officer, U.S. Asset Management & President, Annuities, May 2010 - September 2012); Director and Chief Executive Officer, Columbia Management Investment Distributors, Inc. since May 2010 and February 2012, respectively; Chairman of the Board and Chief Executive Officer, RiverSource Distributors, Inc. since 2006; Director, Threadneedle Asset Management Holdings, SARL since 2014; President and Chief Executive Officer, Ameriprise Certificate Company, 2006 - August 2012. | 192 | Chairman of the Board, Columbia Management Investment Advisers, LLC since May 2010; Director, Columbia Management Investment Distributors, Inc. since May 2010; former Director, Ameriprise Certificate Company, 2006-January 2013 |
| * | Interested person (as defined under the 1940 Act) by reason of being an officer, director, security holder and/or employee of the Investment Manager or Ameriprise Financial. |
| 36 | Columbia Select Large Cap Equity Fund | Annual Report 2019 |
TRUSTEES AND OFFICERS (continued)
Nations Funds refer to the Funds within the Columbia Funds Complex that historically bore the Nations brand and includes series of Columbia Funds Series Trust. RiverSource Funds refer to the Funds within the Columbia Funds Complex that historically bore the RiverSource brand and includes series of Columbia Funds Series Trust II.
The Statement of Additional Information has additional information about the Fund’s Board members and is available, without charge, upon request by calling 800.345.6611, visiting columbiathreadneedleus.com/investor/ or contacting your financial intermediary.
Columbia Select Large Cap Equity Fund | Annual Report 2019
| 37 |
TRUSTEES AND OFFICERS (continued)
The Board has appointed officers who are responsible for day-to-day business decisions based on policies it has established. The officers serve at the pleasure of the Board. The following table provides basic information about the Officers of the Fund as of the printing of this report, including principal occupations during the past five years, although their specific titles may have varied over the period. In addition to Mr. Truscott, who is Senior Vice President, the Fund’s other officers are:
Fund officers
Name,
address and
year of birth | Position and year
first appointed to
position for any Fund
in the Columbia
Funds complex or a
predecessor thereof | Principal occupation(s) during past five years |
Christopher O. Petersen
5228 Ameriprise
Financial Center
Minneapolis, MN 55474
Born 1970 | President and Principal Executive Officer (2015) | Vice President and Lead Chief Counsel, Ameriprise Financial, Inc. since January 2015 (previously, Vice President and Chief Counsel, January 2010 - December 2014; officer of Columbia Funds and affiliated funds since 2007. |
Michael G. Clarke
225 Franklin Street
Boston, MA 02110
Born 1969 | Chief Financial Officer (Principal Financial Officer) (2009) and Senior Vice President (2019) | Vice President — Accounting and Tax, Columbia Management Investment Advisers, LLC, since May 2010; senior officer of Columbia Funds and affiliated funds since 2002 (previously, Treasurer and Chief Accounting Officer, January 2009-January 2019 and December 2015-January 2019, respectively). |
Joseph Beranek
5890 Ameriprise
Financial Center
Minneapolis, MN 55474
Born 1965 | Treasurer and Chief Accounting Officer (Principal Accounting Officer) (2019) | Vice President — Mutual Fund Accounting and Financial Reporting, Columbia Management Investment Advisers, LLC, since December 2018 and March 2017, respectively (previously, Vice President — Pricing and Corporate Actions, May 2010-March 2017). |
Paul B. Goucher
485 Lexington Avenue
New York, NY 10017
Born 1968 | Senior Vice President (2011) and Assistant Secretary (2008) | Senior Vice President and Assistant General Counsel, Ameriprise Financial, Inc. since January 2017 (previously, Vice President and Lead Chief Counsel, November 2008 - January 2017 and January 2013 - January 2017, respectively); Vice President, Chief Legal Officer and Assistant Secretary, Columbia Management Investment Advisers, LLC since March 2015 (previously Vice President and Assistant Secretary, May 2010 – March 2015). |
Thomas P. McGuire
225 Franklin Street
Boston, MA 02110
Born 1972 | Senior Vice President and Chief Compliance Officer (2012) | Vice President — Asset Management Compliance, Ameriprise Financial, Inc., since May 2010; Chief Compliance Officer, Ameriprise Certificate Company since September 2010. |
Colin Moore
225 Franklin Street
Boston, MA 02110
Born 1958 | Senior Vice President (2010) | Executive Vice President and Global Chief Investment Officer, Ameriprise Financial, Inc., since July 2013; Executive Vice President and Global Chief Investment Officer, Columbia Management Investment Advisers, LLC since July 2013. |
Ryan C. Larrenaga
225 Franklin Street
Boston, MA 02110
Born 1970 | Senior Vice President (2017), Chief Legal Officer (2017), and Secretary (2015) | Vice President and Chief Counsel, Ameriprise Financial, Inc. since August 2018 (previously, Vice President and Group Counsel, August 2011 - August 2018); officer of Columbia Funds and affiliated funds since 2005. |
Michael E. DeFao
225 Franklin Street
Boston, MA 02110
Born 1968 | Vice President (2011) and Assistant Secretary (2010) | Vice President and Chief Counsel, Ameriprise Financial, Inc. since May 2010. |
Amy Johnson
5228 Ameriprise
Financial Center
Minneapolis, MN 55474
Born 1965 | Vice President (2006) | Managing Director and Global Head of Operations, Columbia Management Investment Advisers, LLC since April 2016 (previously Managing Director and Chief Operating Officer, 2010 - 2016). |
| 38 | Columbia Select Large Cap Equity Fund | Annual Report 2019 |
TRUSTEES AND OFFICERS (continued)
Fund officers (continued)
Name,
address and
year of birth | Position and year
first appointed to
position for any Fund
in the Columbia
Funds complex or a
predecessor thereof | Principal occupation(s) during past five years |
Lyn Kephart-Strong
5228 Ameriprise
Financial Center
Minneapolis, MN 55474
Born 1960 | Vice President (2015) | President, Columbia Management Investment Services Corp. since October 2014; Vice President & Resolution Officer, Ameriprise Trust Company since August 2009. |
Columbia Select Large Cap Equity Fund | Annual Report 2019
| 39 |
The Fund mails one shareholder report to each shareholder address, unless such shareholder elected to receive shareholder reports from the Fund electronically. If you would like more than one report, please call shareholder services at 800.345.6611 and additional reports will be sent to you.
Proxy voting policies and procedures
The policy of the Board of Trustees is to vote the proxies of the companies in which the Fund holds investments consistent with the procedures as stated in the Statement of Additional Information (SAI). You may obtain a copy of the SAI without charge by calling 800.345.6611; contacting your financial intermediary; visiting columbiathreadneedleus.com/investor/; or searching the website of the Securities and Exchange Commission (SEC) at sec.gov. Information regarding how the Fund voted proxies relating to portfolio securities is filed with the SEC by August 31st for the most recent 12-month period ending June 30th of that year, and is available without charge by visiting columbiathreadneedleus.com/investor/, or searching the website of the SEC at sec.gov.
Quarterly schedule of investments
The Fund files a complete schedule of portfolio holdings with the SEC for the first and third quarters of each fiscal year on Form N-Q or Form N-PORT (available for filings after March 31, 2019). The Fund’s Form N-Q or Form N-PORT is available on the SEC’s website at sec.gov. The Fund’s complete schedule of portfolio holdings, as filed on Form N-Q or Form N-PORT, can also be obtained without charge, upon request, by calling 800.345.6611.
Additional Fund information
For more information about the Fund, please visit columbiathreadneedleus.com/investor/ or call 800.345.6611. Customer Service Representatives are available to answer your questions Monday through Friday from 8 a.m. to 7 p.m. Eastern time.
Fund investment manager
Columbia Management Investment Advisers, LLC
225 Franklin Street
Boston, MA 02110
Fund distributor
Columbia Management Investment Distributors, Inc.
225 Franklin Street
Boston, MA 02110
Fund transfer agent
Columbia Management Investment Services Corp.
P.O. Box 219104
Kansas City, MO 64121-9104
| 40 | Columbia Select Large Cap Equity Fund | Annual Report 2019 |
[THIS PAGE INTENTIONALLY LEFT BLANK]
Columbia Select Large Cap Equity Fund
P.O. Box 219104
Kansas City, MO 64121-9104
Please read and consider the investment objectives, risks, charges and expenses for any fund carefully before investing. For a prospectus and summary prospectus, which contains this and other important information about the Fund, go to
columbiathreadneedleus.com/investor/. The Fund is distributed by Columbia Management Investment Distributors, Inc., member FINRA, and managed by Columbia Management Investment Advisers, LLC.
Columbia Threadneedle Investments (Columbia Threadneedle) is the global brand name of the Columbia and Threadneedle group of companies. All rights reserved.
© 2019 Columbia Management Investment Advisers, LLC.
columbiathreadneedleus.com/investor/

Annual Report
February 28, 2019
Columbia Large Cap Enhanced Core Fund
Beginning on January 1, 2021, as permitted by regulations adopted by the Securities and Exchange Commission, paper copies of the Fund’s annual and semiannual shareholder reports like this one will no longer be sent by mail, unless you specifically request paper copies of the reports. Instead, the reports will be made available on the Fund’s website (columbiathreadneedleus.com/investor/), and each time a report is posted you will be notified by mail and provided with a website address to access the report.
If you have already elected to receive shareholder reports electronically, you will not be affected by this change and you need not take any action. You may elect to receive shareholder reports and other communications from the Fund electronically at any time by contacting your financial intermediary (such as a broker-dealer or bank) or, for Fund shares held directly with the Fund, by calling 800.345.6611 or by enrolling in “eDelivery” by logging into your account at columbiathreadneedleus.com/investor/.
You may elect to receive all future reports in paper free of charge. If you invest through a financial intermediary, you can contact your financial intermediary to request that you continue receiving paper copies of your shareholder reports. If you invest directly with the Fund, you can call 800.345.6611 to let the Fund know you wish to continue receiving paper copies of your shareholder reports. Your election to receive paper reports will apply to all Columbia Funds held in your account if you invest through a financial intermediary or all Columbia Funds held with the fund complex if you invest directly with the Fund.
Not FDIC Insured • No bank guarantee • May lose value
Dear Shareholders,
Volatility exists in financial markets and this is not a comfortable fact of life. How investors deal with this reality, including how they react to short term spikes in volatility as well as to longer periods of increased or decreased volatility, may have a significant impact on their overall investing success.
Too often, investors change their investment strategy based on something that’s happening at a moment in time rather than thinking about how that change in strategy might affect their ability to achieve their longer term financial goals. Emotion replaces logic and reasoning. Investors may sell in reaction to a market drop (fear or panic), locking in low returns which means they won’t be invested when the market returns, or they invest more at a market peak (greed or conviction), essentially when it is expensive to do so. In both cases, selling and buying at the exact wrong time.
We believe the best outcomes come from a consistent approach to investing. Here are five areas where advisors can help us overcome the tendency to react emotionally as we struggle to make the right choices with our investments:
Long-term focus
The further away long-term goals, aspirations and objectives are, the easier it is to stray away from the goals and priorities that we set out. Advisors help us stay focused on what we want to accomplish.
Discipline through up-and-down markets
Advisors help set rules to prevent us from making rash decisions that we may regret later. Knowing ahead of time what you should do in case of certain situations will help you get through volatile markets and not make emotional decisions.
Tax-awareness
Taxes are one of the biggest drags on investment returns and are critical attributes of investing. Yet few of us take the necessary steps to ease the corrosive effect of taxes. Advisors have tools and knowledge that may help us to manage portfolios more tax-efficiently and keep more of what we earn.
Emotional objectivity
Our emotions are very hard to manage and making investment decisions in an emotional state can lead to exceedingly bad outcomes. An objective advisor can help prevent some of the reactionary mistakes emotions often lead us to.
Education and guidance
The role of the advisor is to teach and guide us toward achieving our financial goals. In terms of working through emotions, guidance is by far the most important component.
By understanding our own behaviors and biases, we can prepare for future challenges. Your success is our priority. Talk to your advisor about how working with Columbia Threadneedle Investments may help you stay the course and position your portfolio for consistent, sustainable outcomes, regardless of market conditions.
Sincerely,
Christopher O. Petersen
President, Columbia Funds
Columbia Funds are distributed by Columbia Management Investment Distributors, Inc., member FINRA, and managed by Columbia Management Investment Advisers, LLC.
© 2019 Columbia Management Investment Advisers, LLC. All rights reserved.
Columbia Large Cap Enhanced Core Fund | Annual Report 2019
Columbia Large Cap Enhanced Core Fund | Annual Report 2019
Investment objective
Columbia Large Cap Enhanced Core Fund (the Fund) seeks total return before fees and expenses that exceeds the total return of the Standard & Poor’s (S&P) 500 Index.
Portfolio management
Brian Condon, CFA
Co-Portfolio Manager
Managed Fund since 2009
Peter Albanese
Co-Portfolio Manager
Managed Fund since 2014
Morningstar style boxTM
The Morningstar Style Box is based on a fund’s portfolio holdings. For equity funds, the vertical axis shows the market capitalization of the stocks owned, and the horizontal axis shows investment style (value, blend, or growth). Information shown is based on the most recent data provided by Morningstar.
© 2019 Morningstar, Inc. All rights reserved. The Morningstar information contained herein: (1) is proprietary to Morningstar and/or its content providers; (2) may not be copied or distributed; and (3) is not warranted to be accurate, complete or timely. Neither Morningstar nor its content providers are responsible for any damages or losses arising from any use of this information.
| Average annual total returns (%) (for the period ended February 28, 2019) |
| | | Inception | 1 Year | 5 Years | 10 Years |
| Class A | 07/31/96 | 4.14 | 10.56 | 16.50 |
| Advisor Class* | 07/01/15 | 4.38 | 10.77 | 16.61 |
| Institutional Class | 07/31/96 | 4.42 | 10.84 | 16.79 |
| Institutional 2 Class* | 06/25/14 | 4.50 | 10.94 | 16.70 |
| Institutional 3 Class* | 07/15/09 | 4.58 | 11.00 | 16.93 |
| Class R | 01/23/06 | 3.88 | 10.29 | 16.21 |
| S&P 500 Index | | 4.68 | 10.67 | 16.67 |
All results shown assume reinvestment of distributions during the period. Returns do not reflect the deduction of taxes that a shareholder may pay on Fund distributions or on the redemption of Fund shares. Performance results reflect the effect of any fee waivers or reimbursements of Fund expenses by Columbia Management Investment Advisers, LLC and/or any of its affiliates. Absent these fee waivers or expense reimbursement arrangements, performance results would have been lower.
The performance information shown represents past performance and is not a guarantee of future results. The investment return and principal value of your investment will fluctuate so that your shares, when redeemed, may be worth more or less than their original cost. Current performance may be lower or higher than the performance information shown. You may obtain performance information current to the most recent month-end by contacting your financial intermediary, visiting columbiathreadneedleus.com/investor/ or calling 800.345.6611.
| * | The returns shown for periods prior to the share class inception date (including returns for the Life of the Fund, if shown, which are since Fund inception) include the returns of the Fund’s oldest share class. Since the Fund launched more than one share class at its inception, Class A shares were used. These returns are adjusted to reflect any higher class-related operating expenses of the newer share classes, as applicable. Please visit columbiathreadneedleus.com/investor/investment-products/mutual-funds/appended-performance for more information. |
The S&P 500 Index, an unmanaged index, measures the performance of 500 widely held, large-capitalization U.S. stocks and is frequently used as a general measure of market performance.
Indices are not available for investment, are not professionally managed and do not reflect sales charges, fees, brokerage commissions, taxes or other expenses of investing. Securities in the Fund may not match those in an index.
| 2 | Columbia Large Cap Enhanced Core Fund | Annual Report 2019 |
Fund at a Glance (continued)
Performance of a hypothetical $10,000 investment (February 28, 2009 — February 28, 2019)
The chart above shows the change in value of a hypothetical $10,000 investment in Class A shares of Columbia Large Cap Enhanced Core Fund during the stated time period, and does not reflect the deduction of taxes that a shareholder may pay on Fund distributions or on the redemption of Fund shares.
| Top 10 holdings (%) (at February 28, 2019) |
| Microsoft Corp. | 4.4 |
| Alphabet, Inc., Class A | 3.5 |
| Apple, Inc. | 2.7 |
| Amazon.com, Inc. | 2.4 |
| Facebook, Inc., Class A | 2.3 |
| Johnson & Johnson | 2.1 |
| Visa, Inc., Class A | 1.8 |
| Boeing Co. (The) | 1.7 |
| Cisco Systems, Inc. | 1.7 |
| Verizon Communications, Inc. | 1.6 |
Percentages indicated are based upon total investments excluding Money Market Funds and investments in derivatives, if any.
For further detail about these holdings, please refer to the section entitled “Portfolio of Investments.”
Fund holdings are as of the date given, are subject to change at any time, and are not recommendations to buy or sell any security.
| Portfolio breakdown (%) (at February 28, 2019) |
| Common Stocks | 96.4 |
| Money Market Funds | 3.6 |
| Total | 100.0 |
Percentages indicated are based upon total investments excluding investments in derivatives, if any. The Fund’s portfolio composition is subject to change.
| Equity sector breakdown (%) (at February 28, 2019) |
| Communication Services | 10.2 |
| Consumer Discretionary | 9.4 |
| Consumer Staples | 7.6 |
| Energy | 5.1 |
| Financials | 13.1 |
| Health Care | 15.3 |
| Industrials | 10.0 |
| Information Technology | 20.8 |
| Materials | 2.3 |
| Real Estate | 2.7 |
| Utilities | 3.5 |
| Total | 100.0 |
Percentages indicated are based upon total equity investments. The Fund’s portfolio composition is subject to change.
Columbia Large Cap Enhanced Core Fund | Annual Report 2019
| 3 |
Manager Discussion of Fund Performance
For the 12-month period that ended February 28, 2019, the Fund’s Class A shares returned 4.14%. The Fund’s benchmark, the S&P 500 Index, returned 4.68% for the same time period. Stock selection, as driven by our quantitative models, drove performance.
Stocks advanced despite year-end selloff
Investors kicked off the 12-month period ended February 28, 2019 with soaring optimism. Positive global economic conditions, broad corporate tax cuts and moves to reduce regulation in a number of industries buoyed confidence. The pace of economic growth averaged more than 3.0% as the labor markets added an average of 209,000 jobs per month, wages increased on the order of 3.0% and manufacturing activity remained solid. Unemployment rose modestly in December and January, but even that was a net positive as it reflected an increase in the number of Americans seeking employment. Weak job creation in February drove unemployment back down to 3.8%.
However, as 2018 progressed, the rosy global outlook dimmed. European economies transitioned to a slower pace, struggling with rising interest rates, trade tensions and uncertainty surrounding Brexit (the U.K.’s departure from the European Union). At the same time, China’s economic conditions weakened and emerging markets came under pressure, driven by trade concerns and a rising U.S dollar. In December, the Federal Reserve (the Fed) rattled investors when it raised the target range of its key short-term interest rate, the federal funds rate, to 2.25%-2.50%, the fourth such increase for the year. However, the Fed maintained this rate in its January 2019 meeting and announced that it would be patient moving forward.
As uncertainties rose late in 2018, investors backed away from riskier assets. Technology stocks, which had been global market leaders, stumbled in the third quarter of 2018 and triggered a broader market sell-off of stocks and high-yield bonds in the fourth quarter. However, stocks rebounded early in 2019 as a patient Fed and hopes for progress on the trade front inspired confidence. The S&P 500 Index, a broad measure of U.S. stock returns, gained 4.68% for the 12-month period, with dividends reinvested. Investment-grade bonds, as measured by the Bloomberg Barclays U.S. Aggregate Bond Index, returned 3.17%.
Stock selection models delivered mixed results
We divide the metrics for our stock selection model into three broad categories: valuation (fundamental measures, such as earnings and cash flow, relative to market values), catalyst (price momentum and business momentum) and quality (quality of earnings and financial strength). We then rank the securities within a sector/industry from 1 (most attractive) to 5 (least attractive) based upon the metrics within these categories. For the period, the Fund’s quality factors were the best performing category while the catalyst and valuation themes fell short of expectations. Many of the factors favored by the Fund’s valuation theme, such as low price-to-book and price-to-earnings ratios, were out of favor during the period.
The Fund’s strategy is to keep sector weights in line with the benchmark, so relative performance is primarily driven by stock selection. Security selection within information technology, industrials, and energy added most to relative performance. Stock selection within consumer discretionary, communication services and materials detracted most from relative performance.
Contributors and detractors
Pharmaceutical firm Eli Lilly was the Fund’s top individual contributor for the 12-month period. Eli Lilly shares climbed steadily as the company reported strong quarterly earnings results and announced positive data in the fourth quarter of 2018 regarding a key diabetes drug — a pill and not an injectable — in its pipeline. Technology firm VeriSign was another notable contributor. The company, which provides domain name registry services and internet security, repeatedly posted earnings that beat consensus estimates. The company also sold certain of its security services assets to NeuStar. The Fund had no exposure to semiconductor company NVIDIA, which aided performance. NVIDIA shares fell sharply in the fourth quarter of 2018 after reporting disappointing quarterly results and lowering forward guidance, largely the result of excess inventory overhang stemming from the fall off in crypto demand. The semiconductor industry itself broadly sold off due to cyclical fears of slowing demand.
| 4 | Columbia Large Cap Enhanced Core Fund | Annual Report 2019 |
Manager Discussion of Fund Performance (continued)
A position in Charter Communications was a notable detractor from relative results. The broad communication services provider sold off early in the period after reporting disappointing quarterly results driven by continued issues following the company’s integration with Time Warner. We exited the name not long after these results were reported. A position in pharmaceutical company Bristol-Myers Squibb also weighed on returns. Bristol-Myers shares sold off in October 2018 after reporting disappointing trial results for a drug designed to help treat lung cancer. We continue to own the stock. Underexposure to pharmaceutical company Merck also detracted from relative returns, as Merck enjoyed solid gains for the period.
The Fund employs equity index futures to equitize its cash position. They serve to keep the fund fully invested and to keep its risk profile in line with the benchmark.
Adjustment to stock selection models
During the period, we created a new model for the rebranded communication services sector, which went into effect at the end of the third quarter of 2018. The model comprises telecom, media and several software stocks. To improve the comparability within this diverse sector, fundamental ratios are adjusted at the subsector level. We also modified the “free cash flow yield” signal to address the large disparity in the structure of total investment and balance sheet composition across companies within the sector.
Investment discipline based on stock selection model
Regardless of the economic environment, we maintain our investment discipline, which is linked to the Fund’s quantitative stock selection model. Consequently, we do not rely on macroeconomic scenarios or market outlooks to choose securities. We also seek to minimize sector weight differences between the Fund and its investment benchmark. We continue to favor stocks of companies with attributes considered most important in our quantitative stock selection model — companies with attractive valuations relative to their peers, strong business and market momentum and good quality of earnings and financial strength. Over the long term, we have found that stocks with these characteristics have had the potential to outperform their peers in various macroeconomic conditions.
Market risk may affect a single issuer, sector of the economy, industry or the market as a whole. Investing inderivatives is a specialized activity that involves special risks, which may result in significant losses. The Fund’s net value will generally decline when the performance of its targetedindex declines. See the Fund’s prospectus for more information on these and other risks.
The views expressed in this report reflect the current views of the respective parties. These views are not guarantees of future performance and involve certain risks, uncertainties and assumptions that are difficult to predict, so actual outcomes and results may differ significantly from the views expressed. These views are subject to change at any time based upon economic, market or other conditions and the respective parties disclaim any responsibility to update such views. These views may not be relied on as investment advice and, because investment decisions for a Columbia fund are based on numerous factors, may not be relied on as an indication of trading intent on behalf of any particular Columbia fund. References to specific securities should not be construed as a recommendation or investment advice.
Columbia Large Cap Enhanced Core Fund | Annual Report 2019
| 5 |
Understanding Your Fund’s Expenses
(Unaudited)
As an investor, you incur two types of costs. There are shareholder transaction costs, which may include redemption fees. There are also ongoing fund costs, which generally include management fees, distribution and/or service fees, and other fund expenses. The following information is intended to help you understand your ongoing costs (in dollars) of investing in the Fund and to help you compare these costs with the ongoing costs of investing in other mutual funds.
Analyzing your Fund’s expenses
To illustrate these ongoing costs, we have provided examples and calculated the expenses paid by investors in each share class of the Fund during the period. The actual and hypothetical information in the table is based on an initial investment of $1,000 at the beginning of the period indicated and held for the entire period. Expense information is calculated two ways and each method provides you with different information. The amount listed in the “Actual” column is calculated using the Fund’s actual operating expenses and total return for the period. You may use the Actual information, together with the amount invested, to estimate the expenses that you paid over the period. Simply divide your account value by $1,000 (for example, an $8,600 account value divided by $1,000 = 8.6), then multiply the results by the expenses paid during the period under the “Actual” column. The amount listed in the “Hypothetical” column assumes a 5% annual rate of return before expenses (which is not the Fund’s actual return) and then applies the Fund’s actual expense ratio for the period to the hypothetical return. You should not use the hypothetical account values and expenses to estimate either your actual account balance at the end of the period or the expenses you paid during the period. See “Compare with other funds” below for details on how to use the hypothetical data.
Compare with other funds
Since all mutual funds are required to include the same hypothetical calculations about expenses in shareholder reports, you can use this information to compare the ongoing cost of investing in the Fund with other funds. To do so, compare the hypothetical example with the 5% hypothetical examples that appear in the shareholder reports of other funds. As you compare hypothetical examples of other funds, it is important to note that hypothetical examples are meant to highlight the ongoing costs of investing in a fund only and do not reflect any transaction costs, such as redemption or exchange fees. Therefore, the hypothetical calculations are useful in comparing ongoing costs only, and will not help you determine the relative total costs of owning different funds. If transaction costs were included in these calculations, your costs would be higher.
| September 1, 2018 — February 28, 2019 |
| | Account value at the
beginning of the
period ($) | Account value at the
end of the
period ($) | Expenses paid during
the period ($) | Fund’s annualized
expense ratio (%) |
| | Actual | Hypothetical | Actual | Hypothetical | Actual | Hypothetical | Actual |
| Class A | 1,000.00 | 1,000.00 | 964.70 | 1,020.38 | 4.34 | 4.46 | 0.89 |
| Advisor Class | 1,000.00 | 1,000.00 | 966.10 | 1,021.62 | 3.12 | 3.21 | 0.64 |
| Institutional Class | 1,000.00 | 1,000.00 | 966.00 | 1,021.62 | 3.12 | 3.21 | 0.64 |
| Institutional 2 Class | 1,000.00 | 1,000.00 | 966.70 | 1,022.12 | 2.63 | 2.71 | 0.54 |
| Institutional 3 Class | 1,000.00 | 1,000.00 | 966.90 | 1,022.36 | 2.39 | 2.46 | 0.49 |
| Class R | 1,000.00 | 1,000.00 | 963.60 | 1,019.14 | 5.55 | 5.71 | 1.14 |
Expenses paid during the period are equal to the annualized expense ratio for each class as indicated above, multiplied by the average account value over the period and then multiplied by the number of days in the Fund’s most recent fiscal half year and divided by 365.
Expenses do not include fees and expenses incurred indirectly by the Fund from its investment in underlying funds, including affiliated and non-affiliated pooled investment vehicles, such as mutual funds and exchange-traded funds.
Had Columbia Management Investment Advisers, LLC and/or certain of its affiliates not waived/reimbursed certain fees and expenses, account value at the end of the period would have been reduced.
| 6 | Columbia Large Cap Enhanced Core Fund | Annual Report 2019 |
Portfolio of Investments
February 28, 2019
(Percentages represent value of investments compared to net assets)
Investments in securities
| Common Stocks 96.3% |
| Issuer | Shares | Value ($) |
| Communication Services 9.8% |
| Diversified Telecommunication Services 2.0% |
| AT&T, Inc. | 64,500 | 2,007,240 |
| Verizon Communications, Inc. | 150,400 | 8,560,768 |
| Total | | 10,568,008 |
| Entertainment 0.9% |
| Electronic Arts, Inc.(a) | 47,100 | 4,511,238 |
| Walt Disney Co. (The) | 4,600 | 519,064 |
| Total | | 5,030,302 |
| Interactive Media & Services 5.7% |
| Alphabet, Inc., Class A(a) | 16,455 | 18,537,380 |
| Facebook, Inc., Class A(a) | 75,800 | 12,237,910 |
| TripAdvisor, Inc.(a) | 9,600 | 510,432 |
| Total | | 31,285,722 |
| Media 1.2% |
| Comcast Corp., Class A | 172,600 | 6,674,442 |
| Total Communication Services | 53,558,474 |
| Consumer Discretionary 9.1% |
| Automobiles 0.7% |
| Harley-Davidson, Inc. | 95,700 | 3,552,384 |
| Diversified Consumer Services 0.6% |
| H&R Block, Inc. | 142,600 | 3,443,790 |
| Hotels, Restaurants & Leisure 1.0% |
| Starbucks Corp. | 76,400 | 5,367,864 |
| Household Durables 0.3% |
| Garmin Ltd. | 19,800 | 1,662,606 |
| Internet & Direct Marketing Retail 3.2% |
| Amazon.com, Inc.(a) | 7,550 | 12,380,717 |
| Booking Holdings, Inc.(a) | 2,910 | 4,938,386 |
| Total | | 17,319,103 |
| Multiline Retail 0.8% |
| Kohl’s Corp. | 35,800 | 2,417,574 |
| Macy’s, Inc. | 86,100 | 2,134,419 |
| Total | | 4,551,993 |
| Common Stocks (continued) |
| Issuer | Shares | Value ($) |
| Specialty Retail 2.0% |
| Advance Auto Parts, Inc. | 16,000 | 2,588,480 |
| AutoZone, Inc.(a) | 2,975 | 2,793,436 |
| Foot Locker, Inc. | 43,800 | 2,606,976 |
| Home Depot, Inc. (The) | 12,400 | 2,295,736 |
| Lowe’s Companies, Inc. | 7,000 | 735,630 |
| Total | | 11,020,258 |
| Textiles, Apparel & Luxury Goods 0.5% |
| Capri Holdings Ltd.(a) | 53,500 | 2,439,600 |
| Total Consumer Discretionary | 49,357,598 |
| Consumer Staples 7.3% |
| Beverages 0.2% |
| Coca-Cola Co. (The) | 16,000 | 725,440 |
| PepsiCo, Inc. | 3,900 | 450,996 |
| Total | | 1,176,436 |
| Food & Staples Retailing 2.6% |
| Kroger Co. (The) | 133,400 | 3,912,622 |
| Walgreens Boots Alliance, Inc. | 66,500 | 4,734,135 |
| Walmart, Inc. | 56,800 | 5,622,632 |
| Total | | 14,269,389 |
| Food Products 1.1% |
| Mondelez International, Inc., Class A | 39,600 | 1,867,536 |
| Tyson Foods, Inc., Class A | 61,900 | 3,816,754 |
| Total | | 5,684,290 |
| Household Products 1.1% |
| Kimberly-Clark Corp. | 36,700 | 4,287,661 |
| Procter & Gamble Co. (The) | 19,100 | 1,882,305 |
| Total | | 6,169,966 |
| Tobacco 2.3% |
| Altria Group, Inc. | 109,500 | 5,738,895 |
| Philip Morris International, Inc. | 77,400 | 6,729,156 |
| Total | | 12,468,051 |
| Total Consumer Staples | 39,768,132 |
| Energy 4.9% |
| Energy Equipment & Services 0.1% |
| National Oilwell Varco, Inc. | 9,400 | 264,516 |
The accompanying Notes to Financial Statements are an integral part of this statement.
Columbia Large Cap Enhanced Core Fund | Annual Report 2019
| 7 |
Portfolio of Investments (continued)
February 28, 2019
| Common Stocks (continued) |
| Issuer | Shares | Value ($) |
| Oil, Gas & Consumable Fuels 4.8% |
| Chevron Corp. | 50,400 | 6,026,832 |
| ConocoPhillips Co. | 76,900 | 5,217,665 |
| Devon Energy Corp. | 98,600 | 2,909,686 |
| Exxon Mobil Corp. | 47,600 | 3,761,828 |
| HollyFrontier Corp. | 63,100 | 3,230,720 |
| Marathon Oil Corp. | 67,700 | 1,123,820 |
| Valero Energy Corp. | 49,600 | 4,045,376 |
| Total | | 26,315,927 |
| Total Energy | 26,580,443 |
| Financials 12.7% |
| Banks 5.5% |
| Bank of America Corp. | 286,000 | 8,316,880 |
| Citigroup, Inc. | 112,700 | 7,210,546 |
| Comerica, Inc. | 46,200 | 4,024,482 |
| JPMorgan Chase & Co. | 42,800 | 4,466,608 |
| Regions Financial Corp. | 31,900 | 523,160 |
| Wells Fargo & Co. | 30,000 | 1,496,700 |
| Zions Bancorp | 79,300 | 4,052,230 |
| Total | | 30,090,606 |
| Capital Markets 2.5% |
| Bank of New York Mellon Corp. (The) | 84,300 | 4,424,064 |
| CME Group, Inc. | 18,900 | 3,438,099 |
| Franklin Resources, Inc. | 47,200 | 1,539,192 |
| Intercontinental Exchange, Inc. | 56,100 | 4,328,115 |
| Total | | 13,729,470 |
| Consumer Finance 0.8% |
| Capital One Financial Corp. | 50,800 | 4,245,864 |
| Diversified Financial Services 1.0% |
| Berkshire Hathaway, Inc., Class B(a) | 26,500 | 5,334,450 |
| Insurance 2.9% |
| Allstate Corp. (The) | 39,900 | 3,765,762 |
| Marsh & McLennan Companies, Inc. | 30,700 | 2,855,714 |
| MetLife, Inc. | 99,100 | 4,478,329 |
| Prudential Financial, Inc. | 46,900 | 4,495,365 |
| Total | | 15,595,170 |
| Total Financials | 68,995,560 |
| Common Stocks (continued) |
| Issuer | Shares | Value ($) |
| Health Care 14.7% |
| Biotechnology 2.5% |
| Alexion Pharmaceuticals, Inc.(a) | 25,800 | 3,491,514 |
| Biogen, Inc.(a) | 10,250 | 3,362,102 |
| Gilead Sciences, Inc. | 31,400 | 2,041,628 |
| Regeneron Pharmaceuticals, Inc.(a) | 3,100 | 1,335,294 |
| Vertex Pharmaceuticals, Inc.(a) | 18,700 | 3,529,625 |
| Total | | 13,760,163 |
| Health Care Equipment & Supplies 1.9% |
| Abbott Laboratories | 54,700 | 4,245,814 |
| Baxter International, Inc. | 58,500 | 4,371,705 |
| Hologic, Inc.(a) | 35,300 | 1,664,395 |
| Total | | 10,281,914 |
| Health Care Providers & Services 2.9% |
| Cardinal Health, Inc. | 74,000 | 4,021,160 |
| Cigna Corp. | 18,300 | 3,192,252 |
| HCA Healthcare, Inc. | 21,300 | 2,961,552 |
| McKesson Corp. | 30,200 | 3,840,232 |
| UnitedHealth Group, Inc. | 8,100 | 1,961,982 |
| Total | | 15,977,178 |
| Life Sciences Tools & Services 1.1% |
| Agilent Technologies, Inc. | 53,400 | 4,242,096 |
| IQVIA Holdings, Inc.(a) | 12,300 | 1,723,230 |
| Total | | 5,965,326 |
| Pharmaceuticals 6.3% |
| Allergan PLC | 28,600 | 3,938,506 |
| Bristol-Myers Squibb Co. | 101,800 | 5,258,988 |
| Eli Lilly & Co. | 52,000 | 6,567,080 |
| Johnson & Johnson | 82,100 | 11,218,144 |
| Merck & Co., Inc. | 57,100 | 4,641,659 |
| Perrigo Co. PLC | 11,600 | 564,920 |
| Pfizer, Inc. | 50,100 | 2,171,835 |
| Total | | 34,361,132 |
| Total Health Care | 80,345,713 |
The accompanying Notes to Financial Statements are an integral part of this statement.
| 8 | Columbia Large Cap Enhanced Core Fund | Annual Report 2019 |
Portfolio of Investments (continued)
February 28, 2019
| Common Stocks (continued) |
| Issuer | Shares | Value ($) |
| Industrials 9.6% |
| Aerospace & Defense 1.8% |
| Boeing Co. (The) | 20,750 | 9,129,170 |
| Raytheon Co. | 5,700 | 1,063,050 |
| Total | | 10,192,220 |
| Air Freight & Logistics 0.5% |
| CH Robinson Worldwide, Inc. | 30,200 | 2,729,476 |
| Airlines 0.8% |
| Southwest Airlines Co. | 75,900 | 4,253,436 |
| Building Products 0.7% |
| Masco Corp. | 97,300 | 3,654,588 |
| Electrical Equipment 0.9% |
| Eaton Corp. PLC | 12,600 | 1,005,102 |
| Rockwell Automation, Inc. | 23,000 | 4,106,880 |
| Total | | 5,111,982 |
| Industrial Conglomerates 1.1% |
| Honeywell International, Inc. | 39,500 | 6,085,765 |
| Machinery 1.7% |
| Illinois Tool Works, Inc. | 30,200 | 4,351,216 |
| Parker-Hannifin Corp. | 5,700 | 1,004,112 |
| Snap-On, Inc. | 23,700 | 3,792,000 |
| Total | | 9,147,328 |
| Professional Services 0.7% |
| Robert Half International, Inc. | 57,500 | 3,920,925 |
| Road & Rail 1.4% |
| CSX Corp. | 64,800 | 4,709,016 |
| Union Pacific Corp. | 16,500 | 2,767,050 |
| Total | | 7,476,066 |
| Total Industrials | 52,571,786 |
| Information Technology 20.1% |
| Communications Equipment 2.0% |
| Cisco Systems, Inc. | 169,500 | 8,775,015 |
| F5 Networks, Inc.(a) | 12,900 | 2,169,006 |
| Total | | 10,944,021 |
| Common Stocks (continued) |
| Issuer | Shares | Value ($) |
| IT Services 4.2% |
| MasterCard, Inc., Class A | 37,300 | 8,383,921 |
| PayPal Holdings, Inc.(a) | 9,100 | 892,437 |
| VeriSign, Inc.(a) | 23,200 | 4,130,528 |
| Visa, Inc., Class A | 64,700 | 9,583,364 |
| Total | | 22,990,250 |
| Semiconductors & Semiconductor Equipment 3.0% |
| Broadcom, Inc. | 21,900 | 6,030,384 |
| Intel Corp. | 104,900 | 5,555,504 |
| Lam Research Corp. | 22,600 | 3,979,634 |
| QUALCOMM, Inc. | 7,300 | 389,747 |
| Total | | 15,955,269 |
| Software 7.2% |
| Adobe, Inc.(a) | 25,900 | 6,798,750 |
| Fortinet, Inc.(a) | 47,900 | 4,157,241 |
| Intuit, Inc. | 21,200 | 5,239,156 |
| Microsoft Corp.(b) | 206,200 | 23,100,586 |
| Total | | 39,295,733 |
| Technology Hardware, Storage & Peripherals 3.7% |
| Apple, Inc. | 81,175 | 14,055,451 |
| HP, Inc. | 194,400 | 3,835,512 |
| NetApp, Inc. | 35,800 | 2,334,160 |
| Total | | 20,225,123 |
| Total Information Technology | 109,410,396 |
| Materials 2.2% |
| Chemicals 1.5% |
| CF Industries Holdings, Inc. | 25,600 | 1,080,320 |
| LyondellBasell Industries NV, Class A | 45,300 | 3,874,056 |
| Mosaic Co. (The) | 108,300 | 3,386,541 |
| Total | | 8,340,917 |
| Metals & Mining 0.7% |
| Nucor Corp. | 64,300 | 3,894,651 |
| Total Materials | 12,235,568 |
The accompanying Notes to Financial Statements are an integral part of this statement.
Columbia Large Cap Enhanced Core Fund | Annual Report 2019
| 9 |
Portfolio of Investments (continued)
February 28, 2019
| Common Stocks (continued) |
| Issuer | Shares | Value ($) |
| Real Estate 2.6% |
| Equity Real Estate Investment Trusts (REITS) 2.6% |
| American Tower Corp. | 13,400 | 2,360,410 |
| Equity Residential | 41,800 | 3,080,242 |
| Host Hotels & Resorts, Inc. | 202,300 | 3,967,103 |
| Simon Property Group, Inc. | 26,600 | 4,818,856 |
| Total | | 14,226,611 |
| Total Real Estate | 14,226,611 |
| Utilities 3.3% |
| Electric Utilities 0.8% |
| Exelon Corp. | 91,400 | 4,441,126 |
| Independent Power and Renewable Electricity Producers 1.4% |
| AES Corp. (The) | 220,500 | 3,799,215 |
| NRG Energy, Inc. | 95,200 | 3,967,936 |
| Total | | 7,767,151 |
| Multi-Utilities 1.1% |
| Ameren Corp. | 7,200 | 512,928 |
| CenterPoint Energy, Inc. | 125,200 | 3,773,528 |
| Public Service Enterprise Group, Inc. | 28,400 | 1,670,204 |
| Total | | 5,956,660 |
| Total Utilities | 18,164,937 |
Total Common Stocks
(Cost $411,989,359) | 525,215,218 |
|
| Money Market Funds 3.6% |
| | Shares | Value ($) |
| Columbia Short-Term Cash Fund, 2.523%(c),(d) | 19,546,020 | 19,544,066 |
Total Money Market Funds
(Cost $19,544,066) | 19,544,066 |
Total Investments in Securities
(Cost: $431,533,425) | 544,759,284 |
| Other Assets & Liabilities, Net | | 716,112 |
| Net Assets | 545,475,396 |
At February 28, 2019, securities and/or cash totaling $649,774 were pledged as collateral.
Investments in derivatives
| Long futures contracts |
| Description | Number of
contracts | Expiration
date | Trading
currency | Notional
amount | Value/Unrealized
appreciation ($) | Value/Unrealized
depreciation ($) |
| S&P 500 E-mini | 149 | 03/2019 | USD | 20,746,015 | 1,013,970 | — |
Notes to Portfolio of Investments
| (a) | Non-income producing investment. |
| (b) | This security or a portion of this security has been pledged as collateral in connection with derivative contracts. |
| (c) | The rate shown is the seven-day current annualized yield at February 28, 2019. |
The accompanying Notes to Financial Statements are an integral part of this statement.
| 10 | Columbia Large Cap Enhanced Core Fund | Annual Report 2019 |
Portfolio of Investments (continued)
February 28, 2019
Notes to Portfolio of Investments (continued)
| (d) | As defined in the Investment Company Act of 1940, an affiliated company is one in which the Fund owns 5% or more of the company’s outstanding voting securities, or a company which is under common ownership or control with the Fund. Holdings and transactions in these affiliated companies during the year ended February 28, 2019 are as follows: |
| Issuer | Beginning
shares | Shares
purchased | Shares
sold | Ending
shares | Realized gain
(loss) —
affiliated
issuers ($) | Net change in
unrealized
appreciation
(depreciation) —
affiliated
issuers ($) | Dividends —
affiliated
issuers ($) | Value —
affiliated
issuers
at end of
period ($) |
| Columbia Short-Term Cash Fund, 2.523% |
| | 14,323,611 | 260,317,911 | (255,095,502) | 19,546,020 | (1,373) | 1,026 | 244,024 | 19,544,066 |
Currency Legend
Fair value measurements
The Fund categorizes its fair value measurements according to a three-level hierarchy that maximizes the use of observable inputs and minimizes the use of unobservable inputs by prioritizing that the most observable input be used when available. Observable inputs are those that market participants would use in pricing an investment based on market data obtained from sources independent of the reporting entity. Unobservable inputs are those that reflect the Fund’s assumptions about the information market participants would use in pricing an investment. An investment’s level within the fair value hierarchy is based on the lowest level of any input that is deemed significant to the asset’s or liability’s fair value measurement. The input levels are not necessarily an indication of the risk or liquidity associated with investments at that level. For example, certain U.S. government securities are generally high quality and liquid, however, they are reflected as Level 2 because the inputs used to determine fair value may not always be quoted prices in an active market.
Fair value inputs are summarized in the three broad levels listed below:
| ■ | Level 1 — Valuations based on quoted prices for investments in active markets that the Fund has the ability to access at the measurement date. Valuation adjustments are not applied to Level 1 investments. |
| ■ | Level 2 — Valuations based on other significant observable inputs (including quoted prices for similar securities, interest rates, prepayment speeds, credit risks, etc.). |
| ■ | Level 3 — Valuations based on significant unobservable inputs (including the Fund’s own assumptions and judgment in determining the fair value of investments). |
Inputs that are used in determining fair value of an investment may include price information, credit data, volatility statistics, and other factors. These inputs can be either observable or unobservable. The availability of observable inputs can vary between investments, and is affected by various factors such as the type of investment, and the volume and level of activity for that investment or similar investments in the marketplace. The inputs will be considered by the Investment Manager, along with any other relevant factors in the calculation of an investment’s fair value. The Fund uses prices and inputs that are current as of the measurement date, which may include periods of market dislocations. During these periods, the availability of prices and inputs may be reduced for many investments. This condition could cause an investment to be reclassified between the various levels within the hierarchy.
Certain investments that have been measured at fair value using the net asset value (NAV) per share (or its equivalent) are not categorized in the fair value hierarchy. The fair value amounts presented in the table are intended to reconcile the fair value hierarchy to the amounts presented in the Portfolio of Investments. The Columbia Short-Term Cash Fund seeks to provide shareholders with maximum current income consistent with liquidity and stability of principal. Columbia Short-Term Cash Fund prices its shares with a floating NAV and no longer seeks to maintain a stable NAV.
Investments falling into the Level 3 category are primarily supported by quoted prices from brokers and dealers participating in the market for those investments. However, these may be classified as Level 3 investments due to lack of market transparency and corroboration to support these quoted prices. Additionally, valuation models may be used as the pricing source for any remaining investments classified as Level 3. These models may rely on one or more significant unobservable inputs and/or significant assumptions by the Investment Manager. Inputs used in valuations may include, but are not limited to, financial statement analysis, capital account balances, discount rates and estimated cash flows, and comparable company data.
Under the direction of the Fund’s Board of Trustees (the Board), the Investment Manager’s Valuation Committee (the Committee) is responsible for overseeing the valuation procedures approved by the Board. The Committee consists of voting and non-voting members from various groups within the Investment Manager’s organization, including operations and accounting, trading and investments, compliance, risk management and legal.
The Committee meets at least monthly to review and approve valuation matters, which may include a description of specific valuation determinations, data regarding pricing information received from approved pricing vendors and brokers and the results of Board-approved valuation control policies and procedures (the Policies). The Policies address, among other things, instances when market quotations are or are not readily available, including recommendations of third party pricing vendors and a determination of appropriate pricing methodologies; events that require specific valuation determinations and assessment of fair value techniques; securities with a potential for stale pricing, including those that are illiquid, restricted, or in default; and the effectiveness of third party pricing vendors, including periodic reviews of vendors. The Committee meets more frequently, as needed, to discuss additional valuation matters, which may include the need to review back-testing results, review time-sensitive information or approve related valuation actions. The Committee reports to the Board, with members of the Committee meeting with the Board at each of its regularly scheduled meetings to discuss valuation matters and actions during the period, similar to those described earlier.
For investments categorized as Level 3, the Committee monitors information similar to that described above, which may include: (i) data specific to the issuer or comparable issuers, (ii) general market or specific sector news and (iii) quoted prices and specific or similar security transactions. The Committee considers this data and any changes from prior periods in order to assess the reasonableness of observable and unobservable inputs, any assumptions or internal models used to value those securities and changes in fair value. This data is also used to corroborate, when available, information received from approved pricing vendors and brokers. Various factors impact the frequency of monitoring this information (which may occur as often as daily). However, the Committee may determine that changes to inputs, assumptions and models are not required as a result of the monitoring procedures performed.
The accompanying Notes to Financial Statements are an integral part of this statement.
Columbia Large Cap Enhanced Core Fund | Annual Report 2019
| 11 |
Portfolio of Investments (continued)
February 28, 2019
Fair value measurements (continued)
The following table is a summary of the inputs used to value the Fund’s investments at February 28, 2019:
| | Level 1
quoted prices
in active
markets for
identical
assets ($) | Level 2
other
significant
observable
inputs ($) | Level 3
significant
unobservable
inputs ($) | Investments
measured at
net asset
value ($) | Total ($) |
| Investments in Securities | | | | | |
| Common Stocks | | | | | |
| Communication Services | 53,558,474 | — | — | — | 53,558,474 |
| Consumer Discretionary | 49,357,598 | — | — | — | 49,357,598 |
| Consumer Staples | 39,768,132 | — | — | — | 39,768,132 |
| Energy | 26,580,443 | — | — | — | 26,580,443 |
| Financials | 68,995,560 | — | — | — | 68,995,560 |
| Health Care | 80,345,713 | — | — | — | 80,345,713 |
| Industrials | 52,571,786 | — | — | — | 52,571,786 |
| Information Technology | 109,410,396 | — | — | — | 109,410,396 |
| Materials | 12,235,568 | — | — | — | 12,235,568 |
| Real Estate | 14,226,611 | — | — | — | 14,226,611 |
| Utilities | 18,164,937 | — | — | — | 18,164,937 |
| Total Common Stocks | 525,215,218 | — | — | — | 525,215,218 |
| Money Market Funds | — | — | — | 19,544,066 | 19,544,066 |
| Total Investments in Securities | 525,215,218 | — | — | 19,544,066 | 544,759,284 |
| Investments in Derivatives | | | | | |
| Asset | | | | | |
| Futures Contracts | 1,013,970 | — | — | — | 1,013,970 |
| Total | 526,229,188 | — | — | 19,544,066 | 545,773,254 |
See the Portfolio of Investments for all investment classifications not indicated in the table.
Derivative instruments are valued at unrealized appreciation (depreciation).
There were no transfers of financial assets between levels during the period.
The accompanying Notes to Financial Statements are an integral part of this statement.
| 12 | Columbia Large Cap Enhanced Core Fund | Annual Report 2019 |
Statement of Assets and Liabilities
February 28, 2019
| Assets | |
| Investments in securities, at value | |
| Unaffiliated issuers (cost $411,989,359) | $525,215,218 |
| Affiliated issuers (cost $19,544,066) | 19,544,066 |
| Receivable for: | |
| Capital shares sold | 230,327 |
| Dividends | 1,062,823 |
| Foreign tax reclaims | 4,674 |
| Expense reimbursement due from Investment Manager | 4,406 |
| Prepaid expenses | 1,547 |
| Total assets | 546,063,061 |
| Liabilities | |
| Payable for: | |
| Capital shares purchased | 324,107 |
| Variation margin for futures contracts | 37,568 |
| Management services fees | 11,021 |
| Distribution and/or service fees | 1,250 |
| Transfer agent fees | 63,428 |
| Compensation of board members | 105,098 |
| Compensation of chief compliance officer | 5 |
| Audit fees | 31,050 |
| Other expenses | 14,138 |
| Total liabilities | 587,665 |
| Net assets applicable to outstanding capital stock | $545,475,396 |
| Represented by | |
| Paid in capital | 430,468,261 |
| Total distributable earnings (loss) (Note 2) | 115,007,135 |
| Total - representing net assets applicable to outstanding capital stock | $545,475,396 |
| Class A | |
| Net assets | $75,496,865 |
| Shares outstanding | 3,209,669 |
| Net asset value per share | $23.52 |
| Advisor Class | |
| Net assets | $5,222,147 |
| Shares outstanding | 224,808 |
| Net asset value per share | $23.23 |
| Institutional Class | |
| Net assets | $329,586,509 |
| Shares outstanding | 14,044,484 |
| Net asset value per share | $23.47 |
| Institutional 2 Class | |
| Net assets | $26,349,488 |
| Shares outstanding | 1,127,729 |
| Net asset value per share | $23.37 |
| Institutional 3 Class | |
| Net assets | $55,689,408 |
| Shares outstanding | 2,373,088 |
| Net asset value per share | $23.47 |
| Class R | |
| Net assets | $53,130,979 |
| Shares outstanding | 2,263,102 |
| Net asset value per share | $23.48 |
The accompanying Notes to Financial Statements are an integral part of this statement.
Columbia Large Cap Enhanced Core Fund | Annual Report 2019
| 13 |
Statement of Operations
Year Ended February 28, 2019
| Net investment income | |
| Income: | |
| Dividends — unaffiliated issuers | $8,599,266 |
| Dividends — affiliated issuers | 244,024 |
| Interfund lending | 386 |
| Total income | 8,843,676 |
| Expenses: | |
| Management services fees | 3,215,491 |
| Distribution and/or service fees | |
| Class A | 163,815 |
| Class R | 216,564 |
| Transfer agent fees | |
| Class A | 105,911 |
| Advisor Class | 4,861 |
| Institutional Class | 425,873 |
| Institutional 2 Class | 8,924 |
| Institutional 3 Class | 3,776 |
| Class R | 70,084 |
| Compensation of board members | 12,744 |
| Custodian fees | 11,059 |
| Printing and postage fees | 29,500 |
| Registration fees | 112,196 |
| Audit fees | 33,050 |
| Legal fees | 10,384 |
| Compensation of chief compliance officer | 87 |
| Other | 14,251 |
| Total expenses | 4,438,570 |
| Fees waived or expenses reimbursed by Investment Manager and its affiliates | (1,384,108) |
| Total net expenses | 3,054,462 |
| Net investment income | 5,789,214 |
| Realized and unrealized gain (loss) — net | |
| Net realized gain (loss) on: | |
| Investments — unaffiliated issuers | 28,359,153 |
| Investments — affiliated issuers | (1,373) |
| Futures contracts | (1,306,026) |
| Net realized gain | 27,051,754 |
| Net change in unrealized appreciation (depreciation) on: | |
| Investments — unaffiliated issuers | (8,213,696) |
| Investments — affiliated issuers | 1,026 |
| Futures contracts | 539,300 |
| Net change in unrealized appreciation (depreciation) | (7,673,370) |
| Net realized and unrealized gain | 19,378,384 |
| Net increase in net assets resulting from operations | $25,167,598 |
The accompanying Notes to Financial Statements are an integral part of this statement.
| 14 | Columbia Large Cap Enhanced Core Fund | Annual Report 2019 |
Statement of Changes in Net Assets
| | Year Ended
February 28, 2019 | Year Ended
February 28, 2018 |
| Operations | | |
| Net investment income | $5,789,214 | $5,850,194 |
| Net realized gain | 27,051,754 | 50,769,434 |
| Net change in unrealized appreciation (depreciation) | (7,673,370) | 15,241,732 |
| Net increase in net assets resulting from operations | 25,167,598 | 71,861,360 |
| Distributions to shareholders | | |
| Net investment income and net realized gains | | |
| Class A | (6,770,212) | |
| Advisor Class | (433,283) | |
| Institutional Class | (27,350,744) | |
| Institutional 2 Class | (1,476,257) | |
| Institutional 3 Class | (4,260,470) | |
| Class R | (4,770,255) | |
| Net investment income | | |
| Class A | | (778,745) |
| Advisor Class | | (9,034) |
| Institutional Class | | (3,990,772) |
| Institutional 2 Class | | (170,715) |
| Institutional 3 Class | | (337,867) |
| Class R | | (388,883) |
| Net realized gains | | |
| Class A | | (6,844,706) |
| Advisor Class | | (61,423) |
| Institutional Class | | (29,395,242) |
| Institutional 2 Class | | (1,167,063) |
| Institutional 3 Class | | (2,428,190) |
| Class R | | (4,234,624) |
| Total distributions to shareholders (Note 2) | (45,061,221) | (49,807,264) |
| Increase (decrease) in net assets from capital stock activity | 165,302,223 | (18,343,467) |
| Total increase in net assets | 145,408,600 | 3,710,629 |
| Net assets at beginning of year | 400,066,796 | 396,356,167 |
| Net assets at end of year | $545,475,396 | $400,066,796 |
| Undistributed (excess of distributions over) net investment income | $(103,908) | $596,908 |
The accompanying Notes to Financial Statements are an integral part of this statement.
Columbia Large Cap Enhanced Core Fund | Annual Report 2019
| 15 |
Statement of Changes in Net Assets (continued)
| | Year Ended | Year Ended |
| | February 28, 2019 | February 28, 2018 |
| | Shares | Dollars ($) | Shares | Dollars ($) |
| Capital stock activity |
| Class A | | | | |
| Subscriptions | 1,222,867 | 28,928,382 | 400,829 | 9,879,467 |
| Distributions reinvested | 241,051 | 5,644,252 | 260,995 | 6,274,910 |
| Redemptions | (662,483) | (15,851,999) | (1,571,086) | (38,358,017) |
| Net increase (decrease) | 801,435 | 18,720,635 | (909,262) | (22,203,640) |
| Advisor Class | | | | |
| Subscriptions | 309,941 | 7,487,315 | 38,345 | 927,521 |
| Distributions reinvested | 19,095 | 432,974 | 2,944 | 70,077 |
| Redemptions | (130,912) | (2,830,909) | (25,629) | (612,922) |
| Net increase | 198,124 | 5,089,380 | 15,660 | 384,676 |
| Class I | | | | |
| Redemptions | — | — | (454,904) | (10,723,764) |
| Net decrease | — | — | (454,904) | (10,723,764) |
| Institutional Class | | | | |
| Subscriptions | 6,180,535 | 140,039,331 | 1,518,335 | 37,092,703 |
| Distributions reinvested | 451,353 | 10,534,985 | 393,096 | 9,433,249 |
| Redemptions | (2,996,785) | (69,994,395) | (2,280,542) | (55,947,390) |
| Net increase (decrease) | 3,635,103 | 80,579,921 | (369,111) | (9,421,438) |
| Institutional 2 Class | | | | |
| Subscriptions | 831,351 | 18,729,881 | 212,420 | 5,231,812 |
| Distributions reinvested | 63,602 | 1,475,923 | 55,939 | 1,337,369 |
| Redemptions | (227,104) | (5,194,636) | (107,276) | (2,623,687) |
| Net increase | 667,849 | 15,011,168 | 161,083 | 3,945,494 |
| Institutional 3 Class | | | | |
| Subscriptions | 3,355,471 | 79,354,896 | 1,765,484 | 43,060,637 |
| Distributions reinvested | 183,442 | 4,255,865 | 115,226 | 2,762,074 |
| Redemptions | (2,289,680) | (55,563,737) | (967,850) | (24,287,771) |
| Net increase | 1,249,233 | 28,047,024 | 912,860 | 21,534,940 |
| Class R | | | | |
| Subscriptions | 1,262,838 | 30,559,259 | 575,462 | 14,169,766 |
| Distributions reinvested | 136,826 | 3,180,125 | 96,196 | 2,308,217 |
| Redemptions | (661,854) | (15,885,289) | (744,144) | (18,337,718) |
| Net increase (decrease) | 737,810 | 17,854,095 | (72,486) | (1,859,735) |
| Total net increase (decrease) | 7,289,554 | 165,302,223 | (716,160) | (18,343,467) |
The accompanying Notes to Financial Statements are an integral part of this statement.
| 16 | Columbia Large Cap Enhanced Core Fund | Annual Report 2019 |
[THIS PAGE INTENTIONALLY LEFT BLANK]
Columbia Large Cap Enhanced Core Fund | Annual Report 2019
| 17 |
The following table is intended to help you understand the Fund’s financial performance. Certain information reflects financial results for a single share of a class held for the periods shown. Per share net investment income (loss) amounts are calculated based on average shares outstanding during the period. Total return assumes reinvestment of all dividends and distributions, if any. Total return does not reflect payment of sales charges, if any. Total return and portfolio turnover are not annualized for periods of less than one year. The portfolio turnover rate is calculated without regard to purchase and sales transactions of short-term instruments and certain derivatives, if any. If such transactions were included, the Fund’s portfolio turnover rate may be higher.
| | Net asset value,
beginning of
period | Net
investment
income | Net
realized
and
unrealized
gain (loss) | Total from
investment
operations | Distributions
from net
investment
income | Distributions
from net
realized
gains | Total
distributions to
shareholders |
| Class A |
| Year Ended 2/28/2019 | $25.12 | 0.28 | 0.69 | 0.97 | (0.24) | (2.33) | (2.57) |
| Year Ended 2/28/2018 | $23.81 | 0.32 | 4.16 | 4.48 | (0.32) | (2.85) | (3.17) |
| Year Ended 2/28/2017 | $19.69 | 0.29 | 4.14 | 4.43 | (0.31) | — | (0.31) |
| Year Ended 2/29/2016 | $22.05 | 0.27 | (2.20) | (1.93) | (0.43) | — | (0.43) |
| Year Ended 2/28/2015 | $18.77 | 0.51 | 2.97 | 3.48 | (0.20) | — | (0.20) |
| Advisor Class |
| Year Ended 2/28/2019 | $24.85 | 0.36 | 0.65 | 1.01 | (0.30) | (2.33) | (2.63) |
| Year Ended 2/28/2018 | $23.58 | 0.37 | 4.13 | 4.50 | (0.38) | (2.85) | (3.23) |
| Year Ended 2/28/2017 | $19.49 | 0.36 | 4.09 | 4.45 | (0.36) | — | (0.36) |
| Year Ended 2/29/2016(d) | $21.32 | 0.20 | (1.74) | (1.54) | (0.29) | — | (0.29) |
| Institutional Class |
| Year Ended 2/28/2019 | $25.07 | 0.34 | 0.69 | 1.03 | (0.30) | (2.33) | (2.63) |
| Year Ended 2/28/2018 | $23.77 | 0.38 | 4.15 | 4.53 | (0.38) | (2.85) | (3.23) |
| Year Ended 2/28/2017 | $19.65 | 0.34 | 4.14 | 4.48 | (0.36) | — | (0.36) |
| Year Ended 2/29/2016 | $22.01 | 0.34 | (2.22) | (1.88) | (0.48) | — | (0.48) |
| Year Ended 2/28/2015 | $18.73 | 0.47 | 3.06 | 3.53 | (0.25) | — | (0.25) |
| Institutional 2 Class |
| Year Ended 2/28/2019 | $24.98 | 0.37 | 0.68 | 1.05 | (0.33) | (2.33) | (2.66) |
| Year Ended 2/28/2018 | $23.69 | 0.40 | 4.14 | 4.54 | (0.40) | (2.85) | (3.25) |
| Year Ended 2/28/2017 | $19.58 | 0.36 | 4.13 | 4.49 | (0.38) | — | (0.38) |
| Year Ended 2/29/2016 | $21.93 | 0.37 | (2.22) | (1.85) | (0.50) | — | (0.50) |
| Year Ended 2/28/2015(f) | $19.88 | 0.62 | 1.66 | 2.28 | (0.23) | — | (0.23) |
| Institutional 3 Class |
| Year Ended 2/28/2019 | $25.07 | 0.38 | 0.69 | 1.07 | (0.34) | (2.33) | (2.67) |
| Year Ended 2/28/2018 | $23.77 | 0.44 | 4.13 | 4.57 | (0.42) | (2.85) | (3.27) |
| Year Ended 2/28/2017 | $19.65 | 0.37 | 4.14 | 4.51 | (0.39) | — | (0.39) |
| Year Ended 2/29/2016 | $22.01 | 0.38 | (2.23) | (1.85) | (0.51) | — | (0.51) |
| Year Ended 2/28/2015 | $18.73 | 0.46 | 3.10 | 3.56 | (0.28) | — | (0.28) |
The accompanying Notes to Financial Statements are an integral part of this statement.
| 18 | Columbia Large Cap Enhanced Core Fund | Annual Report 2019 |
Financial Highlights (continued)
| | Net
asset
value,
end of
period | Total
return | Total gross
expense
ratio to
average
net assets(a) | Total net
expense
ratio to
average
net assets(a),(b) | Net investment
income
ratio to
average
net assets | Portfolio
turnover | Net
assets,
end of
period
(000’s) |
| Class A |
| Year Ended 2/28/2019 | $23.52 | 4.14% | 1.21% | 0.89% | 1.17% | 99% | $75,497 |
| Year Ended 2/28/2018 | $25.12 | 19.81% | 1.23% | 0.89% | 1.31% | 70% | $60,502 |
| Year Ended 2/28/2017 | $23.81 | 22.62% | 1.24% | 0.89%(c) | 1.32% | 79% | $79,005 |
| Year Ended 2/29/2016 | $19.69 | (8.94%) | 1.25% | 0.90% | 1.27% | 89% | $75,126 |
| Year Ended 2/28/2015 | $22.05 | 18.60% | 1.27% | 0.90%(c) | 2.51% | 91% | $85,261 |
| Advisor Class |
| Year Ended 2/28/2019 | $23.23 | 4.38% | 0.96% | 0.64% | 1.53% | 99% | $5,222 |
| Year Ended 2/28/2018 | $24.85 | 20.12% | 0.98% | 0.64% | 1.48% | 70% | $663 |
| Year Ended 2/28/2017 | $23.58 | 22.98% | 0.99% | 0.64%(c) | 1.64% | 79% | $260 |
| Year Ended 2/29/2016(d) | $19.49 | (7.31%) | 1.01%(e) | 0.65%(e) | 1.49%(e) | 89% | $120 |
| Institutional Class |
| Year Ended 2/28/2019 | $23.47 | 4.42% | 0.96% | 0.64% | 1.41% | 99% | $329,587 |
| Year Ended 2/28/2018 | $25.07 | 20.08% | 0.98% | 0.64% | 1.56% | 70% | $260,985 |
| Year Ended 2/28/2017 | $23.77 | 22.94% | 0.99% | 0.64%(c) | 1.57% | 79% | $256,195 |
| Year Ended 2/29/2016 | $19.65 | (8.73%) | 1.00% | 0.65% | 1.61% | 89% | $299,136 |
| Year Ended 2/28/2015 | $22.01 | 18.92% | 1.02% | 0.65%(c) | 2.32% | 91% | $330,450 |
| Institutional 2 Class |
| Year Ended 2/28/2019 | $23.37 | 4.50% | 0.87% | 0.54% | 1.56% | 99% | $26,349 |
| Year Ended 2/28/2018 | $24.98 | 20.20% | 0.87% | 0.55% | 1.63% | 70% | $11,486 |
| Year Ended 2/28/2017 | $23.69 | 23.08% | 0.86% | 0.56% | 1.66% | 79% | $7,078 |
| Year Ended 2/29/2016 | $19.58 | (8.62%) | 0.84% | 0.55% | 1.78% | 89% | $2,969 |
| Year Ended 2/28/2015(f) | $21.93 | 11.49% | 0.88%(e) | 0.55%(e) | 4.41%(e) | 91% | $424 |
| Institutional 3 Class |
| Year Ended 2/28/2019 | $23.47 | 4.58% | 0.81% | 0.49% | 1.61% | 99% | $55,689 |
| Year Ended 2/28/2018 | $25.07 | 20.24% | 0.82% | 0.50% | 1.77% | 70% | $28,180 |
| Year Ended 2/28/2017 | $23.77 | 23.11% | 0.81% | 0.51% | 1.71% | 79% | $5,016 |
| Year Ended 2/29/2016 | $19.65 | (8.59%) | 0.80% | 0.50% | 1.79% | 89% | $2,520 |
| Year Ended 2/28/2015 | $22.01 | 19.08% | 0.81% | 0.50% | 2.30% | 91% | $3,511 |
The accompanying Notes to Financial Statements are an integral part of this statement.
Columbia Large Cap Enhanced Core Fund | Annual Report 2019
| 19 |
Financial Highlights (continued)
| | Net asset value,
beginning of
period | Net
investment
income | Net
realized
and
unrealized
gain (loss) | Total from
investment
operations | Distributions
from net
investment
income | Distributions
from net
realized
gains | Total
distributions to
shareholders |
| Class R |
| Year Ended 2/28/2019 | $25.08 | 0.22 | 0.69 | 0.91 | (0.18) | (2.33) | (2.51) |
| Year Ended 2/28/2018 | $23.78 | 0.26 | 4.15 | 4.41 | (0.26) | (2.85) | (3.11) |
| Year Ended 2/28/2017 | $19.66 | 0.23 | 4.15 | 4.38 | (0.26) | — | (0.26) |
| Year Ended 2/29/2016 | $22.02 | 0.25 | (2.24) | (1.99) | (0.37) | — | (0.37) |
| Year Ended 2/28/2015 | $18.75 | 0.43 | 2.99 | 3.42 | (0.15) | — | (0.15) |
| Notes to Financial Highlights |
| (a) | In addition to the fees and expenses that the Fund bears directly, the Fund indirectly bears a pro rata share of the fees and expenses of any other funds in which it invests. Such indirect expenses are not included in the Fund’s reported expense ratios. |
| (b) | Total net expenses include the impact of certain fee waivers/expense reimbursements made by the Investment Manager and certain of its affiliates, if applicable. |
| (c) | The benefits derived from expense reductions had an impact of less than 0.01%. |
| (d) | Advisor Class shares commenced operations on July 1, 2015. Per share data and total return reflect activity from that date. |
| (e) | Annualized. |
| (f) | Institutional 2 Class shares commenced operations on June 25, 2014. Per share data and total return reflect activity from that date. |
The accompanying Notes to Financial Statements are an integral part of this statement.
| 20 | Columbia Large Cap Enhanced Core Fund | Annual Report 2019 |
Financial Highlights (continued)
| | Net
asset
value,
end of
period | Total
return | Total gross
expense
ratio to
average
net assets(a) | Total net
expense
ratio to
average
net assets(a),(b) | Net investment
income
ratio to
average
net assets | Portfolio
turnover | Net
assets,
end of
period
(000’s) |
| Class R |
| Year Ended 2/28/2019 | $23.48 | 3.88% | 1.46% | 1.14% | 0.93% | 99% | $53,131 |
| Year Ended 2/28/2018 | $25.08 | 19.51% | 1.48% | 1.14% | 1.06% | 70% | $38,251 |
| Year Ended 2/28/2017 | $23.78 | 22.36% | 1.49% | 1.14%(c) | 1.08% | 79% | $37,996 |
| Year Ended 2/29/2016 | $19.66 | (9.18%) | 1.51% | 1.15% | 1.20% | 89% | $29,687 |
| Year Ended 2/28/2015 | $22.02 | 18.30% | 1.52% | 1.15%(c) | 2.08% | 91% | $23,414 |
The accompanying Notes to Financial Statements are an integral part of this statement.
Columbia Large Cap Enhanced Core Fund | Annual Report 2019
| 21 |
Notes to Financial Statements
February 28, 2019
Note 1. Organization
Columbia Large Cap Enhanced Core Fund (the Fund), a series of Columbia Funds Series Trust (the Trust), is a diversified fund. The Trust is registered under the Investment Company Act of 1940, as amended (the 1940 Act), as an open-end management investment company organized as a Delaware statutory trust.
Fund shares
The Trust may issue an unlimited number of shares (without par value). Although all share classes generally have identical voting, dividend and liquidation rights, each share class votes separately when required by the Trust’s organizational documents or by law. Different share classes pay different distribution amounts to the extent the expenses of such share classes differ, and distributions in liquidation will be proportional to the net asset value of each share class. Each share class has its own expense and sales charge structure. The Fund offers each of the share classes identified below.
Class A shares are not subject to any front-end sales charge or contingent deferred sales charge.
Advisor Class shares are not subject to sales charges and are generally available only to omnibus retirement plans and certain investors as described in the Fund’s prospectus.
Institutional Class shares are not subject to sales charges and are generally available only to eligible investors, which are subject to different investment minimums as described in the Fund’s prospectus.
Institutional 2 Class shares are not subject to sales charges and are generally available only to investors purchasing through authorized investment professionals and omnibus retirement plans as described in the Fund’s prospectus.
Institutional 3 Class shares are not subject to sales charges and are available to institutional and certain other investors as described in the Fund’s prospectus.
Class R shares are not subject to sales charges and are generally available only to certain retirement plans and other investors as described in the Fund’s prospectus.
Note 2. Summary of significant accounting policies
Basis of preparation
The Fund is an investment company that applies the accounting and reporting guidance in the Financial Accounting Standards Board (FASB) Accounting Standards Codification Topic 946,Financial Services - Investment Companies (ASC 946). The financial statements are prepared in accordance with U.S. generally accepted accounting principles (GAAP), which requires management to make certain estimates and assumptions that affect the reported amounts of assets and liabilities, the disclosure of contingent assets and liabilities at the date of the financial statements and the reported amounts of income and expenses during the reporting period. Actual results could differ from those estimates.
The following is a summary of significant accounting policies followed by the Fund in the preparation of its financial statements.
Security valuation
All equity securities are valued at the close of business of the New York Stock Exchange. Equity securities are valued at the last quoted sales price on the principal exchange or market on which they trade, except for securities traded on the NASDAQ Stock Market, which are valued at the NASDAQ official close price. Unlisted securities or listed securities for which there were no sales during the day are valued at the mean of the latest quoted bid and ask prices on such exchanges or markets.
Foreign equity securities are valued based on the closing price on the foreign exchange in which such securities are primarily traded. If any foreign equity security closing prices are not readily available, the securities are valued at the mean of the latest quoted bid and ask prices on such exchanges or markets. Foreign currency exchange rates are generally determined at 4:00 p.m. Eastern (U.S.) time. Many securities markets and exchanges outside the U.S. close prior to the close of the New York Stock Exchange; therefore, the closing prices for securities in such markets or on such exchanges may not fully reflect events that occur after such close but before the close of the New York Stock Exchange. In those situations, foreign
| 22 | Columbia Large Cap Enhanced Core Fund | Annual Report 2019 |
Notes to Financial Statements (continued)
February 28, 2019
securities will be fair valued pursuant to a policy adopted by the Board of Trustees, including, if available, utilizing a third party pricing service to determine these fair values. The third party pricing service takes into account multiple factors, including, but not limited to, movements in the U.S. securities markets, certain depositary receipts, futures contracts and foreign exchange rates that have occurred subsequent to the close of the foreign exchange or market, to determine a good faith estimate that reasonably reflects the current market conditions as of the close of the New York Stock Exchange. The fair value of a security is likely to be different from the quoted or published price, if available.
Investments in open-end investment companies, including money market funds, are valued at their latest net asset value.
Futures and options on futures contracts are valued based upon the settlement price at the close of regular trading on their principal exchanges or, in the absence of transactions, at the mean of the latest quoted bid and ask prices.
Investments for which market quotations are not readily available, or that have quotations which management believes are not reflective of market value or reliable, are valued at fair value as determined in good faith under procedures approved by and under the general supervision of the Board of Trustees. If a security or class of securities (such as foreign securities) is valued at fair value, such value is likely to be different from the quoted or published price for the security.
The determination of fair value often requires significant judgment. To determine fair value, management may use assumptions including but not limited to future cash flows and estimated risk premiums. Multiple inputs from various sources may be used to determine fair value.
GAAP requires disclosure regarding the inputs and valuation techniques used to measure fair value and any changes in valuation inputs or techniques. In addition, investments shall be disclosed by major category. This information is disclosed following the Fund’s Portfolio of Investments.
Derivative instruments
The Fund invests in certain derivative instruments, as detailed below, to meet its investment objectives. Derivatives are instruments whose values depend on, or are derived from, in whole or in part, the value of one or more securities, currencies, commodities, indices, or other assets or instruments. Derivatives may be used to increase investment flexibility (including to maintain cash reserves while maintaining desired exposure to certain assets), for risk management (hedging) purposes, to facilitate trading, to reduce transaction costs and to pursue higher investment returns. The Fund may also use derivative instruments to mitigate certain investment risks, such as foreign currency exchange rate risk, interest rate risk and credit risk. Derivatives may involve various risks, including the potential inability of the counterparty to fulfill its obligations under the terms of the contract, the potential for an illiquid secondary market (making it difficult for the Fund to sell or terminate, including at favorable prices) and the potential for market movements which may expose the Fund to gains or losses in excess of the amount shown in the Statement of Assets and Liabilities. The notional amounts of derivative instruments, if applicable, are not recorded in the financial statements.
A derivative instrument may suffer a marked-to-market loss if the value of the contract decreases due to an unfavorable change in the market rates or values of the underlying instrument. Losses can also occur if the counterparty does not perform its obligations under the contract. The Fund’s risk of loss from counterparty credit risk on over-the-counter derivatives is generally limited to the aggregate unrealized gain netted against any collateral held by the Fund and the amount of any variation margin held by the counterparty, plus any replacement costs or related amounts. With exchange-traded or centrally cleared derivatives, there is reduced counterparty credit risk to the Fund since the clearinghouse or central counterparty (CCP) provides some protection in the case of clearing member default. The clearinghouse or CCP stands between the buyer and the seller of the contract; therefore, additional counterparty credit risk is failure of the clearinghouse or CCP. However, credit risk still exists in exchange-traded or centrally cleared derivatives with respect to initial and variation margin that is held in a broker’s customer account. While brokers are required to segregate customer margin from their own assets, in the event that a broker becomes insolvent or goes into bankruptcy and at that time there is a shortfall in the aggregate amount of margin held by the broker for all its clients, U.S. bankruptcy laws will typically allocate that shortfall on a pro-rata basis across all the broker’s customers (including the Fund), potentially resulting in losses to the Fund.
Columbia Large Cap Enhanced Core Fund | Annual Report 2019
| 23 |
Notes to Financial Statements (continued)
February 28, 2019
In order to better define its contractual rights and to secure rights that will help the Fund mitigate its counterparty risk, the Fund may enter into an International Swaps and Derivatives Association, Inc. Master Agreement (ISDA Master Agreement) or similar agreement with its derivatives contract counterparties. An ISDA Master Agreement is an agreement between the Fund and a counterparty that governs over-the-counter derivatives and typically contains, among other things, collateral posting terms and netting provisions in the event of a default and/or termination event. Under an ISDA Master Agreement, the Fund may, under certain circumstances, offset with the counterparty certain derivative instrument’s payables and/or receivables with collateral held and/or posted and create one single net payment. The provisions of the ISDA Master Agreement typically permit a single net payment in the event of default (close-out netting), including the bankruptcy or insolvency of the counterparty. Note, however, that bankruptcy or insolvency laws of a particular jurisdiction may impose restrictions on or prohibitions against the right of offset or netting in bankruptcy, insolvency or other events.
Collateral (margin) requirements differ by type of derivative. Margin requirements are established by the clearinghouse or CCP for exchange-traded and centrally cleared derivatives. Brokers can ask for margin in excess of the minimum in certain circumstances. Collateral terms are contract specific for over-the-counter derivatives. For over-the-counter derivatives traded under an ISDA Master Agreement, the collateral requirements are typically calculated by netting the marked-to-market amount for each transaction under such agreement and comparing that amount to the value of any variation margin currently pledged by the Fund and/or the counterparty. Generally, the amount of collateral due from or to a party has to exceed a minimum transfer amount threshold (e.g., $250,000) before a transfer has to be made. To the extent amounts due to the Fund from its counterparties are not fully collateralized, contractually or otherwise, the Fund bears the risk of loss from counterparty nonperformance. The Fund may also pay interest expense on cash collateral received from the broker. Any interest expense paid by the Fund is shown on the Statement of Operations. The Fund attempts to mitigate counterparty risk by only entering into agreements with counterparties that it believes have the financial resources to honor their obligations and by monitoring the financial stability of those counterparties.
Certain ISDA Master Agreements allow counterparties of over-the-counter derivatives transactions to terminate derivatives contracts prior to maturity in the event the Fund’s net asset value declines by a stated percentage over a specified time period or if the Fund fails to meet certain terms of the ISDA Master Agreement, which would cause the Fund to accelerate payment of any net liability owed to the counterparty. The Fund also has termination rights if the counterparty fails to meet certain terms of the ISDA Master Agreement. In determining whether to exercise such termination rights, the Fund would consider, in addition to counterparty credit risk, whether termination would result in a net liability owed from the counterparty.
For financial reporting purposes, the Fund does not offset derivative assets and derivative liabilities that are subject to netting arrangements in the Statement of Assets and Liabilities.
Futures contracts
Futures contracts are exchange-traded and represent commitments for the future purchase or sale of an asset at a specified price on a specified date. The Fund bought and sold futures contracts to maintain appropriate equity market exposure while keeping sufficient cash to accommodate daily redemptions. These instruments may be used for other purposes in future periods. Upon entering into futures contracts, the Fund bears risks that it may not achieve the anticipated benefits of the futures contracts and may realize a loss. Additional risks include counterparty credit risk, the possibility of an illiquid market, and that a change in the value of the contract or option may not correlate with changes in the value of the underlying asset.
Upon entering into a futures contract, the Fund deposits cash or securities with the broker, known as a futures commission merchant (FCM), in an amount sufficient to meet the initial margin requirement. The initial margin deposit must be maintained at an established level over the life of the contract. Cash deposited as initial margin is recorded in the Statement of Assets and Liabilities as margin deposits. Securities deposited as initial margin are designated in the Portfolio of Investments. Subsequent payments (variation margin) are made or received by the Fund each day. The variation margin payments are equal to the daily change in the contract value and are recorded as variation margin receivable or payable and are offset in unrealized gains or losses. The Fund recognizes a realized gain or loss when the contract is closed or expires. Futures contracts involve, to varying degrees, risk of loss in excess of the variation margin disclosed in the Statement of Assets and Liabilities.
| 24 | Columbia Large Cap Enhanced Core Fund | Annual Report 2019 |
Notes to Financial Statements (continued)
February 28, 2019
Effects of derivative transactions in the financial statements
The following tables are intended to provide additional information about the effect of derivatives on the financial statements of the Fund, including: the fair value of derivatives by risk category and the location of those fair values in the Statement of Assets and Liabilities; and the impact of derivative transactions over the period in the Statement of Operations, including realized and unrealized gains (losses). The derivative instrument schedules following the Portfolio of Investments present additional information regarding derivative instruments outstanding at the end of the period, if any.
The following table is a summary of the fair value of derivative instruments (not considered to be hedging instruments for accounting disclosure purposes) at February 28, 2019:
| | Asset derivatives | |
Risk exposure
category | Statement
of assets and liabilities
location | Fair value ($) |
| Equity risk | Component of total distributable earnings (loss) — unrealized appreciation on futures contracts | 1,013,970* |
| * | Includes cumulative appreciation (depreciation) as reported in the tables following the Portfolio of Investments. Only the current day’s variation margin is reported in receivables or payables in the Statement of Assets and Liabilities. |
The following table indicates the effect of derivative instruments (not considered to be hedging instruments for accounting disclosure purposes) in the Statement of Operations for the year ended February 28, 2019:
| Amount of realized gain (loss) on derivatives recognized in income |
| Risk exposure category | Futures
contracts
($) |
| Equity risk | (1,306,026) |
| |
| Change in unrealized appreciation (depreciation) on derivatives recognized in income |
| Risk exposure category | Futures
contracts
($) |
| Equity risk | 539,300 |
The following table is a summary of the average outstanding volume by derivative instrument for the year ended February 28, 2019:
| Derivative instrument | Average notional
amounts ($)* |
| Futures contracts — long | 10,435,178 |
| * | Based on the ending quarterly outstanding amounts for the year ended February 28, 2019. |
Security transactions
Security transactions are accounted for on the trade date. Cost is determined and gains (losses) are based upon the specific identification method for both financial statement and federal income tax purposes.
Income recognition
Corporate actions and dividend income are generally recorded net of any non-reclaimable tax withholdings, on the ex-dividend date or upon receipt of ex-dividend notification in the case of certain foreign securities.
The Fund may receive distributions from holdings in equity securities, business development companies (BDCs), exchange-traded funds (ETFs), limited partnerships (LPs), other regulated investment companies (RICs), and real estate investment trusts (REITs), which report information on the tax character of their distributions annually. These distributions are allocated to dividend income, capital gain and return of capital based on actual information reported. Return of capital is recorded as a reduction of the cost basis of securities held. If the Fund no longer owns the applicable securities, return of capital is recorded as a realized gain. With respect to REITs, to the extent actual information has not yet been reported,
Columbia Large Cap Enhanced Core Fund | Annual Report 2019
| 25 |
Notes to Financial Statements (continued)
February 28, 2019
estimates for return of capital are made by the Fund’s management. Management’s estimates are subsequently adjusted when the actual character of the distributions is disclosed by the REITs, which could result in a proportionate change in return of capital to shareholders.
Awards from class action litigation are recorded as a reduction of cost basis if the Fund still owns the applicable securities on the payment date. If the Fund no longer owns the applicable securities, the proceeds are recorded as realized gains.
Expenses
General expenses of the Trust are allocated to the Fund and other funds of the Trust based upon relative net assets or other expense allocation methodologies determined by the nature of the expense. Expenses directly attributable to the Fund are charged to the Fund. Expenses directly attributable to a specific class of shares are charged to that share class.
Determination of class net asset value
All income, expenses (other than class-specific expenses, which are charged to that share class, as shown in the Statement of Operations) and realized and unrealized gains (losses) are allocated to each class of the Fund on a daily basis, based on the relative net assets of each class, for purposes of determining the net asset value of each class.
Federal income tax status
The Fund intends to qualify each year as a regulated investment company under Subchapter M of the Internal Revenue Code, as amended, and will distribute substantially all of its investment company taxable income and net capital gain, if any, for its tax year, and as such will not be subject to federal income taxes. In addition, the Fund intends to distribute in each calendar year substantially all of its ordinary income, capital gain net income and certain other amounts, if any, such that the Fund should not be subject to federal excise tax. Therefore, no federal income or excise tax provision is recorded.
Distributions to shareholders
Distributions from net investment income, if any, are declared and paid semi-annually. Net realized capital gains, if any, are distributed at least annually. Income distributions and capital gain distributions are determined in accordance with federal income tax regulations, which may differ from GAAP.
Guarantees and indemnifications
Under the Trust’s organizational documents and, in some cases, by contract, its officers and trustees are indemnified against certain liabilities arising out of the performance of their duties to the Trust or its funds. In addition, certain of the Fund’s contracts with its service providers contain general indemnification clauses. The Fund’s maximum exposure under these arrangements is unknown since the amount of any future claims that may be made against the Fund cannot be determined, and the Fund has no historical basis for predicting the likelihood of any such claims.
Recent accounting pronouncements
Accounting Standards Update 2017-08 Premium Amortization on Purchased Callable Debt Securities
In March 2017, the Financial Accounting Standards Board issued Accounting Standards Update (ASU) No. 2017-08 Premium Amortization on Purchased Callable Debt Securities. ASU No. 2017-08 updates the accounting standards to shorten the amortization period for certain purchased callable debt securities, held at a premium, to be amortized to the earliest call date. The update applies to securities with explicit, noncontingent call features that are callable at fixed prices and on preset dates. The standard is effective for annual periods beginning after December 15, 2018 and interim periods within those fiscal years. Management does not expect the implementation of this guidance to have a material impact on the financial statement amounts and footnote disclosures.
Accounting Standards Update 2018-13 Disclosure Framework - Changes to the Disclosure Requirements for Fair Value Measurement
| 26 | Columbia Large Cap Enhanced Core Fund | Annual Report 2019 |
Notes to Financial Statements (continued)
February 28, 2019
In August 2018, the Financial Accounting Standards Board issued Accounting Standards Update (ASU) No. 2018-13 Disclosure Framework - Changes to the Disclosure Requirements for Fair Value Measurement. ASU No. 2018-13, in addition to other modifications and additions, removes the requirement to disclose the amount and reasons for transfers between Level 1 and Level 2 of the fair value hierarchy and the policy for the timing of transfers between levels. The standard is effective for annual periods beginning after December 15, 2019 and interim periods within those fiscal years. At this time, management is evaluating the implication of this guidance and the impact it will have on the financial statement disclosures, if any.
Disclosure Update and Simplification
In September 2018, the Securities and Exchange Commission (SEC) released Final Rule 33-10532, Disclosure Update and Simplification, which amends certain financial statement disclosure requirements that the SEC determined to be redundant, outdated, or superseded in light of other SEC disclosure requirements, GAAP, or changes in the information environment. As a result of the amendments, management implemented disclosure changes which included removing the components of distributable earnings presented on the Statement of Assets and Liabilities and combining income and gain distributions paid to shareholders as presented on the Statement of Changes in Net Assets. Any values presented to meet prior year requirements were left unchanged. The amendments had no effect on the Fund’s net assets or results of operation.
Note 3. Fees and other transactions with affiliates
Management services fees
The Fund has entered into a Management Agreement with Columbia Management Investment Advisers, LLC (the Investment Manager), a wholly-owned subsidiary of Ameriprise Financial, Inc. (Ameriprise Financial). Under the Management Agreement, the Investment Manager provides the Fund with investment research and advice, as well as administrative and accounting services. The management services fee is an annual fee that is equal to a percentage of the Fund’s daily net assets that declines from 0.75% to 0.55% as the Fund’s net assets increase. The effective management services fee rate for the year ended February 28, 2019 was 0.75% of the Fund’s average daily net assets.
Compensation of board members
Members of the Board of Trustees who are not officers or employees of the Investment Manager or Ameriprise Financial are compensated for their services to the Fund as disclosed in the Statement of Operations. Under a Deferred Compensation Plan (the Deferred Plan), these members of the Board of Trustees may elect to defer payment of up to 100% of their compensation. Deferred amounts are treated as though equivalent dollar amounts had been invested in shares of certain funds managed by the Investment Manager. The Fund’s liability for these amounts is adjusted for market value changes and remains in the Fund until distributed in accordance with the Deferred Plan. All amounts payable under the Deferred Plan constitute a general unsecured obligation of the Fund.
Compensation of Chief Compliance Officer
The Board of Trustees has appointed a Chief Compliance Officer to the Fund in accordance with federal securities regulations. As disclosed in the Statement of Operations, a portion of the Chief Compliance Officer’s total compensation is allocated to the Fund, along with other allocations to affiliated registered investment companies managed by the Investment Manager and its affiliates, based on relative net assets.
Transfer agency fees
Under a Transfer and Dividend Disbursing Agent Agreement, Columbia Management Investment Services Corp. (the Transfer Agent), an affiliate of the Investment Manager and a wholly-owned subsidiary of Ameriprise Financial, is responsible for providing transfer agency services to the Fund. The Transfer Agent has contracted with DST Asset Manager Solutions, Inc. (DST) to serve as sub-transfer agent. The Transfer Agent pays the fees of DST for services as sub-transfer agent and DST is not entitled to reimbursement for such fees from the Fund (with the exception of out-of-pocket fees).
Columbia Large Cap Enhanced Core Fund | Annual Report 2019
| 27 |
Notes to Financial Statements (continued)
February 28, 2019
The Fund pays the Transfer Agent a monthly transfer agency fee based on the number or the average value of accounts, depending on the type of account. In addition, the Fund pays the Transfer Agent a fee for shareholder services based on the number of accounts or on a percentage of the average aggregate value of the Fund’s shares maintained in omnibus accounts up to the lesser of the amount charged by the financial intermediary or a cap established by the Board of Trustees from time to time.
The Transfer Agent also receives compensation from the Fund for various shareholder services and reimbursements for certain out-of-pocket fees. Total transfer agency fees for Institutional 2 Class and Institutional 3 Class shares are subject to an annual limitation of not more than 0.07% and 0.02%, respectively, of the average daily net assets attributable to each share class.
For the year ended February 28, 2019, the Fund’s effective transfer agency fee rates as a percentage of average daily net assets of each class were as follows:
| | Effective rate (%) |
| Class A | 0.16 |
| Advisor Class | 0.16 |
| Institutional Class | 0.16 |
| Institutional 2 Class | 0.06 |
| Institutional 3 Class | 0.01 |
| Class R | 0.16 |
An annual minimum account balance fee of $20 may apply to certain accounts with a value below the applicable share class’s initial minimum investment requirements to reduce the impact of small accounts on transfer agency fees. These minimum account balance fees are remitted to the Fund and recorded as part of expense reductions in the Statement of Operations. For the year ended February 28, 2019, no minimum account balance fees were charged by the Fund.
Distribution and service fees
The Fund has entered into an agreement with Columbia Management Investment Distributors, Inc. (the Distributor), an affiliate of the Investment Manager and a wholly-owned subsidiary of Ameriprise Financial, for distribution and shareholder services. The Board of Trustees has approved, and the Fund has adopted, distribution and shareholder service plans (the Plans) applicable to certain share classes, which set the distribution and service fees for the Fund. These fees are calculated daily and are intended to compensate the Distributor and/or eligible selling and/or servicing agents for selling shares of the Fund and providing services to investors.
Under the Plans, the Fund pays a monthly combined distribution and service fee to the Distributor at the maximum annual rate of 0.25% of the average daily net assets attributable to Class A shares of the Fund. Also under the Plans, the Fund pays a monthly distribution fee to the Distributor at the maximum annual rate of 0.50% of the average daily net assets attributable to Class R shares of the Fund.
| 28 | Columbia Large Cap Enhanced Core Fund | Annual Report 2019 |
Notes to Financial Statements (continued)
February 28, 2019
Expenses waived/reimbursed by the Investment Manager and its affiliates
The Investment Manager and certain of its affiliates have contractually agreed to waive fees and/or reimburse expenses (excluding certain fees and expenses described below) for the period(s) disclosed below, unless sooner terminated at the sole discretion of the Board of Trustees, so that the Fund’s net operating expenses, after giving effect to fees waived/expenses reimbursed and any balance credits and/or overdraft charges from the Fund’s custodian, do not exceed the following annual rate(s) as a percentage of the class’ average daily net assets:
| | July 1, 2018
through
June 30, 2019 | Prior to
July 1, 2018 |
| Class A | 0.89% | 0.89% |
| Advisor Class | 0.64 | 0.64 |
| Institutional Class | 0.64 | 0.64 |
| Institutional 2 Class | 0.54 | 0.565 |
| Institutional 3 Class | 0.49 | 0.515 |
| Class R | 1.14 | 1.14 |
Under the agreement governing these fee waivers and/or expense reimbursement arrangements, the following fees and expenses are excluded from the waiver/reimbursement commitment, and therefore will be paid by the Fund, if applicable: taxes (including foreign transaction taxes), expenses associated with investments in affiliated and non-affiliated pooled investment vehicles (including mutual funds and exchange-traded funds), transaction costs and brokerage commissions, costs related to any securities lending program, dividend expenses associated with securities sold short, inverse floater program fees and expenses, transaction charges and interest on borrowed money, interest, infrequent and/or unusual expenses and any other expenses the exclusion of which is specifically approved by the Board of Trustees. This agreement may be modified or amended only with approval from the Investment Manager, certain of its affiliates and the Fund. Any fees waived and/or expenses reimbursed under the expense reimbursement arrangements described above are not recoverable by the Investment Manager or its affiliates in future periods.
Note 4. Federal tax information
The timing and character of income and capital gain distributions are determined in accordance with income tax regulations, which may differ from GAAP because of temporary or permanent book to tax differences.
At February 28, 2019, these differences were primarily due to differing treatment for deferral/reversal of wash sale losses, re-characterization of distributions for investments, derivative investments, tax straddles, post-October capital losses, trustees’ deferred compensation, distribution reclassifications and earnings and profits distributed to shareholders on the redemption of shares. To the extent these differences were permanent, reclassifications were made among the components of the Fund’s net assets. Temporary differences do not require reclassifications.
The following reclassifications were made:
Excess of distributions
over net investment
income ($) | Accumulated
net realized
gain ($) | Paid in
capital ($) |
| (1,440,461) | (1,049,886) | 2,490,347 |
Net investment income (loss) and net realized gains (losses), as disclosed in the Statement of Operations, and net assets were not affected by this reclassification.
The tax character of distributions paid during the years indicated was as follows:
| Year Ended February 28, 2019 | Year Ended February 28, 2018 |
Ordinary
income ($) | Long-term
capital gains ($) | Total ($) | Ordinary
income ($) | Long-term
capital gains ($) | Total ($) |
| 11,622,238 | 33,438,983 | 45,061,221 | 9,430,119 | 40,377,145 | 49,807,264 |
Columbia Large Cap Enhanced Core Fund | Annual Report 2019
| 29 |
Notes to Financial Statements (continued)
February 28, 2019
Short-term capital gain distributions, if any, are considered ordinary income distributions for tax purposes.
At February 28, 2019, the components of distributable earnings on a tax basis were as follows:
Undistributed
ordinary income ($) | Undistributed
long-term
capital gains ($) | Capital loss
carryforwards ($) | Net unrealized
appreciation ($) |
| — | 8,859,963 | — | 109,987,689 |
At February 28, 2019, the cost of all investments for federal income tax purposes along with the aggregate gross unrealized appreciation and depreciation based on that cost was:
Federal
tax cost ($) | Gross unrealized
appreciation ($) | Gross unrealized
(depreciation) ($) | Net unrealized
appreciation ($) |
| 435,785,565 | 115,451,116 | (5,463,427) | 109,987,689 |
Tax cost of investments and unrealized appreciation/(depreciation) may also include timing differences that do not constitute adjustments to tax basis.
Late year
ordinary losses ($) | Post-October
capital losses ($) |
| — | 3,736,609 |
Management of the Fund has concluded that there are no significant uncertain tax positions in the Fund that would require recognition in the financial statements. However, management’s conclusion may be subject to review and adjustment at a later date based on factors including, but not limited to, new tax laws, regulations, and administrative interpretations (including relevant court decisions). Generally, the Fund’s federal tax returns for the prior three fiscal years remain subject to examination by the Internal Revenue Service.
Note 5. Portfolio information
The cost of purchases and proceeds from sales of securities, excluding short-term investments and derivatives, if any, aggregated to $535,588,518 and $415,618,514, respectively, for the year ended February 28, 2019. The amount of purchase and sale activity impacts the portfolio turnover rate reported in the Financial Highlights.
Note 6. Affiliated money market fund
The Fund invests in Columbia Short-Term Cash Fund, an affiliated money market fund established for the exclusive use by the Fund and other affiliated funds (the Affiliated MMF). The income earned by the Fund from such investments is included as Dividends - affiliated issuers in the Statement of Operations. As an investing fund, the Fund indirectly bears its proportionate share of the expenses of the Affiliated MMF. The Affiliated MMF prices its shares with a floating net asset value. In addition, the Board of Trustees of the Affiliated MMF may impose a fee on redemptions (sometimes referred to as a liquidity fee) or temporarily suspend redemptions (sometimes referred to as imposing a redemption gate) in the event its liquidity falls below regulatory limits.
Note 7. Interfund lending
Pursuant to an exemptive order granted by the Securities and Exchange Commission, the Fund participates in a program (the Interfund Program) allowing each participating Columbia Fund (each, a Participating Fund) to lend money directly to and, except for closed-end funds and money market funds, borrow money directly from other Participating Funds for temporary purposes. The amounts eligible for borrowing and lending under the Interfund Program are subject to certain restrictions.
Interfund loans are subject to the risk that the borrowing fund could be unable to repay the loan when due, and a delay in repayment to the lending fund could result in lost opportunities and/or additional lending costs. The exemptive order is subject to conditions intended to mitigate conflicts of interest arising from the Investment Manager’s relationship with each Participating Fund.
| 30 | Columbia Large Cap Enhanced Core Fund | Annual Report 2019 |
Notes to Financial Statements (continued)
February 28, 2019
The Fund’s activity in the Interfund Program during the year ended February 28, 2019 was as follows:
| Fund | Borrower or Lender | Average loan
balance ($) | Weighted average
interest rate (%) | Days
outstanding |
| Columbia Large Cap Enhanced Core Fund | Lender | 1,000,000 | 2.78 | 5 |
The Fund had no outstanding interfund loans at February 28, 2019.
Note 8. Line of credit
The Fund has access to a revolving credit facility with a syndicate of banks led by Citibank, N.A., HSBC Bank USA, N.A. and JPMorgan Chase Bank, N.A. whereby the Fund may borrow for the temporary funding of shareholder redemptions or for other temporary or emergency purposes. The credit facility, which is a collective agreement between the Fund and certain other funds managed by the Investment Manager or an affiliated investment manager, severally and not jointly, permits collective borrowings up to $1 billion. Interest is charged to each participating fund based on its borrowings at a rate equal to the higher of (i) the federal funds effective rate, (ii) the one-month LIBOR rate and (iii) the overnight bank funding rate, plus in each case, 1.00%. Each borrowing under the credit facility matures no later than 60 days after the date of borrowing. The Fund also pays a commitment fee equal to its pro rata share of the unused amount of the credit facility at a rate of 0.15% per annum. The commitment fee is included in other expenses in the Statement of Operations. This agreement expires annually in December unless extended or renewed.
The Fund had no borrowings during the year ended February 28, 2019.
Note 9. Significant risks
Shareholder concentration risk
At February 28, 2019, one unaffiliated shareholder of record owned 32.3% of the outstanding shares of the Fund in one or more accounts. The Fund has no knowledge about whether any portion of those shares was owned beneficially. Subscription and redemption activity by concentrated accounts may have a significant effect on the operations of the Fund. In the case of a large redemption, the Fund may be forced to sell investments at inopportune times, including its liquid positions, which may result in Fund losses and the Fund holding a higher percentage of less liquid positions. Large redemptions could result in decreased economies of scale and increased operating expenses for non-redeeming Fund shareholders.
Technology and technology-related investment risk
The Fund may be more susceptible to the particular risks that may affect companies in the information technology sector, as well as other technology-related sectors (collectively, the technology sectors) than if it were invested in a wider variety of companies in unrelated sectors. Companies in the technology sectors are subject to certain risks, including the risk that new services, equipment or technologies will not be accepted by consumers and businesses or will become rapidly obsolete. Performance of such companies may be affected by factors including obtaining and protecting patents (or the failure to do so) and significant competitive pressures, including aggressive pricing of their products or services, new market entrants, competition for market share and short product cycles due to an accelerated rate of technological developments. Such competitive pressures may lead to limited earnings and/or falling profit margins. As a result, the value of their securities may fall or fail to rise. In addition, many technology sector companies have limited operating histories and prices of these companies’ securities historically have been more volatile than other securities, especially over the short term.
Note 10. Subsequent events
Management has evaluated the events and transactions that have occurred through the date the financial statements were issued and noted no items requiring adjustment of the financial statements or additional disclosure.
Note 11. Information regarding pending and settled legal proceedings
Ameriprise Financial and certain of its affiliates have historically been involved in a number of legal, arbitration and regulatory proceedings, including routine litigation, class actions, and governmental actions, concerning matters arising in connection with the conduct of their business activities. Ameriprise Financial believes that the Fund is not currently the subject of, and
Columbia Large Cap Enhanced Core Fund | Annual Report 2019
| 31 |
Notes to Financial Statements (continued)
February 28, 2019
that neither Ameriprise Financial nor any of its affiliates are the subject of, any pending legal, arbitration or regulatory proceedings that are likely to have a material adverse effect on the Fund or the ability of Ameriprise Financial or its affiliates to perform under their contracts with the Fund. Ameriprise Financial is required to make quarterly (10-Q), annual (10-K) and, as necessary, 8-K filings with the Securities and Exchange Commission (SEC) on legal and regulatory matters that relate to Ameriprise Financial and its affiliates. Copies of these filings may be obtained by accessing the SEC website at www.sec.gov.
There can be no assurance that these matters, or the adverse publicity associated with them, will not result in increased Fund redemptions, reduced sale of Fund shares or other adverse consequences to the Fund. Further, although we believe proceedings are not likely to have a material adverse effect on the Fund or the ability of Ameriprise Financial or its affiliates to perform under their contracts with the Fund, these proceedings are subject to uncertainties and, as such, we are unable to estimate the possible loss or range of loss that may result. An adverse outcome in one or more of these proceedings could result in adverse judgments, settlements, fines, penalties or other relief that could have a material adverse effect on the consolidated financial condition or results of operations of Ameriprise Financial.
| 32 | Columbia Large Cap Enhanced Core Fund | Annual Report 2019 |
Report of Independent Registered Public Accounting Firm
To the Board of Trustees of Columbia Funds Series Trust and Shareholders of Columbia Large Cap Enhanced Core Fund
Opinion on the Financial Statements
We have audited the accompanying statement of assets and liabilities, including the portfolio of investments, of Columbia Large Cap Enhanced Core Fund (one of the funds constituting Columbia Funds Series Trust, referred to hereafter as the "Fund") as of February 28, 2019, the related statement of operations for the year ended February 28, 2019, the statement of changes in net assets for each of the two years in the period ended February 28, 2019, including the related notes, and the financial highlights for each of the periods indicated therein (collectively referred to as the “financial statements”). In our opinion, the financial statements present fairly, in all material respects, the financial position of the Fund as of February 28, 2019, the results of its operations for the year then ended, the changes in its net assets for each of the two years in the period ended February 28, 2019 and the financial highlights for each of the periods indicated therein in conformity with accounting principles generally accepted in the United States of America.
Basis for Opinion
These financial statements are the responsibility of the Fund’s management. Our responsibility is to express an opinion on the Fund’s financial statements based on our audits. We are a public accounting firm registered with the Public Company Accounting Oversight Board (United States) (PCAOB) and are required to be independent with respect to the Fund in accordance with the U.S. federal securities laws and the applicable rules and regulations of the Securities and Exchange Commission and the PCAOB.
We conducted our audits of these financial statements in accordance with the standards of the PCAOB. Those standards require that we plan and perform the audit to obtain reasonable assurance about whether the financial statements are free of material misstatement, whether due to error or fraud.
Our audits included performing procedures to assess the risks of material misstatement of the financial statements, whether due to error or fraud, and performing procedures that respond to those risks. Such procedures included examining, on a test basis, evidence regarding the amounts and disclosures in the financial statements. Our audits also included evaluating the accounting principles used and significant estimates made by management, as well as evaluating the overall presentation of the financial statements. Our procedures included confirmation of securities owned as of February 28, 2019 by correspondence with the custodian, transfer agent and brokers. We believe that our audits provide a reasonable basis for our opinion.
/s/PricewaterhouseCoopers LLP
Minneapolis, Minnesota
April 22, 2019
We have served as the auditor of one or more investment companies within the Columbia Funds Complex since 1977.
Columbia Large Cap Enhanced Core Fund | Annual Report 2019
| 33 |
Federal Income Tax Information
(Unaudited)
The Fund hereby designates the following tax attributes for the fiscal year ended February 28, 2019. Shareholders will be notified in early 2020 of the amounts for use in preparing 2019 income tax returns.
Qualified
dividend
income | Dividends
received
deduction | Capital
gain
dividend |
| 83.28% | 82.61% | $32,787,635 |
Qualified dividend income. For taxable, non-corporate shareholders, the percentage of ordinary income distributed during the fiscal year that represents qualified dividend income subject to reduced tax rates.
Dividends received deduction. The percentage of ordinary income distributed during the fiscal year that qualifies for the corporate dividends received deduction.
Capital gain dividend. The Fund designates as a capital gain dividend the amount reflected above, or if subsequently determined to be different, the net capital gain of such fiscal period.
| 34 | Columbia Large Cap Enhanced Core Fund | Annual Report 2019 |
Shareholders elect the Board that oversees the Fund’s operations. The Board appoints officers who are responsible for day-to-day business decisions based on policies set by the Board. The following table provides basic biographical information about the Fund’s Trustees as of the printing of this report, including their principal occupations during the past five years, although specific titles for individuals may have varied over the period. Under current Board policy, Trustees not affiliated with the Investment Manager generally may serve through the end of the calendar year in which they reach the mandatory retirement age established by the Board.
Independent trustees
Name,
address,
year of birth | Position held
with the Trust and
length of service | Principal occupation(s)
during past five years
and other relevant
professional experience | Number of
Funds in the
Columbia Funds
complex
overseen | Other directorships
held by Trustee
during the past
five years |
George S. Batejan
c/o Columbia Management
Investment Advisers, LLC
225 Franklin Street
Mail Drop BX32 05228
Boston, MA 02110
1953 | Trustee since 1/17 | Executive Vice President, Global Head of Technology and Operations, Janus Capital Group, Inc., 2010-2016 | 123 | Former Chairman of the Board, NICSA (National Investment Company Services Association) (Executive Committee, Nominating Committee and Governance Committee), 2014-2016; former Director, Intech Investment Management, 2011-2016; former Board Member, Metro Denver Chamber of Commerce, 2015-2016; former Advisory Board Member, University of Colorado Business School, 2015-2018 |
Kathleen Blatz
c/o Columbia Management
Investment Advisers, LLC
225 Franklin Street
Mail Drop BX32 05228
Boston, MA 02110
1954 | Trustee since 1/06 for RiverSource Funds and since 6/11 for Nations Funds | Attorney; specializing in arbitration and mediation; Chief Justice, Minnesota Supreme Court, 1998-2006; Associate Justice, Minnesota Supreme Court, 1996-1998; Fourth Judicial District Court Judge, Hennepin County, 1994-1996; Attorney in private practice and public service, 1984-1993; State Representative, Minnesota House of Representatives, 1979-1993, which included service on the Tax and Financial Institutions and Insurance Committees; Member and Interim Chair, Minnesota Sports Facilities Authority, January 2017-July 2017; Interim President and Chief Executive Officer, Blue Cross and Blue Shield of Minnesota (health care insurance), February-July 2018 | 123 | Trustee, BlueCross BlueShield of Minnesota since 2009 (Chair of the Business Development Committee, 2014-2017; Chair of the Governance Committee since 2017); Chair of the Robina Foundation since August 2013; former Member and Chair of the Board, Minnesota Sports Facilities Authority, January 2017-July 2017 |
Edward J. Boudreau, Jr.
c/o Columbia Management
Investment Advisers, LLC
225 Franklin Street
Mail Drop BX32 05228
Boston, MA 02110
1944 | Chair of the Board since 1/18; Trustee since 6/11 for RiverSource Funds and since 1/05 for Nations Funds | Managing Director, E.J. Boudreau & Associates (consulting) since 2000; FINRA Industry Arbitrator, 2002-present; Chairman and Chief Executive Officer, John Hancock Investments (asset management), Chairman and Interested Trustee for open-end and closed-end funds offered by John Hancock, 1989-2000; John Hancock Mutual Life Insurance Company, including Senior Vice President and Treasurer and Senior Vice President Information Technology, 1968-1988 | 123 | Former Trustee, Boston Museum of Science (Chair of Finance Committee) 1985-2013; former Trustee, BofA Funds Series Trust (11 funds), 2005-2011 |
Columbia Large Cap Enhanced Core Fund | Annual Report 2019
| 35 |
TRUSTEES AND OFFICERS (continued)
Independent trustees (continued)
Name,
address,
year of birth | Position held
with the Trust and
length of service | Principal occupation(s)
during past five years
and other relevant
professional experience | Number of
Funds in the
Columbia Funds
complex
overseen | Other directorships
held by Trustee
during the past
five years |
Pamela G. Carlton
c/o Columbia Management
Investment Advisers, LLC
225 Franklin Street
Mail Drop BX32 05228
Boston, MA 02110
1954 | Trustee since 7/07 for RiverSource Funds and since 6/11 for Nations Funds | President, Springboard — Partners in Cross Cultural Leadership (consulting company) since 2003; Managing Director of US Equity Research, JP Morgan Chase, 1999-2003; Director of US Equity Research, Chase Asset Management, 1996-1999; Co-Director Latin America Research, 1993-1996, COO Global Research, 1992-1996, Co-Director of US Research, 1991-1992, Investment Banker, Morgan Stanley, 1982-1991 | 123 | Trustee, New York Presbyterian Hospital Board (Executive Committee and Chair of Human Resources Committee) since 1996; Director, Laurel Road Bank (Audit Committee) since 2017 |
Patricia M. Flynn
c/o Columbia Management
Investment Advisers, LLC
225 Franklin Street
Mail Drop BX32 05228
Boston, MA 02110
1950 | Trustee since 11/04 for RiverSource Funds and since 6/11 for Nations Funds | Trustee Professor of Economics and Management, Bentley University since 1976 (also teaches and conducts research on corporate governance); Dean, McCallum Graduate School of Business, Bentley University, 1992-2002 | 123 | Trustee, MA Taxpayers Foundation since 1997; Board of Directors, The MA Business Roundtable since 2003; Board of Governors, Innovation Institute, MA Technology Collaborative since 2010 |
Brian J. Gallagher
c/o Columbia Management
Investment Advisers, LLC
225 Franklin Street
Mail Drop BX32 05228
Boston, MA 02110
1954 | Trustee since 12/17 | Retired; Partner with Deloitte & Touche LLP and its predecessors, 1977-2016 | 121 | Trustee, Catholic Schools Foundation since 2004 |
Catherine James Paglia
c/o Columbia Management
Investment Advisers, LLC
225 Franklin Street
Mail Drop BX32 05228
Boston, MA 02110
1952 | Trustee since 11/04 for RiverSource Funds and since 6/11 for Nations Funds | Director, Enterprise Asset Management, Inc. (private real estate and asset management company) since September 1998; Managing Director and Partner, Interlaken Capital, Inc., 1989-1997; Managing Director, Morgan Stanley, 1982-1989; Vice President, Investment Banking, 1980-1982, Associate, Investment Banking, 1976-1980, Dean Witter Reynolds, Inc. | 123 | Director, Valmont Industries, Inc. (irrigation systems manufacturer) since 2012; Trustee, Carleton College (on the Investment Committee); Trustee, Carnegie Endowment for International Peace (on the Investment Committee) |
Anthony M. Santomero
c/o Columbia Management
Investment Advisers, LLC
225 Franklin Street
Mail Drop BX32 05228
Boston, MA 02110
1946 | Trustee since 6/11 for RiverSource Funds and since 1/08 for Nations Funds | Richard K. Mellon Professor Emeritus of Finance, The Wharton School, University of Pennsylvania, since 2002; Senior Advisor, McKinsey & Company (consulting), 2006-2008; President, Federal Reserve Bank of Philadelphia, 2000- 2006; Professor of Finance, The Wharton School, University of Pennsylvania, 1972-2002 | 123 | Trustee, Penn Mutual Life Insurance Company since March 2008; Director, Renaissance Reinsurance Ltd. since May 2008; former Trustee, BofA Funds Series Trust (11 funds), 2008-2011; former Director, Citigroup Inc. and Citibank, N.A., 2009-2019 |
| 36 | Columbia Large Cap Enhanced Core Fund | Annual Report 2019 |
TRUSTEES AND OFFICERS (continued)
Independent trustees (continued)
Name,
address,
year of birth | Position held
with the Trust and
length of service | Principal occupation(s)
during past five years
and other relevant
professional experience | Number of
Funds in the
Columbia Funds
complex
overseen | Other directorships
held by Trustee
during the past
five years |
Minor M. Shaw
c/o Columbia Management
Investment Advisers, LLC
225 Franklin Street
Mail Drop BX32 05228
Boston, MA 02110
1947 | Trustee since 6/11 for RiverSource Funds and since 2003 for Nations Funds | President, Micco LLC (private investments) since 2011; President, Micco Corp. (family investment business), 1998-2011 | 123 | Director, BlueCross BlueShield of South Carolina since April 2008; Board Chair, Hollingsworth Funds since 2016; Advisory Board member, Duke Energy Corp. since October 2016; Chair of the Duke Endowment; Chair of Greenville – Spartanburg Airport Commission; former Trustee, BofA Funds Series Trust (11 funds), 2003-2011; former Director, Piedmont Natural Gas, 2004-2016; former Director, National Association of Corporate Directors, Carolinas Chapter, 2013-2018 |
Sandra Yeager
c/o Columbia Management
Investment Advisers, LLC
225 Franklin Street
Mail Drop BX32 05228
Boston, MA 02110
1964 | Trustee since 12/17 | Retired; President and founder, Hanoverian Capital, LLC (SEC registered investment advisor firm), 2008-2016; Managing Director, DuPont Capital, 2006-2008; Managing Director, Morgan Stanley Investment Management, 2004-2006; Senior Vice President, Alliance Bernstein, 1990-2004 | 121 | Director, NAPE Education Foundation since October 2016 |
Interested trustee affiliated with Investment Manager*
Name,
address,
year of birth | Position held with the Trust and length of service | Principal occupation(s) during the
past five years and other relevant
professional experience | Number of
Funds in the
Columbia Funds
complex overseen | Other directorships
held by Trustee
during the past
five years |
William F. Truscott
c/o Columbia Management
Investment Advisers, LLC
225 Franklin St.
Boston, MA 02110
1960 | Trustee since 11/01 for RiverSource Funds and since 6/11 for Nations Funds; Senior Vice President since 2002 for RiverSource Funds and since 5/10 for Nations Funds | Chairman of the Board and President, Columbia Management Investment Advisers, LLC since May 2010 and February 2012, respectively; Chief Executive Officer, Global Asset Management, Ameriprise Financial, Inc. since September 2012 (previously Chief Executive Officer, U.S. Asset Management & President, Annuities, May 2010 - September 2012); Director and Chief Executive Officer, Columbia Management Investment Distributors, Inc. since May 2010 and February 2012, respectively; Chairman of the Board and Chief Executive Officer, RiverSource Distributors, Inc. since 2006; Director, Threadneedle Asset Management Holdings, SARL since 2014; President and Chief Executive Officer, Ameriprise Certificate Company, 2006 - August 2012. | 192 | Chairman of the Board, Columbia Management Investment Advisers, LLC since May 2010; Director, Columbia Management Investment Distributors, Inc. since May 2010; former Director, Ameriprise Certificate Company, 2006-January 2013 |
| * | Interested person (as defined under the 1940 Act) by reason of being an officer, director, security holder and/or employee of the Investment Manager or Ameriprise Financial. |
Columbia Large Cap Enhanced Core Fund | Annual Report 2019
| 37 |
TRUSTEES AND OFFICERS (continued)
Nations Funds refer to the Funds within the Columbia Funds Complex that historically bore the Nations brand and includes series of Columbia Funds Series Trust. RiverSource Funds refer to the Funds within the Columbia Funds Complex that historically bore the RiverSource brand and includes series of Columbia Funds Series Trust II.
The Statement of Additional Information has additional information about the Fund’s Board members and is available, without charge, upon request by calling 800.345.6611, visiting columbiathreadneedleus.com/investor/ or contacting your financial intermediary.
| 38 | Columbia Large Cap Enhanced Core Fund | Annual Report 2019 |
TRUSTEES AND OFFICERS (continued)
The Board has appointed officers who are responsible for day-to-day business decisions based on policies it has established. The officers serve at the pleasure of the Board. The following table provides basic information about the Officers of the Fund as of the printing of this report, including principal occupations during the past five years, although their specific titles may have varied over the period. In addition to Mr. Truscott, who is Senior Vice President, the Fund’s other officers are:
Fund officers
Name,
address and
year of birth | Position and year
first appointed to
position for any Fund
in the Columbia
Funds complex or a
predecessor thereof | Principal occupation(s) during past five years |
Christopher O. Petersen
5228 Ameriprise
Financial Center
Minneapolis, MN 55474
Born 1970 | President and Principal Executive Officer (2015) | Vice President and Lead Chief Counsel, Ameriprise Financial, Inc. since January 2015 (previously, Vice President and Chief Counsel, January 2010 - December 2014; officer of Columbia Funds and affiliated funds since 2007. |
Michael G. Clarke
225 Franklin Street
Boston, MA 02110
Born 1969 | Chief Financial Officer (Principal Financial Officer) (2009) and Senior Vice President (2019) | Vice President — Accounting and Tax, Columbia Management Investment Advisers, LLC, since May 2010; senior officer of Columbia Funds and affiliated funds since 2002 (previously, Treasurer and Chief Accounting Officer, January 2009-January 2019 and December 2015-January 2019, respectively). |
Joseph Beranek
5890 Ameriprise
Financial Center
Minneapolis, MN 55474
Born 1965 | Treasurer and Chief Accounting Officer (Principal Accounting Officer) (2019) | Vice President — Mutual Fund Accounting and Financial Reporting, Columbia Management Investment Advisers, LLC, since December 2018 and March 2017, respectively (previously, Vice President — Pricing and Corporate Actions, May 2010-March 2017). |
Paul B. Goucher
485 Lexington Avenue
New York, NY 10017
Born 1968 | Senior Vice President (2011) and Assistant Secretary (2008) | Senior Vice President and Assistant General Counsel, Ameriprise Financial, Inc. since January 2017 (previously, Vice President and Lead Chief Counsel, November 2008 - January 2017 and January 2013 - January 2017, respectively); Vice President, Chief Legal Officer and Assistant Secretary, Columbia Management Investment Advisers, LLC since March 2015 (previously Vice President and Assistant Secretary, May 2010 – March 2015). |
Thomas P. McGuire
225 Franklin Street
Boston, MA 02110
Born 1972 | Senior Vice President and Chief Compliance Officer (2012) | Vice President — Asset Management Compliance, Ameriprise Financial, Inc., since May 2010; Chief Compliance Officer, Ameriprise Certificate Company since September 2010. |
Colin Moore
225 Franklin Street
Boston, MA 02110
Born 1958 | Senior Vice President (2010) | Executive Vice President and Global Chief Investment Officer, Ameriprise Financial, Inc., since July 2013; Executive Vice President and Global Chief Investment Officer, Columbia Management Investment Advisers, LLC since July 2013. |
Ryan C. Larrenaga
225 Franklin Street
Boston, MA 02110
Born 1970 | Senior Vice President (2017), Chief Legal Officer (2017), and Secretary (2015) | Vice President and Chief Counsel, Ameriprise Financial, Inc. since August 2018 (previously, Vice President and Group Counsel, August 2011 - August 2018); officer of Columbia Funds and affiliated funds since 2005. |
Michael E. DeFao
225 Franklin Street
Boston, MA 02110
Born 1968 | Vice President (2011) and Assistant Secretary (2010) | Vice President and Chief Counsel, Ameriprise Financial, Inc. since May 2010. |
Amy Johnson
5228 Ameriprise
Financial Center
Minneapolis, MN 55474
Born 1965 | Vice President (2006) | Managing Director and Global Head of Operations, Columbia Management Investment Advisers, LLC since April 2016 (previously Managing Director and Chief Operating Officer, 2010 - 2016). |
Columbia Large Cap Enhanced Core Fund | Annual Report 2019
| 39 |
TRUSTEES AND OFFICERS (continued)
Fund officers (continued)
Name,
address and
year of birth | Position and year
first appointed to
position for any Fund
in the Columbia
Funds complex or a
predecessor thereof | Principal occupation(s) during past five years |
Lyn Kephart-Strong
5228 Ameriprise
Financial Center
Minneapolis, MN 55474
Born 1960 | Vice President (2015) | President, Columbia Management Investment Services Corp. since October 2014; Vice President & Resolution Officer, Ameriprise Trust Company since August 2009. |
| 40 | Columbia Large Cap Enhanced Core Fund | Annual Report 2019 |
The Fund mails one shareholder report to each shareholder address, unless such shareholder elected to receive shareholder reports from the Fund electronically. If you would like more than one report, please call shareholder services at 800.345.6611 and additional reports will be sent to you.
Proxy voting policies and procedures
The policy of the Board of Trustees is to vote the proxies of the companies in which the Fund holds investments consistent with the procedures as stated in the Statement of Additional Information (SAI). You may obtain a copy of the SAI without charge by calling 800.345.6611; contacting your financial intermediary; visiting columbiathreadneedleus.com/investor/; or searching the website of the Securities and Exchange Commission (SEC) at sec.gov. Information regarding how the Fund voted proxies relating to portfolio securities is filed with the SEC by August 31st for the most recent 12-month period ending June 30th of that year, and is available without charge by visiting columbiathreadneedleus.com/investor/, or searching the website of the SEC at sec.gov.
Quarterly schedule of investments
The Fund files a complete schedule of portfolio holdings with the SEC for the first and third quarters of each fiscal year on Form N-Q or Form N-PORT (available for filings after March 31, 2019). The Fund’s Form N-Q or Form N-PORT is available on the SEC’s website at sec.gov. The Fund’s complete schedule of portfolio holdings, as filed on Form N-Q or Form N-PORT, can also be obtained without charge, upon request, by calling 800.345.6611.
Additional Fund information
For more information about the Fund, please visit columbiathreadneedleus.com/investor/ or call 800.345.6611. Customer Service Representatives are available to answer your questions Monday through Friday from 8 a.m. to 7 p.m. Eastern time.
Fund investment manager
Columbia Management Investment Advisers, LLC
225 Franklin Street
Boston, MA 02110
Fund distributor
Columbia Management Investment Distributors, Inc.
225 Franklin Street
Boston, MA 02110
Fund transfer agent
Columbia Management Investment Services Corp.
P.O. Box 219104
Kansas City, MO 64121-9104
Columbia Large Cap Enhanced Core Fund | Annual Report 2019
| 41 |
Columbia Large Cap Enhanced Core Fund
P.O. Box 219104
Kansas City, MO 64121-9104
Please read and consider the investment objectives, risks, charges and expenses for any fund carefully before investing. For a prospectus and summary prospectus, which contains this and other important information about the Fund, go to
columbiathreadneedleus.com/investor/. The Fund is distributed by Columbia Management Investment Distributors, Inc., member FINRA, and managed by Columbia Management Investment Advisers, LLC.
Columbia Threadneedle Investments (Columbia Threadneedle) is the global brand name of the Columbia and Threadneedle group of companies. All rights reserved.
© 2019 Columbia Management Investment Advisers, LLC.
columbiathreadneedleus.com/investor/

Annual Report
February 28, 2019
Columbia Large Cap Index Fund
Beginning on January 1, 2021, as permitted by regulations adopted by the Securities and Exchange Commission, paper copies of the Fund’s annual and semiannual shareholder reports like this one will no longer be sent by mail, unless you specifically request paper copies of the reports. Instead, the reports will be made available on the Fund’s website (columbiathreadneedleus.com/investor/), and each time a report is posted you will be notified by mail and provided with a website address to access the report.
If you have already elected to receive shareholder reports electronically, you will not be affected by this change and you need not take any action. You may elect to receive shareholder reports and other communications from the Fund electronically at any time by contacting your financial intermediary (such as a broker-dealer or bank) or, for Fund shares held directly with the Fund, by calling 800.345.6611 or by enrolling in “eDelivery” by logging into your account at columbiathreadneedleus.com/investor/.
You may elect to receive all future reports in paper free of charge. If you invest through a financial intermediary, you can contact your financial intermediary to request that you continue receiving paper copies of your shareholder reports. If you invest directly with the Fund, you can call 800.345.6611 to let the Fund know you wish to continue receiving paper copies of your shareholder reports. Your election to receive paper reports will apply to all Columbia Funds held in your account if you invest through a financial intermediary or all Columbia Funds held with the fund complex if you invest directly with the Fund.
Not FDIC Insured • No bank guarantee • May lose value
Dear Shareholders,
Volatility exists in financial markets and this is not a comfortable fact of life. How investors deal with this reality, including how they react to short term spikes in volatility as well as to longer periods of increased or decreased volatility, may have a significant impact on their overall investing success.
Too often, investors change their investment strategy based on something that’s happening at a moment in time rather than thinking about how that change in strategy might affect their ability to achieve their longer term financial goals. Emotion replaces logic and reasoning. Investors may sell in reaction to a market drop (fear or panic), locking in low returns which means they won’t be invested when the market returns, or they invest more at a market peak (greed or conviction), essentially when it is expensive to do so. In both cases, selling and buying at the exact wrong time.
We believe the best outcomes come from a consistent approach to investing. Here are five areas where advisors can help us overcome the tendency to react emotionally as we struggle to make the right choices with our investments:
Long-term focus
The further away long-term goals, aspirations and objectives are, the easier it is to stray away from the goals and priorities that we set out. Advisors help us stay focused on what we want to accomplish.
Discipline through up-and-down markets
Advisors help set rules to prevent us from making rash decisions that we may regret later. Knowing ahead of time what you should do in case of certain situations will help you get through volatile markets and not make emotional decisions.
Tax-awareness
Taxes are one of the biggest drags on investment returns and are critical attributes of investing. Yet few of us take the necessary steps to ease the corrosive effect of taxes. Advisors have tools and knowledge that may help us to manage portfolios more tax-efficiently and keep more of what we earn.
Emotional objectivity
Our emotions are very hard to manage and making investment decisions in an emotional state can lead to exceedingly bad outcomes. An objective advisor can help prevent some of the reactionary mistakes emotions often lead us to.
Education and guidance
The role of the advisor is to teach and guide us toward achieving our financial goals. In terms of working through emotions, guidance is by far the most important component.
By understanding our own behaviors and biases, we can prepare for future challenges. Your success is our priority. Talk to your advisor about how working with Columbia Threadneedle Investments may help you stay the course and position your portfolio for consistent, sustainable outcomes, regardless of market conditions.
Sincerely,
Christopher O. Petersen
President, Columbia Funds
Columbia Funds are distributed by Columbia Management Investment Distributors, Inc., member FINRA, and managed by Columbia Management Investment Advisers, LLC.
© 2019 Columbia Management Investment Advisers, LLC. All rights reserved.
Columbia Large Cap Index Fund | Annual Report 2019
Columbia Large Cap Index Fund | Annual Report 2019
Investment objective
Columbia Large Cap Index Fund (the Fund) seeks total return before fees and expenses that corresponds to the total return of the Standard & Poor’s (S&P) 500 Index.
Portfolio management
Christopher Lo, CFA
Lead Portfolio Manager
Managed Fund since 2014
Vadim Shteyn
Portfolio Manager
Managed Fund since 2011
Morningstar style boxTM
The Morningstar Style Box is based on a fund’s portfolio holdings. For equity funds, the vertical axis shows the market capitalization of the stocks owned, and the horizontal axis shows investment style (value, blend, or growth). Information shown is based on the most recent data provided by Morningstar.
© 2019 Morningstar, Inc. All rights reserved. The Morningstar information contained herein: (1) is proprietary to Morningstar and/or its content providers; (2) may not be copied or distributed; and (3) is not warranted to be accurate, complete or timely. Neither Morningstar nor its content providers are responsible for any damages or losses arising from any use of this information.
| Average annual total returns (%) (for the period ended February 28, 2019) |
| | | Inception | 1 Year | 5 Years | 10 Years |
| Class A | 10/10/95 | 4.19 | 10.18 | 16.17 |
| Institutional Class | 12/15/93 | 4.46 | 10.45 | 16.47 |
| Institutional 2 Class* | 11/08/12 | 4.45 | 10.45 | 16.47 |
| Institutional 3 Class* | 03/01/17 | 4.46 | 10.46 | 16.47 |
| S&P 500 Index | | 4.68 | 10.67 | 16.67 |
All results shown assume reinvestment of distributions during the period. Returns do not reflect the deduction of taxes that a shareholder may pay on Fund distributions or on the redemption of Fund shares. Performance results reflect the effect of any fee waivers or reimbursements of Fund expenses by Columbia Management Investment Advisers, LLC and/or any of its affiliates. Absent these fee waivers or expense reimbursement arrangements, performance results would have been lower.
The performance information shown represents past performance and is not a guarantee of future results. The investment return and principal value of your investment will fluctuate so that your shares, when redeemed, may be worth more or less than their original cost. Current performance may be lower or higher than the performance information shown. You may obtain performance information current to the most recent month-end by contacting your financial intermediary, visiting columbiathreadneedleus.com/investor/ or calling 800.345.6611.
| * | The returns shown for periods prior to the share class inception date (including returns for the Life of the Fund, if shown, which are since Fund inception) include the returns of the Fund’s oldest share class. These returns are adjusted to reflect any higher class-related operating expenses of the newer share classes, as applicable. Please visit columbiathreadneedleus.com/investor/investment-products/mutual-funds/appended-performance for more information. |
The S&P 500 Index, an unmanaged index, measures the performance of 500 widely held, large-capitalization U.S. stocks and is frequently used as a general measure of market performance.
Indices are not available for investment, are not professionally managed and do not reflect sales charges, fees, brokerage commissions, taxes or other expenses of investing. Securities in the Fund may not match those in an index.
| 2 | Columbia Large Cap Index Fund | Annual Report 2019 |
Fund at a Glance (continued)
Performance of a hypothetical $10,000 investment (February 28, 2009 — February 28, 2019)
The chart above shows the change in value of a hypothetical $10,000 investment in Class A shares of Columbia Large Cap Index Fund during the stated time period, and does not reflect the deduction of taxes that a shareholder may pay on Fund distributions or on the redemption of Fund shares.
| Top 10 holdings (%) (at February 28, 2019) |
| Microsoft Corp. | 3.7 |
| Apple, Inc. | 3.3 |
| Amazon.com, Inc. | 2.9 |
| Berkshire Hathaway, Inc., Class B | 1.7 |
| Facebook, Inc., Class A | 1.7 |
| Johnson & Johnson | 1.6 |
| JPMorgan Chase & Co. | 1.5 |
| Alphabet, Inc., Class C | 1.5 |
| Alphabet, Inc., Class A | 1.4 |
| Exxon Mobil Corp. | 1.4 |
Percentages indicated are based upon total investments excluding Money Market Funds and investments in derivatives, if any.
For further detail about these holdings, please refer to the section entitled “Portfolio of Investments.”
Fund holdings are as of the date given, are subject to change at any time, and are not recommendations to buy or sell any security.
| Portfolio breakdown (%) (at February 28, 2019) |
| Common Stocks | 98.8 |
| Money Market Funds | 1.2 |
| Total | 100.0 |
Percentages indicated are based upon total investments excluding investments in derivatives, if any. The Fund’s portfolio composition is subject to change.
| Equity sector breakdown (%) (at February 28, 2019) |
| Communication Services | 10.1 |
| Consumer Discretionary | 9.9 |
| Consumer Staples | 7.1 |
| Energy | 5.4 |
| Financials | 13.3 |
| Health Care | 14.8 |
| Industrials | 9.8 |
| Information Technology | 20.6 |
| Materials | 2.7 |
| Real Estate | 3.0 |
| Utilities | 3.3 |
| Total | 100.0 |
Percentages indicated are based upon total equity investments. The Fund’s portfolio composition is subject to change.
Columbia Large Cap Index Fund | Annual Report 2019
| 3 |
Manager Discussion of Fund Performance
For the 12-month period that ended February 28, 2019, the Fund’s Class A shares returned 4.19%. The Fund closely tracked its benchmark, the unmanaged S&P 500 Index, which returned 4.68% for the same period. Mutual funds, unlike unmanaged indices, incur operating expenses.
U.S. equity markets posted gains despite tumult, tariffs and trade wars
The 12 months ended February 28, 2019 proved to be tumultuous. Stock markets got off to a mixed start at the beginning of the period, as fears of a global trade war sparked by tariffs the U.S. Administration levied on steel, aluminum and other goods weighed on returns. Worries about retaliation, primarily from China, added to anxiety over the possibility of interest rates and inflation rising faster than most expected. Small cap stocks fared better than large cap stocks during this time, as domestically-oriented small cap stocks were more insulated from global news headlines and geopolitical events. Despite these persistent headwinds, strong U.S. economic data and healthy corporate earnings growth drove stocks higher during the second and third quarters of 2018, with several major U.S. equity indices reaching record highs in the third quarter.
This course reversed sharply in the fourth quarter of 2018 when equity markets began selling off in earnest in October. The sell-off was attributed to worries surrounding the pace of interest rate hikes, exacerbated by the U.S. President’s criticisms of the Federal Reserve’s (the Fed) plan, fears of slowing U.S. economic growth, persistent concerns about U.S.-China trade relations and Washington, D.C.-centric political squabbles. Against this backdrop, U.S. equity markets logged their worst December since the Great Depression, with small cap equities in particular being hit hard amid investors’ flight to relative safety.
The period ended on a positive note, as U.S. equity markets rebounded strongly in the first two months of 2019. Though many issues continued without resolution, investors shrugged off worries about the global economic slowdown and trade conflict. Consensus expectations for a U.S.-China trade deal and a seemingly market-friendlier Fed also helped drive returns. Corporate earnings reports fueled positive investor sentiment, too, as did speculation that equity prices may have already reflected much, if not most, of the bad news. With the rally at the start of 2019, the S&P 500 Index ended the period up 4.68%. Small cap stocks outperformed large cap stocks, as the S& P Small Cap 600 Index climbed 7.20% for the same period.
S&P 500 Index saw greatest gains in traditionally defensive sectors
Nine of the eleven sectors of the S&P 500 Index posted a positive return during the 12 months ended February 28, 2019. In terms of total return, utilities, real estate and health care, each traditionally considered a defensive sector, were the best relative performers. On the basis of impact, which takes weighting and total returns into account, information technology, health care and consumer discretionary were the best relative performers. The top performing industries for the period on the basis of total return were independent power and renewable electricity producers; water utilities; road and rail; life sciences tools and services; and software.
Conversely, materials, financials and energy, each considered a more economically-sensitive cyclical sector, were weakest from both a total return perspective and on the basis of impact. The worst performing industries for the period on the basis of total return were energy equipment and services; metals and mining; household durables; tobacco; and auto components.
Top individual contributors within the S&P 500 Index during the period included information technology leader Microsoft; biotechnology and pharmaceuticals company Merck; consumer staples giant Procter & Gamble; e-commerce retailing behemoth Amazon.com; and aerospace and defense company Boeing. Top detractors were pharmaceuticals company AbbVie; semiconductor producer NVIDIA; materials, chemicals and agricultural products developer DowDuPont; social media giant Facebook; and oilfield services provider Schlumberger.
Information technology was the largest sector by weighting in the S&P 500 Index as of February 28, 2019, with a weighting of 20.62%. As always, each sector and stock in the S&P 500 Index was represented in the Fund with approximately the same weighting as in the Index and therefore had a similar effect.
| 4 | Columbia Large Cap Index Fund | Annual Report 2019 |
Manager Discussion of Fund Performance (continued)
Index additions and deletions drove Fund portfolio changes
During the period, there were 42 additions and 42 deletions to the Index and the Fund’s portfolio. Among those stocks added to the Index and Fund were IPG Photonics, Nektar Therapeutics, Take-Two Interactive Software, MSCI, ABIOMED, Twitter, HollyFrontier, Arista Networks, Fortinet, Diamondback Energy, Lamb Weston Holdings, First Republic Bank, Teleflex and Wabtec. Deletions included Scripps Networks Interactive, Chesapeake Energy, Wyndham Destinations, Navient, Monsanto, Range Resources, Keurig Dr. Pepper, Praxair, Regency Centers, Aetna, Stericycle, Express Scripts Holding, PG&E and Goodyear Tire & Rubber.
We do not anticipate any changes in the portfolio beyond the customary quarterly rebalancings and stock substitutions we make to align the Fund with the S&P 500 Index.
Market risk may affect a single issuer, sector of the economy, industry or the market as a whole. Investing inderivatives is a specialized activity that involves special risks, which may result in significant losses. The Fund’s net value will generally decline when the performance of its targetedindex declines. See the Fund’s prospectus for more information on these and other risks.
The views expressed in this report reflect the current views of the respective parties. These views are not guarantees of future performance and involve certain risks, uncertainties and assumptions that are difficult to predict, so actual outcomes and results may differ significantly from the views expressed. These views are subject to change at any time based upon economic, market or other conditions and the respective parties disclaim any responsibility to update such views. These views may not be relied on as investment advice and, because investment decisions for a Columbia fund are based on numerous factors, may not be relied on as an indication of trading intent on behalf of any particular Columbia fund. References to specific securities should not be construed as a recommendation or investment advice.
Columbia Large Cap Index Fund | Annual Report 2019
| 5 |
Understanding Your Fund’s Expenses
(Unaudited)
As an investor, you incur two types of costs. There are shareholder transaction costs, which may include redemption fees. There are also ongoing fund costs, which generally include management fees, distribution and/or service fees, and other fund expenses. The following information is intended to help you understand your ongoing costs (in dollars) of investing in the Fund and to help you compare these costs with the ongoing costs of investing in other mutual funds.
Analyzing your Fund’s expenses
To illustrate these ongoing costs, we have provided examples and calculated the expenses paid by investors in each share class of the Fund during the period. The actual and hypothetical information in the table is based on an initial investment of $1,000 at the beginning of the period indicated and held for the entire period. Expense information is calculated two ways and each method provides you with different information. The amount listed in the “Actual” column is calculated using the Fund’s actual operating expenses and total return for the period. You may use the Actual information, together with the amount invested, to estimate the expenses that you paid over the period. Simply divide your account value by $1,000 (for example, an $8,600 account value divided by $1,000 = 8.6), then multiply the results by the expenses paid during the period under the “Actual” column. The amount listed in the “Hypothetical” column assumes a 5% annual rate of return before expenses (which is not the Fund’s actual return) and then applies the Fund’s actual expense ratio for the period to the hypothetical return. You should not use the hypothetical account values and expenses to estimate either your actual account balance at the end of the period or the expenses you paid during the period. See “Compare with other funds” below for details on how to use the hypothetical data.
Compare with other funds
Since all mutual funds are required to include the same hypothetical calculations about expenses in shareholder reports, you can use this information to compare the ongoing cost of investing in the Fund with other funds. To do so, compare the hypothetical example with the 5% hypothetical examples that appear in the shareholder reports of other funds. As you compare hypothetical examples of other funds, it is important to note that hypothetical examples are meant to highlight the ongoing costs of investing in a fund only and do not reflect any transaction costs, such as redemption or exchange fees. Therefore, the hypothetical calculations are useful in comparing ongoing costs only, and will not help you determine the relative total costs of owning different funds. If transaction costs were included in these calculations, your costs would be higher.
| September 1, 2018 — February 28, 2019 |
| | Account value at the
beginning of the
period ($) | Account value at the
end of the
period ($) | Expenses paid during
the period ($) | Fund’s annualized
expense ratio (%) |
| | Actual | Hypothetical | Actual | Hypothetical | Actual | Hypothetical | Actual |
| Class A | 1,000.00 | 1,000.00 | 967.40 | 1,022.56 | 2.20 | 2.26 | 0.45 |
| Institutional Class | 1,000.00 | 1,000.00 | 968.60 | 1,023.80 | 0.98 | 1.00 | 0.20 |
| Institutional 2 Class | 1,000.00 | 1,000.00 | 968.50 | 1,023.80 | 0.98 | 1.00 | 0.20 |
| Institutional 3 Class | 1,000.00 | 1,000.00 | 968.50 | 1,023.80 | 0.98 | 1.00 | 0.20 |
Expenses paid during the period are equal to the annualized expense ratio for each class as indicated above, multiplied by the average account value over the period and then multiplied by the number of days in the Fund’s most recent fiscal half year and divided by 365.
Expenses do not include fees and expenses incurred indirectly by the Fund from its investment in underlying funds, including affiliated and non-affiliated pooled investment vehicles, such as mutual funds and exchange-traded funds.
Had Columbia Management Investment Advisers, LLC and/or certain of its affiliates not waived/reimbursed certain fees and expenses, account value at the end of the period would have been reduced.
| 6 | Columbia Large Cap Index Fund | Annual Report 2019 |
Portfolio of Investments
February 28, 2019
(Percentages represent value of investments compared to net assets)
Investments in securities
| Common Stocks 98.6% |
| Issuer | Shares | Value ($) |
| Communication Services 10.0% |
| Diversified Telecommunication Services 2.0% |
| AT&T, Inc. | 994,862 | 30,960,106 |
| CenturyLink, Inc. | 129,991 | 1,714,581 |
| Verizon Communications, Inc. | 564,823 | 32,149,725 |
| Total | | 64,824,412 |
| Entertainment 2.1% |
| 21st Century Fox, Inc., Class A | 144,505 | 7,287,387 |
| 21st Century Fox, Inc., Class B | 66,587 | 3,340,004 |
| Activision Blizzard, Inc. | 104,300 | 4,395,202 |
| Electronic Arts, Inc.(a) | 41,302 | 3,955,906 |
| Netflix, Inc.(a) | 59,607 | 21,345,267 |
| Take-Two Interactive Software, Inc.(a) | 15,562 | 1,357,940 |
| Viacom, Inc., Class B | 48,315 | 1,411,764 |
| Walt Disney Co. (The) | 203,497 | 22,962,601 |
| Total | | 66,056,071 |
| Interactive Media & Services 4.6% |
| Alphabet, Inc., Class A(a) | 40,867 | 46,038,719 |
| Alphabet, Inc., Class C(a) | 42,055 | 47,098,236 |
| Facebook, Inc., Class A(a) | 328,401 | 53,020,341 |
| TripAdvisor, Inc.(a) | 13,994 | 744,061 |
| Twitter, Inc.(a) | 98,859 | 3,042,880 |
| Total | | 149,944,237 |
| Media 1.3% |
| CBS Corp., Class B Non Voting | 46,025 | 2,310,915 |
| Charter Communications, Inc., Class A(a) | 24,096 | 8,310,951 |
| Comcast Corp., Class A | 620,597 | 23,998,486 |
| Discovery, Inc., Class A(a) | 21,426 | 619,211 |
| Discovery, Inc., Class C(a) | 49,246 | 1,341,954 |
| DISH Network Corp., Class A(a) | 31,335 | 1,018,701 |
| Interpublic Group of Companies, Inc. (The) | 52,541 | 1,210,019 |
| News Corp., Class A | 52,658 | 685,607 |
| News Corp., Class B | 16,918 | 225,179 |
| Omnicom Group, Inc. | 30,630 | 2,318,691 |
| Total | | 42,039,714 |
| Total Communication Services | 322,864,434 |
| Common Stocks (continued) |
| Issuer | Shares | Value ($) |
| Consumer Discretionary 9.8% |
| Auto Components 0.1% |
| Aptiv PLC | 36,018 | 2,993,456 |
| BorgWarner, Inc. | 28,472 | 1,156,248 |
| Total | | 4,149,704 |
| Automobiles 0.4% |
| Ford Motor Co. | 534,077 | 4,683,855 |
| General Motors Co. | 179,430 | 7,083,897 |
| Harley-Davidson, Inc. | 22,261 | 826,328 |
| Total | | 12,594,080 |
| Distributors 0.1% |
| Genuine Parts Co. | 20,058 | 2,181,909 |
| LKQ Corp.(a) | 43,495 | 1,204,812 |
| Total | | 3,386,721 |
| Diversified Consumer Services 0.0% |
| H&R Block, Inc. | 28,098 | 678,567 |
| Hotels, Restaurants & Leisure 1.8% |
| Carnival Corp. | 54,731 | 3,161,262 |
| Chipotle Mexican Grill, Inc.(a) | 3,345 | 2,032,188 |
| Darden Restaurants, Inc. | 16,968 | 1,902,282 |
| Hilton Worldwide Holdings, Inc. | 40,544 | 3,369,206 |
| Marriott International, Inc., Class A | 38,699 | 4,847,824 |
| McDonald’s Corp. | 105,376 | 19,372,324 |
| MGM Resorts International | 68,457 | 1,831,225 |
| Norwegian Cruise Line Holdings Ltd.(a) | 30,073 | 1,669,954 |
| Royal Caribbean Cruises Ltd. | 23,427 | 2,775,631 |
| Starbucks Corp. | 169,583 | 11,914,902 |
| Wynn Resorts Ltd. | 13,379 | 1,692,979 |
| Yum! Brands, Inc. | 42,687 | 4,033,921 |
| Total | | 58,603,698 |
| Household Durables 0.3% |
| D.R. Horton, Inc. | 46,804 | 1,820,208 |
| Garmin Ltd. | 16,517 | 1,386,932 |
| Leggett & Platt, Inc. | 17,825 | 809,612 |
| Lennar Corp., Class A | 39,992 | 1,918,816 |
| Mohawk Industries, Inc.(a) | 8,623 | 1,173,763 |
The accompanying Notes to Financial Statements are an integral part of this statement.
Columbia Large Cap Index Fund | Annual Report 2019
| 7 |
Portfolio of Investments (continued)
February 28, 2019
| Common Stocks (continued) |
| Issuer | Shares | Value ($) |
| Newell Brands, Inc. | 58,702 | 952,733 |
| PulteGroup, Inc. | 35,321 | 953,667 |
| Whirlpool Corp. | 8,722 | 1,234,250 |
| Total | | 10,249,981 |
| Internet & Direct Marketing Retail 3.4% |
| Amazon.com, Inc.(a) | 56,140 | 92,060,056 |
| Booking Holdings, Inc.(a) | 6,332 | 10,745,657 |
| eBay, Inc. | 123,719 | 4,596,161 |
| Expedia Group, Inc. | 16,199 | 1,997,499 |
| Total | | 109,399,373 |
| Leisure Products 0.1% |
| Hasbro, Inc. | 15,912 | 1,350,929 |
| Mattel, Inc.(a) | 47,177 | 680,292 |
| Total | | 2,031,221 |
| Multiline Retail 0.5% |
| Dollar General Corp. | 35,931 | 4,256,386 |
| Dollar Tree, Inc.(a) | 32,528 | 3,133,422 |
| Kohl’s Corp. | 22,569 | 1,524,085 |
| Macy’s, Inc. | 42,026 | 1,041,824 |
| Nordstrom, Inc. | 15,549 | 735,157 |
| Target Corp. | 71,334 | 5,181,702 |
| Total | | 15,872,576 |
| Specialty Retail 2.3% |
| Advance Auto Parts, Inc. | 9,967 | 1,612,461 |
| AutoZone, Inc.(a) | 3,447 | 3,236,630 |
| Best Buy Co., Inc. | 32,002 | 2,203,018 |
| CarMax, Inc.(a) | 23,874 | 1,482,575 |
| Foot Locker, Inc. | 15,703 | 934,643 |
| Gap, Inc. (The) | 29,196 | 741,578 |
| Home Depot, Inc. (The) | 154,403 | 28,586,171 |
| L Brands, Inc. | 31,214 | 815,934 |
| Lowe’s Companies, Inc. | 109,757 | 11,534,363 |
| O’Reilly Automotive, Inc.(a) | 10,948 | 4,072,218 |
| Ross Stores, Inc. | 51,035 | 4,839,649 |
| Tiffany & Co. | 14,831 | 1,409,538 |
| TJX Companies, Inc. (The) | 169,162 | 8,676,319 |
| Common Stocks (continued) |
| Issuer | Shares | Value ($) |
| Tractor Supply Co. | 16,687 | 1,591,105 |
| Ulta Beauty, Inc.(a) | 7,705 | 2,407,736 |
| Total | | 74,143,938 |
| Textiles, Apparel & Luxury Goods 0.8% |
| Capri Holdings Ltd.(a) | 20,539 | 936,578 |
| Hanesbrands, Inc. | 49,308 | 916,636 |
| Nike, Inc., Class B | 174,017 | 14,918,478 |
| PVH Corp. | 10,355 | 1,189,168 |
| Ralph Lauren Corp. | 7,461 | 933,893 |
| Tapestry, Inc. | 39,618 | 1,384,253 |
| Under Armour, Inc., Class A(a) | 25,645 | 578,295 |
| Under Armour, Inc., Class C(a) | 26,292 | 527,943 |
| VF Corp. | 44,480 | 3,885,773 |
| Total | | 25,271,017 |
| Total Consumer Discretionary | 316,380,876 |
| Consumer Staples 7.0% |
| Beverages 1.7% |
| Brown-Forman Corp., Class B | 22,730 | 1,124,908 |
| Coca-Cola Co. (The) | 523,655 | 23,742,518 |
| Constellation Brands, Inc., Class A | 22,707 | 3,841,116 |
| Molson Coors Brewing Co., Class B | 25,599 | 1,578,434 |
| Monster Beverage Corp.(a) | 54,427 | 3,474,075 |
| PepsiCo, Inc. | 192,950 | 22,312,738 |
| Total | | 56,073,789 |
| Food & Staples Retailing 1.5% |
| Costco Wholesale Corp. | 59,899 | 13,102,307 |
| Kroger Co. (The) | 109,079 | 3,199,287 |
| Sysco Corp. | 65,370 | 4,415,744 |
| Walgreens Boots Alliance, Inc. | 109,889 | 7,822,998 |
| Walmart, Inc. | 194,596 | 19,263,058 |
| Total | | 47,803,394 |
| Food Products 1.1% |
| Archer-Daniels-Midland Co. | 76,641 | 3,257,242 |
| Campbell Soup Co. | 26,336 | 948,623 |
| ConAgra Foods, Inc. | 66,379 | 1,551,277 |
| General Mills, Inc. | 81,503 | 3,841,236 |
| Hershey Co. (The) | 19,169 | 2,121,625 |
| Hormel Foods Corp. | 37,266 | 1,615,854 |
The accompanying Notes to Financial Statements are an integral part of this statement.
| 8 | Columbia Large Cap Index Fund | Annual Report 2019 |
Portfolio of Investments (continued)
February 28, 2019
| Common Stocks (continued) |
| Issuer | Shares | Value ($) |
| JM Smucker Co. (The) | 15,546 | 1,646,477 |
| Kellogg Co. | 34,626 | 1,948,059 |
| Kraft Heinz Co. (The) | 85,009 | 2,821,449 |
| Lamb Weston Holdings, Inc. | 20,023 | 1,387,794 |
| McCormick & Co., Inc. | 16,643 | 2,263,115 |
| Mondelez International, Inc., Class A | 198,735 | 9,372,343 |
| Tyson Foods, Inc., Class A | 40,338 | 2,487,241 |
| Total | | 35,262,335 |
| Household Products 1.6% |
| Church & Dwight Co., Inc. | 33,663 | 2,215,025 |
| Clorox Co. (The) | 17,448 | 2,757,308 |
| Colgate-Palmolive Co. | 118,561 | 7,809,613 |
| Kimberly-Clark Corp. | 47,336 | 5,530,265 |
| Procter & Gamble Co. (The) | 340,558 | 33,561,991 |
| Total | | 51,874,202 |
| Personal Products 0.1% |
| Coty, Inc., Class A | 61,598 | 677,578 |
| Estee Lauder Companies, Inc. (The), Class A | 30,061 | 4,717,773 |
| Total | | 5,395,351 |
| Tobacco 1.0% |
| Altria Group, Inc. | 256,853 | 13,461,666 |
| Philip Morris International, Inc. | 212,499 | 18,474,663 |
| Total | | 31,936,329 |
| Total Consumer Staples | 228,345,400 |
| Energy 5.3% |
| Energy Equipment & Services 0.5% |
| Baker Hughes, Inc. | 70,173 | 1,851,164 |
| Halliburton Co. | 119,754 | 3,675,250 |
| Helmerich & Payne, Inc. | 14,902 | 807,688 |
| National Oilwell Varco, Inc. | 52,406 | 1,474,705 |
| Schlumberger Ltd. | 189,295 | 8,340,338 |
| TechnipFMC PLC | 58,157 | 1,296,320 |
| Total | | 17,445,465 |
| Oil, Gas & Consumable Fuels 4.8% |
| Anadarko Petroleum Corp. | 68,934 | 2,998,629 |
| Apache Corp. | 51,884 | 1,721,511 |
| Cabot Oil & Gas Corp. | 58,936 | 1,451,004 |
| Chevron Corp. | 261,188 | 31,232,861 |
| Common Stocks (continued) |
| Issuer | Shares | Value ($) |
| Cimarex Energy Co. | 13,679 | 983,657 |
| Concho Resources, Inc. | 27,372 | 3,010,920 |
| ConocoPhillips Co. | 157,365 | 10,677,215 |
| Devon Energy Corp. | 63,999 | 1,888,610 |
| Diamondback Energy, Inc. | 21,088 | 2,170,588 |
| EOG Resources, Inc. | 79,272 | 7,451,568 |
| Exxon Mobil Corp.(b) | 578,739 | 45,737,743 |
| Hess Corp. | 34,018 | 1,967,941 |
| HollyFrontier Corp. | 21,788 | 1,115,546 |
| Kinder Morgan, Inc. | 259,455 | 4,971,158 |
| Marathon Oil Corp. | 113,631 | 1,886,275 |
| Marathon Petroleum Corp. | 94,435 | 5,855,914 |
| Noble Energy, Inc. | 65,584 | 1,452,686 |
| Occidental Petroleum Corp. | 103,210 | 6,827,342 |
| ONEOK, Inc. | 56,232 | 3,613,468 |
| Phillips 66 | 57,995 | 5,588,398 |
| Pioneer Natural Resources Co. | 23,303 | 3,284,558 |
| Valero Energy Corp. | 58,005 | 4,730,888 |
| Williams Companies, Inc. (The) | 165,474 | 4,416,501 |
| Total | | 155,034,981 |
| Total Energy | 172,480,446 |
| Financials 13.2% |
| Banks 5.7% |
| Bank of America Corp. | 1,247,637 | 36,281,284 |
| BB&T Corp. | 105,343 | 5,369,333 |
| Citigroup, Inc. | 333,823 | 21,357,995 |
| Citizens Financial Group, Inc. | 63,956 | 2,362,535 |
| Comerica, Inc. | 22,104 | 1,925,479 |
| Fifth Third Bancorp | 89,624 | 2,471,830 |
| First Republic Bank | 22,390 | 2,350,502 |
| Huntington Bancshares, Inc. | 145,105 | 2,090,963 |
| JPMorgan Chase & Co. | 454,570 | 47,438,925 |
| KeyCorp | 141,415 | 2,497,389 |
| M&T Bank Corp. | 19,187 | 3,320,502 |
| People’s United Financial, Inc. | 51,596 | 916,345 |
| PNC Financial Services Group, Inc. (The) | 63,073 | 7,948,459 |
| Regions Financial Corp. | 141,328 | 2,317,779 |
| SunTrust Banks, Inc. | 61,418 | 3,984,186 |
| SVB Financial Group(a) | 7,279 | 1,799,078 |
The accompanying Notes to Financial Statements are an integral part of this statement.
Columbia Large Cap Index Fund | Annual Report 2019
| 9 |
Portfolio of Investments (continued)
February 28, 2019
| Common Stocks (continued) |
| Issuer | Shares | Value ($) |
| U.S. Bancorp | 207,655 | 10,733,687 |
| Wells Fargo & Co. | 579,108 | 28,891,698 |
| Zions Bancorp | 26,267 | 1,342,244 |
| Total | | 185,400,213 |
| Capital Markets 2.7% |
| Affiliated Managers Group, Inc. | 7,204 | 789,630 |
| Ameriprise Financial, Inc.(c) | 19,049 | 2,507,420 |
| Bank of New York Mellon Corp. (The) | 124,348 | 6,525,783 |
| BlackRock, Inc. | 16,595 | 7,355,236 |
| Cboe Global Markets, Inc. | 15,337 | 1,470,972 |
| Charles Schwab Corp. (The) | 164,294 | 7,559,167 |
| CME Group, Inc. | 48,903 | 8,895,945 |
| E*TRADE Financial Corp. | 34,750 | 1,702,402 |
| Franklin Resources, Inc. | 40,675 | 1,326,412 |
| Goldman Sachs Group, Inc. (The) | 47,292 | 9,302,336 |
| Intercontinental Exchange, Inc. | 77,855 | 6,006,513 |
| Invesco Ltd. | 56,228 | 1,088,012 |
| Moody’s Corp. | 22,788 | 3,945,059 |
| Morgan Stanley | 178,703 | 7,501,952 |
| MSCI, Inc. | 12,033 | 2,222,736 |
| Nasdaq, Inc. | 15,684 | 1,436,184 |
| Northern Trust Corp. | 30,261 | 2,820,325 |
| Raymond James Financial, Inc. | 17,630 | 1,455,885 |
| S&P Global, Inc. | 34,299 | 6,872,491 |
| State Street Corp. | 51,883 | 3,728,831 |
| T. Rowe Price Group, Inc. | 32,893 | 3,303,444 |
| Total | | 87,816,735 |
| Consumer Finance 0.7% |
| American Express Co. | 95,753 | 10,316,428 |
| Capital One Financial Corp. | 64,751 | 5,411,889 |
| Discover Financial Services | 45,926 | 3,288,761 |
| Synchrony Financial | 90,390 | 2,947,618 |
| Total | | 21,964,696 |
| Diversified Financial Services 1.7% |
| Berkshire Hathaway, Inc., Class B(a) | 265,928 | 53,531,307 |
| Jefferies Financial Group, Inc. | 36,356 | 736,936 |
| Total | | 54,268,243 |
| Common Stocks (continued) |
| Issuer | Shares | Value ($) |
| Insurance 2.4% |
| Aflac, Inc. | 104,060 | 5,113,508 |
| Allstate Corp. (The) | 47,083 | 4,443,693 |
| American International Group, Inc. | 120,928 | 5,224,090 |
| Aon PLC | 32,921 | 5,646,939 |
| Arthur J Gallagher & Co. | 25,102 | 2,015,189 |
| Assurant, Inc. | 7,124 | 733,701 |
| Brighthouse Financial, Inc.(a) | 16,208 | 627,574 |
| Chubb Ltd. | 62,991 | 8,434,495 |
| Cincinnati Financial Corp. | 20,692 | 1,796,479 |
| Everest Re Group Ltd. | 5,556 | 1,256,267 |
| Hartford Financial Services Group, Inc. (The) | 49,034 | 2,420,318 |
| Lincoln National Corp. | 29,196 | 1,825,334 |
| Loews Corp. | 37,792 | 1,799,655 |
| Marsh & McLennan Companies, Inc. | 68,859 | 6,405,264 |
| MetLife, Inc. | 134,893 | 6,095,815 |
| Principal Financial Group, Inc. | 35,983 | 1,894,145 |
| Progressive Corp. (The) | 79,702 | 5,810,276 |
| Prudential Financial, Inc. | 56,453 | 5,411,020 |
| Torchmark Corp. | 14,028 | 1,158,152 |
| Travelers Companies, Inc. (The) | 36,205 | 4,812,006 |
| Unum Group | 29,902 | 1,117,139 |
| Willis Towers Watson PLC | 17,765 | 3,055,935 |
| Total | | 77,096,994 |
| Total Financials | 426,546,881 |
| Health Care 14.6% |
| Biotechnology 2.4% |
| AbbVie, Inc. | 205,622 | 16,293,487 |
| Alexion Pharmaceuticals, Inc.(a) | 30,492 | 4,126,482 |
| Amgen, Inc. | 87,109 | 16,557,679 |
| Biogen, Inc.(a) | 27,544 | 9,034,707 |
| Celgene Corp.(a) | 95,580 | 7,944,610 |
| Gilead Sciences, Inc. | 176,829 | 11,497,422 |
| Incyte Corp.(a) | 24,140 | 2,081,592 |
| Regeneron Pharmaceuticals, Inc.(a) | 10,612 | 4,571,013 |
| Vertex Pharmaceuticals, Inc.(a) | 34,934 | 6,593,793 |
| Total | | 78,700,785 |
The accompanying Notes to Financial Statements are an integral part of this statement.
| 10 | Columbia Large Cap Index Fund | Annual Report 2019 |
Portfolio of Investments (continued)
February 28, 2019
| Common Stocks (continued) |
| Issuer | Shares | Value ($) |
| Health Care Equipment & Supplies 3.4% |
| Abbott Laboratories | 240,081 | 18,635,087 |
| ABIOMED, Inc.(a) | 6,152 | 2,057,844 |
| Align Technology, Inc.(a) | 9,952 | 2,577,269 |
| Baxter International, Inc. | 67,653 | 5,055,709 |
| Becton Dickinson and Co. | 36,672 | 9,123,627 |
| Boston Scientific Corp.(a) | 189,158 | 7,589,019 |
| Cooper Companies, Inc. (The) | 6,715 | 1,920,423 |
| Danaher Corp. | 84,316 | 10,709,818 |
| Dentsply Sirona, Inc. | 30,421 | 1,270,381 |
| Edwards Lifesciences Corp.(a) | 28,576 | 4,837,631 |
| Hologic, Inc.(a) | 36,830 | 1,736,534 |
| IDEXX Laboratories, Inc.(a) | 11,789 | 2,487,833 |
| Intuitive Surgical, Inc.(a) | 15,611 | 8,548,740 |
| Medtronic PLC | 183,586 | 16,614,533 |
| ResMed, Inc. | 19,482 | 1,995,541 |
| Stryker Corp. | 42,453 | 8,002,815 |
| Teleflex, Inc. | 6,290 | 1,823,094 |
| Varian Medical Systems, Inc.(a) | 12,457 | 1,673,722 |
| Zimmer Biomet Holdings, Inc. | 27,880 | 3,460,466 |
| Total | | 110,120,086 |
| Health Care Providers & Services 2.9% |
| AmerisourceBergen Corp. | 21,439 | 1,785,869 |
| Anthem, Inc. | 35,358 | 10,633,211 |
| Cardinal Health, Inc. | 40,726 | 2,213,051 |
| Centene Corp.(a) | 56,146 | 3,418,730 |
| Cigna Corp. | 52,055 | 9,080,474 |
| CVS Health Corp. | 176,777 | 10,223,014 |
| DaVita, Inc.(a) | 17,247 | 981,354 |
| Five Star Quality Care, Inc.(a),(d),(e) | 0 | 0 |
| HCA Healthcare, Inc. | 36,699 | 5,102,629 |
| Henry Schein, Inc.(a) | 20,833 | 1,235,397 |
| Humana, Inc. | 18,750 | 5,344,500 |
| Laboratory Corp. of America Holdings(a) | 13,795 | 2,044,971 |
| McKesson Corp. | 26,706 | 3,395,935 |
| Quest Diagnostics, Inc. | 18,596 | 1,609,484 |
| UnitedHealth Group, Inc. | 131,506 | 31,853,383 |
| Common Stocks (continued) |
| Issuer | Shares | Value ($) |
| Universal Health Services, Inc., Class B | 11,655 | 1,618,064 |
| WellCare Health Plans, Inc.(a) | 6,830 | 1,731,951 |
| Total | | 92,272,017 |
| Health Care Technology 0.1% |
| Cerner Corp.(a) | 45,044 | 2,520,212 |
| Life Sciences Tools & Services 1.0% |
| Agilent Technologies, Inc. | 43,578 | 3,461,836 |
| Illumina, Inc.(a) | 20,093 | 6,284,488 |
| IQVIA Holdings, Inc.(a) | 21,655 | 3,033,865 |
| Mettler-Toledo International, Inc.(a) | 3,422 | 2,330,074 |
| PerkinElmer, Inc. | 15,205 | 1,431,703 |
| Thermo Fisher Scientific, Inc. | 55,030 | 14,284,137 |
| Waters Corp.(a) | 10,357 | 2,508,673 |
| Total | | 33,334,776 |
| Pharmaceuticals 4.8% |
| Allergan PLC | 43,335 | 5,967,663 |
| Bristol-Myers Squibb Co. | 223,109 | 11,525,811 |
| Eli Lilly & Co. | 128,878 | 16,276,003 |
| Johnson & Johnson | 366,607 | 50,093,180 |
| Merck & Co., Inc. | 355,459 | 28,895,262 |
| Mylan NV(a) | 70,482 | 1,860,020 |
| Nektar Therapeutics(a) | 23,658 | 959,095 |
| Perrigo Co. PLC | 17,087 | 832,137 |
| Pfizer, Inc. | 790,163 | 34,253,566 |
| Zoetis, Inc. | 65,670 | 6,188,084 |
| Total | | 156,850,821 |
| Total Health Care | 473,798,697 |
| Industrials 9.7% |
| Aerospace & Defense 2.7% |
| Arconic, Inc. | 58,795 | 1,087,120 |
| Boeing Co. (The) | 72,191 | 31,761,152 |
| General Dynamics Corp. | 38,050 | 6,476,871 |
| Harris Corp. | 16,079 | 2,651,909 |
| Huntington Ingalls Industries, Inc. | 5,875 | 1,230,284 |
| L3 Technologies, Inc. | 10,761 | 2,278,642 |
| Lockheed Martin Corp. | 33,822 | 10,464,865 |
| Northrop Grumman Corp. | 23,737 | 6,882,781 |
| Raytheon Co. | 38,901 | 7,255,036 |
The accompanying Notes to Financial Statements are an integral part of this statement.
Columbia Large Cap Index Fund | Annual Report 2019
| 11 |
Portfolio of Investments (continued)
February 28, 2019
| Common Stocks (continued) |
| Issuer | Shares | Value ($) |
| Textron, Inc. | 33,212 | 1,803,412 |
| TransDigm Group, Inc.(a) | 6,635 | 2,880,187 |
| United Technologies Corp. | 110,935 | 13,941,201 |
| Total | | 88,713,460 |
| Air Freight & Logistics 0.6% |
| CH Robinson Worldwide, Inc. | 18,797 | 1,698,873 |
| Expeditors International of Washington, Inc. | 23,596 | 1,768,520 |
| FedEx Corp. | 33,135 | 5,997,435 |
| United Parcel Service, Inc., Class B | 95,036 | 10,472,967 |
| Total | | 19,937,795 |
| Airlines 0.4% |
| Alaska Air Group, Inc. | 16,859 | 1,040,201 |
| American Airlines Group, Inc. | 56,029 | 1,996,313 |
| Delta Air Lines, Inc. | 85,283 | 4,228,331 |
| Southwest Airlines Co. | 69,178 | 3,876,735 |
| United Continental Holdings, Inc.(a) | 31,290 | 2,747,575 |
| Total | | 13,889,155 |
| Building Products 0.3% |
| Allegion PLC | 12,996 | 1,169,120 |
| AO Smith Corp. | 19,666 | 1,021,255 |
| Fortune Brands Home & Security, Inc. | 19,331 | 910,877 |
| Johnson Controls International PLC | 126,313 | 4,455,060 |
| Masco Corp. | 41,757 | 1,568,393 |
| Total | | 9,124,705 |
| Commercial Services & Supplies 0.4% |
| Cintas Corp. | 11,840 | 2,446,144 |
| Copart, Inc.(a) | 28,148 | 1,651,443 |
| Republic Services, Inc. | 29,723 | 2,331,175 |
| Rollins, Inc. | 20,136 | 798,594 |
| Waste Management, Inc. | 53,620 | 5,429,025 |
| Total | | 12,656,381 |
| Construction & Engineering 0.1% |
| Fluor Corp. | 19,232 | 723,123 |
| Jacobs Engineering Group, Inc. | 16,339 | 1,205,492 |
| Quanta Services, Inc. | 19,961 | 711,410 |
| Total | | 2,640,025 |
| Common Stocks (continued) |
| Issuer | Shares | Value ($) |
| Electrical Equipment 0.5% |
| AMETEK, Inc. | 31,728 | 2,524,914 |
| Eaton Corp. PLC | 59,242 | 4,725,734 |
| Emerson Electric Co. | 85,593 | 5,833,163 |
| Rockwell Automation, Inc. | 16,494 | 2,945,169 |
| Total | | 16,028,980 |
| Industrial Conglomerates 1.5% |
| 3M Co. | 79,593 | 16,506,792 |
| General Electric Co. | 1,188,979 | 12,353,492 |
| Honeywell International, Inc. | 101,193 | 15,590,805 |
| Roper Technologies, Inc. | 14,137 | 4,575,440 |
| Total | | 49,026,529 |
| Machinery 1.6% |
| Caterpillar, Inc. | 80,662 | 11,078,119 |
| Cummins, Inc. | 20,188 | 3,110,769 |
| Deere & Co. | 43,975 | 7,213,659 |
| Dover Corp. | 20,005 | 1,811,053 |
| Flowserve Corp. | 17,890 | 794,495 |
| Fortive Corp. | 40,170 | 3,276,667 |
| Illinois Tool Works, Inc. | 41,731 | 6,012,602 |
| Ingersoll-Rand PLC | 33,578 | 3,544,494 |
| PACCAR, Inc. | 47,767 | 3,238,603 |
| Parker-Hannifin Corp. | 18,089 | 3,186,558 |
| Pentair PLC | 21,832 | 928,733 |
| Snap-On, Inc. | 7,607 | 1,217,120 |
| Stanley Black & Decker, Inc. | 20,650 | 2,734,679 |
| Wabtec Corp. | 18,216 | 1,334,504 |
| Xylem, Inc. | 24,563 | 1,855,735 |
| Total | | 51,337,790 |
| Professional Services 0.3% |
| Equifax, Inc. | 16,478 | 1,804,506 |
| IHS Markit Ltd.(a) | 49,028 | 2,606,819 |
| Nielsen Holdings PLC | 48,523 | 1,271,302 |
| Robert Half International, Inc. | 16,600 | 1,131,954 |
| Verisk Analytics, Inc.(a) | 22,504 | 2,845,181 |
| Total | | 9,659,762 |
The accompanying Notes to Financial Statements are an integral part of this statement.
| 12 | Columbia Large Cap Index Fund | Annual Report 2019 |
Portfolio of Investments (continued)
February 28, 2019
| Common Stocks (continued) |
| Issuer | Shares | Value ($) |
| Road & Rail 1.1% |
| CSX Corp. | 109,656 | 7,968,702 |
| JB Hunt Transport Services, Inc. | 11,942 | 1,285,795 |
| Kansas City Southern | 13,902 | 1,510,313 |
| Norfolk Southern Corp. | 37,233 | 6,675,877 |
| Union Pacific Corp. | 100,719 | 16,890,576 |
| Total | | 34,331,263 |
| Trading Companies & Distributors 0.2% |
| Fastenal Co. | 39,236 | 2,469,514 |
| United Rentals, Inc.(a) | 11,084 | 1,491,796 |
| W.W. Grainger, Inc. | 6,237 | 1,900,850 |
| Total | | 5,862,160 |
| Total Industrials | 313,208,005 |
| Information Technology 20.3% |
| Communications Equipment 1.2% |
| Arista Networks, Inc.(a) | 7,112 | 2,028,698 |
| Cisco Systems, Inc. | 614,574 | 31,816,496 |
| F5 Networks, Inc.(a) | 8,284 | 1,392,872 |
| Juniper Networks, Inc. | 47,177 | 1,277,553 |
| Motorola Solutions, Inc. | 22,353 | 3,199,161 |
| Total | | 39,714,780 |
| Electronic Equipment, Instruments & Components 0.5% |
| Amphenol Corp., Class A | 41,194 | 3,871,000 |
| Corning, Inc. | 109,411 | 3,808,597 |
| FLIR Systems, Inc. | 18,911 | 972,971 |
| IPG Photonics Corp.(a) | 4,890 | 758,096 |
| Keysight Technologies, Inc.(a) | 25,617 | 2,162,331 |
| TE Connectivity Ltd. | 46,886 | 3,848,872 |
| Total | | 15,421,867 |
| IT Services 4.9% |
| Accenture PLC, Class A | 87,133 | 14,061,524 |
| Akamai Technologies, Inc.(a) | 22,266 | 1,551,050 |
| Alliance Data Systems Corp. | 6,408 | 1,108,584 |
| Automatic Data Processing, Inc. | 59,839 | 9,157,162 |
| Broadridge Financial Solutions, Inc. | 15,956 | 1,615,545 |
| Cognizant Technology Solutions Corp., Class A | 79,154 | 5,618,351 |
| DXC Technology Co. | 38,285 | 2,521,450 |
| Fidelity National Information Services, Inc. | 44,770 | 4,841,875 |
| Common Stocks (continued) |
| Issuer | Shares | Value ($) |
| Fiserv, Inc.(a) | 54,467 | 4,612,810 |
| FleetCor Technologies, Inc.(a) | 12,118 | 2,826,887 |
| Gartner, Inc.(a) | 12,424 | 1,767,935 |
| Global Payments, Inc. | 21,622 | 2,819,076 |
| International Business Machines Corp. | 124,228 | 17,159,614 |
| Jack Henry & Associates, Inc. | 10,565 | 1,401,236 |
| MasterCard, Inc., Class A | 124,204 | 27,917,333 |
| Paychex, Inc. | 43,688 | 3,364,850 |
| PayPal Holdings, Inc.(a) | 161,072 | 15,796,331 |
| Total System Services, Inc. | 22,948 | 2,166,291 |
| VeriSign, Inc.(a) | 14,541 | 2,588,880 |
| Visa, Inc., Class A | 240,204 | 35,579,016 |
| Western Union Co. (The) | 60,525 | 1,081,582 |
| Total | | 159,557,382 |
| Semiconductors & Semiconductor Equipment 3.8% |
| Advanced Micro Devices, Inc.(a) | 120,218 | 2,828,730 |
| Analog Devices, Inc. | 50,594 | 5,411,534 |
| Applied Materials, Inc. | 134,368 | 5,151,669 |
| Broadcom, Inc. | 56,518 | 15,562,796 |
| Intel Corp. | 623,877 | 33,040,526 |
| KLA-Tencor Corp. | 22,576 | 2,607,302 |
| Lam Research Corp. | 21,216 | 3,735,925 |
| Maxim Integrated Products, Inc. | 37,876 | 2,061,591 |
| Microchip Technology, Inc. | 32,334 | 2,808,855 |
| Micron Technology, Inc.(a) | 153,106 | 6,258,973 |
| NVIDIA Corp. | 83,387 | 12,863,279 |
| Qorvo, Inc.(a) | 17,075 | 1,197,640 |
| QUALCOMM, Inc. | 165,692 | 8,846,296 |
| Skyworks Solutions, Inc. | 24,272 | 1,982,052 |
| Texas Instruments, Inc. | 131,297 | 13,888,597 |
| Xilinx, Inc. | 34,594 | 4,334,628 |
| Total | | 122,580,393 |
| Software 6.2% |
| Adobe, Inc.(a) | 66,730 | 17,516,625 |
| ANSYS, Inc.(a) | 11,426 | 2,025,373 |
| Autodesk, Inc.(a) | 29,941 | 4,880,682 |
| Cadence Design Systems, Inc.(a) | 38,563 | 2,207,732 |
| Citrix Systems, Inc. | 17,503 | 1,846,567 |
| Fortinet, Inc.(a) | 19,792 | 1,717,748 |
The accompanying Notes to Financial Statements are an integral part of this statement.
Columbia Large Cap Index Fund | Annual Report 2019
| 13 |
Portfolio of Investments (continued)
February 28, 2019
| Common Stocks (continued) |
| Issuer | Shares | Value ($) |
| Intuit, Inc. | 35,479 | 8,767,925 |
| Microsoft Corp. | 1,056,499 | 118,359,583 |
| Oracle Corp. | 348,316 | 18,157,713 |
| Red Hat, Inc.(a) | 24,159 | 4,411,433 |
| Salesforce.com, Inc.(a) | 104,567 | 17,112,390 |
| Symantec Corp. | 87,335 | 1,964,164 |
| Synopsys, Inc.(a) | 20,406 | 2,074,882 |
| Total | | 201,042,817 |
| Technology Hardware, Storage & Peripherals 3.7% |
| Apple, Inc. | 616,232 | 106,700,571 |
| Hewlett Packard Enterprise Co. | 194,521 | 3,186,254 |
| HP, Inc. | 216,309 | 4,267,777 |
| NetApp, Inc. | 34,434 | 2,245,097 |
| Seagate Technology PLC | 35,602 | 1,657,629 |
| Western Digital Corp. | 39,564 | 1,990,069 |
| Xerox Corp. | 28,340 | 875,706 |
| Total | | 120,923,103 |
| Total Information Technology | 659,240,342 |
| Materials 2.6% |
| Chemicals 2.0% |
| Air Products & Chemicals, Inc. | 30,008 | 5,436,849 |
| Albemarle Corp. | 14,515 | 1,325,074 |
| Celanese Corp., Class A | 18,286 | 1,870,475 |
| CF Industries Holdings, Inc. | 31,543 | 1,331,115 |
| DowDuPont, Inc. | 313,609 | 16,693,407 |
| Eastman Chemical Co. | 19,140 | 1,582,687 |
| Ecolab, Inc. | 34,746 | 5,868,947 |
| FMC Corp. | 18,409 | 1,647,605 |
| International Flavors & Fragrances, Inc. | 13,842 | 1,764,855 |
| Linde PLC | 75,331 | 13,050,342 |
| LyondellBasell Industries NV, Class A | 43,005 | 3,677,788 |
| Mosaic Co. (The) | 48,481 | 1,516,001 |
| PPG Industries, Inc. | 32,790 | 3,671,496 |
| Sherwin-Williams Co. (The) | 11,264 | 4,879,565 |
| Total | | 64,316,206 |
| Common Stocks (continued) |
| Issuer | Shares | Value ($) |
| Construction Materials 0.1% |
| Martin Marietta Materials, Inc. | 8,570 | 1,609,446 |
| Vulcan Materials Co. | 18,055 | 2,012,410 |
| Total | | 3,621,856 |
| Containers & Packaging 0.3% |
| Avery Dennison Corp. | 11,849 | 1,280,166 |
| Ball Corp. | 46,361 | 2,539,656 |
| International Paper Co. | 55,361 | 2,536,641 |
| Packaging Corp. of America | 12,914 | 1,234,449 |
| Sealed Air Corp. | 21,452 | 935,736 |
| WestRock Co. | 34,659 | 1,295,554 |
| Total | | 9,822,202 |
| Metals & Mining 0.2% |
| Freeport-McMoRan, Inc. | 198,079 | 2,555,219 |
| Newmont Mining Corp. | 72,816 | 2,484,482 |
| Nucor Corp. | 42,917 | 2,599,483 |
| Total | | 7,639,184 |
| Total Materials | 85,399,448 |
| Real Estate 2.9% |
| Equity Real Estate Investment Trusts (REITS) 2.8% |
| Alexandria Real Estate Equities, Inc. | 14,700 | 1,997,583 |
| American Tower Corp. | 60,214 | 10,606,696 |
| Apartment Investment & Management Co., Class A | 20,630 | 1,009,426 |
| AvalonBay Communities, Inc. | 18,893 | 3,677,145 |
| Boston Properties, Inc. | 21,107 | 2,800,688 |
| Crown Castle International Corp. | 56,705 | 6,733,719 |
| Digital Realty Trust, Inc. | 28,199 | 3,189,871 |
| Duke Realty Corp. | 48,983 | 1,448,427 |
| Equinix, Inc. | 10,990 | 4,654,265 |
| Equity Residential | 50,361 | 3,711,102 |
| Essex Property Trust, Inc. | 9,033 | 2,527,795 |
| Extra Space Storage, Inc. | 17,291 | 1,658,899 |
| Federal Realty Investment Trust | 10,100 | 1,349,259 |
| HCP, Inc. | 65,274 | 2,008,481 |
| Host Hotels & Resorts, Inc. | 101,434 | 1,989,121 |
| Iron Mountain, Inc. | 39,122 | 1,385,701 |
| Kimco Realty Corp. | 57,606 | 1,013,290 |
| Macerich Co. (The) | 14,464 | 630,630 |
The accompanying Notes to Financial Statements are an integral part of this statement.
| 14 | Columbia Large Cap Index Fund | Annual Report 2019 |
Portfolio of Investments (continued)
February 28, 2019
| Common Stocks (continued) |
| Issuer | Shares | Value ($) |
| Mid-America Apartment Communities, Inc. | 15,557 | 1,611,394 |
| ProLogis, Inc. | 86,049 | 6,028,593 |
| Public Storage | 20,497 | 4,334,911 |
| Realty Income Corp. | 40,340 | 2,789,914 |
| Regency Centers Corp. | 23,163 | 1,511,386 |
| SBA Communications Corp.(a) | 15,491 | 2,797,055 |
| Simon Property Group, Inc. | 42,275 | 7,658,539 |
| SL Green Realty Corp. | 11,657 | 1,057,523 |
| UDR, Inc. | 37,663 | 1,672,990 |
| Ventas, Inc. | 48,731 | 3,057,870 |
| Vornado Realty Trust | 23,669 | 1,593,160 |
| Welltower, Inc. | 51,350 | 3,815,818 |
| Weyerhaeuser Co. | 102,414 | 2,549,084 |
| Total | | 92,870,335 |
| Real Estate Management & Development 0.1% |
| CBRE Group, Inc., Class A(a) | 43,331 | 2,156,151 |
| Total Real Estate | 95,026,486 |
| Utilities 3.2% |
| Electric Utilities 1.9% |
| Alliant Energy Corp. | 32,249 | 1,479,262 |
| American Electric Power Co., Inc. | 67,401 | 5,469,591 |
| Duke Energy Corp. | 97,443 | 8,736,739 |
| Edison International | 44,533 | 2,667,081 |
| Entergy Corp. | 24,763 | 2,311,131 |
| Evergy, Inc. | 36,015 | 2,013,599 |
| Eversource Energy | 43,321 | 3,024,239 |
| Exelon Corp. | 132,188 | 6,423,015 |
| FirstEnergy Corp. | 66,417 | 2,706,493 |
| NextEra Energy, Inc. | 65,331 | 12,263,935 |
| Pinnacle West Capital Corp. | 15,319 | 1,436,003 |
| PPL Corp. | 98,450 | 3,167,136 |
| Southern Co. (The) | 140,646 | 6,988,700 |
| Xcel Energy, Inc. | 70,266 | 3,854,793 |
| Total | | 62,541,717 |
| Common Stocks (continued) |
| Issuer | Shares | Value ($) |
| Gas Utilities 0.0% |
| Atmos Energy Corp. | 15,970 | 1,578,635 |
| Independent Power and Renewable Electricity Producers 0.1% |
| AES Corp. (The) | 90,536 | 1,559,935 |
| NRG Energy, Inc. | 39,628 | 1,651,695 |
| Total | | 3,211,630 |
| Multi-Utilities 1.1% |
| Ameren Corp. | 33,398 | 2,379,274 |
| CenterPoint Energy, Inc. | 68,509 | 2,064,861 |
| CMS Energy Corp. | 38,728 | 2,106,803 |
| Consolidated Edison, Inc. | 42,576 | 3,510,391 |
| Dominion Energy, Inc. | 104,458 | 7,739,293 |
| DTE Energy Co. | 24,868 | 3,072,690 |
| NiSource, Inc. | 49,664 | 1,339,935 |
| Public Service Enterprise Group, Inc. | 69,095 | 4,063,477 |
| Sempra Energy | 37,406 | 4,505,179 |
| WEC Energy Group, Inc. | 43,131 | 3,290,033 |
| Total | | 34,071,936 |
| Water Utilities 0.1% |
| American Water Works Co., Inc. | 24,683 | 2,508,286 |
| Total Utilities | 103,912,204 |
Total Common Stocks
(Cost $1,304,764,276) | 3,197,203,219 |
|
| Money Market Funds 1.2% |
| | Shares | Value ($) |
| Columbia Short-Term Cash Fund, 2.523%(c),(f) | 37,569,669 | 37,565,912 |
Total Money Market Funds
(Cost $37,565,912) | 37,565,912 |
Total Investments in Securities
(Cost: $1,342,330,188) | 3,234,769,131 |
| Other Assets & Liabilities, Net | | 7,950,814 |
| Net Assets | 3,242,719,945 |
At February 28, 2019, securities and/or cash totaling $2,979,431 were pledged as collateral.
The accompanying Notes to Financial Statements are an integral part of this statement.
Columbia Large Cap Index Fund | Annual Report 2019
| 15 |
Portfolio of Investments (continued)
February 28, 2019
Investments in derivatives
| Long futures contracts |
| Description | Number of
contracts | Expiration
date | Trading
currency | Notional
amount | Value/Unrealized
appreciation ($) | Value/Unrealized
depreciation ($) |
| S&P 500 E-mini | 319 | 03/2019 | USD | 44,415,965 | 2,010,945 | — |
Notes to Portfolio of Investments
| (a) | Non-income producing investment. |
| (b) | This security or a portion of this security has been pledged as collateral in connection with derivative contracts. |
| (c) | As defined in the Investment Company Act of 1940, an affiliated company is one in which the Fund owns 5% or more of the company’s outstanding voting securities, or a company which is under common ownership or control with the Fund. Holdings and transactions in these affiliated companies during the year ended February 28, 2019 are as follows: |
| Issuer | Beginning
shares | Shares
purchased | Shares
sold | Ending
shares | Realized gain
(loss) —
affiliated
issuers ($) | Net change in
unrealized
appreciation
(depreciation) —
affiliated
issuers ($) | Dividends —
affiliated
issuers ($) | Value —
affiliated
issuers
at end of
period ($) |
| Ameriprise Financial, Inc. |
| | 23,437 | 330 | (4,718) | 19,049 | 472,717 | (1,052,326) | 77,850 | 2,507,420 |
| Columbia Short-Term Cash Fund, 2.523% |
| | 55,498,320 | 857,652,847 | (875,581,498) | 37,569,669 | (234) | 3,568 | 961,650 | 37,565,912 |
| Total | | | | | 472,483 | (1,048,758) | 1,039,500 | 40,073,332 |
| (d) | Represents fractional shares. |
| (e) | Negligible market value. |
| (f) | The rate shown is the seven-day current annualized yield at February 28, 2019. |
Currency Legend
Fair value measurements
The Fund categorizes its fair value measurements according to a three-level hierarchy that maximizes the use of observable inputs and minimizes the use of unobservable inputs by prioritizing that the most observable input be used when available. Observable inputs are those that market participants would use in pricing an investment based on market data obtained from sources independent of the reporting entity. Unobservable inputs are those that reflect the Fund’s assumptions about the information market participants would use in pricing an investment. An investment’s level within the fair value hierarchy is based on the lowest level of any input that is deemed significant to the asset’s or liability’s fair value measurement. The input levels are not necessarily an indication of the risk or liquidity associated with investments at that level. For example, certain U.S. government securities are generally high quality and liquid, however, they are reflected as Level 2 because the inputs used to determine fair value may not always be quoted prices in an active market.
Fair value inputs are summarized in the three broad levels listed below:
| ■ | Level 1 — Valuations based on quoted prices for investments in active markets that the Fund has the ability to access at the measurement date. Valuation adjustments are not applied to Level 1 investments. |
| ■ | Level 2 — Valuations based on other significant observable inputs (including quoted prices for similar securities, interest rates, prepayment speeds, credit risks, etc.). |
| ■ | Level 3 — Valuations based on significant unobservable inputs (including the Fund’s own assumptions and judgment in determining the fair value of investments). |
Inputs that are used in determining fair value of an investment may include price information, credit data, volatility statistics, and other factors. These inputs can be either observable or unobservable. The availability of observable inputs can vary between investments, and is affected by various factors such as the type of investment, and the volume and level of activity for that investment or similar investments in the marketplace. The inputs will be considered by the Investment Manager, along with any other relevant factors in the calculation of an investment’s fair value. The Fund uses prices and inputs that are current as of the measurement date, which may include periods of market dislocations. During these periods, the availability of prices and inputs may be reduced for many investments. This condition could cause an investment to be reclassified between the various levels within the hierarchy.
Certain investments that have been measured at fair value using the net asset value (NAV) per share (or its equivalent) are not categorized in the fair value hierarchy. The fair value amounts presented in the table are intended to reconcile the fair value hierarchy to the amounts presented in the Portfolio of Investments. The Columbia Short-Term Cash Fund seeks to provide shareholders with maximum current income consistent with liquidity and stability of principal. Columbia Short-Term Cash Fund prices its shares with a floating NAV and no longer seeks to maintain a stable NAV.
The accompanying Notes to Financial Statements are an integral part of this statement.
| 16 | Columbia Large Cap Index Fund | Annual Report 2019 |
Portfolio of Investments (continued)
February 28, 2019
Fair value measurements (continued)
Investments falling into the Level 3 category are primarily supported by quoted prices from brokers and dealers participating in the market for those investments. However, these may be classified as Level 3 investments due to lack of market transparency and corroboration to support these quoted prices. Additionally, valuation models may be used as the pricing source for any remaining investments classified as Level 3. These models may rely on one or more significant unobservable inputs and/or significant assumptions by the Investment Manager. Inputs used in valuations may include, but are not limited to, financial statement analysis, capital account balances, discount rates and estimated cash flows, and comparable company data.
Under the direction of the Fund’s Board of Trustees (the Board), the Investment Manager’s Valuation Committee (the Committee) is responsible for overseeing the valuation procedures approved by the Board. The Committee consists of voting and non-voting members from various groups within the Investment Manager’s organization, including operations and accounting, trading and investments, compliance, risk management and legal.
The Committee meets at least monthly to review and approve valuation matters, which may include a description of specific valuation determinations, data regarding pricing information received from approved pricing vendors and brokers and the results of Board-approved valuation control policies and procedures (the Policies). The Policies address, among other things, instances when market quotations are or are not readily available, including recommendations of third party pricing vendors and a determination of appropriate pricing methodologies; events that require specific valuation determinations and assessment of fair value techniques; securities with a potential for stale pricing, including those that are illiquid, restricted, or in default; and the effectiveness of third party pricing vendors, including periodic reviews of vendors. The Committee meets more frequently, as needed, to discuss additional valuation matters, which may include the need to review back-testing results, review time-sensitive information or approve related valuation actions. The Committee reports to the Board, with members of the Committee meeting with the Board at each of its regularly scheduled meetings to discuss valuation matters and actions during the period, similar to those described earlier.
For investments categorized as Level 3, the Committee monitors information similar to that described above, which may include: (i) data specific to the issuer or comparable issuers, (ii) general market or specific sector news and (iii) quoted prices and specific or similar security transactions. The Committee considers this data and any changes from prior periods in order to assess the reasonableness of observable and unobservable inputs, any assumptions or internal models used to value those securities and changes in fair value. This data is also used to corroborate, when available, information received from approved pricing vendors and brokers. Various factors impact the frequency of monitoring this information (which may occur as often as daily). However, the Committee may determine that changes to inputs, assumptions and models are not required as a result of the monitoring procedures performed.
The following table is a summary of the inputs used to value the Fund’s investments at February 28, 2019:
| | Level 1
quoted prices
in active
markets for
identical
assets ($) | Level 2
other
significant
observable
inputs ($) | Level 3
significant
unobservable
inputs ($) | Investments
measured at
net asset
value ($) | Total ($) |
| Investments in Securities | | | | | |
| Common Stocks | | | | | |
| Communication Services | 322,864,434 | — | — | — | 322,864,434 |
| Consumer Discretionary | 316,380,876 | — | — | — | 316,380,876 |
| Consumer Staples | 228,345,400 | — | — | — | 228,345,400 |
| Energy | 172,480,446 | — | — | — | 172,480,446 |
| Financials | 426,546,881 | — | — | — | 426,546,881 |
| Health Care | 473,798,697 | 0* | — | — | 473,798,697 |
| Industrials | 313,208,005 | — | — | — | 313,208,005 |
| Information Technology | 659,240,342 | — | — | — | 659,240,342 |
| Materials | 85,399,448 | — | — | — | 85,399,448 |
| Real Estate | 95,026,486 | — | — | — | 95,026,486 |
| Utilities | 103,912,204 | — | — | — | 103,912,204 |
| Total Common Stocks | 3,197,203,219 | 0* | — | — | 3,197,203,219 |
| Money Market Funds | — | — | — | 37,565,912 | 37,565,912 |
| Total Investments in Securities | 3,197,203,219 | 0* | — | 37,565,912 | 3,234,769,131 |
| Investments in Derivatives | | | | | |
| Asset | | | | | |
| Futures Contracts | 2,010,945 | — | — | — | 2,010,945 |
| Total | 3,199,214,164 | 0* | — | 37,565,912 | 3,236,780,076 |
See the Portfolio of Investments for all investment classifications not indicated in the table.
The Fund’s assets assigned to the Level 2 input category are generally valued using the market approach, in which a security’s value is determined through reference to prices and information from market transactions for similar or identical assets.
Derivative instruments are valued at unrealized appreciation (depreciation).
There were no transfers of financial assets between levels during the period.
The accompanying Notes to Financial Statements are an integral part of this statement.
Columbia Large Cap Index Fund | Annual Report 2019
| 17 |
Statement of Assets and Liabilities
February 28, 2019
| Assets | |
| Investments in securities, at value | |
| Unaffiliated issuers (cost $1,304,348,504) | $3,194,695,799 |
| Affiliated issuers (cost $37,981,684) | 40,073,332 |
| Cash | 7,123 |
| Receivable for: | |
| Investments sold | 1 |
| Capital shares sold | 3,537,546 |
| Dividends | 6,833,856 |
| Foreign tax reclaims | 7,063 |
| Expense reimbursement due from Investment Manager | 171 |
| Total assets | 3,245,154,891 |
| Liabilities | |
| Payable for: | |
| Investments purchased | 43,859 |
| Capital shares purchased | 1,979,823 |
| Variation margin for futures contracts | 165,880 |
| Management services fees | 17,808 |
| Distribution and/or service fees | 4,994 |
| Compensation of board members | 217,542 |
| Other expenses | 5,040 |
| Total liabilities | 2,434,946 |
| Net assets applicable to outstanding capital stock | $3,242,719,945 |
| Represented by | |
| Paid in capital | 1,204,755,768 |
| Total distributable earnings (loss) (Note 2) | 2,037,964,177 |
| Total - representing net assets applicable to outstanding capital stock | $3,242,719,945 |
| Class A | |
| Net assets | $726,444,812 |
| Shares outstanding | 15,041,081 |
| Net asset value per share | $48.30 |
| Institutional Class | |
| Net assets | $2,134,511,757 |
| Shares outstanding | 43,949,098 |
| Net asset value per share | $48.57 |
| Institutional 2 Class | |
| Net assets | $336,270,510 |
| Shares outstanding | 6,820,848 |
| Net asset value per share | $49.30 |
| Institutional 3 Class | |
| Net assets | $45,492,866 |
| Shares outstanding | 951,459 |
| Net asset value per share | $47.81 |
The accompanying Notes to Financial Statements are an integral part of this statement.
| 18 | Columbia Large Cap Index Fund | Annual Report 2019 |
Statement of Operations
Year Ended February 28, 2019
| Net investment income | |
| Income: | |
| Dividends — unaffiliated issuers | $74,010,044 |
| Dividends — affiliated issuers | 1,039,500 |
| Interfund lending | 81 |
| Total income | 75,049,625 |
| Expenses: | |
| Management services fees | 7,170,795 |
| Distribution and/or service fees | |
| Class A | 2,212,016 |
| Compensation of board members | 53,525 |
| Interest on interfund lending | 519 |
| Other | 25,373 |
| Total expenses | 9,462,228 |
| Fees waived or expenses reimbursed by Investment Manager and its affiliates | (78,888) |
| Expense reduction | (2,960) |
| Total net expenses | 9,380,380 |
| Net investment income | 65,669,245 |
| Realized and unrealized gain (loss) — net | |
| Net realized gain (loss) on: | |
| Investments — unaffiliated issuers | 294,284,056 |
| Investments — affiliated issuers | 472,483 |
| Futures contracts | (2,238,994) |
| Net realized gain | 292,517,545 |
| Net change in unrealized appreciation (depreciation) on: | |
| Investments — unaffiliated issuers | (209,618,782) |
| Investments — affiliated issuers | (1,048,758) |
| Futures contracts | 2,212,877 |
| Net change in unrealized appreciation (depreciation) | (208,454,663) |
| Net realized and unrealized gain | 84,062,882 |
| Net increase in net assets resulting from operations | $149,732,127 |
The accompanying Notes to Financial Statements are an integral part of this statement.
Columbia Large Cap Index Fund | Annual Report 2019
| 19 |
Statement of Changes in Net Assets
| | Year Ended
February 28, 2019 | Year Ended
February 28, 2018 |
| Operations | | |
| Net investment income | $65,669,245 | $63,620,137 |
| Net realized gain | 292,517,545 | 182,487,509 |
| Net change in unrealized appreciation (depreciation) | (208,454,663) | 333,554,853 |
| Net increase in net assets resulting from operations | 149,732,127 | 579,662,499 |
| Distributions to shareholders | | |
| Net investment income and net realized gains | | |
| Class A | (72,003,666) | |
| Institutional Class | (191,279,357) | |
| Institutional 2 Class | (28,460,122) | |
| Institutional 3 Class | (3,603,049) | |
| Net investment income | | |
| Class A | | (15,384,396) |
| Class B | | (149) |
| Institutional Class | | (42,804,202) |
| Institutional 2 Class | | (6,629,747) |
| Institutional 3 Class | | (4,241) |
| Net realized gains | | |
| Class A | | (27,097,347) |
| Class B | | (679) |
| Institutional Class | | (65,221,872) |
| Institutional 2 Class | | (10,157,156) |
| Institutional 3 Class | | (5,882) |
| Total distributions to shareholders (Note 2) | (295,346,194) | (167,305,671) |
| Decrease in net assets from capital stock activity | (329,802,578) | (386,684,888) |
| Total increase (decrease) in net assets | (475,416,645) | 25,671,940 |
| Net assets at beginning of year | 3,718,136,590 | 3,692,464,650 |
| Net assets at end of year | $3,242,719,945 | $3,718,136,590 |
| Undistributed net investment income | $9,414,518 | $8,448,266 |
The accompanying Notes to Financial Statements are an integral part of this statement.
| 20 | Columbia Large Cap Index Fund | Annual Report 2019 |
Statement of Changes in Net Assets (continued)
| | Year Ended | Year Ended |
| | February 28, 2019 | February 28, 2018 |
| | Shares | Dollars ($) | Shares | Dollars ($) |
| Capital stock activity |
| Class A | | | | |
| Subscriptions | 3,602,972 | 176,634,521 | 4,707,000 | 224,915,403 |
| Distributions reinvested | 1,393,705 | 66,633,359 | 813,690 | 39,182,125 |
| Redemptions | (8,888,336) | (426,451,981) | (10,320,886) | (490,521,356) |
| Net decrease | (3,891,659) | (183,184,101) | (4,800,196) | (226,423,828) |
| Class B | | | | |
| Distributions reinvested | — | — | 17 | 805 |
| Redemptions | — | — | (2,749) | (127,804) |
| Net decrease | — | — | (2,732) | (126,999) |
| Class I | | | | |
| Redemptions | — | — | (70) | (3,174) |
| Net decrease | — | — | (70) | (3,174) |
| Institutional Class | | | | |
| Subscriptions | 9,361,576 | 460,787,545 | 10,016,961 | 475,011,108 |
| Distributions reinvested | 3,272,218 | 157,231,884 | 1,800,955 | 87,190,588 |
| Redemptions | (15,856,072) | (781,638,149) | (14,429,962) | (691,305,469) |
| Net decrease | (3,222,278) | (163,618,720) | (2,612,046) | (129,103,773) |
| Institutional 2 Class | | | | |
| Subscriptions | 1,745,397 | 86,867,384 | 2,134,639 | 104,351,950 |
| Distributions reinvested | 583,231 | 28,449,210 | 342,222 | 16,786,649 |
| Redemptions | (2,755,072) | (139,570,550) | (3,090,111) | (152,702,170) |
| Net decrease | (426,444) | (24,253,956) | (613,250) | (31,563,571) |
| Institutional 3 Class | | | | |
| Subscriptions | 4,123,039 | 197,786,960 | 10,982 | 533,739 |
| Distributions reinvested | 76,120 | 3,602,817 | 207 | 10,000 |
| Redemptions | (3,258,741) | (160,135,578) | (148) | (7,282) |
| Net increase | 940,418 | 41,254,199 | 11,041 | 536,457 |
| Total net decrease | (6,599,963) | (329,802,578) | (8,017,253) | (386,684,888) |
The accompanying Notes to Financial Statements are an integral part of this statement.
Columbia Large Cap Index Fund | Annual Report 2019
| 21 |
The following table is intended to help you understand the Fund’s financial performance. Certain information reflects financial results for a single share of a class held for the periods shown. Per share net investment income (loss) amounts are calculated based on average shares outstanding during the period. Total return assumes reinvestment of all dividends and distributions, if any. Total return does not reflect payment of sales charges, if any. Total return and portfolio turnover are not annualized for periods of less than one year. The portfolio turnover rate is calculated without regard to purchase and sales transactions of short-term instruments and certain derivatives, if any. If such transactions were included, the Fund’s portfolio turnover rate may be higher.
| | Net asset value,
beginning of
period | Net
investment
income | Net
realized
and
unrealized
gain (loss) | Total from
investment
operations | Distributions
from net
investment
income | Distributions
from net
realized
gains | Total
distributions to
shareholders |
| Class A |
| Year Ended 2/28/2019 | $50.42 | 0.81 | 1.18 | 1.99 | (0.83) | (3.28) | (4.11) |
| Year Ended 2/28/2018 | $45.16 | 0.73 | 6.65 | 7.38 | (0.77) | (1.35) | (2.12) |
| Year Ended 2/28/2017 | $37.05 | 0.73 | 8.24 | 8.97 | (0.73) | (0.13) | (0.86) |
| Year Ended 2/29/2016 | $40.60 | 0.64 | (3.24) | (2.60) | (0.85) | (0.10) | (0.95) |
| Year Ended 2/28/2015 | $35.85 | 0.83 | 4.52 | 5.35 | (0.58) | (0.02) | (0.60) |
| Institutional Class |
| Year Ended 2/28/2019 | $50.68 | 0.94 | 1.18 | 2.12 | (0.95) | (3.28) | (4.23) |
| Year Ended 2/28/2018 | $45.38 | 0.85 | 6.69 | 7.54 | (0.89) | (1.35) | (2.24) |
| Year Ended 2/28/2017 | $37.22 | 0.84 | 8.28 | 9.12 | (0.83) | (0.13) | (0.96) |
| Year Ended 2/29/2016 | $40.78 | 0.75 | (3.26) | (2.51) | (0.95) | (0.10) | (1.05) |
| Year Ended 2/28/2015 | $36.00 | 0.89 | 4.59 | 5.48 | (0.68) | (0.02) | (0.70) |
| Institutional 2 Class |
| Year Ended 2/28/2019 | $51.38 | 0.95 | 1.20 | 2.15 | (0.95) | (3.28) | (4.23) |
| Year Ended 2/28/2018 | $45.98 | 0.87 | 6.77 | 7.64 | (0.89) | (1.35) | (2.24) |
| Year Ended 2/28/2017 | $37.70 | 0.85 | 8.39 | 9.24 | (0.83) | (0.13) | (0.96) |
| Year Ended 2/29/2016 | $41.29 | 0.84 | (3.38) | (2.54) | (0.95) | (0.10) | (1.05) |
| Year Ended 2/28/2015 | $36.45 | 0.94 | 4.60 | 5.54 | (0.68) | (0.02) | (0.70) |
| Institutional 3 Class |
| Year Ended 2/28/2019 | $49.95 | 0.92 | 1.17 | 2.09 | (0.95) | (3.28) | (4.23) |
| Year Ended 2/28/2018(f) | $45.37 | 0.98 | 5.84 | 6.82 | (0.89) | (1.35) | (2.24) |
| Notes to Financial Highlights |
| (a) | In addition to the fees and expenses that the Fund bears directly, the Fund indirectly bears a pro rata share of the fees and expenses of any other funds in which it invests. Such indirect expenses are not included in the Fund’s reported expense ratios. |
| (b) | Total net expenses include the impact of certain fee waivers/expense reimbursements made by the Investment Manager and certain of its affiliates, if applicable. |
| (c) | Ratios include interfund lending expense which is less than 0.01%. |
| (d) | The benefits derived from expense reductions had an impact of less than 0.01%. |
| (e) | Ratios include line of credit interest expense which is less than 0.01%. |
| (f) | Institutional 3 Class shares commenced operations on March 1, 2017. Per share data and total return reflect activity from that date. |
The accompanying Notes to Financial Statements are an integral part of this statement.
| 22 | Columbia Large Cap Index Fund | Annual Report 2019 |
Financial Highlights (continued)
| | Net
asset
value,
end of
period | Total
return | Total gross
expense
ratio to
average
net assets(a) | Total net
expense
ratio to
average
net assets(a),(b) | Net investment
income
ratio to
average
net assets | Portfolio
turnover | Net
assets,
end of
period
(000’s) |
| Class A |
| Year Ended 2/28/2019 | $48.30 | 4.19% | 0.45%(c) | 0.45%(c),(d) | 1.64% | 6% | $726,445 |
| Year Ended 2/28/2018 | $50.42 | 16.59% | 0.45% | 0.45%(d) | 1.53% | 2% | $954,529 |
| Year Ended 2/28/2017 | $45.16 | 24.40% | 0.45%(e) | 0.45%(d),(e) | 1.77% | 4% | $1,071,791 |
| Year Ended 2/29/2016 | $37.05 | (6.57%) | 0.45% | 0.45%(d) | 1.63% | 11% | $993,376 |
| Year Ended 2/28/2015 | $40.60 | 14.98% | 0.45% | 0.45%(d) | 2.18% | 5% | $1,126,444 |
| Institutional Class |
| Year Ended 2/28/2019 | $48.57 | 4.46% | 0.20%(c) | 0.20%(c),(d) | 1.89% | 6% | $2,134,512 |
| Year Ended 2/28/2018 | $50.68 | 16.88% | 0.20% | 0.20%(d) | 1.78% | 2% | $2,390,677 |
| Year Ended 2/28/2017 | $45.38 | 24.72% | 0.20%(e) | 0.20%(d),(e) | 2.02% | 4% | $2,259,128 |
| Year Ended 2/29/2016 | $37.22 | (6.34%) | 0.20% | 0.20%(d) | 1.88% | 11% | $1,975,099 |
| Year Ended 2/28/2015 | $40.78 | 15.27% | 0.20% | 0.20%(d) | 2.33% | 5% | $2,406,361 |
| Institutional 2 Class |
| Year Ended 2/28/2019 | $49.30 | 4.45% | 0.20%(c) | 0.20%(c) | 1.89% | 6% | $336,271 |
| Year Ended 2/28/2018 | $51.38 | 16.87% | 0.20% | 0.20% | 1.78% | 2% | $372,379 |
| Year Ended 2/28/2017 | $45.98 | 24.73% | 0.20%(e) | 0.20%(e) | 2.02% | 4% | $361,419 |
| Year Ended 2/29/2016 | $37.70 | (6.33%) | 0.20% | 0.20% | 2.12% | 11% | $273,170 |
| Year Ended 2/28/2015 | $41.29 | 15.25% | 0.20% | 0.20% | 2.44% | 5% | $170,244 |
| Institutional 3 Class |
| Year Ended 2/28/2019 | $47.81 | 4.46% | 0.20%(c) | 0.20%(c) | 1.91% | 6% | $45,493 |
| Year Ended 2/28/2018(f) | $49.95 | 15.29% | 0.21% | 0.20% | 2.01% | 2% | $552 |
The accompanying Notes to Financial Statements are an integral part of this statement.
Columbia Large Cap Index Fund | Annual Report 2019
| 23 |
Notes to Financial Statements
February 28, 2019
Note 1. Organization
Columbia Large Cap Index Fund (the Fund), a series of Columbia Funds Series Trust (the Trust), is a diversified fund. The Trust is registered under the Investment Company Act of 1940, as amended (the 1940 Act), as an open-end management investment company organized as a Delaware statutory trust.
Fund shares
The Trust may issue an unlimited number of shares (without par value). Although all share classes generally have identical voting, dividend and liquidation rights, each share class votes separately when required by the Trust’s organizational documents or by law. Different share classes pay different distribution amounts to the extent the expenses of such share classes differ, and distributions in liquidation will be proportional to the net asset value of each share class. Each share class has its own expense and sales charge structure. The Fund offers each of the share classes identified below.
Class A shares are not subject to any front-end sales charge or contingent deferred sales charge.
Institutional Class shares are not subject to sales charges and are generally available only to eligible investors, which are subject to different investment minimums as described in the Fund’s prospectus.
Institutional 2 Class shares are not subject to sales charges and are generally available only to investors purchasing through authorized investment professionals and omnibus retirement plans as described in the Fund’s prospectus.
Institutional 3 Class shares are not subject to sales charges and are available to institutional and certain other investors as described in the Fund’s prospectus.
Note 2. Summary of significant accounting policies
Basis of preparation
The Fund is an investment company that applies the accounting and reporting guidance in the Financial Accounting Standards Board (FASB) Accounting Standards Codification Topic 946,Financial Services - Investment Companies (ASC 946). The financial statements are prepared in accordance with U.S. generally accepted accounting principles (GAAP), which requires management to make certain estimates and assumptions that affect the reported amounts of assets and liabilities, the disclosure of contingent assets and liabilities at the date of the financial statements and the reported amounts of income and expenses during the reporting period. Actual results could differ from those estimates.
The following is a summary of significant accounting policies followed by the Fund in the preparation of its financial statements.
Security valuation
All equity securities are valued at the close of business of the New York Stock Exchange. Equity securities are valued at the last quoted sales price on the principal exchange or market on which they trade, except for securities traded on the NASDAQ Stock Market, which are valued at the NASDAQ official close price. Unlisted securities or listed securities for which there were no sales during the day are valued at the mean of the latest quoted bid and ask prices on such exchanges or markets.
Foreign equity securities are valued based on the closing price on the foreign exchange in which such securities are primarily traded. If any foreign equity security closing prices are not readily available, the securities are valued at the mean of the latest quoted bid and ask prices on such exchanges or markets. Foreign currency exchange rates are generally determined at 4:00 p.m. Eastern (U.S.) time. Many securities markets and exchanges outside the U.S. close prior to the close of the New York Stock Exchange; therefore, the closing prices for securities in such markets or on such exchanges may not fully reflect events that occur after such close but before the close of the New York Stock Exchange. In those situations, foreign securities will be fair valued pursuant to a policy adopted by the Board of Trustees, including, if available, utilizing a third party pricing service to determine these fair values. The third party pricing service takes into account multiple factors, including, but not limited to, movements in the U.S. securities markets, certain depositary receipts, futures contracts and foreign exchange
| 24 | Columbia Large Cap Index Fund | Annual Report 2019 |
Notes to Financial Statements (continued)
February 28, 2019
rates that have occurred subsequent to the close of the foreign exchange or market, to determine a good faith estimate that reasonably reflects the current market conditions as of the close of the New York Stock Exchange. The fair value of a security is likely to be different from the quoted or published price, if available.
Investments in open-end investment companies, including money market funds, are valued at their latest net asset value.
Futures and options on futures contracts are valued based upon the settlement price at the close of regular trading on their principal exchanges or, in the absence of transactions, at the mean of the latest quoted bid and ask prices.
Investments for which market quotations are not readily available, or that have quotations which management believes are not reflective of market value or reliable, are valued at fair value as determined in good faith under procedures approved by and under the general supervision of the Board of Trustees. If a security or class of securities (such as foreign securities) is valued at fair value, such value is likely to be different from the quoted or published price for the security.
The determination of fair value often requires significant judgment. To determine fair value, management may use assumptions including but not limited to future cash flows and estimated risk premiums. Multiple inputs from various sources may be used to determine fair value.
GAAP requires disclosure regarding the inputs and valuation techniques used to measure fair value and any changes in valuation inputs or techniques. In addition, investments shall be disclosed by major category. This information is disclosed following the Fund’s Portfolio of Investments.
Derivative instruments
The Fund invests in certain derivative instruments, as detailed below, to meet its investment objectives. Derivatives are instruments whose values depend on, or are derived from, in whole or in part, the value of one or more securities, currencies, commodities, indices, or other assets or instruments. Derivatives may be used to increase investment flexibility (including to maintain cash reserves while maintaining desired exposure to certain assets), for risk management (hedging) purposes, to facilitate trading, to reduce transaction costs and to pursue higher investment returns. The Fund may also use derivative instruments to mitigate certain investment risks, such as foreign currency exchange rate risk, interest rate risk and credit risk. Derivatives may involve various risks, including the potential inability of the counterparty to fulfill its obligations under the terms of the contract, the potential for an illiquid secondary market (making it difficult for the Fund to sell or terminate, including at favorable prices) and the potential for market movements which may expose the Fund to gains or losses in excess of the amount shown in the Statement of Assets and Liabilities. The notional amounts of derivative instruments, if applicable, are not recorded in the financial statements.
A derivative instrument may suffer a marked-to-market loss if the value of the contract decreases due to an unfavorable change in the market rates or values of the underlying instrument. Losses can also occur if the counterparty does not perform its obligations under the contract. The Fund’s risk of loss from counterparty credit risk on over-the-counter derivatives is generally limited to the aggregate unrealized gain netted against any collateral held by the Fund and the amount of any variation margin held by the counterparty, plus any replacement costs or related amounts. With exchange-traded or centrally cleared derivatives, there is reduced counterparty credit risk to the Fund since the clearinghouse or central counterparty (CCP) provides some protection in the case of clearing member default. The clearinghouse or CCP stands between the buyer and the seller of the contract; therefore, additional counterparty credit risk is failure of the clearinghouse or CCP. However, credit risk still exists in exchange-traded or centrally cleared derivatives with respect to initial and variation margin that is held in a broker’s customer account. While brokers are required to segregate customer margin from their own assets, in the event that a broker becomes insolvent or goes into bankruptcy and at that time there is a shortfall in the aggregate amount of margin held by the broker for all its clients, U.S. bankruptcy laws will typically allocate that shortfall on a pro-rata basis across all the broker’s customers (including the Fund), potentially resulting in losses to the Fund.
In order to better define its contractual rights and to secure rights that will help the Fund mitigate its counterparty risk, the Fund may enter into an International Swaps and Derivatives Association, Inc. Master Agreement (ISDA Master Agreement) or similar agreement with its derivatives contract counterparties. An ISDA Master Agreement is an agreement between the Fund and a counterparty that governs over-the-counter derivatives and typically contains, among other things, collateral posting terms and netting provisions in the event of a default and/or termination event. Under an ISDA Master Agreement, the Fund
Columbia Large Cap Index Fund | Annual Report 2019
| 25 |
Notes to Financial Statements (continued)
February 28, 2019
may, under certain circumstances, offset with the counterparty certain derivative instrument’s payables and/or receivables with collateral held and/or posted and create one single net payment. The provisions of the ISDA Master Agreement typically permit a single net payment in the event of default (close-out netting), including the bankruptcy or insolvency of the counterparty. Note, however, that bankruptcy or insolvency laws of a particular jurisdiction may impose restrictions on or prohibitions against the right of offset or netting in bankruptcy, insolvency or other events.
Collateral (margin) requirements differ by type of derivative. Margin requirements are established by the clearinghouse or CCP for exchange-traded and centrally cleared derivatives. Brokers can ask for margin in excess of the minimum in certain circumstances. Collateral terms are contract specific for over-the-counter derivatives. For over-the-counter derivatives traded under an ISDA Master Agreement, the collateral requirements are typically calculated by netting the marked-to-market amount for each transaction under such agreement and comparing that amount to the value of any variation margin currently pledged by the Fund and/or the counterparty. Generally, the amount of collateral due from or to a party has to exceed a minimum transfer amount threshold (e.g., $250,000) before a transfer has to be made. To the extent amounts due to the Fund from its counterparties are not fully collateralized, contractually or otherwise, the Fund bears the risk of loss from counterparty nonperformance. The Fund may also pay interest expense on cash collateral received from the broker. Any interest expense paid by the Fund is shown on the Statement of Operations. The Fund attempts to mitigate counterparty risk by only entering into agreements with counterparties that it believes have the financial resources to honor their obligations and by monitoring the financial stability of those counterparties.
Certain ISDA Master Agreements allow counterparties of over-the-counter derivatives transactions to terminate derivatives contracts prior to maturity in the event the Fund’s net asset value declines by a stated percentage over a specified time period or if the Fund fails to meet certain terms of the ISDA Master Agreement, which would cause the Fund to accelerate payment of any net liability owed to the counterparty. The Fund also has termination rights if the counterparty fails to meet certain terms of the ISDA Master Agreement. In determining whether to exercise such termination rights, the Fund would consider, in addition to counterparty credit risk, whether termination would result in a net liability owed from the counterparty.
For financial reporting purposes, the Fund does not offset derivative assets and derivative liabilities that are subject to netting arrangements in the Statement of Assets and Liabilities.
Futures contracts
Futures contracts are exchange-traded and represent commitments for the future purchase or sale of an asset at a specified price on a specified date. The Fund bought and sold futures contracts to maintain appropriate equity market exposure while keeping sufficient cash to accommodate daily redemptions. These instruments may be used for other purposes in future periods. Upon entering into futures contracts, the Fund bears risks that it may not achieve the anticipated benefits of the futures contracts and may realize a loss. Additional risks include counterparty credit risk, the possibility of an illiquid market, and that a change in the value of the contract or option may not correlate with changes in the value of the underlying asset.
Upon entering into a futures contract, the Fund deposits cash or securities with the broker, known as a futures commission merchant (FCM), in an amount sufficient to meet the initial margin requirement. The initial margin deposit must be maintained at an established level over the life of the contract. Cash deposited as initial margin is recorded in the Statement of Assets and Liabilities as margin deposits. Securities deposited as initial margin are designated in the Portfolio of Investments. Subsequent payments (variation margin) are made or received by the Fund each day. The variation margin payments are equal to the daily change in the contract value and are recorded as variation margin receivable or payable and are offset in unrealized gains or losses. The Fund recognizes a realized gain or loss when the contract is closed or expires. Futures contracts involve, to varying degrees, risk of loss in excess of the variation margin disclosed in the Statement of Assets and Liabilities.
Effects of derivative transactions in the financial statements
The following tables are intended to provide additional information about the effect of derivatives on the financial statements of the Fund, including: the fair value of derivatives by risk category and the location of those fair values in the Statement of Assets and Liabilities; and the impact of derivative transactions over the period in the Statement of Operations, including realized and unrealized gains (losses). The derivative instrument schedules following the Portfolio of Investments present additional information regarding derivative instruments outstanding at the end of the period, if any.
| 26 | Columbia Large Cap Index Fund | Annual Report 2019 |
Notes to Financial Statements (continued)
February 28, 2019
The following table is a summary of the fair value of derivative instruments (not considered to be hedging instruments for accounting disclosure purposes) at February 28, 2019:
| | Asset derivatives | |
Risk exposure
category | Statement
of assets and liabilities
location | Fair value ($) |
| Equity risk | Component of total distributable earnings (loss) — unrealized appreciation on futures contracts | 2,010,945* |
| * | Includes cumulative appreciation (depreciation) as reported in the tables following the Portfolio of Investments. Only the current day’s variation margin is reported in receivables or payables in the Statement of Assets and Liabilities. |
The following table indicates the effect of derivative instruments (not considered to be hedging instruments for accounting disclosure purposes) in the Statement of Operations for the year ended February 28, 2019:
| Amount of realized gain (loss) on derivatives recognized in income |
| Risk exposure category | Futures
contracts
($) |
| Equity risk | (2,238,994) |
| |
| Change in unrealized appreciation (depreciation) on derivatives recognized in income |
| Risk exposure category | Futures
contracts
($) |
| Equity risk | 2,212,877 |
The following table is a summary of the average outstanding volume by derivative instrument for the year ended February 28, 2019:
| Derivative instrument | Average notional
amounts ($)* |
| Futures contracts — long | 37,473,205 |
| * | Based on the ending quarterly outstanding amounts for the year ended February 28, 2019. |
Security transactions
Security transactions are accounted for on the trade date. Cost is determined and gains (losses) are based upon the specific identification method for both financial statement and federal income tax purposes.
Income recognition
Corporate actions and dividend income are generally recorded net of any non-reclaimable tax withholdings, on the ex-dividend date or upon receipt of ex-dividend notification in the case of certain foreign securities.
The Fund may receive distributions from holdings in equity securities, business development companies (BDCs), exchange-traded funds (ETFs), limited partnerships (LPs), other regulated investment companies (RICs), and real estate investment trusts (REITs), which report information on the tax character of their distributions annually. These distributions are allocated to dividend income, capital gain and return of capital based on actual information reported. Return of capital is recorded as a reduction of the cost basis of securities held. If the Fund no longer owns the applicable securities, return of capital is recorded as a realized gain. With respect to REITs, to the extent actual information has not yet been reported, estimates for return of capital are made by the Fund’s management. Management’s estimates are subsequently adjusted when the actual character of the distributions is disclosed by the REITs, which could result in a proportionate change in return of capital to shareholders.
Awards from class action litigation are recorded as a reduction of cost basis if the Fund still owns the applicable securities on the payment date. If the Fund no longer owns the applicable securities, the proceeds are recorded as realized gains.
Columbia Large Cap Index Fund | Annual Report 2019
| 27 |
Notes to Financial Statements (continued)
February 28, 2019
Expenses
General expenses of the Trust are allocated to the Fund and other funds of the Trust based upon relative net assets or other expense allocation methodologies determined by the nature of the expense. Expenses directly attributable to the Fund are charged to the Fund. Expenses directly attributable to a specific class of shares are charged to that share class.
Determination of class net asset value
All income, expenses (other than class-specific expenses, which are charged to that share class, as shown in the Statement of Operations) and realized and unrealized gains (losses) are allocated to each class of the Fund on a daily basis, based on the relative net assets of each class, for purposes of determining the net asset value of each class.
Federal income tax status
The Fund intends to qualify each year as a regulated investment company under Subchapter M of the Internal Revenue Code, as amended, and will distribute substantially all of its investment company taxable income and net capital gain, if any, for its tax year, and as such will not be subject to federal income taxes. In addition, the Fund intends to distribute in each calendar year substantially all of its ordinary income, capital gain net income and certain other amounts, if any, such that the Fund should not be subject to federal excise tax. Therefore, no federal income or excise tax provision is recorded.
Foreign taxes
The Fund may be subject to foreign taxes on income, gains on investments or currency repatriation, a portion of which may be recoverable. The Fund will accrue such taxes and recoveries, as applicable, based upon its current interpretation of tax rules and regulations that exist in the markets in which it invests.
Realized gains in certain countries may be subject to foreign taxes at the Fund level, based on statutory rates. The Fund accrues for such foreign taxes on realized and unrealized gains at the appropriate rate for each jurisdiction, as applicable. The amount, if any, is disclosed as a liability on the Statement of Assets and Liabilities.
Distributions to shareholders
Distributions from net investment income, if any, are declared and paid semi-annually. Net realized capital gains, if any, are distributed at least annually. Income distributions and capital gain distributions are determined in accordance with federal income tax regulations, which may differ from GAAP.
Guarantees and indemnifications
Under the Trust’s organizational documents and, in some cases, by contract, its officers and trustees are indemnified against certain liabilities arising out of the performance of their duties to the Trust or its funds. In addition, certain of the Fund’s contracts with its service providers contain general indemnification clauses. The Fund’s maximum exposure under these arrangements is unknown since the amount of any future claims that may be made against the Fund cannot be determined, and the Fund has no historical basis for predicting the likelihood of any such claims.
Recent accounting pronouncements
Accounting Standards Update 2017-08 Premium Amortization on Purchased Callable Debt Securities
In March 2017, the Financial Accounting Standards Board issued Accounting Standards Update (ASU) No. 2017-08 Premium Amortization on Purchased Callable Debt Securities. ASU No. 2017-08 updates the accounting standards to shorten the amortization period for certain purchased callable debt securities, held at a premium, to be amortized to the earliest call date. The update applies to securities with explicit, noncontingent call features that are callable at fixed prices and on preset dates. The standard is effective for annual periods beginning after December 15, 2018 and interim periods within those fiscal years. Management does not expect the implementation of this guidance to have a material impact on the financial statement amounts and footnote disclosures.
Accounting Standards Update 2018-13 Disclosure Framework - Changes to the Disclosure Requirements for Fair Value Measurement
| 28 | Columbia Large Cap Index Fund | Annual Report 2019 |
Notes to Financial Statements (continued)
February 28, 2019
In August 2018, the Financial Accounting Standards Board issued Accounting Standards Update (ASU) No. 2018-13 Disclosure Framework - Changes to the Disclosure Requirements for Fair Value Measurement. ASU No. 2018-13, in addition to other modifications and additions, removes the requirement to disclose the amount and reasons for transfers between Level 1 and Level 2 of the fair value hierarchy and the policy for the timing of transfers between levels. The standard is effective for annual periods beginning after December 15, 2019 and interim periods within those fiscal years. At this time, management is evaluating the implication of this guidance and the impact it will have on the financial statement disclosures, if any.
Disclosure Update and Simplification
In September 2018, the Securities and Exchange Commission (SEC) released Final Rule 33-10532, Disclosure Update and Simplification, which amends certain financial statement disclosure requirements that the SEC determined to be redundant, outdated, or superseded in light of other SEC disclosure requirements, GAAP, or changes in the information environment. As a result of the amendments, management implemented disclosure changes which included removing the components of distributable earnings presented on the Statement of Assets and Liabilities and combining income and gain distributions paid to shareholders as presented on the Statement of Changes in Net Assets. Any values presented to meet prior year requirements were left unchanged. The amendments had no effect on the Fund’s net assets or results of operation.
Note 3. Fees and other transactions with affiliates
Management services fees
The Fund has entered into a Management Agreement with Columbia Management Investment Advisers, LLC (the Investment Manager), a wholly-owned subsidiary of Ameriprise Financial, Inc. (Ameriprise Financial). Under the Management Agreement, the Investment Manager provides the Fund with investment research and advice, as well as administrative and accounting services. The management services fee is an annual fee that is equal to 0.20% of the Fund’s daily net assets.
The Investment Manager, from the management services fee it receives from the Fund, pays all operating expenses of the Fund, with the exception of brokerage fees and commissions, taxes, interest, fees and expenses of Board of Trustees who are not officers, directors or employees of the Investment Manager or its affiliates, distribution and/or shareholder servicing and any extraordinary non-recurring expenses that may arise, including litigation fees.
Compensation of board members
Members of the Board of Trustees who are not officers or employees of the Investment Manager or Ameriprise Financial are compensated for their services to the Fund as disclosed in the Statement of Operations. Under a Deferred Compensation Plan (the Deferred Plan), these members of the Board of Trustees may elect to defer payment of up to 100% of their compensation. Deferred amounts are treated as though equivalent dollar amounts had been invested in shares of certain funds managed by the Investment Manager. The Fund’s liability for these amounts is adjusted for market value changes and remains in the Fund until distributed in accordance with the Deferred Plan. All amounts payable under the Deferred Plan constitute a general unsecured obligation of the Fund.
Compensation of Chief Compliance Officer
The Board of Trustees has appointed a Chief Compliance Officer to the Fund in accordance with federal securities regulations. A portion of the Chief Compliance Officer’s total compensation is allocated to the Fund, along with other allocations to affiliated registered investment companies managed by the Investment Manager and its affiliates, based on relative net assets. The expenses of the Chief Compliance Officer allocated to the Fund are payable by the Investment Manager.
Transfer agency fees
Under a Transfer and Dividend Disbursing Agent Agreement, Columbia Management Investment Services Corp. (the Transfer Agent), an affiliate of the Investment Manager and a wholly-owned subsidiary of Ameriprise Financial, is responsible for providing transfer agency services to the Fund. The Transfer Agent has contracted with DST Asset Manager Solutions, Inc. (DST) to serve as sub-transfer agent.
Columbia Large Cap Index Fund | Annual Report 2019
| 29 |
Notes to Financial Statements (continued)
February 28, 2019
The transfer agency fees are payable by the Investment Manager. The Transfer Agent pays the fees of DST for services as sub-transfer agent and DST is not entitled to reimbursement for such fees from the Fund. The Transfer Agent also receives compensation from the Investment Manager for various shareholder services and reimbursements for certain out-of-pocket expenses.
An annual minimum account balance fee of $20 may apply to certain accounts with a value below the applicable share class’s initial minimum investment requirements to reduce the impact of small accounts on transfer agency fees. These minimum account balance fees are remitted to the Fund and recorded as part of expense reductions in the Statement of Operations. For the year ended February 28, 2019, these minimum account balance fees reduced total expenses of the Fund by $2,960.
Distribution and service fees
The Fund has entered into an agreement with Columbia Management Investment Distributors, Inc. (the Distributor), an affiliate of the Investment Manager and a wholly-owned subsidiary of Ameriprise Financial, for distribution and shareholder services. The Board of Trustees has approved, and the Fund has adopted, distribution and shareholder service plans (the Plans) applicable to certain share classes, which set the distribution and service fees for the Fund. These fees are calculated daily and are intended to compensate the Distributor and/or eligible selling and/or servicing agents for selling shares of the Fund and providing services to investors.
Under the Plans, the Fund pays a monthly combined distribution and service fee to the Distributor at the maximum annual rate of 0.25% of the average daily net assets attributable to Class A shares of the Fund.
Expenses waived/reimbursed by the Investment Manager and its affiliates
The Investment Manager and certain of its affiliates have contractually agreed to waive fees and/or reimburse expenses (excluding certain fees and expenses described below) for the period(s) disclosed below, unless sooner terminated at the sole discretion of the Board of Trustees, so that the Fund’s net operating expenses, after giving effect to fees waived/expenses reimbursed and any balance credits and/or overdraft charges from the Fund’s custodian, do not exceed the following annual rate(s) as a percentage of the class’ average daily net assets:
| | Fee rate(s) contractual
through
June 30, 2019 |
| Class A | 0.45% |
| Institutional Class | 0.20 |
| Institutional 2 Class | 0.20 |
| Institutional 3 Class | 0.20 |
Under the agreement governing these fee waivers and/or expense reimbursement arrangements, the following fees and expenses are excluded from the waiver/reimbursement commitment, and therefore will be paid by the Fund, if applicable: taxes (including foreign transaction taxes), expenses associated with investments in affiliated and non-affiliated pooled investment vehicles (including mutual funds and exchange-traded funds), transaction costs and brokerage commissions, costs related to any securities lending program, dividend expenses associated with securities sold short, inverse floater program fees and expenses, transaction charges and interest on borrowed money, interest, infrequent and/or unusual expenses and any other expenses the exclusion of which is specifically approved by the Board of Trustees. This agreement may be modified or amended only with approval from the Investment Manager, certain of its affiliates and the Fund. Any fees waived and/or expenses reimbursed under the expense reimbursement arrangements described above are not recoverable by the Investment Manager or its affiliates in future periods.
Note 4. Federal tax information
The timing and character of income and capital gain distributions are determined in accordance with income tax regulations, which may differ from GAAP because of temporary or permanent book to tax differences.
| 30 | Columbia Large Cap Index Fund | Annual Report 2019 |
Notes to Financial Statements (continued)
February 28, 2019
At February 28, 2019, these differences were primarily due to differing treatment for deferral/reversal of wash sale losses, re-characterization of distributions for investments, derivative investments, post-October capital losses, trustees’ deferred compensation and capital change due to corporate action. To the extent these differences were permanent, reclassifications were made among the components of the Fund’s net assets. Temporary differences do not require reclassifications.
The following reclassifications were made:
Undistributed net
investment
income ($) | Accumulated
net realized
gain ($) | Paid in
capital ($) |
| (590,680) | 590,680 | — |
Net investment income (loss) and net realized gains (losses), as disclosed in the Statement of Operations, and net assets were not affected by this reclassification.
The tax character of distributions paid during the years indicated was as follows:
| Year Ended February 28, 2019 | Year Ended February 28, 2018 |
Ordinary
income ($) | Long-term
capital gains ($) | Total ($) | Ordinary
income ($) | Long-term
capital gains ($) | Total ($) |
| 65,174,131 | 230,172,063 | 295,346,194 | 64,822,735 | 102,482,936 | 167,305,671 |
Short-term capital gain distributions, if any, are considered ordinary income distributions for tax purposes.
At February 28, 2019, the components of distributable earnings on a tax basis were as follows:
Undistributed
ordinary income ($) | Undistributed
long-term
capital gains ($) | Capital loss
carryforwards ($) | Net unrealized
appreciation ($) |
| 10,197,656 | 165,572,156 | — | 1,869,414,333 |
At February 28, 2019, the cost of all investments for federal income tax purposes along with the aggregate gross unrealized appreciation and depreciation based on that cost was:
Federal
tax cost ($) | Gross unrealized
appreciation ($) | Gross unrealized
(depreciation) ($) | Net unrealized
appreciation ($) |
| 1,367,365,743 | 1,932,954,462 | (63,540,129) | 1,869,414,333 |
Tax cost of investments and unrealized appreciation/(depreciation) may also include timing differences that do not constitute adjustments to tax basis.
Under current tax rules, regulated investment companies can elect to treat certain late-year ordinary losses incurred and post-October capital losses (capital losses realized after October 31) as arising on the first day of the following taxable year. As of February 28, 2019, the Fund will elect to treat the following late-year ordinary losses and post-October capital losses as arising on March 1, 2019.
Late year
ordinary losses ($) | Post-October
capital losses ($) |
| — | 6,508,027 |
Management of the Fund has concluded that there are no significant uncertain tax positions in the Fund that would require recognition in the financial statements. However, management’s conclusion may be subject to review and adjustment at a later date based on factors including, but not limited to, new tax laws, regulations, and administrative interpretations (including relevant court decisions). Generally, the Fund’s federal tax returns for the prior three fiscal years remain subject to examination by the Internal Revenue Service.
Columbia Large Cap Index Fund | Annual Report 2019
| 31 |
Notes to Financial Statements (continued)
February 28, 2019
Note 5. Portfolio information
The cost of purchases and proceeds from sales of securities, excluding short-term investments and derivatives, if any, aggregated to $206,937,808 and $766,008,195, respectively, for the year ended February 28, 2019. The amount of purchase and sale activity impacts the portfolio turnover rate reported in the Financial Highlights.
Note 6. Affiliated money market fund
The Fund invests in Columbia Short-Term Cash Fund, an affiliated money market fund established for the exclusive use by the Fund and other affiliated funds (the Affiliated MMF). The income earned by the Fund from such investments is included as Dividends - affiliated issuers in the Statement of Operations. As an investing fund, the Fund indirectly bears its proportionate share of the expenses of the Affiliated MMF. The Affiliated MMF prices its shares with a floating net asset value. In addition, the Board of Trustees of the Affiliated MMF may impose a fee on redemptions (sometimes referred to as a liquidity fee) or temporarily suspend redemptions (sometimes referred to as imposing a redemption gate) in the event its liquidity falls below regulatory limits.
Note 7. Interfund lending
Pursuant to an exemptive order granted by the Securities and Exchange Commission, the Fund participates in a program (the Interfund Program) allowing each participating Columbia Fund (each, a Participating Fund) to lend money directly to and, except for closed-end funds and money market funds, borrow money directly from other Participating Funds for temporary purposes. The amounts eligible for borrowing and lending under the Interfund Program are subject to certain restrictions.
Interfund loans are subject to the risk that the borrowing fund could be unable to repay the loan when due, and a delay in repayment to the lending fund could result in lost opportunities and/or additional lending costs. The exemptive order is subject to conditions intended to mitigate conflicts of interest arising from the Investment Manager’s relationship with each Participating Fund.
The Fund’s activity in the Interfund Program during the year ended February 28, 2019 was as follows:
| Borrower or lender | Average loan
balance ($) | Weighted average
interest rate (%) | Days
outstanding |
| Borrower | 3,200,000 | 2.73 | 2 |
| Lender | 500,000 | 2.94 | 2 |
Interest income earned and interest expense incurred by the Fund is recorded as Interfund lending in the Statement of Operations. The Fund had no outstanding interfund loans at February 28, 2019.
Note 8. Line of credit
The Fund has access to a revolving credit facility with a syndicate of banks led by Citibank, N.A., HSBC Bank USA, N.A. and JPMorgan Chase Bank, N.A. whereby the Fund may borrow for the temporary funding of shareholder redemptions or for other temporary or emergency purposes. The credit facility, which is a collective agreement between the Fund and certain other funds managed by the Investment Manager or an affiliated investment manager, severally and not jointly, permits collective borrowings up to $1 billion. Interest is charged to each participating fund based on its borrowings at a rate equal to the higher of (i) the federal funds effective rate, (ii) the one-month LIBOR rate and (iii) the overnight bank funding rate, plus in each case, 1.00%. Each borrowing under the credit facility matures no later than 60 days after the date of borrowing. The Fund also pays a commitment fee equal to its pro rata share of the unused amount of the credit facility at a rate of 0.15% per annum. The commitment fee is included in other expenses in the Statement of Operations. This agreement expires annually in December unless extended or renewed.
The Fund had no borrowings during the year ended February 28, 2019.
| 32 | Columbia Large Cap Index Fund | Annual Report 2019 |
Notes to Financial Statements (continued)
February 28, 2019
Note 9. Significant risks
Shareholder concentration risk
At February 28, 2019, one unaffiliated shareholder of record owned 11.6% of the outstanding shares of the Fund in one or more accounts. The Fund has no knowledge about whether any portion of those shares was owned beneficially. Affiliated shareholders of record owned 20.6% of the outstanding shares of the Fund in one or more accounts. Subscription and redemption activity by concentrated accounts may have a significant effect on the operations of the Fund. In the case of a large redemption, the Fund may be forced to sell investments at inopportune times, including its liquid positions, which may result in Fund losses and the Fund holding a higher percentage of less liquid positions. Large redemptions could result in decreased economies of scale and increased operating expenses for non-redeeming Fund shareholders.
Technology and technology-related investment risk
The Fund may be more susceptible to the particular risks that may affect companies in the information technology sector, as well as other technology-related sectors (collectively, the technology sectors) than if it were invested in a wider variety of companies in unrelated sectors. Companies in the technology sectors are subject to certain risks, including the risk that new services, equipment or technologies will not be accepted by consumers and businesses or will become rapidly obsolete. Performance of such companies may be affected by factors including obtaining and protecting patents (or the failure to do so) and significant competitive pressures, including aggressive pricing of their products or services, new market entrants, competition for market share and short product cycles due to an accelerated rate of technological developments. Such competitive pressures may lead to limited earnings and/or falling profit margins. As a result, the value of their securities may fall or fail to rise. In addition, many technology sector companies have limited operating histories and prices of these companies’ securities historically have been more volatile than other securities, especially over the short term.
Note 10. Subsequent events
Management has evaluated the events and transactions that have occurred through the date the financial statements were issued and noted no items requiring adjustment of the financial statements or additional disclosure.
Note 11. Information regarding pending and settled legal proceedings
Ameriprise Financial and certain of its affiliates have historically been involved in a number of legal, arbitration and regulatory proceedings, including routine litigation, class actions, and governmental actions, concerning matters arising in connection with the conduct of their business activities. Ameriprise Financial believes that the Fund is not currently the subject of, and that neither Ameriprise Financial nor any of its affiliates are the subject of, any pending legal, arbitration or regulatory proceedings that are likely to have a material adverse effect on the Fund or the ability of Ameriprise Financial or its affiliates to perform under their contracts with the Fund. Ameriprise Financial is required to make quarterly (10-Q), annual (10-K) and, as necessary, 8-K filings with the Securities and Exchange Commission (SEC) on legal and regulatory matters that relate to Ameriprise Financial and its affiliates. Copies of these filings may be obtained by accessing the SEC website at www.sec.gov.
There can be no assurance that these matters, or the adverse publicity associated with them, will not result in increased Fund redemptions, reduced sale of Fund shares or other adverse consequences to the Fund. Further, although we believe proceedings are not likely to have a material adverse effect on the Fund or the ability of Ameriprise Financial or its affiliates to perform under their contracts with the Fund, these proceedings are subject to uncertainties and, as such, we are unable to estimate the possible loss or range of loss that may result. An adverse outcome in one or more of these proceedings could result in adverse judgments, settlements, fines, penalties or other relief that could have a material adverse effect on the consolidated financial condition or results of operations of Ameriprise Financial.
Columbia Large Cap Index Fund | Annual Report 2019
| 33 |
Report of Independent Registered Public Accounting Firm
To the Board of Trustees of Columbia Funds Series Trust and Shareholders of Columbia Large Cap Index Fund
Opinion on the Financial Statements
We have audited the accompanying statement of assets and liabilities, including the portfolio of investments, of Columbia Large Cap Index Fund (one of the funds constituting Columbia Funds Series Trust, referred to hereafter as the "Fund") as of February 28, 2019, the related statement of operations for the year ended February 28, 2019, the statement of changes in net assets for each of the two years in the period ended February 28, 2019, including the related notes, and the financial highlights for each of the periods indicated therein (collectively referred to as the “financial statements”). In our opinion, the financial statements present fairly, in all material respects, the financial position of the Fund as of February 28, 2019, the results of its operations for the year then ended, the changes in its net assets for each of the two years in the period ended February 28, 2019 and the financial highlights for each of the periods indicated therein in conformity with accounting principles generally accepted in the United States of America.
Basis for Opinion
These financial statements are the responsibility of the Fund’s management. Our responsibility is to express an opinion on the Fund’s financial statements based on our audits. We are a public accounting firm registered with the Public Company Accounting Oversight Board (United States) (PCAOB) and are required to be independent with respect to the Fund in accordance with the U.S. federal securities laws and the applicable rules and regulations of the Securities and Exchange Commission and the PCAOB.
We conducted our audits of these financial statements in accordance with the standards of the PCAOB. Those standards require that we plan and perform the audit to obtain reasonable assurance about whether the financial statements are free of material misstatement, whether due to error or fraud.
Our audits included performing procedures to assess the risks of material misstatement of the financial statements, whether due to error or fraud, and performing procedures that respond to those risks. Such procedures included examining, on a test basis, evidence regarding the amounts and disclosures in the financial statements. Our audits also included evaluating the accounting principles used and significant estimates made by management, as well as evaluating the overall presentation of the financial statements. Our procedures included confirmation of securities owned as of February 28, 2019 by correspondence with the custodian, transfer agent and brokers; when replies were not received from brokers, we performed other auditing procedures. We believe that our audits provide a reasonable basis for our opinion.
/s/PricewaterhouseCoopers LLP
Minneapolis, Minnesota
April 22, 2019
We have served as the auditor of one or more investment companies within the Columbia Funds Complex since 1977.
| 34 | Columbia Large Cap Index Fund | Annual Report 2019 |
Federal Income Tax Information
(Unaudited)
The Fund hereby designates the following tax attributes for the fiscal year ended February 28, 2019. Shareholders will be notified in early 2020 of the amounts for use in preparing 2019 income tax returns.
Qualified
dividend
income | Dividends
received
deduction | Capital
gain
dividend |
| 100.00% | 100.00% | $312,836,169 |
Qualified dividend income. For taxable, non-corporate shareholders, the percentage of ordinary income distributed during the fiscal year that represents qualified dividend income subject to reduced tax rates.
Dividends received deduction. The percentage of ordinary income distributed during the fiscal year that qualifies for the corporate dividends received deduction.
Capital gain dividend. The Fund designates as a capital gain dividend the amount reflected above, or if subsequently determined to be different, the net capital gain of such fiscal period.
Columbia Large Cap Index Fund | Annual Report 2019
| 35 |
Shareholders elect the Board that oversees the Fund’s operations. The Board appoints officers who are responsible for day-to-day business decisions based on policies set by the Board. The following table provides basic biographical information about the Fund’s Trustees as of the printing of this report, including their principal occupations during the past five years, although specific titles for individuals may have varied over the period. Under current Board policy, Trustees not affiliated with the Investment Manager generally may serve through the end of the calendar year in which they reach the mandatory retirement age established by the Board.
Independent trustees
Name,
address,
year of birth | Position held
with the Trust and
length of service | Principal occupation(s)
during past five years
and other relevant
professional experience | Number of
Funds in the
Columbia Funds
complex
overseen | Other directorships
held by Trustee
during the past
five years |
George S. Batejan
c/o Columbia Management
Investment Advisers, LLC
225 Franklin Street
Mail Drop BX32 05228
Boston, MA 02110
1953 | Trustee since 1/17 | Executive Vice President, Global Head of Technology and Operations, Janus Capital Group, Inc., 2010-2016 | 123 | Former Chairman of the Board, NICSA (National Investment Company Services Association) (Executive Committee, Nominating Committee and Governance Committee), 2014-2016; former Director, Intech Investment Management, 2011-2016; former Board Member, Metro Denver Chamber of Commerce, 2015-2016; former Advisory Board Member, University of Colorado Business School, 2015-2018 |
Kathleen Blatz
c/o Columbia Management
Investment Advisers, LLC
225 Franklin Street
Mail Drop BX32 05228
Boston, MA 02110
1954 | Trustee since 1/06 for RiverSource Funds and since 6/11 for Nations Funds | Attorney; specializing in arbitration and mediation; Chief Justice, Minnesota Supreme Court, 1998-2006; Associate Justice, Minnesota Supreme Court, 1996-1998; Fourth Judicial District Court Judge, Hennepin County, 1994-1996; Attorney in private practice and public service, 1984-1993; State Representative, Minnesota House of Representatives, 1979-1993, which included service on the Tax and Financial Institutions and Insurance Committees; Member and Interim Chair, Minnesota Sports Facilities Authority, January 2017-July 2017; Interim President and Chief Executive Officer, Blue Cross and Blue Shield of Minnesota (health care insurance), February-July 2018 | 123 | Trustee, BlueCross BlueShield of Minnesota since 2009 (Chair of the Business Development Committee, 2014-2017; Chair of the Governance Committee since 2017); Chair of the Robina Foundation since August 2013; former Member and Chair of the Board, Minnesota Sports Facilities Authority, January 2017-July 2017 |
Edward J. Boudreau, Jr.
c/o Columbia Management
Investment Advisers, LLC
225 Franklin Street
Mail Drop BX32 05228
Boston, MA 02110
1944 | Chair of the Board since 1/18; Trustee since 6/11 for RiverSource Funds and since 1/05 for Nations Funds | Managing Director, E.J. Boudreau & Associates (consulting) since 2000; FINRA Industry Arbitrator, 2002-present; Chairman and Chief Executive Officer, John Hancock Investments (asset management), Chairman and Interested Trustee for open-end and closed-end funds offered by John Hancock, 1989-2000; John Hancock Mutual Life Insurance Company, including Senior Vice President and Treasurer and Senior Vice President Information Technology, 1968-1988 | 123 | Former Trustee, Boston Museum of Science (Chair of Finance Committee) 1985-2013; former Trustee, BofA Funds Series Trust (11 funds), 2005-2011 |
| 36 | Columbia Large Cap Index Fund | Annual Report 2019 |
TRUSTEES AND OFFICERS (continued)
Independent trustees (continued)
Name,
address,
year of birth | Position held
with the Trust and
length of service | Principal occupation(s)
during past five years
and other relevant
professional experience | Number of
Funds in the
Columbia Funds
complex
overseen | Other directorships
held by Trustee
during the past
five years |
Pamela G. Carlton
c/o Columbia Management
Investment Advisers, LLC
225 Franklin Street
Mail Drop BX32 05228
Boston, MA 02110
1954 | Trustee since 7/07 for RiverSource Funds and since 6/11 for Nations Funds | President, Springboard — Partners in Cross Cultural Leadership (consulting company) since 2003; Managing Director of US Equity Research, JP Morgan Chase, 1999-2003; Director of US Equity Research, Chase Asset Management, 1996-1999; Co-Director Latin America Research, 1993-1996, COO Global Research, 1992-1996, Co-Director of US Research, 1991-1992, Investment Banker, Morgan Stanley, 1982-1991 | 123 | Trustee, New York Presbyterian Hospital Board (Executive Committee and Chair of Human Resources Committee) since 1996; Director, Laurel Road Bank (Audit Committee) since 2017 |
Patricia M. Flynn
c/o Columbia Management
Investment Advisers, LLC
225 Franklin Street
Mail Drop BX32 05228
Boston, MA 02110
1950 | Trustee since 11/04 for RiverSource Funds and since 6/11 for Nations Funds | Trustee Professor of Economics and Management, Bentley University since 1976 (also teaches and conducts research on corporate governance); Dean, McCallum Graduate School of Business, Bentley University, 1992-2002 | 123 | Trustee, MA Taxpayers Foundation since 1997; Board of Directors, The MA Business Roundtable since 2003; Board of Governors, Innovation Institute, MA Technology Collaborative since 2010 |
Brian J. Gallagher
c/o Columbia Management
Investment Advisers, LLC
225 Franklin Street
Mail Drop BX32 05228
Boston, MA 02110
1954 | Trustee since 12/17 | Retired; Partner with Deloitte & Touche LLP and its predecessors, 1977-2016 | 121 | Trustee, Catholic Schools Foundation since 2004 |
Catherine James Paglia
c/o Columbia Management
Investment Advisers, LLC
225 Franklin Street
Mail Drop BX32 05228
Boston, MA 02110
1952 | Trustee since 11/04 for RiverSource Funds and since 6/11 for Nations Funds | Director, Enterprise Asset Management, Inc. (private real estate and asset management company) since September 1998; Managing Director and Partner, Interlaken Capital, Inc., 1989-1997; Managing Director, Morgan Stanley, 1982-1989; Vice President, Investment Banking, 1980-1982, Associate, Investment Banking, 1976-1980, Dean Witter Reynolds, Inc. | 123 | Director, Valmont Industries, Inc. (irrigation systems manufacturer) since 2012; Trustee, Carleton College (on the Investment Committee); Trustee, Carnegie Endowment for International Peace (on the Investment Committee) |
Anthony M. Santomero
c/o Columbia Management
Investment Advisers, LLC
225 Franklin Street
Mail Drop BX32 05228
Boston, MA 02110
1946 | Trustee since 6/11 for RiverSource Funds and since 1/08 for Nations Funds | Richard K. Mellon Professor Emeritus of Finance, The Wharton School, University of Pennsylvania, since 2002; Senior Advisor, McKinsey & Company (consulting), 2006-2008; President, Federal Reserve Bank of Philadelphia, 2000- 2006; Professor of Finance, The Wharton School, University of Pennsylvania, 1972-2002 | 123 | Trustee, Penn Mutual Life Insurance Company since March 2008; Director, Renaissance Reinsurance Ltd. since May 2008; former Trustee, BofA Funds Series Trust (11 funds), 2008-2011; former Director, Citigroup Inc. and Citibank, N.A., 2009-2019 |
Columbia Large Cap Index Fund | Annual Report 2019
| 37 |
TRUSTEES AND OFFICERS (continued)
Independent trustees (continued)
Name,
address,
year of birth | Position held
with the Trust and
length of service | Principal occupation(s)
during past five years
and other relevant
professional experience | Number of
Funds in the
Columbia Funds
complex
overseen | Other directorships
held by Trustee
during the past
five years |
Minor M. Shaw
c/o Columbia Management
Investment Advisers, LLC
225 Franklin Street
Mail Drop BX32 05228
Boston, MA 02110
1947 | Trustee since 6/11 for RiverSource Funds and since 2003 for Nations Funds | President, Micco LLC (private investments) since 2011; President, Micco Corp. (family investment business), 1998-2011 | 123 | Director, BlueCross BlueShield of South Carolina since April 2008; Board Chair, Hollingsworth Funds since 2016; Advisory Board member, Duke Energy Corp. since October 2016; Chair of the Duke Endowment; Chair of Greenville – Spartanburg Airport Commission; former Trustee, BofA Funds Series Trust (11 funds), 2003-2011; former Director, Piedmont Natural Gas, 2004-2016; former Director, National Association of Corporate Directors, Carolinas Chapter, 2013-2018 |
Sandra Yeager
c/o Columbia Management
Investment Advisers, LLC
225 Franklin Street
Mail Drop BX32 05228
Boston, MA 02110
1964 | Trustee since 12/17 | Retired; President and founder, Hanoverian Capital, LLC (SEC registered investment advisor firm), 2008-2016; Managing Director, DuPont Capital, 2006-2008; Managing Director, Morgan Stanley Investment Management, 2004-2006; Senior Vice President, Alliance Bernstein, 1990-2004 | 121 | Director, NAPE Education Foundation since October 2016 |
Interested trustee affiliated with Investment Manager*
| Name, address, year of birth | Position held with the Trust and length of service | Principal occupation(s) during the past five years and other relevant professional experience | Number of Funds in the Columbia Funds Complex overseen | Other directorships held by Trustee during the past five years |
William F. Truscott
c/o Columbia Management
Investment Advisers, LLC
225 Franklin Street
Boston, MA 02110
1960 | Trustee
2012 | Chairman of the Board and President, Columbia Management Investment Advisers, LLC since May 2010 and February 2012, respectively; Chief Executive Officer, Global Asset Management, Ameriprise Financial, Inc. since September 2012 (previously Chief Executive Officer, U.S. Asset Management & President, Annuities, May 2010-September 2012); Director and Chief Executive Officer, Columbia Management Investment Distributors, Inc. since May 2010 and February 2012, respectively; Chairman of the Board and Chief Executive Officer, RiverSource Distributors, Inc. since 2006; Director, Threadneedle Asset Management Holdings, SARL since 2014; President and Chief Executive Officer, Ameriprise Certificate Company, 2006-August 2012 | 193 | Chairman of the Board, Columbia Management Investment Advisers, LLC since May 2010; Director, Columbia Management Investment Distributors, Inc. since May 2010; former Director, Ameriprise Certificate Company, 2006 - January 2013 |
| * | Interested person (as defined under the 1940 Act) by reason of being an officer, director, security holder and/or employee of the Investment Manager or Ameriprise Financial. |
| 38 | Columbia Large Cap Index Fund | Annual Report 2019 |
TRUSTEES AND OFFICERS (continued)
Nations Funds refer to the Funds within the Columbia Funds Complex that historically bore the Nations brand and includes series of Columbia Funds Series Trust. RiverSource Funds refer to the Funds within the Columbia Funds Complex that historically bore the RiverSource brand and includes series of Columbia Funds Series Trust II.
The Statement of Additional Information has additional information about the Fund’s Board members and is available, without charge, upon request by calling 800.345.6611, visiting columbiathreadneedleus.com/investor/ or contacting your financial intermediary.
Columbia Large Cap Index Fund | Annual Report 2019
| 39 |
TRUSTEES AND OFFICERS (continued)
The Board has appointed officers who are responsible for day-to-day business decisions based on policies it has established. The officers serve at the pleasure of the Board. The following table provides basic information about the Officers of the Fund as of the printing of this report, including principal occupations during the past five years, although their specific titles may have varied over the period. In addition to Mr. Truscott, who is Senior Vice President, the Fund’s other officers are:
Fund officers
Name,
address and
year of birth | Position and year
first appointed to
position for any Fund
in the Columbia
Funds complex or a
predecessor thereof | Principal occupation(s) during past five years |
Christopher O. Petersen
5228 Ameriprise
Financial Center
Minneapolis, MN 55474
Born 1970 | President and Principal Executive Officer (2015) | Vice President and Lead Chief Counsel, Ameriprise Financial, Inc. since January 2015 (previously, Vice President and Chief Counsel, January 2010 - December 2014; officer of Columbia Funds and affiliated funds since 2007. |
Michael G. Clarke
225 Franklin Street
Boston, MA 02110
Born 1969 | Chief Financial Officer (Principal Financial Officer) (2009) and Senior Vice President (2019) | Vice President — Accounting and Tax, Columbia Management Investment Advisers, LLC, since May 2010; senior officer of Columbia Funds and affiliated funds since 2002 (previously, Treasurer and Chief Accounting Officer, January 2009-January 2019 and December 2015-January 2019, respectively). |
Joseph Beranek
5890 Ameriprise
Financial Center
Minneapolis, MN 55474
Born 1965 | Treasurer and Chief Accounting Officer (Principal Accounting Officer) (2019) | Vice President — Mutual Fund Accounting and Financial Reporting, Columbia Management Investment Advisers, LLC, since December 2018 and March 2017, respectively (previously, Vice President — Pricing and Corporate Actions, May 2010-March 2017). |
Paul B. Goucher
485 Lexington Avenue
New York, NY 10017
Born 1968 | Senior Vice President (2011) and Assistant Secretary (2008) | Senior Vice President and Assistant General Counsel, Ameriprise Financial, Inc. since January 2017 (previously, Vice President and Lead Chief Counsel, November 2008 - January 2017 and January 2013 - January 2017, respectively); Vice President, Chief Legal Officer and Assistant Secretary, Columbia Management Investment Advisers, LLC since March 2015 (previously Vice President and Assistant Secretary, May 2010 – March 2015). |
Thomas P. McGuire
225 Franklin Street
Boston, MA 02110
Born 1972 | Senior Vice President and Chief Compliance Officer (2012) | Vice President — Asset Management Compliance, Ameriprise Financial, Inc., since May 2010; Chief Compliance Officer, Ameriprise Certificate Company since September 2010. |
Colin Moore
225 Franklin Street
Boston, MA 02110
Born 1958 | Senior Vice President (2010) | Executive Vice President and Global Chief Investment Officer, Ameriprise Financial, Inc., since July 2013; Executive Vice President and Global Chief Investment Officer, Columbia Management Investment Advisers, LLC since July 2013. |
Ryan C. Larrenaga
225 Franklin Street
Boston, MA 02110
Born 1970 | Senior Vice President (2017), Chief Legal Officer (2017), and Secretary (2015) | Vice President and Chief Counsel, Ameriprise Financial, Inc. since August 2018 (previously, Vice President and Group Counsel, August 2011 - August 2018); officer of Columbia Funds and affiliated funds since 2005. |
Michael E. DeFao
225 Franklin Street
Boston, MA 02110
Born 1968 | Vice President (2011) and Assistant Secretary (2010) | Vice President and Chief Counsel, Ameriprise Financial, Inc. since May 2010. |
Amy Johnson
5228 Ameriprise
Financial Center
Minneapolis, MN 55474
Born 1965 | Vice President (2006) | Managing Director and Global Head of Operations, Columbia Management Investment Advisers, LLC since April 2016 (previously Managing Director and Chief Operating Officer, 2010 - 2016). |
| 40 | Columbia Large Cap Index Fund | Annual Report 2019 |
TRUSTEES AND OFFICERS (continued)
Fund officers (continued)
Name,
address and
year of birth | Position and year
first appointed to
position for any Fund
in the Columbia
Funds complex or a
predecessor thereof | Principal occupation(s) during past five years |
Lyn Kephart-Strong
5228 Ameriprise
Financial Center
Minneapolis, MN 55474
Born 1960 | Vice President (2015) | President, Columbia Management Investment Services Corp. since October 2014; Vice President & Resolution Officer, Ameriprise Trust Company since August 2009. |
Columbia Large Cap Index Fund | Annual Report 2019
| 41 |
The Fund mails one shareholder report to each shareholder address, unless such shareholder elected to receive shareholder reports from the Fund electronically. If you would like more than one report, please call shareholder services at 800.345.6611 and additional reports will be sent to you.
Proxy voting policies and procedures
The policy of the Board of Trustees is to vote the proxies of the companies in which the Fund holds investments consistent with the procedures as stated in the Statement of Additional Information (SAI). You may obtain a copy of the SAI without charge by calling 800.345.6611; contacting your financial intermediary; visiting columbiathreadneedleus.com/investor/; or searching the website of the Securities and Exchange Commission (SEC) at sec.gov. Information regarding how the Fund voted proxies relating to portfolio securities is filed with the SEC by August 31st for the most recent 12-month period ending June 30th of that year, and is available without charge by visiting columbiathreadneedleus.com/investor/, or searching the website of the SEC at sec.gov.
Quarterly schedule of investments
The Fund files a complete schedule of portfolio holdings with the SEC for the first and third quarters of each fiscal year on Form N-Q or Form N-PORT (available for filings after March 31, 2019). The Fund’s Form N-Q or Form N-PORT is available on the SEC’s website at sec.gov. The Fund’s complete schedule of portfolio holdings, as filed on Form N-Q or Form N-PORT, can also be obtained without charge, upon request, by calling 800.345.6611.
Additional Fund information
For more information about the Fund, please visit columbiathreadneedleus.com/investor/ or call 800.345.6611. Customer Service Representatives are available to answer your questions Monday through Friday from 8 a.m. to 7 p.m. Eastern time.
Fund investment manager
Columbia Management Investment Advisers, LLC
225 Franklin Street
Boston, MA 02110
Fund distributor
Columbia Management Investment Distributors, Inc.
225 Franklin Street
Boston, MA 02110
Fund transfer agent
Columbia Management Investment Services Corp.
P.O. Box 219104
Kansas City, MO 64121-9104
| 42 | Columbia Large Cap Index Fund | Annual Report 2019 |
[THIS PAGE INTENTIONALLY LEFT BLANK]
[THIS PAGE INTENTIONALLY LEFT BLANK]
[THIS PAGE INTENTIONALLY LEFT BLANK]
Columbia Large Cap Index Fund
P.O. Box 219104
Kansas City, MO 64121-9104
Please read and consider the investment objectives, risks, charges and expenses for any fund carefully before investing. For a prospectus and summary prospectus, which contains this and other important information about the Fund, go to
columbiathreadneedleus.com/investor/. The Fund is distributed by Columbia Management Investment Distributors, Inc., member FINRA, and managed by Columbia Management Investment Advisers, LLC.
Columbia Threadneedle Investments (Columbia Threadneedle) is the global brand name of the Columbia and Threadneedle group of companies. All rights reserved.
© 2019 Columbia Management Investment Advisers, LLC.
columbiathreadneedleus.com/investor/

Annual Report
February 28, 2019
Columbia Large Cap Growth Fund III
Beginning on January 1, 2021, as permitted by regulations adopted by the Securities and Exchange Commission, paper copies of the Fund’s annual and semiannual shareholder reports like this one will no longer be sent by mail, unless you specifically request paper copies of the reports. Instead, the reports will be made available on the Fund’s website (columbiathreadneedleus.com/investor/), and each time a report is posted you will be notified by mail and provided with a website address to access the report.
If you have already elected to receive shareholder reports electronically, you will not be affected by this change and you need not take any action. You may elect to receive shareholder reports and other communications from the Fund electronically at any time by contacting your financial intermediary (such as a broker-dealer or bank) or, for Fund shares held directly with the Fund, by calling 800.345.6611 or by enrolling in “eDelivery” by logging into your account at columbiathreadneedleus.com/investor/.
You may elect to receive all future reports in paper free of charge. If you invest through a financial intermediary, you can contact your financial intermediary to request that you continue receiving paper copies of your shareholder reports. If you invest directly with the Fund, you can call 800.345.6611 to let the Fund know you wish to continue receiving paper copies of your shareholder reports. Your election to receive paper reports will apply to all Columbia Funds held in your account if you invest through a financial intermediary or all Columbia Funds held with the fund complex if you invest directly with the Fund.
Not FDIC Insured • No bank guarantee • May lose value
Dear Shareholders,
Volatility exists in financial markets and this is not a comfortable fact of life. How investors deal with this reality, including how they react to short term spikes in volatility as well as to longer periods of increased or decreased volatility, may have a significant impact on their overall investing success.
Too often, investors change their investment strategy based on something that’s happening at a moment in time rather than thinking about how that change in strategy might affect their ability to achieve their longer term financial goals. Emotion replaces logic and reasoning. Investors may sell in reaction to a market drop (fear or panic), locking in low returns which means they won’t be invested when the market returns, or they invest more at a market peak (greed or conviction), essentially when it is expensive to do so. In both cases, selling and buying at the exact wrong time.
We believe the best outcomes come from a consistent approach to investing. Here are five areas where advisors can help us overcome the tendency to react emotionally as we struggle to make the right choices with our investments:
Long-term focus
The further away long-term goals, aspirations and objectives are, the easier it is to stray away from the goals and priorities that we set out. Advisors help us stay focused on what we want to accomplish.
Discipline through up-and-down markets
Advisors help set rules to prevent us from making rash decisions that we may regret later. Knowing ahead of time what you should do in case of certain situations will help you get through volatile markets and not make emotional decisions.
Tax-awareness
Taxes are one of the biggest drags on investment returns and are critical attributes of investing. Yet few of us take the necessary steps to ease the corrosive effect of taxes. Advisors have tools and knowledge that may help us to manage portfolios more tax-efficiently and keep more of what we earn.
Emotional objectivity
Our emotions are very hard to manage and making investment decisions in an emotional state can lead to exceedingly bad outcomes. An objective advisor can help prevent some of the reactionary mistakes emotions often lead us to.
Education and guidance
The role of the advisor is to teach and guide us toward achieving our financial goals. In terms of working through emotions, guidance is by far the most important component.
By understanding our own behaviors and biases, we can prepare for future challenges. Your success is our priority. Talk to your advisor about how working with Columbia Threadneedle Investments may help you stay the course and position your portfolio for consistent, sustainable outcomes, regardless of market conditions.
Sincerely,
Christopher O. Petersen
President, Columbia Funds
Columbia Funds are distributed by Columbia Management Investment Distributors, Inc., member FINRA, and managed by Columbia Management Investment Advisers, LLC.
© 2019 Columbia Management Investment Advisers, LLC. All rights reserved.
Columbia Large Cap Growth Fund III | Annual Report 2019
Columbia Large Cap Growth Fund III | Annual Report 2019
Investment objective
Columbia Large Cap Growth Fund III (the Fund) seeks long-term growth of capital.
Portfolio management
John Wilson, CFA
Lead Portfolio Manager
Managed Fund since 2015
Tchintcia Barros, CFA
Portfolio Manager
Managed Fund since 2015
Morningstar style boxTM
The Morningstar Style Box is based on a fund’s portfolio holdings. For equity funds, the vertical axis shows the market capitalization of the stocks owned, and the horizontal axis shows investment style (value, blend, or growth). Information shown is based on the most recent data provided by Morningstar.
© 2019 Morningstar, Inc. All rights reserved. The Morningstar information contained herein: (1) is proprietary to Morningstar and/or its content providers; (2) may not be copied or distributed; and (3) is not warranted to be accurate, complete or timely. Neither Morningstar nor its content providers are responsible for any damages or losses arising from any use of this information.
| Average annual total returns (%) (for the period ended February 28, 2019) |
| | | Inception | 1 Year | 5 Years | 10 Years |
| Class A | Excluding sales charges | 12/31/97 | 4.19 | 9.23 | 15.74 |
| | Including sales charges | | -1.81 | 7.95 | 15.05 |
| Advisor Class* | 11/08/12 | 4.53 | 9.51 | 15.92 |
| Class C | Excluding sales charges | 12/31/97 | 3.46 | 8.43 | 14.88 |
| | Including sales charges | | 2.57 | 8.43 | 14.88 |
| Institutional Class | 12/31/97 | 4.51 | 9.51 | 16.03 |
| Institutional 2 Class* | 12/11/13 | 4.60 | 9.63 | 15.96 |
| Institutional 3 Class* | 03/01/17 | 4.61 | 9.40 | 15.83 |
| Class R* | 10/26/16 | 4.00 | 8.96 | 15.45 |
| Russell 1000 Growth Index | | 6.62 | 12.63 | 18.19 |
Returns for Class A shares are shown with and without the maximum initial sales charge of 5.75%. Returns for Class C shares are shown with and without the 1.00% contingent deferred sales charge for the first year only. The Fund’s other share classes are not subject to sales charges and have limited eligibility. Please see the Fund’s prospectus for details. Performance for different share classes will vary based on differences in sales charges and fees associated with each share class. All results shown assume reinvestment of distributions during the period. Returns do not reflect the deduction of taxes that a shareholder may pay on Fund distributions or on the redemption of Fund shares. Performance results reflect the effect of any fee waivers or reimbursements of Fund expenses by Columbia Management Investment Advisers, LLC and/or any of its affiliates. Absent these fee waivers or expense reimbursement arrangements, performance results would have been lower.
The performance information shown represents past performance and is not a guarantee of future results. The investment return and principal value of your investment will fluctuate so that your shares, when redeemed, may be worth more or less than their original cost. Current performance may be lower or higher than the performance information shown. You may obtain performance information current to the most recent month-end by contacting your financial intermediary, visiting columbiathreadneedleus.com/investor/ or calling 800.345.6611.
The Fund’s performance prior to November 2015, when the Investment Manager assumed day-to-day portfolio management responsibilities over the Fund, reflects returns achieved by a subadviser that managed the Fund according to different principal investment strategies. If the Fund’s current strategies had been in place for the prior periods, results shown may have been different.
| * | The returns shown for periods prior to the share class inception date (including returns for the Life of the Fund, if shown, which are since Fund inception) include the returns of the Fund’s oldest share class. Since the Fund launched more than one class of shares at its inception, Class A shares were used. These returns are adjusted to reflect any higher class-related operating expenses of the newer share classes, as applicable. Please visit columbiathreadneedleus.com/investor/investment-products/mutual-funds/appended-performance for more information. |
The Russell 1000 Growth Index, an unmanaged index, measures the performance of those Russell 1000 Index companies with higher price-to-book ratios and higher forecasted growth values.
Indices are not available for investment, are not professionally managed and do not reflect sales charges, fees, brokerage commissions, taxes or other expenses of investing. Securities in the Fund may not match those in an index.
| 2 | Columbia Large Cap Growth Fund III | Annual Report 2019 |
Fund at a Glance (continued)
Performance of a hypothetical $10,000 investment (February 28, 2009 — February 28, 2019)
The chart above shows the change in value of a hypothetical $10,000 investment in Class A shares of Columbia Large Cap Growth Fund III during the stated time period, and does not reflect the deduction of taxes that a shareholder may pay on Fund distributions or on the redemption of Fund shares.
| Top 10 holdings (%) (at February 28, 2019) |
| Amazon.com, Inc. | 5.7 |
| Alphabet, Inc., Class A | 5.7 |
| Microsoft Corp. | 5.6 |
| Apple, Inc. | 4.8 |
| Visa, Inc., Class A | 3.6 |
| Facebook, Inc., Class A | 2.6 |
| Adobe, Inc. | 2.6 |
| PayPal Holdings, Inc. | 2.3 |
| Broadcom, Inc. | 2.1 |
| Nike, Inc., Class B | 2.1 |
Percentages indicated are based upon total investments excluding Money Market Funds and investments in derivatives, if any.
For further detail about these holdings, please refer to the section entitled “Portfolio of Investments.”
Fund holdings are as of the date given, are subject to change at any time, and are not recommendations to buy or sell any security.
| Portfolio breakdown (%) (at February 28, 2019) |
| Common Stocks | 98.9 |
| Money Market Funds | 1.1 |
| Total | 100.0 |
Percentages indicated are based upon total investments excluding investments in derivatives, if any. The Fund’s portfolio composition is subject to change.
| Equity sector breakdown (%) (at February 28, 2019) |
| Communication Services | 12.3 |
| Consumer Discretionary | 16.8 |
| Consumer Staples | 2.3 |
| Energy | 0.7 |
| Financials | 4.1 |
| Health Care | 17.8 |
| Industrials | 9.4 |
| Information Technology | 32.5 |
| Materials | 2.1 |
| Real Estate | 2.0 |
| Total | 100.0 |
Percentages indicated are based upon total equity investments. The Fund’s portfolio composition is subject to change.
Columbia Large Cap Growth Fund III | Annual Report 2019
| 3 |
Manager Discussion of Fund Performance
For the 12-month period that ended February 28, 2019, the Fund’s Class A shares returned 4.19% excluding sales charges. The Fund’s benchmark, the Russell 1000 Growth Index, returned 6.62% for the same period. In a volatile year for the equity markets, stock selection in industrials and financials generally accounted for the Fund’s shortfall relative to the benchmark.
Stocks advanced despite year-end sell-off
Investors kicked off the 12-month period ended February 28, 2019 with rising optimism. Positive global economic conditions, broad corporate tax cuts and moves to reduce regulation in a number of industries buoyed confidence. The pace of U.S. economic growth averaged more than 3.0%, as the labor markets added an average of 209,000 jobs per month, wages increased on the order of 3.0% and manufacturing activity remained solid. Unemployment in the United States rose modestly in December and January, but even that was a net positive as it reflected an increase in the number of Americans seeking employment. A weak February for job creation drove unemployment back down to 3.8% in February 2019.
Despite positive global sentiment at the start of the period, the rosy global picture dimmed as the period progressed. European economies transitioned to a slower pace, struggling with rising interest rates, trade tensions and uncertainty surrounding Brexit (the U.K.’s departure from the European Union). At the same time, China’s economic conditions weakened and emerging markets came under pressure, driven by trade concerns and a rising U.S dollar. In December, the Federal Reserve (the Fed) rattled investors when it raised the target range of its key short-term interest rate, the federal funds rate, to 2.25%-2.50%, the fourth such increase for the year. However, the Fed maintained this rate in its January 2019 meeting and announced that it would be patient moving forward.
As uncertainties rose late in 2018, investors backed away from riskier assets. Technology stocks, which had been global market leaders, stumbled in the third quarter of 2018 and triggered a broader market sell-off of stocks and high-yield bonds in the fourth quarter. However, stocks rebounded early in 2019 as a patient Fed and hopes for progress on the trade front inspired confidence. The S&P 500 Index, a broad measure of U.S. stock returns, gained 4.68% for the 12-month period, with dividends reinvested. Investment-grade bonds, as measured by the Bloomberg Barclays U.S. Aggregate Bond Index, returned 3.17%.
Contributors and detractors
In aggregate, the Fund’s technology and health care holdings outperformed the benchmark. In technology, a position in Zebra Technologies was a standout. The company is the leading provider of barcoding and hand-held scanning equipment, inventory management and tracking applications. Strong revenue and profit growth helped Zebra gain market share. Payment processing companies PayPal and Square also made major contributions to Fund gains, aided by growth in online commerce and transactions. We took some profits in Square as the company’s share price approached our target price. Another technology name, Palo Alto Networks, a recent purchase, did well. The company specializes in corporate security software, which enjoyed strong demand as global enterprises of all kinds face increased security threats.
Positive results from certain health care names, including Illumina, Edwards and Thermo Fisher, aided relative results. Strong execution and attractive product cycles benefited all three. Illumina develops and manufactures tools used by researchers for the study and analysis of genes. A new product that allows faster gene sequencing at lower costs drove significant revenue growth and was strongly rewarded by investors. Shares of Edwards Life Sciences, the leading specialist in artificial heart valves, rose strongly on solid earnings growth. A small position in Exact Sciences also contributed to Fund gains. The company targets people who are candidates for routine colonoscopies but do not get them because of cost or inconvenience. Shares of Exact Sciences rose materially as the company benefited from a partnership with pharmaceutical giant Pfizer, which provides sales and marketing support.
Two consumer discretionary names were strong contributors to Fund returns: Canada Goose and Ulta Cosmetics. Canada Goose, a leading outerwear and leisurewear company, raised its earnings guidance during the year. Investors also took a positive view of an announced new venture in China. We invested in Ulta Cosmetics when there were concerns about the company’s growth dynamics, and the company gained ground as it executed well. However, these gains were partially offset by losses from Booking Holdings, the parent company of Priceline, and luxury brand retailer PVH. Booking lost ground as incremental investment costs pressured profits. Weakness across Calvin Klein, which is one of PVH’s most lucrative brands, hurt overall results. We held on to both positions.
| 4 | Columbia Large Cap Growth Fund III | Annual Report 2019 |
Manager Discussion of Fund Performance (continued)
Stock selection in industrials and financials also detracted from Fund results. Overweights in Federal Express and Northrop Grumman hurt returns as both underperformed. Federal Express lagged after reporting weaker-than-expected results from European markets. We trimmed the Fund’s holdings. Northrop was weighed down by concerns about defense spending. The Fund had no exposure to Boeing, a strong performer for the year, which also detracted from results. In the financials sector, BlackRock underperformed, hurt by overall volatility in the equity markets and competitor Fidelity’s announcement that it was introducing selected no-fee products also detracted.
At period’s end
During the period, we trimmed some of the Fund’s technology exposure as stocks approached our target prices. We used periods of weakness, particularly in the fourth quarter of 2018, to add to names and areas where we thought the risk/reward prospects were particularly strong. The Fund remained underweight in industrials and consumer staples stocks, where we have found it difficult to find companies that meet our investment criteria. As always, we are bottom up stock pickers. We search for growth companies where we see a differentiated thesis, strong long-term risk/reward prospects and names in which we have the highest investment conviction.
Marketrisk may affect a single issuer, sector of the economy, industry or the market as a whole.Growthsecurities, at times, may not perform as well as value securities or the stock market in general and may be out of favor with investors.Foreigninvestments subject the Fund to risks, including political, economic, market, social and others within a particular country, as well as to currency instabilities and less stringent financial and accounting standards generally applicable to U.S. issuers. The Fund may invest significantly in issuers within a particularsector, which may be negatively affected by market, economic or other conditions, making the Fund more vulnerable to unfavorable developments in the sector. See the Fund’s prospectus for more information on these and other risks.
The views expressed in this report reflect the current views of the respective parties. These views are not guarantees of future performance and involve certain risks, uncertainties and assumptions that are difficult to predict, so actual outcomes and results may differ significantly from the views expressed. These views are subject to change at any time based upon economic, market or other conditions and the respective parties disclaim any responsibility to update such views. These views may not be relied on as investment advice and, because investment decisions for a Columbia fund are based on numerous factors, may not be relied on as an indication of trading intent on behalf of any particular Columbia fund. References to specific securities should not be construed as a recommendation or investment advice.
Columbia Large Cap Growth Fund III | Annual Report 2019
| 5 |
Understanding Your Fund’s Expenses
(Unaudited)
As an investor, you incur two types of costs. There are shareholder transaction costs, which generally include sales charges on purchases and may include redemption fees. There are also ongoing fund costs, which generally include management fees, distribution and/or service fees, and other fund expenses. The following information is intended to help you understand your ongoing costs (in dollars) of investing in the Fund and to help you compare these costs with the ongoing costs of investing in other mutual funds.
Analyzing your Fund’s expenses
To illustrate these ongoing costs, we have provided examples and calculated the expenses paid by investors in each share class of the Fund during the period. The actual and hypothetical information in the table is based on an initial investment of $1,000 at the beginning of the period indicated and held for the entire period. Expense information is calculated two ways and each method provides you with different information. The amount listed in the “Actual” column is calculated using the Fund’s actual operating expenses and total return for the period. You may use the Actual information, together with the amount invested, to estimate the expenses that you paid over the period. Simply divide your account value by $1,000 (for example, an $8,600 account value divided by $1,000 = 8.6), then multiply the results by the expenses paid during the period under the “Actual” column. The amount listed in the “Hypothetical” column assumes a 5% annual rate of return before expenses (which is not the Fund’s actual return) and then applies the Fund’s actual expense ratio for the period to the hypothetical return. You should not use the hypothetical account values and expenses to estimate either your actual account balance at the end of the period or the expenses you paid during the period. See “Compare with other funds” below for details on how to use the hypothetical data.
Compare with other funds
Since all mutual funds are required to include the same hypothetical calculations about expenses in shareholder reports, you can use this information to compare the ongoing cost of investing in the Fund with other funds. To do so, compare the hypothetical example with the 5% hypothetical examples that appear in the shareholder reports of other funds. As you compare hypothetical examples of other funds, it is important to note that hypothetical examples are meant to highlight the ongoing costs of investing in a fund only and do not reflect any transaction costs, such as sales charges, or redemption or exchange fees. Therefore, the hypothetical calculations are useful in comparing ongoing costs only, and will not help you determine the relative total costs of owning different funds. If transaction costs were included in these calculations, your costs would be higher.
| September 1, 2018 — February 28, 2019 |
| | Account value at the
beginning of the
period ($) | Account value at the
end of the
period ($) | Expenses paid during
the period ($) | Fund’s annualized
expense ratio (%) |
| | Actual | Hypothetical | Actual | Hypothetical | Actual | Hypothetical | Actual |
| Class A | 1,000.00 | 1,000.00 | 944.40 | 1,019.49 | 5.16 | 5.36 | 1.07 |
| Advisor Class | 1,000.00 | 1,000.00 | 945.80 | 1,020.73 | 3.96 | 4.11 | 0.82 |
| Class C | 1,000.00 | 1,000.00 | 941.20 | 1,015.77 | 8.76 | 9.10 | 1.82 |
| Institutional Class | 1,000.00 | 1,000.00 | 945.60 | 1,020.73 | 3.96 | 4.11 | 0.82 |
| Institutional 2 Class | 1,000.00 | 1,000.00 | 945.90 | 1,021.08 | 3.62 | 3.76 | 0.75 |
| Institutional 3 Class | 1,000.00 | 1,000.00 | 946.30 | 1,021.32 | 3.38 | 3.51 | 0.70 |
| Class R | 1,000.00 | 1,000.00 | 943.20 | 1,018.25 | 6.36 | 6.61 | 1.32 |
Expenses paid during the period are equal to the annualized expense ratio for each class as indicated above, multiplied by the average account value over the period and then multiplied by the number of days in the Fund’s most recent fiscal half year and divided by 365.
Expenses do not include fees and expenses incurred indirectly by the Fund from its investment in underlying funds, including affiliated and non-affiliated pooled investment vehicles, such as mutual funds and exchange-traded funds.
Had Columbia Management Investment Advisers, LLC and/or certain of its affiliates not waived/reimbursed certain fees and expenses, account value at the end of the period would have been reduced.
| 6 | Columbia Large Cap Growth Fund III | Annual Report 2019 |
Portfolio of Investments
February 28, 2019
(Percentages represent value of investments compared to net assets)
Investments in securities
| Common Stocks 99.2% |
| Issuer | Shares | Value ($) |
| Communication Services 12.2% |
| Entertainment 1.1% |
| Electronic Arts, Inc.(a) | 187,228 | 17,932,698 |
| Interactive Media & Services 9.1% |
| Alphabet, Inc., Class A(a) | 76,040 | 85,662,862 |
| Alphabet, Inc., Class C(a) | 12,137 | 13,592,469 |
| Facebook, Inc., Class A(a) | 243,803 | 39,361,994 |
| Total | | 138,617,325 |
| Media 0.6% |
| DISH Network Corp., Class A(a) | 275,942 | 8,970,875 |
| Wireless Telecommunication Services 1.4% |
| T-Mobile U.S.A., Inc.(a) | 291,071 | 21,018,237 |
| Total Communication Services | 186,539,135 |
| Consumer Discretionary 16.7% |
| Hotels, Restaurants & Leisure 0.9% |
| Norwegian Cruise Line Holdings Ltd.(a) | 227,852 | 12,652,622 |
| Internet & Direct Marketing Retail 8.8% |
| Alibaba Group Holding Ltd., ADR(a) | 133,155 | 24,371,360 |
| Amazon.com, Inc.(a) | 52,801 | 86,584,664 |
| Booking Holdings, Inc.(a) | 13,885 | 23,563,400 |
| Total | | 134,519,424 |
| Specialty Retail 3.0% |
| Burlington Stores, Inc.(a) | 68,004 | 11,542,999 |
| O’Reilly Automotive, Inc.(a) | 42,142 | 15,675,138 |
| Ulta Beauty, Inc.(a) | 60,535 | 18,916,582 |
| Total | | 46,134,719 |
| Textiles, Apparel & Luxury Goods 4.0% |
| Canada Goose Holdings, Inc.(a) | 142,224 | 8,093,968 |
| Nike, Inc., Class B | 361,834 | 31,020,029 |
| PVH Corp. | 121,671 | 13,972,698 |
| Tapestry, Inc. | 219,125 | 7,656,227 |
| Total | | 60,742,922 |
| Total Consumer Discretionary | 254,049,687 |
| Consumer Staples 2.3% |
| Food & Staples Retailing 1.3% |
| Costco Wholesale Corp. | 90,106 | 19,709,786 |
| Common Stocks (continued) |
| Issuer | Shares | Value ($) |
| Food Products 1.0% |
| Mondelez International, Inc., Class A | 320,536 | 15,116,478 |
| Total Consumer Staples | 34,826,264 |
| Energy 0.7% |
| Oil, Gas & Consumable Fuels 0.7% |
| Cimarex Energy Co. | 80,216 | 5,768,332 |
| Diamondback Energy, Inc. | 50,775 | 5,226,271 |
| Total | | 10,994,603 |
| Total Energy | 10,994,603 |
| Financials 4.1% |
| Banks 1.0% |
| Citigroup, Inc. | 240,811 | 15,407,088 |
| Capital Markets 1.9% |
| BlackRock, Inc. | 37,157 | 16,468,725 |
| Charles Schwab Corp. (The) | 255,978 | 11,777,548 |
| Total | | 28,246,273 |
| Insurance 1.2% |
| Allstate Corp. (The) | 191,237 | 18,048,948 |
| Total Financials | 61,702,309 |
| Health Care 17.6% |
| Biotechnology 6.1% |
| Alexion Pharmaceuticals, Inc.(a) | 166,196 | 22,491,305 |
| Biogen, Inc.(a) | 60,599 | 19,877,078 |
| BioMarin Pharmaceutical, Inc.(a) | 155,986 | 14,547,254 |
| Exact Sciences Corp.(a) | 147,554 | 13,427,414 |
| Vertex Pharmaceuticals, Inc.(a) | 118,159 | 22,302,511 |
| Total | | 92,645,562 |
| Health Care Equipment & Supplies 4.3% |
| Baxter International, Inc. | 203,846 | 15,233,412 |
| Danaher Corp. | 49,574 | 6,296,889 |
| Edwards Lifesciences Corp.(a) | 120,767 | 20,444,645 |
| IDEXX Laboratories, Inc.(a) | 20,522 | 4,330,758 |
| Medtronic PLC | 205,689 | 18,614,855 |
| Total | | 64,920,559 |
| Health Care Providers & Services 1.1% |
| Humana, Inc. | 60,749 | 17,315,895 |
The accompanying Notes to Financial Statements are an integral part of this statement.
Columbia Large Cap Growth Fund III | Annual Report 2019
| 7 |
Portfolio of Investments (continued)
February 28, 2019
| Common Stocks (continued) |
| Issuer | Shares | Value ($) |
| Life Sciences Tools & Services 2.5% |
| Bio-Techne Corp. | 25,344 | 4,914,202 |
| Illumina, Inc.(a) | 42,433 | 13,271,769 |
| Thermo Fisher Scientific, Inc. | 77,313 | 20,068,135 |
| Total | | 38,254,106 |
| Pharmaceuticals 3.6% |
| Allergan PLC | 66,222 | 9,119,432 |
| Bristol-Myers Squibb Co. | 397,222 | 20,520,488 |
| Johnson & Johnson | 186,195 | 25,441,685 |
| Total | | 55,081,605 |
| Total Health Care | 268,217,727 |
| Industrials 9.3% |
| Aerospace & Defense 3.0% |
| L3 Technologies, Inc. | 117,325 | 24,843,569 |
| Northrop Grumman Corp. | 70,018 | 20,302,419 |
| Total | | 45,145,988 |
| Air Freight & Logistics 0.7% |
| FedEx Corp. | 59,053 | 10,688,593 |
| Electrical Equipment 1.3% |
| AMETEK, Inc. | 249,813 | 19,880,119 |
| Industrial Conglomerates 1.6% |
| Honeywell International, Inc. | 163,248 | 25,151,619 |
| Machinery 2.7% |
| Ingersoll-Rand PLC | 234,057 | 24,707,057 |
| Xylem, Inc. | 215,774 | 16,301,726 |
| Total | | 41,008,783 |
| Total Industrials | 141,875,102 |
| Information Technology 32.2% |
| Electronic Equipment, Instruments & Components 1.2% |
| Zebra Technologies Corp., Class A(a) | 89,268 | 17,899,127 |
| IT Services 7.5% |
| FleetCor Technologies, Inc.(a) | 65,212 | 15,212,655 |
| Pagseguro Digital Ltd., Class A(a) | 213,871 | 6,016,191 |
| PayPal Holdings, Inc.(a) | 350,922 | 34,414,921 |
| Square, Inc., Class A(a) | 56,008 | 4,550,090 |
| Visa, Inc., Class A | 363,015 | 53,769,782 |
| Total | | 113,963,639 |
| Common Stocks (continued) |
| Issuer | Shares | Value ($) |
| Semiconductors & Semiconductor Equipment 6.0% |
| Broadcom, Inc. | 114,986 | 31,662,545 |
| Lam Research Corp. | 147,815 | 26,028,744 |
| NVIDIA Corp. | 126,139 | 19,458,202 |
| NXP Semiconductors NV | 156,110 | 14,255,965 |
| Total | | 91,405,456 |
| Software 12.7% |
| Adobe, Inc.(a) | 147,565 | 38,735,812 |
| Microsoft Corp. | 759,650 | 85,103,589 |
| Palo Alto Networks, Inc.(a) | 93,177 | 22,946,700 |
| Salesforce.com, Inc.(a) | 157,717 | 25,810,387 |
| ServiceNow, Inc.(a) | 89,915 | 21,529,248 |
| Total | | 194,125,736 |
| Technology Hardware, Storage & Peripherals 4.8% |
| Apple, Inc. | 422,390 | 73,136,828 |
| Total Information Technology | 490,530,786 |
| Materials 2.1% |
| Chemicals 2.1% |
| Albemarle Corp. | 155,960 | 14,237,589 |
| Eastman Chemical Co. | 211,500 | 17,488,935 |
| Total | | 31,726,524 |
| Total Materials | 31,726,524 |
| Real Estate 2.0% |
| Equity Real Estate Investment Trusts (REITS) 2.0% |
| American Tower Corp. | 109,326 | 19,257,775 |
| Equinix, Inc. | 27,227 | 11,530,634 |
| Total | | 30,788,409 |
| Total Real Estate | 30,788,409 |
Total Common Stocks
(Cost $1,025,503,391) | 1,511,250,546 |
|
The accompanying Notes to Financial Statements are an integral part of this statement.
| 8 | Columbia Large Cap Growth Fund III | Annual Report 2019 |
Portfolio of Investments (continued)
February 28, 2019
| Money Market Funds 1.0% |
| | Shares | Value ($) |
| Columbia Short-Term Cash Fund, 2.523%(b),(c) | 16,199,955 | 16,198,335 |
Total Money Market Funds
(Cost $16,198,335) | 16,198,335 |
Total Investments in Securities
(Cost: $1,041,701,726) | 1,527,448,881 |
| Other Assets & Liabilities, Net | | (3,663,548) |
| Net Assets | 1,523,785,333 |
Notes to Portfolio of Investments
| (a) | Non-income producing investment. |
| (b) | The rate shown is the seven-day current annualized yield at February 28, 2019. |
| (c) | As defined in the Investment Company Act of 1940, an affiliated company is one in which the Fund owns 5% or more of the company’s outstanding voting securities, or a company which is under common ownership or control with the Fund. Holdings and transactions in these affiliated companies during the year ended February 28, 2019 are as follows: |
| Issuer | Beginning
shares | Shares
purchased | Shares
sold | Ending
shares | Realized gain
(loss) —
affiliated
issuers ($) | Net change in
unrealized
appreciation
(depreciation) —
affiliated
issuers ($) | Dividends —
affiliated
issuers ($) | Value —
affiliated
issuers
at end of
period ($) |
| Columbia Short-Term Cash Fund, 2.523% |
| | 10,205,483 | 306,753,939 | (300,759,467) | 16,199,955 | 134 | — | 315,252 | 16,198,335 |
Abbreviation Legend
| ADR | American Depositary Receipt |
Fair value measurements
The Fund categorizes its fair value measurements according to a three-level hierarchy that maximizes the use of observable inputs and minimizes the use of unobservable inputs by prioritizing that the most observable input be used when available. Observable inputs are those that market participants would use in pricing an investment based on market data obtained from sources independent of the reporting entity. Unobservable inputs are those that reflect the Fund’s assumptions about the information market participants would use in pricing an investment. An investment’s level within the fair value hierarchy is based on the lowest level of any input that is deemed significant to the asset’s or liability’s fair value measurement. The input levels are not necessarily an indication of the risk or liquidity associated with investments at that level. For example, certain U.S. government securities are generally high quality and liquid, however, they are reflected as Level 2 because the inputs used to determine fair value may not always be quoted prices in an active market.
Fair value inputs are summarized in the three broad levels listed below:
| ■ | Level 1 — Valuations based on quoted prices for investments in active markets that the Fund has the ability to access at the measurement date. Valuation adjustments are not applied to Level 1 investments. |
| ■ | Level 2 — Valuations based on other significant observable inputs (including quoted prices for similar securities, interest rates, prepayment speeds, credit risks, etc.). |
| ■ | Level 3 — Valuations based on significant unobservable inputs (including the Fund’s own assumptions and judgment in determining the fair value of investments). |
Inputs that are used in determining fair value of an investment may include price information, credit data, volatility statistics, and other factors. These inputs can be either observable or unobservable. The availability of observable inputs can vary between investments, and is affected by various factors such as the type of investment, and the volume and level of activity for that investment or similar investments in the marketplace. The inputs will be considered by the Investment Manager, along with any other relevant factors in the calculation of an investment’s fair value. The Fund uses prices and inputs that are current as of the measurement date, which may include periods of market dislocations. During these periods, the availability of prices and inputs may be reduced for many investments. This condition could cause an investment to be reclassified between the various levels within the hierarchy.
Certain investments that have been measured at fair value using the net asset value (NAV) per share (or its equivalent) are not categorized in the fair value hierarchy. The fair value amounts presented in the table are intended to reconcile the fair value hierarchy to the amounts presented in the Portfolio of Investments. The Columbia Short-Term Cash Fund seeks to provide shareholders with maximum current income consistent with liquidity and stability of principal. Columbia Short-Term Cash Fund prices its shares with a floating NAV and no longer seeks to maintain a stable NAV.
Investments falling into the Level 3 category are primarily supported by quoted prices from brokers and dealers participating in the market for those investments. However, these may be classified as Level 3 investments due to lack of market transparency and corroboration to support these quoted prices. Additionally, valuation models may be used as the pricing source for any remaining investments classified as Level 3. These models may rely on one or more significant unobservable inputs and/or significant assumptions by the Investment Manager. Inputs used in valuations may include, but are not limited to, financial statement analysis, capital account balances, discount rates and estimated cash flows, and comparable company data.
The accompanying Notes to Financial Statements are an integral part of this statement.
Columbia Large Cap Growth Fund III | Annual Report 2019
| 9 |
Portfolio of Investments (continued)
February 28, 2019
Fair value measurements (continued)
Under the direction of the Fund’s Board of Trustees (the Board), the Investment Manager’s Valuation Committee (the Committee) is responsible for overseeing the valuation procedures approved by the Board. The Committee consists of voting and non-voting members from various groups within the Investment Manager’s organization, including operations and accounting, trading and investments, compliance, risk management and legal.
The Committee meets at least monthly to review and approve valuation matters, which may include a description of specific valuation determinations, data regarding pricing information received from approved pricing vendors and brokers and the results of Board-approved valuation control policies and procedures (the Policies). The Policies address, among other things, instances when market quotations are or are not readily available, including recommendations of third party pricing vendors and a determination of appropriate pricing methodologies; events that require specific valuation determinations and assessment of fair value techniques; securities with a potential for stale pricing, including those that are illiquid, restricted, or in default; and the effectiveness of third party pricing vendors, including periodic reviews of vendors. The Committee meets more frequently, as needed, to discuss additional valuation matters, which may include the need to review back-testing results, review time-sensitive information or approve related valuation actions. The Committee reports to the Board, with members of the Committee meeting with the Board at each of its regularly scheduled meetings to discuss valuation matters and actions during the period, similar to those described earlier.
For investments categorized as Level 3, the Committee monitors information similar to that described above, which may include: (i) data specific to the issuer or comparable issuers, (ii) general market or specific sector news and (iii) quoted prices and specific or similar security transactions. The Committee considers this data and any changes from prior periods in order to assess the reasonableness of observable and unobservable inputs, any assumptions or internal models used to value those securities and changes in fair value. This data is also used to corroborate, when available, information received from approved pricing vendors and brokers. Various factors impact the frequency of monitoring this information (which may occur as often as daily). However, the Committee may determine that changes to inputs, assumptions and models are not required as a result of the monitoring procedures performed.
The following table is a summary of the inputs used to value the Fund’s investments at February 28, 2019:
| | Level 1
quoted prices
in active
markets for
identical
assets ($) | Level 2
other
significant
observable
inputs ($) | Level 3
significant
unobservable
inputs ($) | Investments
measured at
net asset
value ($) | Total ($) |
| Investments in Securities | | | | | |
| Common Stocks | | | | | |
| Communication Services | 186,539,135 | — | — | — | 186,539,135 |
| Consumer Discretionary | 254,049,687 | — | — | — | 254,049,687 |
| Consumer Staples | 34,826,264 | — | — | — | 34,826,264 |
| Energy | 10,994,603 | — | — | — | 10,994,603 |
| Financials | 61,702,309 | — | — | — | 61,702,309 |
| Health Care | 268,217,727 | — | — | — | 268,217,727 |
| Industrials | 141,875,102 | — | — | — | 141,875,102 |
| Information Technology | 490,530,786 | — | — | — | 490,530,786 |
| Materials | 31,726,524 | — | — | — | 31,726,524 |
| Real Estate | 30,788,409 | — | — | — | 30,788,409 |
| Total Common Stocks | 1,511,250,546 | — | — | — | 1,511,250,546 |
| Money Market Funds | — | — | — | 16,198,335 | 16,198,335 |
| Total Investments in Securities | 1,511,250,546 | — | — | 16,198,335 | 1,527,448,881 |
See the Portfolio of Investments for all investment classifications not indicated in the table.
There were no transfers of financial assets between levels during the period.
The accompanying Notes to Financial Statements are an integral part of this statement.
| 10 | Columbia Large Cap Growth Fund III | Annual Report 2019 |
Statement of Assets and Liabilities
February 28, 2019
| Assets | |
| Investments in securities, at value | |
| Unaffiliated issuers (cost $1,025,503,391) | $1,511,250,546 |
| Affiliated issuers (cost $16,198,335) | 16,198,335 |
| Cash | 70 |
| Receivable for: | |
| Investments sold | 6,012,951 |
| Capital shares sold | 225,393 |
| Dividends | 1,302,891 |
| Foreign tax reclaims | 9,909 |
| Expense reimbursement due from Investment Manager | 3,150 |
| Prepaid expenses | 3,249 |
| Total assets | 1,535,006,494 |
| Liabilities | |
| Payable for: | |
| Investments purchased | 9,253,581 |
| Capital shares purchased | 1,164,201 |
| Management services fees | 30,099 |
| Distribution and/or service fees | 8,313 |
| Transfer agent fees | 197,752 |
| Compensation of board members | 474,929 |
| Compensation of chief compliance officer | 15 |
| Other expenses | 92,271 |
| Total liabilities | 11,221,161 |
| Net assets applicable to outstanding capital stock | $1,523,785,333 |
| Represented by | |
| Paid in capital | 1,014,450,070 |
| Total distributable earnings (loss) (Note 2) | 509,335,263 |
| Total - representing net assets applicable to outstanding capital stock | $1,523,785,333 |
The accompanying Notes to Financial Statements are an integral part of this statement.
Columbia Large Cap Growth Fund III | Annual Report 2019
| 11 |
Statement of Assets and Liabilities (continued)
February 28, 2019
| Class A | |
| Net assets | $929,808,453 |
| Shares outstanding | 54,107,749 |
| Net asset value per share | $17.18 |
| Maximum sales charge | 5.75% |
| Maximum offering price per share (calculated by dividing the net asset value per share by 1.0 minus the maximum sales charge for Class A shares) | $18.23 |
| Advisor Class | |
| Net assets | $26,285,694 |
| Shares outstanding | 1,364,941 |
| Net asset value per share | $19.26 |
| Class C | |
| Net assets | $57,316,013 |
| Shares outstanding | 4,899,150 |
| Net asset value per share | $11.70 |
| Institutional Class | |
| Net assets | $472,921,759 |
| Shares outstanding | 25,342,504 |
| Net asset value per share | $18.66 |
| Institutional 2 Class | |
| Net assets | $12,349,366 |
| Shares outstanding | 634,749 |
| Net asset value per share | $19.46 |
| Institutional 3 Class | |
| Net assets | $779,645 |
| Shares outstanding | 41,577 |
| Net asset value per share | $18.75 |
| Class R | |
| Net assets | $24,324,403 |
| Shares outstanding | 1,406,082 |
| Net asset value per share | $17.30 |
The accompanying Notes to Financial Statements are an integral part of this statement.
| 12 | Columbia Large Cap Growth Fund III | Annual Report 2019 |
Statement of Operations
Year Ended February 28, 2019
| Net investment income | |
| Income: | |
| Dividends — unaffiliated issuers | $14,646,742 |
| Dividends — affiliated issuers | 315,252 |
| Total income | 14,961,994 |
| Expenses: | |
| Management services fees | 11,640,148 |
| Distribution and/or service fees | |
| Class A | 2,281,050 |
| Class C | 1,508,551 |
| Class R | 122,858 |
| Class T | 8 |
| Transfer agent fees | |
| Class A | 1,211,263 |
| Advisor Class | 36,014 |
| Class C | 200,211 |
| Institutional Class | 678,669 |
| Institutional 2 Class | 5,823 |
| Institutional 3 Class | 79 |
| Class R | 32,635 |
| Class T | 3 |
| Compensation of board members | 16,267 |
| Custodian fees | 14,769 |
| Printing and postage fees | 142,802 |
| Registration fees | 126,608 |
| Audit fees | 33,051 |
| Legal fees | 21,121 |
| Compensation of chief compliance officer | 350 |
| Other | 36,361 |
| Total expenses | 18,108,641 |
| Fees waived or expenses reimbursed by Investment Manager and its affiliates | (634,659) |
| Expense reduction | (1,795) |
| Total net expenses | 17,472,187 |
| Net investment loss | (2,510,193) |
| Realized and unrealized gain (loss) — net | |
| Net realized gain (loss) on: | |
| Investments — unaffiliated issuers | 121,415,519 |
| Investments — affiliated issuers | 134 |
| Net realized gain | 121,415,653 |
| Net change in unrealized appreciation (depreciation) on: | |
| Investments — unaffiliated issuers | (53,833,080) |
| Net change in unrealized appreciation (depreciation) | (53,833,080) |
| Net realized and unrealized gain | 67,582,573 |
| Net increase in net assets resulting from operations | $65,072,380 |
The accompanying Notes to Financial Statements are an integral part of this statement.
Columbia Large Cap Growth Fund III | Annual Report 2019
| 13 |
Statement of Changes in Net Assets
| | Year Ended
February 28, 2019 | Year Ended
February 28, 2018 |
| Operations | | |
| Net investment loss | $(2,510,193) | $(2,231,005) |
| Net realized gain | 121,415,653 | 162,530,109 |
| Net change in unrealized appreciation (depreciation) | (53,833,080) | 213,458,299 |
| Net increase in net assets resulting from operations | 65,072,380 | 373,757,403 |
| Distributions to shareholders | | |
| Net investment income and net realized gains | | |
| Class A | (92,700,334) | |
| Advisor Class | (2,500,640) | |
| Class C | (21,242,037) | |
| Institutional Class | (48,574,637) | |
| Institutional 2 Class | (926,044) | |
| Institutional 3 Class | (39,559) | |
| Class R | (2,480,069) | |
| Class T | (432) | |
| Net realized gains | | |
| Class A | | (49,624,039) |
| Advisor Class | | (1,562,635) |
| Class B | | (3,487) |
| Class C | | (22,995,937) |
| Institutional Class | | (30,288,033) |
| Institutional 2 Class | | (501,076) |
| Institutional 3 Class | | (11,526) |
| Class R | | (1,428,198) |
| Class T | | (246) |
| Total distributions to shareholders (Note 2) | (168,463,752) | (106,415,177) |
| Decrease in net assets from capital stock activity | (113,505,925) | (305,319,083) |
| Total decrease in net assets | (216,897,297) | (37,976,857) |
| Net assets at beginning of year | 1,740,682,630 | 1,778,659,487 |
| Net assets at end of year | $1,523,785,333 | $1,740,682,630 |
| Excess of distributions over net investment income | $(727,163) | $(511,055) |
The accompanying Notes to Financial Statements are an integral part of this statement.
| 14 | Columbia Large Cap Growth Fund III | Annual Report 2019 |
Statement of Changes in Net Assets (continued)
| | Year Ended | Year Ended |
| | February 28, 2019 | February 28, 2018 |
| | Shares | Dollars ($) | Shares | Dollars ($) |
| Capital stock activity |
| Class A | | | | |
| Subscriptions | 13,931,715 | 255,985,558 | 8,252,408 | 141,623,544 |
| Distributions reinvested | 3,648,728 | 62,240,447 | 1,816,753 | 31,294,882 |
| Redemptions | (9,878,792) | (175,241,781) | (17,034,675) | (287,355,794) |
| Net increase (decrease) | 7,701,651 | 142,984,224 | (6,965,514) | (114,437,368) |
| Advisor Class | | | | |
| Subscriptions | 215,699 | 4,244,833 | 435,299 | 8,483,157 |
| Distributions reinvested | 130,158 | 2,500,242 | 82,040 | 1,562,404 |
| Redemptions | (351,883) | (6,956,623) | (557,295) | (10,832,272) |
| Net decrease | (6,026) | (211,548) | (39,956) | (786,711) |
| Class B | | | | |
| Subscriptions | — | — | 66 | 810 |
| Distributions reinvested | — | — | 195 | 2,395 |
| Redemptions | — | — | (162,904) | (1,924,751) |
| Net decrease | — | — | (162,643) | (1,921,546) |
| Class C | | | | |
| Subscriptions | 320,078 | 3,907,106 | 377,543 | 4,728,914 |
| Distributions reinvested | 1,535,594 | 19,223,307 | 1,666,979 | 20,693,954 |
| Redemptions | (19,119,904) | (248,986,743) | (16,712,020) | (208,884,917) |
| Net decrease | (17,264,232) | (225,856,330) | (14,667,498) | (183,462,049) |
| Class I | | | | |
| Redemptions | — | — | (216) | (3,702) |
| Net decrease | — | — | (216) | (3,702) |
| Institutional Class | | | | |
| Subscriptions | 2,885,192 | 56,261,008 | 8,460,839 | 148,682,510 |
| Distributions reinvested | 2,150,109 | 40,009,637 | 1,327,188 | 24,557,731 |
| Redemptions | (6,961,211) | (132,258,738) | (9,294,465) | (171,663,861) |
| Net increase (decrease) | (1,925,910) | (35,988,093) | 493,562 | 1,576,380 |
| Institutional 2 Class | | | | |
| Subscriptions | 316,668 | 6,320,603 | 210,162 | 4,028,048 |
| Distributions reinvested | 47,893 | 925,648 | 26,093 | 500,844 |
| Redemptions | (185,086) | (3,628,917) | (270,080) | (5,216,944) |
| Net increase (decrease) | 179,475 | 3,617,334 | (33,825) | (688,052) |
| Institutional 3 Class | | | | |
| Subscriptions | 30,754 | 592,956 | 12,679 | 236,220 |
| Distributions reinvested | 2,123 | 38,955 | 610 | 11,364 |
| Redemptions | (4,535) | (87,404) | (54) | (1,039) |
| Net increase | 28,342 | 544,507 | 13,235 | 246,545 |
| Class R | | | | |
| Subscriptions | 240,337 | 4,380,576 | 167,250 | 2,914,861 |
| Distributions reinvested | 135,316 | 2,340,222 | 75,758 | 1,315,564 |
| Redemptions | (293,297) | (5,313,149) | (575,295) | (10,073,005) |
| Net increase (decrease) | 82,356 | 1,407,649 | (332,287) | (5,842,580) |
| Class T | | | | |
| Redemptions | (231) | (3,668) | — | — |
| Net decrease | (231) | (3,668) | — | — |
| Total net decrease | (11,204,575) | (113,505,925) | (21,695,142) | (305,319,083) |
The accompanying Notes to Financial Statements are an integral part of this statement.
Columbia Large Cap Growth Fund III | Annual Report 2019
| 15 |
The following table is intended to help you understand the Fund’s financial performance. Certain information reflects financial results for a single share of a class held for the periods shown. Per share net investment income (loss) amounts are calculated based on average shares outstanding during the period. Total return assumes reinvestment of all dividends and distributions, if any. Total return does not reflect payment of sales charges, if any. Total return and portfolio turnover are not annualized for periods of less than one year. The portfolio turnover rate is calculated without regard to purchase and sales transactions of short-term instruments and certain derivatives, if any. If such transactions were included, the Fund’s portfolio turnover rate may be higher.
| | Net asset value,
beginning of
period | Net
investment
income
(loss) | Net
realized
and
unrealized
gain (loss) | Total from
investment
operations | Distributions
from net
realized
gains | Total
distributions to
shareholders |
| Class A |
| Year Ended 2/28/2019 | $18.33 | (0.03) | 0.75 | 0.72 | (1.87) | (1.87) |
| Year Ended 2/28/2018 | $15.74 | (0.01) | 3.66 | 3.65 | (1.06) | (1.06) |
| Year Ended 2/28/2017 | $14.87 | 0.02 | 2.84 | 2.86 | (1.99) | (1.99) |
| Year Ended 2/29/2016 | $20.50 | (0.09) | (1.73) | (1.82) | (3.81) | (3.81) |
| Year Ended 2/28/2015 | $21.22 | (0.05) | 2.41 | 2.36 | (3.08) | (3.08) |
| Advisor Class |
| Year Ended 2/28/2019 | $20.27 | 0.02 | 0.85 | 0.87 | (1.88) | (1.88) |
| Year Ended 2/28/2018 | $17.30 | 0.03 | 4.03 | 4.06 | (1.09) | (1.09) |
| Year Ended 2/28/2017 | $16.13 | 0.06 | 3.10 | 3.16 | (1.99) | (1.99) |
| Year Ended 2/29/2016 | $21.88 | (0.05) | (1.89) | (1.94) | (3.81) | (3.81) |
| Year Ended 2/28/2015 | $22.42 | 0.01 | 2.57 | 2.58 | (3.12) | (3.12) |
| Class C |
| Year Ended 2/28/2019 | $13.14 | (0.12) | 0.53 | 0.41 | (1.85) | (1.85) |
| Year Ended 2/28/2018 | $11.58 | (0.10) | 2.66 | 2.56 | (1.00) | (1.00) |
| Year Ended 2/28/2017 | $11.51 | (0.07) | 2.13 | 2.06 | (1.99) | (1.99) |
| Year Ended 2/29/2016 | $16.81 | (0.18) | (1.34) | (1.52) | (3.78) | (3.78) |
| Year Ended 2/28/2015 | $17.94 | (0.16) | 1.99 | 1.83 | (2.96) | (2.96) |
| Institutional Class |
| Year Ended 2/28/2019 | $19.70 | 0.02 | 0.82 | 0.84 | (1.88) | (1.88) |
| Year Ended 2/28/2018 | $16.84 | 0.03 | 3.92 | 3.95 | (1.09) | (1.09) |
| Year Ended 2/28/2017 | $15.74 | 0.06 | 3.03 | 3.09 | (1.99) | (1.99) |
| Year Ended 2/29/2016 | $21.44 | (0.04) | (1.85) | (1.89) | (3.81) | (3.81) |
| Year Ended 2/28/2015 | $22.04 | 0.01 | 2.51 | 2.52 | (3.12) | (3.12) |
| Institutional 2 Class |
| Year Ended 2/28/2019 | $20.45 | 0.03 | 0.86 | 0.89 | (1.88) | (1.88) |
| Year Ended 2/28/2018 | $17.44 | 0.05 | 4.06 | 4.11 | (1.10) | (1.10) |
| Year Ended 2/28/2017 | $16.23 | 0.08 | 3.12 | 3.20 | (1.99) | (1.99) |
| Year Ended 2/29/2016 | $21.96 | (0.01) | (1.90) | (1.91) | (3.82) | (3.82) |
| Year Ended 2/28/2015 | $22.49 | 0.04 | 2.58 | 2.62 | (3.15) | (3.15) |
| Institutional 3 Class |
| Year Ended 2/28/2019 | $19.77 | 0.04 | 0.82 | 0.86 | (1.88) | (1.88) |
| Year Ended 2/28/2018(f) | $17.10 | 0.04 | 3.74 | 3.78 | (1.11) | (1.11) |
The accompanying Notes to Financial Statements are an integral part of this statement.
| 16 | Columbia Large Cap Growth Fund III | Annual Report 2019 |
Financial Highlights (continued)
| | Net
asset
value,
end of
period | Total
return | Total gross
expense
ratio to
average
net assets(a) | Total net
expense
ratio to
average
net assets(a),(b) | Net investment
income (loss)
ratio to
average
net assets | Portfolio
turnover | Net
assets,
end of
period
(000’s) |
| Class A |
| Year Ended 2/28/2019 | $17.18 | 4.19% | 1.12% | 1.08%(c) | (0.16%) | 23% | $929,808 |
| Year Ended 2/28/2018 | $18.33 | 23.65% | 1.12% | 1.12%(c) | (0.07%) | 37% | $850,411 |
| Year Ended 2/28/2017 | $15.74 | 20.85% | 1.18%(d) | 1.17%(c),(d) | 0.11% | 29% | $840,034 |
| Year Ended 2/29/2016 | $14.87 | (11.07%) | 1.24%(e) | 1.22%(c),(e) | (0.46%) | 102% | $356,035 |
| Year Ended 2/28/2015 | $20.50 | 12.29% | 1.22%(e) | 1.22%(c),(e) | (0.23%) | 53% | $543,323 |
| Advisor Class |
| Year Ended 2/28/2019 | $19.26 | 4.53% | 0.87% | 0.83%(c) | 0.09% | 23% | $26,286 |
| Year Ended 2/28/2018 | $20.27 | 23.93% | 0.87% | 0.87%(c) | 0.18% | 37% | $27,793 |
| Year Ended 2/28/2017 | $17.30 | 21.11% | 0.92%(d) | 0.92%(c),(d) | 0.32% | 29% | $24,411 |
| Year Ended 2/29/2016 | $16.13 | (10.88%) | 0.98%(e) | 0.97%(c),(e) | (0.23%) | 102% | $3,401 |
| Year Ended 2/28/2015 | $21.88 | 12.64% | 0.98%(e) | 0.97%(c),(e) | 0.03% | 53% | $18,848 |
| Class C |
| Year Ended 2/28/2019 | $11.70 | 3.46% | 1.86% | 1.84%(c) | (0.96%) | 23% | $57,316 |
| Year Ended 2/28/2018 | $13.14 | 22.74% | 1.87% | 1.87%(c) | (0.79%) | 37% | $291,221 |
| Year Ended 2/28/2017 | $11.58 | 19.89% | 1.91%(d) | 1.91%(c),(d) | (0.63%) | 29% | $426,640 |
| Year Ended 2/29/2016 | $11.51 | (11.70%) | 1.99%(e) | 1.97%(c),(e) | (1.21%) | 102% | $148,420 |
| Year Ended 2/28/2015 | $16.81 | 11.47% | 1.97%(e) | 1.97%(c),(e) | (0.98%) | 53% | $227,979 |
| Institutional Class |
| Year Ended 2/28/2019 | $18.66 | 4.51% | 0.87% | 0.83%(c) | 0.09% | 23% | $472,922 |
| Year Ended 2/28/2018 | $19.70 | 23.93% | 0.87% | 0.87%(c) | 0.19% | 37% | $537,229 |
| Year Ended 2/28/2017 | $16.84 | 21.19% | 0.90%(d) | 0.90%(c),(d) | 0.37% | 29% | $450,897 |
| Year Ended 2/29/2016 | $15.74 | (10.87%) | 0.98%(e) | 0.97%(c),(e) | (0.22%) | 102% | $129,655 |
| Year Ended 2/28/2015 | $21.44 | 12.59% | 0.98%(e) | 0.97%(c),(e) | 0.03% | 53% | $285,397 |
| Institutional 2 Class |
| Year Ended 2/28/2019 | $19.46 | 4.60% | 0.80% | 0.76% | 0.17% | 23% | $12,349 |
| Year Ended 2/28/2018 | $20.45 | 24.04% | 0.80% | 0.80% | 0.26% | 37% | $9,310 |
| Year Ended 2/28/2017 | $17.44 | 21.23% | 0.83%(d) | 0.83%(d) | 0.46% | 29% | $8,530 |
| Year Ended 2/29/2016 | $16.23 | (10.72%) | 0.83%(e) | 0.83%(e) | (0.07%) | 102% | $4,934 |
| Year Ended 2/28/2015 | $21.96 | 12.77% | 0.82%(e) | 0.82%(e) | 0.17% | 53% | $8,682 |
| Institutional 3 Class |
| Year Ended 2/28/2019 | $18.75 | 4.61% | 0.77% | 0.71% | 0.24% | 23% | $780 |
| Year Ended 2/28/2018(f) | $19.77 | 22.55% | 0.76% | 0.76% | 0.19% | 37% | $262 |
The accompanying Notes to Financial Statements are an integral part of this statement.
Columbia Large Cap Growth Fund III | Annual Report 2019
| 17 |
Financial Highlights (continued)
| | Net asset value,
beginning of
period | Net
investment
income
(loss) | Net
realized
and
unrealized
gain (loss) | Total from
investment
operations | Distributions
from net
realized
gains | Total
distributions to
shareholders |
| Class R |
| Year Ended 2/28/2019 | $18.47 | (0.07) | 0.76 | 0.69 | (1.86) | (1.86) |
| Year Ended 2/28/2018 | $15.87 | (0.05) | 3.67 | 3.62 | (1.02) | (1.02) |
| Year Ended 2/28/2017(g) | $14.69 | (0.01) | 1.30 | 1.29 | (0.11) | (0.11) |
| Notes to Financial Highlights |
| (a) | In addition to the fees and expenses that the Fund bears directly, the Fund indirectly bears a pro rata share of the fees and expenses of any other funds in which it invests. Such indirect expenses are not included in the Fund’s reported expense ratios. |
| (b) | Total net expenses include the impact of certain fee waivers/expense reimbursements made by the Investment Manager and certain of its affiliates, if applicable. |
| (c) | The benefits derived from expense reductions had an impact of less than 0.01%. |
| (d) | Expenses have been reduced due to a reimbursement of expenses overbilled by a third party. If the reimbursement had been excluded, the expense ratios would have been higher by the percentages shown for each class in the table below. All fee waivers and expense reimbursements by the Investment Manager and its affiliates were applied before giving effect to this third party reimbursement. |
| Year Ended | Class A | Advisor
Class | Class C | Institutional
Class | Institutional 2
Class |
| 02/28/2017 | 0.01% | 0.01% | 0.01% | 0.01% | 0.01% |
| (e) | Ratios include line of credit interest expense which is less than 0.01%. |
| (f) | Institutional 3 Class shares commenced operations on March 1, 2017. Per share data and total return reflect activity from that date. |
| (g) | Class R shares commenced operations on October 26, 2016. Per share data and total return reflect activity from that date. |
| (h) | Annualized. |
The accompanying Notes to Financial Statements are an integral part of this statement.
| 18 | Columbia Large Cap Growth Fund III | Annual Report 2019 |
Financial Highlights (continued)
| | Net
asset
value,
end of
period | Total
return | Total gross
expense
ratio to
average
net assets(a) | Total net
expense
ratio to
average
net assets(a),(b) | Net investment
income (loss)
ratio to
average
net assets | Portfolio
turnover | Net
assets,
end of
period
(000’s) |
| Class R |
| Year Ended 2/28/2019 | $17.30 | 4.00% | 1.37% | 1.33%(c) | (0.41%) | 23% | $24,324 |
| Year Ended 2/28/2018 | $18.47 | 23.28% | 1.37% | 1.37%(c) | (0.31%) | 37% | $24,453 |
| Year Ended 2/28/2017(g) | $15.87 | 8.81% | 1.35%(h) | 1.35%(c),(h) | (0.14%)(h) | 29% | $26,278 |
The accompanying Notes to Financial Statements are an integral part of this statement.
Columbia Large Cap Growth Fund III | Annual Report 2019
| 19 |
Notes to Financial Statements
February 28, 2019
Note 1. Organization
Columbia Large Cap Growth Fund III (the Fund), a series of Columbia Funds Series Trust (the Trust), is a diversified fund. The Trust is registered under the Investment Company Act of 1940, as amended (the 1940 Act), as an open-end management investment company organized as a Delaware statutory trust.
Fund shares
The Trust may issue an unlimited number of shares (without par value). Although all share classes generally have identical voting, dividend and liquidation rights, each share class votes separately when required by the Trust’s organizational documents or by law. Different share classes pay different distribution amounts to the extent the expenses of such share classes differ, and distributions in liquidation will be proportional to the net asset value of each share class. Each share class has its own expense and sales charge structure. The Fund offers each of the share classes identified below.
Class A shares are subject to a maximum front-end sales charge of 5.75% based on the initial investment amount. Class A shares purchased without an initial sales charge in accounts aggregating $1 million to $50 million at the time of purchase are subject to a contingent deferred sales charge (CDSC) if the shares are sold within 18 months after purchase, charged as follows: 1.00% CDSC if redeemed within 12 months after purchase, and 0.50% CDSC if redeemed more than 12, but less than 18, months after purchase.
Advisor Class shares are not subject to sales charges and are generally available only to omnibus retirement plans and certain investors as described in the Fund’s prospectus.
Class C shares are subject to a 1.00% CDSC on shares redeemed within 12 months after purchase. Effective July 1, 2018, Class C shares automatically convert to Class A shares of the same Fund in the month of or the month following the 10-year anniversary of the Class C shares purchase date.
Institutional Class shares are not subject to sales charges and are generally available only to eligible investors, which are subject to different investment minimums as described in the Fund’s prospectus.
Institutional 2 Class shares are not subject to sales charges and are generally available only to investors purchasing through authorized investment professionals and omnibus retirement plans as described in the Fund’s prospectus.
Institutional 3 Class shares are not subject to sales charges and are available to institutional and certain other investors as described in the Fund’s prospectus.
Class R shares are not subject to sales charges and are generally available only to certain retirement plans and other investors as described in the Fund’s prospectus.
Class T shares were subject to a maximum front-end sales charge of 2.50% per transaction and were required to be purchased through financial intermediaries that, by written agreement with Columbia Management Investment Distributors, Inc., were specifically authorized to sell Class T shares. Effective at the close of business on December 14, 2018, Class T shares merged, in a tax-free transaction, into Class A shares of the Fund and are no longer offered for sale.
Note 2. Summary of significant accounting policies
Basis of preparation
The Fund is an investment company that applies the accounting and reporting guidance in the Financial Accounting Standards Board (FASB) Accounting Standards Codification Topic 946,Financial Services - Investment Companies (ASC 946). The financial statements are prepared in accordance with U.S. generally accepted accounting principles (GAAP), which requires management to make certain estimates and assumptions that affect the reported amounts of assets and liabilities, the disclosure of contingent assets and liabilities at the date of the financial statements and the reported amounts of income and expenses during the reporting period. Actual results could differ from those estimates.
The following is a summary of significant accounting policies followed by the Fund in the preparation of its financial statements.
| 20 | Columbia Large Cap Growth Fund III | Annual Report 2019 |
Notes to Financial Statements (continued)
February 28, 2019
Security valuation
All equity securities are valued at the close of business of the New York Stock Exchange. Equity securities are valued at the last quoted sales price on the principal exchange or market on which they trade, except for securities traded on the NASDAQ Stock Market, which are valued at the NASDAQ official close price. Unlisted securities or listed securities for which there were no sales during the day are valued at the mean of the latest quoted bid and ask prices on such exchanges or markets.
Foreign equity securities are valued based on the closing price on the foreign exchange in which such securities are primarily traded. If any foreign equity security closing prices are not readily available, the securities are valued at the mean of the latest quoted bid and ask prices on such exchanges or markets. Foreign currency exchange rates are generally determined at 4:00 p.m. Eastern (U.S.) time. Many securities markets and exchanges outside the U.S. close prior to the close of the New York Stock Exchange; therefore, the closing prices for securities in such markets or on such exchanges may not fully reflect events that occur after such close but before the close of the New York Stock Exchange. In those situations, foreign securities will be fair valued pursuant to a policy adopted by the Board of Trustees, including, if available, utilizing a third party pricing service to determine these fair values. The third party pricing service takes into account multiple factors, including, but not limited to, movements in the U.S. securities markets, certain depositary receipts, futures contracts and foreign exchange rates that have occurred subsequent to the close of the foreign exchange or market, to determine a good faith estimate that reasonably reflects the current market conditions as of the close of the New York Stock Exchange. The fair value of a security is likely to be different from the quoted or published price, if available.
Investments in open-end investment companies, including money market funds, are valued at their latest net asset value.
Investments for which market quotations are not readily available, or that have quotations which management believes are not reflective of market value or reliable, are valued at fair value as determined in good faith under procedures approved by and under the general supervision of the Board of Trustees. If a security or class of securities (such as foreign securities) is valued at fair value, such value is likely to be different from the quoted or published price for the security.
The determination of fair value often requires significant judgment. To determine fair value, management may use assumptions including but not limited to future cash flows and estimated risk premiums. Multiple inputs from various sources may be used to determine fair value.
GAAP requires disclosure regarding the inputs and valuation techniques used to measure fair value and any changes in valuation inputs or techniques. In addition, investments shall be disclosed by major category. This information is disclosed following the Fund’s Portfolio of Investments.
Security transactions
Security transactions are accounted for on the trade date. Cost is determined and gains (losses) are based upon the specific identification method for both financial statement and federal income tax purposes.
Income recognition
Corporate actions and dividend income are generally recorded net of any non-reclaimable tax withholdings, on the ex-dividend date or upon receipt of ex-dividend notification in the case of certain foreign securities.
The Fund may receive distributions from holdings in equity securities, business development companies (BDCs), exchange-traded funds (ETFs), limited partnerships (LPs), other regulated investment companies (RICs), and real estate investment trusts (REITs), which report information on the tax character of their distributions annually. These distributions are allocated to dividend income, capital gain and return of capital based on actual information reported. Return of capital is recorded as a reduction of the cost basis of securities held. If the Fund no longer owns the applicable securities, return of capital is recorded as a realized gain. With respect to REITs, to the extent actual information has not yet been reported, estimates for return of capital are made by the Fund’s management. Management’s estimates are subsequently adjusted when the actual character of the distributions is disclosed by the REITs, which could result in a proportionate change in return of capital to shareholders.
Awards from class action litigation are recorded as a reduction of cost basis if the Fund still owns the applicable securities on the payment date. If the Fund no longer owns the applicable securities, the proceeds are recorded as realized gains.
Columbia Large Cap Growth Fund III | Annual Report 2019
| 21 |
Notes to Financial Statements (continued)
February 28, 2019
Expenses
General expenses of the Trust are allocated to the Fund and other funds of the Trust based upon relative net assets or other expense allocation methodologies determined by the nature of the expense. Expenses directly attributable to the Fund are charged to the Fund. Expenses directly attributable to a specific class of shares are charged to that share class.
Determination of class net asset value
All income, expenses (other than class-specific expenses, which are charged to that share class, as shown in the Statement of Operations) and realized and unrealized gains (losses) are allocated to each class of the Fund on a daily basis, based on the relative net assets of each class, for purposes of determining the net asset value of each class.
Federal income tax status
The Fund intends to qualify each year as a regulated investment company under Subchapter M of the Internal Revenue Code, as amended, and will distribute substantially all of its investment company taxable income and net capital gain, if any, for its tax year, and as such will not be subject to federal income taxes. In addition, the Fund intends to distribute in each calendar year substantially all of its ordinary income, capital gain net income and certain other amounts, if any, such that the Fund should not be subject to federal excise tax. Therefore, no federal income or excise tax provision is recorded.
Distributions to shareholders
Distributions from net investment income, if any, are declared and paid semi-annually. Net realized capital gains, if any, are distributed at least annually. Income distributions and capital gain distributions are determined in accordance with federal income tax regulations, which may differ from GAAP.
Guarantees and indemnifications
Under the Trust’s organizational documents and, in some cases, by contract, its officers and trustees are indemnified against certain liabilities arising out of the performance of their duties to the Trust or its funds. In addition, certain of the Fund’s contracts with its service providers contain general indemnification clauses. The Fund’s maximum exposure under these arrangements is unknown since the amount of any future claims that may be made against the Fund cannot be determined, and the Fund has no historical basis for predicting the likelihood of any such claims.
Recent accounting pronouncements
Accounting Standards Update 2017-08 Premium Amortization on Purchased Callable Debt Securities
In March 2017, the Financial Accounting Standards Board issued Accounting Standards Update (ASU) No. 2017-08 Premium Amortization on Purchased Callable Debt Securities. ASU No. 2017-08 updates the accounting standards to shorten the amortization period for certain purchased callable debt securities, held at a premium, to be amortized to the earliest call date. The update applies to securities with explicit, noncontingent call features that are callable at fixed prices and on preset dates. The standard is effective for annual periods beginning after December 15, 2018 and interim periods within those fiscal years. Management does not expect the implementation of this guidance to have a material impact on the financial statement amounts and footnote disclosures.
Accounting Standards Update 2018-13 Disclosure Framework - Changes to the Disclosure Requirements for Fair Value Measurement
In August 2018, the Financial Accounting Standards Board issued Accounting Standards Update (ASU) No. 2018-13 Disclosure Framework - Changes to the Disclosure Requirements for Fair Value Measurement. ASU No. 2018-13, in addition to other modifications and additions, removes the requirement to disclose the amount and reasons for transfers between Level 1 and Level 2 of the fair value hierarchy and the policy for the timing of transfers between levels. The standard is effective for annual periods beginning after December 15, 2019 and interim periods within those fiscal years. At this time, management is evaluating the implication of this guidance and the impact it will have on the financial statement disclosures, if any.
Disclosure Update and Simplification
| 22 | Columbia Large Cap Growth Fund III | Annual Report 2019 |
Notes to Financial Statements (continued)
February 28, 2019
In September 2018, the Securities and Exchange Commission (SEC) released Final Rule 33-10532, Disclosure Update and Simplification, which amends certain financial statement disclosure requirements that the SEC determined to be redundant, outdated, or superseded in light of other SEC disclosure requirements, GAAP, or changes in the information environment. As a result of the amendments, management implemented disclosure changes which included removing the components of distributable earnings presented on the Statement of Assets and Liabilities and combining income and gain distributions paid to shareholders as presented on the Statement of Changes in Net Assets. Any values presented to meet prior year requirements were left unchanged. The amendments had no effect on the Fund’s net assets or results of operation.
Note 3. Fees and other transactions with affiliates
Management services fees
The Fund has entered into a Management Agreement with Columbia Management Investment Advisers, LLC (the Investment Manager), a wholly-owned subsidiary of Ameriprise Financial, Inc. (Ameriprise Financial). Under the Management Agreement, the Investment Manager provides the Fund with investment research and advice, as well as administrative and accounting services. The management services fee is an annual fee that is equal to a percentage of the Fund’s daily net assets that declines from 0.77% to 0.57% as the Fund’s net assets increase. The effective management services fee rate for the year ended February 28, 2019 was 0.71% of the Fund’s average daily net assets.
Compensation of board members
Members of the Board of Trustees who are not officers or employees of the Investment Manager or Ameriprise Financial are compensated for their services to the Fund as disclosed in the Statement of Operations. Under a Deferred Compensation Plan (the Deferred Plan), these members of the Board of Trustees may elect to defer payment of up to 100% of their compensation. Deferred amounts are treated as though equivalent dollar amounts had been invested in shares of certain funds managed by the Investment Manager. The Fund’s liability for these amounts is adjusted for market value changes and remains in the Fund until distributed in accordance with the Deferred Plan. All amounts payable under the Deferred Plan constitute a general unsecured obligation of the Fund.
Compensation of Chief Compliance Officer
The Board of Trustees has appointed a Chief Compliance Officer to the Fund in accordance with federal securities regulations. As disclosed in the Statement of Operations, a portion of the Chief Compliance Officer’s total compensation is allocated to the Fund, along with other allocations to affiliated registered investment companies managed by the Investment Manager and its affiliates, based on relative net assets.
Transfer agency fees
Under a Transfer and Dividend Disbursing Agent Agreement, Columbia Management Investment Services Corp. (the Transfer Agent), an affiliate of the Investment Manager and a wholly-owned subsidiary of Ameriprise Financial, is responsible for providing transfer agency services to the Fund. The Transfer Agent has contracted with DST Asset Manager Solutions, Inc. (DST) to serve as sub-transfer agent. The Transfer Agent pays the fees of DST for services as sub-transfer agent and DST is not entitled to reimbursement for such fees from the Fund (with the exception of out-of-pocket fees).
The Fund pays the Transfer Agent a monthly transfer agency fee based on the number or the average value of accounts, depending on the type of account. In addition, the Fund pays the Transfer Agent a fee for shareholder services based on the number of accounts or on a percentage of the average aggregate value of the Fund’s shares maintained in omnibus accounts up to the lesser of the amount charged by the financial intermediary or a cap established by the Board of Trustees from time to time.
The Transfer Agent also receives compensation from the Fund for various shareholder services and reimbursements for certain out-of-pocket fees. Total transfer agency fees for Institutional 2 Class and Institutional 3 Class shares are subject to an annual limitation of not more than 0.07% and 0.02%, respectively, of the average daily net assets attributable to each share class.
Columbia Large Cap Growth Fund III | Annual Report 2019
| 23 |
Notes to Financial Statements (continued)
February 28, 2019
For the year ended February 28, 2019, the Fund’s effective transfer agency fee rates as a percentage of average daily net assets of each class were as follows:
| | Effective rate (%) |
| Class A | 0.13 |
| Advisor Class | 0.13 |
| Class C | 0.13 |
| Institutional Class | 0.13 |
| Institutional 2 Class | 0.06 |
| Institutional 3 Class | 0.02 |
| Class R | 0.13 |
| Class T | 0.08(a) |
An annual minimum account balance fee of $20 may apply to certain accounts with a value below the applicable share class’s initial minimum investment requirements to reduce the impact of small accounts on transfer agency fees. These minimum account balance fees are remitted to the Fund and recorded as part of expense reductions in the Statement of Operations. For the year ended February 28, 2019, these minimum account balance fees reduced total expenses of the Fund by $1,795.
Distribution and service fees
The Fund has entered into an agreement with Columbia Management Investment Distributors, Inc. (the Distributor), an affiliate of the Investment Manager and a wholly-owned subsidiary of Ameriprise Financial, for distribution and shareholder services. The Board of Trustees has approved, and the Fund has adopted, distribution and shareholder service plans (the Plans) applicable to certain share classes, which set the distribution and service fees for the Fund. These fees are calculated daily and are intended to compensate the Distributor and/or eligible selling and/or servicing agents for selling shares of the Fund and providing services to investors.
Under the Plans, the Fund pays a monthly combined distribution and service fee to the Distributor at the maximum annual rate of 0.25% of the average daily net assets attributable to Class A shares of the Fund. Also under the Plans, the Fund pays a monthly service fee to the Distributor at the maximum annual rate of 0.25% of the average daily net assets attributable to Class C and Class T shares of the Fund and a monthly distribution fee to the Distributor at the maximum annual rates of 0.75%, 0.50% and 0.25% of the average daily net assets attributable to Class C, Class R and Class T shares of the Fund, respectively. As a result of all Class T shares of the Fund being redeemed or converted to Class A shares, December 14, 2018 was the last day the Fund paid a service fee or distribution fee for Class T shares.
Although the Fund may pay a distribution fee up to 0.25% of the Fund’s average daily net assets attributable to Class T shares and a service fee of up to 0.25% of the Fund’s average daily net assets attributable to Class T shares, the aggregate fee shall not exceed 0.25% of the Fund’s average daily net assets attributable to Class T shares.
Sales charges (unaudited)
Sales charges, including front-end charges and CDSCs, received by the Distributor for distributing Fund shares for the year ended February 28, 2019, if any, are listed below:
| | Amount ($) |
| Class A | 112,461 |
| Class C | 2,285 |
| 24 | Columbia Large Cap Growth Fund III | Annual Report 2019 |
Notes to Financial Statements (continued)
February 28, 2019
Expenses waived/reimbursed by the Investment Manager and its affiliates
The Investment Manager and certain of its affiliates have contractually agreed to waive fees and/or reimburse expenses (excluding certain fees and expenses described below) for the period(s) disclosed below, unless sooner terminated at the sole discretion of the Board of Trustees, so that the Fund’s net operating expenses, after giving effect to fees waived/expenses reimbursed and any balance credits and/or overdraft charges from the Fund’s custodian, do not exceed the following annual rate(s) as a percentage of the class’ average daily net assets:
| | December 1, 2018
through
Novmber 30, 2019 | May 1, 2018
through
November 30, 2018 | Prior to
May 1, 2018 |
| Class A | 1.05% | 1.08% | 1.17% |
| Advisor Class | 0.80 | 0.83 | 0.92 |
| Class C | 1.80 | 1.83 | 1.92 |
| Institutional Class | 0.80 | 0.83 | 0.92 |
| Institutional 2 Class | 0.73 | 0.76 | 0.895 |
| Institutional 3 Class | 0.69 | 0.72 | 0.845 |
| Class R | 1.30 | 1.33 | 1.42 |
Under the agreement governing these fee waivers and/or expense reimbursement arrangements, the following fees and expenses are excluded from the waiver/reimbursement commitment, and therefore will be paid by the Fund, if applicable: taxes (including foreign transaction taxes), expenses associated with investments in affiliated and non-affiliated pooled investment vehicles (including mutual funds and exchange-traded funds), transaction costs and brokerage commissions, costs related to any securities lending program, dividend expenses associated with securities sold short, inverse floater program fees and expenses, transaction charges and interest on borrowed money, interest, infrequent and/or unusual expenses and any other expenses the exclusion of which is specifically approved by the Board of Trustees. This agreement may be modified or amended only with approval from the Investment Manager, certain of its affiliates and the Fund. Any fees waived and/or expenses reimbursed under the expense reimbursement arrangements described above are not recoverable by the Investment Manager or its affiliates in future periods.
Note 4. Federal tax information
The timing and character of income and capital gain distributions are determined in accordance with income tax regulations, which may differ from GAAP because of temporary or permanent book to tax differences.
At February 28, 2019, these differences were primarily due to differing treatment for deferral/reversal of wash sale losses, post-October capital losses, late-year ordinary losses, trustees’ deferred compensation and net operating loss reclassification. To the extent these differences were permanent, reclassifications were made among the components of the Fund’s net assets. Temporary differences do not require reclassifications.
The following reclassifications were made:
Excess of distributions
over net investment
income ($) | Accumulated
net realized
gain ($) | Paid in
capital ($) |
| 2,294,085 | — | (2,294,085) |
Net investment income (loss) and net realized gains (losses), as disclosed in the Statement of Operations, and net assets were not affected by this reclassification.
The tax character of distributions paid during the years indicated was as follows:
| Year Ended February 28, 2019 | Year Ended February 28, 2018 |
Ordinary
income ($) | Long-term
capital gains ($) | Total ($) | Ordinary
income ($) | Long-term
capital gains ($) | Total ($) |
| 1,490,192 | 166,973,560 | 168,463,752 | 5,100,306 | 101,314,871 | 106,415,177 |
Columbia Large Cap Growth Fund III | Annual Report 2019
| 25 |
Notes to Financial Statements (continued)
February 28, 2019
Short-term capital gain distributions, if any, are considered ordinary income distributions for tax purposes.
At February 28, 2019, the components of distributable earnings on a tax basis were as follows:
Undistributed
ordinary income ($) | Undistributed
long-term
capital gains ($) | Capital loss
carryforwards ($) | Net unrealized
appreciation ($) |
| — | 33,829,055 | — | 483,785,300 |
At February 28, 2019, the cost of all investments for federal income tax purposes along with the aggregate gross unrealized appreciation and depreciation based on that cost was:
Federal
tax cost ($) | Gross unrealized
appreciation ($) | Gross unrealized
(depreciation) ($) | Net unrealized
appreciation ($) |
| 1,043,663,581 | 508,175,893 | (24,390,593) | 483,785,300 |
Tax cost of investments and unrealized appreciation/(depreciation) may also include timing differences that do not constitute adjustments to tax basis.
Under current tax rules, regulated investment companies can elect to treat certain late-year ordinary losses incurred and post-October capital losses (capital losses realized after October 31) as arising on the first day of the following taxable year. As of February 28, 2019, the Fund will elect to treat the following late-year ordinary losses and post-October capital losses as arising on March 1, 2019.
Late year
ordinary losses ($) | Post-October
capital losses ($) |
| 254,472 | 7,551,929 |
Management of the Fund has concluded that there are no significant uncertain tax positions in the Fund that would require recognition in the financial statements. However, management’s conclusion may be subject to review and adjustment at a later date based on factors including, but not limited to, new tax laws, regulations, and administrative interpretations (including relevant court decisions). Generally, the Fund’s federal tax returns for the prior three fiscal years remain subject to examination by the Internal Revenue Service.
Note 5. Portfolio information
The cost of purchases and proceeds from sales of securities, excluding short-term investments and derivatives, if any, aggregated to $367,195,162 and $653,766,392, respectively, for the year ended February 28, 2019. The amount of purchase and sale activity impacts the portfolio turnover rate reported in the Financial Highlights.
Note 6. Affiliated money market fund
The Fund invests in Columbia Short-Term Cash Fund, an affiliated money market fund established for the exclusive use by the Fund and other affiliated funds (the Affiliated MMF). The income earned by the Fund from such investments is included as Dividends - affiliated issuers in the Statement of Operations. As an investing fund, the Fund indirectly bears its proportionate share of the expenses of the Affiliated MMF. The Affiliated MMF prices its shares with a floating net asset value. In addition, the Board of Trustees of the Affiliated MMF may impose a fee on redemptions (sometimes referred to as a liquidity fee) or temporarily suspend redemptions (sometimes referred to as imposing a redemption gate) in the event its liquidity falls below regulatory limits.
Note 7. Interfund lending
Pursuant to an exemptive order granted by the Securities and Exchange Commission, the Fund participates in a program (the Interfund Program) allowing each participating Columbia Fund (each, a Participating Fund) to lend money directly to and, except for closed-end funds and money market funds, borrow money directly from other Participating Funds for temporary purposes. The amounts eligible for borrowing and lending under the Interfund Program are subject to certain restrictions.
| 26 | Columbia Large Cap Growth Fund III | Annual Report 2019 |
Notes to Financial Statements (continued)
February 28, 2019
Interfund loans are subject to the risk that the borrowing fund could be unable to repay the loan when due, and a delay in repayment to the lending fund could result in lost opportunities and/or additional lending costs. The exemptive order is subject to conditions intended to mitigate conflicts of interest arising from the Investment Manager’s relationship with each Participating Fund.
The Fund did not borrow or lend money under the Interfund Program during the year ended February 28, 2019.
Note 8. Line of credit
The Fund has access to a revolving credit facility with a syndicate of banks led by Citibank, N.A., HSBC Bank USA, N.A. and JPMorgan Chase Bank, N.A. whereby the Fund may borrow for the temporary funding of shareholder redemptions or for other temporary or emergency purposes. The credit facility, which is a collective agreement between the Fund and certain other funds managed by the Investment Manager or an affiliated investment manager, severally and not jointly, permits collective borrowings up to $1 billion. Interest is charged to each participating fund based on its borrowings at a rate equal to the higher of (i) the federal funds effective rate, (ii) the one-month LIBOR rate and (iii) the overnight bank funding rate, plus in each case, 1.00%. Each borrowing under the credit facility matures no later than 60 days after the date of borrowing. The Fund also pays a commitment fee equal to its pro rata share of the unused amount of the credit facility at a rate of 0.15% per annum. The commitment fee is included in other expenses in the Statement of Operations. This agreement expires annually in December unless extended or renewed.
The Fund had no borrowings during the year ended February 28, 2019.
Note 9. Significant risks
Shareholder concentration risk
At February 28, 2019, one unaffiliated shareholder of record owned 24.4% of the outstanding shares of the Fund in one or more accounts. The Fund has no knowledge about whether any portion of those shares was owned beneficially. Affiliated shareholders of record owned 10.2% of the outstanding shares of the Fund in one or more accounts. Subscription and redemption activity by concentrated accounts may have a significant effect on the operations of the Fund. In the case of a large redemption, the Fund may be forced to sell investments at inopportune times, including its liquid positions, which may result in Fund losses and the Fund holding a higher percentage of less liquid positions. Large redemptions could result in decreased economies of scale and increased operating expenses for non-redeeming Fund shareholders.
Technology and technology-related investment risk
The Fund may be more susceptible to the particular risks that may affect companies in the information technology sector, as well as other technology-related sectors (collectively, the technology sectors) than if it were invested in a wider variety of companies in unrelated sectors. Companies in the technology sectors are subject to certain risks, including the risk that new services, equipment or technologies will not be accepted by consumers and businesses or will become rapidly obsolete. Performance of such companies may be affected by factors including obtaining and protecting patents (or the failure to do so) and significant competitive pressures, including aggressive pricing of their products or services, new market entrants, competition for market share and short product cycles due to an accelerated rate of technological developments. Such competitive pressures may lead to limited earnings and/or falling profit margins. As a result, the value of their securities may fall or fail to rise. In addition, many technology sector companies have limited operating histories and prices of these companies’ securities historically have been more volatile than other securities, especially over the short term.
Note 10. Subsequent events
Management has evaluated the events and transactions that have occurred through the date the financial statements were issued and noted no items requiring adjustment of the financial statements or additional disclosure.
Columbia Large Cap Growth Fund III | Annual Report 2019
| 27 |
Notes to Financial Statements (continued)
February 28, 2019
Note 11. Information regarding pending and settled legal proceedings
Ameriprise Financial and certain of its affiliates have historically been involved in a number of legal, arbitration and regulatory proceedings, including routine litigation, class actions, and governmental actions, concerning matters arising in connection with the conduct of their business activities. Ameriprise Financial believes that the Fund is not currently the subject of, and that neither Ameriprise Financial nor any of its affiliates are the subject of, any pending legal, arbitration or regulatory proceedings that are likely to have a material adverse effect on the Fund or the ability of Ameriprise Financial or its affiliates to perform under their contracts with the Fund. Ameriprise Financial is required to make quarterly (10-Q), annual (10-K) and, as necessary, 8-K filings with the Securities and Exchange Commission (SEC) on legal and regulatory matters that relate to Ameriprise Financial and its affiliates. Copies of these filings may be obtained by accessing the SEC website at www.sec.gov.
There can be no assurance that these matters, or the adverse publicity associated with them, will not result in increased Fund redemptions, reduced sale of Fund shares or other adverse consequences to the Fund. Further, although we believe proceedings are not likely to have a material adverse effect on the Fund or the ability of Ameriprise Financial or its affiliates to perform under their contracts with the Fund, these proceedings are subject to uncertainties and, as such, we are unable to estimate the possible loss or range of loss that may result. An adverse outcome in one or more of these proceedings could result in adverse judgments, settlements, fines, penalties or other relief that could have a material adverse effect on the consolidated financial condition or results of operations of Ameriprise Financial.
| 28 | Columbia Large Cap Growth Fund III | Annual Report 2019 |
Report of Independent Registered Public Accounting Firm
To the Board of Trustees of Columbia Funds Series Trust and Shareholders of Columbia Large Cap Growth Fund III
Opinion on the Financial Statements
We have audited the accompanying statement of assets and liabilities, including the portfolio of investments, of Columbia Large Cap Growth Fund III (one of the funds constituting Columbia Funds Series Trust, referred to hereafter as the "Fund") as of February 28, 2019, the related statement of operations for the year ended February 28, 2019, the statement of changes in net assets for each of the two years in the period ended February 28, 2019, including the related notes, and the financial highlights for each of the periods indicated therein (collectively referred to as the “financial statements”). In our opinion, the financial statements present fairly, in all material respects, the financial position of the Fund as of February 28, 2019, the results of its operations for the year then ended, the changes in its net assets for each of the two years in the period ended February 28, 2019 and the financial highlights for each of the periods indicated therein in conformity with accounting principles generally accepted in the United States of America.
Basis for Opinion
TThese financial statements are the responsibility of the Fund’s management. Our responsibility is to express an opinion on the Fund’s financial statements based on our audits. We are a public accounting firm registered with the Public Company Accounting Oversight Board (United States) (PCAOB) and are required to be independent with respect to the Fund in accordance with the U.S. federal securities laws and the applicable rules and regulations of the Securities and Exchange Commission and the PCAOB.
We conducted our audits of these financial statements in accordance with the standards of the PCAOB. Those standards require that we plan and perform the audit to obtain reasonable assurance about whether the financial statements are free of material misstatement, whether due to error or fraud.
Our audits included performing procedures to assess the risks of material misstatement of the financial statements, whether due to error or fraud, and performing procedures that respond to those risks. Such procedures included examining, on a test basis, evidence regarding the amounts and disclosures in the financial statements. Our audits also included evaluating the accounting principles used and significant estimates made by management, as well as evaluating the overall presentation of the financial statements. Our procedures included confirmation of securities owned as of February 28, 2019 by correspondence with the custodian, transfer agent and brokers; when replies were not received from brokers, we performed other auditing procedures. We believe that our audits provide a reasonable basis for our opinion.
/s/PricewaterhouseCoopers LLP
Minneapolis, Minnesota
April 22, 2019
We have served as the auditor of one or more investment companies within the Columbia Funds Complex since 1977.
Columbia Large Cap Growth Fund III | Annual Report 2019
| 29 |
Federal Income Tax Information
(Unaudited)
The Fund hereby designates the following tax attributes for the fiscal year ended February 28, 2019. Shareholders will be notified in early 2020 of the amounts for use in preparing 2019 income tax returns.
Qualified
dividend
income | Dividends
received
deduction | Capital
gain
dividend |
| 100.00% | 100.00% | $135,292,440 |
Qualified dividend income. For taxable, non-corporate shareholders, the percentage of ordinary income distributed during the fiscal year that represents qualified dividend income subject to reduced tax rates.
Dividends received deduction. The percentage of ordinary income distributed during the fiscal year that qualifies for the corporate dividends received deduction.
Capital gain dividend. The Fund designates as a capital gain dividend the amount reflected above, or if subsequently determined to be different, the net capital gain of such fiscal period.
| 30 | Columbia Large Cap Growth Fund III | Annual Report 2019 |
Shareholders elect the Board that oversees the Fund’s operations. The Board appoints officers who are responsible for day-to-day business decisions based on policies set by the Board. The following table provides basic biographical information about the Fund’s Trustees as of the printing of this report, including their principal occupations during the past five years, although specific titles for individuals may have varied over the period. Under current Board policy, Trustees not affiliated with the Investment Manager generally may serve through the end of the calendar year in which they reach the mandatory retirement age established by the Board.
Independent trustees
Name,
address,
year of birth | Position held
with the Trust and
length of service | Principal occupation(s)
during past five years
and other relevant
professional experience | Number of
Funds in the
Columbia Funds
complex
overseen | Other directorships
held by Trustee
during the past
five years |
George S. Batejan
c/o Columbia Management
Investment Advisers, LLC
225 Franklin Street
Mail Drop BX32 05228
Boston, MA 02110
1953 | Trustee since 1/17 | Executive Vice President, Global Head of Technology and Operations, Janus Capital Group, Inc., 2010-2016 | 123 | Former Chairman of the Board, NICSA (National Investment Company Services Association) (Executive Committee, Nominating Committee and Governance Committee), 2014-2016; former Director, Intech Investment Management, 2011-2016; former Board Member, Metro Denver Chamber of Commerce, 2015-2016; former Advisory Board Member, University of Colorado Business School, 2015-2018 |
Kathleen Blatz
c/o Columbia Management
Investment Advisers, LLC
225 Franklin Street
Mail Drop BX32 05228
Boston, MA 02110
1954 | Trustee since 1/06 for RiverSource Funds and since 6/11 for Nations Funds | Attorney; specializing in arbitration and mediation; Chief Justice, Minnesota Supreme Court, 1998-2006; Associate Justice, Minnesota Supreme Court, 1996-1998; Fourth Judicial District Court Judge, Hennepin County, 1994-1996; Attorney in private practice and public service, 1984-1993; State Representative, Minnesota House of Representatives, 1979-1993, which included service on the Tax and Financial Institutions and Insurance Committees; Member and Interim Chair, Minnesota Sports Facilities Authority, January 2017-July 2017; Interim President and Chief Executive Officer, Blue Cross and Blue Shield of Minnesota (health care insurance), February-July 2018 | 123 | Trustee, BlueCross BlueShield of Minnesota since 2009 (Chair of the Business Development Committee, 2014-2017; Chair of the Governance Committee since 2017); Chair of the Robina Foundation since August 2013; former Member and Chair of the Board, Minnesota Sports Facilities Authority, January 2017-July 2017 |
Edward J. Boudreau, Jr.
c/o Columbia Management
Investment Advisers, LLC
225 Franklin Street
Mail Drop BX32 05228
Boston, MA 02110
1944 | Chair of the Board since 1/18; Trustee since 6/11 for RiverSource Funds and since 1/05 for Nations Funds | Managing Director, E.J. Boudreau & Associates (consulting) since 2000; FINRA Industry Arbitrator, 2002-present; Chairman and Chief Executive Officer, John Hancock Investments (asset management), Chairman and Interested Trustee for open-end and closed-end funds offered by John Hancock, 1989-2000; John Hancock Mutual Life Insurance Company, including Senior Vice President and Treasurer and Senior Vice President Information Technology, 1968-1988 | 123 | Former Trustee, Boston Museum of Science (Chair of Finance Committee) 1985-2013; former Trustee, BofA Funds Series Trust (11 funds), 2005-2011 |
Columbia Large Cap Growth Fund III | Annual Report 2019
| 31 |
TRUSTEES AND OFFICERS (continued)
Independent trustees (continued)
Name,
address,
year of birth | Position held
with the Trust and
length of service | Principal occupation(s)
during past five years
and other relevant
professional experience | Number of
Funds in the
Columbia Funds
complex
overseen | Other directorships
held by Trustee
during the past
five years |
Pamela G. Carlton
c/o Columbia Management
Investment Advisers, LLC
225 Franklin Street
Mail Drop BX32 05228
Boston, MA 02110
1954 | Trustee since 7/07 for RiverSource Funds and since 6/11 for Nations Funds | President, Springboard — Partners in Cross Cultural Leadership (consulting company) since 2003; Managing Director of US Equity Research, JP Morgan Chase, 1999-2003; Director of US Equity Research, Chase Asset Management, 1996-1999; Co-Director Latin America Research, 1993-1996, COO Global Research, 1992-1996, Co-Director of US Research, 1991-1992, Investment Banker, Morgan Stanley, 1982-1991 | 123 | Trustee, New York Presbyterian Hospital Board (Executive Committee and Chair of Human Resources Committee) since 1996; Director, Laurel Road Bank (Audit Committee) since 2017 |
Patricia M. Flynn
c/o Columbia Management
Investment Advisers, LLC
225 Franklin Street
Mail Drop BX32 05228
Boston, MA 02110
1950 | Trustee since 11/04 for RiverSource Funds and since 6/11 for Nations Funds | Trustee Professor of Economics and Management, Bentley University since 1976 (also teaches and conducts research on corporate governance); Dean, McCallum Graduate School of Business, Bentley University, 1992-2002 | 123 | Trustee, MA Taxpayers Foundation since 1997; Board of Directors, The MA Business Roundtable since 2003; Board of Governors, Innovation Institute, MA Technology Collaborative since 2010 |
Brian J. Gallagher
c/o Columbia Management
Investment Advisers, LLC
225 Franklin Street
Mail Drop BX32 05228
Boston, MA 02110
1954 | Trustee since 12/17 | Retired; Partner with Deloitte & Touche LLP and its predecessors, 1977-2016 | 121 | Trustee, Catholic Schools Foundation since 2004 |
Catherine James Paglia
c/o Columbia Management
Investment Advisers, LLC
225 Franklin Street
Mail Drop BX32 05228
Boston, MA 02110
1952 | Trustee since 11/04 for RiverSource Funds and since 6/11 for Nations Funds | Director, Enterprise Asset Management, Inc. (private real estate and asset management company) since September 1998; Managing Director and Partner, Interlaken Capital, Inc., 1989-1997; Managing Director, Morgan Stanley, 1982-1989; Vice President, Investment Banking, 1980-1982, Associate, Investment Banking, 1976-1980, Dean Witter Reynolds, Inc. | 123 | Director, Valmont Industries, Inc. (irrigation systems manufacturer) since 2012; Trustee, Carleton College (on the Investment Committee); Trustee, Carnegie Endowment for International Peace (on the Investment Committee) |
Anthony M. Santomero
c/o Columbia Management
Investment Advisers, LLC
225 Franklin Street
Mail Drop BX32 05228
Boston, MA 02110
1946 | Trustee since 6/11 for RiverSource Funds and since 1/08 for Nations Funds | Richard K. Mellon Professor Emeritus of Finance, The Wharton School, University of Pennsylvania, since 2002; Senior Advisor, McKinsey & Company (consulting), 2006-2008; President, Federal Reserve Bank of Philadelphia, 2000- 2006; Professor of Finance, The Wharton School, University of Pennsylvania, 1972-2002 | 123 | Trustee, Penn Mutual Life Insurance Company since March 2008; Director, Renaissance Reinsurance Ltd. since May 2008; former Trustee, BofA Funds Series Trust (11 funds), 2008-2011; former Director, Citigroup Inc. and Citibank, N.A., 2009-2019 |
| 32 | Columbia Large Cap Growth Fund III | Annual Report 2019 |
TRUSTEES AND OFFICERS (continued)
Independent trustees (continued)
Name,
address,
year of birth | Position held
with the Trust and
length of service | Principal occupation(s)
during past five years
and other relevant
professional experience | Number of
Funds in the
Columbia Funds
complex
overseen | Other directorships
held by Trustee
during the past
five years |
Minor M. Shaw
c/o Columbia Management
Investment Advisers, LLC
225 Franklin Street
Mail Drop BX32 05228
Boston, MA 02110
1947 | Trustee since 6/11 for RiverSource Funds and since 2003 for Nations Funds | President, Micco LLC (private investments) since 2011; President, Micco Corp. (family investment business), 1998-2011 | 123 | Director, BlueCross BlueShield of South Carolina since April 2008; Board Chair, Hollingsworth Funds since 2016; Advisory Board member, Duke Energy Corp. since October 2016; Chair of the Duke Endowment; Chair of Greenville – Spartanburg Airport Commission; former Trustee, BofA Funds Series Trust (11 funds), 2003-2011; former Director, Piedmont Natural Gas, 2004-2016; former Director, National Association of Corporate Directors, Carolinas Chapter, 2013-2018 |
Sandra Yeager
c/o Columbia Management
Investment Advisers, LLC
225 Franklin Street
Mail Drop BX32 05228
Boston, MA 02110
1964 | Trustee since 12/17 | Retired; President and founder, Hanoverian Capital, LLC (SEC registered investment advisor firm), 2008-2016; Managing Director, DuPont Capital, 2006-2008; Managing Director, Morgan Stanley Investment Management, 2004-2006; Senior Vice President, Alliance Bernstein, 1990-2004 | 121 | Director, NAPE Education Foundation since October 2016 |
Interested trustee affiliated with Investment Manager*
Name,
address,
year of birth | Position held with the Trust and length of service | Principal occupation(s) during the
past five years and other relevant
professional experience | Number of
Funds in the
Columbia Funds
complex overseen | Other directorships
held by Trustee
during the past
five years |
William F. Truscott
c/o Columbia Management
Investment Advisers, LLC
225 Franklin St.
Boston, MA 02110
1960 | Trustee since 11/01 for RiverSource Funds and since 6/11 for Nations Funds; Senior Vice President since 2002 for RiverSource Funds and since 5/10 for Nations Funds | Chairman of the Board and President, Columbia Management Investment Advisers, LLC since May 2010 and February 2012, respectively; Chief Executive Officer, Global Asset Management, Ameriprise Financial, Inc. since September 2012 (previously Chief Executive Officer, U.S. Asset Management & President, Annuities, May 2010 - September 2012); Director and Chief Executive Officer, Columbia Management Investment Distributors, Inc. since May 2010 and February 2012, respectively; Chairman of the Board and Chief Executive Officer, RiverSource Distributors, Inc. since 2006; Director, Threadneedle Asset Management Holdings, SARL since 2014; President and Chief Executive Officer, Ameriprise Certificate Company, 2006 - August 2012. | 192 | Chairman of the Board, Columbia Management Investment Advisers, LLC since May 2010; Director, Columbia Management Investment Distributors, Inc. since May 2010; former Director, Ameriprise Certificate Company, 2006-January 2013 |
| * | Interested person (as defined under the 1940 Act) by reason of being an officer, director, security holder and/or employee of the Investment Manager or Ameriprise Financial. |
Columbia Large Cap Growth Fund III | Annual Report 2019
| 33 |
TRUSTEES AND OFFICERS (continued)
Nations Funds refer to the Funds within the Columbia Funds Complex that historically bore the Nations brand and includes series of Columbia Funds Series Trust. RiverSource Funds refer to the Funds within the Columbia Funds Complex that historically bore the RiverSource brand and includes series of Columbia Funds Series Trust II.
The Statement of Additional Information has additional information about the Fund’s Board members and is available, without charge, upon request by calling 800.345.6611, visiting columbiathreadneedleus.com/investor/ or contacting your financial intermediary.
| 34 | Columbia Large Cap Growth Fund III | Annual Report 2019 |
TRUSTEES AND OFFICERS (continued)
The Board has appointed officers who are responsible for day-to-day business decisions based on policies it has established. The officers serve at the pleasure of the Board. The following table provides basic information about the Officers of the Fund as of the printing of this report, including principal occupations during the past five years, although their specific titles may have varied over the period. In addition to Mr. Truscott, who is Senior Vice President, the Fund’s other officers are:
Fund officers
Name,
address and
year of birth | Position and year
first appointed to
position for any Fund
in the Columbia
Funds complex or a
predecessor thereof | Principal occupation(s) during past five years |
Christopher O. Petersen
5228 Ameriprise
Financial Center
Minneapolis, MN 55474
Born 1970 | President and Principal Executive Officer (2015) | Vice President and Lead Chief Counsel, Ameriprise Financial, Inc. since January 2015 (previously, Vice President and Chief Counsel, January 2010 - December 2014; officer of Columbia Funds and affiliated funds since 2007. |
Michael G. Clarke
225 Franklin Street
Boston, MA 02110
Born 1969 | Chief Financial Officer (Principal Financial Officer) (2009) and Senior Vice President (2019) | Vice President — Accounting and Tax, Columbia Management Investment Advisers, LLC, since May 2010; senior officer of Columbia Funds and affiliated funds since 2002 (previously, Treasurer and Chief Accounting Officer, January 2009-January 2019 and December 2015-January 2019, respectively). |
Joseph Beranek
5890 Ameriprise
Financial Center
Minneapolis, MN 55474
Born 1965 | Treasurer and Chief Accounting Officer (Principal Accounting Officer) (2019) | Vice President — Mutual Fund Accounting and Financial Reporting, Columbia Management Investment Advisers, LLC, since December 2018 and March 2017, respectively (previously, Vice President — Pricing and Corporate Actions, May 2010-March 2017). |
Paul B. Goucher
485 Lexington Avenue
New York, NY 10017
Born 1968 | Senior Vice President (2011) and Assistant Secretary (2008) | Senior Vice President and Assistant General Counsel, Ameriprise Financial, Inc. since January 2017 (previously, Vice President and Lead Chief Counsel, November 2008 - January 2017 and January 2013 - January 2017, respectively); Vice President, Chief Legal Officer and Assistant Secretary, Columbia Management Investment Advisers, LLC since March 2015 (previously Vice President and Assistant Secretary, May 2010 – March 2015). |
Thomas P. McGuire
225 Franklin Street
Boston, MA 02110
Born 1972 | Senior Vice President and Chief Compliance Officer (2012) | Vice President — Asset Management Compliance, Ameriprise Financial, Inc., since May 2010; Chief Compliance Officer, Ameriprise Certificate Company since September 2010. |
Colin Moore
225 Franklin Street
Boston, MA 02110
Born 1958 | Senior Vice President (2010) | Executive Vice President and Global Chief Investment Officer, Ameriprise Financial, Inc., since July 2013; Executive Vice President and Global Chief Investment Officer, Columbia Management Investment Advisers, LLC since July 2013. |
Ryan C. Larrenaga
225 Franklin Street
Boston, MA 02110
Born 1970 | Senior Vice President (2017), Chief Legal Officer (2017), and Secretary (2015) | Vice President and Chief Counsel, Ameriprise Financial, Inc. since August 2018 (previously, Vice President and Group Counsel, August 2011 - August 2018); officer of Columbia Funds and affiliated funds since 2005. |
Michael E. DeFao
225 Franklin Street
Boston, MA 02110
Born 1968 | Vice President (2011) and Assistant Secretary (2010) | Vice President and Chief Counsel, Ameriprise Financial, Inc. since May 2010. |
Amy Johnson
5228 Ameriprise
Financial Center
Minneapolis, MN 55474
Born 1965 | Vice President (2006) | Managing Director and Global Head of Operations, Columbia Management Investment Advisers, LLC since April 2016 (previously Managing Director and Chief Operating Officer, 2010 - 2016). |
Columbia Large Cap Growth Fund III | Annual Report 2019
| 35 |
TRUSTEES AND OFFICERS (continued)
Fund officers (continued)
Name,
address and
year of birth | Position and year
first appointed to
position for any Fund
in the Columbia
Funds complex or a
predecessor thereof | Principal occupation(s) during past five years |
Lyn Kephart-Strong
5228 Ameriprise
Financial Center
Minneapolis, MN 55474
Born 1960 | Vice President (2015) | President, Columbia Management Investment Services Corp. since October 2014; Vice President & Resolution Officer, Ameriprise Trust Company since August 2009. |
| 36 | Columbia Large Cap Growth Fund III | Annual Report 2019 |
The Fund mails one shareholder report to each shareholder address, unless such shareholder elected to receive shareholder reports from the Fund electronically. If you would like more than one report, please call shareholder services at 800.345.6611 and additional reports will be sent to you.
Proxy voting policies and procedures
The policy of the Board of Trustees is to vote the proxies of the companies in which the Fund holds investments consistent with the procedures as stated in the Statement of Additional Information (SAI). You may obtain a copy of the SAI without charge by calling 800.345.6611; contacting your financial intermediary; visiting columbiathreadneedleus.com/investor/; or searching the website of the Securities and Exchange Commission (SEC) at sec.gov. Information regarding how the Fund voted proxies relating to portfolio securities is filed with the SEC by August 31st for the most recent 12-month period ending June 30th of that year, and is available without charge by visiting columbiathreadneedleus.com/investor/, or searching the website of the SEC at sec.gov.
Quarterly schedule of investments
The Fund files a complete schedule of portfolio holdings with the SEC for the first and third quarters of each fiscal year on Form N-Q or Form N-PORT (available for filings after March 31, 2019). The Fund’s Form N-Q or Form N-PORT is available on the SEC’s website at sec.gov. The Fund’s complete schedule of portfolio holdings, as filed on Form N-Q or Form N-PORT, can also be obtained without charge, upon request, by calling 800.345.6611.
Additional Fund information
For more information about the Fund, please visit columbiathreadneedleus.com/investor/ or call 800.345.6611. Customer Service Representatives are available to answer your questions Monday through Friday from 8 a.m. to 7 p.m. Eastern time.
Fund investment manager
Columbia Management Investment Advisers, LLC
225 Franklin Street
Boston, MA 02110
Fund distributor
Columbia Management Investment Distributors, Inc.
225 Franklin Street
Boston, MA 02110
Fund transfer agent
Columbia Management Investment Services Corp.
P.O. Box 219104
Kansas City, MO 64121-9104
Columbia Large Cap Growth Fund III | Annual Report 2019
| 37 |
Columbia Large Cap Growth Fund III
P.O. Box 219104
Kansas City, MO 64121-9104
Please read and consider the investment objectives, risks, charges and expenses for any fund carefully before investing. For a prospectus and summary prospectus, which contains this and other important information about the Fund, go to
columbiathreadneedleus.com/investor/. The Fund is distributed by Columbia Management Investment Distributors, Inc., member FINRA, and managed by Columbia Management Investment Advisers, LLC.
Columbia Threadneedle Investments (Columbia Threadneedle) is the global brand name of the Columbia and Threadneedle group of companies. All rights reserved.
© 2019 Columbia Management Investment Advisers, LLC.
columbiathreadneedleus.com/investor/

Annual Report
February 28, 2019
Columbia Mid Cap Index Fund
Beginning on January 1, 2021, as permitted by regulations adopted by the Securities and Exchange Commission, paper copies of the Fund’s annual and semiannual shareholder reports like this one will no longer be sent by mail, unless you specifically request paper copies of the reports. Instead, the reports will be made available on the Fund’s website (columbiathreadneedleus.com/investor/), and each time a report is posted you will be notified by mail and provided with a website address to access the report.
If you have already elected to receive shareholder reports electronically, you will not be affected by this change and you need not take any action. You may elect to receive shareholder reports and other communications from the Fund electronically at any time by contacting your financial intermediary (such as a broker-dealer or bank) or, for Fund shares held directly with the Fund, by calling 800.345.6611 or by enrolling in “eDelivery” by logging into your account at columbiathreadneedleus.com/investor/.
You may elect to receive all future reports in paper free of charge. If you invest through a financial intermediary, you can contact your financial intermediary to request that you continue receiving paper copies of your shareholder reports. If you invest directly with the Fund, you can call 800.345.6611 to let the Fund know you wish to continue receiving paper copies of your shareholder reports. Your election to receive paper reports will apply to all Columbia Funds held in your account if you invest through a financial intermediary or all Columbia Funds held with the fund complex if you invest directly with the Fund.
Not FDIC Insured • No bank guarantee • May lose value
Dear Shareholders,
Volatility exists in financial markets and this is not a comfortable fact of life. How investors deal with this reality, including how they react to short term spikes in volatility as well as to longer periods of increased or decreased volatility, may have a significant impact on their overall investing success.
Too often, investors change their investment strategy based on something that’s happening at a moment in time rather than thinking about how that change in strategy might affect their ability to achieve their longer term financial goals. Emotion replaces logic and reasoning. Investors may sell in reaction to a market drop (fear or panic), locking in low returns which means they won’t be invested when the market returns, or they invest more at a market peak (greed or conviction), essentially when it is expensive to do so. In both cases, selling and buying at the exact wrong time.
We believe the best outcomes come from a consistent approach to investing. Here are five areas where advisors can help us overcome the tendency to react emotionally as we struggle to make the right choices with our investments:
Long-term focus
The further away long-term goals, aspirations and objectives are, the easier it is to stray away from the goals and priorities that we set out. Advisors help us stay focused on what we want to accomplish.
Discipline through up-and-down markets
Advisors help set rules to prevent us from making rash decisions that we may regret later. Knowing ahead of time what you should do in case of certain situations will help you get through volatile markets and not make emotional decisions.
Tax-awareness
Taxes are one of the biggest drags on investment returns and are critical attributes of investing. Yet few of us take the necessary steps to ease the corrosive effect of taxes. Advisors have tools and knowledge that may help us to manage portfolios more tax-efficiently and keep more of what we earn.
Emotional objectivity
Our emotions are very hard to manage and making investment decisions in an emotional state can lead to exceedingly bad outcomes. An objective advisor can help prevent some of the reactionary mistakes emotions often lead us to.
Education and guidance
The role of the advisor is to teach and guide us toward achieving our financial goals. In terms of working through emotions, guidance is by far the most important component.
By understanding our own behaviors and biases, we can prepare for future challenges. Your success is our priority. Talk to your advisor about how working with Columbia Threadneedle Investments may help you stay the course and position your portfolio for consistent, sustainable outcomes, regardless of market conditions.
Sincerely,
Christopher O. Petersen
President, Columbia Funds
Columbia Funds are distributed by Columbia Management Investment Distributors, Inc., member FINRA, and managed by Columbia Management Investment Advisers, LLC.
© 2019 Columbia Management Investment Advisers, LLC. All rights reserved.
Columbia Mid Cap Index Fund | Annual Report 2019
Columbia Mid Cap Index Fund | Annual Report 2019
Investment objective
Columbia Mid Cap Index Fund (the Fund) seeks total return before fees and expenses that corresponds to the total return of the Standard & Poor’s (S&P) MidCap 400 Index.
Portfolio management
Christopher Lo, CFA
Lead Portfolio Manager
Managed Fund since 2014
Vadim Shteyn
Portfolio Manager
Managed Fund since 2011
Morningstar style boxTM
The Morningstar Style Box is based on a fund’s portfolio holdings. For equity funds, the vertical axis shows the market capitalization of the stocks owned, and the horizontal axis shows investment style (value, blend, or growth). Information shown is based on the most recent data provided by Morningstar.
© 2019 Morningstar, Inc. All rights reserved. The Morningstar information contained herein: (1) is proprietary to Morningstar and/or its content providers; (2) may not be copied or distributed; and (3) is not warranted to be accurate, complete or timely. Neither Morningstar nor its content providers are responsible for any damages or losses arising from any use of this information.
| Average annual total returns (%) (for the period ended February 28, 2019) |
| | | Inception | 1 Year | 5 Years | 10 Years |
| Class A | 05/31/00 | 3.66 | 7.98 | 16.83 |
| Institutional Class | 03/31/00 | 3.89 | 8.25 | 17.11 |
| Institutional 2 Class* | 11/08/12 | 3.94 | 8.25 | 17.13 |
| Institutional 3 Class* | 03/01/17 | 3.89 | 8.25 | 17.11 |
| S&P MidCap 400 Index | | 4.14 | 8.49 | 17.36 |
All results shown assume reinvestment of distributions during the period. Returns do not reflect the deduction of taxes that a shareholder may pay on Fund distributions or on the redemption of Fund shares. Performance results reflect the effect of any fee waivers or reimbursements of Fund expenses by Columbia Management Investment Advisers, LLC and/or any of its affiliates. Absent these fee waivers or expense reimbursement arrangements, performance results would have been lower.
The performance information shown represents past performance and is not a guarantee of future results. The investment return and principal value of your investment will fluctuate so that your shares, when redeemed, may be worth more or less than their original cost. Current performance may be lower or higher than the performance information shown. You may obtain performance information current to the most recent month-end by contacting your financial intermediary, visiting columbiathreadneedleus.com/investor/ or calling 800.345.6611.
| * | The returns shown for periods prior to the share class inception date (including returns for the Life of the Fund, if shown, which are since Fund inception) include the returns of the Fund’s oldest share class. These returns are adjusted to reflect any higher class-related operating expenses of the newer share classes, as applicable. Please visit columbiathreadneedleus.com/investor/investment-products/mutual-funds/appended-performance for more information. |
The S&P MidCap 400 Index is a market-value weighted index that tracks the performance of 400 mid-cap U.S. companies.
Indices are not available for investment, are not professionally managed and do not reflect sales charges, fees, brokerage commissions, taxes or other expenses of investing. Securities in the Fund may not match those in an index.
| 2 | Columbia Mid Cap Index Fund | Annual Report 2019 |
Fund at a Glance (continued)
Performance of a hypothetical $10,000 investment (February 28, 2009 — February 28, 2019)
The chart above shows the change in value of a hypothetical $10,000 investment in Class A shares of Columbia Mid Cap Index Fund during the stated time period, and does not reflect the deduction of taxes that a shareholder may pay on Fund distributions or on the redemption of Fund shares.
| Top 10 holdings (%) (at February 28, 2019) |
| IDEX Corp. | 0.7 |
| Zebra Technologies Corp., Class A | 0.6 |
| Domino’s Pizza, Inc. | 0.6 |
| Ultimate Software Group, Inc. (The) | 0.6 |
| STERIS PLC | 0.6 |
| Trimble Navigation Ltd. | 0.6 |
| PTC, Inc. | 0.6 |
| Old Dominion Freight Line, Inc. | 0.6 |
| Leidos Holdings, Inc. | 0.6 |
| UGI Corp. | 0.6 |
Percentages indicated are based upon total investments excluding Money Market Funds and investments in derivatives, if any.
For further detail about these holdings, please refer to the section entitled “Portfolio of Investments.”
Fund holdings are as of the date given, are subject to change at any time, and are not recommendations to buy or sell any security.
| Portfolio breakdown (%) (at February 28, 2019) |
| Common Stocks | 98.7 |
| Money Market Funds | 1.3 |
| Total | 100.0 |
Percentages indicated are based upon total investments excluding investments in derivatives, if any. The Fund’s portfolio composition is subject to change.
| Equity sector breakdown (%) (at February 28, 2019) |
| Communication Services | 2.5 |
| Consumer Discretionary | 12.2 |
| Consumer Staples | 2.8 |
| Energy | 3.7 |
| Financials | 16.9 |
| Health Care | 9.4 |
| Industrials | 15.0 |
| Information Technology | 16.5 |
| Materials | 6.7 |
| Real Estate | 9.8 |
| Utilities | 4.5 |
| Total | 100.0 |
Percentages indicated are based upon total equity investments. The Fund’s portfolio composition is subject to change.
Columbia Mid Cap Index Fund | Annual Report 2019
| 3 |
Manager Discussion of Fund Performance
For the 12-month period that ended February 28, 2019, the Fund’s Class A shares returned 3.66%. The Fund closely tracked its benchmark, the unmanaged S&P MidCap 400 Index, which returned 4.14% for the same period. Mutual funds, unlike unmanaged indices, incur operating expenses.
U.S. equity markets posted gains despite tumult, tariffs and trade wars
The 12 months ended February 28, 2019 proved to be tumultuous. Stock markets got off to a mixed start at the beginning of the period, as fears of a global trade war sparked by tariffs the U.S. Administration levied on steel, aluminum and other goods weighed on returns. Worries about retaliation, primarily from China, added to anxiety over the possibility of interest rates and inflation rising faster than most expected. Small cap stocks fared better than large cap stocks during this time, as domestically-oriented small cap stocks were more insulated from global news headlines and geopolitical events. Despite these persistent headwinds, strong U.S. economic data and healthy corporate earnings growth drove stocks higher during the second and third quarters of 2018, with several major U.S. equity indices reaching record highs in the third quarter.
This course reversed sharply in the fourth quarter of 2018 when equity markets began selling off in earnest in October. The sell-off was attributed to worries surrounding the pace of interest rate hikes, exacerbated by the U.S. President’s criticisms of the Federal Reserve’s (the Fed) plan, fears of slowing U.S. economic growth, persistent concerns about U.S.-China trade relations and Washington, D.C.-centric political squabbles. Against this backdrop, U.S. equity markets logged their worst December since the Great Depression, with small cap equities in particular being hit hard amid investors’ flight to relative safety.
The period ended on a positive note, as U.S. equity markets rebounded strongly in the first two months of 2019. Though many issues continued without resolution, investors shrugged off worries about the global economic slowdown and trade conflict. Consensus expectations for a U.S.-China trade deal and a seemingly market-friendlier Fed also helped drive returns. Corporate earnings reports fueled positive investor sentiment, too, as did speculation that equity prices may have already reflected much, if not most, of the bad news. With the rally at the start of 2019, the S&P 500 Index ended the period up 4.68%. Small cap stocks outperformed large cap stocks, as the S& P Small Cap 600 Index climbed 7.20% for the same period.
S&P MidCap 400 Index saw greatest gains in traditionally defensive sectors
Seven of the eleven sectors of the S&P MidCap 400 Index posted a positive return during the 12 months ended February 28, 2019. In terms of total return, utilities, real estate and health care, each traditionally considered a defensive sector, were the best relative performers. On the basis of impact, which takes weighting and total returns into account, information technology, real estate and health care were the best relative performers. The top performing industries for the period on the basis of total return were beverages; electric utilities; gas utilities; multi-utilities; and life science tools and services.
Conversely, energy, materials and consumer discretionary, each considered a more economically-sensitive cyclical sector, were weakest from both a total return perspective and on the basis of impact. The worst performing industries for the annual period on the basis of total return were automobiles; auto components; construction materials; energy equipment and services; and airlines.
Top individual contributors within the S&P MidCap 400 Index during the period included petroleum products refiner HollyFrontier, cardiovascular product manufacturer ABIOMED, government-sponsored managed care services provider WellCare Health Plans, technology network security solutions provider Fortinet and frozen potato products producer Lamb Weston Holdings. Top detractors were integrated steel producer United States Steel, recreational vehicles producer Thor Industries, financial services provider SEI Investments, corn refiner and sweeteners and starches producer Ingredion and diversified carbon-steel producer and metals recycler Steel Dynamics.
Financials took over from information technology as the largest sector by weighting in the S&P MidCap 400 Index, with a weighting of 16.88% as of February 28, 2019. As always, each sector and stock in the S&P MidCap 400 Index was represented in the Fund with approximately the same weighting as in the Index and therefore had a similar effect.
| 4 | Columbia Mid Cap Index Fund | Annual Report 2019 |
Manager Discussion of Fund Performance (continued)
Index additions and deletions drove Fund portfolio changes
During the period, there were 64 additions and 64 deletions to the Index and the Fund’s portfolio. Among those stocks added to the Index and Fund were LendingTree, Chesapeake Energy, ICU Medical, Evercore, Five Below, Wyndham Destinations, Navient, Acuity Brands, WWE, Marriott Vacations Worldwide, HealthEquity, Penn National Gaming, Ligand Pharmaceuticals, MasTec, Yelp, Brixmor Property Group, Amedisys and Goodyear Tire & Rubber. Deletions included IPG Photonics, Avon Products, Dean Foods, Take-Two Interactive Software, MSCI, Diebold Nixdorf, ABIOMED, GameStop, Office Depot, HollyFrontier, WellCare Health Plans, Rollins, Lamb Weston Holdings, Nabors Industries, Dun & Bradstreet, Dril-Quip, Teleflex and Wabtec.
We do not anticipate any changes in the portfolio beyond the customary quarterly rebalancings and stock substitutions we make to align the Fund with the S&P MidCap 400 Index.
Market risk may affect a single issuer, sector of the economy, industry or the market as a whole. Investments inmid-cap companies involve risks and volatility greater than investments in larger, more established companies. The Fund’s net value will generally decline when the performance of its targetedindex declines. Investing inderivatives is a specialized activity that involves special risks, which may result in significant losses. See the Fund’s prospectus for more information on these and other risks.
The views expressed in this report reflect the current views of the respective parties. These views are not guarantees of future performance and involve certain risks, uncertainties and assumptions that are difficult to predict, so actual outcomes and results may differ significantly from the views expressed. These views are subject to change at any time based upon economic, market or other conditions and the respective parties disclaim any responsibility to update such views. These views may not be relied on as investment advice and, because investment decisions for a Columbia fund are based on numerous factors, may not be relied on as an indication of trading intent on behalf of any particular Columbia fund. References to specific securities should not be construed as a recommendation or investment advice.
Columbia Mid Cap Index Fund | Annual Report 2019
| 5 |
Understanding Your Fund’s Expenses
(Unaudited)
As an investor, you incur two types of costs. There are shareholder transaction costs, which may include redemption fees. There are also ongoing fund costs, which generally include management fees, distribution and/or service fees, and other fund expenses. The following information is intended to help you understand your ongoing costs (in dollars) of investing in the Fund and to help you compare these costs with the ongoing costs of investing in other mutual funds.
Analyzing your Fund’s expenses
To illustrate these ongoing costs, we have provided examples and calculated the expenses paid by investors in each share class of the Fund during the period. The actual and hypothetical information in the table is based on an initial investment of $1,000 at the beginning of the period indicated and held for the entire period. Expense information is calculated two ways and each method provides you with different information. The amount listed in the “Actual” column is calculated using the Fund’s actual operating expenses and total return for the period. You may use the Actual information, together with the amount invested, to estimate the expenses that you paid over the period. Simply divide your account value by $1,000 (for example, an $8,600 account value divided by $1,000 = 8.6), then multiply the results by the expenses paid during the period under the “Actual” column. The amount listed in the “Hypothetical” column assumes a 5% annual rate of return before expenses (which is not the Fund’s actual return) and then applies the Fund’s actual expense ratio for the period to the hypothetical return. You should not use the hypothetical account values and expenses to estimate either your actual account balance at the end of the period or the expenses you paid during the period. See “Compare with other funds” below for details on how to use the hypothetical data.
Compare with other funds
Since all mutual funds are required to include the same hypothetical calculations about expenses in shareholder reports, you can use this information to compare the ongoing cost of investing in the Fund with other funds. To do so, compare the hypothetical example with the 5% hypothetical examples that appear in the shareholder reports of other funds. As you compare hypothetical examples of other funds, it is important to note that hypothetical examples are meant to highlight the ongoing costs of investing in a fund only and do not reflect any transaction costs, such as redemption or exchange fees. Therefore, the hypothetical calculations are useful in comparing ongoing costs only, and will not help you determine the relative total costs of owning different funds. If transaction costs were included in these calculations, your costs would be higher.
| September 1, 2018 — February 28, 2019 |
| | Account value at the
beginning of the
period ($) | Account value at the
end of the
period ($) | Expenses paid during
the period ($) | Fund’s annualized
expense ratio (%) |
| | Actual | Hypothetical | Actual | Hypothetical | Actual | Hypothetical | Actual |
| Class A | 1,000.00 | 1,000.00 | 939.60 | 1,022.56 | 2.16 | 2.26 | 0.45 |
| Institutional Class | 1,000.00 | 1,000.00 | 941.00 | 1,023.80 | 0.96 | 1.00 | 0.20 |
| Institutional 2 Class | 1,000.00 | 1,000.00 | 941.10 | 1,023.80 | 0.96 | 1.00 | 0.20 |
| Institutional 3 Class | 1,000.00 | 1,000.00 | 941.10 | 1,023.80 | 0.96 | 1.00 | 0.20 |
Expenses paid during the period are equal to the annualized expense ratio for each class as indicated above, multiplied by the average account value over the period and then multiplied by the number of days in the Fund’s most recent fiscal half year and divided by 365.
Expenses do not include fees and expenses incurred indirectly by the Fund from its investment in underlying funds, including affiliated and non-affiliated pooled investment vehicles, such as mutual funds and exchange-traded funds.
Had Columbia Management Investment Advisers, LLC and/or certain of its affiliates not waived/reimbursed certain fees and expenses, account value at the end of the period would have been reduced.
| 6 | Columbia Mid Cap Index Fund | Annual Report 2019 |
Portfolio of Investments
February 28, 2019
(Percentages represent value of investments compared to net assets)
Investments in securities
| Common Stocks 98.6% |
| Issuer | Shares | Value ($) |
| Communication Services 2.5% |
| Entertainment 0.9% |
| Cinemark Holdings, Inc. | 258,133 | 9,713,545 |
| Live Nation Entertainment, Inc.(a) | 335,810 | 18,993,413 |
| World Wrestling Entertainment, Inc., Class A | 105,420 | 8,823,654 |
| Total | | 37,530,612 |
| Interactive Media & Services 0.2% |
| Cars.com Inc(a) | 153,170 | 3,605,622 |
| Yelp, Inc.(a) | 185,600 | 6,915,456 |
| Total | | 10,521,078 |
| Media 1.2% |
| AMC Networks, Inc., Class A(a) | 109,374 | 7,186,966 |
| Cable One, Inc. | 12,054 | 11,439,125 |
| John Wiley & Sons, Inc., Class A | 109,834 | 5,699,286 |
| Meredith Corp. | 96,828 | 5,545,340 |
| New York Times Co. (The), Class A | 342,769 | 11,259,962 |
| TEGNA, Inc. | 522,790 | 6,885,144 |
| Total | | 48,015,823 |
| Wireless Telecommunication Services 0.2% |
| Telephone & Data Systems, Inc. | 225,715 | 7,234,166 |
| Total Communication Services | 103,301,679 |
| Consumer Discretionary 12.0% |
| Auto Components 1.1% |
| Adient PLC | 210,900 | 4,099,896 |
| Dana, Inc. | 351,260 | 6,937,385 |
| Delphi Technologies PLC | 214,870 | 4,686,315 |
| Gentex Corp. | 636,456 | 12,945,515 |
| Goodyear Tire & Rubber Co. (The) | 566,340 | 11,202,205 |
| Visteon Corp.(a) | 70,200 | 6,013,332 |
| Total | | 45,884,648 |
| Automobiles 0.2% |
| Thor Industries, Inc. | 121,814 | 7,865,530 |
| Distributors 0.4% |
| Pool Corp. | 97,760 | 15,596,630 |
| Common Stocks (continued) |
| Issuer | Shares | Value ($) |
| Diversified Consumer Services 0.9% |
| Adtalem Global Education, Inc.(a) | 142,638 | 6,875,152 |
| Graham Holdings Co., Class B | 10,532 | 7,200,834 |
| Service Corp. International | 439,381 | 18,164,010 |
| Sotheby’s(a) | 79,902 | 3,505,301 |
| Weight Watchers International, Inc.(a) | 94,130 | 1,904,250 |
| Total | | 37,649,547 |
| Hotels, Restaurants & Leisure 4.2% |
| Boyd Gaming Corp. | 196,170 | 5,838,019 |
| Brinker International, Inc. | 93,729 | 4,289,976 |
| Caesars Entertainment Corp.(a) | 1,414,800 | 12,195,576 |
| Cheesecake Factory, Inc. (The) | 101,275 | 4,790,308 |
| Churchill Downs, Inc. | 87,000 | 8,160,600 |
| Cracker Barrel Old Country Store, Inc. | 58,360 | 9,453,736 |
| Domino’s Pizza, Inc. | 101,000 | 25,344,940 |
| Dunkin’ Brands Group, Inc. | 200,560 | 14,330,012 |
| Eldorado Resorts, Inc.(a) | 157,850 | 7,609,949 |
| International Speedway Corp., Class A | 59,349 | 2,566,844 |
| Jack in the Box, Inc. | 62,510 | 5,034,555 |
| Marriott Vacations Worldwide Corp. | 99,369 | 9,672,578 |
| Papa John’s International, Inc. | 54,380 | 2,376,950 |
| Penn National Gaming, Inc.(a) | 262,630 | 6,526,356 |
| Scientific Games Corp., Class A(a) | 133,610 | 3,882,707 |
| Six Flags Entertainment Corp. | 174,230 | 9,706,353 |
| Texas Roadhouse, Inc. | 161,570 | 10,228,997 |
| Wendy’s Co. (The) | 454,178 | 7,870,905 |
| Wyndham Destinations, Inc. | 236,630 | 10,655,449 |
| Wyndham Hotels & Resorts, Inc. | 240,830 | 12,660,433 |
| Total | | 173,195,243 |
| Household Durables 1.4% |
| Helen of Troy Ltd.(a) | 64,110 | 7,187,372 |
| KB Home | 209,296 | 4,774,042 |
| NVR, Inc.(a) | 8,252 | 21,620,240 |
| Tempur Sealy International, Inc.(a) | 111,154 | 6,470,274 |
| Toll Brothers, Inc. | 329,196 | 11,719,377 |
The accompanying Notes to Financial Statements are an integral part of this statement.
Columbia Mid Cap Index Fund | Annual Report 2019
| 7 |
Portfolio of Investments (continued)
February 28, 2019
| Common Stocks (continued) |
| Issuer | Shares | Value ($) |
| TRI Pointe Group, Inc.(a) | 345,290 | 4,350,654 |
| Tupperware Brands Corp. | 117,960 | 3,551,776 |
| Total | | 59,673,735 |
| Leisure Products 0.5% |
| Brunswick Corp. | 210,620 | 11,108,099 |
| Polaris Industries, Inc. | 141,014 | 12,018,623 |
| Total | | 23,126,722 |
| Multiline Retail 0.4% |
| Big Lots, Inc. | 97,950 | 3,088,363 |
| Dillard’s, Inc., Class A | 44,870 | 3,524,090 |
| Ollie’s Bargain Outlet Holdings, Inc.(a) | 125,200 | 11,045,144 |
| Total | | 17,657,597 |
| Specialty Retail 2.1% |
| Aaron’s, Inc. | 166,559 | 9,042,488 |
| American Eagle Outfitters, Inc. | 409,134 | 8,346,334 |
| AutoNation, Inc.(a) | 139,740 | 4,927,232 |
| Bed Bath & Beyond, Inc. | 335,210 | 5,608,063 |
| Dick’s Sporting Goods, Inc. | 179,110 | 6,996,037 |
| Five Below, Inc.(a) | 135,390 | 16,294,187 |
| Michaels Companies, Inc. (The)(a) | 218,260 | 3,086,196 |
| Murphy U.S.A., Inc.(a) | 72,810 | 5,662,434 |
| Sally Beauty Holdings, Inc.(a) | 291,730 | 5,271,561 |
| Signet Jewelers Ltd. | 126,050 | 3,543,266 |
| Urban Outfitters, Inc.(a) | 182,960 | 5,644,316 |
| Williams-Sonoma, Inc. | 194,628 | 11,319,564 |
| Total | | 85,741,678 |
| Textiles, Apparel & Luxury Goods 0.8% |
| Carter’s, Inc. | 111,332 | 10,848,190 |
| Deckers Outdoor Corp.(a) | 70,712 | 10,461,840 |
| Skechers U.S.A., Inc., Class A(a) | 325,080 | 10,932,441 |
| Total | | 32,242,471 |
| Total Consumer Discretionary | 498,633,801 |
| Consumer Staples 2.8% |
| Beverages 0.2% |
| Boston Beer Co., Inc. (The), Class A(a) | 20,890 | 6,529,378 |
| Common Stocks (continued) |
| Issuer | Shares | Value ($) |
| Food & Staples Retailing 0.5% |
| Casey’s General Stores, Inc. | 88,880 | 11,975,691 |
| Sprouts Farmers Market, Inc.(a) | 309,840 | 7,225,469 |
| Total | | 19,201,160 |
| Food Products 1.6% |
| Flowers Foods, Inc. | 445,511 | 9,119,610 |
| Hain Celestial Group, Inc. (The)(a) | 217,310 | 4,274,488 |
| Ingredion, Inc. | 161,456 | 14,926,607 |
| Lancaster Colony Corp. | 47,395 | 7,430,114 |
| Post Holdings, Inc.(a) | 161,911 | 16,495,493 |
| Sanderson Farms, Inc. | 48,800 | 5,621,760 |
| Tootsie Roll Industries, Inc. | 45,009 | 1,673,885 |
| TreeHouse Foods, Inc.(a) | 135,970 | 8,237,062 |
| Total | | 67,779,019 |
| Household Products 0.2% |
| Energizer Holdings, Inc. | 154,693 | 7,097,315 |
| Personal Products 0.3% |
| Edgewell Personal Care Co.(a) | 131,223 | 5,821,052 |
| Nu Skin Enterprises, Inc., Class A | 134,880 | 8,107,637 |
| Total | | 13,928,689 |
| Total Consumer Staples | 114,535,561 |
| Energy 3.6% |
| Energy Equipment & Services 1.2% |
| Apergy Corp.(a) | 187,800 | 7,883,844 |
| Core Laboratories NV | 107,360 | 6,958,002 |
| Diamond Offshore Drilling, Inc.(a) | 156,840 | 1,497,822 |
| Ensco PLC, Class A | 1,061,340 | 4,351,494 |
| McDermott International, Inc.(a) | 438,480 | 3,718,311 |
| Oceaneering International, Inc.(a) | 239,256 | 3,696,505 |
| Patterson-UTI Energy, Inc. | 527,913 | 7,000,126 |
| Rowan Companies PLC, Class A(a) | 308,540 | 3,489,587 |
| Transocean Ltd.(a) | 1,228,500 | 10,036,845 |
| Total | | 48,632,536 |
| Oil, Gas & Consumable Fuels 2.4% |
| Callon Petroleum Co.(a) | 552,600 | 4,227,390 |
| Chesapeake Energy Corp.(a) | 2,534,460 | 7,502,002 |
| CNX Resources Corp.(a) | 494,370 | 5,240,322 |
| EQT Corp. | 617,780 | 11,194,174 |
The accompanying Notes to Financial Statements are an integral part of this statement.
| 8 | Columbia Mid Cap Index Fund | Annual Report 2019 |
Portfolio of Investments (continued)
February 28, 2019
| Common Stocks (continued) |
| Issuer | Shares | Value ($) |
| Equitrans Midstream Corp. | 493,920 | 8,712,749 |
| Matador Resources Co.(a) | 251,400 | 4,676,040 |
| Murphy Oil Corp. | 394,990 | 11,415,211 |
| Oasis Petroleum, Inc.(a) | 649,490 | 3,630,649 |
| PBF Energy, Inc., Class A | 291,110 | 9,044,788 |
| QEP Resources, Inc.(a) | 574,920 | 4,461,379 |
| Range Resources Corp. | 502,840 | 5,380,388 |
| SM Energy Co. | 250,519 | 4,093,480 |
| Southwestern Energy Co.(a) | 1,411,430 | 5,970,349 |
| World Fuel Services Corp. | 163,250 | 4,520,392 |
| WPX Energy, Inc.(a) | 959,300 | 11,837,762 |
| Total | | 101,907,075 |
| Total Energy | 150,539,611 |
| Financials 16.6% |
| Banks 7.7% |
| Associated Banc-Corp. | 402,539 | 9,371,108 |
| BancorpSouth Bank | 220,240 | 7,177,622 |
| Bank of Hawaii Corp. | 101,386 | 8,336,971 |
| Bank OZK | 293,530 | 9,627,784 |
| Cathay General Bancorp | 187,025 | 7,264,051 |
| Chemical Financial Corp. | 173,480 | 7,950,588 |
| Commerce Bancshares, Inc. | 241,046 | 15,169,025 |
| Cullen/Frost Bankers, Inc. | 155,269 | 16,098,290 |
| East West Bancorp, Inc. | 351,987 | 19,222,010 |
| First Horizon National Corp. | 786,580 | 12,294,245 |
| FNB Corp. | 787,440 | 9,638,266 |
| Fulton Financial Corp. | 427,585 | 7,345,910 |
| Hancock Whitney Corp. | 206,791 | 9,032,631 |
| Home Bancshares, Inc. | 386,310 | 7,525,319 |
| International Bancshares Corp. | 133,322 | 5,442,204 |
| MB Financial, Inc. | 204,540 | 9,259,526 |
| PacWest Bancorp | 295,680 | 12,128,794 |
| Pinnacle Financial Partners, Inc. | 177,780 | 10,433,908 |
| Prosperity Bancshares, Inc. | 161,105 | 11,994,267 |
| Signature Bank | 129,621 | 17,597,347 |
| Sterling Bancorp | 544,940 | 11,078,630 |
| Synovus Financial Corp. | 402,535 | 15,972,589 |
| TCF Financial Corp. | 405,029 | 9,275,164 |
| Texas Capital Bancshares, Inc.(a) | 121,850 | 7,436,506 |
| Common Stocks (continued) |
| Issuer | Shares | Value ($) |
| Trustmark Corp. | 162,900 | 5,779,692 |
| UMB Financial Corp. | 109,000 | 7,500,290 |
| Umpqua Holdings Corp. | 534,780 | 9,722,300 |
| United Bankshares, Inc. | 250,550 | 9,618,614 |
| Valley National Bancorp | 804,911 | 8,499,860 |
| Webster Financial Corp. | 223,965 | 12,860,070 |
| Wintrust Financial Corp. | 136,930 | 10,087,633 |
| Total | | 320,741,214 |
| Capital Markets 3.0% |
| Eaton Vance Corp. | 282,952 | 11,841,541 |
| Evercore, Inc., Class A | 98,270 | 9,050,667 |
| Factset Research Systems, Inc. | 92,364 | 21,721,242 |
| Federated Investors, Inc., Class B | 231,810 | 6,896,347 |
| Interactive Brokers Group, Inc., Class A | 182,320 | 10,069,534 |
| Janus Henderson Group PLC | 405,137 | 9,925,856 |
| Legg Mason, Inc. | 207,670 | 6,074,348 |
| MarketAxess Holdings, Inc. | 91,280 | 22,261,366 |
| SEI Investments Co. | 317,245 | 16,734,674 |
| Stifel Financial Corp. | 174,860 | 9,517,630 |
| Total | | 124,093,205 |
| Consumer Finance 0.6% |
| Green Dot Corp., Class A(a) | 115,170 | 7,434,224 |
| Navient Corp. | 557,480 | 6,812,406 |
| SLM Corp.(a) | 1,057,850 | 11,689,242 |
| Total | | 25,935,872 |
| Insurance 4.7% |
| Alleghany Corp. | 36,028 | 23,164,563 |
| American Financial Group, Inc. | 171,207 | 17,062,490 |
| Brown & Brown, Inc. | 569,516 | 16,869,064 |
| CNO Financial Group, Inc. | 399,790 | 6,808,424 |
| First American Financial Corp. | 271,435 | 13,786,184 |
| Genworth Financial, Inc., Class A(a) | 1,215,910 | 4,705,572 |
| Hanover Insurance Group, Inc. (The) | 102,790 | 12,202,201 |
| Kemper Corp. | 147,781 | 12,280,601 |
| Mercury General Corp. | 65,841 | 3,487,598 |
| Old Republic International Corp. | 690,766 | 14,409,379 |
| Primerica, Inc. | 104,255 | 13,036,045 |
| Reinsurance Group of America, Inc. | 152,429 | 22,024,466 |
The accompanying Notes to Financial Statements are an integral part of this statement.
Columbia Mid Cap Index Fund | Annual Report 2019
| 9 |
Portfolio of Investments (continued)
February 28, 2019
| Common Stocks (continued) |
| Issuer | Shares | Value ($) |
| RenaissanceRe Holdings Ltd. | 97,770 | 14,377,078 |
| WR Berkley Corp. | 234,263 | 19,598,442 |
| Total | | 193,812,107 |
| Thrifts & Mortgage Finance 0.6% |
| LendingTree, Inc.(a) | 18,070 | 5,763,426 |
| New York Community Bancorp, Inc. | 1,190,624 | 14,894,706 |
| Washington Federal, Inc. | 197,889 | 6,071,235 |
| Total | | 26,729,367 |
| Total Financials | 691,311,765 |
| Health Care 9.3% |
| Biotechnology 0.9% |
| Exelixis, Inc.(a) | 725,980 | 16,254,692 |
| Ligand Pharmaceuticals, Inc.(a) | 51,610 | 6,403,769 |
| United Therapeutics Corp.(a) | 105,838 | 13,366,281 |
| Total | | 36,024,742 |
| Health Care Equipment & Supplies 3.6% |
| Avanos Medical, Inc.(a) | 115,160 | 5,421,733 |
| Cantel Medical Corp. | 88,140 | 6,480,053 |
| Globus Medical, Inc., Class A(a) | 184,590 | 8,987,687 |
| Haemonetics Corp.(a) | 125,500 | 10,902,185 |
| Hill-Rom Holdings, Inc. | 163,374 | 17,325,813 |
| ICU Medical, Inc.(a) | 40,300 | 9,904,128 |
| Inogen, Inc.(a) | 42,850 | 4,604,661 |
| Integra LifeSciences Holdings Corp.(a) | 171,670 | 9,457,300 |
| LivaNova PLC(a) | 118,210 | 11,017,172 |
| Masimo Corp.(a) | 118,390 | 15,542,239 |
| NuVasive, Inc.(a) | 124,860 | 7,354,254 |
| STERIS PLC | 205,178 | 24,818,331 |
| West Pharmaceutical Services, Inc. | 179,880 | 18,842,430 |
| Total | | 150,657,986 |
| Health Care Providers & Services 2.2% |
| Acadia Healthcare Co., Inc.(a) | 214,300 | 5,633,947 |
| Amedisys, Inc.(a) | 70,300 | 8,738,290 |
| Chemed Corp. | 38,880 | 12,810,960 |
| Encompass Health Corp. | 240,210 | 15,166,859 |
| HealthEquity, Inc.(a) | 131,800 | 10,607,264 |
| Mednax, Inc.(a) | 217,122 | 7,145,485 |
| Molina Healthcare, Inc.(a) | 151,490 | 20,395,099 |
| Common Stocks (continued) |
| Issuer | Shares | Value ($) |
| Patterson Companies, Inc. | 200,590 | 4,523,305 |
| Tenet Healthcare Corp.(a) | 201,590 | 5,761,442 |
| Total | | 90,782,651 |
| Health Care Technology 0.4% |
| Allscripts Healthcare Solutions, Inc.(a) | 424,233 | 4,547,778 |
| Medidata Solutions, Inc.(a) | 148,580 | 11,146,471 |
| Total | | 15,694,249 |
| Life Sciences Tools & Services 1.6% |
| Bio-Rad Laboratories, Inc., Class A(a) | 48,891 | 13,244,572 |
| Bio-Techne Corp. | 91,701 | 17,780,824 |
| Charles River Laboratories International, Inc.(a) | 116,788 | 16,603,750 |
| Pra Health Sciences, Inc.(a) | 141,990 | 15,190,090 |
| Syneos Health, Inc.(a) | 147,880 | 6,176,948 |
| Total | | 68,996,184 |
| Pharmaceuticals 0.6% |
| Catalent, Inc.(a) | 352,980 | 15,255,795 |
| Mallinckrodt PLC(a) | 202,300 | 5,049,408 |
| Prestige Consumer Healthcare, Inc.(a) | 125,630 | 3,675,934 |
| Total | | 23,981,137 |
| Total Health Care | 386,136,949 |
| Industrials 14.8% |
| Aerospace & Defense 1.0% |
| Curtiss-Wright Corp. | 106,330 | 13,109,426 |
| Esterline Technologies Corp.(a) | 64,503 | 7,853,240 |
| Teledyne Technologies, Inc.(a) | 87,610 | 20,679,464 |
| Total | | 41,642,130 |
| Airlines 0.3% |
| JetBlue Airways Corp.(a) | 740,066 | 12,359,102 |
| Building Products 0.7% |
| Lennox International, Inc. | 88,032 | 21,589,848 |
| Resideo Technologies, Inc.(a) | 298,580 | 7,673,506 |
| Total | | 29,263,354 |
| Commercial Services & Supplies 1.5% |
| Brink’s Co. (The) | 122,900 | 9,699,268 |
| Clean Harbors, Inc.(a) | 123,750 | 8,415,000 |
| Deluxe Corp. | 112,442 | 5,231,926 |
| Healthcare Services Group, Inc. | 179,190 | 6,841,474 |
| Herman Miller, Inc. | 144,079 | 5,284,818 |
The accompanying Notes to Financial Statements are an integral part of this statement.
| 10 | Columbia Mid Cap Index Fund | Annual Report 2019 |
Portfolio of Investments (continued)
February 28, 2019
| Common Stocks (continued) |
| Issuer | Shares | Value ($) |
| HNI Corp. | 106,405 | 4,110,425 |
| MSA Safety, Inc. | 84,996 | 8,787,737 |
| Pitney Bowes, Inc. | 455,570 | 3,275,548 |
| Stericycle, Inc.(a) | 206,780 | 9,218,253 |
| Total | | 60,864,449 |
| Construction & Engineering 1.2% |
| AECOM(a) | 379,645 | 11,753,809 |
| Dycom Industries, Inc.(a) | 75,990 | 3,425,629 |
| EMCOR Group, Inc. | 139,760 | 10,080,889 |
| Granite Construction, Inc. | 113,872 | 5,301,880 |
| KBR, Inc. | 342,077 | 6,759,442 |
| MasTec, Inc.(a) | 154,750 | 6,682,105 |
| Valmont Industries, Inc. | 53,631 | 7,325,458 |
| Total | | 51,329,212 |
| Electrical Equipment 1.3% |
| Acuity Brands, Inc. | 97,340 | 12,665,881 |
| EnerSys | 102,340 | 7,554,739 |
| Hubbell, Inc. | 132,835 | 15,681,171 |
| nVent Electric PLC | 396,460 | 10,894,721 |
| Regal Beloit Corp. | 104,754 | 8,774,195 |
| Total | | 55,570,707 |
| Industrial Conglomerates 0.4% |
| Carlisle Companies, Inc. | 144,584 | 17,795,399 |
| Machinery 4.8% |
| AGCO Corp. | 159,671 | 10,790,566 |
| Crane Co. | 122,695 | 10,376,316 |
| Donaldson Co., Inc. | 310,535 | 16,020,501 |
| Graco, Inc. | 404,136 | 18,978,227 |
| IDEX Corp. | 186,263 | 26,840,498 |
| ITT, Inc. | 212,702 | 12,285,667 |
| Kennametal, Inc. | 199,356 | 7,513,728 |
| Lincoln Electric Holdings, Inc. | 156,485 | 13,523,434 |
| Nordson Corp. | 127,076 | 17,251,838 |
| Oshkosh Corp. | 174,570 | 13,583,292 |
| Terex Corp. | 157,475 | 5,289,585 |
| Timken Co. (The) | 167,965 | 7,288,001 |
| Toro Co. (The) | 255,430 | 17,517,389 |
| Common Stocks (continued) |
| Issuer | Shares | Value ($) |
| Trinity Industries, Inc. | 355,236 | 8,316,075 |
| Woodward, Inc. | 135,017 | 13,007,538 |
| Total | | 198,582,655 |
| Marine 0.2% |
| Kirby Corp.(a) | 130,828 | 9,710,054 |
| Professional Services 0.8% |
| ASGN, Inc.(a) | 127,420 | 8,207,122 |
| Insperity, Inc. | 92,380 | 11,664,823 |
| ManpowerGroup, Inc. | 150,137 | 12,649,042 |
| Total | | 32,520,987 |
| Road & Rail 1.8% |
| Avis Budget Group, Inc.(a) | 157,760 | 5,650,963 |
| Genesee & Wyoming, Inc., Class A(a) | 141,784 | 11,626,288 |
| Knight-Swift Transportation Holdings, Inc. | 305,140 | 10,261,858 |
| Landstar System, Inc. | 99,828 | 10,849,307 |
| Old Dominion Freight Line, Inc. | 158,800 | 23,942,276 |
| Ryder System, Inc. | 128,910 | 8,013,046 |
| Werner Enterprises, Inc. | 107,184 | 3,701,064 |
| Total | | 74,044,802 |
| Trading Companies & Distributors 0.8% |
| GATX Corp. | 91,298 | 7,258,191 |
| MSC Industrial Direct Co., Inc., Class A | 110,250 | 9,306,202 |
| NOW, Inc.(a) | 263,260 | 3,798,842 |
| Watsco, Inc. | 77,983 | 11,220,974 |
| Total | | 31,584,209 |
| Total Industrials | 615,267,060 |
| Information Technology 16.3% |
| Communications Equipment 1.5% |
| Arris International PLC(a) | 396,820 | 12,571,258 |
| Ciena Corp.(a) | 344,732 | 14,706,267 |
| InterDigital, Inc. | 82,174 | 5,729,993 |
| Lumentum Holdings, Inc.(a) | 178,820 | 8,896,295 |
| Netscout Systems, Inc.(a) | 169,810 | 4,647,700 |
| Plantronics, Inc. | 80,219 | 4,030,203 |
| Viasat, Inc.(a) | 136,150 | 10,286,132 |
| Total | | 60,867,848 |
The accompanying Notes to Financial Statements are an integral part of this statement.
Columbia Mid Cap Index Fund | Annual Report 2019
| 11 |
Portfolio of Investments (continued)
February 28, 2019
| Common Stocks (continued) |
| Issuer | Shares | Value ($) |
| Electronic Equipment, Instruments & Components 4.2% |
| Arrow Electronics, Inc.(a) | 211,666 | 16,869,780 |
| Avnet, Inc. | 270,070 | 11,745,344 |
| Belden, Inc. | 97,870 | 6,047,387 |
| Cognex Corp. | 418,110 | 22,327,074 |
| Coherent, Inc.(a) | 59,200 | 7,878,336 |
| Jabil, Inc. | 349,090 | 9,914,156 |
| Littelfuse, Inc. | 61,080 | 11,793,937 |
| National Instruments Corp. | 273,336 | 12,775,725 |
| SYNNEX Corp. | 100,620 | 9,872,835 |
| Tech Data Corp.(a) | 90,614 | 9,262,563 |
| Trimble Navigation Ltd.(a) | 609,818 | 24,398,818 |
| Vishay Intertechnology, Inc. | 320,798 | 7,031,892 |
| Zebra Technologies Corp., Class A(a) | 130,645 | 26,195,629 |
| Total | | 176,113,476 |
| IT Services 3.0% |
| CACI International, Inc., Class A(a) | 60,340 | 10,997,568 |
| CoreLogic, Inc.(a) | 195,617 | 7,173,275 |
| Leidos Holdings, Inc. | 363,642 | 23,487,637 |
| Live Ramp Holdings, Inc.(a) | 165,153 | 8,876,974 |
| MAXIMUS, Inc. | 155,720 | 11,006,290 |
| Perspecta, Inc. | 343,440 | 7,246,584 |
| Sabre Corp. | 668,500 | 14,994,455 |
| Science Applications International Corp. | 123,584 | 9,231,725 |
| Teradata Corp.(a) | 287,010 | 13,882,674 |
| WEX, Inc.(a) | 104,657 | 18,635,225 |
| Total | | 125,532,407 |
| Semiconductors & Semiconductor Equipment 3.4% |
| Cirrus Logic, Inc.(a) | 145,310 | 5,831,290 |
| Cree, Inc.(a) | 249,028 | 13,549,614 |
| Cypress Semiconductor Corp. | 878,872 | 13,560,995 |
| First Solar, Inc.(a) | 183,240 | 9,629,262 |
| Integrated Device Technology, Inc.(a) | 313,321 | 15,142,804 |
| MKS Instruments, Inc. | 131,090 | 10,863,428 |
| Monolithic Power Systems, Inc. | 94,740 | 12,705,581 |
| Silicon Laboratories, Inc.(a) | 104,772 | 8,488,628 |
| Synaptics, Inc.(a) | 84,060 | 3,519,592 |
| Teradyne, Inc. | 435,250 | 17,771,258 |
| Common Stocks (continued) |
| Issuer | Shares | Value ($) |
| Universal Display Corp. | 102,930 | 15,361,273 |
| Versum Materials, Inc. | 264,750 | 12,972,750 |
| Total | | 139,396,475 |
| Software 4.0% |
| ACI Worldwide, Inc.(a) | 281,618 | 8,975,166 |
| Blackbaud, Inc. | 117,930 | 9,108,913 |
| CDK Global, Inc. | 312,680 | 18,138,567 |
| CommVault Systems, Inc.(a) | 94,415 | 6,362,627 |
| Covetrus, Inc.(a) | 232,080 | 8,303,822 |
| Fair Isaac Corp.(a) | 70,302 | 17,422,242 |
| j2 Global, Inc. | 113,690 | 9,664,787 |
| LogMeIn, Inc. | 124,230 | 9,868,831 |
| Manhattan Associates, Inc.(a) | 158,750 | 8,691,562 |
| PTC, Inc.(a) | 259,340 | 24,071,939 |
| Tyler Technologies, Inc.(a) | 94,270 | 19,305,553 |
| Ultimate Software Group, Inc. (The)(a) | 75,930 | 25,170,795 |
| Total | | 165,084,804 |
| Technology Hardware, Storage & Peripherals 0.2% |
| NCR Corp.(a) | 287,010 | 8,042,020 |
| Total Information Technology | 675,037,030 |
| Materials 6.7% |
| Chemicals 2.6% |
| Ashland Global Holdings, Inc. | 151,730 | 11,740,867 |
| Cabot Corp. | 145,759 | 6,833,182 |
| Chemours Co. LLC (The) | 415,420 | 15,798,423 |
| Minerals Technologies, Inc. | 85,615 | 5,068,408 |
| NewMarket Corp. | 21,603 | 9,483,717 |
| Olin Corp. | 405,103 | 10,475,964 |
| PolyOne Corp. | 193,810 | 6,322,082 |
| RPM International, Inc. | 322,261 | 18,649,244 |
| Scotts Miracle-Gro Co. (The), Class A | 95,377 | 7,811,376 |
| Sensient Technologies Corp. | 102,650 | 6,641,455 |
| Valvoline, Inc. | 456,887 | 8,584,907 |
| Total | | 107,409,625 |
| Construction Materials 0.2% |
| Eagle Materials, Inc. | 113,850 | 8,702,694 |
The accompanying Notes to Financial Statements are an integral part of this statement.
| 12 | Columbia Mid Cap Index Fund | Annual Report 2019 |
Portfolio of Investments (continued)
February 28, 2019
| Common Stocks (continued) |
| Issuer | Shares | Value ($) |
| Containers & Packaging 1.4% |
| AptarGroup, Inc. | 152,522 | 15,516,063 |
| Bemis Co., Inc. | 221,000 | 11,690,900 |
| Greif, Inc., Class A | 62,993 | 2,532,318 |
| Owens-Illinois, Inc. | 385,340 | 7,675,973 |
| Silgan Holdings, Inc. | 188,020 | 5,322,846 |
| Sonoco Products Co. | 242,356 | 14,029,989 |
| Total | | 56,768,089 |
| Metals & Mining 2.1% |
| Allegheny Technologies, Inc.(a) | 305,180 | 8,737,303 |
| Carpenter Technology Corp. | 115,022 | 5,399,133 |
| Commercial Metals Co. | 285,622 | 4,727,044 |
| Compass Minerals International, Inc. | 82,194 | 4,305,322 |
| Reliance Steel & Aluminum Co. | 171,021 | 15,263,624 |
| Royal Gold, Inc. | 159,065 | 14,062,937 |
| Steel Dynamics, Inc. | 557,389 | 20,801,758 |
| United States Steel Corp. | 430,440 | 9,646,160 |
| Worthington Industries, Inc. | 97,690 | 3,840,194 |
| Total | | 86,783,475 |
| Paper & Forest Products 0.4% |
| Domtar Corp. | 152,736 | 7,775,790 |
| Louisiana-Pacific Corp. | 342,797 | 8,662,480 |
| Total | | 16,438,270 |
| Total Materials | 276,102,153 |
| Real Estate 9.6% |
| Equity Real Estate Investment Trusts (REITS) 9.1% |
| Alexander & Baldwin, Inc. | 164,399 | 3,769,669 |
| American Campus Communities, Inc. | 332,733 | 14,992,949 |
| Brixmor Property Group, Inc. | 727,980 | 12,710,531 |
| Camden Property Trust | 226,147 | 22,182,759 |
| CoreCivic, Inc. | 288,175 | 6,103,547 |
| Coresite Realty Corp. | 89,110 | 9,111,497 |
| Corporate Office Properties Trust | 264,321 | 6,869,703 |
| Cousins Properties, Inc. | 1,020,760 | 9,717,635 |
| CyrusOne, Inc. | 256,980 | 12,807,883 |
| Douglas Emmett, Inc. | 392,010 | 15,131,586 |
| EPR Properties | 180,500 | 13,263,140 |
| First Industrial Realty Trust, Inc. | 306,690 | 10,280,249 |
| Common Stocks (continued) |
| Issuer | Shares | Value ($) |
| GEO Group, Inc. (The) | 295,735 | 6,719,099 |
| Healthcare Realty Trust, Inc. | 304,090 | 9,624,448 |
| Highwoods Properties, Inc. | 251,284 | 11,636,962 |
| Hospitality Properties Trust | 399,293 | 10,808,862 |
| JBG SMITH Properties | 264,240 | 10,646,230 |
| Kilroy Realty Corp. | 244,625 | 18,031,309 |
| Lamar Advertising Co., Class A | 206,599 | 16,025,884 |
| Liberty Property Trust | 358,931 | 16,988,204 |
| Life Storage, Inc. | 113,150 | 11,043,440 |
| Mack-Cali Realty Corp. | 219,308 | 4,607,661 |
| Medical Properties Trust, Inc. | 886,130 | 16,154,150 |
| National Retail Properties, Inc. | 386,418 | 20,132,378 |
| Omega Healthcare Investors, Inc. | 487,320 | 17,494,788 |
| Pebblebrook Hotel Trust | 310,843 | 9,950,084 |
| PotlatchDeltic Corp. | 164,075 | 5,905,059 |
| Rayonier, Inc. | 314,365 | 9,264,337 |
| Sabra Health Care REIT, Inc. | 432,899 | 7,844,130 |
| Senior Housing Properties Trust | 577,245 | 7,475,323 |
| Tanger Factory Outlet Centers, Inc. | 228,020 | 4,922,952 |
| Taubman Centers, Inc. | 148,279 | 7,915,133 |
| Uniti Group, Inc. | 434,594 | 4,189,486 |
| Urban Edge Properties | 277,550 | 5,390,021 |
| Weingarten Realty Investors | 289,777 | 8,348,475 |
| Total | | 378,059,563 |
| Real Estate Management & Development 0.5% |
| Jones Lang LaSalle, Inc. | 110,648 | 18,270,198 |
| Realogy Holdings Corp. | 286,900 | 3,901,840 |
| Total | | 22,172,038 |
| Total Real Estate | 400,231,601 |
| Utilities 4.4% |
| Electric Utilities 1.5% |
| Allete, Inc. | 124,870 | 10,120,713 |
| Hawaiian Electric Industries, Inc. | 264,376 | 10,120,313 |
| IDACORP, Inc. | 122,359 | 12,041,349 |
| OGE Energy Corp. | 484,978 | 20,621,265 |
| PNM Resources, Inc. | 193,410 | 8,448,149 |
| Total | | 61,351,789 |
The accompanying Notes to Financial Statements are an integral part of this statement.
Columbia Mid Cap Index Fund | Annual Report 2019
| 13 |
Portfolio of Investments (continued)
February 28, 2019
| Common Stocks (continued) |
| Issuer | Shares | Value ($) |
| Gas Utilities 1.8% |
| National Fuel Gas Co. | 208,735 | 12,563,760 |
| New Jersey Resources Corp. | 214,900 | 10,401,160 |
| ONE Gas, Inc. | 127,540 | 11,025,833 |
| Southwest Gas Holdings, Inc. | 128,690 | 10,544,858 |
| Spire, Inc. | 123,600 | 9,803,952 |
| UGI Corp. | 422,131 | 23,174,992 |
| Total | | 77,514,555 |
| Multi-Utilities 0.7% |
| Black Hills Corp. | 131,062 | 9,302,781 |
| MDU Resources Group, Inc. | 475,966 | 12,575,022 |
| NorthWestern Corp. | 122,190 | 8,374,902 |
| Total | | 30,252,705 |
| Water Utilities 0.4% |
| Aqua America, Inc. | 432,068 | 15,528,524 |
| Total Utilities | 184,647,573 |
Total Common Stocks
(Cost $2,887,924,440) | 4,095,744,783 |
|
| Money Market Funds 1.3% |
| | Shares | Value ($) |
| Columbia Short-Term Cash Fund, 2.523%(b),(c) | 53,663,946 | 53,658,579 |
Total Money Market Funds
(Cost $53,658,579) | 53,658,579 |
Total Investments in Securities
(Cost: $2,941,583,019) | 4,149,403,362 |
| Other Assets & Liabilities, Net | | 4,551,353 |
| Net Assets | 4,153,954,715 |
At February 28, 2019, securities and/or cash totaling $2,632,200 were pledged as collateral.
Investments in derivatives
| Long futures contracts |
| Description | Number of
contracts | Expiration
date | Trading
currency | Notional
amount | Value/Unrealized
appreciation ($) | Value/Unrealized
depreciation ($) |
| S&P Mid 400 E-mini | 321 | 03/2019 | USD | 61,336,680 | 4,223,453 | — |
Notes to Portfolio of Investments
| (a) | Non-income producing investment. |
| (b) | The rate shown is the seven-day current annualized yield at February 28, 2019. |
| (c) | As defined in the Investment Company Act of 1940, an affiliated company is one in which the Fund owns 5% or more of the company’s outstanding voting securities, or a company which is under common ownership or control with the Fund. Holdings and transactions in these affiliated companies during the year ended February 28, 2019 are as follows: |
| Issuer | Beginning
shares | Shares
purchased | Shares
sold | Ending
shares | Realized gain
(loss) —
affiliated
issuers ($) | Net change in
unrealized
appreciation
(depreciation) —
affiliated
issuers ($) | Dividends —
affiliated
issuers ($) | Value —
affiliated
issuers
at end of
period ($) |
| Columbia Short-Term Cash Fund, 2.523% |
| | 66,343,121 | 773,513,831 | (786,193,006) | 53,663,946 | 1,805 | 4,776 | 1,250,018 | 53,658,579 |
The accompanying Notes to Financial Statements are an integral part of this statement.
| 14 | Columbia Mid Cap Index Fund | Annual Report 2019 |
Portfolio of Investments (continued)
February 28, 2019
Currency Legend
Fair value measurements
The Fund categorizes its fair value measurements according to a three-level hierarchy that maximizes the use of observable inputs and minimizes the use of unobservable inputs by prioritizing that the most observable input be used when available. Observable inputs are those that market participants would use in pricing an investment based on market data obtained from sources independent of the reporting entity. Unobservable inputs are those that reflect the Fund’s assumptions about the information market participants would use in pricing an investment. An investment’s level within the fair value hierarchy is based on the lowest level of any input that is deemed significant to the asset’s or liability’s fair value measurement. The input levels are not necessarily an indication of the risk or liquidity associated with investments at that level. For example, certain U.S. government securities are generally high quality and liquid, however, they are reflected as Level 2 because the inputs used to determine fair value may not always be quoted prices in an active market.
Fair value inputs are summarized in the three broad levels listed below:
| ■ | Level 1 — Valuations based on quoted prices for investments in active markets that the Fund has the ability to access at the measurement date. Valuation adjustments are not applied to Level 1 investments. |
| ■ | Level 2 — Valuations based on other significant observable inputs (including quoted prices for similar securities, interest rates, prepayment speeds, credit risks, etc.). |
| ■ | Level 3 — Valuations based on significant unobservable inputs (including the Fund’s own assumptions and judgment in determining the fair value of investments). |
Inputs that are used in determining fair value of an investment may include price information, credit data, volatility statistics, and other factors. These inputs can be either observable or unobservable. The availability of observable inputs can vary between investments, and is affected by various factors such as the type of investment, and the volume and level of activity for that investment or similar investments in the marketplace. The inputs will be considered by the Investment Manager, along with any other relevant factors in the calculation of an investment’s fair value. The Fund uses prices and inputs that are current as of the measurement date, which may include periods of market dislocations. During these periods, the availability of prices and inputs may be reduced for many investments. This condition could cause an investment to be reclassified between the various levels within the hierarchy.
Certain investments that have been measured at fair value using the net asset value (NAV) per share (or its equivalent) are not categorized in the fair value hierarchy. The fair value amounts presented in the table are intended to reconcile the fair value hierarchy to the amounts presented in the Portfolio of Investments. The Columbia Short-Term Cash Fund seeks to provide shareholders with maximum current income consistent with liquidity and stability of principal. Columbia Short-Term Cash Fund prices its shares with a floating NAV and no longer seeks to maintain a stable NAV.
Investments falling into the Level 3 category are primarily supported by quoted prices from brokers and dealers participating in the market for those investments. However, these may be classified as Level 3 investments due to lack of market transparency and corroboration to support these quoted prices. Additionally, valuation models may be used as the pricing source for any remaining investments classified as Level 3. These models may rely on one or more significant unobservable inputs and/or significant assumptions by the Investment Manager. Inputs used in valuations may include, but are not limited to, financial statement analysis, capital account balances, discount rates and estimated cash flows, and comparable company data.
Under the direction of the Fund’s Board of Trustees (the Board), the Investment Manager’s Valuation Committee (the Committee) is responsible for overseeing the valuation procedures approved by the Board. The Committee consists of voting and non-voting members from various groups within the Investment Manager’s organization, including operations and accounting, trading and investments, compliance, risk management and legal.
The Committee meets at least monthly to review and approve valuation matters, which may include a description of specific valuation determinations, data regarding pricing information received from approved pricing vendors and brokers and the results of Board-approved valuation control policies and procedures (the Policies). The Policies address, among other things, instances when market quotations are or are not readily available, including recommendations of third party pricing vendors and a determination of appropriate pricing methodologies; events that require specific valuation determinations and assessment of fair value techniques; securities with a potential for stale pricing, including those that are illiquid, restricted, or in default; and the effectiveness of third party pricing vendors, including periodic reviews of vendors. The Committee meets more frequently, as needed, to discuss additional valuation matters, which may include the need to review back-testing results, review time-sensitive information or approve related valuation actions. The Committee reports to the Board, with members of the Committee meeting with the Board at each of its regularly scheduled meetings to discuss valuation matters and actions during the period, similar to those described earlier.
For investments categorized as Level 3, the Committee monitors information similar to that described above, which may include: (i) data specific to the issuer or comparable issuers, (ii) general market or specific sector news and (iii) quoted prices and specific or similar security transactions. The Committee considers this data and any changes from prior periods in order to assess the reasonableness of observable and unobservable inputs, any assumptions or internal models used to value those securities and changes in fair value. This data is also used to corroborate, when available, information received from approved pricing vendors and brokers. Various factors impact the frequency of monitoring this information (which may occur as often as daily). However, the Committee may determine that changes to inputs, assumptions and models are not required as a result of the monitoring procedures performed.
The following table is a summary of the inputs used to value the Fund’s investments at February 28, 2019:
| | Level 1
quoted prices
in active
markets for
identical
assets ($) | Level 2
other
significant
observable
inputs ($) | Level 3
significant
unobservable
inputs ($) | Investments
measured at
net asset
value ($) | Total ($) |
| Investments in Securities | | | | | |
| Common Stocks | | | | | |
| Communication Services | 103,301,679 | — | — | — | 103,301,679 |
| Consumer Discretionary | 498,633,801 | — | — | — | 498,633,801 |
| Consumer Staples | 114,535,561 | — | — | — | 114,535,561 |
| Energy | 150,539,611 | — | — | — | 150,539,611 |
The accompanying Notes to Financial Statements are an integral part of this statement.
Columbia Mid Cap Index Fund | Annual Report 2019
| 15 |
Portfolio of Investments (continued)
February 28, 2019
Fair value measurements (continued)
| | Level 1
quoted prices
in active
markets for
identical
assets ($) | Level 2
other
significant
observable
inputs ($) | Level 3
significant
unobservable
inputs ($) | Investments
measured at
net asset
value ($) | Total ($) |
| Financials | 691,311,765 | — | — | — | 691,311,765 |
| Health Care | 386,136,949 | — | — | — | 386,136,949 |
| Industrials | 615,267,060 | — | — | — | 615,267,060 |
| Information Technology | 675,037,030 | — | — | — | 675,037,030 |
| Materials | 276,102,153 | — | — | — | 276,102,153 |
| Real Estate | 400,231,601 | — | — | — | 400,231,601 |
| Utilities | 184,647,573 | — | — | — | 184,647,573 |
| Total Common Stocks | 4,095,744,783 | — | — | — | 4,095,744,783 |
| Money Market Funds | — | — | — | 53,658,579 | 53,658,579 |
| Total Investments in Securities | 4,095,744,783 | — | — | 53,658,579 | 4,149,403,362 |
| Investments in Derivatives | | | | | |
| Asset | | | | | |
| Futures Contracts | 4,223,453 | — | — | — | 4,223,453 |
| Total | 4,099,968,236 | — | — | 53,658,579 | 4,153,626,815 |
See the Portfolio of Investments for all investment classifications not indicated in the table.
Derivative instruments are valued at unrealized appreciation (depreciation).
There were no transfers of financial assets between levels during the period.
The accompanying Notes to Financial Statements are an integral part of this statement.
| 16 | Columbia Mid Cap Index Fund | Annual Report 2019 |
Statement of Assets and Liabilities
February 28, 2019
| Assets | |
| Investments in securities, at value | |
| Unaffiliated issuers (cost $2,887,924,440) | $4,095,744,783 |
| Affiliated issuers (cost $53,658,579) | 53,658,579 |
| Margin deposits on: | |
| Futures contracts | 2,632,200 |
| Receivable for: | |
| Capital shares sold | 4,129,007 |
| Dividends | 4,381,067 |
| Expense reimbursement due from Investment Manager | 13,605 |
| Prepaid expenses | 7,343 |
| Total assets | 4,160,566,584 |
| Liabilities | |
| Payable for: | |
| Capital shares purchased | 5,431,762 |
| Variation margin for futures contracts | 260,010 |
| Management services fees | 22,865 |
| Distribution and/or service fees | 9,300 |
| Transfer agent fees | 549,438 |
| Compensation of board members | 203,948 |
| Compensation of chief compliance officer | 46 |
| Other expenses | 134,500 |
| Total liabilities | 6,611,869 |
| Net assets applicable to outstanding capital stock | $4,153,954,715 |
| Represented by | |
| Paid in capital | 2,896,781,352 |
| Total distributable earnings (loss) (Note 2) | 1,257,173,363 |
| Total - representing net assets applicable to outstanding capital stock | $4,153,954,715 |
| Class A | |
| Net assets | $1,351,152,789 |
| Shares outstanding | 87,342,559 |
| Net asset value per share | $15.47 |
| Institutional Class | |
| Net assets | $1,979,350,335 |
| Shares outstanding | 128,588,708 |
| Net asset value per share | $15.39 |
| Institutional 2 Class | |
| Net assets | $798,385,644 |
| Shares outstanding | 50,762,125 |
| Net asset value per share | $15.73 |
| Institutional 3 Class | |
| Net assets | $25,065,947 |
| Shares outstanding | 1,658,624 |
| Net asset value per share | $15.11 |
The accompanying Notes to Financial Statements are an integral part of this statement.
Columbia Mid Cap Index Fund | Annual Report 2019
| 17 |
Statement of Operations
Year Ended February 28, 2019
| Net investment income | |
| Income: | |
| Dividends — unaffiliated issuers | $68,858,872 |
| Dividends — affiliated issuers | 1,250,018 |
| Foreign taxes withheld | (38,135) |
| Total income | 70,070,755 |
| Expenses: | |
| Management services fees | 9,168,522 |
| Distribution and/or service fees | |
| Class A | 3,678,296 |
| Transfer agent fees | |
| Class A | 1,710,633 |
| Institutional Class | 2,548,804 |
| Institutional 2 Class | 547,865 |
| Institutional 3 Class | 2,024 |
| Compensation of board members | 68,284 |
| Custodian fees | 41,386 |
| Printing and postage fees | 191,426 |
| Registration fees | 133,017 |
| Licensing fees and expenses | 62,393 |
| Audit fees | 31,551 |
| Legal fees | 46,885 |
| Compensation of chief compliance officer | 976 |
| Other | 77,602 |
| Total expenses | 18,309,664 |
| Fees waived or expenses reimbursed by Investment Manager and its affiliates | (5,462,764) |
| Expense reduction | (81) |
| Total net expenses | 12,846,819 |
| Net investment income | 57,223,936 |
| Realized and unrealized gain (loss) — net | |
| Net realized gain (loss) on: | |
| Investments — unaffiliated issuers | 374,682,367 |
| Investments — affiliated issuers | 1,805 |
| Futures contracts | (553,522) |
| Net realized gain | 374,130,650 |
| Net change in unrealized appreciation (depreciation) on: | |
| Investments — unaffiliated issuers | (285,409,855) |
| Investments — affiliated issuers | 4,776 |
| Futures contracts | 4,336,004 |
| Net change in unrealized appreciation (depreciation) | (281,069,075) |
| Net realized and unrealized gain | 93,061,575 |
| Net increase in net assets resulting from operations | $150,285,511 |
The accompanying Notes to Financial Statements are an integral part of this statement.
| 18 | Columbia Mid Cap Index Fund | Annual Report 2019 |
Statement of Changes in Net Assets
| | Year Ended
February 28, 2019 | Year Ended
February 28, 2018(a) |
| Operations | | |
| Net investment income | $57,223,936 | $56,593,482 |
| Net realized gain | 374,130,650 | 322,793,734 |
| Net change in unrealized appreciation (depreciation) | (281,069,075) | 37,669,977 |
| Net increase in net assets resulting from operations | 150,285,511 | 417,057,193 |
| Distributions to shareholders | | |
| Net investment income and net realized gains | | |
| Class A | (112,473,667) | |
| Institutional Class | (171,180,770) | |
| Institutional 2 Class | (74,829,346) | |
| Institutional 3 Class | (1,466,207) | |
| Net investment income | | |
| Class A | | (15,689,626) |
| Institutional Class | | (27,906,013) |
| Institutional 2 Class | | (10,229,259) |
| Institutional 3 Class | | (10,432) |
| Net realized gains | | |
| Class A | | (101,046,210) |
| Institutional Class | | (144,173,204) |
| Institutional 2 Class | | (52,614,863) |
| Institutional 3 Class | | (49,389) |
| Total distributions to shareholders (Note 2) | (359,949,990) | (351,718,996) |
| Increase (decrease) in net assets from capital stock activity | (310,371,005) | 149,916,889 |
| Total increase (decrease) in net assets | (520,035,484) | 215,255,086 |
| Net assets at beginning of year | 4,673,990,199 | 4,458,735,113 |
| Net assets at end of year | $4,153,954,715 | $4,673,990,199 |
| Undistributed net investment income | $5,433,491 | $2,696,844 |
| (a) | Institutional 3 Class shares are based on operations from March 1, 2017 (commencement of operations) through the stated period end. |
The accompanying Notes to Financial Statements are an integral part of this statement.
Columbia Mid Cap Index Fund | Annual Report 2019
| 19 |
Statement of Changes in Net Assets (continued)
| | Year Ended | Year Ended |
| | February 28, 2019 | February 28, 2018(a) |
| | Shares | Dollars ($) | Shares | Dollars ($) |
| Capital stock activity |
| Class A | | | | |
| Subscriptions | 24,120,775 | 384,645,440 | 30,229,566 | 492,204,396 |
| Distributions reinvested | 6,162,434 | 91,963,935 | 5,878,106 | 95,515,430 |
| Redemptions | (37,890,405) | (608,338,512) | (40,965,908) | (670,689,221) |
| Net decrease | (7,607,196) | (131,729,137) | (4,858,236) | (82,969,395) |
| Class I | | | | |
| Redemptions | — | — | (168) | (2,642) |
| Net decrease | — | — | (168) | (2,642) |
| Institutional Class | | | | |
| Subscriptions | 27,366,724 | 432,869,133 | 31,487,247 | 508,737,176 |
| Distributions reinvested | 7,916,559 | 117,549,063 | 7,367,419 | 119,147,381 |
| Redemptions | (44,471,861) | (707,216,715) | (32,997,927) | (539,648,808) |
| Net increase (decrease) | (9,188,578) | (156,798,519) | 5,856,739 | 88,235,749 |
| Institutional 2 Class | | | | |
| Subscriptions | 18,580,954 | 306,142,993 | 19,974,966 | 332,757,167 |
| Distributions reinvested | 4,279,226 | 64,820,342 | 3,421,061 | 56,445,214 |
| Redemptions | (26,235,382) | (410,732,294) | (15,190,965) | (252,812,032) |
| Net increase (decrease) | (3,375,202) | (39,768,959) | 8,205,062 | 136,390,349 |
| Institutional 3 Class | | | | |
| Subscriptions | 1,296,683 | 20,300,162 | 526,581 | 8,560,137 |
| Distributions reinvested | 95,922 | 1,387,369 | 3,745 | 59,622 |
| Redemptions | (242,668) | (3,761,921) | (21,639) | (356,931) |
| Net increase | 1,149,937 | 17,925,610 | 508,687 | 8,262,828 |
| Total net increase (decrease) | (19,021,039) | (310,371,005) | 9,712,084 | 149,916,889 |
| (a) | Institutional 3 Class shares are based on operations from March 1, 2017 (commencement of operations) through the stated period end. |
The accompanying Notes to Financial Statements are an integral part of this statement.
| 20 | Columbia Mid Cap Index Fund | Annual Report 2019 |
[THIS PAGE INTENTIONALLY LEFT BLANK]
Columbia Mid Cap Index Fund | Annual Report 2019
| 21 |
The following table is intended to help you understand the Fund’s financial performance. Certain information reflects financial results for a single share of a class held for the periods shown. Per share net investment income (loss) amounts are calculated based on average shares outstanding during the period. Total return assumes reinvestment of all dividends and distributions, if any. Total return does not reflect payment of sales charges, if any. Total return and portfolio turnover are not annualized for periods of less than one year. The portfolio turnover rate is calculated without regard to purchase and sales transactions of short-term instruments and certain derivatives, if any. If such transactions were included, the Fund’s portfolio turnover rate may be higher.
| | Net asset value,
beginning of
period | Net
investment
income | Net
realized
and
unrealized
gain (loss) | Total from
investment
operations | Distributions
from net
investment
income | Distributions
from net
realized
gains | Total
distributions to
shareholders |
| Class A |
| Year Ended 2/28/2019 | $16.25 | 0.18 | 0.36 | 0.54 | (0.17) | (1.15) | (1.32) |
| Year Ended 2/28/2018 | $16.05 | 0.17 | 1.26 | 1.43 | (0.16) | (1.07) | (1.23) |
| Year Ended 2/28/2017 | $13.23 | 0.16 | 3.87 | 4.03 | (0.17) | (1.04) | (1.21) |
| Year Ended 2/29/2016 | $16.14 | 0.16 | (1.71) | (1.55) | (0.16) | (1.20) | (1.36) |
| Year Ended 2/28/2015 | $15.49 | 0.15 | 1.44 | 1.59 | (0.14) | (0.80) | (0.94) |
| Institutional Class |
| Year Ended 2/28/2019 | $16.18 | 0.22 | 0.35 | 0.57 | (0.21) | (1.15) | (1.36) |
| Year Ended 2/28/2018 | $15.99 | 0.21 | 1.25 | 1.46 | (0.20) | (1.07) | (1.27) |
| Year Ended 2/28/2017 | $13.18 | 0.20 | 3.85 | 4.05 | (0.20) | (1.04) | (1.24) |
| Year Ended 2/29/2016 | $16.09 | 0.20 | (1.71) | (1.51) | (0.20) | (1.20) | (1.40) |
| Year Ended 2/28/2015 | $15.43 | 0.19 | 1.45 | 1.64 | (0.18) | (0.80) | (0.98) |
| Institutional 2 Class |
| Year Ended 2/28/2019 | $16.50 | 0.22 | 0.37 | 0.59 | (0.21) | (1.15) | (1.36) |
| Year Ended 2/28/2018 | $16.28 | 0.22 | 1.27 | 1.49 | (0.20) | (1.07) | (1.27) |
| Year Ended 2/28/2017 | $13.41 | 0.20 | 3.91 | 4.11 | (0.20) | (1.04) | (1.24) |
| Year Ended 2/29/2016 | $16.34 | 0.20 | (1.73) | (1.53) | (0.20) | (1.20) | (1.40) |
| Year Ended 2/28/2015 | $15.66 | 0.19 | 1.47 | 1.66 | (0.18) | (0.80) | (0.98) |
| Institutional 3 Class |
| Year Ended 2/28/2019 | $15.91 | 0.22 | 0.34 | 0.56 | (0.21) | (1.15) | (1.36) |
| Year Ended 2/28/2018(d) | $16.00 | 0.21 | 0.97 | 1.18 | (0.20) | (1.07) | (1.27) |
| Notes to Financial Highlights |
| (a) | In addition to the fees and expenses that the Fund bears directly, the Fund indirectly bears a pro rata share of the fees and expenses of any other funds in which it invests. Such indirect expenses are not included in the Fund’s reported expense ratios. |
| (b) | Total net expenses include the impact of certain fee waivers/expense reimbursements made by the Investment Manager and certain of its affiliates, if applicable. |
| (c) | The benefits derived from expense reductions had an impact of less than 0.01%. |
| (d) | Institutional 3 Class shares commenced operations on March 1, 2017. Per share data and total return reflect activity from that date. |
The accompanying Notes to Financial Statements are an integral part of this statement.
| 22 | Columbia Mid Cap Index Fund | Annual Report 2019 |
Financial Highlights (continued)
| | Net
asset
value,
end of
period | Total
return | Total gross
expense
ratio to
average
net assets(a) | Total net
expense
ratio to
average
net assets(a),(b) | Net investment
income
ratio to
average
net assets | Portfolio
turnover | Net
assets,
end of
period
(000’s) |
| Class A |
| Year Ended 2/28/2019 | $15.47 | 3.66% | 0.58% | 0.45%(c) | 1.08% | 17% | $1,351,153 |
| Year Ended 2/28/2018 | $16.25 | 8.99% | 0.58% | 0.45%(c) | 1.05% | 23% | $1,543,057 |
| Year Ended 2/28/2017 | $16.05 | 31.10% | 0.61% | 0.45%(c) | 1.07% | 18% | $1,602,086 |
| Year Ended 2/29/2016 | $13.23 | (10.37%) | 0.66% | 0.45%(c) | 1.05% | 20% | $1,044,589 |
| Year Ended 2/28/2015 | $16.14 | 10.58% | 0.66% | 0.45%(c) | 0.96% | 13% | $1,067,529 |
| Institutional Class |
| Year Ended 2/28/2019 | $15.39 | 3.89% | 0.33% | 0.20%(c) | 1.33% | 17% | $1,979,350 |
| Year Ended 2/28/2018 | $16.18 | 9.22% | 0.33% | 0.20%(c) | 1.30% | 23% | $2,229,366 |
| Year Ended 2/28/2017 | $15.99 | 31.45% | 0.37% | 0.20%(c) | 1.32% | 18% | $2,108,834 |
| Year Ended 2/29/2016 | $13.18 | (10.18%) | 0.41% | 0.20%(c) | 1.29% | 20% | $1,736,596 |
| Year Ended 2/28/2015 | $16.09 | 10.95% | 0.41% | 0.20%(c) | 1.20% | 13% | $2,299,318 |
| Institutional 2 Class |
| Year Ended 2/28/2019 | $15.73 | 3.94% | 0.27% | 0.20% | 1.33% | 17% | $798,386 |
| Year Ended 2/28/2018 | $16.50 | 9.24% | 0.28% | 0.20% | 1.30% | 23% | $893,473 |
| Year Ended 2/28/2017 | $16.28 | 31.35% | 0.27% | 0.20% | 1.32% | 18% | $747,812 |
| Year Ended 2/29/2016 | $13.41 | (10.14%) | 0.26% | 0.20% | 1.29% | 20% | $506,524 |
| Year Ended 2/28/2015 | $16.34 | 10.92% | 0.26% | 0.20% | 1.21% | 13% | $618,948 |
| Institutional 3 Class |
| Year Ended 2/28/2019 | $15.11 | 3.89% | 0.23% | 0.20% | 1.38% | 17% | $25,066 |
| Year Ended 2/28/2018(d) | $15.91 | 7.47% | 0.22% | 0.20% | 1.33% | 23% | $8,094 |
The accompanying Notes to Financial Statements are an integral part of this statement.
Columbia Mid Cap Index Fund | Annual Report 2019
| 23 |
Notes to Financial Statements
February 28, 2019
Note 1. Organization
Columbia Mid Cap Index Fund (the Fund), a series of Columbia Funds Series Trust (the Trust), is a diversified fund. The Trust is registered under the Investment Company Act of 1940, as amended (the 1940 Act), as an open-end management investment company organized as a Delaware statutory trust.
Fund shares
The Trust may issue an unlimited number of shares (without par value). Although all share classes generally have identical voting, dividend and liquidation rights, each share class votes separately when required by the Trust’s organizational documents or by law. Different share classes pay different distribution amounts to the extent the expenses of such share classes differ, and distributions in liquidation will be proportional to the net asset value of each share class. Each share class has its own expense and sales charge structure. The Fund offers each of the share classes identified below.
Class A shares are not subject to any front-end sales charge or contingent deferred sales charge.
Institutional Class shares are not subject to sales charges and are generally available only to eligible investors, which are subject to different investment minimums as described in the Fund’s prospectus.
Institutional 2 Class shares are not subject to sales charges and are generally available only to investors purchasing through authorized investment professionals and omnibus retirement plans as described in the Fund’s prospectus.
Institutional 3 Class shares are not subject to sales charges and are available to institutional and certain other investors as described in the Fund’s prospectus.
Note 2. Summary of significant accounting policies
Basis of preparation
The Fund is an investment company that applies the accounting and reporting guidance in the Financial Accounting Standards Board (FASB) Accounting Standards Codification Topic 946,Financial Services - Investment Companies (ASC 946). The financial statements are prepared in accordance with U.S. generally accepted accounting principles (GAAP), which requires management to make certain estimates and assumptions that affect the reported amounts of assets and liabilities, the disclosure of contingent assets and liabilities at the date of the financial statements and the reported amounts of income and expenses during the reporting period. Actual results could differ from those estimates.
The following is a summary of significant accounting policies followed by the Fund in the preparation of its financial statements.
Security valuation
All equity securities are valued at the close of business of the New York Stock Exchange. Equity securities are valued at the last quoted sales price on the principal exchange or market on which they trade, except for securities traded on the NASDAQ Stock Market, which are valued at the NASDAQ official close price. Unlisted securities or listed securities for which there were no sales during the day are valued at the mean of the latest quoted bid and ask prices on such exchanges or markets.
Foreign equity securities are valued based on the closing price on the foreign exchange in which such securities are primarily traded. If any foreign equity security closing prices are not readily available, the securities are valued at the mean of the latest quoted bid and ask prices on such exchanges or markets. Foreign currency exchange rates are generally determined at 4:00 p.m. Eastern (U.S.) time. Many securities markets and exchanges outside the U.S. close prior to the close of the New York Stock Exchange; therefore, the closing prices for securities in such markets or on such exchanges may not fully reflect events that occur after such close but before the close of the New York Stock Exchange. In those situations, foreign securities will be fair valued pursuant to a policy adopted by the Board of Trustees, including, if available, utilizing a third party pricing service to determine these fair values. The third party pricing service takes into account multiple factors, including, but not limited to, movements in the U.S. securities markets, certain depositary receipts, futures contracts and foreign exchange
| 24 | Columbia Mid Cap Index Fund | Annual Report 2019 |
Notes to Financial Statements (continued)
February 28, 2019
rates that have occurred subsequent to the close of the foreign exchange or market, to determine a good faith estimate that reasonably reflects the current market conditions as of the close of the New York Stock Exchange. The fair value of a security is likely to be different from the quoted or published price, if available.
Investments in open-end investment companies, including money market funds, are valued at their latest net asset value.
Futures and options on futures contracts are valued based upon the settlement price at the close of regular trading on their principal exchanges or, in the absence of transactions, at the mean of the latest quoted bid and ask prices.
Investments for which market quotations are not readily available, or that have quotations which management believes are not reflective of market value or reliable, are valued at fair value as determined in good faith under procedures approved by and under the general supervision of the Board of Trustees. If a security or class of securities (such as foreign securities) is valued at fair value, such value is likely to be different from the quoted or published price for the security.
The determination of fair value often requires significant judgment. To determine fair value, management may use assumptions including but not limited to future cash flows and estimated risk premiums. Multiple inputs from various sources may be used to determine fair value.
GAAP requires disclosure regarding the inputs and valuation techniques used to measure fair value and any changes in valuation inputs or techniques. In addition, investments shall be disclosed by major category. This information is disclosed following the Fund’s Portfolio of Investments.
Derivative instruments
The Fund invests in certain derivative instruments, as detailed below, to meet its investment objectives. Derivatives are instruments whose values depend on, or are derived from, in whole or in part, the value of one or more securities, currencies, commodities, indices, or other assets or instruments. Derivatives may be used to increase investment flexibility (including to maintain cash reserves while maintaining desired exposure to certain assets), for risk management (hedging) purposes, to facilitate trading, to reduce transaction costs and to pursue higher investment returns. The Fund may also use derivative instruments to mitigate certain investment risks, such as foreign currency exchange rate risk, interest rate risk and credit risk. Derivatives may involve various risks, including the potential inability of the counterparty to fulfill its obligations under the terms of the contract, the potential for an illiquid secondary market (making it difficult for the Fund to sell or terminate, including at favorable prices) and the potential for market movements which may expose the Fund to gains or losses in excess of the amount shown in the Statement of Assets and Liabilities. The notional amounts of derivative instruments, if applicable, are not recorded in the financial statements.
A derivative instrument may suffer a marked-to-market loss if the value of the contract decreases due to an unfavorable change in the market rates or values of the underlying instrument. Losses can also occur if the counterparty does not perform its obligations under the contract. The Fund’s risk of loss from counterparty credit risk on over-the-counter derivatives is generally limited to the aggregate unrealized gain netted against any collateral held by the Fund and the amount of any variation margin held by the counterparty, plus any replacement costs or related amounts. With exchange-traded or centrally cleared derivatives, there is reduced counterparty credit risk to the Fund since the clearinghouse or central counterparty (CCP) provides some protection in the case of clearing member default. The clearinghouse or CCP stands between the buyer and the seller of the contract; therefore, additional counterparty credit risk is failure of the clearinghouse or CCP. However, credit risk still exists in exchange-traded or centrally cleared derivatives with respect to initial and variation margin that is held in a broker’s customer account. While brokers are required to segregate customer margin from their own assets, in the event that a broker becomes insolvent or goes into bankruptcy and at that time there is a shortfall in the aggregate amount of margin held by the broker for all its clients, U.S. bankruptcy laws will typically allocate that shortfall on a pro-rata basis across all the broker’s customers (including the Fund), potentially resulting in losses to the Fund.
In order to better define its contractual rights and to secure rights that will help the Fund mitigate its counterparty risk, the Fund may enter into an International Swaps and Derivatives Association, Inc. Master Agreement (ISDA Master Agreement) or similar agreement with its derivatives contract counterparties. An ISDA Master Agreement is an agreement between the Fund and a counterparty that governs over-the-counter derivatives and typically contains, among other things, collateral posting terms and netting provisions in the event of a default and/or termination event. Under an ISDA Master Agreement, the Fund
Columbia Mid Cap Index Fund | Annual Report 2019
| 25 |
Notes to Financial Statements (continued)
February 28, 2019
may, under certain circumstances, offset with the counterparty certain derivative instrument’s payables and/or receivables with collateral held and/or posted and create one single net payment. The provisions of the ISDA Master Agreement typically permit a single net payment in the event of default (close-out netting), including the bankruptcy or insolvency of the counterparty. Note, however, that bankruptcy or insolvency laws of a particular jurisdiction may impose restrictions on or prohibitions against the right of offset or netting in bankruptcy, insolvency or other events.
Collateral (margin) requirements differ by type of derivative. Margin requirements are established by the clearinghouse or CCP for exchange-traded and centrally cleared derivatives. Brokers can ask for margin in excess of the minimum in certain circumstances. Collateral terms are contract specific for over-the-counter derivatives. For over-the-counter derivatives traded under an ISDA Master Agreement, the collateral requirements are typically calculated by netting the marked-to-market amount for each transaction under such agreement and comparing that amount to the value of any variation margin currently pledged by the Fund and/or the counterparty. Generally, the amount of collateral due from or to a party has to exceed a minimum transfer amount threshold (e.g., $250,000) before a transfer has to be made. To the extent amounts due to the Fund from its counterparties are not fully collateralized, contractually or otherwise, the Fund bears the risk of loss from counterparty nonperformance. The Fund may also pay interest expense on cash collateral received from the broker. Any interest expense paid by the Fund is shown on the Statement of Operations. The Fund attempts to mitigate counterparty risk by only entering into agreements with counterparties that it believes have the financial resources to honor their obligations and by monitoring the financial stability of those counterparties.
Certain ISDA Master Agreements allow counterparties of over-the-counter derivatives transactions to terminate derivatives contracts prior to maturity in the event the Fund’s net asset value declines by a stated percentage over a specified time period or if the Fund fails to meet certain terms of the ISDA Master Agreement, which would cause the Fund to accelerate payment of any net liability owed to the counterparty. The Fund also has termination rights if the counterparty fails to meet certain terms of the ISDA Master Agreement. In determining whether to exercise such termination rights, the Fund would consider, in addition to counterparty credit risk, whether termination would result in a net liability owed from the counterparty.
For financial reporting purposes, the Fund does not offset derivative assets and derivative liabilities that are subject to netting arrangements in the Statement of Assets and Liabilities.
Futures contracts
Futures contracts are exchange-traded and represent commitments for the future purchase or sale of an asset at a specified price on a specified date. The Fund bought and sold futures contracts to maintain appropriate equity market exposure while keeping sufficient cash to accommodate daily redemptions. These instruments may be used for other purposes in future periods. Upon entering into futures contracts, the Fund bears risks that it may not achieve the anticipated benefits of the futures contracts and may realize a loss. Additional risks include counterparty credit risk, the possibility of an illiquid market, and that a change in the value of the contract or option may not correlate with changes in the value of the underlying asset.
Upon entering into a futures contract, the Fund deposits cash or securities with the broker, known as a futures commission merchant (FCM), in an amount sufficient to meet the initial margin requirement. The initial margin deposit must be maintained at an established level over the life of the contract. Cash deposited as initial margin is recorded in the Statement of Assets and Liabilities as margin deposits. Securities deposited as initial margin are designated in the Portfolio of Investments. Subsequent payments (variation margin) are made or received by the Fund each day. The variation margin payments are equal to the daily change in the contract value and are recorded as variation margin receivable or payable and are offset in unrealized gains or losses. The Fund recognizes a realized gain or loss when the contract is closed or expires. Futures contracts involve, to varying degrees, risk of loss in excess of the variation margin disclosed in the Statement of Assets and Liabilities.
Effects of derivative transactions in the financial statements
The following tables are intended to provide additional information about the effect of derivatives on the financial statements of the Fund, including: the fair value of derivatives by risk category and the location of those fair values in the Statement of Assets and Liabilities; and the impact of derivative transactions over the period in the Statement of Operations, including realized and unrealized gains (losses). The derivative instrument schedules following the Portfolio of Investments present additional information regarding derivative instruments outstanding at the end of the period, if any.
| 26 | Columbia Mid Cap Index Fund | Annual Report 2019 |
Notes to Financial Statements (continued)
February 28, 2019
The following table is a summary of the fair value of derivative instruments (not considered to be hedging instruments for accounting disclosure purposes) at February 28, 2019:
| | Asset derivatives | |
Risk exposure
category | Statement
of assets and liabilities
location | Fair value ($) |
| Equity risk | Component of total distributable earnings (loss) — unrealized appreciation on futures contracts | 4,223,453* |
| * | Includes cumulative appreciation (depreciation) as reported in the tables following the Portfolio of Investments. Only the current day’s variation margin is reported in receivables or payables in the Statement of Assets and Liabilities. |
The following table indicates the effect of derivative instruments (not considered to be hedging instruments for accounting disclosure purposes) in the Statement of Operations for the year ended February 28, 2019:
| Amount of realized gain (loss) on derivatives recognized in income |
| Risk exposure category | Futures
contracts
($) |
| Equity risk | (553,522) |
| |
| Change in unrealized appreciation (depreciation) on derivatives recognized in income |
| Risk exposure category | Futures
contracts
($) |
| Equity risk | 4,336,004 |
The following table is a summary of the average outstanding volume by derivative instrument for the year ended February 28, 2019:
| Derivative instrument | Average notional
amounts ($)* |
| Futures contracts — long | 92,400,223 |
| * | Based on the ending quarterly outstanding amounts for the year ended February 28, 2019. |
Security transactions
Security transactions are accounted for on the trade date. Cost is determined and gains (losses) are based upon the specific identification method for both financial statement and federal income tax purposes.
Income recognition
Corporate actions and dividend income are generally recorded net of any non-reclaimable tax withholdings, on the ex-dividend date or upon receipt of ex-dividend notification in the case of certain foreign securities.
The Fund may receive distributions from holdings in equity securities, business development companies (BDCs), exchange-traded funds (ETFs), limited partnerships (LPs), other regulated investment companies (RICs), and real estate investment trusts (REITs), which report information on the tax character of their distributions annually. These distributions are allocated to dividend income, capital gain and return of capital based on actual information reported. Return of capital is recorded as a reduction of the cost basis of securities held. If the Fund no longer owns the applicable securities, return of capital is recorded as a realized gain. With respect to REITs, to the extent actual information has not yet been reported, estimates for return of capital are made by the Fund’s management. Management’s estimates are subsequently adjusted when the actual character of the distributions is disclosed by the REITs, which could result in a proportionate change in return of capital to shareholders.
Awards from class action litigation are recorded as a reduction of cost basis if the Fund still owns the applicable securities on the payment date. If the Fund no longer owns the applicable securities, the proceeds are recorded as realized gains.
Columbia Mid Cap Index Fund | Annual Report 2019
| 27 |
Notes to Financial Statements (continued)
February 28, 2019
Expenses
General expenses of the Trust are allocated to the Fund and other funds of the Trust based upon relative net assets or other expense allocation methodologies determined by the nature of the expense. Expenses directly attributable to the Fund are charged to the Fund. Expenses directly attributable to a specific class of shares are charged to that share class.
Determination of class net asset value
All income, expenses (other than class-specific expenses, which are charged to that share class, as shown in the Statement of Operations) and realized and unrealized gains (losses) are allocated to each class of the Fund on a daily basis, based on the relative net assets of each class, for purposes of determining the net asset value of each class.
Federal income tax status
The Fund intends to qualify each year as a regulated investment company under Subchapter M of the Internal Revenue Code, as amended, and will distribute substantially all of its investment company taxable income and net capital gain, if any, for its tax year, and as such will not be subject to federal income taxes. In addition, the Fund intends to distribute in each calendar year substantially all of its ordinary income, capital gain net income and certain other amounts, if any, such that the Fund should not be subject to federal excise tax. Therefore, no federal income or excise tax provision is recorded.
Foreign taxes
The Fund may be subject to foreign taxes on income, gains on investments or currency repatriation, a portion of which may be recoverable. The Fund will accrue such taxes and recoveries, as applicable, based upon its current interpretation of tax rules and regulations that exist in the markets in which it invests.
Realized gains in certain countries may be subject to foreign taxes at the Fund level, based on statutory rates. The Fund accrues for such foreign taxes on realized and unrealized gains at the appropriate rate for each jurisdiction, as applicable. The amount, if any, is disclosed as a liability on the Statement of Assets and Liabilities.
Distributions to shareholders
Distributions from net investment income, if any, are declared and paid semi-annually. Net realized capital gains, if any, are distributed at least annually. Income distributions and capital gain distributions are determined in accordance with federal income tax regulations, which may differ from GAAP.
Guarantees and indemnifications
Under the Trust’s organizational documents and, in some cases, by contract, its officers and trustees are indemnified against certain liabilities arising out of the performance of their duties to the Trust or its funds. In addition, certain of the Fund’s contracts with its service providers contain general indemnification clauses. The Fund’s maximum exposure under these arrangements is unknown since the amount of any future claims that may be made against the Fund cannot be determined, and the Fund has no historical basis for predicting the likelihood of any such claims.
Recent accounting pronouncements
Accounting Standards Update 2017-08 Premium Amortization on Purchased Callable Debt Securities
In March 2017, the Financial Accounting Standards Board issued Accounting Standards Update (ASU) No. 2017-08 Premium Amortization on Purchased Callable Debt Securities. ASU No. 2017-08 updates the accounting standards to shorten the amortization period for certain purchased callable debt securities, held at a premium, to be amortized to the earliest call date. The update applies to securities with explicit, noncontingent call features that are callable at fixed prices and on preset dates. The standard is effective for annual periods beginning after December 15, 2018 and interim periods within those fiscal years. Management does not expect the implementation of this guidance to have a material impact on the financial statement amounts and footnote disclosures.
Accounting Standards Update 2018-13 Disclosure Framework - Changes to the Disclosure Requirements for Fair Value Measurement
| 28 | Columbia Mid Cap Index Fund | Annual Report 2019 |
Notes to Financial Statements (continued)
February 28, 2019
In August 2018, the Financial Accounting Standards Board issued Accounting Standards Update (ASU) No. 2018-13 Disclosure Framework - Changes to the Disclosure Requirements for Fair Value Measurement. ASU No. 2018-13, in addition to other modifications and additions, removes the requirement to disclose the amount and reasons for transfers between Level 1 and Level 2 of the fair value hierarchy and the policy for the timing of transfers between levels. The standard is effective for annual periods beginning after December 15, 2019 and interim periods within those fiscal years. At this time, management is evaluating the implication of this guidance and the impact it will have on the financial statement disclosures, if any.
Disclosure Update and Simplification
In September 2018, the Securities and Exchange Commission (SEC) released Final Rule 33-10532, Disclosure Update and Simplification, which amends certain financial statement disclosure requirements that the SEC determined to be redundant, outdated, or superseded in light of other SEC disclosure requirements, GAAP, or changes in the information environment. As a result of the amendments, management implemented disclosure changes which included removing the components of distributable earnings presented on the Statement of Assets and Liabilities and combining income and gain distributions paid to shareholders as presented on the Statement of Changes in Net Assets. Any values presented to meet prior year requirements were left unchanged. The amendments had no effect on the Fund’s net assets or results of operation.
Note 3. Fees and other transactions with affiliates
Management services fees
The Fund has entered into a Management Agreement with Columbia Management Investment Advisers, LLC (the Investment Manager), a wholly-owned subsidiary of Ameriprise Financial, Inc. (Ameriprise Financial). Under the Management Agreement, the Investment Manager provides the Fund with investment research and advice, as well as administrative and accounting services. The management services fee is an annual fee that is equal to 0.20% of the Fund’s daily net assets.
Compensation of board members
Members of the Board of Trustees who are not officers or employees of the Investment Manager or Ameriprise Financial are compensated for their services to the Fund as disclosed in the Statement of Operations. Under a Deferred Compensation Plan (the Deferred Plan), these members of the Board of Trustees may elect to defer payment of up to 100% of their compensation. Deferred amounts are treated as though equivalent dollar amounts had been invested in shares of certain funds managed by the Investment Manager. The Fund’s liability for these amounts is adjusted for market value changes and remains in the Fund until distributed in accordance with the Deferred Plan. All amounts payable under the Deferred Plan constitute a general unsecured obligation of the Fund.
Compensation of Chief Compliance Officer
The Board of Trustees has appointed a Chief Compliance Officer to the Fund in accordance with federal securities regulations. As disclosed in the Statement of Operations, a portion of the Chief Compliance Officer’s total compensation is allocated to the Fund, along with other allocations to affiliated registered investment companies managed by the Investment Manager and its affiliates, based on relative net assets.
Transfer agency fees
Under a Transfer and Dividend Disbursing Agent Agreement, Columbia Management Investment Services Corp. (the Transfer Agent), an affiliate of the Investment Manager and a wholly-owned subsidiary of Ameriprise Financial, is responsible for providing transfer agency services to the Fund. The Transfer Agent has contracted with DST Asset Manager Solutions, Inc. (DST) to serve as sub-transfer agent. The Transfer Agent pays the fees of DST for services as sub-transfer agent and DST is not entitled to reimbursement for such fees from the Fund (with the exception of out-of-pocket fees).
The Fund pays the Transfer Agent a monthly transfer agency fee based on the number or the average value of accounts, depending on the type of account. In addition, the Fund pays the Transfer Agent a fee for shareholder services based on the number of accounts or on a percentage of the average aggregate value of the Fund’s shares maintained in omnibus accounts up to the lesser of the amount charged by the financial intermediary or a cap established by the Board of Trustees from time to time.
Columbia Mid Cap Index Fund | Annual Report 2019
| 29 |
Notes to Financial Statements (continued)
February 28, 2019
The Transfer Agent also receives compensation from the Fund for various shareholder services and reimbursements for certain out-of-pocket fees. Total transfer agency fees for Institutional 2 Class and Institutional 3 Class shares are subject to an annual limitation of not more than 0.07% and 0.02%, respectively, of the average daily net assets attributable to each share class.
For the year ended February 28, 2019, the Fund’s effective transfer agency fee rates as a percentage of average daily net assets of each class were as follows:
| | Effective rate (%) |
| Class A | 0.12 |
| Institutional Class | 0.12 |
| Institutional 2 Class | 0.06 |
| Institutional 3 Class | 0.01 |
An annual minimum account balance fee of $20 may apply to certain accounts with a value below the applicable share class’s initial minimum investment requirements to reduce the impact of small accounts on transfer agency fees. These minimum account balance fees are remitted to the Fund and recorded as part of expense reductions in the Statement of Operations. For the year ended February 28, 2019, these minimum account balance fees reduced total expenses of the Fund by $81.
Distribution and service fees
The Fund has entered into an agreement with Columbia Management Investment Distributors, Inc. (the Distributor), an affiliate of the Investment Manager and a wholly-owned subsidiary of Ameriprise Financial, for distribution and shareholder services. The Board of Trustees has approved, and the Fund has adopted, distribution and shareholder service plans (the Plans) applicable to certain share classes, which set the distribution and service fees for the Fund. These fees are calculated daily and are intended to compensate the Distributor and/or eligible selling and/or servicing agents for selling shares of the Fund and providing services to investors.
Under the Plans, the Fund pays a monthly combined distribution and service fee to the Distributor at the maximum annual rate of 0.25% of the average daily net assets attributable to Class A shares of the Fund.
Expenses waived/reimbursed by the Investment Manager and its affiliates
The Investment Manager and certain of its affiliates have contractually agreed to waive fees and/or reimburse expenses (excluding certain fees and expenses described below) for the period(s) disclosed below, unless sooner terminated at the sole discretion of the Board of Trustees, so that the Fund’s net operating expenses, after giving effect to fees waived/expenses reimbursed and any balance credits and/or overdraft charges from the Fund’s custodian, do not exceed the following annual rate(s) as a percentage of the class’ average daily net assets:
| | Fee rate(s) contractual
through
June 30, 2019 |
| Class A | 0.45% |
| Institutional Class | 0.20 |
| Institutional 2 Class | 0.20 |
| Institutional 3 Class | 0.20 |
Under the agreement governing these fee waivers and/or expense reimbursement arrangements, the following fees and expenses are excluded from the waiver/reimbursement commitment, and therefore will be paid by the Fund, if applicable: taxes (including foreign transaction taxes), expenses associated with investments in affiliated and non-affiliated pooled investment vehicles (including mutual funds and exchange-traded funds), transaction costs and brokerage commissions, costs related to any securities lending program, dividend expenses associated with securities sold short, inverse floater program fees and expenses, transaction charges and interest on borrowed money, interest, infrequent and/or unusual expenses and any other expenses the exclusion of which is specifically approved by the Board of Trustees. This
| 30 | Columbia Mid Cap Index Fund | Annual Report 2019 |
Notes to Financial Statements (continued)
February 28, 2019
agreement may be modified or amended only with approval from the Investment Manager, certain of its affiliates and the Fund. Any fees waived and/or expenses reimbursed under the expense reimbursement arrangements described above are not recoverable by the Investment Manager or its affiliates in future periods.
Note 4. Federal tax information
The timing and character of income and capital gain distributions are determined in accordance with income tax regulations, which may differ from GAAP because of temporary or permanent book to tax differences.
At February 28, 2019, these differences were primarily due to differing treatment for deferral/reversal of wash sale losses, derivative investments, post-October capital losses, trustees’ deferred compensation, distribution reclassifications and earnings and profits distributed to shareholders on the redemption of shares. To the extent these differences were permanent, reclassifications were made among the components of the Fund’s net assets. Temporary differences do not require reclassifications.
The following reclassifications were made:
Undistributed net
investment
income ($) | Accumulated
net realized
gain ($) | Paid in
capital ($) |
| (3,446,365) | (41,296,649) | 44,743,014 |
Net investment income (loss) and net realized gains (losses), as disclosed in the Statement of Operations, and net assets were not affected by this reclassification.
The tax character of distributions paid during the years indicated was as follows:
| Year Ended February 28, 2019 | Year Ended February 28, 2018 |
Ordinary
income ($) | Long-term
capital gains ($) | Total ($) | Ordinary
income ($) | Long-term
capital gains ($) | Total ($) |
| 65,783,290 | 294,166,700 | 359,949,990 | 55,884,572 | 295,834,424 | 351,718,996 |
Short-term capital gain distributions, if any, are considered ordinary income distributions for tax purposes.
At February 28, 2019, the components of distributable earnings on a tax basis were as follows:
Undistributed
ordinary income ($) | Undistributed
long-term
capital gains ($) | Capital loss
carryforwards ($) | Net unrealized
appreciation ($) |
| 5,632,578 | 76,384,967 | — | 1,192,780,851 |
At February 28, 2019, the cost of all investments for federal income tax purposes along with the aggregate gross unrealized appreciation and depreciation based on that cost was:
Federal
tax cost ($) | Gross unrealized
appreciation ($) | Gross unrealized
(depreciation) ($) | Net unrealized
appreciation ($) |
| 2,960,845,964 | 1,439,406,995 | (246,626,144) | 1,192,780,851 |
Tax cost of investments and unrealized appreciation/(depreciation) may also include timing differences that do not constitute adjustments to tax basis.
Under current tax rules, regulated investment companies can elect to treat certain late-year ordinary losses incurred and post-October capital losses (capital losses realized after October 31) as arising on the first day of the following taxable year. As of February 28, 2019, the Fund will elect to treat the following late-year ordinary losses and post-October capital losses as arising on March 1, 2019.
Columbia Mid Cap Index Fund | Annual Report 2019
| 31 |
Notes to Financial Statements (continued)
February 28, 2019
Late year
ordinary losses ($) | Post-October
capital losses ($) |
| — | 17,425,946 |
Management of the Fund has concluded that there are no significant uncertain tax positions in the Fund that would require recognition in the financial statements. However, management’s conclusion may be subject to review and adjustment at a later date based on factors including, but not limited to, new tax laws, regulations, and administrative interpretations (including relevant court decisions). Generally, the Fund’s federal tax returns for the prior three fiscal years remain subject to examination by the Internal Revenue Service.
Note 5. Portfolio information
The cost of purchases and proceeds from sales of securities, excluding short-term investments and derivatives, if any, aggregated to $749,515,425 and $1,344,398,852, respectively, for the year ended February 28, 2019. The amount of purchase and sale activity impacts the portfolio turnover rate reported in the Financial Highlights.
Note 6. Affiliated money market fund
The Fund invests in Columbia Short-Term Cash Fund, an affiliated money market fund established for the exclusive use by the Fund and other affiliated funds (the Affiliated MMF). The income earned by the Fund from such investments is included as Dividends - affiliated issuers in the Statement of Operations. As an investing fund, the Fund indirectly bears its proportionate share of the expenses of the Affiliated MMF. The Affiliated MMF prices its shares with a floating net asset value. In addition, the Board of Trustees of the Affiliated MMF may impose a fee on redemptions (sometimes referred to as a liquidity fee) or temporarily suspend redemptions (sometimes referred to as imposing a redemption gate) in the event its liquidity falls below regulatory limits.
Note 7. Interfund lending
Pursuant to an exemptive order granted by the Securities and Exchange Commission, the Fund participates in a program (the Interfund Program) allowing each participating Columbia Fund (each, a Participating Fund) to lend money directly to and, except for closed-end funds and money market funds, borrow money directly from other Participating Funds for temporary purposes. The amounts eligible for borrowing and lending under the Interfund Program are subject to certain restrictions.
Interfund loans are subject to the risk that the borrowing fund could be unable to repay the loan when due, and a delay in repayment to the lending fund could result in lost opportunities and/or additional lending costs. The exemptive order is subject to conditions intended to mitigate conflicts of interest arising from the Investment Manager’s relationship with each Participating Fund.
The Fund did not borrow or lend money under the Interfund Program during the year ended February 28, 2019.
Note 8. Line of credit
The Fund has access to a revolving credit facility with a syndicate of banks led by Citibank, N.A., HSBC Bank USA, N.A. and JPMorgan Chase Bank, N.A. whereby the Fund may borrow for the temporary funding of shareholder redemptions or for other temporary or emergency purposes. The credit facility, which is a collective agreement between the Fund and certain other funds managed by the Investment Manager or an affiliated investment manager, severally and not jointly, permits collective borrowings up to $1 billion. Interest is charged to each participating fund based on its borrowings at a rate equal to the higher of (i) the federal funds effective rate, (ii) the one-month LIBOR rate and (iii) the overnight bank funding rate, plus in each case, 1.00%. Each borrowing under the credit facility matures no later than 60 days after the date of borrowing. The Fund also pays a commitment fee equal to its pro rata share of the unused amount of the credit facility at a rate of 0.15% per annum. The commitment fee is included in other expenses in the Statement of Operations. This agreement expires annually in December unless extended or renewed.
The Fund had no borrowings during the year ended February 28, 2019.
| 32 | Columbia Mid Cap Index Fund | Annual Report 2019 |
Notes to Financial Statements (continued)
February 28, 2019
Note 9. Significant risks
Shareholder concentration risk
At February 28, 2019, one unaffiliated shareholder of record owned 21.9% of the outstanding shares of the Fund in one or more accounts. The Fund has no knowledge about whether any portion of those shares was owned beneficially. Subscription and redemption activity by concentrated accounts may have a significant effect on the operations of the Fund. In the case of a large redemption, the Fund may be forced to sell investments at inopportune times, including its liquid positions, which may result in Fund losses and the Fund holding a higher percentage of less liquid positions. Large redemptions could result in decreased economies of scale and increased operating expenses for non-redeeming Fund shareholders.
Note 10. Subsequent events
Management has evaluated the events and transactions that have occurred through the date the financial statements were issued and noted no items requiring adjustment of the financial statements or additional disclosure.
Note 11. Information regarding pending and settled legal proceedings
Ameriprise Financial and certain of its affiliates have historically been involved in a number of legal, arbitration and regulatory proceedings, including routine litigation, class actions, and governmental actions, concerning matters arising in connection with the conduct of their business activities. Ameriprise Financial believes that the Fund is not currently the subject of, and that neither Ameriprise Financial nor any of its affiliates are the subject of, any pending legal, arbitration or regulatory proceedings that are likely to have a material adverse effect on the Fund or the ability of Ameriprise Financial or its affiliates to perform under their contracts with the Fund. Ameriprise Financial is required to make quarterly (10-Q), annual (10-K) and, as necessary, 8-K filings with the Securities and Exchange Commission (SEC) on legal and regulatory matters that relate to Ameriprise Financial and its affiliates. Copies of these filings may be obtained by accessing the SEC website at www.sec.gov.
There can be no assurance that these matters, or the adverse publicity associated with them, will not result in increased Fund redemptions, reduced sale of Fund shares or other adverse consequences to the Fund. Further, although we believe proceedings are not likely to have a material adverse effect on the Fund or the ability of Ameriprise Financial or its affiliates to perform under their contracts with the Fund, these proceedings are subject to uncertainties and, as such, we are unable to estimate the possible loss or range of loss that may result. An adverse outcome in one or more of these proceedings could result in adverse judgments, settlements, fines, penalties or other relief that could have a material adverse effect on the consolidated financial condition or results of operations of Ameriprise Financial.
Columbia Mid Cap Index Fund | Annual Report 2019
| 33 |
Report of Independent Registered Public Accounting Firm
To the Board of Trustees of Columbia Funds Series Trust and Shareholders of Columbia Mid Cap Index Fund
Opinion on the Financial Statements
We have audited the accompanying statement of assets and liabilities, including the portfolio of investments, of Columbia Mid Cap Index Fund (one of the funds constituting Columbia Funds Series Trust, referred to hereafter as the "Fund") as of February 28, 2019, the related statement of operations for the year ended February 28, 2019, the statement of changes in net assets for each of the two years in the period ended February 28, 2019, including the related notes, and the financial highlights for each of the periods indicated therein (collectively referred to as the “financial statements”). In our opinion, the financial statements present fairly, in all material respects, the financial position of the Fund as of February 28, 2019, the results of its operations for the year then ended, the changes in its net assets for each of the two years in the period ended February 28, 2019 and the financial highlights for each of the periods indicated therein in conformity with accounting principles generally accepted in the United States of America.
Basis for Opinion
These financial statements are the responsibility of the Fund’s management. Our responsibility is to express an opinion on the Fund’s financial statements based on our audits. We are a public accounting firm registered with the Public Company Accounting Oversight Board (United States) (PCAOB) and are required to be independent with respect to the Fund in accordance with the U.S. federal securities laws and the applicable rules and regulations of the Securities and Exchange Commission and the PCAOB.
We conducted our audits of these financial statements in accordance with the standards of the PCAOB. Those standards require that we plan and perform the audit to obtain reasonable assurance about whether the financial statements are free of material misstatement, whether due to error or fraud.
Our audits included performing procedures to assess the risks of material misstatement of the financial statements, whether due to error or fraud, and performing procedures that respond to those risks. Such procedures included examining, on a test basis, evidence regarding the amounts and disclosures in the financial statements. Our audits also included evaluating the accounting principles used and significant estimates made by management, as well as evaluating the overall presentation of the financial statements. Our procedures included confirmation of securities owned as of February 28, 2019 by correspondence with the custodian, transfer agent and brokers. We believe that our audits provide a reasonable basis for our opinion.
/s/PricewaterhouseCoopers LLP
Minneapolis, Minnesota
April 22, 2019
We have served as the auditor of one or more investment companies within the Columbia Funds Complex since 1977.
| 34 | Columbia Mid Cap Index Fund | Annual Report 2019 |
Federal Income Tax Information
(Unaudited)
The Fund hereby designates the following tax attributes for the fiscal year ended February 28, 2019. Shareholders will be notified in early 2020 of the amounts for use in preparing 2019 income tax returns.
Qualified
dividend
income | Dividends
received
deduction | Capital
gain
dividend |
| 75.75% | 74.42% | $394,427,753 |
Qualified dividend income. For taxable, non-corporate shareholders, the percentage of ordinary income distributed during the fiscal year that represents qualified dividend income subject to reduced tax rates.
Dividends received deduction. The percentage of ordinary income distributed during the fiscal year that qualifies for the corporate dividends received deduction.
Capital gain dividend. The Fund designates as a capital gain dividend the amount reflected above, or if subsequently determined to be different, the net capital gain of such fiscal period.
Columbia Mid Cap Index Fund | Annual Report 2019
| 35 |
Shareholders elect the Board that oversees the Fund’s operations. The Board appoints officers who are responsible for day-to-day business decisions based on policies set by the Board. The following table provides basic biographical information about the Fund’s Trustees as of the printing of this report, including their principal occupations during the past five years, although specific titles for individuals may have varied over the period. Under current Board policy, Trustees not affiliated with the Investment Manager generally may serve through the end of the calendar year in which they reach the mandatory retirement age established by the Board.
Independent trustees
Name,
address,
year of birth | Position held
with the Trust and
length of service | Principal occupation(s)
during past five years
and other relevant
professional experience | Number of
Funds in the
Columbia Funds
complex
overseen | Other directorships
held by Trustee
during the past
five years |
George S. Batejan
c/o Columbia Management
Investment Advisers, LLC
225 Franklin Street
Mail Drop BX32 05228
Boston, MA 02110
1953 | Trustee since 1/17 | Executive Vice President, Global Head of Technology and Operations, Janus Capital Group, Inc., 2010-2016 | 123 | Former Chairman of the Board, NICSA (National Investment Company Services Association) (Executive Committee, Nominating Committee and Governance Committee), 2014-2016; former Director, Intech Investment Management, 2011-2016; former Board Member, Metro Denver Chamber of Commerce, 2015-2016; former Advisory Board Member, University of Colorado Business School, 2015-2018 |
Kathleen Blatz
c/o Columbia Management
Investment Advisers, LLC
225 Franklin Street
Mail Drop BX32 05228
Boston, MA 02110
1954 | Trustee since 1/06 for RiverSource Funds and since 6/11 for Nations Funds | Attorney; specializing in arbitration and mediation; Chief Justice, Minnesota Supreme Court, 1998-2006; Associate Justice, Minnesota Supreme Court, 1996-1998; Fourth Judicial District Court Judge, Hennepin County, 1994-1996; Attorney in private practice and public service, 1984-1993; State Representative, Minnesota House of Representatives, 1979-1993, which included service on the Tax and Financial Institutions and Insurance Committees; Member and Interim Chair, Minnesota Sports Facilities Authority, January 2017-July 2017; Interim President and Chief Executive Officer, Blue Cross and Blue Shield of Minnesota (health care insurance), February-July 2018 | 123 | Trustee, BlueCross BlueShield of Minnesota since 2009 (Chair of the Business Development Committee, 2014-2017; Chair of the Governance Committee since 2017); Chair of the Robina Foundation since August 2013; former Member and Chair of the Board, Minnesota Sports Facilities Authority, January 2017-July 2017 |
Edward J. Boudreau, Jr.
c/o Columbia Management
Investment Advisers, LLC
225 Franklin Street
Mail Drop BX32 05228
Boston, MA 02110
1944 | Chair of the Board since 1/18; Trustee since 6/11 for RiverSource Funds and since 1/05 for Nations Funds | Managing Director, E.J. Boudreau & Associates (consulting) since 2000; FINRA Industry Arbitrator, 2002-present; Chairman and Chief Executive Officer, John Hancock Investments (asset management), Chairman and Interested Trustee for open-end and closed-end funds offered by John Hancock, 1989-2000; John Hancock Mutual Life Insurance Company, including Senior Vice President and Treasurer and Senior Vice President Information Technology, 1968-1988 | 123 | Former Trustee, Boston Museum of Science (Chair of Finance Committee) 1985-2013; former Trustee, BofA Funds Series Trust (11 funds), 2005-2011 |
| 36 | Columbia Mid Cap Index Fund | Annual Report 2019 |
TRUSTEES AND OFFICERS (continued)
Independent trustees (continued)
Name,
address,
year of birth | Position held
with the Trust and
length of service | Principal occupation(s)
during past five years
and other relevant
professional experience | Number of
Funds in the
Columbia Funds
complex
overseen | Other directorships
held by Trustee
during the past
five years |
Pamela G. Carlton
c/o Columbia Management
Investment Advisers, LLC
225 Franklin Street
Mail Drop BX32 05228
Boston, MA 02110
1954 | Trustee since 7/07 for RiverSource Funds and since 6/11 for Nations Funds | President, Springboard — Partners in Cross Cultural Leadership (consulting company) since 2003; Managing Director of US Equity Research, JP Morgan Chase, 1999-2003; Director of US Equity Research, Chase Asset Management, 1996-1999; Co-Director Latin America Research, 1993-1996, COO Global Research, 1992-1996, Co-Director of US Research, 1991-1992, Investment Banker, Morgan Stanley, 1982-1991 | 123 | Trustee, New York Presbyterian Hospital Board (Executive Committee and Chair of Human Resources Committee) since 1996; Director, Laurel Road Bank (Audit Committee) since 2017 |
Patricia M. Flynn
c/o Columbia Management
Investment Advisers, LLC
225 Franklin Street
Mail Drop BX32 05228
Boston, MA 02110
1950 | Trustee since 11/04 for RiverSource Funds and since 6/11 for Nations Funds | Trustee Professor of Economics and Management, Bentley University since 1976 (also teaches and conducts research on corporate governance); Dean, McCallum Graduate School of Business, Bentley University, 1992-2002 | 123 | Trustee, MA Taxpayers Foundation since 1997; Board of Directors, The MA Business Roundtable since 2003; Board of Governors, Innovation Institute, MA Technology Collaborative since 2010 |
Brian J. Gallagher
c/o Columbia Management
Investment Advisers, LLC
225 Franklin Street
Mail Drop BX32 05228
Boston, MA 02110
1954 | Trustee since 12/17 | Retired; Partner with Deloitte & Touche LLP and its predecessors, 1977-2016 | 121 | Trustee, Catholic Schools Foundation since 2004 |
Catherine James Paglia
c/o Columbia Management
Investment Advisers, LLC
225 Franklin Street
Mail Drop BX32 05228
Boston, MA 02110
1952 | Trustee since 11/04 for RiverSource Funds and since 6/11 for Nations Funds | Director, Enterprise Asset Management, Inc. (private real estate and asset management company) since September 1998; Managing Director and Partner, Interlaken Capital, Inc., 1989-1997; Managing Director, Morgan Stanley, 1982-1989; Vice President, Investment Banking, 1980-1982, Associate, Investment Banking, 1976-1980, Dean Witter Reynolds, Inc. | 123 | Director, Valmont Industries, Inc. (irrigation systems manufacturer) since 2012; Trustee, Carleton College (on the Investment Committee); Trustee, Carnegie Endowment for International Peace (on the Investment Committee) |
Anthony M. Santomero
c/o Columbia Management
Investment Advisers, LLC
225 Franklin Street
Mail Drop BX32 05228
Boston, MA 02110
1946 | Trustee since 6/11 for RiverSource Funds and since 1/08 for Nations Funds | Richard K. Mellon Professor Emeritus of Finance, The Wharton School, University of Pennsylvania, since 2002; Senior Advisor, McKinsey & Company (consulting), 2006-2008; President, Federal Reserve Bank of Philadelphia, 2000- 2006; Professor of Finance, The Wharton School, University of Pennsylvania, 1972-2002 | 123 | Trustee, Penn Mutual Life Insurance Company since March 2008; Director, Renaissance Reinsurance Ltd. since May 2008; former Trustee, BofA Funds Series Trust (11 funds), 2008-2011; former Director, Citigroup Inc. and Citibank, N.A., 2009-2019 |
Columbia Mid Cap Index Fund | Annual Report 2019
| 37 |
TRUSTEES AND OFFICERS (continued)
Independent trustees (continued)
Name,
address,
year of birth | Position held
with the Trust and
length of service | Principal occupation(s)
during past five years
and other relevant
professional experience | Number of
Funds in the
Columbia Funds
complex
overseen | Other directorships
held by Trustee
during the past
five years |
Minor M. Shaw
c/o Columbia Management
Investment Advisers, LLC
225 Franklin Street
Mail Drop BX32 05228
Boston, MA 02110
1947 | Trustee since 6/11 for RiverSource Funds and since 2003 for Nations Funds | President, Micco LLC (private investments) since 2011; President, Micco Corp. (family investment business), 1998-2011 | 123 | Director, BlueCross BlueShield of South Carolina since April 2008; Board Chair, Hollingsworth Funds since 2016; Advisory Board member, Duke Energy Corp. since October 2016; Chair of the Duke Endowment; Chair of Greenville – Spartanburg Airport Commission; former Trustee, BofA Funds Series Trust (11 funds), 2003-2011; former Director, Piedmont Natural Gas, 2004-2016; former Director, National Association of Corporate Directors, Carolinas Chapter, 2013-2018 |
Sandra Yeager
c/o Columbia Management
Investment Advisers, LLC
225 Franklin Street
Mail Drop BX32 05228
Boston, MA 02110
1964 | Trustee since 12/17 | Retired; President and founder, Hanoverian Capital, LLC (SEC registered investment advisor firm), 2008-2016; Managing Director, DuPont Capital, 2006-2008; Managing Director, Morgan Stanley Investment Management, 2004-2006; Senior Vice President, Alliance Bernstein, 1990-2004 | 121 | Director, NAPE Education Foundation since October 2016 |
Interested trustee affiliated with Investment Manager*
Name,
address,
year of birth | Position held with the Trust and length of service | Principal occupation(s) during the
past five years and other relevant
professional experience | Number of
Funds in the
Columbia Funds
complex overseen | Other directorships
held by Trustee
during the past
five years |
William F. Truscott
c/o Columbia Management
Investment Advisers, LLC
225 Franklin St.
Boston, MA 02110
1960 | Trustee since 11/01 for RiverSource Funds and since 6/11 for Nations Funds; Senior Vice President since 2002 for RiverSource Funds and since 5/10 for Nations Funds | Chairman of the Board and President, Columbia Management Investment Advisers, LLC since May 2010 and February 2012, respectively; Chief Executive Officer, Global Asset Management, Ameriprise Financial, Inc. since September 2012 (previously Chief Executive Officer, U.S. Asset Management & President, Annuities, May 2010 - September 2012); Director and Chief Executive Officer, Columbia Management Investment Distributors, Inc. since May 2010 and February 2012, respectively; Chairman of the Board and Chief Executive Officer, RiverSource Distributors, Inc. since 2006; Director, Threadneedle Asset Management Holdings, SARL since 2014; President and Chief Executive Officer, Ameriprise Certificate Company, 2006 - August 2012. | 192 | Chairman of the Board, Columbia Management Investment Advisers, LLC since May 2010; Director, Columbia Management Investment Distributors, Inc. since May 2010; former Director, Ameriprise Certificate Company, 2006-January 2013 |
| * | Interested person (as defined under the 1940 Act) by reason of being an officer, director, security holder and/or employee of the Investment Manager or Ameriprise Financial. |
| 38 | Columbia Mid Cap Index Fund | Annual Report 2019 |
TRUSTEES AND OFFICERS (continued)
Nations Funds refer to the Funds within the Columbia Funds Complex that historically bore the Nations brand and includes series of Columbia Funds Series Trust. RiverSource Funds refer to the Funds within the Columbia Funds Complex that historically bore the RiverSource brand and includes series of Columbia Funds Series Trust II.
The Statement of Additional Information has additional information about the Fund’s Board members and is available, without charge, upon request by calling 800.345.6611, visiting columbiathreadneedleus.com/investor/ or contacting your financial intermediary.
Columbia Mid Cap Index Fund | Annual Report 2019
| 39 |
TRUSTEES AND OFFICERS (continued)
The Board has appointed officers who are responsible for day-to-day business decisions based on policies it has established. The officers serve at the pleasure of the Board. The following table provides basic information about the Officers of the Fund as of the printing of this report, including principal occupations during the past five years, although their specific titles may have varied over the period. In addition to Mr. Truscott, who is Senior Vice President, the Fund’s other officers are:
Fund officers
Name,
address and
year of birth | Position and year
first appointed to
position for any Fund
in the Columbia
Funds complex or a
predecessor thereof | Principal occupation(s) during past five years |
Christopher O. Petersen
5228 Ameriprise
Financial Center
Minneapolis, MN 55474
Born 1970 | President and Principal Executive Officer (2015) | Vice President and Lead Chief Counsel, Ameriprise Financial, Inc. since January 2015 (previously, Vice President and Chief Counsel, January 2010 - December 2014; officer of Columbia Funds and affiliated funds since 2007. |
Michael G. Clarke
225 Franklin Street
Boston, MA 02110
Born 1969 | Chief Financial Officer (Principal Financial Officer) (2009) and Senior Vice President (2019) | Vice President — Accounting and Tax, Columbia Management Investment Advisers, LLC, since May 2010; senior officer of Columbia Funds and affiliated funds since 2002 (previously, Treasurer and Chief Accounting Officer, January 2009-January 2019 and December 2015-January 2019, respectively). |
Joseph Beranek
5890 Ameriprise
Financial Center
Minneapolis, MN 55474
Born 1965 | Treasurer and Chief Accounting Officer (Principal Accounting Officer) (2019) | Vice President — Mutual Fund Accounting and Financial Reporting, Columbia Management Investment Advisers, LLC, since December 2018 and March 2017, respectively (previously, Vice President — Pricing and Corporate Actions, May 2010-March 2017). |
Paul B. Goucher
485 Lexington Avenue
New York, NY 10017
Born 1968 | Senior Vice President (2011) and Assistant Secretary (2008) | Senior Vice President and Assistant General Counsel, Ameriprise Financial, Inc. since January 2017 (previously, Vice President and Lead Chief Counsel, November 2008 - January 2017 and January 2013 - January 2017, respectively); Vice President, Chief Legal Officer and Assistant Secretary, Columbia Management Investment Advisers, LLC since March 2015 (previously Vice President and Assistant Secretary, May 2010 – March 2015). |
Thomas P. McGuire
225 Franklin Street
Boston, MA 02110
Born 1972 | Senior Vice President and Chief Compliance Officer (2012) | Vice President — Asset Management Compliance, Ameriprise Financial, Inc., since May 2010; Chief Compliance Officer, Ameriprise Certificate Company since September 2010. |
Colin Moore
225 Franklin Street
Boston, MA 02110
Born 1958 | Senior Vice President (2010) | Executive Vice President and Global Chief Investment Officer, Ameriprise Financial, Inc., since July 2013; Executive Vice President and Global Chief Investment Officer, Columbia Management Investment Advisers, LLC since July 2013. |
Ryan C. Larrenaga
225 Franklin Street
Boston, MA 02110
Born 1970 | Senior Vice President (2017), Chief Legal Officer (2017), and Secretary (2015) | Vice President and Chief Counsel, Ameriprise Financial, Inc. since August 2018 (previously, Vice President and Group Counsel, August 2011 - August 2018); officer of Columbia Funds and affiliated funds since 2005. |
Michael E. DeFao
225 Franklin Street
Boston, MA 02110
Born 1968 | Vice President (2011) and Assistant Secretary (2010) | Vice President and Chief Counsel, Ameriprise Financial, Inc. since May 2010. |
Amy Johnson
5228 Ameriprise
Financial Center
Minneapolis, MN 55474
Born 1965 | Vice President (2006) | Managing Director and Global Head of Operations, Columbia Management Investment Advisers, LLC since April 2016 (previously Managing Director and Chief Operating Officer, 2010 - 2016). |
| 40 | Columbia Mid Cap Index Fund | Annual Report 2019 |
TRUSTEES AND OFFICERS (continued)
Fund officers (continued)
Name,
address and
year of birth | Position and year
first appointed to
position for any Fund
in the Columbia
Funds complex or a
predecessor thereof | Principal occupation(s) during past five years |
Lyn Kephart-Strong
5228 Ameriprise
Financial Center
Minneapolis, MN 55474
Born 1960 | Vice President (2015) | President, Columbia Management Investment Services Corp. since October 2014; Vice President & Resolution Officer, Ameriprise Trust Company since August 2009. |
Columbia Mid Cap Index Fund | Annual Report 2019
| 41 |
The Fund mails one shareholder report to each shareholder address, unless such shareholder elected to receive shareholder reports from the Fund electronically. If you would like more than one report, please call shareholder services at 800.345.6611 and additional reports will be sent to you.
Proxy voting policies and procedures
The policy of the Board of Trustees is to vote the proxies of the companies in which the Fund holds investments consistent with the procedures as stated in the Statement of Additional Information (SAI). You may obtain a copy of the SAI without charge by calling 800.345.6611; contacting your financial intermediary; visiting columbiathreadneedleus.com/investor/; or searching the website of the Securities and Exchange Commission (SEC) at sec.gov. Information regarding how the Fund voted proxies relating to portfolio securities is filed with the SEC by August 31st for the most recent 12-month period ending June 30th of that year, and is available without charge by visiting columbiathreadneedleus.com/investor/, or searching the website of the SEC at sec.gov.
Quarterly schedule of investments
The Fund files a complete schedule of portfolio holdings with the SEC for the first and third quarters of each fiscal year on Form N-Q or Form N-PORT (available for filings after March 31, 2019). The Fund’s Form N-Q or Form N-PORT is available on the SEC’s website at sec.gov. The Fund’s complete schedule of portfolio holdings, as filed on Form N-Q or Form N-PORT, can also be obtained without charge, upon request, by calling 800.345.6611.
Additional Fund information
For more information about the Fund, please visit columbiathreadneedleus.com/investor/ or call 800.345.6611. Customer Service Representatives are available to answer your questions Monday through Friday from 8 a.m. to 7 p.m. Eastern time.
Fund investment manager
Columbia Management Investment Advisers, LLC
225 Franklin Street
Boston, MA 02110
Fund distributor
Columbia Management Investment Distributors, Inc.
225 Franklin Street
Boston, MA 02110
Fund transfer agent
Columbia Management Investment Services Corp.
P.O. Box 219104
Kansas City, MO 64121-9104
| 42 | Columbia Mid Cap Index Fund | Annual Report 2019 |
[THIS PAGE INTENTIONALLY LEFT BLANK]
[THIS PAGE INTENTIONALLY LEFT BLANK]
[THIS PAGE INTENTIONALLY LEFT BLANK]
Columbia Mid Cap Index Fund
P.O. Box 219104
Kansas City, MO 64121-9104
Please read and consider the investment objectives, risks, charges and expenses for any fund carefully before investing. For a prospectus and summary prospectus, which contains this and other important information about the Fund, go to
columbiathreadneedleus.com/investor/. The Fund is distributed by Columbia Management Investment Distributors, Inc., member FINRA, and managed by Columbia Management Investment Advisers, LLC.
Columbia Threadneedle Investments (Columbia Threadneedle) is the global brand name of the Columbia and Threadneedle group of companies. All rights reserved.
© 2019 Columbia Management Investment Advisers, LLC.
columbiathreadneedleus.com/investor/

Annual Report
February 28, 2019
Columbia Select Mid Cap Value Fund
Beginning on January 1, 2021, as permitted by regulations adopted by the Securities and Exchange Commission, paper copies of the Fund’s annual and semiannual shareholder reports like this one will no longer be sent by mail, unless you specifically request paper copies of the reports. Instead, the reports will be made available on the Fund’s website (columbiathreadneedleus.com/investor/), and each time a report is posted you will be notified by mail and provided with a website address to access the report.
If you have already elected to receive shareholder reports electronically, you will not be affected by this change and you need not take any action. You may elect to receive shareholder reports and other communications from the Fund electronically at any time by contacting your financial intermediary (such as a broker-dealer or bank) or, for Fund shares held directly with the Fund, by calling 800.345.6611 or by enrolling in “eDelivery” by logging into your account at columbiathreadneedleus.com/investor/.
You may elect to receive all future reports in paper free of charge. If you invest through a financial intermediary, you can contact your financial intermediary to request that you continue receiving paper copies of your shareholder reports. If you invest directly with the Fund, you can call 800.345.6611 to let the Fund know you wish to continue receiving paper copies of your shareholder reports. Your election to receive paper reports will apply to all Columbia Funds held in your account if you invest through a financial intermediary or all Columbia Funds held with the fund complex if you invest directly with the Fund.
Not FDIC Insured • No bank guarantee • May lose value
Dear Shareholders,
Volatility exists in financial markets and this is not a comfortable fact of life. How investors deal with this reality, including how they react to short term spikes in volatility as well as to longer periods of increased or decreased volatility, may have a significant impact on their overall investing success.
Too often, investors change their investment strategy based on something that’s happening at a moment in time rather than thinking about how that change in strategy might affect their ability to achieve their longer term financial goals. Emotion replaces logic and reasoning. Investors may sell in reaction to a market drop (fear or panic), locking in low returns which means they won’t be invested when the market returns, or they invest more at a market peak (greed or conviction), essentially when it is expensive to do so. In both cases, selling and buying at the exact wrong time.
We believe the best outcomes come from a consistent approach to investing. Here are five areas where advisors can help us overcome the tendency to react emotionally as we struggle to make the right choices with our investments:
Long-term focus
The further away long-term goals, aspirations and objectives are, the easier it is to stray away from the goals and priorities that we set out. Advisors help us stay focused on what we want to accomplish.
Discipline through up-and-down markets
Advisors help set rules to prevent us from making rash decisions that we may regret later. Knowing ahead of time what you should do in case of certain situations will help you get through volatile markets and not make emotional decisions.
Tax-awareness
Taxes are one of the biggest drags on investment returns and are critical attributes of investing. Yet few of us take the necessary steps to ease the corrosive effect of taxes. Advisors have tools and knowledge that may help us to manage portfolios more tax-efficiently and keep more of what we earn.
Emotional objectivity
Our emotions are very hard to manage and making investment decisions in an emotional state can lead to exceedingly bad outcomes. An objective advisor can help prevent some of the reactionary mistakes emotions often lead us to.
Education and guidance
The role of the advisor is to teach and guide us toward achieving our financial goals. In terms of working through emotions, guidance is by far the most important component.
By understanding our own behaviors and biases, we can prepare for future challenges. Your success is our priority. Talk to your advisor about how working with Columbia Threadneedle Investments may help you stay the course and position your portfolio for consistent, sustainable outcomes, regardless of market conditions.
Sincerely,
Christopher O. Petersen
President, Columbia Funds
Columbia Funds are distributed by Columbia Management Investment Distributors, Inc., member FINRA, and managed by Columbia Management Investment Advisers, LLC.
© 2019 Columbia Management Investment Advisers, LLC. All rights reserved.
Columbia Select Mid Cap Value Fund | Annual Report 2019
Columbia Select Mid Cap Value Fund | Annual Report 2019
Investment objective
Columbia Select Mid Cap Value Fund (the Fund) seeks long-term capital appreciation.
Portfolio management
Kari Montanus
Lead Portfolio Manager
Managed Fund since May 2018
David Hoffman
Portfolio Manager
Managed Fund since 2004
Jonas Patrikson, CFA
Portfolio Manager
Managed Fund since 2014
Morningstar style boxTM
The Morningstar Style Box is based on a fund’s portfolio holdings. For equity funds, the vertical axis shows the market capitalization of the stocks owned, and the horizontal axis shows investment style (value, blend, or growth). Information shown is based on the most recent data provided by Morningstar.
© 2019 Morningstar, Inc. All rights reserved. The Morningstar information contained herein: (1) is proprietary to Morningstar and/or its content providers; (2) may not be copied or distributed; and (3) is not warranted to be accurate, complete or timely. Neither Morningstar nor its content providers are responsible for any damages or losses arising from any use of this information.
| Average annual total returns (%) (for the period ended February 28, 2019) |
| | | Inception | 1 Year | 5 Years | 10 Years |
| Class A | Excluding sales charges | 11/20/01 | 3.57 | 5.76 | 15.29 |
| | Including sales charges | | -2.38 | 4.52 | 14.61 |
| Advisor Class* | 11/08/12 | 3.79 | 6.02 | 15.48 |
| Class C | Excluding sales charges | 11/20/01 | 2.78 | 4.96 | 14.43 |
| | Including sales charges | | 2.02 | 4.96 | 14.43 |
| Institutional Class | 11/20/01 | 3.84 | 6.04 | 15.59 |
| Institutional 2 Class* | 11/08/12 | 3.99 | 6.16 | 15.58 |
| Institutional 3 Class* | 07/15/09 | 4.02 | 6.21 | 15.72 |
| Class R | 01/23/06 | 3.34 | 5.51 | 15.01 |
| Russell Midcap Value Index | | 2.63 | 7.44 | 17.31 |
Returns for Class A shares are shown with and without the maximum initial sales charge of 5.75%. Returns for Class C shares are shown with and without the 1.00% contingent deferred sales charge for the first year only. Please see the Fund’s prospectus for details. Performance for different share classes will vary based on differences in sales charges and fees associated with each share class. All results shown assume reinvestment of distributions during the period. Returns do not reflect the deduction of taxes that a shareholder may pay on Fund distributions or on the redemption of Fund shares. Performance results reflect the effect of any fee waivers or reimbursements of Fund expenses by Columbia Management Investment Advisers, LLC and/or any of its affiliates. Absent these fee waivers or expense reimbursement arrangements, performance results would have been lower.
The performance information shown represents past performance and is not a guarantee of future results. The investment return and principal value of your investment will fluctuate so that your shares, when redeemed, may be worth more or less than their original cost. Current performance may be lower or higher than the performance information shown. You may obtain performance information current to the most recent month-end by contacting your financial intermediary, visiting columbiathreadneedleus.com/investor/ or calling 800.345.6611.
| * | The returns shown for periods prior to the share class inception date (including returns for the Life of the Fund, if shown, which are since Fund inception) include the returns of the Fund’s oldest share class. Since the Fund launched more than one share class at its inception, Class A shares were used. These returns are adjusted to reflect any higher class-related operating expenses of the newer share classes, as applicable. Please visit columbiathreadneedleus.com/investor/investment-products/mutual-funds/appended-performance for more information. |
The Russell Midcap Value Index, an unmanaged index, measures the performance of those Russell Midcap Index companies with lower price-to-book ratios and forecasted growth values.
Indices are not available for investment, are not professionally managed and do not reflect sales charges, fees, brokerage commissions, taxes or other expenses of investing. Securities in the Fund may not match those in an index.
| 2 | Columbia Select Mid Cap Value Fund | Annual Report 2019 |
Fund at a Glance (continued)
Performance of a hypothetical $10,000 investment (February 28, 2009 — February 28, 2019)
The chart above shows the change in value of a hypothetical $10,000 investment in Class A shares of Columbia Select Mid Cap Value Fund during the stated time period, and does not reflect the deduction of taxes that a shareholder may pay on Fund distributions or on the redemption of Fund shares.
| Top 10 holdings (%) (at February 28, 2019) |
| FMC Corp. | 3.4 |
| Voya Financial, Inc. | 3.1 |
| ProLogis, Inc. | 2.9 |
| Lincoln National Corp. | 2.9 |
| Ameren Corp. | 2.9 |
| AMETEK, Inc. | 2.8 |
| Pinnacle West Capital Corp. | 2.8 |
| SL Green Realty Corp. | 2.8 |
| Hartford Financial Services Group, Inc. (The) | 2.7 |
| CMS Energy Corp. | 2.7 |
Percentages indicated are based upon total investments excluding Money Market Funds and investments in derivatives, if any.
For further detail about these holdings, please refer to the section entitled “Portfolio of Investments.”
Fund holdings are as of the date given, are subject to change at any time, and are not recommendations to buy or sell any security.
| Portfolio breakdown (%) (at February 28, 2019) |
| Common Stocks | 98.2 |
| Money Market Funds | 1.8 |
| Total | 100.0 |
Percentages indicated are based upon total investments excluding investments in derivatives, if any. The Fund’s portfolio composition is subject to change.
| Equity sector breakdown (%) (at February 28, 2019) |
| Consumer Discretionary | 8.5 |
| Consumer Staples | 5.7 |
| Energy | 7.4 |
| Financials | 17.9 |
| Health Care | 7.7 |
| Industrials | 12.2 |
| Information Technology | 10.5 |
| Materials | 7.1 |
| Real Estate | 10.3 |
| Utilities | 12.7 |
| Total | 100.0 |
Percentages indicated are based upon total equity investments. The Fund’s portfolio composition is subject to change.
Columbia Select Mid Cap Value Fund | Annual Report 2019
| 3 |
Manager Discussion of Fund Performance
For the 12-month period that ended February 28, 2019, the Fund’s Class A shares returned 3.57% excluding sales charges. The Fund outperformed its benchmark, the Russell Midcap Value Index, which returned 2.63% for the same time period. Strong security selection aided relative results.
Stocks advanced despite year-end sell-off
Investors kicked off the 12-month period ended February 28, 2019 with soaring optimism. Positive global economic conditions, broad corporate tax cuts and moves to reduce regulation in a number of industries buoyed confidence. The pace of economic growth averaged more than 3.0% as the labor markets added an average of 209,000 jobs per month, wages increased on the order of 3.0% and manufacturing activity remained solid. Unemployment rose modestly in December and January, but even that was a net positive as it reflected an increase in the number of Americans seeking employment. Weak job creation in February drove unemployment back down to 3.8%.
As 2018 progressed, the rosy global outlook dimmed. European economies transitioned to a slower pace, struggling with rising interest rates, trade tensions and uncertainty surrounding Brexit (the U.K.’s departure from the European Union). At the same time, China’s economic conditions weakened and emerging markets came under pressure, driven by trade concerns and a rising U.S dollar. In December, the Federal Reserve (the Fed) rattled investors when it raised the target range of its key short-term interest rate (the federal funds rate) to 2.25%-2.50%, which was the fourth such increase of the year. However, the Fed maintained this rate in its January 2019 meeting and announced that it would be patient moving forward.
As uncertainties rose late in 2018, investors backed away from riskier assets. Technology stocks, which had been global market leaders, stumbled in the third quarter of 2018 and triggered a broader market sell-off of stocks and high-yield bonds in the fourth quarter. However, stocks rebounded early in 2019 as a patient Fed and hopes for progress on the trade front inspired confidence. The S&P 500 Index, a broad measure of U.S. stock returns, gained 4.68% for the 12-month period, with dividends reinvested. Investment-grade bonds, as measured by the Bloomberg Barclays U.S. Aggregate Bond Index, returned 3.17%.
Contributors and detractors
Strong security selection, especially within the industrials, information technology, health care and consumer discretionary sectors, lifted the Fund’s return above the benchmark.
Real estate investment trust Welltower was the Fund’s top individual performer. The company invests mostly in senior housing, assisted living facilities and medical office buildings. Welltower reported strong quarterly profits throughout the year, driven, in part, by a higher acquisition pace. Power and utilities company AES was another top-performing name. AES shares rose as investors appreciated their consistent execution and progress in the renewables business. The utilities sector as a whole also weathered the fourth quarter 2018 stock market sell-off better than others, as investors shifted toward more defensive names. Within technology, First Data was a notable outperformer for the Fund. Shares in the credit card processing firm jumped early in the period after reporting quarterly results that beat expectations, driven by organic revenue growth and margin expansion. At the end of the period, the firm announced that it would be acquired by Fiserv at a substantial premium. We continued to hold all of these top contributors at the end of the period.
Security selection in the energy sector and an underweight in real estate detracted from relative returns. (Sector allocations are a function of bottom-up stock selection.) Within energy, oil and gas producers Noble Energy and WPX Energy sold off significantly alongside the steep drop in oil prices in the fourth quarter of 2018. Within financials, insurance company Lincoln National was a notable detractor from performance. The company reported modest quarterly results at the beginning of the period, hurt by weaker results in its annuities business. The firm was also hurt by the broader based sell-off in insurance names in December. These positions were still held at the end of the period.
Strategic positioning
During the period, the portfolio underwent a significant change in positioning. In May 2018, we transitioned the Fund from a broadly diversified portfolio of 70 to 135 holdings to a more concentrated, high conviction strategy that targets 30 to 50 stocks. This resulted in substantial turnover in the portfolio.
| 4 | Columbia Select Mid Cap Value Fund | Annual Report 2019 |
Manager Discussion of Fund Performance (continued)
At period’s end
At the end of the period, the Fund was overweight in the energy, information technology and utilities sectors and meaningfully underweight in real estate and communication services. These weights, relative to the benchmark, are byproducts of our bottom-up stock selection process. Most important, we continue to look for companies that we believe are trading at attractive valuations and that have identifiable catalysts with the potential to accelerate earnings and change investor perception. In doing so, we believe we have the potential to generate attractive returns for our shareholders.
Market risk may affect a single issuer, sector of the economy, industry or the market as a whole.Foreign investments subject the Fund to risks, including political, economic, market, social and others within a particular country, as well as to currency instabilities and less stringent financial and accounting standards generally applicable to U.S. issuers. Investments inmid-cap companies involve risks and volatility greater than investments in larger, more established companies.Value securities may be unprofitable if the market fails to recognize their intrinsic worth or the portfolio manager misgauged that worth. The fund may invest significantly in issuers within a particularsector, which may be negatively affected by market, economic or other conditions, making the fund more vulnerable to unfavorable developments in the sector. See the Fund’s prospectus for more information on these and other risks.
The views expressed in this report reflect the current views of the respective parties. These views are not guarantees of future performance and involve certain risks, uncertainties and assumptions that are difficult to predict, so actual outcomes and results may differ significantly from the views expressed. These views are subject to change at any time based upon economic, market or other conditions and the respective parties disclaim any responsibility to update such views. These views may not be relied on as investment advice and, because investment decisions for a Columbia fund are based on numerous factors, may not be relied on as an indication of trading intent on behalf of any particular Columbia fund. References to specific securities should not be construed as a recommendation or investment advice.
Columbia Select Mid Cap Value Fund | Annual Report 2019
| 5 |
Understanding Your Fund’s Expenses
(Unaudited)
As an investor, you incur two types of costs. There are shareholder transaction costs, which generally include sales charges on purchases and may include redemption fees. There are also ongoing fund costs, which generally include management fees, distribution and/or service fees, and other fund expenses. The following information is intended to help you understand your ongoing costs (in dollars) of investing in the Fund and to help you compare these costs with the ongoing costs of investing in other mutual funds.
Analyzing your Fund’s expenses
To illustrate these ongoing costs, we have provided examples and calculated the expenses paid by investors in each share class of the Fund during the period. The actual and hypothetical information in the table is based on an initial investment of $1,000 at the beginning of the period indicated and held for the entire period. Expense information is calculated two ways and each method provides you with different information. The amount listed in the “Actual” column is calculated using the Fund’s actual operating expenses and total return for the period. You may use the Actual information, together with the amount invested, to estimate the expenses that you paid over the period. Simply divide your account value by $1,000 (for example, an $8,600 account value divided by $1,000 = 8.6), then multiply the results by the expenses paid during the period under the “Actual” column. The amount listed in the “Hypothetical” column assumes a 5% annual rate of return before expenses (which is not the Fund’s actual return) and then applies the Fund’s actual expense ratio for the period to the hypothetical return. You should not use the hypothetical account values and expenses to estimate either your actual account balance at the end of the period or the expenses you paid during the period. See “Compare with other funds” below for details on how to use the hypothetical data.
Compare with other funds
Since all mutual funds are required to include the same hypothetical calculations about expenses in shareholder reports, you can use this information to compare the ongoing cost of investing in the Fund with other funds. To do so, compare the hypothetical example with the 5% hypothetical examples that appear in the shareholder reports of other funds. As you compare hypothetical examples of other funds, it is important to note that hypothetical examples are meant to highlight the ongoing costs of investing in a fund only and do not reflect any transaction costs, such as sales charges, or redemption or exchange fees. Therefore, the hypothetical calculations are useful in comparing ongoing costs only, and will not help you determine the relative total costs of owning different funds. If transaction costs were included in these calculations, your costs would be higher.
| September 1, 2018 — February 28, 2019 |
| | Account value at the
beginning of the
period ($) | Account value at the
end of the
period ($) | Expenses paid during
the period ($) | Fund’s annualized
expense ratio (%) |
| | Actual | Hypothetical | Actual | Hypothetical | Actual | Hypothetical | Actual |
| Class A | 1,000.00 | 1,000.00 | 980.40 | 1,018.99 | 5.75 | 5.86 | 1.17 |
| Advisor Class | 1,000.00 | 1,000.00 | 980.60 | 1,020.23 | 4.52 | 4.61 | 0.92 |
| Class C | 1,000.00 | 1,000.00 | 976.00 | 1,015.27 | 9.41 | 9.59 | 1.92 |
| Institutional Class | 1,000.00 | 1,000.00 | 981.80 | 1,020.23 | 4.52 | 4.61 | 0.92 |
| Institutional 2 Class | 1,000.00 | 1,000.00 | 982.10 | 1,020.88 | 3.88 | 3.96 | 0.79 |
| Institutional 3 Class | 1,000.00 | 1,000.00 | 982.60 | 1,021.08 | 3.69 | 3.76 | 0.75 |
| Class R | 1,000.00 | 1,000.00 | 979.10 | 1,017.75 | 6.97 | 7.10 | 1.42 |
Expenses paid during the period are equal to the annualized expense ratio for each class as indicated above, multiplied by the average account value over the period and then multiplied by the number of days in the Fund’s most recent fiscal half year and divided by 365.
Expenses do not include fees and expenses incurred indirectly by the Fund from its investment in underlying funds, including affiliated and non-affiliated pooled investment vehicles, such as mutual funds and exchange-traded funds.
Had Columbia Management Investment Advisers, LLC and/or certain of its affiliates not waived/reimbursed certain fees and expenses, account value at the end of the period would have been reduced.
| 6 | Columbia Select Mid Cap Value Fund | Annual Report 2019 |
Portfolio of Investments
February 28, 2019
(Percentages represent value of investments compared to net assets)
Investments in securities
| Common Stocks 98.2% |
| Issuer | Shares | Value ($) |
| Consumer Discretionary 8.4% |
| Hotels, Restaurants & Leisure 2.6% |
| Royal Caribbean Cruises Ltd. | 349,670 | 41,428,901 |
| Internet & Direct Marketing Retail 1.0% |
| Expedia Group, Inc. | 129,031 | 15,910,813 |
| Multiline Retail 2.5% |
| Dollar Tree, Inc.(a) | 399,325 | 38,466,977 |
| Textiles, Apparel & Luxury Goods 2.3% |
| Ralph Lauren Corp. | 283,316 | 35,462,664 |
| Total Consumer Discretionary | 131,269,355 |
| Consumer Staples 5.6% |
| Food & Staples Retailing 3.5% |
| Kroger Co. (The) | 1,097,285 | 32,183,369 |
| U.S. Foods Holding Corp.(a) | 666,815 | 23,498,561 |
| Total | | 55,681,930 |
| Food Products 2.1% |
| Tyson Foods, Inc., Class A | 526,525 | 32,465,531 |
| Total Consumer Staples | 88,147,461 |
| Energy 7.3% |
| Energy Equipment & Services 1.5% |
| TechnipFMC PLC | 1,070,900 | 23,870,361 |
| Oil, Gas & Consumable Fuels 5.8% |
| Marathon Petroleum Corp. | 506,075 | 31,381,710 |
| Noble Energy, Inc. | 1,249,265 | 27,671,220 |
| WPX Energy, Inc.(a) | 2,496,270 | 30,803,972 |
| Total | | 89,856,902 |
| Total Energy | 113,727,263 |
| Financials 17.6% |
| Banks 7.6% |
| Comerica, Inc. | 294,575 | 25,660,428 |
| Popular, Inc. | 619,835 | 34,946,297 |
| Regions Financial Corp. | 1,311,465 | 21,508,026 |
| SunTrust Banks, Inc. | 568,390 | 36,871,460 |
| Total | | 118,986,211 |
| Common Stocks (continued) |
| Issuer | Shares | Value ($) |
| Capital Markets 1.5% |
| Northern Trust Corp. | 252,300 | 23,514,360 |
| Diversified Financial Services 3.0% |
| Voya Financial, Inc. | 939,700 | 47,520,629 |
| Insurance 5.5% |
| Hartford Financial Services Group, Inc. (The) | 845,563 | 41,736,990 |
| Lincoln National Corp. | 711,505 | 44,483,292 |
| Total | | 86,220,282 |
| Total Financials | 276,241,482 |
| Health Care 7.6% |
| Health Care Equipment & Supplies 2.4% |
| Zimmer Biomet Holdings, Inc. | 296,665 | 36,822,060 |
| Health Care Providers & Services 3.0% |
| Quest Diagnostics, Inc. | 296,685 | 25,678,087 |
| WellCare Health Plans, Inc.(a) | 84,250 | 21,364,115 |
| Total | | 47,042,202 |
| Life Sciences Tools & Services 2.2% |
| Agilent Technologies, Inc. | 441,365 | 35,062,035 |
| Total Health Care | 118,926,297 |
| Industrials 12.0% |
| Aerospace & Defense 2.5% |
| L3 Technologies, Inc. | 185,291 | 39,235,369 |
| Airlines 2.1% |
| United Continental Holdings, Inc.(a) | 376,880 | 33,093,833 |
| Electrical Equipment 2.8% |
| AMETEK, Inc. | 548,380 | 43,640,080 |
| Machinery 2.6% |
| Ingersoll-Rand PLC | 389,673 | 41,133,882 |
| Road & Rail 2.0% |
| Norfolk Southern Corp. | 174,795 | 31,340,744 |
| Total Industrials | 188,443,908 |
| Information Technology 10.3% |
| Communications Equipment 2.2% |
| Motorola Solutions, Inc. | 244,610 | 35,008,583 |
The accompanying Notes to Financial Statements are an integral part of this statement.
Columbia Select Mid Cap Value Fund | Annual Report 2019
| 7 |
Portfolio of Investments (continued)
February 28, 2019
| Common Stocks (continued) |
| Issuer | Shares | Value ($) |
| IT Services 4.0% |
| DXC Technology Co. | 401,190 | 26,422,374 |
| First Data Corp., Class A(a) | 1,417,230 | 35,629,162 |
| Total | | 62,051,536 |
| Semiconductors & Semiconductor Equipment 4.1% |
| Marvell Technology Group Ltd. | 1,305,875 | 26,052,206 |
| Teradyne, Inc. | 932,650 | 38,080,100 |
| Total | | 64,132,306 |
| Total Information Technology | 161,192,425 |
| Materials 6.9% |
| Chemicals 5.7% |
| Eastman Chemical Co. | 466,900 | 38,607,961 |
| FMC Corp. | 579,230 | 51,841,085 |
| Total | | 90,449,046 |
| Metals & Mining 1.2% |
| Freeport-McMoRan, Inc. | 1,438,760 | 18,560,004 |
| Total Materials | 109,009,050 |
| Real Estate 10.1% |
| Equity Real Estate Investment Trusts (REITS) 10.1% |
| ProLogis, Inc. | 646,700 | 45,307,802 |
| SL Green Realty Corp. | 467,550 | 42,416,136 |
| Taubman Centers, Inc. | 582,300 | 31,083,174 |
| Welltower, Inc. | 529,840 | 39,372,410 |
| Total | | 158,179,522 |
| Total Real Estate | 158,179,522 |
| Common Stocks (continued) |
| Issuer | Shares | Value ($) |
| Utilities 12.4% |
| Electric Utilities 4.6% |
| Edison International | 485,780 | 29,093,364 |
| Pinnacle West Capital Corp. | 462,700 | 43,373,498 |
| Total | | 72,466,862 |
| Independent Power and Renewable Electricity Producers 2.3% |
| AES Corp. (The) | 2,131,425 | 36,724,453 |
| Multi-Utilities 5.5% |
| Ameren Corp. | 616,525 | 43,921,241 |
| CMS Energy Corp. | 766,750 | 41,711,200 |
| Total | | 85,632,441 |
| Total Utilities | 194,823,756 |
Total Common Stocks
(Cost $1,351,630,531) | 1,539,960,519 |
|
| Money Market Funds 1.8% |
| | Shares | Value ($) |
| Columbia Short-Term Cash Fund, 2.523%(b),(c) | 28,820,048 | 28,817,166 |
Total Money Market Funds
(Cost $28,817,166) | 28,817,166 |
Total Investments in Securities
(Cost: $1,380,447,697) | 1,568,777,685 |
| Other Assets & Liabilities, Net | | (436,264) |
| Net Assets | 1,568,341,421 |
Notes to Portfolio of Investments
| (a) | Non-income producing investment. |
| (b) | The rate shown is the seven-day current annualized yield at February 28, 2019. |
| (c) | As defined in the Investment Company Act of 1940, an affiliated company is one in which the Fund owns 5% or more of the company’s outstanding voting securities, or a company which is under common ownership or control with the Fund. Holdings and transactions in these affiliated companies during the year ended February 28, 2019 are as follows: |
| Issuer | Beginning
shares | Shares
purchased | Shares
sold | Ending
shares | Realized gain
(loss) —
affiliated
issuers ($) | Net change in
unrealized
appreciation
(depreciation) —
affiliated
issuers ($) | Dividends —
affiliated
issuers ($) | Value —
affiliated
issuers
at end of
period ($) |
| Columbia Short-Term Cash Fund, 2.523% |
| | 106,406,169 | 386,678,328 | (464,264,449) | 28,820,048 | (3,169) | 5,268 | 533,346 | 28,817,166 |
The accompanying Notes to Financial Statements are an integral part of this statement.
| 8 | Columbia Select Mid Cap Value Fund | Annual Report 2019 |
Portfolio of Investments (continued)
February 28, 2019
Fair value measurements
The Fund categorizes its fair value measurements according to a three-level hierarchy that maximizes the use of observable inputs and minimizes the use of unobservable inputs by prioritizing that the most observable input be used when available. Observable inputs are those that market participants would use in pricing an investment based on market data obtained from sources independent of the reporting entity. Unobservable inputs are those that reflect the Fund’s assumptions about the information market participants would use in pricing an investment. An investment’s level within the fair value hierarchy is based on the lowest level of any input that is deemed significant to the asset’s or liability’s fair value measurement. The input levels are not necessarily an indication of the risk or liquidity associated with investments at that level. For example, certain U.S. government securities are generally high quality and liquid, however, they are reflected as Level 2 because the inputs used to determine fair value may not always be quoted prices in an active market.
Fair value inputs are summarized in the three broad levels listed below:
| ■ | Level 1 — Valuations based on quoted prices for investments in active markets that the Fund has the ability to access at the measurement date. Valuation adjustments are not applied to Level 1 investments. |
| ■ | Level 2 — Valuations based on other significant observable inputs (including quoted prices for similar securities, interest rates, prepayment speeds, credit risks, etc.). |
| ■ | Level 3 — Valuations based on significant unobservable inputs (including the Fund’s own assumptions and judgment in determining the fair value of investments). |
Inputs that are used in determining fair value of an investment may include price information, credit data, volatility statistics, and other factors. These inputs can be either observable or unobservable. The availability of observable inputs can vary between investments, and is affected by various factors such as the type of investment, and the volume and level of activity for that investment or similar investments in the marketplace. The inputs will be considered by the Investment Manager, along with any other relevant factors in the calculation of an investment’s fair value. The Fund uses prices and inputs that are current as of the measurement date, which may include periods of market dislocations. During these periods, the availability of prices and inputs may be reduced for many investments. This condition could cause an investment to be reclassified between the various levels within the hierarchy.
Certain investments that have been measured at fair value using the net asset value (NAV) per share (or its equivalent) are not categorized in the fair value hierarchy. The fair value amounts presented in the table are intended to reconcile the fair value hierarchy to the amounts presented in the Portfolio of Investments. The Columbia Short-Term Cash Fund seeks to provide shareholders with maximum current income consistent with liquidity and stability of principal. Columbia Short-Term Cash Fund prices its shares with a floating NAV and no longer seeks to maintain a stable NAV.
Investments falling into the Level 3 category are primarily supported by quoted prices from brokers and dealers participating in the market for those investments. However, these may be classified as Level 3 investments due to lack of market transparency and corroboration to support these quoted prices. Additionally, valuation models may be used as the pricing source for any remaining investments classified as Level 3. These models may rely on one or more significant unobservable inputs and/or significant assumptions by the Investment Manager. Inputs used in valuations may include, but are not limited to, financial statement analysis, capital account balances, discount rates and estimated cash flows, and comparable company data.
Under the direction of the Fund’s Board of Trustees (the Board), the Investment Manager’s Valuation Committee (the Committee) is responsible for overseeing the valuation procedures approved by the Board. The Committee consists of voting and non-voting members from various groups within the Investment Manager’s organization, including operations and accounting, trading and investments, compliance, risk management and legal.
The Committee meets at least monthly to review and approve valuation matters, which may include a description of specific valuation determinations, data regarding pricing information received from approved pricing vendors and brokers and the results of Board-approved valuation control policies and procedures (the Policies). The Policies address, among other things, instances when market quotations are or are not readily available, including recommendations of third party pricing vendors and a determination of appropriate pricing methodologies; events that require specific valuation determinations and assessment of fair value techniques; securities with a potential for stale pricing, including those that are illiquid, restricted, or in default; and the effectiveness of third party pricing vendors, including periodic reviews of vendors. The Committee meets more frequently, as needed, to discuss additional valuation matters, which may include the need to review back-testing results, review time-sensitive information or approve related valuation actions. The Committee reports to the Board, with members of the Committee meeting with the Board at each of its regularly scheduled meetings to discuss valuation matters and actions during the period, similar to those described earlier.
For investments categorized as Level 3, the Committee monitors information similar to that described above, which may include: (i) data specific to the issuer or comparable issuers, (ii) general market or specific sector news and (iii) quoted prices and specific or similar security transactions. The Committee considers this data and any changes from prior periods in order to assess the reasonableness of observable and unobservable inputs, any assumptions or internal models used to value those securities and changes in fair value. This data is also used to corroborate, when available, information received from approved pricing vendors and brokers. Various factors impact the frequency of monitoring this information (which may occur as often as daily). However, the Committee may determine that changes to inputs, assumptions and models are not required as a result of the monitoring procedures performed.
The following table is a summary of the inputs used to value the Fund’s investments at February 28, 2019:
| | Level 1
quoted prices
in active
markets for
identical
assets ($) | Level 2
other
significant
observable
inputs ($) | Level 3
significant
unobservable
inputs ($) | Investments
measured at
net asset
value ($) | Total ($) |
| Investments in Securities | | | | | |
| Common Stocks | | | | | |
| Consumer Discretionary | 131,269,355 | — | — | — | 131,269,355 |
| Consumer Staples | 88,147,461 | — | — | — | 88,147,461 |
| Energy | 113,727,263 | — | — | — | 113,727,263 |
| Financials | 276,241,482 | — | — | — | 276,241,482 |
| Health Care | 118,926,297 | — | — | — | 118,926,297 |
| Industrials | 188,443,908 | — | — | — | 188,443,908 |
| Information Technology | 161,192,425 | — | — | — | 161,192,425 |
| Materials | 109,009,050 | — | — | — | 109,009,050 |
The accompanying Notes to Financial Statements are an integral part of this statement.
Columbia Select Mid Cap Value Fund | Annual Report 2019
| 9 |
Portfolio of Investments (continued)
February 28, 2019
Fair value measurements (continued)
| | Level 1
quoted prices
in active
markets for
identical
assets ($) | Level 2
other
significant
observable
inputs ($) | Level 3
significant
unobservable
inputs ($) | Investments
measured at
net asset
value ($) | Total ($) |
| Real Estate | 158,179,522 | — | — | — | 158,179,522 |
| Utilities | 194,823,756 | — | — | — | 194,823,756 |
| Total Common Stocks | 1,539,960,519 | — | — | — | 1,539,960,519 |
| Money Market Funds | — | — | — | 28,817,166 | 28,817,166 |
| Total Investments in Securities | 1,539,960,519 | — | — | 28,817,166 | 1,568,777,685 |
See the Portfolio of Investments for all investment classifications not indicated in the table.
There were no transfers of financial assets between levels during the period.
The accompanying Notes to Financial Statements are an integral part of this statement.
| 10 | Columbia Select Mid Cap Value Fund | Annual Report 2019 |
Statement of Assets and Liabilities
February 28, 2019
| Assets | |
| Investments in securities, at value | |
| Unaffiliated issuers (cost $1,351,630,531) | $1,539,960,519 |
| Affiliated issuers (cost $28,817,166) | 28,817,166 |
| Receivable for: | |
| Capital shares sold | 502,668 |
| Dividends | 1,694,488 |
| Expense reimbursement due from Investment Manager | 1,847 |
| Prepaid expenses | 3,555 |
| Total assets | 1,570,980,243 |
| Liabilities | |
| Payable for: | |
| Capital shares purchased | 1,953,865 |
| Management services fees | 33,013 |
| Distribution and/or service fees | 4,955 |
| Transfer agent fees | 349,921 |
| Compensation of board members | 199,658 |
| Compensation of chief compliance officer | 10 |
| Other expenses | 97,400 |
| Total liabilities | 2,638,822 |
| Net assets applicable to outstanding capital stock | $1,568,341,421 |
| Represented by | |
| Paid in capital | 1,392,377,587 |
| Total distributable earnings (loss) (Note 2) | 175,963,834 |
| Total - representing net assets applicable to outstanding capital stock | $1,568,341,421 |
| Class A | |
| Net assets | $575,861,310 |
| Shares outstanding | 55,692,607 |
| Net asset value per share | $10.34 |
| Maximum sales charge | 5.75% |
| Maximum offering price per share (calculated by dividing the net asset value per share by 1.0 minus the maximum sales charge for Class A shares) | $10.97 |
| Advisor Class | |
| Net assets | $21,856,866 |
| Shares outstanding | 2,032,366 |
| Net asset value per share | $10.75 |
| Class C | |
| Net assets | $20,763,406 |
| Shares outstanding | 2,231,742 |
| Net asset value per share | $9.30 |
| Institutional Class | |
| Net assets | $694,941,465 |
| Shares outstanding | 66,965,092 |
| Net asset value per share | $10.38 |
| Institutional 2 Class | |
| Net assets | $70,379,015 |
| Shares outstanding | 6,541,906 |
| Net asset value per share | $10.76 |
| Institutional 3 Class | |
| Net assets | $153,442,108 |
| Shares outstanding | 14,842,078 |
| Net asset value per share | $10.34 |
| Class R | |
| Net assets | $31,097,251 |
| Shares outstanding | 3,023,331 |
| Net asset value per share | $10.29 |
The accompanying Notes to Financial Statements are an integral part of this statement.
Columbia Select Mid Cap Value Fund | Annual Report 2019
| 11 |
Statement of Operations
Year Ended February 28, 2019
| Net investment income | |
| Income: | |
| Dividends — unaffiliated issuers | $30,945,151 |
| Dividends — affiliated issuers | 533,346 |
| Foreign taxes withheld | (65,916) |
| Total income | 31,412,581 |
| Expenses: | |
| Management services fees | 13,627,822 |
| Distribution and/or service fees | |
| Class A | 1,597,785 |
| Class C | 403,608 |
| Class R | 182,940 |
| Class T | 356 |
| Transfer agent fees | |
| Class A | 1,144,305 |
| Advisor Class | 95,662 |
| Class C | 71,990 |
| Institutional Class | 1,371,661 |
| Institutional 2 Class | 39,451 |
| Institutional 3 Class | 16,023 |
| Class R | 65,506 |
| Class T | 253 |
| Compensation of board members | 29,143 |
| Custodian fees | 13,911 |
| Printing and postage fees | 133,146 |
| Registration fees | 135,569 |
| Audit fees | 33,551 |
| Legal fees | 22,563 |
| Compensation of chief compliance officer | 393 |
| Other | 38,284 |
| Total expenses | 19,023,922 |
| Fees waived or expenses reimbursed by Investment Manager and its affiliates | (586,542) |
| Expense reduction | (4,243) |
| Total net expenses | 18,433,137 |
| Net investment income | 12,979,444 |
| Realized and unrealized gain (loss) — net | |
| Net realized gain (loss) on: | |
| Investments — unaffiliated issuers | 293,476,781 |
| Investments — affiliated issuers | (3,169) |
| Net realized gain | 293,473,612 |
| Net change in unrealized appreciation (depreciation) on: | |
| Investments — unaffiliated issuers | (249,292,335) |
| Investments — affiliated issuers | 5,268 |
| Net change in unrealized appreciation (depreciation) | (249,287,067) |
| Net realized and unrealized gain | 44,186,545 |
| Net increase in net assets resulting from operations | $57,165,989 |
The accompanying Notes to Financial Statements are an integral part of this statement.
| 12 | Columbia Select Mid Cap Value Fund | Annual Report 2019 |
Statement of Changes in Net Assets
| | Year Ended
February 28, 2019 | Year Ended
February 28, 2018 |
| Operations | | |
| Net investment income | $12,979,444 | $25,361,398 |
| Net realized gain | 293,473,612 | 437,844,555 |
| Net change in unrealized appreciation (depreciation) | (249,287,067) | (306,813,587) |
| Net increase in net assets resulting from operations | 57,165,989 | 156,392,366 |
| Distributions to shareholders | | |
| Net investment income and net realized gains | | |
| Class A | (154,997,509) | |
| Advisor Class | (9,252,914) | |
| Class C | (8,753,910) | |
| Institutional Class | (186,659,217) | |
| Institutional 2 Class | (13,122,849) | |
| Institutional 3 Class | (48,940,519) | |
| Class R | (8,636,973) | |
| Class T | (41,228) | |
| Net investment income | | |
| Class A | | (7,552,387) |
| Advisor Class | | (1,308,429) |
| Class C | | (299,583) |
| Class I | | (6) |
| Institutional Class | | (12,805,263) |
| Institutional 2 Class | | (1,285,687) |
| Institutional 3 Class | | (3,310,571) |
| Class K | | (69) |
| Class R | | (326,013) |
| Class T | | (2,257) |
| Net realized gains | | |
| Class A | | (137,570,241) |
| Advisor Class | | (19,646,312) |
| Class B | | (8,081) |
| Class C | | (14,499,351) |
| Institutional Class | | (174,658,034) |
| Institutional 2 Class | | (17,739,322) |
| Institutional 3 Class | | (39,964,378) |
| Class K | | (1,119) |
| Class R | | (8,031,098) |
| Class T | | (41,228) |
| Total distributions to shareholders (Note 2) | (430,405,119) | (439,049,429) |
| Decrease in net assets from capital stock activity | (90,838,369) | (420,288,939) |
| Total decrease in net assets | (464,077,499) | (702,946,002) |
| Net assets at beginning of year | 2,032,418,920 | 2,735,364,922 |
| Net assets at end of year | $1,568,341,421 | $2,032,418,920 |
| Undistributed net investment income | $1,929,553 | $885,230 |
The accompanying Notes to Financial Statements are an integral part of this statement.
Columbia Select Mid Cap Value Fund | Annual Report 2019
| 13 |
Statement of Changes in Net Assets (continued)
| | Year Ended | Year Ended |
| | February 28, 2019 | February 28, 2018 |
| | Shares | Dollars ($) | Shares | Dollars ($) |
| Capital stock activity |
| Class A | | | | |
| Subscriptions | 6,845,468 | 82,321,052 | 5,069,265 | 74,585,314 |
| Distributions reinvested | 14,110,115 | 143,170,441 | 9,610,610 | 132,872,226 |
| Redemptions | (17,454,758) | (205,393,415) | (20,860,587) | (304,071,879) |
| Net increase (decrease) | 3,500,825 | 20,098,078 | (6,180,712) | (96,614,339) |
| Advisor Class | | | | |
| Subscriptions | 1,063,773 | 13,560,981 | 1,604,294 | 24,521,589 |
| Distributions reinvested | 820,904 | 9,120,135 | 1,475,406 | 20,949,282 |
| Redemptions | (4,944,600) | (61,448,614) | (4,759,582) | (68,979,923) |
| Net decrease | (3,059,923) | (38,767,498) | (1,679,882) | (23,509,052) |
| Class B | | | | |
| Subscriptions | — | — | 12 | 182 |
| Distributions reinvested | — | — | 560 | 7,802 |
| Redemptions | — | — | (60,709) | (852,301) |
| Net decrease | — | — | (60,137) | (844,317) |
| Class C | | | | |
| Subscriptions | 196,327 | 2,057,701 | 229,455 | 3,138,395 |
| Distributions reinvested | 839,232 | 8,239,279 | 1,099,539 | 14,110,112 |
| Redemptions | (4,470,813) | (52,052,375) | (2,620,392) | (36,375,300) |
| Net decrease | (3,435,254) | (41,755,395) | (1,291,398) | (19,126,793) |
| Class I | | | | |
| Redemptions | — | — | (173) | (2,582) |
| Net decrease | — | — | (173) | (2,582) |
| Institutional Class | | | | |
| Subscriptions | 5,320,887 | 63,037,043 | 9,375,692 | 139,120,550 |
| Distributions reinvested | 16,850,564 | 172,232,428 | 11,914,694 | 166,038,931 |
| Redemptions | (18,143,253) | (216,878,671) | (51,689,892) | (761,779,408) |
| Net increase (decrease) | 4,028,198 | 18,390,800 | (30,399,506) | (456,619,927) |
| Institutional 2 Class | | | | |
| Subscriptions | 3,890,214 | 41,231,272 | 2,835,773 | 42,964,137 |
| Distributions reinvested | 1,216,107 | 13,115,217 | 1,341,289 | 19,022,140 |
| Redemptions | (4,573,681) | (58,493,418) | (3,868,617) | (56,613,191) |
| Net increase (decrease) | 532,640 | (4,146,929) | 308,445 | 5,373,086 |
| Institutional 3 Class | | | | |
| Subscriptions | 3,232,831 | 39,389,706 | 33,155,698 | 488,006,984 |
| Distributions reinvested | 2,758,688 | 28,294,838 | 1,667,152 | 22,951,278 |
| Redemptions | (9,172,108) | (109,531,841) | (21,987,128) | (333,341,504) |
| Net increase (decrease) | (3,180,589) | (41,847,297) | 12,835,722 | 177,616,758 |
| Class K | | | | |
| Distributions reinvested | — | — | 50 | 690 |
| Redemptions | (456) | (6,275) | — | — |
| Net increase (decrease) | (456) | (6,275) | 50 | 690 |
| Class R | | | | |
| Subscriptions | 555,228 | 6,591,157 | 588,066 | 8,566,534 |
| Distributions reinvested | 807,129 | 8,188,648 | 570,457 | 7,855,856 |
| Redemptions | (1,462,863) | (17,412,415) | (1,564,861) | (22,957,949) |
| Net decrease | (100,506) | (2,632,610) | (406,338) | (6,535,559) |
The accompanying Notes to Financial Statements are an integral part of this statement.
| 14 | Columbia Select Mid Cap Value Fund | Annual Report 2019 |
Statement of Changes in Net Assets (continued)
| | Year Ended | Year Ended |
| | February 28, 2019 | February 28, 2018 |
| | Shares | Dollars ($) | Shares | Dollars ($) |
| Class T | | | | |
| Subscriptions | — | — | 107 | 1,453 |
| Distributions reinvested | 4,003 | 40,739 | 3,115 | 43,038 |
| Redemptions | (20,899) | (211,982) | (4,822) | (71,395) |
| Net decrease | (16,896) | (171,243) | (1,600) | (26,904) |
| Total net decrease | (1,731,961) | (90,838,369) | (26,875,529) | (420,288,939) |
The accompanying Notes to Financial Statements are an integral part of this statement.
Columbia Select Mid Cap Value Fund | Annual Report 2019
| 15 |
The following table is intended to help you understand the Fund’s financial performance. Certain information reflects financial results for a single share of a class held for the periods shown. Per share net investment income (loss) amounts are calculated based on average shares outstanding during the period. Total return assumes reinvestment of all dividends and distributions, if any. Total return does not reflect payment of sales charges, if any. Total return and portfolio turnover are not annualized for periods of less than one year. The portfolio turnover rate is calculated without regard to purchase and sales transactions of short-term instruments and certain derivatives, if any. If such transactions were included, the Fund’s portfolio turnover rate may be higher.
| | Net asset value,
beginning of
period | Net
investment
income
(loss) | Net
realized
and
unrealized
gain (loss) | Total from
investment
operations | Distributions
from net
investment
income | Distributions
from net
realized
gains | Total
distributions to
shareholders |
| Class A |
| Year Ended 2/28/2019 | $13.27 | 0.07 | 0.18 | 0.25 | (0.07) | (3.11) | (3.18) |
| Year Ended 2/28/2018 | $15.19 | 0.13 | 0.80 | 0.93 | (0.14) | (2.71) | (2.85) |
| Year Ended 2/28/2017 | $12.88 | 0.11 | 3.35 | 3.46 | (0.11) | (1.04) | (1.15) |
| Year Ended 2/29/2016 | $17.18 | 0.06 | (2.03) | (1.97) | (0.05) | (2.28) | (2.33) |
| Year Ended 2/28/2015 | $18.64 | 0.07 | 1.44 | 1.51 | (0.07) | (2.90) | (2.97) |
| Advisor Class |
| Year Ended 2/28/2019 | $13.67 | 0.10 | 0.19 | 0.29 | (0.10) | (3.11) | (3.21) |
| Year Ended 2/28/2018 | $15.57 | 0.17 | 0.82 | 0.99 | (0.18) | (2.71) | (2.89) |
| Year Ended 2/28/2017 | $13.18 | 0.15 | 3.42 | 3.57 | (0.14) | (1.04) | (1.18) |
| Year Ended 2/29/2016 | $17.52 | 0.10 | (2.07) | (1.97) | (0.09) | (2.28) | (2.37) |
| Year Ended 2/28/2015 | $18.95 | 0.12 | 1.47 | 1.59 | (0.12) | (2.90) | (3.02) |
| Class C |
| Year Ended 2/28/2019 | $12.29 | (0.02) | 0.14 | 0.12 | — | (3.11) | (3.11) |
| Year Ended 2/28/2018 | $14.29 | 0.01 | 0.75 | 0.76 | (0.05) | (2.71) | (2.76) |
| Year Ended 2/28/2017 | $12.20 | 0.00(d) | 3.17 | 3.17 | (0.04) | (1.04) | (1.08) |
| Year Ended 2/29/2016 | $16.47 | (0.06) | (1.93) | (1.99) | — | (2.28) | (2.28) |
| Year Ended 2/28/2015 | $18.05 | (0.06) | 1.40 | 1.34 | (0.02) | (2.90) | (2.92) |
| Institutional Class |
| Year Ended 2/28/2019 | $13.31 | 0.10 | 0.18 | 0.28 | (0.10) | (3.11) | (3.21) |
| Year Ended 2/28/2018 | $15.23 | 0.18 | 0.79 | 0.97 | (0.18) | (2.71) | (2.89) |
| Year Ended 2/28/2017 | $12.91 | 0.15 | 3.35 | 3.50 | (0.14) | (1.04) | (1.18) |
| Year Ended 2/29/2016 | $17.21 | 0.10 | (2.03) | (1.93) | (0.09) | (2.28) | (2.37) |
| Year Ended 2/28/2015 | $18.67 | 0.12 | 1.44 | 1.56 | (0.12) | (2.90) | (3.02) |
| Institutional 2 Class |
| Year Ended 2/28/2019 | $13.67 | 0.11 | 0.20 | 0.31 | (0.11) | (3.11) | (3.22) |
| Year Ended 2/28/2018 | $15.57 | 0.18 | 0.83 | 1.01 | (0.20) | (2.71) | (2.91) |
| Year Ended 2/28/2017 | $13.18 | 0.17 | 3.42 | 3.59 | (0.16) | (1.04) | (1.20) |
| Year Ended 2/29/2016 | $17.52 | 0.12 | (2.07) | (1.95) | (0.11) | (2.28) | (2.39) |
| Year Ended 2/28/2015 | $18.96 | 0.15 | 1.45 | 1.60 | (0.14) | (2.90) | (3.04) |
| Institutional 3 Class |
| Year Ended 2/28/2019 | $13.27 | 0.12 | 0.18 | 0.30 | (0.12) | (3.11) | (3.23) |
| Year Ended 2/28/2018 | $15.20 | 0.14 | 0.84 | 0.98 | (0.20) | (2.71) | (2.91) |
| Year Ended 2/28/2017 | $12.89 | 0.17 | 3.35 | 3.52 | (0.17) | (1.04) | (1.21) |
| Year Ended 2/29/2016 | $17.19 | 0.13 | (2.03) | (1.90) | (0.12) | (2.28) | (2.40) |
| Year Ended 2/28/2015 | $18.65 | 0.16 | 1.43 | 1.59 | (0.15) | (2.90) | (3.05) |
The accompanying Notes to Financial Statements are an integral part of this statement.
| 16 | Columbia Select Mid Cap Value Fund | Annual Report 2019 |
Financial Highlights (continued)
| | Net
asset
value,
end of
period | Total
return | Total gross
expense
ratio to
average
net assets(a) | Total net
expense
ratio to
average
net assets(a),(b) | Net investment
income (loss)
ratio to
average
net assets | Portfolio
turnover | Net
assets,
end of
period
(000’s) |
| Class A |
| Year Ended 2/28/2019 | $10.34 | 3.57% | 1.20% | 1.17%(c) | 0.57% | 79% | $575,861 |
| Year Ended 2/28/2018 | $13.27 | 5.96% | 1.18% | 1.18%(c) | 0.86% | 59% | $692,641 |
| Year Ended 2/28/2017 | $15.19 | 27.41% | 1.17% | 1.17%(c) | 0.78% | 33% | $886,910 |
| Year Ended 2/29/2016 | $12.88 | (12.77%) | 1.18% | 1.18%(c) | 0.37% | 47% | $837,676 |
| Year Ended 2/28/2015 | $17.18 | 8.50% | 1.16% | 1.16%(c) | 0.39% | 25% | $1,112,701 |
| Advisor Class |
| Year Ended 2/28/2019 | $10.75 | 3.79% | 0.95% | 0.92%(c) | 0.78% | 79% | $21,857 |
| Year Ended 2/28/2018 | $13.67 | 6.20% | 0.93% | 0.92%(c) | 1.10% | 59% | $69,624 |
| Year Ended 2/28/2017 | $15.57 | 27.70% | 0.93% | 0.93%(c) | 1.02% | 33% | $105,459 |
| Year Ended 2/29/2016 | $13.18 | (12.53%) | 0.94% | 0.94%(c) | 0.64% | 47% | $63,910 |
| Year Ended 2/28/2015 | $17.52 | 8.79% | 0.92% | 0.92%(c) | 0.68% | 25% | $33,559 |
| Class C |
| Year Ended 2/28/2019 | $9.30 | 2.78% | 1.95% | 1.92%(c) | (0.20%) | 79% | $20,763 |
| Year Ended 2/28/2018 | $12.29 | 5.09% | 1.93% | 1.92%(c) | 0.10% | 59% | $69,670 |
| Year Ended 2/28/2017 | $14.29 | 26.48% | 1.92% | 1.92%(c) | 0.03% | 33% | $99,413 |
| Year Ended 2/29/2016 | $12.20 | (13.42%) | 1.93% | 1.93%(c) | (0.38%) | 47% | $99,372 |
| Year Ended 2/28/2015 | $16.47 | 7.73% | 1.91% | 1.91%(c) | (0.36%) | 25% | $138,393 |
| Institutional Class |
| Year Ended 2/28/2019 | $10.38 | 3.84% | 0.95% | 0.92%(c) | 0.82% | 79% | $694,941 |
| Year Ended 2/28/2018 | $13.31 | 6.21% | 0.93% | 0.93%(c) | 1.20% | 59% | $837,610 |
| Year Ended 2/28/2017 | $15.23 | 27.74% | 0.93% | 0.93%(c) | 1.02% | 33% | $1,421,365 |
| Year Ended 2/29/2016 | $12.91 | (12.51%) | 0.93% | 0.93%(c) | 0.61% | 47% | $1,450,834 |
| Year Ended 2/28/2015 | $17.21 | 8.76% | 0.91% | 0.91%(c) | 0.64% | 25% | $2,334,328 |
| Institutional 2 Class |
| Year Ended 2/28/2019 | $10.76 | 3.99% | 0.83% | 0.80% | 0.89% | 79% | $70,379 |
| Year Ended 2/28/2018 | $13.67 | 6.33% | 0.82% | 0.82% | 1.17% | 59% | $82,174 |
| Year Ended 2/28/2017 | $15.57 | 27.86% | 0.80% | 0.80% | 1.15% | 33% | $88,789 |
| Year Ended 2/29/2016 | $13.18 | (12.40%) | 0.79% | 0.79% | 0.76% | 47% | $58,924 |
| Year Ended 2/28/2015 | $17.52 | 8.87% | 0.78% | 0.78% | 0.84% | 25% | $72,152 |
| Institutional 3 Class |
| Year Ended 2/28/2019 | $10.34 | 4.02% | 0.78% | 0.76% | 0.97% | 79% | $153,442 |
| Year Ended 2/28/2018 | $13.27 | 6.34% | 0.77% | 0.77% | 0.98% | 59% | $239,180 |
| Year Ended 2/28/2017 | $15.20 | 27.94% | 0.75% | 0.75% | 1.19% | 33% | $78,828 |
| Year Ended 2/29/2016 | $12.89 | (12.35%) | 0.74% | 0.74% | 0.81% | 47% | $44,147 |
| Year Ended 2/28/2015 | $17.19 | 8.97% | 0.73% | 0.73% | 0.88% | 25% | $27,860 |
The accompanying Notes to Financial Statements are an integral part of this statement.
Columbia Select Mid Cap Value Fund | Annual Report 2019
| 17 |
Financial Highlights (continued)
| | Net asset value,
beginning of
period | Net
investment
income
(loss) | Net
realized
and
unrealized
gain (loss) | Total from
investment
operations | Distributions
from net
investment
income | Distributions
from net
realized
gains | Total
distributions to
shareholders |
| Class R |
| Year Ended 2/28/2019 | $13.22 | 0.04 | 0.18 | 0.22 | (0.04) | (3.11) | (3.15) |
| Year Ended 2/28/2018 | $15.14 | 0.09 | 0.80 | 0.89 | (0.10) | (2.71) | (2.81) |
| Year Ended 2/28/2017 | $12.84 | 0.08 | 3.33 | 3.41 | (0.07) | (1.04) | (1.11) |
| Year Ended 2/29/2016 | $17.14 | 0.02 | (2.03) | (2.01) | (0.01) | (2.28) | (2.29) |
| Year Ended 2/28/2015 | $18.61 | 0.03 | 1.44 | 1.47 | (0.04) | (2.90) | (2.94) |
| Notes to Financial Highlights |
| (a) | In addition to the fees and expenses that the Fund bears directly, the Fund indirectly bears a pro rata share of the fees and expenses of any other funds in which it invests. Such indirect expenses are not included in the Fund’s reported expense ratios. |
| (b) | Total net expenses include the impact of certain fee waivers/expense reimbursements made by the Investment Manager and certain of its affiliates, if applicable. |
| (c) | The benefits derived from expense reductions had an impact of less than 0.01%. |
| (d) | Rounds to zero. |
The accompanying Notes to Financial Statements are an integral part of this statement.
| 18 | Columbia Select Mid Cap Value Fund | Annual Report 2019 |
Financial Highlights (continued)
| | Net
asset
value,
end of
period | Total
return | Total gross
expense
ratio to
average
net assets(a) | Total net
expense
ratio to
average
net assets(a),(b) | Net investment
income (loss)
ratio to
average
net assets | Portfolio
turnover | Net
assets,
end of
period
(000’s) |
| Class R |
| Year Ended 2/28/2019 | $10.29 | 3.34% | 1.45% | 1.42%(c) | 0.32% | 79% | $31,097 |
| Year Ended 2/28/2018 | $13.22 | 5.71% | 1.43% | 1.42%(c) | 0.61% | 59% | $41,290 |
| Year Ended 2/28/2017 | $15.14 | 27.10% | 1.42% | 1.42%(c) | 0.54% | 33% | $53,457 |
| Year Ended 2/29/2016 | $12.84 | (13.02%) | 1.43% | 1.43%(c) | 0.11% | 47% | $52,550 |
| Year Ended 2/28/2015 | $17.14 | 8.25% | 1.41% | 1.41%(c) | 0.15% | 25% | $77,556 |
The accompanying Notes to Financial Statements are an integral part of this statement.
Columbia Select Mid Cap Value Fund | Annual Report 2019
| 19 |
Notes to Financial Statements
February 28, 2019
Note 1. Organization
Columbia Select Mid Cap Value Fund (formerly known as Columbia Mid Cap Value Fund) (the Fund), a series of Columbia Funds Series Trust (the Trust), is a diversified fund. The Trust is registered under the Investment Company Act of 1940, as amended (the 1940 Act), as an open-end management investment company organized as a Delaware statutory trust.
Effective July 1, 2018, Columbia Mid Cap Value Fund was renamed Columbia Select Mid Cap Value Fund.
Fund shares
The Trust may issue an unlimited number of shares (without par value). Although all share classes generally have identical voting, dividend and liquidation rights, each share class votes separately when required by the Trust’s organizational documents or by law. Different share classes pay different distribution amounts to the extent the expenses of such share classes differ, and distributions in liquidation will be proportional to the net asset value of each share class. Each share class has its own expense and sales charge structure. The Fund offers each of the share classes identified below.
Class A shares are subject to a maximum front-end sales charge of 5.75% based on the initial investment amount. Class A shares purchased without an initial sales charge in accounts aggregating $1 million to $50 million at the time of purchase are subject to a contingent deferred sales charge (CDSC) if the shares are sold within 18 months after purchase, charged as follows: 1.00% CDSC if redeemed within 12 months after purchase, and 0.50% CDSC if redeemed more than 12, but less than 18, months after purchase.
Advisor Class shares are not subject to sales charges and are generally available only to omnibus retirement plans and certain investors as described in the Fund’s prospectus.
Class C shares are subject to a 1.00% CDSC on shares redeemed within 12 months after purchase. Effective July 1, 2018, Class C shares automatically convert to Class A shares of the same Fund in the month of or the month following the 10-year anniversary of the Class C shares purchase date.
Institutional Class shares are not subject to sales charges and are generally available only to eligible investors, which are subject to different investment minimums as described in the Fund’s prospectus.
Institutional 2 Class shares are not subject to sales charges and are generally available only to investors purchasing through authorized investment professionals and omnibus retirement plans as described in the Fund’s prospectus.
Institutional 3 Class shares are not subject to sales charges and are available to institutional and certain other investors as described in the Fund’s prospectus.
The Fund no longer accepts investments by existing investors in Class K shares. When available, Class K shares were not subject to sales charges and were made available only to existing investors in Class K shares. On March 9, 2018, Class K shares were redeemed or exchanged for Advisor Class shares of the Fund in a tax free transaction that had no impact on fees and expenses paid by the shareholders.
Class R shares are not subject to sales charges and are generally available only to certain retirement plans and other investors as described in the Fund’s prospectus.
Class T shares were subject to a maximum front-end sales charge of 2.50% per transaction and were required to be purchased through financial intermediaries that, by written agreement with Columbia Management Investment Distributors, Inc., were specifically authorized to sell Class T shares. Effective at the close of business on December 14, 2018, Class T shares merged, in a tax-free transaction, into Class A shares of the Fund and are no longer offered for sale.
| 20 | Columbia Select Mid Cap Value Fund | Annual Report 2019 |
Notes to Financial Statements (continued)
February 28, 2019
Note 2. Summary of significant accounting policies
Basis of preparation
The Fund is an investment company that applies the accounting and reporting guidance in the Financial Accounting Standards Board (FASB) Accounting Standards Codification Topic 946,Financial Services - Investment Companies (ASC 946). The financial statements are prepared in accordance with U.S. generally accepted accounting principles (GAAP), which requires management to make certain estimates and assumptions that affect the reported amounts of assets and liabilities, the disclosure of contingent assets and liabilities at the date of the financial statements and the reported amounts of income and expenses during the reporting period. Actual results could differ from those estimates.
The following is a summary of significant accounting policies followed by the Fund in the preparation of its financial statements.
Security valuation
All equity securities are valued at the close of business of the New York Stock Exchange. Equity securities are valued at the last quoted sales price on the principal exchange or market on which they trade, except for securities traded on the NASDAQ Stock Market, which are valued at the NASDAQ official close price. Unlisted securities or listed securities for which there were no sales during the day are valued at the mean of the latest quoted bid and ask prices on such exchanges or markets.
Foreign equity securities are valued based on the closing price on the foreign exchange in which such securities are primarily traded. If any foreign equity security closing prices are not readily available, the securities are valued at the mean of the latest quoted bid and ask prices on such exchanges or markets. Foreign currency exchange rates are generally determined at 4:00 p.m. Eastern (U.S.) time. Many securities markets and exchanges outside the U.S. close prior to the close of the New York Stock Exchange; therefore, the closing prices for securities in such markets or on such exchanges may not fully reflect events that occur after such close but before the close of the New York Stock Exchange. In those situations, foreign securities will be fair valued pursuant to a policy adopted by the Board of Trustees, including, if available, utilizing a third party pricing service to determine these fair values. The third party pricing service takes into account multiple factors, including, but not limited to, movements in the U.S. securities markets, certain depositary receipts, futures contracts and foreign exchange rates that have occurred subsequent to the close of the foreign exchange or market, to determine a good faith estimate that reasonably reflects the current market conditions as of the close of the New York Stock Exchange. The fair value of a security is likely to be different from the quoted or published price, if available.
Investments in open-end investment companies, including money market funds, are valued at their latest net asset value.
Investments for which market quotations are not readily available, or that have quotations which management believes are not reflective of market value or reliable, are valued at fair value as determined in good faith under procedures approved by and under the general supervision of the Board of Trustees. If a security or class of securities (such as foreign securities) is valued at fair value, such value is likely to be different from the quoted or published price for the security.
The determination of fair value often requires significant judgment. To determine fair value, management may use assumptions including but not limited to future cash flows and estimated risk premiums. Multiple inputs from various sources may be used to determine fair value.
GAAP requires disclosure regarding the inputs and valuation techniques used to measure fair value and any changes in valuation inputs or techniques. In addition, investments shall be disclosed by major category. This information is disclosed following the Fund’s Portfolio of Investments.
Security transactions
Security transactions are accounted for on the trade date. Cost is determined and gains (losses) are based upon the specific identification method for both financial statement and federal income tax purposes.
Columbia Select Mid Cap Value Fund | Annual Report 2019
| 21 |
Notes to Financial Statements (continued)
February 28, 2019
Income recognition
Corporate actions and dividend income are generally recorded net of any non-reclaimable tax withholdings, on the ex-dividend date or upon receipt of ex-dividend notification in the case of certain foreign securities.
The Fund may receive distributions from holdings in equity securities, business development companies (BDCs), exchange-traded funds (ETFs), limited partnerships (LPs), other regulated investment companies (RICs), and real estate investment trusts (REITs), which report information on the tax character of their distributions annually. These distributions are allocated to dividend income, capital gain and return of capital based on actual information reported. Return of capital is recorded as a reduction of the cost basis of securities held. If the Fund no longer owns the applicable securities, return of capital is recorded as a realized gain. With respect to REITs, to the extent actual information has not yet been reported, estimates for return of capital are made by the Fund’s management. Management’s estimates are subsequently adjusted when the actual character of the distributions is disclosed by the REITs, which could result in a proportionate change in return of capital to shareholders.
Awards from class action litigation are recorded as a reduction of cost basis if the Fund still owns the applicable securities on the payment date. If the Fund no longer owns the applicable securities, the proceeds are recorded as realized gains.
Expenses
General expenses of the Trust are allocated to the Fund and other funds of the Trust based upon relative net assets or other expense allocation methodologies determined by the nature of the expense. Expenses directly attributable to the Fund are charged to the Fund. Expenses directly attributable to a specific class of shares are charged to that share class.
Determination of class net asset value
All income, expenses (other than class-specific expenses, which are charged to that share class, as shown in the Statement of Operations) and realized and unrealized gains (losses) are allocated to each class of the Fund on a daily basis, based on the relative net assets of each class, for purposes of determining the net asset value of each class.
Federal income tax status
The Fund intends to qualify each year as a regulated investment company under Subchapter M of the Internal Revenue Code, as amended, and will distribute substantially all of its investment company taxable income and net capital gain, if any, for its tax year, and as such will not be subject to federal income taxes. In addition, the Fund intends to distribute in each calendar year substantially all of its ordinary income, capital gain net income and certain other amounts, if any, such that the Fund should not be subject to federal excise tax. Therefore, no federal income or excise tax provision is recorded.
Foreign taxes
The Fund may be subject to foreign taxes on income, gains on investments or currency repatriation, a portion of which may be recoverable. The Fund will accrue such taxes and recoveries, as applicable, based upon its current interpretation of tax rules and regulations that exist in the markets in which it invests.
Realized gains in certain countries may be subject to foreign taxes at the Fund level, based on statutory rates. The Fund accrues for such foreign taxes on realized and unrealized gains at the appropriate rate for each jurisdiction, as applicable. The amount, if any, is disclosed as a liability on the Statement of Assets and Liabilities.
Distributions to shareholders
Distributions from net investment income, if any, are declared and paid each calendar quarter. Net realized capital gains, if any, are distributed at least annually. Income distributions and capital gain distributions are determined in accordance with federal income tax regulations, which may differ from GAAP.
| 22 | Columbia Select Mid Cap Value Fund | Annual Report 2019 |
Notes to Financial Statements (continued)
February 28, 2019
Guarantees and indemnifications
Under the Trust’s organizational documents and, in some cases, by contract, its officers and trustees are indemnified against certain liabilities arising out of the performance of their duties to the Trust or its funds. In addition, certain of the Fund’s contracts with its service providers contain general indemnification clauses. The Fund’s maximum exposure under these arrangements is unknown since the amount of any future claims that may be made against the Fund cannot be determined, and the Fund has no historical basis for predicting the likelihood of any such claims.
Recent accounting pronouncements
Accounting Standards Update 2017-08 Premium Amortization on Purchased Callable Debt Securities
In March 2017, the Financial Accounting Standards Board issued Accounting Standards Update (ASU) No. 2017-08 Premium Amortization on Purchased Callable Debt Securities. ASU No. 2017-08 updates the accounting standards to shorten the amortization period for certain purchased callable debt securities, held at a premium, to be amortized to the earliest call date. The update applies to securities with explicit, noncontingent call features that are callable at fixed prices and on preset dates. The standard is effective for annual periods beginning after December 15, 2018 and interim periods within those fiscal years. Management does not expect the implementation of this guidance to have a material impact on the financial statement amounts and footnote disclosures.
Accounting Standards Update 2018-13 Disclosure Framework - Changes to the Disclosure Requirements for Fair Value Measurement
In August 2018, the Financial Accounting Standards Board issued Accounting Standards Update (ASU) No. 2018-13 Disclosure Framework - Changes to the Disclosure Requirements for Fair Value Measurement. ASU No. 2018-13, in addition to other modifications and additions, removes the requirement to disclose the amount and reasons for transfers between Level 1 and Level 2 of the fair value hierarchy and the policy for the timing of transfers between levels. The standard is effective for annual periods beginning after December 15, 2019 and interim periods within those fiscal years. At this time, management is evaluating the implication of this guidance and the impact it will have on the financial statement disclosures, if any.
Disclosure Update and Simplification
In September 2018, the Securities and Exchange Commission (SEC) released Final Rule 33-10532, Disclosure Update and Simplification, which amends certain financial statement disclosure requirements that the SEC determined to be redundant, outdated, or superseded in light of other SEC disclosure requirements, GAAP, or changes in the information environment. As a result of the amendments, management implemented disclosure changes which included removing the components of distributable earnings presented on the Statement of Assets and Liabilities and combining income and gain distributions paid to shareholders as presented on the Statement of Changes in Net Assets. Any values presented to meet prior year requirements were left unchanged. The amendments had no effect on the Fund’s net assets or results of operation.
Note 3. Fees and other transactions with affiliates
Management services fees
The Fund has entered into a Management Agreement with Columbia Management Investment Advisers, LLC (the Investment Manager), a wholly-owned subsidiary of Ameriprise Financial, Inc. (Ameriprise Financial). Under the Management Agreement, the Investment Manager provides the Fund with investment research and advice, as well as administrative and accounting services. The management services fee is an annual fee that is equal to a percentage of the Fund’s daily net assets that declines from 0.82% to 0.65% as the Fund’s net assets increase. The effective management services fee rate for the year ended February 28, 2019 was 0.75% of the Fund’s average daily net assets.
Compensation of board members
Members of the Board of Trustees who are not officers or employees of the Investment Manager or Ameriprise Financial are compensated for their services to the Fund as disclosed in the Statement of Operations. Under a Deferred Compensation Plan (the Deferred Plan), these members of the Board of Trustees may elect to defer payment of up to 100% of their
Columbia Select Mid Cap Value Fund | Annual Report 2019
| 23 |
Notes to Financial Statements (continued)
February 28, 2019
compensation. Deferred amounts are treated as though equivalent dollar amounts had been invested in shares of certain funds managed by the Investment Manager. The Fund’s liability for these amounts is adjusted for market value changes and remains in the Fund until distributed in accordance with the Deferred Plan. All amounts payable under the Deferred Plan constitute a general unsecured obligation of the Fund.
Compensation of Chief Compliance Officer
The Board of Trustees has appointed a Chief Compliance Officer to the Fund in accordance with federal securities regulations. As disclosed in the Statement of Operations, a portion of the Chief Compliance Officer’s total compensation is allocated to the Fund, along with other allocations to affiliated registered investment companies managed by the Investment Manager and its affiliates, based on relative net assets.
Transactions with affiliates
For the year ended February 28, 2019, the Fund engaged in purchase and/or sale transactions with affiliates and/or accounts that have a common investment manager (or affiliated investment managers), common directors/trustees, and/or common officers. Those purchase and sale transactions complied with provisions of Rule 17a-7 under the 1940 Act and were $24,194,826 and $35,130,326, respectively. The sale transactions resulted in a net realized gain of $5,895,609.
Transfer agency fees
Under a Transfer and Dividend Disbursing Agent Agreement, Columbia Management Investment Services Corp. (the Transfer Agent), an affiliate of the Investment Manager and a wholly-owned subsidiary of Ameriprise Financial, is responsible for providing transfer agency services to the Fund. The Transfer Agent has contracted with DST Asset Manager Solutions, Inc. (DST) to serve as sub-transfer agent. The Transfer Agent pays the fees of DST for services as sub-transfer agent and DST is not entitled to reimbursement for such fees from the Fund (with the exception of out-of-pocket fees).
The Fund pays the Transfer Agent a monthly transfer agency fee based on the number or the average value of accounts, depending on the type of account. In addition, the Fund pays the Transfer Agent a fee for shareholder services based on the number of accounts or on a percentage of the average aggregate value of the Fund’s shares maintained in omnibus accounts up to the lesser of the amount charged by the financial intermediary or a cap established by the Board of Trustees from time to time.
The Transfer Agent also receives compensation from the Fund for various shareholder services and reimbursements for certain out-of-pocket fees. Total transfer agency fees for Institutional 2 Class and Institutional 3 Class shares are subject to an annual limitation of not more than 0.07% and 0.02%, respectively, of the average daily net assets attributable to each share class.
For the year ended February 28, 2019, the Fund’s effective transfer agency fee rates as a percentage of average daily net assets of each class were as follows:
| | Effective rate (%) |
| Class A | 0.18 |
| Advisor Class | 0.18 |
| Class C | 0.18 |
| Institutional Class | 0.18 |
| Institutional 2 Class | 0.06 |
| Institutional 3 Class | 0.01 |
| Class R | 0.18 |
| Class T | 0.14(a) |
| 24 | Columbia Select Mid Cap Value Fund | Annual Report 2019 |
Notes to Financial Statements (continued)
February 28, 2019
An annual minimum account balance fee of $20 may apply to certain accounts with a value below the applicable share class’s initial minimum investment requirements to reduce the impact of small accounts on transfer agency fees. These minimum account balance fees are remitted to the Fund and recorded as part of expense reductions in the Statement of Operations. For the year ended February 28, 2019, these minimum account balance fees reduced total expenses of the Fund by $4,243.
Distribution and service fees
The Fund has entered into an agreement with Columbia Management Investment Distributors, Inc. (the Distributor), an affiliate of the Investment Manager and a wholly-owned subsidiary of Ameriprise Financial, for distribution and shareholder services. The Board of Trustees has approved, and the Fund has adopted, distribution and shareholder service plans (the Plans) applicable to certain share classes, which set the distribution and service fees for the Fund. These fees are calculated daily and are intended to compensate the Distributor and/or eligible selling and/or servicing agents for selling shares of the Fund and providing services to investors.
Under the Plans, the Fund pays a monthly combined distribution and service fee to the Distributor at the maximum annual rate of 0.25% of the average daily net assets attributable to Class A shares of the Fund. Also under the Plans, the Fund pays a monthly service fee to the Distributor at the maximum annual rate of 0.25% of the average daily net assets attributable to Class C and Class T shares of the Fund and a monthly distribution fee to the Distributor at the maximum annual rates of 0.75%, 0.50% and 0.25% of the average daily net assets attributable to Class C, Class R and Class T shares of the Fund, respectively. As a result of all Class T shares of the Fund being redeemed or converted to Class A shares, December 14, 2018 was the last day the Fund paid a service fee or distribution fee for Class T shares.
Although the Fund may pay a distribution fee up to 0.25% of the Fund’s average daily net assets attributable to Class T shares and a service fee of up to 0.25% of the Fund’s average daily net assets attributable to Class T shares, the aggregate fee shall not exceed 0.25% of the Fund’s average daily net assets attributable to Class T shares.
Sales charges (unaudited)
Sales charges, including front-end charges and CDSCs, received by the Distributor for distributing Fund shares for the year ended February 28, 2019, if any, are listed below:
| | Amount ($) |
| Class A | 98,620 |
| Class C | 567 |
Expenses waived/reimbursed by the Investment Manager and its affiliates
The Investment Manager and certain of its affiliates have contractually agreed to waive fees and/or reimburse expenses (excluding certain fees and expenses described below) for the period(s) disclosed below, unless sooner terminated at the sole discretion of the Board of Trustees, so that the Fund’s net operating expenses, after giving effect to fees waived/expenses reimbursed and any balance credits and/or overdraft charges from the Fund’s custodian, do not exceed the following annual rate(s) as a percentage of the class’ average daily net assets:
| | July 1, 2018
through
June 30, 2019 | Prior to
July 1, 2018 |
| Class A | 1.17% | 1.17% |
| Advisor Class | 0.92 | 0.92 |
| Class C | 1.92 | 1.92 |
| Institutional Class | 0.92 | 0.92 |
| Institutional 2 Class | 0.79 | 0.855 |
| Institutional 3 Class | 0.75 | 0.805 |
| Class R | 1.42 | 1.42 |
Columbia Select Mid Cap Value Fund | Annual Report 2019
| 25 |
Notes to Financial Statements (continued)
February 28, 2019
Under the agreement governing these fee waivers and/or expense reimbursement arrangements, the following fees and expenses are excluded from the waiver/reimbursement commitment, and therefore will be paid by the Fund, if applicable: taxes (including foreign transaction taxes), expenses associated with investments in affiliated and non-affiliated pooled investment vehicles (including mutual funds and exchange-traded funds), transaction costs and brokerage commissions, costs related to any securities lending program, dividend expenses associated with securities sold short, inverse floater program fees and expenses, transaction charges and interest on borrowed money, interest, infrequent and/or unusual expenses and any other expenses the exclusion of which is specifically approved by the Board of Trustees. This agreement may be modified or amended only with approval from the Investment Manager, certain of its affiliates and the Fund. Any fees waived and/or expenses reimbursed under the expense reimbursement arrangements described above are not recoverable by the Investment Manager or its affiliates in future periods.
Note 4. Federal tax information
The timing and character of income and capital gain distributions are determined in accordance with income tax regulations, which may differ from GAAP because of temporary or permanent book to tax differences.
At February 28, 2019, these differences were primarily due to differing treatment for deferral/reversal of wash sale losses, post-October capital losses and trustees’ deferred compensation. To the extent these differences were permanent, reclassifications were made among the components of the Fund’s net assets. Temporary differences do not require reclassifications.
The Fund did not have any permanent differences; therefore, no reclassifications were made.
The tax character of distributions paid during the years indicated was as follows:
| Year Ended February 28, 2019 | Year Ended February 28, 2018 |
Ordinary
income ($) | Long-term
capital gains ($) | Total ($) | Ordinary
income ($) | Long-term
capital gains ($) | Total ($) |
| 51,537,238 | 378,867,881 | 430,405,119 | 44,835,583 | 394,213,846 | 439,049,429 |
Short-term capital gain distributions, if any, are considered ordinary income distributions for tax purposes.
At February 28, 2019, the components of distributable earnings on a tax basis were as follows:
Undistributed
ordinary income ($) | Undistributed
long-term
capital gains ($) | Capital loss
carryforwards ($) | Net unrealized
appreciation ($) |
| 2,126,969 | 2,870,473 | — | 188,005,851 |
At February 28, 2019, the cost of all investments for federal income tax purposes along with the aggregate gross unrealized appreciation and depreciation based on that cost was:
Federal
tax cost ($) | Gross unrealized
appreciation ($) | Gross unrealized
(depreciation) ($) | Net unrealized
appreciation ($) |
| 1,380,771,834 | 254,478,037 | (66,472,186) | 188,005,851 |
Tax cost of investments and unrealized appreciation/(depreciation) may also include timing differences that do not constitute adjustments to tax basis.
Under current tax rules, regulated investment companies can elect to treat certain late-year ordinary losses incurred and post-October capital losses (capital losses realized after October 31) as arising on the first day of the following taxable year. As of February 28, 2019, the Fund will elect to treat the following late-year ordinary losses and post-October capital losses as arising on March 1, 2019.
Late year
ordinary losses ($) | Post-October
capital losses ($) |
| — | 16,842,043 |
| 26 | Columbia Select Mid Cap Value Fund | Annual Report 2019 |
Notes to Financial Statements (continued)
February 28, 2019
Management of the Fund has concluded that there are no significant uncertain tax positions in the Fund that would require recognition in the financial statements. However, management’s conclusion may be subject to review and adjustment at a later date based on factors including, but not limited to, new tax laws, regulations, and administrative interpretations (including relevant court decisions). Generally, the Fund’s federal tax returns for the prior three fiscal years remain subject to examination by the Internal Revenue Service.
Note 5. Portfolio information
The cost of purchases and proceeds from sales of securities, excluding short-term investments and derivatives, if any, aggregated to $1,397,098,563 and $1,840,214,519, respectively, for the year ended February 28, 2019. The amount of purchase and sale activity impacts the portfolio turnover rate reported in the Financial Highlights.
Note 6. Affiliated money market fund
The Fund invests in Columbia Short-Term Cash Fund, an affiliated money market fund established for the exclusive use by the Fund and other affiliated funds (the Affiliated MMF). The income earned by the Fund from such investments is included as Dividends - affiliated issuers in the Statement of Operations. As an investing fund, the Fund indirectly bears its proportionate share of the expenses of the Affiliated MMF. The Affiliated MMF prices its shares with a floating net asset value. In addition, the Board of Trustees of the Affiliated MMF may impose a fee on redemptions (sometimes referred to as a liquidity fee) or temporarily suspend redemptions (sometimes referred to as imposing a redemption gate) in the event its liquidity falls below regulatory limits.
Note 7. Interfund lending
Pursuant to an exemptive order granted by the Securities and Exchange Commission, the Fund participates in a program (the Interfund Program) allowing each participating Columbia Fund (each, a Participating Fund) to lend money directly to and, except for closed-end funds and money market funds, borrow money directly from other Participating Funds for temporary purposes. The amounts eligible for borrowing and lending under the Interfund Program are subject to certain restrictions.
Interfund loans are subject to the risk that the borrowing fund could be unable to repay the loan when due, and a delay in repayment to the lending fund could result in lost opportunities and/or additional lending costs. The exemptive order is subject to conditions intended to mitigate conflicts of interest arising from the Investment Manager’s relationship with each Participating Fund.
The Fund did not borrow or lend money under the Interfund Program during the year ended February 28, 2019.
Note 8. Line of credit
The Fund has access to a revolving credit facility with a syndicate of banks led by Citibank, N.A., HSBC Bank USA, N.A. and JPMorgan Chase Bank, N.A. whereby the Fund may borrow for the temporary funding of shareholder redemptions or for other temporary or emergency purposes. The credit facility, which is a collective agreement between the Fund and certain other funds managed by the Investment Manager or an affiliated investment manager, severally and not jointly, permits collective borrowings up to $1 billion. Interest is charged to each participating fund based on its borrowings at a rate equal to the higher of (i) the federal funds effective rate, (ii) the one-month LIBOR rate and (iii) the overnight bank funding rate, plus in each case, 1.00%. Each borrowing under the credit facility matures no later than 60 days after the date of borrowing. The Fund also pays a commitment fee equal to its pro rata share of the unused amount of the credit facility at a rate of 0.15% per annum. The commitment fee is included in other expenses in the Statement of Operations. This agreement expires annually in December unless extended or renewed.
The Fund had no borrowings during the year ended February 28, 2019.
Note 9. Subsequent events
Management has evaluated the events and transactions that have occurred through the date the financial statements were issued and noted no items requiring adjustment of the financial statements or additional disclosure.
Columbia Select Mid Cap Value Fund | Annual Report 2019
| 27 |
Notes to Financial Statements (continued)
February 28, 2019
Note 10. Information regarding pending and settled legal proceedings
Ameriprise Financial and certain of its affiliates have historically been involved in a number of legal, arbitration and regulatory proceedings, including routine litigation, class actions, and governmental actions, concerning matters arising in connection with the conduct of their business activities. Ameriprise Financial believes that the Fund is not currently the subject of, and that neither Ameriprise Financial nor any of its affiliates are the subject of, any pending legal, arbitration or regulatory proceedings that are likely to have a material adverse effect on the Fund or the ability of Ameriprise Financial or its affiliates to perform under their contracts with the Fund. Ameriprise Financial is required to make quarterly (10-Q), annual (10-K) and, as necessary, 8-K filings with the Securities and Exchange Commission (SEC) on legal and regulatory matters that relate to Ameriprise Financial and its affiliates. Copies of these filings may be obtained by accessing the SEC website at www.sec.gov.
There can be no assurance that these matters, or the adverse publicity associated with them, will not result in increased Fund redemptions, reduced sale of Fund shares or other adverse consequences to the Fund. Further, although we believe proceedings are not likely to have a material adverse effect on the Fund or the ability of Ameriprise Financial or its affiliates to perform under their contracts with the Fund, these proceedings are subject to uncertainties and, as such, we are unable to estimate the possible loss or range of loss that may result. An adverse outcome in one or more of these proceedings could result in adverse judgments, settlements, fines, penalties or other relief that could have a material adverse effect on the consolidated financial condition or results of operations of Ameriprise Financial.
| 28 | Columbia Select Mid Cap Value Fund | Annual Report 2019 |
Report of Independent Registered Public Accounting Firm
To the Board of Trustees of Columbia Funds Series Trust and Shareholders of Columbia Select Mid Cap Value Fund
Opinion on the Financial Statements
We have audited the accompanying statement of assets and liabilities, including the portfolio of investments, of Columbia Select Mid Cap Value Fund (one of the funds constituting Columbia Funds Series Trust, referred to hereafter as the "Fund") as of February 28, 2019, the related statement of operations for the year ended February 28, 2019, the statement of changes in net assets for each of the two years in the period ended February 28, 2019, including the related notes, and the financial highlights for each of the five years in the period ended February 28, 2019 (collectively referred to as the “financial statements”). In our opinion, the financial statements present fairly, in all material respects, the financial position of the Fund as of February 28, 2019, the results of its operations for the year then ended, the changes in its net assets for each of the two years in the period ended February 28, 2019 and the financial highlights for each of the five years in the period ended February 28, 2019 in conformity with accounting principles generally accepted in the United States of America.
Basis for Opinion
These financial statements are the responsibility of the Fund’s management. Our responsibility is to express an opinion on the Fund’s financial statements based on our audits. We are a public accounting firm registered with the Public Company Accounting Oversight Board (United States) (PCAOB) and are required to be independent with respect to the Fund in accordance with the U.S. federal securities laws and the applicable rules and regulations of the Securities and Exchange Commission and the PCAOB.
We conducted our audits of these financial statements in accordance with the standards of the PCAOB. Those standards require that we plan and perform the audit to obtain reasonable assurance about whether the financial statements are free of material misstatement, whether due to error or fraud.
Our audits included performing procedures to assess the risks of material misstatement of the financial statements, whether due to error or fraud, and performing procedures that respond to those risks. Such procedures included examining, on a test basis, evidence regarding the amounts and disclosures in the financial statements. Our audits also included evaluating the accounting principles used and significant estimates made by management, as well as evaluating the overall presentation of the financial statements. Our procedures included confirmation of securities owned as of February 28, 2019 by correspondence with the custodian and transfer agent. We believe that our audits provide a reasonable basis for our opinion.
/s/PricewaterhouseCoopers LLP
Minneapolis, Minnesota
April 22, 2019
We have served as the auditor of one or more investment companies within the Columbia Funds Complex since 1977.
Columbia Select Mid Cap Value Fund | Annual Report 2019
| 29 |
Federal Income Tax Information
(Unaudited)
The Fund hereby designates the following tax attributes for the fiscal year ended February 28, 2019. Shareholders will be notified in early 2020 of the amounts for use in preparing 2019 income tax returns.
Qualified
dividend
income | Dividends
received
deduction | Capital
gain
dividend |
| 64.74% | 60.91% | $296,492,549 |
Qualified dividend income. For taxable, non-corporate shareholders, the percentage of ordinary income distributed during the fiscal year that represents qualified dividend income subject to reduced tax rates.
Dividends received deduction. The percentage of ordinary income distributed during the fiscal year that qualifies for the corporate dividends received deduction.
Capital gain dividend. The Fund designates as a capital gain dividend the amount reflected above, or if subsequently determined to be different, the net capital gain of such fiscal period.
| 30 | Columbia Select Mid Cap Value Fund | Annual Report 2019 |
Shareholders elect the Board that oversees the Fund’s operations. The Board appoints officers who are responsible for day-to-day business decisions based on policies set by the Board. The following table provides basic biographical information about the Fund’s Trustees as of the printing of this report, including their principal occupations during the past five years, although specific titles for individuals may have varied over the period. Under current Board policy, Trustees not affiliated with the Investment Manager generally may serve through the end of the calendar year in which they reach the mandatory retirement age established by the Board.
Independent trustees
Name,
address,
year of birth | Position held
with the Trust and
length of service | Principal occupation(s)
during past five years
and other relevant
professional experience | Number of
Funds in the
Columbia Funds
complex
overseen | Other directorships
held by Trustee
during the past
five years |
George S. Batejan
c/o Columbia Management
Investment Advisers, LLC
225 Franklin Street
Mail Drop BX32 05228
Boston, MA 02110
1953 | Trustee since 1/17 | Executive Vice President, Global Head of Technology and Operations, Janus Capital Group, Inc., 2010-2016 | 123 | Former Chairman of the Board, NICSA (National Investment Company Services Association) (Executive Committee, Nominating Committee and Governance Committee), 2014-2016; former Director, Intech Investment Management, 2011-2016; former Board Member, Metro Denver Chamber of Commerce, 2015-2016; former Advisory Board Member, University of Colorado Business School, 2015-2018 |
Kathleen Blatz
c/o Columbia Management
Investment Advisers, LLC
225 Franklin Street
Mail Drop BX32 05228
Boston, MA 02110
1954 | Trustee since 1/06 for RiverSource Funds and since 6/11 for Nations Funds | Attorney; specializing in arbitration and mediation; Chief Justice, Minnesota Supreme Court, 1998-2006; Associate Justice, Minnesota Supreme Court, 1996-1998; Fourth Judicial District Court Judge, Hennepin County, 1994-1996; Attorney in private practice and public service, 1984-1993; State Representative, Minnesota House of Representatives, 1979-1993, which included service on the Tax and Financial Institutions and Insurance Committees; Member and Interim Chair, Minnesota Sports Facilities Authority, January 2017-July 2017; Interim President and Chief Executive Officer, Blue Cross and Blue Shield of Minnesota (health care insurance), February-July 2018 | 123 | Trustee, BlueCross BlueShield of Minnesota since 2009 (Chair of the Business Development Committee, 2014-2017; Chair of the Governance Committee since 2017); Chair of the Robina Foundation since August 2013; former Member and Chair of the Board, Minnesota Sports Facilities Authority, January 2017-July 2017 |
Edward J. Boudreau, Jr.
c/o Columbia Management
Investment Advisers, LLC
225 Franklin Street
Mail Drop BX32 05228
Boston, MA 02110
1944 | Chair of the Board since 1/18; Trustee since 6/11 for RiverSource Funds and since 1/05 for Nations Funds | Managing Director, E.J. Boudreau & Associates (consulting) since 2000; FINRA Industry Arbitrator, 2002-present; Chairman and Chief Executive Officer, John Hancock Investments (asset management), Chairman and Interested Trustee for open-end and closed-end funds offered by John Hancock, 1989-2000; John Hancock Mutual Life Insurance Company, including Senior Vice President and Treasurer and Senior Vice President Information Technology, 1968-1988 | 123 | Former Trustee, Boston Museum of Science (Chair of Finance Committee) 1985-2013; former Trustee, BofA Funds Series Trust (11 funds), 2005-2011 |
Columbia Select Mid Cap Value Fund | Annual Report 2019
| 31 |
TRUSTEES AND OFFICERS (continued)
Independent trustees (continued)
Name,
address,
year of birth | Position held
with the Trust and
length of service | Principal occupation(s)
during past five years
and other relevant
professional experience | Number of
Funds in the
Columbia Funds
complex
overseen | Other directorships
held by Trustee
during the past
five years |
Pamela G. Carlton
c/o Columbia Management
Investment Advisers, LLC
225 Franklin Street
Mail Drop BX32 05228
Boston, MA 02110
1954 | Trustee since 7/07 for RiverSource Funds and since 6/11 for Nations Funds | President, Springboard — Partners in Cross Cultural Leadership (consulting company) since 2003; Managing Director of US Equity Research, JP Morgan Chase, 1999-2003; Director of US Equity Research, Chase Asset Management, 1996-1999; Co-Director Latin America Research, 1993-1996, COO Global Research, 1992-1996, Co-Director of US Research, 1991-1992, Investment Banker, Morgan Stanley, 1982-1991 | 123 | Trustee, New York Presbyterian Hospital Board (Executive Committee and Chair of Human Resources Committee) since 1996; Director, Laurel Road Bank (Audit Committee) since 2017 |
Patricia M. Flynn
c/o Columbia Management
Investment Advisers, LLC
225 Franklin Street
Mail Drop BX32 05228
Boston, MA 02110
1950 | Trustee since 11/04 for RiverSource Funds and since 6/11 for Nations Funds | Trustee Professor of Economics and Management, Bentley University since 1976 (also teaches and conducts research on corporate governance); Dean, McCallum Graduate School of Business, Bentley University, 1992-2002 | 123 | Trustee, MA Taxpayers Foundation since 1997; Board of Directors, The MA Business Roundtable since 2003; Board of Governors, Innovation Institute, MA Technology Collaborative since 2010 |
Brian J. Gallagher
c/o Columbia Management
Investment Advisers, LLC
225 Franklin Street
Mail Drop BX32 05228
Boston, MA 02110
1954 | Trustee since 12/17 | Retired; Partner with Deloitte & Touche LLP and its predecessors, 1977-2016 | 121 | Trustee, Catholic Schools Foundation since 2004 |
Catherine James Paglia
c/o Columbia Management
Investment Advisers, LLC
225 Franklin Street
Mail Drop BX32 05228
Boston, MA 02110
1952 | Trustee since 11/04 for RiverSource Funds and since 6/11 for Nations Funds | Director, Enterprise Asset Management, Inc. (private real estate and asset management company) since September 1998; Managing Director and Partner, Interlaken Capital, Inc., 1989-1997; Managing Director, Morgan Stanley, 1982-1989; Vice President, Investment Banking, 1980-1982, Associate, Investment Banking, 1976-1980, Dean Witter Reynolds, Inc. | 123 | Director, Valmont Industries, Inc. (irrigation systems manufacturer) since 2012; Trustee, Carleton College (on the Investment Committee); Trustee, Carnegie Endowment for International Peace (on the Investment Committee) |
Anthony M. Santomero
c/o Columbia Management
Investment Advisers, LLC
225 Franklin Street
Mail Drop BX32 05228
Boston, MA 02110
1946 | Trustee since 6/11 for RiverSource Funds and since 1/08 for Nations Funds | Richard K. Mellon Professor Emeritus of Finance, The Wharton School, University of Pennsylvania, since 2002; Senior Advisor, McKinsey & Company (consulting), 2006-2008; President, Federal Reserve Bank of Philadelphia, 2000- 2006; Professor of Finance, The Wharton School, University of Pennsylvania, 1972-2002 | 123 | Trustee, Penn Mutual Life Insurance Company since March 2008; Director, Renaissance Reinsurance Ltd. since May 2008; former Trustee, BofA Funds Series Trust (11 funds), 2008-2011; former Director, Citigroup Inc. and Citibank, N.A., 2009-2019 |
| 32 | Columbia Select Mid Cap Value Fund | Annual Report 2019 |
TRUSTEES AND OFFICERS (continued)
Independent trustees (continued)
Name,
address,
year of birth | Position held
with the Trust and
length of service | Principal occupation(s)
during past five years
and other relevant
professional experience | Number of
Funds in the
Columbia Funds
complex
overseen | Other directorships
held by Trustee
during the past
five years |
Minor M. Shaw
c/o Columbia Management
Investment Advisers, LLC
225 Franklin Street
Mail Drop BX32 05228
Boston, MA 02110
1947 | Trustee since 6/11 for RiverSource Funds and since 2003 for Nations Funds | President, Micco LLC (private investments) since 2011; President, Micco Corp. (family investment business), 1998-2011 | 123 | Director, BlueCross BlueShield of South Carolina since April 2008; Board Chair, Hollingsworth Funds since 2016; Advisory Board member, Duke Energy Corp. since October 2016; Chair of the Duke Endowment; Chair of Greenville – Spartanburg Airport Commission; former Trustee, BofA Funds Series Trust (11 funds), 2003-2011; former Director, Piedmont Natural Gas, 2004-2016; former Director, National Association of Corporate Directors, Carolinas Chapter, 2013-2018 |
Sandra Yeager
c/o Columbia Management
Investment Advisers, LLC
225 Franklin Street
Mail Drop BX32 05228
Boston, MA 02110
1964 | Trustee since 12/17 | Retired; President and founder, Hanoverian Capital, LLC (SEC registered investment advisor firm), 2008-2016; Managing Director, DuPont Capital, 2006-2008; Managing Director, Morgan Stanley Investment Management, 2004-2006; Senior Vice President, Alliance Bernstein, 1990-2004 | 121 | Director, NAPE Education Foundation since October 2016 |
Interested trustee affiliated with Investment Manager*
Name,
address,
year of birth | Position held with the Trust and length of service | Principal occupation(s) during the
past five years and other relevant
professional experience | Number of
Funds in the
Columbia Funds
complex overseen | Other directorships
held by Trustee
during the past
five years |
William F. Truscott
c/o Columbia Management
Investment Advisers, LLC
225 Franklin St.
Boston, MA 02110
1960 | Trustee since 11/01 for RiverSource Funds and since 6/11 for Nations Funds; Senior Vice President since 2002 for RiverSource Funds and since 5/10 for Nations Funds | Chairman of the Board and President, Columbia Management Investment Advisers, LLC since May 2010 and February 2012, respectively; Chief Executive Officer, Global Asset Management, Ameriprise Financial, Inc. since September 2012 (previously Chief Executive Officer, U.S. Asset Management & President, Annuities, May 2010 - September 2012); Director and Chief Executive Officer, Columbia Management Investment Distributors, Inc. since May 2010 and February 2012, respectively; Chairman of the Board and Chief Executive Officer, RiverSource Distributors, Inc. since 2006; Director, Threadneedle Asset Management Holdings, SARL since 2014; President and Chief Executive Officer, Ameriprise Certificate Company, 2006 - August 2012. | 192 | Chairman of the Board, Columbia Management Investment Advisers, LLC since May 2010; Director, Columbia Management Investment Distributors, Inc. since May 2010; former Director, Ameriprise Certificate Company, 2006-January 2013 |
| * | Interested person (as defined under the 1940 Act) by reason of being an officer, director, security holder and/or employee of the Investment Manager or Ameriprise Financial. |
Columbia Select Mid Cap Value Fund | Annual Report 2019
| 33 |
TRUSTEES AND OFFICERS (continued)
Nations Funds refer to the Funds within the Columbia Funds Complex that historically bore the Nations brand and includes series of Columbia Funds Series Trust. RiverSource Funds refer to the Funds within the Columbia Funds Complex that historically bore the RiverSource brand and includes series of Columbia Funds Series Trust II.
The Statement of Additional Information has additional information about the Fund’s Board members and is available, without charge, upon request by calling 800.345.6611, visiting columbiathreadneedleus.com/investor/ or contacting your financial intermediary.
| 34 | Columbia Select Mid Cap Value Fund | Annual Report 2019 |
TRUSTEES AND OFFICERS (continued)
The Board has appointed officers who are responsible for day-to-day business decisions based on policies it has established. The officers serve at the pleasure of the Board. The following table provides basic information about the Officers of the Fund as of the printing of this report, including principal occupations during the past five years, although their specific titles may have varied over the period. In addition to Mr. Truscott, who is Senior Vice President, the Fund’s other officers are:
Fund officers
Name,
address and
year of birth | Position and year
first appointed to
position for any Fund
in the Columbia
Funds complex or a
predecessor thereof | Principal occupation(s) during past five years |
Christopher O. Petersen
5228 Ameriprise
Financial Center
Minneapolis, MN 55474
Born 1970 | President and Principal Executive Officer (2015) | Vice President and Lead Chief Counsel, Ameriprise Financial, Inc. since January 2015 (previously, Vice President and Chief Counsel, January 2010 - December 2014; officer of Columbia Funds and affiliated funds since 2007. |
Michael G. Clarke
225 Franklin Street
Boston, MA 02110
Born 1969 | Chief Financial Officer (Principal Financial Officer) (2009) and Senior Vice President (2019) | Vice President — Accounting and Tax, Columbia Management Investment Advisers, LLC, since May 2010; senior officer of Columbia Funds and affiliated funds since 2002 (previously, Treasurer and Chief Accounting Officer, January 2009-January 2019 and December 2015-January 2019, respectively). |
Joseph Beranek
5890 Ameriprise
Financial Center
Minneapolis, MN 55474
Born 1965 | Treasurer and Chief Accounting Officer (Principal Accounting Officer) (2019) | Vice President — Mutual Fund Accounting and Financial Reporting, Columbia Management Investment Advisers, LLC, since December 2018 and March 2017, respectively (previously, Vice President — Pricing and Corporate Actions, May 2010-March 2017). |
Paul B. Goucher
485 Lexington Avenue
New York, NY 10017
Born 1968 | Senior Vice President (2011) and Assistant Secretary (2008) | Senior Vice President and Assistant General Counsel, Ameriprise Financial, Inc. since January 2017 (previously, Vice President and Lead Chief Counsel, November 2008 - January 2017 and January 2013 - January 2017, respectively); Vice President, Chief Legal Officer and Assistant Secretary, Columbia Management Investment Advisers, LLC since March 2015 (previously Vice President and Assistant Secretary, May 2010 – March 2015). |
Thomas P. McGuire
225 Franklin Street
Boston, MA 02110
Born 1972 | Senior Vice President and Chief Compliance Officer (2012) | Vice President — Asset Management Compliance, Ameriprise Financial, Inc., since May 2010; Chief Compliance Officer, Ameriprise Certificate Company since September 2010. |
Colin Moore
225 Franklin Street
Boston, MA 02110
Born 1958 | Senior Vice President (2010) | Executive Vice President and Global Chief Investment Officer, Ameriprise Financial, Inc., since July 2013; Executive Vice President and Global Chief Investment Officer, Columbia Management Investment Advisers, LLC since July 2013. |
Ryan C. Larrenaga
225 Franklin Street
Boston, MA 02110
Born 1970 | Senior Vice President (2017), Chief Legal Officer (2017), and Secretary (2015) | Vice President and Chief Counsel, Ameriprise Financial, Inc. since August 2018 (previously, Vice President and Group Counsel, August 2011 - August 2018); officer of Columbia Funds and affiliated funds since 2005. |
Michael E. DeFao
225 Franklin Street
Boston, MA 02110
Born 1968 | Vice President (2011) and Assistant Secretary (2010) | Vice President and Chief Counsel, Ameriprise Financial, Inc. since May 2010. |
Amy Johnson
5228 Ameriprise
Financial Center
Minneapolis, MN 55474
Born 1965 | Vice President (2006) | Managing Director and Global Head of Operations, Columbia Management Investment Advisers, LLC since April 2016 (previously Managing Director and Chief Operating Officer, 2010 - 2016). |
Columbia Select Mid Cap Value Fund | Annual Report 2019
| 35 |
TRUSTEES AND OFFICERS (continued)
Fund officers (continued)
Name,
address and
year of birth | Position and year
first appointed to
position for any Fund
in the Columbia
Funds complex or a
predecessor thereof | Principal occupation(s) during past five years |
Lyn Kephart-Strong
5228 Ameriprise
Financial Center
Minneapolis, MN 55474
Born 1960 | Vice President (2015) | President, Columbia Management Investment Services Corp. since October 2014; Vice President & Resolution Officer, Ameriprise Trust Company since August 2009. |
| 36 | Columbia Select Mid Cap Value Fund | Annual Report 2019 |
The Fund mails one shareholder report to each shareholder address, unless such shareholder elected to receive shareholder reports from the Fund electronically. If you would like more than one report, please call shareholder services at 800.345.6611 and additional reports will be sent to you.
Proxy voting policies and procedures
The policy of the Board of Trustees is to vote the proxies of the companies in which the Fund holds investments consistent with the procedures as stated in the Statement of Additional Information (SAI). You may obtain a copy of the SAI without charge by calling 800.345.6611; contacting your financial intermediary; visiting columbiathreadneedleus.com/investor/; or searching the website of the Securities and Exchange Commission (SEC) at sec.gov. Information regarding how the Fund voted proxies relating to portfolio securities is filed with the SEC by August 31st for the most recent 12-month period ending June 30th of that year, and is available without charge by visiting columbiathreadneedleus.com/investor/, or searching the website of the SEC at sec.gov.
Quarterly schedule of investments
The Fund files a complete schedule of portfolio holdings with the SEC for the first and third quarters of each fiscal year on Form N-Q or Form N-PORT (available for filings after March 31, 2019). The Fund’s Form N-Q or Form N-PORT is available on the SEC’s website at sec.gov. The Fund’s complete schedule of portfolio holdings, as filed on Form N-Q or Form N-PORT, can also be obtained without charge, upon request, by calling 800.345.6611.
Additional Fund information
For more information about the Fund, please visit columbiathreadneedleus.com/investor/ or call 800.345.6611. Customer Service Representatives are available to answer your questions Monday through Friday from 8 a.m. to 7 p.m. Eastern time.
Fund investment manager
Columbia Management Investment Advisers, LLC
225 Franklin Street
Boston, MA 02110
Fund distributor
Columbia Management Investment Distributors, Inc.
225 Franklin Street
Boston, MA 02110
Fund transfer agent
Columbia Management Investment Services Corp.
P.O. Box 219104
Kansas City, MO 64121-9104
Columbia Select Mid Cap Value Fund | Annual Report 2019
| 37 |
Columbia Select Mid Cap Value Fund
P.O. Box 219104
Kansas City, MO 64121-9104
Please read and consider the investment objectives, risks, charges and expenses for any fund carefully before investing. For a prospectus and summary prospectus, which contains this and other important information about the Fund, go to
columbiathreadneedleus.com/investor/. The Fund is distributed by Columbia Management Investment Distributors, Inc., member FINRA, and managed by Columbia Management Investment Advisers, LLC.
Columbia Threadneedle Investments (Columbia Threadneedle) is the global brand name of the Columbia and Threadneedle group of companies. All rights reserved.
© 2019 Columbia Management Investment Advisers, LLC.
columbiathreadneedleus.com/investor/

Annual Report
February 28, 2019
Columbia Small Cap Index Fund
Beginning on January 1, 2021, as permitted by regulations adopted by the Securities and Exchange Commission, paper copies of the Fund’s annual and semiannual shareholder reports like this one will no longer be sent by mail, unless you specifically request paper copies of the reports. Instead, the reports will be made available on the Fund’s website (columbiathreadneedleus.com/investor/), and each time a report is posted you will be notified by mail and provided with a website address to access the report.
If you have already elected to receive shareholder reports electronically, you will not be affected by this change and you need not take any action. You may elect to receive shareholder reports and other communications from the Fund electronically at any time by contacting your financial intermediary (such as a broker-dealer or bank) or, for Fund shares held directly with the Fund, by calling 800.345.6611 or by enrolling in “eDelivery” by logging into your account at columbiathreadneedleus.com/investor/.
You may elect to receive all future reports in paper free of charge. If you invest through a financial intermediary, you can contact your financial intermediary to request that you continue receiving paper copies of your shareholder reports. If you invest directly with the Fund, you can call 800.345.6611 to let the Fund know you wish to continue receiving paper copies of your shareholder reports. Your election to receive paper reports will apply to all Columbia Funds held in your account if you invest through a financial intermediary or all Columbia Funds held with the fund complex if you invest directly with the Fund.
Not FDIC Insured • No bank guarantee • May lose value
Dear Shareholders,
Volatility exists in financial markets and this is not a comfortable fact of life. How investors deal with this reality, including how they react to short term spikes in volatility as well as to longer periods of increased or decreased volatility, may have a significant impact on their overall investing success.
Too often, investors change their investment strategy based on something that’s happening at a moment in time rather than thinking about how that change in strategy might affect their ability to achieve their longer term financial goals. Emotion replaces logic and reasoning. Investors may sell in reaction to a market drop (fear or panic), locking in low returns which means they won’t be invested when the market returns, or they invest more at a market peak (greed or conviction), essentially when it is expensive to do so. In both cases, selling and buying at the exact wrong time.
We believe the best outcomes come from a consistent approach to investing. Here are five areas where advisors can help us overcome the tendency to react emotionally as we struggle to make the right choices with our investments:
Long-term focus
The further away long-term goals, aspirations and objectives are, the easier it is to stray away from the goals and priorities that we set out. Advisors help us stay focused on what we want to accomplish.
Discipline through up-and-down markets
Advisors help set rules to prevent us from making rash decisions that we may regret later. Knowing ahead of time what you should do in case of certain situations will help you get through volatile markets and not make emotional decisions.
Tax-awareness
Taxes are one of the biggest drags on investment returns and are critical attributes of investing. Yet few of us take the necessary steps to ease the corrosive effect of taxes. Advisors have tools and knowledge that may help us to manage portfolios more tax-efficiently and keep more of what we earn.
Emotional objectivity
Our emotions are very hard to manage and making investment decisions in an emotional state can lead to exceedingly bad outcomes. An objective advisor can help prevent some of the reactionary mistakes emotions often lead us to.
Education and guidance
The role of the advisor is to teach and guide us toward achieving our financial goals. In terms of working through emotions, guidance is by far the most important component.
By understanding our own behaviors and biases, we can prepare for future challenges. Your success is our priority. Talk to your advisor about how working with Columbia Threadneedle Investments may help you stay the course and position your portfolio for consistent, sustainable outcomes, regardless of market conditions.
Sincerely,
Christopher O. Petersen
President, Columbia Funds
Columbia Funds are distributed by Columbia Management Investment Distributors, Inc., member FINRA, and managed by Columbia Management Investment Advisers, LLC.
© 2019 Columbia Management Investment Advisers, LLC. All rights reserved.
Columbia Small Cap Index Fund | Annual Report 2019
Columbia Small Cap Index Fund | Annual Report 2019
Investment objective
Columbia Small Cap Index Fund (the Fund) seeks total return before fees and expenses that corresponds to the total return of the Standard & Poor’s (S&P) SmallCap 600 Index.
Portfolio management
Christopher Lo, CFA
Lead Portfolio Manager
Managed Fund since 2014
Vadim Shteyn
Portfolio Manager
Managed Fund since 2011
Morningstar style boxTM
The Morningstar Style Box is based on a fund’s portfolio holdings. For equity funds, the vertical axis shows the market capitalization of the stocks owned, and the horizontal axis shows investment style (value, blend, or growth). Information shown is based on the most recent data provided by Morningstar.
© 2019 Morningstar, Inc. All rights reserved. The Morningstar information contained herein: (1) is proprietary to Morningstar and/or its content providers; (2) may not be copied or distributed; and (3) is not warranted to be accurate, complete or timely. Neither Morningstar nor its content providers are responsible for any damages or losses arising from any use of this information.
| Average annual total returns (%) (for the period ended February 28, 2019) |
| | | Inception | 1 Year | 5 Years | 10 Years |
| Class A | 10/15/96 | 6.70 | 8.81 | 17.79 |
| Institutional Class | 10/15/96 | 6.99 | 9.09 | 18.08 |
| Institutional 2 Class* | 11/08/12 | 7.01 | 9.09 | 17.98 |
| Institutional 3 Class* | 03/01/17 | 6.99 | 8.94 | 17.85 |
| S&P SmallCap 600 Index | | 7.20 | 9.34 | 18.32 |
All results shown assume reinvestment of distributions during the period. Returns do not reflect the deduction of taxes that a shareholder may pay on Fund distributions or on the redemption of Fund shares. Performance results reflect the effect of any fee waivers or reimbursements of Fund expenses by Columbia Management Investment Advisers, LLC and/or any of its affiliates. Absent these fee waivers or expense reimbursement arrangements, performance results would have been lower.
The performance information shown represents past performance and is not a guarantee of future results. The investment return and principal value of your investment will fluctuate so that your shares, when redeemed, may be worth more or less than their original cost. Current performance may be lower or higher than the performance information shown. You may obtain performance information current to the most recent month-end by contacting your financial intermediary, visiting columbiathreadneedleus.com/investor/ or calling 800.345.6611.
| * | The returns shown for periods prior to the share class inception date (including returns for the Life of the Fund, if shown, which are since Fund inception) include the returns of the Fund’s oldest share class. Since the Fund launched more than one share class at its inception, Class A shares were used. These returns are adjusted to reflect any higher class-related operating expenses of the newer share classes, as applicable. Please visit columbiathreadneedleus.com/investor/investment-products/mutual-funds/appended-performance for more information. |
The S&P SmallCap 600 Index tracks the performance of 600 domestic companies traded on major stock exchanges. The S&P SmallCap 600 Index is heavily weighted with the stocks of companies with small market capitalizations.
Indices are not available for investment, are not professionally managed and do not reflect sales charges, fees, brokerage commissions, taxes or other expenses of investing. Securities in the Fund may not match those in an index.
| 2 | Columbia Small Cap Index Fund | Annual Report 2019 |
Fund at a Glance (continued)
Performance of a hypothetical $10,000 investment (February 28, 2009 — February 28, 2019)
The chart above shows the change in value of a hypothetical $10,000 investment in Class A shares of Columbia Small Cap Index Fund during the stated time period, and does not reflect the deduction of taxes that a shareholder may pay on Fund distributions or on the redemption of Fund shares.
| Top 10 holdings (%) (at February 28, 2019) |
| iShares Core S&P Small-Cap ETF | 0.9 |
| Ingevity Corp. | 0.6 |
| Trex Co., Inc. | 0.6 |
| First Financial Bankshares, Inc. | 0.6 |
| Selective Insurance Group, Inc. | 0.5 |
| FirstCash, Inc. | 0.5 |
| EastGroup Properties, Inc. | 0.5 |
| Glacier Bancorp, Inc. | 0.5 |
| Semtech Corp. | 0.5 |
| Darling Ingredients, Inc. | 0.5 |
Percentages indicated are based upon total investments excluding Money Market Funds and investments in derivatives, if any.
For further detail about these holdings, please refer to the section entitled “Portfolio of Investments.”
Fund holdings are as of the date given, are subject to change at any time, and are not recommendations to buy or sell any security.
| Portfolio breakdown (%) (at February 28, 2019) |
| Common Stocks | 97.2 |
| Exchange-Traded Funds | 0.9 |
| Money Market Funds | 1.9 |
| Total | 100.0 |
Percentages indicated are based upon total investments excluding investments in derivatives, if any. The Fund’s portfolio composition is subject to change.
| Equity sector breakdown (%) (at February 28, 2019) |
| Communication Services | 2.1 |
| Consumer Discretionary | 13.8 |
| Consumer Staples | 3.5 |
| Energy | 3.8 |
| Financials | 18.5 |
| Health Care | 11.2 |
| Industrials | 18.8 |
| Information Technology | 14.9 |
| Materials | 4.7 |
| Real Estate | 6.8 |
| Utilities | 1.9 |
| Total | 100.0 |
Percentages indicated are based upon total equity investments. The Fund’s portfolio composition is subject to change.
Columbia Small Cap Index Fund | Annual Report 2019
| 3 |
Manager Discussion of Fund Performance
For the 12-month period that ended February 28, 2019, the Fund’s Class A shares returned 6.70%. The Fund closely tracked its benchmark, the unmanaged S&P Small Cap 600 Index, which returned 7.20% for the same period. Mutual funds, unlike unmanaged indices, incur operating expenses.
U.S. equity markets posted gains despite tumult, tariffs and trade wars
The 12 months ended February 28, 2019 proved to be tumultuous. Stock markets got off to a mixed start at the beginning of the period, as fears of a global trade war sparked by tariffs the U.S. Administration levied on steel, aluminum and other goods weighed on returns. Worries about retaliation, primarily from China, added to anxiety over the possibility of interest rates and inflation rising faster than most expected. Small cap stocks fared better than large cap stocks during this time, as domestically-oriented small cap stocks were more insulated from global news headlines and geopolitical events. Despite these persistent headwinds, strong U.S. economic data and healthy corporate earnings growth drove stocks higher during the second and third quarters of 2018, with several major U.S. equity indices reaching record highs in the third quarter.
This course reversed sharply in the fourth quarter of 2018 when equity markets began selling off in earnest in October. The sell-off was attributed to worries surrounding the pace of interest rate hikes, exacerbated by the U.S. President’s criticisms of the Federal Reserve’s (the Fed) plan, fears of slowing U.S. economic growth, persistent concerns about U.S.-China trade relations and Washington, D.C.-centric political squabbles. Against this backdrop, U.S. equity markets logged their worst December since the Great Depression, with small cap equities in particular being hit hard amid investors’ flight to relative safety.
The period ended on a positive note, as U.S. equity markets rebounded strongly in the first two months of 2019. Though many issues continued without resolution, investors shrugged off worries about the global economic slowdown and trade conflict. Consensus expectations for a U.S.-China trade deal and a seemingly market-friendlier Fed also helped drive returns. Corporate earnings reports fueled positive investor sentiment, too, as did speculation that equity prices may have already reflected much, if not most, of the bad news. With the rally at the start of 2019, the S&P 500 Index ended the period up 4.68%. Small cap stocks outperformed large cap stocks, as the S& P Small Cap 600 Index climbed 7.20% for the same period.
S&P Small Cap 600 Index saw greatest gains in traditionally defensive sectors
Nine of the eleven sectors of the S&P Small Cap 600 Index posted a positive return during the 12 months ended February 28, 2019. In terms of total return, communication services, real estate and consumer staples, each traditionally considered a defensive sector, were the best relative performers. On the basis of impact, which takes weightings and total returns into account, health care, information technology and financials were the biggest contributors to the Index’s return. The top performing industries for the period on the basis of total return were entertainment; health care technology; personal products; interactive media and services; and distributors.
Conversely, energy, materials and industrials, each considered a more economically-sensitive cyclical sector, were the weakest performers on the basis of total return. Energy, materials and utilities were the weakest sectors on the basis of impact. The worst performing industries for the period on the basis of total return were multiline retail; construction materials; Internet and direct marketing retail; oil, gas and consumable fuels; and automobiles.
Top individual contributors within the S&P Small Cap 600 Index during the period included internet-based health insurance company eHealth, rent-to-own merchandise store operator Rent-a-Center, medical device developer and manufacturer Tactile Systems Technology, ambulatory outpatient management solutions provider BioTelemetry and alternate-site health care services provider Amedisys. Top detractors were helicopter transportation services provider to the offshore oil and gas industry Bristow Group, coal mining company Cloud Peak Energy, women’s apparel and accessories retailer Francesca’s Holdings, non-catastrophic and customized reinsurance company Maiden Holdings and downhole equipment and specialty chemicals manufacturer for the oilfield services industry Flotek Industries.
Industrials remained the largest sector by weighting in the S&P Small Cap 600 Index as of February 28, 2019, with a weighting of 18.83%. As always, each sector and stock in the S&P Small Cap 600 Index was represented in the Fund with approximately the same weighting as in the Index and therefore had a similar effect.
| 4 | Columbia Small Cap Index Fund | Annual Report 2019 |
Manager Discussion of Fund Performance (continued)
Index additions and deletions drove Fund portfolio changes
During the period, there were 73 additions and 73 deletions to the Index and the Fund’s portfolio. Among those stocks added to the Index and Fund were New York Mortgage Trust, Finisar, FormFactor, Avon Products, Dean Foods, Diebold Nixdorf, GameStop, Office Depot, Ambac Financial Group, Cooper Tire & Rubber, Endo International, Unisys, Chefs’ Warehouse, Nabors Industries, Gulfport Energy and Dril-Quip. Deletions included LendingTree, ICU Medical, Nektar Therapeutics, Evercore, Five Below, Chemed, Capella Education, WWE, FTD, Perry Ellis International, Ligand Pharmaceuticals, Flotek Industries, Fred’s, Analogic, Penn National Gaming and Amedisys.
We do not anticipate any changes in the portfolio beyond the customary quarterly rebalancings and stock substitutions we make to align the Fund with the S&P Small Cap 600 Index.
Market risk may affect a single issuer, sector of the economy, industry or the market as a whole. Investments insmall-cap companies involve risks and volatility greater than investments in larger, more established companies. The Fund’s net value will generally decline when the performance of its targetedindex declines. Investing inderivatives is a specialized activity that involves special risks, which may result in significant losses. The Fund may invest significantly in issuers within a particularsector, which may be negatively affected by market, economic or other conditions, making the Fund more vulnerable to unfavorable developments in the sector. See the Fund’s prospectus for more information on these and other risks.
The views expressed in this report reflect the current views of the respective parties. These views are not guarantees of future performance and involve certain risks, uncertainties and assumptions that are difficult to predict, so actual outcomes and results may differ significantly from the views expressed. These views are subject to change at any time based upon economic, market or other conditions and the respective parties disclaim any responsibility to update such views. These views may not be relied on as investment advice and, because investment decisions for a Columbia fund are based on numerous factors, may not be relied on as an indication of trading intent on behalf of any particular Columbia fund. References to specific securities should not be construed as a recommendation or investment advice.
Columbia Small Cap Index Fund | Annual Report 2019
| 5 |
Understanding Your Fund’s Expenses
(Unaudited)
As an investor, you incur two types of costs. There are shareholder transaction costs, which may include redemption fees. There are also ongoing fund costs, which generally include management fees, distribution and/or service fees, and other fund expenses. The following information is intended to help you understand your ongoing costs (in dollars) of investing in the Fund and to help you compare these costs with the ongoing costs of investing in other mutual funds.
Analyzing your Fund’s expenses
To illustrate these ongoing costs, we have provided examples and calculated the expenses paid by investors in each share class of the Fund during the period. The actual and hypothetical information in the table is based on an initial investment of $1,000 at the beginning of the period indicated and held for the entire period. Expense information is calculated two ways and each method provides you with different information. The amount listed in the “Actual” column is calculated using the Fund’s actual operating expenses and total return for the period. You may use the Actual information, together with the amount invested, to estimate the expenses that you paid over the period. Simply divide your account value by $1,000 (for example, an $8,600 account value divided by $1,000 = 8.6), then multiply the results by the expenses paid during the period under the “Actual” column. The amount listed in the “Hypothetical” column assumes a 5% annual rate of return before expenses (which is not the Fund’s actual return) and then applies the Fund’s actual expense ratio for the period to the hypothetical return. You should not use the hypothetical account values and expenses to estimate either your actual account balance at the end of the period or the expenses you paid during the period. See “Compare with other funds” below for details on how to use the hypothetical data.
Compare with other funds
Since all mutual funds are required to include the same hypothetical calculations about expenses in shareholder reports, you can use this information to compare the ongoing cost of investing in the Fund with other funds. To do so, compare the hypothetical example with the 5% hypothetical examples that appear in the shareholder reports of other funds. As you compare hypothetical examples of other funds, it is important to note that hypothetical examples are meant to highlight the ongoing costs of investing in a fund only and do not reflect any transaction costs, such as redemption or exchange fees. Therefore, the hypothetical calculations are useful in comparing ongoing costs only, and will not help you determine the relative total costs of owning different funds. If transaction costs were included in these calculations, your costs would be higher.
| September 1, 2018 — February 28, 2019 |
| | Account value at the
beginning of the
period ($) | Account value at the
end of the
period ($) | Expenses paid during
the period ($) | Fund’s annualized
expense ratio (%) |
| | Actual | Hypothetical | Actual | Hypothetical | Actual | Hypothetical | Actual |
| Class A | 1,000.00 | 1,000.00 | 891.20 | 1,022.56 | 2.11 | 2.26 | 0.45 |
| Institutional Class | 1,000.00 | 1,000.00 | 892.60 | 1,023.80 | 0.94 | 1.00 | 0.20 |
| Institutional 2 Class | 1,000.00 | 1,000.00 | 892.50 | 1,023.80 | 0.94 | 1.00 | 0.20 |
| Institutional 3 Class | 1,000.00 | 1,000.00 | 892.50 | 1,023.80 | 0.94 | 1.00 | 0.20 |
Expenses paid during the period are equal to the annualized expense ratio for each class as indicated above, multiplied by the average account value over the period and then multiplied by the number of days in the Fund’s most recent fiscal half year and divided by 365.
Expenses do not include fees and expenses incurred indirectly by the Fund from its investment in underlying funds, including affiliated and non-affiliated pooled investment vehicles, such as mutual funds and exchange-traded funds.
Had Columbia Management Investment Advisers, LLC and/or certain of its affiliates not waived/reimbursed certain fees and expenses, account value at the end of the period would have been reduced.
| 6 | Columbia Small Cap Index Fund | Annual Report 2019 |
Portfolio of Investments
February 28, 2019
(Percentages represent value of investments compared to net assets)
Investments in securities
| Common Stocks 97.0% |
| Issuer | Shares | Value ($) |
| Communication Services 2.0% |
| Diversified Telecommunication Services 1.1% |
| ATN International, Inc. | 59,414 | 3,334,908 |
| Cincinnati Bell, Inc.(a) | 274,562 | 2,663,251 |
| Cogent Communications Holdings, Inc. | 228,910 | 11,150,206 |
| Consolidated Communications Holdings, Inc. | 389,960 | 3,872,303 |
| Frontier Communications Corp. | 577,670 | 1,761,894 |
| Iridium Communications, Inc.(a) | 530,140 | 11,286,681 |
| Vonage Holdings Corp.(a) | 1,206,330 | 12,401,072 |
| Total | | 46,470,315 |
| Entertainment 0.1% |
| Marcus Corp. (The) | 117,823 | 4,994,517 |
| Interactive Media & Services 0.2% |
| Care.com, Inc.(a) | 144,740 | 3,646,001 |
| QuinStreet, Inc.(a) | 210,419 | 2,817,510 |
| Total | | 6,463,511 |
| Media 0.6% |
| EW Scripps Co. (The), Class A | 308,494 | 6,524,648 |
| Gannett Co., Inc. | 619,050 | 7,267,647 |
| New Media Investment Group, Inc. | 297,002 | 3,956,067 |
| Scholastic Corp. | 151,880 | 6,426,043 |
| TechTarget, Inc.(a) | 121,070 | 2,007,340 |
| Total | | 26,181,745 |
| Wireless Telecommunication Services 0.0% |
| Spok Holdings, Inc. | 99,029 | 1,367,590 |
| Total Communication Services | 85,477,678 |
| Consumer Discretionary 13.4% |
| Auto Components 2.0% |
| American Axle & Manufacturing Holdings, Inc.(a) | 611,350 | 9,842,735 |
| Cooper Tire & Rubber Co. | 274,040 | 8,758,318 |
| Cooper-Standard Holding, Inc.(a) | 90,470 | 5,438,152 |
| Dorman Products, Inc.(a) | 159,155 | 12,875,639 |
| Fox Factory Holding Corp.(a) | 207,910 | 13,177,336 |
| Garrett Motion, Inc.(a) | 405,100 | 6,781,374 |
| Gentherm, Inc.(a) | 190,950 | 7,828,950 |
| LCI Industries | 138,017 | 11,245,625 |
| Common Stocks (continued) |
| Issuer | Shares | Value ($) |
| Motorcar Parts of America, Inc.(a) | 103,530 | 2,142,036 |
| Standard Motor Products, Inc. | 110,489 | 5,447,108 |
| Superior Industries International, Inc. | 125,974 | 779,779 |
| Total | | 84,317,052 |
| Automobiles 0.1% |
| Winnebago Industries, Inc. | 158,810 | 5,181,970 |
| Distributors 0.2% |
| Core-Mark Holding Co., Inc. | 250,140 | 7,881,911 |
| Diversified Consumer Services 0.6% |
| American Public Education, Inc.(a) | 89,884 | 2,904,152 |
| Career Education Corp.(a) | 381,798 | 6,345,483 |
| Regis Corp.(a) | 165,190 | 2,988,287 |
| Strategic Education, Inc. | 118,816 | 15,538,756 |
| Total | | 27,776,678 |
| Hotels, Restaurants & Leisure 1.7% |
| Belmond Ltd., Class A(a) | 490,390 | 12,186,191 |
| BJ’s Restaurants, Inc. | 116,532 | 5,574,891 |
| Chuy’s Holdings, Inc.(a) | 92,770 | 2,075,265 |
| Dave & Buster’s Entertainment, Inc. | 212,520 | 10,908,652 |
| Dine Brands Global, Inc. | 96,941 | 9,616,547 |
| El Pollo Loco Holdings, Inc.(a) | 121,870 | 1,843,893 |
| Fiesta Restaurant Group, Inc.(a) | 128,290 | 1,933,330 |
| Monarch Casino & Resort, Inc.(a) | 64,635 | 2,834,245 |
| Red Robin Gourmet Burgers, Inc.(a) | 71,024 | 2,159,840 |
| Ruth’s Hospitality Group, Inc. | 156,818 | 3,986,314 |
| Shake Shack, Inc., Class A(a) | 141,460 | 7,800,104 |
| Wingstop, Inc. | 160,340 | 10,680,247 |
| Total | | 71,599,519 |
| Household Durables 2.0% |
| Cavco Industries, Inc.(a) | 46,810 | 6,479,908 |
| Ethan Allen Interiors, Inc. | 135,232 | 2,715,459 |
| Installed Building Products, Inc.(a) | 119,630 | 5,218,261 |
| iRobot Corp.(a) | 151,535 | 18,950,967 |
| La-Z-Boy, Inc. | 256,317 | 8,819,868 |
| LGI Homes, Inc.(a) | 101,950 | 6,025,245 |
| M/I Homes, Inc.(a) | 152,833 | 3,979,771 |
The accompanying Notes to Financial Statements are an integral part of this statement.
Columbia Small Cap Index Fund | Annual Report 2019
| 7 |
Portfolio of Investments (continued)
February 28, 2019
| Common Stocks (continued) |
| Issuer | Shares | Value ($) |
| MDC Holdings, Inc. | 267,710 | 7,720,737 |
| Meritage Homes Corp.(a) | 205,611 | 9,016,042 |
| TopBuild Corp.(a) | 193,660 | 11,522,770 |
| Universal Electronics, Inc.(a) | 75,559 | 2,522,915 |
| William Lyon Homes, Inc., Class A(a) | 180,270 | 2,550,821 |
| Total | | 85,522,764 |
| Internet & Direct Marketing Retail 0.7% |
| Liquidity Services, Inc.(a) | 144,830 | 999,327 |
| Nutrisystem, Inc. | 161,032 | 6,969,465 |
| PetMed Express, Inc. | 113,148 | 2,608,061 |
| Shutterfly, Inc.(a) | 183,920 | 8,241,455 |
| Shutterstock, Inc. | 101,630 | 4,708,518 |
| Stamps.com, Inc.(a) | 93,130 | 8,753,289 |
| Total | | 32,280,115 |
| Leisure Products 0.4% |
| Callaway Golf Co. | 486,175 | 8,367,072 |
| Nautilus, Inc.(a) | 163,020 | 1,064,521 |
| Sturm Ruger & Co., Inc. | 95,550 | 5,441,572 |
| Vista Outdoor, Inc.(a) | 315,120 | 2,807,719 |
| Total | | 17,680,884 |
| Multiline Retail 0.1% |
| JCPenney Co., Inc.(a) | 1,726,180 | 2,623,794 |
| Specialty Retail 4.0% |
| Abercrombie & Fitch Co., Class A | 360,360 | 7,909,902 |
| Asbury Automotive Group, Inc.(a) | 107,280 | 7,701,631 |
| Ascena Retail Group, Inc.(a) | 950,910 | 2,111,020 |
| Barnes & Noble Education, Inc.(a) | 200,433 | 1,380,983 |
| Barnes & Noble, Inc. | 312,360 | 1,967,868 |
| Buckle, Inc. (The) | 155,601 | 2,985,983 |
| Caleres, Inc. | 236,424 | 7,352,786 |
| Cato Corp. (The), Class A | 125,035 | 1,968,051 |
| Chico’s FAS, Inc. | 688,150 | 4,018,796 |
| Children’s Place, Inc. (The) | 88,631 | 8,469,578 |
| Conn’s, Inc.(a) | 133,430 | 3,147,614 |
| DSW, Inc., Class A | 373,300 | 11,053,413 |
| Express, Inc.(a) | 375,060 | 1,950,312 |
| GameStop Corp., Class A | 557,960 | 6,528,132 |
| Genesco, Inc.(a) | 110,512 | 5,334,414 |
| Common Stocks (continued) |
| Issuer | Shares | Value ($) |
| Group 1 Automotive, Inc. | 99,695 | 6,199,035 |
| Guess?, Inc. | 310,470 | 6,951,423 |
| Haverty Furniture Companies, Inc. | 103,866 | 2,530,176 |
| Hibbett Sports, Inc.(a) | 101,553 | 1,882,793 |
| Kirkland’s, Inc.(a) | 81,314 | 949,748 |
| Lithia Motors, Inc., Class A | 123,302 | 11,130,472 |
| Lumber Liquidators Holdings, Inc.(a) | 156,638 | 1,849,895 |
| MarineMax, Inc.(a) | 125,089 | 2,455,497 |
| Monro, Inc. | 180,541 | 13,777,084 |
| Office Depot, Inc. | 2,994,820 | 10,392,026 |
| Rent-A-Center, Inc.(a) | 243,100 | 4,524,091 |
| Restoration Hardware Holdings, Inc.(a) | 102,180 | 15,693,826 |
| Shoe Carnival, Inc. | 54,910 | 2,094,267 |
| Sleep Number Corp.(a) | 168,941 | 7,374,275 |
| Sonic Automotive, Inc., Class A | 129,461 | 1,945,799 |
| Tailored Brands, Inc. | 273,180 | 3,540,413 |
| Tile Shop Holdings, Inc. | 213,680 | 1,363,278 |
| Vitamin Shoppe, Inc.(a) | 85,563 | 630,599 |
| Zumiez, Inc.(a) | 103,398 | 2,553,931 |
| Total | | 171,719,111 |
| Textiles, Apparel & Luxury Goods 1.6% |
| Crocs, Inc.(a) | 365,598 | 9,388,557 |
| Fossil Group, Inc.(a) | 249,020 | 3,894,673 |
| G-III Apparel Group Ltd.(a) | 229,610 | 8,176,412 |
| Movado Group, Inc. | 90,303 | 3,163,314 |
| Oxford Industries, Inc. | 92,776 | 7,332,087 |
| Steven Madden Ltd. | 435,563 | 14,369,223 |
| Unifi, Inc.(a) | 79,480 | 1,758,098 |
| Vera Bradley, Inc.(a) | 118,040 | 1,127,282 |
| Wolverine World Wide, Inc. | 519,062 | 18,561,657 |
| Total | | 67,771,303 |
| Total Consumer Discretionary | 574,355,101 |
| Consumer Staples 3.4% |
| Beverages 0.3% |
| Coca-Cola Bottling Co. Consolidated | 25,400 | 6,295,644 |
| MGP Ingredients, Inc. | 69,190 | 5,663,202 |
| Total | | 11,958,846 |
The accompanying Notes to Financial Statements are an integral part of this statement.
| 8 | Columbia Small Cap Index Fund | Annual Report 2019 |
Portfolio of Investments (continued)
February 28, 2019
| Common Stocks (continued) |
| Issuer | Shares | Value ($) |
| Food & Staples Retailing 0.4% |
| Andersons, Inc. (The) | 144,049 | 5,324,051 |
| SpartanNash Co. | 196,699 | 3,733,347 |
| The Chefs’ Warehouse(a) | 126,300 | 4,042,863 |
| United Natural Foods, Inc.(a) | 278,110 | 4,174,431 |
| Total | | 17,274,692 |
| Food Products 1.5% |
| B&G Foods, Inc. | 360,856 | 8,884,275 |
| Calavo Growers, Inc. | 85,572 | 7,284,744 |
| Cal-Maine Foods, Inc. | 165,516 | 7,299,256 |
| Darling Ingredients, Inc.(a) | 901,173 | 19,807,783 |
| Dean Foods Co. | 500,240 | 2,005,962 |
| J&J Snack Foods Corp. | 82,187 | 12,761,997 |
| John B. Sanfilippo & Son, Inc. | 47,880 | 3,326,702 |
| Seneca Foods Corp., Class A(a) | 36,753 | 1,084,949 |
| Total | | 62,455,668 |
| Household Products 0.5% |
| Central Garden & Pet Co.(a) | 56,500 | 1,767,320 |
| Central Garden & Pet Co., Class A(a) | 224,032 | 6,239,291 |
| WD-40 Co. | 75,749 | 13,556,799 |
| Total | | 21,563,410 |
| Personal Products 0.5% |
| Avon Products, Inc.(a) | 2,421,040 | 7,481,013 |
| Inter Parfums, Inc. | 94,319 | 6,957,913 |
| Medifast, Inc. | 65,489 | 8,345,263 |
| Total | | 22,784,189 |
| Tobacco 0.2% |
| Universal Corp. | 136,660 | 8,109,404 |
| Total Consumer Staples | 144,146,209 |
| Energy 3.7% |
| Energy Equipment & Services 2.1% |
| Archrock, Inc. | 707,860 | 6,908,714 |
| Bristow Group, Inc.(a) | 195,925 | 231,191 |
| C&J Energy Services, Inc.(a) | 342,680 | 5,918,084 |
| CARBO Ceramics, Inc.(a) | 116,830 | 476,666 |
| Dril-Quip, Inc.(a) | 195,660 | 8,337,072 |
| Era Group, Inc.(a) | 111,959 | 1,289,768 |
| Exterran Corp.(a) | 172,140 | 2,938,430 |
| Common Stocks (continued) |
| Issuer | Shares | Value ($) |
| Geospace Technologies Corp.(a) | 74,440 | 1,220,816 |
| Gulf Island Fabrication, Inc. | 75,117 | 736,147 |
| Helix Energy Solutions Group, Inc.(a) | 762,190 | 5,640,206 |
| KLX Energy Services Holdings, Inc.(a) | 122,390 | 3,226,200 |
| Matrix Service Co.(a) | 148,166 | 3,095,188 |
| Nabors Industries Ltd. | 1,781,980 | 5,773,615 |
| Newpark Resources, Inc.(a) | 496,990 | 4,393,392 |
| Noble Corp. PLC(a) | 1,350,710 | 4,065,637 |
| Oil States International, Inc.(a) | 328,270 | 5,626,548 |
| Pioneer Energy Services Corp.(a) | 428,068 | 757,680 |
| ProPetro Holding Corp.(a) | 402,480 | 7,993,253 |
| SEACOR Holdings, Inc.(a) | 93,874 | 4,192,413 |
| Superior Energy Services, Inc.(a) | 845,740 | 3,958,063 |
| Tetra Technologies, Inc.(a) | 688,009 | 1,644,341 |
| Unit Corp.(a) | 295,860 | 4,600,623 |
| US Silica Holdings, Inc. | 424,220 | 6,320,878 |
| Total | | 89,344,925 |
| Oil, Gas & Consumable Fuels 1.6% |
| Bonanza Creek Energy, Inc.(a) | 102,320 | 2,350,290 |
| Carrizo Oil & Gas, Inc.(a) | 466,365 | 5,120,688 |
| CONSOL Energy, Inc.(a) | 152,030 | 5,769,539 |
| Denbury Resources, Inc.(a) | 2,520,570 | 4,839,494 |
| Green Plains, Inc. | 213,060 | 3,323,736 |
| Gulfport Energy Corp.(a) | 863,120 | 6,611,499 |
| HighPoint Resources Corp.(a) | 604,610 | 1,565,940 |
| Laredo Petroleum, Inc.(a) | 832,030 | 2,853,863 |
| Par Pacific Holdings, Inc.(a) | 163,870 | 2,769,403 |
| PDC Energy, Inc.(a) | 361,657 | 13,406,625 |
| Penn Virginia Corp.(a) | 73,430 | 3,940,254 |
| Renewable Energy Group, Inc.(a) | 204,140 | 5,424,000 |
| REX American Resources Corp.(a) | 31,160 | 2,483,764 |
| Ring Energy, Inc.(a) | 311,460 | 1,921,708 |
| SRC Energy, Inc.(a) | 1,327,760 | 6,107,696 |
| Total | | 68,488,499 |
| Total Energy | 157,833,424 |
The accompanying Notes to Financial Statements are an integral part of this statement.
Columbia Small Cap Index Fund | Annual Report 2019
| 9 |
Portfolio of Investments (continued)
February 28, 2019
| Common Stocks (continued) |
| Issuer | Shares | Value ($) |
| Financials 18.0% |
| Banks 9.3% |
| Ameris Bancorp | 218,380 | 8,903,353 |
| Banc of California, Inc. | 233,420 | 4,042,834 |
| Banner Corp. | 172,473 | 10,715,747 |
| Berkshire Hills Bancorp, Inc. | 221,220 | 6,928,610 |
| Boston Private Financial Holdings, Inc. | 461,795 | 5,490,743 |
| Brookline Bancorp, Inc. | 440,514 | 7,039,414 |
| Central Pacific Financial Corp. | 159,660 | 4,658,879 |
| City Holding Co. | 91,050 | 7,296,747 |
| Columbia Banking System, Inc. | 400,945 | 15,187,797 |
| Community Bank System, Inc. | 280,140 | 18,150,271 |
| Customers Bancorp, Inc.(a) | 159,460 | 3,410,849 |
| CVB Financial Corp. | 560,674 | 12,777,760 |
| Eagle Bancorp, Inc.(a) | 172,950 | 10,236,911 |
| Fidelity Southern Corp. | 120,890 | 3,938,596 |
| First BanCorp | 1,188,959 | 13,684,918 |
| First Commonwealth Financial Corp. | 544,142 | 7,650,637 |
| First Financial Bancorp | 535,855 | 14,859,259 |
| First Financial Bankshares, Inc. | 370,642 | 24,036,134 |
| First Midwest Bancorp, Inc. | 582,232 | 13,478,671 |
| Franklin Financial Network, Inc. | 66,780 | 2,190,384 |
| Glacier Bancorp, Inc. | 462,587 | 20,270,562 |
| Great Western Bancorp, Inc. | 315,610 | 11,851,155 |
| Hanmi Financial Corp. | 173,930 | 4,014,304 |
| Heritage Financial Corp. | 181,630 | 5,979,260 |
| Hope Bancorp, Inc. | 669,562 | 9,762,214 |
| Independent Bank Corp. | 153,686 | 13,083,289 |
| LegacyTexas Financial Group, Inc. | 246,893 | 10,302,845 |
| National Bank Holdings Corp., Class A | 141,460 | 5,110,950 |
| NBT Bancorp, Inc. | 238,990 | 9,232,184 |
| OFG Bancorp | 238,620 | 4,937,048 |
| Old National Bancorp | 824,266 | 14,655,449 |
| Opus Bank | 118,410 | 2,696,196 |
| Pacific Premier Bancorp, Inc. | 246,180 | 7,348,473 |
| Preferred Bank | 76,330 | 3,909,623 |
| S&T Bancorp, Inc. | 191,597 | 7,928,284 |
| Seacoast Banking Corp. of Florida(a) | 280,600 | 8,143,012 |
| ServisFirst Bancshares, Inc. | 250,830 | 8,771,525 |
| Common Stocks (continued) |
| Issuer | Shares | Value ($) |
| Simmons First National Corp., Class A | 506,424 | 13,587,356 |
| Southside Bancshares, Inc. | 180,885 | 6,280,327 |
| Tompkins Financial Corp. | 67,733 | 5,446,411 |
| Triumph Bancorp, Inc.(a) | 132,320 | 4,481,678 |
| United Community Banks, Inc. | 433,505 | 12,003,753 |
| Veritex Holdings, Inc. | 247,101 | 6,921,299 |
| Westamerica Bancorporation | 146,280 | 9,402,878 |
| Total | | 400,798,589 |
| Capital Markets 1.0% |
| A. Schulman, Inc. CVR(a),(b),(c) | 164,023 | 328,046 |
| Blucora, Inc.(a) | 262,539 | 7,059,674 |
| Donnelley Financial Solution, Inc.(a) | 186,626 | 2,651,956 |
| Greenhill & Co., Inc. | 95,400 | 2,245,716 |
| INTL FCStone, Inc.(a) | 86,920 | 3,781,020 |
| Investment Technology Group, Inc. | 181,003 | 5,471,721 |
| Piper Jaffray Companies | 81,148 | 5,677,114 |
| Virtus Investment Partners, Inc. | 39,117 | 4,002,060 |
| Waddell & Reed Financial, Inc., Class A | 428,640 | 7,934,126 |
| WisdomTree Investments, Inc. | 636,550 | 4,952,359 |
| Total | | 44,103,792 |
| Consumer Finance 1.1% |
| Encore Capital Group, Inc.(a) | 140,145 | 4,792,959 |
| Enova International, Inc.(a) | 187,591 | 4,787,322 |
| Ezcorp, Inc., Class A(a) | 282,494 | 2,759,967 |
| FirstCash, Inc. | 239,895 | 21,029,196 |
| PRA Group, Inc.(a) | 247,944 | 7,981,317 |
| World Acceptance Corp.(a) | 36,710 | 4,515,330 |
| Total | | 45,866,091 |
| Insurance 3.4% |
| Ambac Financial Group, Inc.(a) | 248,120 | 4,905,332 |
| American Equity Investment Life Holding Co. | 494,450 | 15,649,342 |
| AMERISAFE, Inc. | 105,460 | 6,655,581 |
| eHealth, Inc.(a) | 100,238 | 5,353,712 |
| Employers Holdings, Inc. | 179,516 | 7,478,636 |
| HCI Group, Inc. | 39,670 | 1,831,167 |
| Horace Mann Educators Corp. | 224,067 | 8,781,186 |
| James River Group Holdings Ltd. | 163,930 | 6,735,884 |
| Maiden Holdings Ltd. | 376,780 | 463,439 |
The accompanying Notes to Financial Statements are an integral part of this statement.
| 10 | Columbia Small Cap Index Fund | Annual Report 2019 |
Portfolio of Investments (continued)
February 28, 2019
| Common Stocks (continued) |
| Issuer | Shares | Value ($) |
| Navigators Group, Inc. (The) | 127,122 | 8,870,573 |
| ProAssurance Corp. | 293,546 | 11,917,968 |
| RLI Corp. | 214,246 | 15,108,628 |
| Safety Insurance Group, Inc. | 79,487 | 7,101,369 |
| Selective Insurance Group, Inc. | 322,299 | 21,258,842 |
| Stewart Information Services Corp. | 129,930 | 5,577,895 |
| Third Point Reinsurance Ltd.(a) | 407,160 | 4,352,540 |
| United Fire Group, Inc. | 116,635 | 5,684,790 |
| United Insurance Holdings Corp. | 117,630 | 1,926,779 |
| Universal Insurance Holdings, Inc. | 175,920 | 6,867,917 |
| Total | | 146,521,580 |
| Mortgage Real Estate Investment Trusts (REITS) 1.4% |
| Apollo Commercial Real Estate Finance, Inc. | 615,370 | 11,175,119 |
| ARMOUR Residential REIT, Inc. | 305,140 | 6,118,057 |
| Capstead Mortgage Corp. | 466,745 | 3,873,983 |
| Granite Point Mortgage Trust, Inc. | 275,120 | 5,232,782 |
| Invesco Mortgage Capital, Inc. | 687,440 | 10,944,045 |
| New York Mortgage Trust, Inc. | 1,002,490 | 6,014,940 |
| PennyMac Mortgage Investment Trust | 371,820 | 7,577,692 |
| Redwood Trust, Inc. | 508,690 | 7,782,957 |
| Total | | 58,719,575 |
| Thrifts & Mortgage Finance 1.8% |
| Axos Financial, Inc.(a) | 302,610 | 9,768,251 |
| Dime Community Bancshares, Inc. | 169,544 | 3,387,489 |
| Flagstar Bancorp, Inc. | 160,850 | 5,253,361 |
| HomeStreet, Inc.(a) | 147,730 | 4,121,667 |
| Meta Financial Group, Inc. | 150,970 | 3,525,150 |
| NMI Holdings, Inc., Class A(a) | 362,870 | 8,763,310 |
| Northfield Bancorp, Inc. | 257,590 | 3,840,667 |
| Northwest Bancshares, Inc. | 565,366 | 10,515,808 |
| Oritani Financial Corp. | 211,638 | 3,798,902 |
| Provident Financial Services, Inc. | 336,491 | 9,236,678 |
| TrustCo Bank Corp. | 529,015 | 4,480,757 |
| Walker & Dunlop, Inc. | 157,290 | 8,776,782 |
| Total | | 75,468,822 |
| Total Financials | 771,478,449 |
| Common Stocks (continued) |
| Issuer | Shares | Value ($) |
| Health Care 10.8% |
| Biotechnology 2.1% |
| Acorda Therapeutics, Inc.(a) | 216,035 | 3,184,356 |
| AMAG Pharmaceuticals, Inc.(a) | 189,020 | 2,814,508 |
| Cytokinetics, Inc.(a) | 299,430 | 2,161,885 |
| Eagle Pharmaceuticals, Inc.(a) | 60,190 | 3,013,713 |
| Emergent Biosolutions, Inc.(a) | 245,359 | 14,316,698 |
| Enanta Pharmaceuticals, Inc.(a) | 86,110 | 8,829,719 |
| Momenta Pharmaceuticals, Inc.(a) | 525,401 | 7,402,900 |
| Myriad Genetics, Inc.(a) | 409,170 | 12,696,545 |
| Progenics Pharmaceuticals, Inc.(a) | 462,700 | 2,045,134 |
| REGENXBIO, Inc.(a) | 164,770 | 8,523,552 |
| Repligen Corp.(a) | 213,640 | 12,715,853 |
| Spectrum Pharmaceuticals, Inc.(a) | 555,875 | 6,009,009 |
| Vanda Pharmaceuticals, Inc.(a) | 287,060 | 5,810,094 |
| Total | | 89,523,966 |
| Health Care Equipment & Supplies 2.9% |
| Angiodynamics, Inc.(a) | 203,170 | 4,553,040 |
| Anika Therapeutics, Inc.(a) | 77,780 | 2,537,961 |
| CONMED Corp. | 141,638 | 10,891,962 |
| CryoLife, Inc.(a) | 186,140 | 5,506,021 |
| Cutera, Inc.(a) | 76,100 | 1,302,832 |
| Heska Corp.(a) | 37,380 | 3,057,310 |
| Integer Holdings Corp.(a) | 163,052 | 14,831,210 |
| Invacare Corp. | 181,672 | 1,767,669 |
| Lantheus Holdings, Inc.(a) | 210,520 | 4,810,382 |
| LeMaitre Vascular, Inc. | 86,810 | 2,597,355 |
| Meridian Bioscience, Inc. | 232,070 | 3,961,435 |
| Merit Medical Systems, Inc.(a) | 300,108 | 16,725,019 |
| Natus Medical, Inc.(a) | 184,880 | 5,108,234 |
| Neogen Corp.(a) | 284,565 | 17,631,648 |
| OraSure Technologies, Inc.(a) | 335,220 | 3,603,615 |
| Orthofix Medical, Inc.(a) | 103,550 | 6,326,905 |
| SurModics, Inc.(a) | 73,329 | 4,278,747 |
| Tactile Systems Technology, Inc.(a) | 92,000 | 6,992,920 |
| Varex Imaging Corp.(a) | 208,630 | 6,559,327 |
| Total | | 123,043,592 |
The accompanying Notes to Financial Statements are an integral part of this statement.
Columbia Small Cap Index Fund | Annual Report 2019
| 11 |
Portfolio of Investments (continued)
February 28, 2019
| Common Stocks (continued) |
| Issuer | Shares | Value ($) |
| Health Care Providers & Services 2.5% |
| Addus HomeCare Corp.(a) | 55,200 | 3,709,992 |
| AMN Healthcare Services, Inc.(a) | 256,510 | 12,828,065 |
| BioTelemetry, Inc.(a) | 182,270 | 13,619,215 |
| Community Health Systems, Inc.(a) | 636,420 | 3,150,279 |
| Corvel Corp.(a) | 50,278 | 3,383,709 |
| Cross Country Healthcare, Inc.(a) | 198,401 | 1,734,025 |
| Diplomat Pharmacy, Inc.(a) | 309,780 | 1,998,081 |
| Ensign Group, Inc. (The) | 269,158 | 13,309,863 |
| LHC Group, Inc.(a) | 159,690 | 17,516,396 |
| Magellan Health, Inc.(a) | 132,746 | 9,041,330 |
| Owens & Minor, Inc. | 340,800 | 2,126,592 |
| Providence Service Corp. (The)(a) | 60,300 | 4,300,596 |
| Quorum Health Corp.(a) | 139,770 | 389,958 |
| Select Medical Holdings Corp.(a) | 592,540 | 8,781,443 |
| Tivity Health, Inc.(a) | 224,151 | 4,796,832 |
| U.S. Physical Therapy, Inc. | 69,430 | 7,653,963 |
| Total | | 108,340,339 |
| Health Care Technology 1.2% |
| Computer Programs & Systems, Inc. | 65,531 | 2,158,591 |
| HealthStream, Inc. | 139,759 | 3,885,300 |
| HMS Holdings Corp.(a) | 459,220 | 15,824,721 |
| NextGen Healthcare, Inc.(a) | 261,903 | 4,583,303 |
| Omnicell, Inc.(a) | 216,875 | 18,423,531 |
| Tabula Rasa HealthCare, Inc.(a) | 92,970 | 5,123,577 |
| Total | | 49,999,023 |
| Life Sciences Tools & Services 0.7% |
| Cambrex Corp.(a) | 183,673 | 7,593,042 |
| Luminex Corp. | 226,904 | 5,781,514 |
| Medpace Holdings, Inc.(a) | 142,250 | 7,816,637 |
| NeoGenomics, Inc.(a) | 508,460 | 9,965,816 |
| Total | | 31,157,009 |
| Pharmaceuticals 1.4% |
| Akorn, Inc.(a) | 515,110 | 2,086,195 |
| Amphastar Pharmaceuticals, Inc.(a) | 189,220 | 4,702,117 |
| ANI Pharmaceuticals, Inc.(a) | 45,390 | 2,986,208 |
| Assertio Therapeutics, Inc.(a) | 349,940 | 1,448,752 |
| Corcept Therapeutics, Inc.(a) | 575,100 | 7,171,497 |
| Common Stocks (continued) |
| Issuer | Shares | Value ($) |
| Endo International PLC(a) | 1,092,780 | 12,009,652 |
| Innoviva, Inc.(a) | 370,510 | 5,817,007 |
| Lannett Co., Inc.(a) | 185,480 | 1,745,367 |
| Medicines Co. (The)(a) | 359,777 | 8,875,699 |
| Phibro Animal Health Corp., Class A | 110,610 | 3,240,873 |
| Supernus Pharmaceuticals, Inc.(a) | 286,000 | 11,680,240 |
| Total | | 61,763,607 |
| Total Health Care | 463,827,536 |
| Industrials 18.3% |
| Aerospace & Defense 2.3% |
| AAR Corp. | 178,353 | 6,515,235 |
| Aerojet Rocketdyne Holdings, Inc.(a) | 394,257 | 14,686,073 |
| Aerovironment, Inc.(a) | 116,549 | 9,285,459 |
| Axon Enterprise, Inc.(a) | 319,890 | 17,219,679 |
| Cubic Corp. | 156,337 | 9,645,993 |
| Mercury Systems, Inc.(a) | 264,899 | 16,826,384 |
| Moog, Inc., Class A | 177,854 | 16,711,162 |
| National Presto Industries, Inc. | 27,507 | 3,084,635 |
| Triumph Group, Inc. | 272,750 | 6,316,890 |
| Total | | 100,291,510 |
| Air Freight & Logistics 0.7% |
| Atlas Air Worldwide Holdings, Inc.(a) | 140,055 | 7,526,556 |
| Echo Global Logistics, Inc.(a) | 156,240 | 3,752,885 |
| Forward Air Corp. | 159,819 | 10,332,298 |
| HUB Group, Inc., Class A(a) | 183,957 | 7,906,472 |
| Total | | 29,518,211 |
| Airlines 0.8% |
| Allegiant Travel Co. | 69,872 | 9,230,091 |
| Hawaiian Holdings, Inc. | 270,380 | 8,043,805 |
| Skywest, Inc. | 284,019 | 15,348,387 |
| Total | | 32,622,283 |
| Building Products 2.2% |
| AAON, Inc. | 222,389 | 8,864,426 |
| American Woodmark Corp.(a) | 84,090 | 7,164,468 |
| Apogee Enterprises, Inc. | 154,240 | 5,504,826 |
| Gibraltar Industries, Inc.(a) | 175,497 | 7,107,628 |
| Griffon Corp. | 184,985 | 3,300,132 |
| Insteel Industries, Inc. | 99,940 | 2,273,635 |
The accompanying Notes to Financial Statements are an integral part of this statement.
| 12 | Columbia Small Cap Index Fund | Annual Report 2019 |
Portfolio of Investments (continued)
February 28, 2019
| Common Stocks (continued) |
| Issuer | Shares | Value ($) |
| Patrick Industries, Inc.(a) | 124,820 | 5,643,112 |
| PGT, Inc.(a) | 317,110 | 4,782,019 |
| Quanex Building Products Corp. | 192,454 | 3,308,284 |
| Simpson Manufacturing Co., Inc. | 226,426 | 13,569,710 |
| Trex Co., Inc.(a) | 321,560 | 24,100,922 |
| Universal Forest Products, Inc. | 337,440 | 10,450,517 |
| Total | | 96,069,679 |
| Commercial Services & Supplies 2.4% |
| ABM Industries, Inc. | 360,408 | 12,852,149 |
| Brady Corp., Class A | 267,836 | 12,671,321 |
| Interface, Inc. | 325,749 | 5,782,045 |
| LSC Communications, Inc. | 182,356 | 1,542,732 |
| Matthews International Corp., Class A | 175,540 | 6,981,226 |
| Mobile Mini, Inc. | 244,599 | 8,808,010 |
| Multi-Color Corp. | 76,360 | 3,806,546 |
| RR Donnelley & Sons Co. | 385,303 | 2,072,930 |
| Team, Inc.(a) | 164,590 | 2,570,896 |
| Tetra Tech, Inc. | 302,964 | 18,183,899 |
| U.S. Ecology, Inc. | 120,630 | 6,921,749 |
| Unifirst Corp. | 84,462 | 12,147,325 |
| Viad Corp. | 111,322 | 6,445,544 |
| Total | | 100,786,372 |
| Construction & Engineering 0.6% |
| Aegion Corp.(a) | 176,858 | 3,070,255 |
| Arcosa, Inc. | 266,900 | 8,938,481 |
| Comfort Systems U.S.A., Inc. | 203,323 | 10,902,179 |
| MYR Group, Inc.(a) | 90,660 | 3,040,736 |
| Orion Group Holdings, Inc.(a) | 158,538 | 673,787 |
| Total | | 26,625,438 |
| Electrical Equipment 0.4% |
| AZZ, Inc. | 142,575 | 6,561,301 |
| Encore Wire Corp. | 114,274 | 6,769,592 |
| Powell Industries, Inc. | 47,705 | 1,530,853 |
| Vicor Corp.(a) | 88,619 | 2,816,312 |
| Total | | 17,678,058 |
| Industrial Conglomerates 0.2% |
| Raven Industries, Inc. | 196,790 | 7,855,857 |
| Common Stocks (continued) |
| Issuer | Shares | Value ($) |
| Machinery 5.5% |
| Actuant Corp., Class A | 334,204 | 8,171,288 |
| Alamo Group, Inc. | 52,670 | 5,058,427 |
| Albany International Corp., Class A | 158,722 | 12,308,891 |
| Astec Industries, Inc. | 124,777 | 4,761,490 |
| Barnes Group, Inc. | 258,340 | 15,001,804 |
| Briggs & Stratton Corp. | 231,994 | 3,041,441 |
| Chart Industries, Inc.(a) | 170,780 | 15,076,458 |
| CIRCOR International, Inc.(a) | 108,602 | 3,424,221 |
| EnPro Industries, Inc. | 113,503 | 7,785,171 |
| ESCO Technologies, Inc. | 141,812 | 9,811,972 |
| Federal Signal Corp. | 329,706 | 8,104,173 |
| Franklin Electric Co., Inc. | 212,346 | 11,298,931 |
| Greenbrier Companies, Inc. (The) | 177,050 | 7,303,313 |
| Harsco Corp.(a) | 439,550 | 9,837,129 |
| Hillenbrand, Inc. | 341,225 | 15,112,855 |
| John Bean Technologies Corp. | 172,988 | 16,208,976 |
| Lindsay Corp. | 58,878 | 5,444,449 |
| Lydall, Inc.(a) | 95,268 | 2,681,794 |
| Mueller Industries, Inc. | 315,630 | 10,431,571 |
| Proto Labs, Inc.(a) | 148,150 | 16,739,468 |
| SPX Corp.(a) | 237,480 | 8,634,773 |
| SPX FLOW, Inc.(a) | 232,890 | 8,039,363 |
| Standex International Corp. | 70,218 | 5,758,578 |
| Tennant Co. | 99,200 | 6,269,440 |
| Titan International, Inc. | 275,460 | 1,724,380 |
| Wabash National Corp. | 306,670 | 4,550,983 |
| Watts Water Technologies, Inc., Class A | 151,955 | 12,238,456 |
| Total | | 234,819,795 |
| Marine 0.2% |
| Matson, Inc. | 233,720 | 8,439,629 |
| Professional Services 1.8% |
| Exponent, Inc. | 284,660 | 16,120,296 |
| Forrester Research, Inc. | 55,980 | 2,810,196 |
| FTI Consulting, Inc.(a) | 210,090 | 15,580,274 |
| Heidrick & Struggles International, Inc. | 103,762 | 4,473,180 |
| Kelly Services, Inc., Class A | 170,659 | 4,118,002 |
| Korn/Ferry International | 310,187 | 15,134,024 |
The accompanying Notes to Financial Statements are an integral part of this statement.
Columbia Small Cap Index Fund | Annual Report 2019
| 13 |
Portfolio of Investments (continued)
February 28, 2019
| Common Stocks (continued) |
| Issuer | Shares | Value ($) |
| Navigant Consulting, Inc. | 233,092 | 4,799,364 |
| Resources Connection, Inc. | 162,277 | 2,818,752 |
| TrueBlue, Inc.(a) | 221,571 | 5,100,564 |
| Wageworks, Inc.(a) | 216,930 | 7,136,997 |
| Total | | 78,091,649 |
| Road & Rail 0.6% |
| ArcBest Corp. | 140,605 | 4,897,272 |
| Heartland Express, Inc. | 260,066 | 5,224,726 |
| Marten Transport Ltd. | 211,633 | 3,946,956 |
| Saia, Inc.(a) | 140,620 | 9,303,419 |
| Total | | 23,372,373 |
| Trading Companies & Distributors 0.6% |
| Applied Industrial Technologies, Inc. | 212,111 | 12,332,134 |
| DXP Enterprises, Inc.(a) | 87,510 | 3,095,229 |
| Kaman Corp. | 153,021 | 9,423,033 |
| Veritiv Corp.(a) | 69,380 | 2,004,388 |
| Total | | 26,854,784 |
| Total Industrials | 783,025,638 |
| Information Technology 14.5% |
| Communications Equipment 1.4% |
| ADTRAN, Inc. | 260,790 | 3,917,066 |
| Applied Optoelectronics, Inc.(a) | 102,940 | 1,389,690 |
| CalAmp Corp.(a) | 190,245 | 2,644,406 |
| Comtech Telecommunications Corp. | 130,837 | 3,467,181 |
| Digi International, Inc.(a) | 150,337 | 1,984,448 |
| Extreme Networks, Inc.(a) | 647,660 | 5,323,765 |
| Finisar Corp.(a) | 642,550 | 15,736,049 |
| Harmonic, Inc.(a) | 474,496 | 2,619,218 |
| NETGEAR, Inc.(a) | 172,565 | 6,186,455 |
| Viavi Solutions, Inc.(a) | 1,250,160 | 16,414,601 |
| Total | | 59,682,879 |
| Electronic Equipment, Instruments & Components 4.2% |
| Anixter International, Inc.(a) | 157,591 | 9,247,440 |
| Arlo Technologies, Inc.(a) | 412,177 | 1,784,726 |
| Badger Meter, Inc. | 159,336 | 9,375,330 |
| Bel Fuse, Inc., Class B | 55,120 | 1,347,684 |
| Benchmark Electronics, Inc. | 239,221 | 6,554,655 |
| Control4 Corp.(a) | 146,170 | 2,632,522 |
| Common Stocks (continued) |
| Issuer | Shares | Value ($) |
| CTS Corp. | 181,087 | 5,816,514 |
| Daktronics, Inc. | 216,063 | 1,754,432 |
| ePlus, Inc.(a) | 75,010 | 6,708,894 |
| Fabrinet(a) | 201,590 | 11,793,015 |
| FARO Technologies, Inc.(a) | 94,426 | 4,325,655 |
| II-VI, Inc.(a) | 327,113 | 13,895,760 |
| Insight Enterprises, Inc.(a) | 194,184 | 10,839,351 |
| Itron, Inc.(a) | 183,370 | 9,720,444 |
| KEMET Corp. | 314,390 | 5,957,691 |
| Knowles Corp.(a) | 493,690 | 8,037,273 |
| Methode Electronics, Inc. | 202,431 | 5,680,214 |
| MTS Systems Corp. | 97,801 | 5,212,793 |
| OSI Systems, Inc.(a) | 92,397 | 8,024,679 |
| Park Electrochemical Corp. | 105,427 | 1,833,376 |
| Plexus Corp.(a) | 172,214 | 10,635,937 |
| Rogers Corp.(a) | 100,646 | 15,625,291 |
| Sanmina Corp.(a) | 373,620 | 11,933,423 |
| Scansource, Inc.(a) | 140,155 | 5,262,820 |
| TTM Technologies, Inc.(a) | 505,013 | 6,120,758 |
| Total | | 180,120,677 |
| IT Services 2.0% |
| Cardtronics PLC, Class A(a) | 204,398 | 6,031,785 |
| CSG Systems International, Inc. | 182,407 | 7,579,011 |
| EVERTEC, Inc. | 330,430 | 9,456,906 |
| ExlService Holdings, Inc.(a) | 187,490 | 11,511,886 |
| Mantech International Corp., Class A | 145,280 | 7,895,968 |
| NIC, Inc. | 364,335 | 6,226,485 |
| Perficient, Inc.(a) | 181,603 | 5,195,662 |
| Sykes Enterprises, Inc.(a) | 217,753 | 6,443,311 |
| Travelport Worldwide Ltd. | 718,140 | 11,289,161 |
| TTEC Holdings, Inc. | 75,845 | 2,598,450 |
| Unisys Corp.(a) | 279,260 | 3,772,803 |
| Virtusa Corp.(a) | 150,608 | 7,601,186 |
| Total | | 85,602,614 |
| Semiconductors & Semiconductor Equipment 3.8% |
| Advanced Energy Industries, Inc.(a) | 210,653 | 10,610,592 |
| Axcelis Technologies, Inc.(a) | 177,390 | 3,728,738 |
| Brooks Automation, Inc. | 392,829 | 12,613,739 |
| Cabot Microelectronics Corp. | 156,817 | 17,736,003 |
The accompanying Notes to Financial Statements are an integral part of this statement.
| 14 | Columbia Small Cap Index Fund | Annual Report 2019 |
Portfolio of Investments (continued)
February 28, 2019
| Common Stocks (continued) |
| Issuer | Shares | Value ($) |
| Ceva, Inc.(a) | 119,865 | 3,334,644 |
| Cohu, Inc. | 222,756 | 3,985,105 |
| Diodes, Inc.(a) | 217,137 | 8,757,135 |
| DSP Group, Inc.(a) | 105,683 | 1,451,027 |
| Formfactor, Inc.(a) | 405,560 | 6,428,126 |
| Ichor Holdings Ltd.(a) | 125,070 | 2,622,718 |
| Kopin Corp.(a) | 335,439 | 513,222 |
| Kulicke & Soffa Industries, Inc. | 367,635 | 8,573,248 |
| MaxLinear, Inc., Class A(a) | 343,480 | 8,635,087 |
| Nanometrics, Inc.(a) | 132,530 | 3,771,804 |
| PDF Solutions, Inc.(a) | 151,910 | 1,809,248 |
| Photronics, Inc.(a) | 374,290 | 3,671,785 |
| Power Integrations, Inc. | 160,514 | 11,727,153 |
| Rambus, Inc.(a) | 593,830 | 6,098,634 |
| Rudolph Technologies, Inc.(a) | 174,595 | 3,942,355 |
| Semtech Corp.(a) | 360,170 | 19,823,757 |
| SMART Global Holdings, Inc.(a) | 68,050 | 1,994,545 |
| SolarEdge Technologies, Inc.(a) | 235,380 | 9,947,159 |
| Ultra Clean Holdings, Inc.(a) | 213,520 | 2,273,988 |
| Veeco Instruments, Inc.(a) | 261,574 | 2,987,175 |
| Xperi Corp. | 264,994 | 6,359,856 |
| Total | | 163,396,843 |
| Software 2.5% |
| 8x8, Inc.(a) | 521,970 | 10,267,150 |
| Agilysys, Inc.(a) | 96,574 | 2,018,397 |
| Alarm.com Holdings, Inc.(a) | 191,790 | 12,587,178 |
| Bottomline Technologies de, Inc.(a) | 200,322 | 9,992,061 |
| Ebix, Inc. | 123,218 | 7,179,913 |
| LivePerson, Inc.(a) | 319,312 | 8,927,964 |
| MicroStrategy, Inc., Class A(a) | 47,079 | 6,661,679 |
| Monotype Imaging Holdings, Inc. | 227,361 | 4,456,276 |
| OneSpan, Inc.(a) | 171,853 | 3,660,469 |
| Progress Software Corp. | 245,753 | 9,038,795 |
| Qualys, Inc.(a) | 185,350 | 15,500,820 |
| SPS Commerce, Inc.(a) | 96,680 | 10,323,490 |
| TiVo Corp. | 678,250 | 6,802,847 |
| Total | | 107,417,039 |
| Common Stocks (continued) |
| Issuer | Shares | Value ($) |
| Technology Hardware, Storage & Peripherals 0.6% |
| 3D Systems Corp.(a) | 624,910 | 8,823,729 |
| Cray, Inc.(a) | 223,500 | 5,482,455 |
| Diebold, Inc. | 416,630 | 3,828,830 |
| Electronics for Imaging, Inc.(a) | 240,438 | 6,501,443 |
| Total | | 24,636,457 |
| Total Information Technology | 620,856,509 |
| Materials 4.5% |
| Chemicals 2.9% |
| AdvanSix, Inc.(a) | 163,110 | 5,341,853 |
| American Vanguard Corp. | 146,031 | 2,742,462 |
| Balchem Corp. | 176,492 | 15,660,135 |
| FutureFuel Corp. | 141,250 | 2,604,650 |
| Hawkins, Inc. | 52,807 | 2,176,705 |
| HB Fuller Co. | 277,463 | 14,006,332 |
| Ingevity Corp.(a) | 229,700 | 26,466,034 |
| Innophos Holdings, Inc. | 107,360 | 3,564,352 |
| Innospec, Inc. | 133,670 | 10,942,226 |
| Koppers Holdings, Inc.(a) | 112,242 | 2,760,031 |
| Kraton Performance Polymers, Inc.(a) | 174,905 | 6,223,120 |
| LSB Industries, Inc.(a) | 111,205 | 783,995 |
| Quaker Chemical Corp. | 72,973 | 15,250,627 |
| Rayonier Advanced Materials, Inc. | 279,460 | 3,937,592 |
| Stepan Co. | 110,909 | 10,436,537 |
| Tredegar Corp. | 139,808 | 2,435,455 |
| Total | | 125,332,106 |
| Construction Materials 0.1% |
| U.S. Concrete, Inc.(a) | 87,450 | 3,507,620 |
| Containers & Packaging 0.1% |
| Myers Industries, Inc. | 193,479 | 3,691,579 |
| Metals & Mining 0.8% |
| AK Steel Holding Corp.(a) | 1,726,965 | 5,215,434 |
| Century Aluminum Co.(a) | 268,584 | 2,317,880 |
| Haynes International, Inc. | 68,434 | 2,407,508 |
| Kaiser Aluminum Corp. | 90,319 | 9,888,124 |
| Materion Corp. | 110,799 | 6,401,966 |
| Olympic Steel, Inc. | 50,004 | 971,078 |
The accompanying Notes to Financial Statements are an integral part of this statement.
Columbia Small Cap Index Fund | Annual Report 2019
| 15 |
Portfolio of Investments (continued)
February 28, 2019
| Common Stocks (continued) |
| Issuer | Shares | Value ($) |
| SunCoke Energy, Inc.(a) | 354,367 | 3,515,321 |
| TimkenSteel Corp.(a) | 214,730 | 2,675,536 |
| Total | | 33,392,847 |
| Paper & Forest Products 0.6% |
| Boise Cascade Co. | 212,950 | 5,939,175 |
| Clearwater Paper Corp.(a) | 90,091 | 2,576,603 |
| Mercer International, Inc. | 236,560 | 3,387,539 |
| Neenah, Inc. | 92,315 | 6,238,648 |
| PH Glatfelter Co. | 239,619 | 3,222,875 |
| Schweitzer-Mauduit International, Inc. | 168,387 | 6,493,003 |
| Total | | 27,857,843 |
| Total Materials | 193,781,995 |
| Real Estate 6.6% |
| Equity Real Estate Investment Trusts (REITS) 6.2% |
| Acadia Realty Trust | 446,342 | 12,716,284 |
| Agree Realty Corp. | 188,725 | 12,404,894 |
| American Assets Trust, Inc. | 206,760 | 8,981,654 |
| Armada Hoffler Properties, Inc. | 271,610 | 4,155,633 |
| CareTrust REIT, Inc. | 486,256 | 10,862,959 |
| CBL & Associates Properties, Inc. | 945,020 | 2,022,343 |
| Cedar Realty Trust, Inc. | 482,876 | 1,680,409 |
| Chatham Lodging Trust | 254,580 | 5,086,508 |
| Chesapeake Lodging Trust | 330,540 | 9,955,865 |
| Community Healthcare Trust, Inc. | 96,360 | 3,439,088 |
| DiamondRock Hospitality Co. | 1,137,958 | 12,164,771 |
| Easterly Government Properties, Inc. | 332,860 | 5,984,823 |
| EastGroup Properties, Inc. | 197,252 | 20,841,646 |
| Four Corners Property Trust, Inc. | 370,824 | 10,156,869 |
| Franklin Street Properties Corp. | 586,875 | 4,248,975 |
| Getty Realty Corp. | 184,126 | 6,066,952 |
| Global Net Lease, Inc. | 416,340 | 7,427,506 |
| Hersha Hospitality Trust | 198,510 | 3,741,914 |
| Independence Realty Trust, Inc. | 486,670 | 5,041,901 |
| Innovative Industrial Properties, Inc. | 53,710 | 4,242,553 |
| iStar, Inc. | 372,100 | 3,255,875 |
| Kite Realty Group Trust | 458,170 | 7,211,596 |
| Lexington Realty Trust | 1,150,889 | 10,691,759 |
| LTC Properties, Inc. | 217,041 | 9,640,961 |
| National Storage Affiliates Trust | 309,610 | 8,768,155 |
| Common Stocks (continued) |
| Issuer | Shares | Value ($) |
| NorthStar Realty Europe Corp. | 273,710 | 4,910,357 |
| Office Properties Income Trust | 263,165 | 8,029,164 |
| Pennsylvania Real Estate Investment Trust | 350,944 | 2,158,306 |
| PS Business Parks, Inc. | 109,260 | 16,079,794 |
| Retail Opportunity Investments Corp. | 623,840 | 10,711,333 |
| RPT Realty | 438,680 | 5,562,462 |
| Saul Centers, Inc. | 63,082 | 3,574,857 |
| Summit Hotel Properties, Inc. | 573,360 | 6,530,570 |
| Universal Health Realty Income Trust | 69,216 | 5,154,516 |
| Urstadt Biddle Properties, Inc., Class A | 163,176 | 3,413,642 |
| Washington Prime Group, Inc. | 1,018,380 | 5,886,236 |
| Whitestone REIT | 217,680 | 2,832,017 |
| Total | | 265,635,147 |
| Real Estate Management & Development 0.4% |
| HFF, Inc., Class A | 214,087 | 9,676,732 |
| Marcus & Millichap, Inc.(a) | 116,350 | 4,493,437 |
| RE/MAX Holdings, Inc., Class A | 97,120 | 3,810,018 |
| Total | | 17,980,187 |
| Total Real Estate | 283,615,334 |
| Utilities 1.8% |
| Electric Utilities 0.3% |
| El Paso Electric Co. | 222,705 | 11,981,529 |
| Gas Utilities 0.6% |
| Northwest Natural Holding Co. | 157,865 | 10,138,090 |
| South Jersey Industries, Inc. | 504,916 | 14,617,318 |
| Total | | 24,755,408 |
| Multi-Utilities 0.3% |
| Avista Corp. | 359,514 | 14,527,961 |
| Water Utilities 0.6% |
| American States Water Co. | 201,104 | 14,304,527 |
| California Water Service Group | 263,080 | 13,685,422 |
| Total | | 27,989,949 |
| Total Utilities | 79,254,847 |
Total Common Stocks
(Cost $3,050,767,326) | 4,157,652,720 |
|
The accompanying Notes to Financial Statements are an integral part of this statement.
| 16 | Columbia Small Cap Index Fund | Annual Report 2019 |
Portfolio of Investments (continued)
February 28, 2019
| Exchange-Traded Funds 0.9% |
| | Shares | Value ($) |
| iShares Core S&P Small-Cap ETF | 495,000 | 39,609,900 |
Total Exchange-Traded Funds
(Cost $36,065,700) | 39,609,900 |
|
| Money Market Funds 1.9% |
| | |
| Columbia Short-Term Cash Fund, 2.523%(d),(e) | 82,523,982 | 82,515,730 |
Total Money Market Funds
(Cost $82,515,730) | 82,515,730 |
Total Investments in Securities
(Cost: $3,169,348,756) | 4,279,778,350 |
| Other Assets & Liabilities, Net | | 7,494,990 |
| Net Assets | 4,287,273,340 |
At February 28, 2019, securities and/or cash totaling $4,093,150 were pledged as collateral.
Investments in derivatives
| Long futures contracts |
| Description | Number of
contracts | Expiration
date | Trading
currency | Notional
amount | Value/Unrealized
appreciation ($) | Value/Unrealized
depreciation ($) |
| Russell 2000 E-mini | 1,134 | 03/2019 | USD | 89,330,850 | 7,209,830 | — |
Notes to Portfolio of Investments
| (a) | Non-income producing investment. |
| (b) | Represents fair value as determined in good faith under procedures approved by the Board of Trustees. At February 28, 2019, the total value of these securities amounted to $328,046, which represents 0.01% of total net assets. |
| (c) | Valuation based on significant unobservable inputs. |
| (d) | The rate shown is the seven-day current annualized yield at February 28, 2019. |
| (e) | As defined in the Investment Company Act of 1940, an affiliated company is one in which the Fund owns 5% or more of the company’s outstanding voting securities, or a company which is under common ownership or control with the Fund. Holdings and transactions in these affiliated companies during the year ended February 28, 2019 are as follows: |
| Issuer | Beginning
shares | Shares
purchased | Shares
sold | Ending
shares | Realized gain
(loss) —
affiliated
issuers ($) | Net change in
unrealized
appreciation
(depreciation) —
affiliated
issuers ($) | Dividends —
affiliated
issuers ($) | Value —
affiliated
issuers
at end of
period ($) |
| Columbia Short-Term Cash Fund, 2.523% |
| | 47,376,462 | 821,459,179 | (786,311,659) | 82,523,982 | (11,444) | 1,703 | 1,222,367 | 82,515,730 |
Currency Legend
Fair value measurements
The Fund categorizes its fair value measurements according to a three-level hierarchy that maximizes the use of observable inputs and minimizes the use of unobservable inputs by prioritizing that the most observable input be used when available. Observable inputs are those that market participants would use in pricing an investment based on market data obtained from sources independent of the reporting entity. Unobservable inputs are those that reflect the Fund’s assumptions about the information market participants would use in
The accompanying Notes to Financial Statements are an integral part of this statement.
Columbia Small Cap Index Fund | Annual Report 2019
| 17 |
Portfolio of Investments (continued)
February 28, 2019
Fair value measurements (continued)
pricing an investment. An investment’s level within the fair value hierarchy is based on the lowest level of any input that is deemed significant to the asset’s or liability’s fair value measurement. The input levels are not necessarily an indication of the risk or liquidity associated with investments at that level. For example, certain U.S. government securities are generally high quality and liquid, however, they are reflected as Level 2 because the inputs used to determine fair value may not always be quoted prices in an active market.
Fair value inputs are summarized in the three broad levels listed below:
| ■ | Level 1 — Valuations based on quoted prices for investments in active markets that the Fund has the ability to access at the measurement date. Valuation adjustments are not applied to Level 1 investments. |
| ■ | Level 2 — Valuations based on other significant observable inputs (including quoted prices for similar securities, interest rates, prepayment speeds, credit risks, etc.). |
| ■ | Level 3 — Valuations based on significant unobservable inputs (including the Fund’s own assumptions and judgment in determining the fair value of investments). |
Inputs that are used in determining fair value of an investment may include price information, credit data, volatility statistics, and other factors. These inputs can be either observable or unobservable. The availability of observable inputs can vary between investments, and is affected by various factors such as the type of investment, and the volume and level of activity for that investment or similar investments in the marketplace. The inputs will be considered by the Investment Manager, along with any other relevant factors in the calculation of an investment’s fair value. The Fund uses prices and inputs that are current as of the measurement date, which may include periods of market dislocations. During these periods, the availability of prices and inputs may be reduced for many investments. This condition could cause an investment to be reclassified between the various levels within the hierarchy.
Certain investments that have been measured at fair value using the net asset value (NAV) per share (or its equivalent) are not categorized in the fair value hierarchy. The fair value amounts presented in the table are intended to reconcile the fair value hierarchy to the amounts presented in the Portfolio of Investments. The Columbia Short-Term Cash Fund seeks to provide shareholders with maximum current income consistent with liquidity and stability of principal. Columbia Short-Term Cash Fund prices its shares with a floating NAV and no longer seeks to maintain a stable NAV.
Investments falling into the Level 3 category are primarily supported by quoted prices from brokers and dealers participating in the market for those investments. However, these may be classified as Level 3 investments due to lack of market transparency and corroboration to support these quoted prices. Additionally, valuation models may be used as the pricing source for any remaining investments classified as Level 3. These models may rely on one or more significant unobservable inputs and/or significant assumptions by the Investment Manager. Inputs used in valuations may include, but are not limited to, financial statement analysis, capital account balances, discount rates and estimated cash flows, and comparable company data.
Under the direction of the Fund’s Board of Trustees (the Board), the Investment Manager’s Valuation Committee (the Committee) is responsible for overseeing the valuation procedures approved by the Board. The Committee consists of voting and non-voting members from various groups within the Investment Manager’s organization, including operations and accounting, trading and investments, compliance, risk management and legal.
The Committee meets at least monthly to review and approve valuation matters, which may include a description of specific valuation determinations, data regarding pricing information received from approved pricing vendors and brokers and the results of Board-approved valuation control policies and procedures (the Policies). The Policies address, among other things, instances when market quotations are or are not readily available, including recommendations of third party pricing vendors and a determination of appropriate pricing methodologies; events that require specific valuation determinations and assessment of fair value techniques; securities with a potential for stale pricing, including those that are illiquid, restricted, or in default; and the effectiveness of third party pricing vendors, including periodic reviews of vendors. The Committee meets more frequently, as needed, to discuss additional valuation matters, which may include the need to review back-testing results, review time-sensitive information or approve related valuation actions. The Committee reports to the Board, with members of the Committee meeting with the Board at each of its regularly scheduled meetings to discuss valuation matters and actions during the period, similar to those described earlier.
For investments categorized as Level 3, the Committee monitors information similar to that described above, which may include: (i) data specific to the issuer or comparable issuers, (ii) general market or specific sector news and (iii) quoted prices and specific or similar security transactions. The Committee considers this data and any changes from prior periods in order to assess the reasonableness of observable and unobservable inputs, any assumptions or internal models used to value those securities and changes in fair value. This data is also used to corroborate, when available, information received from approved pricing vendors and brokers. Various factors impact the frequency of monitoring this information (which may occur as often as daily). However, the Committee may determine that changes to inputs, assumptions and models are not required as a result of the monitoring procedures performed.
The following table is a summary of the inputs used to value the Fund’s investments at February 28, 2019:
| | Level 1
quoted prices
in active
markets for
identical
assets ($) | Level 2
other
significant
observable
inputs ($) | Level 3
significant
unobservable
inputs ($) | Investments
measured at
net asset
value ($) | Total ($) |
| Investments in Securities | | | | | |
| Common Stocks | | | | | |
| Communication Services | 85,477,678 | — | — | — | 85,477,678 |
| Consumer Discretionary | 574,355,101 | — | — | — | 574,355,101 |
| Consumer Staples | 144,146,209 | — | — | — | 144,146,209 |
| Energy | 157,833,424 | — | — | — | 157,833,424 |
| Financials | 771,150,403 | — | 328,046 | — | 771,478,449 |
| Health Care | 463,827,536 | — | — | — | 463,827,536 |
| Industrials | 783,025,638 | — | — | — | 783,025,638 |
| Information Technology | 620,856,509 | — | — | — | 620,856,509 |
| Materials | 193,781,995 | — | — | — | 193,781,995 |
The accompanying Notes to Financial Statements are an integral part of this statement.
| 18 | Columbia Small Cap Index Fund | Annual Report 2019 |
Portfolio of Investments (continued)
February 28, 2019
Fair value measurements (continued)
| | Level 1
quoted prices
in active
markets for
identical
assets ($) | Level 2
other
significant
observable
inputs ($) | Level 3
significant
unobservable
inputs ($) | Investments
measured at
net asset
value ($) | Total ($) |
| Real Estate | 283,615,334 | — | — | — | 283,615,334 |
| Utilities | 79,254,847 | — | — | — | 79,254,847 |
| Total Common Stocks | 4,157,324,674 | — | 328,046 | — | 4,157,652,720 |
| Exchange-Traded Funds | 39,609,900 | — | — | — | 39,609,900 |
| Money Market Funds | — | — | — | 82,515,730 | 82,515,730 |
| Total Investments in Securities | 4,196,934,574 | — | 328,046 | 82,515,730 | 4,279,778,350 |
| Investments in Derivatives | | | | | |
| Asset | | | | | |
| Futures Contracts | 7,209,830 | — | — | — | 7,209,830 |
| Total | 4,204,144,404 | — | 328,046 | 82,515,730 | 4,286,988,180 |
See the Portfolio of Investments for all investment classifications not indicated in the table.
Derivative instruments are valued at unrealized appreciation (depreciation).
There were no transfers of financial assets between levels during the period.
The Fund does not hold any significant investments (greater than one percent of net assets) categorized as Level 3.
The Fund’s assets assigned to the Level 3 category are valued utilizing the valuation technique deemed the most appropriate in the circumstances. Certain rights classified as Level 3 are valued using an income approach. To determine fair value for these securities, management considered estimates of future distributions related to the potential actions of the respective company’s restructuring. Significant increases (decreases) to any of these inputs would result in a significantly higher (lower) fair value measurement.
The accompanying Notes to Financial Statements are an integral part of this statement.
Columbia Small Cap Index Fund | Annual Report 2019
| 19 |
Statement of Assets and Liabilities
February 28, 2019
| Assets | |
| Investments in securities, at value | |
| Unaffiliated issuers (cost $3,086,833,026) | $4,197,262,620 |
| Affiliated issuers (cost $82,515,730) | 82,515,730 |
| Cash | 77,393 |
| Margin deposits on: | |
| Futures contracts | 4,093,150 |
| Receivable for: | |
| Capital shares sold | 7,814,712 |
| Dividends | 2,502,719 |
| Expense reimbursement due from Investment Manager | 220 |
| Total assets | 4,294,266,544 |
| Liabilities | |
| Payable for: | |
| Investments purchased | 492,360 |
| Capital shares purchased | 5,877,089 |
| Variation margin for futures contracts | 381,202 |
| Management services fees | 23,554 |
| Distribution and/or service fees | 9,915 |
| Compensation of board members | 203,897 |
| Other expenses | 5,187 |
| Total liabilities | 6,993,204 |
| Net assets applicable to outstanding capital stock | $4,287,273,340 |
| Represented by | |
| Paid in capital | 3,150,449,209 |
| Total distributable earnings (loss) (Note 2) | 1,136,824,131 |
| Total - representing net assets applicable to outstanding capital stock | $4,287,273,340 |
| Class A | |
| Net assets | $1,440,664,828 |
| Shares outstanding | 61,192,672 |
| Net asset value per share | $23.54 |
| Institutional Class | |
| Net assets | $2,026,925,020 |
| Shares outstanding | 85,562,376 |
| Net asset value per share | $23.69 |
| Institutional 2 Class | |
| Net assets | $748,749,431 |
| Shares outstanding | 30,881,030 |
| Net asset value per share | $24.25 |
| Institutional 3 Class | |
| Net assets | $70,934,061 |
| Shares outstanding | 3,073,615 |
| Net asset value per share | $23.08 |
The accompanying Notes to Financial Statements are an integral part of this statement.
| 20 | Columbia Small Cap Index Fund | Annual Report 2019 |
Statement of Operations
Year Ended February 28, 2019
| Net investment income | |
| Income: | |
| Dividends — unaffiliated issuers | $57,067,270 |
| Dividends — affiliated issuers | 1,222,367 |
| Foreign taxes withheld | (13,230) |
| Total income | 58,276,407 |
| Expenses: | |
| Management services fees | 8,691,076 |
| Distribution and/or service fees | |
| Class A | 3,853,951 |
| Class T | 616 |
| Plan administration fees | |
| Class K | 137 |
| Compensation of board members | 63,648 |
| Other | 30,825 |
| Total expenses | 12,640,253 |
| Fees waived or expenses reimbursed by Investment Manager and its affiliates | (94,511) |
| Expense reduction | (1,480) |
| Total net expenses | 12,544,262 |
| Net investment income | 45,732,145 |
| Realized and unrealized gain (loss) — net | |
| Net realized gain (loss) on: | |
| Investments — unaffiliated issuers | 338,947,383 |
| Investments — affiliated issuers | (11,444) |
| Futures contracts | (2,174,373) |
| Net realized gain | 336,761,566 |
| Net change in unrealized appreciation (depreciation) on: | |
| Investments — unaffiliated issuers | (139,291,272) |
| Investments — affiliated issuers | 1,703 |
| Futures contracts | 7,301,889 |
| Net change in unrealized appreciation (depreciation) | (131,987,680) |
| Net realized and unrealized gain | 204,773,886 |
| Net increase in net assets resulting from operations | $250,506,031 |
The accompanying Notes to Financial Statements are an integral part of this statement.
Columbia Small Cap Index Fund | Annual Report 2019
| 21 |
Statement of Changes in Net Assets
| | Year Ended
February 28, 2019 | Year Ended
February 28, 2018(a) |
| Operations | | |
| Net investment income | $45,732,145 | $39,795,886 |
| Net realized gain | 336,761,566 | 269,795,514 |
| Net change in unrealized appreciation (depreciation) | (131,987,680) | 64,610,700 |
| Net increase in net assets resulting from operations | 250,506,031 | 374,202,100 |
| Distributions to shareholders | | |
| Net investment income and net realized gains | | |
| Class A | (138,189,343) | |
| Institutional Class | (190,181,500) | |
| Institutional 2 Class | (65,475,539) | |
| Institutional 3 Class | (5,811,465) | |
| Class T | (26,604) | |
| Net investment income | | |
| Class A | | (13,392,767) |
| Institutional Class | | (20,694,825) |
| Institutional 2 Class | | (5,857,983) |
| Institutional 3 Class | | (6,847) |
| Class K | | (34,110) |
| Class T | | (3,252) |
| Net realized gains | | |
| Class A | | (98,404,248) |
| Class B | | (19,005) |
| Institutional Class | | (118,550,549) |
| Institutional 2 Class | | (33,355,944) |
| Institutional 3 Class | | (33,557) |
| Class K | | (259,245) |
| Class T | | (25,528) |
| Total distributions to shareholders (Note 2) | (399,684,451) | (290,637,860) |
| Increase in net assets from capital stock activity | 490,156,857 | 101,111,425 |
| Total increase in net assets | 340,978,437 | 184,675,665 |
| Net assets at beginning of year | 3,946,294,903 | 3,761,619,238 |
| Net assets at end of year | $4,287,273,340 | $3,946,294,903 |
| Undistributed (excess of distributions over) net investment income | $(199,154) | $1,095,963 |
| (a) | Institutional 3 Class shares are based on operations from March 1, 2017 (commencement of operations) through the stated period end. |
The accompanying Notes to Financial Statements are an integral part of this statement.
| 22 | Columbia Small Cap Index Fund | Annual Report 2019 |
Statement of Changes in Net Assets (continued)
| | Year Ended | Year Ended |
| | February 28, 2019 | February 28, 2018(a) |
| | Shares | Dollars ($) | Shares | Dollars ($) |
| Capital stock activity |
| Class A | | | | |
| Subscriptions | 15,655,887 | 395,797,918 | 15,423,595 | 373,705,846 |
| Distributions reinvested | 5,217,324 | 120,100,570 | 3,959,098 | 95,692,886 |
| Redemptions | (20,840,413) | (518,791,016) | (26,991,120) | (653,188,300) |
| Net increase (decrease) | 32,798 | (2,892,528) | (7,608,427) | (183,789,568) |
| Class B | | | | |
| Subscriptions | — | — | 1,293 | 30,179 |
| Distributions reinvested | — | — | 814 | 18,968 |
| Redemptions | — | — | (79,257) | (1,874,433) |
| Net decrease | — | — | (77,150) | (1,825,286) |
| Class I | | | | |
| Redemptions | — | — | (106) | (2,468) |
| Net decrease | — | — | (106) | (2,468) |
| Institutional Class | | | | |
| Subscriptions | 24,634,983 | 622,818,261 | 19,365,684 | 469,657,489 |
| Distributions reinvested | 5,963,857 | 137,882,592 | 4,069,240 | 98,917,153 |
| Redemptions | (21,316,512) | (527,511,753) | (16,682,524) | (407,748,162) |
| Net increase | 9,282,328 | 233,189,100 | 6,752,400 | 160,826,480 |
| Institutional 2 Class | | | | |
| Subscriptions | 14,705,902 | 379,016,972 | 11,719,379 | 292,115,576 |
| Distributions reinvested | 2,514,445 | 59,405,165 | 1,463,911 | 36,334,405 |
| Redemptions | (9,723,235) | (247,933,263) | (7,717,384) | (192,179,495) |
| Net increase | 7,497,112 | 190,488,874 | 5,465,906 | 136,270,486 |
| Institutional 3 Class | | | | |
| Subscriptions | 2,780,764 | 69,603,523 | 199,687 | 4,881,914 |
| Distributions reinvested | 252,853 | 5,685,170 | 1,685 | 40,208 |
| Redemptions | (141,040) | (3,318,182) | (20,334) | (496,871) |
| Net increase | 2,892,577 | 71,970,511 | 181,038 | 4,425,251 |
| Class K | | | | |
| Subscriptions | 502 | 12,752 | 34,643 | 847,317 |
| Distributions reinvested | — | — | 12,090 | 293,162 |
| Redemptions | (90,475) | (2,326,799) | (150,791) | (3,699,509) |
| Net decrease | (89,973) | (2,314,047) | (104,058) | (2,559,030) |
| Class T | | | | |
| Subscriptions | — | — | 5,067 | 119,717 |
| Distributions reinvested | 1,155 | 26,350 | 1,196 | 28,583 |
| Redemptions | (14,378) | (311,403) | (524,988) | (12,382,740) |
| Net decrease | (13,223) | (285,053) | (518,725) | (12,234,440) |
| Total net increase | 19,601,619 | 490,156,857 | 4,090,878 | 101,111,425 |
| (a) | Institutional 3 Class shares are based on operations from March 1, 2017 (commencement of operations) through the stated period end. |
The accompanying Notes to Financial Statements are an integral part of this statement.
Columbia Small Cap Index Fund | Annual Report 2019
| 23 |
The following table is intended to help you understand the Fund’s financial performance. Certain information reflects financial results for a single share of a class held for the periods shown. Per share net investment income (loss) amounts are calculated based on average shares outstanding during the period. Total return assumes reinvestment of all dividends and distributions, if any. Total return does not reflect payment of sales charges, if any. Total return and portfolio turnover are not annualized for periods of less than one year. The portfolio turnover rate is calculated without regard to purchase and sales transactions of short-term instruments and certain derivatives, if any. If such transactions were included, the Fund’s portfolio turnover rate may be higher.
| | Net asset value,
beginning of
period | Net
investment
income | Net
realized
and
unrealized
gain (loss) | Total from
investment
operations | Distributions
from net
investment
income | Distributions
from net
realized
gains | Total
distributions to
shareholders |
| Class A |
| Year Ended 2/28/2019 | $24.33 | 0.23 | 1.32 | 1.55 | (0.23) | (2.11) | (2.34) |
| Year Ended 2/28/2018 | $23.83 | 0.21 | 2.11 | 2.32 | (0.22) | (1.60) | (1.82) |
| Year Ended 2/28/2017 | $19.05 | 0.19 | 6.28 | 6.47 | (0.19) | (1.50) | (1.69) |
| Year Ended 2/29/2016 | $23.29 | 0.22 | (2.25) | (2.03) | (0.22) | (1.99) | (2.21) |
| Year Ended 2/28/2015 | $23.54 | 0.20 | 1.40 | 1.60 | (0.18) | (1.67) | (1.85) |
| Institutional Class |
| Year Ended 2/28/2019 | $24.47 | 0.29 | 1.33 | 1.62 | (0.29) | (2.11) | (2.40) |
| Year Ended 2/28/2018 | $23.96 | 0.27 | 2.12 | 2.39 | (0.28) | (1.60) | (1.88) |
| Year Ended 2/28/2017 | $19.14 | 0.24 | 6.32 | 6.56 | (0.24) | (1.50) | (1.74) |
| Year Ended 2/29/2016 | $23.39 | 0.27 | (2.25) | (1.98) | (0.28) | (1.99) | (2.27) |
| Year Ended 2/28/2015 | $23.63 | 0.26 | 1.41 | 1.67 | (0.24) | (1.67) | (1.91) |
| Institutional 2 Class |
| Year Ended 2/28/2019 | $24.99 | 0.30 | 1.36 | 1.66 | (0.29) | (2.11) | (2.40) |
| Year Ended 2/28/2018 | $24.43 | 0.28 | 2.16 | 2.44 | (0.28) | (1.60) | (1.88) |
| Year Ended 2/28/2017 | $19.49 | 0.25 | 6.43 | 6.68 | (0.24) | (1.50) | (1.74) |
| Year Ended 2/29/2016 | $23.78 | 0.28 | (2.30) | (2.02) | (0.28) | (1.99) | (2.27) |
| Year Ended 2/28/2015 | $23.99 | 0.27 | 1.43 | 1.70 | (0.24) | (1.67) | (1.91) |
| Institutional 3 Class |
| Year Ended 2/28/2019 | $23.90 | 0.29 | 1.29 | 1.58 | (0.29) | (2.11) | (2.40) |
| Year Ended 2/28/2018(d) | $23.87 | 0.24 | 1.67 | 1.91 | (0.28) | (1.60) | (1.88) |
| Notes to Financial Highlights |
| (a) | In addition to the fees and expenses that the Fund bears directly, the Fund indirectly bears a pro rata share of the fees and expenses of any other funds in which it invests. Such indirect expenses are not included in the Fund’s reported expense ratios. |
| (b) | Total net expenses include the impact of certain fee waivers/expense reimbursements made by the Investment Manager and certain of its affiliates, if applicable. |
| (c) | The benefits derived from expense reductions had an impact of less than 0.01%. |
| (d) | Institutional 3 Class shares commenced operations on March 1, 2017. Per share data and total return reflect activity from that date. |
The accompanying Notes to Financial Statements are an integral part of this statement.
| 24 | Columbia Small Cap Index Fund | Annual Report 2019 |
Financial Highlights (continued)
| | Net
asset
value,
end of
period | Total
return | Total gross
expense
ratio to
average
net assets(a) | Total net
expense
ratio to
average
net assets(a),(b) | Net investment
income
ratio to
average
net assets | Portfolio
turnover | Net
assets,
end of
period
(000’s) |
| Class A |
| Year Ended 2/28/2019 | $23.54 | 6.70% | 0.45% | 0.45%(c) | 0.89% | 22% | $1,440,665 |
| Year Ended 2/28/2018 | $24.33 | 9.86% | 0.45% | 0.45%(c) | 0.88% | 16% | $1,488,143 |
| Year Ended 2/28/2017 | $23.83 | 34.40% | 0.45% | 0.45%(c) | 0.85% | 18% | $1,638,983 |
| Year Ended 2/29/2016 | $19.05 | (9.67%) | 0.45% | 0.45%(c) | 0.99% | 19% | $1,131,160 |
| Year Ended 2/28/2015 | $23.29 | 7.19% | 0.45% | 0.45%(c) | 0.89% | 17% | $1,231,774 |
| Institutional Class |
| Year Ended 2/28/2019 | $23.69 | 6.99% | 0.20% | 0.20%(c) | 1.14% | 22% | $2,026,925 |
| Year Ended 2/28/2018 | $24.47 | 10.11% | 0.20% | 0.20%(c) | 1.12% | 16% | $1,866,835 |
| Year Ended 2/28/2017 | $23.96 | 34.74% | 0.20% | 0.20%(c) | 1.10% | 18% | $1,665,820 |
| Year Ended 2/29/2016 | $19.14 | (9.44%) | 0.20% | 0.20%(c) | 1.22% | 19% | $1,326,728 |
| Year Ended 2/28/2015 | $23.39 | 7.47% | 0.20% | 0.20%(c) | 1.14% | 17% | $1,725,837 |
| Institutional 2 Class |
| Year Ended 2/28/2019 | $24.25 | 7.01% | 0.20% | 0.20% | 1.14% | 22% | $748,749 |
| Year Ended 2/28/2018 | $24.99 | 10.12% | 0.20% | 0.20% | 1.12% | 16% | $584,472 |
| Year Ended 2/28/2017 | $24.43 | 34.73% | 0.20% | 0.20% | 1.10% | 18% | $437,779 |
| Year Ended 2/29/2016 | $19.49 | (9.46%) | 0.20% | 0.20% | 1.24% | 19% | $208,441 |
| Year Ended 2/28/2015 | $23.78 | 7.49% | 0.20% | 0.20% | 1.17% | 17% | $166,247 |
| Institutional 3 Class |
| Year Ended 2/28/2019 | $23.08 | 6.99% | 0.20% | 0.20% | 1.16% | 22% | $70,934 |
| Year Ended 2/28/2018(d) | $23.90 | 8.14% | 0.21% | 0.20% | 1.01% | 16% | $4,327 |
The accompanying Notes to Financial Statements are an integral part of this statement.
Columbia Small Cap Index Fund | Annual Report 2019
| 25 |
Notes to Financial Statements
February 28, 2019
Note 1. Organization
Columbia Small Cap Index Fund (the Fund), a series of Columbia Funds Series Trust (the Trust), is a diversified fund. The Trust is registered under the Investment Company Act of 1940, as amended (the 1940 Act), as an open-end management investment company organized as a Delaware statutory trust.
Fund shares
The Trust may issue an unlimited number of shares (without par value). Although all share classes generally have identical voting, dividend and liquidation rights, each share class votes separately when required by the Trust’s organizational documents or by law. Different share classes pay different distribution amounts to the extent the expenses of such share classes differ, and distributions in liquidation will be proportional to the net asset value of each share class. Each share class has its own expense and sales charge structure. The Fund offers each of the share classes identified below.
Class A shares are not subject to any front-end sales charge or contingent deferred sales charge.
Institutional Class shares are not subject to sales charges and are generally available only to eligible investors, which are subject to different investment minimums as described in the Fund’s prospectus.
Institutional 2 Class shares are not subject to sales charges and are generally available only to investors purchasing through authorized investment professionals and omnibus retirement plans as described in the Fund’s prospectus.
Institutional 3 Class shares are not subject to sales charges and are available to institutional and certain other investors as described in the Fund’s prospectus. Institutional 3 Class shares commenced operations on March 1, 2017.
The Fund no longer accepts investments by existing investors in Class K shares. When available, Class K shares were not subject to sales charges and were made available only to existing investors in Class K shares. On March 9, 2018, Class K shares were redeemed or exchanged for Institutional 2 Class shares of the Fund in a tax free transaction that had no impact on fees and expenses paid by the shareholders.
Class T shares were subject to a maximum front-end sales charge of 2.50% per transaction and were required to be purchased through financial intermediaries that, by written agreement with Columbia Management Investment Distributors, Inc., were specifically authorized to sell Class T shares. Effective at the close of business on December 14, 2018, Class T shares merged, in a tax-free transaction, into Class A shares of the Fund and are no longer offered for sale.
Note 2. Summary of significant accounting policies
Basis of preparation
The Fund is an investment company that applies the accounting and reporting guidance in the Financial Accounting Standards Board (FASB) Accounting Standards Codification Topic 946,Financial Services - Investment Companies (ASC 946). The financial statements are prepared in accordance with U.S. generally accepted accounting principles (GAAP), which requires management to make certain estimates and assumptions that affect the reported amounts of assets and liabilities, the disclosure of contingent assets and liabilities at the date of the financial statements and the reported amounts of income and expenses during the reporting period. Actual results could differ from those estimates.
The following is a summary of significant accounting policies followed by the Fund in the preparation of its financial statements.
Security valuation
All equity securities and exchange-traded funds are valued at the close of business of the New York Stock Exchange. Equity securities and exchange-traded funds are valued at the last quoted sales price on the principal exchange or market on which they trade, except for securities traded on the NASDAQ Stock Market, which are valued at the NASDAQ official close price. Unlisted securities or listed securities for which there were no sales during the day are valued at the mean of the latest quoted bid and ask prices on such exchanges or markets.
| 26 | Columbia Small Cap Index Fund | Annual Report 2019 |
Notes to Financial Statements (continued)
February 28, 2019
Foreign equity securities are valued based on the closing price on the foreign exchange in which such securities are primarily traded. If any foreign equity security closing prices are not readily available, the securities are valued at the mean of the latest quoted bid and ask prices on such exchanges or markets. Foreign currency exchange rates are generally determined at 4:00 p.m. Eastern (U.S.) time. Many securities markets and exchanges outside the U.S. close prior to the close of the New York Stock Exchange; therefore, the closing prices for securities in such markets or on such exchanges may not fully reflect events that occur after such close but before the close of the New York Stock Exchange. In those situations, foreign securities will be fair valued pursuant to a policy adopted by the Board of Trustees, including, if available, utilizing a third party pricing service to determine these fair values. The third party pricing service takes into account multiple factors, including, but not limited to, movements in the U.S. securities markets, certain depositary receipts, futures contracts and foreign exchange rates that have occurred subsequent to the close of the foreign exchange or market, to determine a good faith estimate that reasonably reflects the current market conditions as of the close of the New York Stock Exchange. The fair value of a security is likely to be different from the quoted or published price, if available.
Investments in open-end investment companies, including money market funds, are valued at their latest net asset value.
Futures and options on futures contracts are valued based upon the settlement price at the close of regular trading on their principal exchanges or, in the absence of transactions, at the mean of the latest quoted bid and ask prices.
Investments for which market quotations are not readily available, or that have quotations which management believes are not reflective of market value or reliable, are valued at fair value as determined in good faith under procedures approved by and under the general supervision of the Board of Trustees. If a security or class of securities (such as foreign securities) is valued at fair value, such value is likely to be different from the quoted or published price for the security.
The determination of fair value often requires significant judgment. To determine fair value, management may use assumptions including but not limited to future cash flows and estimated risk premiums. Multiple inputs from various sources may be used to determine fair value.
GAAP requires disclosure regarding the inputs and valuation techniques used to measure fair value and any changes in valuation inputs or techniques. In addition, investments shall be disclosed by major category. This information is disclosed following the Fund’s Portfolio of Investments.
Derivative instruments
The Fund invests in certain derivative instruments, as detailed below, to meet its investment objectives. Derivatives are instruments whose values depend on, or are derived from, in whole or in part, the value of one or more securities, currencies, commodities, indices, or other assets or instruments. Derivatives may be used to increase investment flexibility (including to maintain cash reserves while maintaining desired exposure to certain assets), for risk management (hedging) purposes, to facilitate trading, to reduce transaction costs and to pursue higher investment returns. The Fund may also use derivative instruments to mitigate certain investment risks, such as foreign currency exchange rate risk, interest rate risk and credit risk. Derivatives may involve various risks, including the potential inability of the counterparty to fulfill its obligations under the terms of the contract, the potential for an illiquid secondary market (making it difficult for the Fund to sell or terminate, including at favorable prices) and the potential for market movements which may expose the Fund to gains or losses in excess of the amount shown in the Statement of Assets and Liabilities. The notional amounts of derivative instruments, if applicable, are not recorded in the financial statements.
A derivative instrument may suffer a marked-to-market loss if the value of the contract decreases due to an unfavorable change in the market rates or values of the underlying instrument. Losses can also occur if the counterparty does not perform its obligations under the contract. The Fund’s risk of loss from counterparty credit risk on over-the-counter derivatives is generally limited to the aggregate unrealized gain netted against any collateral held by the Fund and the amount of any variation margin held by the counterparty, plus any replacement costs or related amounts. With exchange-traded or centrally cleared derivatives, there is reduced counterparty credit risk to the Fund since the clearinghouse or central counterparty (CCP) provides some protection in the case of clearing member default. The clearinghouse or CCP stands between the buyer and the seller of the contract; therefore, additional counterparty credit risk is failure of the clearinghouse or CCP. However, credit risk still exists in exchange-traded or centrally cleared derivatives with respect to initial and variation margin that is held in a broker’s customer account. While brokers are required to segregate customer margin from their own assets, in the event
Columbia Small Cap Index Fund | Annual Report 2019
| 27 |
Notes to Financial Statements (continued)
February 28, 2019
that a broker becomes insolvent or goes into bankruptcy and at that time there is a shortfall in the aggregate amount of margin held by the broker for all its clients, U.S. bankruptcy laws will typically allocate that shortfall on a pro-rata basis across all the broker’s customers (including the Fund), potentially resulting in losses to the Fund.
In order to better define its contractual rights and to secure rights that will help the Fund mitigate its counterparty risk, the Fund may enter into an International Swaps and Derivatives Association, Inc. Master Agreement (ISDA Master Agreement) or similar agreement with its derivatives contract counterparties. An ISDA Master Agreement is an agreement between the Fund and a counterparty that governs over-the-counter derivatives and typically contains, among other things, collateral posting terms and netting provisions in the event of a default and/or termination event. Under an ISDA Master Agreement, the Fund may, under certain circumstances, offset with the counterparty certain derivative instrument’s payables and/or receivables with collateral held and/or posted and create one single net payment. The provisions of the ISDA Master Agreement typically permit a single net payment in the event of default (close-out netting), including the bankruptcy or insolvency of the counterparty. Note, however, that bankruptcy or insolvency laws of a particular jurisdiction may impose restrictions on or prohibitions against the right of offset or netting in bankruptcy, insolvency or other events.
Collateral (margin) requirements differ by type of derivative. Margin requirements are established by the clearinghouse or CCP for exchange-traded and centrally cleared derivatives. Brokers can ask for margin in excess of the minimum in certain circumstances. Collateral terms are contract specific for over-the-counter derivatives. For over-the-counter derivatives traded under an ISDA Master Agreement, the collateral requirements are typically calculated by netting the marked-to-market amount for each transaction under such agreement and comparing that amount to the value of any variation margin currently pledged by the Fund and/or the counterparty. Generally, the amount of collateral due from or to a party has to exceed a minimum transfer amount threshold (e.g., $250,000) before a transfer has to be made. To the extent amounts due to the Fund from its counterparties are not fully collateralized, contractually or otherwise, the Fund bears the risk of loss from counterparty nonperformance. The Fund may also pay interest expense on cash collateral received from the broker. Any interest expense paid by the Fund is shown on the Statement of Operations. The Fund attempts to mitigate counterparty risk by only entering into agreements with counterparties that it believes have the financial resources to honor their obligations and by monitoring the financial stability of those counterparties.
Certain ISDA Master Agreements allow counterparties of over-the-counter derivatives transactions to terminate derivatives contracts prior to maturity in the event the Fund’s net asset value declines by a stated percentage over a specified time period or if the Fund fails to meet certain terms of the ISDA Master Agreement, which would cause the Fund to accelerate payment of any net liability owed to the counterparty. The Fund also has termination rights if the counterparty fails to meet certain terms of the ISDA Master Agreement. In determining whether to exercise such termination rights, the Fund would consider, in addition to counterparty credit risk, whether termination would result in a net liability owed from the counterparty.
For financial reporting purposes, the Fund does not offset derivative assets and derivative liabilities that are subject to netting arrangements in the Statement of Assets and Liabilities.
Futures contracts
Futures contracts are exchange-traded and represent commitments for the future purchase or sale of an asset at a specified price on a specified date. The Fund bought and sold futures contracts to maintain appropriate equity market exposure while keeping sufficient cash to accommodate daily redemptions. These instruments may be used for other purposes in future periods. Upon entering into futures contracts, the Fund bears risks that it may not achieve the anticipated benefits of the futures contracts and may realize a loss. Additional risks include counterparty credit risk, the possibility of an illiquid market, and that a change in the value of the contract or option may not correlate with changes in the value of the underlying asset.
Upon entering into a futures contract, the Fund deposits cash or securities with the broker, known as a futures commission merchant (FCM), in an amount sufficient to meet the initial margin requirement. The initial margin deposit must be maintained at an established level over the life of the contract. Cash deposited as initial margin is recorded in the Statement of Assets and Liabilities as margin deposits. Securities deposited as initial margin are designated in the Portfolio of Investments. Subsequent payments (variation margin) are made or received by the Fund each day. The variation margin payments are
| 28 | Columbia Small Cap Index Fund | Annual Report 2019 |
Notes to Financial Statements (continued)
February 28, 2019
equal to the daily change in the contract value and are recorded as variation margin receivable or payable and are offset in unrealized gains or losses. The Fund recognizes a realized gain or loss when the contract is closed or expires. Futures contracts involve, to varying degrees, risk of loss in excess of the variation margin disclosed in the Statement of Assets and Liabilities.
Effects of derivative transactions in the financial statements
The following tables are intended to provide additional information about the effect of derivatives on the financial statements of the Fund, including: the fair value of derivatives by risk category and the location of those fair values in the Statement of Assets and Liabilities; and the impact of derivative transactions over the period in the Statement of Operations, including realized and unrealized gains (losses). The derivative instrument schedules following the Portfolio of Investments present additional information regarding derivative instruments outstanding at the end of the period, if any.
The following table is a summary of the fair value of derivative instruments (not considered to be hedging instruments for accounting disclosure purposes) at February 28, 2019:
| | Asset derivatives | |
Risk exposure
category | Statement
of assets and liabilities
location | Fair value ($) |
| Equity risk | Component of total distributable earnings (loss) — unrealized appreciation on futures contracts | 7,209,830* |
| * | Includes cumulative appreciation (depreciation) as reported in the tables following the Portfolio of Investments. Only the current day’s variation margin is reported in receivables or payables in the Statement of Assets and Liabilities. |
The following table indicates the effect of derivative instruments (not considered to be hedging instruments for accounting disclosure purposes) in the Statement of Operations for the year ended February 28, 2019:
| Amount of realized gain (loss) on derivatives recognized in income |
| Risk exposure category | Futures
contracts
($) |
| Equity risk | (2,174,373) |
| |
| Change in unrealized appreciation (depreciation) on derivatives recognized in income |
| Risk exposure category | Futures
contracts
($) |
| Equity risk | 7,301,889 |
The following table is a summary of the average outstanding volume by derivative instrument for the year ended February 28, 2019:
| Derivative instrument | Average notional
amounts ($)* |
| Futures contracts — long | 78,962,735 |
| * | Based on the ending quarterly outstanding amounts for the year ended February 28, 2019. |
Security transactions
Security transactions are accounted for on the trade date. Cost is determined and gains (losses) are based upon the specific identification method for both financial statement and federal income tax purposes.
Income recognition
Corporate actions and dividend income are generally recorded net of any non-reclaimable tax withholdings, on the ex-dividend date or upon receipt of ex-dividend notification in the case of certain foreign securities.
Columbia Small Cap Index Fund | Annual Report 2019
| 29 |
Notes to Financial Statements (continued)
February 28, 2019
The Fund may receive distributions from holdings in equity securities, business development companies (BDCs), exchange-traded funds (ETFs), limited partnerships (LPs), other regulated investment companies (RICs), and real estate investment trusts (REITs), which report information on the tax character of their distributions annually. These distributions are allocated to dividend income, capital gain and return of capital based on actual information reported. Return of capital is recorded as a reduction of the cost basis of securities held. If the Fund no longer owns the applicable securities, return of capital is recorded as a realized gain. With respect to REITs, to the extent actual information has not yet been reported, estimates for return of capital are made by the Fund’s management. Management’s estimates are subsequently adjusted when the actual character of the distributions is disclosed by the REITs, which could result in a proportionate change in return of capital to shareholders.
Awards from class action litigation are recorded as a reduction of cost basis if the Fund still owns the applicable securities on the payment date. If the Fund no longer owns the applicable securities, the proceeds are recorded as realized gains.
Expenses
General expenses of the Trust are allocated to the Fund and other funds of the Trust based upon relative net assets or other expense allocation methodologies determined by the nature of the expense. Expenses directly attributable to the Fund are charged to the Fund. Expenses directly attributable to a specific class of shares are charged to that share class.
Determination of class net asset value
All income, expenses (other than class-specific expenses, which are charged to that share class, as shown in the Statement of Operations) and realized and unrealized gains (losses) are allocated to each class of the Fund on a daily basis, based on the relative net assets of each class, for purposes of determining the net asset value of each class.
Federal income tax status
The Fund intends to qualify each year as a regulated investment company under Subchapter M of the Internal Revenue Code, as amended, and will distribute substantially all of its investment company taxable income and net capital gain, if any, for its tax year, and as such will not be subject to federal income taxes. In addition, the Fund intends to distribute in each calendar year substantially all of its ordinary income, capital gain net income and certain other amounts, if any, such that the Fund should not be subject to federal excise tax. Therefore, no federal income or excise tax provision is recorded.
Foreign taxes
The Fund may be subject to foreign taxes on income, gains on investments or currency repatriation, a portion of which may be recoverable. The Fund will accrue such taxes and recoveries, as applicable, based upon its current interpretation of tax rules and regulations that exist in the markets in which it invests.
Realized gains in certain countries may be subject to foreign taxes at the Fund level, based on statutory rates. The Fund accrues for such foreign taxes on realized and unrealized gains at the appropriate rate for each jurisdiction, as applicable. The amount, if any, is disclosed as a liability on the Statement of Assets and Liabilities.
Distributions to shareholders
Distributions from net investment income, if any, are declared and paid semi-annually. Net realized capital gains, if any, are distributed at least annually. Income distributions and capital gain distributions are determined in accordance with federal income tax regulations, which may differ from GAAP.
Guarantees and indemnifications
Under the Trust’s organizational documents and, in some cases, by contract, its officers and trustees are indemnified against certain liabilities arising out of the performance of their duties to the Trust or its funds. In addition, certain of the Fund’s contracts with its service providers contain general indemnification clauses. The Fund’s maximum exposure under these arrangements is unknown since the amount of any future claims that may be made against the Fund cannot be determined, and the Fund has no historical basis for predicting the likelihood of any such claims.
| 30 | Columbia Small Cap Index Fund | Annual Report 2019 |
Notes to Financial Statements (continued)
February 28, 2019
Recent accounting pronouncements
Accounting Standards Update 2017-08 Premium Amortization on Purchased Callable Debt Securities
In March 2017, the Financial Accounting Standards Board issued Accounting Standards Update (ASU) No. 2017-08 Premium Amortization on Purchased Callable Debt Securities. ASU No. 2017-08 updates the accounting standards to shorten the amortization period for certain purchased callable debt securities, held at a premium, to be amortized to the earliest call date. The update applies to securities with explicit, noncontingent call features that are callable at fixed prices and on preset dates. The standard is effective for annual periods beginning after December 15, 2018 and interim periods within those fiscal years. Management does not expect the implementation of this guidance to have a material impact on the financial statement amounts and footnote disclosures.
Accounting Standards Update 2018-13 Disclosure Framework - Changes to the Disclosure Requirements for Fair Value Measurement
In August 2018, the Financial Accounting Standards Board issued Accounting Standards Update (ASU) No. 2018-13 Disclosure Framework - Changes to the Disclosure Requirements for Fair Value Measurement. ASU No. 2018-13, in addition to other modifications and additions, removes the requirement to disclose the amount and reasons for transfers between Level 1 and Level 2 of the fair value hierarchy and the policy for the timing of transfers between levels. The standard is effective for annual periods beginning after December 15, 2019 and interim periods within those fiscal years. At this time, management is evaluating the implication of this guidance and the impact it will have on the financial statement disclosures, if any.
Disclosure Update and Simplification
In September 2018, the Securities and Exchange Commission (SEC) released Final Rule 33-10532, Disclosure Update and Simplification, which amends certain financial statement disclosure requirements that the SEC determined to be redundant, outdated, or superseded in light of other SEC disclosure requirements, GAAP, or changes in the information environment. As a result of the amendments, management implemented disclosure changes which included removing the components of distributable earnings presented on the Statement of Assets and Liabilities and combining income and gain distributions paid to shareholders as presented on the Statement of Changes in Net Assets. Any values presented to meet prior year requirements were left unchanged. The amendments had no effect on the Fund’s net assets or results of operation.
Note 3. Fees and other transactions with affiliates
Management services fees
The Fund has entered into a Management Agreement with Columbia Management Investment Advisers, LLC (the Investment Manager), a wholly-owned subsidiary of Ameriprise Financial, Inc. (Ameriprise Financial). Under the Management Agreement, the Investment Manager provides the Fund with investment research and advice, as well as administrative and accounting services. The management services fee is an annual fee that is equal to 0.20% of the Fund’s daily net assets.
The Investment Manager, from the management services fee it receives from the Fund, pays all operating expenses of the Fund, with the exception of brokerage fees and commissions, taxes, interest, fees and expenses of Board of Trustees who are not officers, directors or employees of the Investment Manager or its affiliates, distribution and/or shareholder servicing and any extraordinary non-recurring expenses that may arise, including litigation fees.
Compensation of board members
Members of the Board of Trustees who are not officers or employees of the Investment Manager or Ameriprise Financial are compensated for their services to the Fund as disclosed in the Statement of Operations. Under a Deferred Compensation Plan (the Deferred Plan), these members of the Board of Trustees may elect to defer payment of up to 100% of their compensation. Deferred amounts are treated as though equivalent dollar amounts had been invested in shares of certain funds managed by the Investment Manager. The Fund’s liability for these amounts is adjusted for market value changes and remains in the Fund until distributed in accordance with the Deferred Plan. All amounts payable under the Deferred Plan constitute a general unsecured obligation of the Fund.
Columbia Small Cap Index Fund | Annual Report 2019
| 31 |
Notes to Financial Statements (continued)
February 28, 2019
Compensation of Chief Compliance Officer
The Board of Trustees has appointed a Chief Compliance Officer to the Fund in accordance with federal securities regulations. A portion of the Chief Compliance Officer’s total compensation is allocated to the Fund, along with other allocations to affiliated registered investment companies managed by the Investment Manager and its affiliates, based on relative net assets. The expenses of the Chief Compliance Officer allocated to the Fund are payable by the Investment Manager.
Transfer agency fees
Under a Transfer and Dividend Disbursing Agent Agreement, Columbia Management Investment Services Corp. (the Transfer Agent), an affiliate of the Investment Manager and a wholly-owned subsidiary of Ameriprise Financial, is responsible for providing transfer agency services to the Fund. The Transfer Agent has contracted with DST Asset Manager Solutions, Inc. (DST) to serve as sub-transfer agent.
The transfer agency fees are payable by the Investment Manager. The Transfer Agent pays the fees of DST for services as sub-transfer agent and DST is not entitled to reimbursement for such fees from the Fund. The Transfer Agent also receives compensation from the Investment Manager for various shareholder services and reimbursements for certain out-of-pocket expenses.
An annual minimum account balance fee of $20 may apply to certain accounts with a value below the applicable share class’s initial minimum investment requirements to reduce the impact of small accounts on transfer agency fees. These minimum account balance fees are remitted to the Fund and recorded as part of expense reductions in the Statement of Operations. For the year ended February 28, 2019, these minimum account balance fees reduced total expenses of the Fund by $1,480.
Plan administration fees
Under a Plan Administration Services Agreement with the Transfer Agent, the Fund paid an annual fee at a rate of 0.25% of the Fund’s average daily net assets attributable to Class K shares for the provision of various administrative, recordkeeping, communication and educational services. As a result of all Class K shares of the Fund being redeemed or exchanged for Advisor Class shares, March 9, 2018 was the last day the Fund paid a plan administration fee for Class K shares.
Distribution and service fees
The Fund has entered into an agreement with Columbia Management Investment Distributors, Inc. (the Distributor), an affiliate of the Investment Manager and a wholly-owned subsidiary of Ameriprise Financial, for distribution and shareholder services. The Board of Trustees has approved, and the Fund has adopted, distribution and shareholder service plans (the Plans) applicable to certain share classes, which set the distribution and service fees for the Fund. These fees are calculated daily and are intended to compensate the Distributor and/or eligible selling and/or servicing agents for selling shares of the Fund and providing services to investors.
Under the Plans, the Fund pays a monthly combined distribution and service fee to the Distributor at the maximum annual rate of 0.25% of the average daily net assets attributable to Class A shares of the Fund. Also under the Plans, the Fund pays a monthly service fee to the Distributor at the maximum annual rate of 0.25% of the average daily net assets attributable to Class T shares of the Fund and a monthly distribution fee to the Distributor at the maximum annual rate of 0.25% of the average daily net assets attributable to Class T shares of the Fund. As a result of all Class T shares of the Fund being redeemed or converted to Class A shares, December 14, 2018 was the last day the Fund paid a distribution and shareholder services fee for Class T shares.
Although the Fund may pay a distribution fee up to 0.25% of the Fund’s average daily net assets attributable to Class T shares and a service fee of up to 0.25% of the Fund’s average daily net assets attributable to Class T shares, the aggregate fee shall not exceed 0.25% of the Fund’s average daily net assets attributable to Class T shares.
| 32 | Columbia Small Cap Index Fund | Annual Report 2019 |
Notes to Financial Statements (continued)
February 28, 2019
Expenses waived/reimbursed by the Investment Manager and its affiliates
The Investment Manager and certain of its affiliates have contractually agreed to waive fees and/or reimburse expenses (excluding certain fees and expenses described below) for the period(s) disclosed below, unless sooner terminated at the sole discretion of the Board of Trustees, so that the Fund’s net operating expenses, after giving effect to fees waived/expenses reimbursed and any balance credits and/or overdraft charges from the Fund’s custodian, do not exceed the following annual rate(s) as a percentage of the class’ average daily net assets:
| | Fee rate(s) contractual
through
June 30, 2019 |
| Class A | 0.45% |
| Institutional Class | 0.20 |
| Institutional 2 Class | 0.20 |
| Institutional 3 Class | 0.20 |
Under the agreement governing these fee waivers and/or expense reimbursement arrangements, the following fees and expenses are excluded from the waiver/reimbursement commitment, and therefore will be paid by the Fund, if applicable: taxes (including foreign transaction taxes), expenses associated with investments in affiliated and non-affiliated pooled investment vehicles (including mutual funds and exchange-traded funds), transaction costs and brokerage commissions, costs related to any securities lending program, dividend expenses associated with securities sold short, inverse floater program fees and expenses, transaction charges and interest on borrowed money, interest, infrequent and/or unusual expenses and any other expenses the exclusion of which is specifically approved by the Board of Trustees. This agreement may be modified or amended only with approval from the Investment Manager, certain of its affiliates and the Fund. Any fees waived and/or expenses reimbursed under the expense reimbursement arrangements described above are not recoverable by the Investment Manager or its affiliates in future periods.
Note 4. Federal tax information
The timing and character of income and capital gain distributions are determined in accordance with income tax regulations, which may differ from GAAP because of temporary or permanent book to tax differences.
At February 28, 2019, these differences were primarily due to differing treatment for deferral/reversal of wash sale losses, re-characterization of distributions for investments, derivative investments, post-October capital losses, trustees’ deferred compensation and distribution reclassifications. To the extent these differences were permanent, reclassifications were made among the components of the Fund’s net assets. Temporary differences do not require reclassifications.
The following reclassifications were made:
Excess of distributions
over net investment
income ($) | Accumulated
net realized
gain ($) | Paid in
capital ($) |
| (2,267,622) | 2,267,622 | — |
Net investment income (loss) and net realized gains (losses), as disclosed in the Statement of Operations, and net assets were not affected by these reclassifications.
The tax character of distributions paid during the years indicated was as follows:
| Year Ended February 28, 2019 | Year Ended February 28, 2018 |
Ordinary
income ($) | Long-term
capital gains ($) | Total ($) | Ordinary
income ($) | Long-term
capital gains ($) | Total ($) |
| 52,441,457 | 347,242,994 | 399,684,451 | 68,005,059 | 222,632,801 | 290,637,860 |
Short-term capital gain distributions, if any, are considered ordinary income distributions for tax purposes.
Columbia Small Cap Index Fund | Annual Report 2019
| 33 |
Notes to Financial Statements (continued)
February 28, 2019
At February 28, 2019, the components of distributable earnings on a tax basis were as follows:
Undistributed
ordinary income ($) | Undistributed
long-term
capital gains ($) | Capital loss
carryforwards ($) | Net unrealized
appreciation ($) |
| — | 92,556,176 | — | 1,074,382,846 |
At February 28, 2019, the cost of all investments for federal income tax purposes along with the aggregate gross unrealized appreciation and depreciation based on that cost was:
Federal
tax cost ($) | Gross unrealized
appreciation ($) | Gross unrealized
(depreciation) ($) | Net unrealized
appreciation ($) |
| 3,212,605,334 | 1,414,710,046 | (340,327,200) | 1,074,382,846 |
Tax cost of investments and unrealized appreciation/(depreciation) may also include timing differences that do not constitute adjustments to tax basis.
Under current tax rules, regulated investment companies can elect to treat certain late-year ordinary losses incurred and post-October capital losses (capital losses realized after October 31) as arising on the first day of the following taxable year. As of February 28, 2019, the Fund will elect to treat the following late-year ordinary losses and post-October capital losses as arising on March 1, 2019.
Late year
ordinary losses ($) | Post-October
capital losses ($) |
| — | 29,915,737 |
Management of the Fund has concluded that there are no significant uncertain tax positions in the Fund that would require recognition in the financial statements. However, management’s conclusion may be subject to review and adjustment at a later date based on factors including, but not limited to, new tax laws, regulations, and administrative interpretations (including relevant court decisions). Generally, the Fund’s federal tax returns for the prior three fiscal years remain subject to examination by the Internal Revenue Service.
Note 5. Portfolio information
The cost of purchases and proceeds from sales of securities, excluding short-term investments and derivatives, if any, aggregated to $1,044,193,619 and $940,090,504, respectively, for the year ended February 28, 2019. The amount of purchase and sale activity impacts the portfolio turnover rate reported in the Financial Highlights.
Note 6. Affiliated money market fund
The Fund invests in Columbia Short-Term Cash Fund, an affiliated money market fund established for the exclusive use by the Fund and other affiliated funds (the Affiliated MMF). The income earned by the Fund from such investments is included as Dividends - affiliated issuers in the Statement of Operations. As an investing fund, the Fund indirectly bears its proportionate share of the expenses of the Affiliated MMF. The Affiliated MMF prices its shares with a floating net asset value. In addition, the Board of Trustees of the Affiliated MMF may impose a fee on redemptions (sometimes referred to as a liquidity fee) or temporarily suspend redemptions (sometimes referred to as imposing a redemption gate) in the event its liquidity falls below regulatory limits.
Note 7. Interfund lending
Pursuant to an exemptive order granted by the Securities and Exchange Commission, the Fund participates in a program (the Interfund Program) allowing each participating Columbia Fund (each, a Participating Fund) to lend money directly to and, except for closed-end funds and money market funds, borrow money directly from other Participating Funds for temporary purposes. The amounts eligible for borrowing and lending under the Interfund Program are subject to certain restrictions.
| 34 | Columbia Small Cap Index Fund | Annual Report 2019 |
Notes to Financial Statements (continued)
February 28, 2019
Interfund loans are subject to the risk that the borrowing fund could be unable to repay the loan when due, and a delay in repayment to the lending fund could result in lost opportunities and/or additional lending costs. The exemptive order is subject to conditions intended to mitigate conflicts of interest arising from the Investment Manager’s relationship with each Participating Fund.
The Fund did not borrow or lend money under the Interfund Program during the year ended February 28, 2019.
Note 8. Line of credit
The Fund has access to a revolving credit facility with a syndicate of banks led by Citibank, N.A., HSBC Bank USA, N.A. and JPMorgan Chase Bank, N.A. whereby the Fund may borrow for the temporary funding of shareholder redemptions or for other temporary or emergency purposes. The credit facility, which is a collective agreement between the Fund and certain other funds managed by the Investment Manager or an affiliated investment manager, severally and not jointly, permits collective borrowings up to $1 billion. Interest is charged to each participating fund based on its borrowings at a rate equal to the higher of (i) the federal funds effective rate, (ii) the one-month LIBOR rate and (iii) the overnight bank funding rate, plus in each case, 1.00%. Each borrowing under the credit facility matures no later than 60 days after the date of borrowing. The Fund also pays a commitment fee equal to its pro rata share of the unused amount of the credit facility at a rate of 0.15% per annum. The commitment fee is included in other expenses in the Statement of Operations. This agreement expires annually in December unless extended or renewed.
The Fund had no borrowings during the year ended February 28, 2019.
Note 9. Significant risks
Shareholder concentration risk
At February 28, 2019, one unaffiliated shareholder of record owned 16.7% of the outstanding shares of the Fund in one or more accounts. The Fund has no knowledge about whether any portion of those shares was owned beneficially. Affiliated shareholders of record owned 16.1% of the outstanding shares of the Fund in one or more accounts. Subscription and redemption activity by concentrated accounts may have a significant effect on the operations of the Fund. In the case of a large redemption, the Fund may be forced to sell investments at inopportune times, including its liquid positions, which may result in Fund losses and the Fund holding a higher percentage of less liquid positions. Large redemptions could result in decreased economies of scale and increased operating expenses for non-redeeming Fund shareholders.
Note 10. Subsequent events
Management has evaluated the events and transactions that have occurred through the date the financial statements were issued and noted no items requiring adjustment of the financial statements or additional disclosure.
Note 11. Information regarding pending and settled legal proceedings
Ameriprise Financial and certain of its affiliates have historically been involved in a number of legal, arbitration and regulatory proceedings, including routine litigation, class actions, and governmental actions, concerning matters arising in connection with the conduct of their business activities. Ameriprise Financial believes that the Fund is not currently the subject of, and that neither Ameriprise Financial nor any of its affiliates are the subject of, any pending legal, arbitration or regulatory proceedings that are likely to have a material adverse effect on the Fund or the ability of Ameriprise Financial or its affiliates to perform under their contracts with the Fund. Ameriprise Financial is required to make quarterly (10-Q), annual (10-K) and, as necessary, 8-K filings with the Securities and Exchange Commission (SEC) on legal and regulatory matters that relate to Ameriprise Financial and its affiliates. Copies of these filings may be obtained by accessing the SEC website at www.sec.gov.
There can be no assurance that these matters, or the adverse publicity associated with them, will not result in increased Fund redemptions, reduced sale of Fund shares or other adverse consequences to the Fund. Further, although we believe proceedings are not likely to have a material adverse effect on the Fund or the ability of Ameriprise Financial or its affiliates to perform under their contracts with the Fund, these proceedings are subject to uncertainties and, as such, we are unable to
Columbia Small Cap Index Fund | Annual Report 2019
| 35 |
Notes to Financial Statements (continued)
February 28, 2019
estimate the possible loss or range of loss that may result. An adverse outcome in one or more of these proceedings could result in adverse judgments, settlements, fines, penalties or other relief that could have a material adverse effect on the consolidated financial condition or results of operations of Ameriprise Financial.
| 36 | Columbia Small Cap Index Fund | Annual Report 2019 |
Report of Independent Registered Public Accounting Firm
To the Board of Trustees of Columbia Funds Series Trust and Shareholders of Columbia Small Cap Index Fund
Opinion on the Financial Statements
We have audited the accompanying statement of assets and liabilities, including the portfolio of investments, of Columbia Small Cap Index Fund (one of the funds constituting Columbia Funds Series Trust, referred to hereafter as the "Fund") as of February 28, 2019, the related statement of operations for the year ended February 28, 2019, the statement of changes in net assets for each of the two years in the period ended February 28, 2019, including the related notes, and the financial highlights for each of the periods indicated therein (collectively referred to as the “financial statements”). In our opinion, the financial statements present fairly, in all material respects, the financial position of the Fund as of February 28, 2019, the results of its operations for the year then ended, the changes in its net assets for each of the two years in the period ended February 28, 2019 and the financial highlights for each of the periods indicated therein in conformity with accounting principles generally accepted in the United States of America.
Basis for Opinion
These financial statements are the responsibility of the Fund’s management. Our responsibility is to express an opinion on the Fund’s financial statements based on our audits. We are a public accounting firm registered with the Public Company Accounting Oversight Board (United States) (PCAOB) and are required to be independent with respect to the Fund in accordance with the U.S. federal securities laws and the applicable rules and regulations of the Securities and Exchange Commission and the PCAOB.
We conducted our audits of these financial statements in accordance with the standards of the PCAOB. Those standards require that we plan and perform the audit to obtain reasonable assurance about whether the financial statements are free of material misstatement, whether due to error or fraud.
Our audits included performing procedures to assess the risks of material misstatement of the financial statements, whether due to error or fraud, and performing procedures that respond to those risks. Such procedures included examining, on a test basis, evidence regarding the amounts and disclosures in the financial statements. Our audits also included evaluating the accounting principles used and significant estimates made by management, as well as evaluating the overall presentation of the financial statements. Our procedures included confirmation of securities owned as of February 28, 2019 by correspondence with the custodian, transfer agent and brokers; when replies were not received from brokers, we performed other auditing procedures. We believe that our audits provide a reasonable basis for our opinion.
/s/PricewaterhouseCoopers LLP
Minneapolis, Minnesota
April 22, 2019
We have served as the auditor of one or more investment companies within the Columbia Funds Complex since 1977.
Columbia Small Cap Index Fund | Annual Report 2019
| 37 |
Federal Income Tax Information
(Unaudited)
The Fund hereby designates the following tax attributes for the fiscal year ended February 28, 2019. Shareholders will be notified in early 2020 of the amounts for use in preparing 2019 income tax returns.
Qualified
dividend
income | Dividends
received
deduction | Capital
gain
dividend |
| 84.80% | 84.52% | $392,842,404 |
Qualified dividend income. For taxable, non-corporate shareholders, the percentage of ordinary income distributed during the fiscal year that represents qualified dividend income subject to reduced tax rates.
Dividends received deduction. The percentage of ordinary income distributed during the fiscal year that qualifies for the corporate dividends received deduction.
Capital gain dividend. The Fund designates as a capital gain dividend the amount reflected above, or if subsequently determined to be different, the net capital gain of such fiscal period.
| 38 | Columbia Small Cap Index Fund | Annual Report 2019 |
Shareholders elect the Board that oversees the Fund’s operations. The Board appoints officers who are responsible for day-to-day business decisions based on policies set by the Board. The following table provides basic biographical information about the Fund’s Trustees as of the printing of this report, including their principal occupations during the past five years, although specific titles for individuals may have varied over the period. Under current Board policy, Trustees not affiliated with the Investment Manager generally may serve through the end of the calendar year in which they reach the mandatory retirement age established by the Board.
Independent trustees
Name,
address,
year of birth | Position held
with the Trust and
length of service | Principal occupation(s)
during past five years
and other relevant
professional experience | Number of
Funds in the
Columbia Funds
complex
overseen | Other directorships
held by Trustee
during the past
five years |
George S. Batejan
c/o Columbia Management
Investment Advisers, LLC
225 Franklin Street
Mail Drop BX32 05228
Boston, MA 02110
1953 | Trustee since 1/17 | Executive Vice President, Global Head of Technology and Operations, Janus Capital Group, Inc., 2010-2016 | 123 | Former Chairman of the Board, NICSA (National Investment Company Services Association) (Executive Committee, Nominating Committee and Governance Committee), 2014-2016; former Director, Intech Investment Management, 2011-2016; former Board Member, Metro Denver Chamber of Commerce, 2015-2016; former Advisory Board Member, University of Colorado Business School, 2015-2018 |
Kathleen Blatz
c/o Columbia Management
Investment Advisers, LLC
225 Franklin Street
Mail Drop BX32 05228
Boston, MA 02110
1954 | Trustee since 1/06 for RiverSource Funds and since 6/11 for Nations Funds | Attorney; specializing in arbitration and mediation; Chief Justice, Minnesota Supreme Court, 1998-2006; Associate Justice, Minnesota Supreme Court, 1996-1998; Fourth Judicial District Court Judge, Hennepin County, 1994-1996; Attorney in private practice and public service, 1984-1993; State Representative, Minnesota House of Representatives, 1979-1993, which included service on the Tax and Financial Institutions and Insurance Committees; Member and Interim Chair, Minnesota Sports Facilities Authority, January 2017-July 2017; Interim President and Chief Executive Officer, Blue Cross and Blue Shield of Minnesota (health care insurance), February-July 2018 | 123 | Trustee, BlueCross BlueShield of Minnesota since 2009 (Chair of the Business Development Committee, 2014-2017; Chair of the Governance Committee since 2017); Chair of the Robina Foundation since August 2013; former Member and Chair of the Board, Minnesota Sports Facilities Authority, January 2017-July 2017 |
Edward J. Boudreau, Jr.
c/o Columbia Management
Investment Advisers, LLC
225 Franklin Street
Mail Drop BX32 05228
Boston, MA 02110
1944 | Chair of the Board since 1/18; Trustee since 6/11 for RiverSource Funds and since 1/05 for Nations Funds | Managing Director, E.J. Boudreau & Associates (consulting) since 2000; FINRA Industry Arbitrator, 2002-present; Chairman and Chief Executive Officer, John Hancock Investments (asset management), Chairman and Interested Trustee for open-end and closed-end funds offered by John Hancock, 1989-2000; John Hancock Mutual Life Insurance Company, including Senior Vice President and Treasurer and Senior Vice President Information Technology, 1968-1988 | 123 | Former Trustee, Boston Museum of Science (Chair of Finance Committee) 1985-2013; former Trustee, BofA Funds Series Trust (11 funds), 2005-2011 |
Columbia Small Cap Index Fund | Annual Report 2019
| 39 |
TRUSTEES AND OFFICERS (continued)
Independent trustees (continued)
Name,
address,
year of birth | Position held
with the Trust and
length of service | Principal occupation(s)
during past five years
and other relevant
professional experience | Number of
Funds in the
Columbia Funds
complex
overseen | Other directorships
held by Trustee
during the past
five years |
Pamela G. Carlton
c/o Columbia Management
Investment Advisers, LLC
225 Franklin Street
Mail Drop BX32 05228
Boston, MA 02110
1954 | Trustee since 7/07 for RiverSource Funds and since 6/11 for Nations Funds | President, Springboard — Partners in Cross Cultural Leadership (consulting company) since 2003; Managing Director of US Equity Research, JP Morgan Chase, 1999-2003; Director of US Equity Research, Chase Asset Management, 1996-1999; Co-Director Latin America Research, 1993-1996, COO Global Research, 1992-1996, Co-Director of US Research, 1991-1992, Investment Banker, Morgan Stanley, 1982-1991 | 123 | Trustee, New York Presbyterian Hospital Board (Executive Committee and Chair of Human Resources Committee) since 1996; Director, Laurel Road Bank (Audit Committee) since 2017 |
Patricia M. Flynn
c/o Columbia Management
Investment Advisers, LLC
225 Franklin Street
Mail Drop BX32 05228
Boston, MA 02110
1950 | Trustee since 11/04 for RiverSource Funds and since 6/11 for Nations Funds | Trustee Professor of Economics and Management, Bentley University since 1976 (also teaches and conducts research on corporate governance); Dean, McCallum Graduate School of Business, Bentley University, 1992-2002 | 123 | Trustee, MA Taxpayers Foundation since 1997; Board of Directors, The MA Business Roundtable since 2003; Board of Governors, Innovation Institute, MA Technology Collaborative since 2010 |
Brian J. Gallagher
c/o Columbia Management
Investment Advisers, LLC
225 Franklin Street
Mail Drop BX32 05228
Boston, MA 02110
1954 | Trustee since 12/17 | Retired; Partner with Deloitte & Touche LLP and its predecessors, 1977-2016 | 121 | Trustee, Catholic Schools Foundation since 2004 |
Catherine James Paglia
c/o Columbia Management
Investment Advisers, LLC
225 Franklin Street
Mail Drop BX32 05228
Boston, MA 02110
1952 | Trustee since 11/04 for RiverSource Funds and since 6/11 for Nations Funds | Director, Enterprise Asset Management, Inc. (private real estate and asset management company) since September 1998; Managing Director and Partner, Interlaken Capital, Inc., 1989-1997; Managing Director, Morgan Stanley, 1982-1989; Vice President, Investment Banking, 1980-1982, Associate, Investment Banking, 1976-1980, Dean Witter Reynolds, Inc. | 123 | Director, Valmont Industries, Inc. (irrigation systems manufacturer) since 2012; Trustee, Carleton College (on the Investment Committee); Trustee, Carnegie Endowment for International Peace (on the Investment Committee) |
Anthony M. Santomero
c/o Columbia Management
Investment Advisers, LLC
225 Franklin Street
Mail Drop BX32 05228
Boston, MA 02110
1946 | Trustee since 6/11 for RiverSource Funds and since 1/08 for Nations Funds | Richard K. Mellon Professor Emeritus of Finance, The Wharton School, University of Pennsylvania, since 2002; Senior Advisor, McKinsey & Company (consulting), 2006-2008; President, Federal Reserve Bank of Philadelphia, 2000- 2006; Professor of Finance, The Wharton School, University of Pennsylvania, 1972-2002 | 123 | Trustee, Penn Mutual Life Insurance Company since March 2008; Director, Renaissance Reinsurance Ltd. since May 2008; former Trustee, BofA Funds Series Trust (11 funds), 2008-2011; former Director, Citigroup Inc. and Citibank, N.A., 2009-2019 |
| 40 | Columbia Small Cap Index Fund | Annual Report 2019 |
TRUSTEES AND OFFICERS (continued)
Independent trustees (continued)
Name,
address,
year of birth | Position held
with the Trust and
length of service | Principal occupation(s)
during past five years
and other relevant
professional experience | Number of
Funds in the
Columbia Funds
complex
overseen | Other directorships
held by Trustee
during the past
five years |
Minor M. Shaw
c/o Columbia Management
Investment Advisers, LLC
225 Franklin Street
Mail Drop BX32 05228
Boston, MA 02110
1947 | Trustee since 6/11 for RiverSource Funds and since 2003 for Nations Funds | President, Micco LLC (private investments) since 2011; President, Micco Corp. (family investment business), 1998-2011 | 123 | Director, BlueCross BlueShield of South Carolina since April 2008; Board Chair, Hollingsworth Funds since 2016; Advisory Board member, Duke Energy Corp. since October 2016; Chair of the Duke Endowment; Chair of Greenville – Spartanburg Airport Commission; former Trustee, BofA Funds Series Trust (11 funds), 2003-2011; former Director, Piedmont Natural Gas, 2004-2016; former Director, National Association of Corporate Directors, Carolinas Chapter, 2013-2018 |
Sandra Yeager
c/o Columbia Management
Investment Advisers, LLC
225 Franklin Street
Mail Drop BX32 05228
Boston, MA 02110
1964 | Trustee since 12/17 | Retired; President and founder, Hanoverian Capital, LLC (SEC registered investment advisor firm), 2008-2016; Managing Director, DuPont Capital, 2006-2008; Managing Director, Morgan Stanley Investment Management, 2004-2006; Senior Vice President, Alliance Bernstein, 1990-2004 | 121 | Director, NAPE Education Foundation since October 2016 |
Interested trustee affiliated with Investment Manager*
Name,
address,
year of birth | Position held with the Trust and length of service | Principal occupation(s) during the
past five years and other relevant
professional experience | Number of
Funds in the
Columbia Funds
complex overseen | Other directorships
held by Trustee
during the past
five years |
William F. Truscott
c/o Columbia Management
Investment Advisers, LLC
225 Franklin St.
Boston, MA 02110
1960 | Trustee since 11/01 for RiverSource Funds and since 6/11 for Nations Funds; Senior Vice President since 2002 for RiverSource Funds and since 5/10 for Nations Funds | Chairman of the Board and President, Columbia Management Investment Advisers, LLC since May 2010 and February 2012, respectively; Chief Executive Officer, Global Asset Management, Ameriprise Financial, Inc. since September 2012 (previously Chief Executive Officer, U.S. Asset Management & President, Annuities, May 2010 - September 2012); Director and Chief Executive Officer, Columbia Management Investment Distributors, Inc. since May 2010 and February 2012, respectively; Chairman of the Board and Chief Executive Officer, RiverSource Distributors, Inc. since 2006; Director, Threadneedle Asset Management Holdings, SARL since 2014; President and Chief Executive Officer, Ameriprise Certificate Company, 2006 - August 2012. | 192 | Chairman of the Board, Columbia Management Investment Advisers, LLC since May 2010; Director, Columbia Management Investment Distributors, Inc. since May 2010; former Director, Ameriprise Certificate Company, 2006-January 2013 |
| * | Interested person (as defined under the 1940 Act) by reason of being an officer, director, security holder and/or employee of the Investment Manager or Ameriprise Financial. |
Columbia Small Cap Index Fund | Annual Report 2019
| 41 |
TRUSTEES AND OFFICERS (continued)
Nations Funds refer to the Funds within the Columbia Funds Complex that historically bore the Nations brand and includes series of Columbia Funds Series Trust. RiverSource Funds refer to the Funds within the Columbia Funds Complex that historically bore the RiverSource brand and includes series of Columbia Funds Series Trust II.
The Statement of Additional Information has additional information about the Fund’s Board members and is available, without charge, upon request by calling 800.345.6611, visiting columbiathreadneedleus.com/investor/ or contacting your financial intermediary.
| 42 | Columbia Small Cap Index Fund | Annual Report 2019 |
TRUSTEES AND OFFICERS (continued)
The Board has appointed officers who are responsible for day-to-day business decisions based on policies it has established. The officers serve at the pleasure of the Board. The following table provides basic information about the Officers of the Fund as of the printing of this report, including principal occupations during the past five years, although their specific titles may have varied over the period. In addition to Mr. Truscott, who is Senior Vice President, the Fund’s other officers are:
Fund officers
Name,
address and
year of birth | Position and year
first appointed to
position for any Fund
in the Columbia
Funds complex or a
predecessor thereof | Principal occupation(s) during past five years |
Christopher O. Petersen
5228 Ameriprise
Financial Center
Minneapolis, MN 55474
Born 1970 | President and Principal Executive Officer (2015) | Vice President and Lead Chief Counsel, Ameriprise Financial, Inc. since January 2015 (previously, Vice President and Chief Counsel, January 2010 - December 2014; officer of Columbia Funds and affiliated funds since 2007. |
Michael G. Clarke
225 Franklin Street
Boston, MA 02110
Born 1969 | Chief Financial Officer (Principal Financial Officer) (2009) and Senior Vice President (2019) | Vice President — Accounting and Tax, Columbia Management Investment Advisers, LLC, since May 2010; senior officer of Columbia Funds and affiliated funds since 2002 (previously, Treasurer and Chief Accounting Officer, January 2009-January 2019 and December 2015-January 2019, respectively). |
Joseph Beranek
5890 Ameriprise
Financial Center
Minneapolis, MN 55474
Born 1965 | Treasurer and Chief Accounting Officer (Principal Accounting Officer) (2019) | Vice President — Mutual Fund Accounting and Financial Reporting, Columbia Management Investment Advisers, LLC, since December 2018 and March 2017, respectively (previously, Vice President — Pricing and Corporate Actions, May 2010-March 2017). |
Paul B. Goucher
485 Lexington Avenue
New York, NY 10017
Born 1968 | Senior Vice President (2011) and Assistant Secretary (2008) | Senior Vice President and Assistant General Counsel, Ameriprise Financial, Inc. since January 2017 (previously, Vice President and Lead Chief Counsel, November 2008 - January 2017 and January 2013 - January 2017, respectively); Vice President, Chief Legal Officer and Assistant Secretary, Columbia Management Investment Advisers, LLC since March 2015 (previously Vice President and Assistant Secretary, May 2010 – March 2015). |
Thomas P. McGuire
225 Franklin Street
Boston, MA 02110
Born 1972 | Senior Vice President and Chief Compliance Officer (2012) | Vice President — Asset Management Compliance, Ameriprise Financial, Inc., since May 2010; Chief Compliance Officer, Ameriprise Certificate Company since September 2010. |
Colin Moore
225 Franklin Street
Boston, MA 02110
Born 1958 | Senior Vice President (2010) | Executive Vice President and Global Chief Investment Officer, Ameriprise Financial, Inc., since July 2013; Executive Vice President and Global Chief Investment Officer, Columbia Management Investment Advisers, LLC since July 2013. |
Ryan C. Larrenaga
225 Franklin Street
Boston, MA 02110
Born 1970 | Senior Vice President (2017), Chief Legal Officer (2017), and Secretary (2015) | Vice President and Chief Counsel, Ameriprise Financial, Inc. since August 2018 (previously, Vice President and Group Counsel, August 2011 - August 2018); officer of Columbia Funds and affiliated funds since 2005. |
Michael E. DeFao
225 Franklin Street
Boston, MA 02110
Born 1968 | Vice President (2011) and Assistant Secretary (2010) | Vice President and Chief Counsel, Ameriprise Financial, Inc. since May 2010. |
Amy Johnson
5228 Ameriprise
Financial Center
Minneapolis, MN 55474
Born 1965 | Vice President (2006) | Managing Director and Global Head of Operations, Columbia Management Investment Advisers, LLC since April 2016 (previously Managing Director and Chief Operating Officer, 2010 - 2016). |
Columbia Small Cap Index Fund | Annual Report 2019
| 43 |
TRUSTEES AND OFFICERS (continued)
Fund officers (continued)
Name,
address and
year of birth | Position and year
first appointed to
position for any Fund
in the Columbia
Funds complex or a
predecessor thereof | Principal occupation(s) during past five years |
Lyn Kephart-Strong
5228 Ameriprise
Financial Center
Minneapolis, MN 55474
Born 1960 | Vice President (2015) | President, Columbia Management Investment Services Corp. since October 2014; Vice President & Resolution Officer, Ameriprise Trust Company since August 2009. |
| 44 | Columbia Small Cap Index Fund | Annual Report 2019 |
The Fund mails one shareholder report to each shareholder address, unless such shareholder elected to receive shareholder reports from the Fund electronically. If you would like more than one report, please call shareholder services at 800.345.6611 and additional reports will be sent to you.
Proxy voting policies and procedures
The policy of the Board of Trustees is to vote the proxies of the companies in which the Fund holds investments consistent with the procedures as stated in the Statement of Additional Information (SAI). You may obtain a copy of the SAI without charge by calling 800.345.6611; contacting your financial intermediary; visiting columbiathreadneedleus.com/investor/; or searching the website of the Securities and Exchange Commission (SEC) at sec.gov. Information regarding how the Fund voted proxies relating to portfolio securities is filed with the SEC by August 31st for the most recent 12-month period ending June 30th of that year, and is available without charge by visiting columbiathreadneedleus.com/investor/, or searching the website of the SEC at sec.gov.
Quarterly schedule of investments
The Fund files a complete schedule of portfolio holdings with the SEC for the first and third quarters of each fiscal year on Form N-Q or Form N-PORT (available for filings after March 31, 2019). The Fund’s Form N-Q or Form N-PORT is available on the SEC’s website at sec.gov. The Fund’s complete schedule of portfolio holdings, as filed on Form N-Q or Form N-PORT, can also be obtained without charge, upon request, by calling 800.345.6611.
Additional Fund information
For more information about the Fund, please visit columbiathreadneedleus.com/investor/ or call 800.345.6611. Customer Service Representatives are available to answer your questions Monday through Friday from 8 a.m. to 7 p.m. Eastern time.
Fund investment manager
Columbia Management Investment Advisers, LLC
225 Franklin Street
Boston, MA 02110
Fund distributor
Columbia Management Investment Distributors, Inc.
225 Franklin Street
Boston, MA 02110
Fund transfer agent
Columbia Management Investment Services Corp.
P.O. Box 219104
Kansas City, MO 64121-9104
Columbia Small Cap Index Fund | Annual Report 2019
| 45 |
Columbia Small Cap Index Fund
P.O. Box 219104
Kansas City, MO 64121-9104
Please read and consider the investment objectives, risks, charges and expenses for any fund carefully before investing. For a prospectus and summary prospectus, which contains this and other important information about the Fund, go to
columbiathreadneedleus.com/investor/. The Fund is distributed by Columbia Management Investment Distributors, Inc., member FINRA, and managed by Columbia Management Investment Advisers, LLC.
Columbia Threadneedle Investments (Columbia Threadneedle) is the global brand name of the Columbia and Threadneedle group of companies. All rights reserved.
© 2019 Columbia Management Investment Advisers, LLC.
columbiathreadneedleus.com/investor/

Annual Report
February 28, 2019
Columbia Small Cap Value Fund II
Beginning on January 1, 2021, as permitted by regulations adopted by the Securities and Exchange Commission, paper copies of the Fund’s annual and semiannual shareholder reports like this one will no longer be sent by mail, unless you specifically request paper copies of the reports. Instead, the reports will be made available on the Fund’s website (columbiathreadneedleus.com/investor/), and each time a report is posted you will be notified by mail and provided with a website address to access the report.
If you have already elected to receive shareholder reports electronically, you will not be affected by this change and you need not take any action. You may elect to receive shareholder reports and other communications from the Fund electronically at any time by contacting your financial intermediary (such as a broker-dealer or bank) or, for Fund shares held directly with the Fund, by calling 800.345.6611 or by enrolling in “eDelivery” by logging into your account at columbiathreadneedleus.com/investor/.
You may elect to receive all future reports in paper free of charge. If you invest through a financial intermediary, you can contact your financial intermediary to request that you continue receiving paper copies of your shareholder reports. If you invest directly with the Fund, you can call 800.345.6611 to let the Fund know you wish to continue receiving paper copies of your shareholder reports. Your election to receive paper reports will apply to all Columbia Funds held in your account if you invest through a financial intermediary or all Columbia Funds held with the fund complex if you invest directly with the Fund.
Not FDIC Insured • No bank guarantee • May lose value
Dear Shareholders,
Volatility exists in financial markets and this is not a comfortable fact of life. How investors deal with this reality, including how they react to short term spikes in volatility as well as to longer periods of increased or decreased volatility, may have a significant impact on their overall investing success.
Too often, investors change their investment strategy based on something that’s happening at a moment in time rather than thinking about how that change in strategy might affect their ability to achieve their longer term financial goals. Emotion replaces logic and reasoning. Investors may sell in reaction to a market drop (fear or panic), locking in low returns which means they won’t be invested when the market returns, or they invest more at a market peak (greed or conviction), essentially when it is expensive to do so. In both cases, selling and buying at the exact wrong time.
We believe the best outcomes come from a consistent approach to investing. Here are five areas where advisors can help us overcome the tendency to react emotionally as we struggle to make the right choices with our investments:
Long-term focus
The further away long-term goals, aspirations and objectives are, the easier it is to stray away from the goals and priorities that we set out. Advisors help us stay focused on what we want to accomplish.
Discipline through up-and-down markets
Advisors help set rules to prevent us from making rash decisions that we may regret later. Knowing ahead of time what you should do in case of certain situations will help you get through volatile markets and not make emotional decisions.
Tax-awareness
Taxes are one of the biggest drags on investment returns and are critical attributes of investing. Yet few of us take the necessary steps to ease the corrosive effect of taxes. Advisors have tools and knowledge that may help us to manage portfolios more tax-efficiently and keep more of what we earn.
Emotional objectivity
Our emotions are very hard to manage and making investment decisions in an emotional state can lead to exceedingly bad outcomes. An objective advisor can help prevent some of the reactionary mistakes emotions often lead us to.
Education and guidance
The role of the advisor is to teach and guide us toward achieving our financial goals. In terms of working through emotions, guidance is by far the most important component.
By understanding our own behaviors and biases, we can prepare for future challenges. Your success is our priority. Talk to your advisor about how working with Columbia Threadneedle Investments may help you stay the course and position your portfolio for consistent, sustainable outcomes, regardless of market conditions.
Sincerely,
Christopher O. Petersen
President, Columbia Funds
Columbia Funds are distributed by Columbia Management Investment Distributors, Inc., member FINRA, and managed by Columbia Management Investment Advisers, LLC.
© 2019 Columbia Management Investment Advisers, LLC. All rights reserved.
Columbia Small Cap Value Fund II | Annual Report 2019
Columbia Small Cap Value Fund II | Annual Report 2019
Investment objective
Columbia Small Cap Value Fund II (the Fund) seeks long-term capital appreciation.
Portfolio management
Christian Stadlinger, Ph.D., CFA
Co-Portfolio Manager
Managed Fund since 2002
Jarl Ginsberg, CFA, CAIA
Co-Portfolio Manager
Managed Fund since 2003
Morningstar style boxTM
The Morningstar Style Box is based on a fund’s portfolio holdings. For equity funds, the vertical axis shows the market capitalization of the stocks owned, and the horizontal axis shows investment style (value, blend, or growth). Information shown is based on the most recent data provided by Morningstar.
© 2019 Morningstar, Inc. All rights reserved. The Morningstar information contained herein: (1) is proprietary to Morningstar and/or its content providers; (2) may not be copied or distributed; and (3) is not warranted to be accurate, complete or timely. Neither Morningstar nor its content providers are responsible for any damages or losses arising from any use of this information.
| Average annual total returns (%) (for the period ended February 28, 2019) |
| | | Inception | 1 Year | 5 Years | 10 Years |
| Class A | Excluding sales charges | 05/01/02 | -0.15 | 5.58 | 15.49 |
| | Including sales charges | | -5.87 | 4.33 | 14.81 |
| Advisor Class* | 11/08/12 | 0.09 | 5.84 | 15.67 |
| Class C | Excluding sales charges | 05/01/02 | -0.93 | 4.78 | 14.62 |
| | Including sales charges | | -1.79 | 4.78 | 14.62 |
| Institutional Class | 05/01/02 | 0.09 | 5.84 | 15.78 |
| Institutional 2 Class* | 11/08/12 | 0.22 | 5.99 | 15.78 |
| Institutional 3 Class* | 11/08/12 | 0.27 | 6.05 | 15.82 |
| Class R | 01/23/06 | -0.46 | 5.31 | 15.20 |
| Russell 2000 Value Index | | 4.42 | 6.48 | 15.43 |
Returns for Class A shares are shown with and without the maximum initial sales charge of 5.75%. Returns for Class C shares are shown with and without the 1.00% contingent deferred sales charge for the first year only. The Fund’s other share classes are not subject to sales charges and have limited eligibility. Please see the Fund’s prospectus for details. Performance for different share classes will vary based on differences in sales charges and fees associated with each share class. All results shown assume reinvestment of distributions during the period. Returns do not reflect the deduction of taxes that a shareholder may pay on Fund distributions or on the redemption of Fund shares. Performance results reflect the effect of any fee waivers or reimbursements of Fund expenses by Columbia Management Investment Advisers, LLC and/or any of its affiliates. Absent these fee waivers or expense reimbursement arrangements, performance results would have been lower.
The performance information shown represents past performance and is not a guarantee of future results. The investment return and principal value of your investment will fluctuate so that your shares, when redeemed, may be worth more or less than their original cost. Current performance may be lower or higher than the performance information shown. You may obtain performance information current to the most recent month-end by contacting your financial intermediary, visiting columbiathreadneedleus.com/investor/ or calling 800.345.6611.
| * | The returns shown for periods prior to the share class inception date (including returns for the Life of the Fund, if shown, which are since Fund inception) include the returns of the Fund’s oldest share class. Since the Fund launched more than one share class at its inception, Class A shares were used. These returns are adjusted to reflect any higher class-related operating expenses of the newer share classes, as applicable. Please visit columbiathreadneedleus.com/investor/investment-products/mutual-funds/appended-performance for more information. |
The Russell 2000 Value Index, an unmanaged index, tracks the performance of those Russell 2000 Index companies with lower price-to-book ratios and lower forecasted growth values.
Indices are not available for investment, are not professionally managed and do not reflect sales charges, fees, brokerage commissions, taxes or other expenses of investing. Securities in the Fund may not match those in an index.
| 2 | Columbia Small Cap Value Fund II | Annual Report 2019 |
Fund at a Glance (continued)
Performance of a hypothetical $10,000 investment (February 28, 2009 — February 28, 2019)
The chart above shows the change in value of a hypothetical $10,000 investment in Class A shares of Columbia Small Cap Value Fund II during the stated time period, and does not reflect the deduction of taxes that a shareholder may pay on Fund distributions or on the redemption of Fund shares.
| Top 10 holdings (%) (at February 28, 2019) |
| Independent Bank Corp. | 1.7 |
| Community Bank System, Inc. | 1.6 |
| Union Bankshares Corp. | 1.5 |
| First Industrial Realty Trust, Inc. | 1.5 |
| New Jersey Resources Corp. | 1.5 |
| Renasant Corp. | 1.4 |
| Armstrong World Industries, Inc. | 1.4 |
| MGIC Investment Corp. | 1.4 |
| Dine Brands Global, Inc. | 1.3 |
| Argo Group International Holdings Ltd. | 1.3 |
Percentages indicated are based upon total investments excluding Money Market Funds and investments in derivatives, if any.
For further detail about these holdings, please refer to the section entitled “Portfolio of Investments.”
Fund holdings are as of the date given, are subject to change at any time, and are not recommendations to buy or sell any security.
| Portfolio breakdown (%) (at February 28, 2019) |
| Common Stocks | 98.9 |
| Money Market Funds | 1.1 |
| Total | 100.0 |
Percentages indicated are based upon total investments excluding investments in derivatives, if any. The Fund’s portfolio composition is subject to change.
| Equity sector breakdown (%) (at February 28, 2019) |
| Communication Services | 1.9 |
| Consumer Discretionary | 8.7 |
| Consumer Staples | 2.2 |
| Energy | 4.7 |
| Financials | 30.9 |
| Health Care | 4.1 |
| Industrials | 15.9 |
| Information Technology | 10.9 |
| Materials | 5.4 |
| Real Estate | 9.0 |
| Utilities | 6.3 |
| Total | 100.0 |
Percentages indicated are based upon total equity investments. The Fund’s portfolio composition is subject to change.
Columbia Small Cap Value Fund II | Annual Report 2019
| 3 |
Manager Discussion of Fund Performance
For the 12-month period that ended February 28, 2019, the Fund’s Class A shares returned -0.15% excluding sales charges. The Fund lagged its benchmark, the Russell 2000 Value Index, which returned 4.42% for the same time period. Stock selection and sector allocation both figured into the Fund’s performance shortfall relative to the benchmark.
Stocks advanced despite year-end sell-off
Investors kicked off the 12-month period ended February 28, 2019 with soaring optimism. Positive global economic conditions, broad corporate tax cuts and moves to reduce regulation in a number of industries buoyed confidence. The pace of economic growth averaged more than 3.0% as the labor markets added an average of 209,000 jobs per month, wages increased on the order of 3.0% and manufacturing activity remained solid. Unemployment rose modestly in December and January, but even that was a net positive as it reflected an increase in the number of Americans seeking employment. Weak job creation in February drove unemployment back down to 3.8%.
However, as 2018 progressed, the rosy global outlook dimmed. European economies transitioned to a slower pace, struggling with rising interest rates, trade tensions and uncertainty surrounding Brexit (the U.K.’s departure from the European Union). At the same time, China’s economic conditions weakened and emerging markets came under pressure, driven by trade concerns and a rising U.S dollar. In December, the Federal Reserve (the Fed) rattled investors when it raised the target range of its key short-term interest rate, the federal funds rate, to 2.25%-2.50%, the fourth such increase for the year. However, the Fed maintained this rate in its January 2019 meeting and announced that it would be patient moving forward.
As uncertainties rose late in 2018, investors backed away from riskier assets. Technology stocks, which had been global market leaders, stumbled in the third quarter of 2018 and triggered a broader market sell-off of stocks and high-yield bonds in the fourth quarter. However, stocks rebounded early in 2019 as a patient Fed and hopes for progress on the trade front inspired confidence. The S&P 500 Index, a broad measure of U.S. stock returns, gained 4.68% for the 12-month period, with dividends reinvested. Investment-grade bonds, as measured by the Bloomberg Barclays U.S. Aggregate Bond Index, returned 3.17%.
Contributors and detractors
Strong security selection within the health care sector aided performance for the period. Stock selection within consumer staples and materials, as well as an underweight in energy, also contributed to relative results. In the health care sector, LHC Group, Horizon Pharma and Molina Healthcare all were notable performers. LHC, a company that provides post-acute health care services to patients, climbed early in the period after announcing the successful completion of its merger with Almost Family. LHC continued to benefit throughout the year from the realization of synergies related to this merger. Shares of pharmaceutical company Horizon Pharma jumped at the end of the period after reporting strong quarterly results, driven by the company’s orphan/rheumatology and primary care businesses. Molina Healthcare, a managed care company that provides health insurance through Medicaid and Medicare, reported strong quarterly profits driven by reduced expenses and a lower effective tax rate. We took profits and sold Molina during the period. Outside health care, a position in Dine Brands was a notable outperformer. The company, which owns the Applebee’s and IHOP brands, reported strong quarterly results driven by solid year-over-year sales at its restaurants, increased its dividend and authorized a new share buyback program.
Stock selection within financials, information technology, energy and industrials were the biggest detractors from relative performance. An overweight in materials and an underweight in real estate also detracted from relative returns. The materials sector was one of the worst performing sectors in the benchmark, as many of the more cyclical companies in the sector sold off.
Individual detractors included William Lyon Homes, US Concrete and Ameris Bancorp. William Lyon Homes, which constructs and sells single family homes, sold off alongside the broader homebuilding industry. We exited the name. US Concrete reported quarterly earnings that fell short of expectations, in part because of weather but also because of investor concerns about the potential impact of slower U.S. economic growth. We exited the name. Within financials, a position in Ameris Bancorp, a regional bank in the southeast United States, detracted from returns as it sold off after announcing it would acquire another regional bank in an all-stock transaction. We continue to hold the name.
| 4 | Columbia Small Cap Value Fund II | Annual Report 2019 |
Manager Discussion of Fund Performance (continued)
Strategic positioning
The bulk of underperformance for the 12-month period was the result of Fund positioning during the second quarter of 2018. As global trade tensions and tariff discussions heated up, many investors increased exposure to small cap stocks through exchange traded funds (ETFs), on the rationale that small caps generally derive less revenue outside the United States, which would help insulate them from global trade policies. These flows into passive vehicles led to outperformance from the smallest, and least liquid names in the benchmark, regardless of fundamentals. The Fund is generally underweight in these illiquid names, as they carry more risk. Over the long term, we believe that stock prices correlate to earnings growth, and we expect the impact of these macro-themed trades could be short lived.
At period’s end
Regardless of the economic environment, we continue to focus on bottom-up stock selection. We look for undervalued companies with strong underlying earnings prospects that are exhibiting evidence of an upward inflection. In doing so, we believe we have the potential to avoid value traps and the potential to deliver attractive returns for our clients. As of the end of the period, the Fund was overweight in industrials and materials and underweight in real estate.
Marketrisk may affect a single issuer, sector of the economy, industry or the market as a whole.Foreigninvestments subject the Fund to risks, including political, economic, market, social and others within a particular country, as well as to currency instabilities and less stringent financial and accounting standards generally applicable to U.S. issuers. Investments insmall-cap companies involve risks and volatility greater than investments in larger, more established companies.Valuesecurities may be unprofitable if the market fails to recognize their intrinsic worth or the portfolio manager misgauged that worth. The Fund may invest significantly in issuers within a particularsector, which may be negatively affected by market, economic or other conditions, making the Fund more vulnerable to unfavorable developments in the sector. See the Fund’s prospectus for more information on these and other risks.
The views expressed in this report reflect the current views of the respective parties. These views are not guarantees of future performance and involve certain risks, uncertainties and assumptions that are difficult to predict, so actual outcomes and results may differ significantly from the views expressed. These views are subject to change at any time based upon economic, market or other conditions and the respective parties disclaim any responsibility to update such views. These views may not be relied on as investment advice and, because investment decisions for a Columbia fund are based on numerous factors, may not be relied on as an indication of trading intent on behalf of any particular Columbia fund. References to specific securities should not be construed as a recommendation or investment advice.
Columbia Small Cap Value Fund II | Annual Report 2019
| 5 |
Understanding Your Fund’s Expenses
(Unaudited)
As an investor, you incur two types of costs. There are shareholder transaction costs, which generally include sales charges on purchases and may include redemption fees. There are also ongoing fund costs, which generally include management fees, distribution and/or service fees, and other fund expenses. The following information is intended to help you understand your ongoing costs (in dollars) of investing in the Fund and to help you compare these costs with the ongoing costs of investing in other mutual funds.
Analyzing your Fund’s expenses
To illustrate these ongoing costs, we have provided examples and calculated the expenses paid by investors in each share class of the Fund during the period. The actual and hypothetical information in the table is based on an initial investment of $1,000 at the beginning of the period indicated and held for the entire period. Expense information is calculated two ways and each method provides you with different information. The amount listed in the “Actual” column is calculated using the Fund’s actual operating expenses and total return for the period. You may use the Actual information, together with the amount invested, to estimate the expenses that you paid over the period. Simply divide your account value by $1,000 (for example, an $8,600 account value divided by $1,000 = 8.6), then multiply the results by the expenses paid during the period under the “Actual” column. The amount listed in the “Hypothetical” column assumes a 5% annual rate of return before expenses (which is not the Fund’s actual return) and then applies the Fund’s actual expense ratio for the period to the hypothetical return. You should not use the hypothetical account values and expenses to estimate either your actual account balance at the end of the period or the expenses you paid during the period. See “Compare with other funds” below for details on how to use the hypothetical data.
Compare with other funds
Since all mutual funds are required to include the same hypothetical calculations about expenses in shareholder reports, you can use this information to compare the ongoing cost of investing in the Fund with other funds. To do so, compare the hypothetical example with the 5% hypothetical examples that appear in the shareholder reports of other funds. As you compare hypothetical examples of other funds, it is important to note that hypothetical examples are meant to highlight the ongoing costs of investing in a fund only and do not reflect any transaction costs, such as sales charges, or redemption or exchange fees. Therefore, the hypothetical calculations are useful in comparing ongoing costs only, and will not help you determine the relative total costs of owning different funds. If transaction costs were included in these calculations, your costs would be higher.
| September 1, 2018 — February 28, 2019 |
| | Account value at the
beginning of the
period ($) | Account value at the
end of the
period ($) | Expenses paid during
the period ($) | Fund’s annualized
expense ratio (%) |
| | Actual | Hypothetical | Actual | Hypothetical | Actual | Hypothetical | Actual |
| Class A | 1,000.00 | 1,000.00 | 903.80 | 1,018.50 | 5.99 | 6.36 | 1.27 |
| Advisor Class | 1,000.00 | 1,000.00 | 904.90 | 1,019.74 | 4.82 | 5.11 | 1.02 |
| Class C | 1,000.00 | 1,000.00 | 900.30 | 1,014.78 | 9.52 | 10.09 | 2.02 |
| Institutional Class | 1,000.00 | 1,000.00 | 904.90 | 1,019.74 | 4.82 | 5.11 | 1.02 |
| Institutional 2 Class | 1,000.00 | 1,000.00 | 905.70 | 1,020.43 | 4.16 | 4.41 | 0.88 |
| Institutional 3 Class | 1,000.00 | 1,000.00 | 906.00 | 1,020.68 | 3.92 | 4.16 | 0.83 |
| Class R | 1,000.00 | 1,000.00 | 902.50 | 1,017.26 | 7.17 | 7.60 | 1.52 |
Expenses paid during the period are equal to the annualized expense ratio for each class as indicated above, multiplied by the average account value over the period and then multiplied by the number of days in the Fund’s most recent fiscal half year and divided by 365.
Expenses do not include fees and expenses incurred indirectly by the Fund from its investment in underlying funds, including affiliated and non-affiliated pooled investment vehicles, such as mutual funds and exchange-traded funds.
Had Columbia Management Investment Advisers, LLC and/or certain of its affiliates not waived/reimbursed certain fees and expenses, account value at the end of the period would have been reduced.
| 6 | Columbia Small Cap Value Fund II | Annual Report 2019 |
Portfolio of Investments
February 28, 2019
(Percentages represent value of investments compared to net assets)
Investments in securities
| Common Stocks 98.5% |
| Issuer | Shares | Value ($) |
| Communication Services 1.9% |
| Diversified Telecommunication Services 0.6% |
| Vonage Holdings Corp.(a) | 850,800 | 8,746,224 |
| Media 1.3% |
| Nexstar Media Group, Inc., Class A | 180,000 | 17,591,400 |
| Total Communication Services | 26,337,624 |
| Consumer Discretionary 8.6% |
| Auto Components 0.6% |
| Tower International, Inc. | 347,962 | 8,925,225 |
| Diversified Consumer Services 1.1% |
| Adtalem Global Education, Inc.(a) | 320,000 | 15,424,000 |
| Hotels, Restaurants & Leisure 2.3% |
| Brinker International, Inc. | 280,000 | 12,815,600 |
| Dine Brands Global, Inc. | 185,000 | 18,352,000 |
| Total | | 31,167,600 |
| Household Durables 1.0% |
| KB Home | 410,000 | 9,352,100 |
| TopBuild Corp.(a) | 62,949 | 3,745,466 |
| Total | | 13,097,566 |
| Specialty Retail 3.6% |
| Aaron’s, Inc. | 300,000 | 16,287,000 |
| American Eagle Outfitters, Inc. | 385,000 | 7,854,000 |
| Children’s Place, Inc. (The) | 110,000 | 10,511,600 |
| Genesco, Inc.(a) | 207,000 | 9,991,890 |
| Sally Beauty Holdings, Inc.(a) | 305,000 | 5,511,350 |
| Total | | 50,155,840 |
| Total Consumer Discretionary | 118,770,231 |
| Consumer Staples 2.1% |
| Food & Staples Retailing 1.1% |
| BJ’s Wholesale Club Holdings, Inc.(a) | 625,000 | 15,825,000 |
| Food Products 1.0% |
| TreeHouse Foods, Inc.(a) | 226,000 | 13,691,080 |
| Total Consumer Staples | 29,516,080 |
| Common Stocks (continued) |
| Issuer | Shares | Value ($) |
| Energy 4.7% |
| Energy Equipment & Services 0.7% |
| Diamond Offshore Drilling, Inc.(a) | 142,645 | 1,362,259 |
| Patterson-UTI Energy, Inc. | 615,000 | 8,154,900 |
| Total | | 9,517,159 |
| Oil, Gas & Consumable Fuels 4.0% |
| Arch Coal, Inc. | 170,000 | 15,837,200 |
| Callon Petroleum Co.(a) | 1,180,000 | 9,027,000 |
| Carrizo Oil & Gas, Inc.(a) | 525,000 | 5,764,500 |
| Delek U.S. Holdings, Inc. | 190,100 | 6,725,738 |
| Oasis Petroleum, Inc.(a) | 995,000 | 5,562,050 |
| SM Energy Co. | 335,000 | 5,473,900 |
| Southwestern Energy Co.(a) | 1,600,000 | 6,768,000 |
| Total | | 55,158,388 |
| Total Energy | 64,675,547 |
| Financials 30.4% |
| Banks 16.6% |
| Ameris Bancorp | 370,000 | 15,084,900 |
| Cathay General Bancorp | 445,000 | 17,283,800 |
| Chemical Financial Corp. | 265,000 | 12,144,950 |
| Community Bank System, Inc. | 345,000 | 22,352,550 |
| Hancock Whitney Corp. | 375,000 | 16,380,000 |
| Heritage Commerce Corp. | 647,000 | 9,038,590 |
| Heritage Financial Corp. | 395,000 | 13,003,400 |
| Independent Bank Corp. | 273,000 | 23,240,490 |
| Pacific Premier Bancorp, Inc. | 460,000 | 13,731,000 |
| Renasant Corp. | 490,000 | 18,757,200 |
| Sandy Spring Bancorp, Inc. | 480,000 | 16,833,600 |
| TCF Financial Corp. | 628,000 | 14,381,200 |
| UMB Financial Corp. | 248,000 | 17,064,880 |
| Union Bankshares Corp. | 595,000 | 21,164,150 |
| Total | | 230,460,710 |
The accompanying Notes to Financial Statements are an integral part of this statement.
Columbia Small Cap Value Fund II | Annual Report 2019
| 7 |
Portfolio of Investments (continued)
February 28, 2019
| Common Stocks (continued) |
| Issuer | Shares | Value ($) |
| Capital Markets 2.2% |
| Houlihan Lokey, Inc. | 340,000 | 15,633,200 |
| Moelis & Co., ADR, Class A | 180,000 | 8,029,800 |
| Virtu Financial, Inc. Class A | 300,000 | 7,542,000 |
| Total | | 31,205,000 |
| Consumer Finance 0.9% |
| SLM Corp.(a) | 1,080,000 | 11,934,000 |
| Insurance 5.3% |
| American Equity Investment Life Holding Co. | 405,000 | 12,818,250 |
| AMERISAFE, Inc. | 235,000 | 14,830,850 |
| Argo Group International Holdings Ltd. | 260,000 | 18,072,600 |
| CNO Financial Group, Inc. | 610,000 | 10,388,300 |
| Health Insurance Innovations, Inc., Class A(a) | 170,800 | 6,355,468 |
| MBIA, Inc.(a) | 1,182,787 | 11,745,075 |
| Total | | 74,210,543 |
| Mortgage Real Estate Investment Trusts (REITS) 1.1% |
| Blackstone Mortgage Trust, Inc. | 300,000 | 10,344,000 |
| Invesco Mortgage Capital, Inc. | 300,000 | 4,776,000 |
| Total | | 15,120,000 |
| Thrifts & Mortgage Finance 4.3% |
| Axos Financial, Inc.(a) | 455,000 | 14,687,400 |
| MGIC Investment Corp.(a) | 1,430,000 | 18,561,400 |
| OceanFirst Financial Corp. | 368,700 | 9,291,240 |
| WSFS Financial Corp. | 395,000 | 17,095,600 |
| Total | | 59,635,640 |
| Total Financials | 422,565,893 |
| Health Care 4.1% |
| Biotechnology 0.6% |
| Alder Biopharmaceuticals, Inc.(a) | 360,600 | 4,622,892 |
| Immunomedics, Inc.(a) | 205,000 | 3,230,800 |
| Total | | 7,853,692 |
| Health Care Equipment & Supplies 0.8% |
| Merit Medical Systems, Inc.(a) | 201,999 | 11,257,404 |
| Health Care Providers & Services 1.1% |
| LHC Group, Inc.(a) | 144,000 | 15,795,360 |
| Common Stocks (continued) |
| Issuer | Shares | Value ($) |
| Pharmaceuticals 1.6% |
| Amneal Pharmaceuticals, Inc.(a) | 380,400 | 5,146,812 |
| Endo International PLC(a) | 430,000 | 4,725,700 |
| Horizon Pharma PLC(a) | 415,000 | 12,039,150 |
| Total | | 21,911,662 |
| Total Health Care | 56,818,118 |
| Industrials 15.7% |
| Airlines 2.1% |
| Hawaiian Holdings, Inc. | 290,000 | 8,627,500 |
| Skywest, Inc. | 270,000 | 14,590,800 |
| Spirit Airlines, Inc.(a) | 102,000 | 5,737,500 |
| Total | | 28,955,800 |
| Building Products 1.3% |
| Armstrong World Industries, Inc. | 255,000 | 18,660,900 |
| Construction & Engineering 2.3% |
| Granite Construction, Inc. | 285,000 | 13,269,600 |
| KBR, Inc. | 350,000 | 6,916,000 |
| MasTec, Inc.(a) | 264,000 | 11,399,520 |
| Total | | 31,585,120 |
| Electrical Equipment 0.8% |
| Sunrun, Inc.(a) | 756,000 | 11,725,560 |
| Machinery 3.5% |
| Barnes Group, Inc. | 204,319 | 11,864,804 |
| Evoqua Water Technologies Corp.(a) | 428,600 | 5,820,388 |
| Kennametal, Inc. | 410,000 | 15,452,900 |
| Navistar International Corp.(a) | 420,000 | 16,115,400 |
| Total | | 49,253,492 |
| Professional Services 2.9% |
| ICF International, Inc. | 195,000 | 14,726,400 |
| Kforce, Inc. | 342,000 | 12,657,420 |
| Korn/Ferry International | 250,000 | 12,197,500 |
| Total | | 39,581,320 |
| Road & Rail 1.4% |
| Covenant Transportation Group, Inc., Class A(a) | 452,000 | 10,310,120 |
| Hertz Global Holdings, Inc.(a) | 452,366 | 8,640,191 |
| Total | | 18,950,311 |
The accompanying Notes to Financial Statements are an integral part of this statement.
| 8 | Columbia Small Cap Value Fund II | Annual Report 2019 |
Portfolio of Investments (continued)
February 28, 2019
| Common Stocks (continued) |
| Issuer | Shares | Value ($) |
| Trading Companies & Distributors 1.4% |
| NOW, Inc.(a) | 660,000 | 9,523,800 |
| Triton International Ltd. | 287,600 | 9,464,916 |
| Total | | 18,988,716 |
| Total Industrials | 217,701,219 |
| Information Technology 10.7% |
| Communications Equipment 2.8% |
| Ciena Corp.(a) | 380,000 | 16,210,800 |
| Lumentum Holdings, Inc.(a) | 196,900 | 9,795,775 |
| Viavi Solutions, Inc.(a) | 939,400 | 12,334,322 |
| Total | | 38,340,897 |
| Electronic Equipment, Instruments & Components 1.8% |
| SYNNEX Corp. | 165,000 | 16,189,800 |
| TTM Technologies, Inc.(a) | 750,000 | 9,090,000 |
| Total | | 25,279,800 |
| IT Services 0.8% |
| Science Applications International Corp. | 155,000 | 11,578,500 |
| Semiconductors & Semiconductor Equipment 3.4% |
| Cohu, Inc. | 393,000 | 7,030,770 |
| Cree, Inc.(a) | 250,000 | 13,602,500 |
| Entegris, Inc. | 385,000 | 13,602,050 |
| Kulicke & Soffa Industries, Inc. | 540,000 | 12,592,800 |
| Total | | 46,828,120 |
| Software 1.5% |
| Avaya Holdings Corp.(a) | 540,800 | 8,376,992 |
| Verint Systems, Inc.(a) | 225,000 | 11,981,250 |
| Total | | 20,358,242 |
| Technology Hardware, Storage & Peripherals 0.4% |
| Electronics for Imaging, Inc.(a) | 225,700 | 6,102,928 |
| Total Information Technology | 148,488,487 |
| Materials 5.3% |
| Chemicals 1.3% |
| Livent Corp.(a) | 444,445 | 5,688,896 |
| Orion Engineered Carbons SA | 435,000 | 12,123,450 |
| Total | | 17,812,346 |
| Common Stocks (continued) |
| Issuer | Shares | Value ($) |
| Metals & Mining 4.0% |
| Allegheny Technologies, Inc.(a) | 579,000 | 16,576,770 |
| Carpenter Technology Corp. | 290,000 | 13,612,600 |
| Cleveland-Cliffs, Inc. | 926,100 | 10,270,449 |
| Materion Corp. | 270,000 | 15,600,600 |
| Total | | 56,060,419 |
| Total Materials | 73,872,765 |
| Real Estate 8.8% |
| Equity Real Estate Investment Trusts (REITS) 8.8% |
| American Assets Trust, Inc. | 340,000 | 14,769,600 |
| Brandywine Realty Trust | 560,000 | 8,803,200 |
| Chesapeake Lodging Trust | 565,000 | 17,017,800 |
| CoreCivic, Inc. | 295,000 | 6,248,100 |
| First Industrial Realty Trust, Inc. | 615,000 | 20,614,800 |
| Hudson Pacific Properties, Inc. | 310,000 | 10,298,200 |
| Mack-Cali Realty Corp. | 595,000 | 12,500,950 |
| PS Business Parks, Inc. | 118,000 | 17,366,060 |
| Sunstone Hotel Investors, Inc. | 995,000 | 14,974,750 |
| Total | | 122,593,460 |
| Total Real Estate | 122,593,460 |
| Utilities 6.2% |
| Electric Utilities 1.8% |
| PNM Resources, Inc. | 212,300 | 9,273,264 |
| Portland General Electric Co. | 305,000 | 15,292,700 |
| Total | | 24,565,964 |
| Gas Utilities 4.4% |
| New Jersey Resources Corp. | 415,000 | 20,086,000 |
| ONE Gas, Inc. | 198,000 | 17,117,100 |
| South Jersey Industries, Inc. | 428,000 | 12,390,600 |
| Southwest Gas Holdings, Inc. | 144,000 | 11,799,360 |
| Total | | 61,393,060 |
| Total Utilities | 85,959,024 |
Total Common Stocks
(Cost $1,066,892,003) | 1,367,298,448 |
|
The accompanying Notes to Financial Statements are an integral part of this statement.
Columbia Small Cap Value Fund II | Annual Report 2019
| 9 |
Portfolio of Investments (continued)
February 28, 2019
| Money Market Funds 1.1% |
| | Shares | Value ($) |
| Columbia Short-Term Cash Fund, 2.523%(b),(c) | 15,754,613 | 15,753,038 |
Total Money Market Funds
(Cost $15,753,038) | 15,753,038 |
Total Investments in Securities
(Cost: $1,082,645,041) | 1,383,051,486 |
| Other Assets & Liabilities, Net | | 5,299,439 |
| Net Assets | 1,388,350,925 |
Notes to Portfolio of Investments
| (a) | Non-income producing investment. |
| (b) | The rate shown is the seven-day current annualized yield at February 28, 2019. |
| (c) | As defined in the Investment Company Act of 1940, an affiliated company is one in which the Fund owns 5% or more of the company’s outstanding voting securities, or a company which is under common ownership or control with the Fund. Holdings and transactions in these affiliated companies during the year ended February 28, 2019 are as follows: |
| Issuer | Beginning
shares | Shares
purchased | Shares
sold | Ending
shares | Realized gain
(loss) —
affiliated
issuers ($) | Net change in
unrealized
appreciation
(depreciation) —
affiliated
issuers ($) | Dividends —
affiliated
issuers ($) | Value —
affiliated
issuers
at end of
period ($) |
| Columbia Short-Term Cash Fund, 2.523% |
| | 40,177,690 | 383,732,801 | (408,155,878) | 15,754,613 | 2,195 | — | 730,979 | 15,753,038 |
Abbreviation Legend
| ADR | American Depositary Receipt |
Fair value measurements
The Fund categorizes its fair value measurements according to a three-level hierarchy that maximizes the use of observable inputs and minimizes the use of unobservable inputs by prioritizing that the most observable input be used when available. Observable inputs are those that market participants would use in pricing an investment based on market data obtained from sources independent of the reporting entity. Unobservable inputs are those that reflect the Fund’s assumptions about the information market participants would use in pricing an investment. An investment’s level within the fair value hierarchy is based on the lowest level of any input that is deemed significant to the asset’s or liability’s fair value measurement. The input levels are not necessarily an indication of the risk or liquidity associated with investments at that level. For example, certain U.S. government securities are generally high quality and liquid, however, they are reflected as Level 2 because the inputs used to determine fair value may not always be quoted prices in an active market.
Fair value inputs are summarized in the three broad levels listed below:
| ■ | Level 1 — Valuations based on quoted prices for investments in active markets that the Fund has the ability to access at the measurement date. Valuation adjustments are not applied to Level 1 investments. |
| ■ | Level 2 — Valuations based on other significant observable inputs (including quoted prices for similar securities, interest rates, prepayment speeds, credit risks, etc.). |
| ■ | Level 3 — Valuations based on significant unobservable inputs (including the Fund’s own assumptions and judgment in determining the fair value of investments). |
Inputs that are used in determining fair value of an investment may include price information, credit data, volatility statistics, and other factors. These inputs can be either observable or unobservable. The availability of observable inputs can vary between investments, and is affected by various factors such as the type of investment, and the volume and level of activity for that investment or similar investments in the marketplace. The inputs will be considered by the Investment Manager, along with any other relevant factors in the calculation of an investment’s fair value. The Fund uses prices and inputs that are current as of the measurement date, which may include periods of market dislocations. During these periods, the availability of prices and inputs may be reduced for many investments. This condition could cause an investment to be reclassified between the various levels within the hierarchy.
Certain investments that have been measured at fair value using the net asset value (NAV) per share (or its equivalent) are not categorized in the fair value hierarchy. The fair value amounts presented in the table are intended to reconcile the fair value hierarchy to the amounts presented in the Portfolio of Investments. The Columbia Short-Term Cash Fund seeks to provide shareholders with maximum current income consistent with liquidity and stability of principal. Columbia Short-Term Cash Fund prices its shares with a floating NAV and no longer seeks to maintain a stable NAV.
Investments falling into the Level 3 category are primarily supported by quoted prices from brokers and dealers participating in the market for those investments. However, these may be classified as Level 3 investments due to lack of market transparency and corroboration to support these quoted prices. Additionally, valuation models may be used as the pricing source for any remaining investments classified as Level 3. These models may rely on one or more significant unobservable inputs and/or significant assumptions by the Investment Manager. Inputs used in valuations may include, but are not limited to, financial statement analysis, capital account balances, discount rates and estimated cash flows, and comparable company data.
The accompanying Notes to Financial Statements are an integral part of this statement.
| 10 | Columbia Small Cap Value Fund II | Annual Report 2019 |
Portfolio of Investments (continued)
February 28, 2019
Fair value measurements (continued)
Under the direction of the Fund’s Board of Trustees (the Board), the Investment Manager’s Valuation Committee (the Committee) is responsible for overseeing the valuation procedures approved by the Board. The Committee consists of voting and non-voting members from various groups within the Investment Manager’s organization, including operations and accounting, trading and investments, compliance, risk management and legal.
The Committee meets at least monthly to review and approve valuation matters, which may include a description of specific valuation determinations, data regarding pricing information received from approved pricing vendors and brokers and the results of Board-approved valuation control policies and procedures (the Policies). The Policies address, among other things, instances when market quotations are or are not readily available, including recommendations of third party pricing vendors and a determination of appropriate pricing methodologies; events that require specific valuation determinations and assessment of fair value techniques; securities with a potential for stale pricing, including those that are illiquid, restricted, or in default; and the effectiveness of third party pricing vendors, including periodic reviews of vendors. The Committee meets more frequently, as needed, to discuss additional valuation matters, which may include the need to review back-testing results, review time-sensitive information or approve related valuation actions. The Committee reports to the Board, with members of the Committee meeting with the Board at each of its regularly scheduled meetings to discuss valuation matters and actions during the period, similar to those described earlier.
For investments categorized as Level 3, the Committee monitors information similar to that described above, which may include: (i) data specific to the issuer or comparable issuers, (ii) general market or specific sector news and (iii) quoted prices and specific or similar security transactions. The Committee considers this data and any changes from prior periods in order to assess the reasonableness of observable and unobservable inputs, any assumptions or internal models used to value those securities and changes in fair value. This data is also used to corroborate, when available, information received from approved pricing vendors and brokers. Various factors impact the frequency of monitoring this information (which may occur as often as daily). However, the Committee may determine that changes to inputs, assumptions and models are not required as a result of the monitoring procedures performed.
The following table is a summary of the inputs used to value the Fund’s investments at February 28, 2019:
| | Level 1
quoted prices
in active
markets for
identical
assets ($) | Level 2
other
significant
observable
inputs ($) | Level 3
significant
unobservable
inputs ($) | Investments
measured at
net asset
value ($) | Total ($) |
| Investments in Securities | | | | | |
| Common Stocks | | | | | |
| Communication Services | 26,337,624 | — | — | — | 26,337,624 |
| Consumer Discretionary | 118,770,231 | — | — | — | 118,770,231 |
| Consumer Staples | 29,516,080 | — | — | — | 29,516,080 |
| Energy | 64,675,547 | — | — | — | 64,675,547 |
| Financials | 422,565,893 | — | — | — | 422,565,893 |
| Health Care | 56,818,118 | — | — | — | 56,818,118 |
| Industrials | 217,701,219 | — | — | — | 217,701,219 |
| Information Technology | 148,488,487 | — | — | — | 148,488,487 |
| Materials | 73,872,765 | — | — | — | 73,872,765 |
| Real Estate | 122,593,460 | — | — | — | 122,593,460 |
| Utilities | 85,959,024 | — | — | — | 85,959,024 |
| Total Common Stocks | 1,367,298,448 | — | — | — | 1,367,298,448 |
| Money Market Funds | — | — | — | 15,753,038 | 15,753,038 |
| Total Investments in Securities | 1,367,298,448 | — | — | 15,753,038 | 1,383,051,486 |
See the Portfolio of Investments for all investment classifications not indicated in the table.
There were no transfers of financial assets between levels during the period.
The accompanying Notes to Financial Statements are an integral part of this statement.
Columbia Small Cap Value Fund II | Annual Report 2019
| 11 |
Statement of Assets and Liabilities
February 28, 2019
| Assets | |
| Investments in securities, at value | |
| Unaffiliated issuers (cost $1,066,892,003) | $1,367,298,448 |
| Affiliated issuers (cost $15,753,038) | 15,753,038 |
| Receivable for: | |
| Investments sold | 7,990,665 |
| Capital shares sold | 812,144 |
| Dividends | 1,123,398 |
| Expense reimbursement due from Investment Manager | 2,879 |
| Prepaid expenses | 3,075 |
| Total assets | 1,392,983,647 |
| Liabilities | |
| Payable for: | |
| Investments purchased | 2,447,410 |
| Capital shares purchased | 1,613,402 |
| Management services fees | 31,414 |
| Distribution and/or service fees | 1,100 |
| Transfer agent fees | 326,825 |
| Compensation of board members | 130,167 |
| Compensation of chief compliance officer | 13 |
| Other expenses | 82,391 |
| Total liabilities | 4,632,722 |
| Net assets applicable to outstanding capital stock | $1,388,350,925 |
| Represented by | |
| Paid in capital | 1,067,202,127 |
| Total distributable earnings (loss) (Note 2) | 321,148,798 |
| Total - representing net assets applicable to outstanding capital stock | $1,388,350,925 |
The accompanying Notes to Financial Statements are an integral part of this statement.
| 12 | Columbia Small Cap Value Fund II | Annual Report 2019 |
Statement of Assets and Liabilities (continued)
February 28, 2019
| Class A | |
| Net assets | $144,154,726 |
| Shares outstanding | 9,540,906 |
| Net asset value per share | $15.11 |
| Maximum sales charge | 5.75% |
| Maximum offering price per share (calculated by dividing the net asset value per share by 1.0 minus the maximum sales charge for Class A shares) | $16.03 |
| Advisor Class | |
| Net assets | $85,977,503 |
| Shares outstanding | 5,458,984 |
| Net asset value per share | $15.75 |
| Class C | |
| Net assets | $611,479 |
| Shares outstanding | 47,199 |
| Net asset value per share | $12.96 |
| Institutional Class | |
| Net assets | $545,567,602 |
| Shares outstanding | 35,496,765 |
| Net asset value per share | $15.37 |
| Institutional 2 Class | |
| Net assets | $118,653,761 |
| Shares outstanding | 7,518,886 |
| Net asset value per share | $15.78 |
| Institutional 3 Class | |
| Net assets | $487,282,176 |
| Shares outstanding | 30,766,363 |
| Net asset value per share | $15.84 |
| Class R | |
| Net assets | $6,103,678 |
| Shares outstanding | 412,277 |
| Net asset value per share | $14.80 |
The accompanying Notes to Financial Statements are an integral part of this statement.
Columbia Small Cap Value Fund II | Annual Report 2019
| 13 |
Statement of Operations
Year Ended February 28, 2019
| Net investment income | |
| Income: | |
| Dividends — unaffiliated issuers | $20,801,473 |
| Dividends — affiliated issuers | 730,979 |
| Interfund lending | 1,463 |
| Foreign taxes withheld | (66,499) |
| Total income | 21,467,416 |
| Expenses: | |
| Management services fees | 12,202,766 |
| Distribution and/or service fees | |
| Class A | 396,554 |
| Class C | 34,673 |
| Class R | 39,406 |
| Transfer agent fees | |
| Class A | 404,387 |
| Advisor Class | 190,573 |
| Class C | 8,712 |
| Institutional Class | 1,661,190 |
| Institutional 2 Class | 56,608 |
| Institutional 3 Class | 38,592 |
| Class R | 20,034 |
| Compensation of board members | 27,037 |
| Custodian fees | 13,623 |
| Printing and postage fees | 114,489 |
| Registration fees | 110,387 |
| Audit fees | 34,051 |
| Legal fees | 19,731 |
| Compensation of chief compliance officer | 321 |
| Other | 30,991 |
| Total expenses | 15,404,125 |
| Fees waived or expenses reimbursed by Investment Manager and its affiliates | (830,884) |
| Expense reduction | (20) |
| Total net expenses | 14,573,221 |
| Net investment income | 6,894,195 |
| Realized and unrealized gain (loss) — net | |
| Net realized gain (loss) on: | |
| Investments — unaffiliated issuers | 158,221,386 |
| Investments — affiliated issuers | 2,195 |
| Net realized gain | 158,223,581 |
| Net change in unrealized appreciation (depreciation) on: | |
| Investments — unaffiliated issuers | (164,833,875) |
| Net change in unrealized appreciation (depreciation) | (164,833,875) |
| Net realized and unrealized loss | (6,610,294) |
| Net increase in net assets resulting from operations | $283,901 |
The accompanying Notes to Financial Statements are an integral part of this statement.
| 14 | Columbia Small Cap Value Fund II | Annual Report 2019 |
Statement of Changes in Net Assets
| | Year Ended
February 28, 2019 | Year Ended
February 28, 2018 |
| Operations | | |
| Net investment income | $6,894,195 | $4,900,229 |
| Net realized gain | 158,223,581 | 113,213,844 |
| Net change in unrealized appreciation (depreciation) | (164,833,875) | (43,359,872) |
| Net increase in net assets resulting from operations | 283,901 | 74,754,201 |
| Distributions to shareholders | | |
| Net investment income and net realized gains | | |
| Class A | (17,596,407) | |
| Advisor Class | (7,879,792) | |
| Class C | (300,544) | |
| Institutional Class | (70,660,938) | |
| Institutional 2 Class | (12,427,431) | |
| Institutional 3 Class | (56,205,124) | |
| Class R | (864,604) | |
| Net investment income | | |
| Class A | | (128,970) |
| Advisor Class | | (192,538) |
| Institutional Class | | (2,135,836) |
| Institutional 2 Class | | (323,201) |
| Institutional 3 Class | | (2,133,626) |
| Net realized gains | | |
| Class A | | (16,379,100) |
| Advisor Class | | (6,410,439) |
| Class B | | (1,218) |
| Class C | | (950,843) |
| Institutional Class | | (83,490,570) |
| Institutional 2 Class | | (7,065,045) |
| Institutional 3 Class | | (30,156,471) |
| Class R | | (915,250) |
| Total distributions to shareholders (Note 2) | (165,934,840) | (150,283,107) |
| Increase (decrease) in net assets from capital stock activity | 16,604,536 | (62,620,415) |
| Total decrease in net assets | (149,046,403) | (138,149,321) |
| Net assets at beginning of year | 1,537,397,328 | 1,675,546,649 |
| Net assets at end of year | $1,388,350,925 | $1,537,397,328 |
| Undistributed (excess of distributions over) net investment income | $1,914,359 | $(133,399) |
The accompanying Notes to Financial Statements are an integral part of this statement.
Columbia Small Cap Value Fund II | Annual Report 2019
| 15 |
Statement of Changes in Net Assets (continued)
| | Year Ended | Year Ended |
| | February 28, 2019 | February 28, 2018 |
| | Shares | Dollars ($) | Shares | Dollars ($) |
| Capital stock activity |
| Class A | | | | |
| Subscriptions | 1,331,515 | 22,116,175 | 1,247,368 | 21,955,202 |
| Distributions reinvested | 1,103,156 | 16,608,769 | 908,851 | 15,547,929 |
| Redemptions | (2,559,206) | (42,125,435) | (3,688,487) | (64,905,086) |
| Net decrease | (124,535) | (3,400,491) | (1,532,268) | (27,401,955) |
| Advisor Class | | | | |
| Subscriptions | 2,606,896 | 39,029,354 | 1,717,559 | 31,641,432 |
| Distributions reinvested | 433,584 | 6,788,417 | 333,038 | 5,904,864 |
| Redemptions | (1,604,189) | (25,365,268) | (1,773,703) | (32,498,605) |
| Net increase | 1,436,291 | 20,452,503 | 276,894 | 5,047,691 |
| Class B | | | | |
| Subscriptions | — | — | 2 | 33 |
| Distributions reinvested | — | — | 70 | 1,047 |
| Redemptions | — | — | (8,222) | (126,904) |
| Net decrease | — | — | (8,150) | (125,824) |
| Class C | | | | |
| Subscriptions | 3,709 | 57,670 | 8,892 | 135,966 |
| Distributions reinvested | 20,220 | 294,553 | 58,125 | 879,696 |
| Redemptions | (493,683) | (7,628,683) | (289,354) | (4,497,433) |
| Net decrease | (469,754) | (7,276,460) | (222,337) | (3,481,771) |
| Class I | | | | |
| Redemptions | — | — | (140) | (2,496) |
| Net decrease | — | — | (140) | (2,496) |
| Institutional Class | | | | |
| Subscriptions | 8,443,028 | 144,567,967 | 6,637,598 | 118,044,629 |
| Distributions reinvested | 3,881,352 | 59,496,740 | 4,014,418 | 69,549,765 |
| Redemptions | (18,696,763) | (316,199,177) | (29,009,817) | (510,530,441) |
| Net decrease | (6,372,383) | (112,134,470) | (18,357,801) | (322,936,047) |
| Institutional 2 Class | | | | |
| Subscriptions | 4,194,743 | 73,022,362 | 1,234,664 | 22,803,797 |
| Distributions reinvested | 805,098 | 12,427,168 | 415,268 | 7,388,018 |
| Redemptions | (1,894,410) | (33,103,868) | (1,440,500) | (26,313,509) |
| Net increase | 3,105,431 | 52,345,662 | 209,432 | 3,878,306 |
| Institutional 3 Class | | | | |
| Subscriptions | 8,040,754 | 141,437,234 | 18,521,036 | 333,113,901 |
| Distributions reinvested | 3,004,316 | 47,178,276 | 1,660,149 | 29,823,708 |
| Redemptions | (7,105,243) | (120,780,201) | (4,263,024) | (78,295,580) |
| Net increase | 3,939,827 | 67,835,309 | 15,918,161 | 284,642,029 |
| Class R | | | | |
| Subscriptions | 132,413 | 2,218,597 | 74,665 | 1,290,351 |
| Distributions reinvested | 56,605 | 838,813 | 52,987 | 891,818 |
| Redemptions | (269,677) | (4,274,927) | (256,259) | (4,422,517) |
| Net decrease | (80,659) | (1,217,517) | (128,607) | (2,240,348) |
| Total net increase (decrease) | 1,434,218 | 16,604,536 | (3,844,816) | (62,620,415) |
The accompanying Notes to Financial Statements are an integral part of this statement.
| 16 | Columbia Small Cap Value Fund II | Annual Report 2019 |
[THIS PAGE INTENTIONALLY LEFT BLANK]
Columbia Small Cap Value Fund II | Annual Report 2019
| 17 |
The following table is intended to help you understand the Fund’s financial performance. Certain information reflects financial results for a single share of a class held for the periods shown. Per share net investment income (loss) amounts are calculated based on average shares outstanding during the period. Total return assumes reinvestment of all dividends and distributions, if any. Total return does not reflect payment of sales charges, if any. Total return and portfolio turnover are not annualized for periods of less than one year. The portfolio turnover rate is calculated without regard to purchase and sales transactions of short-term instruments and certain derivatives, if any. If such transactions were included, the Fund’s portfolio turnover rate may be higher.
| | Net asset value,
beginning of
period | Net
investment
income
(loss) | Net
realized
and
unrealized
gain (loss) | Total from
investment
operations | Distributions
from net
investment
income | Distributions
from net
realized
gains | Total
distributions to
shareholders |
| Class A |
| Year Ended 2/28/2019 | $17.11 | 0.03 | (0.10) | (0.07) | (0.01) | (1.92) | (1.93) |
| Year Ended 2/28/2018 | $18.01 | 0.01 | 0.75 | 0.76 | (0.01) | (1.65) | (1.66) |
| Year Ended 2/28/2017 | $14.07 | 0.01 | 4.85 | 4.86 | (0.03) | (0.89) | (0.92) |
| Year Ended 2/29/2016 | $17.60 | 0.02 | (1.65) | (1.63) | — | (1.90) | (1.90) |
| Year Ended 2/28/2015 | $18.61 | 0.02 | 0.71 | 0.73 | (0.04) | (1.70) | (1.74) |
| Advisor Class |
| Year Ended 2/28/2019 | $17.75 | 0.07 | (0.11) | (0.04) | (0.04) | (1.92) | (1.96) |
| Year Ended 2/28/2018 | $18.61 | 0.05 | 0.79 | 0.84 | (0.05) | (1.65) | (1.70) |
| Year Ended 2/28/2017 | $14.52 | 0.05 | 5.00 | 5.05 | (0.07) | (0.89) | (0.96) |
| Year Ended 2/29/2016 | $18.08 | 0.07 | (1.70) | (1.63) | (0.03) | (1.90) | (1.93) |
| Year Ended 2/28/2015 | $19.06 | 0.05 | 0.75 | 0.80 | (0.08) | (1.70) | (1.78) |
| Class C |
| Year Ended 2/28/2019 | $15.06 | (0.11) | (0.07) | (0.18) | — | (1.92) | (1.92) |
| Year Ended 2/28/2018 | $16.13 | (0.11) | 0.68 | 0.57 | — | (1.64) | (1.64) |
| Year Ended 2/28/2017 | $12.75 | (0.10) | 4.37 | 4.27 | (0.00)(d) | (0.89) | (0.89) |
| Year Ended 2/29/2016 | $16.25 | (0.09) | (1.51) | (1.60) | — | (1.90) | (1.90) |
| Year Ended 2/28/2015 | $17.40 | (0.11) | 0.66 | 0.55 | — | (1.70) | (1.70) |
| Institutional Class |
| Year Ended 2/28/2019 | $17.37 | 0.07 | (0.11) | (0.04) | (0.04) | (1.92) | (1.96) |
| Year Ended 2/28/2018 | $18.25 | 0.05 | 0.77 | 0.82 | (0.05) | (1.65) | (1.70) |
| Year Ended 2/28/2017 | $14.25 | 0.05 | 4.91 | 4.96 | (0.07) | (0.89) | (0.96) |
| Year Ended 2/29/2016 | $17.78 | 0.07 | (1.67) | (1.60) | (0.03) | (1.90) | (1.93) |
| Year Ended 2/28/2015 | $18.77 | 0.06 | 0.72 | 0.78 | (0.07) | (1.70) | (1.77) |
| Institutional 2 Class |
| Year Ended 2/28/2019 | $17.78 | 0.10 | (0.11) | (0.01) | (0.07) | (1.92) | (1.99) |
| Year Ended 2/28/2018 | $18.63 | 0.08 | 0.79 | 0.87 | (0.07) | (1.65) | (1.72) |
| Year Ended 2/28/2017 | $14.53 | 0.07 | 5.01 | 5.08 | (0.09) | (0.89) | (0.98) |
| Year Ended 2/29/2016 | $18.09 | 0.10 | (1.71) | (1.61) | (0.05) | (1.90) | (1.95) |
| Year Ended 2/28/2015 | $19.07 | 0.09 | 0.73 | 0.82 | (0.10) | (1.70) | (1.80) |
The accompanying Notes to Financial Statements are an integral part of this statement.
| 18 | Columbia Small Cap Value Fund II | Annual Report 2019 |
Financial Highlights (continued)
| | Net
asset
value,
end of
period | Total
return | Total gross
expense
ratio to
average
net assets(a) | Total net
expense
ratio to
average
net assets(a),(b) | Net investment
income (loss)
ratio to
average
net assets | Portfolio
turnover | Net
assets,
end of
period
(000’s) |
| Class A |
| Year Ended 2/28/2019 | $15.11 | (0.15%) | 1.35% | 1.27%(c) | 0.17% | 38% | $144,155 |
| Year Ended 2/28/2018 | $17.11 | 4.45% | 1.33% | 1.29%(c) | 0.04% | 45% | $165,419 |
| Year Ended 2/28/2017 | $18.01 | 34.98% | 1.30% | 1.30%(c) | 0.06% | 58% | $201,649 |
| Year Ended 2/29/2016 | $14.07 | (10.48%) | 1.30% | 1.30%(c) | 0.15% | 57% | $197,263 |
| Year Ended 2/28/2015 | $17.60 | 4.10% | 1.30% | 1.30%(c) | 0.11% | 38% | $263,946 |
| Advisor Class |
| Year Ended 2/28/2019 | $15.75 | 0.09% | 1.10% | 1.02%(c) | 0.42% | 38% | $85,978 |
| Year Ended 2/28/2018 | $17.75 | 4.73% | 1.08% | 1.04%(c) | 0.30% | 45% | $71,415 |
| Year Ended 2/28/2017 | $18.61 | 35.21% | 1.05% | 1.05%(c) | 0.28% | 58% | $69,709 |
| Year Ended 2/29/2016 | $14.52 | (10.22%) | 1.05% | 1.05%(c) | 0.41% | 57% | $26,487 |
| Year Ended 2/28/2015 | $18.08 | 4.39% | 1.05% | 1.05%(c) | 0.28% | 38% | $30,000 |
| Class C |
| Year Ended 2/28/2019 | $12.96 | (0.93%) | 2.09% | 2.02%(c) | (0.71%) | 38% | $611 |
| Year Ended 2/28/2018 | $15.06 | 3.72% | 2.07% | 2.04%(c) | (0.72%) | 45% | $7,785 |
| Year Ended 2/28/2017 | $16.13 | 33.93% | 2.04% | 2.04%(c) | (0.70%) | 58% | $11,926 |
| Year Ended 2/29/2016 | $12.75 | (11.18%) | 2.05% | 2.05%(c) | (0.60%) | 57% | $11,325 |
| Year Ended 2/28/2015 | $16.25 | 3.34% | 2.05% | 2.05%(c) | (0.64%) | 38% | $14,949 |
| Institutional Class |
| Year Ended 2/28/2019 | $15.37 | 0.09% | 1.10% | 1.02%(c) | 0.42% | 38% | $545,568 |
| Year Ended 2/28/2018 | $17.37 | 4.71% | 1.07% | 1.04%(c) | 0.28% | 45% | $727,418 |
| Year Ended 2/28/2017 | $18.25 | 35.26% | 1.05% | 1.05%(c) | 0.31% | 58% | $1,098,979 |
| Year Ended 2/29/2016 | $14.25 | (10.22%) | 1.05% | 1.05%(c) | 0.40% | 57% | $1,007,843 |
| Year Ended 2/28/2015 | $17.78 | 4.39% | 1.05% | 1.05%(c) | 0.36% | 38% | $1,273,117 |
| Institutional 2 Class |
| Year Ended 2/28/2019 | $15.78 | 0.22% | 0.91% | 0.88% | 0.60% | 38% | $118,654 |
| Year Ended 2/28/2018 | $17.78 | 4.90% | 0.90% | 0.89% | 0.44% | 45% | $78,479 |
| Year Ended 2/28/2017 | $18.63 | 35.42% | 0.90% | 0.90% | 0.39% | 58% | $78,330 |
| Year Ended 2/29/2016 | $14.53 | (10.10%) | 0.89% | 0.89% | 0.59% | 57% | $19,298 |
| Year Ended 2/28/2015 | $18.09 | 4.51% | 0.89% | 0.89% | 0.49% | 38% | $14,349 |
The accompanying Notes to Financial Statements are an integral part of this statement.
Columbia Small Cap Value Fund II | Annual Report 2019
| 19 |
Financial Highlights (continued)
| | Net asset value,
beginning of
period | Net
investment
income
(loss) | Net
realized
and
unrealized
gain (loss) | Total from
investment
operations | Distributions
from net
investment
income | Distributions
from net
realized
gains | Total
distributions to
shareholders |
| Institutional 3 Class |
| Year Ended 2/28/2019 | $17.84 | 0.11 | (0.12) | (0.01) | (0.07) | (1.92) | (1.99) |
| Year Ended 2/28/2018 | $18.68 | 0.09 | 0.80 | 0.89 | (0.08) | (1.65) | (1.73) |
| Year Ended 2/28/2017 | $14.56 | 0.08 | 5.03 | 5.11 | (0.10) | (0.89) | (0.99) |
| Year Ended 2/29/2016 | $18.12 | 0.11 | (1.71) | (1.60) | (0.06) | (1.90) | (1.96) |
| Year Ended 2/28/2015 | $19.10 | 0.10 | 0.72 | 0.82 | (0.10) | (1.70) | (1.80) |
| Class R |
| Year Ended 2/28/2019 | $16.84 | (0.01) | (0.11) | (0.12) | — | (1.92) | (1.92) |
| Year Ended 2/28/2018 | $17.77 | (0.04) | 0.75 | 0.71 | — | (1.64) | (1.64) |
| Year Ended 2/28/2017 | $13.91 | (0.03) | 4.79 | 4.76 | (0.01) | (0.89) | (0.90) |
| Year Ended 2/29/2016 | $17.47 | (0.02) | (1.64) | (1.66) | — | (1.90) | (1.90) |
| Year Ended 2/28/2015 | $18.49 | (0.02) | 0.70 | 0.68 | — | (1.70) | (1.70) |
| Notes to Financial Highlights |
| (a) | In addition to the fees and expenses that the Fund bears directly, the Fund indirectly bears a pro rata share of the fees and expenses of any other funds in which it invests. Such indirect expenses are not included in the Fund’s reported expense ratios. |
| (b) | Total net expenses include the impact of certain fee waivers/expense reimbursements made by the Investment Manager and certain of its affiliates, if applicable. |
| (c) | The benefits derived from expense reductions had an impact of less than 0.01%. |
| (d) | Rounds to zero. |
The accompanying Notes to Financial Statements are an integral part of this statement.
| 20 | Columbia Small Cap Value Fund II | Annual Report 2019 |
Financial Highlights (continued)
| | Net
asset
value,
end of
period | Total
return | Total gross
expense
ratio to
average
net assets(a) | Total net
expense
ratio to
average
net assets(a),(b) | Net investment
income (loss)
ratio to
average
net assets | Portfolio
turnover | Net
assets,
end of
period
(000’s) |
| Institutional 3 Class |
| Year Ended 2/28/2019 | $15.84 | 0.27% | 0.85% | 0.83% | 0.62% | 38% | $487,282 |
| Year Ended 2/28/2018 | $17.84 | 4.98% | 0.86% | 0.84% | 0.52% | 45% | $478,580 |
| Year Ended 2/28/2017 | $18.68 | 35.55% | 0.84% | 0.84% | 0.50% | 58% | $203,778 |
| Year Ended 2/29/2016 | $14.56 | (10.05%) | 0.84% | 0.84% | 0.62% | 57% | $133,139 |
| Year Ended 2/28/2015 | $18.12 | 4.53% | 0.85% | 0.85% | 0.56% | 38% | $112,949 |
| Class R |
| Year Ended 2/28/2019 | $14.80 | (0.46%) | 1.60% | 1.52%(c) | (0.08%) | 38% | $6,104 |
| Year Ended 2/28/2018 | $16.84 | 4.19% | 1.58% | 1.54%(c) | (0.21%) | 45% | $8,302 |
| Year Ended 2/28/2017 | $17.77 | 34.67% | 1.55% | 1.55%(c) | (0.19%) | 58% | $11,042 |
| Year Ended 2/29/2016 | $13.91 | (10.73%) | 1.55% | 1.55%(c) | (0.10%) | 57% | $10,109 |
| Year Ended 2/28/2015 | $17.47 | 3.86% | 1.55% | 1.55%(c) | (0.14%) | 38% | $14,594 |
The accompanying Notes to Financial Statements are an integral part of this statement.
Columbia Small Cap Value Fund II | Annual Report 2019
| 21 |
Notes to Financial Statements
February 28, 2019
Note 1. Organization
Columbia Small Cap Value Fund II (the Fund), a series of Columbia Funds Series Trust (the Trust), is a diversified fund. The Trust is registered under the Investment Company Act of 1940, as amended (the 1940 Act), as an open-end management investment company organized as a Delaware statutory trust.
Fund shares
The Trust may issue an unlimited number of shares (without par value). Although all share classes generally have identical voting, dividend and liquidation rights, each share class votes separately when required by the Trust’s organizational documents or by law. Different share classes pay different distribution amounts to the extent the expenses of such share classes differ, and distributions in liquidation will be proportional to the net asset value of each share class. Each share class has its own expense and sales charge structure. The Fund offers each of the share classes identified below.
Class A shares are subject to a maximum front-end sales charge of 5.75% based on the initial investment amount. Class A shares purchased without an initial sales charge in accounts aggregating $1 million to $50 million at the time of purchase are subject to a contingent deferred sales charge (CDSC) if the shares are sold within 18 months after purchase, charged as follows: 1.00% CDSC if redeemed within 12 months after purchase, and 0.50% CDSC if redeemed more than 12, but less than 18, months after purchase.
Advisor Class shares are not subject to sales charges and are generally available only to omnibus retirement plans and certain investors as described in the Fund’s prospectus.
Class C shares are subject to a 1.00% CDSC on shares redeemed within 12 months after purchase. Effective July 1, 2018, Class C shares automatically convert to Class A shares of the same Fund in the month of or the month following the 10-year anniversary of the Class C shares purchase date.
Institutional Class shares are not subject to sales charges and are generally available only to eligible investors, which are subject to different investment minimums as described in the Fund’s prospectus.
Institutional 2 Class shares are not subject to sales charges and are generally available only to investors purchasing through authorized investment professionals and omnibus retirement plans as described in the Fund’s prospectus.
Institutional 3 Class shares are not subject to sales charges and are available to institutional and certain other investors as described in the Fund’s prospectus.
Class R shares are not subject to sales charges and are generally available only to certain retirement plans and other investors as described in the Fund’s prospectus.
Note 2. Summary of significant accounting policies
Basis of preparation
The Fund is an investment company that applies the accounting and reporting guidance in the Financial Accounting Standards Board (FASB) Accounting Standards Codification Topic 946,Financial Services - Investment Companies (ASC 946). The financial statements are prepared in accordance with U.S. generally accepted accounting principles (GAAP), which requires management to make certain estimates and assumptions that affect the reported amounts of assets and liabilities, the disclosure of contingent assets and liabilities at the date of the financial statements and the reported amounts of income and expenses during the reporting period. Actual results could differ from those estimates.
The following is a summary of significant accounting policies followed by the Fund in the preparation of its financial statements.
| 22 | Columbia Small Cap Value Fund II | Annual Report 2019 |
Notes to Financial Statements (continued)
February 28, 2019
Security valuation
All equity securities are valued at the close of business of the New York Stock Exchange. Equity securities are valued at the last quoted sales price on the principal exchange or market on which they trade, except for securities traded on the NASDAQ Stock Market, which are valued at the NASDAQ official close price. Unlisted securities or listed securities for which there were no sales during the day are valued at the mean of the latest quoted bid and ask prices on such exchanges or markets.
Foreign equity securities are valued based on the closing price on the foreign exchange in which such securities are primarily traded. If any foreign equity security closing prices are not readily available, the securities are valued at the mean of the latest quoted bid and ask prices on such exchanges or markets. Foreign currency exchange rates are generally determined at 4:00 p.m. Eastern (U.S.) time. Many securities markets and exchanges outside the U.S. close prior to the close of the New York Stock Exchange; therefore, the closing prices for securities in such markets or on such exchanges may not fully reflect events that occur after such close but before the close of the New York Stock Exchange. In those situations, foreign securities will be fair valued pursuant to a policy adopted by the Board of Trustees, including, if available, utilizing a third party pricing service to determine these fair values. The third party pricing service takes into account multiple factors, including, but not limited to, movements in the U.S. securities markets, certain depositary receipts, futures contracts and foreign exchange rates that have occurred subsequent to the close of the foreign exchange or market, to determine a good faith estimate that reasonably reflects the current market conditions as of the close of the New York Stock Exchange. The fair value of a security is likely to be different from the quoted or published price, if available.
Investments in open-end investment companies, including money market funds, are valued at their latest net asset value.
Investments for which market quotations are not readily available, or that have quotations which management believes are not reflective of market value or reliable, are valued at fair value as determined in good faith under procedures approved by and under the general supervision of the Board of Trustees. If a security or class of securities (such as foreign securities) is valued at fair value, such value is likely to be different from the quoted or published price for the security.
The determination of fair value often requires significant judgment. To determine fair value, management may use assumptions including but not limited to future cash flows and estimated risk premiums. Multiple inputs from various sources may be used to determine fair value.
GAAP requires disclosure regarding the inputs and valuation techniques used to measure fair value and any changes in valuation inputs or techniques. In addition, investments shall be disclosed by major category. This information is disclosed following the Fund’s Portfolio of Investments.
Security transactions
Security transactions are accounted for on the trade date. Cost is determined and gains (losses) are based upon the specific identification method for both financial statement and federal income tax purposes.
Income recognition
Corporate actions and dividend income are generally recorded net of any non-reclaimable tax withholdings, on the ex-dividend date or upon receipt of ex-dividend notification in the case of certain foreign securities.
The Fund may receive distributions from holdings in equity securities, business development companies (BDCs), exchange-traded funds (ETFs), limited partnerships (LPs), other regulated investment companies (RICs), and real estate investment trusts (REITs), which report information on the tax character of their distributions annually. These distributions are allocated to dividend income, capital gain and return of capital based on actual information reported. Return of capital is recorded as a reduction of the cost basis of securities held. If the Fund no longer owns the applicable securities, return of capital is recorded as a realized gain. With respect to REITs, to the extent actual information has not yet been reported, estimates for return of capital are made by the Fund’s management. Management’s estimates are subsequently adjusted when the actual character of the distributions is disclosed by the REITs, which could result in a proportionate change in return of capital to shareholders.
Awards from class action litigation are recorded as a reduction of cost basis if the Fund still owns the applicable securities on the payment date. If the Fund no longer owns the applicable securities, the proceeds are recorded as realized gains.
Columbia Small Cap Value Fund II | Annual Report 2019
| 23 |
Notes to Financial Statements (continued)
February 28, 2019
Expenses
General expenses of the Trust are allocated to the Fund and other funds of the Trust based upon relative net assets or other expense allocation methodologies determined by the nature of the expense. Expenses directly attributable to the Fund are charged to the Fund. Expenses directly attributable to a specific class of shares are charged to that share class.
Determination of class net asset value
All income, expenses (other than class-specific expenses, which are charged to that share class, as shown in the Statement of Operations) and realized and unrealized gains (losses) are allocated to each class of the Fund on a daily basis, based on the relative net assets of each class, for purposes of determining the net asset value of each class.
Federal income tax status
The Fund intends to qualify each year as a regulated investment company under Subchapter M of the Internal Revenue Code, as amended, and will distribute substantially all of its investment company taxable income and net capital gain, if any, for its tax year, and as such will not be subject to federal income taxes. In addition, the Fund intends to distribute in each calendar year substantially all of its ordinary income, capital gain net income and certain other amounts, if any, such that the Fund should not be subject to federal excise tax. Therefore, no federal income or excise tax provision is recorded.
Foreign taxes
The Fund may be subject to foreign taxes on income, gains on investments or currency repatriation, a portion of which may be recoverable. The Fund will accrue such taxes and recoveries, as applicable, based upon its current interpretation of tax rules and regulations that exist in the markets in which it invests.
Realized gains in certain countries may be subject to foreign taxes at the Fund level, based on statutory rates. The Fund accrues for such foreign taxes on realized and unrealized gains at the appropriate rate for each jurisdiction, as applicable. The amount, if any, is disclosed as a liability on the Statement of Assets and Liabilities.
Distributions to shareholders
Distributions from net investment income, if any, are declared and paid semi-annually. Net realized capital gains, if any, are distributed at least annually. Income distributions and capital gain distributions are determined in accordance with federal income tax regulations, which may differ from GAAP.
Guarantees and indemnifications
Under the Trust’s organizational documents and, in some cases, by contract, its officers and trustees are indemnified against certain liabilities arising out of the performance of their duties to the Trust or its funds. In addition, certain of the Fund’s contracts with its service providers contain general indemnification clauses. The Fund’s maximum exposure under these arrangements is unknown since the amount of any future claims that may be made against the Fund cannot be determined, and the Fund has no historical basis for predicting the likelihood of any such claims.
Recent accounting pronouncements
Accounting Standards Update 2017-08 Premium Amortization on Purchased Callable Debt Securities
In March 2017, the Financial Accounting Standards Board issued Accounting Standards Update (ASU) No. 2017-08 Premium Amortization on Purchased Callable Debt Securities. ASU No. 2017-08 updates the accounting standards to shorten the amortization period for certain purchased callable debt securities, held at a premium, to be amortized to the earliest call date. The update applies to securities with explicit, noncontingent call features that are callable at fixed prices and on preset dates. The standard is effective for annual periods beginning after December 15, 2018 and interim periods within those fiscal years. Management does not expect the implementation of this guidance to have a material impact on the financial statement amounts and footnote disclosures.
Accounting Standards Update 2018-13 Disclosure Framework - Changes to the Disclosure Requirements for Fair Value Measurement
| 24 | Columbia Small Cap Value Fund II | Annual Report 2019 |
Notes to Financial Statements (continued)
February 28, 2019
In August 2018, the Financial Accounting Standards Board issued Accounting Standards Update (ASU) No. 2018-13 Disclosure Framework - Changes to the Disclosure Requirements for Fair Value Measurement. ASU No. 2018-13, in addition to other modifications and additions, removes the requirement to disclose the amount and reasons for transfers between Level 1 and Level 2 of the fair value hierarchy and the policy for the timing of transfers between levels. The standard is effective for annual periods beginning after December 15, 2019 and interim periods within those fiscal years. At this time, management is evaluating the implication of this guidance and the impact it will have on the financial statement disclosures, if any.
Disclosure Update and Simplification
In September 2018, the Securities and Exchange Commission (SEC) released Final Rule 33-10532, Disclosure Update and Simplification, which amends certain financial statement disclosure requirements that the SEC determined to be redundant, outdated, or superseded in light of other SEC disclosure requirements, GAAP, or changes in the information environment. As a result of the amendments, management implemented disclosure changes which included removing the components of distributable earnings presented on the Statement of Assets and Liabilities and combining income and gain distributions paid to shareholders as presented on the Statement of Changes in Net Assets. Any values presented to meet prior year requirements were left unchanged. The amendments had no effect on the Fund’s net assets or results of operation.
Note 3. Fees and other transactions with affiliates
Management services fees
The Fund has entered into a Management Agreement with Columbia Management Investment Advisers, LLC (the Investment Manager), a wholly-owned subsidiary of Ameriprise Financial, Inc. (Ameriprise Financial). Under the Management Agreement, the Investment Manager provides the Fund with investment research and advice, as well as administrative and accounting services. The management services fee is an annual fee that is equal to a percentage of the Fund’s daily net assets that declines from 0.87% to 0.75% as the Fund’s net assets increase. The effective management services fee rate for the year ended February 28, 2019 was 0.82% of the Fund’s average daily net assets.
Compensation of board members
Members of the Board of Trustees who are not officers or employees of the Investment Manager or Ameriprise Financial are compensated for their services to the Fund as disclosed in the Statement of Operations. Under a Deferred Compensation Plan (the Deferred Plan), these members of the Board of Trustees may elect to defer payment of up to 100% of their compensation. Deferred amounts are treated as though equivalent dollar amounts had been invested in shares of certain funds managed by the Investment Manager. The Fund’s liability for these amounts is adjusted for market value changes and remains in the Fund until distributed in accordance with the Deferred Plan. All amounts payable under the Deferred Plan constitute a general unsecured obligation of the Fund.
Compensation of Chief Compliance Officer
The Board of Trustees has appointed a Chief Compliance Officer to the Fund in accordance with federal securities regulations. As disclosed in the Statement of Operations, a portion of the Chief Compliance Officer’s total compensation is allocated to the Fund, along with other allocations to affiliated registered investment companies managed by the Investment Manager and its affiliates, based on relative net assets.
Transfer agency fees
Under a Transfer and Dividend Disbursing Agent Agreement, Columbia Management Investment Services Corp. (the Transfer Agent), an affiliate of the Investment Manager and a wholly-owned subsidiary of Ameriprise Financial, is responsible for providing transfer agency services to the Fund. The Transfer Agent has contracted with DST Asset Manager Solutions, Inc. (DST) to serve as sub-transfer agent. The Transfer Agent pays the fees of DST for services as sub-transfer agent and DST is not entitled to reimbursement for such fees from the Fund (with the exception of out-of-pocket fees).
Columbia Small Cap Value Fund II | Annual Report 2019
| 25 |
Notes to Financial Statements (continued)
February 28, 2019
The Fund pays the Transfer Agent a monthly transfer agency fee based on the number or the average value of accounts, depending on the type of account. In addition, the Fund pays the Transfer Agent a fee for shareholder services based on the number of accounts or on a percentage of the average aggregate value of the Fund’s shares maintained in omnibus accounts up to the lesser of the amount charged by the financial intermediary or a cap established by the Board of Trustees from time to time.
The Transfer Agent also receives compensation from the Fund for various shareholder services and reimbursements for certain out-of-pocket fees. Total transfer agency fees for Institutional 2 Class and Institutional 3 Class shares are subject to an annual limitation of not more than 0.07% and 0.02%, respectively, of the average daily net assets attributable to each share class.
For the year ended February 28, 2019, the Fund’s effective transfer agency fee rates as a percentage of average daily net assets of each class were as follows:
| | Effective rate (%) |
| Class A | 0.25 |
| Advisor Class | 0.26 |
| Class C | 0.25 |
| Institutional Class | 0.25 |
| Institutional 2 Class | 0.06 |
| Institutional 3 Class | 0.01 |
| Class R | 0.25 |
An annual minimum account balance fee of $20 may apply to certain accounts with a value below the applicable share class’s initial minimum investment requirements to reduce the impact of small accounts on transfer agency fees. These minimum account balance fees are remitted to the Fund and recorded as part of expense reductions in the Statement of Operations. For the year ended February 28, 2019, these minimum account balance fees reduced total expenses of the Fund by $20.
Distribution and service fees
The Fund has entered into an agreement with Columbia Management Investment Distributors, Inc. (the Distributor), an affiliate of the Investment Manager and a wholly-owned subsidiary of Ameriprise Financial, for distribution and shareholder services. The Board of Trustees has approved, and the Fund has adopted, distribution and shareholder service plans (the Plans) applicable to certain share classes, which set the distribution and service fees for the Fund. These fees are calculated daily and are intended to compensate the Distributor and/or eligible selling and/or servicing agents for selling shares of the Fund and providing services to investors.
Under the Plans, the Fund pays a monthly combined distribution and service fee to the Distributor at the maximum annual rate of 0.25% of the average daily net assets attributable to Class A shares of the Fund. Also under the Plans, the Fund pays a monthly service fee to the Distributor at the maximum annual rate of 0.25% of the average daily net assets attributable to Class C shares of the Fund and a monthly distribution fee to the Distributor at the maximum annual rates of 0.75% and 0.50% of the average daily net assets attributable to Class C and Class R shares of the Fund, respectively.
Sales charges (unaudited)
Sales charges, including front-end charges and CDSCs, received by the Distributor for distributing Fund shares for the year ended February 28, 2019, if any, are listed below:
| 26 | Columbia Small Cap Value Fund II | Annual Report 2019 |
Notes to Financial Statements (continued)
February 28, 2019
Expenses waived/reimbursed by the Investment Manager and its affiliates
The Investment Manager and certain of its affiliates have contractually agreed to waive fees and/or reimburse expenses (excluding certain fees and expenses described below) for the period(s) disclosed below, unless sooner terminated at the sole discretion of the Board of Trustees, so that the Fund’s net operating expenses, after giving effect to fees waived/expenses reimbursed and any balance credits and/or overdraft charges from the Fund’s custodian, do not exceed the following annual rate(s) as a percentage of the class’ average daily net assets:
| | July 1, 2018
through
June 30, 2019 | Prior to
July 1, 2018 |
| Class A | 1.27% | 1.27% |
| Advisor Class | 1.02 | 1.02 |
| Class C | 2.02 | 2.02 |
| Institutional Class | 1.02 | 1.02 |
| Institutional 2 Class | 0.88 | 0.905 |
| Institutional 3 Class | 0.83 | 0.855 |
| Class R | 1.52 | 1.52 |
Under the agreement governing these fee waivers and/or expense reimbursement arrangements, the following fees and expenses are excluded from the waiver/reimbursement commitment, and therefore will be paid by the Fund, if applicable: taxes (including foreign transaction taxes), expenses associated with investments in affiliated and non-affiliated pooled investment vehicles (including mutual funds and exchange-traded funds), transaction costs and brokerage commissions, costs related to any securities lending program, dividend expenses associated with securities sold short, inverse floater program fees and expenses, transaction charges and interest on borrowed money, interest, infrequent and/or unusual expenses and any other expenses the exclusion of which is specifically approved by the Board of Trustees. This agreement may be modified or amended only with approval from the Investment Manager, certain of its affiliates and the Fund. Any fees waived and/or expenses reimbursed under the expense reimbursement arrangements described above are not recoverable by the Investment Manager or its affiliates in future periods.
Note 4. Federal tax information
The timing and character of income and capital gain distributions are determined in accordance with income tax regulations, which may differ from GAAP because of temporary or permanent book to tax differences.
At February 28, 2019, these differences were primarily due to differing treatment for deferral/reversal of wash sale losses, post-October capital losses, trustees’ deferred compensation and earnings and profits distributed to shareholders on the redemption of shares. To the extent these differences were permanent, reclassifications were made among the components of the Fund’s net assets. Temporary differences do not require reclassifications.
The following reclassifications were made:
Undistributed net
investment
income ($) | Accumulated
net realized
gain ($) | Paid in
capital ($) |
| (340,025) | (15,500,805) | 15,840,830 |
Net investment income (loss) and net realized gains (losses), as disclosed in the Statement of Operations, and net assets were not affected by this reclassification.
The tax character of distributions paid during the years indicated was as follows:
| Year Ended February 28, 2019 | Year Ended February 28, 2018 |
Ordinary
income ($) | Long-term
capital gains ($) | Total ($) | Ordinary
income ($) | Long-term
capital gains ($) | Total ($) |
| 4,506,412 | 161,428,428 | 165,934,840 | 16,068,296 | 134,214,811 | 150,283,107 |
Columbia Small Cap Value Fund II | Annual Report 2019
| 27 |
Notes to Financial Statements (continued)
February 28, 2019
Short-term capital gain distributions, if any, are considered ordinary income distributions for tax purposes.
At February 28, 2019, the components of distributable earnings on a tax basis were as follows:
Undistributed
ordinary income ($) | Undistributed
long-term
capital gains ($) | Capital loss
carryforwards ($) | Net unrealized
appreciation ($) |
| 2,042,454 | 24,032,933 | — | 299,534,031 |
At February 28, 2019, the cost of all investments for federal income tax purposes along with the aggregate gross unrealized appreciation and depreciation based on that cost was:
Federal
tax cost ($) | Gross unrealized
appreciation ($) | Gross unrealized
(depreciation) ($) | Net unrealized
appreciation ($) |
| 1,083,517,455 | 362,297,368 | (62,763,337) | 299,534,031 |
Tax cost of investments and unrealized appreciation/(depreciation) may also include timing differences that do not constitute adjustments to tax basis.
Under current tax rules, regulated investment companies can elect to treat certain late-year ordinary losses incurred and post-October capital losses (capital losses realized after October 31) as arising on the first day of the following taxable year. As of February 28, 2019, the Fund will elect to treat the following late-year ordinary losses and post-October capital losses as arising on March 1, 2019.
Late year
ordinary losses ($) | Post-October
capital losses ($) |
| — | 4,332,524 |
Management of the Fund has concluded that there are no significant uncertain tax positions in the Fund that would require recognition in the financial statements. However, management’s conclusion may be subject to review and adjustment at a later date based on factors including, but not limited to, new tax laws, regulations, and administrative interpretations (including relevant court decisions). Generally, the Fund’s federal tax returns for the prior three fiscal years remain subject to examination by the Internal Revenue Service.
Note 5. Portfolio information
The cost of purchases and proceeds from sales of securities, excluding short-term investments and derivatives, if any, aggregated to $545,314,740 and $681,833,944, respectively, for the year ended February 28, 2019. The amount of purchase and sale activity impacts the portfolio turnover rate reported in the Financial Highlights.
Note 6. Affiliated money market fund
The Fund invests in Columbia Short-Term Cash Fund, an affiliated money market fund established for the exclusive use by the Fund and other affiliated funds (the Affiliated MMF). The income earned by the Fund from such investments is included as Dividends - affiliated issuers in the Statement of Operations. As an investing fund, the Fund indirectly bears its proportionate share of the expenses of the Affiliated MMF. The Affiliated MMF prices its shares with a floating net asset value. In addition, the Board of Trustees of the Affiliated MMF may impose a fee on redemptions (sometimes referred to as a liquidity fee) or temporarily suspend redemptions (sometimes referred to as imposing a redemption gate) in the event its liquidity falls below regulatory limits.
Note 7. Interfund lending
Pursuant to an exemptive order granted by the Securities and Exchange Commission, the Fund participates in a program (the Interfund Program) allowing each participating Columbia Fund (each, a Participating Fund) to lend money directly to and, except for closed-end funds and money market funds, borrow money directly from other Participating Funds for temporary purposes. The amounts eligible for borrowing and lending under the Interfund Program are subject to certain restrictions.
| 28 | Columbia Small Cap Value Fund II | Annual Report 2019 |
Notes to Financial Statements (continued)
February 28, 2019
Interfund loans are subject to the risk that the borrowing fund could be unable to repay the loan when due, and a delay in repayment to the lending fund could result in lost opportunities and/or additional lending costs. The exemptive order is subject to conditions intended to mitigate conflicts of interest arising from the Investment Manager’s relationship with each Participating Fund.
The Fund’s activity in the Interfund Program during the year ended February 28, 2019 was as follows:
| Borrower or lender | Average loan
balance ($) | Weighted average
interest rate (%) | Days
outstanding |
| Lender | 1,950,000 | 2.68 | 10 |
Interest income earned by the Fund is recorded as Interfund lending in the Statement of Operations. The Fund had no outstanding interfund loans at February 28, 2019.
Note 8. Line of credit
The Fund has access to a revolving credit facility with a syndicate of banks led by Citibank, N.A., HSBC Bank USA, N.A. and JPMorgan Chase Bank, N.A. whereby the Fund may borrow for the temporary funding of shareholder redemptions or for other temporary or emergency purposes. The credit facility, which is a collective agreement between the Fund and certain other funds managed by the Investment Manager or an affiliated investment manager, severally and not jointly, permits collective borrowings up to $1 billion. Interest is charged to each participating fund based on its borrowings at a rate equal to the higher of (i) the federal funds effective rate, (ii) the one-month LIBOR rate and (iii) the overnight bank funding rate, plus in each case, 1.00%. Each borrowing under the credit facility matures no later than 60 days after the date of borrowing. The Fund also pays a commitment fee equal to its pro rata share of the unused amount of the credit facility at a rate of 0.15% per annum. The commitment fee is included in other expenses in the Statement of Operations. This agreement expires annually in December unless extended or renewed.
The Fund had no borrowings during the year ended February 28, 2019.
Note 9. Significant risks
Financial sector risk
The Fund may be more susceptible to the particular risks that may affect companies in the financial services sector than if it were invested in a wider variety of companies in unrelated sectors. Companies in the financial services sector are subject to certain risks, including the risk of regulatory change, decreased liquidity in credit markets and unstable interest rates. Such companies may have concentrated portfolios, such as a high level of loans to real estate developers, which makes them vulnerable to economic conditions that affect that industry. Performance of such companies may be affected by competitive pressures and exposure to investments or agreements that, under certain circumstances, may lead to losses (e.g., subprime loans). Companies in the financial services sector are subject to extensive governmental regulation that may limit the amount and types of loans and other financial commitments they can make, and interest rates and fees that they may charge. In addition, profitability of such companies is largely dependent upon the availability and the cost of capital.
Shareholder concentration risk
At February 28, 2019, three unaffiliated shareholders of record owned 52.8% of the outstanding shares of the Fund in one or more accounts. The Fund has no knowledge about whether any portion of those shares was owned beneficially. Subscription and redemption activity by concentrated accounts may have a significant effect on the operations of the Fund. In the case of a large redemption, the Fund may be forced to sell investments at inopportune times, including its liquid positions, which may result in Fund losses and the Fund holding a higher percentage of less liquid positions. Large redemptions could result in decreased economies of scale and increased operating expenses for non-redeeming Fund shareholders.
Note 10. Subsequent events
Management has evaluated the events and transactions that have occurred through the date the financial statements were issued and noted no items requiring adjustment of the financial statements or additional disclosure.
Columbia Small Cap Value Fund II | Annual Report 2019
| 29 |
Notes to Financial Statements (continued)
February 28, 2019
Note 11. Information regarding pending and settled legal proceedings
Ameriprise Financial and certain of its affiliates have historically been involved in a number of legal, arbitration and regulatory proceedings, including routine litigation, class actions, and governmental actions, concerning matters arising in connection with the conduct of their business activities. Ameriprise Financial believes that the Fund is not currently the subject of, and that neither Ameriprise Financial nor any of its affiliates are the subject of, any pending legal, arbitration or regulatory proceedings that are likely to have a material adverse effect on the Fund or the ability of Ameriprise Financial or its affiliates to perform under their contracts with the Fund. Ameriprise Financial is required to make quarterly (10-Q), annual (10-K) and, as necessary, 8-K filings with the Securities and Exchange Commission (SEC) on legal and regulatory matters that relate to Ameriprise Financial and its affiliates. Copies of these filings may be obtained by accessing the SEC website at www.sec.gov.
There can be no assurance that these matters, or the adverse publicity associated with them, will not result in increased Fund redemptions, reduced sale of Fund shares or other adverse consequences to the Fund. Further, although we believe proceedings are not likely to have a material adverse effect on the Fund or the ability of Ameriprise Financial or its affiliates to perform under their contracts with the Fund, these proceedings are subject to uncertainties and, as such, we are unable to estimate the possible loss or range of loss that may result. An adverse outcome in one or more of these proceedings could result in adverse judgments, settlements, fines, penalties or other relief that could have a material adverse effect on the consolidated financial condition or results of operations of Ameriprise Financial.
| 30 | Columbia Small Cap Value Fund II | Annual Report 2019 |
Report of Independent Registered Public Accounting Firm
To the Board of Trustees of Columbia Funds Series Trust and Shareholders of Columbia Small Cap Value Fund II
Opinion on the Financial Statements
We have audited the accompanying statement of assets and liabilities, including the portfolio of investments, of Columbia Small Cap Value Fund II (one of the funds constituting Columbia Funds Series Trust, referred to hereafter as the "Fund") as of February 28, 2019, the related statement of operations for the year ended February 28, 2019, the statement of changes in net assets for each of the two years in the period ended February 28, 2019, including the related notes, and the financial highlights for each of the five years in the period ended February 28, 2019 (collectively referred to as the “financial statements”). In our opinion, the financial statements present fairly, in all material respects, the financial position of the Fund as of February 28, 2019, the results of its operations for the year then ended, the changes in its net assets for each of the two years in the period ended February 28, 2019 and the financial highlights for each of the five years in the period ended February 28, 2019 in conformity with accounting principles generally accepted in the United States of America.
Basis for Opinion
These financial statements are the responsibility of the Fund’s management. Our responsibility is to express an opinion on the Fund’s financial statements based on our audits. We are a public accounting firm registered with the Public Company Accounting Oversight Board (United States) (PCAOB) and are required to be independent with respect to the Fund in accordance with the U.S. federal securities laws and the applicable rules and regulations of the Securities and Exchange Commission and the PCAOB.
We conducted our audits of these financial statements in accordance with the standards of the PCAOB. Those standards require that we plan and perform the audit to obtain reasonable assurance about whether the financial statements are free of material misstatement, whether due to error or fraud.
Our audits included performing procedures to assess the risks of material misstatement of the financial statements, whether due to error or fraud, and performing procedures that respond to those risks. Such procedures included examining, on a test basis, evidence regarding the amounts and disclosures in the financial statements. Our audits also included evaluating the accounting principles used and significant estimates made by management, as well as evaluating the overall presentation of the financial statements. Our procedures included confirmation of securities owned as of February 28, 2019 by correspondence with the custodian, transfer agent and brokers; when replies were not received from brokers, we performed other auditing procedures. We believe that our audits provide a reasonable basis for our opinion.
/s/PricewaterhouseCoopers LLP
Minneapolis, Minnesota
April 22, 2019
We have served as the auditor of one or more investment companies within the Columbia Funds Complex since 1977.
Columbia Small Cap Value Fund II | Annual Report 2019
| 31 |
Federal Income Tax Information
(Unaudited)
The Fund hereby designates the following tax attributes for the fiscal year ended February 28, 2019. Shareholders will be notified in early 2020 of the amounts for use in preparing 2019 income tax returns.
Qualified
dividend
income | Dividends
received
deduction | Capital
gain
dividend |
| 100.00% | 100.00% | $170,132,160 |
Qualified dividend income. For taxable, non-corporate shareholders, the percentage of ordinary income distributed during the fiscal year that represents qualified dividend income subject to reduced tax rates.
Dividends received deduction. The percentage of ordinary income distributed during the fiscal year that qualifies for the corporate dividends received deduction.
Capital gain dividend. The Fund designates as a capital gain dividend the amount reflected above, or if subsequently determined to be different, the net capital gain of such fiscal period.
| 32 | Columbia Small Cap Value Fund II | Annual Report 2019 |
Shareholders elect the Board that oversees the Fund’s operations. The Board appoints officers who are responsible for day-to-day business decisions based on policies set by the Board. The following table provides basic biographical information about the Fund’s Trustees as of the printing of this report, including their principal occupations during the past five years, although specific titles for individuals may have varied over the period. Under current Board policy, Trustees not affiliated with the Investment Manager generally may serve through the end of the calendar year in which they reach the mandatory retirement age established by the Board.
Independent trustees
Name,
address,
year of birth | Position held
with the Trust and
length of service | Principal occupation(s)
during past five years
and other relevant
professional experience | Number of
Funds in the
Columbia Funds
complex
overseen | Other directorships
held by Trustee
during the past
five years |
George S. Batejan
c/o Columbia Management
Investment Advisers, LLC
225 Franklin Street
Mail Drop BX32 05228
Boston, MA 02110
1953 | Trustee since 1/17 | Executive Vice President, Global Head of Technology and Operations, Janus Capital Group, Inc., 2010-2016 | 123 | Former Chairman of the Board, NICSA (National Investment Company Services Association) (Executive Committee, Nominating Committee and Governance Committee), 2014-2016; former Director, Intech Investment Management, 2011-2016; former Board Member, Metro Denver Chamber of Commerce, 2015-2016; former Advisory Board Member, University of Colorado Business School, 2015-2018 |
Kathleen Blatz
c/o Columbia Management
Investment Advisers, LLC
225 Franklin Street
Mail Drop BX32 05228
Boston, MA 02110
1954 | Trustee since 1/06 for RiverSource Funds and since 6/11 for Nations Funds | Attorney; specializing in arbitration and mediation; Chief Justice, Minnesota Supreme Court, 1998-2006; Associate Justice, Minnesota Supreme Court, 1996-1998; Fourth Judicial District Court Judge, Hennepin County, 1994-1996; Attorney in private practice and public service, 1984-1993; State Representative, Minnesota House of Representatives, 1979-1993, which included service on the Tax and Financial Institutions and Insurance Committees; Member and Interim Chair, Minnesota Sports Facilities Authority, January 2017-July 2017; Interim President and Chief Executive Officer, Blue Cross and Blue Shield of Minnesota (health care insurance), February-July 2018 | 123 | Trustee, BlueCross BlueShield of Minnesota since 2009 (Chair of the Business Development Committee, 2014-2017; Chair of the Governance Committee since 2017); Chair of the Robina Foundation since August 2013; former Member and Chair of the Board, Minnesota Sports Facilities Authority, January 2017-July 2017 |
Edward J. Boudreau, Jr.
c/o Columbia Management
Investment Advisers, LLC
225 Franklin Street
Mail Drop BX32 05228
Boston, MA 02110
1944 | Chair of the Board since 1/18; Trustee since 6/11 for RiverSource Funds and since 1/05 for Nations Funds | Managing Director, E.J. Boudreau & Associates (consulting) since 2000; FINRA Industry Arbitrator, 2002-present; Chairman and Chief Executive Officer, John Hancock Investments (asset management), Chairman and Interested Trustee for open-end and closed-end funds offered by John Hancock, 1989-2000; John Hancock Mutual Life Insurance Company, including Senior Vice President and Treasurer and Senior Vice President Information Technology, 1968-1988 | 123 | Former Trustee, Boston Museum of Science (Chair of Finance Committee) 1985-2013; former Trustee, BofA Funds Series Trust (11 funds), 2005-2011 |
Columbia Small Cap Value Fund II | Annual Report 2019
| 33 |
TRUSTEES AND OFFICERS (continued)
Independent trustees (continued)
Name,
address,
year of birth | Position held
with the Trust and
length of service | Principal occupation(s)
during past five years
and other relevant
professional experience | Number of
Funds in the
Columbia Funds
complex
overseen | Other directorships
held by Trustee
during the past
five years |
Pamela G. Carlton
c/o Columbia Management
Investment Advisers, LLC
225 Franklin Street
Mail Drop BX32 05228
Boston, MA 02110
1954 | Trustee since 7/07 for RiverSource Funds and since 6/11 for Nations Funds | President, Springboard — Partners in Cross Cultural Leadership (consulting company) since 2003; Managing Director of US Equity Research, JP Morgan Chase, 1999-2003; Director of US Equity Research, Chase Asset Management, 1996-1999; Co-Director Latin America Research, 1993-1996, COO Global Research, 1992-1996, Co-Director of US Research, 1991-1992, Investment Banker, Morgan Stanley, 1982-1991 | 123 | Trustee, New York Presbyterian Hospital Board (Executive Committee and Chair of Human Resources Committee) since 1996; Director, Laurel Road Bank (Audit Committee) since 2017 |
Patricia M. Flynn
c/o Columbia Management
Investment Advisers, LLC
225 Franklin Street
Mail Drop BX32 05228
Boston, MA 02110
1950 | Trustee since 11/04 for RiverSource Funds and since 6/11 for Nations Funds | Trustee Professor of Economics and Management, Bentley University since 1976 (also teaches and conducts research on corporate governance); Dean, McCallum Graduate School of Business, Bentley University, 1992-2002 | 123 | Trustee, MA Taxpayers Foundation since 1997; Board of Directors, The MA Business Roundtable since 2003; Board of Governors, Innovation Institute, MA Technology Collaborative since 2010 |
Brian J. Gallagher
c/o Columbia Management
Investment Advisers, LLC
225 Franklin Street
Mail Drop BX32 05228
Boston, MA 02110
1954 | Trustee since 12/17 | Retired; Partner with Deloitte & Touche LLP and its predecessors, 1977-2016 | 121 | Trustee, Catholic Schools Foundation since 2004 |
Catherine James Paglia
c/o Columbia Management
Investment Advisers, LLC
225 Franklin Street
Mail Drop BX32 05228
Boston, MA 02110
1952 | Trustee since 11/04 for RiverSource Funds and since 6/11 for Nations Funds | Director, Enterprise Asset Management, Inc. (private real estate and asset management company) since September 1998; Managing Director and Partner, Interlaken Capital, Inc., 1989-1997; Managing Director, Morgan Stanley, 1982-1989; Vice President, Investment Banking, 1980-1982, Associate, Investment Banking, 1976-1980, Dean Witter Reynolds, Inc. | 123 | Director, Valmont Industries, Inc. (irrigation systems manufacturer) since 2012; Trustee, Carleton College (on the Investment Committee); Trustee, Carnegie Endowment for International Peace (on the Investment Committee) |
Anthony M. Santomero
c/o Columbia Management
Investment Advisers, LLC
225 Franklin Street
Mail Drop BX32 05228
Boston, MA 02110
1946 | Trustee since 6/11 for RiverSource Funds and since 1/08 for Nations Funds | Richard K. Mellon Professor Emeritus of Finance, The Wharton School, University of Pennsylvania, since 2002; Senior Advisor, McKinsey & Company (consulting), 2006-2008; President, Federal Reserve Bank of Philadelphia, 2000- 2006; Professor of Finance, The Wharton School, University of Pennsylvania, 1972-2002 | 123 | Trustee, Penn Mutual Life Insurance Company since March 2008; Director, Renaissance Reinsurance Ltd. since May 2008; former Trustee, BofA Funds Series Trust (11 funds), 2008-2011; former Director, Citigroup Inc. and Citibank, N.A., 2009-2019 |
| 34 | Columbia Small Cap Value Fund II | Annual Report 2019 |
TRUSTEES AND OFFICERS (continued)
Independent trustees (continued)
Name,
address,
year of birth | Position held
with the Trust and
length of service | Principal occupation(s)
during past five years
and other relevant
professional experience | Number of
Funds in the
Columbia Funds
complex
overseen | Other directorships
held by Trustee
during the past
five years |
Minor M. Shaw
c/o Columbia Management
Investment Advisers, LLC
225 Franklin Street
Mail Drop BX32 05228
Boston, MA 02110
1947 | Trustee since 6/11 for RiverSource Funds and since 2003 for Nations Funds | President, Micco LLC (private investments) since 2011; President, Micco Corp. (family investment business), 1998-2011 | 123 | Director, BlueCross BlueShield of South Carolina since April 2008; Board Chair, Hollingsworth Funds since 2016; Advisory Board member, Duke Energy Corp. since October 2016; Chair of the Duke Endowment; Chair of Greenville – Spartanburg Airport Commission; former Trustee, BofA Funds Series Trust (11 funds), 2003-2011; former Director, Piedmont Natural Gas, 2004-2016; former Director, National Association of Corporate Directors, Carolinas Chapter, 2013-2018 |
Sandra Yeager
c/o Columbia Management
Investment Advisers, LLC
225 Franklin Street
Mail Drop BX32 05228
Boston, MA 02110
1964 | Trustee since 12/17 | Retired; President and founder, Hanoverian Capital, LLC (SEC registered investment advisor firm), 2008-2016; Managing Director, DuPont Capital, 2006-2008; Managing Director, Morgan Stanley Investment Management, 2004-2006; Senior Vice President, Alliance Bernstein, 1990-2004 | 121 | Director, NAPE Education Foundation since October 2016 |
Interested trustee affiliated with Investment Manager*
Name,
address,
year of birth | Position held with the Trust and length of service | Principal occupation(s) during the
past five years and other relevant
professional experience | Number of
Funds in the
Columbia Funds
complex overseen | Other directorships
held by Trustee
during the past
five years |
William F. Truscott
c/o Columbia Management
Investment Advisers, LLC
225 Franklin St.
Boston, MA 02110
1960 | Trustee since 11/01 for RiverSource Funds and since 6/11 for Nations Funds; Senior Vice President since 2002 for RiverSource Funds and since 5/10 for Nations Funds | Chairman of the Board and President, Columbia Management Investment Advisers, LLC since May 2010 and February 2012, respectively; Chief Executive Officer, Global Asset Management, Ameriprise Financial, Inc. since September 2012 (previously Chief Executive Officer, U.S. Asset Management & President, Annuities, May 2010 - September 2012); Director and Chief Executive Officer, Columbia Management Investment Distributors, Inc. since May 2010 and February 2012, respectively; Chairman of the Board and Chief Executive Officer, RiverSource Distributors, Inc. since 2006; Director, Threadneedle Asset Management Holdings, SARL since 2014; President and Chief Executive Officer, Ameriprise Certificate Company, 2006 - August 2012. | 192 | Chairman of the Board, Columbia Management Investment Advisers, LLC since May 2010; Director, Columbia Management Investment Distributors, Inc. since May 2010; former Director, Ameriprise Certificate Company, 2006-January 2013 |
| * | Interested person (as defined under the 1940 Act) by reason of being an officer, director, security holder and/or employee of the Investment Manager or Ameriprise Financial. |
Columbia Small Cap Value Fund II | Annual Report 2019
| 35 |
TRUSTEES AND OFFICERS (continued)
Nations Funds refer to the Funds within the Columbia Funds Complex that historically bore the Nations brand and includes series of Columbia Funds Series Trust. RiverSource Funds refer to the Funds within the Columbia Funds Complex that historically bore the RiverSource brand and includes series of Columbia Funds Series Trust II.
The Statement of Additional Information has additional information about the Fund’s Board members and is available, without charge, upon request by calling 800.345.6611, visiting columbiathreadneedleus.com/investor/ or contacting your financial intermediary.
| 36 | Columbia Small Cap Value Fund II | Annual Report 2019 |
TRUSTEES AND OFFICERS (continued)
The Board has appointed officers who are responsible for day-to-day business decisions based on policies it has established. The officers serve at the pleasure of the Board. The following table provides basic information about the Officers of the Fund as of the printing of this report, including principal occupations during the past five years, although their specific titles may have varied over the period. In addition to Mr. Truscott, who is Senior Vice President, the Fund’s other officers are:
Fund officers
Name,
address and
year of birth | Position and year
first appointed to
position for any Fund
in the Columbia
Funds complex or a
predecessor thereof | Principal occupation(s) during past five years |
Christopher O. Petersen
5228 Ameriprise
Financial Center
Minneapolis, MN 55474
Born 1970 | President and Principal Executive Officer (2015) | Vice President and Lead Chief Counsel, Ameriprise Financial, Inc. since January 2015 (previously, Vice President and Chief Counsel, January 2010 - December 2014; officer of Columbia Funds and affiliated funds since 2007. |
Michael G. Clarke
225 Franklin Street
Boston, MA 02110
Born 1969 | Chief Financial Officer (Principal Financial Officer) (2009) and Senior Vice President (2019) | Vice President — Accounting and Tax, Columbia Management Investment Advisers, LLC, since May 2010; senior officer of Columbia Funds and affiliated funds since 2002 (previously, Treasurer and Chief Accounting Officer, January 2009-January 2019 and December 2015-January 2019, respectively). |
Joseph Beranek
5890 Ameriprise
Financial Center
Minneapolis, MN 55474
Born 1965 | Treasurer and Chief Accounting Officer (Principal Accounting Officer) (2019) | Vice President — Mutual Fund Accounting and Financial Reporting, Columbia Management Investment Advisers, LLC, since December 2018 and March 2017, respectively (previously, Vice President — Pricing and Corporate Actions, May 2010-March 2017). |
Paul B. Goucher
485 Lexington Avenue
New York, NY 10017
Born 1968 | Senior Vice President (2011) and Assistant Secretary (2008) | Senior Vice President and Assistant General Counsel, Ameriprise Financial, Inc. since January 2017 (previously, Vice President and Lead Chief Counsel, November 2008 - January 2017 and January 2013 - January 2017, respectively); Vice President, Chief Legal Officer and Assistant Secretary, Columbia Management Investment Advisers, LLC since March 2015 (previously Vice President and Assistant Secretary, May 2010 – March 2015). |
Thomas P. McGuire
225 Franklin Street
Boston, MA 02110
Born 1972 | Senior Vice President and Chief Compliance Officer (2012) | Vice President — Asset Management Compliance, Ameriprise Financial, Inc., since May 2010; Chief Compliance Officer, Ameriprise Certificate Company since September 2010. |
Colin Moore
225 Franklin Street
Boston, MA 02110
Born 1958 | Senior Vice President (2010) | Executive Vice President and Global Chief Investment Officer, Ameriprise Financial, Inc., since July 2013; Executive Vice President and Global Chief Investment Officer, Columbia Management Investment Advisers, LLC since July 2013. |
Ryan C. Larrenaga
225 Franklin Street
Boston, MA 02110
Born 1970 | Senior Vice President (2017), Chief Legal Officer (2017), and Secretary (2015) | Vice President and Chief Counsel, Ameriprise Financial, Inc. since August 2018 (previously, Vice President and Group Counsel, August 2011 - August 2018); officer of Columbia Funds and affiliated funds since 2005. |
Michael E. DeFao
225 Franklin Street
Boston, MA 02110
Born 1968 | Vice President (2011) and Assistant Secretary (2010) | Vice President and Chief Counsel, Ameriprise Financial, Inc. since May 2010. |
Amy Johnson
5228 Ameriprise
Financial Center
Minneapolis, MN 55474
Born 1965 | Vice President (2006) | Managing Director and Global Head of Operations, Columbia Management Investment Advisers, LLC since April 2016 (previously Managing Director and Chief Operating Officer, 2010 - 2016). |
Columbia Small Cap Value Fund II | Annual Report 2019
| 37 |
TRUSTEES AND OFFICERS (continued)
Fund officers (continued)
Name,
address and
year of birth | Position and year
first appointed to
position for any Fund
in the Columbia
Funds complex or a
predecessor thereof | Principal occupation(s) during past five years |
Lyn Kephart-Strong
5228 Ameriprise
Financial Center
Minneapolis, MN 55474
Born 1960 | Vice President (2015) | President, Columbia Management Investment Services Corp. since October 2014; Vice President & Resolution Officer, Ameriprise Trust Company since August 2009. |
| 38 | Columbia Small Cap Value Fund II | Annual Report 2019 |
The Fund mails one shareholder report to each shareholder address, unless such shareholder elected to receive shareholder reports from the Fund electronically. If you would like more than one report, please call shareholder services at 800.345.6611 and additional reports will be sent to you.
Proxy voting policies and procedures
The policy of the Board of Trustees is to vote the proxies of the companies in which the Fund holds investments consistent with the procedures as stated in the Statement of Additional Information (SAI). You may obtain a copy of the SAI without charge by calling 800.345.6611; contacting your financial intermediary; visiting columbiathreadneedleus.com/investor/; or searching the website of the Securities and Exchange Commission (SEC) at sec.gov. Information regarding how the Fund voted proxies relating to portfolio securities is filed with the SEC by August 31st for the most recent 12-month period ending June 30th of that year, and is available without charge by visiting columbiathreadneedleus.com/investor/, or searching the website of the SEC at sec.gov.
Quarterly schedule of investments
The Fund files a complete schedule of portfolio holdings with the SEC for the first and third quarters of each fiscal year on Form N-Q or Form N-PORT (available for filings after March 31, 2019). The Fund’s Form N-Q or Form N-PORT is available on the SEC’s website at sec.gov. The Fund’s complete schedule of portfolio holdings, as filed on Form N-Q or Form N-PORT, can also be obtained without charge, upon request, by calling 800.345.6611.
Additional Fund information
For more information about the Fund, please visit columbiathreadneedleus.com/investor/ or call 800.345.6611. Customer Service Representatives are available to answer your questions Monday through Friday from 8 a.m. to 7 p.m. Eastern time.
Fund investment manager
Columbia Management Investment Advisers, LLC
225 Franklin Street
Boston, MA 02110
Fund distributor
Columbia Management Investment Distributors, Inc.
225 Franklin Street
Boston, MA 02110
Fund transfer agent
Columbia Management Investment Services Corp.
P.O. Box 219104
Kansas City, MO 64121-9104
Columbia Small Cap Value Fund II | Annual Report 2019
| 39 |
[THIS PAGE INTENTIONALLY LEFT BLANK]
[THIS PAGE INTENTIONALLY LEFT BLANK]
Columbia Small Cap Value Fund II
P.O. Box 219104
Kansas City, MO 64121-9104
Please read and consider the investment objectives, risks, charges and expenses for any fund carefully before investing. For a prospectus and summary prospectus, which contains this and other important information about the Fund, go to
columbiathreadneedleus.com/investor/. The Fund is distributed by Columbia Management Investment Distributors, Inc., member FINRA, and managed by Columbia Management Investment Advisers, LLC.
Columbia Threadneedle Investments (Columbia Threadneedle) is the global brand name of the Columbia and Threadneedle group of companies. All rights reserved.
© 2019 Columbia Management Investment Advisers, LLC.
columbiathreadneedleus.com/investor/

Annual Report
February 28, 2019
Columbia Overseas Value Fund
Beginning on January 1, 2021, as permitted by regulations adopted by the Securities and Exchange Commission, paper copies of the Fund’s annual and semiannual shareholder reports like this one will no longer be sent by mail, unless you specifically request paper copies of the reports. Instead, the reports will be made available on the Fund’s website (columbiathreadneedleus.com/investor/), and each time a report is posted you will be notified by mail and provided with a website address to access the report.
If you have already elected to receive shareholder reports electronically, you will not be affected by this change and you need not take any action. You may elect to receive shareholder reports and other communications from the Fund electronically at any time by contacting your financial intermediary (such as a broker-dealer or bank) or, for Fund shares held directly with the Fund, by calling 800.345.6611 or by enrolling in “eDelivery” by logging into your account at columbiathreadneedleus.com/investor/.
You may elect to receive all future reports in paper free of charge. If you invest through a financial intermediary, you can contact your financial intermediary to request that you continue receiving paper copies of your shareholder reports. If you invest directly with the Fund, you can call 800.345.6611 to let the Fund know you wish to continue receiving paper copies of your shareholder reports. Your election to receive paper reports will apply to all Columbia Funds held in your account if you invest through a financial intermediary or all Columbia Funds held with the fund complex if you invest directly with the Fund.
Not FDIC Insured • No bank guarantee • May lose value
Dear Shareholders,
Volatility exists in financial markets and this is not a comfortable fact of life. How investors deal with this reality, including how they react to short term spikes in volatility as well as to longer periods of increased or decreased volatility, may have a significant impact on their overall investing success.
Too often, investors change their investment strategy based on something that’s happening at a moment in time rather than thinking about how that change in strategy might affect their ability to achieve their longer term financial goals. Emotion replaces logic and reasoning. Investors may sell in reaction to a market drop (fear or panic), locking in low returns which means they won’t be invested when the market returns, or they invest more at a market peak (greed or conviction), essentially when it is expensive to do so. In both cases, selling and buying at the exact wrong time.
We believe the best outcomes come from a consistent approach to investing. Here are five areas where advisors can help us overcome the tendency to react emotionally as we struggle to make the right choices with our investments:
Long-term focus
The further away long-term goals, aspirations and objectives are, the easier it is to stray away from the goals and priorities that we set out. Advisors help us stay focused on what we want to accomplish.
Discipline through up-and-down markets
Advisors help set rules to prevent us from making rash decisions that we may regret later. Knowing ahead of time what you should do in case of certain situations will help you get through volatile markets and not make emotional decisions.
Tax-awareness
Taxes are one of the biggest drags on investment returns and are critical attributes of investing. Yet few of us take the necessary steps to ease the corrosive effect of taxes. Advisors have tools and knowledge that may help us to manage portfolios more tax-efficiently and keep more of what we earn.
Emotional objectivity
Our emotions are very hard to manage and making investment decisions in an emotional state can lead to exceedingly bad outcomes. An objective advisor can help prevent some of the reactionary mistakes emotions often lead us to.
Education and guidance
The role of the advisor is to teach and guide us toward achieving our financial goals. In terms of working through emotions, guidance is by far the most important component.
By understanding our own behaviors and biases, we can prepare for future challenges. Your success is our priority. Talk to your advisor about how working with Columbia Threadneedle Investments may help you stay the course and position your portfolio for consistent, sustainable outcomes, regardless of market conditions.
Sincerely,
Christopher O. Petersen
President, Columbia Funds
Columbia Funds are distributed by Columbia Management Investment Distributors, Inc., member FINRA, and managed by Columbia Management Investment Advisers, LLC.
© 2019 Columbia Management Investment Advisers, LLC. All rights reserved.
Columbia Overseas Value Fund | Annual Report 2019
Columbia Overseas Value Fund | Annual Report 2019
Investment objective
Columbia Overseas Value Fund (the Fund) seeks long-term capital appreciation.
Portfolio management
Fred Copper, CFA
Co-Portfolio Manager
Managed Fund since 2008
Daisuke Nomoto, CMA (SAAJ)
Co-Portfolio Manager
Managed Fund since 2013
Morningstar style boxTM
The Morningstar Style Box is based on a fund’s portfolio holdings. For equity funds, the vertical axis shows the market capitalization of the stocks owned, and the horizontal axis shows investment style (value, blend, or growth). Information shown is based on the most recent data provided by Morningstar.
© 2019 Morningstar, Inc. All rights reserved. The Morningstar information contained herein: (1) is proprietary to Morningstar and/or its content providers; (2) may not be copied or distributed; and (3) is not warranted to be accurate, complete or timely. Neither Morningstar nor its content providers are responsible for any damages or losses arising from any use of this information.
| Average annual total returns (%) (for the period ended February 28, 2019) |
| | | Inception | 1 Year | 5 Years | 10 Years |
| Class A* | Excluding sales charges | 02/28/13 | -7.96 | 2.83 | 10.27 |
| | Including sales charges | | -13.23 | 1.62 | 9.62 |
| Advisor Class* | 07/01/15 | -7.80 | 3.10 | 10.67 |
| Class C* | Excluding sales charges | 02/28/13 | -8.60 | 2.08 | 9.45 |
| | Including sales charges | | -9.49 | 2.08 | 9.45 |
| Institutional Class | 03/31/08 | -7.69 | 3.09 | 10.67 |
| Institutional 2 Class* | 07/01/15 | -7.61 | 3.20 | 10.73 |
| Institutional 3 Class* | 07/01/15 | -7.64 | 3.26 | 10.76 |
| Class R* | 03/01/16 | -8.20 | 2.60 | 10.15 |
| MSCI EAFE Value Index (Net) | | -7.92 | 0.65 | 8.92 |
Returns for Class A shares are shown with and without the maximum initial sales charge of 5.75%. Returns for Class C shares are shown with and without the 1.00% contingent deferred sales charge for the first year only. The Fund’s other share classes are not subject to sales charges and have limited eligibility. Please see the Fund’s prospectus for details. Performance for different share classes will vary based on differences in sales charges and fees associated with each share class. All results shown assume reinvestment of distributions during the period. Returns do not reflect the deduction of taxes that a shareholder may pay on Fund distributions or on the redemption of Fund shares. Performance results reflect the effect of any fee waivers or reimbursements of Fund expenses by Columbia Management Investment Advisers, LLC and/or any of its affiliates. Absent these fee waivers or expense reimbursement arrangements, performance results would have been lower.
The performance information shown represents past performance and is not a guarantee of future results. The investment return and principal value of your investment will fluctuate so that your shares, when redeemed, may be worth more or less than their original cost. Current performance may be lower or higher than the performance information shown. You may obtain performance information current to the most recent month-end by contacting your financial intermediary, visiting columbiathreadneedleus.com/investor/ or calling 800.345.6611.
| * | The returns shown for periods prior to the share class inception date (including returns for the Life of the Fund, if shown, which are since Fund inception) include the returns of the Fund’s oldest share class. These returns are adjusted to reflect any higher class-related operating expenses of the newer share classes, as applicable. Please visit columbiathreadneedleus.com/investor/investment-products/mutual-funds/appended-performance for more information. |
The MSCI EAFE Value Index (Net) is a subset of the MSCI EAFE Index (Net), and constituents of the index include securities from Europe, Australasia and the Far East. The index generally represents approximately 50% of the free float-adjusted market capitalization of the MSCI EAFE Index (Net), and consists of those securities classified by MSCI Inc. as most representing the value style, such as, higher book value-to-price ratios, higher forward earnings-to-price ratios, higher dividend yields and lower forecasted growth rates than securities representing the growth style.
Indices are not available for investment, are not professionally managed and do not reflect sales charges, fees, brokerage commissions, taxes (except the MSCI EAFE Value Index (Net), which reflects reinvested dividends net of withholding taxes) or other expenses of investing. Securities in the Fund may not match those in an index.
| 2 | Columbia Overseas Value Fund | Annual Report 2019 |
Fund at a Glance (continued)
Performance of a hypothetical $10,000 investment (February 28, 2009 — February 28, 2019)
The chart above shows the change in value of a hypothetical $10,000 investment in Class A shares of Columbia Overseas Value Fund during the stated time period, and does not reflect the deduction of taxes that a shareholder may pay on Fund distributions or on the redemption of Fund shares.
| Top 10 holdings (%) (at February 28, 2019) |
| Royal Dutch Shell PLC, Class B (United Kingdom) | 4.4 |
| Total SA (France) | 3.1 |
| Takeda Pharmaceutical Co., Ltd. (Japan) | 2.6 |
| BP PLC (United Kingdom) | 2.5 |
| AXA SA (France) | 2.4 |
| Sanofi (France) | 2.3 |
| Endesa SA (Spain) | 2.0 |
| ING Groep NV (Netherlands) | 1.9 |
| ITOCHU Corp. (Japan) | 1.7 |
| British American Tobacco PLC (United Kingdom) | 1.7 |
Percentages indicated are based upon total investments including options purchased and excluding Money Market Funds and all other investments in derivatives, if any.
For further detail about these holdings, please refer to the section entitled “Portfolio of Investments.”
Fund holdings are as of the date given, are subject to change at any time, and are not recommendations to buy or sell any security.
| Equity sector breakdown (%) (at February 28, 2019) |
| Communication Services | 5.9 |
| Consumer Discretionary | 9.4 |
| Consumer Staples | 8.1 |
| Energy | 12.3 |
| Financials | 25.9 |
| Health Care | 12.9 |
| Industrials | 11.1 |
| Information Technology | 4.5 |
| Materials | 4.0 |
| Real Estate | 2.6 |
| Utilities | 3.3 |
| Total | 100.0 |
Percentages indicated are based upon total equity investments. The Fund’s portfolio composition is subject to change.
Columbia Overseas Value Fund | Annual Report 2019
| 3 |
Fund at a Glance (continued)
| Country breakdown (%) (at February 28, 2019) |
| Argentina | 0.2 |
| Australia | 1.9 |
| Brazil | 1.1 |
| Canada | 3.3 |
| China | 0.7 |
| Denmark | 0.3 |
| Finland | 1.0 |
| France | 10.8 |
| Germany | 5.1 |
| Greece | 0.1 |
| Hong Kong | 2.4 |
| Ireland | 0.3 |
| Israel | 2.2 |
| Italy | 2.0 |
| Japan | 20.8 |
| Netherlands | 7.9 |
| Norway | 0.6 |
| Pakistan | 0.6 |
| Portugal | 0.0(a) |
| Russian Federation | 0.5 |
| Singapore | 1.3 |
| South Korea | 1.4 |
| Spain | 4.4 |
| Sweden | 1.3 |
| Switzerland | 0.8 |
| United Kingdom | 23.1 |
| United States(b) | 5.9 |
| Total | 100.0 |
| (a) | Rounds to zero. |
| (b) | Includes investments in Money Market Funds and Exchange-Traded Funds. |
Country breakdown is based primarily on issuer’s place of organization/incorporation. Percentages indicated are based upon total investments including options purchased and excluding all other investments in derivatives, if any. The Fund’s portfolio composition is subject to change.
| 4 | Columbia Overseas Value Fund | Annual Report 2019 |
Manager Discussion of Fund Performance
For the 12-month period ended February 28, 2019, the Fund’s Class A shares returned -7.96% excluding sales charges. The Fund’s benchmark, the MSCI EAFE Value Index (Net), returned -7.92% for the same time period. The Fund’s security selection was strongest within the health care, information technology, industrials and consumer discretionary sectors. Selection within communication services and materials detracted from relative return. In terms of sector allocation, an overweight to health care and an underweight to financials were additive, while an underweight to utilities detracted.
Trade tensions and decelerating global growth sparked volatility
Over the 12-month period ended February 28, 2019, international stocks generally posted declines. During the fourth quarter of 2018, global stock markets buckled under the weight of the myriad issues that had been accumulating over the course of the year. These included the ongoing U.S. trade wars with various countries, most notably China; the continued deceleration of economic growth outside the United States, which was joined in the fourth quarter by the evident slowing of the U.S. economy; monetary tightening by several global central banks; the ongoing Brexit saga (the U.K.’s exit from the European Union (EU)); budget battles between the EU and the new coalition government in Italy; violent protests in France over the high cost of living; and lastly, the breakdown in the cohort of growth stocks that had been market leaders.
Bolstered by the stimulative benefits of tax reform, the U.S. economy did not experience the slowdown that affected other international markets. This, and the resulting strong U.S. dollar, dampened the relative returns of international stocks, particularly within the emerging markets. During the fourth quarter especially, the continued political turbulence, stock market volatility and threats of trade wars resulted in “risk-off” investor sentiment that sent global stocks down sharply. However, over the first two months of 2019 international markets regained some of the lost ground as investors seemed to shrug off previous worries over the global economic slowdown and various trade conflicts.
Industry allocation and security selection
During the annual period, the Fund’s security selection was strongest within the health care, information technology, industrials and consumer discretionary sectors. Selection within communication services and materials detracted from relative return. In terms of sector allocation, an overweight to health care and an underweight to financials were additive, while an underweight to utilities detracted. On a country basis, security selection was strongest within Japan and Spain. The Fund’s allocation to U.S. stocks contributed to results. Security selection within Germany and the U.K. detracted, as did an underweight to Switzerland.
The largest individual contributor to performance came from the Fund’s position in the Irish biopharmaceutical company Shire Plc. Shares of Shire rose at the start of the period on news of a potential acquisition by a Japanese pharmaceutical company, Takeda Pharmaceutical Co. Ltd., that culminated in a $62 billion transaction in December 2018. The Japanese internet security provider Digital Arts, Inc. was another top contributor to Fund performance. Digital Arts’ shares rose throughout the period as the company reported impressive sales growth that offset expenses related to company expansion. The Spanish utility company Endesa, S.A. was another notable contributor. Endesa’s shares rallied significantly during the market sell-off in the fourth quarter as investors sought defensive stocks with more predictable cash flows. Conversely, the Canadian gaming and online gambling company Stars Group Inc. represented the largest detractor from relative return. Shares of Stars Group fell after the company reported a decline in gross margins amid weakened sentiment regarding the online gaming sector against a backdrop of rising regulatory costs. Lastly, the British investment broker TP ICAP plc stumbled based on company officials’ profit warnings and the replacement of the company’s CEO.
During the period, the Fund used forward foreign currency contracts to hedge currency exposure associated with Fund securities, to shift investment exposure from one currency to another, to shift U.S. dollar exposure to achieve a representative weighted mix of major currencies in the benchmark, and/or to adjust an underweight country exposure in the portfolio. The Fund used equity index futures to manage exposure to the securities market and to maintain equity market exposure while managing cash flows. The Fund used options contracts to help efficiently exit from particular positions, or to implement a particular tactical view on the overall market without having to trade in the Fund’s underlying securities. On a stand-alone basis, the use of these derivatives had a negative impact on Fund performance.
Columbia Overseas Value Fund | Annual Report 2019
| 5 |
Manager Discussion of Fund Performance (continued)
At period’s end
At the close of the reporting period, the Fund was defensively positioned, with overweights in health care as well as some longer term growth technology names. In addition, we continued to underweight some cyclical sectors, including materials and financials, based on our expectations for a continued deceleration in global growth. On a country basis, the Fund was underweight in Japan, Switzerland, Australia and Germany, and overweight in the United States (not in the benchmark), the Netherlands and South Korea. While our outlook for Japan was generally favorable, the Fund was underweight there on concerns that the yen, generally viewed as a safe haven asset, may strengthen and hurt Japanese exporters.
Market risk may affect a single issuer, sector of the economy, industry or the market as a whole.Valuesecurities may be unprofitable if the market fails to recognize their intrinsic worth or the portfolio manager misgauged that worth.International investing involves certain risks and volatility due to potential political, economic or currency instabilities and different financial and accounting standards. Risks are enhanced foremerging market issuers. Investing in derivatives is a specialized activity that involves special risks that subject the Fund to significant loss potential, including when used as leverage, and may result in greater fluctuation in Fund value. See the Fund’s prospectus for information on these and other risks.
The views expressed in this report reflect the current views of the respective parties. These views are not guarantees of future performance and involve certain risks, uncertainties and assumptions that are difficult to predict, so actual outcomes and results may differ significantly from the views expressed. These views are subject to change at any time based upon economic, market or other conditions and the respective parties disclaim any responsibility to update such views. These views may not be relied on as investment advice and, because investment decisions for a Columbia fund are based on numerous factors, may not be relied on as an indication of trading intent on behalf of any particular Columbia fund. References to specific securities should not be construed as a recommendation or investment advice.
| 6 | Columbia Overseas Value Fund | Annual Report 2019 |
Understanding Your Fund’s Expenses
(Unaudited)
As an investor, you incur two types of costs. There are shareholder transaction costs, which generally include sales charges on purchases and may include redemption fees. There are also ongoing fund costs, which generally include management fees, distribution and/or service fees, and other fund expenses. The following information is intended to help you understand your ongoing costs (in dollars) of investing in the Fund and to help you compare these costs with the ongoing costs of investing in other mutual funds.
Analyzing your Fund’s expenses
To illustrate these ongoing costs, we have provided examples and calculated the expenses paid by investors in each share class of the Fund during the period. The actual and hypothetical information in the table is based on an initial investment of $1,000 at the beginning of the period indicated and held for the entire period. Expense information is calculated two ways and each method provides you with different information. The amount listed in the “Actual” column is calculated using the Fund’s actual operating expenses and total return for the period. You may use the Actual information, together with the amount invested, to estimate the expenses that you paid over the period. Simply divide your account value by $1,000 (for example, an $8,600 account value divided by $1,000 = 8.6), then multiply the results by the expenses paid during the period under the “Actual” column. The amount listed in the “Hypothetical” column assumes a 5% annual rate of return before expenses (which is not the Fund’s actual return) and then applies the Fund’s actual expense ratio for the period to the hypothetical return. You should not use the hypothetical account values and expenses to estimate either your actual account balance at the end of the period or the expenses you paid during the period. See “Compare with other funds” below for details on how to use the hypothetical data.
Compare with other funds
Since all mutual funds are required to include the same hypothetical calculations about expenses in shareholder reports, you can use this information to compare the ongoing cost of investing in the Fund with other funds. To do so, compare the hypothetical example with the 5% hypothetical examples that appear in the shareholder reports of other funds. As you compare hypothetical examples of other funds, it is important to note that hypothetical examples are meant to highlight the ongoing costs of investing in a fund only and do not reflect any transaction costs, such as sales charges, or redemption or exchange fees. Therefore, the hypothetical calculations are useful in comparing ongoing costs only, and will not help you determine the relative total costs of owning different funds. If transaction costs were included in these calculations, your costs would be higher.
| September 1, 2018 — February 28, 2019 |
| | Account value at the
beginning of the
period ($) | Account value at the
end of the
period ($) | Expenses paid during
the period ($) | Fund’s annualized
expense ratio (%) |
| | Actual | Hypothetical | Actual | Hypothetical | Actual | Hypothetical | Actual |
| Class A | 1,000.00 | 1,000.00 | 974.00 | 1,018.70 | 6.02 | 6.16 | 1.23 |
| Advisor Class | 1,000.00 | 1,000.00 | 974.40 | 1,019.93 | 4.80 | 4.91 | 0.98 |
| Class C | 1,000.00 | 1,000.00 | 970.80 | 1,014.98 | 9.68 | 9.89 | 1.98 |
| Institutional Class | 1,000.00 | 1,000.00 | 975.40 | 1,019.93 | 4.80 | 4.91 | 0.98 |
| Institutional 2 Class | 1,000.00 | 1,000.00 | 975.30 | 1,020.48 | 4.26 | 4.36 | 0.87 |
| Institutional 3 Class | 1,000.00 | 1,000.00 | 975.70 | 1,020.63 | 4.11 | 4.21 | 0.84 |
| Class R | 1,000.00 | 1,000.00 | 973.10 | 1,017.46 | 7.24 | 7.40 | 1.48 |
Expenses paid during the period are equal to the annualized expense ratio for each class as indicated above, multiplied by the average account value over the period and then multiplied by the number of days in the Fund’s most recent fiscal half year and divided by 365.
Expenses do not include fees and expenses incurred indirectly by the Fund from its investment in underlying funds, including affiliated and non-affiliated pooled investment vehicles, such as mutual funds and exchange-traded funds.
Had Columbia Management Investment Advisers, LLC and/or certain of its affiliates not waived/reimbursed certain fees and expenses, account value at the end of the period would have been reduced.
Columbia Overseas Value Fund | Annual Report 2019
| 7 |
Portfolio of Investments
February 28, 2019
(Percentages represent value of investments compared to net assets)
Investments in securities
| Common Stocks 98.4% |
| Issuer | Shares | Value ($) |
| Argentina 0.2% |
| Banco Macro SA, ADR | 79,689 | 4,024,294 |
| Australia 1.9% |
| Ansell Ltd. | 1,368,747 | 23,930,045 |
| National Australia Bank Ltd. | 537,161 | 9,588,887 |
| Total | 33,518,932 |
| Brazil 1.1% |
| Pagseguro Digital Ltd., Class A(a) | 683,962 | 19,239,851 |
| Canada 3.3% |
| Cott Corp. | 1,796,297 | 26,962,418 |
| Stars Group, Inc. (The)(a) | 1,014,290 | 16,910,614 |
| Yamana Gold, Inc. | 5,699,465 | 14,704,620 |
| Total | 58,577,652 |
| China 0.7% |
| BeiGene Ltd., ADR(a) | 18,465 | 2,530,628 |
| Tencent Holdings Ltd. | 233,100 | 9,982,100 |
| Total | 12,512,728 |
| Denmark 0.3% |
| Pandora A/S | 90,003 | 4,722,881 |
| Finland 1.0% |
| UPM-Kymmene OYJ | 595,061 | 17,950,109 |
| France 10.9% |
| Aperam SA | 180,686 | 5,902,568 |
| AXA SA | 1,639,173 | 41,568,500 |
| BNP Paribas SA | 295,518 | 15,144,642 |
| Capgemini SE | 183,618 | 21,971,670 |
| DBV Technologies SA, ADR(a) | 95,774 | 779,600 |
| Eiffage SA | 118,116 | 11,524,626 |
| Sanofi | 487,069 | 40,720,201 |
| Total SA | 951,965 | 54,129,772 |
| Total | 191,741,579 |
| Germany 5.1% |
| Allianz SE, Registered Shares | 112,367 | 24,999,983 |
| BASF SE | 154,122 | 11,743,747 |
| Bayer AG, Registered Shares | 228,567 | 18,271,633 |
| Duerr AG | 314,544 | 12,858,537 |
| Common Stocks (continued) |
| Issuer | Shares | Value ($) |
| E.ON SE | 2,031,581 | 22,380,297 |
| Total | 90,254,197 |
| Greece 0.1% |
| Piraeus Bank SA(a) | 707,647 | 990,043 |
| Hong Kong 2.4% |
| Link REIT (The) | 1,344,500 | 15,207,881 |
| WH Group Ltd. | 30,688,500 | 27,213,188 |
| Total | 42,421,069 |
| Ireland 0.3% |
| Amarin Corp. PLC, ADR(a) | 85,756 | 1,755,425 |
| ICON PLC(a) | 20,903 | 2,926,002 |
| Total | 4,681,427 |
| Israel 2.2% |
| Bank Hapoalim BM | 3,953,601 | 27,216,186 |
| Bezeq The Israeli Telecommunication Corp., Ltd. | 12,457,555 | 10,923,218 |
| Total | 38,139,404 |
| Italy 2.0% |
| Esprinet SpA | 1,155,413 | 4,606,355 |
| Recordati SpA | 796,408 | 29,957,246 |
| Total | 34,563,601 |
| Japan 20.9% |
| Amano Corp. | 443,700 | 9,428,049 |
| BayCurrent Consulting, Inc. | 415,700 | 12,485,440 |
| CYBERDYNE, Inc.(a) | 118,600 | 700,696 |
| Dai-ichi Life Holdings, Inc. | 1,034,700 | 15,766,791 |
| Hoya Corp. | 191,300 | 11,695,592 |
| Invincible Investment Corp. | 25,212 | 11,468,943 |
| ITOCHU Corp. | 1,670,000 | 29,998,137 |
| Katitas Co., Ltd. | 156,400 | 4,902,855 |
| Kinden Corp. | 635,400 | 10,314,155 |
| Koito Manufacturing Co., Ltd. | 157,900 | 9,136,624 |
| Matsumotokiyoshi Holdings Co., Ltd. | 655,800 | 22,456,226 |
| Nihon M&A Center, Inc. | 1,034,100 | 26,170,429 |
| Nippon Telegraph & Telephone Corp. | 563,700 | 24,364,615 |
| ORIX Corp. | 1,784,100 | 25,831,232 |
| Round One Corp. | 858,200 | 11,176,222 |
The accompanying Notes to Financial Statements are an integral part of this statement.
| 8 | Columbia Overseas Value Fund | Annual Report 2019 |
Portfolio of Investments (continued)
February 28, 2019
| Common Stocks (continued) |
| Issuer | Shares | Value ($) |
| Ship Healthcare Holdings, Inc. | 183,300 | 6,947,191 |
| Sony Corp. | 434,800 | 20,877,146 |
| Starts Corp., Inc. | 255,700 | 5,579,122 |
| Sumitomo Mitsui Financial Group, Inc. | 780,700 | 27,740,851 |
| Suzuki Motor Corp. | 133,700 | 6,865,429 |
| Takeda Pharmaceutical Co., Ltd. | 1,155,077 | 46,483,730 |
| Takuma Co., Ltd. | 883,545 | 11,715,186 |
| Toyota Motor Corp. | 269,700 | 16,297,624 |
| Total | 368,402,285 |
| Netherlands 7.9% |
| ABN AMRO Group NV | 1,219,011 | 29,561,530 |
| ASR Nederland NV | 648,123 | 28,559,403 |
| ING Groep NV | 2,527,116 | 33,435,795 |
| Koninklijke Ahold Delhaize NV | 854,521 | 22,039,519 |
| Signify NV | 993,239 | 26,379,875 |
| Total | 139,976,122 |
| Norway 0.6% |
| BW LPG Ltd.(a) | 2,512,075 | 8,208,541 |
| Kongsberg Automotive ASA(a) | 3,221,822 | 3,106,360 |
| Total | 11,314,901 |
| Pakistan 0.6% |
| DG Khan Cement Co., Ltd. | 7,755,900 | 5,167,054 |
| Lucky Cement Ltd. | 1,517,700 | 5,114,594 |
| Total | 10,281,648 |
| Portugal 0.0% |
| Banco Espirito Santo SA, Registered Shares(a),(b),(c) | 3,582,817 | 4 |
| Russian Federation 0.5% |
| Sberbank of Russia PJSC, ADR | 736,398 | 9,396,438 |
| Singapore 1.3% |
| DBS Group Holdings Ltd. | 1,263,000 | 23,155,523 |
| South Korea 1.4% |
| GS Home Shopping, Inc. | 20,951 | 3,428,613 |
| Hyundai Home Shopping Network Corp. | 101,421 | 9,820,734 |
| Youngone Corp. | 361,273 | 11,264,623 |
| Total | 24,513,970 |
| Common Stocks (continued) |
| Issuer | Shares | Value ($) |
| Spain 4.4% |
| ACS Actividades de Construccion y Servicios SA | 504,150 | 22,352,890 |
| Banco Santander SA | 1,766,185 | 8,630,432 |
| Endesa SA | 1,375,013 | 34,642,771 |
| Tecnicas Reunidas SA | 420,421 | 11,247,443 |
| Total | 76,873,536 |
| Sweden 1.3% |
| Granges AB | 820,109 | 8,586,460 |
| Hemfosa Fastigheter AB | 1,697,508 | 14,501,232 |
| Total | 23,087,692 |
| Switzerland 0.8% |
| Autoneum Holding AG | 30,329 | 4,986,713 |
| Novartis AG, Registered Shares | 108,110 | 9,861,564 |
| Total | 14,848,277 |
| United Kingdom 23.1% |
| Barclays Bank PLC | 7,387,863 | 16,085,857 |
| BP PLC | 6,264,784 | 44,404,868 |
| British American Tobacco PLC | 818,959 | 29,963,544 |
| BT Group PLC | 8,202,392 | 23,357,728 |
| Crest Nicholson Holdings PLC | 1,346,923 | 6,981,606 |
| DCC PLC | 339,380 | 29,371,410 |
| Greene King PLC | 2,805,782 | 24,561,557 |
| GW Pharmaceuticals PLC, ADR(a) | 14,743 | 2,535,943 |
| HSBC Holdings PLC | 2,769,018 | 22,509,893 |
| Imperial Brands PLC | 367,755 | 12,245,509 |
| Inchcape PLC | 903,806 | 6,773,010 |
| Intermediate Capital Group PLC | 1,195,276 | 16,614,509 |
| John Wood Group PLC | 1,827,904 | 12,616,785 |
| Just Group PLC | 17,717,610 | 24,228,238 |
| Legal & General Group PLC | 4,846,154 | 18,036,111 |
| Nightstar Therapeutics PLC, ADR(a) | 148,723 | 2,204,075 |
| Royal Dutch Shell PLC, Class B | 2,485,394 | 77,945,778 |
| TP ICAP PLC | 6,246,723 | 26,289,380 |
| WPP PLC | 1,051,697 | 11,519,233 |
| Total | 408,245,034 |
The accompanying Notes to Financial Statements are an integral part of this statement.
Columbia Overseas Value Fund | Annual Report 2019
| 9 |
Portfolio of Investments (continued)
February 28, 2019
| Common Stocks (continued) |
| Issuer | Shares | Value ($) |
| United States 4.1% |
| ACADIA Pharmaceuticals, Inc.(a) | 93,712 | 2,483,368 |
| Aerie Pharmaceuticals, Inc.(a) | 39,821 | 1,858,446 |
| Alexion Pharmaceuticals, Inc.(a) | 24,201 | 3,275,121 |
| Broadcom, Inc. | 56,113 | 15,451,276 |
| Insmed, Inc.(a) | 96,361 | 2,857,104 |
| Liberty Global PLC, Class C(a) | 872,725 | 22,158,488 |
| NVIDIA Corp. | 53,279 | 8,218,818 |
| Puma Biotechnology, Inc.(a) | 41,159 | 1,144,632 |
| Quotient Ltd.(a) | 754,981 | 7,980,149 |
| Sage Therapeutics, Inc.(a) | 15,480 | 2,465,190 |
| Teekay Tankers Ltd., Class A | 4,295,389 | 4,596,066 |
| Total | 72,488,658 |
Total Common Stocks
(Cost $1,776,182,995) | 1,735,921,855 |
|
| Exchange-Traded Funds 1.2% |
| | Shares | Value ($) |
| United States 1.2% |
| iShares MSCI EAFE ETF | 325,766 | 20,936,981 |
Total Exchange-Traded Funds
(Cost $20,434,975) | 20,936,981 |
| Options Purchased Calls 0.0% |
| | | | | | Value ($) |
| (Cost $1,219,812) | 700,575 |
| Money Market Funds 0.6% |
| | Shares | Value ($) |
| Columbia Short-Term Cash Fund, 2.523%(d),(e) | 9,754,825 | 9,753,850 |
Total Money Market Funds
(Cost $9,753,850) | 9,753,850 |
Total Investments in Securities
(Cost $1,807,591,632) | 1,767,313,261 |
| Other Assets & Liabilities, Net | | (3,043,031) |
| Net Assets | $1,764,270,230 |
At February 28, 2019, securities and/or cash totaling $100,000 were pledged as collateral.
Investments in derivatives
| Forward foreign currency exchange contracts |
Currency to
be sold | Currency to
be purchased | Counterparty | Settlement
date | Unrealized
appreciation ($) | Unrealized
depreciation ($) |
| 31,272,000 CAD | 23,459,513 USD | Goldman Sachs | 03/20/2019 | — | (314,043) |
| 22,889,000 GBP | 29,989,626 USD | Goldman Sachs | 03/20/2019 | — | (395,197) |
| 92,071,000 ILS | 25,152,575 USD | Goldman Sachs | 03/20/2019 | — | (276,743) |
| 2,032,179,000 JPY | 18,567,686 USD | Goldman Sachs | 03/20/2019 | 311,980 | — |
| 22,606,360,000 KRW | 20,076,696 USD | Goldman Sachs | 03/20/2019 | — | (24,156) |
| 3,464,034 USD | 4,883,000 AUD | Goldman Sachs | 03/20/2019 | 711 | — |
| 87,314,687 USD | 122,137,000 AUD | Goldman Sachs | 03/20/2019 | — | (652,060) |
| 8,389,309 USD | 8,303,000 CHF | Goldman Sachs | 03/20/2019 | — | (57,023) |
| 3,465,124 USD | 3,067,000 EUR | Goldman Sachs | 03/20/2019 | 28,309 | — |
| 10,061,393 USD | 8,798,000 EUR | Goldman Sachs | 03/20/2019 | — | (40,126) |
| 11,732,124 USD | 105,335,000 SEK | Goldman Sachs | 03/20/2019 | — | (312,249) |
| Total | | | | 341,000 | (2,071,597) |
The accompanying Notes to Financial Statements are an integral part of this statement.
| 10 | Columbia Overseas Value Fund | Annual Report 2019 |
Portfolio of Investments (continued)
February 28, 2019
| Call option contracts purchased |
| Description | Counterparty | Trading
currency | Notional
amount | Number of
contracts | Exercise
price/Rate | Expiration
date | Cost ($) | Value ($) |
| CBOE Volatility Index | Deutsche Bank | USD | 27,873,544 | 18,682 | 20.00 | 03/19/2019 | 1,219,812 | 700,575 |
| Call option contracts written |
| Description | Counterparty | Trading
currency | Notional
amount | Number of
contracts | Exercise
price/Rate | Expiration
date | Premium
received ($) | Value ($) |
| ACADIA Pharmaceuticals, Inc. | Deutsche Bank | USD | (2,483,050) | (937) | 28.00 | 3/15/2019 | (45,876) | (46,850) |
| GW Pharmaceuticals PLC | Deutsche Bank | USD | (2,528,547) | (147) | 185.00 | 3/15/2019 | (23,877) | (23,152) |
| Total | | | | | | | (69,753) | (70,002) |
Notes to Portfolio of Investments
| (a) | Non-income producing investment. |
| (b) | Represents fair value as determined in good faith under procedures approved by the Board of Trustees. At February 28, 2019, the total value of these securities amounted to $4, which represents less than 0.01% of total net assets. |
| (c) | Valuation based on significant unobservable inputs. |
| (d) | The rate shown is the seven-day current annualized yield at February 28, 2019. |
| (e) | As defined in the Investment Company Act of 1940, an affiliated company is one in which the Fund owns 5% or more of the company’s outstanding voting securities, or a company which is under common ownership or control with the Fund. Holdings and transactions in these affiliated companies during the year ended February 28, 2019 are as follows: |
| Issuer | Beginning
shares | Shares
purchased | Shares
sold | Ending
shares | Realized gain
(loss) —
affiliated
issuers ($) | Net change in
unrealized
appreciation
(depreciation) —
affiliated
issuers ($) | Dividends —
affiliated
issuers ($) | Value —
affiliated
issuers
at end of
period ($) |
| Columbia Short-Term Cash Fund, 2.523% |
| | 24,879,162 | 791,906,113 | (807,030,450) | 9,754,825 | 4,971 | 492 | 364,958 | 9,753,850 |
Abbreviation Legend
| ADR | American Depositary Receipt |
Currency Legend
| AUD | Australian Dollar |
| CAD | Canada Dollar |
| CHF | Swiss Franc |
| EUR | Euro |
| GBP | British Pound |
| ILS | New Israeli Sheqel |
| JPY | Japanese Yen |
| KRW | South Korean Won |
| SEK | Swedish Krona |
| USD | US Dollar |
Fair value measurements
The Fund categorizes its fair value measurements according to a three-level hierarchy that maximizes the use of observable inputs and minimizes the use of unobservable inputs by prioritizing that the most observable input be used when available. Observable inputs are those that market participants would use in pricing an investment based on market data obtained from sources independent of the reporting entity. Unobservable inputs are those that reflect the Fund’s assumptions about the information market participants would use in pricing an investment. An investment’s level within the fair value hierarchy is based on the lowest level of any input that is deemed significant to the asset’s or liability’s fair value measurement. The input levels are not necessarily an indication of the risk or liquidity associated with investments at that level. For example, certain U.S. government securities are generally high quality and liquid, however, they are reflected as Level 2 because the inputs used to determine fair value may not always be quoted prices in an active market.
Fair value inputs are summarized in the three broad levels listed below:
The accompanying Notes to Financial Statements are an integral part of this statement.
Columbia Overseas Value Fund | Annual Report 2019
| 11 |
Portfolio of Investments (continued)
February 28, 2019
Fair value measurements (continued)
| ■ | Level 1 — Valuations based on quoted prices for investments in active markets that the Fund has the ability to access at the measurement date. Valuation adjustments are not applied to Level 1 investments. |
| ■ | Level 2 — Valuations based on other significant observable inputs (including quoted prices for similar securities, interest rates, prepayment speeds, credit risks, etc.). |
| ■ | Level 3 — Valuations based on significant unobservable inputs (including the Fund’s own assumptions and judgment in determining the fair value of investments). |
Inputs that are used in determining fair value of an investment may include price information, credit data, volatility statistics, and other factors. These inputs can be either observable or unobservable. The availability of observable inputs can vary between investments, and is affected by various factors such as the type of investment, and the volume and level of activity for that investment or similar investments in the marketplace. The inputs will be considered by the Investment Manager, along with any other relevant factors in the calculation of an investment’s fair value. The Fund uses prices and inputs that are current as of the measurement date, which may include periods of market dislocations. During these periods, the availability of prices and inputs may be reduced for many investments. This condition could cause an investment to be reclassified between the various levels within the hierarchy.
Foreign equity securities actively traded in markets where there is a significant delay in the local close relative to the New York Stock Exchange are classified as Level 2. The values of these securities may include an adjustment to reflect the impact of significant market movements following the close of local trading, as described in Note 2 to the financial statements – Security valuation.
Certain investments that have been measured at fair value using the net asset value (NAV) per share (or its equivalent) are not categorized in the fair value hierarchy. The fair value amounts presented in the table are intended to reconcile the fair value hierarchy to the amounts presented in the Portfolio of Investments. The Columbia Short-Term Cash Fund seeks to provide shareholders with maximum current income consistent with liquidity and stability of principal. Columbia Short-Term Cash Fund prices its shares with a floating NAV and no longer seeks to maintain a stable NAV.
Investments falling into the Level 3 category are primarily supported by quoted prices from brokers and dealers participating in the market for those investments. However, these may be classified as Level 3 investments due to lack of market transparency and corroboration to support these quoted prices. Additionally, valuation models may be used as the pricing source for any remaining investments classified as Level 3. These models may rely on one or more significant unobservable inputs and/or significant assumptions by the Investment Manager. Inputs used in valuations may include, but are not limited to, financial statement analysis, capital account balances, discount rates and estimated cash flows, and comparable company data.
Under the direction of the Fund’s Board of Trustees (the Board), the Investment Manager’s Valuation Committee (the Committee) is responsible for overseeing the valuation procedures approved by the Board. The Committee consists of voting and non-voting members from various groups within the Investment Manager’s organization, including operations and accounting, trading and investments, compliance, risk management and legal.
The Committee meets at least monthly to review and approve valuation matters, which may include a description of specific valuation determinations, data regarding pricing information received from approved pricing vendors and brokers and the results of Board-approved valuation control policies and procedures (the Policies). The Policies address, among other things, instances when market quotations are or are not readily available, including recommendations of third party pricing vendors and a determination of appropriate pricing methodologies; events that require specific valuation determinations and assessment of fair value techniques; securities with a potential for stale pricing, including those that are illiquid, restricted, or in default; and the effectiveness of third party pricing vendors, including periodic reviews of vendors. The Committee meets more frequently, as needed, to discuss additional valuation matters, which may include the need to review back-testing results, review time-sensitive information or approve related valuation actions. The Committee reports to the Board, with members of the Committee meeting with the Board at each of its regularly scheduled meetings to discuss valuation matters and actions during the period, similar to those described earlier.
For investments categorized as Level 3, the Committee monitors information similar to that described above, which may include: (i) data specific to the issuer or comparable issuers, (ii) general market or specific sector news and (iii) quoted prices and specific or similar security transactions. The Committee considers this data and any changes from prior periods in order to assess the reasonableness of observable and unobservable inputs, any assumptions or internal models used to value those securities and changes in fair value. This data is also used to corroborate, when available, information received from approved pricing vendors and brokers. Various factors impact the frequency of monitoring this information (which may occur as often as daily). However, the Committee may determine that changes to inputs, assumptions and models are not required as a result of the monitoring procedures performed.
The following table is a summary of the inputs used to value the Fund’s investments at February 28, 2019:
| | Level 1
quoted prices
in active
markets for
identical
assets ($) | Level 2
other
significant
observable
inputs ($) | Level 3
significant
unobservable
inputs ($) | Investments
measured at
net asset
value ($) | Total ($) |
| Investments in Securities | | | | | |
| Common Stocks | | | | | |
| Argentina | 4,024,294 | — | — | — | 4,024,294 |
| Australia | — | 33,518,932 | — | — | 33,518,932 |
| Brazil | 19,239,851 | — | — | — | 19,239,851 |
| Canada | 58,577,652 | — | — | — | 58,577,652 |
| China | 2,530,628 | 9,982,100 | — | — | 12,512,728 |
| Denmark | — | 4,722,881 | — | — | 4,722,881 |
| Finland | — | 17,950,109 | — | — | 17,950,109 |
| France | 779,600 | 190,961,979 | — | — | 191,741,579 |
| Germany | — | 90,254,197 | — | — | 90,254,197 |
| Greece | — | 990,043 | — | — | 990,043 |
| Hong Kong | — | 42,421,069 | — | — | 42,421,069 |
| Ireland | 4,681,427 | — | — | — | 4,681,427 |
The accompanying Notes to Financial Statements are an integral part of this statement.
| 12 | Columbia Overseas Value Fund | Annual Report 2019 |
Portfolio of Investments (continued)
February 28, 2019
Fair value measurements (continued)
| | Level 1
quoted prices
in active
markets for
identical
assets ($) | Level 2
other
significant
observable
inputs ($) | Level 3
significant
unobservable
inputs ($) | Investments
measured at
net asset
value ($) | Total ($) |
| Israel | — | 38,139,404 | — | — | 38,139,404 |
| Italy | — | 34,563,601 | — | — | 34,563,601 |
| Japan | — | 368,402,285 | — | — | 368,402,285 |
| Netherlands | — | 139,976,122 | — | — | 139,976,122 |
| Norway | — | 11,314,901 | — | — | 11,314,901 |
| Pakistan | — | 10,281,648 | — | — | 10,281,648 |
| Portugal | — | — | 4 | — | 4 |
| Russian Federation | — | 9,396,438 | — | — | 9,396,438 |
| Singapore | — | 23,155,523 | — | — | 23,155,523 |
| South Korea | — | 24,513,970 | — | — | 24,513,970 |
| Spain | — | 76,873,536 | — | — | 76,873,536 |
| Sweden | — | 23,087,692 | — | — | 23,087,692 |
| Switzerland | — | 14,848,277 | — | — | 14,848,277 |
| United Kingdom | 4,740,018 | 403,505,016 | — | — | 408,245,034 |
| United States | 72,488,658 | — | — | — | 72,488,658 |
| Total Common Stocks | 167,062,128 | 1,568,859,723 | 4 | — | 1,735,921,855 |
| Exchange-Traded Funds | 20,936,981 | — | — | — | 20,936,981 |
| Options Purchased Calls | 700,575 | — | — | — | 700,575 |
| Money Market Funds | — | — | — | 9,753,850 | 9,753,850 |
| Total Investments in Securities | 188,699,684 | 1,568,859,723 | 4 | 9,753,850 | 1,767,313,261 |
| Investments in Derivatives | | | | | |
| Asset | | | | | |
| Forward Foreign Currency Exchange Contracts | — | 341,000 | — | — | 341,000 |
| Liability | | | | | |
| Forward Foreign Currency Exchange Contracts | — | (2,071,597) | — | — | (2,071,597) |
| Options Contracts Written | (70,002) | — | — | — | (70,002) |
| Total | 188,629,682 | 1,567,129,126 | 4 | 9,753,850 | 1,765,512,662 |
See the Portfolio of Investments for all investment classifications not indicated in the table.
The Fund’s assets assigned to the Level 2 input category are generally valued using the market approach, in which a security’s value is determined through reference to prices and information from market transactions for similar or identical assets. These assets include certain foreign securities for which a third party statistical pricing service may be employed for purposes of fair market valuation. The model utilized by such third party statistical pricing service takes into account a security’s correlation to available market data including, but not limited to, intraday index, ADR, and exchange-traded fund movements.
Forward foreign currency exchange contracts are valued at unrealized appreciation (depreciation).
There were no transfers of financial assets between levels during the period.
The Fund does not hold any significant investments (greater than one percent of net assets) categorized as Level 3.
The Fund’s assets assigned to the Level 3 category are valued utilizing the valuation technique deemed the most appropriate in the circumstances. Certain common stocks classified as Level 3 securities are valued using the market approach. To determine fair value for these securities, management considered various factors which may have included, but were not limited to, the halt price of the security, discount rates observed in the market for similar assets as well as the movement in certain foreign or domestic market indices. Significant increases (decreases) to any of these inputs would result in a significantly higher (lower) fair value measurement. Generally, a change in observable yields on comparable securities would result in a directionally similar change to discount rates.
The accompanying Notes to Financial Statements are an integral part of this statement.
Columbia Overseas Value Fund | Annual Report 2019
| 13 |
Statement of Assets and Liabilities
February 28, 2019
| Assets | |
| Investments in securities, at value | |
| Unaffiliated issuers (cost $1,796,617,970) | $1,756,858,836 |
| Affiliated issuers (cost $9,753,850) | 9,753,850 |
| Options purchased (cost $1,219,812) | 700,575 |
| Foreign currency (cost $1,767,194) | 1,767,195 |
| Cash collateral held at broker for: | |
| Forward foreign currency exchange contracts | 100,000 |
| Unrealized appreciation on forward foreign currency exchange contracts | 341,000 |
| Receivable for: | |
| Investments sold | 17,052,673 |
| Capital shares sold | 2,479,077 |
| Dividends | 4,174,550 |
| Foreign tax reclaims | 1,893,081 |
| Expense reimbursement due from Investment Manager | 5,053 |
| Prepaid expenses | 2,654 |
| Total assets | 1,795,128,544 |
| Liabilities | |
| Option contracts written, at value (premiums received $69,753) | 70,002 |
| Unrealized depreciation on forward foreign currency exchange contracts | 2,071,597 |
| Payable for: | |
| Investments purchased | 25,927,751 |
| Capital shares purchased | 2,160,885 |
| Management services fees | 38,972 |
| Distribution and/or service fees | 3,580 |
| Transfer agent fees | 171,560 |
| Compensation of board members | 193,660 |
| Compensation of chief compliance officer | 20 |
| Other expenses | 220,287 |
| Total liabilities | 30,858,314 |
| Net assets applicable to outstanding capital stock | $1,764,270,230 |
| Represented by | |
| Paid in capital | 2,098,347,951 |
| Total distributable earnings (loss) (Note 2) | (334,077,721) |
| Total - representing net assets applicable to outstanding capital stock | $1,764,270,230 |
The accompanying Notes to Financial Statements are an integral part of this statement.
| 14 | Columbia Overseas Value Fund | Annual Report 2019 |
Statement of Assets and Liabilities (continued)
February 28, 2019
| Class A | |
| Net assets | $341,197,756 |
| Shares outstanding | 36,931,281 |
| Net asset value per share | $9.24 |
| Maximum sales charge | 5.75% |
| Maximum offering price per share (calculated by dividing the net asset value per share by 1.0 minus the maximum sales charge for Class A shares) | $9.80 |
| Advisor Class | |
| Net assets | $161,150,252 |
| Shares outstanding | 17,491,060 |
| Net asset value per share | $9.21 |
| Class C | |
| Net assets | $42,164,985 |
| Shares outstanding | 4,584,682 |
| Net asset value per share | $9.20 |
| Institutional Class | |
| Net assets | $432,060,987 |
| Shares outstanding | 46,705,425 |
| Net asset value per share | $9.25 |
| Institutional 2 Class | |
| Net assets | $533,584,198 |
| Shares outstanding | 58,006,727 |
| Net asset value per share | $9.20 |
| Institutional 3 Class | |
| Net assets | $248,248,196 |
| Shares outstanding | 26,956,786 |
| Net asset value per share | $9.21 |
| Class R | |
| Net assets | $5,863,856 |
| Shares outstanding | 650,104 |
| Net asset value per share | $9.02 |
The accompanying Notes to Financial Statements are an integral part of this statement.
Columbia Overseas Value Fund | Annual Report 2019
| 15 |
Statement of Operations
Year Ended February 28, 2019
| Net investment income | |
| Income: | |
| Dividends — unaffiliated issuers | $46,190,829 |
| Dividends — affiliated issuers | 364,958 |
| Foreign taxes withheld | (3,732,351) |
| Total income | 42,823,436 |
| Expenses: | |
| Management services fees | 11,261,888 |
| Distribution and/or service fees | |
| Class A | 900,357 |
| Class C | 463,486 |
| Class R | 21,106 |
| Class T | 1,721 |
| Transfer agent fees | |
| Class A | 548,836 |
| Advisor Class | 199,089 |
| Class C | 70,576 |
| Institutional Class | 592,467 |
| Institutional 2 Class | 141,789 |
| Institutional 3 Class | 17,543 |
| Class K | 2 |
| Class R | 6,477 |
| Class T | 1,035 |
| Plan administration fees | |
| Class K | 9 |
| Compensation of board members | 21,989 |
| Custodian fees | 211,848 |
| Printing and postage fees | 217,050 |
| Registration fees | 282,085 |
| Audit fees | 101,485 |
| Legal fees | 18,683 |
| Interest on collateral | 1,524 |
| Interest on interfund lending | 114 |
| Compensation of chief compliance officer | 276 |
| Other | 47,687 |
| Total expenses | 15,129,122 |
| Fees waived or expenses reimbursed by Investment Manager and its affiliates | (634,875) |
| Fees waived by transfer agent | |
| Institutional 2 Class | (44,264) |
| Expense reduction | (433) |
| Total net expenses | 14,449,550 |
| Net investment income | 28,373,886 |
The accompanying Notes to Financial Statements are an integral part of this statement.
| 16 | Columbia Overseas Value Fund | Annual Report 2019 |
Statement of Operations (continued)
Year Ended February 28, 2019
| Realized and unrealized gain (loss) — net | |
| Net realized gain (loss) on: | |
| Investments — unaffiliated issuers | $14,179,159 |
| Investments — affiliated issuers | 4,971 |
| Foreign currency translations | (135,894) |
| Forward foreign currency exchange contracts | (2,019,913) |
| Futures contracts | (631,975) |
| Options purchased | (1,066,885) |
| Options contracts written | 418,347 |
| Net realized gain | 10,747,810 |
| Net change in unrealized appreciation (depreciation) on: | |
| Investments — unaffiliated issuers | (123,180,116) |
| Investments — affiliated issuers | 492 |
| Foreign currency translations | 9,001 |
| Forward foreign currency exchange contracts | (3,198,463) |
| Options purchased | (519,237) |
| Options contracts written | (249) |
| Net change in unrealized appreciation (depreciation) | (126,888,572) |
| Net realized and unrealized loss | (116,140,762) |
| Net decrease in net assets resulting from operations | $(87,766,876) |
The accompanying Notes to Financial Statements are an integral part of this statement.
Columbia Overseas Value Fund | Annual Report 2019
| 17 |
Statement of Changes in Net Assets
| | Year Ended
February 28, 2019 | Year Ended
February 28, 2018 |
| Operations | | |
| Net investment income | $28,373,886 | $13,801,567 |
| Net realized gain | 10,747,810 | 37,548,733 |
| Net change in unrealized appreciation (depreciation) | (126,888,572) | 126,751,363 |
| Net increase (decrease) in net assets resulting from operations | (87,766,876) | 178,101,663 |
| Distributions to shareholders | | |
| Net investment income and net realized gains | | |
| Class A | (11,129,073) | |
| Advisor Class | (4,877,227) | |
| Class C | (1,101,771) | |
| Institutional Class | (13,232,351) | |
| Institutional 2 Class | (11,949,202) | |
| Institutional 3 Class | (7,891,502) | |
| Class R | (129,052) | |
| Class T | (12,607) | |
| Net investment income | | |
| Class A | | (4,949,741) |
| Advisor Class | | (758,760) |
| Class C | | (297,974) |
| Institutional Class | | (3,378,171) |
| Institutional 2 Class | | (536,614) |
| Institutional 3 Class | | (6,015,196) |
| Class K | | (2,287) |
| Class R | | (34,668) |
| Class T | | (16,528) |
| Net realized gains | | |
| Class A | | (5,591,761) |
| Advisor Class | | (759,190) |
| Class C | | (549,438) |
| Institutional Class | | (3,380,087) |
| Institutional 2 Class | | (504,599) |
| Institutional 3 Class | | (5,537,346) |
| Class K | | (2,410) |
| Class R | | (44,972) |
| Class T | | (18,867) |
| Total distributions to shareholders (Note 2) | (50,322,785) | (32,378,609) |
| Increase in net assets from capital stock activity | 691,732,292 | 374,877,174 |
| Total increase in net assets | 553,642,631 | 520,600,228 |
| Net assets at beginning of year | 1,210,627,599 | 690,027,371 |
| Net assets at end of year | $1,764,270,230 | $1,210,627,599 |
| Excess of distributions over net investment income | $(2,752,387) | $(3,232,467) |
The accompanying Notes to Financial Statements are an integral part of this statement.
| 18 | Columbia Overseas Value Fund | Annual Report 2019 |
Statement of Changes in Net Assets (continued)
| | Year Ended | Year Ended |
| | February 28, 2019 | February 28, 2018 |
| | Shares | Dollars ($) | Shares | Dollars ($) |
| Capital stock activity |
| Class A | | | | |
| Subscriptions | 10,252,736 | 100,421,639 | 12,543,287 | 127,173,811 |
| Distributions reinvested | 1,167,990 | 10,628,368 | 977,450 | 9,862,470 |
| Redemptions | (9,579,912) | (90,346,038) | (7,065,293) | (67,527,392) |
| Net increase | 1,840,814 | 20,703,969 | 6,455,444 | 69,508,889 |
| Advisor Class | | | | |
| Subscriptions | 16,608,652 | 158,458,810 | 5,323,467 | 55,021,216 |
| Distributions reinvested | 549,056 | 4,875,876 | 150,875 | 1,517,803 |
| Redemptions | (7,267,321) | (64,550,993) | (660,408) | (6,512,973) |
| Net increase | 9,890,387 | 98,783,693 | 4,813,934 | 50,026,046 |
| Class B | | | | |
| Redemptions | — | — | (126,009) | (1,181,042) |
| Net decrease | — | — | (126,009) | (1,181,042) |
| Class C | | | | |
| Subscriptions | 2,382,707 | 23,294,142 | 2,833,580 | 29,088,297 |
| Distributions reinvested | 116,574 | 1,079,628 | 81,799 | 822,081 |
| Redemptions | (2,239,354) | (21,194,842) | (1,045,493) | (10,029,789) |
| Net increase | 259,927 | 3,178,928 | 1,869,886 | 19,880,589 |
| Class I | | | | |
| Subscriptions | — | — | 130,010 | 1,122,106 |
| Redemptions | — | — | (32,248,837) | (283,052,237) |
| Net decrease | — | — | (32,118,827) | (281,930,131) |
| Institutional Class | | | | |
| Subscriptions | 37,501,046 | 356,509,812 | 28,471,007 | 284,635,649 |
| Distributions reinvested | 1,404,912 | 12,660,249 | 612,275 | 6,183,975 |
| Redemptions | (22,037,346) | (203,937,393) | (6,045,520) | (59,899,825) |
| Net increase | 16,868,612 | 165,232,668 | 23,037,762 | 230,919,799 |
| Institutional 2 Class | | | | |
| Subscriptions | 58,444,628 | 534,350,296 | 5,005,130 | 52,263,079 |
| Distributions reinvested | 1,395,264 | 11,881,874 | 103,588 | 1,041,062 |
| Redemptions | (8,493,058) | (76,627,116) | (1,977,083) | (19,906,842) |
| Net increase | 51,346,834 | 469,605,054 | 3,131,635 | 33,397,299 |
| Institutional 3 Class | | | | |
| Subscriptions | 11,498,746 | 110,803,219 | 35,689,701 | 318,614,140 |
| Distributions reinvested | 881,444 | 7,891,406 | 1,148,354 | 11,552,438 |
| Redemptions | (18,347,804) | (186,649,689) | (5,552,234) | (54,174,936) |
| Net increase (decrease) | (5,967,614) | (67,955,064) | 31,285,821 | 275,991,642 |
| Class K | | | | |
| Distributions reinvested | — | — | 455 | 4,598 |
| Redemptions | (14,117) | (147,944) | (2,685) | (23,369) |
| Net decrease | (14,117) | (147,944) | (2,230) | (18,771) |
| Class R | | | | |
| Subscriptions | 452,712 | 4,200,572 | 296,916 | 2,953,920 |
| Distributions reinvested | 12,449 | 109,035 | 6,260 | 61,720 |
| Redemptions | (121,077) | (1,105,947) | (113,897) | (1,089,331) |
| Net increase | 344,084 | 3,203,660 | 189,279 | 1,926,309 |
The accompanying Notes to Financial Statements are an integral part of this statement.
Columbia Overseas Value Fund | Annual Report 2019
| 19 |
Statement of Changes in Net Assets (continued)
| | Year Ended | Year Ended |
| | February 28, 2019 | February 28, 2018 |
| | Shares | Dollars ($) | Shares | Dollars ($) |
| Class T | | | | |
| Subscriptions | — | — | 12,187 | 105,694 |
| Distributions reinvested | 1,259 | 12,568 | 3,506 | 35,304 |
| Redemptions | (99,744) | (885,240) | (2,697,739) | (23,784,453) |
| Net decrease | (98,485) | (872,672) | (2,682,046) | (23,643,455) |
| Total net increase | 74,470,442 | 691,732,292 | 35,854,649 | 374,877,174 |
The accompanying Notes to Financial Statements are an integral part of this statement.
| 20 | Columbia Overseas Value Fund | Annual Report 2019 |
[THIS PAGE INTENTIONALLY LEFT BLANK]
Columbia Overseas Value Fund | Annual Report 2019
| 21 |
The following table is intended to help you understand the Fund’s financial performance. Certain information reflects financial results for a single share of a class held for the periods shown. Per share net investment income (loss) amounts are calculated based on average shares outstanding during the period. Total return assumes reinvestment of all dividends and distributions, if any. Total return does not reflect payment of sales charges, if any. Total return and portfolio turnover are not annualized for periods of less than one year. The portfolio turnover rate is calculated without regard to purchase and sales transactions of short-term instruments and certain derivatives, if any. If such transactions were included, the Fund’s portfolio turnover rate may be higher.
| | Net asset value,
beginning of
period | Net
investment
income | Net
realized
and
unrealized
gain (loss) | Total from
investment
operations | Distributions
from net
investment
income | Distributions
from net
realized
gains | Tax
return of
capital | Total
distributions to
shareholders |
| Class A |
| Year Ended 2/28/2019 | $10.37 | 0.20 | (1.03) | (0.83) | (0.13) | (0.17) | — | (0.30) |
| Year Ended 2/28/2018 | $8.52 | 0.14 | 2.04 | 2.18 | (0.15) | (0.18) | — | (0.33) |
| Year Ended 2/28/2017 | $7.46 | 0.17 | 1.04 | 1.21 | (0.15) | — | — | (0.15) |
| Year Ended 2/29/2016 | $8.65 | 0.16 | (1.18) | (1.02) | (0.17) | — | — | (0.17) |
| Year Ended 2/28/2015 | $9.20 | 0.20 | (0.49) | (0.29) | (0.26) | — | (0.00)(h) | (0.26) |
| Advisor Class |
| Year Ended 2/28/2019 | $10.35 | 0.20 | (1.02) | (0.82) | (0.15) | (0.17) | — | (0.32) |
| Year Ended 2/28/2018 | $8.49 | 0.15 | 2.06 | 2.21 | (0.17) | (0.18) | — | (0.35) |
| Year Ended 2/28/2017 | $7.43 | 0.12 | 1.10 | 1.22 | (0.16) | — | — | (0.16) |
| Year Ended 2/29/2016(i) | $8.78 | 0.01 | (1.17) | (1.16) | (0.19) | — | — | (0.19) |
| Class C |
| Year Ended 2/28/2019 | $10.31 | 0.13 | (1.02) | (0.89) | (0.05) | (0.17) | — | (0.22) |
| Year Ended 2/28/2018 | $8.48 | 0.06 | 2.04 | 2.10 | (0.09) | (0.18) | — | (0.27) |
| Year Ended 2/28/2017 | $7.44 | 0.06 | 1.08 | 1.14 | (0.10) | — | — | (0.10) |
| Year Ended 2/29/2016 | $8.64 | 0.09 | (1.17) | (1.08) | (0.12) | — | — | (0.12) |
| Year Ended 2/28/2015 | $9.18 | 0.13 | (0.47) | (0.34) | (0.20) | — | (0.00)(h) | (0.20) |
| Institutional Class |
| Year Ended 2/28/2019 | $10.38 | 0.21 | (1.02) | (0.81) | (0.15) | (0.17) | — | (0.32) |
| Year Ended 2/28/2018 | $8.53 | 0.15 | 2.05 | 2.20 | (0.17) | (0.18) | — | (0.35) |
| Year Ended 2/28/2017 | $7.46 | 0.12 | 1.11 | 1.23 | (0.16) | — | — | (0.16) |
| Year Ended 2/29/2016 | $8.66 | 0.10 | (1.11) | (1.01) | (0.19) | — | — | (0.19) |
| Year Ended 2/28/2015 | $9.20 | 0.23 | (0.48) | (0.25) | (0.29) | — | (0.00)(h) | (0.29) |
| Institutional 2 Class |
| Year Ended 2/28/2019 | $10.33 | 0.14 | (0.94) | (0.80) | (0.16) | (0.17) | — | (0.33) |
| Year Ended 2/28/2018 | $8.48 | 0.18 | 2.03 | 2.21 | (0.18) | (0.18) | — | (0.36) |
| Year Ended 2/28/2017 | $7.42 | 0.15 | 1.09 | 1.24 | (0.18) | — | — | (0.18) |
| Year Ended 2/29/2016(k) | $8.78 | 0.02 | (1.18) | (1.16) | (0.20) | — | — | (0.20) |
| Institutional 3 Class |
| Year Ended 2/28/2019 | $10.35 | 0.23 | (1.03) | (0.80) | (0.17) | (0.17) | — | (0.34) |
| Year Ended 2/28/2018 | $8.49 | 0.21 | 2.02 | 2.23 | (0.19) | (0.18) | — | (0.37) |
| Year Ended 2/28/2017 | $7.42 | 0.07 | 1.18 | 1.25 | (0.18) | — | — | (0.18) |
| Year Ended 2/29/2016(l) | $8.78 | 0.07 | (1.22) | (1.15) | (0.21) | — | — | (0.21) |
The accompanying Notes to Financial Statements are an integral part of this statement.
| 22 | Columbia Overseas Value Fund | Annual Report 2019 |
Financial Highlights (continued)
| | Net
asset
value,
end of
period | Total
return | Total gross
expense
ratio to
average
net assets(a) | Total net
expense
ratio to
average
net assets(a),(b) | Net investment
income
ratio to
average
net assets | Portfolio
turnover | Net
assets,
end of
period
(000’s) |
| Class A |
| Year Ended 2/28/2019 | $9.24 | (7.96%) | 1.29%(c),(d) | 1.25%(c),(d),(e) | 2.10% | 58% | $341,198 |
| Year Ended 2/28/2018 | $10.37 | 25.72% | 1.36%(f) | 1.36%(e),(f) | 1.41% | 47% | $363,817 |
| Year Ended 2/28/2017 | $8.52 | 16.25% | 1.45%(g) | 1.45%(g) | 2.13% | 89% | $243,879 |
| Year Ended 2/29/2016 | $7.46 | (11.95%) | 1.44% | 1.44%(e) | 1.93% | 68% | $171,630 |
| Year Ended 2/28/2015 | $8.65 | (2.92%) | 1.40% | 1.40%(e) | 2.32% | 74% | $188,171 |
| Advisor Class |
| Year Ended 2/28/2019 | $9.21 | (7.80%) | 1.04%(c),(d) | 0.99%(c),(d),(e) | 2.10% | 58% | $161,150 |
| Year Ended 2/28/2018 | $10.35 | 26.18% | 1.11%(f) | 1.10%(e),(f) | 1.47% | 47% | $78,634 |
| Year Ended 2/28/2017 | $8.49 | 16.55% | 1.20%(g) | 1.20%(g) | 1.48% | 89% | $23,666 |
| Year Ended 2/29/2016(i) | $7.43 | (13.43%) | 1.23%(j) | 1.21%(e),(j) | 0.22%(j) | 68% | $1,425 |
| Class C |
| Year Ended 2/28/2019 | $9.20 | (8.60%) | 2.04%(c),(d) | 2.00%(c),(d),(e) | 1.41% | 58% | $42,165 |
| Year Ended 2/28/2018 | $10.31 | 24.87% | 2.11%(f) | 2.10%(e),(f) | 0.61% | 47% | $44,594 |
| Year Ended 2/28/2017 | $8.48 | 15.32% | 2.20%(g) | 2.20%(g) | 0.80% | 89% | $20,829 |
| Year Ended 2/29/2016 | $7.44 | (12.66%) | 2.19% | 2.19%(e) | 1.08% | 68% | $5,345 |
| Year Ended 2/28/2015 | $8.64 | (3.60%) | 2.16% | 2.16%(e) | 1.54% | 74% | $4,597 |
| Institutional Class |
| Year Ended 2/28/2019 | $9.25 | (7.69%) | 1.04%(c),(d) | 1.00%(c),(d),(e) | 2.23% | 58% | $432,061 |
| Year Ended 2/28/2018 | $10.38 | 25.94% | 1.11%(f) | 1.10%(e),(f) | 1.46% | 47% | $309,845 |
| Year Ended 2/28/2017 | $8.53 | 16.63% | 1.20%(g) | 1.20%(g) | 1.52% | 89% | $57,964 |
| Year Ended 2/29/2016 | $7.46 | (11.87%) | 1.22% | 1.20%(e) | 1.25% | 68% | $3,660 |
| Year Ended 2/28/2015 | $8.66 | (2.56%) | 1.16% | 1.16%(e) | 2.64% | 74% | $340 |
| Institutional 2 Class |
| Year Ended 2/28/2019 | $9.20 | (7.61%) | 0.96%(c),(d) | 0.88%(c),(d) | 1.58% | 58% | $533,584 |
| Year Ended 2/28/2018 | $10.33 | 26.23% | 0.99%(f) | 0.98%(f) | 1.82% | 47% | $68,822 |
| Year Ended 2/28/2017 | $8.48 | 16.79% | 0.98%(g) | 0.98%(g) | 1.82% | 89% | $29,936 |
| Year Ended 2/29/2016(k) | $7.42 | (13.41%) | 1.04%(j) | 1.04%(j) | 0.45%(j) | 68% | $768 |
| Institutional 3 Class |
| Year Ended 2/28/2019 | $9.21 | (7.64%) | 0.89%(c),(d) | 0.85%(c),(d) | 2.36% | 58% | $248,248 |
| Year Ended 2/28/2018 | $10.35 | 26.37% | 0.94%(f) | 0.93%(f) | 2.08% | 47% | $340,651 |
| Year Ended 2/28/2017 | $8.49 | 16.95% | 0.95%(g) | 0.95%(g) | 0.85% | 89% | $13,916 |
| Year Ended 2/29/2016(l) | $7.42 | (13.34%) | 0.92%(j) | 0.92%(j) | 1.26%(j) | 68% | $2 |
The accompanying Notes to Financial Statements are an integral part of this statement.
Columbia Overseas Value Fund | Annual Report 2019
| 23 |
Financial Highlights (continued)
| | Net asset value,
beginning of
period | Net
investment
income | Net
realized
and
unrealized
gain (loss) | Total from
investment
operations | Distributions
from net
investment
income | Distributions
from net
realized
gains | Tax
return of
capital | Total
distributions to
shareholders |
| Class R |
| Year Ended 2/28/2019 | $10.13 | 0.15 | (0.99) | (0.84) | (0.10) | (0.17) | — | (0.27) |
| Year Ended 2/28/2018 | $8.33 | 0.08 | 2.03 | 2.11 | (0.13) | (0.18) | — | (0.31) |
| Year Ended 2/28/2017(m) | $7.46 | 0.06 | 0.94 | 1.00 | (0.13) | — | — | (0.13) |
| Notes to Financial Highlights |
| (a) | In addition to the fees and expenses that the Fund bears directly, the Fund indirectly bears a pro rata share of the fees and expenses of any other funds in which it invests. Such indirect expenses are not included in the Fund’s reported expense ratios. |
| (b) | Total net expenses include the impact of certain fee waivers/expense reimbursements made by the Investment Manager and certain of its affiliates, if applicable. |
| (c) | Ratios include interest on collateral expense which is less than 0.01%. |
| (d) | Ratios include interfund lending expense which is less than 0.01%. |
| (e) | The benefits derived from expense reductions had an impact of less than 0.01%. |
| (f) | Ratios include line of credit interest expense which is less than 0.01%. |
| (g) | Expenses have been reduced due to a reimbursement of expenses overbilled by a third party. If the reimbursement had been excluded, the expense ratios would have been higher by the percentages shown for each class in the table below. All fee waivers and expense reimbursements by the Investment Manager and its affiliates were applied before giving effect to this third party reimbursement. |
| Year Ended | Class A | Advisor
Class | Class C | Institutional
Class | Institutional 2
Class | Institutional 3
Class | Class R |
| 02/28/2017 | 0.01% | 0.02% | 0.02% | 0.02% | 0.02% | 0.03% | 0.02% |
| (h) | Rounds to zero. |
| (i) | Advisor Class shares commenced operations on July 1, 2015. Per share data and total return reflect activity from that date. |
| (j) | Annualized. |
| (k) | Institutional 2 Class shares commenced operations on July 1, 2015. Per share data and total return reflect activity from that date. |
| (l) | Institutional 3 Class shares commenced operations on July 1, 2015. Per share data and total return reflect activity from that date. |
| (m) | Class R shares commenced operations on March 1, 2016. Per share data and total return reflect activity from that date. |
The accompanying Notes to Financial Statements are an integral part of this statement.
| 24 | Columbia Overseas Value Fund | Annual Report 2019 |
Financial Highlights (continued)
| | Net
asset
value,
end of
period | Total
return | Total gross
expense
ratio to
average
net assets(a) | Total net
expense
ratio to
average
net assets(a),(b) | Net investment
income
ratio to
average
net assets | Portfolio
turnover | Net
assets,
end of
period
(000’s) |
| Class R |
| Year Ended 2/28/2019 | $9.02 | (8.20%) | 1.55%(c),(d) | 1.49%(c),(d),(e) | 1.57% | 58% | $5,864 |
| Year Ended 2/28/2018 | $10.13 | 25.46% | 1.61%(f) | 1.59%(e),(f) | 0.80% | 47% | $3,099 |
| Year Ended 2/28/2017(m) | $8.33 | 13.47% | 1.70%(g),(j) | 1.70%(g),(j) | 0.72%(j) | 89% | $972 |
The accompanying Notes to Financial Statements are an integral part of this statement.
Columbia Overseas Value Fund | Annual Report 2019
| 25 |
Notes to Financial Statements
February 28, 2019
Note 1. Organization
Columbia Overseas Value Fund (the Fund), a series of Columbia Funds Series Trust (the Trust), is a diversified fund. The Trust is registered under the Investment Company Act of 1940, as amended (the 1940 Act), as an open-end management investment company organized as a Delaware statutory trust.
Fund shares
The Trust may issue an unlimited number of shares (without par value). Although all share classes generally have identical voting, dividend and liquidation rights, each share class votes separately when required by the Trust’s organizational documents or by law. Different share classes pay different distribution amounts to the extent the expenses of such share classes differ, and distributions in liquidation will be proportional to the net asset value of each share class. Each share class has its own expense and sales charge structure. The Fund offers each of the share classes identified below.
Class A shares are subject to a maximum front-end sales charge of 5.75% based on the initial investment amount. Class A shares purchased without an initial sales charge in accounts aggregating $1 million to $50 million at the time of purchase are subject to a contingent deferred sales charge (CDSC) if the shares are sold within 18 months after purchase, charged as follows: 1.00% CDSC if redeemed within 12 months after purchase, and 0.50% CDSC if redeemed more than 12, but less than 18, months after purchase.
Advisor Class shares are not subject to sales charges and are generally available only to omnibus retirement plans and certain investors as described in the Fund’s prospectus.
Class C shares are subject to a 1.00% CDSC on shares redeemed within 12 months after purchase. Effective July 1, 2018, Class C shares automatically convert to Class A shares of the same Fund in the month of or the month following the 10-year anniversary of the Class C shares purchase date.
Institutional Class shares are not subject to sales charges and are generally available only to eligible investors, which are subject to different investment minimums as described in the Fund’s prospectus.
Institutional 2 Class shares are not subject to sales charges and are generally available only to investors purchasing through authorized investment professionals and omnibus retirement plans as described in the Fund’s prospectus.
Institutional 3 Class shares are not subject to sales charges and are available to institutional and certain other investors as described in the Fund’s prospectus.
The Fund no longer accepts investments by existing investors in Class K shares. When available, Class K shares were not subject to sales charges and were made available only to existing investors in Class K shares. On March 9, 2018, Class K shares were redeemed or exchanged for Advisor Class shares of the Fund in a tax free transaction that had no impact on fees and expenses paid by the shareholders.
Class R shares are not subject to sales charges and are generally available only to certain retirement plans and other investors as described in the Fund’s prospectus.
Class T shares were subject to a maximum front-end sales charge of 2.50% per transaction and were required to be purchased through financial intermediaries that, by written agreement with Columbia Management Investment Distributors, Inc., were specifically authorized to sell Class T shares. Effective at the close of business on December 14, 2018, Class T shares merged, in a tax-free transaction, into Class A shares of the Fund and are no longer offered for sale.
Note 2. Summary of significant accounting policies
Basis of preparation
The Fund is an investment company that applies the accounting and reporting guidance in the Financial Accounting Standards Board (FASB) Accounting Standards Codification Topic 946,Financial Services - Investment Companies (ASC 946). The financial statements are prepared in accordance with U.S. generally accepted accounting principles (GAAP), which
| 26 | Columbia Overseas Value Fund | Annual Report 2019 |
Notes to Financial Statements (continued)
February 28, 2019
requires management to make certain estimates and assumptions that affect the reported amounts of assets and liabilities, the disclosure of contingent assets and liabilities at the date of the financial statements and the reported amounts of income and expenses during the reporting period. Actual results could differ from those estimates.
The following is a summary of significant accounting policies followed by the Fund in the preparation of its financial statements.
Security valuation
All equity securities and exchange-traded funds are valued at the close of business of the New York Stock Exchange. Equity securities and exchange-traded funds are valued at the last quoted sales price on the principal exchange or market on which they trade, except for securities traded on the NASDAQ Stock Market, which are valued at the NASDAQ official close price. Unlisted securities or listed securities for which there were no sales during the day are valued at the mean of the latest quoted bid and ask prices on such exchanges or markets.
Foreign equity securities are valued based on the closing price on the foreign exchange in which such securities are primarily traded. If any foreign equity security closing prices are not readily available, the securities are valued at the mean of the latest quoted bid and ask prices on such exchanges or markets. Foreign currency exchange rates are generally determined at 4:00 p.m. Eastern (U.S.) time. Many securities markets and exchanges outside the U.S. close prior to the close of the New York Stock Exchange; therefore, the closing prices for securities in such markets or on such exchanges may not fully reflect events that occur after such close but before the close of the New York Stock Exchange. In those situations, foreign securities will be fair valued pursuant to a policy adopted by the Board of Trustees, including, if available, utilizing a third party pricing service to determine these fair values. The third party pricing service takes into account multiple factors, including, but not limited to, movements in the U.S. securities markets, certain depositary receipts, futures contracts and foreign exchange rates that have occurred subsequent to the close of the foreign exchange or market, to determine a good faith estimate that reasonably reflects the current market conditions as of the close of the New York Stock Exchange. The fair value of a security is likely to be different from the quoted or published price, if available.
Investments in open-end investment companies, including money market funds, are valued at their latest net asset value.
Forward foreign currency exchange contracts are marked-to-market based upon foreign currency exchange rates provided by a pricing service.
Option contracts are valued at the mean of the latest quoted bid and ask prices on their primary exchanges. Option contracts, including over-the-counter option contracts, with no readily available market quotations are valued using quotes obtained from independent brokers as of the close of the New York Stock Exchange.
Investments for which market quotations are not readily available, or that have quotations which management believes are not reflective of market value or reliable, are valued at fair value as determined in good faith under procedures approved by and under the general supervision of the Board of Trustees. If a security or class of securities (such as foreign securities) is valued at fair value, such value is likely to be different from the quoted or published price for the security.
The determination of fair value often requires significant judgment. To determine fair value, management may use assumptions including but not limited to future cash flows and estimated risk premiums. Multiple inputs from various sources may be used to determine fair value.
GAAP requires disclosure regarding the inputs and valuation techniques used to measure fair value and any changes in valuation inputs or techniques. In addition, investments shall be disclosed by major category. This information is disclosed following the Fund’s Portfolio of Investments.
Foreign currency transactions and translations
The values of all assets and liabilities denominated in foreign currencies are generally translated into U.S. dollars at exchange rates determined at the close of regular trading on the New York Stock Exchange. Net realized and unrealized gains (losses) on foreign currency transactions and translations include gains (losses) arising from the fluctuation in exchange
Columbia Overseas Value Fund | Annual Report 2019
| 27 |
Notes to Financial Statements (continued)
February 28, 2019
rates between trade and settlement dates on securities transactions, gains (losses) arising from the disposition of foreign currency and currency gains (losses) between the accrual and payment dates on dividends, interest income and foreign withholding taxes.
For financial statement purposes, the Fund does not distinguish that portion of gains (losses) on investments which is due to changes in foreign exchange rates from that which is due to changes in market prices of the investments. Such fluctuations are included with the net realized and unrealized gains (losses) on investments in the Statement of Operations.
Derivative instruments
The Fund invests in certain derivative instruments, as detailed below, to meet its investment objectives. Derivatives are instruments whose values depend on, or are derived from, in whole or in part, the value of one or more securities, currencies, commodities, indices, or other assets or instruments. Derivatives may be used to increase investment flexibility (including to maintain cash reserves while maintaining desired exposure to certain assets), for risk management (hedging) purposes, to facilitate trading, to reduce transaction costs and to pursue higher investment returns. The Fund may also use derivative instruments to mitigate certain investment risks, such as foreign currency exchange rate risk, interest rate risk and credit risk. Derivatives may involve various risks, including the potential inability of the counterparty to fulfill its obligations under the terms of the contract, the potential for an illiquid secondary market (making it difficult for the Fund to sell or terminate, including at favorable prices) and the potential for market movements which may expose the Fund to gains or losses in excess of the amount shown in the Statement of Assets and Liabilities. The notional amounts of derivative instruments, if applicable, are not recorded in the financial statements.
A derivative instrument may suffer a marked-to-market loss if the value of the contract decreases due to an unfavorable change in the market rates or values of the underlying instrument. Losses can also occur if the counterparty does not perform its obligations under the contract. The Fund’s risk of loss from counterparty credit risk on over-the-counter derivatives is generally limited to the aggregate unrealized gain netted against any collateral held by the Fund and the amount of any variation margin held by the counterparty, plus any replacement costs or related amounts. With exchange-traded or centrally cleared derivatives, there is reduced counterparty credit risk to the Fund since the clearinghouse or central counterparty (CCP) provides some protection in the case of clearing member default. The clearinghouse or CCP stands between the buyer and the seller of the contract; therefore, additional counterparty credit risk is failure of the clearinghouse or CCP. However, credit risk still exists in exchange-traded or centrally cleared derivatives with respect to initial and variation margin that is held in a broker’s customer account. While brokers are required to segregate customer margin from their own assets, in the event that a broker becomes insolvent or goes into bankruptcy and at that time there is a shortfall in the aggregate amount of margin held by the broker for all its clients, U.S. bankruptcy laws will typically allocate that shortfall on a pro-rata basis across all the broker’s customers (including the Fund), potentially resulting in losses to the Fund.
In order to better define its contractual rights and to secure rights that will help the Fund mitigate its counterparty risk, the Fund may enter into an International Swaps and Derivatives Association, Inc. Master Agreement (ISDA Master Agreement) or similar agreement with its derivatives contract counterparties. An ISDA Master Agreement is an agreement between the Fund and a counterparty that governs over-the-counter derivatives and typically contains, among other things, collateral posting terms and netting provisions in the event of a default and/or termination event. Under an ISDA Master Agreement, the Fund may, under certain circumstances, offset with the counterparty certain derivative instrument’s payables and/or receivables with collateral held and/or posted and create one single net payment. The provisions of the ISDA Master Agreement typically permit a single net payment in the event of default (close-out netting), including the bankruptcy or insolvency of the counterparty. Note, however, that bankruptcy or insolvency laws of a particular jurisdiction may impose restrictions on or prohibitions against the right of offset or netting in bankruptcy, insolvency or other events.
Collateral (margin) requirements differ by type of derivative. Margin requirements are established by the clearinghouse or CCP for exchange-traded and centrally cleared derivatives. Brokers can ask for margin in excess of the minimum in certain circumstances. Collateral terms are contract specific for over-the-counter derivatives. For over-the-counter derivatives traded under an ISDA Master Agreement, the collateral requirements are typically calculated by netting the marked-to-market amount for each transaction under such agreement and comparing that amount to the value of any variation margin currently pledged by the Fund and/or the counterparty. Generally, the amount of collateral due from or to a party has to exceed a minimum transfer amount threshold (e.g., $250,000) before a transfer has to be made. To the extent amounts due to the Fund from its counterparties are not fully collateralized, contractually or otherwise, the Fund bears the risk of loss from counterparty
| 28 | Columbia Overseas Value Fund | Annual Report 2019 |
Notes to Financial Statements (continued)
February 28, 2019
nonperformance. The Fund may also pay interest expense on cash collateral received from the broker. Any interest expense paid by the Fund is shown on the Statement of Operations. The Fund attempts to mitigate counterparty risk by only entering into agreements with counterparties that it believes have the financial resources to honor their obligations and by monitoring the financial stability of those counterparties.
Certain ISDA Master Agreements allow counterparties of over-the-counter derivatives transactions to terminate derivatives contracts prior to maturity in the event the Fund’s net asset value declines by a stated percentage over a specified time period or if the Fund fails to meet certain terms of the ISDA Master Agreement, which would cause the Fund to accelerate payment of any net liability owed to the counterparty. The Fund also has termination rights if the counterparty fails to meet certain terms of the ISDA Master Agreement. In determining whether to exercise such termination rights, the Fund would consider, in addition to counterparty credit risk, whether termination would result in a net liability owed from the counterparty.
For financial reporting purposes, the Fund does not offset derivative assets and derivative liabilities that are subject to netting arrangements in the Statement of Assets and Liabilities.
Forward foreign currency exchange contracts
Forward foreign currency exchange contracts are over-the-counter agreements between two parties to buy and sell a currency at a set price on a future date. The Fund utilized forward foreign currency exchange contracts to hedge the currency exposure associated with some or all of the Fund’s securities, to shift investment exposure from one currency to another, to shift U.S. dollar exposure to achieve a representative weighted mix of major currencies in its benchmark and/or to recover an underweight country exposure in its portfolio. These instruments may be used for other purposes in future periods.
The values of forward foreign currency exchange contracts fluctuate daily with changes in foreign currency exchange rates. Changes in the value of these contracts are recorded as unrealized appreciation or depreciation until the contract is exercised or has expired. The Fund will realize a gain or loss when the forward foreign currency exchange contract is closed or expires. Non-deliverable forward foreign currency exchange contracts are settled with the counterparty in U.S. Dollars without delivery of foreign currency.
The use of forward foreign currency exchange contracts does not eliminate fluctuations in the prices of the Fund’s portfolio securities. The risks of forward foreign currency exchange contracts include movement in the values of the foreign currencies relative to the U.S. dollar (or other foreign currencies) and the possibility that counterparties will not complete their contractual obligations, which may be in excess of the amount reflected, if any, in the Statement of Assets and Liabilities.
Futures contracts
Futures contracts are exchange-traded and represent commitments for the future purchase or sale of an asset at a specified price on a specified date. The Fund bought and sold futures contracts to maintain appropriate equity market exposure while keeping sufficient cash to accommodate daily redemptions. These instruments may be used for other purposes in future periods. Upon entering into futures contracts, the Fund bears risks that it may not achieve the anticipated benefits of the futures contracts and may realize a loss. Additional risks include counterparty credit risk, the possibility of an illiquid market, and that a change in the value of the contract or option may not correlate with changes in the value of the underlying asset.
Upon entering into a futures contract, the Fund deposits cash or securities with the broker, known as a futures commission merchant (FCM), in an amount sufficient to meet the initial margin requirement. The initial margin deposit must be maintained at an established level over the life of the contract. Cash deposited as initial margin is recorded in the Statement of Assets and Liabilities as margin deposits. Securities deposited as initial margin are designated in the Portfolio of Investments. Subsequent payments (variation margin) are made or received by the Fund each day. The variation margin payments are equal to the daily change in the contract value and are recorded as variation margin receivable or payable and are offset in unrealized gains or losses. The Fund recognizes a realized gain or loss when the contract is closed or expires. Futures contracts involve, to varying degrees, risk of loss in excess of the variation margin disclosed in the Statement of Assets and Liabilities.
Columbia Overseas Value Fund | Annual Report 2019
| 29 |
Notes to Financial Statements (continued)
February 28, 2019
Options contracts
Options are contracts which entitle the holder to purchase or sell securities or other identified assets at a specified price, or in the case of index option contracts, to receive or pay the difference between the index value and the strike price of the index option contract. Option contracts can be either exchange-traded or over-the-counter. The Fund purchased and wrote option contracts to decrease the Fund’s exposure to equity market risk, to increase return on investments and to facilitate buying and selling of securities for investments. These instruments may be used for other purposes in future periods. Completion of transactions for option contracts traded in the over-the-counter market depends upon the performance of the other party. Cash collateral may be collected or posted by the Fund to secure certain over-the-counter option contract trades. Cash collateral held or posted by the Fund for such option contract trades must be returned to the broker or the Fund upon closure, exercise or expiration of the contract.
Options contracts purchased are recorded as investments. When the Fund writes an options contract, the premium received is recorded as an asset and an amount equivalent to the premium is recorded as a liability in the Statement of Assets and Liabilities and is subsequently adjusted to reflect the current fair value of the option written. Changes in the fair value of the written option are recorded as unrealized appreciation or depreciation until the contract is exercised or has expired. The Fund will realize a gain or loss when the option contract is closed or expires. When option contracts are exercised, the proceeds on sales for a written call or purchased put option contract, or the purchase cost for a written put or purchased call option contract, is adjusted by the amount of premium received or paid.
For over-the-counter options purchased, the Fund bears the risk of loss of the amount of the premiums paid plus the positive change in market values net of any collateral held by the Fund should the counterparty fail to perform under the contracts. Option contracts written by the Fund do not typically give rise to significant counterparty credit risk, as options written generally obligate the Fund and not the counterparty to perform. The risk in writing a call option contract is that the Fund gives up the opportunity for profit if the market price of the security increases above the strike price and the option contract is exercised. The risk in writing a put option contract is that the Fund may incur a loss if the market price of the security decreases below the strike price and the option contract is exercised. Exercise of a written option could result in the Fund purchasing or selling a security or foreign currency when it otherwise would not, or at a price different from the current market value. In purchasing and writing options, the Fund bears the risk of an unfavorable change in the value of the underlying instrument or the risk that the Fund may not be able to enter into a closing transaction due to an illiquid market.
Effects of derivative transactions in the financial statements
The following tables are intended to provide additional information about the effect of derivatives on the financial statements of the Fund, including: the fair value of derivatives by risk category and the location of those fair values in the Statement of Assets and Liabilities; and the impact of derivative transactions over the period in the Statement of Operations, including realized and unrealized gains (losses). The derivative instrument schedules following the Portfolio of Investments present additional information regarding derivative instruments outstanding at the end of the period, if any.
The following table is a summary of the fair value of derivative instruments (not considered to be hedging instruments for accounting disclosure purposes) at February 28, 2019:
| | Asset derivatives | |
Risk exposure
category | Statement
of assets and liabilities
location | Fair value ($) |
| Equity risk | Investments, at value — Options Purchased | 700,575 |
| Foreign exchange risk | Unrealized appreciation on forward foreign currency exchange contracts | 341,000 |
| Total | | 1,041,575 |
| 30 | Columbia Overseas Value Fund | Annual Report 2019 |
Notes to Financial Statements (continued)
February 28, 2019
| | Liability derivatives | |
Risk exposure
category | Statement
of assets and liabilities
location | Fair value ($) |
| Equity risk | Options contracts written, at value | 70,002 |
| Foreign exchange risk | Unrealized depreciation on forward foreign currency exchange contracts | 2,071,597 |
| Total | | 2,141,599 |
The following table indicates the effect of derivative instruments (not considered to be hedging instruments for accounting disclosure purposes) in the Statement of Operations for the year ended February 28, 2019:
| Amount of realized gain (loss) on derivatives recognized in income |
| Risk exposure category | Forward
foreign
currency
exchange
contracts
($) | Futures
contracts
($) | Options
contracts
written
($) | Options
contracts
purchased
($) | Total
($) |
| Equity risk | — | (631,975) | 418,347 | (1,066,885) | (1,280,513) |
| Foreign exchange risk | (2,019,913) | — | — | — | (2,019,913) |
| Total | (2,019,913) | (631,975) | 418,347 | (1,066,885) | (3,300,426) |
| Change in unrealized appreciation (depreciation) on derivatives recognized in income |
| Risk exposure category | Forward
foreign
currency
exchange
contracts
($) | Options
contracts
written
($) | Options
contracts
purchased
($) | Total
($) |
| Equity risk | — | (249) | (519,237) | (519,486) |
| Foreign exchange risk | (3,198,463) | — | — | (3,198,463) |
| Total | (3,198,463) | (249) | (519,237) | (3,717,949) |
The following table is a summary of the average outstanding volume by derivative instrument for the year ended February 28, 2019:
| Derivative instrument | Average notional
amounts ($)* |
| Futures contracts — long | 520,792 |
| Derivative instrument | Average
value ($)** |
| Options contracts — purchased | 234,984 |
| Options contracts — written | (59,507) |
| Derivative instrument | Average unrealized
appreciation ($)** | Average unrealized
depreciation ($)** |
| Forward foreign currency exchange contracts | 1,202,322 | (1,384,765) |
| * | Based on the ending daily outstanding amounts for the year ended February 28, 2019. |
| ** | Based on the ending quarterly outstanding amounts for the year ended February 28, 2019. |
Columbia Overseas Value Fund | Annual Report 2019
| 31 |
Notes to Financial Statements (continued)
February 28, 2019
Offsetting of assets and liabilities
The following table presents the Fund’s gross and net amount of assets and liabilities available for offset under netting arrangements as well as any related collateral received or pledged by the Fund as of February 28, 2019:
| | Deutsche
Bank ($) | Goldman
Sachs ($) | Total ($) |
| Assets | | | |
| Forward foreign currency exchange contracts | - | 341,000 | 341,000 |
| Options purchased calls | 700,575 | - | 700,575 |
| Total assets | 700,575 | 341,000 | 1,041,575 |
| Liabilities | | | |
| Forward foreign currency exchange contracts | - | 2,071,597 | 2,071,597 |
| Options contracts written | 70,002 | - | 70,002 |
| Total liabilities | 70,002 | 2,071,597 | 2,141,599 |
| Total financial and derivative net assets | 630,573 | (1,730,597) | (1,100,024) |
| Total collateral received (pledged)(a) | - | (100,000) | (100,000) |
| Net amount(b) | 630,573 | (1,630,597) | (1,000,024) |
| (a) | In some instances, the actual collateral received and/or pledged may be more than the amount shown due to overcollateralization. |
| (b) | Represents the net amount due from/(to) counterparties in the event of default. |
Security transactions
Security transactions are accounted for on the trade date. Cost is determined and gains (losses) are based upon the specific identification method for both financial statement and federal income tax purposes.
Income recognition
Corporate actions and dividend income are generally recorded net of any non-reclaimable tax withholdings, on the ex-dividend date or upon receipt of ex-dividend notification in the case of certain foreign securities.
The Fund may receive distributions from holdings in equity securities, business development companies (BDCs), exchange-traded funds (ETFs), limited partnerships (LPs), other regulated investment companies (RICs), and real estate investment trusts (REITs), which report information on the tax character of their distributions annually. These distributions are allocated to dividend income, capital gain and return of capital based on actual information reported. Return of capital is recorded as a reduction of the cost basis of securities held. If the Fund no longer owns the applicable securities, return of capital is recorded as a realized gain. With respect to REITs, to the extent actual information has not yet been reported, estimates for return of capital are made by the Fund’s management. Management’s estimates are subsequently adjusted when the actual character of the distributions is disclosed by the REITs, which could result in a proportionate change in return of capital to shareholders.
Awards from class action litigation are recorded as a reduction of cost basis if the Fund still owns the applicable securities on the payment date. If the Fund no longer owns the applicable securities, the proceeds are recorded as realized gains.
Expenses
General expenses of the Trust are allocated to the Fund and other funds of the Trust based upon relative net assets or other expense allocation methodologies determined by the nature of the expense. Expenses directly attributable to the Fund are charged to the Fund. Expenses directly attributable to a specific class of shares are charged to that share class.
Determination of class net asset value
All income, expenses (other than class-specific expenses, which are charged to that share class, as shown in the Statement of Operations) and realized and unrealized gains (losses) are allocated to each class of the Fund on a daily basis, based on the relative net assets of each class, for purposes of determining the net asset value of each class.
| 32 | Columbia Overseas Value Fund | Annual Report 2019 |
Notes to Financial Statements (continued)
February 28, 2019
Federal income tax status
The Fund intends to qualify each year as a regulated investment company under Subchapter M of the Internal Revenue Code, as amended, and will distribute substantially all of its investment company taxable income and net capital gain, if any, for its tax year, and as such will not be subject to federal income taxes. In addition, the Fund intends to distribute in each calendar year substantially all of its ordinary income, capital gain net income and certain other amounts, if any, such that the Fund should not be subject to federal excise tax. Therefore, no federal income or excise tax provision is recorded.
Foreign taxes
The Fund may be subject to foreign taxes on income, gains on investments or currency repatriation, a portion of which may be recoverable. The Fund will accrue such taxes and recoveries, as applicable, based upon its current interpretation of tax rules and regulations that exist in the markets in which it invests.
Realized gains in certain countries may be subject to foreign taxes at the Fund level, based on statutory rates. The Fund accrues for such foreign taxes on realized and unrealized gains at the appropriate rate for each jurisdiction, as applicable. The amount, if any, is disclosed as a liability on the Statement of Assets and Liabilities.
Distributions to shareholders
Distributions from net investment income, if any, are declared and paid semi-annually. Net realized capital gains, if any, are distributed at least annually. Income distributions and capital gain distributions are determined in accordance with federal income tax regulations, which may differ from GAAP.
Guarantees and indemnifications
Under the Trust’s organizational documents and, in some cases, by contract, its officers and trustees are indemnified against certain liabilities arising out of the performance of their duties to the Trust or its funds. In addition, certain of the Fund’s contracts with its service providers contain general indemnification clauses. The Fund’s maximum exposure under these arrangements is unknown since the amount of any future claims that may be made against the Fund cannot be determined, and the Fund has no historical basis for predicting the likelihood of any such claims.
Recent accounting pronouncements
Accounting Standards Update 2017-08 Premium Amortization on Purchased Callable Debt Securities
In March 2017, the Financial Accounting Standards Board issued Accounting Standards Update (ASU) No. 2017-08 Premium Amortization on Purchased Callable Debt Securities. ASU No. 2017-08 updates the accounting standards to shorten the amortization period for certain purchased callable debt securities, held at a premium, to be amortized to the earliest call date. The update applies to securities with explicit, noncontingent call features that are callable at fixed prices and on preset dates. The standard is effective for annual periods beginning after December 15, 2018 and interim periods within those fiscal years. Management does not expect the implementation of this guidance to have a material impact on the financial statement amounts and footnote disclosures.
Accounting Standards Update 2018-13 Disclosure Framework - Changes to the Disclosure Requirements for Fair Value Measurement
In August 2018, the Financial Accounting Standards Board issued Accounting Standards Update (ASU) No. 2018-13 Disclosure Framework - Changes to the Disclosure Requirements for Fair Value Measurement. ASU No. 2018-13, in addition to other modifications and additions, removes the requirement to disclose the amount and reasons for transfers between Level 1 and Level 2 of the fair value hierarchy and the policy for the timing of transfers between levels. The standard is effective for annual periods beginning after December 15, 2019 and interim periods within those fiscal years. At this time, management is evaluating the implication of this guidance and the impact it will have on the financial statement disclosures, if any.
Disclosure Update and Simplification
Columbia Overseas Value Fund | Annual Report 2019
| 33 |
Notes to Financial Statements (continued)
February 28, 2019
In September 2018, the Securities and Exchange Commission (SEC) released Final Rule 33-10532, Disclosure Update and Simplification, which amends certain financial statement disclosure requirements that the SEC determined to be redundant, outdated, or superseded in light of other SEC disclosure requirements, GAAP, or changes in the information environment. As a result of the amendments, management implemented disclosure changes which included removing the components of distributable earnings presented on the Statement of Assets and Liabilities and combining income and gain distributions paid to shareholders as presented on the Statement of Changes in Net Assets. Any values presented to meet prior year requirements were left unchanged. The amendments had no effect on the Fund’s net assets or results of operation.
Note 3. Fees and other transactions with affiliates
Management services fees
The Fund has entered into a Management Agreement with Columbia Management Investment Advisers, LLC (the Investment Manager), a wholly-owned subsidiary of Ameriprise Financial, Inc. (Ameriprise Financial). Under the Management Agreement, the Investment Manager provides the Fund with investment research and advice, as well as administrative and accounting services. The management services fee is an annual fee that is equal to a percentage of the Fund’s daily net assets that declines from 0.87% to 0.67% as the Fund’s net assets increase. The effective management services fee rate for the year ended February 28, 2019 was 0.82% of the Fund’s average daily net assets.
Compensation of board members
Members of the Board of Trustees who are not officers or employees of the Investment Manager or Ameriprise Financial are compensated for their services to the Fund as disclosed in the Statement of Operations. Under a Deferred Compensation Plan (the Deferred Plan), these members of the Board of Trustees may elect to defer payment of up to 100% of their compensation. Deferred amounts are treated as though equivalent dollar amounts had been invested in shares of certain funds managed by the Investment Manager. The Fund’s liability for these amounts is adjusted for market value changes and remains in the Fund until distributed in accordance with the Deferred Plan. All amounts payable under the Deferred Plan constitute a general unsecured obligation of the Fund.
Compensation of Chief Compliance Officer
The Board of Trustees has appointed a Chief Compliance Officer to the Fund in accordance with federal securities regulations. As disclosed in the Statement of Operations, a portion of the Chief Compliance Officer’s total compensation is allocated to the Fund, along with other allocations to affiliated registered investment companies managed by the Investment Manager and its affiliates, based on relative net assets.
Transactions with affiliates
For the year ended February 28, 2019, the Fund engaged in purchase and/or sale transactions with affiliates and/or accounts that have a common investment manager (or affiliated investment managers), common directors/trustees, and/or common officers. Those purchase and sale transactions complied with provisions of Rule 17a-7 under the 1940 Act and were $14,086,111 and $0, respectively.
Transfer agency fees
Under a Transfer and Dividend Disbursing Agent Agreement, Columbia Management Investment Services Corp. (the Transfer Agent), an affiliate of the Investment Manager and a wholly-owned subsidiary of Ameriprise Financial, is responsible for providing transfer agency services to the Fund. The Transfer Agent has contracted with DST Asset Manager Solutions, Inc. (DST) to serve as sub-transfer agent. The Transfer Agent pays the fees of DST for services as sub-transfer agent and DST is not entitled to reimbursement for such fees from the Fund (with the exception of out-of-pocket fees).
The Fund pays the Transfer Agent a monthly transfer agency fee based on the number or the average value of accounts, depending on the type of account. In addition, the Fund pays the Transfer Agent a fee for shareholder services based on the number of accounts or on a percentage of the average aggregate value of the Fund’s shares maintained in omnibus accounts up to the lesser of the amount charged by the financial intermediary or a cap established by the Board of Trustees from time to time.
| 34 | Columbia Overseas Value Fund | Annual Report 2019 |
Notes to Financial Statements (continued)
February 28, 2019
The Transfer Agent also receives compensation from the Fund for various shareholder services and reimbursements for certain out-of-pocket fees. Total transfer agency fees for Class K, Institutional 2 Class and Institutional 3 Class shares are subject to an annual limitation of not more than 0.07%, 0.07% and 0.02%, respectively, of the average daily net assets attributable to each share class. Effective November 2, 2018 through June 30, 2020, Institutional 2 Class shares are subject to a contractual transfer agency fee annual limitation of not more than 0.04% of the average daily net assets attributable to Institutional 2 Class shares.
For the year ended February 28, 2019, the Fund’s effective transfer agency fee rates as a percentage of average daily net assets of each class were as follows:
| | Effective rate (%) |
| Class A | 0.15 |
| Advisor Class | 0.15 |
| Class C | 0.15 |
| Institutional Class | 0.15 |
| Institutional 2 Class | 0.05 |
| Institutional 3 Class | 0.01 |
| Class K | 0.00(a) |
| Class R | 0.15 |
| Class T | 0.12(a) |
An annual minimum account balance fee of $20 may apply to certain accounts with a value below the applicable share class’s initial minimum investment requirements to reduce the impact of small accounts on transfer agency fees. These minimum account balance fees are remitted to the Fund and recorded as part of expense reductions in the Statement of Operations. For the year ended February 28, 2019, these minimum account balance fees reduced total expenses of the Fund by $433.
Plan administration fees
Under a Plan Administration Services Agreement with the Transfer Agent, the Fund paid an annual fee at a rate of 0.25% of the Fund’s average daily net assets attributable to Class K shares for the provision of various administrative, recordkeeping, communication and educational services. As a result of all Class K shares of the Fund being redeemed or exchanged for Advisor Class shares, March 9, 2018 was the last day the Fund paid a plan administration fee for Class K shares.
Distribution and service fees
The Fund has entered into an agreement with Columbia Management Investment Distributors, Inc. (the Distributor), an affiliate of the Investment Manager and a wholly-owned subsidiary of Ameriprise Financial, for distribution and shareholder services. The Board of Trustees has approved, and the Fund has adopted, distribution and shareholder service plans (the Plans) applicable to certain share classes, which set the distribution and service fees for the Fund. These fees are calculated daily and are intended to compensate the Distributor and/or eligible selling and/or servicing agents for selling shares of the Fund and providing services to investors.
Under the Plans, the Fund pays a monthly combined distribution and service fee to the Distributor at the maximum annual rate of 0.25% of the average daily net assets attributable to Class A shares of the Fund. Also under the Plans, the Fund pays a monthly service fee to the Distributor at the maximum annual rate of 0.25% of the average daily net assets attributable to Class C and Class T shares of the Fund and a monthly distribution fee to the Distributor at the maximum annual rates of 0.75%, 0.50% and 0.25% of the average daily net assets attributable to Class C, Class R and Class T shares of the Fund, respectively. As a result of all Class T shares of the Fund being redeemed or converted to Class A shares, December 14, 2018 was the last day the Fund paid a service fee or distribution fee for Class T shares.
Although the Fund may pay a distribution fee up to 0.25% of the Fund’s average daily net assets attributable to Class T shares and a service fee of up to 0.25% of the Fund’s average daily net assets attributable to Class T shares, the aggregate fee shall not exceed 0.25% of the Fund’s average daily net assets attributable to Class T shares.
Columbia Overseas Value Fund | Annual Report 2019
| 35 |
Notes to Financial Statements (continued)
February 28, 2019
Sales charges (unaudited)
Sales charges, including front-end charges and CDSCs, received by the Distributor for distributing Fund shares for the year ended February 28, 2019, if any, are listed below:
| | Amount ($) |
| Class A | 578,411 |
| Class C | 16,462 |
Expenses waived/reimbursed by the Investment Manager and its affiliates
The Investment Manager and certain of its affiliates have contractually agreed to waive fees and/or reimburse expenses (excluding certain fees and expenses described below) for the period(s) disclosed below, unless sooner terminated at the sole discretion of the Board of Trustees, so that the Fund’s net operating expenses, after giving effect to fees waived/expenses reimbursed and any balance credits and/or overdraft charges from the Fund’s custodian, do not exceed the following annual rate(s) as a percentage of the class’ average daily net assets:
| | November 2, 2018
through
June 30, 2020 | Prior to
November 2, 2018 |
| Class A | 1.22% | 1.28% |
| Advisor Class | 0.97 | 1.03 |
| Class C | 1.97 | 2.03 |
| Institutional Class | 0.97 | 1.03 |
| Institutional 2 Class | 0.86 | 0.92 |
| Institutional 3 Class | 0.83 | 0.87 |
| Class R | 1.47 | 1.53 |
Under the agreement governing these fee waivers and/or expense reimbursement arrangements, the following fees and expenses are excluded from the waiver/reimbursement commitment, and therefore will be paid by the Fund, if applicable: taxes (including foreign transaction taxes), expenses associated with investments in affiliated and non-affiliated pooled investment vehicles (including mutual funds and exchange-traded funds), transaction costs and brokerage commissions, costs related to any securities lending program, dividend expenses associated with securities sold short, inverse floater program fees and expenses, transaction charges and interest on borrowed money, interest, infrequent and/or unusual expenses and any other expenses the exclusion of which is specifically approved by the Board of Trustees. This agreement may be modified or amended only with approval from the Investment Manager, certain of its affiliates and the Fund. Reflected in the contractual cap commitment, effective November 2, 2018 through June 30, 2020, is the Transfer Agent’s contractual agreement to limit total transfer agency fees to an annual rate of not more than 0.04% for Institutional 2 Class of the average daily net assets attributable to Institutional 2 Class, unless sooner terminated at the sole discretion of the Board of Trustees. In addition to the contractual agreement, the Investment Manager and certain of its affiliates have voluntarily agreed to waive fees and/or reimburse Fund expenses (excluding certain fees and expenses described above) so that Fund level expenses (expenses directly attributable to the Fund and not to a specific share class) are waived proportionately across all share classes, but the Fund’s net operating expenses shall not exceed the contractual annual rates listed in the table above. This arrangement may be revised or discontinued at any time. Any fees waived and/or expenses reimbursed under the expense reimbursement arrangements described above are not recoverable by the Investment Manager or its affiliates in future periods.
Note 4. Federal tax information
The timing and character of income and capital gain distributions are determined in accordance with income tax regulations, which may differ from GAAP because of temporary or permanent book to tax differences.
| 36 | Columbia Overseas Value Fund | Annual Report 2019 |
Notes to Financial Statements (continued)
February 28, 2019
At February 28, 2019, these differences were primarily due to differing treatment for deferral/reversal of wash sale losses, passive foreign investment company (PFIC) holdings, derivative investments, post-October capital losses, capital loss carryforwards, trustees’ deferred compensation, foreign currency transactions, distribution reclassifications and disallowed capital gains (losses) on a redemption-in-kind. To the extent these differences were permanent, reclassifications were made among the components of the Fund’s net assets. Temporary differences do not require reclassifications.
The following reclassifications were made:
Excess of distributions
over net investment
income ($) | Accumulated
net realized
(loss) ($) | Paid in
capital ($) |
| (1,402,151) | (6,683,993) | 8,086,144 |
Net investment income (loss) and net realized gains (losses), as disclosed in the Statement of Operations, and net assets were not affected by this reclassification.
The tax character of distributions paid during the years indicated was as follows:
| Year Ended February 28, 2019 | Year Ended February 28, 2018 |
Ordinary
income ($) | Long-term
capital gains ($) | Total ($) | Ordinary
income ($) | Long-term
capital gains ($) | Total ($) |
| 26,613,132 | 23,709,653 | 50,322,785 | 15,989,939 | 16,388,670 | 32,378,609 |
Short-term capital gain distributions, if any, are considered ordinary income distributions for tax purposes.
At February 28, 2019, the components of distributable earnings on a tax basis were as follows:
Undistributed
ordinary income ($) | Undistributed
long-term
capital gains ($) | Capital loss
carryforwards ($) | Net unrealized
(depreciation) ($) |
| 979,770 | — | (280,431,437) | (48,489,311) |
At February 28, 2019, the cost of all investments for federal income tax purposes along with the aggregate gross unrealized appreciation and depreciation based on that cost was:
Federal
tax cost ($) | Gross unrealized
appreciation ($) | Gross unrealized
(depreciation) ($) | Net unrealized
(depreciation) ($) |
| 1,814,001,973 | 91,558,910 | (140,048,221) | (48,489,311) |
Tax cost of investments and unrealized appreciation/(depreciation) may also include timing differences that do not constitute adjustments to tax basis.
The following capital loss carryforwards, determined at February 28, 2019, may be available to reduce taxable income arising from future net realized gains on investments, if any, to the extent permitted by the Internal Revenue Code. Capital loss carryforwards with no expiration are required to be utilized prior to any capital losses which carry an expiration date. As a result of this ordering rule, capital loss carryforwards which carry an expiration date may be more likely to expire unused. In addition, for the year ended February 28, 2019, capital loss carryforwards utilized and expired unused, if any, were as follows:
No expiration
short-term ($) | No expiration
long-term ($) | Total ($) | Utilized ($) | Expired ($) |
| — | 280,431,437 | 280,431,437 | 2,018,768 | — |
Under current tax rules, regulated investment companies can elect to treat certain late-year ordinary losses incurred and post-October capital losses (capital losses realized after October 31) as arising on the first day of the following taxable year. As of February 28, 2019, the Fund will elect to treat the following late-year ordinary losses and post-October capital losses as arising on March 1, 2019.
Columbia Overseas Value Fund | Annual Report 2019
| 37 |
Notes to Financial Statements (continued)
February 28, 2019
Late year
ordinary losses ($) | Post-October
capital losses ($) |
| — | 5,982,630 |
Management of the Fund has concluded that there are no significant uncertain tax positions in the Fund that would require recognition in the financial statements. However, management’s conclusion may be subject to review and adjustment at a later date based on factors including, but not limited to, new tax laws, regulations, and administrative interpretations (including relevant court decisions). Generally, the Fund’s federal tax returns for the prior three fiscal years remain subject to examination by the Internal Revenue Service.
Note 5. Portfolio information
The cost of purchases and proceeds from sales of securities, excluding short-term investments and derivatives, if any, aggregated to $1,477,830,819 and $794,216,376, respectively, for the year ended February 28, 2019. The amount of purchase and sale activity impacts the portfolio turnover rate reported in the Financial Highlights.
Note 6. Redemption-in-kind
Proceeds from the sales of securities for Columbia Overseas Value Fund include the value of securities delivered through an in-kind redemption of certain fund shares. During the year ended February 28, 2019, securities and other assets with a value of $140,000,000 were distributed to shareholders to satisfy their redemption requests. The net realized gain on these securities was $8,997,801, which is not taxable to remaining shareholders in the Fund.
Note 7. Affiliated money market fund
The Fund invests in Columbia Short-Term Cash Fund, an affiliated money market fund established for the exclusive use by the Fund and other affiliated funds (the Affiliated MMF). The income earned by the Fund from such investments is included as Dividends - affiliated issuers in the Statement of Operations. As an investing fund, the Fund indirectly bears its proportionate share of the expenses of the Affiliated MMF. The Affiliated MMF prices its shares with a floating net asset value. In addition, the Board of Trustees of the Affiliated MMF may impose a fee on redemptions (sometimes referred to as a liquidity fee) or temporarily suspend redemptions (sometimes referred to as imposing a redemption gate) in the event its liquidity falls below regulatory limits.
Note 8. Interfund lending
Pursuant to an exemptive order granted by the Securities and Exchange Commission, the Fund participates in a program (the Interfund Program) allowing each participating Columbia Fund (each, a Participating Fund) to lend money directly to and, except for closed-end funds and money market funds, borrow money directly from other Participating Funds for temporary purposes. The amounts eligible for borrowing and lending under the Interfund Program are subject to certain restrictions.
Interfund loans are subject to the risk that the borrowing fund could be unable to repay the loan when due, and a delay in repayment to the lending fund could result in lost opportunities and/or additional lending costs. The exemptive order is subject to conditions intended to mitigate conflicts of interest arising from the Investment Manager’s relationship with each Participating Fund.
The Fund’s activity in the Interfund Program during the year ended February 28, 2019 was as follows:
| Borrower or lender | Average loan
balance ($) | Weighted average
interest rate (%) | Days
outstanding |
| Borrower | 1,400,000 | 2.94 | 1 |
Interest expense incurred by the Fund is recorded as Interfund lending in the Statement of Operations. The Fund had no outstanding interfund loans at February 28, 2019.
| 38 | Columbia Overseas Value Fund | Annual Report 2019 |
Notes to Financial Statements (continued)
February 28, 2019
Note 9. Line of credit
The Fund has access to a revolving credit facility with a syndicate of banks led by Citibank, N.A., HSBC Bank USA, N.A. and JPMorgan Chase Bank, N.A. whereby the Fund may borrow for the temporary funding of shareholder redemptions or for other temporary or emergency purposes. The credit facility, which is a collective agreement between the Fund and certain other funds managed by the Investment Manager or an affiliated investment manager, severally and not jointly, permits collective borrowings up to $1 billion. Interest is charged to each participating fund based on its borrowings at a rate equal to the higher of (i) the federal funds effective rate, (ii) the one-month LIBOR rate and (iii) the overnight bank funding rate, plus in each case, 1.00%. Each borrowing under the credit facility matures no later than 60 days after the date of borrowing. The Fund also pays a commitment fee equal to its pro rata share of the unused amount of the credit facility at a rate of 0.15% per annum. The commitment fee is included in other expenses in the Statement of Operations. This agreement expires annually in December unless extended or renewed.
The Fund had no borrowings during the year ended February 28, 2019.
Note 10. Significant risks
Financial sector risk
The Fund may be more susceptible to the particular risks that may affect companies in the financial services sector than if it were invested in a wider variety of companies in unrelated sectors. Companies in the financial services sector are subject to certain risks, including the risk of regulatory change, decreased liquidity in credit markets and unstable interest rates. Such companies may have concentrated portfolios, such as a high level of loans to real estate developers, which makes them vulnerable to economic conditions that affect that industry. Performance of such companies may be affected by competitive pressures and exposure to investments or agreements that, under certain circumstances, may lead to losses (e.g., subprime loans). Companies in the financial services sector are subject to extensive governmental regulation that may limit the amount and types of loans and other financial commitments they can make, and interest rates and fees that they may charge. In addition, profitability of such companies is largely dependent upon the availability and the cost of capital.
Foreign securities and emerging market countries risk
Investing in foreign securities may include certain risks and considerations not typically associated with investing in U.S. securities, such as fluctuating currency values and changing local and regional economic, political and social conditions, which may result in greater market volatility. In addition, certain foreign securities may not be as liquid as U.S. securities. Investing in emerging markets may accentuate these risks. These countries are also more likely to experience high levels of inflation, deflation or currency devaluation which could hurt their economies and securities markets. To the extent that the Fund concentrates its investment exposure to any one or a few specific countries, the Fund will be particularly susceptible to the various conditions, events or other factors impacting those countries and may, therefore, have a greater risk than that of a fund which is more geographically diversified.
Shareholder concentration risk
At February 28, 2019, one unaffiliated shareholder of record owned 25.5% of the outstanding shares of the Fund in one or more accounts. The Fund has no knowledge about whether any portion of those shares was owned beneficially. Affiliated shareholders of record owned 27.4% of the outstanding shares of the Fund in one or more accounts. Subscription and redemption activity by concentrated accounts may have a significant effect on the operations of the Fund. In the case of a large redemption, the Fund may be forced to sell investments at inopportune times, including its liquid positions, which may result in Fund losses and the Fund holding a higher percentage of less liquid positions. Large redemptions could result in decreased economies of scale and increased operating expenses for non-redeeming Fund shareholders.
Note 11. Subsequent events
Management has evaluated the events and transactions that have occurred through the date the financial statements were issued and noted no items requiring adjustment of the financial statements or additional disclosure.
Columbia Overseas Value Fund | Annual Report 2019
| 39 |
Notes to Financial Statements (continued)
February 28, 2019
Note 12. Information regarding pending and settled legal proceedings
Ameriprise Financial and certain of its affiliates have historically been involved in a number of legal, arbitration and regulatory proceedings, including routine litigation, class actions, and governmental actions, concerning matters arising in connection with the conduct of their business activities. Ameriprise Financial believes that the Fund is not currently the subject of, and that neither Ameriprise Financial nor any of its affiliates are the subject of, any pending legal, arbitration or regulatory proceedings that are likely to have a material adverse effect on the Fund or the ability of Ameriprise Financial or its affiliates to perform under their contracts with the Fund. Ameriprise Financial is required to make quarterly (10-Q), annual (10-K) and, as necessary, 8-K filings with the Securities and Exchange Commission (SEC) on legal and regulatory matters that relate to Ameriprise Financial and its affiliates. Copies of these filings may be obtained by accessing the SEC website at www.sec.gov.
There can be no assurance that these matters, or the adverse publicity associated with them, will not result in increased Fund redemptions, reduced sale of Fund shares or other adverse consequences to the Fund. Further, although we believe proceedings are not likely to have a material adverse effect on the Fund or the ability of Ameriprise Financial or its affiliates to perform under their contracts with the Fund, these proceedings are subject to uncertainties and, as such, we are unable to estimate the possible loss or range of loss that may result. An adverse outcome in one or more of these proceedings could result in adverse judgments, settlements, fines, penalties or other relief that could have a material adverse effect on the consolidated financial condition or results of operations of Ameriprise Financial.
| 40 | Columbia Overseas Value Fund | Annual Report 2019 |
Report of Independent Registered Public Accounting Firm
To the Board of Trustees of Columbia Funds Series Trust and Shareholders of Columbia Overseas Value Fund
Opinion on the Financial Statements
We have audited the accompanying statement of assets and liabilities, including the portfolio of investments, of Columbia Overseas Value Fund (one of the funds constituting Columbia Funds Series Trust, referred to hereafter as the "Fund") as of February 28, 2019, the related statement of operations for the year ended February 28, 2019, the statement of changes in net assets for each of the two years in the period ended February 28, 2019, including the related notes, and the financial highlights for each of the periods indicated therein (collectively referred to as the “financial statements”). In our opinion, the financial statements present fairly, in all material respects, the financial position of the Fund as of February 28, 2019, the results of its operations for the year then ended, the changes in its net assets for each of the two years in the period ended February 28, 2019 and the financial highlights for each of the periods indicated therein in conformity with accounting principles generally accepted in the United States of America.
Basis for Opinion
These financial statements are the responsibility of the Fund’s management. Our responsibility is to express an opinion on the Fund’s financial statements based on our audits. We are a public accounting firm registered with the Public Company Accounting Oversight Board (United States) (PCAOB) and are required to be independent with respect to the Fund in accordance with the U.S. federal securities laws and the applicable rules and regulations of the Securities and Exchange Commission and the PCAOB.
We conducted our audits of these financial statements in accordance with the standards of the PCAOB. Those standards require that we plan and perform the audit to obtain reasonable assurance about whether the financial statements are free of material misstatement, whether due to error or fraud.
Our audits included performing procedures to assess the risks of material misstatement of the financial statements, whether due to error or fraud, and performing procedures that respond to those risks. Such procedures included examining, on a test basis, evidence regarding the amounts and disclosures in the financial statements. Our audits also included evaluating the accounting principles used and significant estimates made by management, as well as evaluating the overall presentation of the financial statements. Our procedures included confirmation of securities owned as of February 28, 2019 by correspondence with the custodian, transfer agent and brokers; when replies were not received from brokers, we performed other auditing procedures. We believe that our audits provide a reasonable basis for our opinion.
/s/PricewaterhouseCoopers LLP
Minneapolis, Minnesota
April 22, 2019
We have served as the auditor of one or more investment companies within the Columbia Funds Complex since 1977.
Columbia Overseas Value Fund | Annual Report 2019
| 41 |
Federal Income Tax Information
(Unaudited)
The Fund hereby designates the following tax attributes for the fiscal year ended February 28, 2019. Shareholders will be notified in early 2020 of the amounts for use in preparing 2019 income tax returns.
Qualified
dividend
income | Dividends
received
deduction | Capital
gain
dividend | Foreign
taxes paid
to foreign
countries | Foreign
taxes paid
per share
to foreign
countries | Foreign
source
income | Foreign
source
income per
share |
| 100.00% | 1.49% | $9,014,787 | $3,732,351 | $0.02 | $45,359,758 | $0.24 |
Qualified dividend income. For taxable, non-corporate shareholders, the percentage of ordinary income distributed during the fiscal year that represents qualified dividend income subject to reduced tax rates.
Dividends received deduction. The percentage of ordinary income distributed during the fiscal year that qualifies for the corporate dividends received deduction.
Capital gain dividend. The Fund designates as a capital gain dividend the amount reflected above, or if subsequently determined to be different, the net capital gain of such fiscal period.
Foreign taxes. The Fund makes the election to pass through to shareholders the foreign taxes paid. Eligible shareholders may claim a foreign tax credit. These taxes, and the corresponding foreign source income, are provided.
| 42 | Columbia Overseas Value Fund | Annual Report 2019 |
Shareholders elect the Board that oversees the Fund’s operations. The Board appoints officers who are responsible for day-to-day business decisions based on policies set by the Board. The following table provides basic biographical information about the Fund’s Trustees as of the printing of this report, including their principal occupations during the past five years, although specific titles for individuals may have varied over the period. Under current Board policy, Trustees not affiliated with the Investment Manager generally may serve through the end of the calendar year in which they reach the mandatory retirement age established by the Board.
Independent trustees
Name,
address,
year of birth | Position held
with the Trust and
length of service | Principal occupation(s)
during past five years
and other relevant
professional experience | Number of
Funds in the
Columbia Funds
complex
overseen | Other directorships
held by Trustee
during the past
five years |
George S. Batejan
c/o Columbia Management
Investment Advisers, LLC
225 Franklin Street
Mail Drop BX32 05228
Boston, MA 02110
1953 | Trustee since 1/17 | Executive Vice President, Global Head of Technology and Operations, Janus Capital Group, Inc., 2010-2016 | 123 | Former Chairman of the Board, NICSA (National Investment Company Services Association) (Executive Committee, Nominating Committee and Governance Committee), 2014-2016; former Director, Intech Investment Management, 2011-2016; former Board Member, Metro Denver Chamber of Commerce, 2015-2016; former Advisory Board Member, University of Colorado Business School, 2015-2018 |
Kathleen Blatz
c/o Columbia Management
Investment Advisers, LLC
225 Franklin Street
Mail Drop BX32 05228
Boston, MA 02110
1954 | Trustee since 1/06 for RiverSource Funds and since 6/11 for Nations Funds | Attorney; specializing in arbitration and mediation; Chief Justice, Minnesota Supreme Court, 1998-2006; Associate Justice, Minnesota Supreme Court, 1996-1998; Fourth Judicial District Court Judge, Hennepin County, 1994-1996; Attorney in private practice and public service, 1984-1993; State Representative, Minnesota House of Representatives, 1979-1993, which included service on the Tax and Financial Institutions and Insurance Committees; Member and Interim Chair, Minnesota Sports Facilities Authority, January 2017-July 2017; Interim President and Chief Executive Officer, Blue Cross and Blue Shield of Minnesota (health care insurance), February-July 2018 | 123 | Trustee, BlueCross BlueShield of Minnesota since 2009 (Chair of the Business Development Committee, 2014-2017; Chair of the Governance Committee since 2017); Chair of the Robina Foundation since August 2013; former Member and Chair of the Board, Minnesota Sports Facilities Authority, January 2017-July 2017 |
Edward J. Boudreau, Jr.
c/o Columbia Management
Investment Advisers, LLC
225 Franklin Street
Mail Drop BX32 05228
Boston, MA 02110
1944 | Chair of the Board since 1/18; Trustee since 6/11 for RiverSource Funds and since 1/05 for Nations Funds | Managing Director, E.J. Boudreau & Associates (consulting) since 2000; FINRA Industry Arbitrator, 2002-present; Chairman and Chief Executive Officer, John Hancock Investments (asset management), Chairman and Interested Trustee for open-end and closed-end funds offered by John Hancock, 1989-2000; John Hancock Mutual Life Insurance Company, including Senior Vice President and Treasurer and Senior Vice President Information Technology, 1968-1988 | 123 | Former Trustee, Boston Museum of Science (Chair of Finance Committee) 1985-2013; former Trustee, BofA Funds Series Trust (11 funds), 2005-2011 |
Columbia Overseas Value Fund | Annual Report 2019
| 43 |
TRUSTEES AND OFFICERS (continued)
Independent trustees (continued)
Name,
address,
year of birth | Position held
with the Trust and
length of service | Principal occupation(s)
during past five years
and other relevant
professional experience | Number of
Funds in the
Columbia Funds
complex
overseen | Other directorships
held by Trustee
during the past
five years |
Pamela G. Carlton
c/o Columbia Management
Investment Advisers, LLC
225 Franklin Street
Mail Drop BX32 05228
Boston, MA 02110
1954 | Trustee since 7/07 for RiverSource Funds and since 6/11 for Nations Funds | President, Springboard — Partners in Cross Cultural Leadership (consulting company) since 2003; Managing Director of US Equity Research, JP Morgan Chase, 1999-2003; Director of US Equity Research, Chase Asset Management, 1996-1999; Co-Director Latin America Research, 1993-1996, COO Global Research, 1992-1996, Co-Director of US Research, 1991-1992, Investment Banker, Morgan Stanley, 1982-1991 | 123 | Trustee, New York Presbyterian Hospital Board (Executive Committee and Chair of Human Resources Committee) since 1996; Director, Laurel Road Bank (Audit Committee) since 2017 |
Patricia M. Flynn
c/o Columbia Management
Investment Advisers, LLC
225 Franklin Street
Mail Drop BX32 05228
Boston, MA 02110
1950 | Trustee since 11/04 for RiverSource Funds and since 6/11 for Nations Funds | Trustee Professor of Economics and Management, Bentley University since 1976 (also teaches and conducts research on corporate governance); Dean, McCallum Graduate School of Business, Bentley University, 1992-2002 | 123 | Trustee, MA Taxpayers Foundation since 1997; Board of Directors, The MA Business Roundtable since 2003; Board of Governors, Innovation Institute, MA Technology Collaborative since 2010 |
Brian J. Gallagher
c/o Columbia Management
Investment Advisers, LLC
225 Franklin Street
Mail Drop BX32 05228
Boston, MA 02110
1954 | Trustee since 12/17 | Retired; Partner with Deloitte & Touche LLP and its predecessors, 1977-2016 | 121 | Trustee, Catholic Schools Foundation since 2004 |
Catherine James Paglia
c/o Columbia Management
Investment Advisers, LLC
225 Franklin Street
Mail Drop BX32 05228
Boston, MA 02110
1952 | Trustee since 11/04 for RiverSource Funds and since 6/11 for Nations Funds | Director, Enterprise Asset Management, Inc. (private real estate and asset management company) since September 1998; Managing Director and Partner, Interlaken Capital, Inc., 1989-1997; Managing Director, Morgan Stanley, 1982-1989; Vice President, Investment Banking, 1980-1982, Associate, Investment Banking, 1976-1980, Dean Witter Reynolds, Inc. | 123 | Director, Valmont Industries, Inc. (irrigation systems manufacturer) since 2012; Trustee, Carleton College (on the Investment Committee); Trustee, Carnegie Endowment for International Peace (on the Investment Committee) |
Anthony M. Santomero
c/o Columbia Management
Investment Advisers, LLC
225 Franklin Street
Mail Drop BX32 05228
Boston, MA 02110
1946 | Trustee since 6/11 for RiverSource Funds and since 1/08 for Nations Funds | Richard K. Mellon Professor Emeritus of Finance, The Wharton School, University of Pennsylvania, since 2002; Senior Advisor, McKinsey & Company (consulting), 2006-2008; President, Federal Reserve Bank of Philadelphia, 2000- 2006; Professor of Finance, The Wharton School, University of Pennsylvania, 1972-2002 | 123 | Trustee, Penn Mutual Life Insurance Company since March 2008; Director, Renaissance Reinsurance Ltd. since May 2008; former Trustee, BofA Funds Series Trust (11 funds), 2008-2011; former Director, Citigroup Inc. and Citibank, N.A., 2009-2019 |
| 44 | Columbia Overseas Value Fund | Annual Report 2019 |
TRUSTEES AND OFFICERS (continued)
Independent trustees (continued)
Name,
address,
year of birth | Position held
with the Trust and
length of service | Principal occupation(s)
during past five years
and other relevant
professional experience | Number of
Funds in the
Columbia Funds
complex
overseen | Other directorships
held by Trustee
during the past
five years |
Minor M. Shaw
c/o Columbia Management
Investment Advisers, LLC
225 Franklin Street
Mail Drop BX32 05228
Boston, MA 02110
1947 | Trustee since 6/11 for RiverSource Funds and since 2003 for Nations Funds | President, Micco LLC (private investments) since 2011; President, Micco Corp. (family investment business), 1998-2011 | 123 | Director, BlueCross BlueShield of South Carolina since April 2008; Board Chair, Hollingsworth Funds since 2016; Advisory Board member, Duke Energy Corp. since October 2016; Chair of the Duke Endowment; Chair of Greenville – Spartanburg Airport Commission; former Trustee, BofA Funds Series Trust (11 funds), 2003-2011; former Director, Piedmont Natural Gas, 2004-2016; former Director, National Association of Corporate Directors, Carolinas Chapter, 2013-2018 |
Sandra Yeager
c/o Columbia Management
Investment Advisers, LLC
225 Franklin Street
Mail Drop BX32 05228
Boston, MA 02110
1964 | Trustee since 12/17 | Retired; President and founder, Hanoverian Capital, LLC (SEC registered investment advisor firm), 2008-2016; Managing Director, DuPont Capital, 2006-2008; Managing Director, Morgan Stanley Investment Management, 2004-2006; Senior Vice President, Alliance Bernstein, 1990-2004 | 121 | Director, NAPE Education Foundation since October 2016 |
Interested trustee affiliated with Investment Manager*
Name,
address,
year of birth | Position held with the Trust and length of service | Principal occupation(s) during the
past five years and other relevant
professional experience | Number of
Funds in the
Columbia Funds
complex overseen | Other directorships
held by Trustee
during the past
five years |
William F. Truscott
c/o Columbia Management
Investment Advisers, LLC
225 Franklin St.
Boston, MA 02110
1960 | Trustee since 11/01 for RiverSource Funds and since 6/11 for Nations Funds; Senior Vice President since 2002 for RiverSource Funds and since 5/10 for Nations Funds | Chairman of the Board and President, Columbia Management Investment Advisers, LLC since May 2010 and February 2012, respectively; Chief Executive Officer, Global Asset Management, Ameriprise Financial, Inc. since September 2012 (previously Chief Executive Officer, U.S. Asset Management & President, Annuities, May 2010 - September 2012); Director and Chief Executive Officer, Columbia Management Investment Distributors, Inc. since May 2010 and February 2012, respectively; Chairman of the Board and Chief Executive Officer, RiverSource Distributors, Inc. since 2006; Director, Threadneedle Asset Management Holdings, SARL since 2014; President and Chief Executive Officer, Ameriprise Certificate Company, 2006 - August 2012. | 192 | Chairman of the Board, Columbia Management Investment Advisers, LLC since May 2010; Director, Columbia Management Investment Distributors, Inc. since May 2010; former Director, Ameriprise Certificate Company, 2006-January 2013 |
| * | Interested person (as defined under the 1940 Act) by reason of being an officer, director, security holder and/or employee of the Investment Manager or Ameriprise Financial. |
Columbia Overseas Value Fund | Annual Report 2019
| 45 |
TRUSTEES AND OFFICERS (continued)
Nations Funds refer to the Funds within the Columbia Funds Complex that historically bore the Nations brand and includes series of Columbia Funds Series Trust. RiverSource Funds refer to the Funds within the Columbia Funds Complex that historically bore the RiverSource brand and includes series of Columbia Funds Series Trust II.
The Statement of Additional Information has additional information about the Fund’s Board members and is available, without charge, upon request by calling 800.345.6611, visiting columbiathreadneedleus.com/investor/ or contacting your financial intermediary.
| 46 | Columbia Overseas Value Fund | Annual Report 2019 |
TRUSTEES AND OFFICERS (continued)
The Board has appointed officers who are responsible for day-to-day business decisions based on policies it has established. The officers serve at the pleasure of the Board. The following table provides basic information about the Officers of the Fund as of the printing of this report, including principal occupations during the past five years, although their specific titles may have varied over the period. In addition to Mr. Truscott, who is Senior Vice President, the Fund’s other officers are:
Fund officers
Name,
address and
year of birth | Position and year
first appointed to
position for any Fund
in the Columbia
Funds complex or a
predecessor thereof | Principal occupation(s) during past five years |
Christopher O. Petersen
5228 Ameriprise
Financial Center
Minneapolis, MN 55474
Born 1970 | President and Principal Executive Officer (2015) | Vice President and Lead Chief Counsel, Ameriprise Financial, Inc. since January 2015 (previously, Vice President and Chief Counsel, January 2010 - December 2014; officer of Columbia Funds and affiliated funds since 2007. |
Michael G. Clarke
225 Franklin Street
Boston, MA 02110
Born 1969 | Chief Financial Officer (Principal Financial Officer) (2009) and Senior Vice President (2019) | Vice President — Accounting and Tax, Columbia Management Investment Advisers, LLC, since May 2010; senior officer of Columbia Funds and affiliated funds since 2002 (previously, Treasurer and Chief Accounting Officer, January 2009-January 2019 and December 2015-January 2019, respectively). |
Joseph Beranek
5890 Ameriprise
Financial Center
Minneapolis, MN 55474
Born 1965 | Treasurer and Chief Accounting Officer (Principal Accounting Officer) (2019) | Vice President — Mutual Fund Accounting and Financial Reporting, Columbia Management Investment Advisers, LLC, since December 2018 and March 2017, respectively (previously, Vice President — Pricing and Corporate Actions, May 2010-March 2017). |
Paul B. Goucher
485 Lexington Avenue
New York, NY 10017
Born 1968 | Senior Vice President (2011) and Assistant Secretary (2008) | Senior Vice President and Assistant General Counsel, Ameriprise Financial, Inc. since January 2017 (previously, Vice President and Lead Chief Counsel, November 2008 - January 2017 and January 2013 - January 2017, respectively); Vice President, Chief Legal Officer and Assistant Secretary, Columbia Management Investment Advisers, LLC since March 2015 (previously Vice President and Assistant Secretary, May 2010 – March 2015). |
Thomas P. McGuire
225 Franklin Street
Boston, MA 02110
Born 1972 | Senior Vice President and Chief Compliance Officer (2012) | Vice President — Asset Management Compliance, Ameriprise Financial, Inc., since May 2010; Chief Compliance Officer, Ameriprise Certificate Company since September 2010. |
Colin Moore
225 Franklin Street
Boston, MA 02110
Born 1958 | Senior Vice President (2010) | Executive Vice President and Global Chief Investment Officer, Ameriprise Financial, Inc., since July 2013; Executive Vice President and Global Chief Investment Officer, Columbia Management Investment Advisers, LLC since July 2013. |
Ryan C. Larrenaga
225 Franklin Street
Boston, MA 02110
Born 1970 | Senior Vice President (2017), Chief Legal Officer (2017), and Secretary (2015) | Vice President and Chief Counsel, Ameriprise Financial, Inc. since August 2018 (previously, Vice President and Group Counsel, August 2011 - August 2018); officer of Columbia Funds and affiliated funds since 2005. |
Michael E. DeFao
225 Franklin Street
Boston, MA 02110
Born 1968 | Vice President (2011) and Assistant Secretary (2010) | Vice President and Chief Counsel, Ameriprise Financial, Inc. since May 2010. |
Amy Johnson
5228 Ameriprise
Financial Center
Minneapolis, MN 55474
Born 1965 | Vice President (2006) | Managing Director and Global Head of Operations, Columbia Management Investment Advisers, LLC since April 2016 (previously Managing Director and Chief Operating Officer, 2010 - 2016). |
Columbia Overseas Value Fund | Annual Report 2019
| 47 |
TRUSTEES AND OFFICERS (continued)
Fund officers (continued)
Name,
address and
year of birth | Position and year
first appointed to
position for any Fund
in the Columbia
Funds complex or a
predecessor thereof | Principal occupation(s) during past five years |
Lyn Kephart-Strong
5228 Ameriprise
Financial Center
Minneapolis, MN 55474
Born 1960 | Vice President (2015) | President, Columbia Management Investment Services Corp. since October 2014; Vice President & Resolution Officer, Ameriprise Trust Company since August 2009. |
| 48 | Columbia Overseas Value Fund | Annual Report 2019 |
The Fund mails one shareholder report to each shareholder address, unless such shareholder elected to receive shareholder reports from the Fund electronically. If you would like more than one report, please call shareholder services at 800.345.6611 and additional reports will be sent to you.
Proxy voting policies and procedures
The policy of the Board of Trustees is to vote the proxies of the companies in which the Fund holds investments consistent with the procedures as stated in the Statement of Additional Information (SAI). You may obtain a copy of the SAI without charge by calling 800.345.6611; contacting your financial intermediary; visiting columbiathreadneedleus.com/investor/; or searching the website of the Securities and Exchange Commission (SEC) at sec.gov. Information regarding how the Fund voted proxies relating to portfolio securities is filed with the SEC by August 31st for the most recent 12-month period ending June 30th of that year, and is available without charge by visiting columbiathreadneedleus.com/investor/, or searching the website of the SEC at sec.gov.
Quarterly schedule of investments
The Fund files a complete schedule of portfolio holdings with the SEC for the first and third quarters of each fiscal year on Form N-Q or Form N-PORT (available for filings after March 31, 2019). The Fund’s Form N-Q or Form N-PORT is available on the SEC’s website at sec.gov. The Fund’s complete schedule of portfolio holdings, as filed on Form N-Q or Form N-PORT, can also be obtained without charge, upon request, by calling 800.345.6611.
Additional Fund information
For more information about the Fund, please visit columbiathreadneedleus.com/investor/ or call 800.345.6611. Customer Service Representatives are available to answer your questions Monday through Friday from 8 a.m. to 7 p.m. Eastern time.
Fund investment manager
Columbia Management Investment Advisers, LLC
225 Franklin Street
Boston, MA 02110
Fund distributor
Columbia Management Investment Distributors, Inc.
225 Franklin Street
Boston, MA 02110
Fund transfer agent
Columbia Management Investment Services Corp.
P.O. Box 219104
Kansas City, MO 64121-9104
Columbia Overseas Value Fund | Annual Report 2019
| 49 |
Columbia Overseas Value Fund
P.O. Box 219104
Kansas City, MO 64121-9104
Please read and consider the investment objectives, risks, charges and expenses for any fund carefully before investing. For a prospectus and summary prospectus, which contains this and other important information about the Fund, go to
columbiathreadneedleus.com/investor/. The Fund is distributed by Columbia Management Investment Distributors, Inc., member FINRA, and managed by Columbia Management Investment Advisers, LLC.
Columbia Threadneedle Investments (Columbia Threadneedle) is the global brand name of the Columbia and Threadneedle group of companies. All rights reserved.
© 2019 Columbia Management Investment Advisers, LLC.
columbiathreadneedleus.com/investor/

Annual Report
February 28, 2019
Columbia Select International Equity Fund
Beginning on January 1, 2021, as permitted by regulations adopted by the Securities and Exchange Commission, paper copies of the Fund’s annual and semiannual shareholder reports like this one will no longer be sent by mail, unless you specifically request paper copies of the reports. Instead, the reports will be made available on the Fund’s website (columbiathreadneedleus.com/investor/), and each time a report is posted you will be notified by mail and provided with a website address to access the report.
If you have already elected to receive shareholder reports electronically, you will not be affected by this change and you need not take any action. You may elect to receive shareholder reports and other communications from the Fund electronically at any time by contacting your financial intermediary (such as a broker-dealer or bank) or, for Fund shares held directly with the Fund, by calling 800.345.6611 or by enrolling in “eDelivery” by logging into your account at columbiathreadneedleus.com/investor/.
You may elect to receive all future reports in paper free of charge. If you invest through a financial intermediary, you can contact your financial intermediary to request that you continue receiving paper copies of your shareholder reports. If you invest directly with the Fund, you can call 800.345.6611 to let the Fund know you wish to continue receiving paper copies of your shareholder reports. Your election to receive paper reports will apply to all Columbia Funds held in your account if you invest through a financial intermediary or all Columbia Funds held with the fund complex if you invest directly with the Fund.
Not FDIC Insured • No bank guarantee • May lose value
Dear Shareholders,
Volatility exists in financial markets and this is not a comfortable fact of life. How investors deal with this reality, including how they react to short term spikes in volatility as well as to longer periods of increased or decreased volatility, may have a significant impact on their overall investing success.
Too often, investors change their investment strategy based on something that’s happening at a moment in time rather than thinking about how that change in strategy might affect their ability to achieve their longer term financial goals. Emotion replaces logic and reasoning. Investors may sell in reaction to a market drop (fear or panic), locking in low returns which means they won’t be invested when the market returns, or they invest more at a market peak (greed or conviction), essentially when it is expensive to do so. In both cases, selling and buying at the exact wrong time.
We believe the best outcomes come from a consistent approach to investing. Here are five areas where advisors can help us overcome the tendency to react emotionally as we struggle to make the right choices with our investments:
Long-term focus
The further away long-term goals, aspirations and objectives are, the easier it is to stray away from the goals and priorities that we set out. Advisors help us stay focused on what we want to accomplish.
Discipline through up-and-down markets
Advisors help set rules to prevent us from making rash decisions that we may regret later. Knowing ahead of time what you should do in case of certain situations will help you get through volatile markets and not make emotional decisions.
Tax-awareness
Taxes are one of the biggest drags on investment returns and are critical attributes of investing. Yet few of us take the necessary steps to ease the corrosive effect of taxes. Advisors have tools and knowledge that may help us to manage portfolios more tax-efficiently and keep more of what we earn.
Emotional objectivity
Our emotions are very hard to manage and making investment decisions in an emotional state can lead to exceedingly bad outcomes. An objective advisor can help prevent some of the reactionary mistakes emotions often lead us to.
Education and guidance
The role of the advisor is to teach and guide us toward achieving our financial goals. In terms of working through emotions, guidance is by far the most important component.
By understanding our own behaviors and biases, we can prepare for future challenges. Your success is our priority. Talk to your advisor about how working with Columbia Threadneedle Investments may help you stay the course and position your portfolio for consistent, sustainable outcomes, regardless of market conditions.
Sincerely,
Christopher O. Petersen
President, Columbia Funds
Columbia Funds are distributed by Columbia Management Investment Distributors, Inc., member FINRA, and managed by Columbia Management Investment Advisers, LLC.
© 2019 Columbia Management Investment Advisers, LLC. All rights reserved.
Columbia Select International Equity Fund | Annual Report 2019
Columbia Select International Equity Fund | Annual Report 2019
Investment objective
Columbia Select International Equity Fund (the Fund) seeks long-term capital growth.
Portfolio management
Threadneedle International Limited
Simon Haines, CFA
William Davies
David Dudding, CFA
Morningstar style boxTM
The Morningstar Style Box is based on a fund’s portfolio holdings. For equity funds, the vertical axis shows the market capitalization of the stocks owned, and the horizontal axis shows investment style (value, blend, or growth). Information shown is based on the most recent data provided by Morningstar.
© 2019 Morningstar, Inc. All rights reserved. The Morningstar information contained herein: (1) is proprietary to Morningstar and/or its content providers; (2) may not be copied or distributed; and (3) is not warranted to be accurate, complete or timely. Neither Morningstar nor its content providers are responsible for any damages or losses arising from any use of this information.
| Average annual total returns (%) (for the period ended February 28, 2019) |
| | | Inception | 1 Year | 5 Years | 10 Years |
| Class A | Excluding sales charges | 06/03/92 | -5.10 | 0.82 | 7.87 |
| | Including sales charges | | -10.54 | -0.38 | 7.23 |
| Advisor Class* | 11/08/12 | -4.93 | 1.05 | 8.14 |
| Class C | Excluding sales charges | 06/17/92 | -5.77 | 0.06 | 7.07 |
| | Including sales charges | | -6.70 | 0.06 | 7.07 |
| Institutional Class | 12/02/91 | -4.83 | 1.07 | 8.15 |
| Institutional 2 Class* | 11/08/12 | -4.72 | 1.23 | 8.25 |
| Institutional 3 Class* | 03/07/11 | -4.68 | 1.28 | 8.33 |
| Class R | 01/23/06 | -5.37 | 0.55 | 7.60 |
| MSCI EAFE Index (Net) | | -6.04 | 2.07 | 9.56 |
Returns for Class A shares are shown with and without the maximum initial sales charge of 5.75%. Returns for Class C shares are shown with and without the 1.00% contingent deferred sales charge for the first year only. The Fund’s other share classes are not subject to sales charges and have limited eligibility. Please see the Fund’s prospectus for details. Performance for different share classes will vary based on differences in sales charges and fees associated with each share class. All results shown assume reinvestment of distributions during the period. Returns do not reflect the deduction of taxes that a shareholder may pay on Fund distributions or on the redemption of Fund shares. Performance results reflect the effect of any fee waivers or reimbursements of Fund expenses by Columbia Management Investment Advisers, LLC and/or any of its affiliates. Absent these fee waivers or expense reimbursement arrangements, performance results would have been lower.
The performance information shown represents past performance and is not a guarantee of future results. The investment return and principal value of your investment will fluctuate so that your shares, when redeemed, may be worth more or less than their original cost. Current performance may be lower or higher than the performance information shown. You may obtain performance information current to the most recent month-end by contacting your financial intermediary, visiting columbiathreadneedleus.com/investor/ or calling 800.345.6611.
The Fund’s performance prior to May 2015 reflects returns achieved pursuant to different principal investment strategies. If the Fund’s current strategies had been in place for the prior periods, results shown may have been different.
| * | The returns shown for periods prior to the share class inception date (including returns for the Life of the Fund, if shown, which are since Fund inception) include the returns of the Fund’s oldest share class. These returns are adjusted to reflect any higher class-related operating expenses of the newer share classes, as applicable. Please visit columbiathreadneedleus.com/investor/investment-products/mutual-funds/appended-performance for more information. |
The MSCI EAFE Index (Net) is a free float-adjusted market capitalization index that is designed to measure the equity market performance of developed markets, excluding the U.S. and Canada. The index is compiled from a composite of securities markets of Europe, Australasia and the Far East and is widely recognized by investors in foreign markets as the measurement index for portfolios of non-North American securities.
Indices are not available for investment, are not professionally managed and do not reflect sales charges, fees, brokerage commissions, taxes (except the MSCI EAFE Index (Net), which reflects reinvested dividends net of withholding taxes) or other expenses of investing. Securities in the Fund may not match those in an index.
| 2 | Columbia Select International Equity Fund | Annual Report 2019 |
Fund at a Glance (continued)
Performance of a hypothetical $10,000 investment (February 28, 2009 — February 28, 2019)
The chart above shows the change in value of a hypothetical $10,000 investment in Class A shares of Columbia Select International Equity Fund during the stated time period, and does not reflect the deduction of taxes that a shareholder may pay on Fund distributions or on the redemption of Fund shares.
| Top 10 holdings (%) (at February 28, 2019) |
| AIA Group Ltd. (Hong Kong) | 4.1 |
| RELX PLC (United Kingdom) | 4.0 |
| Roche Holding AG, Genusschein Shares (Switzerland) | 3.4 |
| Suncor Energy, Inc. (Canada) | 3.1 |
| CRH PLC (Ireland) | 3.0 |
| Airbus Group SE (France) | 3.0 |
| Unilever PLC (United Kingdom) | 3.0 |
| Rio Tinto PLC (United Kingdom) | 2.7 |
| Mitsubishi UFJ Financial Group, Inc. (Japan) | 2.6 |
| Total SA (France) | 2.6 |
Percentages indicated are based upon total investments excluding Money Market Funds and investments in derivatives, if any.
For further detail about these holdings, please refer to the section entitled “Portfolio of Investments.”
Fund holdings are as of the date given, are subject to change at any time, and are not recommendations to buy or sell any security.
| Equity sector breakdown (%) (at February 28, 2019) |
| Communication Services | 5.6 |
| Consumer Discretionary | 8.5 |
| Consumer Staples | 7.1 |
| Energy | 7.9 |
| Financials | 22.6 |
| Health Care | 10.5 |
| Industrials | 22.6 |
| Information Technology | 7.5 |
| Materials | 7.7 |
| Total | 100.0 |
Percentages indicated are based upon total equity investments. The Fund’s portfolio composition is subject to change.
Columbia Select International Equity Fund | Annual Report 2019
| 3 |
Fund at a Glance (continued)
| Country breakdown (%) (at February 28, 2019) |
| Australia | 2.4 |
| Canada | 3.1 |
| China | 2.2 |
| France | 10.3 |
| Germany | 4.1 |
| Hong Kong | 4.1 |
| India | 0.9 |
| Indonesia | 1.4 |
| Ireland | 4.8 |
| Japan | 24.7 |
| Jersey | 1.9 |
| Malta | 0.0(a) |
| Netherlands | 4.4 |
| Singapore | 1.3 |
| Spain | 2.1 |
| Sweden | 4.6 |
| Switzerland | 6.2 |
| United Kingdom | 20.9 |
| United States(b) | 0.6 |
| Total | 100.0 |
| (a) | Rounds to zero. |
| (b) | Includes investments in Money Market Funds. |
Country breakdown is based primarily on issuer’s place of organization/incorporation. Percentages indicated are based upon total investments excluding investments in derivatives, if any. The Fund’s portfolio composition is subject to change.
| 4 | Columbia Select International Equity Fund | Annual Report 2019 |
Manager Discussion of Fund Performance
For the 12-month period that ended February 28, 2019, the Fund’s Class A shares returned -5.10% excluding sales charges. The Fund outperformed its benchmark, the MSCI EAFE Index (Net), which returned -6.04% over the same period. The Fund benefited from security selection at both the regional and sector levels; in particular, selections in the financials and health care sectors contributed notably to performance.
Markets faced headwinds after positive start
Markets started the review period positively, despite an uptick in volatility, as strong labor-market conditions and corporate earnings buoyed sentiment. From the autumn onwards, however, markets were increasingly rattled by a range of factors. These included tightening monetary conditions, rising political uncertainty in Europe, President Trump’s tariff war against China and other U.S. trading partners, and, related to the last, evidence of economic deceleration in China. Though concerns about Brexit and cooling global growth persisted in the first two months of 2019, markets rebounded strongly over the period amid optimism around plans for stimulus measures in China and the eurozone, and apparent progress in U.S.-China trade negotiations. Sentiment was further buoyed by an unexpectedly dovish shift on the part of the U.S. Federal Reserve. Nevertheless, most sectors ended the period with declines. Exceptions were more defensive sources of growth, such as the utilities, health care and consumer staples sectors, which benefited from falling bond yields in the second half of the period.
Contributors and detractors
Financials, materials and communication services were the top-performing sectors on a relative basis during the period. Financials contributed the most to Fund performance, owing chiefly to security selection. Holdings such as AIA and Legal & General added value. Within the materials sector, Rio Tinto and CRH were leading contributors, while SoftBank, Capcom and Deutsche Telekom proved to be our top performers within communication services. Our exposure to both sectors was broadly in line with the benchmark throughout the period. While the more defensive components of the communication services sector performed well, stocks of gaming and media-related companies were hurt by negative market sentiment. Other contributors included AIA, L’Oreal and Roche. All three posted positive absolute returns. Pan-Asian insurer AIA generated most of its gains towards the end of the period as improved trading prospects, plans for increased economic stimulus in China and signs of a recovery in offshore insurance sales buoyed sentiment. While we trimmed this position over the period, AIA remained a key holding, given our conviction in its ability to capitalize on secular financial themes in Asia. L’Oreal’s gains were also driven by impressive results, partly owing to strong demand for its high-end skincare products in the Asia-Pacific region. We took some profits on our holding during the year. Roche was one of several pharmaceutical stocks to benefit from the rotation towards defensive sectors. The company performed particularly well in July after boosting its earnings guidance as its expansion into new drugs provided reassurance around its growth prospects.
The industrial, energy and utilities sectors were key relative detractors. Our overweight relative to the benchmark to industrials detracted as worries about global growth caused the sector to trend lower, given that its constituents are perceived to be economically sensitive. Security selection also detracted, despite value from our holding in Airbus. While energy sector benchmark returns were positive, largely driven by gains in oil prices in the first half of the period and in 2019, our position in the sector detracted from relative returns owing to security selection, though the overweight allocation was beneficial. The benchmark’s return for the utilities sector was positive as investors favored cheaper and more defensive sources of growth. Our zero-weight exposure, however, detracted on a relative basis. We tend to be underweight or carry a zero weight to utilities, as stocks with the qualities we focus on – durable competitive advantage, high returns on capital and sustainably high earnings growth – are typically scarce in such regulated industries. Among individual holdings, the three largest detractors in relative terms were TechnipFMC, Tokyo Electron and Mitsubishi UFJ Financial. All three also declined in absolute terms, but we increased our position in each case over the period. Oil-services firm TechnipFMC was hurt by weakness across its business lines, though merger-related synergies showed signs of materializing. Tokyo Electron lagged as markets priced in a memory capex correction in 2019, given sluggish orders. However, the stock outperformed towards the end of the period on robust earnings in the sector. Mitsubishi UFJ Financial was one of several Japanese financial stocks to be pressured by a flattening of yield curves and expectations that the Bank of Japan would be likely to keep rates “lower for longer.”
Columbia Select International Equity Fund | Annual Report 2019
| 5 |
Manager Discussion of Fund Performance (continued)
Portfolio positioning
Our most significant exposure increases were to the U.K. and Sweden. The former was due to the corporate simplification undertaken by British multinational RELX, which resulted in its domicile shifting from the Netherlands to the U.K. As a result, our Netherlands weighting was lowered. Our position in Indonesia was also cut, though we maintain an overweight to the country, relative to the benchmark’s zero weighting. Our sale of Anheuser- Busch InBev also meant that our exposure to Belgium went from an overweight to a zero weight. Among individual stocks, key new positions included Adidas, which continues to gain market share in a relatively concentrated industry. The arrival of new, well-regarded management is promising, given their success in improving margins in their previous role. We also initiated a position in insurance group Prudential. We believed the firm offered healthy regional diversification with a low-risk U.K. life/asset management business which is capable of strong free cash flow generation, and an Asian segment exposed to structural growth. Other purchases included Japanese medical device company Terumo. In our view, the company offered multiple sources of growth, notably in cardiac and vascular care, where we anticipated benefits from the expansion of existing products and new developments. Sales included Sekisui Chemical. We felt that the company’s returns on capital may be reaching a peak, following its recent rise on the back of cost cutting and improved management. A consumption tax hike in Japan later this year also has the potential to affect the company’s housing division. Other sales from Japan included Resona and Seiko Epson. We believed restrictions on real estate lending enforced by the regulator – following malpractice by a peer – would have the potential to impact on Resona’s loan growth. Meanwhile, unexpectedly high cost volatility – and our lack of conviction that this would be addressed in the near term – led us to close our position in electronics company Seiko Epson.
Marketrisk may affect a single issuer, sector of the economy, industry or the market as a whole.Growthsecurities, at times, may not perform as well as value securities or the stock market in general and may be out of favor with investors.Valuesecurities may be unprofitable if the market fails to recognize their intrinsic worth or the portfolio manager misgauged that worth.Internationalinvesting involves certain risks and volatility due to potential political, economic or currency instabilities and different financial and accounting standards. Risks are enhanced foremerging market issuers. Investing inderivativesis a specialized activity that involves special risks that subject the Fund to significant loss potential, including when used as leverage, and may result in greater fluctuation in fund value. The value of the Fund’s portfolio may be more volatile due toconcentratedinvestments in similar industries, sectors or geographical regions. Investments in alimitednumber of companies subject the Fund to greater risk of loss. See the Fund’s prospectus for more information on these and other risks.
The views expressed in this report reflect the current views of the respective parties. These views are not guarantees of future performance and involve certain risks, uncertainties and assumptions that are difficult to predict, so actual outcomes and results may differ significantly from the views expressed. These views are subject to change at any time based upon economic, market or other conditions and the respective parties disclaim any responsibility to update such views. These views may not be relied on as investment advice and, because investment decisions for a Columbia fund are based on numerous factors, may not be relied on as an indication of trading intent on behalf of any particular Columbia fund. References to specific securities should not be construed as a recommendation or investment advice.
| 6 | Columbia Select International Equity Fund | Annual Report 2019 |
Understanding Your Fund’s Expenses
(Unaudited)
As an investor, you incur two types of costs. There are shareholder transaction costs, which generally include sales charges on purchases and may include redemption fees. There are also ongoing fund costs, which generally include management fees, distribution and/or service fees, and other fund expenses. The following information is intended to help you understand your ongoing costs (in dollars) of investing in the Fund and to help you compare these costs with the ongoing costs of investing in other mutual funds.
Analyzing your Fund’s expenses
To illustrate these ongoing costs, we have provided examples and calculated the expenses paid by investors in each share class of the Fund during the period. The actual and hypothetical information in the table is based on an initial investment of $1,000 at the beginning of the period indicated and held for the entire period. Expense information is calculated two ways and each method provides you with different information. The amount listed in the “Actual” column is calculated using the Fund’s actual operating expenses and total return for the period. You may use the Actual information, together with the amount invested, to estimate the expenses that you paid over the period. Simply divide your account value by $1,000 (for example, an $8,600 account value divided by $1,000 = 8.6), then multiply the results by the expenses paid during the period under the “Actual” column. The amount listed in the “Hypothetical” column assumes a 5% annual rate of return before expenses (which is not the Fund’s actual return) and then applies the Fund’s actual expense ratio for the period to the hypothetical return. You should not use the hypothetical account values and expenses to estimate either your actual account balance at the end of the period or the expenses you paid during the period. See “Compare with other funds” below for details on how to use the hypothetical data.
Compare with other funds
Since all mutual funds are required to include the same hypothetical calculations about expenses in shareholder reports, you can use this information to compare the ongoing cost of investing in the Fund with other funds. To do so, compare the hypothetical example with the 5% hypothetical examples that appear in the shareholder reports of other funds. As you compare hypothetical examples of other funds, it is important to note that hypothetical examples are meant to highlight the ongoing costs of investing in a fund only and do not reflect any transaction costs, such as sales charges, or redemption or exchange fees. Therefore, the hypothetical calculations are useful in comparing ongoing costs only, and will not help you determine the relative total costs of owning different funds. If transaction costs were included in these calculations, your costs would be higher.
| September 1, 2018 — February 28, 2019 |
| | Account value at the
beginning of the
period ($) | Account value at the
end of the
period ($) | Expenses paid during
the period ($) | Fund’s annualized
expense ratio (%) |
| | Actual | Hypothetical | Actual | Hypothetical | Actual | Hypothetical | Actual |
| Class A | 1,000.00 | 1,000.00 | 960.20 | 1,018.10 | 6.56 | 6.76 | 1.35 |
| Advisor Class | 1,000.00 | 1,000.00 | 961.30 | 1,019.34 | 5.35 | 5.51 | 1.10 |
| Class C | 1,000.00 | 1,000.00 | 956.90 | 1,014.38 | 10.19 | 10.49 | 2.10 |
| Institutional Class | 1,000.00 | 1,000.00 | 961.70 | 1,019.34 | 5.35 | 5.51 | 1.10 |
| Institutional 2 Class | 1,000.00 | 1,000.00 | 962.10 | 1,019.98 | 4.72 | 4.86 | 0.97 |
| Institutional 3 Class | 1,000.00 | 1,000.00 | 962.00 | 1,020.33 | 4.38 | 4.51 | 0.90 |
| Class R | 1,000.00 | 1,000.00 | 958.50 | 1,016.86 | 7.77 | 8.00 | 1.60 |
Expenses paid during the period are equal to the annualized expense ratio for each class as indicated above, multiplied by the average account value over the period and then multiplied by the number of days in the Fund’s most recent fiscal half year and divided by 365.
Expenses do not include fees and expenses incurred indirectly by the Fund from its investment in underlying funds, including affiliated and non-affiliated pooled investment vehicles, such as mutual funds and exchange-traded funds.
Had Columbia Management Investment Advisers, LLC and/or certain of its affiliates not waived/reimbursed certain fees and expenses, account value at the end of the period would have been reduced.
Columbia Select International Equity Fund | Annual Report 2019
| 7 |
Portfolio of Investments
February 28, 2019
(Percentages represent value of investments compared to net assets)
Investments in securities
| Common Stocks 99.1% |
| Issuer | Shares | Value ($) |
| Australia 2.4% |
| CSL Ltd. | 46,091 | 6,316,897 |
| Canada 3.1% |
| Suncor Energy, Inc. | 233,497 | 8,048,500 |
| China 2.2% |
| China Milk Products Group Ltd.(a),(b),(c) | 7,426,000 | 6 |
| Tencent Holdings Ltd. | 133,200 | 5,704,057 |
| Total | 5,704,063 |
| France 10.2% |
| Airbus Group SE | 61,167 | 7,903,648 |
| EssilorLuxottica SA | 15,047 | 1,821,913 |
| L’Oreal SA | 26,085 | 6,583,854 |
| Schneider Electric SE | 51,272 | 3,990,207 |
| Total SA | 116,909 | 6,647,574 |
| Total | 26,947,196 |
| Germany 4.1% |
| Adidas AG | 19,804 | 4,811,564 |
| Deutsche Telekom AG, Registered Shares | 176,221 | 2,903,409 |
| Knorr-Bremse AG(b) | 29,526 | 2,966,840 |
| Total | 10,681,813 |
| Hong Kong 4.1% |
| AIA Group Ltd. | 1,075,400 | 10,732,850 |
| India 0.9% |
| HDFC Bank Ltd. | 78,000 | 2,283,671 |
| Indonesia 1.4% |
| PT Bank Rakyat Indonesia Persero Tbk | 13,851,700 | 3,786,679 |
| Ireland 4.8% |
| Bank of Ireland Group PLC | 374,079 | 2,431,709 |
| CRH PLC | 250,410 | 7,929,631 |
| Ryanair Holdings PLC, ADR(b) | 30,778 | 2,294,192 |
| Total | 12,655,532 |
| Common Stocks (continued) |
| Issuer | Shares | Value ($) |
| Japan 24.6% |
| Bridgestone Corp. | 60,000 | 2,376,691 |
| Capcom Co., Ltd. | 145,700 | 2,924,757 |
| Daikin Industries Ltd. | 27,600 | 3,004,442 |
| Hoya Corp. | 95,700 | 5,850,853 |
| Keyence Corp. | 8,600 | 5,028,977 |
| Koito Manufacturing Co., Ltd. | 76,700 | 4,438,120 |
| Kubota Corp. | 292,800 | 3,949,013 |
| Mitsubishi UFJ Financial Group, Inc. | 1,323,200 | 6,866,600 |
| Nidec Corp. | 17,200 | 2,086,020 |
| Nihon M&A Center, Inc. | 206,400 | 5,223,457 |
| Nintendo Co., Ltd. | 11,300 | 3,098,903 |
| Pigeon Corp. | 106,800 | 4,360,519 |
| Shimano, Inc. | 33,200 | 5,049,857 |
| Terumo Corp. | 72,000 | 4,422,680 |
| Tokyo Electron Ltd. | 29,100 | 3,978,089 |
| Yaskawa Electric Corp. | 73,600 | 2,100,274 |
| Total | 64,759,252 |
| Jersey 1.9% |
| Ferguson PLC | 72,505 | 5,020,878 |
| Malta 0.0% |
| BGP Holdings PLC(a),(b),(c) | 2,232,232 | 3 |
| Netherlands 4.4% |
| ASML Holding NV | 31,275 | 5,731,639 |
| ING Groep NV | 447,659 | 5,922,892 |
| Total | 11,654,531 |
| Singapore 1.3% |
| DBS Group Holdings Ltd. | 194,100 | 3,558,580 |
| Spain 2.1% |
| Industria de Diseno Textil SA | 182,122 | 5,497,882 |
| Sweden 4.6% |
| Atlas Copco AB, Class A | 88,791 | 2,405,798 |
| Epiroc AB, Class A(b) | 173,189 | 1,738,828 |
| Hexagon AB, Class B | 49,917 | 2,625,560 |
| Volvo AB, B Shares | 354,347 | 5,217,756 |
| Total | 11,987,942 |
The accompanying Notes to Financial Statements are an integral part of this statement.
| 8 | Columbia Select International Equity Fund | Annual Report 2019 |
Portfolio of Investments (continued)
February 28, 2019
| Common Stocks (continued) |
| Issuer | Shares | Value ($) |
| Switzerland 6.2% |
| Roche Holding AG, Genusschein Shares | 32,128 | 8,926,501 |
| Sika AG(b) | 37,421 | 5,061,705 |
| UBS AG | 192,997 | 2,455,851 |
| Total | 16,444,057 |
| United Kingdom 20.8% |
| 3i Group PLC | 413,946 | 5,192,793 |
| DCC PLC | 31,689 | 2,742,503 |
| HSBC Holdings PLC | 804,701 | 6,541,573 |
| Legal & General Group PLC | 1,705,927 | 6,349,012 |
| Prudential PLC | 136,823 | 2,885,455 |
| RELX PLC | 456,058 | 10,473,419 |
| Rio Tinto PLC | 122,170 | 7,026,060 |
| TechnipFMC PLC | 266,182 | 5,861,599 |
| Common Stocks (continued) |
| Issuer | Shares | Value ($) |
| Unilever PLC | 145,000 | 7,708,214 |
| Total | 54,780,628 |
Total Common Stocks
(Cost $226,083,223) | 260,860,954 |
|
| Money Market Funds 0.6% |
| | Shares | Value ($) |
| Columbia Short-Term Cash Fund, 2.523%(d),(e) | 1,697,978 | 1,697,808 |
Total Money Market Funds
(Cost $1,697,808) | 1,697,808 |
Total Investments in Securities
(Cost $227,781,031) | 262,558,762 |
| Other Assets & Liabilities, Net | | 764,988 |
| Net Assets | $263,323,750 |
Notes to Portfolio of Investments
| (a) | Represents fair value as determined in good faith under procedures approved by the Board of Trustees. At February 28, 2019, the total value of these securities amounted to $9, which represents less than 0.01% of total net assets. |
| (b) | Non-income producing investment. |
| (c) | Valuation based on significant unobservable inputs. |
| (d) | The rate shown is the seven-day current annualized yield at February 28, 2019. |
| (e) | As defined in the Investment Company Act of 1940, an affiliated company is one in which the Fund owns 5% or more of the company’s outstanding voting securities, or a company which is under common ownership or control with the Fund. Holdings and transactions in these affiliated companies during the year ended February 28, 2019 are as follows: |
| Issuer | Beginning
shares | Shares
purchased | Shares
sold | Ending
shares | Realized gain
(loss) —
affiliated
issuers ($) | Net change in
unrealized
appreciation
(depreciation) —
affiliated
issuers ($) | Dividends —
affiliated
issuers ($) | Value —
affiliated
issuers
at end of
period ($) |
| Columbia Short-Term Cash Fund, 2.523% |
| | 2,855,571 | 68,515,626 | (69,673,219) | 1,697,978 | (474) | 83 | 53,707 | 1,697,808 |
Abbreviation Legend
| ADR | American Depositary Receipt |
Fair value measurements
The Fund categorizes its fair value measurements according to a three-level hierarchy that maximizes the use of observable inputs and minimizes the use of unobservable inputs by prioritizing that the most observable input be used when available. Observable inputs are those that market participants would use in pricing an investment based on market data obtained from sources independent of the reporting entity. Unobservable inputs are those that reflect the Fund’s assumptions about the information market participants would use in pricing an investment. An investment’s level within the fair value hierarchy is based on the lowest level of any input that is deemed significant to the asset’s or liability’s fair value measurement. The input levels are not necessarily an indication of the risk or liquidity associated with investments at that level. For example, certain U.S. government securities are generally high quality and liquid, however, they are reflected as Level 2 because the inputs used to determine fair value may not always be quoted prices in an active market.
Fair value inputs are summarized in the three broad levels listed below:
| ■ | Level 1 — Valuations based on quoted prices for investments in active markets that the Fund has the ability to access at the measurement date. Valuation adjustments are not applied to Level 1 investments. |
| ■ | Level 2 — Valuations based on other significant observable inputs (including quoted prices for similar securities, interest rates, prepayment speeds, credit risks, etc.). |
The accompanying Notes to Financial Statements are an integral part of this statement.
Columbia Select International Equity Fund | Annual Report 2019
| 9 |
Portfolio of Investments (continued)
February 28, 2019
Fair value measurements (continued)
| ■ | Level 3 — Valuations based on significant unobservable inputs (including the Fund’s own assumptions and judgment in determining the fair value of investments). |
Inputs that are used in determining fair value of an investment may include price information, credit data, volatility statistics, and other factors. These inputs can be either observable or unobservable. The availability of observable inputs can vary between investments, and is affected by various factors such as the type of investment, and the volume and level of activity for that investment or similar investments in the marketplace. The inputs will be considered by the Investment Manager, along with any other relevant factors in the calculation of an investment’s fair value. The Fund uses prices and inputs that are current as of the measurement date, which may include periods of market dislocations. During these periods, the availability of prices and inputs may be reduced for many investments. This condition could cause an investment to be reclassified between the various levels within the hierarchy.
Foreign equity securities actively traded in markets where there is a significant delay in the local close relative to the New York Stock Exchange are classified as Level 2. The values of these securities may include an adjustment to reflect the impact of significant market movements following the close of local trading, as described in Note 2 to the financial statements – Security valuation.
Certain investments that have been measured at fair value using the net asset value (NAV) per share (or its equivalent) are not categorized in the fair value hierarchy. The fair value amounts presented in the table are intended to reconcile the fair value hierarchy to the amounts presented in the Portfolio of Investments. The Columbia Short-Term Cash Fund seeks to provide shareholders with maximum current income consistent with liquidity and stability of principal. Columbia Short-Term Cash Fund prices its shares with a floating NAV and no longer seeks to maintain a stable NAV.
Investments falling into the Level 3 category are primarily supported by quoted prices from brokers and dealers participating in the market for those investments. However, these may be classified as Level 3 investments due to lack of market transparency and corroboration to support these quoted prices. Additionally, valuation models may be used as the pricing source for any remaining investments classified as Level 3. These models may rely on one or more significant unobservable inputs and/or significant assumptions by the Investment Manager. Inputs used in valuations may include, but are not limited to, financial statement analysis, capital account balances, discount rates and estimated cash flows, and comparable company data.
Under the direction of the Fund’s Board of Trustees (the Board), the Investment Manager’s Valuation Committee (the Committee) is responsible for overseeing the valuation procedures approved by the Board. The Committee consists of voting and non-voting members from various groups within the Investment Manager’s organization, including operations and accounting, trading and investments, compliance, risk management and legal.
The Committee meets at least monthly to review and approve valuation matters, which may include a description of specific valuation determinations, data regarding pricing information received from approved pricing vendors and brokers and the results of Board-approved valuation control policies and procedures (the Policies). The Policies address, among other things, instances when market quotations are or are not readily available, including recommendations of third party pricing vendors and a determination of appropriate pricing methodologies; events that require specific valuation determinations and assessment of fair value techniques; securities with a potential for stale pricing, including those that are illiquid, restricted, or in default; and the effectiveness of third party pricing vendors, including periodic reviews of vendors. The Committee meets more frequently, as needed, to discuss additional valuation matters, which may include the need to review back-testing results, review time-sensitive information or approve related valuation actions. The Committee reports to the Board, with members of the Committee meeting with the Board at each of its regularly scheduled meetings to discuss valuation matters and actions during the period, similar to those described earlier.
For investments categorized as Level 3, the Committee monitors information similar to that described above, which may include: (i) data specific to the issuer or comparable issuers, (ii) general market or specific sector news and (iii) quoted prices and specific or similar security transactions. The Committee considers this data and any changes from prior periods in order to assess the reasonableness of observable and unobservable inputs, any assumptions or internal models used to value those securities and changes in fair value. This data is also used to corroborate, when available, information received from approved pricing vendors and brokers. Various factors impact the frequency of monitoring this information (which may occur as often as daily). However, the Committee may determine that changes to inputs, assumptions and models are not required as a result of the monitoring procedures performed.
The following table is a summary of the inputs used to value the Fund’s investments at February 28, 2019:
| | Level 1
quoted prices
in active
markets for
identical
assets ($) | Level 2
other
significant
observable
inputs ($) | Level 3
significant
unobservable
inputs ($) | Investments
measured at
net asset
value ($) | Total ($) |
| Investments in Securities | | | | | |
| Common Stocks | | | | | |
| Australia | — | 6,316,897 | — | — | 6,316,897 |
| Canada | 8,048,500 | — | — | — | 8,048,500 |
| China | — | 5,704,057 | 6 | — | 5,704,063 |
| France | — | 26,947,196 | — | — | 26,947,196 |
| Germany | — | 10,681,813 | — | — | 10,681,813 |
| Hong Kong | — | 10,732,850 | — | — | 10,732,850 |
| India | — | 2,283,671 | — | — | 2,283,671 |
| Indonesia | — | 3,786,679 | — | — | 3,786,679 |
| Ireland | 2,294,192 | 10,361,340 | — | — | 12,655,532 |
| Japan | — | 64,759,252 | — | — | 64,759,252 |
| Jersey | — | 5,020,878 | — | — | 5,020,878 |
| Malta | — | — | 3 | — | 3 |
| Netherlands | — | 11,654,531 | — | — | 11,654,531 |
| Singapore | — | 3,558,580 | — | — | 3,558,580 |
| Spain | — | 5,497,882 | — | — | 5,497,882 |
The accompanying Notes to Financial Statements are an integral part of this statement.
| 10 | Columbia Select International Equity Fund | Annual Report 2019 |
Portfolio of Investments (continued)
February 28, 2019
Fair value measurements (continued)
| | Level 1
quoted prices
in active
markets for
identical
assets ($) | Level 2
other
significant
observable
inputs ($) | Level 3
significant
unobservable
inputs ($) | Investments
measured at
net asset
value ($) | Total ($) |
| Sweden | — | 11,987,942 | — | — | 11,987,942 |
| Switzerland | — | 16,444,057 | — | — | 16,444,057 |
| United Kingdom | — | 54,780,628 | — | — | 54,780,628 |
| Total Common Stocks | 10,342,692 | 250,518,253 | 9 | — | 260,860,954 |
| Money Market Funds | — | — | — | 1,697,808 | 1,697,808 |
| Total Investments in Securities | 10,342,692 | 250,518,253 | 9 | 1,697,808 | 262,558,762 |
See the Portfolio of Investments for all investment classifications not indicated in the table.
The Fund’s assets assigned to the Level 2 input category are generally valued using the market approach, in which a security’s value is determined through reference to prices and information from market transactions for similar or identical assets. These assets include certain foreign securities for which a third party statistical pricing service may be employed for purposes of fair market valuation. The model utilized by such third party statistical pricing service takes into account a security’s correlation to available market data including, but not limited to, intraday index, ADR, and exchange-traded fund movements.
There were no transfers of financial assets between levels during the period.
The Fund does not hold any significant investments (greater than one percent of net assets) categorized as Level 3.
The Fund’s assets assigned to the Level 3 category are valued utilizing the valuation technique deemed the most appropriate in the circumstances. Certain common stocks classified as Level 3 securities are valued using the market approach. To determine fair value for these securities, management considered various factors which may have included, but were not limited to, the halt price of the security, the movement in observed market prices for other securities from the issuer, the movement in certain foreign or domestic market indices, and the position of the security within the respective company’s capital structure. Significant increases (decreases) to any of these inputs would result in a significantly higher (lower) fair value measurement.
The accompanying Notes to Financial Statements are an integral part of this statement.
Columbia Select International Equity Fund | Annual Report 2019
| 11 |
Statement of Assets and Liabilities
February 28, 2019
| Assets | |
| Investments in securities, at value | |
| Unaffiliated issuers (cost $226,083,223) | $260,860,954 |
| Affiliated issuers (cost $1,697,808) | 1,697,808 |
| Foreign currency (cost $4,743) | 4,618 |
| Receivable for: | |
| Capital shares sold | 20,965 |
| Dividends | 379,735 |
| Foreign tax reclaims | 926,214 |
| Expense reimbursement due from Investment Manager | 883 |
| Prepaid expenses | 1,418 |
| Total assets | 263,892,595 |
| Liabilities | |
| Payable for: | |
| Capital shares purchased | 208,790 |
| Management services fees | 6,293 |
| Distribution and/or service fees | 1,284 |
| Transfer agent fees | 38,593 |
| Compensation of board members | 238,523 |
| Compensation of chief compliance officer | 2 |
| Audit fees | 39,225 |
| Other expenses | 36,135 |
| Total liabilities | 568,845 |
| Net assets applicable to outstanding capital stock | $263,323,750 |
| Represented by | |
| Paid in capital | 245,774,031 |
| Total distributable earnings (loss) (Note 2) | 17,549,719 |
| Total - representing net assets applicable to outstanding capital stock | $263,323,750 |
The accompanying Notes to Financial Statements are an integral part of this statement.
| 12 | Columbia Select International Equity Fund | Annual Report 2019 |
Statement of Assets and Liabilities (continued)
February 28, 2019
| Class A | |
| Net assets | $175,021,375 |
| Shares outstanding | 12,728,996 |
| Net asset value per share | $13.75 |
| Maximum sales charge | 5.75% |
| Maximum offering price per share (calculated by dividing the net asset value per share by 1.0 minus the maximum sales charge for Class A shares) | $14.59 |
| Advisor Class | |
| Net assets | $518,143 |
| Shares outstanding | 36,619 |
| Net asset value per share | $14.15 |
| Class C | |
| Net assets | $2,589,393 |
| Shares outstanding | 216,020 |
| Net asset value per share | $11.99 |
| Institutional Class | |
| Net assets | $76,853,096 |
| Shares outstanding | 5,463,639 |
| Net asset value per share | $14.07 |
| Institutional 2 Class | |
| Net assets | $408,446 |
| Shares outstanding | 28,707 |
| Net asset value per share | $14.23 |
| Institutional 3 Class | |
| Net assets | $7,151,101 |
| Shares outstanding | 503,851 |
| Net asset value per share | $14.19 |
| Class R | |
| Net assets | $782,196 |
| Shares outstanding | 57,379 |
| Net asset value per share | $13.63 |
The accompanying Notes to Financial Statements are an integral part of this statement.
Columbia Select International Equity Fund | Annual Report 2019
| 13 |
Statement of Operations
Year Ended February 28, 2019
| Net investment income | |
| Income: | |
| Dividends — unaffiliated issuers | $8,212,028 |
| Dividends — affiliated issuers | 53,707 |
| Foreign taxes withheld | (563,062) |
| Total income | 7,702,673 |
| Expenses: | |
| Management services fees | 2,485,353 |
| Distribution and/or service fees | |
| Class A | 470,038 |
| Class C | 57,453 |
| Class R | 4,090 |
| Class T | 1,549 |
| Transfer agent fees | |
| Class A | 466,683 |
| Advisor Class | 1,460 |
| Class C | 13,992 |
| Institutional Class | 204,234 |
| Institutional 2 Class | 266 |
| Institutional 3 Class | 123 |
| Class K | 1 |
| Class R | 2,033 |
| Class T | 1,503 |
| Plan administration fees | |
| Class K | 2 |
| Compensation of board members | 5,775 |
| Custodian fees | 39,976 |
| Printing and postage fees | 72,513 |
| Registration fees | 112,728 |
| Audit fees | 65,874 |
| Legal fees | 9,283 |
| Interest on interfund lending | 150 |
| Compensation of chief compliance officer | 62 |
| Other | 13,198 |
| Total expenses | 4,028,339 |
| Fees waived or expenses reimbursed by Investment Manager and its affiliates | (311,603) |
| Expense reduction | (12,341) |
| Total net expenses | 3,704,395 |
| Net investment income | 3,998,278 |
| Realized and unrealized gain (loss) — net | |
| Net realized gain (loss) on: | |
| Investments — unaffiliated issuers | 17,815,346 |
| Investments — affiliated issuers | (474) |
| Foreign currency translations | (32,185) |
| Net realized gain | 17,782,687 |
| Net change in unrealized appreciation (depreciation) on: | |
| Investments — unaffiliated issuers | (37,501,609) |
| Investments — affiliated issuers | 83 |
| Foreign currency translations | (67,422) |
| Net change in unrealized appreciation (depreciation) | (37,568,948) |
| Net realized and unrealized loss | (19,786,261) |
| Net decrease in net assets resulting from operations | $(15,787,983) |
The accompanying Notes to Financial Statements are an integral part of this statement.
| 14 | Columbia Select International Equity Fund | Annual Report 2019 |
Statement of Changes in Net Assets
| | Year Ended
February 28, 2019 | Year Ended
February 28, 2018 |
| Operations | | |
| Net investment income | $3,998,278 | $3,190,544 |
| Net realized gain | 17,782,687 | 37,280,654 |
| Net change in unrealized appreciation (depreciation) | (37,568,948) | 28,538,231 |
| Net increase (decrease) in net assets resulting from operations | (15,787,983) | 69,009,429 |
| Distributions to shareholders | | |
| Net investment income and net realized gains | | |
| Class A | (4,252,126) | |
| Advisor Class | (14,568) | |
| Class C | (156,921) | |
| Institutional Class | (2,057,724) | |
| Institutional 2 Class | (9,218) | |
| Institutional 3 Class | (180,777) | |
| Class R | (15,845) | |
| Class T | (16,886) | |
| Net investment income | | |
| Class A | | (3,777,673) |
| Advisor Class | | (3,798) |
| Class B | | (2,866) |
| Class C | | (152,583) |
| Institutional Class | | (1,837,678) |
| Institutional 2 Class | | (3,551) |
| Institutional 3 Class | | (184,853) |
| Class K | | (631) |
| Class R | | (15,186) |
| Class T | | (23,587) |
| Total distributions to shareholders (Note 2) | (6,704,065) | (6,002,406) |
| Decrease in net assets from capital stock activity | (33,108,125) | (78,656,385) |
| Total decrease in net assets | (55,600,173) | (15,649,362) |
| Net assets at beginning of year | 318,923,923 | 334,573,285 |
| Net assets at end of year | $263,323,750 | $318,923,923 |
| Undistributed net investment income | $1,263,591 | $3,453,700 |
The accompanying Notes to Financial Statements are an integral part of this statement.
Columbia Select International Equity Fund | Annual Report 2019
| 15 |
Statement of Changes in Net Assets (continued)
| | Year Ended | Year Ended |
| | February 28, 2019 | February 28, 2018 |
| | Shares | Dollars ($) | Shares | Dollars ($) |
| Capital stock activity |
| Class A | | | | |
| Subscriptions | 679,422 | 9,697,135 | 379,942 | 5,164,539 |
| Distributions reinvested | 264,619 | 3,794,637 | 255,023 | 3,412,210 |
| Redemptions | (2,135,188) | (29,745,464) | (4,636,476) | (63,395,499) |
| Net decrease | (1,191,147) | (16,253,692) | (4,001,511) | (54,818,750) |
| Advisor Class | | | | |
| Subscriptions | 26,548 | 386,581 | 24,432 | 353,639 |
| Distributions reinvested | 982 | 14,469 | 271 | 3,724 |
| Redemptions | (21,240) | (288,452) | (8,744) | (128,264) |
| Net increase | 6,290 | 112,598 | 15,959 | 229,099 |
| Class B | | | | |
| Subscriptions | — | — | 7 | 89 |
| Distributions reinvested | — | — | 225 | 2,680 |
| Redemptions | — | — | (37,844) | (442,435) |
| Net decrease | — | — | (37,612) | (439,666) |
| Class C | | | | |
| Subscriptions | 21,702 | 257,763 | 23,073 | 280,693 |
| Distributions reinvested | 12,251 | 153,987 | 12,569 | 147,813 |
| Redemptions | (690,771) | (8,714,365) | (431,948) | (5,237,584) |
| Net decrease | (656,818) | (8,302,615) | (396,306) | (4,809,078) |
| Class I | | | | |
| Redemptions | — | — | (279) | (3,639) |
| Net decrease | — | — | (279) | (3,639) |
| Institutional Class | | | | |
| Subscriptions | 440,167 | 6,235,639 | 2,431,851 | 31,900,189 |
| Distributions reinvested | 120,748 | 1,768,962 | 116,243 | 1,587,879 |
| Redemptions | (1,079,645) | (15,248,429) | (2,090,408) | (29,533,705) |
| Net increase (decrease) | (518,730) | (7,243,828) | 457,686 | 3,954,363 |
| Institutional 2 Class | | | | |
| Subscriptions | 10,412 | 149,581 | 15,237 | 223,678 |
| Distributions reinvested | 618 | 9,151 | 254 | 3,501 |
| Redemptions | (6,042) | (86,429) | (1,009) | (14,516) |
| Net increase | 4,988 | 72,303 | 14,482 | 212,663 |
| Institutional 3 Class | | | | |
| Subscriptions | 25,132 | 363,159 | 15,988 | 236,053 |
| Distributions reinvested | 12,243 | 180,709 | 13,430 | 184,802 |
| Redemptions | (70,777) | (1,091,406) | (290,111) | (4,058,865) |
| Net decrease | (33,402) | (547,538) | (260,693) | (3,638,010) |
| Class K | | | | |
| Distributions reinvested | — | — | 43 | 585 |
| Redemptions | (2,577) | (39,476) | (1,538) | (20,446) |
| Net decrease | (2,577) | (39,476) | (1,495) | (19,861) |
| Class R | | | | |
| Subscriptions | 12,544 | 176,778 | 12,176 | 170,724 |
| Distributions reinvested | 1,055 | 15,036 | 1,083 | 14,402 |
| Redemptions | (13,263) | (184,271) | (39,332) | (549,749) |
| Net increase (decrease) | 336 | 7,543 | (26,073) | (364,623) |
The accompanying Notes to Financial Statements are an integral part of this statement.
| 16 | Columbia Select International Equity Fund | Annual Report 2019 |
Statement of Changes in Net Assets (continued)
| | Year Ended | Year Ended |
| | February 28, 2019 | February 28, 2018 |
| | Shares | Dollars ($) | Shares | Dollars ($) |
| Class T | | | | |
| Subscriptions | — | — | 6,585 | 83,093 |
| Distributions reinvested | 1,173 | 16,826 | 1,760 | 23,543 |
| Redemptions | (71,130) | (930,246) | (1,502,574) | (19,065,519) |
| Net decrease | (69,957) | (913,420) | (1,494,229) | (18,958,883) |
| Total net decrease | (2,461,017) | (33,108,125) | (5,730,071) | (78,656,385) |
The accompanying Notes to Financial Statements are an integral part of this statement.
Columbia Select International Equity Fund | Annual Report 2019
| 17 |
The following table is intended to help you understand the Fund’s financial performance. Certain information reflects financial results for a single share of a class held for the periods shown. Per share net investment income (loss) amounts are calculated based on average shares outstanding during the period. Total return assumes reinvestment of all dividends and distributions, if any. Total return does not reflect payment of sales charges, if any. Total return and portfolio turnover are not annualized for periods of less than one year. The portfolio turnover rate is calculated without regard to purchase and sales transactions of short-term instruments and certain derivatives, if any. If such transactions were included, the Fund’s portfolio turnover rate may be higher.
| | Net asset value,
beginning of
period | Net
investment
income
(loss) | Net
realized
and
unrealized
gain (loss) | Total from
investment
operations | Distributions
from net
investment
income | Total
distributions to
shareholders |
| Class A |
| Year Ended 2/28/2019 | $14.81 | 0.18 | (0.92) | (0.74) | (0.32) | (0.32) |
| Year Ended 2/28/2018 | $12.30 | 0.12 | 2.62 | 2.74 | (0.23) | (0.23) |
| Year Ended 2/28/2017 | $11.41 | 0.12 | 0.90 | 1.02 | (0.13) | (0.13) |
| Year Ended 2/29/2016 | $13.69 | 0.10 | (2.44) | (2.34) | — | — |
| Year Ended 2/28/2015 | $13.88 | 0.12 | (0.32) | (0.20) | — | — |
| Advisor Class |
| Year Ended 2/28/2019 | $15.24 | 0.22 | (0.96) | (0.74) | (0.35) | (0.35) |
| Year Ended 2/28/2018 | $12.64 | 0.10 | 2.76 | 2.86 | (0.26) | (0.26) |
| Year Ended 2/28/2017 | $11.73 | 0.07 | 1.00 | 1.07 | (0.16) | (0.16) |
| Year Ended 2/29/2016 | $14.04 | 0.15 | (2.52) | (2.37) | — | — |
| Year Ended 2/28/2015 | $14.20 | 0.24 | (0.41) | (0.17) | — | — |
| Class C |
| Year Ended 2/28/2019 | $12.94 | 0.18 | (0.92) | (0.74) | (0.21) | (0.21) |
| Year Ended 2/28/2018 | $10.77 | 0.03 | 2.28 | 2.31 | (0.14) | (0.14) |
| Year Ended 2/28/2017 | $10.00 | (0.01) | 0.81 | 0.80 | (0.03) | (0.03) |
| Year Ended 2/29/2016 | $12.08 | 0.00(j) | (2.13) | (2.13) | — | — |
| Year Ended 2/28/2015 | $12.34 | 0.02 | (0.29) | (0.27) | — | — |
| Institutional Class |
| Year Ended 2/28/2019 | $15.14 | 0.23 | (0.95) | (0.72) | (0.35) | (0.35) |
| Year Ended 2/28/2018 | $12.57 | 0.16 | 2.67 | 2.83 | (0.26) | (0.26) |
| Year Ended 2/28/2017 | $11.66 | 0.15 | 0.92 | 1.07 | (0.16) | (0.16) |
| Year Ended 2/29/2016 | $13.96 | 0.16 | (2.52) | (2.36) | — | — |
| Year Ended 2/28/2015 | $14.11 | 0.17 | (0.33) | (0.16) | — | — |
| Institutional 2 Class |
| Year Ended 2/28/2019 | $15.31 | 0.23 | (0.94) | (0.71) | (0.37) | (0.37) |
| Year Ended 2/28/2018 | $12.70 | 0.12 | 2.77 | 2.89 | (0.28) | (0.28) |
| Year Ended 2/28/2017 | $11.79 | 0.16 | 0.94 | 1.10 | (0.19) | (0.19) |
| Year Ended 2/29/2016 | $14.08 | 0.17 | (2.52) | (2.35) | — | — |
| Year Ended 2/28/2015 | $14.21 | 0.12 | (0.26) | (0.14) | — | — |
The accompanying Notes to Financial Statements are an integral part of this statement.
| 18 | Columbia Select International Equity Fund | Annual Report 2019 |
Financial Highlights (continued)
| | Proceeds from
regulatory
settlements | Net
asset
value,
end of
period | Total
return | Total gross
expense
ratio to
average
net assets(a) | Total net
expense
ratio to
average
net assets(a),(b) | Net investment
income (loss)
ratio to
average
net assets | Portfolio
turnover | Net
assets,
end of
period
(000’s) |
| Class A |
| Year Ended 2/28/2019 | — | $13.75 | (5.10%) | 1.48%(c) | 1.36%(c),(d) | 1.31% | 34% | $175,021 |
| Year Ended 2/28/2018 | — | $14.81 | 22.50% | 1.50% | 1.40%(d) | 0.89% | 34% | $206,109 |
| Year Ended 2/28/2017 | — | $12.30 | 8.98% | 1.44%(e),(f) | 1.33%(d),(e),(f) | 1.02% | 103% | $220,357 |
| Year Ended 2/29/2016 | 0.06 | $11.41 | (16.65%)(g) | 1.45%(e) | 1.42%(d),(e) | 0.78% | 131% | $210,841 |
| Year Ended 2/28/2015 | 0.01 | $13.69 | (1.37%)(h) | 1.49% | 1.47%(d) | 0.94% | 96% | $274,993 |
| Advisor Class |
| Year Ended 2/28/2019 | — | $14.15 | (4.93%) | 1.23%(c) | 1.12%(c),(d) | 1.51% | 34% | $518 |
| Year Ended 2/28/2018 | — | $15.24 | 22.89% | 1.24% | 1.15%(d) | 0.70% | 34% | $462 |
| Year Ended 2/28/2017 | — | $12.64 | 9.18% | 1.18%(e),(f) | 1.06%(d),(e),(f) | 0.57% | 103% | $182 |
| Year Ended 2/29/2016 | 0.06 | $11.73 | (16.45%)(g) | 1.21%(e) | 1.18%(d),(e) | 1.16% | 131% | $22 |
| Year Ended 2/28/2015 | 0.01 | $14.04 | (1.13%)(h) | 1.25% | 1.21%(i) | 1.77% | 96% | $3 |
| Class C |
| Year Ended 2/28/2019 | — | $11.99 | (5.77%) | 2.23%(c) | 2.12%(c),(d) | 1.47% | 34% | $2,589 |
| Year Ended 2/28/2018 | — | $12.94 | 21.62% | 2.25% | 2.15%(d) | 0.22% | 34% | $11,296 |
| Year Ended 2/28/2017 | — | $10.77 | 8.02% | 2.18%(e),(f) | 2.07%(d),(e),(f) | (0.06%) | 103% | $13,673 |
| Year Ended 2/29/2016 | 0.05 | $10.00 | (17.22%)(g) | 2.20%(e) | 2.18%(d),(e) | 0.02% | 131% | $7,886 |
| Year Ended 2/28/2015 | 0.01 | $12.08 | (2.11%)(h) | 2.24% | 2.22%(d) | 0.19% | 96% | $11,042 |
| Institutional Class |
| Year Ended 2/28/2019 | — | $14.07 | (4.83%) | 1.23%(c) | 1.12%(c),(d) | 1.57% | 34% | $76,853 |
| Year Ended 2/28/2018 | — | $15.14 | 22.76% | 1.25% | 1.15%(d) | 1.14% | 34% | $90,578 |
| Year Ended 2/28/2017 | — | $12.57 | 9.25% | 1.19%(e),(f) | 1.08%(d),(e),(f) | 1.20% | 103% | $69,419 |
| Year Ended 2/29/2016 | 0.06 | $11.66 | (16.48%)(g) | 1.19%(e) | 1.17%(d),(e) | 1.20% | 131% | $64,631 |
| Year Ended 2/28/2015 | 0.01 | $13.96 | (1.06%)(h) | 1.24% | 1.22%(d) | 1.23% | 96% | $179,330 |
| Institutional 2 Class |
| Year Ended 2/28/2019 | — | $14.23 | (4.72%) | 1.05%(c) | 0.99%(c) | 1.62% | 34% | $408 |
| Year Ended 2/28/2018 | — | $15.31 | 23.00% | 1.08% | 1.02% | 0.81% | 34% | $363 |
| Year Ended 2/28/2017 | — | $12.70 | 9.33% | 0.96%(e),(f) | 0.93%(e),(f) | 1.33% | 103% | $117 |
| Year Ended 2/29/2016 | 0.06 | $11.79 | (16.26%)(g) | 1.01%(e) | 1.01%(e) | 1.23% | 131% | $59 |
| Year Ended 2/28/2015 | 0.01 | $14.08 | (0.91%)(h) | 1.01% | 1.01% | 0.86% | 96% | $59 |
The accompanying Notes to Financial Statements are an integral part of this statement.
Columbia Select International Equity Fund | Annual Report 2019
| 19 |
Financial Highlights (continued)
| | Net asset value,
beginning of
period | Net
investment
income
(loss) | Net
realized
and
unrealized
gain (loss) | Total from
investment
operations | Distributions
from net
investment
income | Total
distributions to
shareholders |
| Institutional 3 Class |
| Year Ended 2/28/2019 | $15.27 | 0.25 | (0.95) | (0.70) | (0.38) | (0.38) |
| Year Ended 2/28/2018 | $12.67 | 0.19 | 2.70 | 2.89 | (0.29) | (0.29) |
| Year Ended 2/28/2017 | $11.76 | 0.19 | 0.91 | 1.10 | (0.19) | (0.19) |
| Year Ended 2/29/2016 | $14.04 | 0.17 | (2.51) | (2.34) | — | — |
| Year Ended 2/28/2015 | $14.16 | 0.19 | (0.32) | (0.13) | — | — |
| Class R |
| Year Ended 2/28/2019 | $14.69 | 0.14 | (0.92) | (0.78) | (0.28) | (0.28) |
| Year Ended 2/28/2018 | $12.20 | 0.09 | 2.60 | 2.69 | (0.20) | (0.20) |
| Year Ended 2/28/2017 | $11.32 | 0.07 | 0.91 | 0.98 | (0.10) | (0.10) |
| Year Ended 2/29/2016 | $13.62 | 0.07 | (2.43) | (2.36) | — | — |
| Year Ended 2/28/2015 | $13.84 | 0.10 | (0.33) | (0.23) | — | — |
| Notes to Financial Highlights |
| (a) | In addition to the fees and expenses that the Fund bears directly, the Fund indirectly bears a pro rata share of the fees and expenses of any other funds in which it invests. Such indirect expenses are not included in the Fund’s reported expense ratios. |
| (b) | Total net expenses include the impact of certain fee waivers/expense reimbursements made by the Investment Manager and certain of its affiliates, if applicable. |
| (c) | Ratios include interfund lending expense which is less than 0.01%. |
| (d) | The benefits derived from expense reductions had an impact of less than 0.01%. |
| (e) | Ratios include line of credit interest expense which is less than 0.01%. |
| (f) | Expenses have been reduced due to a reimbursement of expenses overbilled by a third party. If the reimbursement had been excluded, the expense ratios would have been higher by the percentages shown for each class in the table below. All fee waivers and expense reimbursements by the Investment Manager and its affiliates were applied before giving effect to this third party reimbursement. |
| Year Ended | Class A | Advisor
Class | Class C | Institutional
Class | Institutional 2
Class | Institutional 3
Class | Class R |
| 02/28/2017 | 0.08% | 0.10% | 0.09% | 0.08% | 0.08% | 0.08% | 0.08% |
| (g) | The Fund received proceeds from regulatory settlements. Had the Fund not received these proceeds, the total return would have been lower by 0.44%. |
| (h) | The Fund received proceeds from regulatory settlements. Had the Fund not received these proceeds, the total return would have been lower by 0.10%. |
| (i) | The benefits derived from expense reductions had an impact of 0.01%. |
| (j) | Rounds to zero. |
The accompanying Notes to Financial Statements are an integral part of this statement.
| 20 | Columbia Select International Equity Fund | Annual Report 2019 |
Financial Highlights (continued)
| | Proceeds from
regulatory
settlements | Net
asset
value,
end of
period | Total
return | Total gross
expense
ratio to
average
net assets(a) | Total net
expense
ratio to
average
net assets(a),(b) | Net investment
income (loss)
ratio to
average
net assets | Portfolio
turnover | Net
assets,
end of
period
(000’s) |
| Institutional 3 Class |
| Year Ended 2/28/2019 | — | $14.19 | (4.68%) | 0.98%(c) | 0.92%(c) | 1.73% | 34% | $7,151 |
| Year Ended 2/28/2018 | — | $15.27 | 23.03% | 1.00% | 0.95% | 1.36% | 34% | $8,203 |
| Year Ended 2/28/2017 | — | $12.67 | 9.42% | 0.90%(e),(f) | 0.88%(e),(f) | 1.56% | 103% | $10,108 |
| Year Ended 2/29/2016 | 0.06 | $11.76 | (16.24%)(g) | 0.95%(e) | 0.95%(e) | 1.26% | 131% | $11,312 |
| Year Ended 2/28/2015 | 0.01 | $14.04 | (0.85%)(h) | 0.96% | 0.96% | 1.41% | 96% | $15,568 |
| Class R |
| Year Ended 2/28/2019 | — | $13.63 | (5.37%) | 1.73%(c) | 1.62%(c),(d) | 1.02% | 34% | $782 |
| Year Ended 2/28/2018 | — | $14.69 | 22.24% | 1.75% | 1.65%(d) | 0.68% | 34% | $838 |
| Year Ended 2/28/2017 | — | $12.20 | 8.66% | 1.68%(e),(f) | 1.58%(d),(e),(f) | 0.55% | 103% | $1,014 |
| Year Ended 2/29/2016 | 0.06 | $11.32 | (16.89%)(g) | 1.70%(e) | 1.67%(d),(e) | 0.54% | 131% | $808 |
| Year Ended 2/28/2015 | 0.01 | $13.62 | (1.59%)(h) | 1.74% | 1.72%(d) | 0.72% | 96% | $1,563 |
The accompanying Notes to Financial Statements are an integral part of this statement.
Columbia Select International Equity Fund | Annual Report 2019
| 21 |
Notes to Financial Statements
February 28, 2019
Note 1. Organization
Columbia Select International Equity Fund (the Fund), a series of Columbia Funds Series Trust (the Trust), is a diversified fund. The Trust is registered under the Investment Company Act of 1940, as amended (the 1940 Act), as an open-end management investment company organized as a Delaware statutory trust.
Fund shares
The Trust may issue an unlimited number of shares (without par value). Although all share classes generally have identical voting, dividend and liquidation rights, each share class votes separately when required by the Trust’s organizational documents or by law. Different share classes pay different distribution amounts to the extent the expenses of such share classes differ, and distributions in liquidation will be proportional to the net asset value of each share class. Each share class has its own expense and sales charge structure. The Fund offers each of the share classes identified below.
Class A shares are subject to a maximum front-end sales charge of 5.75% based on the initial investment amount. Class A shares purchased without an initial sales charge in accounts aggregating $1 million to $50 million at the time of purchase are subject to a contingent deferred sales charge (CDSC) if the shares are sold within 18 months after purchase, charged as follows: 1.00% CDSC if redeemed within 12 months after purchase, and 0.50% CDSC if redeemed more than 12, but less than 18, months after purchase.
Advisor Class shares are not subject to sales charges and are generally available only to omnibus retirement plans and certain investors as described in the Fund’s prospectus.
Class C shares are subject to a 1.00% CDSC on shares redeemed within 12 months after purchase. Effective July 1, 2018, Class C shares automatically convert to Class A shares of the same Fund in the month of or the month following the 10-year anniversary of the Class C shares purchase date.
Institutional Class shares are not subject to sales charges and are generally available only to eligible investors, which are subject to different investment minimums as described in the Fund’s prospectus.
Institutional 2 Class shares are not subject to sales charges and are generally available only to investors purchasing through authorized investment professionals and omnibus retirement plans as described in the Fund’s prospectus.
Institutional 3 Class shares are not subject to sales charges and are available to institutional and certain other investors as described in the Fund’s prospectus.
The Fund no longer accepts investments by existing investors in Class K shares. When available, Class K shares were not subject to sales charges and were made available only to existing investors in Class K shares. On March 9, 2018, Class K shares were redeemed or exchanged for Advisor Class shares of the Fund in a tax free transaction that had no impact on fees and expenses paid by the shareholders.
Class R shares are not subject to sales charges and are generally available only to certain retirement plans and other investors as described in the Fund’s prospectus.
Class T shares were subject to a maximum front-end sales charge of 2.50% per transaction and were required to be purchased through financial intermediaries that, by written agreement with Columbia Management Investment Distributors, Inc., were specifically authorized to sell Class T shares. Effective at the close of business on December 14, 2018, Class T shares merged, in a tax-free transaction, into Class A shares of the Fund and are no longer offered for sale.
Note 2. Summary of significant accounting policies
Basis of preparation
The Fund is an investment company that applies the accounting and reporting guidance in the Financial Accounting Standards Board (FASB) Accounting Standards Codification Topic 946,Financial Services - Investment Companies (ASC 946). The financial statements are prepared in accordance with U.S. generally accepted accounting principles (GAAP), which
| 22 | Columbia Select International Equity Fund | Annual Report 2019 |
Notes to Financial Statements (continued)
February 28, 2019
requires management to make certain estimates and assumptions that affect the reported amounts of assets and liabilities, the disclosure of contingent assets and liabilities at the date of the financial statements and the reported amounts of income and expenses during the reporting period. Actual results could differ from those estimates.
The following is a summary of significant accounting policies followed by the Fund in the preparation of its financial statements.
Security valuation
All equity securities are valued at the close of business of the New York Stock Exchange. Equity securities are valued at the last quoted sales price on the principal exchange or market on which they trade, except for securities traded on the NASDAQ Stock Market, which are valued at the NASDAQ official close price. Unlisted securities or listed securities for which there were no sales during the day are valued at the mean of the latest quoted bid and ask prices on such exchanges or markets.
Foreign equity securities are valued based on the closing price on the foreign exchange in which such securities are primarily traded. If any foreign equity security closing prices are not readily available, the securities are valued at the mean of the latest quoted bid and ask prices on such exchanges or markets. Foreign currency exchange rates are generally determined at 4:00 p.m. Eastern (U.S.) time. Many securities markets and exchanges outside the U.S. close prior to the close of the New York Stock Exchange; therefore, the closing prices for securities in such markets or on such exchanges may not fully reflect events that occur after such close but before the close of the New York Stock Exchange. In those situations, foreign securities will be fair valued pursuant to a policy adopted by the Board of Trustees, including, if available, utilizing a third party pricing service to determine these fair values. The third party pricing service takes into account multiple factors, including, but not limited to, movements in the U.S. securities markets, certain depositary receipts, futures contracts and foreign exchange rates that have occurred subsequent to the close of the foreign exchange or market, to determine a good faith estimate that reasonably reflects the current market conditions as of the close of the New York Stock Exchange. The fair value of a security is likely to be different from the quoted or published price, if available.
Investments in open-end investment companies, including money market funds, are valued at their latest net asset value.
Investments for which market quotations are not readily available, or that have quotations which management believes are not reflective of market value or reliable, are valued at fair value as determined in good faith under procedures approved by and under the general supervision of the Board of Trustees. If a security or class of securities (such as foreign securities) is valued at fair value, such value is likely to be different from the quoted or published price for the security.
The determination of fair value often requires significant judgment. To determine fair value, management may use assumptions including but not limited to future cash flows and estimated risk premiums. Multiple inputs from various sources may be used to determine fair value.
GAAP requires disclosure regarding the inputs and valuation techniques used to measure fair value and any changes in valuation inputs or techniques. In addition, investments shall be disclosed by major category. This information is disclosed following the Fund’s Portfolio of Investments.
Foreign currency transactions and translations
The values of all assets and liabilities denominated in foreign currencies are generally translated into U.S. dollars at exchange rates determined at the close of regular trading on the New York Stock Exchange. Net realized and unrealized gains (losses) on foreign currency transactions and translations include gains (losses) arising from the fluctuation in exchange rates between trade and settlement dates on securities transactions, gains (losses) arising from the disposition of foreign currency and currency gains (losses) between the accrual and payment dates on dividends, interest income and foreign withholding taxes.
For financial statement purposes, the Fund does not distinguish that portion of gains (losses) on investments which is due to changes in foreign exchange rates from that which is due to changes in market prices of the investments. Such fluctuations are included with the net realized and unrealized gains (losses) on investments in the Statement of Operations.
Columbia Select International Equity Fund | Annual Report 2019
| 23 |
Notes to Financial Statements (continued)
February 28, 2019
Security transactions
Security transactions are accounted for on the trade date. Cost is determined and gains (losses) are based upon the specific identification method for both financial statement and federal income tax purposes.
Income recognition
Corporate actions and dividend income are generally recorded net of any non-reclaimable tax withholdings, on the ex-dividend date or upon receipt of ex-dividend notification in the case of certain foreign securities.
The Fund may receive distributions from holdings in equity securities, business development companies (BDCs), exchange-traded funds (ETFs), limited partnerships (LPs), other regulated investment companies (RICs), and real estate investment trusts (REITs), which report information on the tax character of their distributions annually. These distributions are allocated to dividend income, capital gain and return of capital based on actual information reported. Return of capital is recorded as a reduction of the cost basis of securities held. If the Fund no longer owns the applicable securities, return of capital is recorded as a realized gain. With respect to REITs, to the extent actual information has not yet been reported, estimates for return of capital are made by the Fund’s management. Management’s estimates are subsequently adjusted when the actual character of the distributions is disclosed by the REITs, which could result in a proportionate change in return of capital to shareholders.
Awards from class action litigation are recorded as a reduction of cost basis if the Fund still owns the applicable securities on the payment date. If the Fund no longer owns the applicable securities, the proceeds are recorded as realized gains.
Expenses
General expenses of the Trust are allocated to the Fund and other funds of the Trust based upon relative net assets or other expense allocation methodologies determined by the nature of the expense. Expenses directly attributable to the Fund are charged to the Fund. Expenses directly attributable to a specific class of shares are charged to that share class.
Determination of class net asset value
All income, expenses (other than class-specific expenses, which are charged to that share class, as shown in the Statement of Operations) and realized and unrealized gains (losses) are allocated to each class of the Fund on a daily basis, based on the relative net assets of each class, for purposes of determining the net asset value of each class.
Federal income tax status
The Fund intends to qualify each year as a regulated investment company under Subchapter M of the Internal Revenue Code, as amended, and will distribute substantially all of its investment company taxable income and net capital gain, if any, for its tax year, and as such will not be subject to federal income taxes. In addition, the Fund intends to distribute in each calendar year substantially all of its ordinary income, capital gain net income and certain other amounts, if any, such that the Fund should not be subject to federal excise tax. Therefore, no federal income or excise tax provision is recorded.
Foreign taxes
The Fund may be subject to foreign taxes on income, gains on investments or currency repatriation, a portion of which may be recoverable. The Fund will accrue such taxes and recoveries, as applicable, based upon its current interpretation of tax rules and regulations that exist in the markets in which it invests.
Realized gains in certain countries may be subject to foreign taxes at the Fund level, based on statutory rates. The Fund accrues for such foreign taxes on realized and unrealized gains at the appropriate rate for each jurisdiction, as applicable. The amount, if any, is disclosed as a liability on the Statement of Assets and Liabilities.
Distributions to shareholders
Distributions from net investment income, if any, are declared and paid semi-annually. Net realized capital gains, if any, are distributed at least annually. Income distributions and capital gain distributions are determined in accordance with federal income tax regulations, which may differ from GAAP.
| 24 | Columbia Select International Equity Fund | Annual Report 2019 |
Notes to Financial Statements (continued)
February 28, 2019
Guarantees and indemnifications
Under the Trust’s organizational documents and, in some cases, by contract, its officers and trustees are indemnified against certain liabilities arising out of the performance of their duties to the Trust or its funds. In addition, certain of the Fund’s contracts with its service providers contain general indemnification clauses. The Fund’s maximum exposure under these arrangements is unknown since the amount of any future claims that may be made against the Fund cannot be determined, and the Fund has no historical basis for predicting the likelihood of any such claims.
Recent accounting pronouncements
Accounting Standards Update 2017-08 Premium Amortization on Purchased Callable Debt Securities
In March 2017, the Financial Accounting Standards Board issued Accounting Standards Update (ASU) No. 2017-08 Premium Amortization on Purchased Callable Debt Securities. ASU No. 2017-08 updates the accounting standards to shorten the amortization period for certain purchased callable debt securities, held at a premium, to be amortized to the earliest call date. The update applies to securities with explicit, noncontingent call features that are callable at fixed prices and on preset dates. The standard is effective for annual periods beginning after December 15, 2018 and interim periods within those fiscal years. Management does not expect the implementation of this guidance to have a material impact on the financial statement amounts and footnote disclosures.
Accounting Standards Update 2018-13 Disclosure Framework - Changes to the Disclosure Requirements for Fair Value Measurement
In August 2018, the Financial Accounting Standards Board issued Accounting Standards Update (ASU) No. 2018-13 Disclosure Framework - Changes to the Disclosure Requirements for Fair Value Measurement. ASU No. 2018-13, in addition to other modifications and additions, removes the requirement to disclose the amount and reasons for transfers between Level 1 and Level 2 of the fair value hierarchy and the policy for the timing of transfers between levels. The standard is effective for annual periods beginning after December 15, 2019 and interim periods within those fiscal years. At this time, management is evaluating the implication of this guidance and the impact it will have on the financial statement disclosures, if any.
Disclosure Update and Simplification
In September 2018, the Securities and Exchange Commission (SEC) released Final Rule 33-10532, Disclosure Update and Simplification, which amends certain financial statement disclosure requirements that the SEC determined to be redundant, outdated, or superseded in light of other SEC disclosure requirements, GAAP, or changes in the information environment. As a result of the amendments, management implemented disclosure changes which included removing the components of distributable earnings presented on the Statement of Assets and Liabilities and combining income and gain distributions paid to shareholders as presented on the Statement of Changes in Net Assets. Any values presented to meet prior year requirements were left unchanged. The amendments had no effect on the Fund’s net assets or results of operation.
Note 3. Fees and other transactions with affiliates
Management services fees
The Fund has entered into a Management Agreement with Columbia Management Investment Advisers, LLC (the Investment Manager), a wholly-owned subsidiary of Ameriprise Financial, Inc. (Ameriprise Financial). Under the Management Agreement, the Investment Manager provides the Fund with investment research and advice, as well as administrative and accounting services. The management services fee is an annual fee that is equal to a percentage of the Fund’s daily net assets that declines from 0.87% to 0.67% as the Fund’s net assets increase. The effective management services fee rate for the year ended February 28, 2019 was 0.87% of the Fund’s average daily net assets.
Columbia Select International Equity Fund | Annual Report 2019
| 25 |
Notes to Financial Statements (continued)
February 28, 2019
Subadvisory agreement
The Investment Manager has entered into a Subadvisory Agreement with Threadneedle International Limited (Threadneedle), an affiliate of the Investment Manager and an indirect wholly-owned subsidiary of Ameriprise Financial, to serve as the subadviser to the Fund. The Investment Manager compensates Threadneedle to manage the investment of the Fund’s assets.
Compensation of board members
Members of the Board of Trustees who are not officers or employees of the Investment Manager or Ameriprise Financial are compensated for their services to the Fund as disclosed in the Statement of Operations. Under a Deferred Compensation Plan (the Deferred Plan), these members of the Board of Trustees may elect to defer payment of up to 100% of their compensation. Deferred amounts are treated as though equivalent dollar amounts had been invested in shares of certain funds managed by the Investment Manager. The Fund’s liability for these amounts is adjusted for market value changes and remains in the Fund until distributed in accordance with the Deferred Plan. All amounts payable under the Deferred Plan constitute a general unsecured obligation of the Fund.
Compensation of Chief Compliance Officer
The Board of Trustees has appointed a Chief Compliance Officer to the Fund in accordance with federal securities regulations. As disclosed in the Statement of Operations, a portion of the Chief Compliance Officer’s total compensation is allocated to the Fund, along with other allocations to affiliated registered investment companies managed by the Investment Manager and its affiliates, based on relative net assets.
Transfer agency fees
Under a Transfer and Dividend Disbursing Agent Agreement, Columbia Management Investment Services Corp. (the Transfer Agent), an affiliate of the Investment Manager and a wholly-owned subsidiary of Ameriprise Financial, is responsible for providing transfer agency services to the Fund. The Transfer Agent has contracted with DST Asset Manager Solutions, Inc. (DST) to serve as sub-transfer agent. The Transfer Agent pays the fees of DST for services as sub-transfer agent and DST is not entitled to reimbursement for such fees from the Fund (with the exception of out-of-pocket fees).
The Fund pays the Transfer Agent a monthly transfer agency fee based on the number or the average value of accounts, depending on the type of account. In addition, the Fund pays the Transfer Agent a fee for shareholder services based on the number of accounts or on a percentage of the average aggregate value of the Fund’s shares maintained in omnibus accounts up to the lesser of the amount charged by the financial intermediary or a cap established by the Board of Trustees from time to time.
The Transfer Agent also receives compensation from the Fund for various shareholder services and reimbursements for certain out-of-pocket fees. Total transfer agency fees for Class K, Institutional 2 Class and Institutional 3 Class shares are subject to an annual limitation of not more than 0.07%, 0.07% and 0.02%, respectively, of the average daily net assets attributable to each share class.
For the year ended February 28, 2019, the Fund’s effective transfer agency fee rates as a percentage of average daily net assets of each class were as follows:
| | Effective rate (%) |
| Class A | 0.25 |
| Advisor Class | 0.25 |
| Class C | 0.25 |
| Institutional Class | 0.25 |
| Institutional 2 Class | 0.07 |
| Institutional 3 Class | 0.00 |
| Class K | 0.00(a) |
| Class R | 0.25 |
| Class T | 0.19(a) |
| 26 | Columbia Select International Equity Fund | Annual Report 2019 |
Notes to Financial Statements (continued)
February 28, 2019
An annual minimum account balance fee of $20 may apply to certain accounts with a value below the applicable share class’s initial minimum investment requirements to reduce the impact of small accounts on transfer agency fees. These minimum account balance fees are remitted to the Fund and recorded as part of expense reductions in the Statement of Operations. For the year ended February 28, 2019, these minimum account balance fees reduced total expenses of the Fund by $12,341.
Plan administration fees
Under a Plan Administration Services Agreement with the Transfer Agent, the Fund paid an annual fee at a rate of 0.25% of the Fund’s average daily net assets attributable to Class K shares for the provision of various administrative, recordkeeping, communication and educational services. As a result of all Class K shares of the Fund being redeemed or exchanged for Advisor Class shares, March 9, 2018 was the last day the Fund paid a plan administration fee for Class K shares.
Distribution and service fees
The Fund has entered into an agreement with Columbia Management Investment Distributors, Inc. (the Distributor), an affiliate of the Investment Manager and a wholly-owned subsidiary of Ameriprise Financial, for distribution and shareholder services. The Board of Trustees has approved, and the Fund has adopted, distribution and shareholder service plans (the Plans) applicable to certain share classes, which set the distribution and service fees for the Fund. These fees are calculated daily and are intended to compensate the Distributor and/or eligible selling and/or servicing agents for selling shares of the Fund and providing services to investors.
Under the Plans, the Fund pays a monthly combined distribution and service fee to the Distributor at the maximum annual rate of 0.25% of the average daily net assets attributable to Class A shares of the Fund. Also under the Plans, the Fund pays a monthly service fee to the Distributor at the maximum annual rate of 0.25% of the average daily net assets attributable to Class C and Class T shares of the Fund and a monthly distribution fee to the Distributor at the maximum annual rates of 0.75%, 0.50% and 0.25% of the average daily net assets attributable to Class C, Class R and Class T shares of the Fund, respectively. As a result of all Class T shares of the Fund being redeemed or converted to Class A shares, December 14, 2018 was the last day the Fund paid a service fee or distribution fee for Class T shares.
Although the Fund may pay a distribution fee up to 0.25% of the Fund’s average daily net assets attributable to Class T shares and a service fee of up to 0.25% of the Fund’s average daily net assets attributable to Class T shares, the aggregate fee shall not exceed 0.25% of the Fund’s average daily net assets attributable to Class T shares.
Sales charges (unaudited)
Sales charges, including front-end charges and CDSCs, received by the Distributor for distributing Fund shares for the year ended February 28, 2019, if any, are listed below:
| | Amount ($) |
| Class A | 10,570 |
| Class C | 329 |
Columbia Select International Equity Fund | Annual Report 2019
| 27 |
Notes to Financial Statements (continued)
February 28, 2019
Expenses waived/reimbursed by the Investment Manager and its affiliates
The Investment Manager and certain of its affiliates have contractually agreed to waive fees and/or reimburse expenses (excluding certain fees and expenses described below) for the period(s) disclosed below, unless sooner terminated at the sole discretion of the Board of Trustees, so that the Fund’s net operating expenses, after giving effect to fees waived/expenses reimbursed and any balance credits and/or overdraft charges from the Fund’s custodian, do not exceed the following annual rate(s) as a percentage of the class’ average daily net assets:
| | July 1, 2018
through
June 30, 2019 | Prior to
July 1, 2018 |
| Class A | 1.35% | 1.40% |
| Advisor Class | 1.10 | 1.15 |
| Class C | 2.10 | 2.15 |
| Institutional Class | 1.10 | 1.15 |
| Institutional 2 Class | 0.97 | 1.025 |
| Institutional 3 Class | 0.90 | 0.975 |
| Class R | 1.60 | 1.65 |
Under the agreement governing these fee waivers and/or expense reimbursement arrangements, the following fees and expenses are excluded from the waiver/reimbursement commitment, and therefore will be paid by the Fund, if applicable: taxes (including foreign transaction taxes), expenses associated with investments in affiliated and non-affiliated pooled investment vehicles (including mutual funds and exchange-traded funds), transaction costs and brokerage commissions, costs related to any securities lending program, dividend expenses associated with securities sold short, inverse floater program fees and expenses, transaction charges and interest on borrowed money, interest, infrequent and/or unusual expenses and any other expenses the exclusion of which is specifically approved by the Board of Trustees. This agreement may be modified or amended only with approval from the Investment Manager, certain of its affiliates and the Fund. Any fees waived and/or expenses reimbursed under the expense reimbursement arrangements described above are not recoverable by the Investment Manager or its affiliates in future periods.
Note 4. Federal tax information
The timing and character of income and capital gain distributions are determined in accordance with income tax regulations, which may differ from GAAP because of temporary or permanent book to tax differences.
At February 28, 2019, these differences were primarily due to differing treatment for deferral/reversal of wash sale losses, passive foreign investment company (PFIC) holdings, capital loss carryforwards, trustees’ deferred compensation and foreign currency transactions. To the extent these differences were permanent, reclassifications were made among the components of the Fund’s net assets. Temporary differences do not require reclassifications.
The following reclassifications were made:
Undistributed net
investment
income ($) | Accumulated
net realized
(loss) ($) | Paid in
capital ($) |
| 515,678 | (515,678) | — |
Net investment income (loss) and net realized gains (losses), as disclosed in the Statement of Operations, and net assets were not affected by this reclassification.
The tax character of distributions paid during the years indicated was as follows:
| Year Ended February 28, 2019 | Year Ended February 28, 2018 |
Ordinary
income ($) | Long-term
capital gains ($) | Total ($) | Ordinary
income ($) | Long-term
capital gains ($) | Total ($) |
| 6,704,065 | — | 6,704,065 | 6,002,406 | — | 6,002,406 |
| 28 | Columbia Select International Equity Fund | Annual Report 2019 |
Notes to Financial Statements (continued)
February 28, 2019
Short-term capital gain distributions, if any, are considered ordinary income distributions for tax purposes.
At February 28, 2019, the components of distributable earnings on a tax basis were as follows:
Undistributed
ordinary income ($) | Undistributed
long-term
capital gains ($) | Capital loss
carryforwards ($) | Net unrealized
appreciation ($) |
| 3,703,253 | — | (17,775,303) | 31,868,928 |
At February 28, 2019, the cost of all investments for federal income tax purposes along with the aggregate gross unrealized appreciation and depreciation based on that cost was:
Federal
tax cost ($) | Gross unrealized
appreciation ($) | Gross unrealized
(depreciation) ($) | Net unrealized
appreciation ($) |
| 230,689,834 | 48,613,317 | (16,744,389) | 31,868,928 |
Tax cost of investments and unrealized appreciation/(depreciation) may also include timing differences that do not constitute adjustments to tax basis.
The following capital loss carryforwards, determined at February 28, 2019, may be available to reduce taxable income arising from future net realized gains on investments, if any, to the extent permitted by the Internal Revenue Code. Capital loss carryforwards with no expiration are required to be utilized prior to any capital losses which carry an expiration date. As a result of this ordering rule, capital loss carryforwards which carry an expiration date may be more likely to expire unused. In addition, for the year ended February 28, 2019, capital loss carryforwards utilized and expired unused, if any, were as follows:
No expiration
short-term ($) | No expiration
long-term ($) | Total ($) | Utilized ($) | Expired ($) |
| 17,775,303 | — | 17,775,303 | 16,516,436 | — |
Management of the Fund has concluded that there are no significant uncertain tax positions in the Fund that would require recognition in the financial statements. However, management’s conclusion may be subject to review and adjustment at a later date based on factors including, but not limited to, new tax laws, regulations, and administrative interpretations (including relevant court decisions). Generally, the Fund’s federal tax returns for the prior three fiscal years remain subject to examination by the Internal Revenue Service.
Note 5. Portfolio information
The cost of purchases and proceeds from sales of securities, excluding short-term investments and derivatives, if any, aggregated to $94,805,174 and $126,795,482, respectively, for the year ended February 28, 2019. The amount of purchase and sale activity impacts the portfolio turnover rate reported in the Financial Highlights.
Note 6. Affiliated money market fund
The Fund invests in Columbia Short-Term Cash Fund, an affiliated money market fund established for the exclusive use by the Fund and other affiliated funds (the Affiliated MMF). The income earned by the Fund from such investments is included as Dividends - affiliated issuers in the Statement of Operations. As an investing fund, the Fund indirectly bears its proportionate share of the expenses of the Affiliated MMF. The Affiliated MMF prices its shares with a floating net asset value. In addition, the Board of Trustees of the Affiliated MMF may impose a fee on redemptions (sometimes referred to as a liquidity fee) or temporarily suspend redemptions (sometimes referred to as imposing a redemption gate) in the event its liquidity falls below regulatory limits.
Note 7. Interfund lending
Pursuant to an exemptive order granted by the Securities and Exchange Commission, the Fund participates in a program (the Interfund Program) allowing each participating Columbia Fund (each, a Participating Fund) to lend money directly to and, except for closed-end funds and money market funds, borrow money directly from other Participating Funds for temporary purposes. The amounts eligible for borrowing and lending under the Interfund Program are subject to certain restrictions.
Columbia Select International Equity Fund | Annual Report 2019
| 29 |
Notes to Financial Statements (continued)
February 28, 2019
Interfund loans are subject to the risk that the borrowing fund could be unable to repay the loan when due, and a delay in repayment to the lending fund could result in lost opportunities and/or additional lending costs. The exemptive order is subject to conditions intended to mitigate conflicts of interest arising from the Investment Manager’s relationship with each Participating Fund.
The Fund’s activity in the Interfund Program during the year ended February 28, 2019 was as follows:
| Borrower or lender | Average loan
balance ($) | Weighted average
interest rate (%) | Days
outstanding |
| Borrower | 500,000 | 2.69 | 4 |
Interest expense incurred by the Fund is recorded as Interfund lending in the Statement of Operations. The Fund had no outstanding interfund loans at February 28, 2019.
Note 8. Line of credit
The Fund has access to a revolving credit facility with a syndicate of banks led by Citibank, N.A., HSBC Bank USA, N.A. and JPMorgan Chase Bank, N.A. whereby the Fund may borrow for the temporary funding of shareholder redemptions or for other temporary or emergency purposes. The credit facility, which is a collective agreement between the Fund and certain other funds managed by the Investment Manager or an affiliated investment manager, severally and not jointly, permits collective borrowings up to $1 billion. Interest is charged to each participating fund based on its borrowings at a rate equal to the higher of (i) the federal funds effective rate, (ii) the one-month LIBOR rate and (iii) the overnight bank funding rate, plus in each case, 1.00%. Each borrowing under the credit facility matures no later than 60 days after the date of borrowing. The Fund also pays a commitment fee equal to its pro rata share of the unused amount of the credit facility at a rate of 0.15% per annum. The commitment fee is included in other expenses in the Statement of Operations. This agreement expires annually in December unless extended or renewed.
The Fund had no borrowings during the year ended February 28, 2019.
Note 9. Significant risks
Financial sector risk
The Fund may be more susceptible to the particular risks that may affect companies in the financial services sector than if it were invested in a wider variety of companies in unrelated sectors. Companies in the financial services sector are subject to certain risks, including the risk of regulatory change, decreased liquidity in credit markets and unstable interest rates. Such companies may have concentrated portfolios, such as a high level of loans to real estate developers, which makes them vulnerable to economic conditions that affect that industry. Performance of such companies may be affected by competitive pressures and exposure to investments or agreements that, under certain circumstances, may lead to losses (e.g., subprime loans). Companies in the financial services sector are subject to extensive governmental regulation that may limit the amount and types of loans and other financial commitments they can make, and interest rates and fees that they may charge. In addition, profitability of such companies is largely dependent upon the availability and the cost of capital.
Foreign securities and emerging market countries risk
Investing in foreign securities may include certain risks and considerations not typically associated with investing in U.S. securities, such as fluctuating currency values and changing local and regional economic, political and social conditions, which may result in greater market volatility. In addition, certain foreign securities may not be as liquid as U.S. securities. Investing in emerging markets may accentuate these risks. These countries are also more likely to experience high levels of inflation, deflation or currency devaluation which could hurt their economies and securities markets. To the extent that the Fund concentrates its investment exposure to any one or a few specific countries, the Fund will be particularly susceptible to the various conditions, events or other factors impacting those countries and may, therefore, have a greater risk than that of a fund which is more geographically diversified.
| 30 | Columbia Select International Equity Fund | Annual Report 2019 |
Notes to Financial Statements (continued)
February 28, 2019
Industrial sector risk
The Fund may be more susceptible to the particular risks that may affect companies in the industrials sector than if it were invested in a wider variety of companies in unrelated sectors. Companies in the industrials sector are subject to certain risks, including changes in supply and demand for their specific product or service and for industrial sector products in general, including decline in demand for such products due to rapid technological developments and frequent new product introduction. Performance of such companies may be affected by factors including government regulation, world events and economic conditions and risks for environmental damage and product liability claims.
Shareholder concentration risk
At February 28, 2019, affiliated shareholders of record owned 35.0% of the outstanding shares of the Fund in one or more accounts. Subscription and redemption activity by concentrated accounts may have a significant effect on the operations of the Fund. In the case of a large redemption, the Fund may be forced to sell investments at inopportune times, including its liquid positions, which may result in Fund losses and the Fund holding a higher percentage of less liquid positions. Large redemptions could result in decreased economies of scale and increased operating expenses for non-redeeming Fund shareholders.
Note 10. Subsequent events
Management has evaluated the events and transactions that have occurred through the date the financial statements were issued and noted no items requiring adjustment of the financial statements or additional disclosure.
Note 11. Information regarding pending and settled legal proceedings
Ameriprise Financial and certain of its affiliates have historically been involved in a number of legal, arbitration and regulatory proceedings, including routine litigation, class actions, and governmental actions, concerning matters arising in connection with the conduct of their business activities. Ameriprise Financial believes that the Fund is not currently the subject of, and that neither Ameriprise Financial nor any of its affiliates are the subject of, any pending legal, arbitration or regulatory proceedings that are likely to have a material adverse effect on the Fund or the ability of Ameriprise Financial or its affiliates to perform under their contracts with the Fund. Ameriprise Financial is required to make quarterly (10-Q), annual (10-K) and, as necessary, 8-K filings with the Securities and Exchange Commission (SEC) on legal and regulatory matters that relate to Ameriprise Financial and its affiliates. Copies of these filings may be obtained by accessing the SEC website at www.sec.gov.
There can be no assurance that these matters, or the adverse publicity associated with them, will not result in increased Fund redemptions, reduced sale of Fund shares or other adverse consequences to the Fund. Further, although we believe proceedings are not likely to have a material adverse effect on the Fund or the ability of Ameriprise Financial or its affiliates to perform under their contracts with the Fund, these proceedings are subject to uncertainties and, as such, we are unable to estimate the possible loss or range of loss that may result. An adverse outcome in one or more of these proceedings could result in adverse judgments, settlements, fines, penalties or other relief that could have a material adverse effect on the consolidated financial condition or results of operations of Ameriprise Financial.
Columbia Select International Equity Fund | Annual Report 2019
| 31 |
Report of Independent Registered Public Accounting Firm
To the Board of Trustees of Columbia Funds Series Trust and Shareholders of Columbia Select International Equity Fund
Opinion on the Financial Statements
We have audited the accompanying statement of assets and liabilities, including the portfolio of investments, of Columbia Select International Equity Fund (one of the funds constituting Columbia Funds Series Trust, referred to hereafter as the "Fund") as of February 28, 2019, the related statement of operations for the year ended February 28, 2019, the statement of changes in net assets for each of the two years in the period ended February 28, 2019, including the related notes, and the financial highlights for each of the five years in the period ended February 28, 2019 (collectively referred to as the “financial statements”). In our opinion, the financial statements present fairly, in all material respects, the financial position of the Fund as of February 28, 2019, the results of its operations for the year then ended, the changes in its net assets for each of the two years in the period ended February 28, 2019 and the financial highlights for each of the five years in the period ended February 28, 2019 in conformity with accounting principles generally accepted in the United States of America.
Basis for Opinion
These financial statements are the responsibility of the Fund’s management. Our responsibility is to express an opinion on the Fund’s financial statements based on our audits. We are a public accounting firm registered with the Public Company Accounting Oversight Board (United States) (PCAOB) and are required to be independent with respect to the Fund in accordance with the U.S. federal securities laws and the applicable rules and regulations of the Securities and Exchange Commission and the PCAOB.
We conducted our audits of these financial statements in accordance with the standards of the PCAOB. Those standards require that we plan and perform the audit to obtain reasonable assurance about whether the financial statements are free of material misstatement, whether due to error or fraud.
Our audits included performing procedures to assess the risks of material misstatement of the financial statements, whether due to error or fraud, and performing procedures that respond to those risks. Such procedures included examining, on a test basis, evidence regarding the amounts and disclosures in the financial statements. Our audits also included evaluating the accounting principles used and significant estimates made by management, as well as evaluating the overall presentation of the financial statements. Our procedures included confirmation of securities owned as of February 28, 2019 by correspondence with the custodian and transfer agent. We believe that our audits provide a reasonable basis for our opinion.
/s/PricewaterhouseCoopers LLP
Minneapolis, Minnesota
April 22, 2019
We have served as the auditor of one or more investment companies within the Columbia Funds Complex since 1977.
| 32 | Columbia Select International Equity Fund | Annual Report 2019 |
Federal Income Tax Information
(Unaudited)
The Fund hereby designates the following tax attributes for the fiscal year ended February 28, 2019. Shareholders will be notified in early 2020 of the amounts for use in preparing 2019 income tax returns.
Qualified
dividend
income | Foreign
taxes paid
to foreign
countries | Foreign
taxes paid
per share
to foreign
countries | Foreign
source
income | Foreign
source
income per
share |
| 100.00% | $511,215 | $0.03 | $8,212,026 | $0.43 |
Qualified dividend income. For taxable, non-corporate shareholders, the percentage of ordinary income distributed during the fiscal year that represents qualified dividend income subject to reduced tax rates.
Foreign taxes. The Fund makes the election to pass through to shareholders the foreign taxes paid. Eligible shareholders may claim a foreign tax credit. These taxes, and the corresponding foreign source income, are provided.
Columbia Select International Equity Fund | Annual Report 2019
| 33 |
Shareholders elect the Board that oversees the Fund’s operations. The Board appoints officers who are responsible for day-to-day business decisions based on policies set by the Board. The following table provides basic biographical information about the Fund’s Trustees as of the printing of this report, including their principal occupations during the past five years, although specific titles for individuals may have varied over the period. Under current Board policy, Trustees not affiliated with the Investment Manager generally may serve through the end of the calendar year in which they reach the mandatory retirement age established by the Board.
Independent trustees
Name,
address,
year of birth | Position held
with the Trust and
length of service | Principal occupation(s)
during past five years
and other relevant
professional experience | Number of
Funds in the
Columbia Funds
complex
overseen | Other directorships
held by Trustee
during the past
five years |
George S. Batejan
c/o Columbia Management
Investment Advisers, LLC
225 Franklin Street
Mail Drop BX32 05228
Boston, MA 02110
1953 | Trustee since 1/17 | Executive Vice President, Global Head of Technology and Operations, Janus Capital Group, Inc., 2010-2016 | 123 | Former Chairman of the Board, NICSA (National Investment Company Services Association) (Executive Committee, Nominating Committee and Governance Committee), 2014-2016; former Director, Intech Investment Management, 2011-2016; former Board Member, Metro Denver Chamber of Commerce, 2015-2016; former Advisory Board Member, University of Colorado Business School, 2015-2018 |
Kathleen Blatz
c/o Columbia Management
Investment Advisers, LLC
225 Franklin Street
Mail Drop BX32 05228
Boston, MA 02110
1954 | Trustee since 1/06 for RiverSource Funds and since 6/11 for Nations Funds | Attorney; specializing in arbitration and mediation; Chief Justice, Minnesota Supreme Court, 1998-2006; Associate Justice, Minnesota Supreme Court, 1996-1998; Fourth Judicial District Court Judge, Hennepin County, 1994-1996; Attorney in private practice and public service, 1984-1993; State Representative, Minnesota House of Representatives, 1979-1993, which included service on the Tax and Financial Institutions and Insurance Committees; Member and Interim Chair, Minnesota Sports Facilities Authority, January 2017-July 2017; Interim President and Chief Executive Officer, Blue Cross and Blue Shield of Minnesota (health care insurance), February-July 2018 | 123 | Trustee, BlueCross BlueShield of Minnesota since 2009 (Chair of the Business Development Committee, 2014-2017; Chair of the Governance Committee since 2017); Chair of the Robina Foundation since August 2013; former Member and Chair of the Board, Minnesota Sports Facilities Authority, January 2017-July 2017 |
Edward J. Boudreau, Jr.
c/o Columbia Management
Investment Advisers, LLC
225 Franklin Street
Mail Drop BX32 05228
Boston, MA 02110
1944 | Chair of the Board since 1/18; Trustee since 6/11 for RiverSource Funds and since 1/05 for Nations Funds | Managing Director, E.J. Boudreau & Associates (consulting) since 2000; FINRA Industry Arbitrator, 2002-present; Chairman and Chief Executive Officer, John Hancock Investments (asset management), Chairman and Interested Trustee for open-end and closed-end funds offered by John Hancock, 1989-2000; John Hancock Mutual Life Insurance Company, including Senior Vice President and Treasurer and Senior Vice President Information Technology, 1968-1988 | 123 | Former Trustee, Boston Museum of Science (Chair of Finance Committee) 1985-2013; former Trustee, BofA Funds Series Trust (11 funds), 2005-2011 |
| 34 | Columbia Select International Equity Fund | Annual Report 2019 |
TRUSTEES AND OFFICERS (continued)
Independent trustees (continued)
Name,
address,
year of birth | Position held
with the Trust and
length of service | Principal occupation(s)
during past five years
and other relevant
professional experience | Number of
Funds in the
Columbia Funds
complex
overseen | Other directorships
held by Trustee
during the past
five years |
Pamela G. Carlton
c/o Columbia Management
Investment Advisers, LLC
225 Franklin Street
Mail Drop BX32 05228
Boston, MA 02110
1954 | Trustee since 7/07 for RiverSource Funds and since 6/11 for Nations Funds | President, Springboard — Partners in Cross Cultural Leadership (consulting company) since 2003; Managing Director of US Equity Research, JP Morgan Chase, 1999-2003; Director of US Equity Research, Chase Asset Management, 1996-1999; Co-Director Latin America Research, 1993-1996, COO Global Research, 1992-1996, Co-Director of US Research, 1991-1992, Investment Banker, Morgan Stanley, 1982-1991 | 123 | Trustee, New York Presbyterian Hospital Board (Executive Committee and Chair of Human Resources Committee) since 1996; Director, Laurel Road Bank (Audit Committee) since 2017 |
Patricia M. Flynn
c/o Columbia Management
Investment Advisers, LLC
225 Franklin Street
Mail Drop BX32 05228
Boston, MA 02110
1950 | Trustee since 11/04 for RiverSource Funds and since 6/11 for Nations Funds | Trustee Professor of Economics and Management, Bentley University since 1976 (also teaches and conducts research on corporate governance); Dean, McCallum Graduate School of Business, Bentley University, 1992-2002 | 123 | Trustee, MA Taxpayers Foundation since 1997; Board of Directors, The MA Business Roundtable since 2003; Board of Governors, Innovation Institute, MA Technology Collaborative since 2010 |
Brian J. Gallagher
c/o Columbia Management
Investment Advisers, LLC
225 Franklin Street
Mail Drop BX32 05228
Boston, MA 02110
1954 | Trustee since 12/17 | Retired; Partner with Deloitte & Touche LLP and its predecessors, 1977-2016 | 121 | Trustee, Catholic Schools Foundation since 2004 |
Catherine James Paglia
c/o Columbia Management
Investment Advisers, LLC
225 Franklin Street
Mail Drop BX32 05228
Boston, MA 02110
1952 | Trustee since 11/04 for RiverSource Funds and since 6/11 for Nations Funds | Director, Enterprise Asset Management, Inc. (private real estate and asset management company) since September 1998; Managing Director and Partner, Interlaken Capital, Inc., 1989-1997; Managing Director, Morgan Stanley, 1982-1989; Vice President, Investment Banking, 1980-1982, Associate, Investment Banking, 1976-1980, Dean Witter Reynolds, Inc. | 123 | Director, Valmont Industries, Inc. (irrigation systems manufacturer) since 2012; Trustee, Carleton College (on the Investment Committee); Trustee, Carnegie Endowment for International Peace (on the Investment Committee) |
Anthony M. Santomero
c/o Columbia Management
Investment Advisers, LLC
225 Franklin Street
Mail Drop BX32 05228
Boston, MA 02110
1946 | Trustee since 6/11 for RiverSource Funds and since 1/08 for Nations Funds | Richard K. Mellon Professor Emeritus of Finance, The Wharton School, University of Pennsylvania, since 2002; Senior Advisor, McKinsey & Company (consulting), 2006-2008; President, Federal Reserve Bank of Philadelphia, 2000- 2006; Professor of Finance, The Wharton School, University of Pennsylvania, 1972-2002 | 123 | Trustee, Penn Mutual Life Insurance Company since March 2008; Director, Renaissance Reinsurance Ltd. since May 2008; former Trustee, BofA Funds Series Trust (11 funds), 2008-2011; former Director, Citigroup Inc. and Citibank, N.A., 2009-2019 |
Columbia Select International Equity Fund | Annual Report 2019
| 35 |
TRUSTEES AND OFFICERS (continued)
Independent trustees (continued)
Name,
address,
year of birth | Position held
with the Trust and
length of service | Principal occupation(s)
during past five years
and other relevant
professional experience | Number of
Funds in the
Columbia Funds
complex
overseen | Other directorships
held by Trustee
during the past
five years |
Minor M. Shaw
c/o Columbia Management
Investment Advisers, LLC
225 Franklin Street
Mail Drop BX32 05228
Boston, MA 02110
1947 | Trustee since 6/11 for RiverSource Funds and since 2003 for Nations Funds | President, Micco LLC (private investments) since 2011; President, Micco Corp. (family investment business), 1998-2011 | 123 | Director, BlueCross BlueShield of South Carolina since April 2008; Board Chair, Hollingsworth Funds since 2016; Advisory Board member, Duke Energy Corp. since October 2016; Chair of the Duke Endowment; Chair of Greenville – Spartanburg Airport Commission; former Trustee, BofA Funds Series Trust (11 funds), 2003-2011; former Director, Piedmont Natural Gas, 2004-2016; former Director, National Association of Corporate Directors, Carolinas Chapter, 2013-2018 |
Sandra Yeager
c/o Columbia Management
Investment Advisers, LLC
225 Franklin Street
Mail Drop BX32 05228
Boston, MA 02110
1964 | Trustee since 12/17 | Retired; President and founder, Hanoverian Capital, LLC (SEC registered investment advisor firm), 2008-2016; Managing Director, DuPont Capital, 2006-2008; Managing Director, Morgan Stanley Investment Management, 2004-2006; Senior Vice President, Alliance Bernstein, 1990-2004 | 121 | Director, NAPE Education Foundation since October 2016 |
Interested trustee affiliated with Investment Manager*
Name,
address,
year of birth | Position held with the Trust and length of service | Principal occupation(s) during the
past five years and other relevant
professional experience | Number of
Funds in the
Columbia Funds
complex overseen | Other directorships
held by Trustee
during the past
five years |
William F. Truscott
c/o Columbia Management
Investment Advisers, LLC
225 Franklin St.
Boston, MA 02110
1960 | Trustee since 11/01 for RiverSource Funds and since 6/11 for Nations Funds; Senior Vice President since 2002 for RiverSource Funds and since 5/10 for Nations Funds | Chairman of the Board and President, Columbia Management Investment Advisers, LLC since May 2010 and February 2012, respectively; Chief Executive Officer, Global Asset Management, Ameriprise Financial, Inc. since September 2012 (previously Chief Executive Officer, U.S. Asset Management & President, Annuities, May 2010 - September 2012); Director and Chief Executive Officer, Columbia Management Investment Distributors, Inc. since May 2010 and February 2012, respectively; Chairman of the Board and Chief Executive Officer, RiverSource Distributors, Inc. since 2006; Director, Threadneedle Asset Management Holdings, SARL since 2014; President and Chief Executive Officer, Ameriprise Certificate Company, 2006 - August 2012. | 192 | Chairman of the Board, Columbia Management Investment Advisers, LLC since May 2010; Director, Columbia Management Investment Distributors, Inc. since May 2010; former Director, Ameriprise Certificate Company, 2006-January 2013 |
| * | Interested person (as defined under the 1940 Act) by reason of being an officer, director, security holder and/or employee of the Investment Manager or Ameriprise Financial. |
| 36 | Columbia Select International Equity Fund | Annual Report 2019 |
TRUSTEES AND OFFICERS (continued)
Nations Funds refer to the Funds within the Columbia Funds Complex that historically bore the Nations brand and includes series of Columbia Funds Series Trust. RiverSource Funds refer to the Funds within the Columbia Funds Complex that historically bore the RiverSource brand and includes series of Columbia Funds Series Trust II.
The Statement of Additional Information has additional information about the Fund’s Board members and is available, without charge, upon request by calling 800.345.6611, visiting columbiathreadneedleus.com/investor/ or contacting your financial intermediary.
Columbia Select International Equity Fund | Annual Report 2019
| 37 |
TRUSTEES AND OFFICERS (continued)
The Board has appointed officers who are responsible for day-to-day business decisions based on policies it has established. The officers serve at the pleasure of the Board. The following table provides basic information about the Officers of the Fund as of the printing of this report, including principal occupations during the past five years, although their specific titles may have varied over the period. In addition to Mr. Truscott, who is Senior Vice President, the Fund’s other officers are:
Fund officers
Name,
address and
year of birth | Position and year
first appointed to
position for any Fund
in the Columbia
Funds complex or a
predecessor thereof | Principal occupation(s) during past five years |
Christopher O. Petersen
5228 Ameriprise
Financial Center
Minneapolis, MN 55474
Born 1970 | President and Principal Executive Officer (2015) | Vice President and Lead Chief Counsel, Ameriprise Financial, Inc. since January 2015 (previously, Vice President and Chief Counsel, January 2010 - December 2014; officer of Columbia Funds and affiliated funds since 2007. |
Michael G. Clarke
225 Franklin Street
Boston, MA 02110
Born 1969 | Chief Financial Officer (Principal Financial Officer) (2009) and Senior Vice President (2019) | Vice President — Accounting and Tax, Columbia Management Investment Advisers, LLC, since May 2010; senior officer of Columbia Funds and affiliated funds since 2002 (previously, Treasurer and Chief Accounting Officer, January 2009-January 2019 and December 2015-January 2019, respectively). |
Joseph Beranek
5890 Ameriprise
Financial Center
Minneapolis, MN 55474
Born 1965 | Treasurer and Chief Accounting Officer (Principal Accounting Officer) (2019) | Vice President — Mutual Fund Accounting and Financial Reporting, Columbia Management Investment Advisers, LLC, since December 2018 and March 2017, respectively (previously, Vice President — Pricing and Corporate Actions, May 2010-March 2017). |
Paul B. Goucher
485 Lexington Avenue
New York, NY 10017
Born 1968 | Senior Vice President (2011) and Assistant Secretary (2008) | Senior Vice President and Assistant General Counsel, Ameriprise Financial, Inc. since January 2017 (previously, Vice President and Lead Chief Counsel, November 2008 - January 2017 and January 2013 - January 2017, respectively); Vice President, Chief Legal Officer and Assistant Secretary, Columbia Management Investment Advisers, LLC since March 2015 (previously Vice President and Assistant Secretary, May 2010 – March 2015). |
Thomas P. McGuire
225 Franklin Street
Boston, MA 02110
Born 1972 | Senior Vice President and Chief Compliance Officer (2012) | Vice President — Asset Management Compliance, Ameriprise Financial, Inc., since May 2010; Chief Compliance Officer, Ameriprise Certificate Company since September 2010. |
Colin Moore
225 Franklin Street
Boston, MA 02110
Born 1958 | Senior Vice President (2010) | Executive Vice President and Global Chief Investment Officer, Ameriprise Financial, Inc., since July 2013; Executive Vice President and Global Chief Investment Officer, Columbia Management Investment Advisers, LLC since July 2013. |
Ryan C. Larrenaga
225 Franklin Street
Boston, MA 02110
Born 1970 | Senior Vice President (2017), Chief Legal Officer (2017), and Secretary (2015) | Vice President and Chief Counsel, Ameriprise Financial, Inc. since August 2018 (previously, Vice President and Group Counsel, August 2011 - August 2018); officer of Columbia Funds and affiliated funds since 2005. |
Michael E. DeFao
225 Franklin Street
Boston, MA 02110
Born 1968 | Vice President (2011) and Assistant Secretary (2010) | Vice President and Chief Counsel, Ameriprise Financial, Inc. since May 2010. |
Amy Johnson
5228 Ameriprise
Financial Center
Minneapolis, MN 55474
Born 1965 | Vice President (2006) | Managing Director and Global Head of Operations, Columbia Management Investment Advisers, LLC since April 2016 (previously Managing Director and Chief Operating Officer, 2010 - 2016). |
| 38 | Columbia Select International Equity Fund | Annual Report 2019 |
TRUSTEES AND OFFICERS (continued)
Fund officers (continued)
Name,
address and
year of birth | Position and year
first appointed to
position for any Fund
in the Columbia
Funds complex or a
predecessor thereof | Principal occupation(s) during past five years |
Lyn Kephart-Strong
5228 Ameriprise
Financial Center
Minneapolis, MN 55474
Born 1960 | Vice President (2015) | President, Columbia Management Investment Services Corp. since October 2014; Vice President & Resolution Officer, Ameriprise Trust Company since August 2009. |
Columbia Select International Equity Fund | Annual Report 2019
| 39 |
The Fund mails one shareholder report to each shareholder address, unless such shareholder elected to receive shareholder reports from the Fund electronically. If you would like more than one report, please call shareholder services at 800.345.6611 and additional reports will be sent to you.
Proxy voting policies and procedures
The policy of the Board of Trustees is to vote the proxies of the companies in which the Fund holds investments consistent with the procedures as stated in the Statement of Additional Information (SAI). You may obtain a copy of the SAI without charge by calling 800.345.6611; contacting your financial intermediary; visiting columbiathreadneedleus.com/investor/; or searching the website of the Securities and Exchange Commission (SEC) at sec.gov. Information regarding how the Fund voted proxies relating to portfolio securities is filed with the SEC by August 31st for the most recent 12-month period ending June 30th of that year, and is available without charge by visiting columbiathreadneedleus.com/investor/, or searching the website of the SEC at sec.gov.
Quarterly schedule of investments
The Fund files a complete schedule of portfolio holdings with the SEC for the first and third quarters of each fiscal year on Form N-Q or Form N-PORT (available for filings after March 31, 2019). The Fund’s Form N-Q or Form N-PORT is available on the SEC’s website at sec.gov. The Fund’s complete schedule of portfolio holdings, as filed on Form N-Q or Form N-PORT, can also be obtained without charge, upon request, by calling 800.345.6611.
Additional Fund information
For more information about the Fund, please visit columbiathreadneedleus.com/investor/ or call 800.345.6611. Customer Service Representatives are available to answer your questions Monday through Friday from 8 a.m. to 7 p.m. Eastern time.
Fund investment manager
Columbia Management Investment Advisers, LLC
225 Franklin Street
Boston, MA 02110
Fund distributor
Columbia Management Investment Distributors, Inc.
225 Franklin Street
Boston, MA 02110
Fund transfer agent
Columbia Management Investment Services Corp.
P.O. Box 219104
Kansas City, MO 64121-9104
| 40 | Columbia Select International Equity Fund | Annual Report 2019 |
[THIS PAGE INTENTIONALLY LEFT BLANK]
Columbia Select International Equity Fund
P.O. Box 219104
Kansas City, MO 64121-9104
Please read and consider the investment objectives, risks, charges and expenses for any fund carefully before investing. For a prospectus and summary prospectus, which contains this and other important information about the Fund, go to
columbiathreadneedleus.com/investor/. The Fund is distributed by Columbia Management Investment Distributors, Inc., member FINRA, and managed by Columbia Management Investment Advisers, LLC.
Columbia Threadneedle Investments (Columbia Threadneedle) is the global brand name of the Columbia and Threadneedle group of companies. All rights reserved.
© 2019 Columbia Management Investment Advisers, LLC.
columbiathreadneedleus.com/investor/

Annual Report
February 28, 2019
Columbia Select Global Growth Fund
Beginning on January 1, 2021, as permitted by regulations adopted by the Securities and Exchange Commission, paper copies of the Fund’s annual and semiannual shareholder reports like this one will no longer be sent by mail, unless you specifically request paper copies of the reports. Instead, the reports will be made available on the Fund’s website (columbiathreadneedleus.com/investor/), and each time a report is posted you will be notified by mail and provided with a website address to access the report.
If you have already elected to receive shareholder reports electronically, you will not be affected by this change and you need not take any action. You may elect to receive shareholder reports and other communications from the Fund electronically at any time by contacting your financial intermediary (such as a broker-dealer or bank) or, for Fund shares held directly with the Fund, by calling 800.345.6611 or by enrolling in “eDelivery” by logging into your account at columbiathreadneedleus.com/investor/.
You may elect to receive all future reports in paper free of charge. If you invest through a financial intermediary, you can contact your financial intermediary to request that you continue receiving paper copies of your shareholder reports. If you invest directly with the Fund, you can call 800.345.6611 to let the Fund know you wish to continue receiving paper copies of your shareholder reports. Your election to receive paper reports will apply to all Columbia Funds held in your account if you invest through a financial intermediary or all Columbia Funds held with the fund complex if you invest directly with the Fund.
Not FDIC Insured • No bank guarantee • May lose value
Dear Shareholders,
Volatility exists in financial markets and this is not a comfortable fact of life. How investors deal with this reality, including how they react to short term spikes in volatility as well as to longer periods of increased or decreased volatility, may have a significant impact on their overall investing success.
Too often, investors change their investment strategy based on something that’s happening at a moment in time rather than thinking about how that change in strategy might affect their ability to achieve their longer term financial goals. Emotion replaces logic and reasoning. Investors may sell in reaction to a market drop (fear or panic), locking in low returns which means they won’t be invested when the market returns, or they invest more at a market peak (greed or conviction), essentially when it is expensive to do so. In both cases, selling and buying at the exact wrong time.
We believe the best outcomes come from a consistent approach to investing. Here are five areas where advisors can help us overcome the tendency to react emotionally as we struggle to make the right choices with our investments:
Long-term focus
The further away long-term goals, aspirations and objectives are, the easier it is to stray away from the goals and priorities that we set out. Advisors help us stay focused on what we want to accomplish.
Discipline through up-and-down markets
Advisors help set rules to prevent us from making rash decisions that we may regret later. Knowing ahead of time what you should do in case of certain situations will help you get through volatile markets and not make emotional decisions.
Tax-awareness
Taxes are one of the biggest drags on investment returns and are critical attributes of investing. Yet few of us take the necessary steps to ease the corrosive effect of taxes. Advisors have tools and knowledge that may help us to manage portfolios more tax-efficiently and keep more of what we earn.
Emotional objectivity
Our emotions are very hard to manage and making investment decisions in an emotional state can lead to exceedingly bad outcomes. An objective advisor can help prevent some of the reactionary mistakes emotions often lead us to.
Education and guidance
The role of the advisor is to teach and guide us toward achieving our financial goals. In terms of working through emotions, guidance is by far the most important component.
By understanding our own behaviors and biases, we can prepare for future challenges. Your success is our priority. Talk to your advisor about how working with Columbia Threadneedle Investments may help you stay the course and position your portfolio for consistent, sustainable outcomes, regardless of market conditions.
Sincerely,
Christopher O. Petersen
President, Columbia Funds
Columbia Funds are distributed by Columbia Management Investment Distributors, Inc., member FINRA, and managed by Columbia Management Investment Advisers, LLC.
© 2019 Columbia Management Investment Advisers, LLC. All rights reserved.
Columbia Select Global Growth Fund | Annual Report 2019
Columbia Select Global Growth Fund | Annual Report 2019
Investment objective
Columbia Select Global Growth Fund (the Fund) seeks long-term growth of capital.
Portfolio management
Thomas Galvin, CFA
Lead Portfolio Manager
Managed Fund since 2015
Richard Carter
Portfolio Manager
Managed Fund since 2015
Todd Herget
Portfolio Manager
Managed Fund since 2015
Morningstar style boxTM
The Morningstar Style Box is based on a fund’s portfolio holdings. For equity funds, the vertical axis shows the market capitalization of the stocks owned, and the horizontal axis shows investment style (value, blend, or growth). Information shown is based on the most recent data provided by Morningstar.
© 2019 Morningstar, Inc. All rights reserved. The Morningstar information contained herein: (1) is proprietary to Morningstar and/or its content providers; (2) may not be copied or distributed; and (3) is not warranted to be accurate, complete or timely. Neither Morningstar nor its content providers are responsible for any damages or losses arising from any use of this information.
| Average annual total returns (%) (for the period ended February 28, 2019) |
| | | Inception | 1 Year | 5 Years | 10 Years |
| Class A | Excluding sales charges | 04/30/08 | -5.21 | 5.64 | 14.67 |
| | Including sales charges | | -10.68 | 4.39 | 14.00 |
| Advisor Class* | 01/08/14 | -4.98 | 5.91 | 14.82 |
| Class C | Excluding sales charges | 04/30/08 | -5.95 | 4.85 | 13.82 |
| | Including sales charges | | -6.88 | 4.85 | 13.82 |
| Institutional Class | 04/30/08 | -4.91 | 5.92 | 14.97 |
| Institutional 2 Class* | 01/08/14 | -4.96 | 5.97 | 14.85 |
| Institutional 3 Class* | 03/01/17 | -4.89 | 5.79 | 14.75 |
| Class R | 04/30/08 | -5.38 | 5.40 | 14.39 |
| MSCI ACWI (Net) | | -0.84 | 6.28 | 12.73 |
| MSCI ACWI Growth Index (Net) | | -0.05 | 7.89 | 13.69 |
Returns for Class A shares are shown with and without the maximum initial sales charge of 5.75%. Returns for Class C shares are shown with and without the 1.00% contingent deferred sales charge for the first year only. The Fund’s other share classes are not subject to sales charges and have limited eligibility. Please see the Fund’s prospectus for details. Performance for different share classes will vary based on differences in sales charges and fees associated with each share class. All results shown assume reinvestment of distributions during the period. Returns do not reflect the deduction of taxes that a shareholder may pay on Fund distributions or on the redemption of Fund shares. Performance results reflect the effect of any fee waivers or reimbursements of Fund expenses by Columbia Management Investment Advisers, LLC and/or any of its affiliates. Absent these fee waivers or expense reimbursement arrangements, performance results would have been lower.
The performance information shown represents past performance and is not a guarantee of future results. The investment return and principal value of your investment will fluctuate so that your shares, when redeemed, may be worth more or less than their original cost. Current performance may be lower or higher than the performance information shown. You may obtain performance information current to the most recent month-end by contacting your financial intermediary, visiting columbiathreadneedleus.com/investor/ or calling 800.345.6611.
| * | The returns shown for periods prior to the share class inception date (including returns for the Life of the Fund, if shown, which are since Fund inception) include the returns of the Fund’s oldest share class. Since the Fund launched more than one class of shares at its inception, Class A shares were used. These returns are adjusted to reflect any higher class-related operating expenses of the newer share classes, as applicable. Please visit columbiathreadneedleus.com/investor/investment-products/mutual-funds/appended-performance for more information. |
The MSCI ACWI (Net) is a free float-adjusted market capitalization weighted index that is designed to measure the equity market performance of developed and emerging markets. The index consists of 46 country indices comprising 23 developed and 23 emerging market country indices.
The MSCI ACWI Growth Index (Net) captures large and mid-cap securities exhibiting overall growth style characteristics across 23 developed markets countries and 23 emerging markets countries. The growth investment style characteristics for index construction are defined using five variables: long-term forward EPS growth rate, short-term forward EPS growth rate, current internal growth rate and long-term historical EPS growth trend and long-term historical sales per share growth trend.
Indices are not available for investment, are not professionally managed and do not reflect sales charges, fees, brokerage commissions, taxes (except the MSCI ACWI (Net) and the MSCI ACWI Growth Index (Net), which reflect reinvested dividends net of withholding taxes) or other expenses of investing. Securities in the Fund may not match those in an index.
| 2 | Columbia Select Global Growth Fund | Annual Report 2019 |
Fund at a Glance (continued)
Performance of a hypothetical $10,000 investment (February 28, 2009 — February 28, 2019)
The chart above shows the change in value of a hypothetical $10,000 investment in Class A shares of Columbia Select Global Growth Fund during the stated time period, and does not reflect the deduction of taxes that a shareholder may pay on Fund distributions or on the redemption of Fund shares.
| Top 10 holdings (%) (at February 28, 2019) |
| Alibaba Group Holding Ltd., ADR (China) | 5.2 |
| New Oriental Education & Technology Group, Inc., ADR (China) | 4.5 |
| Amazon.com, Inc. (United States) | 4.0 |
| ServiceNow, Inc. (United States) | 3.5 |
| Salesforce.com, Inc. (United States) | 3.4 |
| Tencent Holdings Ltd. (China) | 3.4 |
| Facebook, Inc., Class A (United States) | 3.3 |
| Square, Inc., Class A (United States) | 3.1 |
| Adobe, Inc. (United States) | 3.1 |
| PayPal Holdings, Inc. (United States) | 2.9 |
Percentages indicated are based upon total investments excluding Money Market Funds and investments in derivatives, if any.
For further detail about these holdings, please refer to the section entitled “Portfolio of Investments.”
Fund holdings are as of the date given, are subject to change at any time, and are not recommendations to buy or sell any security.
| Equity sector breakdown (%) (at February 28, 2019) |
| Communication Services | 10.7 |
| Consumer Discretionary | 24.0 |
| Energy | 2.2 |
| Financials | 8.0 |
| Health Care | 18.6 |
| Industrials | 5.0 |
| Information Technology | 31.5 |
| Total | 100.0 |
Percentages indicated are based upon total equity investments. The Fund’s portfolio composition is subject to change.
Columbia Select Global Growth Fund | Annual Report 2019
| 3 |
Fund at a Glance (continued)
| Country breakdown (%) (at February 28, 2019) |
| Argentina | 2.1 |
| Belgium | 1.7 |
| Brazil | 2.6 |
| Canada | 1.3 |
| China | 14.3 |
| Denmark | 1.5 |
| India | 2.2 |
| Ireland | 2.3 |
| Japan | 4.3 |
| Netherlands | 0.9 |
| Russian Federation | 2.4 |
| Switzerland | 2.5 |
| United Kingdom | 2.4 |
| United States | 59.5 |
| Total | 100.0 |
Country breakdown is based primarily on issuer’s place of organization/incorporation. Percentages indicated are based upon total investments excluding investments in derivatives, if any. The Fund’s portfolio composition is subject to change.
The Fund may use place of organization/incorporation or other factors in determining whether an issuer is domestic (U.S.) or foreign for purposes of its investment policies. At February 28, 2019, the Fund invested at least 40% of its net assets in foreign companies in accordance with its principal investment strategy.
| 4 | Columbia Select Global Growth Fund | Annual Report 2019 |
Manager Discussion of Fund Performance
For the 12-month period that ended February 28, 2019, the Fund’s Class A shares returned -5.21% excluding sales charges. The Fund underperformed its benchmark, the MSCI AC World Index (Net), which returned -0.84% during the period. The Fund also lagged the MSCI ACWI Growth Index (Net), which returned -0.05%. Stock selection in the communication services, consumer discretionary and energy sectors detracted from Fund results.
U.S. stocks advanced; most other global markets down
Positive global economic conditions spurred investor confidence at the outset of the 12-month period ended February 28, 2019. However, growth stalled in most regions outside the United States during the period. The U.K. was weighed down by the disorderly process of breaking with the European Union. Euro area growth was dragged down by softening demand. China’s economy was beset by softening demand and the impact of the ongoing trade impasse with the United States. Japan’s economy showed some life in the fourth quarter of 2018, but uncertainty tilted prospects to the downside. Across the globe, trade policy was the single greatest risk facing major economies at the end of the period.
Against this backdrop, stock prices dropped in all major markets except the United States, where economic growth was also the most resilient. For the 12-month period ended February 28, 2019, the MSCI All World Index ex US (Net) returned -6.46%. The MSCI EAFE Index (Net), a broad measure of stock markets in the developed markets of Europe, Australasia and the Far East, returned -6.04%. The S&P 500 Index, a broad measure of U.S. stock performance, gained 4.68%. In response to heightened financial market volatility and slowing growth, major central banks, including the U.S. Federal Reserve, put interest rate hikes on hold.
Contributors and detractors
Stock selection in the information technology and health care sectors aided Fund results relative to the benchmark. A significant overweight in information technology also benefited returns, as did the Fund’s lack of exposure to the materials sector, where returns were down sharply for the period. In the information technology sector, U.S. software firms ServiceNow and Splunk delivered strong returns on solid execution, beating revenues and earnings expectations throughout the year. Square, an innovative point-of-sale payment processor, was another top performer. The company is expanding into Canada, the U.K. and Australia.
In the health care sector, positions in Exact Sciences, Edwards Lifesciences and Illumina bolstered relative returns. Exact Sciences has developed an FDA-approved screening test for colon cancer, which has the advantage of being both less costly and less invasive than a traditional colonoscopy. The company recently announced an exclusive promotion and sales agreement with Pfizer. Medical equipment company Edwards Lifesciences, which specializes in artificial heart valves, delivered a solid year on better-than-expected sales of its transcatheter heart valves, which led to increased earnings guidance. Shares of genomic sequencing device leader Illumina Laboratories moved higher as the company executed well on its NovaSeq launch and its consumables business lines. The firm continued to benefit from the broader adoption of genetic sequencing, which drove its consumable and arrays revenues. The company also increased its forward earnings guidance.
Stock selection in the communication services, consumer discretionary and energy sectors accounted for much of the Fund’s shortfall relative to the benchmark. A significant overweight in the consumer discretionary sector also weighed on results. Within the newly-formed communication services sector, a position in Activision Blizzard was a notable detractor. After a strong start to the year, many video game-related firms pulled back. Activision shares declined sharply after the firm reported mixed results despite strong sales of its new Call of Duty game, which helped overcome the difficult Destiny franchise. Ultimately, investors were concerned that the firm did not increase its 2018 guidance, which implied less upside to the all-important 2018 holiday season.
Within the consumer discretionary sector, Zalando, ASOS and Ctrip International were major detractors. Zalando is a pure-play fashion leader in Europe, with a centralized platform for sourcing, fulfillment and technology helping deliver scale advantages to brands unable to make the required individual investments. Zalando’s share price decline was largely due to significant multiple contraction and negative revisions, owing to sluggish consumer spending in Europe while the company pursued aggressive infrastructure investment. ASOS is an e-commerce fashion apparel platform with significant operations in the U.K. and Continental Europe and a growing business in the United States. The company has invested aggressively,
Columbia Select Global Growth Fund | Annual Report 2019
| 5 |
Manager Discussion of Fund Performance (continued)
leading to significant operating profit deleveraging in a very difficult U.K. holiday sales environment, driving shares downward. Ctrip, China’s largest online travel company in the country’s fast-growing travel industry, underperformed as regulatory changes reduced air ticketing commission rates and a weak domestic economy further weighed on Ctrip shares.
The Fund used forward foreign currency exchange contracts to help neutralize the currency effect of investing in foreign countries and to more efficiently and effectively shift the Fund’s currency exposure to align with that of the benchmark. On a stand-alone basis, the use of these derivatives had a negative impact on Fund performance.
At period’s end
We continue to balance the portfolio with established and emerging growth opportunities, focusing on unique business models that we believe offer differentiated products and services that can grow in a variety of different economic environments. We believe that companies offering an innovative product have the potential to maintain pricing power and garner incremental market share, making them more attractive.
Marketrisk may affect a single issuer, sector of the economy, industry or the market as a whole.Growthsecurities, at times, may not perform as well as value securities or the stock market in general and may be out of favor with investors.Internationalinvesting involves certain risks and volatility due to potential political, economic or currency instabilities and different financial and accounting standards. Risks are enhanced foremerging market issuers. Investing inderivativesis a specialized activity that involves special risks, which may result in significant losses. Investments in alimitednumber of companies subject the Fund to greater risk of loss. See the Fund’s prospectus for more information on these and other risks. See the Fund’s prospectus for more information on these and other risks.
The views expressed in this report reflect the current views of the respective parties. These views are not guarantees of future performance and involve certain risks, uncertainties and assumptions that are difficult to predict, so actual outcomes and results may differ significantly from the views expressed. These views are subject to change at any time based upon economic, market or other conditions and the respective parties disclaim any responsibility to update such views. These views may not be relied on as investment advice and, because investment decisions for a Columbia fund are based on numerous factors, may not be relied on as an indication of trading intent on behalf of any particular Columbia fund. References to specific securities should not be construed as a recommendation or investment advice.
| 6 | Columbia Select Global Growth Fund | Annual Report 2019 |
Understanding Your Fund’s Expenses
(Unaudited)
As an investor, you incur two types of costs. There are shareholder transaction costs, which generally include sales charges on purchases and may include redemption fees. There are also ongoing fund costs, which generally include management fees, distribution and/or service fees, and other fund expenses. The following information is intended to help you understand your ongoing costs (in dollars) of investing in the Fund and to help you compare these costs with the ongoing costs of investing in other mutual funds.
Analyzing your Fund’s expenses
To illustrate these ongoing costs, we have provided examples and calculated the expenses paid by investors in each share class of the Fund during the period. The actual and hypothetical information in the table is based on an initial investment of $1,000 at the beginning of the period indicated and held for the entire period. Expense information is calculated two ways and each method provides you with different information. The amount listed in the “Actual” column is calculated using the Fund’s actual operating expenses and total return for the period. You may use the Actual information, together with the amount invested, to estimate the expenses that you paid over the period. Simply divide your account value by $1,000 (for example, an $8,600 account value divided by $1,000 = 8.6), then multiply the results by the expenses paid during the period under the “Actual” column. The amount listed in the “Hypothetical” column assumes a 5% annual rate of return before expenses (which is not the Fund’s actual return) and then applies the Fund’s actual expense ratio for the period to the hypothetical return. You should not use the hypothetical account values and expenses to estimate either your actual account balance at the end of the period or the expenses you paid during the period. See “Compare with other funds” below for details on how to use the hypothetical data.
Compare with other funds
Since all mutual funds are required to include the same hypothetical calculations about expenses in shareholder reports, you can use this information to compare the ongoing cost of investing in the Fund with other funds. To do so, compare the hypothetical example with the 5% hypothetical examples that appear in the shareholder reports of other funds. As you compare hypothetical examples of other funds, it is important to note that hypothetical examples are meant to highlight the ongoing costs of investing in a fund only and do not reflect any transaction costs, such as sales charges, or redemption or exchange fees. Therefore, the hypothetical calculations are useful in comparing ongoing costs only, and will not help you determine the relative total costs of owning different funds. If transaction costs were included in these calculations, your costs would be higher.
| September 1, 2018 — February 28, 2019 |
| | Account value at the
beginning of the
period ($) | Account value at the
end of the
period ($) | Expenses paid during
the period ($) | Fund’s annualized
expense ratio (%) |
| | Actual | Hypothetical | Actual | Hypothetical | Actual | Hypothetical | Actual |
| Class A | 1,000.00 | 1,000.00 | 917.10 | 1,018.00 | 6.51 | 6.85 | 1.37 |
| Advisor Class | 1,000.00 | 1,000.00 | 918.40 | 1,019.24 | 5.33 | 5.61 | 1.12 |
| Class C | 1,000.00 | 1,000.00 | 913.70 | 1,014.28 | 10.06 | 10.59 | 2.12 |
| Institutional Class | 1,000.00 | 1,000.00 | 918.40 | 1,019.24 | 5.33 | 5.61 | 1.12 |
| Institutional 2 Class | 1,000.00 | 1,000.00 | 918.10 | 1,019.49 | 5.09 | 5.36 | 1.07 |
| Institutional 3 Class | 1,000.00 | 1,000.00 | 919.00 | 1,019.79 | 4.81 | 5.06 | 1.01 |
| Class R | 1,000.00 | 1,000.00 | 916.40 | 1,016.76 | 7.70 | 8.10 | 1.62 |
Expenses paid during the period are equal to the annualized expense ratio for each class as indicated above, multiplied by the average account value over the period and then multiplied by the number of days in the Fund’s most recent fiscal half year and divided by 365.
Expenses do not include fees and expenses incurred indirectly by the Fund from its investment in underlying funds, including affiliated and non-affiliated pooled investment vehicles, such as mutual funds and exchange-traded funds.
Had Columbia Management Investment Advisers, LLC and/or certain of its affiliates not waived/reimbursed certain fees and expenses, account value at the end of the period would have been reduced.
Columbia Select Global Growth Fund | Annual Report 2019
| 7 |
Portfolio of Investments
February 28, 2019
(Percentages represent value of investments compared to net assets)
Investments in securities
| Common Stocks 94.3% |
| Issuer | Shares | Value ($) |
| Argentina 2.1% |
| MercadoLibre, Inc. | 3,197 | 1,466,752 |
| Belgium 1.7% |
| Galapagos NV(a) | 12,009 | 1,178,006 |
| Brazil 2.6% |
| Pagseguro Digital Ltd., Class A(a) | 63,975 | 1,799,617 |
| Canada 1.3% |
| Canada Goose Holdings, Inc.(a) | 15,844 | 901,682 |
| China 14.2% |
| Alibaba Group Holding Ltd., ADR(a) | 18,843 | 3,448,834 |
| New Oriental Education & Technology Group, Inc., ADR(a) | 35,876 | 2,943,985 |
| Tencent Holdings Ltd. | 51,700 | 2,213,962 |
| Wuxi Biologics Cayman, Inc.(a) | 134,500 | 1,277,409 |
| Total | 9,884,190 |
| Denmark 1.5% |
| Novo Nordisk A/S, Class B | 21,003 | 1,030,562 |
| India 2.2% |
| HDFC Bank Ltd., ADR | 14,840 | 1,500,621 |
| Ireland 2.3% |
| Ryanair Holdings PLC, ADR(a) | 21,809 | 1,625,643 |
| Japan 4.2% |
| Keyence Corp. | 3,000 | 1,754,294 |
| ZOZO, Inc. | 64,000 | 1,207,388 |
| Total | 2,961,682 |
| Netherlands 0.9% |
| Core Laboratories NV | 10,147 | 657,627 |
| Russian Federation 2.4% |
| Yandex NV, Class A(a) | 48,495 | 1,668,228 |
| Switzerland 2.4% |
| Lonza Group AG, Registered Shares | 6,106 | 1,697,726 |
| United Kingdom 2.4% |
| Ashtead Group PLC | 61,685 | 1,638,772 |
| United States 54.1% |
| Activision Blizzard, Inc. | 23,221 | 978,533 |
| Common Stocks (continued) |
| Issuer | Shares | Value ($) |
| Adobe, Inc.(a) | 7,646 | 2,007,075 |
| Alexion Pharmaceuticals, Inc.(a) | 7,218 | 976,812 |
| Amazon.com, Inc.(a) | 1,599 | 2,622,088 |
| Bio-Rad Laboratories, Inc., Class A(a) | 4,840 | 1,311,156 |
| Booking Holdings, Inc.(a) | 861 | 1,461,151 |
| Bristol-Myers Squibb Co. | 19,834 | 1,024,624 |
| Burford Capital Ltd. | 78,761 | 1,849,024 |
| Charles Schwab Corp. (The) | 23,300 | 1,072,033 |
| Edwards Lifesciences Corp.(a) | 6,133 | 1,038,255 |
| Exact Sciences Corp.(a) | 13,780 | 1,253,980 |
| Facebook, Inc., Class A(a) | 13,337 | 2,153,259 |
| Illumina, Inc.(a) | 3,550 | 1,110,333 |
| MACOM Technology Solutions Holdings, Inc.(a) | 72,633 | 1,386,564 |
| MSCI, Inc. | 4,658 | 860,426 |
| Nike, Inc., Class B | 20,020 | 1,716,315 |
| NVIDIA Corp. | 11,860 | 1,829,523 |
| PayPal Holdings, Inc.(a) | 19,754 | 1,937,275 |
| Pioneer Natural Resources Co. | 5,684 | 801,160 |
| Salesforce.com, Inc.(a) | 13,720 | 2,245,278 |
| Sarepta Therapeutics, Inc.(a) | 2,390 | 344,734 |
| ServiceNow, Inc.(a) | 9,581 | 2,294,075 |
| Splunk, Inc.(a) | 12,663 | 1,720,648 |
| Square, Inc., Class A(a) | 24,845 | 2,018,408 |
| Visa, Inc., Class A | 11,742 | 1,739,225 |
| Total | 37,751,954 |
Total Common Stocks
(Cost $49,539,117) | 65,763,062 |
|
| Money Market Funds 5.0% |
| | Shares | Value ($) |
| Columbia Short-Term Cash Fund, 2.523%(b),(c) | 3,451,325 | 3,450,980 |
Total Money Market Funds
(Cost $3,450,980) | 3,450,980 |
Total Investments in Securities
(Cost $52,990,097) | 69,214,042 |
| Other Assets & Liabilities, Net | | 522,721 |
| Net Assets | $69,736,763 |
The accompanying Notes to Financial Statements are an integral part of this statement.
| 8 | Columbia Select Global Growth Fund | Annual Report 2019 |
Portfolio of Investments (continued)
February 28, 2019
Investments in derivatives
| Forward foreign currency exchange contracts |
Currency to
be sold | Currency to
be purchased | Counterparty | Settlement
date | Unrealized
appreciation ($) | Unrealized
depreciation ($) |
| 1,232,000 DKK | 188,783 USD | Morgan Stanley | 03/20/2019 | 679 | — |
| 377,000 GBP | 493,854 USD | Morgan Stanley | 03/20/2019 | — | (6,609) |
| 27,021,000 INR | 377,336 USD | Morgan Stanley | 03/20/2019 | — | (2,533) |
| 1,131,679 USD | 1,583,000 AUD | Morgan Stanley | 03/20/2019 | — | (8,457) |
| 250,824 USD | 936,000 BRL | Morgan Stanley | 03/20/2019 | — | (1,931) |
| 1,257,328 USD | 1,676,000 CAD | Morgan Stanley | 03/20/2019 | 16,799 | — |
| 204,651 USD | 180,000 EUR | Morgan Stanley | 03/20/2019 | 376 | — |
| 2,381,173 USD | 2,082,000 EUR | Morgan Stanley | 03/20/2019 | — | (9,693) |
| 353,567 USD | 38,583,000 JPY | Morgan Stanley | 03/20/2019 | — | (6,964) |
| 1,004,475 USD | 1,130,759,000 KRW | Morgan Stanley | 03/20/2019 | 959 | — |
| 314,547 USD | 2,823,000 SEK | Morgan Stanley | 03/20/2019 | — | (8,492) |
| 313,873 USD | 426,000 SGD | Morgan Stanley | 03/20/2019 | 1,300 | — |
| 879,996 USD | 27,106,000 TWD | Morgan Stanley | 03/20/2019 | 489 | — |
| 314,744 USD | 4,379,000 ZAR | Morgan Stanley | 03/20/2019 | — | (4,642) |
| Total | | | | 20,602 | (49,321) |
Notes to Portfolio of Investments
| (a) | Non-income producing investment. |
| (b) | The rate shown is the seven-day current annualized yield at February 28, 2019. |
| (c) | As defined in the Investment Company Act of 1940, an affiliated company is one in which the Fund owns 5% or more of the company’s outstanding voting securities, or a company which is under common ownership or control with the Fund. Holdings and transactions in these affiliated companies during the year ended February 28, 2019 are as follows: |
| Issuer | Beginning
shares | Shares
purchased | Shares
sold | Ending
shares | Realized gain
(loss) —
affiliated
issuers ($) | Net change in
unrealized
appreciation
(depreciation) —
affiliated
issuers ($) | Dividends —
affiliated
issuers ($) | Value —
affiliated
issuers
at end of
period ($) |
| Columbia Short-Term Cash Fund, 2.523% |
| | 276,663 | 39,267,569 | (36,092,907) | 3,451,325 | 292 | — | 53,902 | 3,450,980 |
Abbreviation Legend
| ADR | American Depositary Receipt |
Currency Legend
| AUD | Australian Dollar |
| BRL | Brazilian Real |
| CAD | Canada Dollar |
| DKK | Danish Krone |
| EUR | Euro |
| GBP | British Pound |
| INR | Indian Rupee |
| JPY | Japanese Yen |
| KRW | South Korean Won |
| SEK | Swedish Krona |
| SGD | Singapore Dollar |
| TWD | New Taiwan Dollar |
| USD | US Dollar |
| ZAR | South African Rand |
The accompanying Notes to Financial Statements are an integral part of this statement.
Columbia Select Global Growth Fund | Annual Report 2019
| 9 |
Portfolio of Investments (continued)
February 28, 2019
Fair value measurements
The Fund categorizes its fair value measurements according to a three-level hierarchy that maximizes the use of observable inputs and minimizes the use of unobservable inputs by prioritizing that the most observable input be used when available. Observable inputs are those that market participants would use in pricing an investment based on market data obtained from sources independent of the reporting entity. Unobservable inputs are those that reflect the Fund’s assumptions about the information market participants would use in pricing an investment. An investment’s level within the fair value hierarchy is based on the lowest level of any input that is deemed significant to the asset’s or liability’s fair value measurement. The input levels are not necessarily an indication of the risk or liquidity associated with investments at that level. For example, certain U.S. government securities are generally high quality and liquid, however, they are reflected as Level 2 because the inputs used to determine fair value may not always be quoted prices in an active market.
Fair value inputs are summarized in the three broad levels listed below:
| ■ | Level 1 — Valuations based on quoted prices for investments in active markets that the Fund has the ability to access at the measurement date. Valuation adjustments are not applied to Level 1 investments. |
| ■ | Level 2 — Valuations based on other significant observable inputs (including quoted prices for similar securities, interest rates, prepayment speeds, credit risks, etc.). |
| ■ | Level 3 — Valuations based on significant unobservable inputs (including the Fund’s own assumptions and judgment in determining the fair value of investments). |
Inputs that are used in determining fair value of an investment may include price information, credit data, volatility statistics, and other factors. These inputs can be either observable or unobservable. The availability of observable inputs can vary between investments, and is affected by various factors such as the type of investment, and the volume and level of activity for that investment or similar investments in the marketplace. The inputs will be considered by the Investment Manager, along with any other relevant factors in the calculation of an investment’s fair value. The Fund uses prices and inputs that are current as of the measurement date, which may include periods of market dislocations. During these periods, the availability of prices and inputs may be reduced for many investments. This condition could cause an investment to be reclassified between the various levels within the hierarchy.
Foreign equity securities actively traded in markets where there is a significant delay in the local close relative to the New York Stock Exchange are classified as Level 2. The values of these securities may include an adjustment to reflect the impact of significant market movements following the close of local trading, as described in Note 2 to the financial statements – Security valuation.
Certain investments that have been measured at fair value using the net asset value (NAV) per share (or its equivalent) are not categorized in the fair value hierarchy. The fair value amounts presented in the table are intended to reconcile the fair value hierarchy to the amounts presented in the Portfolio of Investments. The Columbia Short-Term Cash Fund seeks to provide shareholders with maximum current income consistent with liquidity and stability of principal. Columbia Short-Term Cash Fund prices its shares with a floating NAV and no longer seeks to maintain a stable NAV.
Investments falling into the Level 3 category are primarily supported by quoted prices from brokers and dealers participating in the market for those investments. However, these may be classified as Level 3 investments due to lack of market transparency and corroboration to support these quoted prices. Additionally, valuation models may be used as the pricing source for any remaining investments classified as Level 3. These models may rely on one or more significant unobservable inputs and/or significant assumptions by the Investment Manager. Inputs used in valuations may include, but are not limited to, financial statement analysis, capital account balances, discount rates and estimated cash flows, and comparable company data.
Under the direction of the Fund’s Board of Trustees (the Board), the Investment Manager’s Valuation Committee (the Committee) is responsible for overseeing the valuation procedures approved by the Board. The Committee consists of voting and non-voting members from various groups within the Investment Manager’s organization, including operations and accounting, trading and investments, compliance, risk management and legal.
The Committee meets at least monthly to review and approve valuation matters, which may include a description of specific valuation determinations, data regarding pricing information received from approved pricing vendors and brokers and the results of Board-approved valuation control policies and procedures (the Policies). The Policies address, among other things, instances when market quotations are or are not readily available, including recommendations of third party pricing vendors and a determination of appropriate pricing methodologies; events that require specific valuation determinations and assessment of fair value techniques; securities with a potential for stale pricing, including those that are illiquid, restricted, or in default; and the effectiveness of third party pricing vendors, including periodic reviews of vendors. The Committee meets more frequently, as needed, to discuss additional valuation matters, which may include the need to review back-testing results, review time-sensitive information or approve related valuation actions. The Committee reports to the Board, with members of the Committee meeting with the Board at each of its regularly scheduled meetings to discuss valuation matters and actions during the period, similar to those described earlier.
For investments categorized as Level 3, the Committee monitors information similar to that described above, which may include: (i) data specific to the issuer or comparable issuers, (ii) general market or specific sector news and (iii) quoted prices and specific or similar security transactions. The Committee considers this data and any changes from prior periods in order to assess the reasonableness of observable and unobservable inputs, any assumptions or internal models used to value those securities and changes in fair value. This data is also used to corroborate, when available, information received from approved pricing vendors and brokers. Various factors impact the frequency of monitoring this information (which may occur as often as daily). However, the Committee may determine that changes to inputs, assumptions and models are not required as a result of the monitoring procedures performed.
The following table is a summary of the inputs used to value the Fund’s investments at February 28, 2019:
| | Level 1
quoted prices
in active
markets for
identical
assets ($) | Level 2
other
significant
observable
inputs ($) | Level 3
significant
unobservable
inputs ($) | Investments
measured at
net asset
value ($) | Total ($) |
| Investments in Securities | | | | | |
| Common Stocks | | | | | |
| Argentina | 1,466,752 | — | — | — | 1,466,752 |
| Belgium | — | 1,178,006 | — | — | 1,178,006 |
| Brazil | 1,799,617 | — | — | — | 1,799,617 |
| Canada | 901,682 | — | — | — | 901,682 |
| China | 6,392,819 | 3,491,371 | — | — | 9,884,190 |
The accompanying Notes to Financial Statements are an integral part of this statement.
| 10 | Columbia Select Global Growth Fund | Annual Report 2019 |
Portfolio of Investments (continued)
February 28, 2019
Fair value measurements (continued)
| | Level 1
quoted prices
in active
markets for
identical
assets ($) | Level 2
other
significant
observable
inputs ($) | Level 3
significant
unobservable
inputs ($) | Investments
measured at
net asset
value ($) | Total ($) |
| Denmark | — | 1,030,562 | — | — | 1,030,562 |
| India | 1,500,621 | — | — | — | 1,500,621 |
| Ireland | 1,625,643 | — | — | — | 1,625,643 |
| Japan | — | 2,961,682 | — | — | 2,961,682 |
| Netherlands | 657,627 | — | — | — | 657,627 |
| Russian Federation | 1,668,228 | — | — | — | 1,668,228 |
| Switzerland | — | 1,697,726 | — | — | 1,697,726 |
| United Kingdom | — | 1,638,772 | — | — | 1,638,772 |
| United States | 35,902,930 | 1,849,024 | — | — | 37,751,954 |
| Total Common Stocks | 51,915,919 | 13,847,143 | — | — | 65,763,062 |
| Money Market Funds | — | — | — | 3,450,980 | 3,450,980 |
| Total Investments in Securities | 51,915,919 | 13,847,143 | — | 3,450,980 | 69,214,042 |
| Investments in Derivatives | | | | | |
| Asset | | | | | |
| Forward Foreign Currency Exchange Contracts | — | 20,602 | — | — | 20,602 |
| Liability | | | | | |
| Forward Foreign Currency Exchange Contracts | — | (49,321) | — | — | (49,321) |
| Total | 51,915,919 | 13,818,424 | — | 3,450,980 | 69,185,323 |
See the Portfolio of Investments for all investment classifications not indicated in the table.
The Fund’s assets assigned to the Level 2 input category are generally valued using the market approach, in which a security’s value is determined through reference to prices and information from market transactions for similar or identical assets. These assets include certain foreign securities for which a third party statistical pricing service may be employed for purposes of fair market valuation. The model utilized by such third party statistical pricing service takes into account a security’s correlation to available market data including, but not limited to, intraday index, ADR, and exchange-traded fund movements.
Derivative instruments are valued at unrealized appreciation (depreciation).
There were no transfers of financial assets between levels during the period.
The accompanying Notes to Financial Statements are an integral part of this statement.
Columbia Select Global Growth Fund | Annual Report 2019
| 11 |
Statement of Assets and Liabilities
February 28, 2019
| Assets | |
| Investments in securities, at value | |
| Unaffiliated issuers (cost $49,539,117) | $65,763,062 |
| Affiliated issuers (cost $3,450,980) | 3,450,980 |
| Unrealized appreciation on forward foreign currency exchange contracts | 20,602 |
| Receivable for: | |
| Investments sold | 557,720 |
| Capital shares sold | 138,973 |
| Dividends | 14,883 |
| Foreign tax reclaims | 29,321 |
| Expense reimbursement due from Investment Manager | 707 |
| Prepaid expenses | 1,134 |
| Total assets | 69,977,382 |
| Liabilities | |
| Unrealized depreciation on forward foreign currency exchange contracts | 49,321 |
| Payable for: | |
| Investments purchased | 5,350 |
| Capital shares purchased | 76,707 |
| Management services fees | 1,670 |
| Distribution and/or service fees | 445 |
| Transfer agent fees | 6,538 |
| Compensation of board members | 42,171 |
| Compensation of chief compliance officer | 1 |
| Audit fees | 33,975 |
| Custodian fees | 18,708 |
| Other expenses | 5,733 |
| Total liabilities | 240,619 |
| Net assets applicable to outstanding capital stock | $69,736,763 |
| Represented by | |
| Paid in capital | 54,814,155 |
| Total distributable earnings (loss) (Note 2) | 14,922,608 |
| Total - representing net assets applicable to outstanding capital stock | $69,736,763 |
The accompanying Notes to Financial Statements are an integral part of this statement.
| 12 | Columbia Select Global Growth Fund | Annual Report 2019 |
Statement of Assets and Liabilities (continued)
February 28, 2019
| Class A | |
| Net assets | $29,547,875 |
| Shares outstanding | 1,956,398 |
| Net asset value per share | $15.10 |
| Maximum sales charge | 5.75% |
| Maximum offering price per share (calculated by dividing the net asset value per share by 1.0 minus the maximum sales charge for Class A shares) | $16.02 |
| Advisor Class | |
| Net assets | $2,490,660 |
| Shares outstanding | 160,993 |
| Net asset value per share | $15.47 |
| Class C | |
| Net assets | $8,447,524 |
| Shares outstanding | 601,951 |
| Net asset value per share | $14.03 |
| Institutional Class | |
| Net assets | $23,721,541 |
| Shares outstanding | 1,532,822 |
| Net asset value per share | $15.48 |
| Institutional 2 Class | |
| Net assets | $285,014 |
| Shares outstanding | 18,363 |
| Net asset value per share | $15.52 |
| Institutional 3 Class | |
| Net assets | $4,515,676 |
| Shares outstanding | 293,594 |
| Net asset value per share | $15.38 |
| Class R | |
| Net assets | $728,473 |
| Shares outstanding | 49,403 |
| Net asset value per share | $14.75 |
The accompanying Notes to Financial Statements are an integral part of this statement.
Columbia Select Global Growth Fund | Annual Report 2019
| 13 |
Statement of Operations
Year Ended February 28, 2019
| Net investment income | |
| Income: | |
| Dividends — unaffiliated issuers | $307,357 |
| Dividends — affiliated issuers | 53,902 |
| Foreign taxes withheld | (15,088) |
| Total income | 346,171 |
| Expenses: | |
| Management services fees | 636,601 |
| Distribution and/or service fees | |
| Class A | 82,315 |
| Class C | 106,069 |
| Class R | 3,625 |
| Transfer agent fees | |
| Class A | 42,353 |
| Advisor Class | 3,471 |
| Class C | 13,613 |
| Institutional Class | 27,053 |
| Institutional 2 Class | 377 |
| Institutional 3 Class | 401 |
| Class R | 937 |
| Compensation of board members | 10,269 |
| Custodian fees | 57,302 |
| Printing and postage fees | 23,765 |
| Registration fees | 109,142 |
| Audit fees | 33,975 |
| Legal fees | 7,393 |
| Interest on interfund lending | 138 |
| Compensation of chief compliance officer | 16 |
| Other | 13,517 |
| Total expenses | 1,172,332 |
| Fees waived or expenses reimbursed by Investment Manager and its affiliates | (165,874) |
| Total net expenses | 1,006,458 |
| Net investment loss | (660,287) |
| Realized and unrealized gain (loss) — net | |
| Net realized gain (loss) on: | |
| Investments — unaffiliated issuers | (225,698) |
| Investments — affiliated issuers | 292 |
| Foreign currency translations | 14,985 |
| Forward foreign currency exchange contracts | (657,916) |
| Net realized loss | (868,337) |
| Net change in unrealized appreciation (depreciation) on: | |
| Investments — unaffiliated issuers | (2,638,030) |
| Foreign currency translations | (1,844) |
| Forward foreign currency exchange contracts | 21,543 |
| Net change in unrealized appreciation (depreciation) | (2,618,331) |
| Net realized and unrealized loss | (3,486,668) |
| Net decrease in net assets resulting from operations | $(4,146,955) |
The accompanying Notes to Financial Statements are an integral part of this statement.
| 14 | Columbia Select Global Growth Fund | Annual Report 2019 |
Statement of Changes in Net Assets
| | Year Ended
February 28, 2019 | Year Ended
February 28, 2018 |
| Operations | | |
| Net investment loss | $(660,287) | $(550,403) |
| Net realized gain (loss) | (868,337) | 2,031,807 |
| Net change in unrealized appreciation (depreciation) | (2,618,331) | 14,658,550 |
| Net increase (decrease) in net assets resulting from operations | (4,146,955) | 16,139,954 |
| Distributions to shareholders | | |
| Net investment income and net realized gains | | |
| Class A | (423,326) | — |
| Advisor Class | (28,921) | — |
| Class C | (138,792) | — |
| Institutional Class | (268,712) | — |
| Institutional 2 Class | (7,040) | — |
| Institutional 3 Class | (59,867) | — |
| Class R | (10,481) | — |
| Total distributions to shareholders (Note 2) | (937,139) | — |
| Increase (decrease) in net assets from capital stock activity | 7,274,607 | (3,656,139) |
| Total increase in net assets | 2,190,513 | 12,483,815 |
| Net assets at beginning of year | 67,546,250 | 55,062,435 |
| Net assets at end of year | $69,736,763 | $67,546,250 |
| Excess of distributions over net investment income | $(139,274) | $(140,705) |
The accompanying Notes to Financial Statements are an integral part of this statement.
Columbia Select Global Growth Fund | Annual Report 2019
| 15 |
Statement of Changes in Net Assets (continued)
| | Year Ended | Year Ended |
| | February 28, 2019 | February 28, 2018(a) |
| | Shares | Dollars ($) | Shares | Dollars ($) |
| Capital stock activity |
| Class A | | | | |
| Subscriptions | 983,343 | 15,734,358 | 343,252 | 4,921,667 |
| Distributions reinvested | 29,579 | 403,233 | — | — |
| Redemptions | (878,204) | (13,747,889) | (1,408,683) | (18,719,765) |
| Net increase (decrease) | 134,718 | 2,389,702 | (1,065,431) | (13,798,098) |
| Advisor Class | | | | |
| Subscriptions | 83,522 | 1,267,634 | 258,433 | 3,802,476 |
| Distributions reinvested | 2,044 | 28,885 | — | — |
| Redemptions | (160,653) | (2,614,768) | (139,458) | (2,239,797) |
| Net increase (decrease) | (75,087) | (1,318,249) | 118,975 | 1,562,679 |
| Class C | | | | |
| Subscriptions | 138,157 | 2,098,462 | 140,036 | 1,932,047 |
| Distributions reinvested | 10,422 | 132,600 | — | — |
| Redemptions | (309,247) | (4,468,074) | (290,016) | (3,933,850) |
| Net decrease | (160,668) | (2,237,012) | (149,980) | (2,001,803) |
| Institutional Class | | | | |
| Subscriptions | 832,225 | 13,083,574 | 1,190,796 | 16,057,131 |
| Distributions reinvested | 17,575 | 243,368 | — | — |
| Redemptions | (367,086) | (5,615,850) | (620,347) | (9,220,965) |
| Net increase | 482,714 | 7,711,092 | 570,449 | 6,836,166 |
| Institutional 2 Class | | | | |
| Subscriptions | 31,966 | 540,045 | 20,671 | 280,650 |
| Distributions reinvested | 500 | 7,004 | — | — |
| Redemptions | (29,151) | (453,364) | (23,182) | (367,427) |
| Net increase (decrease) | 3,315 | 93,685 | (2,511) | (86,777) |
| Institutional 3 Class | | | | |
| Subscriptions | 130,022 | 2,126,582 | 298,864 | 4,464,015 |
| Distributions reinvested | 4,348 | 59,826 | — | — |
| Redemptions | (112,257) | (1,760,265) | (27,383) | (422,815) |
| Net increase | 22,113 | 426,143 | 271,481 | 4,041,200 |
| Class R | | | | |
| Subscriptions | 20,515 | 308,630 | 6,577 | 93,264 |
| Distributions reinvested | 792 | 10,421 | — | — |
| Redemptions | (8,536) | (109,805) | (22,932) | (302,770) |
| Net increase (decrease) | 12,771 | 209,246 | (16,355) | (209,506) |
| Total net increase (decrease) | 419,876 | 7,274,607 | (273,372) | (3,656,139) |
| (a) | Institutional 3 Class shares are based on operations from March 1, 2017 (commencement of operations) through the stated period end. |
The accompanying Notes to Financial Statements are an integral part of this statement.
| 16 | Columbia Select Global Growth Fund | Annual Report 2019 |
[THIS PAGE INTENTIONALLY LEFT BLANK]
Columbia Select Global Growth Fund | Annual Report 2019
| 17 |
The following table is intended to help you understand the Fund’s financial performance. Certain information reflects financial results for a single share of a class held for the periods shown. Per share net investment income (loss) amounts are calculated based on average shares outstanding during the period. Total return assumes reinvestment of all dividends and distributions, if any. Total return does not reflect payment of sales charges, if any. Total return and portfolio turnover are not annualized for periods of less than one year. The portfolio turnover rate is calculated without regard to purchase and sales transactions of short-term instruments and certain derivatives, if any. If such transactions were included, the Fund’s portfolio turnover rate may be higher.
| | Net asset value,
beginning of
period | Net
investment
income
(loss) | Net
realized
and
unrealized
gain (loss) | Total from
investment
operations | Distributions
from net
realized
gains | Total
distributions to
shareholders |
| Class A |
| Year Ended 2/28/2019 | $16.17 | (0.14) | (0.73) | (0.87) | (0.20) | (0.20) |
| Year Ended 2/28/2018 | $12.44 | (0.12) | 3.85 | 3.73 | — | — |
| Year Ended 2/28/2017 | $11.14 | (0.10) | 2.16 | 2.06 | (0.76) | (0.76) |
| Year Ended 2/29/2016 | $13.58 | (0.09) | (2.12) | (2.21) | (0.23) | (0.23) |
| Year Ended 2/28/2015 | $14.05 | (0.06) | 1.02 | 0.96 | (1.43) | (1.43) |
| Advisor Class |
| Year Ended 2/28/2019 | $16.52 | (0.10) | (0.75) | (0.85) | (0.20) | (0.20) |
| Year Ended 2/28/2018 | $12.67 | (0.10) | 3.95 | 3.85 | — | — |
| Year Ended 2/28/2017 | $11.31 | (0.07) | 2.19 | 2.12 | (0.76) | (0.76) |
| Year Ended 2/29/2016 | $13.75 | (0.03) | (2.18) | (2.21) | (0.23) | (0.23) |
| Year Ended 2/28/2015 | $14.17 | (0.02) | 1.03 | 1.01 | (1.43) | (1.43) |
| Class C |
| Year Ended 2/28/2019 | $15.16 | (0.24) | (0.69) | (0.93) | (0.20) | (0.20) |
| Year Ended 2/28/2018 | $11.74 | (0.21) | 3.63 | 3.42 | — | — |
| Year Ended 2/28/2017 | $10.64 | (0.18) | 2.04 | 1.86 | (0.76) | (0.76) |
| Year Ended 2/29/2016 | $13.07 | (0.18) | (2.02) | (2.20) | (0.23) | (0.23) |
| Year Ended 2/28/2015 | $13.67 | (0.15) | 0.98 | 0.83 | (1.43) | (1.43) |
| Institutional Class |
| Year Ended 2/28/2019 | $16.52 | (0.10) | (0.74) | (0.84) | (0.20) | (0.20) |
| Year Ended 2/28/2018 | $12.67 | (0.08) | 3.93 | 3.85 | — | — |
| Year Ended 2/28/2017 | $11.31 | (0.07) | 2.19 | 2.12 | (0.76) | (0.76) |
| Year Ended 2/29/2016 | $13.75 | (0.05) | (2.16) | (2.21) | (0.23) | (0.23) |
| Year Ended 2/28/2015 | $14.17 | (0.02) | 1.03 | 1.01 | (1.43) | (1.43) |
| Institutional 2 Class |
| Year Ended 2/28/2019 | $16.57 | (0.10) | (0.75) | (0.85) | (0.20) | (0.20) |
| Year Ended 2/28/2018 | $12.70 | (0.08) | 3.95 | 3.87 | — | — |
| Year Ended 2/28/2017 | $11.33 | (0.06) | 2.19 | 2.13 | (0.76) | (0.76) |
| Year Ended 2/29/2016 | $13.76 | (0.06) | (2.14) | (2.20) | (0.23) | (0.23) |
| Year Ended 2/28/2015 | $14.17 | (0.07) | 1.09 | 1.02 | (1.43) | (1.43) |
The accompanying Notes to Financial Statements are an integral part of this statement.
| 18 | Columbia Select Global Growth Fund | Annual Report 2019 |
Financial Highlights (continued)
| | Net
asset
value,
end of
period | Total
return | Total gross
expense
ratio to
average
net assets(a) | Total net
expense
ratio to
average
net assets(a),(b) | Net investment
income (loss)
ratio to
average
net assets | Portfolio
turnover | Net
assets,
end of
period
(000’s) |
| Class A |
| Year Ended 2/28/2019 | $15.10 | (5.21%) | 1.60%(c) | 1.37%(c) | (0.90%) | 46% | $29,548 |
| Year Ended 2/28/2018 | $16.17 | 29.98% | 1.67% | 1.38%(d) | (0.83%) | 48% | $29,457 |
| Year Ended 2/28/2017 | $12.44 | 18.89% | 1.60% | 1.42% | (0.80%) | 27% | $35,911 |
| Year Ended 2/29/2016 | $11.14 | (16.49%) | 1.57% | 1.47% | (0.71%) | 154% | $40,252 |
| Year Ended 2/28/2015 | $13.58 | 7.53% | 1.71%(e) | 1.49%(e) | (0.44%) | 98% | $32,186 |
| Advisor Class |
| Year Ended 2/28/2019 | $15.47 | (4.98%) | 1.34%(c) | 1.12%(c) | (0.63%) | 46% | $2,491 |
| Year Ended 2/28/2018 | $16.52 | 30.39% | 1.44% | 1.13%(d) | (0.65%) | 48% | $3,899 |
| Year Ended 2/28/2017 | $12.67 | 19.15% | 1.35% | 1.17% | (0.53%) | 27% | $1,484 |
| Year Ended 2/29/2016 | $11.31 | (16.28%) | 1.32% | 1.22% | (0.26%) | 154% | $1,451 |
| Year Ended 2/28/2015 | $13.75 | 7.83% | 1.45%(e) | 1.24%(e) | (0.12%) | 98% | $3,917 |
| Class C |
| Year Ended 2/28/2019 | $14.03 | (5.95%) | 2.34%(c) | 2.12%(c) | (1.64%) | 46% | $8,448 |
| Year Ended 2/28/2018 | $15.16 | 29.13% | 2.43% | 2.13%(d) | (1.58%) | 48% | $11,558 |
| Year Ended 2/28/2017 | $11.74 | 17.86% | 2.35% | 2.17% | (1.55%) | 27% | $10,718 |
| Year Ended 2/29/2016 | $10.64 | (17.06%) | 2.32% | 2.22% | (1.45%) | 154% | $13,111 |
| Year Ended 2/28/2015 | $13.07 | 6.74% | 2.46%(e) | 2.24%(e) | (1.18%) | 98% | $9,521 |
| Institutional Class |
| Year Ended 2/28/2019 | $15.48 | (4.91%) | 1.35%(c) | 1.12%(c) | (0.65%) | 46% | $23,722 |
| Year Ended 2/28/2018 | $16.52 | 30.39% | 1.44% | 1.13%(d) | (0.58%) | 48% | $17,349 |
| Year Ended 2/28/2017 | $12.67 | 19.14% | 1.35% | 1.17% | (0.57%) | 27% | $6,079 |
| Year Ended 2/29/2016 | $11.31 | (16.29%) | 1.32% | 1.22% | (0.39%) | 154% | $5,950 |
| Year Ended 2/28/2015 | $13.75 | 7.83% | 1.44%(e) | 1.24%(e) | (0.12%) | 98% | $8,874 |
| Institutional 2 Class |
| Year Ended 2/28/2019 | $15.52 | (4.96%) | 1.28%(c) | 1.08%(c) | (0.60%) | 46% | $285 |
| Year Ended 2/28/2018 | $16.57 | 30.47% | 1.37% | 1.09% | (0.54%) | 48% | $249 |
| Year Ended 2/28/2017 | $12.70 | 19.20% | 1.26% | 1.10% | (0.48%) | 27% | $223 |
| Year Ended 2/29/2016 | $11.33 | (16.20%) | 1.21% | 1.14% | (0.47%) | 154% | $194 |
| Year Ended 2/28/2015 | $13.76 | 7.90% | 1.37%(e) | 1.18%(e) | (0.55%) | 98% | $51 |
The accompanying Notes to Financial Statements are an integral part of this statement.
Columbia Select Global Growth Fund | Annual Report 2019
| 19 |
Financial Highlights (continued)
| | Net asset value,
beginning of
period | Net
investment
income
(loss) | Net
realized
and
unrealized
gain (loss) | Total from
investment
operations | Distributions
from net
realized
gains | Total
distributions to
shareholders |
| Institutional 3 Class |
| Year Ended 2/28/2019 | $16.41 | (0.09) | (0.74) | (0.83) | (0.20) | (0.20) |
| Year Ended 2/28/2018(f) | $12.70 | (0.11) | 3.82 | 3.71 | — | — |
| Class R |
| Year Ended 2/28/2019 | $15.83 | (0.17) | (0.71) | (0.88) | (0.20) | (0.20) |
| Year Ended 2/28/2018 | $12.21 | (0.15) | 3.77 | 3.62 | — | — |
| Year Ended 2/28/2017 | $10.97 | (0.13) | 2.13 | 2.00 | (0.76) | (0.76) |
| Year Ended 2/29/2016 | $13.41 | (0.12) | (2.09) | (2.21) | (0.23) | (0.23) |
| Year Ended 2/28/2015 | $13.92 | (0.06) | 0.98 | 0.92 | (1.43) | (1.43) |
| Notes to Financial Highlights |
| (a) | In addition to the fees and expenses that the Fund bears directly, the Fund indirectly bears a pro rata share of the fees and expenses of any other funds in which it invests. Such indirect expenses are not included in the Fund’s reported expense ratios. |
| (b) | Total net expenses include the impact of certain fee waivers/expense reimbursements made by the Investment Manager and certain of its affiliates, if applicable. |
| (c) | Ratios include interfund lending expense which is less than 0.01%. |
| (d) | The benefits derived from expense reductions had an impact of less than 0.01%. |
| (e) | Ratios include line of credit interest expense which is less than 0.01%. |
| (f) | Institutional 3 Class shares commenced operations on March 1, 2017. Per share data and total return reflect activity from that date. |
The accompanying Notes to Financial Statements are an integral part of this statement.
| 20 | Columbia Select Global Growth Fund | Annual Report 2019 |
Financial Highlights (continued)
| | Net
asset
value,
end of
period | Total
return | Total gross
expense
ratio to
average
net assets(a) | Total net
expense
ratio to
average
net assets(a),(b) | Net investment
income (loss)
ratio to
average
net assets | Portfolio
turnover | Net
assets,
end of
period
(000’s) |
| Institutional 3 Class |
| Year Ended 2/28/2019 | $15.38 | (4.89%) | 1.23%(c) | 1.02%(c) | (0.55%) | 46% | $4,516 |
| Year Ended 2/28/2018(f) | $16.41 | 29.21% | 1.32% | 1.03% | (0.71%) | 48% | $4,454 |
| Class R |
| Year Ended 2/28/2019 | $14.75 | (5.38%) | 1.85%(c) | 1.62%(c) | (1.16%) | 46% | $728 |
| Year Ended 2/28/2018 | $15.83 | 29.65% | 1.93% | 1.63%(d) | (1.08%) | 48% | $580 |
| Year Ended 2/28/2017 | $12.21 | 18.63% | 1.85% | 1.67% | (1.08%) | 27% | $647 |
| Year Ended 2/29/2016 | $10.97 | (16.70%) | 1.82% | 1.72% | (0.93%) | 154% | $543 |
| Year Ended 2/28/2015 | $13.41 | 7.30% | 1.92%(e) | 1.75%(e) | (0.41%) | 98% | $647 |
The accompanying Notes to Financial Statements are an integral part of this statement.
Columbia Select Global Growth Fund | Annual Report 2019
| 21 |
Notes to Financial Statements
February 28, 2019
Note 1. Organization
Columbia Select Global Growth Fund (the Fund), a series of Columbia Funds Series Trust (the Trust), is a diversified fund. The Trust is registered under the Investment Company Act of 1940, as amended (the 1940 Act), as an open-end management investment company organized as a Delaware statutory trust.
Fund shares
The Trust may issue an unlimited number of shares (without par value). Although all share classes generally have identical voting, dividend and liquidation rights, each share class votes separately when required by the Trust’s organizational documents or by law. Different share classes pay different distribution amounts to the extent the expenses of such share classes differ, and distributions in liquidation will be proportional to the net asset value of each share class. Each share class has its own expense and sales charge structure. The Fund offers each of the share classes identified below.
Class A shares are subject to a maximum front-end sales charge of 5.75% based on the initial investment amount. Class A shares purchased without an initial sales charge in accounts aggregating $1 million to $50 million at the time of purchase are subject to a contingent deferred sales charge (CDSC) if the shares are sold within 18 months after purchase, charged as follows: 1.00% CDSC if redeemed within 12 months after purchase, and 0.50% CDSC if redeemed more than 12, but less than 18, months after purchase.
Advisor Class shares are not subject to sales charges and are generally available only to omnibus retirement plans and certain investors as described in the Fund’s prospectus.
Class C shares are subject to a 1.00% CDSC on shares redeemed within 12 months after purchase. Effective July 1, 2018, Class C shares automatically convert to Class A shares of the same Fund in the month of or the month following the 10-year anniversary of the Class C shares purchase date.
Institutional Class shares are not subject to sales charges and are generally available only to eligible investors, which are subject to different investment minimums as described in the Fund’s prospectus.
Institutional 2 Class shares are not subject to sales charges and are generally available only to investors purchasing through authorized investment professionals and omnibus retirement plans as described in the Fund’s prospectus.
Institutional 3 Class shares are not subject to sales charges and are available to institutional and certain other investors as described in the Fund’s prospectus.
Class R shares are not subject to sales charges and are generally available only to certain retirement plans and other investors as described in the Fund’s prospectus.
Note 2. Summary of significant accounting policies
Basis of preparation
The Fund is an investment company that applies the accounting and reporting guidance in the Financial Accounting Standards Board (FASB) Accounting Standards Codification Topic 946,Financial Services - Investment Companies (ASC 946). The financial statements are prepared in accordance with U.S. generally accepted accounting principles (GAAP), which requires management to make certain estimates and assumptions that affect the reported amounts of assets and liabilities, the disclosure of contingent assets and liabilities at the date of the financial statements and the reported amounts of income and expenses during the reporting period. Actual results could differ from those estimates.
The following is a summary of significant accounting policies followed by the Fund in the preparation of its financial statements.
| 22 | Columbia Select Global Growth Fund | Annual Report 2019 |
Notes to Financial Statements (continued)
February 28, 2019
Security valuation
All equity securities are valued at the close of business of the New York Stock Exchange. Equity securities are valued at the last quoted sales price on the principal exchange or market on which they trade, except for securities traded on the NASDAQ Stock Market, which are valued at the NASDAQ official close price. Unlisted securities or listed securities for which there were no sales during the day are valued at the mean of the latest quoted bid and ask prices on such exchanges or markets.
Foreign equity securities are valued based on the closing price on the foreign exchange in which such securities are primarily traded. If any foreign equity security closing prices are not readily available, the securities are valued at the mean of the latest quoted bid and ask prices on such exchanges or markets. Foreign currency exchange rates are generally determined at 4:00 p.m. Eastern (U.S.) time. Many securities markets and exchanges outside the U.S. close prior to the close of the New York Stock Exchange; therefore, the closing prices for securities in such markets or on such exchanges may not fully reflect events that occur after such close but before the close of the New York Stock Exchange. In those situations, foreign securities will be fair valued pursuant to a policy adopted by the Board of Trustees, including, if available, utilizing a third party pricing service to determine these fair values. The third party pricing service takes into account multiple factors, including, but not limited to, movements in the U.S. securities markets, certain depositary receipts, futures contracts and foreign exchange rates that have occurred subsequent to the close of the foreign exchange or market, to determine a good faith estimate that reasonably reflects the current market conditions as of the close of the New York Stock Exchange. The fair value of a security is likely to be different from the quoted or published price, if available.
Investments in open-end investment companies, including money market funds, are valued at their latest net asset value.
Forward foreign currency exchange contracts are marked-to-market based upon foreign currency exchange rates provided by a pricing service.
Investments for which market quotations are not readily available, or that have quotations which management believes are not reflective of market value or reliable, are valued at fair value as determined in good faith under procedures approved by and under the general supervision of the Board of Trustees. If a security or class of securities (such as foreign securities) is valued at fair value, such value is likely to be different from the quoted or published price for the security.
The determination of fair value often requires significant judgment. To determine fair value, management may use assumptions including but not limited to future cash flows and estimated risk premiums. Multiple inputs from various sources may be used to determine fair value.
GAAP requires disclosure regarding the inputs and valuation techniques used to measure fair value and any changes in valuation inputs or techniques. In addition, investments shall be disclosed by major category. This information is disclosed following the Fund’s Portfolio of Investments.
Foreign currency transactions and translations
The values of all assets and liabilities denominated in foreign currencies are generally translated into U.S. dollars at exchange rates determined at the close of regular trading on the New York Stock Exchange. Net realized and unrealized gains (losses) on foreign currency transactions and translations include gains (losses) arising from the fluctuation in exchange rates between trade and settlement dates on securities transactions, gains (losses) arising from the disposition of foreign currency and currency gains (losses) between the accrual and payment dates on dividends, interest income and foreign withholding taxes.
For financial statement purposes, the Fund does not distinguish that portion of gains (losses) on investments which is due to changes in foreign exchange rates from that which is due to changes in market prices of the investments. Such fluctuations are included with the net realized and unrealized gains (losses) on investments in the Statement of Operations.
Derivative instruments
The Fund invests in certain derivative instruments, as detailed below, to meet its investment objectives. Derivatives are instruments whose values depend on, or are derived from, in whole or in part, the value of one or more securities, currencies, commodities, indices, or other assets or instruments. Derivatives may be used to increase investment flexibility (including to maintain cash reserves while maintaining desired exposure to certain assets), for risk management (hedging)
Columbia Select Global Growth Fund | Annual Report 2019
| 23 |
Notes to Financial Statements (continued)
February 28, 2019
purposes, to facilitate trading, to reduce transaction costs and to pursue higher investment returns. The Fund may also use derivative instruments to mitigate certain investment risks, such as foreign currency exchange rate risk, interest rate risk and credit risk. Derivatives may involve various risks, including the potential inability of the counterparty to fulfill its obligations under the terms of the contract, the potential for an illiquid secondary market (making it difficult for the Fund to sell or terminate, including at favorable prices) and the potential for market movements which may expose the Fund to gains or losses in excess of the amount shown in the Statement of Assets and Liabilities. The notional amounts of derivative instruments, if applicable, are not recorded in the financial statements.
A derivative instrument may suffer a marked-to-market loss if the value of the contract decreases due to an unfavorable change in the market rates or values of the underlying instrument. Losses can also occur if the counterparty does not perform its obligations under the contract. The Fund’s risk of loss from counterparty credit risk on over-the-counter derivatives is generally limited to the aggregate unrealized gain netted against any collateral held by the Fund and the amount of any variation margin held by the counterparty, plus any replacement costs or related amounts. With exchange-traded or centrally cleared derivatives, there is reduced counterparty credit risk to the Fund since the clearinghouse or central counterparty (CCP) provides some protection in the case of clearing member default. The clearinghouse or CCP stands between the buyer and the seller of the contract; therefore, additional counterparty credit risk is failure of the clearinghouse or CCP. However, credit risk still exists in exchange-traded or centrally cleared derivatives with respect to initial and variation margin that is held in a broker’s customer account. While brokers are required to segregate customer margin from their own assets, in the event that a broker becomes insolvent or goes into bankruptcy and at that time there is a shortfall in the aggregate amount of margin held by the broker for all its clients, U.S. bankruptcy laws will typically allocate that shortfall on a pro-rata basis across all the broker’s customers (including the Fund), potentially resulting in losses to the Fund.
In order to better define its contractual rights and to secure rights that will help the Fund mitigate its counterparty risk, the Fund may enter into an International Swaps and Derivatives Association, Inc. Master Agreement (ISDA Master Agreement) or similar agreement with its derivatives contract counterparties. An ISDA Master Agreement is an agreement between the Fund and a counterparty that governs over-the-counter derivatives and typically contains, among other things, collateral posting terms and netting provisions in the event of a default and/or termination event. Under an ISDA Master Agreement, the Fund may, under certain circumstances, offset with the counterparty certain derivative instrument’s payables and/or receivables with collateral held and/or posted and create one single net payment. The provisions of the ISDA Master Agreement typically permit a single net payment in the event of default (close-out netting), including the bankruptcy or insolvency of the counterparty. Note, however, that bankruptcy or insolvency laws of a particular jurisdiction may impose restrictions on or prohibitions against the right of offset or netting in bankruptcy, insolvency or other events.
Collateral (margin) requirements differ by type of derivative. Margin requirements are established by the clearinghouse or CCP for exchange-traded and centrally cleared derivatives. Brokers can ask for margin in excess of the minimum in certain circumstances. Collateral terms are contract specific for over-the-counter derivatives. For over-the-counter derivatives traded under an ISDA Master Agreement, the collateral requirements are typically calculated by netting the marked-to-market amount for each transaction under such agreement and comparing that amount to the value of any variation margin currently pledged by the Fund and/or the counterparty. Generally, the amount of collateral due from or to a party has to exceed a minimum transfer amount threshold (e.g., $250,000) before a transfer has to be made. To the extent amounts due to the Fund from its counterparties are not fully collateralized, contractually or otherwise, the Fund bears the risk of loss from counterparty nonperformance. The Fund may also pay interest expense on cash collateral received from the broker. Any interest expense paid by the Fund is shown on the Statement of Operations. The Fund attempts to mitigate counterparty risk by only entering into agreements with counterparties that it believes have the financial resources to honor their obligations and by monitoring the financial stability of those counterparties.
Certain ISDA Master Agreements allow counterparties of over-the-counter derivatives transactions to terminate derivatives contracts prior to maturity in the event the Fund’s net asset value declines by a stated percentage over a specified time period or if the Fund fails to meet certain terms of the ISDA Master Agreement, which would cause the Fund to accelerate payment of any net liability owed to the counterparty. The Fund also has termination rights if the counterparty fails to meet certain terms of the ISDA Master Agreement. In determining whether to exercise such termination rights, the Fund would consider, in addition to counterparty credit risk, whether termination would result in a net liability owed from the counterparty.
| 24 | Columbia Select Global Growth Fund | Annual Report 2019 |
Notes to Financial Statements (continued)
February 28, 2019
For financial reporting purposes, the Fund does not offset derivative assets and derivative liabilities that are subject to netting arrangements in the Statement of Assets and Liabilities.
Forward foreign currency exchange contracts
Forward foreign currency exchange contracts are over-the-counter agreements between two parties to buy and sell a currency at a set price on a future date. The Fund utilized forward foreign currency exchange contracts to hedge the currency exposure associated with some or all of the Fund’s securities, to shift investment exposure from one currency to another, to shift U.S. dollar exposure to achieve a representative weighted mix of major currencies in its benchmark and to recover an underweight country exposure in its portfolio. These instruments may be used for other purposes in future periods.
The values of forward foreign currency exchange contracts fluctuate daily with changes in foreign currency exchange rates. Changes in the value of these contracts are recorded as unrealized appreciation or depreciation until the contract is exercised or has expired. The Fund will realize a gain or loss when the forward foreign currency exchange contract is closed or expires. Non-deliverable forward foreign currency exchange contracts are settled with the counterparty in U.S. Dollars without delivery of foreign currency.
The use of forward foreign currency exchange contracts does not eliminate fluctuations in the prices of the Fund’s portfolio securities. The risks of forward foreign currency exchange contracts include movement in the values of the foreign currencies relative to the U.S. dollar (or other foreign currencies) and the possibility that counterparties will not complete their contractual obligations, which may be in excess of the amount reflected, if any, in the Statement of Assets and Liabilities.
Effects of derivative transactions in the financial statements
The following tables are intended to provide additional information about the effect of derivatives on the financial statements of the Fund, including: the fair value of derivatives by risk category and the location of those fair values in the Statement of Assets and Liabilities; and the impact of derivative transactions over the period in the Statement of Operations, including realized and unrealized gains (losses). The derivative instrument schedules following the Portfolio of Investments present additional information regarding derivative instruments outstanding at the end of the period, if any.
The following table is a summary of the fair value of derivative instruments (not considered to be hedging instruments for accounting disclosure purposes) at February 28, 2019:
| | Asset derivatives | |
Risk exposure
category | Statement
of assets and liabilities
location | Fair value ($) |
| Foreign exchange risk | Unrealized appreciation on forward foreign currency exchange contracts | 20,602 |
| | Liability derivatives | |
Risk exposure
category | Statement
of assets and liabilities
location | Fair value ($) |
| Foreign exchange risk | Unrealized depreciation on forward foreign currency exchange contracts | 49,321 |
Columbia Select Global Growth Fund | Annual Report 2019
| 25 |
Notes to Financial Statements (continued)
February 28, 2019
The following table indicates the effect of derivative instruments (not considered to be hedging instruments for accounting disclosure purposes) in the Statement of Operations for the year ended February 28, 2019:
| Amount of realized gain (loss) on derivatives recognized in income |
| Risk exposure category | Forward
foreign
currency
exchange
contracts
($) |
| Foreign exchange risk | (657,916) |
| |
| Change in unrealized appreciation (depreciation) on derivatives recognized in income |
| Risk exposure category | Forward
foreign
currency
exchange
contracts
($) |
| Foreign exchange risk | 21,543 |
The following table is a summary of the average outstanding volume by derivative instrument for the year ended February 28, 2019:
| Derivative instrument | Average unrealized
appreciation ($)* | Average unrealized
depreciation ($)* |
| Forward foreign currency exchange contracts | 42,115 | (72,804) |
| * | Based on the ending quarterly outstanding amounts for the year ended February 28, 2019. |
Offsetting of assets and liabilities
The following table presents the Fund’s gross and net amount of assets and liabilities available for offset under netting arrangements as well as any related collateral received or pledged by the Fund as of February 28, 2019:
| | Morgan
Stanley ($) |
| Assets | |
| Forward foreign currency exchange contracts | 20,602 |
| Liabilities | |
| Forward foreign currency exchange contracts | 49,321 |
| Total financial and derivative net assets | (28,719) |
| Total collateral received (pledged)(a) | - |
| Net amount(b) | (28,719) |
| (a) | In some instances, the actual collateral received and/or pledged may be more than the amount shown due to overcollateralization. |
| (b) | Represents the net amount due from/(to) counterparties in the event of default. |
Security transactions
Security transactions are accounted for on the trade date. Cost is determined and gains (losses) are based upon the specific identification method for both financial statement and federal income tax purposes.
Income recognition
Corporate actions and dividend income are generally recorded net of any non-reclaimable tax withholdings, on the ex-dividend date or upon receipt of ex-dividend notification in the case of certain foreign securities.
| 26 | Columbia Select Global Growth Fund | Annual Report 2019 |
Notes to Financial Statements (continued)
February 28, 2019
The Fund may receive distributions from holdings in equity securities, business development companies (BDCs), exchange-traded funds (ETFs), limited partnerships (LPs), other regulated investment companies (RICs), and real estate investment trusts (REITs), which report information on the tax character of their distributions annually. These distributions are allocated to dividend income, capital gain and return of capital based on actual information reported. Return of capital is recorded as a reduction of the cost basis of securities held. If the Fund no longer owns the applicable securities, return of capital is recorded as a realized gain. With respect to REITs, to the extent actual information has not yet been reported, estimates for return of capital are made by the Fund’s management. Management’s estimates are subsequently adjusted when the actual character of the distributions is disclosed by the REITs, which could result in a proportionate change in return of capital to shareholders.
Awards from class action litigation are recorded as a reduction of cost basis if the Fund still owns the applicable securities on the payment date. If the Fund no longer owns the applicable securities, the proceeds are recorded as realized gains.
Expenses
General expenses of the Trust are allocated to the Fund and other funds of the Trust based upon relative net assets or other expense allocation methodologies determined by the nature of the expense. Expenses directly attributable to the Fund are charged to the Fund. Expenses directly attributable to a specific class of shares are charged to that share class.
Determination of class net asset value
All income, expenses (other than class-specific expenses, which are charged to that share class, as shown in the Statement of Operations) and realized and unrealized gains (losses) are allocated to each class of the Fund on a daily basis, based on the relative net assets of each class, for purposes of determining the net asset value of each class.
Federal income tax status
The Fund intends to qualify each year as a regulated investment company under Subchapter M of the Internal Revenue Code, as amended, and will distribute substantially all of its investment company taxable income and net capital gain, if any, for its tax year, and as such will not be subject to federal income taxes. In addition, the Fund intends to distribute in each calendar year substantially all of its ordinary income, capital gain net income and certain other amounts, if any, such that the Fund should not be subject to federal excise tax. Therefore, no federal income or excise tax provision is recorded.
Foreign taxes
The Fund may be subject to foreign taxes on income, gains on investments or currency repatriation, a portion of which may be recoverable. The Fund will accrue such taxes and recoveries, as applicable, based upon its current interpretation of tax rules and regulations that exist in the markets in which it invests.
Realized gains in certain countries may be subject to foreign taxes at the Fund level, based on statutory rates. The Fund accrues for such foreign taxes on realized and unrealized gains at the appropriate rate for each jurisdiction, as applicable. The amount, if any, is disclosed as a liability on the Statement of Assets and Liabilities.
Distributions to shareholders
Distributions from net investment income, if any, are declared and paid semi-annually. Net realized capital gains, if any, are distributed at least annually. Income distributions and capital gain distributions are determined in accordance with federal income tax regulations, which may differ from GAAP.
Guarantees and indemnifications
Under the Trust’s organizational documents and, in some cases, by contract, its officers and trustees are indemnified against certain liabilities arising out of the performance of their duties to the Trust or its funds. In addition, certain of the Fund’s contracts with its service providers contain general indemnification clauses. The Fund’s maximum exposure under these arrangements is unknown since the amount of any future claims that may be made against the Fund cannot be determined, and the Fund has no historical basis for predicting the likelihood of any such claims.
Columbia Select Global Growth Fund | Annual Report 2019
| 27 |
Notes to Financial Statements (continued)
February 28, 2019
Recent accounting pronouncements
Accounting Standards Update 2017-08 Premium Amortization on Purchased Callable Debt Securities
In March 2017, the Financial Accounting Standards Board issued Accounting Standards Update (ASU) No. 2017-08 Premium Amortization on Purchased Callable Debt Securities. ASU No. 2017-08 updates the accounting standards to shorten the amortization period for certain purchased callable debt securities, held at a premium, to be amortized to the earliest call date. The update applies to securities with explicit, noncontingent call features that are callable at fixed prices and on preset dates. The standard is effective for annual periods beginning after December 15, 2018 and interim periods within those fiscal years. Management does not expect the implementation of this guidance to have a material impact on the financial statement amounts and footnote disclosures.
Accounting Standards Update 2018-13 Disclosure Framework - Changes to the Disclosure Requirements for Fair Value Measurement
In August 2018, the Financial Accounting Standards Board issued Accounting Standards Update (ASU) No. 2018-13 Disclosure Framework - Changes to the Disclosure Requirements for Fair Value Measurement. ASU No. 2018-13, in addition to other modifications and additions, removes the requirement to disclose the amount and reasons for transfers between Level 1 and Level 2 of the fair value hierarchy and the policy for the timing of transfers between levels. The standard is effective for annual periods beginning after December 15, 2019 and interim periods within those fiscal years. At this time, management is evaluating the implication of this guidance and the impact it will have on the financial statement disclosures, if any.
Disclosure Update and Simplification
In September 2018, the Securities and Exchange Commission (SEC) released Final Rule 33-10532, Disclosure Update and Simplification, which amends certain financial statement disclosure requirements that the SEC determined to be redundant, outdated, or superseded in light of other SEC disclosure requirements, GAAP, or changes in the information environment. As a result of the amendments, management implemented disclosure changes which included removing the components of distributable earnings presented on the Statement of Assets and Liabilities and combining income and gain distributions paid to shareholders as presented on the Statement of Changes in Net Assets. Any values presented to meet prior year requirements were left unchanged. The amendments had no effect on the Fund’s net assets or results of operation.
Note 3. Fees and other transactions with affiliates
Management services fees
The Fund has entered into a Management Agreement with Columbia Management Investment Advisers, LLC (the Investment Manager), a wholly-owned subsidiary of Ameriprise Financial, Inc. (Ameriprise Financial). Under the Management Agreement, the Investment Manager provides the Fund with investment research and advice, as well as administrative and accounting services. The management services fee is an annual fee that is equal to a percentage of the Fund’s daily net assets that declines from 0.87% to 0.67% as the Fund’s net assets increase. The effective management services fee rate for the year ended February 28, 2019 was 0.87% of the Fund’s average daily net assets.
Compensation of board members
Members of the Board of Trustees who are not officers or employees of the Investment Manager or Ameriprise Financial are compensated for their services to the Fund as disclosed in the Statement of Operations. Under a Deferred Compensation Plan (the Deferred Plan), these members of the Board of Trustees may elect to defer payment of up to 100% of their compensation. Deferred amounts are treated as though equivalent dollar amounts had been invested in shares of certain funds managed by the Investment Manager. The Fund’s liability for these amounts is adjusted for market value changes and remains in the Fund until distributed in accordance with the Deferred Plan. All amounts payable under the Deferred Plan constitute a general unsecured obligation of the Fund.
| 28 | Columbia Select Global Growth Fund | Annual Report 2019 |
Notes to Financial Statements (continued)
February 28, 2019
Compensation of Chief Compliance Officer
The Board of Trustees has appointed a Chief Compliance Officer to the Fund in accordance with federal securities regulations. As disclosed in the Statement of Operations, a portion of the Chief Compliance Officer’s total compensation is allocated to the Fund, along with other allocations to affiliated registered investment companies managed by the Investment Manager and its affiliates, based on relative net assets.
Transfer agency fees
Under a Transfer and Dividend Disbursing Agent Agreement, Columbia Management Investment Services Corp. (the Transfer Agent), an affiliate of the Investment Manager and a wholly-owned subsidiary of Ameriprise Financial, is responsible for providing transfer agency services to the Fund. The Transfer Agent has contracted with DST Asset Manager Solutions, Inc. (DST) to serve as sub-transfer agent. The Transfer Agent pays the fees of DST for services as sub-transfer agent and DST is not entitled to reimbursement for such fees from the Fund (with the exception of out-of-pocket fees).
The Fund pays the Transfer Agent a monthly transfer agency fee based on the number or the average value of accounts, depending on the type of account. In addition, the Fund pays the Transfer Agent a fee for shareholder services based on the number of accounts or on a percentage of the average aggregate value of the Fund’s shares maintained in omnibus accounts up to the lesser of the amount charged by the financial intermediary or a cap established by the Board of Trustees from time to time.
The Transfer Agent also receives compensation from the Fund for various shareholder services and reimbursements for certain out-of-pocket fees. Total transfer agency fees for Institutional 2 Class and Institutional 3 Class shares are subject to an annual limitation of not more than 0.07% and 0.02%, respectively, of the average daily net assets attributable to each share class.
For the year ended February 28, 2019, the Fund’s effective transfer agency fee rates as a percentage of average daily net assets of each class were as follows:
| | Effective rate (%) |
| Class A | 0.13 |
| Advisor Class | 0.13 |
| Class C | 0.13 |
| Institutional Class | 0.13 |
| Institutional 2 Class | 0.07 |
| Institutional 3 Class | 0.01 |
| Class R | 0.13 |
An annual minimum account balance fee of $20 may apply to certain accounts with a value below the applicable share class’s initial minimum investment requirements to reduce the impact of small accounts on transfer agency fees. These minimum account balance fees are remitted to the Fund and recorded as part of expense reductions in the Statement of Operations. For the year ended February 28, 2019, no minimum account balance fees were charged by the Fund.
Distribution and service fees
The Fund has entered into an agreement with Columbia Management Investment Distributors, Inc. (the Distributor), an affiliate of the Investment Manager and a wholly-owned subsidiary of Ameriprise Financial, for distribution and shareholder services. The Board of Trustees has approved, and the Fund has adopted, distribution and shareholder service plans (the Plans) applicable to certain share classes, which set the distribution and service fees for the Fund. These fees are calculated daily and are intended to compensate the Distributor and/or eligible selling and/or servicing agents for selling shares of the Fund and providing services to investors.
Columbia Select Global Growth Fund | Annual Report 2019
| 29 |
Notes to Financial Statements (continued)
February 28, 2019
Under the Plans, the Fund pays a monthly combined distribution and service fee to the Distributor at the maximum annual rate of 0.25% of the average daily net assets attributable to Class A shares of the Fund. Also under the Plans, the Fund pays a monthly service fee to the Distributor at the maximum annual rate of 0.25% of the average daily net assets attributable to Class C shares of the Fund and a monthly distribution fee to the Distributor at the maximum annual rates of 0.75% and 0.50% of the average daily net assets attributable to Class C and Class R shares of the Fund, respectively.
Sales charges (unaudited)
Sales charges, including front-end charges and CDSCs, received by the Distributor for distributing Fund shares for the year ended February 28, 2019, if any, are listed below:
| | Amount ($) |
| Class A | 75,962 |
| Class C | 562 |
Expenses waived/reimbursed by the Investment Manager and its affiliates
The Investment Manager and certain of its affiliates have contractually agreed to waive fees and/or reimburse expenses (excluding certain fees and expenses described below) for the period(s) disclosed below, unless sooner terminated at the sole discretion of the Board of Trustees, so that the Fund’s net operating expenses, after giving effect to fees waived/expenses reimbursed and any balance credits and/or overdraft charges from the Fund’s custodian, do not exceed the following annual rate(s) as a percentage of the class’ average daily net assets:
| | July 1, 2018
through
June 30, 2019 | Prior to
July 1, 2018 |
| Class A | 1.37% | 1.37% |
| Advisor Class | 1.12 | 1.12 |
| Class C | 2.12 | 2.12 |
| Institutional Class | 1.12 | 1.12 |
| Institutional 2 Class | 1.07 | 1.095 |
| Institutional 3 Class | 1.01 | 1.045 |
| Class R | 1.62 | 1.62 |
Under the agreement governing these fee waivers and/or expense reimbursement arrangements, the following fees and expenses are excluded from the waiver/reimbursement commitment, and therefore will be paid by the Fund, if applicable: taxes (including foreign transaction taxes), expenses associated with investments in affiliated and non-affiliated pooled investment vehicles (including mutual funds and exchange-traded funds), transaction costs and brokerage commissions, costs related to any securities lending program, dividend expenses associated with securities sold short, inverse floater program fees and expenses, transaction charges and interest on borrowed money, interest, infrequent and/or unusual expenses and any other expenses the exclusion of which is specifically approved by the Board of Trustees. This agreement may be modified or amended only with approval from the Investment Manager, certain of its affiliates and the Fund. Any fees waived and/or expenses reimbursed under the expense reimbursement arrangements described above are not recoverable by the Investment Manager or its affiliates in future periods.
Note 4. Federal tax information
The timing and character of income and capital gain distributions are determined in accordance with income tax regulations, which may differ from GAAP because of temporary or permanent book to tax differences.
At February 28, 2019, these differences were primarily due to differing treatment for deferral/reversal of wash sale losses, derivative investments, post-October capital losses, late-year ordinary losses, trustees’ deferred compensation, foreign currency transactions and net operating loss reclassification. To the extent these differences were permanent, reclassifications were made among the components of the Fund’s net assets. Temporary differences do not require reclassifications.
| 30 | Columbia Select Global Growth Fund | Annual Report 2019 |
Notes to Financial Statements (continued)
February 28, 2019
The following reclassifications were made:
Excess of distributions
over net investment
income ($) | Accumulated
net realized
(loss) ($) | Paid in
capital ($) |
| 661,718 | 642,931 | (1,304,649) |
Net investment income (loss) and net realized gains (losses), as disclosed in the Statement of Operations, and net assets were not affected by these reclassifications.
The tax character of distributions paid during the years indicated was as follows:
| Year Ended February 28, 2019 | Year Ended February 28, 2018 |
Ordinary
income ($) | Long-term
capital gains ($) | Total ($) | Ordinary
income ($) | Long-term
capital gains ($) | Total ($) |
| — | 937,139 | 937,139 | — | — | — |
Short-term capital gain distributions, if any, are considered ordinary income distributions for tax purposes.
At February 28, 2019, the components of distributable earnings on a tax basis were as follows:
Undistributed
ordinary income ($) | Undistributed
long-term
capital gains ($) | Capital loss
carryforwards ($) | Net unrealized
appreciation ($) |
| — | — | — | 16,056,792 |
At February 28, 2019, the cost of all investments for federal income tax purposes along with the aggregate gross unrealized appreciation and depreciation based on that cost was:
Federal
tax cost ($) | Gross unrealized
appreciation ($) | Gross unrealized
(depreciation) ($) | Net unrealized
appreciation ($) |
| 53,128,531 | 17,068,691 | (1,011,899) | 16,056,792 |
Tax cost of investments and unrealized appreciation/(depreciation) may also include timing differences that do not constitute adjustments to tax basis.
Under current tax rules, regulated investment companies can elect to treat certain late-year ordinary losses incurred and post-October capital losses (capital losses realized after October 31) as arising on the first day of the following taxable year. As of February 28, 2019, the Fund will elect to treat the following late-year ordinary losses and post-October capital losses as arising on March 1, 2019.
Late year
ordinary losses ($) | Post-October
capital losses ($) |
| 129,111 | 963,235 |
Management of the Fund has concluded that there are no significant uncertain tax positions in the Fund that would require recognition in the financial statements. However, management’s conclusion may be subject to review and adjustment at a later date based on factors including, but not limited to, new tax laws, regulations, and administrative interpretations (including relevant court decisions). Generally, the Fund’s federal tax returns for the prior three fiscal years remain subject to examination by the Internal Revenue Service.
Note 5. Portfolio information
The cost of purchases and proceeds from sales of securities, excluding short-term investments and derivatives, if any, aggregated to $33,896,764 and $32,506,675, respectively, for the year ended February 28, 2019. The amount of purchase and sale activity impacts the portfolio turnover rate reported in the Financial Highlights.
Columbia Select Global Growth Fund | Annual Report 2019
| 31 |
Notes to Financial Statements (continued)
February 28, 2019
Note 6. Affiliated money market fund
The Fund invests in Columbia Short-Term Cash Fund, an affiliated money market fund established for the exclusive use by the Fund and other affiliated funds (the Affiliated MMF). The income earned by the Fund from such investments is included as Dividends - affiliated issuers in the Statement of Operations. As an investing fund, the Fund indirectly bears its proportionate share of the expenses of the Affiliated MMF. The Affiliated MMF prices its shares with a floating net asset value. In addition, the Board of Trustees of the Affiliated MMF may impose a fee on redemptions (sometimes referred to as a liquidity fee) or temporarily suspend redemptions (sometimes referred to as imposing a redemption gate) in the event its liquidity falls below regulatory limits.
Note 7. Interfund lending
Pursuant to an exemptive order granted by the Securities and Exchange Commission, the Fund participates in a program (the Interfund Program) allowing each participating Columbia Fund (each, a Participating Fund) to lend money directly to and, except for closed-end funds and money market funds, borrow money directly from other Participating Funds for temporary purposes. The amounts eligible for borrowing and lending under the Interfund Program are subject to certain restrictions.
Interfund loans are subject to the risk that the borrowing fund could be unable to repay the loan when due, and a delay in repayment to the lending fund could result in lost opportunities and/or additional lending costs. The exemptive order is subject to conditions intended to mitigate conflicts of interest arising from the Investment Manager’s relationship with each Participating Fund.
The Fund’s activity in the Interfund Program during the year ended February 28, 2019 was as follows:
| Borrower or lender | Average loan
balance ($) | Weighted average
interest rate (%) | Days
outstanding |
| Borrower | 2,000,000 | 2.49 | 1 |
Interest expense incurred by the Fund is recorded as Interfund lending in the Statement of Operations. The Fund had no outstanding interfund loans at February 28, 2019.
Note 8. Line of credit
The Fund has access to a revolving credit facility with a syndicate of banks led by Citibank, N.A., HSBC Bank USA, N.A. and JPMorgan Chase Bank, N.A. whereby the Fund may borrow for the temporary funding of shareholder redemptions or for other temporary or emergency purposes. The credit facility, which is a collective agreement between the Fund and certain other funds managed by the Investment Manager or an affiliated investment manager, severally and not jointly, permits collective borrowings up to $1 billion. Interest is charged to each participating fund based on its borrowings at a rate equal to the higher of (i) the federal funds effective rate, (ii) the one-month LIBOR rate and (iii) the overnight bank funding rate, plus in each case, 1.00%. Each borrowing under the credit facility matures no later than 60 days after the date of borrowing. The Fund also pays a commitment fee equal to its pro rata share of the unused amount of the credit facility at a rate of 0.15% per annum. The commitment fee is included in other expenses in the Statement of Operations. This agreement expires annually in December unless extended or renewed.
The Fund had no borrowings during the year ended February 28, 2019.
Note 9. Significant risks
Consumer discretionary sector risk
The Fund may be more susceptible to the particular risks that may affect companies in the consumer discretionary sector than if it were invested in a wider variety of companies in unrelated sectors. Companies in the consumer discretionary sector are subject to certain risks, including fluctuations in the performance of the overall domestic and international economy, interest rate changes, increased competition and consumer confidence. Performance of such companies may be affected by factors including reduced disposable household income, reduced consumer spending, changing demographics and consumer tastes.
| 32 | Columbia Select Global Growth Fund | Annual Report 2019 |
Notes to Financial Statements (continued)
February 28, 2019
Foreign securities and emerging market countries risk
Investing in foreign securities may include certain risks and considerations not typically associated with investing in U.S. securities, such as fluctuating currency values and changing local and regional economic, political and social conditions, which may result in greater market volatility. In addition, certain foreign securities may not be as liquid as U.S. securities. Investing in emerging markets may accentuate these risks. These countries are also more likely to experience high levels of inflation, deflation or currency devaluation which could hurt their economies and securities markets. To the extent that the Fund concentrates its investment exposure to any one or a few specific countries, the Fund will be particularly susceptible to the various conditions, events or other factors impacting those countries and may, therefore, have a greater risk than that of a fund which is more geographically diversified.
Shareholder concentration risk
At February 28, 2019, affiliated shareholders of record owned 54.2% of the outstanding shares of the Fund in one or more accounts. Subscription and redemption activity by concentrated accounts may have a significant effect on the operations of the Fund. In the case of a large redemption, the Fund may be forced to sell investments at inopportune times, including its liquid positions, which may result in Fund losses and the Fund holding a higher percentage of less liquid positions. Large redemptions could result in decreased economies of scale and increased operating expenses for non-redeeming Fund shareholders.
Technology and technology-related investment risk
The Fund may be more susceptible to the particular risks that may affect companies in the information technology sector, as well as other technology-related sectors (collectively, the technology sectors) than if it were invested in a wider variety of companies in unrelated sectors. Companies in the technology sectors are subject to certain risks, including the risk that new services, equipment or technologies will not be accepted by consumers and businesses or will become rapidly obsolete. Performance of such companies may be affected by factors including obtaining and protecting patents (or the failure to do so) and significant competitive pressures, including aggressive pricing of their products or services, new market entrants, competition for market share and short product cycles due to an accelerated rate of technological developments. Such competitive pressures may lead to limited earnings and/or falling profit margins. As a result, the value of their securities may fall or fail to rise. In addition, many technology sector companies have limited operating histories and prices of these companies’ securities historically have been more volatile than other securities, especially over the short term.
Note 10. Subsequent events
Management has evaluated the events and transactions that have occurred through the date the financial statements were issued and noted no items requiring adjustment of the financial statements or additional disclosure.
Note 11. Information regarding pending and settled legal proceedings
Ameriprise Financial and certain of its affiliates have historically been involved in a number of legal, arbitration and regulatory proceedings, including routine litigation, class actions, and governmental actions, concerning matters arising in connection with the conduct of their business activities. Ameriprise Financial believes that the Fund is not currently the subject of, and that neither Ameriprise Financial nor any of its affiliates are the subject of, any pending legal, arbitration or regulatory proceedings that are likely to have a material adverse effect on the Fund or the ability of Ameriprise Financial or its affiliates to perform under their contracts with the Fund. Ameriprise Financial is required to make quarterly (10-Q), annual (10-K) and, as necessary, 8-K filings with the Securities and Exchange Commission (SEC) on legal and regulatory matters that relate to Ameriprise Financial and its affiliates. Copies of these filings may be obtained by accessing the SEC website at www.sec.gov.
There can be no assurance that these matters, or the adverse publicity associated with them, will not result in increased Fund redemptions, reduced sale of Fund shares or other adverse consequences to the Fund. Further, although we believe proceedings are not likely to have a material adverse effect on the Fund or the ability of Ameriprise Financial or its affiliates to perform under their contracts with the Fund, these proceedings are subject to uncertainties and, as such, we are unable to estimate the possible loss or range of loss that may result. An adverse outcome in one or more of these proceedings could result in adverse judgments, settlements, fines, penalties or other relief that could have a material adverse effect on the consolidated financial condition or results of operations of Ameriprise Financial.
Columbia Select Global Growth Fund | Annual Report 2019
| 33 |
Report of Independent Registered Public Accounting Firm
To the Board of Trustees of Columbia Funds Series Trust and Shareholders of Columbia Select Global Growth Fund
Opinion on the Financial Statements
We have audited the accompanying statement of assets and liabilities, including the portfolio of investments, of Columbia Select Global Growth Fund (one of the funds constituting Columbia Funds Series Trust, referred to hereafter as the "Fund") as of February 28, 2019, the related statement of operations for the year ended February 28, 2019, the statement of changes in net assets for each of the two years in the period ended February 28, 2019, including the related notes, and the financial highlights for each of the periods indicated therein (collectively referred to as the “financial statements”). In our opinion, the financial statements present fairly, in all material respects, the financial position of the Fund as of February 28, 2019, the results of its operations for the year then ended, the changes in its net assets for each of the two years in the period ended February 28, 2019 and the financial highlights for each of the periods indicated therein in conformity with accounting principles generally accepted in the United States of America.
Basis for Opinion
These financial statements are the responsibility of the Fund’s management. Our responsibility is to express an opinion on the Fund’s financial statements based on our audits. We are a public accounting firm registered with the Public Company Accounting Oversight Board (United States) (PCAOB) and are required to be independent with respect to the Fund in accordance with the U.S. federal securities laws and the applicable rules and regulations of the Securities and Exchange Commission and the PCAOB.
We conducted our audits of these financial statements in accordance with the standards of the PCAOB. Those standards require that we plan and perform the audit to obtain reasonable assurance about whether the financial statements are free of material misstatement, whether due to error or fraud.
Our audits included performing procedures to assess the risks of material misstatement of the financial statements, whether due to error or fraud, and performing procedures that respond to those risks. Such procedures included examining, on a test basis, evidence regarding the amounts and disclosures in the financial statements. Our audits also included evaluating the accounting principles used and significant estimates made by management, as well as evaluating the overall presentation of the financial statements. Our procedures included confirmation of securities owned as of February 28, 2019 by correspondence with the custodian, transfer agent and brokers. We believe that our audits provide a reasonable basis for our opinion.
/s/PricewaterhouseCoopers LLP
Minneapolis, Minnesota
April 22, 2019
We have served as the auditor of one or more investment companies within the Columbia Funds Complex since 1977.
| 34 | Columbia Select Global Growth Fund | Annual Report 2019 |
Federal Income Tax Information
(Unaudited)
The Fund hereby designates the following tax attributes for the fiscal year ended February 28, 2019. Shareholders will be notified in early 2020 of the amounts for use in preparing 2019 income tax returns.
Capital
gain
dividend | |
| $774,720 | |
Capital gain dividend. The Fund designates as a capital gain dividend the amount reflected above, or if subsequently determined to be different, the net capital gain of such fiscal period.
Columbia Select Global Growth Fund | Annual Report 2019
| 35 |
Shareholders elect the Board that oversees the Fund’s operations. The Board appoints officers who are responsible for day-to-day business decisions based on policies set by the Board. The following table provides basic biographical information about the Fund’s Trustees as of the printing of this report, including their principal occupations during the past five years, although specific titles for individuals may have varied over the period. Under current Board policy, Trustees not affiliated with the Investment Manager generally may serve through the end of the calendar year in which they reach the mandatory retirement age established by the Board.
Independent trustees
Name,
address,
year of birth | Position held
with the Trust and
length of service | Principal occupation(s)
during past five years
and other relevant
professional experience | Number of
Funds in the
Columbia Funds
complex
overseen | Other directorships
held by Trustee
during the past
five years |
George S. Batejan
c/o Columbia Management
Investment Advisers, LLC
225 Franklin Street
Mail Drop BX32 05228
Boston, MA 02110
1953 | Trustee since 1/17 | Executive Vice President, Global Head of Technology and Operations, Janus Capital Group, Inc., 2010-2016 | 123 | Former Chairman of the Board, NICSA (National Investment Company Services Association) (Executive Committee, Nominating Committee and Governance Committee), 2014-2016; former Director, Intech Investment Management, 2011-2016; former Board Member, Metro Denver Chamber of Commerce, 2015-2016; former Advisory Board Member, University of Colorado Business School, 2015-2018 |
Kathleen Blatz
c/o Columbia Management
Investment Advisers, LLC
225 Franklin Street
Mail Drop BX32 05228
Boston, MA 02110
1954 | Trustee since 1/06 for RiverSource Funds and since 6/11 for Nations Funds | Attorney; specializing in arbitration and mediation; Chief Justice, Minnesota Supreme Court, 1998-2006; Associate Justice, Minnesota Supreme Court, 1996-1998; Fourth Judicial District Court Judge, Hennepin County, 1994-1996; Attorney in private practice and public service, 1984-1993; State Representative, Minnesota House of Representatives, 1979-1993, which included service on the Tax and Financial Institutions and Insurance Committees; Member and Interim Chair, Minnesota Sports Facilities Authority, January 2017-July 2017; Interim President and Chief Executive Officer, Blue Cross and Blue Shield of Minnesota (health care insurance), February-July 2018 | 123 | Trustee, BlueCross BlueShield of Minnesota since 2009 (Chair of the Business Development Committee, 2014-2017; Chair of the Governance Committee since 2017); Chair of the Robina Foundation since August 2013; former Member and Chair of the Board, Minnesota Sports Facilities Authority, January 2017-July 2017 |
Edward J. Boudreau, Jr.
c/o Columbia Management
Investment Advisers, LLC
225 Franklin Street
Mail Drop BX32 05228
Boston, MA 02110
1944 | Chair of the Board since 1/18; Trustee since 6/11 for RiverSource Funds and since 1/05 for Nations Funds | Managing Director, E.J. Boudreau & Associates (consulting) since 2000; FINRA Industry Arbitrator, 2002-present; Chairman and Chief Executive Officer, John Hancock Investments (asset management), Chairman and Interested Trustee for open-end and closed-end funds offered by John Hancock, 1989-2000; John Hancock Mutual Life Insurance Company, including Senior Vice President and Treasurer and Senior Vice President Information Technology, 1968-1988 | 123 | Former Trustee, Boston Museum of Science (Chair of Finance Committee) 1985-2013; former Trustee, BofA Funds Series Trust (11 funds), 2005-2011 |
| 36 | Columbia Select Global Growth Fund | Annual Report 2019 |
TRUSTEES AND OFFICERS (continued)
Independent trustees (continued)
Name,
address,
year of birth | Position held
with the Trust and
length of service | Principal occupation(s)
during past five years
and other relevant
professional experience | Number of
Funds in the
Columbia Funds
complex
overseen | Other directorships
held by Trustee
during the past
five years |
Pamela G. Carlton
c/o Columbia Management
Investment Advisers, LLC
225 Franklin Street
Mail Drop BX32 05228
Boston, MA 02110
1954 | Trustee since 7/07 for RiverSource Funds and since 6/11 for Nations Funds | President, Springboard — Partners in Cross Cultural Leadership (consulting company) since 2003; Managing Director of US Equity Research, JP Morgan Chase, 1999-2003; Director of US Equity Research, Chase Asset Management, 1996-1999; Co-Director Latin America Research, 1993-1996, COO Global Research, 1992-1996, Co-Director of US Research, 1991-1992, Investment Banker, Morgan Stanley, 1982-1991 | 123 | Trustee, New York Presbyterian Hospital Board (Executive Committee and Chair of Human Resources Committee) since 1996; Director, Laurel Road Bank (Audit Committee) since 2017 |
Patricia M. Flynn
c/o Columbia Management
Investment Advisers, LLC
225 Franklin Street
Mail Drop BX32 05228
Boston, MA 02110
1950 | Trustee since 11/04 for RiverSource Funds and since 6/11 for Nations Funds | Trustee Professor of Economics and Management, Bentley University since 1976 (also teaches and conducts research on corporate governance); Dean, McCallum Graduate School of Business, Bentley University, 1992-2002 | 123 | Trustee, MA Taxpayers Foundation since 1997; Board of Directors, The MA Business Roundtable since 2003; Board of Governors, Innovation Institute, MA Technology Collaborative since 2010 |
Brian J. Gallagher
c/o Columbia Management
Investment Advisers, LLC
225 Franklin Street
Mail Drop BX32 05228
Boston, MA 02110
1954 | Trustee since 12/17 | Retired; Partner with Deloitte & Touche LLP and its predecessors, 1977-2016 | 121 | Trustee, Catholic Schools Foundation since 2004 |
Catherine James Paglia
c/o Columbia Management
Investment Advisers, LLC
225 Franklin Street
Mail Drop BX32 05228
Boston, MA 02110
1952 | Trustee since 11/04 for RiverSource Funds and since 6/11 for Nations Funds | Director, Enterprise Asset Management, Inc. (private real estate and asset management company) since September 1998; Managing Director and Partner, Interlaken Capital, Inc., 1989-1997; Managing Director, Morgan Stanley, 1982-1989; Vice President, Investment Banking, 1980-1982, Associate, Investment Banking, 1976-1980, Dean Witter Reynolds, Inc. | 123 | Director, Valmont Industries, Inc. (irrigation systems manufacturer) since 2012; Trustee, Carleton College (on the Investment Committee); Trustee, Carnegie Endowment for International Peace (on the Investment Committee) |
Anthony M. Santomero
c/o Columbia Management
Investment Advisers, LLC
225 Franklin Street
Mail Drop BX32 05228
Boston, MA 02110
1946 | Trustee since 6/11 for RiverSource Funds and since 1/08 for Nations Funds | Richard K. Mellon Professor Emeritus of Finance, The Wharton School, University of Pennsylvania, since 2002; Senior Advisor, McKinsey & Company (consulting), 2006-2008; President, Federal Reserve Bank of Philadelphia, 2000- 2006; Professor of Finance, The Wharton School, University of Pennsylvania, 1972-2002 | 123 | Trustee, Penn Mutual Life Insurance Company since March 2008; Director, Renaissance Reinsurance Ltd. since May 2008; former Trustee, BofA Funds Series Trust (11 funds), 2008-2011; former Director, Citigroup Inc. and Citibank, N.A., 2009-2019 |
Columbia Select Global Growth Fund | Annual Report 2019
| 37 |
TRUSTEES AND OFFICERS (continued)
Independent trustees (continued)
Name,
address,
year of birth | Position held
with the Trust and
length of service | Principal occupation(s)
during past five years
and other relevant
professional experience | Number of
Funds in the
Columbia Funds
complex
overseen | Other directorships
held by Trustee
during the past
five years |
Minor M. Shaw
c/o Columbia Management
Investment Advisers, LLC
225 Franklin Street
Mail Drop BX32 05228
Boston, MA 02110
1947 | Trustee since 6/11 for RiverSource Funds and since 2003 for Nations Funds | President, Micco LLC (private investments) since 2011; President, Micco Corp. (family investment business), 1998-2011 | 123 | Director, BlueCross BlueShield of South Carolina since April 2008; Board Chair, Hollingsworth Funds since 2016; Advisory Board member, Duke Energy Corp. since October 2016; Chair of the Duke Endowment; Chair of Greenville – Spartanburg Airport Commission; former Trustee, BofA Funds Series Trust (11 funds), 2003-2011; former Director, Piedmont Natural Gas, 2004-2016; former Director, National Association of Corporate Directors, Carolinas Chapter, 2013-2018 |
Sandra Yeager
c/o Columbia Management
Investment Advisers, LLC
225 Franklin Street
Mail Drop BX32 05228
Boston, MA 02110
1964 | Trustee since 12/17 | Retired; President and founder, Hanoverian Capital, LLC (SEC registered investment advisor firm), 2008-2016; Managing Director, DuPont Capital, 2006-2008; Managing Director, Morgan Stanley Investment Management, 2004-2006; Senior Vice President, Alliance Bernstein, 1990-2004 | 121 | Director, NAPE Education Foundation since October 2016 |
Interested trustee affiliated with Investment Manager*
Name,
address,
year of birth | Position held with the Trust and length of service | Principal occupation(s) during the
past five years and other relevant
professional experience | Number of
Funds in the
Columbia Funds
complex overseen | Other directorships
held by Trustee
during the past
five years |
William F. Truscott
c/o Columbia Management
Investment Advisers, LLC
225 Franklin St.
Boston, MA 02110
1960 | Trustee since 11/01 for RiverSource Funds and since 6/11 for Nations Funds; Senior Vice President since 2002 for RiverSource Funds and since 5/10 for Nations Funds | Chairman of the Board and President, Columbia Management Investment Advisers, LLC since May 2010 and February 2012, respectively; Chief Executive Officer, Global Asset Management, Ameriprise Financial, Inc. since September 2012 (previously Chief Executive Officer, U.S. Asset Management & President, Annuities, May 2010 - September 2012); Director and Chief Executive Officer, Columbia Management Investment Distributors, Inc. since May 2010 and February 2012, respectively; Chairman of the Board and Chief Executive Officer, RiverSource Distributors, Inc. since 2006; Director, Threadneedle Asset Management Holdings, SARL since 2014; President and Chief Executive Officer, Ameriprise Certificate Company, 2006 - August 2012. | 192 | Chairman of the Board, Columbia Management Investment Advisers, LLC since May 2010; Director, Columbia Management Investment Distributors, Inc. since May 2010; former Director, Ameriprise Certificate Company, 2006-January 2013 |
| * | Interested person (as defined under the 1940 Act) by reason of being an officer, director, security holder and/or employee of the Investment Manager or Ameriprise Financial. |
| 38 | Columbia Select Global Growth Fund | Annual Report 2019 |
TRUSTEES AND OFFICERS (continued)
Nations Funds refer to the Funds within the Columbia Funds Complex that historically bore the Nations brand and includes series of Columbia Funds Series Trust. RiverSource Funds refer to the Funds within the Columbia Funds Complex that historically bore the RiverSource brand and includes series of Columbia Funds Series Trust II.
The Statement of Additional Information has additional information about the Fund’s Board members and is available, without charge, upon request by calling 800.345.6611, visiting columbiathreadneedleus.com/investor/ or contacting your financial intermediary.
Columbia Select Global Growth Fund | Annual Report 2019
| 39 |
TRUSTEES AND OFFICERS (continued)
The Board has appointed officers who are responsible for day-to-day business decisions based on policies it has established. The officers serve at the pleasure of the Board. The following table provides basic information about the Officers of the Fund as of the printing of this report, including principal occupations during the past five years, although their specific titles may have varied over the period. In addition to Mr. Truscott, who is Senior Vice President, the Fund’s other officers are:
Fund officers
Name,
address and
year of birth | Position and year
first appointed to
position for any Fund
in the Columbia
Funds complex or a
predecessor thereof | Principal occupation(s) during past five years |
Christopher O. Petersen
5228 Ameriprise
Financial Center
Minneapolis, MN 55474
Born 1970 | President and Principal Executive Officer (2015) | Vice President and Lead Chief Counsel, Ameriprise Financial, Inc. since January 2015 (previously, Vice President and Chief Counsel, January 2010 - December 2014; officer of Columbia Funds and affiliated funds since 2007. |
Michael G. Clarke
225 Franklin Street
Boston, MA 02110
Born 1969 | Chief Financial Officer (Principal Financial Officer) (2009) and Senior Vice President (2019) | Vice President — Accounting and Tax, Columbia Management Investment Advisers, LLC, since May 2010; senior officer of Columbia Funds and affiliated funds since 2002 (previously, Treasurer and Chief Accounting Officer, January 2009-January 2019 and December 2015-January 2019, respectively). |
Joseph Beranek
5890 Ameriprise
Financial Center
Minneapolis, MN 55474
Born 1965 | Treasurer and Chief Accounting Officer (Principal Accounting Officer) (2019) | Vice President — Mutual Fund Accounting and Financial Reporting, Columbia Management Investment Advisers, LLC, since December 2018 and March 2017, respectively (previously, Vice President — Pricing and Corporate Actions, May 2010-March 2017). |
Paul B. Goucher
485 Lexington Avenue
New York, NY 10017
Born 1968 | Senior Vice President (2011) and Assistant Secretary (2008) | Senior Vice President and Assistant General Counsel, Ameriprise Financial, Inc. since January 2017 (previously, Vice President and Lead Chief Counsel, November 2008 - January 2017 and January 2013 - January 2017, respectively); Vice President, Chief Legal Officer and Assistant Secretary, Columbia Management Investment Advisers, LLC since March 2015 (previously Vice President and Assistant Secretary, May 2010 – March 2015). |
Thomas P. McGuire
225 Franklin Street
Boston, MA 02110
Born 1972 | Senior Vice President and Chief Compliance Officer (2012) | Vice President — Asset Management Compliance, Ameriprise Financial, Inc., since May 2010; Chief Compliance Officer, Ameriprise Certificate Company since September 2010. |
Colin Moore
225 Franklin Street
Boston, MA 02110
Born 1958 | Senior Vice President (2010) | Executive Vice President and Global Chief Investment Officer, Ameriprise Financial, Inc., since July 2013; Executive Vice President and Global Chief Investment Officer, Columbia Management Investment Advisers, LLC since July 2013. |
Ryan C. Larrenaga
225 Franklin Street
Boston, MA 02110
Born 1970 | Senior Vice President (2017), Chief Legal Officer (2017), and Secretary (2015) | Vice President and Chief Counsel, Ameriprise Financial, Inc. since August 2018 (previously, Vice President and Group Counsel, August 2011 - August 2018); officer of Columbia Funds and affiliated funds since 2005. |
Michael E. DeFao
225 Franklin Street
Boston, MA 02110
Born 1968 | Vice President (2011) and Assistant Secretary (2010) | Vice President and Chief Counsel, Ameriprise Financial, Inc. since May 2010. |
Amy Johnson
5228 Ameriprise
Financial Center
Minneapolis, MN 55474
Born 1965 | Vice President (2006) | Managing Director and Global Head of Operations, Columbia Management Investment Advisers, LLC since April 2016 (previously Managing Director and Chief Operating Officer, 2010 - 2016). |
| 40 | Columbia Select Global Growth Fund | Annual Report 2019 |
TRUSTEES AND OFFICERS (continued)
Fund officers (continued)
Name,
address and
year of birth | Position and year
first appointed to
position for any Fund
in the Columbia
Funds complex or a
predecessor thereof | Principal occupation(s) during past five years |
Lyn Kephart-Strong
5228 Ameriprise
Financial Center
Minneapolis, MN 55474
Born 1960 | Vice President (2015) | President, Columbia Management Investment Services Corp. since October 2014; Vice President & Resolution Officer, Ameriprise Trust Company since August 2009. |
Columbia Select Global Growth Fund | Annual Report 2019
| 41 |
The Fund mails one shareholder report to each shareholder address, unless such shareholder elected to receive shareholder reports from the Fund electronically. If you would like more than one report, please call shareholder services at 800.345.6611 and additional reports will be sent to you.
Proxy voting policies and procedures
The policy of the Board of Trustees is to vote the proxies of the companies in which the Fund holds investments consistent with the procedures as stated in the Statement of Additional Information (SAI). You may obtain a copy of the SAI without charge by calling 800.345.6611; contacting your financial intermediary; visiting columbiathreadneedleus.com/investor/; or searching the website of the Securities and Exchange Commission (SEC) at sec.gov. Information regarding how the Fund voted proxies relating to portfolio securities is filed with the SEC by August 31st for the most recent 12-month period ending June 30th of that year, and is available without charge by visiting columbiathreadneedleus.com/investor/, or searching the website of the SEC at sec.gov.
Quarterly schedule of investments
The Fund files a complete schedule of portfolio holdings with the SEC for the first and third quarters of each fiscal year on Form N-Q or Form N-PORT (available for filings after March 31, 2019). The Fund’s Form N-Q or Form N-PORT is available on the SEC’s website at sec.gov. The Fund’s complete schedule of portfolio holdings, as filed on Form N-Q or Form N-PORT, can also be obtained without charge, upon request, by calling 800.345.6611.
Additional Fund information
For more information about the Fund, please visit columbiathreadneedleus.com/investor/ or call 800.345.6611. Customer Service Representatives are available to answer your questions Monday through Friday from 8 a.m. to 7 p.m. Eastern time.
Fund investment manager
Columbia Management Investment Advisers, LLC
225 Franklin Street
Boston, MA 02110
Fund distributor
Columbia Management Investment Distributors, Inc.
225 Franklin Street
Boston, MA 02110
Fund transfer agent
Columbia Management Investment Services Corp.
P.O. Box 219104
Kansas City, MO 64121-9104
| 42 | Columbia Select Global Growth Fund | Annual Report 2019 |
[THIS PAGE INTENTIONALLY LEFT BLANK]
[THIS PAGE INTENTIONALLY LEFT BLANK]
[THIS PAGE INTENTIONALLY LEFT BLANK]
Columbia Select Global Growth Fund
P.O. Box 219104
Kansas City, MO 64121-9104
Please read and consider the investment objectives, risks, charges and expenses for any fund carefully before investing. For a prospectus and summary prospectus, which contains this and other important information about the Fund, go to
columbiathreadneedleus.com/investor/. The Fund is distributed by Columbia Management Investment Distributors, Inc., member FINRA, and managed by Columbia Management Investment Advisers, LLC.
Columbia Threadneedle Investments (Columbia Threadneedle) is the global brand name of the Columbia and Threadneedle group of companies. All rights reserved.
© 2019 Columbia Management Investment Advisers, LLC.
columbiathreadneedleus.com/investor/
Item 2. Code of Ethics.
| | (a) | The registrant has adopted a code of ethics that applies to the registrant’s principal executive officer, principal financial officer, principal accounting officer or controller, or persons performing similar functions, regardless of whether these individuals are employed by the registrant or a third party. |
| | (b) | During the period covered by this report, there were not any amendments to a provision of the code of ethics that applies to the registrant’s principal executive officer, principal financial officer, principal accounting officer or controller, or persons performing similar functions, regardless of whether these individuals are employed by the registrant or a third party, and that relates to any element of the code of ethics definition enumerated in paragraph (b) of this Item. |
| | (c) | During the period covered by this report, there were no waivers, including any implicit waivers, from a provision of the code of ethics to the registrant’s principal executive officer, principal financial officer, principal accounting officer or controller, or persons performing similar functions, regardless of whether these individuals are employed by the registrant or a third party that relates to one or more of the items set forth in paragraph (b) of this Item. |
Item 3. Audit Committee Financial Expert.
The registrant’s Board of Trustees has determined that Pamela G. Carlton, Anthony M. Santomero, Brian J. Gallagher and Catherine James Paglia, each of whom are members of the registrant’s Board of Trustees and Audit Committee, each qualify as an audit committee financial expert. Ms. Carlton, Mr. Santomero, Mr. Gallagher and Ms. Paglia are each independent trustees, as defined in paragraph (a)(2) of this item’s instructions.
Item 4. Principal Accountant Fees and Services.
Fee information below is disclosed for the twelve series of the registrant whose reports to stockholders are included in this annual filing.
(a)Audit Fees. Aggregate Audit Fees billed by the principal accountant for professional services rendered during the fiscal years ended February 28, 2019 and February 28, 2018 are approximately as follows:
| | | | |
| 2019 | | 2018 | |
$349,800 | | $ | 324,600 | |
Audit Fees include amounts related to the audit of the registrant’s annual financial statements or services that are normally provided by the accountant in connection with statutory and regulatory filings or engagements for those fiscal years.
(b)Audit-Related Fees.Aggregate Audit-Related Fees billed to the registrant by the principal accountant for professional services rendered during the fiscal years ended February 28, 2019 and February 28, 2018 are approximately as follows:
Audit-Related Fees include amounts for assurance and related services by the principal accountant that are reasonably related to the performance of the audit of the registrant’s financial statements and are not reported in Audit Fees above.
During the fiscal years ended February 28, 2019 and February 28, 2018, there were no Audit-Related Fees billed by the registrant’s principal accountant to the registrant’s investment adviser (not including anysub-adviser whose role is primarily portfolio management and is subcontracted with or overseen by another investment adviser) and any entity controlling, controlled by, or under common control with the adviser that provides ongoing services to the registrant for an engagement that related directly to the operations and financial reporting of the registrant.
(c)Tax Fees. Aggregate Tax Fees billed by the principal accountant to the registrant for professional services rendered during the fiscal years ended February 28, 2019 and February 28, 2018 are approximately as follows:
| | | | |
| 2019 | | 2018 | |
$72,900 | | $ | 113,500 | |
Tax Fees include amounts for the review of annual tax returns, the review of required shareholder distribution calculations and typically include amounts for professional services by the principal accountant for tax compliance, tax advice and tax planning. Fiscal year 2018 also include Tax Fees for foreign tax filings.
During the fiscal years ended February 28, 2019 and February 28, 2018, there were no Tax Fees billed by the registrant’s principal accountant to the registrant’s investment adviser (not including anysub-adviser whose role is primarily portfolio management and is subcontracted with or overseen by another investment adviser) and any entity controlling, controlled by, or under common control with the adviser that provides ongoing services to the registrant for an engagement that related directly to the operations and financial reporting of the registrant.
(d)All Other Fees. Aggregate All Other Fees billed by the principal accountant to the registrant for professional services rendered during the fiscal years ended February 28, 2019 and February 28, 2018 are approximately as follows:
All Other Fees include amounts for products and services provided by the principal accountant, other than the services reported in paragraphs (a) through (c) above.
Aggregate All Other Fees billed by the registrant’s principal accountant to the registrant’s investment adviser (not including anysub-adviser whose role is primarily portfolio management and is subcontracted with or overseen by another investment adviser) and any entity controlling, controlled by, or under common control with the adviser that provides ongoing services to the registrant for an engagement that related directly to the operations and financial reporting of the registrant during the fiscal years ended February 28, 2019 and February 28, 2018 are approximately as follows:
| | | | |
| 2019 | | 2018 | |
$225,000 | | $ | 225,000 | |
In fiscal years 2019 and 2018, All Other Fees primarily consists of fees billed for internal control examinations of the registrant’s transfer agent and investment adviser.
(e)(1) Audit CommitteePre-Approval Policies and Procedures
The registrant’s Audit Committee is required topre-approve the engagement of the registrant’s independent auditors to provide audit andnon-audit services to the registrant andnon-audit services to its investment adviser (excluding anysub-adviser whose role is primarily portfolio management and issub-contracted or overseen by another investment adviser (the “Adviser”) or any entity controlling, controlled by or under common control with the Adviser that provides ongoing services to the Fund (a “Control Affiliate”) if the engagement relates directly to the operations and financial reporting of the registrant.
The Audit Committee has adopted a Policy for Engagement of Independent Auditors for Audit andNon-Audit Services (the “Policy”). The Policy sets forth the understanding of the Audit Committee regarding the engagement of the registrant’s independent accountants to provide (i) audit and permissible audit-related, tax and other services to the registrant (“Fund Services”); (ii)non-audit services to the registrant’s Adviser and any Control Affiliates, that relates directly to the operations and financial reporting of a Fund (“Fund-related Adviser Services”); and (iii) certain other audit andnon-audit services to the registrant’s Adviser and its Control Affiliates. A service will require specificpre-approval by the Audit Committee if it is to be provided by the Fund’s independent auditor; provided, however, thatpre-approval ofnon-audit services to the Fund, the Adviser or Control Affiliates may be waived if certain de minimis requirements set forth in the SEC’s rules are met.
Under the Policy, the Audit Committee may delegatepre-approval authority to anypre-designated member or members who are independent board members. The member(s) to whom such authority is delegated must report, for informational purposes only, anypre-approval decisions to the Audit Committee at its next regular meeting. The Audit Committee’s responsibilities with respect to thepre-approval of services performed by the independent auditor may not be delegated to management.
On an annual basis, at a regularly scheduled Audit Committee meeting, the Fund’s Treasurer or other Fund officer shall submit to the Audit Committee a schedule of the types of Fund Services and Fund-related Adviser Services that are subject to specificpre-approval. This schedule will provide a description of each type of service that is subject to specificpre-approval, along with total projected fees for each service. Thepre-approval will generally cover aone-year period. The Audit Committee will review and approve the types of services and the projected fees for the nextone-year period and may add to, or subtract from, the list ofpre-approved services from time to time, based on subsequent determinations. This specific approval acknowledges that the Audit Committee is in agreement with the specific types of services that the independent auditor will be permitted to perform and the projected fees for each service.
The Fund’s Treasurer or other Fund officer shall report to the Audit Committee at each of its regular meetings regarding all Fund Services or Fund-related Adviser Services provided since the last such report was rendered, including a description of the services, by category, with forecasted fees for the annual reporting period, proposed changes requiring specificpre-approval and a description of services provided by the independent auditor, by category, with actual fees during the current reporting period.
*****
(e)(2) 100% of the services performed for items (b) through (d) above during 2019 and 2018 werepre-approved by the registrant’s Audit Committee.
(f) Not applicable.
(g) The aggregatenon-audit fees billed by the registrant’s accountant for services rendered to the registrant, and rendered to the registrant’s investment adviser (not including anysub-adviser whose role is primarily portfolio management and is subcontracted with or overseen by another investment adviser), and any entity controlling, controlled by, or under common control with the adviser that provides ongoing services to the registrant for the fiscal years ended February 28, 2019 and February 28, 2018 are approximately as follows:
| | | | |
| 2019 | | 2018 | |
$297,900 | | $ | 338,500 | |
(h) The registrant’s Audit Committee of the Board of Directors has considered whether the provision ofnon-audit services that were rendered to the registrant’s adviser (not including anysub-adviser whose role is primarily portfolio management and is subcontracted with or overseen by another investment adviser), and any entity controlling, controlled by, or under common control with the investment adviser that provides ongoing services to the registrant that were notpre-approved pursuant to paragraph (c)(7)(ii) of Rule2-01 of RegulationS-X, is compatible with maintaining the principal accountant’s independence.
Item 5. Audit Committee of Listed Registrants.
Not applicable.
Item 6. Investments
| | (a) | The registrant’s “Schedule I – Investments in securities of unaffiliated issuers” (as set forth in 17 CFR210.12-12) is included in Item 1 of this FormN-CSR. |
Item 7. Disclosure of Proxy Voting Policies and Procedures forClosed-End Management Investment Companies.
Not applicable.
Item 8. Portfolio Managers ofClosed-End Management Investment Companies.
Not applicable.
Item 9. Purchases of Equity Securities byClosed-End Management Investment Company and Affiliated Purchasers.
Not applicable.
Item 10. Submission of Matters to a Vote of Security Holders.
There were no material changes to the procedures by which shareholders may recommend nominees to the registrant’s board of directors.
Item 11. Controls and Procedures.
| | (a) | The registrant’s principal executive officer and principal financial officer, based on their evaluation of the registrant’s disclosure controls and procedures as of a date within 90 days of the filing of this report, have concluded that such controls and procedures are adequately designed to ensure that information required to be disclosed by the registrant in FormN-CSR is accumulated and communicated to the registrant’s management, including the principal executive officer and principal financial officer, or persons performing similar functions, as appropriate to allow timely decisions regarding required disclosure. |
| | (b) | There was no change in the registrant’s internal control over financial reporting that occurred during the period covered by this report that has materially affected, or is reasonably likely to materially affect, the registrant’s internal control over financial reporting. |
Item 12. Disclosure of Securities Lending Activities forClosed-End Management Investment Companies
Not applicable.
Item 13. Exhibits.
(a)(1) Code of ethics required to be disclosed under Item 2 of FormN-CSR attached hereto as Exhibit 99.CODE ETH.
(a)(2) Certifications pursuant to Rule30a-2(a) under the Investment Company Act of 1940 (17 CFR270.30a-2(a)) attached hereto as Exhibit 99.CERT.
(a)(3) Not applicable.
(b) Certification pursuant to Rule30a-2(b) under the Investment Company Act of 1940 (17 CFR270.30a-2(b)) attached hereto as Exhibit 99.906CERT.
SIGNATURES
Pursuant to the requirements of the Securities Exchange Act of 1934 and the Investment Company Act of 1940, the registrant has duly caused this report to be signed on its behalf by the undersigned, thereunto duly authorized.
| | |
| (registrant) Columbia Funds Series Trust |
| | |
| By (Signature and Title) | | /s/ Christopher O. Petersen |
| | Christopher O. Petersen, President and Principal Executive Officer |
Pursuant to the requirements of the Securities Exchange Act of 1934 and the Investment Company Act of 1940, this report has been signed below by the following persons on behalf of the registrant and in the capacities and on the dates indicated.
| | | | |
| By (Signature and Title) | | /s/ Christopher O. Petersen |
| | Christopher O. Petersen, President and Principal Executive Officer |
| | |
| By (Signature and Title) | | /s/ Michael G. Clarke |
| | Michael G. Clarke, Chief Financial Officer |