UNITED STATES
SECURITIES AND EXCHANGE COMMISSION
Washington, D.C. 20549
FORM N-CSR
CERTIFIED SHAREHOLDER REPORT OF REGISTERED
MANAGEMENT INVESTMENT COMPANIES
Investment Company Act file number 811-09645
Columbia Funds Series Trust
(Exact name of registrant as specified in charter)
225 Franklin Street
Boston, Massachusetts 02110
(Address of principal executive offices) (Zip code)
Christopher O. Petersen, Esq.
c/o Columbia Management Investment Advisers, LLC
225 Franklin Street
Boston, Massachusetts 02110
Ryan C. Larrenaga, Esq.
c/o Columbia Management Investment Advisers, LLC
225 Franklin Street
Boston, MA 02110
(Name and address of agent for service)
Registrant’s telephone number, including area code: (800) 345-6611
Date of fiscal year end: April 30
Date of reporting period: April 30, 2018
Form N-CSR is to be used by management investment companies to file reports with the Commission not later than 10 days after the transmission to stockholders of any report that is required to be transmitted to stockholders under Rule 30e-1 under the Investment Company Act of 1940 (17 CFR 270.30e-1). The Commission may use the information provided on Form N-CSR in its regulatory, disclosure review, inspection, and policymaking roles.
A registrant is required to disclose the information specified by Form N-CSR, and the Commission will make this information public. A registrant is not required to respond to the collection of information contained in Form N-CSR unless the Form displays a currently valid Office of Management and Budget (���OMB”) control number. Please direct comments concerning the accuracy of the information collection burden estimate and any suggestions for reducing the burden to Secretary, Securities and Exchange Commission, 450 Fifth Street, NW, Washington, DC 20549-0609. The OMB has reviewed this collection of information under the clearance requirements of 44 U.S.C. § 3507.
Item 1. Reports to Stockholders.

Annual Report
April 30, 2018
Columbia AMT-Free California Intermediate Muni Bond Fund
Not FDIC Insured • No bank guarantee • May lose value
Dear Shareholders,
The year 2017 was an extraordinary year in the financial markets. The S&P 500 Index didn’t experience a single down month and returned over 20%. Continuing this trend, January 2018 marked the fastest start for the index ever. Low volatility, which had been a feature of the U.S. equity market for several years, along with the surge in the S&P 500 Index, drove investor sentiment to very high levels. This arguably set the stage for an overdue correction, which we witnessed in February 2018.
A return to volatility
There have been few periods of market upheaval such as were experienced in the first part of 2018. While investors were taken by surprise by the sudden and pronounced market swings, the return to some level of volatility actually marked a resumption of relatively normal market conditions. Having said that, it’s important to distinguish between a good technical correction where excess enthusiasm in the marketplace is being let out, versus a real change in the underlying fundamentals – things like an underperforming economy or weaker corporate earnings. Our view is that the recent market volatility falls into the former category, and the fundamentals remain strong. We’re continuing to see improvements in global economic activity, and we’re seeing corporate earnings expectations continue to rise – and not just because of tax reform.
Consistency is more important than ever
It’s important to keep in mind that when it comes to long-term investing, it’s the destination, not the journey that matters most. If you have a financial goal that you’ve worked out with your financial advisor, and you have a good asset allocation plan to reach it, it’s a question of sticking with your plan rather than become focused on near-term volatility. Bouts of volatility are normal. After all, it’s hard to cross the ocean without hitting an occasional rough patch. You need to focus on the destination.
One final thought. In weathering volatility, it’s the consistency of the return that is essential. Investors who chase higher returns are usually the first to sell when an investment goes through a bad patch, and they therefore don’t tend to benefit from the recovery. More disciplined investors who perhaps panic less or not at all during periods of volatility, tend to have improved long-term results and are more likely to reach their financial goals. Nothing is more important to us than making sure those who have entrusted us to protect and grow their assets are able to do what matters most to them.
Your success is our priority. Talk to your financial advisor about how working with Columbia Threadneedle Investments may help you position your portfolio for consistent, sustainable outcomes, no matter the market conditions.
Sincerely,
Christopher O. Petersen
President, Columbia Funds
The S&P 500 Index, an unmanaged index, measures the performance of 500 widely held, large-capitalization U.S. stocks and is frequently used as a general measure of market performance. Past performance is no guarantee of future results.
Columbia Funds are distributed by Columbia Management Investment Distributors, Inc., member FINRA, and managed by Columbia Management Investment Advisers, LLC.
© 2018 Columbia Management Investment Advisers, LLC. All rights reserved.
Columbia AMT-Free California Intermediate Muni Bond Fund | Annual Report 2018
Columbia AMT-Free California Intermediate Muni Bond Fund | Annual Report 2018
Investment objective
Columbia AMT-Free California Intermediate Muni Bond Fund (the Fund) seeks current income exempt from U.S. federal income tax and California individual income tax, consistent with moderate fluctuation of principal.
Portfolio management
Paul Fuchs, CFA
Co-Portfolio Manager
Managed Fund since 2012
Deborah Vargo
Co-Portfolio Manager
Managed Fund since December 2017
| Average annual total returns (%) (for the period ended April 30, 2018) |
| | | Inception | 1 Year | 5 Years | 10 Years |
| Class A | Excluding sales charges | 09/09/02 | 1.10 | 1.85 | 3.75 |
| | Including sales charges | | -1.92 | 1.23 | 3.44 |
| Advisor Class* | 03/19/13 | 1.25 | 2.12 | 4.00 |
| Class C | Excluding sales charges | 09/11/02 | 0.25 | 1.09 | 2.96 |
| | Including sales charges | | -0.74 | 1.09 | 2.96 |
| Institutional Class | 08/19/02 | 1.35 | 2.12 | 4.00 |
| Institutional 2 Class* | 11/08/12 | 1.42 | 2.19 | 4.05 |
| Institutional 3 Class* | 03/01/17 | 1.46 | 2.15 | 4.01 |
| Bloomberg Barclays California 3-15 Year Blend Municipal Bond Index | | 0.96 | 2.27 | 4.20 |
| Bloomberg Barclays 3-15 Year Blend Municipal Bond Index | | 0.87 | 2.10 | 3.99 |
Returns for Class A shares are shown with and without the maximum initial sales charge of 3.00%. Returns for Class C shares are shown with and without the 1.00% contingent deferred sales charge for the first year only. The Fund’s other classes are not subject to sales charges and have limited eligibility. Effective November 1, 2017, Class R4, Class R5, Class Y and Class Z shares were renamed Advisor Class, Institutional 2 Class, Institutional 3 Class and Institutional Class shares, respectively. Please see the Fund’s prospectus for details. Performance for different share classes will vary based on differences in sales charges and fees associated with each class. All results shown assume reinvestment of distributions during the period. Returns do not reflect the deduction of taxes that a shareholder may pay on Fund distributions or on the redemption of Fund shares. Performance results reflect the effect of any fee waivers or reimbursements of Fund expenses by Columbia Management Investment Advisers, LLC and/or any of its affiliates. Absent these fee waivers or expense reimbursement arrangements, performance results would have been lower.
The performance information shown represents past performance and is not a guarantee of future results. The investment return and principal value of your investment will fluctuate so that your shares, when redeemed, may be worth more or less than their original cost. Current performance may be lower or higher than the performance information shown. You may obtain performance information current to the most recent month-end by contacting your financial intermediary, visiting columbiathreadneedleus.com/investor/ or calling 800.345.6611.
| * | The returns shown for periods prior to the share class inception date (including returns for the Life of the Fund, if shown, which are since Fund inception) include the returns of the Fund’s oldest share class. These returns are adjusted to reflect any higher class-related operating expenses of the newer share classes, as applicable. Please visit columbiathreadneedleus.com/investor/investment-products/mutual-funds/appended-performance for more information. |
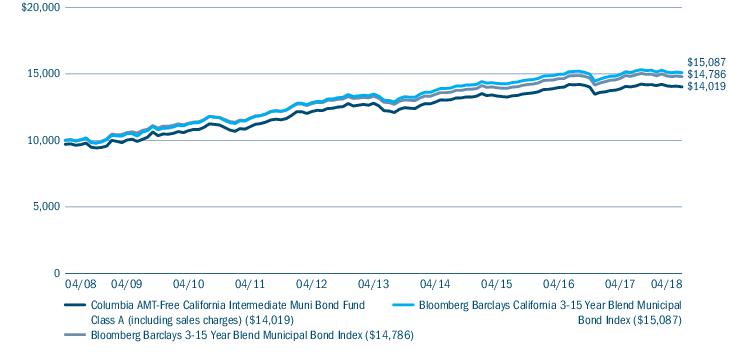
The Bloomberg Barclays California 3-15 Year Blend Municipal Bond Index is an unmanaged index that tracks the performance of investment-grade bonds issued from the state of California and its municipalities.
The Bloomberg Barclays 3–15 Year Blend Municipal Bond Index is an unmanaged index that tracks the performance of municipal bonds issued after December 31, 1990, with remaining maturities between 2 and 17 years and at least $7 million in principal amount outstanding.
Indices are not available for investment, are not professionally managed and do not reflect sales charges, fees, brokerage commissions, taxes or other expenses of investing. Securities in the Fund may not match those in an index.
| 2 | Columbia AMT-Free California Intermediate Muni Bond Fund | Annual Report 2018 |
Fund at a Glance (continued)
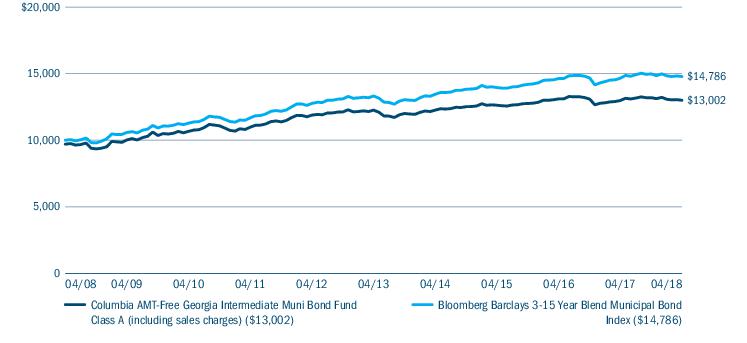
Performance of a hypothetical $10,000 investment (April 30, 2008 — April 30, 2018)
The chart above shows the change in value of a hypothetical $10,000 investment in Class A shares of Columbia AMT-Free California Intermediate Muni Bond Fund during the stated time period, and does not reflect the deduction of taxes that a shareholder may pay on Fund distributions or on the redemption of Fund shares.
| Quality breakdown (%) (at April 30, 2018) |
| AAA rating | 0.5 |
| AA rating | 45.3 |
| A rating | 32.8 |
| BBB rating | 17.5 |
| BB rating | 1.3 |
| Not rated | 2.6 |
| Total | 100.0 |
Percentages indicated are based upon total fixed income investments (excluding Money Market Funds).
Bond ratings apply to the underlying holdings of the Fund and not the Fund itself and are divided into categories ranging from highest to lowest credit quality, determined by using the middle rating of Moody’s, S&P and Fitch, after dropping the highest and lowest available ratings. When ratings are available from only two rating agencies, the lower rating is used. When a rating is available from only one rating agency, that rating is used. When a bond is not rated by any rating agency, it is designated as “Not rated.” Credit quality ratings assigned by a rating agency are subjective opinions, not statements of fact, and are subject to change, including daily. The ratings assigned by credit rating agencies are but one of the considerations that the Investment Manager and/or Fund’s subadviser incorporates into its credit analysis process, along with such other issuer-specific factors as cash flows, capital structure and leverage ratios, ability to de-leverage (repay) through free cash flow, quality of management, market positioning and access to capital, as well as such security-specific factors as the terms of the security (e.g., interest rate and time to maturity) and the amount and type of any collateral.
Columbia AMT-Free California Intermediate Muni Bond Fund | Annual Report 2018
| 3 |
Manager Discussion of Fund Performance
During the 12-month period that ended April 30, 2018, the Fund’s Class A shares returned 1.10% excluding sales charges. Institutional Class shares of the Fund returned 1.35%. During the same time period, the Bloomberg Barclays California 3-15 Year Blend Municipal Bond Index returned 0.96% and the broader national index, the Bloomberg Barclays 3-15 Year Blend Municipal Bond Index, returned 0.87%. The Fund benefited from its overweight in lower rated investment-grade bonds, which outperformed higher quality issues.
Market overview
The national municipal bond market posted a small gain in the 12-month period, as the contribution from income helped offset a moderate decline in prices. The period began on a positive note, reflecting the ongoing rebound from the post-election sell-off of late 2016. During this time, prices were supported by a generally positive tone to the financial markets, muted concerns about U.S. Federal Reserve (Fed) policy and a favorable balance of supply and demand stemming from strong mutual fund inflows and lower new issuance. Although unfunded pension liabilities and budgetary stress among notable issuers such as Illinois, New Jersey, Pennsylvania, Connecticut and Kentucky persisted, overall credit conditions for municipal bonds remained on sound footing. In addition, Illinois passed a budget for the first time in two years in July 2017, preventing the state from being downgraded to a below investment-grade rating. The passage of Illinois’ budget took some risk out of the broader market, providing additional support for prices through the middle of 2017.
The market landscape became more challenging in the autumn after Republican legislators unveiled a preliminary outline for overhauling the nation’s tax code. The initial proposals eliminated municipal issuers’ ability to advance refund outstanding debt, and it stripped private activity bonds (PABs) of their tax-exempt status. The surprise inclusion of the two provisions initially fueled a market rally as investors anticipated a dramatic reduction in future supply. However, municipalities responded to the proposed tax bill by pulling forward an estimated $35 billion of new bond issuance into December in an effort to beat any negative consequences from the potential changes. Fourth-quarter supply therefore jumped to the highest level in history, weighing on prices. The final bill, signed into law on December 22, spared PABs and only marginally reduced top personal tax rates.
Municipal bonds nevertheless remained under pressure in early 2018 as expectations for higher inflation weighed heavily on all segments of the fixed-income market. Investors worried that the introduction of fiscal stimulus, coming at a time when the economy appeared to be operating near full capacity, would force the Fed to raise interest rates further and faster than expected in order to tame inflation. The 10-year U.S. Treasury yield rose sharply during the first half of the quarter as a result, and municipal yields followed suit. Tax reform lessened the value proposition of municipals for banks and insurance companies, leading some to reduce their holdings of municipal bonds, but this potential headwind was offset by a sharp reduction in supply stemming from the surge of new issuance in December. This factor, together with a slowing rate of increase in Treasury yields late in the period, helped stabilize the municipal bond market in March and April. Still, the broad-based national indexes closed roughly flat for the full 12 months due to the earlier sell-off. Lower quality bonds outpaced higher quality issues, reflecting investors’ ongoing search for yield.
California municipal bond market delivered competitive results
California’s economy continued to boom in conjunction with the strength in the information technology sector. The expansion in technology led to personal income growth that was well above the U.S. average, which in turn fueled a surge in housing prices. Against this favorable backdrop, the California intermediate municipal market outperformed the broader national index by a small margin during the year. State and local general obligations, which comprise roughly 40% of the California intermediate index, finished narrowly ahead of the national market. Nevertheless, the state’s debt underperformed the national index by a wide margin within the BBB category due to the strong outperformance of Illinois and New Jersey.
Contributors and detractors
The Fund benefited from its overweight in lower rated investment-grade issues due to their outperformance versus higher quality securities. At the sector level, local general obligation bonds outperformed. Lower rated sectors such as hospitals and transportation, which continued to be sought after by yield-hungry investors, also performed well.
| 4 | Columbia AMT-Free California Intermediate Muni Bond Fund | Annual Report 2018 |
Manager Discussion of Fund Performance (continued)
The Fund’s positions in pre-refunded bonds and holdings with maturities of between two and eight years detracted from results. At a time in which the yield curve flattened — indicating outperformance for longer term issues — the two- to eight-year area lagged considerably. Pre-refunded bonds, which are very short-dated, high-quality and low-yielding securities, contributed very little to total return. As a result, we looked for opportunities to reinvest in other areas as existing holdings in this space matured.
Fund positioning
Our strategy was largely unchanged during the period. We retained an overweight in A and BBB rated securities, as we did not anticipate a dramatic widening of yield spreads versus higher quality debt. However, given that spreads are very tight for lower-rated investment-grade issues, we remained on the lookout for opportunities to increase the portfolio’s credit quality when reinvesting the proceeds of maturing securities. We targeted a neutral duration profile — i.e., an interest-rate sensitivity in line with the benchmark — in order to maintain a balanced stance within the portfolio. At period’s end, the Fund’s positioning continued to reflect our expectation for gradual Fed tightening and a flattening bias to the yield curve.
Fixed-income securities present issuer default risk. The Fund invests substantially in municipal securities and will be affected by tax, legislative, regulatory, demographic or political changes, as well as changes impacting a state’s financial, economic or other conditions. A relatively small number of tax-exempt issuers may necessitate the Fund investing more heavily in a single issuer and, therefore, be more exposed to the risk of loss than a fund that invests more broadly. The value of the Fund’s portfolio may be more volatile than a more geographically-diversified fund. Prepayment and extension risk exists because the timing of payments on a loan, bond or other investment may accelerate when interest rates fall or decelerate when interest rates rise which may reduce investment opportunities and potential returns. A rise in interest rates may result in a price decline of fixed-income instruments held by the Fund, negatively impacting its performance and NAV. Falling rates may result in the Fund investing in lower yielding debt instruments, lowering the Fund’s income and yield. These risks may be heightened for longer maturity and duration securities. Non-investment-grade (high-yield or junk) securities present greater price volatility and more risk to principal and income than higher rated securities. Market risk may affect a single issuer, sector of the economy, industry or the market as a whole. Federal and state tax rules apply to capital gain distributions and any gains or losses on sales. Income may be subject to state or local taxes. Liquidity risk is associated with the difficulty of selling investments at a desirable time or price. See the Fund’s prospectus for more information on these and other risks.
The views expressed in this report reflect the current views of the respective parties. These views are not guarantees of future performance and involve certain risks, uncertainties and assumptions that are difficult to predict, so actual outcomes and results may differ significantly from the views expressed. These views are subject to change at any time based upon economic, market or other conditions and the respective parties disclaim any responsibility to update such views. These views may not be relied on as investment advice and, because investment decisions for a Columbia fund are based on numerous factors, may not be relied on as an indication of trading intent on behalf of any particular Columbia fund. References to specific securities should not be construed as a recommendation or investment advice.
Columbia AMT-Free California Intermediate Muni Bond Fund | Annual Report 2018
| 5 |
Understanding Your Fund’s Expenses
(Unaudited)
As an investor, you incur two types of costs. There are transaction costs, which generally include sales charges on purchases and may include redemption fees. There are also ongoing costs, which generally include management fees, distribution and/or service fees, and other fund expenses. The following information is intended to help you understand your ongoing costs (in dollars) of investing in the Fund and to help you compare these costs with the ongoing costs of investing in other mutual funds.
Analyzing your Fund’s expenses
To illustrate these ongoing costs, we have provided examples and calculated the expenses paid by investors in each share class of the Fund during the period. The actual and hypothetical information in the table is based on an initial investment of $1,000 at the beginning of the period indicated and held for the entire period. Expense information is calculated two ways and each method provides you with different information. The amount listed in the “Actual” column is calculated using the Fund’s actual operating expenses and total return for the period. You may use the Actual information, together with the amount invested, to estimate the expenses that you paid over the period. Simply divide your account value by $1,000 (for example, an $8,600 account value divided by $1,000 = 8.6), then multiply the results by the expenses paid during the period under the “Actual” column. The amount listed in the “Hypothetical” column assumes a 5% annual rate of return before expenses (which is not the Fund’s actual return) and then applies the Fund’s actual expense ratio for the period to the hypothetical return. You should not use the hypothetical account values and expenses to estimate either your actual account balance at the end of the period or the expenses you paid during the period. See “Compare with other funds” below for details on how to use the hypothetical data.
Compare with other funds
Since all mutual funds are required to include the same hypothetical calculations about expenses in shareholder reports, you can use this information to compare the ongoing cost of investing in the Fund with other funds. To do so, compare the hypothetical example with the 5% hypothetical examples that appear in the shareholder reports of other funds. As you compare hypothetical examples of other funds, it is important to note that hypothetical examples are meant to highlight the ongoing costs of investing in a fund only and do not reflect any transaction costs, such as sales charges, or redemption or exchange fees. Therefore, the hypothetical calculations are useful in comparing ongoing costs only, and will not help you determine the relative total costs of owning different funds. If transaction costs were included in these calculations, your costs would be higher.
| November 1, 2017 — April 30, 2018 |
| | Account value at the
beginning of the
period ($) | Account value at the
end of the
period ($) | Expenses paid during
the period ($) | Fund’s annualized
expense ratio (%) |
| | Actual | Hypothetical | Actual | Hypothetical | Actual | Hypothetical | Actual |
| Class A | 1,000.00 | 1,000.00 | 987.70 | 1,021.12 | 3.65 | 3.71 | 0.74 |
| Advisor Class | 1,000.00 | 1,000.00 | 988.90 | 1,022.36 | 2.42 | 2.46 | 0.49 |
| Class C | 1,000.00 | 1,000.00 | 984.00 | 1,017.41 | 7.33 | 7.45 | 1.49 |
| Institutional Class | 1,000.00 | 1,000.00 | 989.90 | 1,022.36 | 2.42 | 2.46 | 0.49 |
| Institutional 2 Class | 1,000.00 | 1,000.00 | 990.10 | 1,022.71 | 2.07 | 2.11 | 0.42 |
| Institutional 3 Class | 1,000.00 | 1,000.00 | 989.40 | 1,022.91 | 1.87 | 1.91 | 0.38 |
Expenses paid during the period are equal to the annualized expense ratio for each class as indicated above, multiplied by the average account value over the period and then multiplied by the number of days in the Fund’s most recent fiscal half year and divided by 365.
Expenses do not include fees and expenses incurred indirectly by the Fund from its investment in underlying funds, including affiliated and non-affiliated pooled investment vehicles, such as mutual funds and exchange-traded funds.
Had Columbia Management Investment Advisers, LLC and/or certain of its affiliates not waived/reimbursed certain fees and expenses, account value at the end of the period would have been reduced.
| 6 | Columbia AMT-Free California Intermediate Muni Bond Fund | Annual Report 2018 |
Portfolio of Investments
April 30, 2018
(Percentages represent value of investments compared to net assets)
Investments in securities
| Floating Rate Notes 0.7% |
| Issue Description | Effective
Yield | | Principal
Amount ($) | Value ($) |
| Variable Rate Demand Notes 0.7% |
| State of California(a),(b) |
| Unlimited General Obligation Bonds |
| Kindergarten |
| Series 2013A2 (State Street) |
| 05/01/2034 | 1.200% | | 3,000,000 | 3,000,000 |
Total Floating Rate Notes
(Cost $3,000,000) | 3,000,000 |
|
| Municipal Bonds 96.4% |
| Issue Description | Coupon
Rate | | Principal
Amount ($) | Value ($) |
| Airport 4.9% |
| City of Los Angeles Department of Airports |
| Revenue Bonds |
| Subordinated Series 2017B |
| 05/15/2029 | 5.000% | | 330,000 | 389,915 |
| 05/15/2030 | 5.000% | | 500,000 | 588,590 |
| Subordinated Refunding Revenue Bonds |
| Series 2015C |
| 05/15/2029 | 5.000% | | 2,410,000 | 2,758,028 |
| County of Orange Airport |
| Revenue Bonds |
| Series 2009A |
| 07/01/2025 | 5.250% | | 1,500,000 | 1,558,590 |
| County of Sacramento Airport System |
| Refunding Revenue Bonds |
| Subordinated Series 2016B |
| 07/01/2036 | 5.000% | | 1,750,000 | 1,978,690 |
| Unrefunded Revenue Bonds |
| Series 2008A (AGM) |
| 07/01/2023 | 5.000% | | 870,000 | 874,698 |
| County of Sacramento Airport System(c) |
| Refunding Revenue Bonds |
| Subordinated Series 2018E |
| 07/01/2034 | 5.000% | | 1,000,000 | 1,163,540 |
| Norman Y. Mineta San Jose International Airport |
| Refunding Revenue Bonds |
| Series 2014B |
| 03/01/2027 | 5.000% | | 2,000,000 | 2,265,000 |
| Series 2014C |
| 03/01/2030 | 5.000% | | 2,500,000 | 2,815,375 |
| San Diego County Regional Airport Authority |
| Refunding Revenue Bonds |
| Subordinated Series 2017A |
| 07/01/2033 | 5.000% | | 1,000,000 | 1,160,040 |
| 07/01/2034 | 5.000% | | 700,000 | 808,381 |
| Municipal Bonds (continued) |
| Issue Description | Coupon
Rate | | Principal
Amount ($) | Value ($) |
| Subordinated Revenue Bonds |
| Series 2010A |
| 07/01/2024 | 5.000% | | 1,000,000 | 1,063,420 |
| San Francisco City & County Airport Commission - San Francisco International Airport |
| Refunding Revenue Bonds |
| 2nd Series 2011 |
| 05/01/2026 | 5.250% | | 555,000 | 607,392 |
| San Francisco City & County Airports Commission - San Francisco International Airport |
| Refunding Revenue Bonds |
| 2nd Series 2016A |
| 05/01/2026 | 5.000% | | 1,975,000 | 2,332,455 |
| Total | 20,364,114 |
| Charter Schools 3.5% |
| California School Finance Authority(d) |
| Refunding Revenue Bonds |
| Aspire Public Schools |
| Series 2016 |
| 08/01/2029 | 5.000% | | 1,100,000 | 1,206,227 |
| 08/01/2030 | 5.000% | | 1,505,000 | 1,645,296 |
| 08/01/2031 | 5.000% | | 925,000 | 1,008,148 |
| Revenue Bonds |
| Alliance College-Ready Public Schools |
| Series 2015 |
| 07/01/2030 | 5.000% | | 1,700,000 | 1,876,885 |
| Green Dot Public School Project |
| Series 2015A |
| 08/01/2035 | 5.000% | | 1,010,000 | 1,079,488 |
| KIPP Los Angeles Projects |
| Series 2015A |
| 07/01/2035 | 5.000% | | 1,250,000 | 1,356,300 |
| Series 2017 |
| 07/01/2037 | 5.000% | | 3,090,000 | 3,403,357 |
| River Springs Charter School Project |
| Series 2015 |
| 07/01/2025 | 5.250% | | 2,000,000 | 2,197,380 |
| California School Finance Authority |
| Revenue Bonds |
| KIPP Los Angeles Projects |
| Series 2014A |
| 07/01/2034 | 5.000% | | 600,000 | 649,830 |
| Total | 14,422,911 |
| Health Services 0.3% |
| California Municipal Finance Authority |
| Refunding Revenue Bonds |
| Harbor Regional Center Project |
| Series 2015 |
| 11/01/2032 | 5.000% | | 1,120,000 | 1,255,027 |
The accompanying Notes to Financial Statements are an integral part of this statement.
Columbia AMT-Free California Intermediate Muni Bond Fund | Annual Report 2018
| 7 |
Portfolio of Investments (continued)
April 30, 2018
| Municipal Bonds (continued) |
| Issue Description | Coupon
Rate | | Principal
Amount ($) | Value ($) |
| Higher Education 4.3% |
| California Educational Facilities Authority |
| Refunding Revenue Bonds |
| Loma Linda University |
| Series 2017A |
| 04/01/2034 | 5.000% | | 1,485,000 | 1,671,219 |
| 04/01/2035 | 5.000% | | 2,000,000 | 2,245,880 |
| Revenue Bonds |
| California Lutheran University |
| Series 2008 |
| 10/01/2021 | 5.250% | | 1,230,000 | 1,247,749 |
| Chapman University |
| Series 2015 |
| 04/01/2026 | 5.000% | | 1,000,000 | 1,146,870 |
| University of Southern California |
| Series 2009C |
| 10/01/2024 | 5.250% | | 3,000,000 | 3,538,590 |
| California Municipal Finance Authority |
| Refunding Revenue Bonds |
| Azusa Pacific University |
| Series 2015B |
| 04/01/2025 | 5.000% | | 395,000 | 449,538 |
| 04/01/2026 | 5.000% | | 1,000,000 | 1,132,020 |
| Biola University |
| Series 2017 |
| 10/01/2031 | 5.000% | | 540,000 | 626,551 |
| 10/01/2032 | 5.000% | | 615,000 | 709,759 |
| Revenue Bonds |
| Biola University |
| Series 2013 |
| 10/01/2024 | 5.000% | | 505,000 | 565,287 |
| 10/01/2028 | 5.000% | | 840,000 | 926,890 |
| California Municipal Finance Authority(d) |
| Revenue Bonds |
| California Baptist University |
| Series 2016A |
| 11/01/2026 | 4.000% | | 1,000,000 | 1,027,350 |
| California Statewide Communities Development Authority(d) |
| Refunding Revenue Bonds |
| California Baptist University |
| Series 2017A |
| 11/01/2032 | 5.000% | | 1,135,000 | 1,237,059 |
| Revenue Bonds |
| California Baptist University |
| Series 2014A |
| 11/01/2023 | 5.125% | | 715,000 | 761,182 |
| Lancer Plaza Project |
| Series 2013 |
| 11/01/2023 | 5.125% | | 670,000 | 709,724 |
| Total | 17,995,668 |
| Municipal Bonds (continued) |
| Issue Description | Coupon
Rate | | Principal
Amount ($) | Value ($) |
| Hospital 9.8% |
| ABAG Finance Authority for Nonprofit Corps. |
| Revenue Bonds |
| Sharp Healthcare |
| Series 2011A |
| 08/01/2024 | 5.250% | | 2,750,000 | 3,003,247 |
| California Health Facilities Financing Authority |
| Refunding Revenue Bonds |
| Cedars Sinai Medical Center |
| Series 2015 |
| 11/15/2028 | 5.000% | | 1,000,000 | 1,181,280 |
| El Camino Hospital |
| Series 2015A |
| 02/01/2027 | 5.000% | | 1,500,000 | 1,705,500 |
| Marshall Medical Center |
| Series 2015 |
| 11/01/2023 | 5.000% | | 325,000 | 365,957 |
| Sutter Health |
| Series 2017A |
| 11/15/2033 | 5.000% | | 1,000,000 | 1,157,600 |
| Sutter Health Obligation Group |
| Series 2011D |
| 08/15/2026 | 5.000% | | 2,250,000 | 2,462,827 |
| Revenue Bonds |
| Children’s Hospital of Orange County |
| Series 2009 |
| 11/01/2021 | 6.000% | | 2,000,000 | 2,130,900 |
| City of Hope Obligation Group |
| Series 2012A |
| 11/15/2021 | 5.000% | | 600,000 | 659,214 |
| Dignity Health |
| Series 2009E |
| 07/01/2025 | 5.625% | | 1,500,000 | 1,560,435 |
| El Camino Hospital |
| Series 2017 |
| 02/01/2033 | 5.000% | | 2,500,000 | 2,844,950 |
| 02/01/2034 | 5.000% | | 500,000 | 566,130 |
| Kaiser Permanente |
| Subordinated Series 2017A-1-G |
| 11/01/2027 | 5.000% | | 1,875,000 | 2,269,106 |
| Lucile Salter Packard Children’s Hospital |
| Series 2014 |
| 08/15/2028 | 5.000% | | 300,000 | 339,081 |
| Series 2017 |
| 11/15/2034 | 5.000% | | 250,000 | 289,178 |
| 11/15/2035 | 5.000% | | 270,000 | 311,588 |
| Providence Health & Services |
| Series 2014A |
| 10/01/2030 | 5.000% | | 1,500,000 | 1,709,475 |
The accompanying Notes to Financial Statements are an integral part of this statement.
| 8 | Columbia AMT-Free California Intermediate Muni Bond Fund | Annual Report 2018 |
Portfolio of Investments (continued)
April 30, 2018
| Municipal Bonds (continued) |
| Issue Description | Coupon
Rate | | Principal
Amount ($) | Value ($) |
| Sutter Health |
| Series 2018A |
| 11/15/2034 | 5.000% | | 1,000,000 | 1,146,920 |
| California Municipal Finance Authority |
| Refunding Revenue Bonds |
| Community Medical Centers |
| Series 2015A |
| 02/01/2027 | 5.000% | | 1,200,000 | 1,354,944 |
| Series 2017A |
| 02/01/2033 | 5.000% | | 2,770,000 | 3,093,896 |
| California Statewide Communities Development Authority |
| Refunding Revenue Bonds |
| Enloe Medical Center |
| Series 2015 |
| 08/15/2030 | 5.000% | | 1,990,000 | 2,294,291 |
| Huntington Memorial Hospital |
| Series 2014B |
| 07/01/2033 | 5.000% | | 2,300,000 | 2,554,288 |
| Revenue Bonds |
| Henry Mayo Newhall Memorial |
| Series 2014A (AGM) |
| 10/01/2027 | 5.000% | | 1,000,000 | 1,117,120 |
| Kaiser Permanente |
| Series 2009A |
| 04/01/2019 | 5.000% | | 2,000,000 | 2,058,640 |
| Loma Linda University Medical Center |
| Series 2014 |
| 12/01/2034 | 5.250% | | 3,000,000 | 3,245,640 |
| City of Upland |
| Refunding Certificate of Participation |
| San Antonio Regional Hospital |
| Series 2017 |
| 01/01/2034 | 5.000% | | 500,000 | 555,820 |
| 01/01/2036 | 4.000% | | 1,000,000 | 1,004,740 |
| Total | 40,982,767 |
| Joint Power Authority 2.9% |
| M-S-R Public Power Agency |
| Subordinated Revenue Bonds |
| Lien |
| Series 2008L (AGM) |
| 07/01/2021 | 5.000% | | 2,500,000 | 2,513,200 |
| Northern California Transmission Agency |
| Refunding Revenue Bonds |
| California-Oregon Project |
| Series 2016 |
| 05/01/2032 | 5.000% | | 1,500,000 | 1,724,550 |
| Southern California Public Power Authority |
| Refunding Revenue Bonds |
| Series 2008A |
| 07/01/2022 | 5.000% | | 2,000,000 | 2,011,320 |
| Municipal Bonds (continued) |
| Issue Description | Coupon
Rate | | Principal
Amount ($) | Value ($) |
| Series 2015C |
| 07/01/2026 | 5.000% | | 5,000,000 | 5,812,750 |
| Total | 12,061,820 |
| Local Appropriation 2.7% |
| City & County of San Francisco |
| Certificate of Participation |
| Multiple Capital Improvement Projects |
| Series 2009B |
| 04/01/2024 | 5.000% | | 1,495,000 | 1,538,280 |
| Los Angeles County Public Works Financing Authority |
| Refunding Revenue Bonds |
| Series 2015B |
| 12/01/2025 | 5.000% | | 1,750,000 | 2,068,938 |
| Oakland Joint Powers Financing Authority |
| Refunding Revenue Bonds |
| Oakland Administration Buildings |
| Series 2008B (AGM) |
| 08/01/2022 | 5.000% | | 2,000,000 | 2,014,240 |
| Riverside Public Financing Authority |
| Refunding Revenue Bonds |
| Series 2012A |
| 11/01/2027 | 5.000% | | 2,145,000 | 2,359,285 |
| 11/01/2028 | 5.000% | | 1,155,000 | 1,268,329 |
| San Rafael Joint Powers Financing Authority |
| Revenue Bonds |
| Public Safety Facilities Project |
| Series 2018 |
| 06/01/2033 | 5.000% | | 850,000 | 1,002,592 |
| 06/01/2034 | 5.000% | | 775,000 | 907,486 |
| Total | 11,159,150 |
| Local General Obligation 11.1% |
| Compton Community College District |
| Unlimited General Obligation Refunding Bonds |
| Series 2012 |
| 07/01/2022 | 5.000% | | 2,095,000 | 2,331,546 |
| Compton Unified School District(e) |
| Unlimited General Obligation Bonds |
| Election of 2002 - Capital Appreciation |
| Series 2006C (AMBAC) |
| 06/01/2023 | 0.000% | | 2,025,000 | 1,775,925 |
| 06/01/2024 | 0.000% | | 1,925,000 | 1,629,455 |
| Corona-Norco Unified School District |
| Unlimited General Obligation Bonds |
| Election 2014 |
| Series 2018B |
| 08/01/2034 | 4.000% | | 500,000 | 527,970 |
The accompanying Notes to Financial Statements are an integral part of this statement.
Columbia AMT-Free California Intermediate Muni Bond Fund | Annual Report 2018
| 9 |
Portfolio of Investments (continued)
April 30, 2018
| Municipal Bonds (continued) |
| Issue Description | Coupon
Rate | | Principal
Amount ($) | Value ($) |
| Culver City School Facilities Financing Authority |
| Revenue Bonds |
| Unified School District |
| Series 2005 (AGM) |
| 08/01/2023 | 5.500% | | 1,490,000 | 1,739,605 |
| East Side Union High School District |
| Unlimited General Obligation Refunding Bonds |
| 2012 Crossover |
| Series 2006 (AGM) |
| 09/01/2020 | 5.250% | | 1,280,000 | 1,378,483 |
| Long Beach Unified School District(e) |
| Unlimited General Obligation Bonds |
| Series 2015D-1 |
| 08/01/2031 | 0.000% | | 1,375,000 | 829,537 |
| Los Angeles Unified School District |
| Unlimited General Obligation Bonds |
| Election 2008 |
| Series 2018B-1 |
| 07/01/2032 | 5.000% | | 4,000,000 | 4,751,600 |
| Monterey Peninsula Community College District(e) |
| Unlimited General Obligation Refunding Bonds |
| Series 2016 |
| 08/01/2028 | 0.000% | | 2,125,000 | 1,517,144 |
| Oakland Unified School District/Alameda County |
| Unlimited General Obligation Bonds |
| Series 2015A |
| 08/01/2025 | 5.000% | | 650,000 | 766,994 |
| Palomar Community College District(e) |
| Unlimited General Obligation Bonds |
| Capital Appreciation-Election of 2006 |
| Series 2010B |
| 08/01/2022 | 0.000% | | 2,140,000 | 1,943,548 |
| Pomona Unified School District(e) |
| Unlimited General Obligation Bonds |
| Election 2008 |
| Series 2016G (AGM) |
| 08/01/2032 | 0.000% | | 1,000,000 | 586,540 |
| Rancho Santiago Community College District(e) |
| Unlimited General Obligation Bonds |
| Capital Appreciation-Election of 2002 |
| Series 2006C (AGM) |
| 09/01/2031 | 0.000% | | 3,785,000 | 2,399,009 |
| Rancho Santiago Community College District |
| Unlimited General Obligation Refunding Bonds |
| Series 2005 (AGM) |
| 09/01/2019 | 5.250% | | 1,000,000 | 1,047,160 |
| Rescue Union School District(e) |
| Unlimited General Obligation Bonds |
| Capital Appreciation-Election of 1998 |
| Series 2005 (NPFGC) |
| 09/01/2026 | 0.000% | | 1,100,000 | 871,123 |
| Municipal Bonds (continued) |
| Issue Description | Coupon
Rate | | Principal
Amount ($) | Value ($) |
| Salinas Union High School District(e) |
| Unlimited General Obligation Bonds |
| BAN Series 2015 |
| 08/01/2020 | 0.000% | | 4,725,000 | 4,509,115 |
| San Mateo Foster City School District |
| Revenue Bonds |
| Series 2005 (AGM) |
| 08/15/2019 | 5.500% | | 2,000,000 | 2,097,000 |
| Santa Monica Community College District |
| Unlimited General Obligation Bonds |
| Election 2016 |
| Series 2018A |
| 08/01/2034 | 4.000% | | 500,000 | 533,790 |
| Saugus Union School District |
| Unlimited General Obligation Refunding Bonds |
| Series 2006 (NPFGC) |
| 08/01/2021 | 5.250% | | 2,375,000 | 2,625,111 |
| Sierra Kings Health Care District |
| Unlimited General Obligation Refunding Bonds |
| Series 2015 |
| 08/01/2028 | 5.000% | | 1,000,000 | 1,130,750 |
| 08/01/2032 | 5.000% | | 1,500,000 | 1,674,360 |
| Simi Valley Unified School District |
| Unlimited General Obligation Refunding Bonds |
| Series 2017 |
| 08/01/2025 | 5.000% | | 1,000,000 | 1,182,920 |
| 08/01/2026 | 5.000% | | 2,000,000 | 2,401,820 |
| West Contra Costa Unified School District |
| Unlimited General Obligation Refunding Bonds |
| Series 2011 (AGM) |
| 08/01/2023 | 5.250% | | 3,000,000 | 3,301,980 |
| Series 2012 |
| 08/01/2027 | 5.000% | | 2,365,000 | 2,634,066 |
| Total | 46,186,551 |
| Multi-Family 1.1% |
| California Municipal Finance Authority |
| Revenue Bonds |
| Bowles Hall Foundation |
| Series 2015A |
| 06/01/2035 | 5.000% | | 400,000 | 432,896 |
| Caritas Affordable Housing |
| Senior Series 2014 |
| 08/15/2030 | 5.000% | | 1,000,000 | 1,099,440 |
| California Statewide Communities Development Authority |
| Refunding Revenue Bonds |
| University of California Irvine East Campus Apartments |
| Series 2012 |
| 05/15/2019 | 5.000% | | 1,000,000 | 1,031,430 |
| 05/15/2020 | 5.000% | | 750,000 | 794,048 |
The accompanying Notes to Financial Statements are an integral part of this statement.
| 10 | Columbia AMT-Free California Intermediate Muni Bond Fund | Annual Report 2018 |
Portfolio of Investments (continued)
April 30, 2018
| Municipal Bonds (continued) |
| Issue Description | Coupon
Rate | | Principal
Amount ($) | Value ($) |
| Revenue Bonds |
| Series 2017 |
| 05/15/2032 | 5.000% | | 1,000,000 | 1,132,720 |
| Total | 4,490,534 |
| Municipal Power 4.8% |
| City of Redding Electric System |
| Refunding Revenue Bonds |
| Series 2017 |
| 06/01/2029 | 5.000% | | 1,250,000 | 1,492,350 |
| City of Riverside Electric |
| Revenue Bonds |
| Series 2008D (AGM) |
| 10/01/2023 | 5.000% | | 1,000,000 | 1,013,280 |
| City of Santa Clara Electric |
| Refunding Revenue Bonds |
| Series 2011A |
| 07/01/2029 | 5.375% | | 1,000,000 | 1,098,750 |
| City of Vernon Electric System |
| Unrefunded Revenue Bonds |
| Series 2009A |
| 08/01/2021 | 5.125% | | 1,910,000 | 1,980,192 |
| Imperial Irrigation District Electric System |
| Refunding Revenue Bonds |
| Series 2011D |
| 11/01/2022 | 5.000% | | 2,860,000 | 3,145,371 |
| 11/01/2023 | 5.000% | | 1,040,000 | 1,143,033 |
| Los Angeles Department of Water & Power System |
| Refunding Revenue Bonds |
| Series 2018A |
| 07/01/2035 | 5.000% | | 1,750,000 | 2,054,500 |
| Revenue Bonds |
| Power System |
| Series 2009B |
| 07/01/2023 | 5.250% | | 2,000,000 | 2,081,900 |
| Series 2014D |
| 07/01/2033 | 5.000% | | 1,700,000 | 1,931,965 |
| Redding Joint Powers Financing Authority |
| Refunding Revenue Bonds |
| Series 2015A |
| 06/01/2031 | 5.000% | | 1,045,000 | 1,201,018 |
| Sacramento Municipal Utility District |
| Unrefunded Revenue Bonds |
| Series 2008U (AGM) |
| 08/15/2021 | 5.000% | | 920,000 | 929,136 |
| Municipal Bonds (continued) |
| Issue Description | Coupon
Rate | | Principal
Amount ($) | Value ($) |
| Turlock Irrigation District |
| Refunding Revenue Bonds |
| First Priority |
| Subordinated Series 2014 |
| 01/01/2030 | 5.000% | | 850,000 | 961,843 |
| 01/01/2031 | 5.000% | | 1,000,000 | 1,127,940 |
| Total | 20,161,278 |
| Other Bond Issue 1.3% |
| California Infrastructure & Economic Development Bank |
| Refunding Revenue Bonds |
| Salvation Army Western Territory (The) |
| Series 2016 |
| 09/01/2033 | 4.000% | | 400,000 | 418,156 |
| 09/01/2034 | 4.000% | | 600,000 | 623,694 |
| Walt Disney Family Museum |
| Series 2016 |
| 02/01/2032 | 4.000% | | 350,000 | 368,081 |
| 02/01/2033 | 4.000% | | 500,000 | 522,340 |
| City of Long Beach Marina System |
| Revenue Bonds |
| Series 2015 |
| 05/15/2028 | 5.000% | | 635,000 | 717,588 |
| County of San Diego |
| Refunding Revenue Bonds |
| Sanford Burnham Prebys Medical Discovery Group |
| Series 2015 |
| 11/01/2025 | 5.000% | | 350,000 | 405,594 |
| Long Beach Bond Finance Authority |
| Refunding Revenue Bonds |
| Aquarium of the Pacific |
| Series 2012 |
| 11/01/2027 | 5.000% | | 2,210,000 | 2,412,525 |
| Total | 5,467,978 |
| Ports 1.1% |
| Port of Los Angeles |
| Revenue Bonds |
| Series 2009A |
| 08/01/2023 | 5.250% | | 2,000,000 | 2,086,180 |
| San Diego Unified Port District |
| Refunding Revenue Bonds |
| Series 2013A |
| 09/01/2027 | 5.000% | | 1,000,000 | 1,118,710 |
| 09/01/2028 | 5.000% | | 1,100,000 | 1,230,581 |
| Total | 4,435,471 |
| Prepaid Gas 0.6% |
| M-S-R Energy Authority |
| Revenue Bonds |
| Series 2009B |
| 11/01/2029 | 6.125% | | 2,000,000 | 2,459,280 |
The accompanying Notes to Financial Statements are an integral part of this statement.
Columbia AMT-Free California Intermediate Muni Bond Fund | Annual Report 2018
| 11 |
Portfolio of Investments (continued)
April 30, 2018
| Municipal Bonds (continued) |
| Issue Description | Coupon
Rate | | Principal
Amount ($) | Value ($) |
| Recreation 1.0% |
| California Infrastructure & Economic Development Bank |
| Refunding Revenue Bonds |
| Segerstrom Center for the Arts |
| Series 2016 |
| 07/01/2026 | 5.000% | | 2,000,000 | 2,336,540 |
| Del Mar Race Track Authority |
| Refunding Revenue Bonds |
| Series 2015 |
| 10/01/2025 | 5.000% | | 1,665,000 | 1,894,887 |
| Total | 4,231,427 |
| Refunded / Escrowed 8.6% |
| California Educational Facilities Authority |
| Revenue Bonds |
| Pitzer College |
| Series 2009 Escrowed to Maturity |
| 04/01/2019 | 5.000% | | 1,610,000 | 1,656,915 |
| California Health Facilities Financing Authority |
| Prerefunded 07/01/19 Revenue Bonds |
| Dignity Health |
| Series 2009A |
| 07/01/2029 | 6.000% | | 1,250,000 | 1,310,162 |
| Revenue Bonds |
| Insured Episcopal Home |
| Series 2010B Escrowed to Maturity |
| 02/01/2019 | 5.100% | | 140,000 | 143,590 |
| California State Public Works Board |
| Prerefunded 03/01/20 Revenue Bonds |
| Various Capital Projects |
| Subordinated Series 2010A-1 |
| 03/01/2022 | 5.250% | | 2,000,000 | 2,124,020 |
| California State University |
| Prerefunded 05/01/19 Revenue Bonds |
| Systemwide |
| Series 2009A |
| 11/01/2022 | 5.250% | | 2,500,000 | 2,587,900 |
| California Statewide Communities Development Authority |
| Prerefunded 08/15/20 Revenue Bonds |
| Sutter Health |
| Series 2011A |
| 08/15/2026 | 5.500% | | 1,000,000 | 1,080,840 |
| City & County of San Francisco |
| Prerefunded 06/15/20 Unlimited General Obligation Bonds |
| Earthquake Safety |
| Series 2010E |
| 06/15/2027 | 5.000% | | 3,380,000 | 3,603,147 |
| City of Los Angeles |
| Prerefunded 09/01/21 Unlimited General Obligation Bonds |
| Series 2011A |
| 09/01/2025 | 5.000% | | 3,000,000 | 3,295,620 |
| Municipal Bonds (continued) |
| Issue Description | Coupon
Rate | | Principal
Amount ($) | Value ($) |
| City of Los Angeles Wastewater System |
| Prerefunded 06/01/19 Revenue Bonds |
| Series 2009A |
| 06/01/2025 | 5.750% | | 1,110,000 | 1,156,809 |
| 06/01/2025 | 5.750% | | 890,000 | 928,519 |
| City of Newport Beach |
| Prerefunded 12/01/21 Revenue Bonds |
| Hoag Memorial Hospital Presbyterian |
| Series 2011 |
| 12/01/2030 | 5.875% | | 1,000,000 | 1,131,010 |
| Long Beach Community College District |
| Prerefunded 08/01/22 Unlimited General Obligation Bonds |
| 2008 Election |
| Series 2012B |
| 08/01/2023 | 5.000% | | 700,000 | 785,078 |
| Pasadena Public Financing Authority |
| Prerefunded 03/01/21 Revenue Bonds |
| Rose Bowl Renovation |
| Series 2010A |
| 03/01/2026 | 5.000% | | 2,500,000 | 2,713,250 |
| Pico Rivera Public Financing Authority |
| Prerefunded 09/01/19 Revenue Bonds |
| Series 2009 |
| 09/01/2026 | 5.250% | | 1,085,000 | 1,133,673 |
| San Diego Public Facilities Financing Authority Sewer |
| Prerefunded 05/15/19 Revenue Bonds |
| Senior Series 2009B |
| 05/15/2025 | 5.250% | | 1,500,000 | 1,553,970 |
| San Diego Public Facilities Financing Authority Water |
| Prerefunded 08/01/20 Revenue Bonds |
| Series 2010A |
| 08/01/2024 | 5.000% | | 2,000,000 | 2,137,080 |
| San Francisco City & County Airport Commission - San Francisco International Airport |
| Prerefunded 05/03/21 Revenue Bonds |
| Series 2011-2 |
| 05/01/2026 | 5.250% | | 1,445,000 | 1,581,206 |
| San Francisco City & County Redevelopment Agency |
| Tax Allocation Bonds |
| San Francisco Redevelopment Projects |
| Series 2009B Escrowed to Maturity |
| 08/01/2018 | 5.000% | | 1,255,000 | 1,265,191 |
| San Mateo Joint Powers Financing Authority |
| Prerefunded 07/15/18 Revenue Bonds |
| Youth Services Campus |
| Series 2008A |
| 07/15/2028 | 5.250% | | 2,275,000 | 2,291,585 |
| Sulphur Springs Union School District |
| Prerefunded 09/01/22 Special Tax Bonds |
| Community Facilities District |
| Series 2012 |
| 09/01/2028 | 5.000% | | 520,000 | 580,726 |
| 09/01/2029 | 5.000% | | 585,000 | 653,316 |
The accompanying Notes to Financial Statements are an integral part of this statement.
| 12 | Columbia AMT-Free California Intermediate Muni Bond Fund | Annual Report 2018 |
Portfolio of Investments (continued)
April 30, 2018
| Municipal Bonds (continued) |
| Issue Description | Coupon
Rate | | Principal
Amount ($) | Value ($) |
| Tuolumne Wind Project Authority |
| Prerefunded 01/01/19 Revenue Bonds |
| Tuolumne Co. Project |
| Series 2009 |
| 01/01/2022 | 5.000% | | 1,000,000 | 1,021,870 |
| University of California |
| Prerefunded 05/15/19 Revenue Bonds |
| Series 2009O |
| 05/15/2020 | 5.000% | | 1,000,000 | 1,033,430 |
| Total | 35,768,907 |
| Retirement Communities 5.4% |
| ABAG Finance Authority for Nonprofit Corps. |
| Refunding Revenue Bonds |
| Episcopal Senior Communities |
| Series 2011 |
| 07/01/2024 | 5.375% | | 2,795,000 | 3,079,112 |
| Series 2012 |
| 07/01/2021 | 5.000% | | 1,000,000 | 1,095,370 |
| Revenue Bonds |
| Odd Fellows Home of California |
| Series 2012-A |
| 04/01/2032 | 5.000% | | 4,750,000 | 5,242,575 |
| California Health Facilities Financing Authority |
| Refunding Revenue Bonds |
| Northern California Presbyterian Homes |
| Series 2015 |
| 07/01/2028 | 5.000% | | 310,000 | 352,687 |
| 07/01/2029 | 5.000% | | 300,000 | 340,062 |
| California Municipal Finance Authority |
| Refunding Revenue Bonds |
| Retirement Housing Foundation |
| Series 2017 |
| 11/15/2029 | 5.000% | | 390,000 | 461,818 |
| 11/15/2030 | 5.000% | | 600,000 | 714,912 |
| California Statewide Communities Development Authority(d) |
| Refunding Revenue Bonds |
| 899 Charleston Project |
| Series 2014A |
| 11/01/2019 | 5.000% | | 375,000 | 384,604 |
| California Statewide Communities Development Authority |
| Refunding Revenue Bonds |
| American Baptist Homes West |
| Series 2015 |
| 10/01/2024 | 5.000% | | 2,575,000 | 2,921,595 |
| 10/01/2026 | 5.000% | | 1,000,000 | 1,141,310 |
| Episcopal Communities and Services |
| Series 2012 |
| 05/15/2027 | 5.000% | | 1,520,000 | 1,651,602 |
| Front Porch Communities and Services |
| Series 2017 |
| 04/01/2030 | 5.000% | | 150,000 | 171,541 |
| Municipal Bonds (continued) |
| Issue Description | Coupon
Rate | | Principal
Amount ($) | Value ($) |
| Revenue Bonds |
| Insured Redwoods Project |
| Series 2013 |
| 11/15/2028 | 5.000% | | 1,000,000 | 1,123,540 |
| City of La Verne |
| Refunding Certificate of Participation |
| Brethren Hillcrest Homes |
| Series 2014 |
| 05/15/2024 | 5.000% | | 310,000 | 340,120 |
| 05/15/2025 | 5.000% | | 530,000 | 573,232 |
| 05/15/2026 | 5.000% | | 700,000 | 752,675 |
| 05/15/2029 | 5.000% | | 1,135,000 | 1,203,565 |
| Los Angeles County Regional Financing Authority |
| Revenue Bonds |
| Montecedro, Inc. Project |
| Series 2014A |
| 11/15/2034 | 5.000% | | 1,000,000 | 1,102,060 |
| Total | 22,652,380 |
| Special Non Property Tax 0.3% |
| Berkeley Joint Powers Financing Authority |
| Revenue Bonds |
| Series 2016 (BAM) |
| 06/01/2032 | 4.000% | | 500,000 | 526,450 |
| 06/01/2033 | 4.000% | | 415,000 | 435,447 |
| 06/01/2034 | 4.000% | | 250,000 | 260,695 |
| Total | 1,222,592 |
| Special Property Tax 14.2% |
| Chino Public Financing Authority |
| Refunding Special Tax Bonds |
| Series 2012 |
| 09/01/2023 | 5.000% | | 1,070,000 | 1,178,188 |
| City of Irvine |
| Refunding Special Assessment Bonds |
| Limited Obligation Reassessment District |
| Series 2015 |
| 09/02/2025 | 5.000% | | 1,300,000 | 1,534,624 |
| Concord Redevelopment Agency Successor Agency |
| Refunding Tax Allocation Bonds |
| Series 2014 (BAM) |
| 03/01/2025 | 5.000% | | 840,000 | 972,224 |
| County of El Dorado |
| Refunding Special Tax Bonds |
| Community Facilities District No. 92-1 |
| Series 2012 |
| 09/01/2026 | 5.000% | | 630,000 | 689,365 |
| 09/01/2027 | 5.000% | | 805,000 | 880,509 |
The accompanying Notes to Financial Statements are an integral part of this statement.
Columbia AMT-Free California Intermediate Muni Bond Fund | Annual Report 2018
| 13 |
Portfolio of Investments (continued)
April 30, 2018
| Municipal Bonds (continued) |
| Issue Description | Coupon
Rate | | Principal
Amount ($) | Value ($) |
| Emeryville Redevelopment Agency Successor Agency |
| Refunding Tax Allocation Bonds |
| Series 2014A (AGM) |
| 09/01/2023 | 5.000% | | 2,415,000 | 2,741,581 |
| 09/01/2026 | 5.000% | | 1,000,000 | 1,142,990 |
| 09/01/2027 | 5.000% | | 1,000,000 | 1,139,850 |
| 09/01/2030 | 5.000% | | 815,000 | 921,349 |
| 09/01/2031 | 5.000% | | 590,000 | 665,166 |
| Garden Grove Agency Community Development Successor Agency |
| Refunding Tax Allocation Bonds |
| Garden Grove Community Project |
| Series 2016 (BAM) |
| 10/01/2030 | 5.000% | | 1,040,000 | 1,189,469 |
| 10/01/2031 | 5.000% | | 1,640,000 | 1,868,255 |
| Glendale Redevelopment Agency Successor Agency |
| Refunding Tax Allocation Bonds |
| Central Glendale Redevelopment |
| Subordinated Series 2013 (AGM) |
| 12/01/2021 | 5.000% | | 755,000 | 829,307 |
| Inglewood Redevelopment Agency Successor Agency |
| Refunding Tax Allocation Bonds |
| Merged Redevelopment Project |
| Subordinated Series 2017 (BAM) |
| 05/01/2032 | 5.000% | | 500,000 | 572,825 |
| 05/01/2033 | 5.000% | | 1,000,000 | 1,138,080 |
| Irvine Unified School District |
| Refunding Special Tax Bonds |
| Series 2015 |
| 09/01/2030 | 5.000% | | 2,065,000 | 2,310,157 |
| 09/01/2031 | 5.000% | | 2,720,000 | 3,035,819 |
| Jurupa Public Financing Authority |
| Refunding Special Tax Bonds |
| Series 2014A |
| 09/01/2029 | 5.000% | | 530,000 | 596,536 |
| 09/01/2030 | 5.000% | | 625,000 | 701,156 |
| 09/01/2032 | 5.000% | | 625,000 | 696,556 |
| La Quinta Redevelopment Agency Successor Agency |
| Refunding Tax Allocation Bonds |
| Redevelopment Project |
| Subordinated Series 2013A |
| 09/01/2030 | 5.000% | | 1,500,000 | 1,663,875 |
| Long Beach Bond Finance Authority |
| Tax Allocation Bonds |
| Industrial Redevelopment Project Areas |
| Series 2002B (AMBAC) |
| 11/01/2019 | 5.500% | | 1,070,000 | 1,127,085 |
| Los Angeles Community Facilities District |
| Refunding Special Tax Bonds |
| Playa Vista-Phase 1 |
| Series 2014 |
| 09/01/2030 | 5.000% | | 1,000,000 | 1,118,780 |
| Municipal Bonds (continued) |
| Issue Description | Coupon
Rate | | Principal
Amount ($) | Value ($) |
| Los Angeles County Redevelopment Authority |
| Refunding Tax Allocation Bonds |
| Los Angeles Bunker Hill Project |
| Series 2014C (AGM) |
| 12/01/2028 | 5.000% | | 3,000,000 | 3,428,940 |
| Oakland Redevelopment Successor Agency |
| Subordinated Refunding Tax Allocation Bonds |
| Series 2013 |
| 09/01/2022 | 5.000% | | 2,000,000 | 2,222,180 |
| Palm Desert Redevelopment Agency |
| Refunding Tax Allocation Bonds |
| Series 2017A (BAM) |
| 10/01/2029 | 5.000% | | 890,000 | 1,048,100 |
| 10/01/2030 | 5.000% | | 350,000 | 410,060 |
| Poway Unified School District |
| Special Tax Bonds |
| Community Facilities District No. 6-4S Ranch |
| Series 2012 |
| 09/01/2028 | 5.000% | | 1,770,000 | 1,918,680 |
| 09/01/2029 | 5.000% | | 1,200,000 | 1,296,732 |
| Poway Unified School District Public Financing Authority |
| Special Tax Refunding Bonds |
| Series 2015B |
| 09/01/2026 | 5.000% | | 995,000 | 1,148,389 |
| Rancho Cucamonga Redevelopment Agency Successor Agency |
| Tax Allocation Bonds |
| Rancho Redevelopment Project Area |
| Series 2014 |
| 09/01/2030 | 5.000% | | 700,000 | 792,218 |
| Series 2014 (AGM) |
| 09/01/2027 | 5.000% | | 2,200,000 | 2,514,578 |
| Riverside County Public Financing Authority |
| Tax Allocation Bonds |
| Project Area #1-Desert Communities |
| Series 2016 (BAM) |
| 10/01/2031 | 4.000% | | 2,500,000 | 2,619,225 |
| San Francisco City & County Redevelopment Agency |
| Refunding Tax Allocation Bonds |
| Mission Bay North Redevelopment Project |
| Series 2016 |
| 08/01/2030 | 5.000% | | 275,000 | 319,487 |
| 08/01/2031 | 5.000% | | 355,000 | 410,728 |
| Mission Bay South Redevelopment Project |
| Series 2016 |
| 08/01/2031 | 5.000% | | 670,000 | 771,987 |
| 08/01/2032 | 5.000% | | 580,000 | 665,080 |
| Tax Allocation Bonds |
| Mission Bay South Redevelopment Project |
| Series 2014A |
| 08/01/2029 | 5.000% | | 225,000 | 255,944 |
| 08/01/2030 | 5.000% | | 175,000 | 198,744 |
The accompanying Notes to Financial Statements are an integral part of this statement.
| 14 | Columbia AMT-Free California Intermediate Muni Bond Fund | Annual Report 2018 |
Portfolio of Investments (continued)
April 30, 2018
| Municipal Bonds (continued) |
| Issue Description | Coupon
Rate | | Principal
Amount ($) | Value ($) |
| San Mateo Redevelopment Agency Successor Agency |
| Refunding Tax Allocation Bonds |
| Series 2015A |
| 08/01/2028 | 5.000% | | 1,860,000 | 2,101,893 |
| 08/01/2029 | 5.000% | | 1,000,000 | 1,125,890 |
| Semitropic Improvement District |
| Refunding Revenue Bonds |
| Series 2015A 2nd Lien (AGM) |
| 12/01/2023 | 5.000% | | 300,000 | 343,203 |
| 12/01/2024 | 5.000% | | 400,000 | 464,008 |
| Sulphur Springs Union School District |
| Unrefunded Special Tax Bonds |
| Community Facilities District |
| Series 2012 |
| 09/01/2028 | 5.000% | | 530,000 | 569,602 |
| 09/01/2029 | 5.000% | | 595,000 | 638,465 |
| Tustin Community Facilities District |
| Refunding Special Tax Bonds |
| Legacy Villages of Columbus #06-1 |
| Series 2015 |
| 09/01/2029 | 5.000% | | 1,200,000 | 1,360,212 |
| Tustin Community Redevelopment Agency Successor Agency |
| Refunding Tax Allocation Bonds |
| Series 2016 |
| 09/01/2032 | 4.000% | | 2,295,000 | 2,421,363 |
| Vista Redevelopment Agency Successor Agency |
| Tax Allocation Refunding Bonds |
| Series 2015B1 (AGM) |
| 09/01/2024 | 5.000% | | 580,000 | 666,588 |
| 09/01/2026 | 5.000% | | 700,000 | 806,904 |
| Total | 59,232,946 |
| State Appropriated 3.8% |
| California State Public Works Board |
| Refunding Revenue Bonds |
| Various Capital Projects |
| Series 2012G |
| 11/01/2028 | 5.000% | | 1,500,000 | 1,672,770 |
| Revenue Bonds |
| Department of Corrections and Rehabilitation |
| Series 2014C |
| 10/01/2022 | 5.000% | | 1,925,000 | 2,149,647 |
| Series 2015A |
| 06/01/2028 | 5.000% | | 1,175,000 | 1,353,812 |
| Various Capital Projects |
| Series 2011A |
| 10/01/2020 | 5.000% | | 2,000,000 | 2,143,120 |
| Series 2013I |
| 11/01/2028 | 5.250% | | 3,000,000 | 3,431,220 |
| Series 2014E |
| 09/01/2030 | 5.000% | | 1,500,000 | 1,693,875 |
| Municipal Bonds (continued) |
| Issue Description | Coupon
Rate | | Principal
Amount ($) | Value ($) |
| Various Correctional Facilities |
| Series 2014A |
| 09/01/2031 | 5.000% | | 3,000,000 | 3,378,480 |
| Total | 15,822,924 |
| State General Obligation 4.0% |
| State of California |
| Unlimited General Obligation Bonds |
| Series 2010 |
| 11/01/2024 | 5.000% | | 5,000,000 | 5,364,900 |
| Various Purpose |
| Series 2009 |
| 04/01/2026 | 5.625% | | 2,000,000 | 2,069,360 |
| 10/01/2029 | 5.250% | | 1,500,000 | 1,572,120 |
| Series 2011 |
| 10/01/2019 | 5.000% | | 4,000,000 | 4,180,120 |
| Unlimited General Obligation Refunding Bonds |
| Series 2014 |
| 08/01/2032 | 5.000% | | 3,000,000 | 3,412,590 |
| Total | 16,599,090 |
| Tobacco 3.0% |
| Golden State Tobacco Securitization Corp. |
| Asset-Backed Refunding Revenue Bonds |
| Series 2015A |
| 06/01/2033 | 5.000% | | 4,000,000 | 4,495,960 |
| Refunding Revenue Bonds |
| Series 2017A-1 |
| 06/01/2024 | 5.000% | | 4,000,000 | 4,510,240 |
| Series 2018A |
| 06/01/2022 | 5.000% | | 3,000,000 | 3,311,250 |
| Total | 12,317,450 |
| Turnpike / Bridge / Toll Road 2.0% |
| Bay Area Toll Authority |
| Refunding Revenue Bonds |
| Subordinated Series 2017 |
| 04/01/2031 | 4.000% | | 2,000,000 | 2,150,520 |
| Foothill-Eastern Transportation Corridor Agency(e) |
| Refunding Revenue Bonds |
| Series 2015 |
| 01/15/2033 | 0.000% | | 5,000,000 | 2,671,050 |
| Foothill-Eastern Transportation Corridor Agency |
| Subordinated Refunding Revenue Bonds |
| Series 2014B-3 |
| 01/15/2053 | 5.500% | | 3,000,000 | 3,364,470 |
| Total | 8,186,040 |
The accompanying Notes to Financial Statements are an integral part of this statement.
Columbia AMT-Free California Intermediate Muni Bond Fund | Annual Report 2018
| 15 |
Portfolio of Investments (continued)
April 30, 2018
| Municipal Bonds (continued) |
| Issue Description | Coupon
Rate | | Principal
Amount ($) | Value ($) |
| Water & Sewer 5.7% |
| Central Coast Water Authority |
| Refunding Revenue Bonds |
| State Water Project Regional Facilities |
| Series 2016 |
| 10/01/2021 | 5.000% | | 5,000,000 | 5,476,900 |
| City of Fresno Sewer System |
| Revenue Bonds |
| Series 2008A |
| 09/01/2023 | 5.000% | | 1,000,000 | 1,010,930 |
| City of Tulare Sewer |
| Refunding Revenue Bonds |
| Series 2015 (AGM) |
| 11/15/2025 | 5.000% | | 700,000 | 821,093 |
| 11/15/2026 | 5.000% | | 1,000,000 | 1,167,750 |
| Kern County Water Agency Improvement District No. 4 |
| Refunding Revenue Bonds |
| Series 2016A (AGM) |
| 05/01/2027 | 5.000% | | 2,300,000 | 2,714,460 |
| Livermore Valley Water Financing Authority |
| Refunding Revenue Bonds |
| Series 2018A |
| 07/01/2034 | 4.000% | | 920,000 | 971,281 |
| Los Angeles County Sanitation Districts Financing Authority |
| Subordinated Refunding Revenue Bonds |
| Capital Projects - District #14 |
| Series 2015 |
| 10/01/2024 | 5.000% | | 1,050,000 | 1,220,184 |
| 10/01/2025 | 5.000% | | 1,100,000 | 1,300,541 |
| Oxnard Financing Authority |
| Revenue Bonds |
| Project |
| Series 2006 |
| 06/01/2031 | 5.000% | | 4,315,000 | 4,323,241 |
| Municipal Bonds (continued) |
| Issue Description | Coupon
Rate | | Principal
Amount ($) | Value ($) |
| Semitropic Improvement District |
| Refunding Revenue Bonds |
| Series 2012A |
| 12/01/2023 | 5.000% | | 2,850,000 | 3,190,575 |
| Stockton Public Financing Authority |
| Refunding Revenue Bonds |
| Series 2014 (BAM) |
| 09/01/2028 | 5.000% | | 1,500,000 | 1,703,205 |
| Total | 23,900,160 |
Total Municipal Bonds
(Cost $389,960,192) | 401,376,465 |
| Money Market Funds 0.6% |
| | Shares | Value ($) |
| Dreyfus Tax-Exempt Cash Management Fund, Institutional Shares, 1.450%(f) | 2,375,524 | 2,375,524 |
Total Money Market Funds
(Cost $2,375,524) | 2,375,524 |
Total Investments in Securities
(Cost: $395,335,716) | 406,751,989 |
| Other Assets & Liabilities, Net | | 9,712,229 |
| Net Assets | 416,464,218 |
Notes to Portfolio of Investments
| (a) | The Fund is entitled to receive principal and interest from the guarantor after a day or a week’s notice or upon maturity. The maturity date disclosed represents the final maturity. |
| (b) | Represents a variable rate security where the coupon rate adjusts on specified dates (generally daily or weekly) using the prevailing money market rate. The interest rate shown was the current rate as of April 30, 2018. |
| (c) | Represents a security purchased on a when-issued basis. |
| (d) | Represents privately placed and other securities and instruments exempt from SEC registration (collectively, private placements), such as Section 4(a)(2) and Rule 144A eligible securities, which are often sold only to qualified institutional buyers. The Fund may invest in private placements determined to be liquid as well as those determined to be illiquid. Private placements may be determined to be liquid under guidelines established by the Fund’s Board of Trustees. At April 30, 2018, the value of these securities amounted to $17,893,000, which represents 4.30% of net assets. |
| (e) | Zero coupon bond. |
| (f) | The rate shown is the seven-day current annualized yield at April 30, 2018. |
The accompanying Notes to Financial Statements are an integral part of this statement.
| 16 | Columbia AMT-Free California Intermediate Muni Bond Fund | Annual Report 2018 |
Portfolio of Investments (continued)
April 30, 2018
Abbreviation Legend
| AGM | Assured Guaranty Municipal Corporation |
| AMBAC | Ambac Assurance Corporation |
| BAM | Build America Mutual Assurance Co. |
| BAN | Bond Anticipation Note |
| NPFGC | National Public Finance Guarantee Corporation |
Fair value measurements
The Fund categorizes its fair value measurements according to a three-level hierarchy that maximizes the use of observable inputs and minimizes the use of unobservable inputs by prioritizing that the most observable input be used when available. Observable inputs are those that market participants would use in pricing an investment based on market data obtained from sources independent of the reporting entity. Unobservable inputs are those that reflect the Fund’s assumptions about the information market participants would use in pricing an investment. An investment’s level within the fair value hierarchy is based on the lowest level of any input that is deemed significant to the asset’s or liability’s fair value measurement. The input levels are not necessarily an indication of the risk or liquidity associated with investments at that level. For example, certain U.S. government securities are generally high quality and liquid, however, they are reflected as Level 2 because the inputs used to determine fair value may not always be quoted prices in an active market.
Fair value inputs are summarized in the three broad levels listed below:
| ■ | Level 1 — Valuations based on quoted prices for investments in active markets that the Fund has the ability to access at the measurement date. Valuation adjustments are not applied to Level 1 investments. |
| ■ | Level 2 — Valuations based on other significant observable inputs (including quoted prices for similar securities, interest rates, prepayment speeds, credit risks, etc.). |
| ■ | Level 3 — Valuations based on significant unobservable inputs (including the Fund’s own assumptions and judgment in determining the fair value of investments). |
Inputs that are used in determining fair value of an investment may include price information, credit data, volatility statistics, and other factors. These inputs can be either observable or unobservable. The availability of observable inputs can vary between investments, and is affected by various factors such as the type of investment, and the volume and level of activity for that investment or similar investments in the marketplace. The inputs will be considered by the Investment Manager, along with any other relevant factors in the calculation of an investment’s fair value. The Fund uses prices and inputs that are current as of the measurement date, which may include periods of market dislocations. During these periods, the availability of prices and inputs may be reduced for many investments. This condition could cause an investment to be reclassified between the various levels within the hierarchy.
Investments falling into the Level 3 category are primarily supported by quoted prices from brokers and dealers participating in the market for those investments. However, these may be classified as Level 3 investments due to lack of market transparency and corroboration to support these quoted prices. Additionally, valuation models may be used as the pricing source for any remaining investments classified as Level 3. These models may rely on one or more significant unobservable inputs and/or significant assumptions by the Investment Manager. Inputs used in valuations may include, but are not limited to, financial statement analysis, capital account balances, discount rates and estimated cash flows, and comparable company data.
Under the direction of the Fund’s Board of Trustees (the Board), the Investment Manager’s Valuation Committee (the Committee) is responsible for overseeing the valuation procedures approved by the Board. The Committee consists of voting and non-voting members from various groups within the Investment Manager’s organization, including operations and accounting, trading and investments, compliance, risk management and legal.
The Committee meets at least monthly to review and approve valuation matters, which may include a description of specific valuation determinations, data regarding pricing information received from approved pricing vendors and brokers and the results of Board-approved valuation control policies and procedures (the Policies). The Policies address, among other things, instances when market quotations are or are not readily available, including recommendations of third party pricing vendors and a determination of appropriate pricing methodologies; events that require specific valuation determinations and assessment of fair value techniques; securities with a potential for stale pricing, including those that are illiquid, restricted, or in default; and the effectiveness of third party pricing vendors, including periodic reviews of vendors. The Committee meets more frequently, as needed, to discuss additional valuation matters, which may include the need to review back-testing results, review time-sensitive information or approve related valuation actions. The Committee reports to the Board, with members of the Committee meeting with the Board at each of its regularly scheduled meetings to discuss valuation matters and actions during the period, similar to those described earlier.
For investments categorized as Level 3, the Committee monitors information similar to that described above, which may include: (i) data specific to the issuer or comparable issuers, (ii) general market or specific sector news and (iii) quoted prices and specific or similar security transactions. The Committee considers this data and any changes from prior periods in order to assess the reasonableness of observable and unobservable inputs, any assumptions or internal models used to value those securities and changes in fair value. This data is also used to corroborate, when available, information received from approved pricing vendors and brokers. Various factors impact the frequency of monitoring this information (which may occur as often as daily). However, the Committee may determine that changes to inputs, assumptions and models are not required as a result of the monitoring procedures performed.
The following table is a summary of the inputs used to value the Fund’s investments at April 30, 2018:
| | Level 1
quoted prices in active
markets for identical
assets ($) | Level 2
other significant
observable inputs ($) | Level 3
significant
unobservable inputs ($) | Total ($) |
| Investments in Securities | | | | |
| Floating Rate Notes | — | 3,000,000 | — | 3,000,000 |
| Municipal Bonds | — | 401,376,465 | — | 401,376,465 |
| Money Market Funds | 2,375,524 | — | — | 2,375,524 |
| Total Investments in Securities | 2,375,524 | 404,376,465 | — | 406,751,989 |
See the Portfolio of Investments for all investment classifications not indicated in the table.
The accompanying Notes to Financial Statements are an integral part of this statement.
Columbia AMT-Free California Intermediate Muni Bond Fund | Annual Report 2018
| 17 |
Portfolio of Investments (continued)
April 30, 2018
Fair value measurements (continued)
The Fund’s assets assigned to the Level 2 input category are generally valued using the market approach, in which a security’s value is determined through reference to prices and information from market transactions for similar or identical assets.
There were no transfers of financial assets between levels during the period.
The accompanying Notes to Financial Statements are an integral part of this statement.
| 18 | Columbia AMT-Free California Intermediate Muni Bond Fund | Annual Report 2018 |
Statement of Assets and Liabilities
April 30, 2018
| Assets | |
| Investments in securities, at value | |
| Unaffiliated issuers (cost $395,335,716) | $406,751,989 |
| Cash | 3,035,336 |
| Receivable for: | |
| Investments sold | 4,209,218 |
| Capital shares sold | 515,341 |
| Interest | 4,763,230 |
| Expense reimbursement due from Investment Manager | 4,741 |
| Prepaid expenses | 788 |
| Total assets | 419,280,643 |
| Liabilities | |
| Payable for: | |
| Investments purchased on a delayed delivery basis | 1,163,530 |
| Capital shares purchased | 481,607 |
| Distributions to shareholders | 981,590 |
| Management services fees | 16,009 |
| Distribution and/or service fees | 1,664 |
| Transfer agent fees | 49,945 |
| Compensation of board members | 82,458 |
| Other expenses | 39,622 |
| Total liabilities | 2,816,425 |
| Net assets applicable to outstanding capital stock | $416,464,218 |
| Represented by | |
| Paid in capital | 409,845,537 |
| Excess of distributions over net investment income | (51,885) |
| Accumulated net realized loss | (4,745,707) |
| Unrealized appreciation (depreciation) on: | |
| Investments - unaffiliated issuers | 11,416,273 |
| Total - representing net assets applicable to outstanding capital stock | $416,464,218 |
| Class A | |
| Net assets | $27,340,775 |
| Shares outstanding | 2,672,511 |
| Net asset value per share | $10.23 |
| Maximum sales charge | 3.00% |
| Maximum offering price per share (calculated by dividing the net asset value per share by 1.0 minus the maximum sales charge for Class A shares) | $10.55 |
| Advisor Class | |
| Net assets | $1,931,116 |
| Shares outstanding | 189,258 |
| Net asset value per share | $10.20 |
| Class C | |
| Net assets | $13,507,665 |
| Shares outstanding | 1,321,145 |
| Net asset value per share | $10.22 |
| Institutional Class | |
| Net assets | $365,455,486 |
| Shares outstanding | 35,804,511 |
| Net asset value per share | $10.21 |
| Institutional 2 Class | |
| Net assets | $7,363,089 |
| Shares outstanding | 723,300 |
| Net asset value per share | $10.18 |
| Institutional 3 Class | |
| Net assets | $866,087 |
| Shares outstanding | 84,897 |
| Net asset value per share | $10.20 |
The accompanying Notes to Financial Statements are an integral part of this statement.
Columbia AMT-Free California Intermediate Muni Bond Fund | Annual Report 2018
| 19 |
Statement of Operations
Year Ended April 30, 2018
| Net investment income | |
| Income: | |
| Dividends — unaffiliated issuers | $21,845 |
| Interest | 14,084,483 |
| Total income | 14,106,328 |
| Expenses: | |
| Management services fees | 2,008,129 |
| Distribution and/or service fees | |
| Class A | 75,758 |
| Class B | 28 |
| Class C | 143,095 |
| Transfer agent fees | |
| Class A | 40,037 |
| Advisor Class | 1,711 |
| Class B | 4 |
| Class C | 18,950 |
| Institutional Class | 497,143 |
| Institutional 2 Class | 3,951 |
| Institutional 3 Class | 104 |
| Compensation of board members | 25,289 |
| Custodian fees | 3,870 |
| Printing and postage fees | 15,294 |
| Registration fees | 15,849 |
| Audit fees | 32,083 |
| Legal fees | 10,834 |
| Compensation of chief compliance officer | 88 |
| Other | 16,371 |
| Total expenses | 2,908,588 |
| Fees waived or expenses reimbursed by Investment Manager and its affiliates | (605,380) |
| Expense reduction | (40) |
| Total net expenses | 2,303,168 |
| Net investment income | 11,803,160 |
| Realized and unrealized gain (loss) — net | |
| Net realized gain (loss) on: | |
| Investments — unaffiliated issuers | 306,351 |
| Net realized gain | 306,351 |
| Net change in unrealized appreciation (depreciation) on: | |
| Investments — unaffiliated issuers | (6,764,353) |
| Net change in unrealized appreciation (depreciation) | (6,764,353) |
| Net realized and unrealized loss | (6,458,002) |
| Net increase in net assets resulting from operations | $5,345,158 |
The accompanying Notes to Financial Statements are an integral part of this statement.
| 20 | Columbia AMT-Free California Intermediate Muni Bond Fund | Annual Report 2018 |
Statement of Changes in Net Assets
| | Year Ended
April 30, 2018 | Year Ended
April 30, 2017 (a) |
| Operations | | |
| Net investment income | $11,803,160 | $11,965,545 |
| Net realized gain (loss) | 306,351 | (2,186,554) |
| Net change in unrealized appreciation (depreciation) | (6,764,353) | (14,158,354) |
| Net increase (decrease) in net assets resulting from operations | 5,345,158 | (4,379,363) |
| Distributions to shareholders | | |
| Net investment income | | |
| Class A | (768,273) | (1,113,563) |
| Advisor Class | (36,558) | (26,762) |
| Class B | (48) | (176) |
| Class C | (255,849) | (266,249) |
| Institutional Class | (10,485,055) | (10,409,826) |
| Institutional 2 Class | (177,401) | (180,405) |
| Institutional 3 Class | (15,152) | (48) |
| Total distributions to shareholders | (11,738,336) | (11,997,029) |
| Decrease in net assets from capital stock activity | (839,608) | (9,272,164) |
| Total decrease in net assets | (7,232,786) | (25,648,556) |
| Net assets at beginning of year | 423,697,004 | 449,345,560 |
| Net assets at end of year | $416,464,218 | $423,697,004 |
| Excess of distributions over net investment income | $(51,885) | $(116,638) |
| (a) | Institutional 3 Class shares are based on operations from March 1, 2017 (commencement of operations) through the stated period end. |
The accompanying Notes to Financial Statements are an integral part of this statement.
Columbia AMT-Free California Intermediate Muni Bond Fund | Annual Report 2018
| 21 |
Statement of Changes in Net Assets (continued)
| | Year Ended | Year Ended |
| | April 30, 2018 | April 30, 2017 (a) |
| | Shares | Dollars ($) | Shares | Dollars ($) |
| Capital stock activity |
| Class A | | | | |
| Subscriptions | 568,644 | 5,932,350 | 1,293,645 | 13,645,417 |
| Distributions reinvested | 63,662 | 663,365 | 95,492 | 1,006,884 |
| Redemptions | (971,417) | (10,117,936) | (3,215,071) | (33,515,366) |
| Net decrease | (339,111) | (3,522,221) | (1,825,934) | (18,863,065) |
| Advisor Class | | | | |
| Subscriptions | 131,476 | 1,369,845 | 78,182 | 818,869 |
| Distributions reinvested | 3,502 | 36,274 | 2,481 | 26,069 |
| Redemptions | (32,922) | (342,003) | (129,751) | (1,374,685) |
| Net increase (decrease) | 102,056 | 1,064,116 | (49,088) | (529,747) |
| Class B | | | | |
| Redemptions | (971) | (10,245) | — | — |
| Net decrease | (971) | (10,245) | — | — |
| Class C | | | | |
| Subscriptions | 188,393 | 1,963,830 | 478,387 | 5,070,896 |
| Distributions reinvested | 18,690 | 194,585 | 17,722 | 186,202 |
| Redemptions | (379,798) | (3,963,125) | (360,032) | (3,775,035) |
| Net increase (decrease) | (172,715) | (1,804,710) | 136,077 | 1,482,063 |
| Institutional Class | | | | |
| Subscriptions | 7,019,542 | 73,010,509 | 15,057,323 | 157,857,698 |
| Distributions reinvested | 203,148 | 2,109,952 | 184,865 | 1,945,719 |
| Redemptions | (7,240,569) | (75,190,123) | (14,814,871) | (153,667,563) |
| Net increase (decrease) | (17,879) | (69,662) | 427,317 | 6,135,854 |
| Institutional 2 Class | | | | |
| Subscriptions | 324,509 | 3,368,093 | 1,190,985 | 12,589,515 |
| Distributions reinvested | 17,102 | 177,111 | 17,337 | 180,117 |
| Redemptions | (89,403) | (924,442) | (1,002,463) | (10,276,901) |
| Net increase | 252,208 | 2,620,762 | 205,859 | 2,492,731 |
| Institutional 3 Class | | | | |
| Subscriptions | 86,753 | 911,412 | 974 | 10,000 |
| Distributions reinvested | 1,437 | 14,857 | — | — |
| Redemptions | (4,267) | (43,917) | — | — |
| Net increase | 83,923 | 882,352 | 974 | 10,000 |
| Total net decrease | (92,489) | (839,608) | (1,104,795) | (9,272,164) |
| (a) | Institutional 3 Class shares are based on operations from March 1, 2017 (commencement of operations) through the stated period end. |
The accompanying Notes to Financial Statements are an integral part of this statement.
| 22 | Columbia AMT-Free California Intermediate Muni Bond Fund | Annual Report 2018 |
[THIS PAGE INTENTIONALLY LEFT BLANK]
Columbia AMT-Free California Intermediate Muni Bond Fund | Annual Report 2018
| 23 |
The following table is intended to help you understand the Fund’s financial performance. Certain information reflects financial results for a single share of a class held for the periods shown. Per share net investment income (loss) amounts are calculated based on average shares outstanding during the period. Total return assumes reinvestment of all dividends and distributions, if any. Total return does not reflect payment of sales charges, if any. Total return and portfolio turnover are not annualized for periods of less than one year. The portfolio turnover rate is calculated without regard to purchase and sales transactions of short-term instruments and certain derivatives, if any. If such transactions were included, the Fund’s portfolio turnover rate may be higher.
| | Net asset value,
beginning of
period | Net
investment
income | Net
realized
and
unrealized
gain (loss) | Total from
investment
operations | Distributions
from net
investment
income |
| Class A |
| Year Ended 4/30/2018 | $10.38 | 0.27 | (0.15) | 0.12 | (0.27) |
| Year Ended 4/30/2017 | $10.72 | 0.26 | (0.34) | (0.08) | (0.26) |
| Year Ended 4/30/2016 | $10.50 | 0.27 | 0.22 | 0.49 | (0.27) |
| Year Ended 4/30/2015 | $10.42 | 0.29 | 0.08 | 0.37 | (0.29) |
| Year Ended 4/30/2014 | $10.68 | 0.32 | (0.26) | 0.06 | (0.32) |
| Advisor Class |
| Year Ended 4/30/2018 | $10.36 | 0.29 | (0.16) | 0.13 | (0.29) |
| Year Ended 4/30/2017 | $10.69 | 0.29 | (0.33) | (0.04) | (0.29) |
| Year Ended 4/30/2016 | $10.46 | 0.29 | 0.24 | 0.53 | (0.30) |
| Year Ended 4/30/2015 | $10.39 | 0.32 | 0.07 | 0.39 | (0.32) |
| Year Ended 4/30/2014 | $10.64 | 0.34 | (0.25) | 0.09 | (0.34) |
| Class C |
| Year Ended 4/30/2018 | $10.38 | 0.19 | (0.16) | 0.03 | (0.19) |
| Year Ended 4/30/2017 | $10.72 | 0.18 | (0.34) | (0.16) | (0.18) |
| Year Ended 4/30/2016 | $10.49 | 0.19 | 0.23 | 0.42 | (0.19) |
| Year Ended 4/30/2015 | $10.42 | 0.21 | 0.07 | 0.28 | (0.21) |
| Year Ended 4/30/2014 | $10.67 | 0.24 | (0.25) | (0.01) | (0.24) |
| Institutional Class |
| Year Ended 4/30/2018 | $10.36 | 0.29 | (0.15) | 0.14 | (0.29) |
| Year Ended 4/30/2017 | $10.70 | 0.28 | (0.33) | (0.05) | (0.29) |
| Year Ended 4/30/2016 | $10.47 | 0.30 | 0.23 | 0.53 | (0.30) |
| Year Ended 4/30/2015 | $10.40 | 0.32 | 0.07 | 0.39 | (0.32) |
| Year Ended 4/30/2014 | $10.65 | 0.34 | (0.25) | 0.09 | (0.34) |
| Institutional 2 Class |
| Year Ended 4/30/2018 | $10.33 | 0.30 | (0.15) | 0.15 | (0.30) |
| Year Ended 4/30/2017 | $10.67 | 0.29 | (0.34) | (0.05) | (0.29) |
| Year Ended 4/30/2016 | $10.44 | 0.31 | 0.23 | 0.54 | (0.31) |
| Year Ended 4/30/2015 | $10.37 | 0.32 | 0.08 | 0.40 | (0.33) |
| Year Ended 4/30/2014 | $10.63 | 0.35 | (0.26) | 0.09 | (0.35) |
The accompanying Notes to Financial Statements are an integral part of this statement.
| 24 | Columbia AMT-Free California Intermediate Muni Bond Fund | Annual Report 2018 |
Total
distributions to
shareholders | Net
asset
value,
end of
period | Total
return | Total gross
expense
ratio to
average
net assets(a) | Total net
expense
ratio to
average
net assets(a),(b) | Net investment
income
ratio to
average
net assets | Portfolio
turnover | Net
assets,
end of
period
(000’s) |
| |
| (0.27) | $10.23 | 1.10% | 0.88% | 0.74% (c) | 2.56% | 5% | $27,341 |
| (0.26) | $10.38 | (0.75%) | 0.92% | 0.74% (c) | 2.45% | 17% | $31,273 |
| (0.27) | $10.72 | 4.76% | 0.94% | 0.74% (c) | 2.58% | 8% | $51,869 |
| (0.29) | $10.50 | 3.60% | 0.95% | 0.74% (c) | 2.76% | 6% | $47,317 |
| (0.32) | $10.42 | 0.64% | 0.96% | 0.74% (c) | 3.10% | 12% | $33,140 |
| |
| (0.29) | $10.20 | 1.25% | 0.63% | 0.49% (c) | 2.83% | 5% | $1,931 |
| (0.29) | $10.36 | (0.42%) | 0.67% | 0.49% (c) | 2.71% | 17% | $903 |
| (0.30) | $10.69 | 5.13% | 0.69% | 0.49% (c) | 2.81% | 8% | $1,457 |
| (0.32) | $10.46 | 3.76% | 0.70% | 0.49% (c) | 3.02% | 6% | $529 |
| (0.34) | $10.39 | 0.98% | 0.70% | 0.49% (c) | 3.46% | 12% | $52 |
| |
| (0.19) | $10.22 | 0.25% | 1.63% | 1.49% (c) | 1.81% | 5% | $13,508 |
| (0.18) | $10.38 | (1.49%) | 1.67% | 1.49% (c) | 1.71% | 17% | $15,503 |
| (0.19) | $10.72 | 4.08% | 1.69% | 1.49% (c) | 1.83% | 8% | $14,549 |
| (0.21) | $10.49 | 2.72% | 1.70% | 1.49% (c) | 2.01% | 6% | $12,965 |
| (0.24) | $10.42 | (0.02%) | 1.71% | 1.49% (c) | 2.35% | 12% | $9,253 |
| |
| (0.29) | $10.21 | 1.35% | 0.63% | 0.49% (c) | 2.82% | 5% | $365,455 |
| (0.29) | $10.36 | (0.51%) | 0.67% | 0.49% (c) | 2.71% | 17% | $371,130 |
| (0.30) | $10.70 | 5.12% | 0.69% | 0.49% (c) | 2.83% | 8% | $378,630 |
| (0.32) | $10.47 | 3.76% | 0.70% | 0.49% (c) | 3.02% | 6% | $329,535 |
| (0.34) | $10.40 | 0.98% | 0.71% | 0.49% (c) | 3.35% | 12% | $260,101 |
| |
| (0.30) | $10.18 | 1.42% | 0.56% | 0.42% | 2.89% | 5% | $7,363 |
| (0.29) | $10.33 | (0.42%) | 0.55% | 0.41% | 2.80% | 17% | $4,867 |
| (0.31) | $10.67 | 5.23% | 0.55% | 0.39% | 2.93% | 8% | $2,829 |
| (0.33) | $10.44 | 3.85% | 0.55% | 0.40% | 3.09% | 6% | $1,738 |
| (0.35) | $10.37 | 0.98% | 0.58% | 0.40% | 3.47% | 12% | $341 |
Columbia AMT-Free California Intermediate Muni Bond Fund | Annual Report 2018
| 25 |
Financial Highlights (continued)
| | Net asset value,
beginning of
period | Net
investment
income | Net
realized
and
unrealized
gain (loss) | Total from
investment
operations | Distributions
from net
investment
income |
| Institutional 3 Class |
| Year Ended 4/30/2018 | $10.35 | 0.30 | (0.15) | 0.15 | (0.30) |
| Year Ended 4/30/2017(d) | $10.27 | 0.05 | 0.08 | 0.13 | (0.05) |
| Notes to Financial Highlights |
| (a) | In addition to the fees and expenses that the Fund bears directly, the Fund indirectly bears a pro rata share of the fees and expenses of any other funds in which it invests. Such indirect expenses are not included in the Fund’s reported expense ratios. |
| (b) | Total net expenses include the impact of certain fee waivers/expense reimbursements made by the Investment Manager and certain of its affiliates, if applicable. |
| (c) | The benefits derived from expense reductions had an impact of less than 0.01%. |
| (d) | Institutional 3 Class shares commenced operations on March 1, 2017. Per share data and total return reflect activity from that date. |
| (e) | Annualized. |
The accompanying Notes to Financial Statements are an integral part of this statement.
| 26 | Columbia AMT-Free California Intermediate Muni Bond Fund | Annual Report 2018 |
Total
distributions to
shareholders | Net
asset
value,
end of
period | Total
return | Total gross
expense
ratio to
average
net assets(a) | Total net
expense
ratio to
average
net assets(a),(b) | Net investment
income
ratio to
average
net assets | Portfolio
turnover | Net
assets,
end of
period
(000’s) |
| |
| (0.30) | $10.20 | 1.46% | 0.52% | 0.38% | 2.95% | 5% | $866 |
| (0.05) | $10.35 | 1.27% | 0.52% (e) | 0.36% (e) | 2.98% (e) | 17% | $10 |
Columbia AMT-Free California Intermediate Muni Bond Fund | Annual Report 2018
| 27 |
Notes to Financial Statements
April 30, 2018
Note 1. Organization
Columbia AMT-Free California Intermediate Muni Bond Fund (the Fund), a series of Columbia Funds Series Trust (the Trust), is a diversified fund. The Trust is registered under the Investment Company Act of 1940, as amended (the 1940 Act), as an open-end management investment company organized as a Delaware statutory trust.
Fund shares
The Trust may issue an unlimited number of shares (without par value). Although all share classes generally have identical voting, dividend and liquidation rights, each share class votes separately when required by the Trust’s organizational documents or by law. Different share classes pay different distribution amounts to the extent the expenses of such share classes differ, and distributions in liquidation will be proportional to the net asset value of each share class. Each share class has its own expense and sales charge structure. The Fund offers each of the share classes identified below.
Class A shares are subject to a maximum front-end sales charge of 3.00% based on the initial investment amount. Class A shares purchased without an initial sales charge are subject to a contingent deferred sales charge (CDSC) of 0.75% on certain investments of $500,000 or more if redeemed within 12 months after purchase.
Advisor Class shares are not subject to sales charges and are generally available only to omnibus retirement plans and certain investors as described in the Fund’s prospectus. Prior to November 1, 2017, Advisor Class shares were known as Class R4 shares.
Class B shares of the Fund are no longer offered for sale. When available, Class B shares were subject to a maximum CDSC of 3.00% based upon the holding period after purchase. Effective July 17, 2017, Class B shares were automatically converted to Class A shares without a CDSC. On August 4, 2017, the capital owned by Columbia Management Investment Advisers, LLC in Class B shares was redeemed without a CDSC.
Class C shares are subject to a 1.00% CDSC on shares redeemed within 12 months after purchase.
Institutional Class shares are not subject to sales charges and are generally available only to eligible investors, which are subject to different investment minimums as described in the Fund’s prospectus. Prior to November 1, 2017, Institutional Class shares were known as Class Z shares.
Institutional 2 Class shares are not subject to sales charges and are generally available only to investors purchasing through authorized investment professionals and omnibus retirement plans as described in the Fund’s prospectus. Prior to November 1, 2017, Institutional 2 Class shares were known as Class R5 shares.
Institutional 3 Class shares are not subject to sales charges and are available to institutional and certain other investors as described in the Fund’s prospectus. Prior to November 1, 2017, Institutional 3 Class shares were known as Class Y shares.
Note 2. Summary of significant accounting policies
Basis of preparation
The Fund is an investment company that applies the accounting and reporting guidance in the Financial Accounting Standards Board (FASB) Accounting Standards Codification Topic 946, Financial Services - Investment Companies (ASC 946). The financial statements are prepared in accordance with U.S. generally accepted accounting principles (GAAP), which requires management to make certain estimates and assumptions that affect the reported amounts of assets and liabilities, the disclosure of contingent assets and liabilities at the date of the financial statements and the reported amounts of income and expenses during the reporting period. Actual results could differ from those estimates.
The following is a summary of significant accounting policies followed by the Fund in the preparation of its financial statements.
| 28 | Columbia AMT-Free California Intermediate Muni Bond Fund | Annual Report 2018 |
Notes to Financial Statements (continued)
April 30, 2018
Security valuation
Debt securities generally are valued by pricing services approved by the Board of Trustees based upon market transactions for normal, institutional-size trading units of similar securities. The services may use various pricing techniques that take into account, as applicable, factors such as yield, quality, coupon rate, maturity, type of issue, trading characteristics and other data, as well as approved independent broker-dealer quotes. Debt securities for which quotations are not readily available or not believed to be reflective of market value may also be valued based upon a bid quote from an approved independent broker-dealer. Debt securities maturing in 60 days or less are valued primarily at amortized cost value, unless this method results in a valuation that management believes does not approximate market value.
Investments in open-end investment companies, including money market funds, are valued at their latest net asset value.
Investments for which market quotations are not readily available, or that have quotations which management believes are not reflective of market value or reliable, are valued at fair value as determined in good faith under procedures approved by and under the general supervision of the Board of Trustees. If a security or class of securities (such as foreign securities) is valued at fair value, such value is likely to be different from the quoted or published price for the security.
The determination of fair value often requires significant judgment. To determine fair value, management may use assumptions including but not limited to future cash flows and estimated risk premiums. Multiple inputs from various sources may be used to determine fair value.
GAAP requires disclosure regarding the inputs and valuation techniques used to measure fair value and any changes in valuation inputs or techniques. In addition, investments shall be disclosed by major category. This information is disclosed following the Fund’s Portfolio of Investments.
Delayed delivery securities
The Fund may trade securities on other than normal settlement terms, including securities purchased or sold on a “when-issued” or "forward commitment" basis. This may increase risk to the Fund since the other party to the transaction may fail to deliver, which could cause the Fund to subsequently invest at less advantageous prices. The Fund designates cash or liquid securities in an amount equal to the delayed delivery commitment.
Security transactions
Security transactions are accounted for on the trade date. Cost is determined and gains (losses) are based upon the specific identification method for both financial statement and federal income tax purposes.
Income recognition
Interest income is recorded on an accrual basis. Market premiums and discounts, including original issue discounts, are amortized and accreted, respectively, over the expected life of the security on all debt securities, unless otherwise noted.
The Fund may place a debt security on non-accrual status and reduce related interest income when it becomes probable that the interest will not be collected and the amount of uncollectible interest can be reasonably estimated. A defaulted debt security is removed from non-accrual status when the issuer resumes interest payments or when collectibility of interest is reasonably assured.
Dividend income is recorded on the ex-dividend date.
Expenses
General expenses of the Trust are allocated to the Fund and other funds of the Trust based upon relative net assets or other expense allocation methodologies determined by the nature of the expense. Expenses directly attributable to the Fund are charged to the Fund. Expenses directly attributable to a specific class of shares are charged to that share class.
Columbia AMT-Free California Intermediate Muni Bond Fund | Annual Report 2018
| 29 |
Notes to Financial Statements (continued)
April 30, 2018
Determination of class net asset value
All income, expenses (other than class-specific expenses, which are charged to that share class, as shown in the Statement of Operations) and realized and unrealized gains (losses) are allocated to each class of the Fund on a daily basis, based on the relative net assets of each class, for purposes of determining the net asset value of each class.
Federal income tax status
The Fund intends to qualify each year as a regulated investment company under Subchapter M of the Internal Revenue Code, as amended, and will distribute substantially all of its net tax-exempt and investment company taxable income and net capital gain, if any, for its tax year, and as such will not be subject to federal income taxes. In addition, the Fund intends to distribute in each calendar year substantially all of its ordinary income, capital gain net income and certain other amounts, if any, such that the Fund should not be subject to federal excise tax. Therefore, no federal income or excise tax provision is recorded.
Distributions to shareholders
Distributions from net investment income, if any, are declared daily and paid monthly. Net realized capital gains, if any, are distributed at least annually. Income distributions and capital gain distributions are determined in accordance with federal income tax regulations, which may differ from GAAP.
Guarantees and indemnifications
Under the Trust’s organizational documents and, in some cases, by contract, its officers and trustees are indemnified against certain liabilities arising out of the performance of their duties to the Trust or its funds. In addition, certain of the Fund’s contracts with its service providers contain general indemnification clauses. The Fund’s maximum exposure under these arrangements is unknown since the amount of any future claims that may be made against the Fund cannot be determined, and the Fund has no historical basis for predicting the likelihood of any such claims.
Recent accounting pronouncement
Accounting Standards Update 2017-08 Premium Amortization on Purchased Callable Debt Securities
In March 2017, the Financial Accounting Standards Board issued Accounting Standards Update (ASU) No. 2017-08 Premium Amortization on Purchased Callable Debt Securities. ASU No. 2017-08 updates the accounting standards to shorten the amortization period for certain purchased callable debt securities, held at a premium, to be amortized to the earliest call date. The update applies to securities with explicit, noncontingent call features that are callable at fixed prices and on preset dates. The standard is effective for annual periods beginning after December 15, 2018 and interim periods within those fiscal years. At this time, management is evaluating the implication of this guidance and the impact it will have on the financial statement amounts and footnote disclosures, if any.
Note 3. Fees and other transactions with affiliates
Management services fees
The Fund has entered into a Management Agreement with Columbia Management Investment Advisers, LLC (the Investment Manager), a wholly-owned subsidiary of Ameriprise Financial, Inc. (Ameriprise Financial). Under the Management Agreement, the Investment Manager provides the Fund with investment research and advice, as well as administrative and accounting services. The management services fee is an annual fee that is equal to a percentage of the Fund’s daily net assets that declines from 0.47% to 0.31% as the Fund’s net assets increase. The effective management services fee rate for the year ended April 30, 2018 was 0.47% of the Fund’s average daily net assets.
Compensation of board members
Members of the Board of Trustees who are not officers or employees of the Investment Manager or Ameriprise Financial are compensated for their services to the Fund as disclosed in the Statement of Operations. Under a Deferred Compensation Plan (the Plan), these members of the Board of Trustees may elect to defer payment of up to 100% of their compensation. Deferred amounts are treated as though equivalent dollar amounts had been invested in shares of certain funds managed by
| 30 | Columbia AMT-Free California Intermediate Muni Bond Fund | Annual Report 2018 |
Notes to Financial Statements (continued)
April 30, 2018
the Investment Manager. The Fund’s liability for these amounts is adjusted for market value changes and remains in the Fund until distributed in accordance with the Plan. All amounts payable under the Plan constitute a general unsecured obligation of the Fund.
Compensation of Chief Compliance Officer
The Board of Trustees has appointed a Chief Compliance Officer to the Fund in accordance with federal securities regulations. As disclosed in the Statement of Operations, a portion of the Chief Compliance Officer’s total compensation is allocated to the Fund, along with other allocations to affiliated funds governed by the Board of Trustees, based on relative net assets.
Transactions with affiliates
For the year ended April 30, 2018, the Fund engaged in purchase and/or sale transactions with affiliates and/or accounts that have a common investment manager (or affiliated investment managers), common directors/trustees, and/or common officers. Those purchase and sale transactions complied with provisions of Rule 17a-7 under the 1940 Act and were $114,900 and $0, respectively.
Transfer agency fees
Under a Transfer and Dividend Disbursing Agent Agreement, Columbia Management Investment Services Corp. (the Transfer Agent), an affiliate of the Investment Manager and a wholly-owned subsidiary of Ameriprise Financial, is responsible for providing transfer agency services to the Fund. The Transfer Agent has contracted with DST Asset Manager Solutions, Inc. (DST) to serve as sub-transfer agent. The Transfer Agent pays the fees of DST for services as sub-transfer agent and DST is not entitled to reimbursement for such fees from the Fund (with the exception of out-of-pocket fees).
The Fund pays the Transfer Agent a monthly transfer agency fee based on the number or the average value of accounts, depending on the type of account. In addition, the Fund pays the Transfer Agent a fee for shareholder services based on the number of accounts or on a percentage of the average aggregate value of the Fund’s shares maintained in omnibus accounts up to the lesser of the amount charged by the financial intermediary or a cap established by the Board of Trustees from time to time.
The Transfer Agent also receives compensation from the Fund for various shareholder services and reimbursements for certain out-of-pocket fees. Effective August 1, 2017, total transfer agency fees for Institutional 2 Class and Institutional 3 Class shares are subject to an annual limitation of not more than 0.07% and 0.02%, respectively, of the average daily net assets attributable to each share class. Prior to August 1, 2017, these limitations were 0.075% for Institutional 2 Class shares and 0.025% for Institutional 3 Class shares.
For the year ended April 30, 2018, the Fund’s effective transfer agency fee rates as a percentage of average daily net assets of each class were as follows:
| | Effective rate (%) |
| Class A | 0.13 |
| Advisor Class | 0.13 |
| Class B | 0.04 (a) |
| Class C | 0.13 |
| Institutional Class | 0.13 |
| Institutional 2 Class | 0.06 |
| Institutional 3 Class | 0.02 |
An annual minimum account balance fee of $20 may apply to certain accounts with a value below the applicable share class’s initial minimum investment requirements to reduce the impact of small accounts on transfer agency fees. These minimum account balance fees are remitted to the Fund and recorded as part of expense reductions in the Statement of Operations. For the year ended April 30, 2018, these minimum account balance fees reduced total expenses of the Fund by $40.
Columbia AMT-Free California Intermediate Muni Bond Fund | Annual Report 2018
| 31 |
Notes to Financial Statements (continued)
April 30, 2018
Distribution and service fees
The Fund has entered into an agreement with Columbia Management Investment Distributors, Inc. (the Distributor), an affiliate of the Investment Manager and a wholly-owned subsidiary of Ameriprise Financial, for distribution and shareholder services. The Board of Trustees has approved, and the Fund has adopted, distribution and shareholder service plans (the Plans) applicable to certain share classes, which set the distribution and service fees for the Fund. These fees are calculated daily and are intended to compensate the Distributor and/or eligible selling and/or servicing agents for selling shares of the Fund and providing services to investors.
Under the Plans, the Fund pays a monthly combined distribution and service fee to the Distributor at the maximum annual rate of 0.25% of the average daily net assets attributable to Class A shares of the Fund. Also under the Plans, the Fund pays a monthly service fee to the Distributor at the maximum annual rate of 0.25% of the average daily net assets attributable to Class B and Class C shares of the Fund and a monthly distribution fee to the Distributor at the maximum annual rate of 0.75% of the average daily net assets attributable to Class B and Class C shares of the Fund. As a result of all Class B shares of the Fund being redeemed or converted to Class A shares, August 4, 2017 was the last day the Fund paid a distribution and service fee for Class B shares.
Sales charges (unaudited)
Sales charges, including front-end charges and CDSCs, received by the Distributor for distributing Fund shares for the year ended April 30, 2018, if any, are listed below:
| | Amount ($) |
| Class A | 20,671 |
| Class C | 2,359 |
Expenses waived/reimbursed by the Investment Manager and its affiliates
The Investment Manager and certain of its affiliates have contractually agreed to waive fees and/or reimburse expenses (excluding certain fees and expenses described below) for the period(s) disclosed below, unless sooner terminated at the sole discretion of the Board of Trustees, so that the Fund’s net operating expenses, after giving effect to fees waived/expenses reimbursed and any balance credits and/or overdraft charges from the Fund’s custodian, do not exceed the following annual rate(s) as a percentage of the class’ average daily net assets:
| | September 1, 2017
through
August 31, 2018 | Prior to
September 1, 2017 |
| Class A | 0.74% | 0.74% |
| Advisor Class | 0.49 | 0.49 |
| Class C | 1.49 | 1.49 |
| Institutional Class | 0.49 | 0.49 |
| Institutional 2 Class | 0.43 | 0.41 |
| Institutional 3 Class | 0.38 | 0.36 |
Under the agreement governing these fee waivers and/or expense reimbursement arrangements, the following fees and expenses are excluded from the waiver/reimbursement commitment, and therefore will be paid by the Fund, if applicable: taxes (including foreign transaction taxes), expenses associated with investments in affiliated and non-affiliated pooled investment vehicles (including mutual funds and exchange-traded funds), transaction costs and brokerage commissions, costs related to any securities lending program, dividend expenses associated with securities sold short, inverse floater program fees and expenses, transaction charges and interest on borrowed money, interest, infrequent and/or unusual expenses and any other expenses the exclusion of which is specifically approved by the Board of Trustees. This agreement may be modified or amended only with approval from the Investment Manager, certain of its affiliates and the Fund. Any fees waived and/or expenses reimbursed under the expense reimbursement arrangements described above are not recoverable by the Investment Manager or its affiliates in future periods.
| 32 | Columbia AMT-Free California Intermediate Muni Bond Fund | Annual Report 2018 |
Notes to Financial Statements (continued)
April 30, 2018
Note 4. Federal tax information
The timing and character of income and capital gain distributions are determined in accordance with income tax regulations, which may differ from GAAP because of temporary or permanent book to tax differences.
At April 30, 2018, these differences were primarily due to differing treatment for re-characterization of distributions for investments, capital loss carryforwards, trustees’ deferred compensation and distributions. To the extent these differences were permanent, reclassifications were made among the components of the Fund’s net assets in the Statement of Assets and Liabilities. Temporary differences do not require reclassifications.
In the Statement of Assets and Liabilities the following reclassifications were made:
Excess of distributions
over net investment
income ($) | Accumulated
net realized
(loss) ($) | Paid in
capital ($) |
| (71) | 71 | — |
Net investment income (loss) and net realized gains (losses), as disclosed in the Statement of Operations, and net assets were not affected by this reclassification.
The tax character of distributions paid during the years indicated was as follows:
| Year Ended April 30, 2018 | Year Ended April 30, 2017 |
Ordinary
income ($) | Tax-exempt
income ($) | Long-term
capital gains ($) | Total ($) | Ordinary
income ($) | Tax-exempt
income ($) | Long-term
capital gains ($) | Total ($) |
| 18,109 | 11,720,227 | — | 11,738,336 | 19,491 | 11,977,538 | — | 11,997,029 |
Short-term capital gain distributions, if any, are considered ordinary income distributions for tax purposes.
At April 30, 2018, the components of distributable earnings on a tax basis were as follows:
Undistributed
ordinary income ($) | Undistributed tax-
exempt income ($) | Undistributed
long-term
capital gains ($) | Capital loss
carryforwards ($) | Net unrealized
appreciation ($) |
| — | 1,010,774 | — | (4,745,707) | 11,416,273 |
At April 30, 2018, the cost of all investments for federal income tax purposes along with the aggregate gross unrealized appreciation and depreciation based on that cost was:
Federal
tax cost ($) | Gross unrealized
appreciation ($) | Gross unrealized
(depreciation) ($) | Net unrealized
appreciation ($) |
| 395,335,716 | 13,013,113 | (1,596,840) | 11,416,273 |
Tax cost of investments and unrealized appreciation/(depreciation) may also include timing differences that do not constitute adjustments to tax basis.
The following capital loss carryforwards, determined at April 30, 2018, may be available to reduce taxable income arising from future net realized gains on investments, if any, to the extent permitted by the Internal Revenue Code. Capital loss carryforwards with no expiration are required to be utilized prior to any capital losses which carry an expiration date. As a result of this ordering rule, capital loss carryforwards which carry an expiration date may be more likely to expire unused. In addition, for the year ended April 30, 2018, capital loss carryforwards utilized, expired unused and permanently lost, if any, were as follows:
| 2019 ($) | No expiration
short-term ($) | No expiration
long-term ($) | Total ($) | Utilized ($) | Expired ($) | Permanently
lost ($) |
| — | 4,745,707 | — | 4,745,707 | 306,422 | — | — |
Columbia AMT-Free California Intermediate Muni Bond Fund | Annual Report 2018
| 33 |
Notes to Financial Statements (continued)
April 30, 2018
Management of the Fund has concluded that there are no significant uncertain tax positions in the Fund that would require recognition in the financial statements. However, management’s conclusion may be subject to review and adjustment at a later date based on factors including, but not limited to, new tax laws, regulations, and administrative interpretations (including relevant court decisions). Generally, the Fund’s federal tax returns for the prior three fiscal years remain subject to examination by the Internal Revenue Service.
Note 5. Portfolio information
The cost of purchases and proceeds from sales of securities, excluding short-term investments and derivatives, if any, aggregated to $36,434,541 and $21,227,562, respectively, for the year ended April 30, 2018. The amount of purchase and sale activity impacts the portfolio turnover rate reported in the Financial Highlights.
Note 6. Line of credit
The Fund has access to a revolving credit facility with a syndicate of banks led by Citibank, N.A., HSBC Bank USA, N.A. and JPMorgan Chase Bank, N.A. whereby the Fund may borrow for the temporary funding of shareholder redemptions or for other temporary or emergency purposes. The credit facility, which is a collective agreement between the Fund and certain other funds managed by the Investment Manager, severally and not jointly, permits collective borrowings up to $1 billion. Interest is charged to each participating fund based on its borrowings at a rate equal to the higher of (i) the overnight federal funds rate plus 1.00% or (ii) the one-month LIBOR rate plus 1.00%. Each borrowing under the credit facility matures no later than 60 days after the date of borrowing. The Fund also pays a commitment fee equal to its pro rata share of the amount of the credit facility at a rate of 0.15% per annum. The commitment fee is included in other expenses in the Statement of Operations.
The Fund had no borrowings during the year ended April 30, 2018.
Note 7. Significant risks
Credit risk
Credit risk is the risk that the value of debt securities in the Fund’s portfolio may decline because the issuer may default and fail to pay interest or repay principal when due. Rating agencies assign credit ratings to debt securities to indicate their credit risk. Lower rated or unrated debt securities held by the Fund may present increased credit risk as compared to higher-rated debt securities.
Geographic concentration risk
Because the Fund invests substantially in municipal securities issued by the state identified in the Fund’s name and political sub-divisions of that state, the Fund will be particularly affected by adverse tax, legislative, regulatory, demographic or political changes as well as changes impacting the state’s financial, economic or other condition and prospects. In addition, because of the relatively small number of issuers of tax-exempt securities in the state, the Fund may invest a higher percentage of assets in a single issuer and, therefore, be more exposed to the risk of loss than a fund that invests more broadly. The value of municipal and other securities owned by the Fund also may be adversely affected by future changes in federal or state income tax laws.
Interest rate risk
Interest rate risk is the risk of losses attributable to changes in interest rates. In general, if prevailing interest rates rise, the values of debt securities tend to fall, and if interest rates fall, the values of debt securities tend to rise. Actions by governments and central banking authorities can result in increases in interest rates. Increasing interest rates may negatively affect the value of debt securities held by the Fund, resulting in a negative impact on the Fund’s performance and net asset value per share. In general, the longer the maturity or duration of a debt security, the greater its sensitivity to changes in interest rates.
| 34 | Columbia AMT-Free California Intermediate Muni Bond Fund | Annual Report 2018 |
Notes to Financial Statements (continued)
April 30, 2018
Liquidity risk
Liquidity risk is the risk associated with a lack of marketability of investments which may make it difficult to sell the investment at a desirable time or price. Changing regulatory, market or other conditions or environments (for example, the interest rate or credit environments) may adversely affect the liquidity of the Fund’s investments. The Fund may have to accept a lower selling price for the holding, sell other investments, or forego another, more appealing investment opportunity. Generally, the less liquid the market at the time the Fund sells a portfolio investment, the greater the risk of loss or decline of value to the Fund. A less liquid market can lead to an increase in Fund redemptions, which may negatively impact Fund performance and net asset value per share, including, for example, if the Fund is forced to sell securities in a down market.
Shareholder concentration risk
At April 30, 2018, one unaffiliated shareholder of record owned 70.4% of the outstanding shares of the Fund in one or more accounts. The Fund has no knowledge about whether any portion of those shares was owned beneficially. Subscription and redemption activity by concentrated accounts may have a significant effect on the operations of the Fund. In the case of a large redemption, the Fund may be forced to sell investments at inopportune times, including its liquid positions, which may result in Fund losses and the Fund holding a higher percentage of less liquid positions. Large redemptions could result in decreased economies of scale and increased operating expenses for non-redeeming Fund shareholders.
Note 8. Subsequent events
Management has evaluated the events and transactions that have occurred through the date the financial statements were issued and noted no items requiring adjustment of the financial statements or additional disclosure.
Note 9. Information regarding pending and settled legal proceedings
Ameriprise Financial and certain of its affiliates have historically been involved in a number of legal, arbitration and regulatory proceedings, including routine litigation, class actions, and governmental actions, concerning matters arising in connection with the conduct of their business activities. Ameriprise Financial believes that the Fund is not currently the subject of, and that neither Ameriprise Financial nor any of its affiliates are the subject of, any pending legal, arbitration or regulatory proceedings that are likely to have a material adverse effect on the Fund or the ability of Ameriprise Financial or its affiliates to perform under their contracts with the Fund. Ameriprise Financial is required to make quarterly (10-Q), annual (10-K) and, as necessary, 8-K filings with the Securities and Exchange Commission (SEC) on legal and regulatory matters that relate to Ameriprise Financial and its affiliates. Copies of these filings may be obtained by accessing the SEC website at www.sec.gov.
There can be no assurance that these matters, or the adverse publicity associated with them, will not result in increased Fund redemptions, reduced sale of Fund shares or other adverse consequences to the Fund. Further, although we believe proceedings are not likely to have a material adverse effect on the Fund or the ability of Ameriprise Financial or its affiliates to perform under their contracts with the Fund, these proceedings are subject to uncertainties and, as such, we are unable to estimate the possible loss or range of loss that may result. An adverse outcome in one or more of these proceedings could result in adverse judgments, settlements, fines, penalties or other relief that could have a material adverse effect on the consolidated financial condition or results of operations of Ameriprise Financial.
Columbia AMT-Free California Intermediate Muni Bond Fund | Annual Report 2018
| 35 |
Report of Independent Registered Public Accounting Firm
To the Board of Trustees of Columbia Funds Series Trust and Shareholders of Columbia AMT-Free California Intermediate Muni Bond Fund
Opinion on the Financial Statements
We have audited the accompanying statement of assets and liabilities, including the portfolio of investments, of Columbia AMT-Free California Intermediate Muni Bond Fund (one of the funds constituting Columbia Funds Series Trust, referred to hereafter as the "Fund") as of April 30, 2018, the related statement of operations for the year ended April 30, 2018, the statement of changes in net assets for each of the two years in the period ended April 30, 2018, including the related notes, and the financial highlights for each of the periods indicated therein (collectively referred to as the “financial statements”). In our opinion, the financial statements present fairly, in all material respects, the financial position of the Fund as of April 30, 2018, the results of its operations for the year then ended, the changes in its net assets for each of the two years in the period ended April 30, 2018 and the financial highlights for each of the periods indicated therein in conformity with accounting principles generally accepted in the United States of America.
Basis for Opinion
These financial statements are the responsibility of the Fund’s management. Our responsibility is to express an opinion on the Fund’s financial statements based on our audits. We are a public accounting firm registered with the Public Company Accounting Oversight Board (United States) (“PCAOB”) and are required to be independent with respect to the Fund in accordance with the U.S. federal securities laws and the applicable rules and regulations of the Securities and Exchange Commission and the PCAOB.
We conducted our audits of these financial statements in accordance with the standards of the PCAOB. Those standards require that we plan and perform the audit to obtain reasonable assurance about whether the financial statements are free of material misstatement, whether due to error or fraud.
Our audits included performing procedures to assess the risks of material misstatement of the financial statements, whether due to error or fraud, and performing procedures that respond to those risks. Such procedures included examining, on a test basis, evidence regarding the amounts and disclosures in the financial statements. Our audits also included evaluating the accounting principles used and significant estimates made by management, as well as evaluating the overall presentation of the financial statements. Our procedures included confirmation of securities owned as of April 30, 2018 by correspondence with the custodian and brokers; when replies were not received from brokers, we performed other auditing procedures. We believe that our audits provide a reasonable basis for our opinion.
/s/PricewaterhouseCoopers LLP
Minneapolis, Minnesota
June 21, 2018
We have served as auditors of one or more investment companies within the Columbia Funds Complex since 1977.
| 36 | Columbia AMT-Free California Intermediate Muni Bond Fund | Annual Report 2018 |
Federal Income Tax Information
(Unaudited)
The Fund hereby designates the following tax attributes for the fiscal year ended April 30, 2018. Shareholders will be notified in early 2019 of the amounts for use in preparing 2018 income tax returns.
Exempt-
interest
dividends | |
| 99.85% | |
Exempt-interest dividends. The percentage of net investment income distributed during the fiscal year that qualifies as exempt-interest dividends for federal income tax purposes.
Columbia AMT-Free California Intermediate Muni Bond Fund | Annual Report 2018
| 37 |
Shareholders elect the Board that oversees the Fund’s operations. The Board appoints officers who are responsible for day-to-day business decisions based on policies set by the Board. The following table provides basic biographical information about the Fund’s Trustees, including their principal occupations during the past five years, although specific titles for individuals may have varied over the period. Under current Board policy, Trustees not affiliated with the Investment Manager generally may serve through the end of the calendar year in which they reach either the mandatory retirement age established by the Board or the fifteenth anniversary of the first Columbia Funds board meeting they attended as a member of the Board.
Independent trustees
Name,
address,
year of birth | Position held
with the Trust and
length of service | Principal occupation(s)
during past five years
and other relevant
professional experience | Number of
Funds in the
Columbia Funds
complex
overseen | Other directorships
held by Trustee
during the past
five years |
George S. Batejan
c/o Columbia Management
Investment Advisers, LLC
225 Franklin Street
Mail Drop BX32 05228
Boston, MA 02110
1953 | Trustee since 1/17 | Executive Vice President, Global Head of Technology and Operations, Janus Capital Group, Inc., 2010-2016 | 125 | Advisory Board Member, University of Colorado Business School since November 2015; former Chairman of the Board, NICSA (National Investment Company Services Association) (Executive Committee, Nominating Committee and Governance Committee), 2014-2016; former Director, Intech Investment Management, 2011- 2016; former Board Member, Metro Denver Chamber of Commerce, 2015-2016 |
Kathleen Blatz
c/o Columbia Management
Investment Advisers, LLC
225 Franklin Street
Mail Drop BX32 05228
Boston, MA 02110
1954 | Trustee since 1/06 for RiverSource Funds and since 6/11 for Nations Funds | Attorney; specializing in arbitration and mediation; Interim President and Chief Executive Officer, Blue Cross and Blue Shield of Minnesota (health care insurance) since February 2018; Chief Justice, Minnesota Supreme Court, 1998-2006; Associate Justice, Minnesota Supreme Court, 1996-1998; Fourth Judicial District Court Judge, Hennepin County, 1994-1996; Attorney in private practice and public service, 1984-1993; State Representative, Minnesota House of Representatives, 1979-1993, which included service on the Tax and Financial Institutions and Insurance Committees; Interim Chair, Minnesota Sports Facilities Authority, March 2017-July 2017 | 125 | Trustee, BlueCross BlueShield of Minnesota since 2009 (Chair of the Business Development Committee, 2014-2017; Chair of the Governance Committee since 2017); Chair of the Robina Foundation since August 2013; former Member of the Board, Minnesota Sports Facilities Authority, January 2017-July 2017 |
Edward J. Boudreau, Jr.
c/o Columbia Management
Investment Advisers, LLC
225 Franklin Street
Mail Drop BX32 05228
Boston, MA 02110
1944 | Chair of the Board since 1/18; Trustee since 6/11 for RiverSource Funds and since 1/05 for Nations Funds | Managing Director, E.J. Boudreau & Associates (consulting) since 2000; FINRA Industry Arbitrator, 2002-present; Chairman and Chief Executive Officer, John Hancock Investments (asset management), Chairman and Interested Trustee for open-end and closed-end funds offered by John Hancock, 1989-2000; John Hancock Mutual Life Insurance Company, including Senior Vice President and Treasurer and Senior Vice President Information Technology, 1968-1988 | 125 | Former Trustee, Boston Museum of Science (Chair of Finance Committee) 1985-2013; former Trustee, BofA Funds Series Trust (11 funds), 2005-2011 |
| 38 | Columbia AMT-Free California Intermediate Muni Bond Fund | Annual Report 2018 |
TRUSTEES AND OFFICERS (continued)
Independent trustees (continued)
Name,
address,
year of birth | Position held
with the Trust and
length of service | Principal occupation(s)
during past five years
and other relevant
professional experience | Number of
Funds in the
Columbia Funds
complex
overseen | Other directorships
held by Trustee
during the past
five years |
Pamela G. Carlton
c/o Columbia Management
Investment Advisers, LLC
225 Franklin Street
Mail Drop BX32 05228
Boston, MA 02110
1954 | Trustee since 7/07 for RiverSource Funds and since 6/11 for Nations Funds | President, Springboard — Partners in Cross Cultural Leadership (consulting company) since 2003; Managing Director of US Equity Research, JP Morgan Chase, 1999-2003; Director of US Equity Research, Chase Asset Management, 1996-1999; Co-Director Latin America Research, 1993-1996, COO Global Research, 1992-1996, Co-Director of US Research, 1991-1992, Investment Banker, Morgan Stanley, 1982-1991 | 125 | Trustee, New York Presbyterian Hospital Board (Executive Committee and Chair of Human Resources Committee) since 1996; Director, Darien Rowayton Bank (Audit Committee) since 2017 |
William P. Carmichael
c/o Columbia Management
Investment Advisers, LLC
225 Franklin Street
Mail Drop BX32 05228
Boston, MA 02110
1943 | Trustee since 6/11 for RiverSource Funds and since 2003 for Nations Funds | Retired; Co-founder, The Succession Fund (provides exit strategies to owners of privately held companies), 1998-2007; Adjunct Professor of Finance, Kelley School of Business, Indiana University, 1993-2007; Senior Vice President, Sara Lee Corporation, 1991-1993; Senior Vice President and Chief Financial Officer, Beatrice Foods Company, 1984-1990; Vice President, Esmark, Inc., 1973-1984; Associate, Price Waterhouse, 1968-1972 | 125 | Director, The Finish Line (athletic shoes and apparel) since July 2003; former Director, Cobra Electronics Corporation (electronic equipment manufacturer), 1994-August 2014; former Director, Spectrum Brands, Inc. (consumer products), 2002-2009; former Director, Simmons Company (bedding), 2004-2010; former Trustee, BofA Funds Series Trust (11 funds) 2003-2011; former Director, McMoRan Exploration Company (oil and gas exploration and development) 2010 - 2013; former Director, International Textile Corp., 2012-2016; former Director, hhgregg, 2015-2017 |
Patricia M. Flynn
c/o Columbia Management
Investment Advisers, LLC
225 Franklin Street
Mail Drop BX32 05228
Boston, MA 02110
1950 | Trustee since 11/04 for RiverSource Funds and since 6/11 for Nations Funds | Trustee Professor of Economics and Management, Bentley University since 1976 (also teaches and conducts research on corporate governance); Dean, McCallum Graduate School of Business, Bentley University, 1992-2002 | 125 | Trustee, MA Taxpayers Foundation since 1997; Board of Directors, The MA Business Roundtable since 2003; Board of Governors, Innovation Institute, MA Technology Collaborative since 2010 |
Brian J. Gallagher
c/o Columbia Management
Investment Advisers, LLC
225 Franklin Street
Mail Drop BX32 05228
Boston, MA 02110
1954 | Trustee since 12/17 | Retired; Partner with Deloitte & Touche LLP and its predecessors, 1977-2016 | 123 | Trustee, Catholic Schools Foundation since 2004 |
Catherine James Paglia
c/o Columbia Management
Investment Advisers, LLC
225 Franklin Street
Mail Drop BX32 05228
Boston, MA 02110
1952 | Trustee since 11/04 for RiverSource Funds and since 6/11 for Nations Funds | Director, Enterprise Asset Management, Inc. (private real estate and asset management company) since September 1998; Managing Director and Partner, Interlaken Capital, Inc., 1989-1997; Managing Director, Morgan Stanley, 1982-1989; Vice President, Investment Banking, 1980-1982, Associate, Investment Banking, 1976-1980, Dean Witter Reynolds, Inc. | 125 | Director, Valmont Industries, Inc. (irrigation systems manufacturer) since 2012; Trustee, Carleton College (on the Investment Committee); Trustee, Carnegie Endowment for International Peace (on the Investment Committee) |
Columbia AMT-Free California Intermediate Muni Bond Fund | Annual Report 2018
| 39 |
TRUSTEES AND OFFICERS (continued)
Independent trustees (continued)
Name,
address,
year of birth | Position held
with the Trust and
length of service | Principal occupation(s)
during past five years
and other relevant
professional experience | Number of
Funds in the
Columbia Funds
complex
overseen | Other directorships
held by Trustee
during the past
five years |
Minor M. Shaw
c/o Columbia Management
Investment Advisers, LLC
225 Franklin Street
Mail Drop BX32 05228
Boston, MA 02110
1947 | Trustee since 6/11 for RiverSource Funds and since 2003 for Nations Funds | President, Micco LLC (private investments) since 2011; President, Micco Corp. (family investment business), 1998-2011 | 125 | Director, BlueCross BlueShield of South Carolina since April 2008; Director, National Association of Corporate Directors, Carolinas Chapter, since 2013; Board Chair, Hollingsworth Funds since 2016; Advisory Board member, Duke Energy Corp. since October 2016; Chair of the Duke Endowment; Chair of Greenville – Spartanburg Airport Commission; former Trustee, BofA Funds Series Trust (11 funds), 2003-2011; former Director, Piedmont Natural Gas, 2004-2016 |
Sandra Yeager
c/o Columbia Management
Investment Advisers, LLC
225 Franklin Street
Mail Drop BX32 05228
Boston, MA 02110
1964 | Trustee since 12/17 | Retired; President and founder, Hanoverian Capital, LLC (SEC registered investment advisor firm), 2008-2016 | 123 | Director, NAPE Education Foundation since October 2016 |
Interested trustee not affiliated with Investment Manager*
Name,
address,
year of birth | Position held
with the Trust and
length of service | Principal occupation(s) during the
past five years and other relevant
professional experience | Number of
Funds in the
Columbia Funds
complex overseen | Other directorships/
held by Trustee
during the past
five years |
Anthony M. Santomero
c/o Columbia Management
Investment Advisers, LLC
225 Franklin Street
Mail Drop BX32 05228
Boston, MA 02110
1946 | Trustee since 6/11 for RiverSource Funds and since 1/08 for Nations Funds | Richard K. Mellon Professor Emeritus of Finance, The Wharton School, University of Pennsylvania, since 2002; Senior Advisor, McKinsey & Company (consulting), 2006-2008; President, Federal Reserve Bank of Philadelphia, 2000-2006, Professor of Finance, The Wharton School, University of Pennsylvania, 1972-2002 | 123 | Trustee, Penn Mutual Life Insurance Company since March 2008; Director, Renaissance Reinsurance Ltd. since May 2008; Director, Citigroup Inc. since 2009; Director, Citibank, N.A. since 2009; former Trustee, BofA Funds Series Trust (11 funds), 2008-2011 |
| * | Dr. Santomero is not an affiliated person of the Investment Manager or Ameriprise Financial. However, he is currently deemed by the Funds to be an “interested person” (as defined in the 1940 Act) of the Funds because he serves as a Director of Citigroup Inc. and Citibank, N.A., companies that may directly or through subsidiaries and affiliates engage from time-to-time in brokerage execution, principal transactions and lending relationships with the Funds or accounts advised/managed by the Investment Manager. |
| 40 | Columbia AMT-Free California Intermediate Muni Bond Fund | Annual Report 2018 |
TRUSTEES AND OFFICERS (continued)
Interested trustee affiliated with Investment Manager*
Name,
address,
year of birth | Position held with the Trusts and length of service | Principal occupation(s) during the
past five years and other relevant
professional experience | Number of
Funds in the
Columbia Funds
complex overseen | Other directorships
held by Trustee
during the past
five years |
William F. Truscott
c/o Columbia Management
Investment Advisers, LLC
225 Franklin St.
Boston, MA 02110
1960 | Trustee since 11/01 for RiverSource Funds and since 6/11 for Nations Funds; Senior Vice President since 2002 for RiverSource Funds and since 5/10 for Nations Funds | Chairman of the Board and President, Columbia Management Investment Advisers, LLC since May 2010 and February 2012, respectively; Chief Executive Officer, Global Asset Management, Ameriprise Financial, Inc. since September 2012 (previously Chief Executive Officer, U.S. Asset Management & President, Annuities, May 2010 - September 2012); Director and Chief Executive Officer, Columbia Management Investment Distributors, Inc. since May 2010 and February 2012, respectively; Chairman of the Board and Chief Executive Officer, RiverSource Distributors, Inc. since 2006; Director, Threadneedle Asset Management Holdings, SARL since 2014; President and Chief Executive Officer, Ameriprise Certificate Company, 2006 - August 2012. | 196 | Chairman of the Board, Columbia Management Investment Advisers, LLC since May 2010; Director, Columbia Management Investment Distributors, Inc. since May 2010; former Director, Ameriprise Certificate Company, 2006-January 2013 |
| * | Interested person (as defined under the 1940 Act) by reason of being an officer, director, security holder and/or employee of the Investment Manager or Ameriprise Financial. |
Nations Funds refer to the Funds within the Columbia Funds Complex that historically bore the Nations brand and includes series of Columbia Funds Series Trust. RiverSource Funds refer to the Funds within the Columbia Funds Complex that historically bore the RiverSource brand and includes series of Columbia Funds Series Trust II.
The Statement of Additional Information has additional information about the Fund’s Board members and is available, without charge, upon request by calling 800.345.6611, visiting columbiathreadneedleus.com/investor/ or contacting your financial intermediary.
Columbia AMT-Free California Intermediate Muni Bond Fund | Annual Report 2018
| 41 |
TRUSTEES AND OFFICERS (continued)
The Board has appointed officers who are responsible for day-to-day business decisions based on policies it has established. The officers serve at the pleasure of the Board. The following table provides basic information about the Officers of the Fund, including principal occupations during the past five years, although their specific titles may have varied over the period. In addition to Mr. Truscott, who is Senior Vice President, the Fund’s other officers are:
Fund officers
Name,
address and
year of birth | Position and year
first appointed to
position for any Fund
in the Columbia
Funds complex or a
predecessor thereof | Principal occupation(s) during past five years |
Christopher O. Petersen
5228 Ameriprise
Financial Center
Minneapolis, MN 55474
Born 1970 | President and Principal Executive Officer (2015) | Vice President and Lead Chief Counsel, Ameriprise Financial, Inc. since January 2015 (previously, Vice President and Chief Counsel, January 2010 - December 2014; officer of Columbia Funds and affiliated funds since 2007. |
Michael G. Clarke
225 Franklin Street
Boston, MA 02110
Born 1969 | Treasurer (2011), Chief Financial Officer (2009) and Chief Accounting Officer (2015) | Vice President — Mutual Fund Administration, Columbia Management Investment Advisers, LLC, since May 2010; senior officer of Columbia Funds and affiliated funds since 2002. |
Paul B. Goucher
100 Park Avenue
New York, NY 10017
Born 1968 | Senior Vice President (2011) and Assistant Secretary (2008) | Senior Vice President and Assistant General Counsel, Ameriprise Financial, Inc. since January 2017 (previously Vice President and Lead Chief Counsel, November 2008 - January 2017 and January 2013 - January 2017, respectively; and Chief Counsel, January 2010 - January 2013); Vice President, Chief Legal Officer and Assistant Secretary, Columbia Management Investment Advisers, LLC since May 2010. |
Thomas P. McGuire
225 Franklin Street
Boston, MA 02110
Born 1972 | Senior Vice President and Chief Compliance Officer (2012) | Vice President — Asset Management Compliance, Ameriprise Financial, Inc., since May 2010; Chief Compliance Officer, Ameriprise Certificate Company since September 2010. |
Colin Moore
225 Franklin Street
Boston, MA 02110
Born 1958 | Senior Vice President (2010) | Executive Vice President and Global Chief Investment Officer, Ameriprise Financial, Inc., since July 2013; Executive Vice President and Global Chief Investment Officer, Columbia Management Investment Advisers, LLC since July 2013 (previously Director and Global Chief Investment Officer, 2010 - 2013). |
Ryan C. Larrenaga
225 Franklin Street
Boston, MA 02110
Born 1970 | Senior Vice President (2017), Chief Legal Officer (2017) and Secretary (2015) | Vice President and Group Counsel, Ameriprise Financial, Inc. since August 2011; officer of Columbia Funds and affiliated funds since 2005. |
Michael E. DeFao
225 Franklin Street
Boston, MA 02110
Born 1968 | Vice President (2011) and Assistant Secretary (2010) | Vice President and Chief Counsel, Ameriprise Financial, Inc. since May 2010. |
Amy Johnson
5228 Ameriprise
Financial Center
Minneapolis, MN 55474
Born 1965 | Vice President (2006) | Managing Director and Global Head of Operations, Columbia Management Investment Advisers, LLC since April 2016 (previously Managing Director and Chief Operating Officer, 2010 - 2016). |
Lyn Kephart-Strong
5228 Ameriprise
Financial Center
Minneapolis, MN 55474
Born 1960 | Vice President (2015) | President, Columbia Management Investment Services Corp. since October 2014; Vice President & Resolution Officer, Ameriprise Trust Company since August 2009. |
| 42 | Columbia AMT-Free California Intermediate Muni Bond Fund | Annual Report 2018 |
The Fund mails one shareholder report to each shareholder address. If you would like more than one report, please call shareholder services at 800.345.6611 and additional reports will be sent to you.
Proxy voting policies and procedures
The policy of the Board of Trustees is to vote the proxies of the companies in which the Fund holds investments consistent with the procedures as stated in the Statement of Additional Information (SAI). You may obtain a copy of the SAI without charge by calling 800.345.6611; contacting your financial intermediary; visiting columbiathreadneedleus.com/investor/; or searching the website of the Securities and Exchange Commission (SEC) at sec.gov. Information regarding how the Fund voted proxies relating to portfolio securities is filed with the SEC by August 31st for the most recent 12-month period ending June 30th of that year, and is available without charge by visiting columbiathreadneedleus.com/investor/, or searching the website of the SEC at sec.gov.
Quarterly schedule of investments
The Fund files a complete schedule of portfolio holdings with the SEC for the first and third quarters of each fiscal year on Form N-Q. The Fund’s Form N-Q is available on the SEC’s website at sec.gov and may be reviewed and copied at the SEC’s Public Reference Room in Washington, D.C. Information on the operation of the Public Reference Room may be obtained by calling 800.SEC.0330. The Fund’s complete schedule of portfolio holdings, as filed on Form N-Q, can also be obtained without charge, upon request, by calling 800.345.6611.
Additional Fund information
For more information about the Fund, please visit columbiathreadneedleus.com/investor/ or call 800.345.6611. Customer Service Representatives are available to answer your questions Monday through Friday from 8 a.m. to 7 p.m. Eastern time.
Fund investment manager
Columbia Management Investment Advisers, LLC
225 Franklin Street
Boston, MA 02110
Fund distributor
Columbia Management Investment Distributors, Inc.
225 Franklin Street
Boston, MA 02110
Fund transfer agent
Columbia Management Investment Services Corp.
P.O. Box 8081
Boston, MA 02266-8081
Columbia AMT-Free California Intermediate Muni Bond Fund | Annual Report 2018
| 43 |
[THIS PAGE INTENTIONALLY LEFT BLANK]
[THIS PAGE INTENTIONALLY LEFT BLANK]
Columbia AMT-Free California Intermediate Muni Bond Fund
P.O. Box 8081
Boston, MA 02266-8081
Please read and consider the investment objectives, risks, charges and expenses for any fund carefully before investing. For a prospectus and summary prospectus, which contains this and other important information about the Fund, go to
columbiathreadneedleus.com/investor/. The Fund is distributed by Columbia Management Investment Distributors, Inc., member FINRA, and managed by Columbia Management Investment Advisers, LLC.
Columbia Threadneedle Investments (Columbia Threadneedle) is the global brand name of the Columbia and Threadneedle group of companies. All rights reserved. Columbia Management Investment Distributors, Inc., 225 Franklin Street, Boston, MA 02110-2804
© 2018 Columbia Management Investment Advisers, LLC.
columbiathreadneedleus .com/investor/

Annual Report
April 30, 2018
Columbia Short Term Municipal Bond Fund
Not FDIC Insured • No bank guarantee • May lose value
Dear Shareholders,
The year 2017 was an extraordinary year in the financial markets. The S&P 500 Index didn’t experience a single down month and returned over 20%. Continuing this trend, January 2018 marked the fastest start for the index ever. Low volatility, which had been a feature of the U.S. equity market for several years, along with the surge in the S&P 500 Index, drove investor sentiment to very high levels. This arguably set the stage for an overdue correction, which we witnessed in February 2018.
A return to volatility
There have been few periods of market upheaval such as were experienced in the first part of 2018. While investors were taken by surprise by the sudden and pronounced market swings, the return to some level of volatility actually marked a resumption of relatively normal market conditions. Having said that, it’s important to distinguish between a good technical correction where excess enthusiasm in the marketplace is being let out, versus a real change in the underlying fundamentals – things like an underperforming economy or weaker corporate earnings. Our view is that the recent market volatility falls into the former category, and the fundamentals remain strong. We’re continuing to see improvements in global economic activity, and we’re seeing corporate earnings expectations continue to rise – and not just because of tax reform.
Consistency is more important than ever
It’s important to keep in mind that when it comes to long-term investing, it’s the destination, not the journey that matters most. If you have a financial goal that you’ve worked out with your financial advisor, and you have a good asset allocation plan to reach it, it’s a question of sticking with your plan rather than become focused on near-term volatility. Bouts of volatility are normal. After all, it’s hard to cross the ocean without hitting an occasional rough patch. You need to focus on the destination.
One final thought. In weathering volatility, it’s the consistency of the return that is essential. Investors who chase higher returns are usually the first to sell when an investment goes through a bad patch, and they therefore don’t tend to benefit from the recovery. More disciplined investors who perhaps panic less or not at all during periods of volatility, tend to have improved long-term results and are more likely to reach their financial goals. Nothing is more important to us than making sure those who have entrusted us to protect and grow their assets are able to do what matters most to them.
Your success is our priority. Talk to your financial advisor about how working with Columbia Threadneedle Investments may help you position your portfolio for consistent, sustainable outcomes, no matter the market conditions.
Sincerely,
Christopher O. Petersen
President, Columbia Funds
The S&P 500 Index, an unmanaged index, measures the performance of 500 widely held, large-capitalization U.S. stocks and is frequently used as a general measure of market performance. Past performance is no guarantee of future results.
Columbia Funds are distributed by Columbia Management Investment Distributors, Inc., member FINRA, and managed by Columbia Management Investment Advisers, LLC.
© 2018 Columbia Management Investment Advisers, LLC. All rights reserved.
Columbia Short Term Municipal Bond Fund | Annual Report 2018
Columbia Short Term Municipal Bond Fund | Annual Report 2018
Investment objective
Columbia Short Term Municipal Bond Fund (the Fund) seeks current income exempt from federal income tax, consistent with minimal fluctuation of principal.
Portfolio management
Catherine Stienstra
Co-Portfolio Manager
Managed Fund since 2012
Anders Myhran, CFA
Co-Portfolio Manager
Managed Fund since 2015
| Average annual total returns (%) (for the period ended April 30, 2018) |
| | | Inception | 1 Year | 5 Years | 10 Years |
| Class A | Excluding sales charges | 11/02/93 | 0.16 | 0.35 | 1.23 |
| | Including sales charges | | -0.80 | 0.14 | 1.13 |
| Advisor Class* | 03/19/13 | 0.51 | 0.62 | 1.49 |
| Class C | Excluding sales charges | 05/19/94 | -0.59 | -0.40 | 0.48 |
| | Including sales charges | | -1.58 | -0.40 | 0.48 |
| Institutional Class | 10/07/93 | 0.40 | 0.60 | 1.48 |
| Institutional 2 Class* | 11/08/12 | 0.55 | 0.70 | 1.54 |
| Institutional 3 Class* | 03/01/17 | 0.41 | 0.61 | 1.49 |
| Bloomberg Barclays 1-3 Year Municipal Bond Index | | 0.20 | 0.72 | 1.59 |
Returns for Class A shares are shown with and without the maximum initial sales charge of 1.00%. Returns for Class C shares are shown with and without the 1.00% contingent deferred sales charge for the first year only. The Fund’s other classes are not subject to sales charges and have limited eligibility. Effective November 1, 2017, Class R4, Class R5, Class Y and Class Z shares were renamed Advisor Class, Institutional 2 Class, Institutional 3 Class and Institutional Class shares, respectively. Please see the Fund’s prospectus for details. Performance for different share classes will vary based on differences in sales charges and fees associated with each class. All results shown assume reinvestment of distributions during the period. Returns do not reflect the deduction of taxes that a shareholder may pay on Fund distributions or on the redemption of Fund shares. Performance results reflect the effect of any fee waivers or reimbursements of Fund expenses by Columbia Management Investment Advisers, LLC and/or any of its affiliates. Absent these fee waivers or expense reimbursement arrangements, performance results would have been lower.
The performance information shown represents past performance and is not a guarantee of future results. The investment return and principal value of your investment will fluctuate so that your shares, when redeemed, may be worth more or less than their original cost. Current performance may be lower or higher than the performance information shown. You may obtain performance information current to the most recent month-end by contacting your financial intermediary, visiting columbiathreadneedleus.com/investor/ or calling 800.345.6611.
| * | The returns shown for periods prior to the share class inception date (including returns for the Life of the Fund, if shown, which are since Fund inception) include the returns of the Fund’s oldest share class. These returns are adjusted to reflect any higher class-related operating expenses of the newer share classes, as applicable. Please visit columbiathreadneedleus.com/investor/investment-products/mutual-funds/appended-performance for more information. |
The Bloomberg Barclays 1-3 Year Municipal Bond Index is an unmanaged index which consists of a broad selection of investment-grade general obligation and revenue bonds of maturities ranging from one year to three years.
Indices are not available for investment, are not professionally managed and do not reflect sales charges, fees, brokerage commissions, taxes or other expenses of investing. Securities in the Fund may not match those in an index.
| 2 | Columbia Short Term Municipal Bond Fund | Annual Report 2018 |
Fund at a Glance (continued)
Performance of a hypothetical $10,000 investment (April 30, 2008 — April 30, 2018)
The chart above shows the change in value of a hypothetical $10,000 investment in Class A shares of Columbia Short Term Municipal Bond Fund during the stated time period, and does not reflect the deduction of taxes that a shareholder may pay on Fund distributions or on the redemption of Fund shares.
| Quality breakdown (%) (at April 30, 2018) |
| AAA rating | 5.6 |
| AA rating | 22.0 |
| A rating | 34.1 |
| BBB rating | 15.5 |
| BB rating | 1.2 |
| B rating | 0.5 |
| Not rated | 21.1 |
| Total | 100.0 |
Percentages indicated are based upon total fixed income investments (excluding Money Market Funds).
Bond ratings apply to the underlying holdings of the Fund and not the Fund itself and are divided into categories ranging from highest to lowest credit quality, determined by using the middle rating of Moody’s, S&P and Fitch, after dropping the highest and lowest available ratings. When ratings are available from only two rating agencies, the lower rating is used. When a rating is available from only one rating agency, that rating is used. When a bond is not rated by any rating agency, it is designated as “Not rated.” Credit quality ratings assigned by a rating agency are subjective opinions, not statements of fact, and are subject to change, including daily. The ratings assigned by credit rating agencies are but one of the considerations that the Investment Manager and/or Fund’s subadviser incorporates into its credit analysis process, along with such other issuer-specific factors as cash flows, capital structure and leverage ratios, ability to de-leverage (repay) through free cash flow, quality of management, market positioning and access to capital, as well as such security-specific factors as the terms of the security (e.g., interest rate and time to maturity) and the amount and type of any collateral.
Top Ten States/Territories (%)
(at April 30, 2018) |
| New York | 26.8 |
| Illinois | 14.0 |
| Connecticut | 4.8 |
| Pennsylvania | 4.4 |
| New Jersey | 4.2 |
| California | 4.1 |
| Texas | 3.5 |
| Florida | 2.9 |
| Tennessee | 2.4 |
| Minnesota | 2.4 |
Percentages indicated are based upon total investments (excluding Money Market Funds).
For further detail about these holdings, please refer to the section entitled “Portfolio of Investments.”
Fund holdings are as of the date given, are subject to change at any time, and are not recommendations to buy or sell any security.
Columbia Short Term Municipal Bond Fund | Annual Report 2018
| 3 |
Manager Discussion of Fund Performance
For the 12-month period that ended April 30, 2018, the Fund’s Class A shares returned 0.16% excluding sales charges. Institutional Class shares of the Fund returned 0.40%. During the same time period, the Bloomberg Barclays 1-3 Year Municipal Bond Index returned 0.20%. Effective duration, yield curve, credit quality and sector positioning overall contributed positively, slightly offset by the mixed results of security selection during the period.
Short-term tax-exempt bond market pressured by first quarter 2018 investor sentiment
The period began strongly in May 2017, with the short-term tax-exempt bond market supported by a change in tone surrounding the Trump Administration’s trade policies and post-election sell-off and concerns about the potential for significant economic growth, increased infrastructure spending and higher inflation waning. The Federal Reserve (the Fed) continued on its path of raising short-term interest rates in June 2017, having done similarly in March 2017. Delays in U.S. tax reform further buoyed the short-term tax-exempt bond market. The technical, or supply/demand, environment also remained supportive, as investment inflows persisted and new issue supply was lower than usual.
Positive performance by the short-term tax-exempt bond market continued into the third calendar quarter, supported by lower than expected supply and consistently strong demand. Concerns about repeal of the Affordable Care Act were reduced, as legislation continued to stall. With the U.S. economy showing rather steady signs of growth and labor market strength during the fourth quarter of 2017, the Fed commenced its unwinding of its expansive balance sheet in October and hiked the targeted federal funds rate again in December. In the process, the difference between short-term and longer term maturity yields collapsed to the lowest level in more than 10 years. Tax reform dominated the municipal landscape after Republican legislators unveiled a preliminary outline for overhauling the nation’s tax code during the fourth quarter of 2017. Initial proposals eliminated municipal bond issuers’ ability to advance refund outstanding debt and stripped Private Activity Bonds (PABs) of their tax-exempt status. The surprise inclusion of the two provisions initially fueled a market rally, as investors anticipated a dramatic reduction in future supply. Municipalities responded by pulling forward an estimated $35 billion of new bond issuance into December 2017 in an effort to beat any negative consequences from the proposed tax changes. As a result, fourth quarter supply jumped to the highest level in 20 years. The final bill, signed into law in late December, spared PABs and only marginally reduced top personal tax rates. This preserved the attractiveness of the municipal interest exemption for high income earners, particularly considering the $10,000 cap on state and local tax deductions. The broad tax-exempt bond market absorbed record supply in December without pause, as investor demand remained robust in anticipation of lower issuance in 2018.
While many market participants looked for a strong start to the 2018 calendar year given expected favorable supply/demand technicals, the short-term tax-exempt bond market surprised by declining. Aggressively rising yields characterized the start to 2018, as expectations for higher inflation weighed heavily on bond prices. Investors worried the introduction of fiscal stimulus, at a time when the economy appeared to be operating near full capacity, could force the Fed to raise interest rates even further and faster than had been anticipated to tame inflation. U.S. Treasury yields moved higher in response, with shorter maturities leading the way. The Fed delivered a widely anticipated interest rate hike in March 2018 and guided markets for a steeper ramp up in 2019 and 2020. During this time, there was also reduced demand from some institutional buyers, such as banks and property and casualty insurance companies. In April 2018, interest rates softened, as trade rhetoric materialized into tariffs on steel and aluminum, sowing concerns that a trade war with China could be imminent. New issue volume was down significantly from the high levels seen in the fourth quarter of 2017, and investors largely sat on the sidelines, preferring to wait for interest rates to stabilize even as municipal bond yields approached a three-year high.
From a fundamental perspective, generally stable to positive gains in employment and steady tax revenues supported the municipal bond market throughout the period. Further, municipal bond market defaults remained benign, with no imminent threat to the credit cycle seen as of the end of the period.
Contributors and detractors
The Fund’s duration positioning boosted its relative results during the period. The Fund had a shorter duration stance than that of the benchmark for most of the period, which helped as interest rates rose. Additionally, yield curve positioning proved beneficial, as those segments of the municipal bond market where the Fund has its greatest exposure, i.e. less than one-year maturities and greater than three-year maturities, which are both not part of the benchmark, outperformed the benchmark during the period. The yield curve flattened dramatically, meaning the differential in yields between shorter term and longer term maturities narrowed, during the period.
| 4 | Columbia Short Term Municipal Bond Fund | Annual Report 2018 |
Manager Discussion of Fund Performance (continued)
Further, as lower quality securities overall outperformed higher quality securities during the period, having underweighted allocations to bonds rated AAA and AA, overweighted allocations to lower rated, i.e. A and Baa, investment-grade bonds, and exposure to non-rated securities, added value.
From a sector perspective, having an underweight to pre-refunded bonds contributed positively to the Fund’s relative results. Pre-refunded bonds, also known as advance refunding, is a procedure in which a bond issuer floats a second bond at a lower interest rate, and the proceeds from the sale of the second bond are invested, usually in Treasury securities, which in turn, are held in escrow collateralizing the first bond. Advance refunded bonds no longer represent the credit risk profile of the original borrower, and given the high credit quality of the escrow account they often increase in value — sometimes significantly. The pre-refunded sector is generally a higher quality one, which underperformed lower quality sectors during the period. Having an overweight to housing bonds and to Illinois credits, each of which generally outperformed the benchmark during the period, also helped. Security selection within the transportation sector and among state and local general obligation securities of Illinois and Chicago, respectively, proved effective as well.
Security selection amongst housing sector bonds hampered the Fund’s relative results during the period.
Fundamental analysis drove portfolio changes
We adjusted the Fund’s duration during the period, though it was shorter than the benchmark throughout. From the start of the period in May 2017 through December 2017, we kept the Fund’s duration around 1.65 years. We began to reduce the Fund’s duration to just under 1.60 years in the latter months of the period when short-term yields moved higher. From a credit quality perspective, we marginally increased exposure to bonds rated AAA and BBB and modestly decreased exposure to bonds rated AA and A. Exposure to non-rated notes drifted slightly higher. All that said, the aggregate credit quality of the Fund remained unchanged during the period at A+/A1.
We increased the Fund’s allocations to housing and hospital bonds. We reduced the Fund’s exposure to state appropriation bonds, local general obligation bonds and toll facilities bonds.
Fixed-income securities present issuer default risk. The Fund invests substantially in municipal securities and will be affected by tax, legislative, regulatory, demographic or political changes, as well as changes impacting a state’s financial, economic or other conditions. A relatively small number of tax-exempt issuers may necessitate the Fund investing more heavily in a single issuer and, therefore, be more exposed to the risk of loss than a fund that invests more broadly. Prepayment and extension risk exists because the timing of payments on a loan, bond or other investment may accelerate when interest rates fall or decelerate when interest rates rise which may reduce investment opportunities and potential returns. Market risk may affect a single issuer, sector of the economy, industry or the market as a whole. A rise in interest rates may result in a price decline of fixed-income instruments held by the Fund, negatively impacting its performance and NAV. Falling rates may result in the Fund investing in lower yielding debt instruments, lowering the Fund’s income and yield. These risks may be heightened for longer maturity and duration securities. Federal and state tax rules apply to capital gain distributions and any gains or losses on sales. Income may be subject to state, local or alternative minimum taxes. See the Fund’s prospectus for more information on these and other risks.
The views expressed in this report reflect the current views of the respective parties. These views are not guarantees of future performance and involve certain risks, uncertainties and assumptions that are difficult to predict, so actual outcomes and results may differ significantly from the views expressed. These views are subject to change at any time based upon economic, market or other conditions and the respective parties disclaim any responsibility to update such views. These views may not be relied on as investment advice and, because investment decisions for a Columbia fund are based on numerous factors, may not be relied on as an indication of trading intent on behalf of any particular Columbia fund. References to specific securities should not be construed as a recommendation or investment advice.
Columbia Short Term Municipal Bond Fund | Annual Report 2018
| 5 |
Understanding Your Fund’s Expenses
(Unaudited)
As an investor, you incur two types of costs. There are transaction costs, which generally include sales charges on purchases and may include redemption fees. There are also ongoing costs, which generally include management fees, distribution and/or service fees, and other fund expenses. The following information is intended to help you understand your ongoing costs (in dollars) of investing in the Fund and to help you compare these costs with the ongoing costs of investing in other mutual funds.
Analyzing your Fund’s expenses
To illustrate these ongoing costs, we have provided examples and calculated the expenses paid by investors in each share class of the Fund during the period. The actual and hypothetical information in the table is based on an initial investment of $1,000 at the beginning of the period indicated and held for the entire period. Expense information is calculated two ways and each method provides you with different information. The amount listed in the “Actual” column is calculated using the Fund’s actual operating expenses and total return for the period. You may use the Actual information, together with the amount invested, to estimate the expenses that you paid over the period. Simply divide your account value by $1,000 (for example, an $8,600 account value divided by $1,000 = 8.6), then multiply the results by the expenses paid during the period under the “Actual” column. The amount listed in the “Hypothetical” column assumes a 5% annual rate of return before expenses (which is not the Fund’s actual return) and then applies the Fund’s actual expense ratio for the period to the hypothetical return. You should not use the hypothetical account values and expenses to estimate either your actual account balance at the end of the period or the expenses you paid during the period. See “Compare with other funds” below for details on how to use the hypothetical data.
Compare with other funds
Since all mutual funds are required to include the same hypothetical calculations about expenses in shareholder reports, you can use this information to compare the ongoing cost of investing in the Fund with other funds. To do so, compare the hypothetical example with the 5% hypothetical examples that appear in the shareholder reports of other funds. As you compare hypothetical examples of other funds, it is important to note that hypothetical examples are meant to highlight the ongoing costs of investing in a fund only and do not reflect any transaction costs, such as sales charges, or redemption or exchange fees. Therefore, the hypothetical calculations are useful in comparing ongoing costs only, and will not help you determine the relative total costs of owning different funds. If transaction costs were included in these calculations, your costs would be higher.
| November 1, 2017 — April 30, 2018 |
| | Account value at the
beginning of the
period ($) | Account value at the
end of the
period ($) | Expenses paid during
the period ($) | Fund’s annualized
expense ratio (%) |
| | Actual | Hypothetical | Actual | Hypothetical | Actual | Hypothetical | Actual |
| Class A | 1,000.00 | 1,000.00 | 995.40 | 1,021.52 | 3.27 | 3.31 | 0.66 |
| Advisor Class | 1,000.00 | 1,000.00 | 997.60 | 1,022.76 | 2.03 | 2.06 | 0.41 |
| Class C | 1,000.00 | 1,000.00 | 991.70 | 1,017.80 | 6.96 | 7.05 | 1.41 |
| Institutional Class | 1,000.00 | 1,000.00 | 996.60 | 1,022.76 | 2.03 | 2.06 | 0.41 |
| Institutional 2 Class | 1,000.00 | 1,000.00 | 996.80 | 1,022.91 | 1.88 | 1.91 | 0.38 |
| Institutional 3 Class | 1,000.00 | 1,000.00 | 997.00 | 1,023.16 | 1.63 | 1.66 | 0.33 |
Expenses paid during the period are equal to the annualized expense ratio for each class as indicated above, multiplied by the average account value over the period and then multiplied by the number of days in the Fund’s most recent fiscal half year and divided by 365.
Expenses do not include fees and expenses incurred indirectly by the Fund from its investment in underlying funds, including affiliated and non-affiliated pooled investment vehicles, such as mutual funds and exchange-traded funds.
Had Columbia Management Investment Advisers, LLC and/or certain of its affiliates not waived/reimbursed certain fees and expenses, account value at the end of the period would have been reduced.
| 6 | Columbia Short Term Municipal Bond Fund | Annual Report 2018 |
Portfolio of Investments
April 30, 2018
(Percentages represent value of investments compared to net assets)
Investments in securities
| Floating Rate Notes 3.0% |
| Issue Description | Effective
Yield | | Principal
Amount ($) | Value ($) |
| California 0.8% |
| Grossmont Union High School District(a),(b),(c) |
| Prerefunded 08/01/18 Unlimited General Obligation Bonds |
| Election of 2004 |
| Series 2008 (JPMorgan Chase Bank) |
| 08/01/2018 | 1.850% | | 4,545,000 | 4,545,000 |
| Unlimited General Obligation Bonds |
| Election of 2008 |
| Series 2010B (JPMorgan Chase Bank) |
| 08/01/2018 | 1.850% | | 4,850,000 | 4,850,000 |
| Total | 9,395,000 |
| Minnesota 0.6% |
| City of Minneapolis/St. Paul Housing & Redevelopment Authority(b),(c) |
| Revenue Bonds |
| Allina Health Systems |
| Series 2009B-1 (JPMorgan Chase Bank) |
| 11/15/2035 | 1.520% | | 6,600,000 | 6,600,000 |
| New York 0.5% |
| New York City Transitional Finance Authority Future Tax Secured(b),(c) |
| Revenue Bonds |
| Subordinated Series 2015 (Royal Bank of Canada) |
| 08/01/2041 | 1.550% | | 4,000,000 | 4,000,000 |
| New York City Water & Sewer System(b),(c) |
| Revenue Bonds |
| 2nd General Resolution |
| Series 2013DD-2 (JPMorgan Chase Bank) |
| 06/15/2043 | 1.550% | | 2,300,000 | 2,300,000 |
| Total | 6,300,000 |
| Pennsylvania 0.4% |
| Geisinger Authority(b),(c) |
| Revenue Bonds |
| Geisinger Health System |
| Series 2013 (Wells Fargo Bank) |
| 10/01/2043 | 1.530% | | 4,400,000 | 4,400,000 |
| Tennessee 0.7% |
| Metropolitan Government of Nashville & Davidson County Water & Sewer(b),(c) |
| Revenue Bonds |
| Series 1977 Escrowed to Maturity (JPMorgan Chase Bank) |
| 07/01/2021 | 1.950% | | 7,500,000 | 7,500,000 |
Total Floating Rate Notes
(Cost $34,195,000) | 34,195,000 |
|
| Municipal Bonds 82.3% |
| Issue Description | Coupon
Rate | | Principal
Amount ($) | Value ($) |
| Alabama 2.1% |
| Alabama 21st Century Authority |
| Revenue Bonds |
| Series 2012A |
| 06/01/2018 | 5.000% | | 1,250,000 | 1,253,935 |
| Alabama Federal Aid Highway Finance Authority |
| Revenue Bonds |
| Grant Anticipation - GARVEE |
| Series 2012 |
| 09/01/2020 | 5.000% | | 2,210,000 | 2,356,523 |
| Black Belt Energy Gas District |
| Revenue Bonds |
| Series 2016A |
| 07/01/2046 | 4.000% | | 5,000,000 | 5,217,950 |
| Series 2018A |
| 12/01/2048 | 4.000% | | 3,000,000 | 3,194,250 |
| Black Belt Energy Gas District(d) |
| Revenue Bonds |
| Series 2018B-2 |
Muni Swap Index Yield + 0.620%
12/01/2048 | 2.370% | | 5,000,000 | 5,000,000 |
| Industrial Development Board of the City of Mobile |
| Revenue Bonds |
| Alabama Power Co.-Barry Plant |
| Series 2015 |
| 07/15/2034 | 1.625% | | 3,250,000 | 3,245,060 |
| State of Alabama Docks Department |
| Refunding Revenue Bonds |
| Docks Facilities |
| Series 2017B |
| 10/01/2018 | 5.000% | | 1,295,000 | 1,309,931 |
| 10/01/2019 | 5.000% | | 1,275,000 | 1,322,953 |
| 10/01/2020 | 5.000% | | 1,280,000 | 1,359,744 |
| Total | 24,260,346 |
| Alaska 0.9% |
| Alaska Industrial Development & Export Authority |
| Revenue Bonds |
| Yukon-Kuskokwim Health Corp. Project |
| Series 2017 |
| 12/01/2020 | 3.500% | | 5,300,000 | 5,358,512 |
| Alaska Railroad Corp. |
| Refunding Revenue Bonds |
| Sections 5307 & 5337 |
| Series 2015 |
| 08/01/2018 | 5.000% | | 4,500,000 | 4,533,615 |
| Total | 9,892,127 |
The accompanying Notes to Financial Statements are an integral part of this statement.
Columbia Short Term Municipal Bond Fund | Annual Report 2018
| 7 |
Portfolio of Investments (continued)
April 30, 2018
| Municipal Bonds (continued) |
| Issue Description | Coupon
Rate | | Principal
Amount ($) | Value ($) |
| Arizona 0.7% |
| Arizona Health Facilities Authority |
| Refunding Revenue Bonds |
| Banner Health |
| Series 2015A |
| 01/01/2021 | 5.000% | | 2,435,000 | 2,613,680 |
| Maricopa County Industrial Development Authority |
| Revenue Bonds |
| Banner Health |
| Series 2017B |
| 01/01/2048 | 5.000% | | 4,500,000 | 4,998,195 |
| Total | 7,611,875 |
| Arkansas 0.7% |
| Arkansas Development Finance Authority |
| Refunding Revenue Bonds |
| Baptist Health |
| Series 2015A |
| 12/01/2019 | 5.000% | | 8,095,000 | 8,478,622 |
| California 2.8% |
| Brea Redevelopment Agency |
| Refunding Tax Allocation Bonds |
| Redevelopment Project |
| Series 2013 |
| 08/01/2018 | 5.000% | | 995,000 | 1,003,259 |
| California Municipal Finance Authority |
| Refunding Revenue Bonds |
| Community Medical Centers |
| Series 2017A |
| 02/01/2019 | 5.000% | | 1,635,000 | 1,668,321 |
| 02/01/2020 | 5.000% | | 1,100,000 | 1,152,085 |
| 02/01/2021 | 5.000% | | 1,200,000 | 1,284,408 |
| 02/01/2022 | 5.000% | | 1,000,000 | 1,090,360 |
| California Pollution Control Financing Authority(a),(e) |
| Revenue Bonds |
| Waste Management Project |
| Series 2017 AMT |
| 07/01/2031 | 1.600% | | 9,000,000 | 9,000,000 |
| California Statewide Communities Development Authority(a) |
| Refunding Revenue Bonds |
| California Baptist University |
| Series 2017A |
| 11/01/2022 | 3.000% | | 2,000,000 | 1,995,820 |
| County of Los Angeles(f) |
| Certificate of Participation |
| Capital Appreciation - Disney Parking Project |
| Series 1993 (AMBAC) |
| 09/01/2019 | 0.000% | | 2,650,000 | 2,587,910 |
| Municipal Bonds (continued) |
| Issue Description | Coupon
Rate | | Principal
Amount ($) | Value ($) |
| Norman Y. Mineta San Jose International Airport(e) |
| Refunding Revenue Bonds |
| Series 2017A AMT |
| 03/01/2021 | 5.000% | | 2,750,000 | 2,956,167 |
| 03/01/2022 | 5.000% | | 1,750,000 | 1,918,875 |
| Palm Desert Redevelopment Agency |
| Refunding Tax Allocation Bonds |
| Series 2017A |
| 10/01/2019 | 4.000% | | 950,000 | 978,899 |
| Series 2017A (BAM) |
| 10/01/2021 | 5.000% | | 850,000 | 932,255 |
| Palomar Health |
| Refunding Revenue Bonds |
| Series 2016 |
| 11/01/2018 | 4.000% | | 875,000 | 881,099 |
| 11/01/2019 | 4.000% | | 1,500,000 | 1,527,540 |
| 11/01/2020 | 5.000% | | 2,235,000 | 2,352,807 |
| Total | 31,329,805 |
| Colorado 1.9% |
| City & County of Denver Airport System(e) |
| Revenue Bonds |
| Series 2011A AMT |
| 11/15/2021 | 5.000% | | 5,000,000 | 5,434,600 |
| Colorado Health Facilities Authority |
| Refunding Revenue Bonds |
| Evangelical Lutheran Good Samaritan Society |
| Series 2015 |
| 06/01/2018 | 3.000% | | 550,000 | 550,563 |
| 06/01/2019 | 4.000% | | 900,000 | 917,289 |
| Series 2017 |
| 06/01/2019 | 5.000% | | 950,000 | 976,277 |
| 06/01/2021 | 5.000% | | 700,000 | 750,701 |
| Dawson Ridge Metropolitan District No. 1(f) |
| Limited General Obligation Refunding Bonds |
| Series 1992B Escrowed to maturity |
| 10/01/2022 | 0.000% | | 3,375,000 | 3,035,036 |
| E-470 Public Highway Authority |
| Refunding Revenue Bonds |
| Series 2015A |
| 09/01/2019 | 5.000% | | 1,000,000 | 1,039,840 |
| University of Colorado Hospital Authority |
| Revenue Bonds |
| Obligation Group |
| Series 2017 |
| 11/15/2038 | 5.000% | | 3,650,000 | 3,953,132 |
| 11/15/2047 | 4.000% | | 4,700,000 | 4,817,688 |
| Total | 21,475,126 |
The accompanying Notes to Financial Statements are an integral part of this statement.
| 8 | Columbia Short Term Municipal Bond Fund | Annual Report 2018 |
Portfolio of Investments (continued)
April 30, 2018
| Municipal Bonds (continued) |
| Issue Description | Coupon
Rate | | Principal
Amount ($) | Value ($) |
| Connecticut 4.6% |
| City of New Britain |
| Unlimited General Obligation Refunding Bonds |
| Series 2016A (BAM) |
| 03/01/2020 | 5.000% | | 1,000,000 | 1,056,040 |
| 03/01/2021 | 5.000% | | 1,500,000 | 1,611,180 |
| City of Waterbury |
| Unlimited General Obligation Bonds |
| Series 2017A |
| 11/15/2019 | 3.000% | | 500,000 | 506,915 |
| 11/15/2020 | 4.000% | | 350,000 | 365,544 |
| 11/15/2021 | 5.000% | | 500,000 | 544,880 |
| Unlimited General Obligation Refunding Bonds |
| Series 2017B |
| 09/01/2019 | 3.000% | | 325,000 | 328,942 |
| 09/01/2020 | 4.000% | | 330,000 | 343,646 |
| 09/01/2021 | 5.000% | | 425,000 | 461,291 |
| Connecticut Housing Finance Authority |
| Refunding Revenue Bonds |
| Subordinated Series 2016E-1 |
| 11/15/2046 | 3.500% | | 8,870,000 | 9,095,830 |
| Revenue Bonds |
| Series 2014A-1 |
| 11/15/2044 | 4.000% | | 2,775,000 | 2,864,688 |
| Connecticut Housing Finance Authority(e) |
| Refunding Revenue Bonds |
| Subordinated Series 2018A-2 AMT |
| 05/15/2021 | 2.150% | | 1,595,000 | 1,561,983 |
| 11/15/2021 | 2.250% | | 1,625,000 | 1,590,371 |
| 05/15/2022 | 2.375% | | 1,460,000 | 1,431,048 |
| Revenue Bonds |
| Subordinated Series 2017 C-2 AMT |
| 05/15/2020 | 2.750% | | 1,630,000 | 1,641,915 |
| 05/15/2021 | 3.000% | | 2,680,000 | 2,715,001 |
| 11/15/2021 | 3.000% | | 4,435,000 | 4,479,971 |
| Connecticut State Health & Educational Facility Authority(a) |
| Revenue Bonds |
| Church Home of Hartford, Inc. |
| Series 2016 |
| 09/01/2020 | 2.875% | | 390,000 | 390,152 |
| 09/01/2021 | 3.250% | | 635,000 | 635,121 |
| State of Connecticut |
| Unlimited General Obligation Bonds |
| Series 2018A |
| 04/15/2020 | 5.000% | | 2,000,000 | 2,102,520 |
| Unlimited General Obligation Refunding Bonds |
| Series 2014C |
| 12/15/2018 | 5.000% | | 5,200,000 | 5,302,284 |
| Series 2014H |
| 11/15/2019 | 5.000% | | 5,000,000 | 5,213,350 |
| Municipal Bonds (continued) |
| Issue Description | Coupon
Rate | | Principal
Amount ($) | Value ($) |
| State of Connecticut Special Tax Revenue |
| Revenue Bonds |
| Transportation Infrastructure |
| Series 2016A |
| 09/01/2021 | 5.000% | | 7,000,000 | 7,551,040 |
| Total | 51,793,712 |
| Florida 2.9% |
| Citizens Property Insurance Corp. |
| Revenue Bonds |
| Series 2015A-1 |
| 06/01/2020 | 5.000% | | 3,925,000 | 4,107,866 |
| City of Cape Coral Water & Sewer |
| Refunding Special Assessment Bonds |
| Various Areas |
| Series 2017 (AGM) |
| 09/01/2019 | 1.650% | | 995,000 | 987,766 |
| 09/01/2020 | 1.900% | | 990,000 | 973,526 |
| City of Orlando |
| Refunding Revenue Bonds |
| Senior Lien Tourist Development Tax |
| Series 2017 (AGM) |
| 11/01/2020 | 4.000% | | 850,000 | 887,613 |
| 11/01/2021 | 4.000% | | 900,000 | 951,444 |
| County of Broward Airport System(e) |
| Refunding Revenue Bonds |
| Series 2015C AMT |
| 10/01/2019 | 5.000% | | 3,000,000 | 3,124,800 |
| 10/01/2020 | 5.000% | | 1,885,000 | 2,011,144 |
| Revenue Bonds |
| Series 2017 AMT |
| 10/01/2021 | 5.000% | | 1,480,000 | 1,609,441 |
| County of Lee Solid Waste System(e) |
| Refunding Revenue Bonds |
| Series 2016 (NPFGC) AMT |
| 10/01/2022 | 5.000% | | 3,100,000 | 3,371,839 |
| County of Miami-Dade Aviation(e) |
| Refunding Revenue Bonds |
| Series 2014 AMT |
| 10/01/2020 | 5.000% | | 2,000,000 | 2,129,940 |
| Florida Housing Finance Corp. |
| Revenue Bonds |
| Homeowner Mortgage Special Program |
| Series 2010A (GNMA / FNMA / FHLMC) |
| 07/01/2028 | 5.000% | | 495,000 | 498,732 |
| Florida Ports Financing Commission(e) |
| Refunding Revenue Bonds |
| Transportation Fund |
| Seris 2011B AMT |
| 06/01/2023 | 5.000% | | 3,000,000 | 3,237,660 |
The accompanying Notes to Financial Statements are an integral part of this statement.
Columbia Short Term Municipal Bond Fund | Annual Report 2018
| 9 |
Portfolio of Investments (continued)
April 30, 2018
| Municipal Bonds (continued) |
| Issue Description | Coupon
Rate | | Principal
Amount ($) | Value ($) |
| Hillsborough County Aviation Authority(e) |
| Refunding Revenue Bonds |
| Tampa International |
| Subordinated Series 2013A AMT |
| 10/01/2019 | 5.000% | | 2,000,000 | 2,083,480 |
| Pasco County School Board |
| Revenue Bonds |
| Series 2013 |
| 10/01/2018 | 5.000% | | 1,000,000 | 1,013,160 |
| School Board of Miami-Dade County (The) |
| Refunding Bonds Certificate of Participation |
| Series 2015D |
| 02/01/2020 | 5.000% | | 2,250,000 | 2,361,690 |
| Refunding Certificate of Participation |
| Series 2015A |
| 05/01/2019 | 5.000% | | 2,000,000 | 2,059,960 |
| St. John’s County School Board |
| Refunding Certificate of Participation |
| Series 2015 |
| 07/01/2020 | 5.000% | | 2,000,000 | 2,123,760 |
| Total | 33,533,821 |
| Georgia 2.3% |
| Burke County Development Authority |
| Refunding Revenue Bonds |
| Georgia Power Co. Plant Vogtle Project |
| Series 2015 |
| 10/01/2032 | 2.350% | | 7,700,000 | 7,655,494 |
| Georgia Power Company Plant Vogtle |
| Series 2017 |
| 12/01/2049 | 1.850% | | 4,350,000 | 4,314,939 |
| City of Atlanta |
| Refunding Tax Allocation Bonds |
| Atlantic Station Project |
| Series 2017 |
| 12/01/2019 | 5.000% | | 1,000,000 | 1,044,520 |
| 12/01/2020 | 5.000% | | 1,000,000 | 1,065,180 |
| Georgia Housing & Finance Authority |
| Refunding Revenue Bonds |
| Single Family Mortgage |
| Series 2016A-1 |
| 12/01/2046 | 3.500% | | 3,190,000 | 3,271,281 |
| Main Street Natural Gas, Inc. |
| Revenue Bonds |
| Series 2007A |
| 03/15/2021 | 5.000% | | 5,000,000 | 5,364,000 |
| Monroe County Development Authority |
| Revenue Bonds |
| Georgia Power Co. Plant Scherer |
| Series 2015 |
| 10/01/2048 | 2.350% | | 4,000,000 | 3,976,880 |
| Total | 26,692,294 |
| Municipal Bonds (continued) |
| Issue Description | Coupon
Rate | | Principal
Amount ($) | Value ($) |
| Illinois 13.7% |
| Chicago Board of Education |
| Unlimited General Obligation Refunding Bonds |
| Dedicated |
| Series 2017F |
| 12/01/2019 | 5.000% | | 6,000,000 | 6,160,320 |
| Chicago O’Hare International Airport(e) |
| Refunding Revenue Bonds |
| General Senior Lien |
| Series 2012B AMT |
| 01/01/2022 | 5.000% | | 5,000,000 | 5,434,900 |
| Series 2013A AMT |
| 01/01/2022 | 5.000% | | 5,675,000 | 6,168,611 |
| Revenue Bonds |
| General Purpose Senior Lien |
| Series 2013C AMT |
| 01/01/2021 | 5.000% | | 2,035,000 | 2,173,950 |
| Chicago O’Hare International Airport |
| Refunding Revenue Bonds |
| Series 2015B |
| 01/01/2020 | 5.000% | | 3,000,000 | 3,140,940 |
| 01/01/2021 | 5.000% | | 4,000,000 | 4,288,120 |
| Chicago Park District |
| Limited General Obligation Refunding Bonds |
| Series 2015B |
| 01/01/2019 | 4.000% | | 1,750,000 | 1,767,710 |
| Series 2015C |
| 01/01/2019 | 4.000% | | 1,805,000 | 1,823,267 |
| Limited Tax General Obligation Refunding Bonds |
| Series 2014D |
| 01/01/2020 | 5.000% | | 1,000,000 | 1,040,960 |
| 01/01/2021 | 5.000% | | 1,000,000 | 1,060,020 |
| Chicago Transit Authority |
| Refunding Revenue Bonds |
| Federal Transit Administration Section 5307 |
| Series 2015 |
| 06/01/2018 | 5.000% | | 6,000,000 | 6,015,612 |
| 06/01/2019 | 5.000% | | 5,000,000 | 5,145,900 |
| Federal Transit Administration Section 5307 Urbanized Area Formula Funds |
| Series 2015 |
| 06/01/2020 | 5.000% | | 11,250,000 | 11,844,675 |
| City of Chicago |
| Prerefunded 01/01/20 Revenue Bonds |
| Series 2009A |
| 01/01/2022 | 5.000% | | 2,090,000 | 2,192,055 |
| Refunding General Obligation Unlimited Bonds |
| Project |
| Series 2014A |
| 01/01/2020 | 4.000% | | 1,175,000 | 1,190,263 |
| Series 2015 |
| 01/01/2020 | 5.000% | | 1,625,000 | 1,673,555 |
The accompanying Notes to Financial Statements are an integral part of this statement.
| 10 | Columbia Short Term Municipal Bond Fund | Annual Report 2018 |
Portfolio of Investments (continued)
April 30, 2018
| Municipal Bonds (continued) |
| Issue Description | Coupon
Rate | | Principal
Amount ($) | Value ($) |
| Unlimited General Obligation Bonds |
| Series 2015A |
| 01/01/2019 | 5.000% | | 1,300,000 | 1,318,291 |
| 01/01/2020 | 5.000% | | 3,480,000 | 3,583,982 |
| Unlimited General Obligation Notes |
| Series 2015A |
| 01/01/2021 | 5.000% | | 5,000,000 | 5,213,550 |
| Unlimited General Obligation Refunding Bonds |
| Project |
| Series 2014A |
| 01/01/2021 | 5.000% | | 4,875,000 | 5,083,211 |
| Series 2016C |
| 01/01/2022 | 5.000% | | 5,000,000 | 5,231,050 |
| City of Chicago Wastewater Transmission |
| Refunding Revenue Bonds |
| 2nd Lien |
| Series 2015C |
| 01/01/2019 | 5.000% | | 2,810,000 | 2,863,362 |
| 01/01/2020 | 5.000% | | 1,000,000 | 1,042,630 |
| 01/01/2021 | 5.000% | | 1,000,000 | 1,066,940 |
| City of Chicago Waterworks |
| Refunding Revenue Bonds |
| 2nd Lien |
| Series 2016 |
| 11/01/2018 | 5.000% | | 1,000,000 | 1,015,070 |
| 11/01/2019 | 5.000% | | 3,000,000 | 3,122,610 |
| 11/01/2020 | 5.000% | | 5,000,000 | 5,320,800 |
| Revenue Bonds |
| 2nd Lien Project |
| Series 2014 |
| 11/01/2018 | 4.000% | | 1,000,000 | 1,010,140 |
| Second Lien |
| Series 2012 |
| 11/01/2021 | 4.000% | | 1,500,000 | 1,570,275 |
| City of Chicago Waterworks(f) |
| Revenue Bonds |
| Capital Appreciation Senior Lien |
| Series 2000 (AMBAC) |
| 11/01/2019 | 0.000% | | 5,550,000 | 5,341,819 |
| City of Springfield Electric |
| Refunding Revenue Bonds |
| Senior Lien |
| Series 2015 |
| 03/01/2019 | 5.000% | | 2,000,000 | 2,047,780 |
| 03/01/2020 | 5.000% | | 2,000,000 | 2,098,040 |
| Illinois Finance Authority |
| Refunding Revenue Bonds |
| Advocate Health Care |
| Series 2014 |
| 08/01/2019 | 5.000% | | 600,000 | 622,728 |
| Municipal Bonds (continued) |
| Issue Description | Coupon
Rate | | Principal
Amount ($) | Value ($) |
| Swedish Covenant Hospital |
| Series 2016 |
| 08/15/2018 | 5.000% | | 200,000 | 201,208 |
| 08/15/2019 | 5.000% | | 495,000 | 507,756 |
| 08/15/2020 | 5.000% | | 400,000 | 417,800 |
| 08/15/2021 | 5.000% | | 455,000 | 482,232 |
| Illinois Finance Authority(d) |
| Refunding Revenue Bonds |
| Presbyterian Home |
| Series 2016 |
1-month USD LIBOR + 1.350%
05/01/2036 | 2.671% | | 2,400,000 | 2,408,496 |
| Illinois State Toll Highway Authority |
| Refunding Revenue Bonds |
| Series 2014A |
| 12/01/2020 | 5.000% | | 5,330,000 | 5,712,001 |
| Kane Cook & DuPage Counties School District No. U-46 Elgin |
| Unlimited General Obligation Refunding Bonds |
| Series 2015C |
| 01/01/2019 | 5.000% | | 1,250,000 | 1,274,238 |
| 01/01/2020 | 5.000% | | 1,500,000 | 1,568,460 |
| Northern Illinois Municipal Power Agency |
| Refunding Revenue Bonds |
| Series 2016A |
| 12/01/2022 | 5.000% | | 1,500,000 | 1,654,485 |
| Regional Transportation Authority |
| Revenue Bonds |
| Series 2003A (NPFGC) |
| 07/01/2022 | 5.500% | | 3,470,000 | 3,879,113 |
| Series 2006A (NPFGC) |
| 07/01/2018 | 5.000% | | 4,970,000 | 4,982,673 |
| State of Illinois |
| Unlimited General Obligation Bonds |
| Series 2013CR (AGM) |
| 04/01/2021 | 5.000% | | 7,180,000 | 7,633,417 |
| Series 2014 |
| 04/01/2019 | 5.000% | | 5,000,000 | 5,092,100 |
| Series 2016 |
| 01/01/2020 | 5.000% | | 2,500,000 | 2,563,650 |
| Series 2017D |
| 11/01/2021 | 5.000% | | 5,000,000 | 5,204,750 |
| Unrefunded Revenue Bonds |
| Build Illinois |
| Series 2009B |
| 06/15/2020 | 5.000% | | 1,415,000 | 1,462,530 |
| University of Illinois |
| Refunding Certificate of Participation |
| Series 2014C |
| 03/15/2019 | 5.000% | | 1,555,000 | 1,589,677 |
| Total | 155,307,722 |
The accompanying Notes to Financial Statements are an integral part of this statement.
Columbia Short Term Municipal Bond Fund | Annual Report 2018
| 11 |
Portfolio of Investments (continued)
April 30, 2018
| Municipal Bonds (continued) |
| Issue Description | Coupon
Rate | | Principal
Amount ($) | Value ($) |
| Indiana 1.2% |
| Indiana Finance Authority |
| Refunding Revenue Bonds |
| Indiana University Health |
| Series 2016A |
| 12/01/2019 | 5.000% | | 1,100,000 | 1,152,305 |
| Indiana Health & Educational Facilities Financing Authority |
| Revenue Bonds |
| Ascension Senior Credit |
| Series 2016 |
| 11/15/2031 | 1.750% | | 5,000,000 | 4,898,100 |
| Indiana Health Facility Financing Authority |
| Revenue Bonds |
| Ascension Health Subordinated Credit Group |
| Series 2016 |
| 11/01/2027 | 1.250% | | 3,565,000 | 3,494,378 |
| Indiana Housing & Community Development Authority(e) |
| Refunding Revenue Bonds |
| Series 2017A-2 (GNMA) AMT |
| 01/01/2039 | 4.000% | | 1,885,000 | 1,954,104 |
| Series 2017C-2 (GNMA) AMT |
| 01/01/2037 | 4.000% | | 2,000,000 | 2,074,640 |
| Total | 13,573,527 |
| Iowa 0.3% |
| People’s Memorial Hospital of Buchanan County |
| Revenue Bonds |
| Series 2016 |
| 12/01/2018 | 1.500% | | 3,000,000 | 2,981,760 |
| Kentucky 1.6% |
| Kentucky Economic Development Finance Authority |
| Refunding Revenue Bonds |
| Owensboro Health System |
| Series 2017A |
| 06/01/2021 | 5.000% | | 1,000,000 | 1,055,390 |
| 06/01/2022 | 5.000% | | 1,000,000 | 1,067,920 |
| Kentucky State Property & Building Commission |
| Refunding Revenue Bonds |
| Project #108 |
| Series 2015B |
| 08/01/2019 | 5.000% | | 2,500,000 | 2,589,975 |
| Project #112 |
| Series 2016B |
| 11/01/2021 | 5.000% | | 6,000,000 | 6,516,120 |
| Project #117 |
| Series 2017D |
| 05/01/2020 | 5.000% | | 2,500,000 | 2,634,025 |
| 05/01/2021 | 5.000% | | 2,000,000 | 2,151,320 |
| Municipal Bonds (continued) |
| Issue Description | Coupon
Rate | | Principal
Amount ($) | Value ($) |
| Project No. 100 |
| Series 2011A |
| 08/01/2018 | 5.000% | | 2,500,000 | 2,519,225 |
| Total | 18,533,975 |
| Louisiana 0.2% |
| State of Louisiana |
| Unlimited General Obligation Bonds |
| Series 2015B |
| 05/01/2019 | 5.000% | | 2,530,000 | 2,609,138 |
| Maine 0.3% |
| Maine State Housing Authority |
| Revenue Bonds |
| Series 2016B-1 |
| 11/15/2046 | 3.500% | | 3,870,000 | 3,967,331 |
| Maryland 0.1% |
| Maryland Health & Higher Educational Facilities Authority |
| Refunding Revenue Bonds |
| Meritus Medical Center Issue |
| Series 2015 |
| 07/01/2018 | 5.000% | | 305,000 | 306,360 |
| 07/01/2019 | 5.000% | | 500,000 | 515,575 |
| Total | 821,935 |
| Massachusetts 1.6% |
| Massachusetts Educational Financing Authority(e) |
| Refunding Revenue Bonds |
| Issue K |
| Senior Series 2017A AMT |
| 07/01/2020 | 4.000% | | 375,000 | 386,685 |
| 07/01/2021 | 4.000% | | 1,000,000 | 1,039,450 |
| Series 2016J AMT |
| 07/01/2019 | 4.000% | | 2,500,000 | 2,548,475 |
| 07/01/2020 | 4.000% | | 2,150,000 | 2,216,994 |
| Revenue Bonds |
| Education Loan |
| Series 2014-I AMT |
| 01/01/2019 | 5.000% | | 2,000,000 | 2,035,580 |
| Series 2015A AMT |
| 01/01/2019 | 5.000% | | 3,000,000 | 3,053,370 |
| 01/01/2022 | 5.000% | | 3,500,000 | 3,763,690 |
| Massachusetts Housing Finance Agency(e) |
| Refunding Revenue Bonds |
| Single Family |
| Series 2017-188 AMT |
| 12/01/2020 | 1.700% | | 885,000 | 864,194 |
| 06/01/2021 | 1.800% | | 685,000 | 665,464 |
The accompanying Notes to Financial Statements are an integral part of this statement.
| 12 | Columbia Short Term Municipal Bond Fund | Annual Report 2018 |
Portfolio of Investments (continued)
April 30, 2018
| Municipal Bonds (continued) |
| Issue Description | Coupon
Rate | | Principal
Amount ($) | Value ($) |
| Massachusetts Housing Finance Agency |
| Revenue Bonds |
| Construction Loan Notes |
| Series 2017B |
| 12/01/2021 | 2.050% | | 2,000,000 | 1,972,720 |
| Total | 18,546,622 |
| Michigan 1.0% |
| Michigan Finance Authority |
| Refunding Revenue Bonds |
| Senior Lien - Great Lakes Water Authority |
| Series 2014C-5 |
| 07/01/2018 | 5.000% | | 2,165,000 | 2,175,717 |
| Series 2014H-1 |
| 10/01/2019 | 5.000% | | 1,415,000 | 1,472,251 |
| Michigan Finance Authority(e) |
| Refunding Revenue Bonds |
| Student Loan |
| Series 2014 25-A AMT |
| 11/01/2018 | 5.000% | | 2,220,000 | 2,250,680 |
| 11/01/2019 | 5.000% | | 1,250,000 | 1,298,825 |
| Royal Oak School District |
| Unlimited General Obligation Refunding Bonds |
| Series 2014 |
| 05/01/2019 | 5.000% | | 450,000 | 464,170 |
| Wayne County Airport Authority(e) |
| Refunding Revenue Bonds |
| Junior Lien |
| Series 2017B AMT |
| 12/01/2018 | 5.000% | | 350,000 | 356,066 |
| 12/01/2019 | 5.000% | | 500,000 | 522,020 |
| 12/01/2020 | 5.000% | | 550,000 | 585,706 |
| 12/01/2021 | 5.000% | | 1,000,000 | 1,085,100 |
| 12/01/2022 | 5.000% | | 1,100,000 | 1,207,305 |
| Total | 11,417,840 |
| Minnesota 1.8% |
| City of Maple Grove |
| Refunding Revenue Bonds |
| Maple Grove Hospital Corp. |
| Series 2017 |
| 05/01/2020 | 4.000% | | 785,000 | 812,153 |
| 05/01/2021 | 4.000% | | 500,000 | 523,890 |
| 05/01/2022 | 4.000% | | 500,000 | 528,950 |
| City of Minneapolis |
| Revenue Bonds |
| Housing - 1500 Nicollet Apartments Project |
| Series 2017 |
| 05/01/2021 | 3.000% | | 1,450,000 | 1,438,748 |
| Municipal Bonds (continued) |
| Issue Description | Coupon
Rate | | Principal
Amount ($) | Value ($) |
| Hastings Independent School District No. 200(f) |
| Unlimited General Obligation Bonds |
| Student Credit Enhancement Program School Building |
| Series 2018A |
| 02/01/2023 | 0.000% | | 800,000 | 708,000 |
| Housing & Redevelopment Authority of The City of St. Paul |
| Refunding Revenue Bonds |
| Fairview Health Services |
| Series 2017 |
| 11/15/2021 | 5.000% | | 1,460,000 | 1,597,284 |
| 11/15/2022 | 5.000% | | 600,000 | 668,304 |
| Revenue Bonds |
| Union Flats Apartments Project |
| Series 2017B |
| 02/01/2022 | 2.750% | | 2,125,000 | 2,088,216 |
| Minnesota Housing Finance Agency |
| Refunding Revenue Bonds |
| Non-Ace Residential Housing |
| Series 2016S (GNMA) |
| 07/01/2046 | 3.500% | | 6,815,000 | 6,990,214 |
| Minnesota Housing Finance Agency(e) |
| Refunding Revenue Bonds |
| Residential Housing |
| Series 2014C (GNMA) AMT |
| 07/01/2019 | 1.800% | | 1,440,000 | 1,435,536 |
| Series 2017D (FNMA) AMT |
| 01/01/2020 | 2.000% | | 1,000,000 | 992,570 |
| Series 2017D (GNMA) AMT |
| 07/01/2019 | 1.800% | | 1,000,000 | 994,720 |
| 01/01/2021 | 2.200% | | 1,575,000 | 1,553,800 |
| Total | 20,332,385 |
| Mississippi 0.3% |
| Mississippi Development Bank |
| Refunding Revenue Bonds |
| Jackson Public School District Project |
| Series 2015A |
| 04/01/2020 | 5.000% | | 1,000,000 | 1,052,750 |
| State of Mississippi |
| Revenue Bonds |
| Series 2015E |
| 10/15/2018 | 4.000% | | 2,080,000 | 2,098,720 |
| Total | 3,151,470 |
| Missouri 1.4% |
| Cape Girardeau County Industrial Development Authority |
| Refunding Revenue Bonds |
| SoutheastHEALTH |
| Series 2017 |
| 03/01/2019 | 5.000% | | 300,000 | 306,240 |
| 03/01/2020 | 5.000% | | 325,000 | 338,904 |
| 03/01/2021 | 5.000% | | 400,000 | 423,100 |
The accompanying Notes to Financial Statements are an integral part of this statement.
Columbia Short Term Municipal Bond Fund | Annual Report 2018
| 13 |
Portfolio of Investments (continued)
April 30, 2018
| Municipal Bonds (continued) |
| Issue Description | Coupon
Rate | | Principal
Amount ($) | Value ($) |
| City of St. Louis Airport |
| Refunding Revenue Bonds |
| Lambert-St. Louis International Airport |
| Series 2013 |
| 07/01/2018 | 5.000% | | 765,000 | 768,848 |
| Kansas City Planned Industrial Expansion Authority |
| Revenue Bonds |
| 2nd & DE Apartments |
| Series 2016 |
| 12/01/2018 | 1.500% | | 6,430,000 | 6,414,439 |
| Missouri Joint Municipal Electric Utility Commission |
| Refunding Revenue Bonds |
| Series 2014 |
| 01/01/2020 | 5.000% | | 7,825,000 | 8,205,764 |
| Total | 16,457,295 |
| Nebraska 1.8% |
| Central Plains Energy Project |
| Refunding Revenue Bonds |
| Series 2014 (Royal Bank of Canada) |
| 08/01/2039 | 5.000% | | 14,500,000 | 15,120,165 |
| Public Power Generation Agency |
| Refunding Revenue Bonds |
| Whelan Energy Center Unit |
| Series 2015 |
| 01/01/2019 | 5.000% | | 2,250,000 | 2,297,093 |
| 01/01/2020 | 5.000% | | 3,030,000 | 3,179,985 |
| Total | 20,597,243 |
| Nevada 1.7% |
| County of Clark Department of Aviation(e) |
| Refunding Revenue Bonds |
| Airport System Junior Subordinated Lien |
| Series 2017C AMT |
| 07/01/2021 | 5.000% | | 5,000,000 | 5,382,550 |
| Las Vegas McCarran International Airport |
| Series 2017 AMT |
| 07/01/2021 | 5.000% | | 2,500,000 | 2,696,825 |
| 07/01/2022 | 5.000% | | 2,240,000 | 2,453,562 |
| Subordinated Series 2017A-1 AMT |
| 07/01/2022 | 5.000% | | 3,000,000 | 3,286,020 |
| County of Washoe(e) |
| Refunding Revenue Bonds |
| Sierra Pacific Power |
| Series 2016S AMT |
| 08/01/2031 | 1.500% | | 5,500,000 | 5,452,480 |
| Total | 19,271,437 |
| Municipal Bonds (continued) |
| Issue Description | Coupon
Rate | | Principal
Amount ($) | Value ($) |
| New Jersey 4.2% |
| City of Atlantic City |
| Unlimited General Obligation Bonds |
| Tax Appeal |
| Series 2017B (AGM) |
| 03/01/2019 | 4.000% | | 500,000 | 507,395 |
| 03/01/2020 | 5.000% | | 400,000 | 419,016 |
| 03/01/2021 | 5.000% | | 650,000 | 691,737 |
| 03/01/2022 | 5.000% | | 500,000 | 540,050 |
| New Jersey Building Authority |
| Refunding Revenue Bonds |
| Series 2009 Escrowed to Maturity |
| 12/15/2018 | 5.000% | | 175,000 | 178,386 |
| Series 2009A |
| 12/15/2018 | 5.000% | | 2,520,000 | 2,563,898 |
| New Jersey Economic Development Authority |
| Refunding Revenue Bonds |
| School Facilities Construction |
| Series 2013 |
| 03/01/2023 | 5.000% | | 2,520,000 | 2,712,074 |
| Series 2014 Escrowed to Maturity |
| 06/15/2018 | 5.000% | | 1,400,000 | 1,405,722 |
| Series 2017B |
| 11/01/2022 | 5.000% | | 2,285,000 | 2,452,034 |
| Revenue Bonds |
| Series 2017DDD |
| 06/15/2019 | 5.000% | | 500,000 | 515,330 |
| 06/15/2020 | 5.000% | | 500,000 | 523,205 |
| Unrefunded Revenue Bonds |
| School Facilities Construction |
| Series 2014 |
| 06/15/2018 | 5.000% | | 3,600,000 | 3,613,248 |
| New Jersey Health Care Facilities Financing Authority |
| Refunding Revenue Bonds |
| Princeton HealthCare System |
| Series 2016 |
| 07/01/2018 | 5.000% | | 540,000 | 542,403 |
| 07/01/2019 | 5.000% | | 525,000 | 541,233 |
| 07/01/2020 | 5.000% | | 650,000 | 685,692 |
| 07/01/2021 | 5.000% | | 750,000 | 806,910 |
| New Jersey Higher Education Student Assistance Authority(e) |
| Revenue Bonds |
| Senior Series 2015-1A AMT |
| 12/01/2018 | 5.000% | | 4,250,000 | 4,322,930 |
| Series 2016-1A AMT |
| 12/01/2018 | 5.000% | | 645,000 | 656,068 |
| 12/01/2020 | 5.000% | | 1,250,000 | 1,327,275 |
| Student Loan |
| Series 2012-1A AMT |
| 12/01/2018 | 5.000% | | 2,480,000 | 2,522,557 |
The accompanying Notes to Financial Statements are an integral part of this statement.
| 14 | Columbia Short Term Municipal Bond Fund | Annual Report 2018 |
Portfolio of Investments (continued)
April 30, 2018
| Municipal Bonds (continued) |
| Issue Description | Coupon
Rate | | Principal
Amount ($) | Value ($) |
| New Jersey Housing & Mortgage Finance Agency |
| Refunding Revenue Bonds |
| Series 2017B |
| 05/01/2021 | 2.000% | | 7,675,000 | 7,549,437 |
| New Jersey Transit Corp |
| Revenue Bonds |
| Grant Anticipation Note |
| Series 2014A |
| 09/15/2018 | 5.000% | | 3,500,000 | 3,537,800 |
| New Jersey Transportation Trust Fund Authority |
| Revenue Bonds |
| Transportation System |
| Series 1999A |
| 06/15/2020 | 5.750% | | 5,000,000 | 5,235,350 |
| Series 2006A (AGM) |
| 12/15/2020 | 5.250% | | 2,360,000 | 2,512,975 |
| Tobacco Settlement Financing Corp. |
| Refunding Revenue Bonds |
| Series 2018A |
| 06/01/2022 | 5.000% | | 1,000,000 | 1,094,760 |
| Total | 47,457,485 |
| New York 14.6% |
| Chautauqua Utility District |
| Limited General Obligation Notes |
| BAN Series 2017 |
| 08/02/2018 | 2.250% | | 8,000,000 | 8,007,040 |
| Cincinnatus Central School District |
| Unlimited General Obligation Notes |
| BAN Series 2017 |
| 07/12/2018 | 2.250% | | 8,340,000 | 8,345,171 |
| City of Poughkeepsie(g) |
| Limited General Obligation Notes |
| BAN Series 2018A |
| 05/03/2019 | 4.000% | | 1,820,000 | 1,838,873 |
| County of Broome |
| Limited General Obligation Notes |
| BAN Series 2017 |
| 05/04/2018 | 2.500% | | 10,000,000 | 10,001,069 |
| County of Madison |
| Limited General Obligation Notes |
| BAN Series 2018 |
| 04/12/2019 | 2.100% | | 3,965,000 | 3,966,705 |
| County of Monroe |
| Limited General Obligation Bonds |
| Series 2016B |
| 06/01/2018 | 5.000% | | 4,185,000 | 4,196,855 |
| 06/01/2019 | 5.000% | | 5,200,000 | 5,371,496 |
| County of Rockland |
| Limited General Obligation Bonds |
| Series 2014A (AGM) |
| 03/01/2019 | 5.000% | | 2,000,000 | 2,052,980 |
| Municipal Bonds (continued) |
| Issue Description | Coupon
Rate | | Principal
Amount ($) | Value ($) |
| East Ramapo Central School District |
| Unlimited General Obligation Notes |
| BAN Series 2018 |
| 04/26/2019 | 3.000% | | 5,000,000 | 5,041,250 |
| Housing Development Corp. |
| Refunding Revenue Bonds |
| Series 2015G-2 |
| 11/01/2019 | 1.450% | | 2,500,000 | 2,474,800 |
| Revenue Bonds |
| Series 2017C-2 |
| 07/01/2021 | 1.700% | | 3,000,000 | 2,962,530 |
| Sustainable Neighborhood |
| Series 2017G |
| 11/01/2057 | 2.000% | | 3,000,000 | 2,976,870 |
| Metropolitan Transportation Authority |
| Revenue Bonds |
| Series 2005A (AMBAC) |
| 11/15/2018 | 5.500% | | 5,000,000 | 5,102,300 |
| New York City Industrial Development Agency(e) |
| Refunding Revenue Bonds |
| Senior Trips |
| Series 2012A AMT |
| 07/01/2019 | 5.000% | | 1,730,000 | 1,787,332 |
| Trips Obligated Group |
| Senior Series 2012A AMT |
| 07/01/2018 | 5.000% | | 4,655,000 | 4,677,158 |
| New York State Dormitory Authority |
| Refunding Revenue Bonds |
| Personal Income Tax |
| Series 2017B |
| 02/15/2023 | 5.000% | | 5,000,000 | 5,610,750 |
| New York State Urban Development Corp. |
| Refunding Revenue Bonds |
| Personal Income Tax |
| Series 2017 |
| 03/15/2024 | 5.000% | | 5,000,000 | 5,701,750 |
| New York Transportation Development Corp.(e) |
| Refunding Revenue Bonds |
| American Airlines, Inc. |
| Series 2016 AMT |
| 08/01/2018 | 5.000% | | 5,000,000 | 5,032,100 |
| Terminal One Group Association |
| Series 2015 AMT |
| 01/01/2021 | 5.000% | | 5,500,000 | 5,869,655 |
| New York Transportation Development Corp.(e),(g) |
| Revenue Bonds |
| Delta Air Lines, Inc., LaGuardia |
| Series 2018 AMT |
| 01/01/2022 | 5.000% | | 2,465,000 | 2,663,087 |
The accompanying Notes to Financial Statements are an integral part of this statement.
Columbia Short Term Municipal Bond Fund | Annual Report 2018
| 15 |
Portfolio of Investments (continued)
April 30, 2018
| Municipal Bonds (continued) |
| Issue Description | Coupon
Rate | | Principal
Amount ($) | Value ($) |
| Port Authority of New York & New Jersey(e) |
| Revenue Bonds |
| Series 2011-106 AMT |
| 10/15/2021 | 5.000% | | 2,250,000 | 2,446,605 |
| Salmon River Central School District |
| Unlimited General Obligation Notes |
| RAN Series 2017 |
| 06/28/2018 | 2.000% | | 9,000,000 | 8,999,913 |
| Sauquoit Valley Central School District |
| Unlimited General Obligation Notes |
| BAN Series 2017 |
| 06/20/2018 | 2.000% | | 7,000,000 | 7,000,176 |
| State of New York Mortgage Agency(e) |
| Refunding Revenue Bonds |
| Series 2014-189 AMT |
| 04/01/2021 | 2.450% | | 1,000,000 | 994,970 |
| Series 2017-206 AMT |
| 10/01/2019 | 1.450% | | 1,470,000 | 1,450,155 |
| 04/01/2020 | 1.500% | | 1,340,000 | 1,316,148 |
| 10/01/2020 | 1.600% | | 1,490,000 | 1,456,505 |
| 04/01/2021 | 1.700% | | 1,730,000 | 1,683,705 |
| 10/01/2021 | 1.800% | | 1,165,000 | 1,126,823 |
| 04/01/2022 | 1.950% | | 1,300,000 | 1,256,801 |
| Revenue Bonds |
| 55th Series 2017 AMT |
| 04/01/2019 | 1.500% | | 585,000 | 581,783 |
| 10/01/2019 | 1.650% | | 845,000 | 838,561 |
| 04/01/2020 | 1.750% | | 960,000 | 951,408 |
| 10/01/2020 | 1.800% | | 1,725,000 | 1,705,249 |
| 04/01/2021 | 1.950% | | 1,815,000 | 1,791,115 |
| 10/01/2021 | 2.050% | | 505,000 | 497,440 |
| Stockbridge Valley Central School District |
| Unlimited General Obligation Notes |
| BAN Series 2017 |
| 07/06/2018 | 2.250% | | 5,250,000 | 5,253,255 |
| Town of Oyster Bay |
| General Obligation Limited Notes |
| BAN Series 2017A |
| 06/01/2018 | 3.500% | | 10,000,000 | 10,012,066 |
| TSASC, Inc. |
| Refunding Revenue Bonds |
| Series 2017A |
| 06/01/2019 | 4.000% | | 2,000,000 | 2,041,220 |
| 06/01/2020 | 5.000% | | 1,000,000 | 1,056,830 |
| Utica School District |
| Unlimited General Obligation Notes |
| RAN Series 2017 |
| 06/26/2018 | 2.000% | | 10,000,000 | 10,002,523 |
| Village of Cold Spring |
| Limited General Obligation Notes |
| BAN Series 2017 |
| 05/11/2018 | 2.250% | | 2,984,000 | 2,984,570 |
| Municipal Bonds (continued) |
| Issue Description | Coupon
Rate | | Principal
Amount ($) | Value ($) |
| Wappingers Central School District |
| Unlimited General Obligation Notes |
| BAN Series 2017A |
| 07/05/2018 | 2.250% | | 3,765,262 | 3,768,312 |
| Westchester County Healthcare Corp. |
| Revenue Bonds |
| Senior Lien |
| Series 2010B |
| 11/01/2019 | 5.000% | | 3,135,000 | 3,259,804 |
| Total | 166,155,708 |
| North Carolina 0.2% |
| North Carolina Housing Finance Agency(e) |
| Refunding Revenue Bonds |
| Series 2016-37A AMT |
| 07/01/2039 | 3.500% | | 2,220,000 | 2,271,149 |
| North Dakota 0.2% |
| North Dakota Housing Finance Agency |
| Refunding Revenue Bonds |
| Housing and Home Mortgage Finance Program |
| Series 2017 |
| 07/01/2019 | 1.700% | | 435,000 | 432,551 |
| 01/01/2020 | 1.750% | | 900,000 | 892,404 |
| 07/01/2020 | 1.850% | | 730,000 | 722,773 |
| 01/01/2021 | 1.950% | | 645,000 | 636,260 |
| Total | 2,683,988 |
| Ohio 0.5% |
| Ohio Housing Finance Agency |
| Refunding Revenue Bonds |
| Housing and Urban Development Corp., Ltd. |
| Series 2018A |
| 04/01/2021 | 3.000% | | 2,110,000 | 2,148,972 |
| Revenue Bonds |
| Series 2010-1 (GNMA / FNMA) |
| 11/01/2028 | 5.000% | | 540,000 | 550,325 |
| State of Ohio(e) |
| Revenue Bonds |
| Ohio Water Development Authority Waste Management |
| Series 2015 AMT |
| 11/01/2022 | 1.700% | | 2,980,000 | 2,974,874 |
| Total | 5,674,171 |
| Oklahoma 0.8% |
| Cleveland County Educational Facilities Authority |
| Revenue Bonds |
| Moore Public Schools Project |
| Series 2016 |
| 06/01/2019 | 5.000% | | 3,000,000 | 3,097,320 |
| 06/01/2020 | 5.000% | | 500,000 | 529,465 |
The accompanying Notes to Financial Statements are an integral part of this statement.
| 16 | Columbia Short Term Municipal Bond Fund | Annual Report 2018 |
Portfolio of Investments (continued)
April 30, 2018
| Municipal Bonds (continued) |
| Issue Description | Coupon
Rate | | Principal
Amount ($) | Value ($) |
| Norman Public Schools Project |
| Series 2014 |
| 07/01/2018 | 5.000% | | 2,400,000 | 2,412,264 |
| Norman Regional Hospital Authority |
| Refunding Revenue Bonds |
| Series 2016 |
| 09/01/2018 | 4.000% | | 800,000 | 804,952 |
| 09/01/2019 | 4.000% | | 1,005,000 | 1,028,165 |
| Oklahoma County Finance Authority |
| Revenue Bonds |
| Midwest City Public Schools |
| Series 2018 |
| 10/01/2022 | 5.000% | | 1,000,000 | 1,099,890 |
| Total | 8,972,056 |
| Pennsylvania 4.1% |
| City of Philadelphia Airport(e) |
| Refunding Revenue Bonds |
| Series 2017B AMT |
| 07/01/2022 | 5.000% | | 500,000 | 550,995 |
| Commonwealth Financing Authority |
| Revenue Bonds |
| Tobacco Master Settlement Payment |
| Series 2018 |
| 06/01/2020 | 5.000% | | 1,000,000 | 1,053,900 |
| Commonwealth of Pennsylvania |
| Unlimited General Obligation Bonds |
| 1st Series 2013 |
| 04/01/2021 | 5.000% | | 5,000,000 | 5,379,750 |
| Unlimited General Obligation Refunding Bonds |
| 2nd Series 2009 |
| 07/01/2019 | 5.000% | | 2,335,000 | 2,417,332 |
| Montgomery County Industrial Development Authority |
| Refunding Revenue Bonds |
| Albert Einstein HealthCare Network |
| Series 2015 |
| 01/15/2019 | 5.000% | | 1,000,000 | 1,016,360 |
| Pennsylvania Economic Development Financing Authority(e) |
| Revenue Bonds |
| Waste Management, Inc. Project |
| Series 2014 AMT |
| 07/01/2041 | 2.250% | | 2,775,000 | 2,770,199 |
| Series 2017A AMT |
| 08/01/2037 | 1.700% | | 2,000,000 | 1,963,420 |
| Pennsylvania Housing Finance Agency |
| Refunding Revenue Bonds |
| Series 2016-119 |
| 10/01/2041 | 3.500% | | 4,820,000 | 4,944,211 |
| Series 2016-120 |
| 10/01/2046 | 3.500% | | 6,115,000 | 6,277,231 |
| Municipal Bonds (continued) |
| Issue Description | Coupon
Rate | | Principal
Amount ($) | Value ($) |
| Pennsylvania Housing Finance Agency(e) |
| Refunding Revenue Bonds |
| Series 2017-124A AMT |
| 10/01/2019 | 1.350% | | 835,000 | 821,623 |
| 04/01/2020 | 1.450% | | 1,000,000 | 974,760 |
| 10/01/2020 | 1.550% | | 1,000,000 | 970,650 |
| 04/01/2021 | 1.650% | | 1,000,000 | 962,270 |
| 10/01/2021 | 1.750% | | 725,000 | 693,448 |
| Pennsylvania Turnpike Commission(d) |
| Revenue Bonds |
| Series 2013B |
Muni Swap Index Yield + 1.150%
12/01/2019 | 1.640% | | 3,070,000 | 3,107,700 |
| Pittsburgh Public Parking Authority |
| Refunding Revenue Bonds |
| System |
| Series 2015A |
| 12/01/2018 | 4.000% | | 1,750,000 | 1,770,493 |
| Quakertown General Authority |
| Refunding Revenue Bonds |
| USDA Loan Anticipation Notes |
| Series 2017 |
| 07/01/2021 | 3.125% | | 2,500,000 | 2,493,575 |
| School District of Philadelphia (The) |
| Limited General Obligation Bonds |
| Series 2018A |
| 09/01/2022 | 5.000% | | 560,000 | 612,769 |
| 09/01/2023 | 5.000% | | 450,000 | 497,048 |
| Unlimited General Obligation Refunding Bonds |
| Series 2015D |
| 09/01/2019 | 5.000% | | 3,750,000 | 3,890,850 |
| State Public School Building Authority |
| Refunding Revenue Bonds |
| The School District of Philadelphia Project |
| Series 2015 |
| 06/01/2019 | 5.000% | | 2,890,000 | 2,974,012 |
| Total | 46,142,596 |
| Rhode Island 0.6% |
| Rhode Island Health & Educational Building Corp. |
| Refunding Revenue Bonds |
| Hospital Financing - Lifespan Obligation |
| Series 2016G |
| 05/15/2018 | 5.000% | | 1,250,000 | 1,251,371 |
| 05/15/2019 | 5.000% | | 1,500,000 | 1,540,905 |
| 05/15/2022 | 5.000% | | 1,250,000 | 1,357,737 |
| Rhode Island Housing & Mortgage Finance Corp. |
| Revenue Bonds |
| Series 2016 |
| 10/01/2046 | 3.500% | | 1,400,000 | 1,433,278 |
The accompanying Notes to Financial Statements are an integral part of this statement.
Columbia Short Term Municipal Bond Fund | Annual Report 2018
| 17 |
Portfolio of Investments (continued)
April 30, 2018
| Municipal Bonds (continued) |
| Issue Description | Coupon
Rate | | Principal
Amount ($) | Value ($) |
| Rhode Island Student Loan Authority(e),(g) |
| Refunding Revenue Bonds |
| Series 2018A AMT |
| 12/01/2022 | 5.000% | | 1,300,000 | 1,414,283 |
| Total | 6,997,574 |
| South Carolina 1.3% |
| Piedmont Municipal Power Agency |
| Refunding Revenue Bonds |
| Series 2009A-4 |
| 01/01/2019 | 5.000% | | 6,645,000 | 6,782,751 |
| SCAGO Educational Facilities Corp. for Pickens School District |
| Refunding Revenue Bonds |
| Series 2015 |
| 12/01/2019 | 5.000% | | 1,250,000 | 1,309,038 |
| South Carolina State Housing Finance & Development Authority |
| Refunding Revenue Bonds |
| Series 2016B-1 |
| 07/01/2043 | 3.500% | | 1,715,000 | 1,765,438 |
| South Carolina State Housing Finance & Development Authority(e) |
| Refunding Revenue Bonds |
| Series 2016B-2 AMT |
| 07/01/2043 | 4.000% | | 4,265,000 | 4,434,875 |
| Total | 14,292,102 |
| Tennessee 1.7% |
| Memphis Health Educational & Housing Facility Board |
| Revenue Bonds |
| Forum Flats Apartments Project |
| Series 2017 |
| 12/01/2020 | 1.800% | | 1,350,000 | 1,346,017 |
| Metropolitan Government Nashville & Davidson County Health & Educational Facilities Board |
| Revenue Bonds |
| Ascension Senior Credit |
| Series 2016 |
| 11/15/2030 | 1.550% | | 3,000,000 | 2,951,340 |
| East Webster Street Apartments |
| Series 2018 |
| 04/01/2021 | 2.050% | | 1,250,000 | 1,250,463 |
| Tennessee Energy Acquisition Corp. |
| Revenue Bonds |
| Series 2006C |
| 02/01/2019 | 5.000% | | 9,920,000 | 10,134,867 |
| 02/01/2020 | 5.000% | | 3,820,000 | 4,000,877 |
| Total | 19,683,564 |
| Municipal Bonds (continued) |
| Issue Description | Coupon
Rate | | Principal
Amount ($) | Value ($) |
| Texas 3.5% |
| City of Houston |
| Limited General Obligation Refunding Bonds |
| Series 2017A |
| 03/01/2020 | 5.000% | | 875,000 | 922,250 |
| 03/01/2021 | 5.000% | | 1,000,000 | 1,077,260 |
| Harris County-Houston Sports Authority |
| Refunding Revenue Bonds |
| Senior Lien |
| Series 2014A |
| 11/15/2019 | 5.000% | | 3,000,000 | 3,135,450 |
| Houston Independent School District Public Facility Corp.(f) |
| Revenue Bonds |
| Capital Appreciation-Cesar E. Chavez |
| Series 1998A (AMBAC) |
| 09/15/2020 | 0.000% | | 2,685,000 | 2,550,535 |
| Lewisville Independent School District(f) |
| Unlimited General Obligation Refunding Bonds |
| Series 2014B |
| 08/15/2022 | 0.000% | | 3,175,000 | 2,859,119 |
| Matagorda County Navigation District No. 1(e) |
| Refunding Revenue Bonds |
| Central Power and Light Co. |
| Series 2017 AMT |
| 05/01/2030 | 1.750% | | 3,000,000 | 2,939,340 |
| North Texas Tollway Authority |
| Refunding Revenue Bonds |
| 2nd Tier |
| Series 2015A |
| 01/01/2019 | 5.000% | | 1,350,000 | 1,378,175 |
| 01/01/2020 | 5.000% | | 1,105,000 | 1,159,510 |
| State of Texas(e) |
| Unlimited General Obligation Bonds |
| Series 2014 AMT |
| 08/01/2023 | 6.000% | | 3,475,000 | 4,076,939 |
| Tarrant County Cultural Education Facilities Finance Corp. |
| Refunding Revenue Bonds |
| Trinity Terrace Project |
| Series 2014 |
| 12/01/2018 | 2.500% | | 1,480,000 | 1,479,556 |
| Tarrant County Housing Finance Corp. |
| Revenue Bonds |
| Multifamily Housing Reserve Quebec Apartments |
| Series 2016 |
| 08/01/2018 | 1.000% | | 5,100,000 | 5,089,800 |
| Texas Department of Housing & Community Affairs |
| Revenue Bonds |
| EMLI Liberty Crossing Housing |
| Series 2017 |
| 12/01/2020 | 1.800% | | 3,600,000 | 3,566,952 |
The accompanying Notes to Financial Statements are an integral part of this statement.
| 18 | Columbia Short Term Municipal Bond Fund | Annual Report 2018 |
Portfolio of Investments (continued)
April 30, 2018
| Municipal Bonds (continued) |
| Issue Description | Coupon
Rate | | Principal
Amount ($) | Value ($) |
| Texas State University System |
| Refunding Revenue Bonds |
| Series 2017A |
| 03/15/2020 | 5.000% | | 1,580,000 | 1,670,708 |
| 03/15/2021 | 5.000% | | 1,600,000 | 1,728,512 |
| Travis County Housing Finance Corp. |
| Revenue Bonds |
| McKinney Falls Apartments |
| Series 2018 |
| 04/01/2021 | 2.000% | | 2,500,000 | 2,490,650 |
| University of Texas System (The) |
| Revenue Bonds |
| Series 2017J |
| 08/15/2021 | 5.000% | | 3,895,000 | 4,256,923 |
| Total | 40,381,679 |
| Utah 0.1% |
| Utah Housing Corp.(e) |
| Refunding Revenue Bonds |
| Series 2015D-1 Class III (FHA) AMT |
| 01/01/2019 | 1.850% | | 1,500,000 | 1,496,340 |
| Vermont 0.9% |
| Vermont Economic Development Authority |
| Revenue Bonds |
| Bennington College Real Estate Project |
| RAN Series 2017 |
| 07/01/2020 | 2.000% | | 10,000,000 | 9,719,800 |
| Virgin Islands, U.S. 0.2% |
| Virgin Islands Public Finance Authority(a),(h) |
| Revenue Bonds |
| Series 2015 |
| 09/01/2018 | 5.000% | | 1,720,000 | 1,732,711 |
| 09/01/2020 | 5.000% | | 750,000 | 781,942 |
| Total | 2,514,653 |
| Virginia 2.1% |
| Louisa Industrial Development Authority |
| Refunding Revenue Bonds |
| Series 2015 |
| 11/01/2035 | 1.750% | | 7,000,000 | 6,966,400 |
| Wise County Industrial Development Authority |
| Revenue Bonds |
| Series 2015A |
| 10/01/2040 | 2.150% | | 11,875,000 | 11,802,563 |
| Virginia Electric & Power Co. |
| Series 2015A |
| 11/01/2040 | 1.875% | | 5,000,000 | 4,952,000 |
| Total | 23,720,963 |
| Municipal Bonds (continued) |
| Issue Description | Coupon
Rate | | Principal
Amount ($) | Value ($) |
| Washington 0.3% |
| Energy Northwest |
| Refunding Revenue Bonds |
| Wind Project |
| Series 2014 |
| 07/01/2018 | 5.000% | | 1,425,000 | 1,432,168 |
| Washington State Housing Finance Commission(e) |
| Refunding Revenue Bonds |
| Single Family Program |
| Series 2015 AMT |
| 12/01/2022 | 2.600% | | 1,030,000 | 1,023,377 |
| Series 2017 AMT |
| 06/01/2039 | 4.000% | | 1,155,000 | 1,201,743 |
| Washington State Housing Finance Commission |
| Revenue Bonds |
| Series 2010A (GNMA / FNMA / FHLMC) |
| 10/01/2028 | 4.700% | | 230,000 | 233,613 |
| Total | 3,890,901 |
| Wisconsin 0.9% |
| Public Finance Authority |
| Loan Anticipation Notes |
| Lake Ocone Academy |
| Series 2017 |
| 10/01/2019 | 2.300% | | 3,585,000 | 3,563,347 |
| Wisconsin Health & Educational Facilities Authority |
| Revenue Bonds |
| Tomah Memorial Hospital, Inc. |
| BAN Series 2017A |
| 11/01/2020 | 2.650% | | 2,200,000 | 2,165,988 |
| Wisconsin Housing & Economic Development Authority(e) |
| Refunding Revenue Bonds |
| Series 2017B (FHA) AMT |
| 09/01/2019 | 1.500% | | 400,000 | 394,988 |
| 03/01/2020 | 1.600% | | 350,000 | 344,319 |
| 03/01/2021 | 1.850% | | 525,000 | 511,591 |
| 09/01/2022 | 2.150% | | 870,000 | 839,585 |
| Revenue Bonds |
| Series 2018A AMT |
| 03/01/2021 | 2.250% | | 390,000 | 385,694 |
| 03/01/2022 | 2.500% | | 1,265,000 | 1,249,365 |
| 09/01/2022 | 2.600% | | 710,000 | 703,085 |
| Total | 10,157,962 |
| Wyoming 0.2% |
| Wyoming Community Development Authority(e) |
| Refunding Revenue Bonds |
| Series 2016-1 AMT |
| 12/01/2038 | 3.500% | | 1,920,000 | 1,964,006 |
Total Municipal Bonds
(Cost $947,375,939) | 936,814,105 |
|
The accompanying Notes to Financial Statements are an integral part of this statement.
Columbia Short Term Municipal Bond Fund | Annual Report 2018
| 19 |
Portfolio of Investments (continued)
April 30, 2018
| Municipal Short Term 15.1% |
| Issue Description | Effective
Yield | | Principal
Amount ($) | Value ($) |
| California 0.5% |
| California Pollution Control Financing Authority(a),(e),(g) |
| Refunding Revenue Bonds |
| Republic Services, Inc. |
| Series 2010A AMT |
| 08/01/2023 | 2.050% | | 6,000,000 | 6,000,000 |
| Colorado 0.1% |
| Colorado Health Facilities Authority |
| Refunding Revenue Bonds |
| Evangelical Lutheran Good Samaritan Society |
| Series 2017 |
| 06/01/2018 | 2.050% | | 500,000 | 501,248 |
| Connecticut 0.2% |
| City of New Haven |
| Unlimited General Obligation Notes |
| TAN Series 2017 |
| 05/15/2018 | 1.720% | | 2,000,000 | 2,000,620 |
| City of Waterbury |
| Unlimited General Obligation Bonds |
| Series 2017A |
| 11/15/2018 | 2.000% | | 430,000 | 432,300 |
| Unlimited General Obligation Refunding Bonds |
| Series 2017B |
| 09/01/2018 | 2.000% | | 265,000 | 265,880 |
| Total | 2,698,800 |
| Illinois 0.5% |
| State of Illinois |
| Unlimited General Obligation Notes |
| Series 2017A |
| 11/01/2018 | 2.720% | | 5,000,000 | 5,056,650 |
| Massachusetts 0.1% |
| Town of Templeton |
| Limited General Obligation Notes |
| BAN Series 2017 |
| 11/30/2018 | 1.960% | | 1,600,000 | 1,602,464 |
| Michigan 1.2% |
| Waterford School District |
| Limited General Obligation Notes |
| Series 2017 (Qualified School Bond Loan Fund) |
| 09/25/2018 | 2.110% | | 13,500,000 | 13,506,210 |
| New York 11.8% |
| Alexandria Central School District |
| Unlimited General Obligation Notes |
| BAN Series 2017 |
| 06/29/2018 | 2.050% | | 6,180,000 | 6,181,641 |
| Municipal Short Term (continued) |
| Issue Description | Effective
Yield | | Principal
Amount ($) | Value ($) |
| Bemus Point Central School District |
| Unlimited General Obligation Notes |
| BAN Series 2017 |
| 06/27/2018 | 1.820% | | 15,430,000 | 15,439,683 |
| Board of Cooperative Educational Services for the Sole Supervisory District |
| Revenue Notes |
| RAN Series 2017 |
| 06/29/2018 | 1.940% | | 5,000,000 | 5,002,311 |
| Bolivar-Richburg Central School District |
| Unlimited General Obligation Notes |
| BAN Series 2017 |
| 07/13/2018 | 1.920% | | 5,730,000 | 5,733,381 |
| City of Batavia(g) |
| Unlimited General Obligation Notes |
| BAN Series 2018 |
| 05/02/2019 | 2.500% | | 4,100,000 | 4,109,758 |
| City of New York(d) |
| Unlimited General Obligation Bonds |
| Fiscal 1995 |
| Subordinated Series 2015F |
Muni Swap Index Yield + 0.650%
02/15/2019 | 2.390% | | 6,250,000 | 6,267,875 |
| Frankfort-Schuyler Central School District |
| Unlimited General Obligation Notes |
| BAN Series 2017 |
| 06/29/2018 | 1.890% | | 6,715,000 | 6,718,633 |
| Holley Central School District |
| Unlimited General Obligation Notes |
| BAN Series 2017 |
| 07/11/2018 | 1.880% | | 6,375,000 | 6,379,271 |
| Montauk Union Free School District |
| Limited General Obligation Notes |
| TAN Series 2017 |
| 06/28/2018 | 1.900% | | 3,800,000 | 3,801,985 |
| Norwich City School District |
| Unlimited General Obligation Notes |
| BAN Series 2017 |
| 06/29/2018 | 1.950% | | 7,225,000 | 7,228,056 |
| Oakfield-Alabama Central School District |
| Unlimited General Obligation Notes |
| BAN Series 2017 |
| 06/26/2018 | 1.900% | | 15,660,000 | 15,667,609 |
| Owego Appalachian Central School District |
| Limited General Obligation Notes |
| RAN Series 2018A |
| 06/28/2018 | 1.900% | | 7,443,429 | 7,441,557 |
| Unlimited General Obligation Notes |
| RAN Series 2017 |
| 10/26/2018 | 2.120% | | 4,455,000 | 4,442,348 |
The accompanying Notes to Financial Statements are an integral part of this statement.
| 20 | Columbia Short Term Municipal Bond Fund | Annual Report 2018 |
Portfolio of Investments (continued)
April 30, 2018
| Municipal Short Term (continued) |
| Issue Description | Effective
Yield | | Principal
Amount ($) | Value ($) |
| Salmon River Central School District |
| Unlimited General Obligation Notes |
| BAN Series 2017 |
| 06/29/2018 | 1.990% | | 9,113,371 | 9,116,777 |
| Schenevus Central School District |
| Unlimited General Obligation Notes |
| BAN Series 2017 |
| 06/29/2018 | 1.960% | | 6,700,000 | 6,702,834 |
| Tompkins-Seneca-Tioga Board of Cooperative Educational Services |
| Revenue Notes |
| RAN Series 2017 |
| 06/29/2018 | 2.050% | | 10,000,000 | 10,002,951 |
| Town of Oyster Bay |
| Limited General Obligation Notes |
| BAN Series 2017C |
| 06/01/2018 | 2.050% | | 2,550,000 | 2,550,896 |
| Unadilla Valley Central School District |
| Unlimited General Obligation Notes |
| BAN Series 2017B |
| 07/20/2018 | 1.960% | | 7,775,000 | 7,779,354 |
| Village of Alden |
| Limited General Obligation Notes |
| BAN Series 2017 |
| 09/13/2018 | 1.720% | | 3,561,000 | 3,557,938 |
| Total | 134,124,858 |
| Municipal Short Term (continued) |
| Issue Description | Effective
Yield | | Principal
Amount ($) | Value ($) |
| Wisconsin 0.7% |
| Public Finance Authority(e),(g) |
| Refunding Revenue Bonds |
| Waste Management, Inc. Project |
| Series 2018 AMT |
| 06/01/2023 | 2.000% | | 8,000,000 | 8,000,000 |
Total Municipal Short Term
(Cost $171,670,825) | 171,490,230 |
| Money Market Funds 0.0% |
| | Shares | Value ($) |
| Dreyfus Tax-Exempt Cash Management Fund, Institutional Shares, 1.450%(i) | 120,085 | 120,085 |
Total Money Market Funds
(Cost $120,073) | 120,085 |
Total Investments in Securities
(Cost $1,153,361,837) | 1,142,619,420 |
| Other Assets & Liabilities, Net | | (5,000,507) |
| Net Assets | $1,137,618,913 |
Notes to Portfolio of Investments
| (a) | Represents privately placed and other securities and instruments exempt from SEC registration (collectively, private placements), such as Section 4(a)(2) and Rule 144A eligible securities, which are often sold only to qualified institutional buyers. The Fund may invest in private placements determined to be liquid as well as those determined to be illiquid. Private placements may be determined to be liquid under guidelines established by the Fund’s Board of Trustees. At April 30, 2018, the value of these securities amounted to $29,930,746, which represents 2.63% of net assets. |
| (b) | The Fund is entitled to receive principal and interest from the guarantor after a day or a week’s notice or upon maturity. The maturity date disclosed represents the final maturity. |
| (c) | Represents a variable rate security where the coupon rate adjusts on specified dates (generally daily or weekly) using the prevailing money market rate. The interest rate shown was the current rate as of April 30, 2018. |
| (d) | Variable rate security. The interest rate shown was the current rate as of April 30, 2018. |
| (e) | Income from this security may be subject to alternative minimum tax. |
| (f) | Zero coupon bond. |
| (g) | Represents a security purchased on a when-issued basis. |
| (h) | Municipal obligations include debt obligations issued by or on behalf of territories, possessions, or sovereign nations within the territorial boundaries of the United States. At April 30, 2018, the value of these securities amounted to $2,514,653, which represents 0.22% of net assets. |
| (i) | The rate shown is the seven-day current annualized yield at April 30, 2018. |
Abbreviation Legend
| AGM | Assured Guaranty Municipal Corporation |
| AMBAC | Ambac Assurance Corporation |
| AMT | Alternative Minimum Tax |
| BAM | Build America Mutual Assurance Co. |
| BAN | Bond Anticipation Note |
| FHA | Federal Housing Authority |
The accompanying Notes to Financial Statements are an integral part of this statement.
Columbia Short Term Municipal Bond Fund | Annual Report 2018
| 21 |
Portfolio of Investments (continued)
April 30, 2018
Abbreviation Legend (continued)
| FHLMC | Federal Home Loan Mortgage Corporation |
| FNMA | Federal National Mortgage Association |
| GNMA | Government National Mortgage Association |
| NPFGC | National Public Finance Guarantee Corporation |
| TAN | Tax Anticipation Note |
Fair value measurements
The Fund categorizes its fair value measurements according to a three-level hierarchy that maximizes the use of observable inputs and minimizes the use of unobservable inputs by prioritizing that the most observable input be used when available. Observable inputs are those that market participants would use in pricing an investment based on market data obtained from sources independent of the reporting entity. Unobservable inputs are those that reflect the Fund’s assumptions about the information market participants would use in pricing an investment. An investment’s level within the fair value hierarchy is based on the lowest level of any input that is deemed significant to the asset’s or liability’s fair value measurement. The input levels are not necessarily an indication of the risk or liquidity associated with investments at that level. For example, certain U.S. government securities are generally high quality and liquid, however, they are reflected as Level 2 because the inputs used to determine fair value may not always be quoted prices in an active market.
Fair value inputs are summarized in the three broad levels listed below:
| ■ | Level 1 — Valuations based on quoted prices for investments in active markets that the Fund has the ability to access at the measurement date. Valuation adjustments are not applied to Level 1 investments. |
| ■ | Level 2 — Valuations based on other significant observable inputs (including quoted prices for similar securities, interest rates, prepayment speeds, credit risks, etc.). |
| ■ | Level 3 — Valuations based on significant unobservable inputs (including the Fund’s own assumptions and judgment in determining the fair value of investments). |
Inputs that are used in determining fair value of an investment may include price information, credit data, volatility statistics, and other factors. These inputs can be either observable or unobservable. The availability of observable inputs can vary between investments, and is affected by various factors such as the type of investment, and the volume and level of activity for that investment or similar investments in the marketplace. The inputs will be considered by the Investment Manager, along with any other relevant factors in the calculation of an investment’s fair value. The Fund uses prices and inputs that are current as of the measurement date, which may include periods of market dislocations. During these periods, the availability of prices and inputs may be reduced for many investments. This condition could cause an investment to be reclassified between the various levels within the hierarchy.
Investments falling into the Level 3 category are primarily supported by quoted prices from brokers and dealers participating in the market for those investments. However, these may be classified as Level 3 investments due to lack of market transparency and corroboration to support these quoted prices. Additionally, valuation models may be used as the pricing source for any remaining investments classified as Level 3. These models may rely on one or more significant unobservable inputs and/or significant assumptions by the Investment Manager. Inputs used in valuations may include, but are not limited to, financial statement analysis, capital account balances, discount rates and estimated cash flows, and comparable company data.
Under the direction of the Fund’s Board of Trustees (the Board), the Investment Manager’s Valuation Committee (the Committee) is responsible for overseeing the valuation procedures approved by the Board. The Committee consists of voting and non-voting members from various groups within the Investment Manager’s organization, including operations and accounting, trading and investments, compliance, risk management and legal.
The Committee meets at least monthly to review and approve valuation matters, which may include a description of specific valuation determinations, data regarding pricing information received from approved pricing vendors and brokers and the results of Board-approved valuation control policies and procedures (the Policies). The Policies address, among other things, instances when market quotations are or are not readily available, including recommendations of third party pricing vendors and a determination of appropriate pricing methodologies; events that require specific valuation determinations and assessment of fair value techniques; securities with a potential for stale pricing, including those that are illiquid, restricted, or in default; and the effectiveness of third party pricing vendors, including periodic reviews of vendors. The Committee meets more frequently, as needed, to discuss additional valuation matters, which may include the need to review back-testing results, review time-sensitive information or approve related valuation actions. The Committee reports to the Board, with members of the Committee meeting with the Board at each of its regularly scheduled meetings to discuss valuation matters and actions during the period, similar to those described earlier.
For investments categorized as Level 3, the Committee monitors information similar to that described above, which may include: (i) data specific to the issuer or comparable issuers, (ii) general market or specific sector news and (iii) quoted prices and specific or similar security transactions. The Committee considers this data and any changes from prior periods in order to assess the reasonableness of observable and unobservable inputs, any assumptions or internal models used to value those securities and changes in fair value. This data is also used to corroborate, when available, information received from approved pricing vendors and brokers. Various factors impact the frequency of monitoring this information (which may occur as often as daily). However, the Committee may determine that changes to inputs, assumptions and models are not required as a result of the monitoring procedures performed.
The following table is a summary of the inputs used to value the Fund’s investments at April 30, 2018:
| | Level 1
quoted prices in active
markets for identical
assets ($) | Level 2
other significant
observable inputs ($) | Level 3
significant
unobservable inputs ($) | Total ($) |
| Investments in Securities | | | | |
| Floating Rate Notes | — | 34,195,000 | — | 34,195,000 |
| Municipal Bonds | — | 936,814,105 | — | 936,814,105 |
| Municipal Short Term | — | 171,490,230 | — | 171,490,230 |
| Money Market Funds | 120,085 | — | — | 120,085 |
| Total Investments in Securities | 120,085 | 1,142,499,335 | — | 1,142,619,420 |
The accompanying Notes to Financial Statements are an integral part of this statement.
| 22 | Columbia Short Term Municipal Bond Fund | Annual Report 2018 |
Portfolio of Investments (continued)
April 30, 2018
Fair value measurements (continued)
See the Portfolio of Investments for all investment classifications not indicated in the table.
The Fund’s assets assigned to the Level 2 input category are generally valued using the market approach, in which a security’s value is determined through reference to prices and information from market transactions for similar or identical assets.
There were no transfers of financial assets between levels during the period.
The accompanying Notes to Financial Statements are an integral part of this statement.
Columbia Short Term Municipal Bond Fund | Annual Report 2018
| 23 |
Statement of Assets and Liabilities
April 30, 2018
| Assets | |
| Investments in securities, at value | |
| Unaffiliated issuers (cost $1,153,361,837) | $1,142,619,420 |
| Cash | 78,779 |
| Receivable for: | |
| Investments sold | 1,028,320 |
| Capital shares sold | 438,470 |
| Interest | 14,180,188 |
| Expense reimbursement due from Investment Manager | 11,257 |
| Prepaid expenses | 1,458 |
| Total assets | 1,158,357,892 |
| Liabilities | |
| Payable for: | |
| Investments purchased | 2,448,315 |
| Investments purchased on a delayed delivery basis | 15,529,720 |
| Capital shares purchased | 979,553 |
| Distributions to shareholders | 1,506,802 |
| Management services fees | 39,879 |
| Distribution and/or service fees | 2,562 |
| Transfer agent fees | 24,379 |
| Compensation of board members | 162,543 |
| Other expenses | 45,226 |
| Total liabilities | 20,738,979 |
| Net assets applicable to outstanding capital stock | $1,137,618,913 |
| Represented by | |
| Paid in capital | 1,149,823,829 |
| Undistributed net investment income | 727,538 |
| Accumulated net realized loss | (2,190,037) |
| Unrealized appreciation (depreciation) on: | |
| Investments - unaffiliated issuers | (10,742,417) |
| Total - representing net assets applicable to outstanding capital stock | $1,137,618,913 |
The accompanying Notes to Financial Statements are an integral part of this statement.
| 24 | Columbia Short Term Municipal Bond Fund | Annual Report 2018 |
Statement of Assets and Liabilities (continued)
April 30, 2018
| Class A | |
| Net assets | $83,579,819 |
| Shares outstanding | 8,147,003 |
| Net asset value per share | $10.26 |
| Maximum sales charge | 1.00% |
| Maximum offering price per share (calculated by dividing the net asset value per share by 1.0 minus the maximum sales charge for Class A shares) | $10.36 |
| Advisor Class | |
| Net assets | $606,529 |
| Shares outstanding | 59,073 |
| Net asset value per share | $10.27 |
| Class C | |
| Net assets | $10,327,152 |
| Shares outstanding | 1,007,220 |
| Net asset value per share | $10.25 |
| Institutional Class | |
| Net assets | $112,698,560 |
| Shares outstanding | 10,984,838 |
| Net asset value per share | $10.26 |
| Institutional 2 Class | |
| Net assets | $18,813,238 |
| Shares outstanding | 1,834,389 |
| Net asset value per share | $10.26 |
| Institutional 3 Class | |
| Net assets | $911,593,615 |
| Shares outstanding | 88,893,249 |
| Net asset value per share | $10.25 |
The accompanying Notes to Financial Statements are an integral part of this statement.
Columbia Short Term Municipal Bond Fund | Annual Report 2018
| 25 |
Statement of Operations
Year Ended April 30, 2018
| Net investment income | |
| Income: | |
| Dividends — unaffiliated issuers | $13,319 |
| Interest | 23,527,055 |
| Total income | 23,540,374 |
| Expenses: | |
| Management services fees | 5,698,822 |
| Distribution and/or service fees | |
| Class A | 247,436 |
| Class B | 41 |
| Class C | 119,294 |
| Transfer agent fees | |
| Class A | 112,127 |
| Advisor Class | 1,112 |
| Class B | 6 |
| Class C | 13,636 |
| Institutional Class | 755,488 |
| Institutional 2 Class | 8,973 |
| Institutional 3 Class | 56,326 |
| Compensation of board members | 47,110 |
| Custodian fees | 12,100 |
| Printing and postage fees | 21,197 |
| Registration fees | 115,843 |
| Audit fees | 32,083 |
| Legal fees | 18,870 |
| Compensation of chief compliance officer | 301 |
| Other | 45,022 |
| Total expenses | 7,305,787 |
| Fees waived or expenses reimbursed by Investment Manager and its affiliates | (1,832,498) |
| Expense reduction | (40) |
| Total net expenses | 5,473,249 |
| Net investment income | 18,067,125 |
| Realized and unrealized gain (loss) — net | |
| Net realized gain (loss) on: | |
| Investments — unaffiliated issuers | (1,175,235) |
| Futures contracts | 39,865 |
| Net realized loss | (1,135,370) |
| Net change in unrealized appreciation (depreciation) on: | |
| Investments — unaffiliated issuers | (9,538,429) |
| Net change in unrealized appreciation (depreciation) | (9,538,429) |
| Net realized and unrealized loss | (10,673,799) |
| Net increase in net assets resulting from operations | $7,393,326 |
The accompanying Notes to Financial Statements are an integral part of this statement.
| 26 | Columbia Short Term Municipal Bond Fund | Annual Report 2018 |
Statement of Changes in Net Assets
| | Year Ended
April 30, 2018 | Year Ended
April 30, 2017 (a) |
| Operations | | |
| Net investment income | $18,067,125 | $18,029,218 |
| Net realized loss | (1,135,370) | (712,683) |
| Net change in unrealized appreciation (depreciation) | (9,538,429) | (9,950,490) |
| Net increase in net assets resulting from operations | 7,393,326 | 7,366,045 |
| Distributions to shareholders | | |
| Net investment income | | |
| Class A | (1,103,543) | (1,090,308) |
| Advisor Class | (13,684) | (6,089) |
| Class B | (8) | (98) |
| Class C | (43,285) | (30,979) |
| Institutional Class | (6,394,562) | (17,749,792) |
| Institutional 2 Class | (205,669) | (210,368) |
| Institutional 3 Class | (10,736,230) | (23) |
| Total distributions to shareholders | (18,496,981) | (19,087,657) |
| Decrease in net assets from capital stock activity | (354,956,693) | (278,087,530) |
| Total decrease in net assets | (366,060,348) | (289,809,142) |
| Net assets at beginning of year | 1,503,679,261 | 1,793,488,403 |
| Net assets at end of year | $1,137,618,913 | $1,503,679,261 |
| Undistributed net investment income | $727,538 | $1,157,394 |
| (a) | Institutional 3 Class shares are based on operations from March 1, 2017 (commencement of operations) through the stated period end. |
The accompanying Notes to Financial Statements are an integral part of this statement.
Columbia Short Term Municipal Bond Fund | Annual Report 2018
| 27 |
Statement of Changes in Net Assets (continued)
| | Year Ended | Year Ended |
| | April 30, 2018 | April 30, 2017 (a) |
| | Shares | Dollars ($) | Shares | Dollars ($) |
| Capital stock activity |
| Class A | | | | |
| Subscriptions | 2,449,058 | 25,363,429 | 6,366,818 | 65,879,168 |
| Distributions reinvested | 89,887 | 929,330 | 88,329 | 915,766 |
| Redemptions | (4,698,890) | (48,652,288) | (8,402,406) | (87,086,042) |
| Net decrease | (2,159,945) | (22,359,529) | (1,947,259) | (20,291,108) |
| Advisor Class | | | | |
| Subscriptions | 112,053 | 1,163,795 | 113,247 | 1,169,951 |
| Distributions reinvested | 1,307 | 13,526 | 577 | 5,975 |
| Redemptions | (154,797) | (1,602,924) | (65,491) | (679,453) |
| Net increase (decrease) | (41,437) | (425,603) | 48,333 | 496,473 |
| Class B | | | | |
| Subscriptions | — | — | 2 | 18 |
| Distributions reinvested | — | — | 1 | 15 |
| Redemptions | (1,591) | (16,497) | (11,432) | (117,674) |
| Net decrease | (1,591) | (16,497) | (11,429) | (117,641) |
| Class C | | | | |
| Subscriptions | 109,723 | 1,132,629 | 229,616 | 2,375,122 |
| Distributions reinvested | 2,693 | 27,796 | 1,582 | 16,334 |
| Redemptions | (518,913) | (5,367,897) | (648,322) | (6,709,101) |
| Net decrease | (406,497) | (4,207,472) | (417,124) | (4,317,645) |
| Institutional Class | | | | |
| Subscriptions | 12,544,502 | 130,090,046 | 50,085,852 | 519,195,345 |
| Distributions reinvested | 130,328 | 1,347,487 | 114,029 | 1,182,672 |
| Redemptions | (133,629,684) | (1,389,556,931) | (73,973,871) | (766,632,282) |
| Net decrease | (120,954,854) | (1,258,119,398) | (23,773,990) | (246,254,265) |
| Institutional 2 Class | | | | |
| Subscriptions | 2,095,745 | 21,578,811 | 1,199,074 | 12,434,908 |
| Distributions reinvested | 18,515 | 191,293 | 20,280 | 210,211 |
| Redemptions | (1,675,981) | (17,254,744) | (1,949,281) | (20,258,463) |
| Net increase (decrease) | 438,279 | 4,515,360 | (729,927) | (7,613,344) |
| Institutional 3 Class | | | | |
| Subscriptions | 112,105,218 | 1,165,355,248 | 966 | 10,000 |
| Distributions reinvested | 1,815 | 18,690 | — | — |
| Redemptions | (23,214,750) | (239,717,492) | — | — |
| Net increase | 88,892,283 | 925,656,446 | 966 | 10,000 |
| Total net decrease | (34,233,762) | (354,956,693) | (26,830,430) | (278,087,530) |
| (a) | Institutional 3 Class shares are based on operations from March 1, 2017 (commencement of operations) through the stated period end. |
The accompanying Notes to Financial Statements are an integral part of this statement.
| 28 | Columbia Short Term Municipal Bond Fund | Annual Report 2018 |
[THIS PAGE INTENTIONALLY LEFT BLANK]
Columbia Short Term Municipal Bond Fund | Annual Report 2018
| 29 |
The following table is intended to help you understand the Fund’s financial performance. Certain information reflects financial results for a single share of a class held for the periods shown. Per share net investment income (loss) amounts are calculated based on average shares outstanding during the period. Total return assumes reinvestment of all dividends and distributions, if any. Total return does not reflect payment of sales charges, if any. Total return and portfolio turnover are not annualized for periods of less than one year. The portfolio turnover rate is calculated without regard to purchase and sales transactions of short-term instruments and certain derivatives, if any. If such transactions were included, the Fund’s portfolio turnover rate may be higher.
| | Net asset value,
beginning of
period | Net
investment
income
(loss) | Net
realized
and
unrealized
gain (loss) | Total from
investment
operations | Distributions
from net
investment
income |
| Class A |
| Year Ended 4/30/2018 | $10.36 | 0.11 | (0.09) | 0.02 | (0.12) |
| Year Ended 4/30/2017 | $10.43 | 0.09 | (0.06) | 0.03 | (0.10) |
| Year Ended 4/30/2016 | $10.42 | 0.07 | 0.01 | 0.08 | (0.07) |
| Year Ended 4/30/2015 | $10.48 | 0.08 | (0.06) | 0.02 | (0.08) |
| Year Ended 4/30/2014 | $10.54 | 0.10 | (0.06) | 0.04 | (0.10) |
| Advisor Class |
| Year Ended 4/30/2018 | $10.36 | 0.14 | (0.09) | 0.05 | (0.14) |
| Year Ended 4/30/2017 | $10.43 | 0.12 | (0.07) | 0.05 | (0.12) |
| Year Ended 4/30/2016 | $10.41 | 0.09 | 0.02 | 0.11 | (0.09) |
| Year Ended 4/30/2015 | $10.47 | 0.11 | (0.06) | 0.05 | (0.11) |
| Year Ended 4/30/2014 | $10.54 | 0.13 | (0.08) | 0.05 | (0.12) |
| Class C |
| Year Ended 4/30/2018 | $10.35 | 0.03 | (0.09) | (0.06) | (0.04) |
| Year Ended 4/30/2017 | $10.42 | 0.01 | (0.06) | (0.05) | (0.02) |
| Year Ended 4/30/2016 | $10.42 | (0.01) | 0.01 | 0.00 (d) | (0.00) (d) |
| Year Ended 4/30/2015 | $10.48 | 0.00 (d) | (0.06) | (0.06) | (0.00) (d) |
| Year Ended 4/30/2014 | $10.54 | 0.02 | (0.06) | (0.04) | (0.02) |
| Institutional Class |
| Year Ended 4/30/2018 | $10.36 | 0.13 | (0.09) | 0.04 | (0.14) |
| Year Ended 4/30/2017 | $10.43 | 0.12 | (0.07) | 0.05 | (0.12) |
| Year Ended 4/30/2016 | $10.42 | 0.09 | 0.01 | 0.10 | (0.09) |
| Year Ended 4/30/2015 | $10.48 | 0.11 | (0.06) | 0.05 | (0.11) |
| Year Ended 4/30/2014 | $10.54 | 0.13 | (0.06) | 0.07 | (0.13) |
| Institutional 2 Class |
| Year Ended 4/30/2018 | $10.35 | 0.15 | (0.09) | 0.06 | (0.15) |
| Year Ended 4/30/2017 | $10.42 | 0.13 | (0.07) | 0.06 | (0.13) |
| Year Ended 4/30/2016 | $10.41 | 0.10 | 0.01 | 0.11 | (0.10) |
| Year Ended 4/30/2015 | $10.47 | 0.12 | (0.06) | 0.06 | (0.12) |
| Year Ended 4/30/2014 | $10.54 | 0.14 | (0.07) | 0.07 | (0.14) |
The accompanying Notes to Financial Statements are an integral part of this statement.
| 30 | Columbia Short Term Municipal Bond Fund | Annual Report 2018 |
Total
distributions to
shareholders | Net
asset
value,
end of
period | Total
return | Total gross
expense
ratio to
average
net assets(a) | Total net
expense
ratio to
average
net assets(a),(b) | Net investment
income (loss)
ratio to
average
net assets | Portfolio
turnover | Net
assets,
end of
period
(000’s) |
| |
| (0.12) | $10.26 | 0.16% | 0.81% | 0.67% (c) | 1.08% | 36% | $83,580 |
| (0.10) | $10.36 | 0.26% | 0.86% | 0.71% (c) | 0.86% | 46% | $106,751 |
| (0.07) | $10.43 | 0.74% | 0.89% | 0.72% (c) | 0.64% | 37% | $127,769 |
| (0.08) | $10.42 | 0.22% | 0.89% | 0.73% (c) | 0.79% | 28% | $130,876 |
| (0.10) | $10.48 | 0.37% | 0.89% | 0.73% (c) | 0.94% | 31% | $165,777 |
| |
| (0.14) | $10.27 | 0.51% | 0.56% | 0.42% (c) | 1.33% | 36% | $607 |
| (0.12) | $10.36 | 0.51% | 0.62% | 0.45% (c) | 1.15% | 46% | $1,041 |
| (0.09) | $10.43 | 1.09% | 0.64% | 0.47% (c) | 0.89% | 37% | $544 |
| (0.11) | $10.41 | 0.47% | 0.65% | 0.48% (c) | 1.04% | 28% | $568 |
| (0.12) | $10.47 | 0.53% | 0.64% | 0.48% (c) | 1.19% | 31% | $85 |
| |
| (0.04) | $10.25 | (0.59%) | 1.56% | 1.42% (c) | 0.33% | 36% | $10,327 |
| (0.02) | $10.35 | (0.48%) | 1.61% | 1.46% (c) | 0.11% | 46% | $14,630 |
| (0.00) (d) | $10.42 | 0.00% (d) | 1.64% | 1.47% (c) | (0.10%) | 37% | $19,074 |
| (0.00) (d) | $10.42 | (0.53%) | 1.64% | 1.48% (c) | 0.04% | 28% | $21,184 |
| (0.02) | $10.48 | (0.38%) | 1.64% | 1.48% (c) | 0.19% | 31% | $24,424 |
| |
| (0.14) | $10.26 | 0.40% | 0.58% | 0.44% (c) | 1.21% | 36% | $112,699 |
| (0.12) | $10.36 | 0.51% | 0.61% | 0.46% (c) | 1.11% | 46% | $1,366,779 |
| (0.09) | $10.43 | 0.99% | 0.64% | 0.47% (c) | 0.89% | 37% | $1,623,807 |
| (0.11) | $10.42 | 0.47% | 0.64% | 0.48% (c) | 1.04% | 28% | $1,699,650 |
| (0.13) | $10.48 | 0.62% | 0.64% | 0.48% (c) | 1.19% | 31% | $1,822,976 |
| |
| (0.15) | $10.26 | 0.55% | 0.51% | 0.37% | 1.41% | 36% | $18,813 |
| (0.13) | $10.35 | 0.61% | 0.50% | 0.36% | 1.21% | 46% | $14,452 |
| (0.10) | $10.42 | 1.10% | 0.49% | 0.37% | 1.00% | 37% | $22,159 |
| (0.12) | $10.41 | 0.57% | 0.49% | 0.38% | 1.14% | 28% | $15,024 |
| (0.14) | $10.47 | 0.67% | 0.48% | 0.37% | 1.31% | 31% | $23,173 |
Columbia Short Term Municipal Bond Fund | Annual Report 2018
| 31 |
Financial Highlights (continued)
| | Net asset value,
beginning of
period | Net
investment
income
(loss) | Net
realized
and
unrealized
gain (loss) | Total from
investment
operations | Distributions
from net
investment
income |
| Institutional 3 Class |
| Year Ended 4/30/2018 | $10.36 | 0.15 | (0.11) | 0.04 | (0.15) |
| Year Ended 4/30/2017(e) | $10.35 | 0.02 | 0.01 (f) | 0.03 | (0.02) |
| Notes to Financial Highlights |
| (a) | In addition to the fees and expenses that the Fund bears directly, the Fund indirectly bears a pro rata share of the fees and expenses of any other funds in which it invests. Such indirect expenses are not included in the Fund’s reported expense ratios. |
| (b) | Total net expenses include the impact of certain fee waivers/expense reimbursements made by the Investment Manager and certain of its affiliates, if applicable. |
| (c) | The benefits derived from expense reductions had an impact of less than 0.01%. |
| (d) | Rounds to zero. |
| (e) | Institutional 3 Class shares commenced operations on March 1, 2017. Per share data and total return reflect activity from that date. |
| (f) | Calculation of the net gain (loss) per share (both realized and unrealized) does not correlate to the aggregate realized and unrealized gain (loss) presented in the Statement of Operations due to the timing of subscriptions and redemptions of Fund shares in relation to fluctuations in the market value of the portfolio. |
| (g) | Annualized. |
The accompanying Notes to Financial Statements are an integral part of this statement.
| 32 | Columbia Short Term Municipal Bond Fund | Annual Report 2018 |
Total
distributions to
shareholders | Net
asset
value,
end of
period | Total
return | Total gross
expense
ratio to
average
net assets(a) | Total net
expense
ratio to
average
net assets(a),(b) | Net investment
income (loss)
ratio to
average
net assets | Portfolio
turnover | Net
assets,
end of
period
(000’s) |
| |
| (0.15) | $10.25 | 0.41% | 0.46% | 0.33% | 1.50% | 36% | $911,594 |
| (0.02) | $10.36 | 0.33% | 0.50% (g) | 0.31% (g) | 1.42% (g) | 46% | $10 |
Columbia Short Term Municipal Bond Fund | Annual Report 2018
| 33 |
Notes to Financial Statements
April 30, 2018
Note 1. Organization
Columbia Short Term Municipal Bond Fund (the Fund), a series of Columbia Funds Series Trust (the Trust), is a diversified fund. The Trust is registered under the Investment Company Act of 1940, as amended (the 1940 Act), as an open-end management investment company organized as a Delaware statutory trust.
Fund shares
The Trust may issue an unlimited number of shares (without par value). Although all share classes generally have identical voting, dividend and liquidation rights, each share class votes separately when required by the Trust’s organizational documents or by law. Different share classes pay different distribution amounts to the extent the expenses of such share classes differ, and distributions in liquidation will be proportional to the net asset value of each share class. Each share class has its own expense and sales charge structure. The Fund offers each of the share classes identified below.
Class A shares are subject to a maximum front-end sales charge of 1.00% based on the initial investment amount. Class A shares purchased without an initial sales charge are subject to a contingent deferred sales charge (CDSC) of 0.50% on certain investments of $500,000 or more if redeemed within 12 months after purchase.
Advisor Class shares are not subject to sales charges and are generally available only to omnibus retirement plans and certain investors as described in the Fund’s prospectus. Prior to November 1, 2017, Advisor Class shares were known as Class R4 shares.
Class B shares of the Fund are no longer offered for sale. Effective July 17, 2017, Class B shares were automatically converted to Class A shares without a CDSC. On August 4, 2017, the capital owned by Columbia Management Investment Advisers, LLC in Class B shares was redeemed without a CDSC.
Class C shares are subject to a 1.00% CDSC on shares redeemed within 12 months after purchase.
Institutional Class shares are not subject to sales charges and are generally available only to eligible investors, which are subject to different investment minimums as described in the Fund’s prospectus. Prior to November 1, 2017, Institutional Class shares were known as Class Z shares.
Institutional 2 Class shares are not subject to sales charges and are generally available only to investors purchasing through authorized investment professionals and omnibus retirement plans as described in the Fund’s prospectus. Prior to November 1, 2017, Institutional 2 Class shares were known as Class R5 shares.
Institutional 3 Class shares are not subject to sales charges and are available to institutional and certain other investors as described in the Fund’s prospectus. Institutional 3 Class shares commenced operations on March 1, 2017. Prior to November 1, 2017, Institutional 3 Class shares were known as Class Y shares.
Note 2. Summary of significant accounting policies
Basis of preparation
The Fund is an investment company that applies the accounting and reporting guidance in the Financial Accounting Standards Board (FASB) Accounting Standards Codification Topic 946, Financial Services - Investment Companies (ASC 946). The financial statements are prepared in accordance with U.S. generally accepted accounting principles (GAAP), which requires management to make certain estimates and assumptions that affect the reported amounts of assets and liabilities, the disclosure of contingent assets and liabilities at the date of the financial statements and the reported amounts of income and expenses during the reporting period. Actual results could differ from those estimates.
The following is a summary of significant accounting policies followed by the Fund in the preparation of its financial statements.
| 34 | Columbia Short Term Municipal Bond Fund | Annual Report 2018 |
Notes to Financial Statements (continued)
April 30, 2018
Security valuation
Debt securities generally are valued by pricing services approved by the Board of Trustees based upon market transactions for normal, institutional-size trading units of similar securities. The services may use various pricing techniques that take into account, as applicable, factors such as yield, quality, coupon rate, maturity, type of issue, trading characteristics and other data, as well as approved independent broker-dealer quotes. Debt securities for which quotations are not readily available or not believed to be reflective of market value may also be valued based upon a bid quote from an approved independent broker-dealer. Debt securities maturing in 60 days or less are valued primarily at amortized cost value, unless this method results in a valuation that management believes does not approximate market value.
Investments in open-end investment companies, including money market funds, are valued at their latest net asset value.
Investments for which market quotations are not readily available, or that have quotations which management believes are not reflective of market value or reliable, are valued at fair value as determined in good faith under procedures approved by and under the general supervision of the Board of Trustees. If a security or class of securities (such as foreign securities) is valued at fair value, such value is likely to be different from the quoted or published price for the security.
The determination of fair value often requires significant judgment. To determine fair value, management may use assumptions including but not limited to future cash flows and estimated risk premiums. Multiple inputs from various sources may be used to determine fair value.
GAAP requires disclosure regarding the inputs and valuation techniques used to measure fair value and any changes in valuation inputs or techniques. In addition, investments shall be disclosed by major category. This information is disclosed following the Fund’s Portfolio of Investments.
Derivative instruments
The Fund invests in certain derivative instruments, as detailed below, to meet its investment objectives. Derivatives are instruments whose values depend on, or are derived from, in whole or in part, the value of one or more securities, currencies, commodities, indices, or other assets or instruments. Derivatives may be used to increase investment flexibility (including to maintain cash reserves while maintaining desired exposure to certain assets), for risk management (hedging) purposes, to facilitate trading, to reduce transaction costs and to pursue higher investment returns. The Fund may also use derivative instruments to mitigate certain investment risks, such as foreign currency exchange rate risk, interest rate risk and credit risk. Derivatives may involve various risks, including the potential inability of the counterparty to fulfill its obligations under the terms of the contract, the potential for an illiquid secondary market (making it difficult for the Fund to sell or terminate, including at favorable prices) and the potential for market movements which may expose the Fund to gains or losses in excess of the amount shown in the Statement of Assets and Liabilities. The notional amounts of derivative instruments, if applicable, are not recorded in the financial statements.
A derivative instrument may suffer a marked-to-market loss if the value of the contract decreases due to an unfavorable change in the market rates or values of the underlying instrument. Losses can also occur if the counterparty does not perform its obligations under the contract. The Fund’s risk of loss from counterparty credit risk on over-the-counter derivatives is generally limited to the aggregate unrealized gain netted against any collateral held by the Fund and the amount of any variation margin held by the counterparty, plus any replacement costs or related amounts. With exchange-traded or centrally cleared derivatives, there is reduced counterparty credit risk to the Fund since the clearinghouse or central counterparty (CCP) provides some protection in the case of clearing member default. The clearinghouse or CCP stands between the buyer and the seller of the contract; therefore, additional counterparty credit risk is failure of the clearinghouse or CCP. However, credit risk still exists in exchange-traded or centrally cleared derivatives with respect to initial and variation margin that is held in a broker’s customer account. While brokers are required to segregate customer margin from their own assets, in the event that a broker becomes insolvent or goes into bankruptcy and at that time there is a shortfall in the aggregate amount of margin held by the broker for all its clients, U.S. bankruptcy laws will typically allocate that shortfall on a pro-rata basis across all the broker’s customers (including the Fund), potentially resulting in losses to the Fund.
In order to better define its contractual rights and to secure rights that will help the Fund mitigate its counterparty risk, the Fund may enter into an International Swaps and Derivatives Association, Inc. Master Agreement (ISDA Master Agreement) or similar agreement with its derivatives contract counterparties. An ISDA Master Agreement is an agreement between the Fund
Columbia Short Term Municipal Bond Fund | Annual Report 2018
| 35 |
Notes to Financial Statements (continued)
April 30, 2018
and a counterparty that governs over-the-counter derivatives and typically contains, among other things, collateral posting terms and netting provisions in the event of a default and/or termination event. Under an ISDA Master Agreement, the Fund may, under certain circumstances, offset with the counterparty certain derivative instrument’s payables and/or receivables with collateral held and/or posted and create one single net payment. The provisions of the ISDA Master Agreement typically permit a single net payment in the event of default (close-out netting), including the bankruptcy or insolvency of the counterparty. Note, however, that bankruptcy or insolvency laws of a particular jurisdiction may impose restrictions on or prohibitions against the right of offset or netting in bankruptcy, insolvency or other events.
Collateral (margin) requirements differ by type of derivative. Margin requirements are established by the clearinghouse or CCP for exchange-traded and centrally cleared derivatives. Brokers can ask for margin in excess of the minimum in certain circumstances. Collateral terms are contract specific for over-the-counter derivatives. For over-the-counter derivatives traded under an ISDA Master Agreement, the collateral requirements are typically calculated by netting the marked-to-market amount for each transaction under such agreement and comparing that amount to the value of any variation margin currently pledged by the Fund and/or the counterparty. Generally, the amount of collateral due from or to a party has to exceed a minimum transfer amount threshold (e.g., $250,000) before a transfer has to be made. To the extent amounts due to the Fund from its counterparties are not fully collateralized, contractually or otherwise, the Fund bears the risk of loss from counterparty nonperformance. The Fund may also pay interest expense on cash collateral received from the broker. Any interest expense paid by the Fund is shown on the Statement of Operations. The Fund attempts to mitigate counterparty risk by only entering into agreements with counterparties that it believes have the financial resources to honor their obligations and by monitoring the financial stability of those counterparties.
Certain ISDA Master Agreements allow counterparties of over-the-counter derivatives transactions to terminate derivatives contracts prior to maturity in the event the Fund’s net asset value declines by a stated percentage over a specified time period or if the Fund fails to meet certain terms of the ISDA Master Agreement, which would cause the Fund to accelerate payment of any net liability owed to the counterparty. The Fund also has termination rights if the counterparty fails to meet certain terms of the ISDA Master Agreement. In addition to considering counterparty credit risk, the Fund would consider terminating the derivatives contracts based on whether termination would result in a net liability owed from the counterparty.
For financial reporting purposes, the Fund does not offset derivative assets and derivative liabilities that are subject to netting arrangements in the Statement of Assets and Liabilities.
Futures contracts
Futures contracts are exchange-traded and represent commitments for the future purchase or sale of an asset at a specified price on a specified date. The Fund bought and sold futures contracts to manage the duration and yield curve exposure of the Fund versus the benchmark and to manage exposure to movements in interest rates. These instruments may be used for other purposes in future periods. Upon entering into futures contracts, the Fund bears risks that it may not achieve the anticipated benefits of the futures contracts and may realize a loss. Additional risks include counterparty credit risk, the possibility of an illiquid market, and that a change in the value of the contract or option may not correlate with changes in the value of the underlying asset.
Upon entering into a futures contract, the Fund deposits cash or securities with the broker, known as a futures commission merchant (FCM), in an amount sufficient to meet the initial margin requirement. The initial margin deposit must be maintained at an established level over the life of the contract. Cash deposited as initial margin is recorded in the Statement of Assets and Liabilities as margin deposits. Securities deposited as initial margin are designated in the Portfolio of Investments. Subsequent payments (variation margin) are made or received by the Fund each day. The variation margin payments are equal to the daily change in the contract value and are recorded as variation margin receivable or payable and are offset in unrealized gains or losses. The Fund recognizes a realized gain or loss when the contract is closed or expires. Futures contracts involve, to varying degrees, risk of loss in excess of the variation margin disclosed in the Statement of Assets and Liabilities.
| 36 | Columbia Short Term Municipal Bond Fund | Annual Report 2018 |
Notes to Financial Statements (continued)
April 30, 2018
Effects of derivative transactions in the financial statements
The following tables are intended to provide additional information about the effect of derivatives on the financial statements of the Fund, including: the fair value of derivatives by risk category and the location of those fair values in the Statement of Assets and Liabilities; and the impact of derivative transactions over the period in the Statement of Operations, including realized and unrealized gains (losses). The derivative instrument schedules following the Portfolio of Investments present additional information regarding derivative instruments outstanding at the end of the period, if any.
The following table indicates the effect of derivative instruments (not considered to be hedging instruments for accounting disclosure purposes) in the Statement of Operations for the year ended April 30, 2018:
| Amount of realized gain (loss) on derivatives recognized in income |
| Risk exposure category | Futures
contracts
($) |
| Interest rate risk | 39,865 |
The following table is a summary of the average outstanding volume by derivative instrument for the year ended April 30, 2018:
| Derivative instrument | Average notional
amounts ($)* |
| Futures contracts — short | 1,687,205 |
| * | Based on the ending daily outstanding amounts for the year ended April 30, 2018. |
Delayed delivery securities
The Fund may trade securities on other than normal settlement terms, including securities purchased or sold on a “when-issued” or "forward commitment" basis. This may increase risk to the Fund since the other party to the transaction may fail to deliver, which could cause the Fund to subsequently invest at less advantageous prices. The Fund designates cash or liquid securities in an amount equal to the delayed delivery commitment.
Security transactions
Security transactions are accounted for on the trade date. Cost is determined and gains (losses) are based upon the specific identification method for both financial statement and federal income tax purposes.
Income recognition
Interest income is recorded on an accrual basis. Market premiums and discounts, including original issue discounts, are amortized and accreted, respectively, over the expected life of the security on all debt securities, unless otherwise noted.
The Fund may place a debt security on non-accrual status and reduce related interest income when it becomes probable that the interest will not be collected and the amount of uncollectible interest can be reasonably estimated. A defaulted debt security is removed from non-accrual status when the issuer resumes interest payments or when collectibility of interest is reasonably assured.
Dividend income is recorded on the ex-dividend date.
Expenses
General expenses of the Trust are allocated to the Fund and other funds of the Trust based upon relative net assets or other expense allocation methodologies determined by the nature of the expense. Expenses directly attributable to the Fund are charged to the Fund. Expenses directly attributable to a specific class of shares are charged to that share class.
Columbia Short Term Municipal Bond Fund | Annual Report 2018
| 37 |
Notes to Financial Statements (continued)
April 30, 2018
Determination of class net asset value
All income, expenses (other than class-specific expenses, which are charged to that share class, as shown in the Statement of Operations) and realized and unrealized gains (losses) are allocated to each class of the Fund on a daily basis, based on the relative net assets of each class, for purposes of determining the net asset value of each class.
Federal income tax status
The Fund intends to qualify each year as a regulated investment company under Subchapter M of the Internal Revenue Code, as amended, and will distribute substantially all of its net tax-exempt and investment company taxable income and net capital gain, if any, for its tax year, and as such will not be subject to federal income taxes. In addition, the Fund intends to distribute in each calendar year substantially all of its ordinary income, capital gain net income and certain other amounts, if any, such that the Fund should not be subject to federal excise tax. Therefore, no federal income or excise tax provision is recorded.
Distributions to shareholders
Distributions from net investment income, if any, are declared daily and paid monthly. Net realized capital gains, if any, are distributed at least annually. Income distributions and capital gain distributions are determined in accordance with federal income tax regulations, which may differ from GAAP.
Guarantees and indemnifications
Under the Trust’s organizational documents and, in some cases, by contract, its officers and trustees are indemnified against certain liabilities arising out of the performance of their duties to the Trust or its funds. In addition, certain of the Fund’s contracts with its service providers contain general indemnification clauses. The Fund’s maximum exposure under these arrangements is unknown since the amount of any future claims that may be made against the Fund cannot be determined, and the Fund has no historical basis for predicting the likelihood of any such claims.
Recent accounting pronouncement
Accounting Standards Update 2017-08 Premium Amortization on Purchased Callable Debt Securities
In March 2017, the Financial Accounting Standards Board issued Accounting Standards Update (ASU) No. 2017-08 Premium Amortization on Purchased Callable Debt Securities. ASU No. 2017-08 updates the accounting standards to shorten the amortization period for certain purchased callable debt securities, held at a premium, to be amortized to the earliest call date. The update applies to securities with explicit, noncontingent call features that are callable at fixed prices and on preset dates. The standard is effective for annual periods beginning after December 15, 2018 and interim periods within those fiscal years. At this time, management is evaluating the implication of this guidance and the impact it will have on the financial statement amounts and footnote disclosures, if any.
Note 3. Fees and other transactions with affiliates
Management services fees
The Fund has entered into a Management Agreement with Columbia Management Investment Advisers, LLC (the Investment Manager), a wholly-owned subsidiary of Ameriprise Financial, Inc. (Ameriprise Financial). Under the Management Agreement, the Investment Manager provides the Fund with investment research and advice, as well as administrative and accounting services. The management services fee is an annual fee that is equal to a percentage of the Fund’s daily net assets that declines from 0.43% to 0.28% as the Fund’s net assets increase. The effective management services fee rate for the year ended April 30, 2018 was 0.42% of the Fund’s average daily net assets.
Compensation of board members
Members of the Board of Trustees who are not officers or employees of the Investment Manager or Ameriprise Financial are compensated for their services to the Fund as disclosed in the Statement of Operations. Under a Deferred Compensation Plan (the Plan), these members of the Board of Trustees may elect to defer payment of up to 100% of their compensation. Deferred amounts are treated as though equivalent dollar amounts had been invested in shares of certain funds managed by
| 38 | Columbia Short Term Municipal Bond Fund | Annual Report 2018 |
Notes to Financial Statements (continued)
April 30, 2018
the Investment Manager. The Fund’s liability for these amounts is adjusted for market value changes and remains in the Fund until distributed in accordance with the Plan. All amounts payable under the Plan constitute a general unsecured obligation of the Fund.
Compensation of Chief Compliance Officer
The Board of Trustees has appointed a Chief Compliance Officer to the Fund in accordance with federal securities regulations. As disclosed in the Statement of Operations, a portion of the Chief Compliance Officer’s total compensation is allocated to the Fund, along with other allocations to affiliated funds governed by the Board of Trustees, based on relative net assets.
Transfer agency fees
Under a Transfer and Dividend Disbursing Agent Agreement, Columbia Management Investment Services Corp. (the Transfer Agent), an affiliate of the Investment Manager and a wholly-owned subsidiary of Ameriprise Financial, is responsible for providing transfer agency services to the Fund. The Transfer Agent has contracted with DST Asset Manager Solutions, Inc. (DST) to serve as sub-transfer agent. The Transfer Agent pays the fees of DST for services as sub-transfer agent and DST is not entitled to reimbursement for such fees from the Fund (with the exception of out-of-pocket fees).
The Fund pays the Transfer Agent a monthly transfer agency fee based on the number or the average value of accounts, depending on the type of account. In addition, the Fund pays the Transfer Agent a fee for shareholder services based on the number of accounts or on a percentage of the average aggregate value of the Fund’s shares maintained in omnibus accounts up to the lesser of the amount charged by the financial intermediary or a cap established by the Board of Trustees from time to time.
The Transfer Agent also receives compensation from the Fund for various shareholder services and reimbursements for certain out-of-pocket fees. Effective August 1, 2017, total transfer agency fees for Institutional 2 Class and Institutional 3 Class shares are subject to an annual limitation of not more than 0.07% and 0.02%, respectively, of the average daily net assets attributable to each share class. Prior to August 1, 2017, these limitations were 0.075% for Institutional 2 Class shares and 0.025% for Institutional 3 Class shares.
For the year ended April 30, 2018, the Fund’s effective transfer agency fee rates as a percentage of average daily net assets of each class were as follows:
| | Effective rate (%) |
| Class A | 0.11 |
| Advisor Class | 0.11 |
| Class B | 0.04 (a) |
| Class C | 0.11 |
| Institutional Class | 0.14 |
| Institutional 2 Class | 0.06 |
| Institutional 3 Class | 0.01 |
An annual minimum account balance fee of $20 may apply to certain accounts with a value below the applicable share class’s initial minimum investment requirements to reduce the impact of small accounts on transfer agency fees. These minimum account balance fees are remitted to the Fund and recorded as part of expense reductions in the Statement of Operations. For the year ended April 30, 2018, these minimum account balance fees reduced total expenses of the Fund by $40.
Distribution and service fees
The Fund has entered into an agreement with Columbia Management Investment Distributors, Inc. (the Distributor), an affiliate of the Investment Manager and a wholly-owned subsidiary of Ameriprise Financial, for distribution and shareholder services. The Board of Trustees has approved, and the Fund has adopted, distribution and shareholder service plans (the
Columbia Short Term Municipal Bond Fund | Annual Report 2018
| 39 |
Notes to Financial Statements (continued)
April 30, 2018
Plans) applicable to certain share classes, which set the distribution and service fees for the Fund. These fees are calculated daily and are intended to compensate the Distributor and/or eligible selling and/or servicing agents for selling shares of the Fund and providing services to investors.
Under the Plans, the Fund pays a monthly combined distribution and service fee to the Distributor at the maximum annual rate of 0.25% of the average daily net assets attributable to Class A shares of the Fund. Also under the Plans, the Fund pays a monthly service fee to the Distributor at the maximum annual rate of 0.25% of the average daily net assets attributable to Class B and Class C shares of the Fund and a monthly distribution fee to the Distributor at the maximum annual rate of 0.75% of the average daily net assets attributable to Class B and Class C shares of the Fund. As a result of all Class B shares of the Fund being redeemed or converted to Class A shares, August 4, 2017 was the last day the Fund paid a distribution and service fee for Class B shares.
Sales charges (unaudited)
Sales charges, including front-end charges and CDSCs, received by the Distributor for distributing Fund shares for the year ended April 30, 2018, if any, are listed below:
| | Amount ($) |
| Class A | 21,994 |
| Class C | 358 |
Expenses waived/reimbursed by the Investment Manager and its affiliates
The Investment Manager and certain of its affiliates have contractually agreed to waive fees and/or reimburse expenses (excluding certain fees and expenses described below) for the period(s) disclosed below, unless sooner terminated at the sole discretion of the Board of Trustees, so that the Fund’s net operating expenses, after giving effect to fees waived/expenses reimbursed and any balance credits and/or overdraft charges from the Fund’s custodian, do not exceed the following annual rate(s) as a percentage of the class’ average daily net assets:
| | September 1, 2017
through
August 31, 2018 | Prior to
September 1, 2017 |
| Class A | 0.67% | 0.70% |
| Advisor Class | 0.42 | 0.45 |
| Class C | 1.42 | 1.45 |
| Institutional Class | 0.42 | 0.45 |
| Institutional 2 Class | 0.39 | 0.36 |
| Institutional 3 Class | 0.33 | 0.31 |
Under the agreement governing these fee waivers and/or expense reimbursement arrangements, the following fees and expenses are excluded from the waiver/reimbursement commitment, and therefore will be paid by the Fund, if applicable: taxes (including foreign transaction taxes), expenses associated with investments in affiliated and non-affiliated pooled investment vehicles (including mutual funds and exchange-traded funds), transaction costs and brokerage commissions, costs related to any securities lending program, dividend expenses associated with securities sold short, inverse floater program fees and expenses, transaction charges and interest on borrowed money, interest, infrequent and/or unusual expenses and any other expenses the exclusion of which is specifically approved by the Board of Trustees. This agreement may be modified or amended only with approval from the Investment Manager, certain of its affiliates and the Fund. In addition to the contractual agreement, the Investment Manager and certain of its affiliates have voluntarily agreed to waive fees and/or reimburse Fund expenses (excluding certain fees and expenses described above) so that Fund level expenses (expenses directly attributable to the Fund and not to a specific share class) are waived proportionately across all share classes, but the Fund’s net operating expenses shall not exceed the contractual annual rates listed in the table above. This arrangement may be revised or discontinued at any time. Any fees waived and/or expenses reimbursed under the expense reimbursement arrangements described above are not recoverable by the Investment Manager or its affiliates in future periods.
| 40 | Columbia Short Term Municipal Bond Fund | Annual Report 2018 |
Notes to Financial Statements (continued)
April 30, 2018
Note 4. Federal tax information
The timing and character of income and capital gain distributions are determined in accordance with income tax regulations, which may differ from GAAP because of temporary or permanent book to tax differences.
At April 30, 2018, these differences were primarily due to differing treatment for capital loss carryforwards, trustees’ deferred compensation and distributions. To the extent these differences were permanent, reclassifications were made among the components of the Fund’s net assets in the Statement of Assets and Liabilities. Temporary differences do not require reclassifications.
In the Statement of Assets and Liabilities the following reclassifications were made:
Undistributed net
investment
income ($) | Accumulated
net realized
(loss) ($) | Paid in
capital ($) |
| — | 602,849 | (602,849) |
Net investment income (loss) and net realized gains (losses), as disclosed in the Statement of Operations, and net assets were not affected by this reclassification.
The tax character of distributions paid during the years indicated was as follows:
| Year Ended April 30, 2018 | Year Ended April 30, 2017 |
Ordinary
income ($) | Tax-exempt
income ($) | Long-term
capital gains ($) | Total ($) | Ordinary
income ($) | Tax-exempt
income ($) | Long-term
capital gains ($) | Total ($) |
| — | 18,496,981 | — | 18,496,981 | — | 19,087,657 | — | 19,087,657 |
Short-term capital gain distributions, if any, are considered ordinary income distributions for tax purposes.
At April 30, 2018, the components of distributable earnings on a tax basis were as follows:
Undistributed
ordinary income ($) | Undistributed tax-
exempt income ($) | Undistributed
long-term
capital gains ($) | Capital loss
carryforwards ($) | Net unrealized
(depreciation) ($) |
| — | 2,394,621 | — | (2,190,037) | (10,742,417) |
At April 30, 2018, the cost of all investments for federal income tax purposes along with the aggregate gross unrealized appreciation and depreciation based on that cost was:
Federal
tax cost ($) | Gross unrealized
appreciation ($) | Gross unrealized
(depreciation) ($) | Net unrealized
(depreciation) ($) |
| 1,153,361,837 | 438,349 | (11,180,766) | (10,742,417) |
Tax cost of investments and unrealized appreciation/(depreciation) may also include timing differences that do not constitute adjustments to tax basis.
The following capital loss carryforwards, determined at April 30, 2018, may be available to reduce taxable income arising from future net realized gains on investments, if any, to the extent permitted by the Internal Revenue Code. Capital loss carryforwards with no expiration are required to be utilized prior to any capital losses which carry an expiration date. As a result of this ordering rule, capital loss carryforwards which carry an expiration date may be more likely to expire unused. In addition, for the year ended April 30, 2018, capital loss carryforwards utilized, expired unused and permanently lost, if any, were as follows:
| 2019 ($) | No expiration
short-term ($) | No expiration
long-term ($) | Total ($) | Utilized ($) | Expired ($) | Permanently
lost ($) |
| — | 690,134 | 1,499,903 | 2,190,037 | — | 602,849 | — |
Columbia Short Term Municipal Bond Fund | Annual Report 2018
| 41 |
Notes to Financial Statements (continued)
April 30, 2018
Management of the Fund has concluded that there are no significant uncertain tax positions in the Fund that would require recognition in the financial statements. However, management’s conclusion may be subject to review and adjustment at a later date based on factors including, but not limited to, new tax laws, regulations, and administrative interpretations (including relevant court decisions). Generally, the Fund’s federal tax returns for the prior three fiscal years remain subject to examination by the Internal Revenue Service.
Note 5. Portfolio information
The cost of purchases and proceeds from sales of securities, excluding short-term investments and derivatives, if any, aggregated to $417,253,284 and $730,409,204, respectively, for the year ended April 30, 2018. The amount of purchase and sale activity impacts the portfolio turnover rate reported in the Financial Highlights.
Note 6. Line of credit
The Fund has access to a revolving credit facility with a syndicate of banks led by Citibank, N.A., HSBC Bank USA, N.A. and JPMorgan Chase Bank, N.A. whereby the Fund may borrow for the temporary funding of shareholder redemptions or for other temporary or emergency purposes. The credit facility, which is a collective agreement between the Fund and certain other funds managed by the Investment Manager, severally and not jointly, permits collective borrowings up to $1 billion. Interest is charged to each participating fund based on its borrowings at a rate equal to the higher of (i) the overnight federal funds rate plus 1.00% or (ii) the one-month LIBOR rate plus 1.00%. Each borrowing under the credit facility matures no later than 60 days after the date of borrowing. The Fund also pays a commitment fee equal to its pro rata share of the amount of the credit facility at a rate of 0.15% per annum. The commitment fee is included in other expenses in the Statement of Operations.
The Fund had no borrowings during the year ended April 30, 2018.
Note 7. Significant risks
Credit risk
Credit risk is the risk that the value of debt securities in the Fund’s portfolio may decline because the issuer may default and fail to pay interest or repay principal when due. Rating agencies assign credit ratings to debt securities to indicate their credit risk. Lower rated or unrated debt securities held by the Fund may present increased credit risk as compared to higher-rated debt securities.
New York geographic concentration risk
To the extent that the Fund concentrates its investments in the municipal securities issued by a particular state and political sub-divisions of the state, the Fund will be particularly affected by political and economic conditions and developments in such state in which it invests. The Fund may, therefore, have a greater risk than that of a municipal bond fund which is more geographically diversified. The value of the municipal securities owned by the Fund also may be adversely affected by future changes in federal or state income tax laws.
Interest rate risk
Interest rate risk is the risk of losses attributable to changes in interest rates. In general, if prevailing interest rates rise, the values of debt securities tend to fall, and if interest rates fall, the values of debt securities tend to rise. Actions by governments and central banking authorities can result in increases in interest rates. Increasing interest rates may negatively affect the value of debt securities held by the Fund, resulting in a negative impact on the Fund’s performance and net asset value per share. In general, the longer the maturity or duration of a debt security, the greater its sensitivity to changes in interest rates.
Liquidity risk
Liquidity risk is the risk associated with a lack of marketability of investments which may make it difficult to sell the investment at a desirable time or price. Changing regulatory, market or other conditions or environments (for example, the interest rate or credit environments) may adversely affect the liquidity of the Fund’s investments. The Fund may have to
| 42 | Columbia Short Term Municipal Bond Fund | Annual Report 2018 |
Notes to Financial Statements (continued)
April 30, 2018
accept a lower selling price for the holding, sell other investments, or forego another, more appealing investment opportunity. Generally, the less liquid the market at the time the Fund sells a portfolio investment, the greater the risk of loss or decline of value to the Fund. A less liquid market can lead to an increase in Fund redemptions, which may negatively impact Fund performance and net asset value per share, including, for example, if the Fund is forced to sell securities in a down market.
Municipal securities risk
Securities issued by a particular state and its instrumentalities are subject to the risk of unfavorable developments in such state. A municipal security can be significantly affected by adverse tax, legislative, regulatory, demographic or political changes as well as changes in a particular state’s (state and its instrumentalities’) financial, economic or other condition and prospects. Because the Fund invests significantly in municipal securities issued by the State of New York and its political sub-divisions, the Fund will be particularly affected by any such changes in or otherwise impacting New York and its political sub-divisions.
Note 8. Subsequent events
Management has evaluated the events and transactions that have occurred through the date the financial statements were issued and noted no items requiring adjustment of the financial statements or additional disclosure.
Note 9. Information regarding pending and settled legal proceedings
Ameriprise Financial and certain of its affiliates have historically been involved in a number of legal, arbitration and regulatory proceedings, including routine litigation, class actions, and governmental actions, concerning matters arising in connection with the conduct of their business activities. Ameriprise Financial believes that the Fund is not currently the subject of, and that neither Ameriprise Financial nor any of its affiliates are the subject of, any pending legal, arbitration or regulatory proceedings that are likely to have a material adverse effect on the Fund or the ability of Ameriprise Financial or its affiliates to perform under their contracts with the Fund. Ameriprise Financial is required to make quarterly (10-Q), annual (10-K) and, as necessary, 8-K filings with the Securities and Exchange Commission (SEC) on legal and regulatory matters that relate to Ameriprise Financial and its affiliates. Copies of these filings may be obtained by accessing the SEC website at www.sec.gov.
There can be no assurance that these matters, or the adverse publicity associated with them, will not result in increased Fund redemptions, reduced sale of Fund shares or other adverse consequences to the Fund. Further, although we believe proceedings are not likely to have a material adverse effect on the Fund or the ability of Ameriprise Financial or its affiliates to perform under their contracts with the Fund, these proceedings are subject to uncertainties and, as such, we are unable to estimate the possible loss or range of loss that may result. An adverse outcome in one or more of these proceedings could result in adverse judgments, settlements, fines, penalties or other relief that could have a material adverse effect on the consolidated financial condition or results of operations of Ameriprise Financial.
Columbia Short Term Municipal Bond Fund | Annual Report 2018
| 43 |
Report of Independent Registered Public Accounting Firm
To the Board of Trustees of Columbia Funds Series Trust and Shareholders of Columbia Short Term Municipal Bond Fund
Opinion on the Financial Statements
We have audited the accompanying statement of assets and liabilities, including the portfolio of investments, of Columbia Short Term Municipal Bond Fund (one of the funds constituting Columbia Funds Series Trust, referred to hereafter as the "Fund") as of April 30, 2018, the related statement of operations for the year ended April 30, 2018, the statement of changes in net assets for each of the two years in the period ended April 30, 2018, including the related notes, and the financial highlights for each of the periods indicated therein (collectively referred to as the “financial statements”). In our opinion, the financial statements present fairly, in all material respects, the financial position of the Fund as of April 30, 2018, the results of its operations for the year then ended, the changes in its net assets for each of the two years in the period ended April 30, 2018 and the financial highlights for each of the periods indicated therein in conformity with accounting principles generally accepted in the United States of America.
Basis for Opinion
These financial statements are the responsibility of the Fund’s management. Our responsibility is to express an opinion on the Fund’s financial statements based on our audits. We are a public accounting firm registered with the Public Company Accounting Oversight Board (United States) (“PCAOB”) and are required to be independent with respect to the Fund in accordance with the U.S. federal securities laws and the applicable rules and regulations of the Securities and Exchange Commission and the PCAOB.
We conducted our audits of these financial statements in accordance with the standards of the PCAOB. Those standards require that we plan and perform the audit to obtain reasonable assurance about whether the financial statements are free of material misstatement, whether due to error or fraud.
Our audits included performing procedures to assess the risks of material misstatement of the financial statements, whether due to error or fraud, and performing procedures that respond to those risks. Such procedures included examining, on a test basis, evidence regarding the amounts and disclosures in the financial statements. Our audits also included evaluating the accounting principles used and significant estimates made by management, as well as evaluating the overall presentation of the financial statements. Our procedures included confirmation of securities owned as of April 30, 2018 by correspondence with the custodian and brokers; when replies were not received from brokers, we performed other auditing procedures. We believe that our audits provide a reasonable basis for our opinion.
/s/PricewaterhouseCoopers LLP
Minneapolis, Minnesota
June 21, 2018
We have served as auditors of one or more investment companies within the Columbia Funds Complex since 1977.
| 44 | Columbia Short Term Municipal Bond Fund | Annual Report 2018 |
Federal Income Tax Information
(Unaudited)
The Fund hereby designates the following tax attributes for the fiscal year ended April 30, 2018. Shareholders will be notified in early 2019 of the amounts for use in preparing 2018 income tax returns.
Exempt-
interest
dividends | |
| 100.00% | |
Exempt-interest dividends. The percentage of net investment income distributed during the fiscal year that qualifies as exempt-interest dividends for federal income tax purposes. A portion of the income may be subject to federal alternative minimum tax.
Shareholders elect the Board that oversees the Fund’s operations. The Board appoints officers who are responsible for day-to-day business decisions based on policies set by the Board. The following table provides basic biographical information about the Fund’s Trustees, including their principal occupations during the past five years, although specific titles for individuals may have varied over the period. Under current Board policy, Trustees not affiliated with the Investment Manager generally may serve through the end of the calendar year in which they reach either the mandatory retirement age established by the Board or the fifteenth anniversary of the first Columbia Funds board meeting they attended as a member of the Board.
Independent trustees
Name,
address,
year of birth | Position held
with the Trust and
length of service | Principal occupation(s)
during past five years
and other relevant
professional experience | Number of
Funds in the
Columbia Funds
complex
overseen | Other directorships
held by Trustee
during the past
five years |
George S. Batejan
c/o Columbia Management
Investment Advisers, LLC
225 Franklin Street
Mail Drop BX32 05228
Boston, MA 02110
1953 | Trustee since 1/17 | Executive Vice President, Global Head of Technology and Operations, Janus Capital Group, Inc., 2010-2016 | 125 | Advisory Board Member, University of Colorado Business School since November 2015; former Chairman of the Board, NICSA (National Investment Company Services Association) (Executive Committee, Nominating Committee and Governance Committee), 2014-2016; former Director, Intech Investment Management, 2011- 2016; former Board Member, Metro Denver Chamber of Commerce, 2015-2016 |
Kathleen Blatz
c/o Columbia Management
Investment Advisers, LLC
225 Franklin Street
Mail Drop BX32 05228
Boston, MA 02110
1954 | Trustee since 1/06 for RiverSource Funds and since 6/11 for Nations Funds | Attorney; specializing in arbitration and mediation; Interim President and Chief Executive Officer, Blue Cross and Blue Shield of Minnesota (health care insurance) since February 2018; Chief Justice, Minnesota Supreme Court, 1998-2006; Associate Justice, Minnesota Supreme Court, 1996-1998; Fourth Judicial District Court Judge, Hennepin County, 1994-1996; Attorney in private practice and public service, 1984-1993; State Representative, Minnesota House of Representatives, 1979-1993, which included service on the Tax and Financial Institutions and Insurance Committees; Interim Chair, Minnesota Sports Facilities Authority, March 2017-July 2017 | 125 | Trustee, BlueCross BlueShield of Minnesota since 2009 (Chair of the Business Development Committee, 2014-2017; Chair of the Governance Committee since 2017); Chair of the Robina Foundation since August 2013; former Member of the Board, Minnesota Sports Facilities Authority, January 2017-July 2017 |
Edward J. Boudreau, Jr.
c/o Columbia Management
Investment Advisers, LLC
225 Franklin Street
Mail Drop BX32 05228
Boston, MA 02110
1944 | Chair of the Board since 1/18; Trustee since 6/11 for RiverSource Funds and since 1/05 for Nations Funds | Managing Director, E.J. Boudreau & Associates (consulting) since 2000; FINRA Industry Arbitrator, 2002-present; Chairman and Chief Executive Officer, John Hancock Investments (asset management), Chairman and Interested Trustee for open-end and closed-end funds offered by John Hancock, 1989-2000; John Hancock Mutual Life Insurance Company, including Senior Vice President and Treasurer and Senior Vice President Information Technology, 1968-1988 | 125 | Former Trustee, Boston Museum of Science (Chair of Finance Committee) 1985-2013; former Trustee, BofA Funds Series Trust (11 funds), 2005-2011 |
| 46 | Columbia Short Term Municipal Bond Fund | Annual Report 2018 |
TRUSTEES AND OFFICERS (continued)
Independent trustees (continued)
Name,
address,
year of birth | Position held
with the Trust and
length of service | Principal occupation(s)
during past five years
and other relevant
professional experience | Number of
Funds in the
Columbia Funds
complex
overseen | Other directorships
held by Trustee
during the past
five years |
Pamela G. Carlton
c/o Columbia Management
Investment Advisers, LLC
225 Franklin Street
Mail Drop BX32 05228
Boston, MA 02110
1954 | Trustee since 7/07 for RiverSource Funds and since 6/11 for Nations Funds | President, Springboard — Partners in Cross Cultural Leadership (consulting company) since 2003; Managing Director of US Equity Research, JP Morgan Chase, 1999-2003; Director of US Equity Research, Chase Asset Management, 1996-1999; Co-Director Latin America Research, 1993-1996, COO Global Research, 1992-1996, Co-Director of US Research, 1991-1992, Investment Banker, Morgan Stanley, 1982-1991 | 125 | Trustee, New York Presbyterian Hospital Board (Executive Committee and Chair of Human Resources Committee) since 1996; Director, Darien Rowayton Bank (Audit Committee) since 2017 |
William P. Carmichael
c/o Columbia Management
Investment Advisers, LLC
225 Franklin Street
Mail Drop BX32 05228
Boston, MA 02110
1943 | Trustee since 6/11 for RiverSource Funds and since 2003 for Nations Funds | Retired; Co-founder, The Succession Fund (provides exit strategies to owners of privately held companies), 1998-2007; Adjunct Professor of Finance, Kelley School of Business, Indiana University, 1993-2007; Senior Vice President, Sara Lee Corporation, 1991-1993; Senior Vice President and Chief Financial Officer, Beatrice Foods Company, 1984-1990; Vice President, Esmark, Inc., 1973-1984; Associate, Price Waterhouse, 1968-1972 | 125 | Director, The Finish Line (athletic shoes and apparel) since July 2003; former Director, Cobra Electronics Corporation (electronic equipment manufacturer), 1994-August 2014; former Director, Spectrum Brands, Inc. (consumer products), 2002-2009; former Director, Simmons Company (bedding), 2004-2010; former Trustee, BofA Funds Series Trust (11 funds) 2003-2011; former Director, McMoRan Exploration Company (oil and gas exploration and development) 2010 - 2013; former Director, International Textile Corp., 2012-2016; former Director, hhgregg, 2015-2017 |
Patricia M. Flynn
c/o Columbia Management
Investment Advisers, LLC
225 Franklin Street
Mail Drop BX32 05228
Boston, MA 02110
1950 | Trustee since 11/04 for RiverSource Funds and since 6/11 for Nations Funds | Trustee Professor of Economics and Management, Bentley University since 1976 (also teaches and conducts research on corporate governance); Dean, McCallum Graduate School of Business, Bentley University, 1992-2002 | 125 | Trustee, MA Taxpayers Foundation since 1997; Board of Directors, The MA Business Roundtable since 2003; Board of Governors, Innovation Institute, MA Technology Collaborative since 2010 |
Brian J. Gallagher
c/o Columbia Management
Investment Advisers, LLC
225 Franklin Street
Mail Drop BX32 05228
Boston, MA 02110
1954 | Trustee since 12/17 | Retired; Partner with Deloitte & Touche LLP and its predecessors, 1977-2016 | 123 | Trustee, Catholic Schools Foundation since 2004 |
Catherine James Paglia
c/o Columbia Management
Investment Advisers, LLC
225 Franklin Street
Mail Drop BX32 05228
Boston, MA 02110
1952 | Trustee since 11/04 for RiverSource Funds and since 6/11 for Nations Funds | Director, Enterprise Asset Management, Inc. (private real estate and asset management company) since September 1998; Managing Director and Partner, Interlaken Capital, Inc., 1989-1997; Managing Director, Morgan Stanley, 1982-1989; Vice President, Investment Banking, 1980-1982, Associate, Investment Banking, 1976-1980, Dean Witter Reynolds, Inc. | 125 | Director, Valmont Industries, Inc. (irrigation systems manufacturer) since 2012; Trustee, Carleton College (on the Investment Committee); Trustee, Carnegie Endowment for International Peace (on the Investment Committee) |
Columbia Short Term Municipal Bond Fund | Annual Report 2018
| 47 |
TRUSTEES AND OFFICERS (continued)
Independent trustees (continued)
Name,
address,
year of birth | Position held
with the Trust and
length of service | Principal occupation(s)
during past five years
and other relevant
professional experience | Number of
Funds in the
Columbia Funds
complex
overseen | Other directorships
held by Trustee
during the past
five years |
Minor M. Shaw
c/o Columbia Management
Investment Advisers, LLC
225 Franklin Street
Mail Drop BX32 05228
Boston, MA 02110
1947 | Trustee since 6/11 for RiverSource Funds and since 2003 for Nations Funds | President, Micco LLC (private investments) since 2011; President, Micco Corp. (family investment business), 1998-2011 | 125 | Director, BlueCross BlueShield of South Carolina since April 2008; Director, National Association of Corporate Directors, Carolinas Chapter, since 2013; Board Chair, Hollingsworth Funds since 2016; Advisory Board member, Duke Energy Corp. since October 2016; Chair of the Duke Endowment; Chair of Greenville – Spartanburg Airport Commission; former Trustee, BofA Funds Series Trust (11 funds), 2003-2011; former Director, Piedmont Natural Gas, 2004-2016 |
Sandra Yeager
c/o Columbia Management
Investment Advisers, LLC
225 Franklin Street
Mail Drop BX32 05228
Boston, MA 02110
1964 | Trustee since 12/17 | Retired; President and founder, Hanoverian Capital, LLC (SEC registered investment advisor firm), 2008-2016 | 123 | Director, NAPE Education Foundation since October 2016 |
Interested trustee not affiliated with Investment Manager*
Name,
address,
year of birth | Position held
with the Trust and
length of service | Principal occupation(s) during the
past five years and other relevant
professional experience | Number of
Funds in the
Columbia Funds
complex overseen | Other directorships/
held by Trustee
during the past
five years |
Anthony M. Santomero
c/o Columbia Management
Investment Advisers, LLC
225 Franklin Street
Mail Drop BX32 05228
Boston, MA 02110
1946 | Trustee since 6/11 for RiverSource Funds and since 1/08 for Nations Funds | Richard K. Mellon Professor Emeritus of Finance, The Wharton School, University of Pennsylvania, since 2002; Senior Advisor, McKinsey & Company (consulting), 2006-2008; President, Federal Reserve Bank of Philadelphia, 2000-2006, Professor of Finance, The Wharton School, University of Pennsylvania, 1972-2002 | 123 | Trustee, Penn Mutual Life Insurance Company since March 2008; Director, Renaissance Reinsurance Ltd. since May 2008; Director, Citigroup Inc. since 2009; Director, Citibank, N.A. since 2009; former Trustee, BofA Funds Series Trust (11 funds), 2008-2011 |
| * | Dr. Santomero is not an affiliated person of the Investment Manager or Ameriprise Financial. However, he is currently deemed by the Funds to be an “interested person” (as defined in the 1940 Act) of the Funds because he serves as a Director of Citigroup Inc. and Citibank, N.A., companies that may directly or through subsidiaries and affiliates engage from time-to-time in brokerage execution, principal transactions and lending relationships with the Funds or accounts advised/managed by the Investment Manager. |
| 48 | Columbia Short Term Municipal Bond Fund | Annual Report 2018 |
TRUSTEES AND OFFICERS (continued)
Interested trustee affiliated with Investment Manager*
Name,
address,
year of birth | Position held with the Trusts and length of service | Principal occupation(s) during the
past five years and other relevant
professional experience | Number of
Funds in the
Columbia Funds
complex overseen | Other directorships
held by Trustee
during the past
five years |
William F. Truscott
c/o Columbia Management
Investment Advisers, LLC
225 Franklin St.
Boston, MA 02110
1960 | Trustee since 11/01 for RiverSource Funds and since 6/11 for Nations Funds; Senior Vice President since 2002 for RiverSource Funds and since 5/10 for Nations Funds | Chairman of the Board and President, Columbia Management Investment Advisers, LLC since May 2010 and February 2012, respectively; Chief Executive Officer, Global Asset Management, Ameriprise Financial, Inc. since September 2012 (previously Chief Executive Officer, U.S. Asset Management & President, Annuities, May 2010 - September 2012); Director and Chief Executive Officer, Columbia Management Investment Distributors, Inc. since May 2010 and February 2012, respectively; Chairman of the Board and Chief Executive Officer, RiverSource Distributors, Inc. since 2006; Director, Threadneedle Asset Management Holdings, SARL since 2014; President and Chief Executive Officer, Ameriprise Certificate Company, 2006 - August 2012. | 196 | Chairman of the Board, Columbia Management Investment Advisers, LLC since May 2010; Director, Columbia Management Investment Distributors, Inc. since May 2010; former Director, Ameriprise Certificate Company, 2006-January 2013 |
| * | Interested person (as defined under the 1940 Act) by reason of being an officer, director, security holder and/or employee of the Investment Manager or Ameriprise Financial. |
Nations Funds refer to the Funds within the Columbia Funds Complex that historically bore the Nations brand and includes series of Columbia Funds Series Trust. RiverSource Funds refer to the Funds within the Columbia Funds Complex that historically bore the RiverSource brand and includes series of Columbia Funds Series Trust II.
The Statement of Additional Information has additional information about the Fund’s Board members and is available, without charge, upon request by calling 800.345.6611, visiting columbiathreadneedleus.com/investor/ or contacting your financial intermediary.
Columbia Short Term Municipal Bond Fund | Annual Report 2018
| 49 |
TRUSTEES AND OFFICERS (continued)
The Board has appointed officers who are responsible for day-to-day business decisions based on policies it has established. The officers serve at the pleasure of the Board. The following table provides basic information about the Officers of the Fund, including principal occupations during the past five years, although their specific titles may have varied over the period. In addition to Mr. Truscott, who is Senior Vice President, the Fund’s other officers are:
Fund officers
Name,
address and
year of birth | Position and year
first appointed to
position for any Fund
in the Columbia
Funds complex or a
predecessor thereof | Principal occupation(s) during past five years |
Christopher O. Petersen
5228 Ameriprise
Financial Center
Minneapolis, MN 55474
Born 1970 | President and Principal Executive Officer (2015) | Vice President and Lead Chief Counsel, Ameriprise Financial, Inc. since January 2015 (previously, Vice President and Chief Counsel, January 2010 - December 2014; officer of Columbia Funds and affiliated funds since 2007. |
Michael G. Clarke
225 Franklin Street
Boston, MA 02110
Born 1969 | Treasurer (2011), Chief Financial Officer (2009) and Chief Accounting Officer (2015) | Vice President — Mutual Fund Administration, Columbia Management Investment Advisers, LLC, since May 2010; senior officer of Columbia Funds and affiliated funds since 2002. |
Paul B. Goucher
100 Park Avenue
New York, NY 10017
Born 1968 | Senior Vice President (2011) and Assistant Secretary (2008) | Senior Vice President and Assistant General Counsel, Ameriprise Financial, Inc. since January 2017 (previously Vice President and Lead Chief Counsel, November 2008 - January 2017 and January 2013 - January 2017, respectively; and Chief Counsel, January 2010 - January 2013); Vice President, Chief Legal Officer and Assistant Secretary, Columbia Management Investment Advisers, LLC since May 2010. |
Thomas P. McGuire
225 Franklin Street
Boston, MA 02110
Born 1972 | Senior Vice President and Chief Compliance Officer (2012) | Vice President — Asset Management Compliance, Ameriprise Financial, Inc., since May 2010; Chief Compliance Officer, Ameriprise Certificate Company since September 2010. |
Colin Moore
225 Franklin Street
Boston, MA 02110
Born 1958 | Senior Vice President (2010) | Executive Vice President and Global Chief Investment Officer, Ameriprise Financial, Inc., since July 2013; Executive Vice President and Global Chief Investment Officer, Columbia Management Investment Advisers, LLC since July 2013 (previously Director and Global Chief Investment Officer, 2010 - 2013). |
Ryan C. Larrenaga
225 Franklin Street
Boston, MA 02110
Born 1970 | Senior Vice President (2017), Chief Legal Officer (2017) and Secretary (2015) | Vice President and Group Counsel, Ameriprise Financial, Inc. since August 2011; officer of Columbia Funds and affiliated funds since 2005. |
Michael E. DeFao
225 Franklin Street
Boston, MA 02110
Born 1968 | Vice President (2011) and Assistant Secretary (2010) | Vice President and Chief Counsel, Ameriprise Financial, Inc. since May 2010. |
Amy Johnson
5228 Ameriprise
Financial Center
Minneapolis, MN 55474
Born 1965 | Vice President (2006) | Managing Director and Global Head of Operations, Columbia Management Investment Advisers, LLC since April 2016 (previously Managing Director and Chief Operating Officer, 2010 - 2016). |
Lyn Kephart-Strong
5228 Ameriprise
Financial Center
Minneapolis, MN 55474
Born 1960 | Vice President (2015) | President, Columbia Management Investment Services Corp. since October 2014; Vice President & Resolution Officer, Ameriprise Trust Company since August 2009. |
| 50 | Columbia Short Term Municipal Bond Fund | Annual Report 2018 |
The Fund mails one shareholder report to each shareholder address. If you would like more than one report, please call shareholder services at 800.345.6611 and additional reports will be sent to you.
Proxy voting policies and procedures
The policy of the Board of Trustees is to vote the proxies of the companies in which the Fund holds investments consistent with the procedures as stated in the Statement of Additional Information (SAI). You may obtain a copy of the SAI without charge by calling 800.345.6611; contacting your financial intermediary; visiting columbiathreadneedleus.com/investor/; or searching the website of the Securities and Exchange Commission (SEC) at sec.gov. Information regarding how the Fund voted proxies relating to portfolio securities is filed with the SEC by August 31st for the most recent 12-month period ending June 30th of that year, and is available without charge by visiting columbiathreadneedleus.com/investor/, or searching the website of the SEC at sec.gov.
Quarterly schedule of investments
The Fund files a complete schedule of portfolio holdings with the SEC for the first and third quarters of each fiscal year on Form N-Q. The Fund’s Form N-Q is available on the SEC’s website at sec.gov and may be reviewed and copied at the SEC’s Public Reference Room in Washington, D.C. Information on the operation of the Public Reference Room may be obtained by calling 800.SEC.0330. The Fund’s complete schedule of portfolio holdings, as filed on Form N-Q, can also be obtained without charge, upon request, by calling 800.345.6611.
Additional Fund information
For more information about the Fund, please visit columbiathreadneedleus.com/investor/ or call 800.345.6611. Customer Service Representatives are available to answer your questions Monday through Friday from 8 a.m. to 7 p.m. Eastern time.
Fund investment manager
Columbia Management Investment Advisers, LLC
225 Franklin Street
Boston, MA 02110
Fund distributor
Columbia Management Investment Distributors, Inc.
225 Franklin Street
Boston, MA 02110
Fund transfer agent
Columbia Management Investment Services Corp.
P.O. Box 8081
Boston, MA 02266-8081
Columbia Short Term Municipal Bond Fund | Annual Report 2018
| 51 |
[THIS PAGE INTENTIONALLY LEFT BLANK]
[THIS PAGE INTENTIONALLY LEFT BLANK]
Columbia Short Term Municipal Bond Fund
P.O. Box 8081
Boston, MA 02266-8081
Please read and consider the investment objectives, risks, charges and expenses for any fund carefully before investing. For a prospectus and summary prospectus, which contains this and other important information about the Fund, go to
columbiathreadneedleus.com/investor/. The Fund is distributed by Columbia Management Investment Distributors, Inc., member FINRA, and managed by Columbia Management Investment Advisers, LLC.
Columbia Threadneedle Investments (Columbia Threadneedle) is the global brand name of the Columbia and Threadneedle group of companies. All rights reserved. Columbia Management Investment Distributors, Inc., 225 Franklin Street, Boston, MA 02110-2804
© 2018 Columbia Management Investment Advisers, LLC.
columbiathreadneedleus .com/investor/

Annual Report
April 30, 2018
Columbia AMT-Free Virginia Intermediate Muni Bond Fund
Not FDIC Insured • No bank guarantee • May lose value
Dear Shareholders,
The year 2017 was an extraordinary year in the financial markets. The S&P 500 Index didn’t experience a single down month and returned over 20%. Continuing this trend, January 2018 marked the fastest start for the index ever. Low volatility, which had been a feature of the U.S. equity market for several years, along with the surge in the S&P 500 Index, drove investor sentiment to very high levels. This arguably set the stage for an overdue correction, which we witnessed in February 2018.
A return to volatility
There have been few periods of market upheaval such as were experienced in the first part of 2018. While investors were taken by surprise by the sudden and pronounced market swings, the return to some level of volatility actually marked a resumption of relatively normal market conditions. Having said that, it’s important to distinguish between a good technical correction where excess enthusiasm in the marketplace is being let out, versus a real change in the underlying fundamentals – things like an underperforming economy or weaker corporate earnings. Our view is that the recent market volatility falls into the former category, and the fundamentals remain strong. We’re continuing to see improvements in global economic activity, and we’re seeing corporate earnings expectations continue to rise – and not just because of tax reform.
Consistency is more important than ever
It’s important to keep in mind that when it comes to long-term investing, it’s the destination, not the journey that matters most. If you have a financial goal that you’ve worked out with your financial advisor, and you have a good asset allocation plan to reach it, it’s a question of sticking with your plan rather than become focused on near-term volatility. Bouts of volatility are normal. After all, it’s hard to cross the ocean without hitting an occasional rough patch. You need to focus on the destination.
One final thought. In weathering volatility, it’s the consistency of the return that is essential. Investors who chase higher returns are usually the first to sell when an investment goes through a bad patch, and they therefore don’t tend to benefit from the recovery. More disciplined investors who perhaps panic less or not at all during periods of volatility, tend to have improved long-term results and are more likely to reach their financial goals. Nothing is more important to us than making sure those who have entrusted us to protect and grow their assets are able to do what matters most to them.
Your success is our priority. Talk to your financial advisor about how working with Columbia Threadneedle Investments may help you position your portfolio for consistent, sustainable outcomes, no matter the market conditions.
Sincerely,
Christopher O. Petersen
President, Columbia Funds
The S&P 500 Index, an unmanaged index, measures the performance of 500 widely held, large-capitalization U.S. stocks and is frequently used as a general measure of market performance. Past performance is no guarantee of future results.
Columbia Funds are distributed by Columbia Management Investment Distributors, Inc., member FINRA, and managed by Columbia Management Investment Advisers, LLC.
© 2018 Columbia Management Investment Advisers, LLC. All rights reserved.
Columbia AMT-Free Virginia Intermediate Muni Bond Fund | Annual Report 2018
Columbia AMT-Free Virginia Intermediate Muni Bond Fund | Annual Report 2018
Investment objective
Columbia AMT-Free Virginia Intermediate Muni Bond Fund (the Fund) seeks current income exempt from U.S. federal income tax and Virginia individual income tax, consistent with moderate fluctuation of principal.
Portfolio management
Paul Fuchs, CFA
Co-Portfolio Manager
Managed Fund since 2016
Deborah Vargo
Co-Portfolio Manager
Managed Fund since December 2017
| Average annual total returns (%) (for the period ended April 30, 2018) |
| | | Inception | 1 Year | 5 Years | 10 Years |
| Class A | Excluding sales charges | 12/05/89 | -0.39 | 1.07 | 2.93 |
| | Including sales charges | | -3.35 | 0.45 | 2.61 |
| Advisor Class* | 03/19/13 | -0.14 | 1.36 | 3.19 |
| Class C | Excluding sales charges | 06/17/92 | -1.13 | 0.34 | 2.17 |
| | Including sales charges | | -2.10 | 0.34 | 2.17 |
| Institutional Class | 09/20/89 | -0.15 | 1.32 | 3.18 |
| Institutional 3 Class* | 03/01/17 | -0.13 | 1.35 | 3.20 |
| Bloomberg Barclays 3-15 Year Blend Municipal Bond Index | | 0.87 | 2.10 | 3.99 |
Returns for Class A shares are shown with and without the maximum initial sales charge of 3.00%. Returns for Class C shares are shown with and without the 1.00% contingent deferred sales charge for the first year only. The Fund’s other classes are not subject to sales charges and have limited eligibility. Effective November 1, 2017, Class R4, Class Y and Class Z shares were renamed Advisor Class, Institutional 3 Class and Institutional Class shares, respectively. Please see the Fund’s prospectus for details. Performance for different share classes will vary based on differences in sales charges and fees associated with each class. All results shown assume reinvestment of distributions during the period. Returns do not reflect the deduction of taxes that a shareholder may pay on Fund distributions or on the redemption of Fund shares. Performance results reflect the effect of any fee waivers or reimbursements of Fund expenses by Columbia Management Investment Advisers, LLC and/or any of its affiliates. Absent these fee waivers or expense reimbursement arrangements, performance results would have been lower.
The performance information shown represents past performance and is not a guarantee of future results. The investment return and principal value of your investment will fluctuate so that your shares, when redeemed, may be worth more or less than their original cost. Current performance may be lower or higher than the performance information shown. You may obtain performance information current to the most recent month-end by contacting your financial intermediary, visiting columbiathreadneedleus.com/investor/ or calling 800.345.6611.
| * | The returns shown for periods prior to the share class inception date (including returns for the Life of the Fund, if shown, which are since Fund inception) include the returns of the Fund’s oldest share class. These returns are adjusted to reflect any higher class-related operating expenses of the newer share classes, as applicable. Please visit columbiathreadneedleus.com/investor/investment-products/mutual-funds/appended-performance for more information. |
The Bloomberg Barclays 3–15 Year Blend Municipal Bond Index is an unmanaged index that tracks the performance of municipal bonds issued after December 31, 1990, with remaining maturities between 2 and 17 years and at least $7 million in principal amount outstanding.
Indices are not available for investment, are not professionally managed and do not reflect sales charges, fees, brokerage commissions, taxes or other expenses of investing. Securities in the Fund may not match those in an index.
| 2 | Columbia AMT-Free Virginia Intermediate Muni Bond Fund | Annual Report 2018 |
Fund at a Glance (continued)
Performance of a hypothetical $10,000 investment (April 30, 2008 — April 30, 2018)
The chart above shows the change in value of a hypothetical $10,000 investment in Class A shares of Columbia AMT-Free Virginia Intermediate Muni Bond Fund during the stated time period, and does not reflect the deduction of taxes that a shareholder may pay on Fund distributions or on the redemption of Fund shares.
| Quality breakdown (%) (at April 30, 2018) |
| AAA rating | 16.1 |
| AA rating | 56.2 |
| A rating | 12.6 |
| BBB rating | 9.4 |
| B rating | 0.6 |
| Not rated | 5.1 |
| Total | 100.0 |
Percentages indicated are based upon total fixed income investments (excluding Money Market Funds).
Bond ratings apply to the underlying holdings of the Fund and not the Fund itself and are divided into categories ranging from highest to lowest credit quality, determined by using the middle rating of Moody’s, S&P and Fitch, after dropping the highest and lowest available ratings. When ratings are available from only two rating agencies, the lower rating is used. When a rating is available from only one rating agency, that rating is used. When a bond is not rated by any rating agency, it is designated as “Not rated.” Credit quality ratings assigned by a rating agency are subjective opinions, not statements of fact, and are subject to change, including daily. The ratings assigned by credit rating agencies are but one of the considerations that the Investment Manager and/or Fund’s subadviser incorporates into its credit analysis process, along with such other issuer-specific factors as cash flows, capital structure and leverage ratios, ability to de-leverage (repay) through free cash flow, quality of management, market positioning and access to capital, as well as such security-specific factors as the terms of the security (e.g., interest rate and time to maturity) and the amount and type of any collateral.
Columbia AMT-Free Virginia Intermediate Muni Bond Fund | Annual Report 2018
| 3 |
Manager Discussion of Fund Performance
For the 12-month period that ended April 30, 2018, the Fund’s Class A shares returned -0.39% excluding sales charges. Institutional Class shares of the Fund returned -0.15%. During the same time period, the Fund’s benchmark, the Bloomberg Barclays 3-15 Year Blend Municipal Bond Index, returned 0.87%. The higher quality bias of Virginia’s municipal market caused it to lag the national benchmark, which translated to underperformance for the Fund.
Market overview
The national municipal bond market posted a small gain in the 12-month period, as the contribution from income helped offset a moderate decline in prices. The period began on a positive note, reflecting the ongoing rebound from the post-election sell-off of late 2016. During this time, prices were supported by a generally positive tone to the financial markets, muted concerns about U.S. Federal Reserve (Fed) policy and a favorable balance of supply and demand stemming from strong mutual fund inflows and lower new issuance. Although unfunded pension liabilities and budgetary stress among notable issuers such as Illinois, New Jersey, Pennsylvania, Connecticut and Kentucky persisted, overall credit conditions for municipal bonds remained on sound footing. In addition, Illinois passed a budget for the first time in two years in July 2017, preventing the state from being downgraded to a below investment-grade rating. The passage of Illinois’ budget took some risk out of the broader market, providing additional support for prices through the middle of 2017.
The market landscape became more challenging in the autumn after Republican legislators unveiled a preliminary outline for overhauling the nation’s tax code. The initial proposals eliminated municipal issuers’ ability to advance refund outstanding debt, and it stripped private activity bonds (PABs) of their tax-exempt status. The surprise inclusion of the two provisions initially fueled a market rally as investors anticipated a dramatic reduction in future supply. However, municipalities responded to the proposed tax bill by pulling forward an estimated $35 billion of new bond issuance into December in an effort to beat any negative consequences from the potential changes. Fourth-quarter supply therefore jumped to the highest level in history, weighing on prices. The final bill, signed into law on December 22, spared PABs and only marginally reduced top personal tax rates.
Municipal bonds nevertheless remained under pressure in early 2018 as expectations for higher inflation weighed heavily on all segments of the fixed-income market. Investors worried that the introduction of fiscal stimulus, coming at a time when the economy appeared to be operating near full capacity, would force the Fed to raise interest rates further and faster than expected in order to tame inflation. The 10-year U.S. Treasury yield rose sharply during the first half of the quarter as a result, and municipal yields followed suit. Tax reform lessened the value proposition of municipals for banks and insurance companies, leading some to reduce their holdings of municipal bonds, but this potential headwind was offset by a sharp reduction in supply stemming from the surge of new issuance in December. This factor, together with a slowing rate of increase Treasury yields late in the period, helped stabilize the municipal bond market in March and April. Still, the broad-based national indexes closed roughly flat for the full 12 months due to the earlier sell-off. Lower quality bonds outpaced higher quality issues, reflecting investors’ ongoing search for yield.
Virginia’s municipal market lagged
The Virginia intermediate municipal market significantly underperformed its national peers. Forty percent of the Virginia intermediate index is comprised of high-quality local general obligation and pooled/bank obligation debt, which trailed the national market as a whole. Virginia — one of the highest-quality municipal markets in the country — has relatively few lower investment-grade bonds, which prevented it from participating in the outperformance of A and BBB rated securities. The timing of issuance also contributed to Virginia’s underperformance, as many of the worst-performing bonds came to market in 2017 just before interest rates spiked in response to tax reform. Virginia enjoys very strong demand for its municipal bonds, however, with its new issuance consistently experiencing strong subscriptions. On the economic front, the Commonwealth continues to experience positive growth, but at a lower level than the national average since an unfavorable industry mix has translated to a sluggish employment market.
Contributors and detractors
The Fund benefited from its overweight allocation to hospital issues, the top-performing revenue sector in the period. It also experienced strong performance from its holdings in bonds issued by jail authorities, an essential service for state and local governments. The Fund’s longer maturity water and sewer positions also outpaced the national benchmark, aiding relative performance.
| 4 | Columbia AMT-Free Virginia Intermediate Muni Bond Fund | Annual Report 2018 |
Manager Discussion of Fund Performance (continued)
The Fund’s exposure to higher quality, shorter maturity pooled/bond bank obligations and local general obligations (which are rated AA+ on average) detracted from performance, as did its allocation to pre-refunded issues. In total, these categories made up over 30% of the portfolio. The poor performance of the Fund’s holdings in general obligations was partially a result of the timing of certain purchases. Holdings we added in early September (near the low in U.S. Treasury yields) produced disappointing returns, as did those we purchased near the end of 2017.
Fund positioning
Our targeted strategy remained largely unchanged during the period. Given the limited number of opportunities to buy higher yielding, lower rated investment-grade issues in Virginia, we sought to purchase bonds with higher coupons in order to generate additional income. We targeted a neutral duration profile — i.e., an interest-rate sensitivity in line with the benchmark — in order to maintain a balanced stance within the portfolio. The Fund’s positioning continues to reflect our expectation for gradual Fed tightening and a flattening bias to the yield curve.
At the period’s end, we continued to monitor credit conditions given Virginia’s below-average growth and lower reserves. The Commonwealth has typically built up its reserves during periods of positive growth in the past, which may indicate a reduced capacity to respond to economic challenges in the future. When investing in local communities, we continued to focus on those with robust economies, stable growth in their tax bases, manageable debt and pension liabilities, and strong reserve levels that are driven by consistent financial performance.
Fixed-income securities present issuer default risk. The Fund invests substantially in municipal securities and will be affected by tax, legislative, regulatory, demographic or political changes, as well as changes impacting a state’s financial, economic or other conditions. A relatively small number of tax-exempt issuers may necessitate the Fund investing more heavily in a single issuer and, therefore, be more exposed to the risk of loss than a fund that invests more broadly. The value of the Fund’s portfolio may be more volatile than a more geographically-diversified fund. Prepayment and extension risk exists because the timing of payments on a loan, bond or other investment may accelerate when interest rates fall or decelerate when interest rates rise which may reduce investment opportunities and potential returns. A rise in interest rates may result in a price decline of fixed-income instruments held by the Fund, negatively impacting its performance and NAV. Falling rates may result in the Fund investing in lower yielding debt instruments, lowering the Fund’s income and yield. These risks may be heightened for longer maturity and duration securities. Non-investment-grade (high-yield or junk) securities present greater price volatility and more risk to principal and income than higher rated securities. Market risk may affect a single issuer, sector of the economy, industry or the market as a whole. Federal and state tax rules apply to capital gain distributions and any gains or losses on sales. Income may be subject to state or local taxes. Liquidity risk is associated with the difficulty of selling underlying investments at a desirable time or price. See the Fund’s prospectus for more information on these and other risks.
The views expressed in this report reflect the current views of the respective parties. These views are not guarantees of future performance and involve certain risks, uncertainties and assumptions that are difficult to predict, so actual outcomes and results may differ significantly from the views expressed. These views are subject to change at any time based upon economic, market or other conditions and the respective parties disclaim any responsibility to update such views. These views may not be relied on as investment advice and, because investment decisions for a Columbia fund are based on numerous factors, may not be relied on as an indication of trading intent on behalf of any particular Columbia fund. References to specific securities should not be construed as a recommendation or investment advice.
Columbia AMT-Free Virginia Intermediate Muni Bond Fund | Annual Report 2018
| 5 |
Understanding Your Fund’s Expenses
(Unaudited)
As an investor, you incur two types of costs. There are transaction costs, which generally include sales charges on purchases and may include redemption fees. There are also ongoing costs, which generally include management fees, distribution and/or service fees, and other fund expenses. The following information is intended to help you understand your ongoing costs (in dollars) of investing in the Fund and to help you compare these costs with the ongoing costs of investing in other mutual funds.
Analyzing your Fund’s expenses
To illustrate these ongoing costs, we have provided examples and calculated the expenses paid by investors in each share class of the Fund during the period. The actual and hypothetical information in the table is based on an initial investment of $1,000 at the beginning of the period indicated and held for the entire period. Expense information is calculated two ways and each method provides you with different information. The amount listed in the “Actual” column is calculated using the Fund’s actual operating expenses and total return for the period. You may use the Actual information, together with the amount invested, to estimate the expenses that you paid over the period. Simply divide your account value by $1,000 (for example, an $8,600 account value divided by $1,000 = 8.6), then multiply the results by the expenses paid during the period under the “Actual” column. The amount listed in the “Hypothetical” column assumes a 5% annual rate of return before expenses (which is not the Fund’s actual return) and then applies the Fund’s actual expense ratio for the period to the hypothetical return. You should not use the hypothetical account values and expenses to estimate either your actual account balance at the end of the period or the expenses you paid during the period. See “Compare with other funds” below for details on how to use the hypothetical data.
Compare with other funds
Since all mutual funds are required to include the same hypothetical calculations about expenses in shareholder reports, you can use this information to compare the ongoing cost of investing in the Fund with other funds. To do so, compare the hypothetical example with the 5% hypothetical examples that appear in the shareholder reports of other funds. As you compare hypothetical examples of other funds, it is important to note that hypothetical examples are meant to highlight the ongoing costs of investing in a fund only and do not reflect any transaction costs, such as sales charges, or redemption or exchange fees. Therefore, the hypothetical calculations are useful in comparing ongoing costs only, and will not help you determine the relative total costs of owning different funds. If transaction costs were included in these calculations, your costs would be higher.
| November 1, 2017 — April 30, 2018 |
| | Account value at the
beginning of the
period ($) | Account value at the
end of the
period ($) | Expenses paid during
the period ($) | Fund’s annualized
expense ratio (%) |
| | Actual | Hypothetical | Actual | Hypothetical | Actual | Hypothetical | Actual |
| Class A | 1,000.00 | 1,000.00 | 983.80 | 1,020.78 | 3.98 | 4.06 | 0.81 |
| Advisor Class | 1,000.00 | 1,000.00 | 985.10 | 1,022.02 | 2.76 | 2.81 | 0.56 |
| Class C | 1,000.00 | 1,000.00 | 981.10 | 1,017.06 | 7.66 | 7.80 | 1.56 |
| Institutional Class | 1,000.00 | 1,000.00 | 986.00 | 1,022.02 | 2.76 | 2.81 | 0.56 |
| Institutional 3 Class | 1,000.00 | 1,000.00 | 985.50 | 1,022.41 | 2.36 | 2.41 | 0.48 |
Expenses paid during the period are equal to the annualized expense ratio for each class as indicated above, multiplied by the average account value over the period and then multiplied by the number of days in the Fund’s most recent fiscal half year and divided by 365.
Expenses do not include fees and expenses incurred indirectly by the Fund from its investment in underlying funds, including affiliated and non-affiliated pooled investment vehicles, such as mutual funds and exchange-traded funds.
Had Columbia Management Investment Advisers, LLC and/or certain of its affiliates not waived/reimbursed certain fees and expenses, account value at the end of the period would have been reduced.
| 6 | Columbia AMT-Free Virginia Intermediate Muni Bond Fund | Annual Report 2018 |
Portfolio of Investments
April 30, 2018
(Percentages represent value of investments compared to net assets)
Investments in securities
| Floating Rate Notes 1.2% |
| Issue Description | Effective
Yield | | Principal
Amount ($) | Value ($) |
| Variable Rate Demand Notes 1.2% |
| Virginia College Building Authority(a),(b) |
| Revenue Bonds |
| University of Richmond Project |
| Series 2009 (Wells Fargo Bank) |
| 11/01/2036 | 1.540% | | 2,000,000 | 2,000,000 |
Total Floating Rate Notes
(Cost $2,000,000) | 2,000,000 |
|
| Municipal Bonds 97.2% |
| Issue Description | Coupon
Rate | | Principal
Amount ($) | Value ($) |
| Airport 8.1% |
| Capital Region Airport Commission |
| Refunding Revenue Bonds |
| Series 2016A |
| 07/01/2034 | 4.000% | | 1,125,000 | 1,171,913 |
| Metropolitan Washington Airports Authority |
| Refunding Revenue Bonds |
| Series 2010F-1 |
| 10/01/2021 | 5.000% | | 1,000,000 | 1,097,120 |
| Revenue Bonds |
| Series 2009B |
| 10/01/2021 | 5.000% | | 2,500,000 | 2,608,650 |
| Series 2009C |
| 10/01/2023 | 5.000% | | 3,000,000 | 3,039,330 |
| Series 2010A |
| 10/01/2023 | 5.000% | | 2,475,000 | 2,646,047 |
| 10/01/2027 | 5.000% | | 1,515,000 | 1,615,641 |
| Norfolk Airport Authority |
| Refunding Revenue Bonds |
| Series 2011 (AGM) |
| 07/01/2024 | 5.000% | | 1,000,000 | 1,080,630 |
| Total | 13,259,331 |
| Higher Education 9.9% |
| Amherst Industrial Development Authority |
| Refunding Revenue Bonds |
| Educational Facilities Sweet Briar Institute |
| Series 2006 |
| 09/01/2026 | 5.000% | | 1,000,000 | 943,240 |
| Lexington Industrial Development Authority |
| Revenue Bonds |
| VMI Development Board, Inc. Project |
| Series 2006A |
| 12/01/2020 | 5.000% | | 1,400,000 | 1,506,204 |
| Municipal Bonds (continued) |
| Issue Description | Coupon
Rate | | Principal
Amount ($) | Value ($) |
| Virginia College Building Authority |
| Refunding Revenue Bonds |
| University of Richmond Project |
| Series 2011A |
| 03/01/2022 | 5.000% | | 1,245,000 | 1,344,388 |
| Series 2011B |
| 03/01/2021 | 5.000% | | 2,250,000 | 2,432,205 |
| Revenue Bonds |
| Liberty University Projects |
| Series 2010 |
| 03/01/2022 | 5.000% | | 1,455,000 | 1,532,493 |
| 03/01/2023 | 5.000% | | 2,000,000 | 2,106,520 |
| Washington & Lee University Project |
| Series 1998 (NPFGC) |
| 01/01/2026 | 5.250% | | 3,115,000 | 3,525,931 |
| Virginia Polytechnic Institute & State University |
| Revenue Bonds |
| General Dorm and Dining Hall |
| Series 2015A |
| 06/01/2027 | 4.000% | | 2,650,000 | 2,863,537 |
| Total | 16,254,518 |
| Hospital 10.9% |
| Fairfax County Industrial Development Authority |
| Refunding Revenue Bonds |
| Inova Health System Project |
| Series 1993I (NPFGC) |
| 08/15/2019 | 5.250% | | 530,000 | 542,943 |
| Fredericksburg Economic Development Authority |
| Refunding Revenue Bonds |
| MediCorp Health Systems Obligation |
| Series 2007 |
| 06/15/2020 | 5.250% | | 4,000,000 | 4,239,200 |
| Norfolk Economic Development Authority |
| Refunding Revenue Bonds |
| Sentara Healthcare |
| Series 2012B |
| 11/01/2027 | 5.000% | | 1,735,000 | 1,930,916 |
| Roanoke Economic Development Authority |
| Refunding Revenue Bonds |
| Carilion Clinic Obligation Group |
| Series 2010 |
| 07/01/2025 | 5.000% | | 3,500,000 | 3,720,430 |
| Revenue Bonds |
| Carilion Clinic Obligation Group |
| Series 2012 |
| 07/01/2022 | 5.000% | | 2,000,000 | 2,214,860 |
| 07/01/2023 | 5.000% | | 1,000,000 | 1,096,590 |
The accompanying Notes to Financial Statements are an integral part of this statement.
Columbia AMT-Free Virginia Intermediate Muni Bond Fund | Annual Report 2018
| 7 |
Portfolio of Investments (continued)
April 30, 2018
| Municipal Bonds (continued) |
| Issue Description | Coupon
Rate | | Principal
Amount ($) | Value ($) |
| Stafford County Economic Development Authority |
| Refunding Revenue Bonds |
| Mary Washington Healthcare |
| Series 2016 |
| 06/15/2030 | 5.000% | | 1,300,000 | 1,447,420 |
| 06/15/2033 | 5.000% | | 200,000 | 220,294 |
| 06/15/2035 | 5.000% | | 1,000,000 | 1,093,350 |
| Winchester Economic Development Authority |
| Refunding Revenue Bonds |
| Valley Health System Obligation Group |
| Series 2015 |
| 01/01/2032 | 5.000% | | 1,250,000 | 1,403,600 |
| Total | 17,909,603 |
| Investor Owned 1.3% |
| Chesterfield County Economic Development Authority |
| Refunding Revenue Bonds |
| Virginia Electric & Power Co. |
| Series 2009A |
| 05/01/2023 | 5.000% | | 2,000,000 | 2,065,180 |
| Local Appropriation 4.8% |
| Appomattox County Economic Development Authority |
| Unrefunded Revenue Bonds |
| Series 2010 |
| 05/01/2022 | 5.000% | | 175,000 | 183,717 |
| Arlington County Industrial Development Authority |
| Refunding Revenue Bonds |
| Series 2017 |
| 02/15/2029 | 5.000% | | 1,000,000 | 1,176,080 |
| Fairfax County Economic Development Authority |
| Revenue Bonds |
| Metrorail Parking Systems |
| Series 2017 |
| 04/01/2033 | 5.000% | | 745,000 | 860,132 |
| Six Public Facilities Projects |
| Series 2010 |
| 04/01/2024 | 4.000% | | 1,000,000 | 1,017,190 |
| Loudoun County Economic Development Authority |
| Revenue Bonds |
| Roads & Public Facilities Project |
| Series 2015 |
| 12/01/2025 | 5.000% | | 3,000,000 | 3,510,420 |
| Series 2015 |
| 12/01/2028 | 5.000% | | 1,035,000 | 1,181,639 |
| Total | 7,929,178 |
| Local General Obligation 10.3% |
| City of Alexandria Virginia |
| Unlimited General Obligation Refunding Bonds |
| Series 2017C |
| 07/01/2030 | 4.000% | | 1,000,000 | 1,097,220 |
| Municipal Bonds (continued) |
| Issue Description | Coupon
Rate | | Principal
Amount ($) | Value ($) |
| City of Lynchburg Virginia |
| Unlimited General Obligation Refunding Bonds |
| Series 2017 |
| 08/01/2029 | 4.000% | | 840,000 | 912,316 |
| City of Newport News |
| Unlimited General Obligation Refunding & Improvement Bonds |
| Water |
| Series 2007B |
| 07/01/2020 | 5.250% | | 2,000,000 | 2,139,120 |
| Unlimited General Obligation Refunding Bonds |
| Series 2016A |
| 08/01/2031 | 5.000% | | 1,000,000 | 1,164,970 |
| City of Norfolk |
| Unlimited General Obligation Refunding Bonds |
| Series 2017C |
| 09/01/2033 | 4.000% | | 1,380,000 | 1,455,596 |
| City of Richmond |
| Unlimited General Obligation Bonds |
| Public Improvement |
| Series 2015B |
| 03/01/2028 | 4.000% | | 2,000,000 | 2,148,200 |
| Unlimited General Obligation Refunding Bonds |
| Series 2017B |
| 07/15/2029 | 4.000% | | 2,000,000 | 2,205,400 |
| Series 2017D |
| 03/01/2028 | 5.000% | | 1,250,000 | 1,502,713 |
| City of Suffolk |
| Unlimited General Obligation Refunding Bonds |
| Series 2014 |
| 02/01/2029 | 4.000% | | 2,000,000 | 2,139,680 |
| County of Arlington |
| Unlimited General Obligation Bonds |
| Series 2017 |
| 08/15/2034 | 4.000% | | 2,000,000 | 2,125,920 |
| Total | 16,891,135 |
| Other Bond Issue 4.3% |
| Montgomery County Economic Development Authority |
| Refunding Revenue Bonds |
| Virginia Tech Foundation |
| Series 2017A |
| 06/01/2029 | 5.000% | | 200,000 | 236,468 |
| Rappahannock Regional Jail Authority |
| Refunding Revenue Bonds |
| Series 2015 |
| 10/01/2030 | 5.000% | | 1,725,000 | 1,977,437 |
| Riverside Regional Jail Authority |
| Refunding Revenue Bonds |
| Series 2015 |
| 07/01/2028 | 5.000% | | 2,685,000 | 3,082,836 |
The accompanying Notes to Financial Statements are an integral part of this statement.
| 8 | Columbia AMT-Free Virginia Intermediate Muni Bond Fund | Annual Report 2018 |
Portfolio of Investments (continued)
April 30, 2018
| Municipal Bonds (continued) |
| Issue Description | Coupon
Rate | | Principal
Amount ($) | Value ($) |
| Western Regional Jail Authority |
| Refunding Revenue Bonds |
| Series 2015 |
| 12/01/2027 | 5.000% | | 1,500,000 | 1,738,380 |
| Total | 7,035,121 |
| Pool / Bond Bank 11.1% |
| Virginia College Building Authority |
| Refunding Revenue Bonds |
| Series 2016A |
| 09/01/2033 | 3.000% | | 500,000 | 470,995 |
| Virginia Public School Authority |
| Refunding Revenue Bonds |
| School Financing |
| Series 2009C |
| 08/01/2025 | 4.000% | | 1,250,000 | 1,281,700 |
| Virginia Resources Authority |
| Refunding Revenue Bonds |
| Revolving Fund |
| Series 2011A |
| 08/01/2024 | 5.000% | | 1,395,000 | 1,518,555 |
| Series 2015 |
| 10/01/2027 | 5.000% | | 1,500,000 | 1,755,630 |
| State Revolving Fund |
| Subordinated Series 2005 |
| 10/01/2020 | 5.500% | | 3,500,000 | 3,794,980 |
| 10/01/2021 | 5.500% | | 6,475,000 | 7,207,776 |
| Virginia Infrastructure Pooled |
| Series 2017F |
| 11/01/2034 | 4.000% | | 1,000,000 | 1,064,230 |
| Revenue Bonds |
| Virginia Pooled Financing Program |
| Series 2016S |
| 11/01/2033 | 4.000% | | 1,000,000 | 1,066,010 |
| Total | 18,159,876 |
| Refunded / Escrowed 11.6% |
| Appomattox County Economic Development Authority |
| Prerefunded 05/01/20 Revenue Bonds |
| Series 2010 |
| 05/01/2022 | 5.000% | | 1,315,000 | 1,391,059 |
| Chesapeake Bay Bridge & Tunnel District |
| Refunding Revenue Bonds |
| General Resolution |
| Series 1998 Escrowed to Maturity (NPFGC) |
| 07/01/2025 | 5.500% | | 4,000,000 | 4,675,080 |
| City of Richmond |
| Prerefunded 07/15/20 Unlimited General Obligation Public Improvement Bonds |
| Series 2010D |
| 07/15/2024 | 5.000% | | 1,000,000 | 1,064,750 |
| Municipal Bonds (continued) |
| Issue Description | Coupon
Rate | | Principal
Amount ($) | Value ($) |
| County of Fairfax |
| Prerefunded 04/01/21 Unlimited General Obligation Refunding Bonds |
| Public Improvement |
| Series 2011A |
| 04/01/2024 | 4.000% | | 2,000,000 | 2,109,740 |
| County of Pittsylvania |
| Prerefunded 02/01/19 Unlimited General Obligation Bonds |
| Series 2008B |
| 02/01/2023 | 5.500% | | 1,030,000 | 1,058,521 |
| County of Smyth |
| Prerefunded 11/01/21 Unlimited General Obligation Bonds |
| Public Improvement |
| Series 2011A |
| 11/01/2031 | 5.000% | | 4,000,000 | 4,377,840 |
| Fairfax County Industrial Development Authority |
| Prerefunded 05/15/19 Revenue Bonds |
| Inova Health System Project |
| Series 2009C |
| 05/15/2025 | 5.000% | | 1,000,000 | 1,032,170 |
| Virginia Commonwealth Transportation Board |
| Prerefunded 05/15/22 Revenue Bonds |
| Capital Projects |
| Series 2012 |
| 05/15/2029 | 5.000% | | 3,000,000 | 3,331,290 |
| Total | 19,040,450 |
| Retirement Communities 2.7% |
| Albermarle County Economic Development Authority |
| Revenue Bonds |
| Westminster-Canterbury of the Blue Ridge |
| Series 2012 |
| 01/01/2032 | 4.625% | | 2,000,000 | 2,034,720 |
| Hanover County Economic Development Authority |
| Revenue Bonds |
| Covenant Woods |
| Series 2012A |
| 07/01/2022 | 4.000% | | 975,000 | 1,000,428 |
| Henrico County Economic Development Authority |
| Refunding Revenue Bonds |
| Westminster-Canterbury Corp. |
| Series 2015 |
| 10/01/2035 | 4.000% | | 1,320,000 | 1,327,814 |
| Total | 4,362,962 |
| Sales Tax 1.4% |
| Northern Virginia Transportation Authority |
| Revenue Bonds |
| Series 2014 |
| 06/01/2032 | 5.000% | | 2,000,000 | 2,257,520 |
The accompanying Notes to Financial Statements are an integral part of this statement.
Columbia AMT-Free Virginia Intermediate Muni Bond Fund | Annual Report 2018
| 9 |
Portfolio of Investments (continued)
April 30, 2018
| Municipal Bonds (continued) |
| Issue Description | Coupon
Rate | | Principal
Amount ($) | Value ($) |
| Special Non Property Tax 2.8% |
| Greater Richmond Convention Center Authority |
| Refunding Revenue Bonds |
| Series 2015 |
| 06/15/2029 | 5.000% | | 1,350,000 | 1,529,280 |
| 06/15/2030 | 5.000% | | 1,540,000 | 1,739,230 |
| Hampton Roads Transportation Accountability Commission |
| Revenue Bonds |
| Senior Lien Hampton Roads Transportation Fund |
| Series 2018A |
| 07/01/2032 | 5.000% | | 1,150,000 | 1,358,598 |
| Total | 4,627,108 |
| Special Property Tax 3.6% |
| Dulles Town Center Community Development Authority |
| Refunding Special Assessment Bonds |
| Dulles Town Center Project |
| Series 2012 |
| 03/01/2023 | 4.000% | | 1,000,000 | 995,610 |
| Fairfax County Economic Development Authority |
| Refunding Special Tax Bonds |
| Silver Line Phase I Project |
| Series 2016 |
| 04/01/2031 | 4.000% | | 1,000,000 | 1,065,600 |
| 04/01/2032 | 4.000% | | 1,000,000 | 1,059,110 |
| Marquis Community Development Authority of York County(c),(d) |
| Revenue Bonds |
| Convertible |
| Series 2015 |
| 09/01/2045 | 0.000% | | 644,000 | 451,818 |
| Marquis Community Development Authority of York County |
| Tax Allocation Bonds |
| Series 2007B |
| 09/01/2041 | 5.625% | | 2,084,000 | 1,454,111 |
| Marquis Community Development Authority of York County(d) |
| Tax Allocation Bonds |
| Series 2007C |
| 09/01/2041 | 0.000% | | 3,164,000 | 159,276 |
| Virginia Gateway Community Development Authority |
| Refunding Special Assessment Bonds |
| Series 2012 |
| 03/01/2025 | 5.000% | | 690,000 | 704,407 |
| Total | 5,889,932 |
| State Appropriated 1.9% |
| Virginia College Building Authority |
| Revenue Bonds |
| 21st Century College Program |
| Series 2017 |
| 02/01/2034 | 4.000% | | 1,500,000 | 1,581,495 |
| Municipal Bonds (continued) |
| Issue Description | Coupon
Rate | | Principal
Amount ($) | Value ($) |
| Virginia Public Building Authority(e) |
| Revenue Bonds |
| Series 2018A |
| 08/01/2035 | 4.000% | | 1,500,000 | 1,577,160 |
| Total | 3,158,655 |
| Transportation 5.0% |
| Virginia Commonwealth Transportation Board |
| Refunding Revenue Bonds |
| GARVEE Notes |
| Series 2017 |
| 03/15/2028 | 5.000% | | 2,000,000 | 2,389,460 |
| Revenue Bonds |
| Series 2016 |
| 05/15/2030 | 4.000% | | 500,000 | 535,465 |
| Washington Metropolitan Area Transit Authority |
| Refunding Revenue Bonds |
| Series 2017A-1 |
| 07/01/2029 | 5.000% | | 2,500,000 | 2,950,600 |
| Revenue Bonds |
| Series 2017B |
| 07/01/2034 | 5.000% | | 2,000,000 | 2,309,660 |
| Total | 8,185,185 |
| Turnpike / Bridge / Toll Road 3.9% |
| City of Chesapeake Expressway Toll Road |
| Revenue Bonds |
| Transportation System |
| Senior Series 2012A |
| 07/15/2023 | 5.000% | | 1,025,000 | 1,145,694 |
| 07/15/2027 | 5.000% | | 1,000,000 | 1,089,520 |
| Metropolitan Washington Airports Authority Dulles Toll Road(d) |
| Revenue Bonds |
| Capital Appreciation-2nd Senior Lien |
| Series 2009B (AGM) |
| 10/01/2023 | 0.000% | | 5,000,000 | 4,192,500 |
| Total | 6,427,714 |
| Water & Sewer 3.6% |
| County of Fairfax Sewer |
| Refunding Revenue Bonds |
| Series 2016A |
| 07/15/2030 | 5.000% | | 1,000,000 | 1,175,420 |
| Fairfax County Water Authority |
| Refunding Revenue Bonds |
| Series 2017 |
| 04/01/2029 | 5.000% | | 2,000,000 | 2,388,440 |
The accompanying Notes to Financial Statements are an integral part of this statement.
| 10 | Columbia AMT-Free Virginia Intermediate Muni Bond Fund | Annual Report 2018 |
Portfolio of Investments (continued)
April 30, 2018
| Municipal Bonds (continued) |
| Issue Description | Coupon
Rate | | Principal
Amount ($) | Value ($) |
| Hampton Roads Sanitation District |
| Refunding Subordinated Revenue Bonds |
| Series 2016A |
| 08/01/2031 | 5.000% | | 2,000,000 | 2,329,940 |
| Total | 5,893,800 |
Total Municipal Bonds
(Cost $157,407,890) | 159,347,268 |
Total Investments in Securities
(Cost: $159,407,890) | 161,347,268 |
| Other Assets & Liabilities, Net | | 2,574,189 |
| Net Assets | 163,921,457 |
Notes to Portfolio of Investments
| (a) | The Fund is entitled to receive principal and interest from the guarantor after a day or a week’s notice or upon maturity. The maturity date disclosed represents the final maturity. |
| (b) | Represents a variable rate security where the coupon rate adjusts on specified dates (generally daily or weekly) using the prevailing money market rate. The interest rate shown was the current rate as of April 30, 2018. |
| (c) | Represents privately placed and other securities and instruments exempt from SEC registration (collectively, private placements), such as Section 4(a)(2) and Rule 144A eligible securities, which are often sold only to qualified institutional buyers. The Fund may invest in private placements determined to be liquid as well as those determined to be illiquid. Private placements may be determined to be liquid under guidelines established by the Fund’s Board of Trustees. At April 30, 2018, the value of these securities amounted to $451,818, which represents 0.28% of net assets. |
| (d) | Zero coupon bond. |
| (e) | Represents a security purchased on a when-issued basis. |
Abbreviation Legend
| AGM | Assured Guaranty Municipal Corporation |
| NPFGC | National Public Finance Guarantee Corporation |
Fair value measurements
The Fund categorizes its fair value measurements according to a three-level hierarchy that maximizes the use of observable inputs and minimizes the use of unobservable inputs by prioritizing that the most observable input be used when available. Observable inputs are those that market participants would use in pricing an investment based on market data obtained from sources independent of the reporting entity. Unobservable inputs are those that reflect the Fund’s assumptions about the information market participants would use in pricing an investment. An investment’s level within the fair value hierarchy is based on the lowest level of any input that is deemed significant to the asset’s or liability’s fair value measurement. The input levels are not necessarily an indication of the risk or liquidity associated with investments at that level. For example, certain U.S. government securities are generally high quality and liquid, however, they are reflected as Level 2 because the inputs used to determine fair value may not always be quoted prices in an active market.
Fair value inputs are summarized in the three broad levels listed below:
| ■ | Level 1 — Valuations based on quoted prices for investments in active markets that the Fund has the ability to access at the measurement date. Valuation adjustments are not applied to Level 1 investments. |
| ■ | Level 2 — Valuations based on other significant observable inputs (including quoted prices for similar securities, interest rates, prepayment speeds, credit risks, etc.). |
| ■ | Level 3 — Valuations based on significant unobservable inputs (including the Fund’s own assumptions and judgment in determining the fair value of investments). |
Inputs that are used in determining fair value of an investment may include price information, credit data, volatility statistics, and other factors. These inputs can be either observable or unobservable. The availability of observable inputs can vary between investments, and is affected by various factors such as the type of investment, and the volume and level of activity for that investment or similar investments in the marketplace. The inputs will be considered by the Investment Manager, along with any other relevant factors in the calculation of an investment’s fair value. The Fund uses prices and inputs that are current as of the measurement date, which may include periods of market dislocations. During these periods, the availability of prices and inputs may be reduced for many investments. This condition could cause an investment to be reclassified between the various levels within the hierarchy.
Investments falling into the Level 3 category are primarily supported by quoted prices from brokers and dealers participating in the market for those investments. However, these may be classified as Level 3 investments due to lack of market transparency and corroboration to support these quoted prices. Additionally, valuation models may be used as the pricing source for any remaining investments classified as Level 3. These models may rely on one or more significant unobservable inputs and/or significant assumptions by the Investment Manager. Inputs used in valuations may include, but are not limited to, financial statement analysis, capital account balances, discount rates and estimated cash flows, and comparable company data.
Under the direction of the Fund’s Board of Trustees (the Board), the Investment Manager’s Valuation Committee (the Committee) is responsible for overseeing the valuation procedures approved by the Board. The Committee consists of voting and non-voting members from various groups within the Investment Manager’s organization, including operations and accounting, trading and investments, compliance, risk management and legal.
The Committee meets at least monthly to review and approve valuation matters, which may include a description of specific valuation determinations, data regarding pricing information received from approved pricing vendors and brokers and the results of Board-approved valuation control policies and procedures (the Policies). The Policies address, among other things, instances when market quotations are or are not readily available, including recommendations of third party pricing vendors and a determination of appropriate pricing
The accompanying Notes to Financial Statements are an integral part of this statement.
Columbia AMT-Free Virginia Intermediate Muni Bond Fund | Annual Report 2018
| 11 |
Portfolio of Investments (continued)
April 30, 2018
Fair value measurements (continued)
methodologies; events that require specific valuation determinations and assessment of fair value techniques; securities with a potential for stale pricing, including those that are illiquid, restricted, or in default; and the effectiveness of third party pricing vendors, including periodic reviews of vendors. The Committee meets more frequently, as needed, to discuss additional valuation matters, which may include the need to review back-testing results, review time-sensitive information or approve related valuation actions. The Committee reports to the Board, with members of the Committee meeting with the Board at each of its regularly scheduled meetings to discuss valuation matters and actions during the period, similar to those described earlier.
For investments categorized as Level 3, the Committee monitors information similar to that described above, which may include: (i) data specific to the issuer or comparable issuers, (ii) general market or specific sector news and (iii) quoted prices and specific or similar security transactions. The Committee considers this data and any changes from prior periods in order to assess the reasonableness of observable and unobservable inputs, any assumptions or internal models used to value those securities and changes in fair value. This data is also used to corroborate, when available, information received from approved pricing vendors and brokers. Various factors impact the frequency of monitoring this information (which may occur as often as daily). However, the Committee may determine that changes to inputs, assumptions and models are not required as a result of the monitoring procedures performed.
The following table is a summary of the inputs used to value the Fund’s investments at April 30, 2018:
| | Level 1
quoted prices in active
markets for identical
assets ($) | Level 2
other significant
observable inputs ($) | Level 3
significant
unobservable inputs ($) | Total ($) |
| Investments in Securities | | | | |
| Floating Rate Notes | — | 2,000,000 | — | 2,000,000 |
| Municipal Bonds | — | 159,347,268 | — | 159,347,268 |
| Total Investments in Securities | — | 161,347,268 | — | 161,347,268 |
See the Portfolio of Investments for all investment classifications not indicated in the table.
The Fund’s assets assigned to the Level 2 input category are generally valued using the market approach, in which a security’s value is determined through reference to prices and information from market transactions for similar or identical assets.
There were no transfers of financial assets between levels during the period.
The accompanying Notes to Financial Statements are an integral part of this statement.
| 12 | Columbia AMT-Free Virginia Intermediate Muni Bond Fund | Annual Report 2018 |
Statement of Assets and Liabilities
April 30, 2018
| Assets | |
| Investments in securities, at value | |
| Unaffiliated issuers (cost $159,407,890) | $161,347,268 |
| Cash | 3,023,826 |
| Receivable for: | |
| Capital shares sold | 192,331 |
| Interest | 1,813,976 |
| Expense reimbursement due from Investment Manager | 1,004 |
| Prepaid expenses | 642 |
| Total assets | 166,379,047 |
| Liabilities | |
| Payable for: | |
| Investments purchased on a delayed delivery basis | 1,597,185 |
| Capital shares purchased | 302,339 |
| Distributions to shareholders | 390,534 |
| Management services fees | 6,334 |
| Distribution and/or service fees | 868 |
| Transfer agent fees | 6,190 |
| Compensation of board members | 117,455 |
| Other expenses | 36,685 |
| Total liabilities | 2,457,590 |
| Net assets applicable to outstanding capital stock | $163,921,457 |
| Represented by | |
| Paid in capital | 161,267,237 |
| Undistributed net investment income | 122,052 |
| Accumulated net realized gain | 592,790 |
| Unrealized appreciation (depreciation) on: | |
| Investments - unaffiliated issuers | 1,939,378 |
| Total - representing net assets applicable to outstanding capital stock | $163,921,457 |
| Class A | |
| Net assets | $27,005,187 |
| Shares outstanding | 2,587,343 |
| Net asset value per share | $10.44 |
| Maximum sales charge | 3.00% |
| Maximum offering price per share (calculated by dividing the net asset value per share by 1.0 minus the maximum sales charge for Class A shares) | $10.76 |
| Advisor Class | |
| Net assets | $1,822,531 |
| Shares outstanding | 174,628 |
| Net asset value per share | $10.44 |
| Class C | |
| Net assets | $3,823,741 |
| Shares outstanding | 366,055 |
| Net asset value per share | $10.45 |
| Institutional Class | |
| Net assets | $29,199,487 |
| Shares outstanding | 2,798,042 |
| Net asset value per share | $10.44 |
| Institutional 3 Class | |
| Net assets | $102,070,511 |
| Shares outstanding | 9,757,072 |
| Net asset value per share | $10.46 |
The accompanying Notes to Financial Statements are an integral part of this statement.
Columbia AMT-Free Virginia Intermediate Muni Bond Fund | Annual Report 2018
| 13 |
Statement of Operations
Year Ended April 30, 2018
| Net investment income | |
| Income: | |
| Interest | $6,237,456 |
| Total income | 6,237,456 |
| Expenses: | |
| Management services fees | 874,358 |
| Distribution and/or service fees | |
| Class A | 70,776 |
| Class B | 27 |
| Class C | 44,489 |
| Transfer agent fees | |
| Class A | 31,246 |
| Advisor Class | 1,783 |
| Class B | 4 |
| Class C | 4,927 |
| Institutional Class | 94,587 |
| Institutional 3 Class | 6,340 |
| Compensation of board members | 25,155 |
| Custodian fees | 2,427 |
| Printing and postage fees | 11,332 |
| Registration fees | 13,853 |
| Audit fees | 31,520 |
| Legal fees | 8,737 |
| Compensation of chief compliance officer | 40 |
| Other | 12,289 |
| Total expenses | 1,233,890 |
| Fees waived or expenses reimbursed by Investment Manager and its affiliates | (143,250) |
| Expense reduction | (20) |
| Total net expenses | 1,090,620 |
| Net investment income | 5,146,836 |
| Realized and unrealized gain (loss) — net | |
| Net realized gain (loss) on: | |
| Investments — unaffiliated issuers | 1,166,822 |
| Net realized gain | 1,166,822 |
| Net change in unrealized appreciation (depreciation) on: | |
| Investments — unaffiliated issuers | (6,380,720) |
| Net change in unrealized appreciation (depreciation) | (6,380,720) |
| Net realized and unrealized loss | (5,213,898) |
| Net decrease in net assets resulting from operations | $(67,062) |
The accompanying Notes to Financial Statements are an integral part of this statement.
| 14 | Columbia AMT-Free Virginia Intermediate Muni Bond Fund | Annual Report 2018 |
Statement of Changes in Net Assets
| | Year Ended
April 30, 2018 | Year Ended
April 30, 2017 (a) |
| Operations | | |
| Net investment income | $5,146,836 | $5,860,854 |
| Net realized gain (loss) | 1,166,822 | (8,421) |
| Net change in unrealized appreciation (depreciation) | (6,380,720) | (7,110,868) |
| Net decrease in net assets resulting from operations | (67,062) | (1,258,435) |
| Distributions to shareholders | | |
| Net investment income | | |
| Class A | (739,090) | (1,058,469) |
| Advisor Class | (48,373) | (19,024) |
| Class B | (47) | (201) |
| Class C | (82,833) | (101,500) |
| Institutional Class | (2,041,523) | (4,995,471) |
| Institutional 3 Class | (2,354,809) | (52) |
| Net realized gains | | |
| Class A | (78,523) | (127,621) |
| Advisor Class | (5,862) | (2,336) |
| Class B | — | (31) |
| Class C | (12,565) | (17,010) |
| Institutional Class | (93,227) | (537,963) |
| Institutional 3 Class | (313,338) | — |
| Total distributions to shareholders | (5,770,190) | (6,859,678) |
| Decrease in net assets from capital stock activity | (26,032,570) | (17,471,019) |
| Total decrease in net assets | (31,869,822) | (25,589,132) |
| Net assets at beginning of year | 195,791,279 | 221,380,411 |
| Net assets at end of year | $163,921,457 | $195,791,279 |
| Undistributed net investment income | $122,052 | $241,891 |
| (a) | Institutional 3 Class shares are based on operations from March 1, 2017 (commencement of operations) through the stated period end. |
The accompanying Notes to Financial Statements are an integral part of this statement.
Columbia AMT-Free Virginia Intermediate Muni Bond Fund | Annual Report 2018
| 15 |
Statement of Changes in Net Assets (continued)
| | Year Ended | Year Ended |
| | April 30, 2018 | April 30, 2017 (a) |
| | Shares | Dollars ($) | Shares | Dollars ($) |
| Capital stock activity |
| Class A | | | | |
| Subscriptions | 414,444 | 4,441,045 | 666,139 | 7,246,638 |
| Distributions reinvested | 44,301 | 473,707 | 68,544 | 747,740 |
| Redemptions | (481,634) | (5,156,319) | (1,884,374) | (20,270,581) |
| Net decrease | (22,889) | (241,567) | (1,149,691) | (12,276,203) |
| Advisor Class | | | | |
| Subscriptions | 150,640 | 1,624,026 | 96,413 | 1,047,662 |
| Distributions reinvested | 5,035 | 53,729 | 1,929 | 21,033 |
| Redemptions | (56,357) | (596,030) | (68,313) | (726,973) |
| Net increase | 99,318 | 1,081,725 | 30,029 | 341,722 |
| Class B | | | | |
| Subscriptions | — | — | 1 | 6 |
| Redemptions | (904) | (9,878) | (60) | (637) |
| Net decrease | (904) | (9,878) | (59) | (631) |
| Class C | | | | |
| Subscriptions | 76,389 | 821,561 | 111,239 | 1,234,219 |
| Distributions reinvested | 7,590 | 81,268 | 8,573 | 93,363 |
| Redemptions | (175,272) | (1,881,579) | (122,031) | (1,330,962) |
| Net decrease | (91,293) | (978,750) | (2,219) | (3,380) |
| Institutional Class | | | | |
| Subscriptions | 795,350 | 8,556,321 | 3,794,757 | 41,194,146 |
| Distributions reinvested | 72,645 | 777,323 | 50,579 | 550,870 |
| Redemptions | (13,068,801) | (141,811,119) | (4,379,904) | (47,287,543) |
| Net decrease | (12,200,806) | (132,477,475) | (534,568) | (5,542,527) |
| Institutional 3 Class | | | | |
| Subscriptions | 12,736,917 | 138,439,858 | 930 | 10,000 |
| Distributions reinvested | 5,105 | 54,205 | — | — |
| Redemptions | (2,985,880) | (31,900,688) | — | — |
| Net increase | 9,756,142 | 106,593,375 | 930 | 10,000 |
| Total net decrease | (2,460,432) | (26,032,570) | (1,655,578) | (17,471,019) |
| (a) | Institutional 3 Class shares are based on operations from March 1, 2017 (commencement of operations) through the stated period end. |
The accompanying Notes to Financial Statements are an integral part of this statement.
| 16 | Columbia AMT-Free Virginia Intermediate Muni Bond Fund | Annual Report 2018 |
[THIS PAGE INTENTIONALLY LEFT BLANK]
Columbia AMT-Free Virginia Intermediate Muni Bond Fund | Annual Report 2018
| 17 |
The following table is intended to help you understand the Fund’s financial performance. Certain information reflects financial results for a single share of a class held for the periods shown. Per share net investment income (loss) amounts are calculated based on average shares outstanding during the period. Total return assumes reinvestment of all dividends and distributions, if any. Total return does not reflect payment of sales charges, if any. Total return and portfolio turnover are not annualized for periods of less than one year. The portfolio turnover rate is calculated without regard to purchase and sales transactions of short-term instruments and certain derivatives, if any. If such transactions were included, the Fund’s portfolio turnover rate may be higher.
| | Net asset value,
beginning of
period | Net
investment
income | Net
realized
and
unrealized
gain (loss) | Total from
investment
operations | Distributions
from net
investment
income | Distributions
from net
realized
gains |
| Class A |
| Year Ended 4/30/2018 | $10.79 | 0.27 | (0.31) | (0.04) | (0.28) | (0.03) |
| Year Ended 4/30/2017 | $11.18 | 0.28 | (0.34) | (0.06) | (0.30) | (0.03) |
| Year Ended 4/30/2016 | $11.13 | 0.30 | 0.10 | 0.40 | (0.32) | (0.03) |
| Year Ended 4/30/2015 | $11.09 | 0.31 | 0.04 | 0.35 | (0.31) | (0.00) (d) |
| Year Ended 4/30/2014 | $11.54 | 0.32 | (0.39) | (0.07) | (0.31) | (0.07) |
| Advisor Class |
| Year Ended 4/30/2018 | $10.79 | 0.30 | (0.31) | (0.01) | (0.31) | (0.03) |
| Year Ended 4/30/2017 | $11.18 | 0.31 | (0.34) | (0.03) | (0.33) | (0.03) |
| Year Ended 4/30/2016 | $11.12 | 0.33 | 0.11 | 0.44 | (0.35) | (0.03) |
| Year Ended 4/30/2015 | $11.08 | 0.34 | 0.04 | 0.38 | (0.34) | (0.00) (d) |
| Year Ended 4/30/2014 | $11.52 | 0.35 | (0.38) | (0.03) | (0.34) | (0.07) |
| Class C |
| Year Ended 4/30/2018 | $10.80 | 0.19 | (0.31) | (0.12) | (0.20) | (0.03) |
| Year Ended 4/30/2017 | $11.19 | 0.20 | (0.34) | (0.14) | (0.22) | (0.03) |
| Year Ended 4/30/2016 | $11.13 | 0.22 | 0.10 | 0.32 | (0.23) | (0.03) |
| Year Ended 4/30/2015 | $11.10 | 0.23 | 0.03 | 0.26 | (0.23) | (0.00) (d) |
| Year Ended 4/30/2014 | $11.54 | 0.23 | (0.37) | (0.14) | (0.23) | (0.07) |
| Institutional Class |
| Year Ended 4/30/2018 | $10.79 | 0.30 | (0.31) | (0.01) | (0.31) | (0.03) |
| Year Ended 4/30/2017 | $11.18 | 0.31 | (0.34) | (0.03) | (0.33) | (0.03) |
| Year Ended 4/30/2016 | $11.13 | 0.33 | 0.10 | 0.43 | (0.35) | (0.03) |
| Year Ended 4/30/2015 | $11.09 | 0.34 | 0.04 | 0.38 | (0.34) | (0.00) (d) |
| Year Ended 4/30/2014 | $11.54 | 0.34 | (0.38) | (0.04) | (0.34) | (0.07) |
| Institutional 3 Class |
| Year Ended 4/30/2018 | $10.82 | 0.31 | (0.32) | (0.01) | (0.32) | (0.03) |
| Year Ended 4/30/2017(e) | $10.75 | 0.05 | 0.08 (f) | 0.13 | (0.06) | — |
| Notes to Financial Highlights |
| (a) | In addition to the fees and expenses that the Fund bears directly, the Fund indirectly bears a pro rata share of the fees and expenses of any other funds in which it invests. Such indirect expenses are not included in the Fund’s reported expense ratios. |
| (b) | Total net expenses include the impact of certain fee waivers/expense reimbursements made by the Investment Manager and certain of its affiliates, if applicable. |
| (c) | The benefits derived from expense reductions had an impact of less than 0.01%. |
| (d) | Rounds to zero. |
| (e) | Institutional 3 Class shares commenced operations on March 1, 2017. Per share data and total return reflect activity from that date. |
| (f) | Calculation of the net gain (loss) per share (both realized and unrealized) does not correlate to the aggregate realized and unrealized gain (loss) presented in the Statement of Operations due to the timing of subscriptions and redemptions of Fund shares in relation to fluctuations in the market value of the portfolio. |
| (g) | Annualized. |
The accompanying Notes to Financial Statements are an integral part of this statement.
| 18 | Columbia AMT-Free Virginia Intermediate Muni Bond Fund | Annual Report 2018 |
Total
distributions to
shareholders | Net
asset
value,
end of
period | Total
return | Total gross
expense
ratio to
average
net assets(a) | Total net
expense
ratio to
average
net assets(a),(b) | Net investment
income
ratio to
average
net assets | Portfolio
turnover | Net
assets,
end of
period
(000’s) |
| |
| (0.31) | $10.44 | (0.39%) | 0.89% | 0.81% (c) | 2.55% | 14% | $27,005 |
| (0.33) | $10.79 | (0.51%) | 0.95% | 0.81% | 2.56% | 7% | $28,168 |
| (0.35) | $11.18 | 3.65% | 0.96% | 0.81% (c) | 2.72% | 12% | $42,046 |
| (0.31) | $11.13 | 3.21% | 0.97% | 0.81% (c) | 2.79% | 9% | $47,324 |
| (0.38) | $11.09 | (0.51%) | 0.97% | 0.81% (c) | 2.86% | 2% | $47,113 |
| |
| (0.34) | $10.44 | (0.14%) | 0.63% | 0.56% (c) | 2.80% | 14% | $1,823 |
| (0.36) | $10.79 | (0.26%) | 0.70% | 0.56% | 2.81% | 7% | $812 |
| (0.38) | $11.18 | 4.00% | 0.72% | 0.56% (c) | 2.97% | 12% | $506 |
| (0.34) | $11.12 | 3.47% | 0.72% | 0.56% (c) | 3.06% | 9% | $656 |
| (0.41) | $11.08 | (0.19%) | 0.72% | 0.56% (c) | 3.18% | 2% | $77 |
| |
| (0.23) | $10.45 | (1.13%) | 1.64% | 1.56% (c) | 1.79% | 14% | $3,824 |
| (0.25) | $10.80 | (1.25%) | 1.70% | 1.56% | 1.82% | 7% | $4,938 |
| (0.26) | $11.19 | 2.97% | 1.72% | 1.56% (c) | 1.97% | 12% | $5,141 |
| (0.23) | $11.13 | 2.35% | 1.72% | 1.56% (c) | 2.03% | 9% | $4,419 |
| (0.30) | $11.10 | (1.16%) | 1.72% | 1.56% (c) | 2.11% | 2% | $4,044 |
| |
| (0.34) | $10.44 | (0.15%) | 0.65% | 0.56% (c) | 2.76% | 14% | $29,199 |
| (0.36) | $10.79 | (0.26%) | 0.70% | 0.56% | 2.82% | 7% | $161,853 |
| (0.38) | $11.18 | 3.91% | 0.71% | 0.56% (c) | 2.97% | 12% | $173,677 |
| (0.34) | $11.13 | 3.47% | 0.72% | 0.56% (c) | 3.04% | 9% | $171,775 |
| (0.41) | $11.09 | (0.26%) | 0.72% | 0.56% (c) | 3.09% | 2% | $177,502 |
| |
| (0.35) | $10.46 | (0.13%) | 0.54% | 0.48% | 2.91% | 14% | $102,071 |
| (0.06) | $10.82 | 1.17% | 0.55% (g) | 0.42% (g) | 3.04% (g) | 7% | $10 |
Columbia AMT-Free Virginia Intermediate Muni Bond Fund | Annual Report 2018
| 19 |
Notes to Financial Statements
April 30, 2018
Note 1. Organization
Columbia AMT-Free Virginia Intermediate Muni Bond Fund (the Fund), a series of Columbia Funds Series Trust (the Trust), is a diversified fund. The Trust is registered under the Investment Company Act of 1940, as amended (the 1940 Act), as an open-end management investment company organized as a Delaware statutory trust.
Fund shares
The Trust may issue an unlimited number of shares (without par value). Although all share classes generally have identical voting, dividend and liquidation rights, each share class votes separately when required by the Trust’s organizational documents or by law. Different share classes pay different distribution amounts to the extent the expenses of such share classes differ, and distributions in liquidation will be proportional to the net asset value of each share class. Each share class has its own expense and sales charge structure. The Fund offers each of the share classes identified below.
Class A shares are subject to a maximum front-end sales charge of 3.00% based on the initial investment amount. Class A shares purchased without an initial sales charge are subject to a contingent deferred sales charge (CDSC) of 0.75% on certain investments of $500,000 or more if redeemed within 12 months after purchase.
Advisor Class shares are not subject to sales charges and are generally available only to omnibus retirement plans and certain investors as described in the Fund’s prospectus. Prior to November 1, 2017, Advisor Class shares were known as Class R4 shares.
Class B shares of the Fund are no longer offered for sale. When available, Class B shares were subject to a maximum CDSC of 3.00% based upon the holding period after purchase. Effective July 17, 2017, Class B shares were automatically converted to Class A shares without a CDSC. On August 4, 2017, the capital owned by Columbia Management Investment Advisers, LLC in Class B shares was redeemed without a CDSC.
Class C shares are subject to a 1.00% CDSC on shares redeemed within 12 months after purchase.
Institutional Class shares are not subject to sales charges and are generally available only to eligible investors, which are subject to different investment minimums as described in the Fund’s prospectus. Prior to November 1, 2017, Institutional Class shares were known as Class Z shares.
Institutional 3 Class shares are not subject to sales charges and are available to institutional and certain other investors as described in the Fund’s prospectus. Prior to November 1, 2017, Institutional 3 Class shares were known as Class Y shares.
Note 2. Summary of significant accounting policies
Basis of preparation
The Fund is an investment company that applies the accounting and reporting guidance in the Financial Accounting Standards Board (FASB) Accounting Standards Codification Topic 946, Financial Services - Investment Companies (ASC 946). The financial statements are prepared in accordance with U.S. generally accepted accounting principles (GAAP), which requires management to make certain estimates and assumptions that affect the reported amounts of assets and liabilities, the disclosure of contingent assets and liabilities at the date of the financial statements and the reported amounts of income and expenses during the reporting period. Actual results could differ from those estimates.
The following is a summary of significant accounting policies followed by the Fund in the preparation of its financial statements.
Security valuation
Debt securities generally are valued by pricing services approved by the Board of Trustees based upon market transactions for normal, institutional-size trading units of similar securities. The services may use various pricing techniques that take into account, as applicable, factors such as yield, quality, coupon rate, maturity, type of issue, trading characteristics and other data, as well as approved independent broker-dealer quotes. Debt securities for which quotations are not readily available or
| 20 | Columbia AMT-Free Virginia Intermediate Muni Bond Fund | Annual Report 2018 |
Notes to Financial Statements (continued)
April 30, 2018
not believed to be reflective of market value may also be valued based upon a bid quote from an approved independent broker-dealer. Debt securities maturing in 60 days or less are valued primarily at amortized cost value, unless this method results in a valuation that management believes does not approximate market value.
Investments for which market quotations are not readily available, or that have quotations which management believes are not reflective of market value or reliable, are valued at fair value as determined in good faith under procedures approved by and under the general supervision of the Board of Trustees. If a security or class of securities (such as foreign securities) is valued at fair value, such value is likely to be different from the quoted or published price for the security.
The determination of fair value often requires significant judgment. To determine fair value, management may use assumptions including but not limited to future cash flows and estimated risk premiums. Multiple inputs from various sources may be used to determine fair value.
GAAP requires disclosure regarding the inputs and valuation techniques used to measure fair value and any changes in valuation inputs or techniques. In addition, investments shall be disclosed by major category. This information is disclosed following the Fund’s Portfolio of Investments.
Delayed delivery securities
The Fund may trade securities on other than normal settlement terms, including securities purchased or sold on a “when-issued” or "forward commitment" basis. This may increase risk to the Fund since the other party to the transaction may fail to deliver, which could cause the Fund to subsequently invest at less advantageous prices. The Fund designates cash or liquid securities in an amount equal to the delayed delivery commitment.
Security transactions
Security transactions are accounted for on the trade date. Cost is determined and gains (losses) are based upon the specific identification method for both financial statement and federal income tax purposes.
Income recognition
Interest income is recorded on an accrual basis. Market premiums and discounts, including original issue discounts, are amortized and accreted, respectively, over the expected life of the security on all debt securities, unless otherwise noted.
The Fund may place a debt security on non-accrual status and reduce related interest income when it becomes probable that the interest will not be collected and the amount of uncollectible interest can be reasonably estimated. A defaulted debt security is removed from non-accrual status when the issuer resumes interest payments or when collectibility of interest is reasonably assured.
Expenses
General expenses of the Trust are allocated to the Fund and other funds of the Trust based upon relative net assets or other expense allocation methodologies determined by the nature of the expense. Expenses directly attributable to the Fund are charged to the Fund. Expenses directly attributable to a specific class of shares are charged to that share class.
Determination of class net asset value
All income, expenses (other than class-specific expenses, which are charged to that share class, as shown in the Statement of Operations) and realized and unrealized gains (losses) are allocated to each class of the Fund on a daily basis, based on the relative net assets of each class, for purposes of determining the net asset value of each class.
Federal income tax status
The Fund intends to qualify each year as a regulated investment company under Subchapter M of the Internal Revenue Code, as amended, and will distribute substantially all of its net tax-exempt and investment company taxable income and net capital gain, if any, for its tax year, and as such will not be subject to federal income taxes. In addition, the Fund intends to distribute in each calendar year substantially all of its ordinary income, capital gain net income and certain other amounts, if any, such that the Fund should not be subject to federal excise tax. Therefore, no federal income or excise tax provision is recorded.
Columbia AMT-Free Virginia Intermediate Muni Bond Fund | Annual Report 2018
| 21 |
Notes to Financial Statements (continued)
April 30, 2018
Distributions to shareholders
Distributions from net investment income, if any, are declared daily and paid monthly. Net realized capital gains, if any, are distributed at least annually. Income distributions and capital gain distributions are determined in accordance with federal income tax regulations, which may differ from GAAP.
Guarantees and indemnifications
Under the Trust’s organizational documents and, in some cases, by contract, its officers and trustees are indemnified against certain liabilities arising out of the performance of their duties to the Trust or its funds. In addition, certain of the Fund’s contracts with its service providers contain general indemnification clauses. The Fund’s maximum exposure under these arrangements is unknown since the amount of any future claims that may be made against the Fund cannot be determined, and the Fund has no historical basis for predicting the likelihood of any such claims.
Recent accounting pronouncement
Accounting Standards Update 2017-08 Premium Amortization on Purchased Callable Debt Securities
In March 2017, the Financial Accounting Standards Board issued Accounting Standards Update (ASU) No. 2017-08 Premium Amortization on Purchased Callable Debt Securities. ASU No. 2017-08 updates the accounting standards to shorten the amortization period for certain purchased callable debt securities, held at a premium, to be amortized to the earliest call date. The update applies to securities with explicit, noncontingent call features that are callable at fixed prices and on preset dates. The standard is effective for annual periods beginning after December 15, 2018 and interim periods within those fiscal years. At this time, management is evaluating the implication of this guidance and the impact it will have on the financial statement amounts and footnote disclosures, if any.
Note 3. Fees and other transactions with affiliates
Management services fees
The Fund has entered into a Management Agreement with Columbia Management Investment Advisers, LLC (the Investment Manager), a wholly-owned subsidiary of Ameriprise Financial, Inc. (Ameriprise Financial). Under the Management Agreement, the Investment Manager provides the Fund with investment research and advice, as well as administrative and accounting services. The management services fee is an annual fee that is equal to a percentage of the Fund’s daily net assets that declines from 0.47% to 0.31% as the Fund’s net assets increase. The effective management services fee rate for the year ended April 30, 2018 was 0.47% of the Fund’s average daily net assets.
Compensation of board members
Members of the Board of Trustees who are not officers or employees of the Investment Manager or Ameriprise Financial are compensated for their services to the Fund as disclosed in the Statement of Operations. Under a Deferred Compensation Plan (the Plan), these members of the Board of Trustees may elect to defer payment of up to 100% of their compensation. Deferred amounts are treated as though equivalent dollar amounts had been invested in shares of certain funds managed by the Investment Manager. The Fund’s liability for these amounts is adjusted for market value changes and remains in the Fund until distributed in accordance with the Plan. All amounts payable under the Plan constitute a general unsecured obligation of the Fund.
Compensation of Chief Compliance Officer
The Board of Trustees has appointed a Chief Compliance Officer to the Fund in accordance with federal securities regulations. As disclosed in the Statement of Operations, a portion of the Chief Compliance Officer’s total compensation is allocated to the Fund, along with other allocations to affiliated funds governed by the Board of Trustees, based on relative net assets.
| 22 | Columbia AMT-Free Virginia Intermediate Muni Bond Fund | Annual Report 2018 |
Notes to Financial Statements (continued)
April 30, 2018
Transfer agency fees
Under a Transfer and Dividend Disbursing Agent Agreement, Columbia Management Investment Services Corp. (the Transfer Agent), an affiliate of the Investment Manager and a wholly-owned subsidiary of Ameriprise Financial, is responsible for providing transfer agency services to the Fund. The Transfer Agent has contracted with DST Asset Manager Solutions, Inc. (DST) to serve as sub-transfer agent. The Transfer Agent pays the fees of DST for services as sub-transfer agent and DST is not entitled to reimbursement for such fees from the Fund (with the exception of out-of-pocket fees).
The Fund pays the Transfer Agent a monthly transfer agency fee based on the number or the average value of accounts, depending on the type of account. In addition, the Fund pays the Transfer Agent a fee for shareholder services based on the number of accounts or on a percentage of the average aggregate value of the Fund’s shares maintained in omnibus accounts up to the lesser of the amount charged by the financial intermediary or a cap established by the Board of Trustees from time to time.
The Transfer Agent also receives compensation from the Fund for various shareholder services and reimbursements for certain out-of-pocket fees. Effective August 1, 2017, total transfer agency fees for Institutional 3 Class shares are subject to an annual limitation of not more than 0.02% of the average daily net assets attributable to Institutional 3 Class shares. Prior to August 1, 2017, the limitation was 0.025% for Institutional 3 Class shares.
For the year ended April 30, 2018, the Fund’s effective transfer agency fee rates as a percentage of average daily net assets of each class were as follows:
| | Effective rate (%) |
| Class A | 0.11 |
| Advisor Class | 0.11 |
| Class B | 0.04 (a) |
| Class C | 0.11 |
| Institutional Class | 0.13 |
| Institutional 3 Class | 0.01 |
An annual minimum account balance fee of $20 may apply to certain accounts with a value below the applicable share class’s initial minimum investment requirements to reduce the impact of small accounts on transfer agency fees. These minimum account balance fees are remitted to the Fund and recorded as part of expense reductions in the Statement of Operations. For the year ended April 30, 2018, these minimum account balance fees reduced total expenses of the Fund by $20.
Distribution and service fees
The Fund has entered into an agreement with Columbia Management Investment Distributors, Inc. (the Distributor), an affiliate of the Investment Manager and a wholly-owned subsidiary of Ameriprise Financial, for distribution and shareholder services. The Board of Trustees has approved, and the Fund has adopted, distribution and shareholder service plans (the Plans) applicable to certain share classes, which set the distribution and service fees for the Fund. These fees are calculated daily and are intended to compensate the Distributor and/or eligible selling and/or servicing agents for selling shares of the Fund and providing services to investors.
Under the Plans, the Fund pays a monthly combined distribution and service fee to the Distributor at the maximum annual rate of 0.25% of the average daily net assets attributable to Class A shares of the Fund. Also under the Plans, the Fund pays a monthly service fee to the Distributor at the maximum annual rate of 0.25% of the average daily net assets attributable to Class B and Class C shares of the Fund and a monthly distribution fee to the Distributor at the maximum annual rate of 0.75% of the average daily net assets attributable to Class B and Class C shares of the Fund. As a result of all Class B shares of the Fund being redeemed or converted to Class A shares, August 4, 2017 was the last day the Fund paid a distribution and service fee for Class B shares.
Columbia AMT-Free Virginia Intermediate Muni Bond Fund | Annual Report 2018
| 23 |
Notes to Financial Statements (continued)
April 30, 2018
Sales charges (unaudited)
Sales charges, including front-end charges and CDSCs, received by the Distributor for distributing Fund shares for the year ended April 30, 2018, if any, are listed below:
| | Amount ($) |
| Class A | 25,809 |
| Class C | 36 |
Expenses waived/reimbursed by the Investment Manager and its affiliates
The Investment Manager and certain of its affiliates have contractually agreed to waive fees and/or reimburse expenses (excluding certain fees and expenses described below) for the period(s) disclosed below, unless sooner terminated at the sole discretion of the Board of Trustees, so that the Fund’s net operating expenses, after giving effect to fees waived/expenses reimbursed and any balance credits and/or overdraft charges from the Fund’s custodian, do not exceed the following annual rate(s) as a percentage of the class’ average daily net assets:
| | September 1, 2017
through
August 31, 2018 | Prior to
September 1, 2017 |
| Class A | 0.81% | 0.81% |
| Advisor Class | 0.56 | 0.56 |
| Class C | 1.56 | 1.56 |
| Institutional Class | 0.56 | 0.56 |
| Institutional 3 Class | 0.48 | 0.42 |
Under the agreement governing these fee waivers and/or expense reimbursement arrangements, the following fees and expenses are excluded from the waiver/reimbursement commitment, and therefore will be paid by the Fund, if applicable: taxes (including foreign transaction taxes), expenses associated with investments in affiliated and non-affiliated pooled investment vehicles (including mutual funds and exchange-traded funds), transaction costs and brokerage commissions, costs related to any securities lending program, dividend expenses associated with securities sold short, inverse floater program fees and expenses, transaction charges and interest on borrowed money, interest, infrequent and/or unusual expenses and any other expenses the exclusion of which is specifically approved by the Board of Trustees. This agreement may be modified or amended only with approval from the Investment Manager, certain of its affiliates and the Fund. Any fees waived and/or expenses reimbursed under the expense reimbursement arrangements described above are not recoverable by the Investment Manager or its affiliates in future periods.
Note 4. Federal tax information
The timing and character of income and capital gain distributions are determined in accordance with income tax regulations, which may differ from GAAP because of temporary or permanent book to tax differences.
At April 30, 2018, these differences were primarily due to differing treatment for trustees’ deferred compensation and distributions. To the extent these differences were permanent, reclassifications were made among the components of the Fund’s net assets in the Statement of Assets and Liabilities. Temporary differences do not require reclassifications.
The Fund did not have any permanent differences; therefore, no reclassifications were made to the Statement of Assets and Liabilities.
The tax character of distributions paid during the years indicated was as follows:
| Year Ended April 30, 2018 | Year Ended April 30, 2017 |
Ordinary
income ($) | Tax-exempt
income ($) | Long-term
capital gains ($) | Total ($) | Ordinary
income ($) | Tax-exempt
income ($) | Long-term
capital gains ($) | Total ($) |
| 41,955 | 5,224,720 | 503,515 | 5,770,190 | 40,043 | 6,134,674 | 684,961 | 6,859,678 |
Short-term capital gain distributions, if any, are considered ordinary income distributions for tax purposes.
| 24 | Columbia AMT-Free Virginia Intermediate Muni Bond Fund | Annual Report 2018 |
Notes to Financial Statements (continued)
April 30, 2018
At April 30, 2018, the components of distributable earnings on a tax basis were as follows:
Undistributed
ordinary income ($) | Undistributed tax-
exempt income ($) | Undistributed
long-term
capital gains ($) | Capital loss
carryforwards ($) | Net unrealized
appreciation ($) |
| — | 628,937 | 592,790 | — | 1,939,378 |
At April 30, 2018, the cost of all investments for federal income tax purposes along with the aggregate gross unrealized appreciation and depreciation based on that cost was:
Federal
tax cost ($) | Gross unrealized
appreciation ($) | Gross unrealized
(depreciation) ($) | Net unrealized
appreciation ($) |
| 159,407,890 | 4,730,770 | (2,791,392) | 1,939,378 |
Management of the Fund has concluded that there are no significant uncertain tax positions in the Fund that would require recognition in the financial statements. However, management’s conclusion may be subject to review and adjustment at a later date based on factors including, but not limited to, new tax laws, regulations, and administrative interpretations (including relevant court decisions). Generally, the Fund’s federal tax returns for the prior three fiscal years remain subject to examination by the Internal Revenue Service.
Note 5. Portfolio information
The cost of purchases and proceeds from sales of securities, excluding short-term investments and derivatives, if any, aggregated to $24,547,681 and $48,715,238, respectively, for the year ended April 30, 2018. The amount of purchase and sale activity impacts the portfolio turnover rate reported in the Financial Highlights.
Note 6. Line of credit
The Fund has access to a revolving credit facility with a syndicate of banks led by Citibank, N.A., HSBC Bank USA, N.A. and JPMorgan Chase Bank, N.A. whereby the Fund may borrow for the temporary funding of shareholder redemptions or for other temporary or emergency purposes. The credit facility, which is a collective agreement between the Fund and certain other funds managed by the Investment Manager, severally and not jointly, permits collective borrowings up to $1 billion. Interest is charged to each participating fund based on its borrowings at a rate equal to the higher of (i) the overnight federal funds rate plus 1.00% or (ii) the one-month LIBOR rate plus 1.00%. Each borrowing under the credit facility matures no later than 60 days after the date of borrowing. The Fund also pays a commitment fee equal to its pro rata share of the amount of the credit facility at a rate of 0.15% per annum. The commitment fee is included in other expenses in the Statement of Operations.
The Fund had no borrowings during the year ended April 30, 2018.
Note 7. Significant risks
Credit risk
Credit risk is the risk that the value of debt securities in the Fund’s portfolio may decline because the issuer may default and fail to pay interest or repay principal when due. Rating agencies assign credit ratings to debt securities to indicate their credit risk. Lower rated or unrated debt securities held by the Fund may present increased credit risk as compared to higher-rated debt securities.
Geographic concentration risk
Because the Fund invests substantially in municipal securities issued by the state identified in the Fund’s name and political sub-divisions of that state, the Fund will be particularly affected by adverse tax, legislative, regulatory, demographic or political changes as well as changes impacting the state’s financial, economic or other condition and prospects. In addition, because of the relatively small number of issuers of tax-exempt securities in the state, the Fund may invest a higher percentage of
Columbia AMT-Free Virginia Intermediate Muni Bond Fund | Annual Report 2018
| 25 |
Notes to Financial Statements (continued)
April 30, 2018
assets in a single issuer and, therefore, be more exposed to the risk of loss than a fund that invests more broadly. The value of municipal and other securities owned by the Fund also may be adversely affected by future changes in federal or state income tax laws.
Interest rate risk
Interest rate risk is the risk of losses attributable to changes in interest rates. In general, if prevailing interest rates rise, the values of debt securities tend to fall, and if interest rates fall, the values of debt securities tend to rise. Actions by governments and central banking authorities can result in increases in interest rates. Increasing interest rates may negatively affect the value of debt securities held by the Fund, resulting in a negative impact on the Fund’s performance and net asset value per share. In general, the longer the maturity or duration of a debt security, the greater its sensitivity to changes in interest rates.
Liquidity risk
Liquidity risk is the risk associated with a lack of marketability of investments which may make it difficult to sell the investment at a desirable time or price. Changing regulatory, market or other conditions or environments (for example, the interest rate or credit environments) may adversely affect the liquidity of the Fund’s investments. The Fund may have to accept a lower selling price for the holding, sell other investments, or forego another, more appealing investment opportunity. Generally, the less liquid the market at the time the Fund sells a portfolio investment, the greater the risk of loss or decline of value to the Fund. A less liquid market can lead to an increase in Fund redemptions, which may negatively impact Fund performance and net asset value per share, including, for example, if the Fund is forced to sell securities in a down market.
Shareholder concentration risk
At April 30, 2018, one unaffiliated shareholder of record owned 69.6% of the outstanding shares of the Fund in one or more accounts. The Fund has no knowledge about whether any portion of those shares was owned beneficially. Subscription and redemption activity by concentrated accounts may have a significant effect on the operations of the Fund. In the case of a large redemption, the Fund may be forced to sell investments at inopportune times, including its liquid positions, which may result in Fund losses and the Fund holding a higher percentage of less liquid positions. Large redemptions could result in decreased economies of scale and increased operating expenses for non-redeeming Fund shareholders.
Note 8. Subsequent events
Management has evaluated the events and transactions that have occurred through the date the financial statements were issued and noted no items requiring adjustment of the financial statements or additional disclosure.
Note 9. Information regarding pending and settled legal proceedings
Ameriprise Financial and certain of its affiliates have historically been involved in a number of legal, arbitration and regulatory proceedings, including routine litigation, class actions, and governmental actions, concerning matters arising in connection with the conduct of their business activities. Ameriprise Financial believes that the Fund is not currently the subject of, and that neither Ameriprise Financial nor any of its affiliates are the subject of, any pending legal, arbitration or regulatory proceedings that are likely to have a material adverse effect on the Fund or the ability of Ameriprise Financial or its affiliates to perform under their contracts with the Fund. Ameriprise Financial is required to make quarterly (10-Q), annual (10-K) and, as necessary, 8-K filings with the Securities and Exchange Commission (SEC) on legal and regulatory matters that relate to Ameriprise Financial and its affiliates. Copies of these filings may be obtained by accessing the SEC website at www.sec.gov.
There can be no assurance that these matters, or the adverse publicity associated with them, will not result in increased Fund redemptions, reduced sale of Fund shares or other adverse consequences to the Fund. Further, although we believe proceedings are not likely to have a material adverse effect on the Fund or the ability of Ameriprise Financial or its affiliates to perform under their contracts with the Fund, these proceedings are subject to uncertainties and, as such, we are unable to estimate the possible loss or range of loss that may result. An adverse outcome in one or more of these proceedings could result in adverse judgments, settlements, fines, penalties or other relief that could have a material adverse effect on the consolidated financial condition or results of operations of Ameriprise Financial.
| 26 | Columbia AMT-Free Virginia Intermediate Muni Bond Fund | Annual Report 2018 |
Report of Independent Registered Public Accounting Firm
To the Board of Trustees of Columbia Funds Series Trust and Shareholders of Columbia AMT-Free Virginia Intermediate Muni Bond Fund
Opinion on the Financial Statements
We have audited the accompanying statement of assets and liabilities, including the portfolio of investments, of Columbia AMT-Free Virginia Intermediate Muni Bond Fund (one of the funds constituting Columbia Funds Series Trust, referred to hereafter as the "Fund") as of April 30, 2018, the related statement of operations for the year ended April 30, 2018, the statement of changes in net assets for each of the two years in the period ended April 30, 2018, including the related notes, and the financial highlights for each of the periods indicated therein (collectively referred to as the “financial statements”). In our opinion, the financial statements present fairly, in all material respects, the financial position of the Fund as of April 30, 2018, the results of its operations for the year then ended, the changes in its net assets for each of the two years in the period ended April 30, 2018 and the financial highlights for each of the periods indicated therein in conformity with accounting principles generally accepted in the United States of America.
Basis for Opinion
These financial statements are the responsibility of the Fund’s management. Our responsibility is to express an opinion on the Fund’s financial statements based on our audits. We are a public accounting firm registered with the Public Company Accounting Oversight Board (United States) (“PCAOB”) and are required to be independent with respect to the Fund in accordance with the U.S. federal securities laws and the applicable rules and regulations of the Securities and Exchange Commission and the PCAOB.
We conducted our audits of these financial statements in accordance with the standards of the PCAOB. Those standards require that we plan and perform the audit to obtain reasonable assurance about whether the financial statements are free of material misstatement, whether due to error or fraud.
Our audits included performing procedures to assess the risks of material misstatement of the financial statements, whether due to error or fraud, and performing procedures that respond to those risks. Such procedures included examining, on a test basis, evidence regarding the amounts and disclosures in the financial statements. Our audits also included evaluating the accounting principles used and significant estimates made by management, as well as evaluating the overall presentation of the financial statements. Our procedures included confirmation of securities owned as of April 30, 2018 by correspondence with the custodian and brokers; when replies were not received from brokers, we performed other auditing procedures. We believe that our audits provide a reasonable basis for our opinion.
/s/PricewaterhouseCoopers LLP
Minneapolis, Minnesota
June 21, 2018
We have served as auditors of one or more investment companies within the Columbia Funds Complex since 1977.
Columbia AMT-Free Virginia Intermediate Muni Bond Fund | Annual Report 2018
| 27 |
Federal Income Tax Information
(Unaudited)
The Fund hereby designates the following tax attributes for the fiscal year ended April 30, 2018. Shareholders will be notified in early 2019 of the amounts for use in preparing 2018 income tax returns.
Capital
gain
dividend | Exempt-
interest
dividends |
| $1,151,120 | 99.20% |
Capital gain dividend. The Fund designates as a capital gain dividend the amount reflected above, or if subsequently determined to be different, the net capital gain of such fiscal period.
Exempt-interest dividends. The percentage of net investment income distributed during the fiscal year that qualifies as exempt-interest dividends for federal income tax purposes.
| 28 | Columbia AMT-Free Virginia Intermediate Muni Bond Fund | Annual Report 2018 |
Shareholders elect the Board that oversees the Fund’s operations. The Board appoints officers who are responsible for day-to-day business decisions based on policies set by the Board. The following table provides basic biographical information about the Fund’s Trustees, including their principal occupations during the past five years, although specific titles for individuals may have varied over the period. Under current Board policy, Trustees not affiliated with the Investment Manager generally may serve through the end of the calendar year in which they reach either the mandatory retirement age established by the Board or the fifteenth anniversary of the first Columbia Funds board meeting they attended as a member of the Board.
Independent trustees
Name,
address,
year of birth | Position held
with the Trust and
length of service | Principal occupation(s)
during past five years
and other relevant
professional experience | Number of
Funds in the
Columbia Funds
complex
overseen | Other directorships
held by Trustee
during the past
five years |
George S. Batejan
c/o Columbia Management
Investment Advisers, LLC
225 Franklin Street
Mail Drop BX32 05228
Boston, MA 02110
1953 | Trustee since 1/17 | Executive Vice President, Global Head of Technology and Operations, Janus Capital Group, Inc., 2010-2016 | 125 | Advisory Board Member, University of Colorado Business School since November 2015; former Chairman of the Board, NICSA (National Investment Company Services Association) (Executive Committee, Nominating Committee and Governance Committee), 2014-2016; former Director, Intech Investment Management, 2011- 2016; former Board Member, Metro Denver Chamber of Commerce, 2015-2016 |
Kathleen Blatz
c/o Columbia Management
Investment Advisers, LLC
225 Franklin Street
Mail Drop BX32 05228
Boston, MA 02110
1954 | Trustee since 1/06 for RiverSource Funds and since 6/11 for Nations Funds | Attorney; specializing in arbitration and mediation; Interim President and Chief Executive Officer, Blue Cross and Blue Shield of Minnesota (health care insurance) since February 2018; Chief Justice, Minnesota Supreme Court, 1998-2006; Associate Justice, Minnesota Supreme Court, 1996-1998; Fourth Judicial District Court Judge, Hennepin County, 1994-1996; Attorney in private practice and public service, 1984-1993; State Representative, Minnesota House of Representatives, 1979-1993, which included service on the Tax and Financial Institutions and Insurance Committees; Interim Chair, Minnesota Sports Facilities Authority, March 2017-July 2017 | 125 | Trustee, BlueCross BlueShield of Minnesota since 2009 (Chair of the Business Development Committee, 2014-2017; Chair of the Governance Committee since 2017); Chair of the Robina Foundation since August 2013; former Member of the Board, Minnesota Sports Facilities Authority, January 2017-July 2017 |
Edward J. Boudreau, Jr.
c/o Columbia Management
Investment Advisers, LLC
225 Franklin Street
Mail Drop BX32 05228
Boston, MA 02110
1944 | Chair of the Board since 1/18; Trustee since 6/11 for RiverSource Funds and since 1/05 for Nations Funds | Managing Director, E.J. Boudreau & Associates (consulting) since 2000; FINRA Industry Arbitrator, 2002-present; Chairman and Chief Executive Officer, John Hancock Investments (asset management), Chairman and Interested Trustee for open-end and closed-end funds offered by John Hancock, 1989-2000; John Hancock Mutual Life Insurance Company, including Senior Vice President and Treasurer and Senior Vice President Information Technology, 1968-1988 | 125 | Former Trustee, Boston Museum of Science (Chair of Finance Committee) 1985-2013; former Trustee, BofA Funds Series Trust (11 funds), 2005-2011 |
Columbia AMT-Free Virginia Intermediate Muni Bond Fund | Annual Report 2018
| 29 |
TRUSTEES AND OFFICERS (continued)
Independent trustees (continued)
Name,
address,
year of birth | Position held
with the Trust and
length of service | Principal occupation(s)
during past five years
and other relevant
professional experience | Number of
Funds in the
Columbia Funds
complex
overseen | Other directorships
held by Trustee
during the past
five years |
Pamela G. Carlton
c/o Columbia Management
Investment Advisers, LLC
225 Franklin Street
Mail Drop BX32 05228
Boston, MA 02110
1954 | Trustee since 7/07 for RiverSource Funds and since 6/11 for Nations Funds | President, Springboard — Partners in Cross Cultural Leadership (consulting company) since 2003; Managing Director of US Equity Research, JP Morgan Chase, 1999-2003; Director of US Equity Research, Chase Asset Management, 1996-1999; Co-Director Latin America Research, 1993-1996, COO Global Research, 1992-1996, Co-Director of US Research, 1991-1992, Investment Banker, Morgan Stanley, 1982-1991 | 125 | Trustee, New York Presbyterian Hospital Board (Executive Committee and Chair of Human Resources Committee) since 1996; Director, Darien Rowayton Bank (Audit Committee) since 2017 |
William P. Carmichael
c/o Columbia Management
Investment Advisers, LLC
225 Franklin Street
Mail Drop BX32 05228
Boston, MA 02110
1943 | Trustee since 6/11 for RiverSource Funds and since 2003 for Nations Funds | Retired; Co-founder, The Succession Fund (provides exit strategies to owners of privately held companies), 1998-2007; Adjunct Professor of Finance, Kelley School of Business, Indiana University, 1993-2007; Senior Vice President, Sara Lee Corporation, 1991-1993; Senior Vice President and Chief Financial Officer, Beatrice Foods Company, 1984-1990; Vice President, Esmark, Inc., 1973-1984; Associate, Price Waterhouse, 1968-1972 | 125 | Director, The Finish Line (athletic shoes and apparel) since July 2003; former Director, Cobra Electronics Corporation (electronic equipment manufacturer), 1994-August 2014; former Director, Spectrum Brands, Inc. (consumer products), 2002-2009; former Director, Simmons Company (bedding), 2004-2010; former Trustee, BofA Funds Series Trust (11 funds) 2003-2011; former Director, McMoRan Exploration Company (oil and gas exploration and development) 2010 - 2013; former Director, International Textile Corp., 2012-2016; former Director, hhgregg, 2015-2017 |
Patricia M. Flynn
c/o Columbia Management
Investment Advisers, LLC
225 Franklin Street
Mail Drop BX32 05228
Boston, MA 02110
1950 | Trustee since 11/04 for RiverSource Funds and since 6/11 for Nations Funds | Trustee Professor of Economics and Management, Bentley University since 1976 (also teaches and conducts research on corporate governance); Dean, McCallum Graduate School of Business, Bentley University, 1992-2002 | 125 | Trustee, MA Taxpayers Foundation since 1997; Board of Directors, The MA Business Roundtable since 2003; Board of Governors, Innovation Institute, MA Technology Collaborative since 2010 |
Brian J. Gallagher
c/o Columbia Management
Investment Advisers, LLC
225 Franklin Street
Mail Drop BX32 05228
Boston, MA 02110
1954 | Trustee since 12/17 | Retired; Partner with Deloitte & Touche LLP and its predecessors, 1977-2016 | 123 | Trustee, Catholic Schools Foundation since 2004 |
Catherine James Paglia
c/o Columbia Management
Investment Advisers, LLC
225 Franklin Street
Mail Drop BX32 05228
Boston, MA 02110
1952 | Trustee since 11/04 for RiverSource Funds and since 6/11 for Nations Funds | Director, Enterprise Asset Management, Inc. (private real estate and asset management company) since September 1998; Managing Director and Partner, Interlaken Capital, Inc., 1989-1997; Managing Director, Morgan Stanley, 1982-1989; Vice President, Investment Banking, 1980-1982, Associate, Investment Banking, 1976-1980, Dean Witter Reynolds, Inc. | 125 | Director, Valmont Industries, Inc. (irrigation systems manufacturer) since 2012; Trustee, Carleton College (on the Investment Committee); Trustee, Carnegie Endowment for International Peace (on the Investment Committee) |
| 30 | Columbia AMT-Free Virginia Intermediate Muni Bond Fund | Annual Report 2018 |
TRUSTEES AND OFFICERS (continued)
Independent trustees (continued)
Name,
address,
year of birth | Position held
with the Trust and
length of service | Principal occupation(s)
during past five years
and other relevant
professional experience | Number of
Funds in the
Columbia Funds
complex
overseen | Other directorships
held by Trustee
during the past
five years |
Minor M. Shaw
c/o Columbia Management
Investment Advisers, LLC
225 Franklin Street
Mail Drop BX32 05228
Boston, MA 02110
1947 | Trustee since 6/11 for RiverSource Funds and since 2003 for Nations Funds | President, Micco LLC (private investments) since 2011; President, Micco Corp. (family investment business), 1998-2011 | 125 | Director, BlueCross BlueShield of South Carolina since April 2008; Director, National Association of Corporate Directors, Carolinas Chapter, since 2013; Board Chair, Hollingsworth Funds since 2016; Advisory Board member, Duke Energy Corp. since October 2016; Chair of the Duke Endowment; Chair of Greenville – Spartanburg Airport Commission; former Trustee, BofA Funds Series Trust (11 funds), 2003-2011; former Director, Piedmont Natural Gas, 2004-2016 |
Sandra Yeager
c/o Columbia Management
Investment Advisers, LLC
225 Franklin Street
Mail Drop BX32 05228
Boston, MA 02110
1964 | Trustee since 12/17 | Retired; President and founder, Hanoverian Capital, LLC (SEC registered investment advisor firm), 2008-2016 | 123 | Director, NAPE Education Foundation since October 2016 |
Interested trustee not affiliated with Investment Manager*
Name,
address,
year of birth | Position held
with the Trust and
length of service | Principal occupation(s) during the
past five years and other relevant
professional experience | Number of
Funds in the
Columbia Funds
complex overseen | Other directorships/
held by Trustee
during the past
five years |
Anthony M. Santomero
c/o Columbia Management
Investment Advisers, LLC
225 Franklin Street
Mail Drop BX32 05228
Boston, MA 02110
1946 | Trustee since 6/11 for RiverSource Funds and since 1/08 for Nations Funds | Richard K. Mellon Professor Emeritus of Finance, The Wharton School, University of Pennsylvania, since 2002; Senior Advisor, McKinsey & Company (consulting), 2006-2008; President, Federal Reserve Bank of Philadelphia, 2000-2006, Professor of Finance, The Wharton School, University of Pennsylvania, 1972-2002 | 123 | Trustee, Penn Mutual Life Insurance Company since March 2008; Director, Renaissance Reinsurance Ltd. since May 2008; Director, Citigroup Inc. since 2009; Director, Citibank, N.A. since 2009; former Trustee, BofA Funds Series Trust (11 funds), 2008-2011 |
| * | Dr. Santomero is not an affiliated person of the Investment Manager or Ameriprise Financial. However, he is currently deemed by the Funds to be an “interested person” (as defined in the 1940 Act) of the Funds because he serves as a Director of Citigroup Inc. and Citibank, N.A., companies that may directly or through subsidiaries and affiliates engage from time-to-time in brokerage execution, principal transactions and lending relationships with the Funds or accounts advised/managed by the Investment Manager. |
Columbia AMT-Free Virginia Intermediate Muni Bond Fund | Annual Report 2018
| 31 |
TRUSTEES AND OFFICERS (continued)
Interested trustee affiliated with Investment Manager*
Name,
address,
year of birth | Position held with the Trusts and length of service | Principal occupation(s) during the
past five years and other relevant
professional experience | Number of
Funds in the
Columbia Funds
complex overseen | Other directorships
held by Trustee
during the past
five years |
William F. Truscott
c/o Columbia Management
Investment Advisers, LLC
225 Franklin St.
Boston, MA 02110
1960 | Trustee since 11/01 for RiverSource Funds and since 6/11 for Nations Funds; Senior Vice President since 2002 for RiverSource Funds and since 5/10 for Nations Funds | Chairman of the Board and President, Columbia Management Investment Advisers, LLC since May 2010 and February 2012, respectively; Chief Executive Officer, Global Asset Management, Ameriprise Financial, Inc. since September 2012 (previously Chief Executive Officer, U.S. Asset Management & President, Annuities, May 2010 - September 2012); Director and Chief Executive Officer, Columbia Management Investment Distributors, Inc. since May 2010 and February 2012, respectively; Chairman of the Board and Chief Executive Officer, RiverSource Distributors, Inc. since 2006; Director, Threadneedle Asset Management Holdings, SARL since 2014; President and Chief Executive Officer, Ameriprise Certificate Company, 2006 - August 2012. | 196 | Chairman of the Board, Columbia Management Investment Advisers, LLC since May 2010; Director, Columbia Management Investment Distributors, Inc. since May 2010; former Director, Ameriprise Certificate Company, 2006-January 2013 |
| * | Interested person (as defined under the 1940 Act) by reason of being an officer, director, security holder and/or employee of the Investment Manager or Ameriprise Financial. |
Nations Funds refer to the Funds within the Columbia Funds Complex that historically bore the Nations brand and includes series of Columbia Funds Series Trust. RiverSource Funds refer to the Funds within the Columbia Funds Complex that historically bore the RiverSource brand and includes series of Columbia Funds Series Trust II.
The Statement of Additional Information has additional information about the Fund’s Board members and is available, without charge, upon request by calling 800.345.6611, visiting columbiathreadneedleus.com/investor/ or contacting your financial intermediary.
| 32 | Columbia AMT-Free Virginia Intermediate Muni Bond Fund | Annual Report 2018 |
TRUSTEES AND OFFICERS (continued)
The Board has appointed officers who are responsible for day-to-day business decisions based on policies it has established. The officers serve at the pleasure of the Board. The following table provides basic information about the Officers of the Fund, including principal occupations during the past five years, although their specific titles may have varied over the period. In addition to Mr. Truscott, who is Senior Vice President, the Fund’s other officers are:
Fund officers
Name,
address and
year of birth | Position and year
first appointed to
position for any Fund
in the Columbia
Funds complex or a
predecessor thereof | Principal occupation(s) during past five years |
Christopher O. Petersen
5228 Ameriprise
Financial Center
Minneapolis, MN 55474
Born 1970 | President and Principal Executive Officer (2015) | Vice President and Lead Chief Counsel, Ameriprise Financial, Inc. since January 2015 (previously, Vice President and Chief Counsel, January 2010 - December 2014; officer of Columbia Funds and affiliated funds since 2007. |
Michael G. Clarke
225 Franklin Street
Boston, MA 02110
Born 1969 | Treasurer (2011), Chief Financial Officer (2009) and Chief Accounting Officer (2015) | Vice President — Mutual Fund Administration, Columbia Management Investment Advisers, LLC, since May 2010; senior officer of Columbia Funds and affiliated funds since 2002. |
Paul B. Goucher
100 Park Avenue
New York, NY 10017
Born 1968 | Senior Vice President (2011) and Assistant Secretary (2008) | Senior Vice President and Assistant General Counsel, Ameriprise Financial, Inc. since January 2017 (previously Vice President and Lead Chief Counsel, November 2008 - January 2017 and January 2013 - January 2017, respectively; and Chief Counsel, January 2010 - January 2013); Vice President, Chief Legal Officer and Assistant Secretary, Columbia Management Investment Advisers, LLC since May 2010. |
Thomas P. McGuire
225 Franklin Street
Boston, MA 02110
Born 1972 | Senior Vice President and Chief Compliance Officer (2012) | Vice President — Asset Management Compliance, Ameriprise Financial, Inc., since May 2010; Chief Compliance Officer, Ameriprise Certificate Company since September 2010. |
Colin Moore
225 Franklin Street
Boston, MA 02110
Born 1958 | Senior Vice President (2010) | Executive Vice President and Global Chief Investment Officer, Ameriprise Financial, Inc., since July 2013; Executive Vice President and Global Chief Investment Officer, Columbia Management Investment Advisers, LLC since July 2013 (previously Director and Global Chief Investment Officer, 2010 - 2013). |
Ryan C. Larrenaga
225 Franklin Street
Boston, MA 02110
Born 1970 | Senior Vice President (2017), Chief Legal Officer (2017) and Secretary (2015) | Vice President and Group Counsel, Ameriprise Financial, Inc. since August 2011; officer of Columbia Funds and affiliated funds since 2005. |
Michael E. DeFao
225 Franklin Street
Boston, MA 02110
Born 1968 | Vice President (2011) and Assistant Secretary (2010) | Vice President and Chief Counsel, Ameriprise Financial, Inc. since May 2010. |
Amy Johnson
5228 Ameriprise
Financial Center
Minneapolis, MN 55474
Born 1965 | Vice President (2006) | Managing Director and Global Head of Operations, Columbia Management Investment Advisers, LLC since April 2016 (previously Managing Director and Chief Operating Officer, 2010 - 2016). |
Lyn Kephart-Strong
5228 Ameriprise
Financial Center
Minneapolis, MN 55474
Born 1960 | Vice President (2015) | President, Columbia Management Investment Services Corp. since October 2014; Vice President & Resolution Officer, Ameriprise Trust Company since August 2009. |
Columbia AMT-Free Virginia Intermediate Muni Bond Fund | Annual Report 2018
| 33 |
The Fund mails one shareholder report to each shareholder address. If you would like more than one report, please call shareholder services at 800.345.6611 and additional reports will be sent to you.
Proxy voting policies and procedures
The policy of the Board of Trustees is to vote the proxies of the companies in which the Fund holds investments consistent with the procedures as stated in the Statement of Additional Information (SAI). You may obtain a copy of the SAI without charge by calling 800.345.6611; contacting your financial intermediary; visiting columbiathreadneedleus.com/investor/; or searching the website of the Securities and Exchange Commission (SEC) at sec.gov. Information regarding how the Fund voted proxies relating to portfolio securities is filed with the SEC by August 31st for the most recent 12-month period ending June 30th of that year, and is available without charge by visiting columbiathreadneedleus.com/investor/, or searching the website of the SEC at sec.gov.
Quarterly schedule of investments
The Fund files a complete schedule of portfolio holdings with the SEC for the first and third quarters of each fiscal year on Form N-Q. The Fund’s Form N-Q is available on the SEC’s website at sec.gov and may be reviewed and copied at the SEC’s Public Reference Room in Washington, D.C. Information on the operation of the Public Reference Room may be obtained by calling 800.SEC.0330. The Fund’s complete schedule of portfolio holdings, as filed on Form N-Q, can also be obtained without charge, upon request, by calling 800.345.6611.
Additional Fund information
For more information about the Fund, please visit columbiathreadneedleus.com/investor/ or call 800.345.6611. Customer Service Representatives are available to answer your questions Monday through Friday from 8 a.m. to 7 p.m. Eastern time.
Fund investment manager
Columbia Management Investment Advisers, LLC
225 Franklin Street
Boston, MA 02110
Fund distributor
Columbia Management Investment Distributors, Inc.
225 Franklin Street
Boston, MA 02110
Fund transfer agent
Columbia Management Investment Services Corp.
P.O. Box 8081
Boston, MA 02266-8081
| 34 | Columbia AMT-Free Virginia Intermediate Muni Bond Fund | Annual Report 2018 |
[THIS PAGE INTENTIONALLY LEFT BLANK]
[THIS PAGE INTENTIONALLY LEFT BLANK]
[THIS PAGE INTENTIONALLY LEFT BLANK]
Columbia AMT-Free Virginia Intermediate Muni Bond Fund
P.O. Box 8081
Boston, MA 02266-8081
Please read and consider the investment objectives, risks, charges and expenses for any fund carefully before investing. For a prospectus and summary prospectus, which contains this and other important information about the Fund, go to
columbiathreadneedleus.com/investor/. The Fund is distributed by Columbia Management Investment Distributors, Inc., member FINRA, and managed by Columbia Management Investment Advisers, LLC.
Columbia Threadneedle Investments (Columbia Threadneedle) is the global brand name of the Columbia and Threadneedle group of companies. All rights reserved. Columbia Management Investment Distributors, Inc., 225 Franklin Street, Boston, MA 02110-2804
© 2018 Columbia Management Investment Advisers, LLC.
columbiathreadneedleus .com/investor/

Annual Report
April 30, 2018
Columbia AMT-Free South Carolina Intermediate Muni Bond Fund
Not FDIC Insured • No bank guarantee • May lose value
Dear Shareholders,
The year 2017 was an extraordinary year in the financial markets. The S&P 500 Index didn’t experience a single down month and returned over 20%. Continuing this trend, January 2018 marked the fastest start for the index ever. Low volatility, which had been a feature of the U.S. equity market for several years, along with the surge in the S&P 500 Index, drove investor sentiment to very high levels. This arguably set the stage for an overdue correction, which we witnessed in February 2018.
A return to volatility
There have been few periods of market upheaval such as were experienced in the first part of 2018. While investors were taken by surprise by the sudden and pronounced market swings, the return to some level of volatility actually marked a resumption of relatively normal market conditions. Having said that, it’s important to distinguish between a good technical correction where excess enthusiasm in the marketplace is being let out, versus a real change in the underlying fundamentals – things like an underperforming economy or weaker corporate earnings. Our view is that the recent market volatility falls into the former category, and the fundamentals remain strong. We’re continuing to see improvements in global economic activity, and we’re seeing corporate earnings expectations continue to rise – and not just because of tax reform.
Consistency is more important than ever
It’s important to keep in mind that when it comes to long-term investing, it’s the destination, not the journey that matters most. If you have a financial goal that you’ve worked out with your financial advisor, and you have a good asset allocation plan to reach it, it’s a question of sticking with your plan rather than become focused on near-term volatility. Bouts of volatility are normal. After all, it’s hard to cross the ocean without hitting an occasional rough patch. You need to focus on the destination.
One final thought. In weathering volatility, it’s the consistency of the return that is essential. Investors who chase higher returns are usually the first to sell when an investment goes through a bad patch, and they therefore don’t tend to benefit from the recovery. More disciplined investors who perhaps panic less or not at all during periods of volatility, tend to have improved long-term results and are more likely to reach their financial goals. Nothing is more important to us than making sure those who have entrusted us to protect and grow their assets are able to do what matters most to them.
Your success is our priority. Talk to your financial advisor about how working with Columbia Threadneedle Investments may help you position your portfolio for consistent, sustainable outcomes, no matter the market conditions.
Sincerely,
Christopher O. Petersen
President, Columbia Funds
The S&P 500 Index, an unmanaged index, measures the performance of 500 widely held, large-capitalization U.S. stocks and is frequently used as a general measure of market performance. Past performance is no guarantee of future results.
Columbia Funds are distributed by Columbia Management Investment Distributors, Inc., member FINRA, and managed by Columbia Management Investment Advisers, LLC.
© 2018 Columbia Management Investment Advisers, LLC. All rights reserved.
Columbia AMT-Free South Carolina Intermediate Muni Bond Fund | Annual Report 2018
Columbia AMT-Free South Carolina Intermediate Muni Bond Fund | Annual Report 2018
Investment objective
Columbia AMT-Free South Carolina Intermediate Muni Bond Fund (the Fund) seeks current income exempt from U.S. federal income tax and South Carolina individual income tax, consistent with moderate fluctuation of principal.
Portfolio management
Paul Fuchs, CFA
Co-Portfolio Manager
Managed Fund since 2016
Deborah Vargo
Co-Portfolio Manager
Managed Fund since December 2017
| Average annual total returns (%) (for the period ended April 30, 2018) |
| | | Inception | 1 Year | 5 Years | 10 Years |
| Class A | Excluding sales charges | 05/05/92 | 0.43 | 1.21 | 3.11 |
| | Including sales charges | | -2.54 | 0.59 | 2.80 |
| Advisor Class* | 03/19/13 | 0.78 | 1.49 | 3.37 |
| Class C | Excluding sales charges | 06/17/92 | -0.32 | 0.46 | 2.33 |
| | Including sales charges | | -1.30 | 0.46 | 2.33 |
| Institutional Class | 01/06/92 | 0.68 | 1.47 | 3.36 |
| Institutional 3 Class* | 03/01/17 | 0.91 | 1.51 | 3.38 |
| Bloomberg Barclays 3-15 Year Blend Municipal Bond Index | | 0.87 | 2.10 | 3.99 |
Returns for Class A shares are shown with and without the maximum initial sales charge of 3.00%. Returns for Class C shares are shown with and without the 1.00% contingent deferred sales charge for the first year only. The Fund’s other classes are not subject to sales charges and have limited eligibility. Effective November 1, 2017, Class R4, Class Y and Class Z shares were renamed Advisor Class, Institutional 3 Class and Institutional Class shares, respectively. Please see the Fund’s prospectus for details. Performance for different share classes will vary based on differences in sales charges and fees associated with each class. All results shown assume reinvestment of distributions during the period. Returns do not reflect the deduction of taxes that a shareholder may pay on Fund distributions or on the redemption of Fund shares. Performance results reflect the effect of any fee waivers or reimbursements of Fund expenses by Columbia Management Investment Advisers, LLC and/or any of its affiliates. Absent these fee waivers or expense reimbursement arrangements, performance results would have been lower.
The performance information shown represents past performance and is not a guarantee of future results. The investment return and principal value of your investment will fluctuate so that your shares, when redeemed, may be worth more or less than their original cost. Current performance may be lower or higher than the performance information shown. You may obtain performance information current to the most recent month-end by contacting your financial intermediary, visiting columbiathreadneedleus.com/investor/ or calling 800.345.6611.
| * | The returns shown for periods prior to the share class inception date (including returns for the Life of the Fund, if shown, which are since Fund inception) include the returns of the Fund’s oldest share class. These returns are adjusted to reflect any higher class-related operating expenses of the newer share classes, as applicable. Please visit columbiathreadneedleus.com/investor/investment-products/mutual-funds/appended-performance for more information. |
The Bloomberg Barclays 3–15 Year Blend Municipal Bond Index is an unmanaged index that tracks the performance of municipal bonds issued after December 31, 1990, with remaining maturities between 2 and 17 years and at least $7 million in principal amount outstanding.
Indices are not available for investment, are not professionally managed and do not reflect sales charges, fees, brokerage commissions, taxes or other expenses of investing. Securities in the Fund may not match those in an index.
| 2 | Columbia AMT-Free South Carolina Intermediate Muni Bond Fund | Annual Report 2018 |
Fund at a Glance (continued)
Performance of a hypothetical $10,000 investment (April 30, 2008 — April 30, 2018)
The chart above shows the change in value of a hypothetical $10,000 investment in Class A shares of Columbia AMT-Free South Carolina Intermediate Muni Bond Fund during the stated time period, and does not reflect the deduction of taxes that a shareholder may pay on Fund distributions or on the redemption of Fund shares.
| Quality breakdown (%) (at April 30, 2018) |
| AAA rating | 3.9 |
| AA rating | 32.4 |
| A rating | 59.8 |
| BBB rating | 1.6 |
| BB rating | 0.9 |
| Not rated | 1.4 |
| Total | 100.0 |
Percentages indicated are based upon total fixed income investments (excluding Money Market Funds).
Bond ratings apply to the underlying holdings of the Fund and not the Fund itself and are divided into categories ranging from highest to lowest credit quality, determined by using the middle rating of Moody’s, S&P and Fitch, after dropping the highest and lowest available ratings. When ratings are available from only two rating agencies, the lower rating is used. When a rating is available from only one rating agency, that rating is used. When a bond is not rated by any rating agency, it is designated as “Not rated.” Credit quality ratings assigned by a rating agency are subjective opinions, not statements of fact, and are subject to change, including daily. The ratings assigned by credit rating agencies are but one of the considerations that the Investment Manager and/or Fund’s subadviser incorporates into its credit analysis process, along with such other issuer-specific factors as cash flows, capital structure and leverage ratios, ability to de-leverage (repay) through free cash flow, quality of management, market positioning and access to capital, as well as such security-specific factors as the terms of the security (e.g., interest rate and time to maturity) and the amount and type of any collateral.
Columbia AMT-Free South Carolina Intermediate Muni Bond Fund | Annual Report 2018
| 3 |
Manager Discussion of Fund Performance
For the 12-month period that ended April 30, 2018, the Fund’s Class A shares returned 0.43% excluding sales charges. Institutional shares of the Fund returned 0.68%. During the same time period, the Fund’s benchmark, the Bloomberg Barclays 3-15 Year Blend Municipal Bond Index, returned 0.87%. South Carolina’s municipal market delivered a modest gain thanks to a favorable economic backdrop and supportive credit conditions.
Market overview
The national municipal bond market posted a small gain in the 12-month period, as the contribution from income helped offset a moderate decline in prices. The period began on a positive note, reflecting the ongoing rebound from the post-election sell-off of late 2016. During this time, prices were supported by a generally positive tone to the financial markets, muted concerns about U.S. Federal Reserve (Fed) policy and a favorable balance of supply and demand stemming from strong mutual fund inflows and lower new issuance. Although unfunded pension liabilities and budgetary stress among notable issuers such as Illinois, New Jersey, Pennsylvania, Connecticut and Kentucky persisted, overall credit conditions for municipal bonds remained on a sound footing. In addition, Illinois passed a budget for the first time in two years in July 2017, preventing the state from being downgraded to a below investment-grade rating. The passage of Illinois’ budget took some risk out of the broader market, providing additional support for prices through the middle of 2017.
The market landscape became more challenging in the autumn after Republican legislators unveiled a preliminary outline for overhauling the nation’s tax code. The initial proposals eliminated municipal issuers’ ability to advance refund outstanding debt, and it stripped private activity bonds (PABs) of their tax-exempt status. The surprise inclusion of the two provisions initially fueled a market rally as investors anticipated a dramatic reduction in future supply. However, municipalities responded to the proposed tax bill by pulling forward an estimated $35 billion of new bond issuance into December in an effort to beat any negative consequences from the potential changes. Fourth-quarter supply therefore jumped to the highest level in history, weighing on prices. The final bill, signed into law on December 22, spared PABs and only marginally reduced top personal tax rates.
Municipal bonds nevertheless remained under pressure in early 2018 as expectations for higher inflation weighed heavily on all segments of the fixed-income market. Investors worried that the introduction of fiscal stimulus, coming at a time when the economy appeared to be operating near full capacity, would force the Fed to raise interest rates further and faster than expected in order to tame inflation. The 10-year U.S. Treasury yield rose sharply during the first half of the quarter as a result, and municipal yields followed suit. Tax reform lessened the value proposition of municipals for banks and insurance companies, leading some to reduce their holdings of municipal bonds, but this potential headwind was offset by a sharp reduction in supply stemming from the surge of new issuance in December. This factor, together with a slowing rate of increase in Treasury yields late in the period, helped stabilize the municipal bond market in March and April. Still, the broad-based national indexes closed roughly flat for the full 12 months due to the earlier sell-off. Lower quality bonds outpaced higher quality issues, reflecting investors’ ongoing search for yield.
South Carolina’s robust economy contributed to positive market performance
South Carolina experienced healthy growth relative to the nation as a whole, which continued a trend that has been in place for several years. Strength in the auto, manufacturing and healthcare industries has helped keep the unemployment rate below 4%, which in turn has fueled gains in the housing market. In addition, the state has benefited from positive population trends due to healthy in-migration.
The South Carolina intermediate municipal market outperformed the national intermediate market. The majority of strong performance came from bonds related to the South Carolina Public Service Authority (Santee Cooper) and its project to develop nuclear power plants. Santee Cooper and Piedmont Municipal Power Agency, which combine to make up roughly 30% of the state’s intermediate index, outpaced the national market by a wide margin after concerns about the nuclear project subsided. The hospital sector, which has an average rating of single A, also performed well due to investors’ preference for higher yielding, lower quality securities within the investment-grade segment.
| 4 | Columbia AMT-Free South Carolina Intermediate Muni Bond Fund | Annual Report 2018 |
Manager Discussion of Fund Performance (continued)
Contributors and detractors
The Fund benefited from the strong returns of the A rated public power, hospital and local appropriation sectors. Positions in longer maturity local appropriation issues were particularly important for relative performance, as it was the Fund’s largest sector weighting. The South Carolina municipal market presents an abundance of opportunities to invest in local appropriation issues, as they are a common component of municipal financing in the state.
The Fund’s allocation to shorter maturity, transportation-related issues was one of the few drags on performance. These positions, which mature in four years on average, lagged due to the general underperformance of bonds in the two- to eight-year maturity range. The Fund has one local appropriation position in the BBB underlying rating category. While the position outperformed the national index as a whole, it lagged similarly rated securities at the national level due to the robust performance of Illinois and New Jersey.
Fund positioning
Our strategy was largely unchanged during the period. We retained an overweight in A and BBB rated securities, as we did not anticipate a dramatic widening of yield spreads versus higher quality debt. However, given that spreads are very tight for lower rated investment-grade issues, we remained on the lookout for opportunities to increase the portfolio’s credit quality when reinvesting the proceeds of maturing securities. We targeted a neutral duration profile — i.e., an interest-rate sensitivity in line with the benchmark — in order to maintain a balanced stance within the portfolio. The Fund’s positioning continues to reflect our expectation for gradual Fed tightening and a flattening bias to the yield curve.
At period end, we believed South Carolina’s credit profile was generally stable. While the state economy had recovered well, it may be somewhat hampered in the long run by generally weaker demographics (including below-average per capita income and low educational attainment) and a focus on low-value-added manufacturing, which tends to be economically sensitive. The manufacturing base could also be affected to the extent federal trade policy influences exports. While the state’s financial position was very strong and its debt was modest, pension and other post-employment benefits liabilities remained a potential long-term funding pressure.
Fixed-income securities present issuer default risk. The Fund invests substantially in municipal securities and will be affected by tax, legislative, regulatory, demographic or political changes, as well as changes impacting a state’s financial, economic or other conditions. A relatively small number of tax-exempt issuers may necessitate the Fund investing more heavily in a single issuer and, therefore, be more exposed to the risk of loss than a fund that invests more broadly. The value of the Fund’s portfolio may be more volatile than a more geographically diversified fund. Prepayment and extension risk exists because the timing of payments on a loan, bond or other investment may accelerate when interest rates fall or decelerate when interest rates rise which may reduce investment opportunities and potential returns. A rise in interest rates may result in a price decline of fixed-income instruments held by the Fund, negatively impacting its performance and NAV. Falling rates may result in the Fund investing in lower yielding debt instruments, lowering the Fund’s income and yield. These risks may be heightened for longer maturity and duration securities. Non-investment-grade (high-yield or junk) securities present greater price volatility and more risk to principal and income than higher rated securities. Market risk may affect a single issuer, sector of the economy, industry or the market as a whole. Federal and state tax rules apply to capital gain distributions and any gains or losses on sales. Income may be subject to state or local taxes. Liquidity risk is associated with the difficulty of selling underlying investments at a desirable time or price. See the Fund’s prospectus for more information on these and other risks.
The views expressed in this report reflect the current views of the respective parties. These views are not guarantees of future performance and involve certain risks, uncertainties and assumptions that are difficult to predict, so actual outcomes and results may differ significantly from the views expressed. These views are subject to change at any time based upon economic, market or other conditions and the respective parties disclaim any responsibility to update such views. These views may not be relied on as investment advice and, because investment decisions for a Columbia fund are based on numerous factors, may not be relied on as an indication of trading intent on behalf of any particular Columbia fund. References to specific securities should not be construed as a recommendation or investment advice.
Columbia AMT-Free South Carolina Intermediate Muni Bond Fund | Annual Report 2018
| 5 |
Understanding Your Fund’s Expenses
(Unaudited)
As an investor, you incur two types of costs. There are transaction costs, which generally include sales charges on purchases and may include redemption fees. There are also ongoing costs, which generally include management fees, distribution and/or service fees, and other fund expenses. The following information is intended to help you understand your ongoing costs (in dollars) of investing in the Fund and to help you compare these costs with the ongoing costs of investing in other mutual funds.
Analyzing your Fund’s expenses
To illustrate these ongoing costs, we have provided examples and calculated the expenses paid by investors in each share class of the Fund during the period. The actual and hypothetical information in the table is based on an initial investment of $1,000 at the beginning of the period indicated and held for the entire period. Expense information is calculated two ways and each method provides you with different information. The amount listed in the “Actual” column is calculated using the Fund’s actual operating expenses and total return for the period. You may use the Actual information, together with the amount invested, to estimate the expenses that you paid over the period. Simply divide your account value by $1,000 (for example, an $8,600 account value divided by $1,000 = 8.6), then multiply the results by the expenses paid during the period under the “Actual” column. The amount listed in the “Hypothetical” column assumes a 5% annual rate of return before expenses (which is not the Fund’s actual return) and then applies the Fund’s actual expense ratio for the period to the hypothetical return. You should not use the hypothetical account values and expenses to estimate either your actual account balance at the end of the period or the expenses you paid during the period. See “Compare with other funds” below for details on how to use the hypothetical data.
Compare with other funds
Since all mutual funds are required to include the same hypothetical calculations about expenses in shareholder reports, you can use this information to compare the ongoing cost of investing in the Fund with other funds. To do so, compare the hypothetical example with the 5% hypothetical examples that appear in the shareholder reports of other funds. As you compare hypothetical examples of other funds, it is important to note that hypothetical examples are meant to highlight the ongoing costs of investing in a fund only and do not reflect any transaction costs, such as sales charges, or redemption or exchange fees. Therefore, the hypothetical calculations are useful in comparing ongoing costs only, and will not help you determine the relative total costs of owning different funds. If transaction costs were included in these calculations, your costs would be higher.
| November 1, 2017 — April 30, 2018 |
| | Account value at the
beginning of the
period ($) | Account value at the
end of the
period ($) | Expenses paid during
the period ($) | Fund’s annualized
expense ratio (%) |
| | Actual | Hypothetical | Actual | Hypothetical | Actual | Hypothetical | Actual |
| Class A | 1,000.00 | 1,000.00 | 987.00 | 1,020.78 | 3.99 | 4.06 | 0.81 |
| Advisor Class | 1,000.00 | 1,000.00 | 988.30 | 1,022.02 | 2.76 | 2.81 | 0.56 |
| Class C | 1,000.00 | 1,000.00 | 982.40 | 1,017.06 | 7.67 | 7.80 | 1.56 |
| Institutional Class | 1,000.00 | 1,000.00 | 987.30 | 1,022.02 | 2.76 | 2.81 | 0.56 |
| Institutional 3 Class | 1,000.00 | 1,000.00 | 988.90 | 1,022.56 | 2.22 | 2.26 | 0.45 |
Expenses paid during the period are equal to the annualized expense ratio for each class as indicated above, multiplied by the average account value over the period and then multiplied by the number of days in the Fund’s most recent fiscal half year and divided by 365.
Expenses do not include fees and expenses incurred indirectly by the Fund from its investment in underlying funds, including affiliated and non-affiliated pooled investment vehicles, such as mutual funds and exchange-traded funds.
Had Columbia Management Investment Advisers, LLC and/or certain of its affiliates not waived/reimbursed certain fees and expenses, account value at the end of the period would have been reduced.
| 6 | Columbia AMT-Free South Carolina Intermediate Muni Bond Fund | Annual Report 2018 |
Portfolio of Investments
April 30, 2018
(Percentages represent value of investments compared to net assets)
Investments in securities
| Municipal Bonds 94.9% |
| Issue Description | Coupon
Rate | | Principal
Amount ($) | Value ($) |
| Airport 1.1% |
| County of Horry Airport |
| Revenue Bonds |
| Series 2010A |
| 07/01/2020 | 5.000% | | 1,150,000 | 1,212,399 |
| Charter Schools 1.3% |
| South Carolina Jobs-Economic Development Authority(a) |
| Revenue Bonds |
| Series 2015A |
| 08/15/2035 | 5.125% | | 1,000,000 | 990,310 |
| South Carolina Jobs-Economic Development Authority |
| Revenue Bonds |
| York Preparatory Academy Project |
| Series 2014A |
| 11/01/2033 | 7.000% | | 500,000 | 528,225 |
| Total | 1,518,535 |
| Higher Education 7.5% |
| Clemson University |
| Revenue Bonds |
| Athletic Facility |
| Series 2014A |
| 05/01/2028 | 5.000% | | 1,170,000 | 1,342,949 |
| Coastal Carolina University |
| Revenue Bonds |
| Series 2015 |
| 06/01/2024 | 5.000% | | 1,500,000 | 1,694,925 |
| South Carolina Jobs-Economic Development Authority |
| Refunding Revenue Bonds |
| Furman University |
| Series 2015 |
| 10/01/2032 | 5.000% | | 1,895,000 | 2,151,943 |
| University of South Carolina |
| Refunding Revenue Bonds |
| Series 2017B |
| 05/01/2034 | 5.000% | | 1,500,000 | 1,714,680 |
| Revenue Bonds |
| Moore School of Business Project |
| Series 2012 |
| 05/01/2026 | 5.000% | | 1,500,000 | 1,650,810 |
| Total | 8,555,307 |
| Hospital 13.0% |
| County of Florence |
| Refunding Revenue Bonds |
| McLeod Regional Medical Center Project |
| Series 2014 |
| 11/01/2031 | 5.000% | | 1,500,000 | 1,675,905 |
| Municipal Bonds (continued) |
| Issue Description | Coupon
Rate | | Principal
Amount ($) | Value ($) |
| County of Greenwood |
| Refunding Revenue Bonds |
| Self Regional Healthcare |
| Series 2012B |
| 10/01/2027 | 5.000% | | 1,750,000 | 1,900,535 |
| 10/01/2031 | 5.000% | | 2,000,000 | 2,159,680 |
| Greenville Health System |
| Refunding Revenue Bonds |
| Series 2008A |
| 05/01/2021 | 5.250% | | 2,750,000 | 2,757,700 |
| Lexington County Health Services District, Inc. |
| Refunding Revenue Bonds |
| Lexington Medical Center Obligated Group |
| Series 2017 |
| 11/01/2032 | 4.000% | | 1,050,000 | 1,095,559 |
| Revenue Bonds |
| Lexington Medical Center |
| Series 2016 |
| 11/01/2034 | 5.000% | | 1,500,000 | 1,670,145 |
| South Carolina Jobs-Economic Development Authority |
| Refunding Revenue Bonds |
| Palmetto Health |
| Series 2005A (AGM) |
| 08/01/2021 | 5.250% | | 2,000,000 | 2,007,420 |
| Revenue Bonds |
| Bon Secours Health System, Inc. |
| Series 2013 |
| 11/01/2020 | 5.000% | | 1,000,000 | 1,069,190 |
| 11/01/2024 | 5.000% | | 450,000 | 496,967 |
| Total | 14,833,101 |
| Joint Power Authority 4.3% |
| South Carolina Public Service Authority |
| Refunding Revenue Bonds |
| Series 2014B |
| 12/01/2032 | 5.000% | | 1,250,000 | 1,355,425 |
| Series 2016A |
| 12/01/2028 | 5.000% | | 2,000,000 | 2,231,880 |
| Unrefunded Revenue Bonds |
| Series 2009A |
| 01/01/2028 | 5.000% | | 1,360,000 | 1,383,202 |
| Total | 4,970,507 |
| Local Appropriation 26.2% |
| Berkeley County School District |
| Refunding Revenue Bonds |
| Securing Assets for Education |
| Series 2015A |
| 12/01/2027 | 5.000% | | 1,500,000 | 1,680,885 |
The accompanying Notes to Financial Statements are an integral part of this statement.
Columbia AMT-Free South Carolina Intermediate Muni Bond Fund | Annual Report 2018
| 7 |
Portfolio of Investments (continued)
April 30, 2018
| Municipal Bonds (continued) |
| Issue Description | Coupon
Rate | | Principal
Amount ($) | Value ($) |
| Charleston Educational Excellence Finance Corp. |
| Refunding Revenue Bonds |
| Charleston County School |
| Series 2013 |
| 12/01/2025 | 5.000% | | 2,000,000 | 2,257,780 |
| Charleston Public Facilities Corp. |
| Revenue Bonds |
| Series 2015A |
| 09/01/2029 | 5.000% | | 1,000,000 | 1,156,320 |
| City of Florence Accommodations Fee |
| Revenue Bonds |
| Series 2015 |
| 05/01/2030 | 4.000% | | 1,000,000 | 1,051,080 |
| 05/01/2035 | 5.000% | | 1,000,000 | 1,120,030 |
| City of North Charleston |
| Revenue Bonds |
| Series 2012 |
| 06/01/2029 | 5.000% | | 2,280,000 | 2,480,366 |
| County of Florence |
| Revenue Bonds |
| Series 2015 |
| 10/01/2028 | 5.000% | | 1,000,000 | 1,104,490 |
| Dorchester County School District No. 2 |
| Refunding Revenue Bonds |
| Growth Installment Purchase |
| Series 2013 |
| 12/01/2027 | 5.000% | | 1,000,000 | 1,121,690 |
| Fort Mill School Facilities Corp. |
| Refunding Revenue Bonds |
| Fort Mills School District #4 |
| Series 2015 |
| 12/01/2028 | 5.000% | | 1,000,000 | 1,140,390 |
| Greenwood Fifty Schools Facilities, Inc. |
| Refunding Revenue Bonds |
| Greenwood School District #50 |
| Series 2016 (BAM) |
| 12/01/2027 | 5.000% | | 1,750,000 | 2,010,278 |
| Kershaw County School District |
| Refunding Revenue Bonds |
| Series 2015 |
| 12/01/2025 | 5.000% | | 1,000,000 | 1,147,830 |
| Lexington One School Facilities Corp. |
| Refunding Revenue Bonds |
| Lexington County School District |
| Series 2015 |
| 12/01/2026 | 5.000% | | 835,000 | 937,070 |
| Lexington School District No. 2 Educational Facilities Corp. |
| Refunding Revenue Bonds |
| Series 2015B |
| 12/01/2026 | 5.000% | | 1,815,000 | 2,041,276 |
| Municipal Bonds (continued) |
| Issue Description | Coupon
Rate | | Principal
Amount ($) | Value ($) |
| Newberry Investing in Children’s Education |
| Refunding Revenue Bonds |
| Newberry County School District |
| Series 2014 |
| 12/01/2029 | 5.000% | | 1,500,000 | 1,699,935 |
| SCAGO Educational Facilities Corp. for Calhoun School District |
| Refunding Revenue Bonds |
| Series 2015 (BAM) |
| 12/01/2026 | 5.000% | | 520,000 | 599,555 |
| SCAGO Educational Facilities Corp. for Cherokee School District No. 1 |
| Refunding Revenue Bonds |
| Series 2015 |
| 12/01/2028 | 5.000% | | 1,830,000 | 2,080,619 |
| SCAGO Educational Facilities Corp. for Colleton School District |
| Refunding Revenue Bonds |
| Series 2015 |
| 12/01/2027 | 5.000% | | 1,295,000 | 1,465,254 |
| SCAGO Educational Facilities Corp. for Pickens School District |
| Refunding Revenue Bonds |
| Series 2015 |
| 12/01/2029 | 5.000% | | 1,500,000 | 1,692,105 |
| 12/01/2030 | 5.000% | | 1,275,000 | 1,433,954 |
| Sumter Two School Facilities, Inc. |
| Refunding Revenue Bonds |
| Sumter County School District No. 2 |
| Series 2016 (BAM) |
| 12/01/2027 | 5.000% | | 1,500,000 | 1,684,725 |
| Total | 29,905,632 |
| Local General Obligation 4.2% |
| Anderson County School District No. 5 |
| Unlimited General Obligation Bonds |
| South Carolina School District Credit Enhancement Program |
| Series 2017 |
| 03/01/2030 | 4.000% | | 2,245,000 | 2,447,072 |
| Beaufort County School District |
| Unlimited General Obligation Bonds |
| Series 2014B |
| 03/01/2023 | 5.000% | | 1,190,000 | 1,338,381 |
| South Carolina Jobs-Economic Development Authority |
| Refunding Revenue Bonds |
| Series 2015 |
| 04/01/2034 | 5.000% | | 940,000 | 1,051,597 |
| Total | 4,837,050 |
| Municipal Power 2.4% |
| City of Rock Hill Combined Utility System |
| Refunding Revenue Bonds |
| Series 2012A (AGM) |
| 01/01/2023 | 5.000% | | 1,560,000 | 1,700,260 |
The accompanying Notes to Financial Statements are an integral part of this statement.
| 8 | Columbia AMT-Free South Carolina Intermediate Muni Bond Fund | Annual Report 2018 |
Portfolio of Investments (continued)
April 30, 2018
| Municipal Bonds (continued) |
| Issue Description | Coupon
Rate | | Principal
Amount ($) | Value ($) |
| Easley Combined Utility System |
| Refunding Revenue Bonds |
| Series 2011 (AGM) |
| 12/01/2028 | 5.000% | | 1,000,000 | 1,017,560 |
| Total | 2,717,820 |
| Ports 0.9% |
| South Carolina Ports Authority |
| Revenue Bonds |
| Series 2010 |
| 07/01/2023 | 5.250% | | 1,000,000 | 1,067,360 |
| Refunded / Escrowed 5.5% |
| Anderson Regional Joint Water System |
| Prerefunded 07/15/22 Revenue Bonds |
| Series 2012 |
| 07/15/2028 | 5.000% | | 2,000,000 | 2,228,680 |
| City of Columbia Waterworks & Sewer System |
| Prerefunded 02/01/21 Revenue Bonds |
| Series 2011A |
| 02/01/2027 | 5.000% | | 1,000,000 | 1,079,220 |
| County of Charleston |
| Prerefunded 08/01/19 Unlimited General Obligation Bonds |
| Improvement |
| Series 2009A |
| 08/01/2023 | 5.000% | | 1,000,000 | 1,038,880 |
| South Carolina Jobs-Economic Development Authority |
| Prerefunded 09/15/18 Revenue Bonds |
| Kershaw County Medical Center Project |
| Series 2008 |
| 09/15/2025 | 5.500% | | 1,925,000 | 1,951,411 |
| Total | 6,298,191 |
| Resource Recovery 2.6% |
| Three Rivers Solid Waste Authority(b) |
| Revenue Bonds |
| Capital Appreciation-Landfill Gas Project |
| Series 2007 |
| 10/01/2024 | 0.000% | | 1,835,000 | 1,498,828 |
| 10/01/2025 | 0.000% | | 1,835,000 | 1,441,723 |
| Total | 2,940,551 |
| Retirement Communities 0.8% |
| South Carolina Jobs-Economic Development Authority(a) |
| Refunding Revenue Bonds |
| Wesley Commons |
| Series 2016 |
| 10/01/2026 | 5.000% | | 920,000 | 960,406 |
| Municipal Bonds (continued) |
| Issue Description | Coupon
Rate | | Principal
Amount ($) | Value ($) |
| Single Family 0.1% |
| South Carolina State Housing Finance & Development Authority |
| Revenue Bonds |
| Series 2010-1 (GNMA) |
| 01/01/2028 | 5.000% | | 145,000 | 146,783 |
| Special Non Property Tax 6.5% |
| City of Columbia |
| Revenue Bonds |
| Series 2014 |
| 02/01/2033 | 5.000% | | 1,195,000 | 1,332,282 |
| City of Greenville Hospitality Tax |
| Improvement Refunding Revenue Bonds |
| Series 2011 (AGM) |
| 04/01/2021 | 5.000% | | 1,290,000 | 1,387,975 |
| City of Myrtle Beach |
| Revenue Bonds |
| Hospitality Fee |
| Series 2014B |
| 06/01/2030 | 5.000% | | 560,000 | 622,804 |
| City of Rock Hill |
| Revenue Bonds |
| Hospitality Fee Pledge |
| Series 2013 |
| 04/01/2023 | 5.000% | | 695,000 | 773,500 |
| Greenville County Public Facilities Corp. |
| Refunding Certificate of Participation |
| Series 2014 |
| 04/01/2026 | 5.000% | | 890,000 | 998,073 |
| Spartanburg County Tourist Public Facilities Corp. |
| Refunding Certificate of Participation |
| Public Facilities Corp. |
| Series 2016 (BAM) |
| 04/01/2028 | 4.000% | | 580,000 | 619,736 |
| Town of Hilton Head Island |
| Revenue Bonds |
| Beach Preservation Fee Pledge |
| Series 2017 |
| 08/01/2025 | 5.000% | | 400,000 | 462,736 |
| Series 2011A |
| 06/01/2023 | 5.000% | | 555,000 | 600,860 |
| 06/01/2024 | 5.000% | | 580,000 | 627,026 |
| Total | 7,424,992 |
| Special Property Tax 1.0% |
| City of Myrtle Beach |
| Refunding Tax Allocation Bonds |
| Myrtle Beach Air Force Base |
| Series 2016 |
| 10/01/2030 | 5.000% | | 1,000,000 | 1,123,980 |
The accompanying Notes to Financial Statements are an integral part of this statement.
Columbia AMT-Free South Carolina Intermediate Muni Bond Fund | Annual Report 2018
| 9 |
Portfolio of Investments (continued)
April 30, 2018
| Municipal Bonds (continued) |
| Issue Description | Coupon
Rate | | Principal
Amount ($) | Value ($) |
| State General Obligation 1.0% |
| State of South Carolina |
| Unlimited General Obligation Bonds |
| Series 2014B |
| 04/01/2025 | 5.000% | | 1,000,000 | 1,144,310 |
| Student Loan 1.1% |
| South Carolina State Education Assistance Authority |
| Revenue Bonds |
| Student Loan |
| Series 2009I |
| 10/01/2024 | 5.000% | | 1,210,000 | 1,241,194 |
| Transportation 6.6% |
| South Carolina Transportation Infrastructure Bank |
| Refunding Revenue Bonds |
| Infrastructure Bank |
| Series 2015A |
| 10/01/2024 | 5.000% | | 2,000,000 | 2,283,100 |
| Series 2005A (AMBAC) |
| 10/01/2020 | 5.250% | | 4,880,000 | 5,243,462 |
| Total | 7,526,562 |
| Water & Sewer 8.8% |
| Beaufort-Jasper Water & Sewer Authority |
| Refunding Revenue Bonds |
| Series 2016B |
| 03/01/2024 | 5.000% | | 1,000,000 | 1,142,400 |
| City of Spartanburg Water System |
| Refunding Revenue Bonds |
| Series 2017B |
| 06/01/2035 | 4.000% | | 1,375,000 | 1,438,965 |
| City of Sumter Waterworks & Sewer System |
| Refunding Revenue Bonds |
| Series 2015 |
| 12/01/2027 | 4.000% | | 400,000 | 430,872 |
| County of Berkeley Water & Sewer |
| Refunding Revenue Bonds |
| Series 2008A (AGM) |
| 06/01/2021 | 5.000% | | 1,000,000 | 1,002,190 |
| Municipal Bonds (continued) |
| Issue Description | Coupon
Rate | | Principal
Amount ($) | Value ($) |
| Georgetown County Water & Sewer District |
| Refunding Revenue Bonds |
| Series 2015 |
| 06/01/2027 | 4.000% | | 450,000 | 478,508 |
| Renewable Water Resources |
| Refunding Revenue Bonds |
| Series 2005B (AGM) |
| 03/01/2019 | 5.250% | | 1,000,000 | 1,028,880 |
| Series 2010A |
| 01/01/2020 | 5.000% | | 1,500,000 | 1,576,530 |
| Series 2012 |
| 01/01/2024 | 5.000% | | 1,000,000 | 1,097,280 |
| Spartanburg Sanitation Sewer District |
| Refunding Revenue Bonds |
| Series 2014B |
| 03/01/2034 | 5.000% | | 1,000,000 | 1,118,070 |
| Town of Lexington Waterworks & Sewer System |
| Refunding Revenue Bonds |
| Series 2017 |
| 06/01/2034 | 4.000% | | 750,000 | 798,007 |
| Total | 10,111,702 |
Total Municipal Bonds
(Cost $107,193,075) | 108,536,382 |
| Money Market Funds 2.0% |
| | Shares | Value ($) |
| Dreyfus Tax-Exempt Cash Management Fund, Institutional Shares, 1.450%(c) | 2,261,891 | 2,261,891 |
Total Money Market Funds
(Cost $2,261,891) | 2,261,891 |
Total Investments in Securities
(Cost: $109,454,966) | 110,798,273 |
| Other Assets & Liabilities, Net | | 3,515,104 |
| Net Assets | 114,313,377 |
Notes to Portfolio of Investments
| (a) | Represents privately placed and other securities and instruments exempt from SEC registration (collectively, private placements), such as Section 4(a)(2) and Rule 144A eligible securities, which are often sold only to qualified institutional buyers. The Fund may invest in private placements determined to be liquid as well as those determined to be illiquid. Private placements may be determined to be liquid under guidelines established by the Fund’s Board of Trustees. At April 30, 2018, the value of these securities amounted to $1,950,716, which represents 1.71% of net assets. |
| (b) | Zero coupon bond. |
| (c) | The rate shown is the seven-day current annualized yield at April 30, 2018. |
The accompanying Notes to Financial Statements are an integral part of this statement.
| 10 | Columbia AMT-Free South Carolina Intermediate Muni Bond Fund | Annual Report 2018 |
Portfolio of Investments (continued)
April 30, 2018
Abbreviation Legend
| AGM | Assured Guaranty Municipal Corporation |
| AMBAC | Ambac Assurance Corporation |
| BAM | Build America Mutual Assurance Co. |
| GNMA | Government National Mortgage Association |
Fair value measurements
The Fund categorizes its fair value measurements according to a three-level hierarchy that maximizes the use of observable inputs and minimizes the use of unobservable inputs by prioritizing that the most observable input be used when available. Observable inputs are those that market participants would use in pricing an investment based on market data obtained from sources independent of the reporting entity. Unobservable inputs are those that reflect the Fund’s assumptions about the information market participants would use in pricing an investment. An investment’s level within the fair value hierarchy is based on the lowest level of any input that is deemed significant to the asset’s or liability’s fair value measurement. The input levels are not necessarily an indication of the risk or liquidity associated with investments at that level. For example, certain U.S. government securities are generally high quality and liquid, however, they are reflected as Level 2 because the inputs used to determine fair value may not always be quoted prices in an active market.
Fair value inputs are summarized in the three broad levels listed below:
| ■ | Level 1 — Valuations based on quoted prices for investments in active markets that the Fund has the ability to access at the measurement date. Valuation adjustments are not applied to Level 1 investments. |
| ■ | Level 2 — Valuations based on other significant observable inputs (including quoted prices for similar securities, interest rates, prepayment speeds, credit risks, etc.). |
| ■ | Level 3 — Valuations based on significant unobservable inputs (including the Fund’s own assumptions and judgment in determining the fair value of investments). |
Inputs that are used in determining fair value of an investment may include price information, credit data, volatility statistics, and other factors. These inputs can be either observable or unobservable. The availability of observable inputs can vary between investments, and is affected by various factors such as the type of investment, and the volume and level of activity for that investment or similar investments in the marketplace. The inputs will be considered by the Investment Manager, along with any other relevant factors in the calculation of an investment’s fair value. The Fund uses prices and inputs that are current as of the measurement date, which may include periods of market dislocations. During these periods, the availability of prices and inputs may be reduced for many investments. This condition could cause an investment to be reclassified between the various levels within the hierarchy.
Investments falling into the Level 3 category are primarily supported by quoted prices from brokers and dealers participating in the market for those investments. However, these may be classified as Level 3 investments due to lack of market transparency and corroboration to support these quoted prices. Additionally, valuation models may be used as the pricing source for any remaining investments classified as Level 3. These models may rely on one or more significant unobservable inputs and/or significant assumptions by the Investment Manager. Inputs used in valuations may include, but are not limited to, financial statement analysis, capital account balances, discount rates and estimated cash flows, and comparable company data.
Under the direction of the Fund’s Board of Trustees (the Board), the Investment Manager’s Valuation Committee (the Committee) is responsible for overseeing the valuation procedures approved by the Board. The Committee consists of voting and non-voting members from various groups within the Investment Manager’s organization, including operations and accounting, trading and investments, compliance, risk management and legal.
The Committee meets at least monthly to review and approve valuation matters, which may include a description of specific valuation determinations, data regarding pricing information received from approved pricing vendors and brokers and the results of Board-approved valuation control policies and procedures (the Policies). The Policies address, among other things, instances when market quotations are or are not readily available, including recommendations of third party pricing vendors and a determination of appropriate pricing methodologies; events that require specific valuation determinations and assessment of fair value techniques; securities with a potential for stale pricing, including those that are illiquid, restricted, or in default; and the effectiveness of third party pricing vendors, including periodic reviews of vendors. The Committee meets more frequently, as needed, to discuss additional valuation matters, which may include the need to review back-testing results, review time-sensitive information or approve related valuation actions. The Committee reports to the Board, with members of the Committee meeting with the Board at each of its regularly scheduled meetings to discuss valuation matters and actions during the period, similar to those described earlier.
For investments categorized as Level 3, the Committee monitors information similar to that described above, which may include: (i) data specific to the issuer or comparable issuers, (ii) general market or specific sector news and (iii) quoted prices and specific or similar security transactions. The Committee considers this data and any changes from prior periods in order to assess the reasonableness of observable and unobservable inputs, any assumptions or internal models used to value those securities and changes in fair value. This data is also used to corroborate, when available, information received from approved pricing vendors and brokers. Various factors impact the frequency of monitoring this information (which may occur as often as daily). However, the Committee may determine that changes to inputs, assumptions and models are not required as a result of the monitoring procedures performed.
The following table is a summary of the inputs used to value the Fund’s investments at April 30, 2018:
| | Level 1
quoted prices in active
markets for identical
assets ($) | Level 2
other significant
observable inputs ($) | Level 3
significant
unobservable inputs ($) | Total ($) |
| Investments in Securities | | | | |
| Municipal Bonds | — | 108,536,382 | — | 108,536,382 |
| Money Market Funds | 2,261,891 | — | — | 2,261,891 |
| Total Investments in Securities | 2,261,891 | 108,536,382 | — | 110,798,273 |
See the Portfolio of Investments for all investment classifications not indicated in the table.
The Fund’s assets assigned to the Level 2 input category are generally valued using the market approach, in which a security’s value is determined through reference to prices and information from market transactions for similar or identical assets.
The accompanying Notes to Financial Statements are an integral part of this statement.
Columbia AMT-Free South Carolina Intermediate Muni Bond Fund | Annual Report 2018
| 11 |
Portfolio of Investments (continued)
April 30, 2018
Fair value measurements (continued)
There were no transfers of financial assets between levels during the period.
The accompanying Notes to Financial Statements are an integral part of this statement.
| 12 | Columbia AMT-Free South Carolina Intermediate Muni Bond Fund | Annual Report 2018 |
Statement of Assets and Liabilities
April 30, 2018
| Assets | |
| Investments in securities, at value | |
| Unaffiliated issuers (cost $109,454,966) | $110,798,273 |
| Cash | 2,380,187 |
| Receivable for: | |
| Investments sold | 15,250 |
| Capital shares sold | 107,642 |
| Interest | 1,458,206 |
| Expense reimbursement due from Investment Manager | 1,009 |
| Prepaid expenses | 593 |
| Total assets | 114,761,160 |
| Liabilities | |
| Payable for: | |
| Capital shares purchased | 45,016 |
| Distributions to shareholders | 237,255 |
| Management services fees | 4,415 |
| Distribution and/or service fees | 1,356 |
| Transfer agent fees | 14,486 |
| Compensation of board members | 108,747 |
| Audit fees | 31,520 |
| Other expenses | 4,988 |
| Total liabilities | 447,783 |
| Net assets applicable to outstanding capital stock | $114,313,377 |
| Represented by | |
| Paid in capital | 113,054,554 |
| Undistributed net investment income | 245,636 |
| Accumulated net realized loss | (330,120) |
| Unrealized appreciation (depreciation) on: | |
| Investments - unaffiliated issuers | 1,343,307 |
| Total - representing net assets applicable to outstanding capital stock | $114,313,377 |
| Class A | |
| Net assets | $23,049,894 |
| Shares outstanding | 2,319,243 |
| Net asset value per share | $9.94 |
| Maximum sales charge | 3.00% |
| Maximum offering price per share (calculated by dividing the net asset value per share by 1.0 minus the maximum sales charge for Class A shares) | $10.25 |
| Advisor Class | |
| Net assets | $1,984,464 |
| Shares outstanding | 199,731 |
| Net asset value per share | $9.94 |
| Class C | |
| Net assets | $10,758,801 |
| Shares outstanding | 1,081,846 |
| Net asset value per share | $9.94 |
| Institutional Class | |
| Net assets | $77,773,398 |
| Shares outstanding | 7,821,936 |
| Net asset value per share | $9.94 |
| Institutional 3 Class | |
| Net assets | $746,820 |
| Shares outstanding | 74,858 |
| Net asset value per share | $9.98 |
The accompanying Notes to Financial Statements are an integral part of this statement.
Columbia AMT-Free South Carolina Intermediate Muni Bond Fund | Annual Report 2018
| 13 |
Statement of Operations
Year Ended April 30, 2018
| Net investment income | |
| Income: | |
| Dividends — unaffiliated issuers | $10,830 |
| Interest | 3,818,486 |
| Total income | 3,829,316 |
| Expenses: | |
| Management services fees | 559,179 |
| Distribution and/or service fees | |
| Class A | 55,286 |
| Class B | 26 |
| Class C | 123,527 |
| Transfer agent fees | |
| Class A | 29,616 |
| Advisor Class | 1,978 |
| Class B | 3 |
| Class C | 16,553 |
| Institutional Class | 110,557 |
| Institutional 3 Class | 91 |
| Compensation of board members | 23,277 |
| Custodian fees | 2,148 |
| Printing and postage fees | 10,807 |
| Registration fees | 370 |
| Audit fees | 31,520 |
| Legal fees | 8,136 |
| Compensation of chief compliance officer | 25 |
| Other | 11,261 |
| Total expenses | 984,360 |
| Fees waived or expenses reimbursed by Investment Manager and its affiliates | (140,635) |
| Expense reduction | (20) |
| Total net expenses | 843,705 |
| Net investment income | 2,985,611 |
| Realized and unrealized gain (loss) — net | |
| Net realized gain (loss) on: | |
| Investments — unaffiliated issuers | 28,612 |
| Net realized gain | 28,612 |
| Net change in unrealized appreciation (depreciation) on: | |
| Investments — unaffiliated issuers | (2,297,426) |
| Net change in unrealized appreciation (depreciation) | (2,297,426) |
| Net realized and unrealized loss | (2,268,814) |
| Net increase in net assets resulting from operations | $716,797 |
The accompanying Notes to Financial Statements are an integral part of this statement.
| 14 | Columbia AMT-Free South Carolina Intermediate Muni Bond Fund | Annual Report 2018 |
Statement of Changes in Net Assets
| | Year Ended
April 30, 2018 | Year Ended
April 30, 2017 (a) |
| Operations | | |
| Net investment income | $2,985,611 | $3,528,613 |
| Net realized gain (loss) | 28,612 | (292,352) |
| Net change in unrealized appreciation (depreciation) | (2,297,426) | (5,107,583) |
| Net increase (decrease) in net assets resulting from operations | 716,797 | (1,871,322) |
| Distributions to shareholders | | |
| Net investment income | | |
| Class A | (575,811) | (626,804) |
| Advisor Class | (41,779) | (29,497) |
| Class B | (44) | (229) |
| Class C | (230,029) | (284,374) |
| Institutional Class | (2,357,405) | (2,893,513) |
| Institutional 3 Class | (13,721) | (50) |
| Net realized gains | | |
| Class A | — | (21,761) |
| Advisor Class | — | (858) |
| Class B | — | (10) |
| Class C | — | (14,040) |
| Institutional Class | — | (98,365) |
| Total distributions to shareholders | (3,218,789) | (3,969,501) |
| Decrease in net assets from capital stock activity | (3,335,695) | (17,015,022) |
| Total decrease in net assets | (5,837,687) | (22,855,845) |
| Net assets at beginning of year | 120,151,064 | 143,006,909 |
| Net assets at end of year | $114,313,377 | $120,151,064 |
| Undistributed net investment income | $245,636 | $478,849 |
| (a) | Institutional 3 Class shares are based on operations from March 1, 2017 (commencement of operations) through the stated period end. |
The accompanying Notes to Financial Statements are an integral part of this statement.
Columbia AMT-Free South Carolina Intermediate Muni Bond Fund | Annual Report 2018
| 15 |
Statement of Changes in Net Assets (continued)
| | Year Ended | Year Ended |
| | April 30, 2018 | April 30, 2017 (a) |
| | Shares | Dollars ($) | Shares | Dollars ($) |
| Capital stock activity |
| Class A | | | | |
| Subscriptions | 494,660 | 5,002,483 | 739,754 | 7,679,830 |
| Distributions reinvested | 44,160 | 448,031 | 51,043 | 525,331 |
| Redemptions | (334,897) | (3,400,794) | (758,007) | (7,736,451) |
| Net increase | 203,923 | 2,049,720 | 32,790 | 468,710 |
| Advisor Class | | | | |
| Subscriptions | 95,247 | 968,400 | 74,650 | 772,282 |
| Distributions reinvested | 4,102 | 41,498 | 2,924 | 30,054 |
| Redemptions | (18,261) | (183,610) | (30,776) | (310,923) |
| Net increase | 81,088 | 826,288 | 46,798 | 491,413 |
| Class B | | | | |
| Distributions reinvested | — | — | 2 | 25 |
| Redemptions | (965) | (9,865) | (1,554) | (16,499) |
| Net decrease | (965) | (9,865) | (1,552) | (16,474) |
| Class C | | | | |
| Subscriptions | 54,342 | 552,727 | 154,232 | 1,608,614 |
| Distributions reinvested | 17,748 | 180,346 | 21,705 | 223,288 |
| Redemptions | (337,944) | (3,434,290) | (253,768) | (2,603,985) |
| Net decrease | (265,854) | (2,701,217) | (77,831) | (772,083) |
| Institutional Class | | | | |
| Subscriptions | 1,366,064 | 13,824,080 | 2,820,656 | 28,977,425 |
| Distributions reinvested | 60,784 | 617,249 | 46,778 | 481,388 |
| Redemptions | (1,845,954) | (18,703,040) | (4,592,797) | (46,655,401) |
| Net decrease | (419,106) | (4,261,711) | (1,725,363) | (17,196,588) |
| Institutional 3 Class | | | | |
| Subscriptions | 83,639 | 859,459 | 987 | 10,000 |
| Distributions reinvested | 1,326 | 13,420 | — | — |
| Redemptions | (11,094) | (111,789) | — | — |
| Net increase | 73,871 | 761,090 | 987 | 10,000 |
| Total net decrease | (327,043) | (3,335,695) | (1,724,171) | (17,015,022) |
| (a) | Institutional 3 Class shares are based on operations from March 1, 2017 (commencement of operations) through the stated period end. |
The accompanying Notes to Financial Statements are an integral part of this statement.
| 16 | Columbia AMT-Free South Carolina Intermediate Muni Bond Fund | Annual Report 2018 |
[THIS PAGE INTENTIONALLY LEFT BLANK]
Columbia AMT-Free South Carolina Intermediate Muni Bond Fund | Annual Report 2018
| 17 |
The following table is intended to help you understand the Fund’s financial performance. Certain information reflects financial results for a single share of a class held for the periods shown. Per share net investment income (loss) amounts are calculated based on average shares outstanding during the period. Total return assumes reinvestment of all dividends and distributions, if any. Total return does not reflect payment of sales charges, if any. Total return and portfolio turnover are not annualized for periods of less than one year. The portfolio turnover rate is calculated without regard to purchase and sales transactions of short-term instruments and certain derivatives, if any. If such transactions were included, the Fund’s portfolio turnover rate may be higher.
| | Net asset value,
beginning of
period | Net
investment
income | Net
realized
and
unrealized
gain (loss) | Total from
investment
operations | Distributions
from net
investment
income | Distributions
from net
realized
gains |
| Class A |
| Year Ended 4/30/2018 | $10.16 | 0.25 | (0.20) | 0.05 | (0.27) | — |
| Year Ended 4/30/2017 | $10.55 | 0.25 | (0.35) | (0.10) | (0.28) | (0.01) |
| Year Ended 4/30/2016 | $10.44 | 0.28 | 0.16 | 0.44 | (0.30) | (0.03) |
| Year Ended 4/30/2015 | $10.49 | 0.30 | 0.02 (d) | 0.32 | (0.30) | (0.07) |
| Year Ended 4/30/2014 | $10.89 | 0.32 | (0.40) | (0.08) | (0.31) | (0.01) |
| Advisor Class |
| Year Ended 4/30/2018 | $10.15 | 0.27 | (0.19) | 0.08 | (0.29) | — |
| Year Ended 4/30/2017 | $10.54 | 0.28 | (0.36) | (0.08) | (0.30) | (0.01) |
| Year Ended 4/30/2016 | $10.43 | 0.30 | 0.17 | 0.47 | (0.33) | (0.03) |
| Year Ended 4/30/2015 | $10.49 | 0.33 | 0.00 (d),(e) | 0.33 | (0.32) | (0.07) |
| Year Ended 4/30/2014 | $10.88 | 0.34 | (0.38) | (0.04) | (0.34) | (0.01) |
| Class C |
| Year Ended 4/30/2018 | $10.16 | 0.17 | (0.20) | (0.03) | (0.19) | — |
| Year Ended 4/30/2017 | $10.56 | 0.18 | (0.37) | (0.19) | (0.20) | (0.01) |
| Year Ended 4/30/2016 | $10.44 | 0.20 | 0.18 | 0.38 | (0.23) | (0.03) |
| Year Ended 4/30/2015 | $10.50 | 0.22 | 0.01 (d) | 0.23 | (0.22) | (0.07) |
| Year Ended 4/30/2014 | $10.89 | 0.24 | (0.39) | (0.15) | (0.23) | (0.01) |
| Institutional Class |
| Year Ended 4/30/2018 | $10.16 | 0.27 | (0.20) | 0.07 | (0.29) | — |
| Year Ended 4/30/2017 | $10.56 | 0.28 | (0.37) | (0.09) | (0.30) | (0.01) |
| Year Ended 4/30/2016 | $10.44 | 0.31 | 0.17 | 0.48 | (0.33) | (0.03) |
| Year Ended 4/30/2015 | $10.50 | 0.33 | 0.00 (d),(e) | 0.33 | (0.32) | (0.07) |
| Year Ended 4/30/2014 | $10.89 | 0.34 | (0.38) | (0.04) | (0.34) | (0.01) |
| Institutional 3 Class |
| Year Ended 4/30/2018 | $10.19 | 0.28 | (0.19) | 0.09 | (0.30) | — |
| Year Ended 4/30/2017(f) | $10.13 | 0.05 | 0.06 (d) | 0.11 | (0.05) | — |
| Notes to Financial Highlights |
| (a) | In addition to the fees and expenses that the Fund bears directly, the Fund indirectly bears a pro rata share of the fees and expenses of any other funds in which it invests. Such indirect expenses are not included in the Fund’s reported expense ratios. |
| (b) | Total net expenses include the impact of certain fee waivers/expense reimbursements made by the Investment Manager and certain of its affiliates, if applicable. |
| (c) | The benefits derived from expense reductions had an impact of less than 0.01%. |
| (d) | Calculation of the net gain (loss) per share (both realized and unrealized) does not correlate to the aggregate realized and unrealized gain (loss) presented in the Statement of Operations due to the timing of subscriptions and redemptions of Fund shares in relation to fluctuations in the market value of the portfolio. |
| (e) | Rounds to zero. |
| (f) | Institutional 3 Class shares commenced operations on March 1, 2017. Per share data and total return reflect activity from that date. |
| (g) | Annualized. |
The accompanying Notes to Financial Statements are an integral part of this statement.
| 18 | Columbia AMT-Free South Carolina Intermediate Muni Bond Fund | Annual Report 2018 |
Total
distributions to
shareholders | Net
asset
value,
end of
period | Total
return | Total gross
expense
ratio to
average
net assets(a) | Total net
expense
ratio to
average
net assets(a),(b) | Net investment
income
ratio to
average
net assets | Portfolio
turnover | Net
assets,
end of
period
(000’s) |
| |
| (0.27) | $9.94 | 0.43% | 0.93% | 0.81% (c) | 2.41% | 7% | $23,050 |
| (0.29) | $10.16 | (0.98%) | 0.98% | 0.81% (c) | 2.45% | 11% | $21,486 |
| (0.33) | $10.55 | 4.33% | 0.99% | 0.81% | 2.69% | 16% | $21,972 |
| (0.37) | $10.44 | 3.05% | 1.00% | 0.81% | 2.85% | 16% | $23,975 |
| (0.32) | $10.49 | (0.66%) | 1.01% | 0.81% | 3.02% | 6% | $21,694 |
| |
| (0.29) | $9.94 | 0.78% | 0.68% | 0.56% (c) | 2.66% | 7% | $1,984 |
| (0.31) | $10.15 | (0.74%) | 0.73% | 0.56% (c) | 2.71% | 11% | $1,205 |
| (0.36) | $10.54 | 4.59% | 0.74% | 0.56% | 2.93% | 16% | $758 |
| (0.39) | $10.43 | 3.21% | 0.75% | 0.56% | 3.11% | 16% | $703 |
| (0.35) | $10.49 | (0.32%) | 0.79% | 0.56% | 3.34% | 6% | $604 |
| |
| (0.19) | $9.94 | (0.32%) | 1.68% | 1.56% (c) | 1.66% | 7% | $10,759 |
| (0.21) | $10.16 | (1.81%) | 1.73% | 1.56% (c) | 1.70% | 11% | $13,698 |
| (0.26) | $10.56 | 3.65% | 1.74% | 1.56% | 1.94% | 16% | $15,051 |
| (0.29) | $10.44 | 2.18% | 1.75% | 1.56% | 2.10% | 16% | $15,677 |
| (0.24) | $10.50 | (1.31%) | 1.76% | 1.56% | 2.28% | 6% | $13,871 |
| |
| (0.29) | $9.94 | 0.68% | 0.68% | 0.56% (c) | 2.66% | 7% | $77,773 |
| (0.31) | $10.16 | (0.83%) | 0.73% | 0.56% (c) | 2.70% | 11% | $83,743 |
| (0.36) | $10.56 | 4.69% | 0.74% | 0.56% | 2.93% | 16% | $105,200 |
| (0.39) | $10.44 | 3.21% | 0.75% | 0.56% | 3.10% | 16% | $94,697 |
| (0.35) | $10.50 | (0.32%) | 0.76% | 0.56% | 3.27% | 6% | $87,992 |
| |
| (0.30) | $9.98 | 0.91% | 0.56% | 0.45% | 2.79% | 7% | $747 |
| (0.05) | $10.19 | 1.09% | 0.57% (g) | 0.43% (g) | 2.85% (g) | 11% | $10 |
Columbia AMT-Free South Carolina Intermediate Muni Bond Fund | Annual Report 2018
| 19 |
Notes to Financial Statements
April 30, 2018
Note 1. Organization
Columbia AMT-Free South Carolina Intermediate Muni Bond Fund (the Fund), a series of Columbia Funds Series Trust (the Trust), is a diversified fund. The Trust is registered under the Investment Company Act of 1940, as amended (the 1940 Act), as an open-end management investment company organized as a Delaware statutory trust.
Fund shares
The Trust may issue an unlimited number of shares (without par value). Although all share classes generally have identical voting, dividend and liquidation rights, each share class votes separately when required by the Trust’s organizational documents or by law. Different share classes pay different distribution amounts to the extent the expenses of such share classes differ, and distributions in liquidation will be proportional to the net asset value of each share class. Each share class has its own expense and sales charge structure. The Fund offers each of the share classes identified below.
Class A shares are subject to a maximum front-end sales charge of 3.00% based on the initial investment amount. Class A shares purchased without an initial sales charge are subject to a contingent deferred sales charge (CDSC) of 0.75% on certain investments of $500,000 or more if redeemed within 12 months after purchase.
Advisor Class shares are not subject to sales charges and are generally available only to omnibus retirement plans and certain investors as described in the Fund’s prospectus. Prior to November 1, 2017, Advisor Class shares were known as Class R4 shares.
Class B shares of the Fund are no longer offered for sale. When available, Class B shares were subject to a maximum CDSC of 3.00% based upon the holding period after purchase. Effective July 17, 2017, Class B shares were automatically converted to Class A shares without a CDSC. On August 4, 2017, the capital owned by Columbia Management Investment Advisers, LLC in Class B shares was redeemed without a CDSC.
Class C shares are subject to a 1.00% CDSC on shares redeemed within 12 months after purchase.
Institutional Class shares are not subject to sales charges and are generally available only to eligible investors, which are subject to different investment minimums as described in the Fund’s prospectus. Prior to November 1, 2017, Institutional Class shares were known as Class Z shares.
Institutional 3 Class shares are not subject to sales charges and are available to institutional and certain other investors as described in the Fund’s prospectus. Prior to November 1, 2017, Institutional 3 Class shares were known as Class Y shares.
Note 2. Summary of significant accounting policies
Basis of preparation
The Fund is an investment company that applies the accounting and reporting guidance in the Financial Accounting Standards Board (FASB) Accounting Standards Codification Topic 946, Financial Services - Investment Companies (ASC 946). The financial statements are prepared in accordance with U.S. generally accepted accounting principles (GAAP), which requires management to make certain estimates and assumptions that affect the reported amounts of assets and liabilities, the disclosure of contingent assets and liabilities at the date of the financial statements and the reported amounts of income and expenses during the reporting period. Actual results could differ from those estimates.
The following is a summary of significant accounting policies followed by the Fund in the preparation of its financial statements.
Security valuation
Debt securities generally are valued by pricing services approved by the Board of Trustees based upon market transactions for normal, institutional-size trading units of similar securities. The services may use various pricing techniques that take into account, as applicable, factors such as yield, quality, coupon rate, maturity, type of issue, trading characteristics and other data, as well as approved independent broker-dealer quotes. Debt securities for which quotations are not readily available or
| 20 | Columbia AMT-Free South Carolina Intermediate Muni Bond Fund | Annual Report 2018 |
Notes to Financial Statements (continued)
April 30, 2018
not believed to be reflective of market value may also be valued based upon a bid quote from an approved independent broker-dealer. Debt securities maturing in 60 days or less are valued primarily at amortized cost value, unless this method results in a valuation that management believes does not approximate market value.
Investments in open-end investment companies, including money market funds, are valued at their latest net asset value.
Investments for which market quotations are not readily available, or that have quotations which management believes are not reflective of market value or reliable, are valued at fair value as determined in good faith under procedures approved by and under the general supervision of the Board of Trustees. If a security or class of securities (such as foreign securities) is valued at fair value, such value is likely to be different from the quoted or published price for the security.
The determination of fair value often requires significant judgment. To determine fair value, management may use assumptions including but not limited to future cash flows and estimated risk premiums. Multiple inputs from various sources may be used to determine fair value.
GAAP requires disclosure regarding the inputs and valuation techniques used to measure fair value and any changes in valuation inputs or techniques. In addition, investments shall be disclosed by major category. This information is disclosed following the Fund’s Portfolio of Investments.
Security transactions
Security transactions are accounted for on the trade date. Cost is determined and gains (losses) are based upon the specific identification method for both financial statement and federal income tax purposes.
Income recognition
Interest income is recorded on an accrual basis. Market premiums and discounts, including original issue discounts, are amortized and accreted, respectively, over the expected life of the security on all debt securities, unless otherwise noted.
The Fund may place a debt security on non-accrual status and reduce related interest income when it becomes probable that the interest will not be collected and the amount of uncollectible interest can be reasonably estimated. A defaulted debt security is removed from non-accrual status when the issuer resumes interest payments or when collectibility of interest is reasonably assured.
Dividend income is recorded on the ex-dividend date.
Expenses
General expenses of the Trust are allocated to the Fund and other funds of the Trust based upon relative net assets or other expense allocation methodologies determined by the nature of the expense. Expenses directly attributable to the Fund are charged to the Fund. Expenses directly attributable to a specific class of shares are charged to that share class.
Determination of class net asset value
All income, expenses (other than class-specific expenses, which are charged to that share class, as shown in the Statement of Operations) and realized and unrealized gains (losses) are allocated to each class of the Fund on a daily basis, based on the relative net assets of each class, for purposes of determining the net asset value of each class.
Federal income tax status
The Fund intends to qualify each year as a regulated investment company under Subchapter M of the Internal Revenue Code, as amended, and will distribute substantially all of its net tax-exempt and investment company taxable income and net capital gain, if any, for its tax year, and as such will not be subject to federal income taxes. In addition, the Fund intends to distribute in each calendar year substantially all of its ordinary income, capital gain net income and certain other amounts, if any, such that the Fund should not be subject to federal excise tax. Therefore, no federal income or excise tax provision is recorded.
Columbia AMT-Free South Carolina Intermediate Muni Bond Fund | Annual Report 2018
| 21 |
Notes to Financial Statements (continued)
April 30, 2018
Distributions to shareholders
Distributions from net investment income, if any, are declared daily and paid monthly. Net realized capital gains, if any, are distributed at least annually. Income distributions and capital gain distributions are determined in accordance with federal income tax regulations, which may differ from GAAP.
Guarantees and indemnifications
Under the Trust’s organizational documents and, in some cases, by contract, its officers and trustees are indemnified against certain liabilities arising out of the performance of their duties to the Trust or its funds. In addition, certain of the Fund’s contracts with its service providers contain general indemnification clauses. The Fund’s maximum exposure under these arrangements is unknown since the amount of any future claims that may be made against the Fund cannot be determined, and the Fund has no historical basis for predicting the likelihood of any such claims.
Recent accounting pronouncement
Accounting Standards Update 2017-08 Premium Amortization on Purchased Callable Debt Securities
In March 2017, the Financial Accounting Standards Board issued Accounting Standards Update (ASU) No. 2017-08 Premium Amortization on Purchased Callable Debt Securities. ASU No. 2017-08 updates the accounting standards to shorten the amortization period for certain purchased callable debt securities, held at a premium, to be amortized to the earliest call date. The update applies to securities with explicit, noncontingent call features that are callable at fixed prices and on preset dates. The standard is effective for annual periods beginning after December 15, 2018 and interim periods within those fiscal years. At this time, management is evaluating the implication of this guidance and the impact it will have on the financial statement amounts and footnote disclosures, if any.
Note 3. Fees and other transactions with affiliates
Management services fees
The Fund has entered into a Management Agreement with Columbia Management Investment Advisers, LLC (the Investment Manager), a wholly-owned subsidiary of Ameriprise Financial, Inc. (Ameriprise Financial). Under the Management Agreement, the Investment Manager provides the Fund with investment research and advice, as well as administrative and accounting services. The management services fee is an annual fee that is equal to a percentage of the Fund’s daily net assets that declines from 0.47% to 0.31% as the Fund’s net assets increase. The effective management services fee rate for the year ended April 30, 2018 was 0.47% of the Fund’s average daily net assets.
Compensation of board members
Members of the Board of Trustees who are not officers or employees of the Investment Manager or Ameriprise Financial are compensated for their services to the Fund as disclosed in the Statement of Operations. Under a Deferred Compensation Plan (the Plan), these members of the Board of Trustees may elect to defer payment of up to 100% of their compensation. Deferred amounts are treated as though equivalent dollar amounts had been invested in shares of certain funds managed by the Investment Manager. The Fund’s liability for these amounts is adjusted for market value changes and remains in the Fund until distributed in accordance with the Plan. All amounts payable under the Plan constitute a general unsecured obligation of the Fund.
Compensation of Chief Compliance Officer
The Board of Trustees has appointed a Chief Compliance Officer to the Fund in accordance with federal securities regulations. As disclosed in the Statement of Operations, a portion of the Chief Compliance Officer’s total compensation is allocated to the Fund, along with other allocations to affiliated funds governed by the Board of Trustees, based on relative net assets.
| 22 | Columbia AMT-Free South Carolina Intermediate Muni Bond Fund | Annual Report 2018 |
Notes to Financial Statements (continued)
April 30, 2018
Transfer agency fees
Under a Transfer and Dividend Disbursing Agent Agreement, Columbia Management Investment Services Corp. (the Transfer Agent), an affiliate of the Investment Manager and a wholly-owned subsidiary of Ameriprise Financial, is responsible for providing transfer agency services to the Fund. The Transfer Agent has contracted with DST Asset Manager Solutions, Inc. (DST) to serve as sub-transfer agent. The Transfer Agent pays the fees of DST for services as sub-transfer agent and DST is not entitled to reimbursement for such fees from the Fund (with the exception of out-of-pocket fees).
The Fund pays the Transfer Agent a monthly transfer agency fee based on the number or the average value of accounts, depending on the type of account. In addition, the Fund pays the Transfer Agent a fee for shareholder services based on the number of accounts or on a percentage of the average aggregate value of the Fund’s shares maintained in omnibus accounts up to the lesser of the amount charged by the financial intermediary or a cap established by the Board of Trustees from time to time.
The Transfer Agent also receives compensation from the Fund for various shareholder services and reimbursements for certain out-of-pocket fees. Effective August 1, 2017, total transfer agency fees for Institutional 3 Class shares are subject to an annual limitation of not more than 0.02% of the average daily net assets attributable to Institutional 3 Class shares. Prior to August 1, 2017, the limitation was 0.025% for Institutional 3 Class shares.
For the year ended April 30, 2018, the Fund’s effective transfer agency fee rates as a percentage of average daily net assets of each class were as follows:
| | Effective rate (%) |
| Class A | 0.13 |
| Advisor Class | 0.13 |
| Class B | 0.04 (a) |
| Class C | 0.13 |
| Institutional Class | 0.13 |
| Institutional 3 Class | 0.02 |
An annual minimum account balance fee of $20 may apply to certain accounts with a value below the applicable share class’s initial minimum investment requirements to reduce the impact of small accounts on transfer agency fees. These minimum account balance fees are remitted to the Fund and recorded as part of expense reductions in the Statement of Operations. For the year ended April 30, 2018, these minimum account balance fees reduced total expenses of the Fund by $20.
Distribution and service fees
The Fund has entered into an agreement with Columbia Management Investment Distributors, Inc. (the Distributor), an affiliate of the Investment Manager and a wholly-owned subsidiary of Ameriprise Financial, for distribution and shareholder services. The Board of Trustees has approved, and the Fund has adopted, distribution and shareholder service plans (the Plans) applicable to certain share classes, which set the distribution and service fees for the Fund. These fees are calculated daily and are intended to compensate the Distributor and/or eligible selling and/or servicing agents for selling shares of the Fund and providing services to investors.
Under the Plans, the Fund pays a monthly combined distribution and service fee to the Distributor at the maximum annual rate of 0.25% of the average daily net assets attributable to Class A shares of the Fund. Also under the Plans, the Fund pays a monthly service fee to the Distributor at the maximum annual rate of 0.25% of the average daily net assets attributable to Class B and Class C shares of the Fund and a monthly distribution fee to the Distributor at the maximum annual rate of 0.75% of the average daily net assets attributable to Class B and Class C shares of the Fund. As a result of all Class B shares of the Fund being redeemed or converted to Class A shares, August 4, 2017 was the last day the Fund paid a distribution and service fee for Class B shares.
Columbia AMT-Free South Carolina Intermediate Muni Bond Fund | Annual Report 2018
| 23 |
Notes to Financial Statements (continued)
April 30, 2018
Sales charges (unaudited)
Sales charges, including front-end charges and CDSCs, received by the Distributor for distributing Fund shares for the year ended April 30, 2018, if any, are listed below:
| | Amount ($) |
| Class A | 18,079 |
| Class C | 673 |
Expenses waived/reimbursed by the Investment Manager and its affiliates
The Investment Manager and certain of its affiliates have contractually agreed to waive fees and/or reimburse expenses (excluding certain fees and expenses described below) for the period(s) disclosed below, unless sooner terminated at the sole discretion of the Board of Trustees, so that the Fund’s net operating expenses, after giving effect to fees waived/expenses reimbursed and any balance credits and/or overdraft charges from the Fund’s custodian, do not exceed the following annual rate(s) as a percentage of the class’ average daily net assets:
| | September 1, 2017
through
August 31, 2018 | Prior to
September 1, 2017 |
| Class A | 0.81% | 0.81% |
| Advisor Class | 0.56 | 0.56 |
| Class C | 1.56 | 1.56 |
| Institutional Class | 0.56 | 0.56 |
| Institutional 3 Class | 0.45 | 0.43 |
Under the agreement governing these fee waivers and/or expense reimbursement arrangements, the following fees and expenses are excluded from the waiver/reimbursement commitment, and therefore will be paid by the Fund, if applicable: taxes (including foreign transaction taxes), expenses associated with investments in affiliated and non-affiliated pooled investment vehicles (including mutual funds and exchange-traded funds), transaction costs and brokerage commissions, costs related to any securities lending program, dividend expenses associated with securities sold short, inverse floater program fees and expenses, transaction charges and interest on borrowed money, interest, infrequent and/or unusual expenses and any other expenses the exclusion of which is specifically approved by the Board of Trustees. This agreement may be modified or amended only with approval from the Investment Manager, certain of its affiliates and the Fund. Any fees waived and/or expenses reimbursed under the expense reimbursement arrangements described above are not recoverable by the Investment Manager or its affiliates in future periods.
Note 4. Federal tax information
The timing and character of income and capital gain distributions are determined in accordance with income tax regulations, which may differ from GAAP because of temporary or permanent book to tax differences.
At April 30, 2018, these differences were primarily due to differing treatment for deferral/reversal of wash sale losses, re-characterization of distributions for investments, capital loss carryforwards, trustees’ deferred compensation and distributions. To the extent these differences were permanent, reclassifications were made among the components of the Fund’s net assets in the Statement of Assets and Liabilities. Temporary differences do not require reclassifications.
In the Statement of Assets and Liabilities the following reclassifications were made:
Undistributed net
investment
income ($) | Accumulated
net realized
(loss) ($) | Paid in
capital ($) |
| (35) | 35 | — |
Net investment income (loss) and net realized gains (losses), as disclosed in the Statement of Operations, and net assets were not affected by this reclassification.
| 24 | Columbia AMT-Free South Carolina Intermediate Muni Bond Fund | Annual Report 2018 |
Notes to Financial Statements (continued)
April 30, 2018
The tax character of distributions paid during the years indicated was as follows:
| Year Ended April 30, 2018 | Year Ended April 30, 2017 |
Ordinary
income ($) | Tax-exempt
income ($) | Long-term
capital gains ($) | Total ($) | Ordinary
income ($) | Tax-exempt
income ($) | Long-term
capital gains ($) | Total ($) |
| 22 | 3,218,767 | — | 3,218,789 | 2,665 | 3,832,447 | 134,389 | 3,969,501 |
Short-term capital gain distributions, if any, are considered ordinary income distributions for tax purposes.
At April 30, 2018, the components of distributable earnings on a tax basis were as follows:
Undistributed
ordinary income ($) | Undistributed tax-
exempt income ($) | Undistributed
long-term
capital gains ($) | Capital loss
carryforwards ($) | Net unrealized
appreciation ($) |
| — | 590,599 | — | (263,705) | 1,276,892 |
At April 30, 2018, the cost of all investments for federal income tax purposes along with the aggregate gross unrealized appreciation and depreciation based on that cost was:
Federal
tax cost ($) | Gross unrealized
appreciation ($) | Gross unrealized
(depreciation) ($) | Net unrealized
appreciation ($) |
| 109,521,381 | 2,041,371 | (764,479) | 1,276,892 |
Tax cost of investments and unrealized appreciation/(depreciation) may also include timing differences that do not constitute adjustments to tax basis.
The following capital loss carryforwards, determined at April 30, 2018, may be available to reduce taxable income arising from future net realized gains on investments, if any, to the extent permitted by the Internal Revenue Code. Capital loss carryforwards with no expiration are required to be utilized prior to any capital losses which carry an expiration date. As a result of this ordering rule, capital loss carryforwards which carry an expiration date may be more likely to expire unused. In addition, for the year ended April 30, 2018, capital loss carryforwards utilized, expired unused and permanently lost, if any, were as follows:
| 2019 ($) | No expiration
short-term ($) | No expiration
long-term ($) | Total ($) | Utilized ($) | Expired ($) | Permanently
lost ($) |
| — | 263,705 | — | 263,705 | 28,647 | — | — |
Management of the Fund has concluded that there are no significant uncertain tax positions in the Fund that would require recognition in the financial statements. However, management’s conclusion may be subject to review and adjustment at a later date based on factors including, but not limited to, new tax laws, regulations, and administrative interpretations (including relevant court decisions). Generally, the Fund’s federal tax returns for the prior three fiscal years remain subject to examination by the Internal Revenue Service.
Note 5. Portfolio information
The cost of purchases and proceeds from sales of securities, excluding short-term investments and derivatives, if any, aggregated to $8,238,223 and $11,348,026, respectively, for the year ended April 30, 2018. The amount of purchase and sale activity impacts the portfolio turnover rate reported in the Financial Highlights.
Note 6. Line of credit
The Fund has access to a revolving credit facility with a syndicate of banks led by Citibank, N.A., HSBC Bank USA, N.A. and JPMorgan Chase Bank, N.A. whereby the Fund may borrow for the temporary funding of shareholder redemptions or for other temporary or emergency purposes. The credit facility, which is a collective agreement between the Fund and certain other funds managed by the Investment Manager, severally and not jointly, permits collective borrowings up to $1 billion. Interest is charged to each participating fund based on its borrowings at a rate equal to the higher of (i) the overnight federal funds rate
Columbia AMT-Free South Carolina Intermediate Muni Bond Fund | Annual Report 2018
| 25 |
Notes to Financial Statements (continued)
April 30, 2018
plus 1.00% or (ii) the one-month LIBOR rate plus 1.00%. Each borrowing under the credit facility matures no later than 60 days after the date of borrowing. The Fund also pays a commitment fee equal to its pro rata share of the amount of the credit facility at a rate of 0.15% per annum. The commitment fee is included in other expenses in the Statement of Operations.
The Fund had no borrowings during the year ended April 30, 2018.
Note 7. Significant risks
Credit risk
Credit risk is the risk that the value of debt securities in the Fund’s portfolio may decline because the issuer may default and fail to pay interest or repay principal when due. Rating agencies assign credit ratings to debt securities to indicate their credit risk. Lower rated or unrated debt securities held by the Fund may present increased credit risk as compared to higher-rated debt securities.
Geographic concentration risk
Because the Fund invests substantially in municipal securities issued by the state identified in the Fund’s name and political sub-divisions of that state, the Fund will be particularly affected by adverse tax, legislative, regulatory, demographic or political changes as well as changes impacting the state’s financial, economic or other condition and prospects. In addition, because of the relatively small number of issuers of tax-exempt securities in the state, the Fund may invest a higher percentage of assets in a single issuer and, therefore, be more exposed to the risk of loss than a fund that invests more broadly. The value of municipal and other securities owned by the Fund also may be adversely affected by future changes in federal or state income tax laws.
Interest rate risk
Interest rate risk is the risk of losses attributable to changes in interest rates. In general, if prevailing interest rates rise, the values of debt securities tend to fall, and if interest rates fall, the values of debt securities tend to rise. Actions by governments and central banking authorities can result in increases in interest rates. Increasing interest rates may negatively affect the value of debt securities held by the Fund, resulting in a negative impact on the Fund’s performance and net asset value per share. In general, the longer the maturity or duration of a debt security, the greater its sensitivity to changes in interest rates.
Liquidity risk
Liquidity risk is the risk associated with a lack of marketability of investments which may make it difficult to sell the investment at a desirable time or price. Changing regulatory, market or other conditions or environments (for example, the interest rate or credit environments) may adversely affect the liquidity of the Fund’s investments. The Fund may have to accept a lower selling price for the holding, sell other investments, or forego another, more appealing investment opportunity. Generally, the less liquid the market at the time the Fund sells a portfolio investment, the greater the risk of loss or decline of value to the Fund. A less liquid market can lead to an increase in Fund redemptions, which may negatively impact Fund performance and net asset value per share, including, for example, if the Fund is forced to sell securities in a down market.
Shareholder concentration risk
At April 30, 2018, one unaffiliated shareholder of record owned 54.5% of the outstanding shares of the Fund in one or more accounts. The Fund has no knowledge about whether any portion of those shares was owned beneficially. Subscription and redemption activity by concentrated accounts may have a significant effect on the operations of the Fund. In the case of a large redemption, the Fund may be forced to sell investments at inopportune times, including its liquid positions, which may result in Fund losses and the Fund holding a higher percentage of less liquid positions. Large redemptions could result in decreased economies of scale and increased operating expenses for non-redeeming Fund shareholders.
| 26 | Columbia AMT-Free South Carolina Intermediate Muni Bond Fund | Annual Report 2018 |
Notes to Financial Statements (continued)
April 30, 2018
Note 8. Subsequent events
Management has evaluated the events and transactions that have occurred through the date the financial statements were issued and noted no items requiring adjustment of the financial statements or additional disclosure.
Note 9. Information regarding pending and settled legal proceedings
Ameriprise Financial and certain of its affiliates have historically been involved in a number of legal, arbitration and regulatory proceedings, including routine litigation, class actions, and governmental actions, concerning matters arising in connection with the conduct of their business activities. Ameriprise Financial believes that the Fund is not currently the subject of, and that neither Ameriprise Financial nor any of its affiliates are the subject of, any pending legal, arbitration or regulatory proceedings that are likely to have a material adverse effect on the Fund or the ability of Ameriprise Financial or its affiliates to perform under their contracts with the Fund. Ameriprise Financial is required to make quarterly (10-Q), annual (10-K) and, as necessary, 8-K filings with the Securities and Exchange Commission (SEC) on legal and regulatory matters that relate to Ameriprise Financial and its affiliates. Copies of these filings may be obtained by accessing the SEC website at www.sec.gov.
There can be no assurance that these matters, or the adverse publicity associated with them, will not result in increased Fund redemptions, reduced sale of Fund shares or other adverse consequences to the Fund. Further, although we believe proceedings are not likely to have a material adverse effect on the Fund or the ability of Ameriprise Financial or its affiliates to perform under their contracts with the Fund, these proceedings are subject to uncertainties and, as such, we are unable to estimate the possible loss or range of loss that may result. An adverse outcome in one or more of these proceedings could result in adverse judgments, settlements, fines, penalties or other relief that could have a material adverse effect on the consolidated financial condition or results of operations of Ameriprise Financial.
Columbia AMT-Free South Carolina Intermediate Muni Bond Fund | Annual Report 2018
| 27 |
Report of Independent Registered Public Accounting Firm
To the Board of Trustees of Columbia Funds Series Trust and Shareholders of Columbia AMT-Free South Carolina Intermediate Muni Bond Fund
Opinion on the Financial Statements
We have audited the accompanying statement of assets and liabilities, including the portfolio of investments, of Columbia AMT-Free South Carolina Intermediate Muni Bond Fund (one of the funds constituting Columbia Funds Series Trust, referred to hereafter as the "Fund") as of April 30, 2018, the related statement of operations for the year ended April 30, 2018, the statement of changes in net assets for each of the two years in the period ended April 30, 2018, including the related notes, and the financial highlights for each of the periods indicated therein (collectively referred to as the “financial statements”). In our opinion, the financial statements present fairly, in all material respects, the financial position of the Fund as of April 30, 2018, the results of its operations for the year then ended, the changes in its net assets for each of the two years in the period ended April 30, 2018 and the financial highlights for each of the periods indicated therein in conformity with accounting principles generally accepted in the United States of America.
Basis for Opinion
These financial statements are the responsibility of the Fund’s management. Our responsibility is to express an opinion on the Fund’s financial statements based on our audits. We are a public accounting firm registered with the Public Company Accounting Oversight Board (United States) (“PCAOB”) and are required to be independent with respect to the Fund in accordance with the U.S. federal securities laws and the applicable rules and regulations of the Securities and Exchange Commission and the PCAOB.
We conducted our audits of these financial statements in accordance with the standards of the PCAOB. Those standards require that we plan and perform the audit to obtain reasonable assurance about whether the financial statements are free of material misstatement, whether due to error or fraud.
Our audits included performing procedures to assess the risks of material misstatement of the financial statements, whether due to error or fraud, and performing procedures that respond to those risks. Such procedures included examining, on a test basis, evidence regarding the amounts and disclosures in the financial statements. Our audits also included evaluating the accounting principles used and significant estimates made by management, as well as evaluating the overall presentation of the financial statements. Our procedures included confirmation of securities owned as of April 30, 2018 by correspondence with the custodian and brokers; when replies were not received from brokers, we performed other auditing procedures. We believe that our audits provide a reasonable basis for our opinion.
/s/PricewaterhouseCoopers LLP
Minneapolis, Minnesota
June 21, 2018
We have served as the auditor of one or more investment companies in the Columbia Funds Complex since 1977.
| 28 | Columbia AMT-Free South Carolina Intermediate Muni Bond Fund | Annual Report 2018 |
Federal Income Tax Information
(Unaudited)
The Fund hereby designates the following tax attributes for the fiscal year ended April 30, 2018. Shareholders will be notified in early 2019 of the amounts for use in preparing 2018 income tax returns.
Exempt-
interest
dividends | |
| 100.00% | |
Exempt-interest dividends. The percentage of net investment income distributed during the fiscal year that qualifies as exempt-interest dividends for federal income tax purposes.
Columbia AMT-Free South Carolina Intermediate Muni Bond Fund | Annual Report 2018
| 29 |
Shareholders elect the Board that oversees the Fund’s operations. The Board appoints officers who are responsible for day-to-day business decisions based on policies set by the Board. The following table provides basic biographical information about the Fund’s Trustees, including their principal occupations during the past five years, although specific titles for individuals may have varied over the period. Under current Board policy, Trustees not affiliated with the Investment Manager generally may serve through the end of the calendar year in which they reach either the mandatory retirement age established by the Board or the fifteenth anniversary of the first Columbia Funds board meeting they attended as a member of the Board.
Independent trustees
Name,
address,
year of birth | Position held
with the Trust and
length of service | Principal occupation(s)
during past five years
and other relevant
professional experience | Number of
Funds in the
Columbia Funds
complex
overseen | Other directorships
held by Trustee
during the past
five years |
George S. Batejan
c/o Columbia Management
Investment Advisers, LLC
225 Franklin Street
Mail Drop BX32 05228
Boston, MA 02110
1953 | Trustee since 1/17 | Executive Vice President, Global Head of Technology and Operations, Janus Capital Group, Inc., 2010-2016 | 125 | Advisory Board Member, University of Colorado Business School since November 2015; former Chairman of the Board, NICSA (National Investment Company Services Association) (Executive Committee, Nominating Committee and Governance Committee), 2014-2016; former Director, Intech Investment Management, 2011- 2016; former Board Member, Metro Denver Chamber of Commerce, 2015-2016 |
Kathleen Blatz
c/o Columbia Management
Investment Advisers, LLC
225 Franklin Street
Mail Drop BX32 05228
Boston, MA 02110
1954 | Trustee since 1/06 for RiverSource Funds and since 6/11 for Nations Funds | Attorney; specializing in arbitration and mediation; Interim President and Chief Executive Officer, Blue Cross and Blue Shield of Minnesota (health care insurance) since February 2018; Chief Justice, Minnesota Supreme Court, 1998-2006; Associate Justice, Minnesota Supreme Court, 1996-1998; Fourth Judicial District Court Judge, Hennepin County, 1994-1996; Attorney in private practice and public service, 1984-1993; State Representative, Minnesota House of Representatives, 1979-1993, which included service on the Tax and Financial Institutions and Insurance Committees; Interim Chair, Minnesota Sports Facilities Authority, March 2017-July 2017 | 125 | Trustee, BlueCross BlueShield of Minnesota since 2009 (Chair of the Business Development Committee, 2014-2017; Chair of the Governance Committee since 2017); Chair of the Robina Foundation since August 2013; former Member of the Board, Minnesota Sports Facilities Authority, January 2017-July 2017 |
Edward J. Boudreau, Jr.
c/o Columbia Management
Investment Advisers, LLC
225 Franklin Street
Mail Drop BX32 05228
Boston, MA 02110
1944 | Chair of the Board since 1/18; Trustee since 6/11 for RiverSource Funds and since 1/05 for Nations Funds | Managing Director, E.J. Boudreau & Associates (consulting) since 2000; FINRA Industry Arbitrator, 2002-present; Chairman and Chief Executive Officer, John Hancock Investments (asset management), Chairman and Interested Trustee for open-end and closed-end funds offered by John Hancock, 1989-2000; John Hancock Mutual Life Insurance Company, including Senior Vice President and Treasurer and Senior Vice President Information Technology, 1968-1988 | 125 | Former Trustee, Boston Museum of Science (Chair of Finance Committee) 1985-2013; former Trustee, BofA Funds Series Trust (11 funds), 2005-2011 |
| 30 | Columbia AMT-Free South Carolina Intermediate Muni Bond Fund | Annual Report 2018 |
TRUSTEES AND OFFICERS (continued)
Independent trustees (continued)
Name,
address,
year of birth | Position held
with the Trust and
length of service | Principal occupation(s)
during past five years
and other relevant
professional experience | Number of
Funds in the
Columbia Funds
complex
overseen | Other directorships
held by Trustee
during the past
five years |
Pamela G. Carlton
c/o Columbia Management
Investment Advisers, LLC
225 Franklin Street
Mail Drop BX32 05228
Boston, MA 02110
1954 | Trustee since 7/07 for RiverSource Funds and since 6/11 for Nations Funds | President, Springboard — Partners in Cross Cultural Leadership (consulting company) since 2003; Managing Director of US Equity Research, JP Morgan Chase, 1999-2003; Director of US Equity Research, Chase Asset Management, 1996-1999; Co-Director Latin America Research, 1993-1996, COO Global Research, 1992-1996, Co-Director of US Research, 1991-1992, Investment Banker, Morgan Stanley, 1982-1991 | 125 | Trustee, New York Presbyterian Hospital Board (Executive Committee and Chair of Human Resources Committee) since 1996; Director, Darien Rowayton Bank (Audit Committee) since 2017 |
William P. Carmichael
c/o Columbia Management
Investment Advisers, LLC
225 Franklin Street
Mail Drop BX32 05228
Boston, MA 02110
1943 | Trustee since 6/11 for RiverSource Funds and since 2003 for Nations Funds | Retired; Co-founder, The Succession Fund (provides exit strategies to owners of privately held companies), 1998-2007; Adjunct Professor of Finance, Kelley School of Business, Indiana University, 1993-2007; Senior Vice President, Sara Lee Corporation, 1991-1993; Senior Vice President and Chief Financial Officer, Beatrice Foods Company, 1984-1990; Vice President, Esmark, Inc., 1973-1984; Associate, Price Waterhouse, 1968-1972 | 125 | Director, The Finish Line (athletic shoes and apparel) since July 2003; former Director, Cobra Electronics Corporation (electronic equipment manufacturer), 1994-August 2014; former Director, Spectrum Brands, Inc. (consumer products), 2002-2009; former Director, Simmons Company (bedding), 2004-2010; former Trustee, BofA Funds Series Trust (11 funds) 2003-2011; former Director, McMoRan Exploration Company (oil and gas exploration and development) 2010 - 2013; former Director, International Textile Corp., 2012-2016; former Director, hhgregg, 2015-2017 |
Patricia M. Flynn
c/o Columbia Management
Investment Advisers, LLC
225 Franklin Street
Mail Drop BX32 05228
Boston, MA 02110
1950 | Trustee since 11/04 for RiverSource Funds and since 6/11 for Nations Funds | Trustee Professor of Economics and Management, Bentley University since 1976 (also teaches and conducts research on corporate governance); Dean, McCallum Graduate School of Business, Bentley University, 1992-2002 | 125 | Trustee, MA Taxpayers Foundation since 1997; Board of Directors, The MA Business Roundtable since 2003; Board of Governors, Innovation Institute, MA Technology Collaborative since 2010 |
Brian J. Gallagher
c/o Columbia Management
Investment Advisers, LLC
225 Franklin Street
Mail Drop BX32 05228
Boston, MA 02110
1954 | Trustee since 12/17 | Retired; Partner with Deloitte & Touche LLP and its predecessors, 1977-2016 | 123 | Trustee, Catholic Schools Foundation since 2004 |
Catherine James Paglia
c/o Columbia Management
Investment Advisers, LLC
225 Franklin Street
Mail Drop BX32 05228
Boston, MA 02110
1952 | Trustee since 11/04 for RiverSource Funds and since 6/11 for Nations Funds | Director, Enterprise Asset Management, Inc. (private real estate and asset management company) since September 1998; Managing Director and Partner, Interlaken Capital, Inc., 1989-1997; Managing Director, Morgan Stanley, 1982-1989; Vice President, Investment Banking, 1980-1982, Associate, Investment Banking, 1976-1980, Dean Witter Reynolds, Inc. | 125 | Director, Valmont Industries, Inc. (irrigation systems manufacturer) since 2012; Trustee, Carleton College (on the Investment Committee); Trustee, Carnegie Endowment for International Peace (on the Investment Committee) |
Columbia AMT-Free South Carolina Intermediate Muni Bond Fund | Annual Report 2018
| 31 |
TRUSTEES AND OFFICERS (continued)
Independent trustees (continued)
Name,
address,
year of birth | Position held
with the Trust and
length of service | Principal occupation(s)
during past five years
and other relevant
professional experience | Number of
Funds in the
Columbia Funds
complex
overseen | Other directorships
held by Trustee
during the past
five years |
Minor M. Shaw
c/o Columbia Management
Investment Advisers, LLC
225 Franklin Street
Mail Drop BX32 05228
Boston, MA 02110
1947 | Trustee since 6/11 for RiverSource Funds and since 2003 for Nations Funds | President, Micco LLC (private investments) since 2011; President, Micco Corp. (family investment business), 1998-2011 | 125 | Director, BlueCross BlueShield of South Carolina since April 2008; Director, National Association of Corporate Directors, Carolinas Chapter, since 2013; Board Chair, Hollingsworth Funds since 2016; Advisory Board member, Duke Energy Corp. since October 2016; Chair of the Duke Endowment; Chair of Greenville – Spartanburg Airport Commission; former Trustee, BofA Funds Series Trust (11 funds), 2003-2011; former Director, Piedmont Natural Gas, 2004-2016 |
Sandra Yeager
c/o Columbia Management
Investment Advisers, LLC
225 Franklin Street
Mail Drop BX32 05228
Boston, MA 02110
1964 | Trustee since 12/17 | Retired; President and founder, Hanoverian Capital, LLC (SEC registered investment advisor firm), 2008-2016 | 123 | Director, NAPE Education Foundation since October 2016 |
Consultants to the Independent Trustees*
Name,
address,
year of birth | Position held
with the Trust and
length of service | Principal occupation(s) during the
past five years and other relevant
professional experience | Number of
Funds in the
Columbia Funds
complex overseen | Other directorships/
held by Trustee
during the past
five years |
Anthony M. Santomero
c/o Columbia Management
Investment Advisers, LLC
225 Franklin Street
Mail Drop BX32 05228
Boston, MA 02110
1946 | Trustee since 6/11 for RiverSource Funds and since 1/08 for Nations Funds | Richard K. Mellon Professor Emeritus of Finance, The Wharton School, University of Pennsylvania, since 2002; Senior Advisor, McKinsey & Company (consulting), 2006-2008; President, Federal Reserve Bank of Philadelphia, 2000-2006, Professor of Finance, The Wharton School, University of Pennsylvania, 1972-2002 | 123 | Trustee, Penn Mutual Life Insurance Company since March 2008; Director, Renaissance Reinsurance Ltd. since May 2008; Director, Citigroup Inc. since 2009; Director, Citibank, N.A. since 2009; former Trustee, BofA Funds Series Trust (11 funds), 2008-2011 |
| * | Dr. Santomero is not an affiliated person of the Investment Manager or Ameriprise Financial. However, he is currently deemed by the Funds to be an “interested person” (as defined in the 1940 Act) of the Funds because he serves as a Director of Citigroup Inc. and Citibank, N.A., companies that may directly or through subsidiaries and affiliates engage from time-to-time in brokerage execution, principal transactions and lending relationships with the Funds or accounts advised/managed by the Investment Manager. |
| 32 | Columbia AMT-Free South Carolina Intermediate Muni Bond Fund | Annual Report 2018 |
TRUSTEES AND OFFICERS (continued)
Interested trustee affiliated with Investment Manager*
Name,
address,
year of birth | Position held with the Trusts and length of service | Principal occupation(s) during the
past five years and other relevant
professional experience | Number of
Funds in the
Columbia Funds
complex overseen | Other directorships
held by Trustee
during the past
five years |
William F. Truscott
c/o Columbia Management
Investment Advisers, LLC
225 Franklin St.
Boston, MA 02110
1960 | Trustee since 11/01 for RiverSource Funds and since 6/11 for Nations Funds; Senior Vice President since 2002 for RiverSource Funds and since 5/10 for Nations Funds | Chairman of the Board and President, Columbia Management Investment Advisers, LLC since May 2010 and February 2012, respectively; Chief Executive Officer, Global Asset Management, Ameriprise Financial, Inc. since September 2012 (previously Chief Executive Officer, U.S. Asset Management & President, Annuities, May 2010 - September 2012); Director and Chief Executive Officer, Columbia Management Investment Distributors, Inc. since May 2010 and February 2012, respectively; Chairman of the Board and Chief Executive Officer, RiverSource Distributors, Inc. since 2006; Director, Threadneedle Asset Management Holdings, SARL since 2014; President and Chief Executive Officer, Ameriprise Certificate Company, 2006 - August 2012. | 196 | Chairman of the Board, Columbia Management Investment Advisers, LLC since May 2010; Director, Columbia Management Investment Distributors, Inc. since May 2010; former Director, Ameriprise Certificate Company, 2006-January 2013 |
| * | Interested person (as defined under the 1940 Act) by reason of being an officer, director, security holder and/or employee of the Investment Manager or Ameriprise Financial. |
Nations Funds refer to the Funds within the Columbia Funds Complex that historically bore the Nations brand and includes series of Columbia Funds Series Trust. RiverSource Funds refer to the Funds within the Columbia Funds Complex that historically bore the RiverSource brand and includes series of Columbia Funds Series Trust II.
The Statement of Additional Information has additional information about the Fund’s Board members and is available, without charge, upon request by calling 800.345.6611, visiting columbiathreadneedleus.com/investor/ or contacting your financial intermediary.
Columbia AMT-Free South Carolina Intermediate Muni Bond Fund | Annual Report 2018
| 33 |
TRUSTEES AND OFFICERS (continued)
The Board has appointed officers who are responsible for day-to-day business decisions based on policies it has established. The officers serve at the pleasure of the Board. The following table provides basic information about the Officers of the Fund, including principal occupations during the past five years, although their specific titles may have varied over the period. In addition to Mr. Truscott, who is Senior Vice President, the Fund’s other officers are:
Fund officers
Name,
address and
year of birth | Position and year
first appointed to
position for any Fund
in the Columbia
Funds complex or a
predecessor thereof | Principal occupation(s) during past five years |
Christopher O. Petersen
5228 Ameriprise
Financial Center
Minneapolis, MN 55474
Born 1970 | President and Principal Executive Officer (2015) | Vice President and Lead Chief Counsel, Ameriprise Financial, Inc. since January 2015 (previously, Vice President and Chief Counsel, January 2010 - December 2014; officer of Columbia Funds and affiliated funds since 2007. |
Michael G. Clarke
225 Franklin Street
Boston, MA 02110
Born 1969 | Treasurer (2011), Chief Financial Officer (2009) and Chief Accounting Officer (2015) | Vice President — Mutual Fund Administration, Columbia Management Investment Advisers, LLC, since May 2010; senior officer of Columbia Funds and affiliated funds since 2002. |
Paul B. Goucher
100 Park Avenue
New York, NY 10017
Born 1968 | Senior Vice President (2011) and Assistant Secretary (2008) | Senior Vice President and Assistant General Counsel, Ameriprise Financial, Inc. since January 2017 (previously Vice President and Lead Chief Counsel, November 2008 - January 2017 and January 2013 - January 2017, respectively; and Chief Counsel, January 2010 - January 2013); Vice President, Chief Legal Officer and Assistant Secretary, Columbia Management Investment Advisers, LLC since May 2010. |
Thomas P. McGuire
225 Franklin Street
Boston, MA 02110
Born 1972 | Senior Vice President and Chief Compliance Officer (2012) | Vice President — Asset Management Compliance, Ameriprise Financial, Inc., since May 2010; Chief Compliance Officer, Ameriprise Certificate Company since September 2010. |
Colin Moore
225 Franklin Street
Boston, MA 02110
Born 1958 | Senior Vice President (2010) | Executive Vice President and Global Chief Investment Officer, Ameriprise Financial, Inc., since July 2013; Executive Vice President and Global Chief Investment Officer, Columbia Management Investment Advisers, LLC since July 2013 (previously Director and Global Chief Investment Officer, 2010 - 2013). |
Ryan C. Larrenaga
225 Franklin Street
Boston, MA 02110
Born 1970 | Senior Vice President (2017), Chief Legal Officer (2017) and Secretary (2015) | Vice President and Group Counsel, Ameriprise Financial, Inc. since August 2011; officer of Columbia Funds and affiliated funds since 2005. |
Michael E. DeFao
225 Franklin Street
Boston, MA 02110
Born 1968 | Vice President (2011) and Assistant Secretary (2010) | Vice President and Chief Counsel, Ameriprise Financial, Inc. since May 2010. |
Amy Johnson
5228 Ameriprise
Financial Center
Minneapolis, MN 55474
Born 1965 | Vice President (2006) | Managing Director and Global Head of Operations, Columbia Management Investment Advisers, LLC since April 2016 (previously Managing Director and Chief Operating Officer, 2010 - 2016). |
Lyn Kephart-Strong
5228 Ameriprise
Financial Center
Minneapolis, MN 55474
Born 1960 | Vice President (2015) | President, Columbia Management Investment Services Corp. since October 2014; Vice President & Resolution Officer, Ameriprise Trust Company since August 2009. |
| 34 | Columbia AMT-Free South Carolina Intermediate Muni Bond Fund | Annual Report 2018 |
The Fund mails one shareholder report to each shareholder address. If you would like more than one report, please call shareholder services at 800.345.6611 and additional reports will be sent to you.
Proxy voting policies and procedures
The policy of the Board of Trustees is to vote the proxies of the companies in which the Fund holds investments consistent with the procedures as stated in the Statement of Additional Information (SAI). You may obtain a copy of the SAI without charge by calling 800.345.6611; contacting your financial intermediary; visiting columbiathreadneedleus.com/investor/; or searching the website of the Securities and Exchange Commission (SEC) at sec.gov. Information regarding how the Fund voted proxies relating to portfolio securities is filed with the SEC by August 31st for the most recent 12-month period ending June 30th of that year, and is available without charge by visiting columbiathreadneedleus.com/investor/, or searching the website of the SEC at sec.gov.
Quarterly schedule of investments
The Fund files a complete schedule of portfolio holdings with the SEC for the first and third quarters of each fiscal year on Form N-Q. The Fund’s Form N-Q is available on the SEC’s website at sec.gov and may be reviewed and copied at the SEC’s Public Reference Room in Washington, D.C. Information on the operation of the Public Reference Room may be obtained by calling 800.SEC.0330. The Fund’s complete schedule of portfolio holdings, as filed on Form N-Q, can also be obtained without charge, upon request, by calling 800.345.6611.
Additional Fund information
For more information about the Fund, please visit columbiathreadneedleus.com/investor/ or call 800.345.6611. Customer Service Representatives are available to answer your questions Monday through Friday from 8 a.m. to 7 p.m. Eastern time.
Fund investment manager
Columbia Management Investment Advisers, LLC
225 Franklin Street
Boston, MA 02110
Fund distributor
Columbia Management Investment Distributors, Inc.
225 Franklin Street
Boston, MA 02110
Fund transfer agent
Columbia Management Investment Services Corp.
P.O. Box 8081
Boston, MA 02266-8081
Columbia AMT-Free South Carolina Intermediate Muni Bond Fund | Annual Report 2018
| 35 |
[THIS PAGE INTENTIONALLY LEFT BLANK]
[THIS PAGE INTENTIONALLY LEFT BLANK]
Columbia AMT-Free South Carolina Intermediate Muni Bond Fund
P.O. Box 8081
Boston, MA 02266-8081
Please read and consider the investment objectives, risks, charges and expenses for any fund carefully before investing. For a prospectus and summary prospectus, which contains this and other important information about the Fund, go to
columbiathreadneedleus.com/investor/. The Fund is distributed by Columbia Management Investment Distributors, Inc., member FINRA, and managed by Columbia Management Investment Advisers, LLC.
Columbia Threadneedle Investments (Columbia Threadneedle) is the global brand name of the Columbia and Threadneedle group of companies. All rights reserved. Columbia Management Investment Distributors, Inc., 225 Franklin Street, Boston, MA 02110-2804
© 2018 Columbia Management Investment Advisers, LLC.
columbiathreadneedleus .com/investor/

Annual Report
April 30, 2018
Columbia AMT-Free North Carolina Intermediate Muni Bond Fund
Not FDIC Insured • No bank guarantee • May lose value
Dear Shareholders,
The year 2017 was an extraordinary year in the financial markets. The S&P 500 Index didn’t experience a single down month and returned over 20%. Continuing this trend, January 2018 marked the fastest start for the index ever. Low volatility, which had been a feature of the U.S. equity market for several years, along with the surge in the S&P 500 Index, drove investor sentiment to very high levels. This arguably set the stage for an overdue correction, which we witnessed in February 2018.
A return to volatility
There have been few periods of market upheaval such as were experienced in the first part of 2018. While investors were taken by surprise by the sudden and pronounced market swings, the return to some level of volatility actually marked a resumption of relatively normal market conditions. Having said that, it’s important to distinguish between a good technical correction where excess enthusiasm in the marketplace is being let out, versus a real change in the underlying fundamentals – things like an underperforming economy or weaker corporate earnings. Our view is that the recent market volatility falls into the former category, and the fundamentals remain strong. We’re continuing to see improvements in global economic activity, and we’re seeing corporate earnings expectations continue to rise – and not just because of tax reform.
Consistency is more important than ever
It’s important to keep in mind that when it comes to long-term investing, it’s the destination, not the journey that matters most. If you have a financial goal that you’ve worked out with your financial advisor, and you have a good asset allocation plan to reach it, it’s a question of sticking with your plan rather than become focused on near-term volatility. Bouts of volatility are normal. After all, it’s hard to cross the ocean without hitting an occasional rough patch. You need to focus on the destination.
One final thought. In weathering volatility, it’s the consistency of the return that is essential. Investors who chase higher returns are usually the first to sell when an investment goes through a bad patch, and they therefore don’t tend to benefit from the recovery. More disciplined investors who perhaps panic less or not at all during periods of volatility, tend to have improved long-term results and are more likely to reach their financial goals. Nothing is more important to us than making sure those who have entrusted us to protect and grow their assets are able to do what matters most to them.
Your success is our priority. Talk to your financial advisor about how working with Columbia Threadneedle Investments may help you position your portfolio for consistent, sustainable outcomes, no matter the market conditions.
Sincerely,
Christopher O. Petersen
President, Columbia Funds
The S&P 500 Index, an unmanaged index, measures the performance of 500 widely held, large-capitalization U.S. stocks and is frequently used as a general measure of market performance. Past performance is no guarantee of future results.
Columbia Funds are distributed by Columbia Management Investment Distributors, Inc., member FINRA, and managed by Columbia Management Investment Advisers, LLC.
© 2018 Columbia Management Investment Advisers, LLC. All rights reserved.
Columbia AMT-Free North Carolina Intermediate Muni Bond Fund | Annual Report 2018
Columbia AMT-Free North Carolina Intermediate Muni Bond Fund | Annual Report 2018
Investment objective
Columbia AMT-Free North Carolina Intermediate Muni Bond Fund (the Fund) seeks current income exempt from U.S. federal income tax and North Carolina individual income tax, consistent with moderate fluctuation of principal.
Portfolio management
Paul Fuchs, CFA
Co-Portfolio Manager
Managed Fund since 2016
Deborah Vargo
Co-Portfolio Manager
Managed Fund since December 2017
| Average annual total returns (%) (for the period ended April 30, 2018) |
| | | Inception | 1 Year | 5 Years | 10 Years |
| Class A | Excluding sales charges | 12/14/92 | 0.48 | 1.05 | 2.86 |
| | Including sales charges | | -2.54 | 0.43 | 2.55 |
| Advisor Class* | 03/19/13 | 0.63 | 1.28 | 3.11 |
| Class C | Excluding sales charges | 12/16/92 | -0.38 | 0.28 | 2.09 |
| | Including sales charges | | -1.36 | 0.28 | 2.09 |
| Institutional Class | 12/11/92 | 0.72 | 1.30 | 3.12 |
| Institutional 3 Class* | 03/01/17 | 0.83 | 1.32 | 3.13 |
| Bloomberg Barclays 3-15 Year Blend Municipal Bond Index | | 0.87 | 2.10 | 3.99 |
Returns for Class A shares are shown with and without the maximum initial sales charge of 3.00%. Returns for Class C shares are shown with and without the 1.00% contingent deferred sales charge for the first year only. The Fund’s other classes are not subject to sales charges and have limited eligibility. Effective November 1, 2017, Class R4, Class Y and Class Z shares were renamed Advisor Class, Institutional 3 Class and Institutional Class shares, respectively. Please see the Fund’s prospectus for details. Performance for different share classes will vary based on differences in sales charges and fees associated with each class. All results shown assume reinvestment of distributions during the period. Returns do not reflect the deduction of taxes that a shareholder may pay on Fund distributions or on the redemption of Fund shares. Performance results reflect the effect of any fee waivers or reimbursements of Fund expenses by Columbia Management Investment Advisers, LLC and/or any of its affiliates. Absent these fee waivers or expense reimbursement arrangements, performance results would have been lower.
The performance information shown represents past performance and is not a guarantee of future results. The investment return and principal value of your investment will fluctuate so that your shares, when redeemed, may be worth more or less than their original cost. Current performance may be lower or higher than the performance information shown. You may obtain performance information current to the most recent month-end by contacting your financial intermediary, visiting columbiathreadneedleus.com/investor/ or calling 800.345.6611.
| * | The returns shown for periods prior to the share class inception date (including returns for the Life of the Fund, if shown, which are since Fund inception) include the returns of the Fund’s oldest share class. These returns are adjusted to reflect any higher class-related operating expenses of the newer share classes, as applicable. Please visit columbiathreadneedleus.com/investor/investment-products /mutual-funds/appended-performance for more information. |
The Bloomberg Barclays 3–15 Year Blend Municipal Bond Index is an unmanaged index that tracks the performance of municipal bonds issued after December 31, 1990, with remaining maturities between 2 and 17 years and at least $7 million in principal amount outstanding.
Indices are not available for investment, are not professionally managed and do not reflect sales charges, fees, brokerage commissions, taxes or other expenses of investing. Securities in the Fund may not match those in an index.
| 2 | Columbia AMT-Free North Carolina Intermediate Muni Bond Fund | Annual Report 2018 |
Fund at a Glance (continued)
Performance of a hypothetical $10,000 investment (April 30, 2008 — April 30, 2018)
The chart above shows the change in value of a hypothetical $10,000 investment in Class A shares of Columbia AMT-Free North Carolina Intermediate Muni Bond Fund during the stated time period, and does not reflect the deduction of taxes that a shareholder may pay on Fund distributions or on the redemption of Fund shares.
| Quality breakdown (%) (at April 30, 2018) |
| AAA rating | 13.7 |
| AA rating | 47.5 |
| A rating | 27.5 |
| BBB rating | 6.1 |
| Not rated | 5.2 |
| Total | 100.0 |
Percentages indicated are based upon total fixed income investments (excluding Money Market Funds).
Bond ratings apply to the underlying holdings of the Fund and not the Fund itself and are divided into categories ranging from highest to lowest credit quality, determined by using the middle rating of Moody’s, S&P and Fitch, after dropping the highest and lowest available ratings. When ratings are available from only two rating agencies, the lower rating is used. When a rating is available from only one rating agency, that rating is used. When a bond is not rated by any rating agency, it is designated as “Not rated.” Credit quality ratings assigned by a rating agency are subjective opinions, not statements of fact, and are subject to change, including daily. The ratings assigned by credit rating agencies are but one of the considerations that the Investment Manager and/or Fund’s subadviser incorporates into its credit analysis process, along with such other issuer-specific factors as cash flows, capital structure and leverage ratios, ability to de-leverage (repay) through free cash flow, quality of management, market positioning and access to capital, as well as such security-specific factors as the terms of the security (e.g., interest rate and time to maturity) and the amount and type of any collateral.
Columbia AMT-Free North Carolina Intermediate Muni Bond Fund | Annual Report 2018
| 3 |
Manager Discussion of Fund Performance
For the 12-month period that ended April 30, 2018, the Fund’s Class A shares returned 0.48% excluding sales charges. Institutional Class shares of the Fund returned 0.72%. During the same time period, the Fund’s benchmark, the Bloomberg Barclays 3-15 Year Blend Municipal Bond Index, returned 0.87%. The higher quality bias of North Carolina’s municipal market caused it to lag the national benchmark, which translated to slight underperformance for the Fund.
Market overview
The national municipal bond market posted a small gain in the 12-month period, as the contribution from income helped offset a moderate decline in prices. The period began on a positive note, reflecting the ongoing rebound from the post-election sell-off of late 2016. During this time, prices were supported by a generally positive tone to the financial markets, muted concerns about U.S. Federal Reserve (Fed) policy and a favorable balance of supply and demand stemming from strong mutual fund inflows and lower new issuance. Although unfunded pension liabilities and budgetary stress among notable issuers such as Illinois, New Jersey, Pennsylvania, Connecticut and Kentucky persisted, overall credit conditions for municipal bonds remained on a sound footing. In addition, Illinois passed a budget for the first time in two years in July 2017, preventing the state from being downgraded to a below investment-grade rating. The passage of Illinois’ budget took some risk out of the broader market, providing additional support for prices through the middle of 2017.
The market landscape became more challenging in the autumn after Republican legislators unveiled a preliminary outline for overhauling the nation’s tax code. The initial proposals eliminated municipal issuers’ ability to advance refund outstanding debt, and it stripped private activity bonds (PABs) of their tax-exempt status. The surprise inclusion of the two provisions initially fueled a market rally as investors anticipated a dramatic reduction in future supply. However, municipalities responded to the proposed tax bill by pulling forward an estimated $35 billion of new bond issuance into December in an effort to beat any negative consequences from the potential changes. Fourth-quarter supply therefore jumped to the highest level in history, weighing on prices. The final bill, signed into law on December 22, spared PABs and only marginally reduced top personal tax rates.
Municipal bonds nevertheless remained under pressure in early 2018 as expectations for higher inflation weighed heavily on all segments of the fixed-income market. Investors worried that the introduction of fiscal stimulus, coming at a time when the economy appeared to be operating near full capacity, would force the Fed to raise interest rates further and faster than expected in order to tame inflation. The 10-year U.S. Treasury yield rose sharply during the first half of the quarter as a result, and municipal yields followed suit. Tax reform lessened the value proposition of municipals for banks and insurance companies, leading some to reduce their holdings of municipal bonds, but this potential headwind was offset by a sharp reduction in supply stemming from the surge of new issuance in December. This factor, together with a slowing rate of increase in Treasury yields late in the period, helped stabilize the municipal bond market in March and April. Still, the broad-based national indexes closed roughly flat for the full 12 months due to the earlier sell-off. Lower quality bonds outpaced higher quality issues, reflecting investors’ ongoing search for yield.
North Carolina’s municipal bond market underperformed
North Carolina’s economy continued to chug along at a steady pace, led by growth in the technology sector and strength in manufacturing activity. Favorable demographic trends, robust property prices and a healthy employment market also contributed to a firm underpinning for the state’s economy. Despite these positive factors, North Carolina intermediate-term municipal bonds lagged the national intermediate market by a wide margin. The high-quality bias of the state’s tax-exempt market was the primary reason for the shortfall. AAA rated state and local general obligations and pre-refunded bonds make up more than 50% of the North Carolina market, and both areas underperformed amid the general strength in lower-rated investment-grade revenue sectors. The state’s debt underperformed the national index by a wide margin within the BBB category, since Illinois and New Jersey were the top performing states in the annual period.
Contributors and detractors
The Fund benefited from its yield curve positioning. The yield curve flattened over the course of the year, with bonds in the two- to eight-year range producing negative total returns. The Fund was underweight this segment, which aided both absolute and relative performance. The Fund’s overweights in longer maturity A rated hospital- and education-related issues also helped results given that both areas outperformed.
| 4 | Columbia AMT-Free North Carolina Intermediate Muni Bond Fund | Annual Report 2018 |
Manager Discussion of Fund Performance (continued)
The Fund’s allocation to pre-refunded bonds detracted. The Fund’s weighting in this area — the worst-performing segment of the market in the past year — was roughly double that of the benchmark. There has been a great deal of refinancing by municipal issuers in recent years, which leads to portfolios holding a large amount of refunded bonds. We continued to look for opportunities to reinvest in other areas as our existing investments in this space matured.
Fund positioning
Our strategy remained largely unchanged during the period. We targeted a neutral duration profile — i.e., an interest-rate sensitivity in line with the benchmark — in order to maintain a balanced stance within the portfolio. The Fund’s positioning continues to reflect our expectation for gradual Fed tightening and a continued flattening bias to the yield curve. The portfolio has a “barbell” structure, with an overweight in bonds maturing in the zero- to two-year range as well as those 12 years and longer. It is underweight the two- to ten-year portion of the yield in response to rising short-term interest rates, limited inflation and a flattening yield curve.
At the period’s end, we believed credit conditions in North Carolina were generally stable at both the state and local levels. The state economy continued to perform well, driven by growth in the technology sector (namely, at the Research Triangle located between Raleigh, Durham and Chapel Hill) and banking. Affordable housing, a low cost of doing business, and improving demographics provided a firm underpinning for economic growth. North Carolina’s finances were solid, with policymakers restoring rainy day reserve accounts to pre-recession levels, which we believe puts the state in a strong position to weather any future national recessions.
Fixed-income securities present issuer default risk. The Fund invests substantially in municipal securities and will be affected by tax, legislative, regulatory, demographic or political changes, as well as changes impacting a state’s financial, economic or other conditions. A relatively small number of tax-exempt issuers may necessitate the Fund investing more heavily in a single issuer and, therefore, be more exposed to the risk of loss than a fund that invests more broadly. The value of the Fund’s portfolio may be more volatile than a more geographically-diversified fund. Prepayment and extension risk exists because the timing of payments on a loan, bond or other investment may accelerate when interest rates fall or decelerate when interest rates rise which may reduce investment opportunities and potential returns. A rise in interest rates may result in a price decline of fixed-income (debt) instruments held by the Fund, negatively affecting its performance and NAV. Falling rates may result in the Fund investing in lower yielding debt instruments, lowering the Fund’s income and yield. Debt instruments with longer maturity and duration have greater sensitivity to interest rate changes. Interest rates can change due to local government and banking regulation changes. Non-investment-grade (high-yield or junk) securities present greater price volatility and more risk to principal and income than higher rated securities. Market risk may affect a single issuer, sector of the economy, industry or the market as a whole. Federal and state tax rules apply to capital gain distributions and any gains or losses on sales. Income may be subject to state or local taxes. Liquidity risk is associated with the difficulty of selling underlying investments at a desirable time or price. See the Fund’s prospectus for more information on these and other risks.
The views expressed in this report reflect the current views of the respective parties. These views are not guarantees of future performance and involve certain risks, uncertainties and assumptions that are difficult to predict, so actual outcomes and results may differ significantly from the views expressed. These views are subject to change at any time based upon economic, market or other conditions and the respective parties disclaim any responsibility to update such views. These views may not be relied on as investment advice and, because investment decisions for a Columbia fund are based on numerous factors, may not be relied on as an indication of trading intent on behalf of any particular Columbia fund. References to specific securities should not be construed as a recommendation or investment advice.
Columbia AMT-Free North Carolina Intermediate Muni Bond Fund | Annual Report 2018
| 5 |
Understanding Your Fund’s Expenses
(Unaudited)
As an investor, you incur two types of costs. There are transaction costs, which generally include sales charges on purchases and may include redemption fees. There are also ongoing costs, which generally include management fees, distribution and/or service fees, and other fund expenses. The following information is intended to help you understand your ongoing costs (in dollars) of investing in the Fund and to help you compare these costs with the ongoing costs of investing in other mutual funds.
Analyzing your Fund’s expenses
To illustrate these ongoing costs, we have provided examples and calculated the expenses paid by investors in each share class of the Fund during the period. The actual and hypothetical information in the table is based on an initial investment of $1,000 at the beginning of the period indicated and held for the entire period. Expense information is calculated two ways and each method provides you with different information. The amount listed in the “Actual” column is calculated using the Fund’s actual operating expenses and total return for the period. You may use the Actual information, together with the amount invested, to estimate the expenses that you paid over the period. Simply divide your account value by $1,000 (for example, an $8,600 account value divided by $1,000 = 8.6), then multiply the results by the expenses paid during the period under the “Actual” column. The amount listed in the “Hypothetical” column assumes a 5% annual rate of return before expenses (which is not the Fund’s actual return) and then applies the Fund’s actual expense ratio for the period to the hypothetical return. You should not use the hypothetical account values and expenses to estimate either your actual account balance at the end of the period or the expenses you paid during the period. See “Compare with other funds” below for details on how to use the hypothetical data.
Compare with other funds
Since all mutual funds are required to include the same hypothetical calculations about expenses in shareholder reports, you can use this information to compare the ongoing cost of investing in the Fund with other funds. To do so, compare the hypothetical example with the 5% hypothetical examples that appear in the shareholder reports of other funds. As you compare hypothetical examples of other funds, it is important to note that hypothetical examples are meant to highlight the ongoing costs of investing in a fund only and do not reflect any transaction costs, such as sales charges, or redemption or exchange fees. Therefore, the hypothetical calculations are useful in comparing ongoing costs only, and will not help you determine the relative total costs of owning different funds. If transaction costs were included in these calculations, your costs would be higher.
| November 1, 2017 — April 30, 2018 |
| | Account value at the
beginning of the
period ($) | Account value at the
end of the
period ($) | Expenses paid during
the period ($) | Fund’s annualized
expense ratio (%) |
| | Actual | Hypothetical | Actual | Hypothetical | Actual | Hypothetical | Actual |
| Class A | 1,000.00 | 1,000.00 | 986.20 | 1,020.78 | 3.99 | 4.06 | 0.81 |
| Advisor Class | 1,000.00 | 1,000.00 | 986.50 | 1,022.02 | 2.76 | 2.81 | 0.56 |
| Class C | 1,000.00 | 1,000.00 | 981.60 | 1,017.06 | 7.66 | 7.80 | 1.56 |
| Institutional Class | 1,000.00 | 1,000.00 | 987.40 | 1,022.02 | 2.76 | 2.81 | 0.56 |
| Institutional 3 Class | 1,000.00 | 1,000.00 | 987.90 | 1,022.36 | 2.42 | 2.46 | 0.49 |
Expenses paid during the period are equal to the annualized expense ratio for each class as indicated above, multiplied by the average account value over the period and then multiplied by the number of days in the Fund’s most recent fiscal half year and divided by 365.
Expenses do not include fees and expenses incurred indirectly by the Fund from its investment in underlying funds, including affiliated and non-affiliated pooled investment vehicles, such as mutual funds and exchange-traded funds.
Had Columbia Management Investment Advisers, LLC and/or certain of its affiliates not waived/reimbursed certain fees and expenses, account value at the end of the period would have been reduced.
| 6 | Columbia AMT-Free North Carolina Intermediate Muni Bond Fund | Annual Report 2018 |
Portfolio of Investments
April 30, 2018
(Percentages represent value of investments compared to net assets)
Investments in securities
| Municipal Bonds 94.9% |
| Issue Description | Coupon
Rate | | Principal
Amount ($) | Value ($) |
| Airport 1.6% |
| City of Charlotte Airport |
| Revenue Bonds |
| Series 2017A |
| 07/01/2028 | 5.000% | | 500,000 | 594,130 |
| Raleigh Durham Airport Authority |
| Refunding Revenue Bonds |
| Series 2010A |
| 05/01/2023 | 5.000% | | 2,000,000 | 2,118,120 |
| Total | 2,712,250 |
| Higher Education 10.0% |
| Appalachian State University |
| Refunding Revenue Bonds |
| Series 2016A |
| 10/01/2026 | 5.000% | | 325,000 | 379,701 |
| Series 2016B |
| 10/01/2020 | 5.000% | | 1,380,000 | 1,477,745 |
| East Carolina University |
| Revenue Bonds |
| General |
| Series 2014A |
| 10/01/2031 | 5.000% | | 1,900,000 | 2,117,683 |
| North Carolina Agricultural & Technical State University |
| Refunding Revenue Bonds |
| General Purpose |
| Series 2015A |
| 10/01/2032 | 5.000% | | 2,000,000 | 2,272,620 |
| North Carolina Capital Facilities Finance Agency |
| Unrefunded Revenue Bonds |
| Meredith College |
| Series 2008A |
| 06/01/2031 | 6.000% | | 970,000 | 973,405 |
| North Carolina Central University |
| Refunding Revenue Bonds |
| Series 2016 |
| 10/01/2028 | 4.000% | | 955,000 | 1,005,290 |
| 10/01/2029 | 4.000% | | 625,000 | 652,137 |
| University of North Carolina at Charlotte (The) |
| Revenue Bonds |
| Board of Governors |
| Series 2017 |
| 10/01/2029 | 5.000% | | 500,000 | 588,655 |
| Series 2014 |
| 04/01/2030 | 5.000% | | 1,000,000 | 1,113,920 |
| Municipal Bonds (continued) |
| Issue Description | Coupon
Rate | | Principal
Amount ($) | Value ($) |
| University of North Carolina at Greensboro |
| Refunding Revenue Bonds |
| Series 2016 |
| 04/01/2029 | 5.000% | | 390,000 | 452,618 |
| 04/01/2030 | 5.000% | | 250,000 | 289,178 |
| Revenue Bonds |
| General |
| Series 2014 |
| 04/01/2032 | 5.000% | | 2,000,000 | 2,265,020 |
| University of North Carolina at Wilmington |
| Refunding Revenue Bonds |
| Series 2015 |
| 06/01/2029 | 5.000% | | 2,000,000 | 2,283,540 |
| Western Carolina University |
| Revenue Bonds |
| General |
| Series 2018 |
| 10/01/2033 | 5.000% | | 250,000 | 291,898 |
| 10/01/2034 | 5.000% | | 575,000 | 667,086 |
| Total | 16,830,496 |
| Hospital 12.9% |
| Charlotte-Mecklenburg Hospital Authority (The) |
| Refunding Revenue Bonds |
| Carolinas Health Care System Group |
| Series 2009A |
| 01/15/2021 | 5.000% | | 1,000,000 | 1,022,010 |
| County of New Hanover |
| Refunding Revenue Bonds |
| New Hanover Regional Medical Center |
| Series 2017 |
| 10/01/2030 | 5.000% | | 1,200,000 | 1,387,008 |
| North Carolina Medical Care Commission |
| Refunding Revenue Bonds |
| Mission Health System, Inc. |
| Series 2015 |
| 10/01/2036 | 5.000% | | 2,515,000 | 2,577,498 |
| Novant Health Obligation Group |
| Series 2013 |
| 11/01/2024 | 5.000% | | 530,000 | 589,132 |
| Southeastern Regional Medical Center |
| Series 2012 |
| 06/01/2026 | 5.000% | | 1,000,000 | 1,094,760 |
| Vidant Health |
| Series 2012A |
| 06/01/2025 | 5.000% | | 1,500,000 | 1,648,260 |
| 06/01/2036 | 5.000% | | 1,445,000 | 1,557,493 |
| Series 2015 |
| 06/01/2030 | 5.000% | | 1,000,000 | 1,130,790 |
The accompanying Notes to Financial Statements are an integral part of this statement.
Columbia AMT-Free North Carolina Intermediate Muni Bond Fund | Annual Report 2018
| 7 |
Portfolio of Investments (continued)
April 30, 2018
| Municipal Bonds (continued) |
| Issue Description | Coupon
Rate | | Principal
Amount ($) | Value ($) |
| WakeMed |
| Series 2012A |
| 10/01/2031 | 5.000% | | 2,000,000 | 2,191,900 |
| Revenue Bonds |
| Duke University Health System |
| Series 2012A |
| 06/01/2032 | 5.000% | | 3,635,000 | 3,988,358 |
| Moses Cone Health System |
| Series 2011 |
| 10/01/2020 | 5.000% | | 3,215,000 | 3,430,148 |
| Rex Hospital, Inc. |
| Series 2015A |
| 07/01/2032 | 5.000% | | 1,000,000 | 1,120,500 |
| Total | 21,737,857 |
| Joint Power Authority 2.4% |
| North Carolina Municipal Power Agency No. 1 |
| Refunding Revenue Bonds |
| Series 2015A |
| 01/01/2031 | 5.000% | | 2,000,000 | 2,277,840 |
| Series 2016A |
| 01/01/2028 | 5.000% | | 1,500,000 | 1,738,110 |
| Total | 4,015,950 |
| Local Appropriation 20.3% |
| City of Durham(a) |
| Revenue Bonds |
| Series 2018 |
| 04/01/2034 | 4.000% | | 1,000,000 | 1,055,190 |
| City of Kannapolis |
| Revenue Bonds |
| Series 2014 |
| 04/01/2031 | 5.000% | | 1,365,000 | 1,505,677 |
| City of Monroe |
| Refunding Revenue Bonds |
| Series 2016 |
| 03/01/2033 | 4.000% | | 800,000 | 830,496 |
| 03/01/2035 | 5.000% | | 1,000,000 | 1,123,030 |
| City of Raleigh |
| Limited Obligation Refunding Revenue Bonds |
| Series 2016 |
| 02/01/2031 | 4.000% | | 385,000 | 410,052 |
| 02/01/2032 | 4.000% | | 775,000 | 816,672 |
| City of Wilmington |
| Refunding Revenue Bonds |
| Series 2014A |
| 06/01/2028 | 5.000% | | 500,000 | 565,275 |
| City of Winston-Salem |
| Refunding Revenue Bonds |
| Series 2014C |
| 06/01/2029 | 5.000% | | 750,000 | 847,020 |
| Municipal Bonds (continued) |
| Issue Description | Coupon
Rate | | Principal
Amount ($) | Value ($) |
| County of Brunswick |
| Revenue Bonds |
| Series 2015A |
| 06/01/2028 | 5.000% | | 250,000 | 287,348 |
| 06/01/2029 | 5.000% | | 250,000 | 286,480 |
| County of Buncombe |
| Revenue Bonds |
| Series 2012 |
| 06/01/2028 | 5.000% | | 500,000 | 551,465 |
| 06/01/2029 | 5.000% | | 1,000,000 | 1,101,700 |
| Series 2014A |
| 06/01/2032 | 5.000% | | 1,635,000 | 1,831,887 |
| County of Cabarru |
| Revenue Bonds |
| Installment Financing Contract |
| Series 2016 |
| 04/01/2028 | 5.000% | | 1,000,000 | 1,161,330 |
| County of Cabarrus |
| Revenue Bonds |
| Installment Financing Contract |
| Series 2017 |
| 06/01/2033 | 4.000% | | 500,000 | 528,870 |
| County of Catawba |
| Revenue Bonds |
| Series 2011 |
| 10/01/2022 | 5.000% | | 400,000 | 434,432 |
| County of Cumberland |
| Refunding Certificate of Participation |
| Improvement Projects |
| Series 2009-B1 |
| 12/01/2021 | 5.000% | | 2,775,000 | 2,906,063 |
| County of Dare |
| Refunding Revenue Bonds |
| Series 2016A |
| 06/01/2031 | 4.000% | | 225,000 | 236,412 |
| County of Davidson |
| Revenue Bonds |
| Series 2016 |
| 06/01/2029 | 5.000% | | 1,000,000 | 1,164,380 |
| County of Duplin |
| Revenue Bonds |
| Series 2016 |
| 04/01/2034 | 5.000% | | 1,000,000 | 1,120,490 |
| County of Johnston |
| Revenue Bonds |
| Series 2014 |
| 06/01/2028 | 5.000% | | 1,000,000 | 1,129,360 |
| County of Lee(a) |
| Revenue Bonds |
| Series 2018 |
| 05/01/2036 | 4.000% | | 500,000 | 523,905 |
The accompanying Notes to Financial Statements are an integral part of this statement.
| 8 | Columbia AMT-Free North Carolina Intermediate Muni Bond Fund | Annual Report 2018 |
Portfolio of Investments (continued)
April 30, 2018
| Municipal Bonds (continued) |
| Issue Description | Coupon
Rate | | Principal
Amount ($) | Value ($) |
| County of Martin |
| Refunding Revenue Bonds |
| Water & Sewer District |
| Series 2014 |
| 06/01/2030 | 4.000% | | 730,000 | 760,791 |
| County of Onslow |
| Revenue Bonds |
| Series 2015 |
| 06/01/2027 | 4.000% | | 405,000 | 438,449 |
| County of Pender |
| Revenue Bonds |
| Series 2015 |
| 04/01/2027 | 5.000% | | 1,165,000 | 1,325,852 |
| 04/01/2028 | 5.000% | | 1,290,000 | 1,457,713 |
| County of Randolph |
| Refunding Revenue Bonds |
| Series 2013C |
| 10/01/2026 | 5.000% | | 1,500,000 | 1,739,715 |
| County of Sampson |
| Refunding Revenue Bonds |
| Series 2017 |
| 09/01/2035 | 4.000% | | 1,000,000 | 1,040,280 |
| County of Union |
| Refunding Revenue Bonds |
| Series 2012 |
| 12/01/2024 | 5.000% | | 1,715,000 | 1,971,392 |
| County of Wayne |
| Revenue Bonds |
| Series 2017 |
| 06/01/2027 | 5.000% | | 350,000 | 415,366 |
| County of Wilkes |
| Refunding Revenue Bonds |
| Series 2015 |
| 06/01/2027 | 5.000% | | 500,000 | 565,735 |
| 06/01/2029 | 5.000% | | 500,000 | 563,015 |
| Durham Capital Financing Corp. |
| Refunding Revenue Bonds |
| Series 2016 |
| 12/01/2028 | 5.000% | | 630,000 | 742,417 |
| 12/01/2029 | 5.000% | | 1,100,000 | 1,291,675 |
| Mecklenburg County Public Facilities Corp. |
| Refunding Revenue Bonds |
| Series 2017 |
| 02/01/2027 | 5.000% | | 500,000 | 596,345 |
| Orange County Public Facilities Co. |
| Unrefunded Revenue Bonds |
| Series 2012 |
| 10/01/2024 | 5.000% | | 835,000 | 927,610 |
| Total | 34,253,889 |
| Municipal Bonds (continued) |
| Issue Description | Coupon
Rate | | Principal
Amount ($) | Value ($) |
| Local General Obligation 4.0% |
| City of Winston-Salem |
| Unlimited General Obligation Bonds |
| Series 2016B |
| 06/01/2023 | 5.000% | | 1,000,000 | 1,133,880 |
| County of Henderson |
| Revenue Bonds |
| Series 2015 |
| 10/01/2030 | 5.000% | | 500,000 | 573,535 |
| County of Pitt |
| Refunding Revenue Bonds |
| Series 2017 |
| 04/01/2022 | 5.000% | | 750,000 | 828,030 |
| 04/01/2024 | 5.000% | | 410,000 | 465,776 |
| County of Wake |
| Unlimited General Obligation Refunding Bonds |
| Series 2010C |
| 03/01/2022 | 5.000% | | 2,000,000 | 2,214,680 |
| Unrefunded Unlimited General Obligation Public Improvement Bonds |
| Series 2009 |
| 03/01/2020 | 5.000% | | 1,565,000 | 1,606,332 |
| Total | 6,822,233 |
| Multi-Family 3.2% |
| North Carolina Capital Facilities Finance Agency |
| Refunding Revenue Bonds |
| North Carolina A&T University Foundation Project |
| Series 2015A |
| 06/01/2028 | 5.000% | | 1,000,000 | 1,113,880 |
| The Arc of North Carolina |
| Series 2017 |
| 10/01/2034 | 5.000% | | 1,500,000 | 1,679,085 |
| Western Carolina University |
| Limited Obligation Refunding Revenue Bonds |
| Student Housing |
| Series 2016 (AGM) |
| 06/01/2027 | 5.000% | | 500,000 | 576,700 |
| 06/01/2028 | 5.000% | | 1,000,000 | 1,148,730 |
| 06/01/2029 | 5.000% | | 800,000 | 912,808 |
| Total | 5,431,203 |
| Municipal Power 2.4% |
| City of Concord Utilities Systems |
| Refunding Revenue Bonds |
| Series 2009B |
| 12/01/2019 | 5.000% | | 1,500,000 | 1,573,725 |
| City of Fayetteville Public Works Commission |
| Revenue Bonds |
| Series 2014 |
| 03/01/2027 | 4.000% | | 1,250,000 | 1,337,087 |
The accompanying Notes to Financial Statements are an integral part of this statement.
Columbia AMT-Free North Carolina Intermediate Muni Bond Fund | Annual Report 2018
| 9 |
Portfolio of Investments (continued)
April 30, 2018
| Municipal Bonds (continued) |
| Issue Description | Coupon
Rate | | Principal
Amount ($) | Value ($) |
| Greenville Utilities Commission |
| Revenue Bonds |
| Series 2008A (AGM) |
| 11/01/2018 | 5.000% | | 1,040,000 | 1,056,869 |
| Total | 3,967,681 |
| Ports 1.2% |
| North Carolina State Ports Authority |
| Revenue Bonds |
| Senior Lien |
| Series 2010B |
| 02/01/2025 | 5.000% | | 2,000,000 | 2,110,600 |
| Refunded / Escrowed 12.6% |
| City of High Point Combined Water & Sewer System |
| Prerefunded 11/01/18 Revenue Bonds |
| Series 2008 (AGM) |
| 11/01/2025 | 5.000% | | 1,000,000 | 1,016,170 |
| City of Raleigh Combined Enterprise System |
| Prerefunded 03/01/21 Revenue Bonds |
| Series 2011 |
| 03/01/2027 | 5.000% | | 800,000 | 865,248 |
| City of Winston-Salem Water & Sewer System |
| Prerefunded 06/01/19 Revenue Bonds |
| Series 2009 |
| 06/01/2023 | 5.000% | | 1,000,000 | 1,033,970 |
| County of Harnett |
| Prerefunded 06/01/19 Certificate of Participation |
| Series 2009 |
| 06/01/2022 | 5.000% | | 1,880,000 | 1,942,830 |
| County of Mecklenburg |
| Prerefunded 02/01/19 Certificate of Participation |
| Series 2009A |
| 02/01/2023 | 5.000% | | 1,000,000 | 1,024,000 |
| County of Moore |
| Prerefunded 06/01/20 Revenue Bonds |
| Series 2010 |
| 06/01/2024 | 5.000% | | 1,635,000 | 1,736,860 |
| County of Wake |
| Prerefunded 10/01/26 Revenue Bonds |
| Series 1993 (NPFGC) |
| 10/01/2026 | 5.125% | | 2,500,000 | 2,749,825 |
| Jacksonville Public Facilities Corp. |
| Prerefunded 04/01/22 Limited Obligation Revenue Bonds |
| Series 2012 |
| 04/01/2026 | 5.000% | | 1,075,000 | 1,188,122 |
| North Carolina Capital Facilities Finance Agency |
| Prerefunded 01/01/19 Revenue Bonds |
| Wake Forest University |
| Series 2009 |
| 01/01/2026 | 5.000% | | 1,000,000 | 1,021,070 |
| Municipal Bonds (continued) |
| Issue Description | Coupon
Rate | | Principal
Amount ($) | Value ($) |
| Prerefunded 06/01/18 Revenue Bonds |
| Meredith College |
| Series 2008A |
| 06/01/2031 | 6.000% | | 30,000 | 30,103 |
| North Carolina Eastern Municipal Power Agency |
| Prerefunded 01/01/19 Revenue Bonds |
| Series 2009B |
| 01/01/2026 | 5.000% | | 1,500,000 | 1,531,605 |
| Prerefunded 01/01/22 Revenue Bonds |
| Series 1988A |
| 01/01/2026 | 6.000% | | 1,000,000 | 1,136,430 |
| Refunding Revenue Bonds |
| Series 1993B Escrowed to Maturity (NPFGC / IBC) |
| 01/01/2022 | 6.000% | | 3,000,000 | 3,386,640 |
| Series 1993B Escrowed to Maturity (NPFGC) |
| 01/01/2022 | 6.000% | | 1,000,000 | 1,134,540 |
| Orange County Public Facilities Co. |
| Prerefunded 10/01/22 Revenue Bonds |
| Series 2012 |
| 10/01/2024 | 5.000% | | 490,000 | 545,870 |
| University of North Carolina System |
| Prerefunded 10/01/18 Revenue Bonds |
| Series 2008A (AGM) |
| 10/01/2022 | 5.000% | | 985,000 | 998,081 |
| Total | 21,341,364 |
| Retirement Communities 4.1% |
| North Carolina Medical Care Commission |
| Refunding Revenue Bonds |
| 1st Mortgage-United Church |
| Series 2015A |
| 09/01/2030 | 4.500% | | 1,000,000 | 1,028,870 |
| 1st Mortgage-United Methodist |
| Series 2013A |
| 10/01/2033 | 5.000% | | 1,595,000 | 1,706,331 |
| Deerfield Episcopal Retirement Community |
| Series 2016 |
| 11/01/2031 | 5.000% | | 1,000,000 | 1,132,990 |
| Pennybyrn at Maryfield |
| Series 2015 |
| 10/01/2025 | 5.000% | | 750,000 | 822,885 |
| Southminster, Inc. |
| Series 2016 |
| 10/01/2025 | 5.000% | | 1,260,000 | 1,391,973 |
| United Methodist Retirement |
| Series 2016 |
| 10/01/2030 | 5.000% | | 700,000 | 780,255 |
| Total | 6,863,304 |
The accompanying Notes to Financial Statements are an integral part of this statement.
| 10 | Columbia AMT-Free North Carolina Intermediate Muni Bond Fund | Annual Report 2018 |
Portfolio of Investments (continued)
April 30, 2018
| Municipal Bonds (continued) |
| Issue Description | Coupon
Rate | | Principal
Amount ($) | Value ($) |
| Sales Tax 0.7% |
| City of Rocky Mount |
| Revenue Bonds |
| Series 2016 |
| 05/01/2028 | 5.000% | | 1,000,000 | 1,155,110 |
| Single Family 1.2% |
| North Carolina Housing Finance Agency |
| Revenue Bonds |
| Series 2017-38B |
| 07/01/2037 | 3.850% | | 2,000,000 | 2,021,980 |
| State Appropriated 1.4% |
| State of North Carolina |
| Refunding Revenue Bonds |
| Series 2014B |
| 06/01/2025 | 5.000% | | 2,000,000 | 2,326,820 |
| Transportation 0.6% |
| State of North Carolina |
| Revenue Bonds |
| Vehicle - GARVEE |
| Series 2015 |
| 03/01/2027 | 5.000% | | 900,000 | 1,034,352 |
| Turnpike / Bridge / Toll Road 2.3% |
| North Carolina Turnpike Authority |
| Refunding Revenue Bonds |
| Senior Lien |
| Series 2017 |
| 01/01/2030 | 5.000% | | 1,700,000 | 1,936,776 |
| 01/01/2032 | 5.000% | | 700,000 | 790,699 |
| Series 2017 (AGM) |
| 01/01/2031 | 5.000% | | 750,000 | 860,580 |
| North Carolina Turnpike Authority(b) |
| Revenue Bonds |
| Series 2017C |
| 07/01/2031 | 0.000% | | 500,000 | 285,230 |
| Total | 3,873,285 |
| Water & Sewer 14.0% |
| City of Charlotte Water & Sewer System |
| Refunding Revenue Bonds |
| Series 2018 |
| 07/01/2035 | 4.000% | | 2,000,000 | 2,121,760 |
| Revenue Bonds |
| Series 2009B |
| 07/01/2025 | 5.000% | | 5,835,000 | 6,217,834 |
| City of Gastonia Combined Utilities System |
| Revenue Bonds |
| Series 2015 |
| 05/01/2029 | 5.000% | | 265,000 | 302,354 |
| 05/01/2030 | 5.000% | | 660,000 | 751,238 |
| Municipal Bonds (continued) |
| Issue Description | Coupon
Rate | | Principal
Amount ($) | Value ($) |
| City of Greensboro Combined Water & Sewer System |
| Refunding Revenue Bonds |
| Series 2006 |
| 06/01/2022 | 5.250% | | 1,200,000 | 1,346,064 |
| 06/01/2023 | 5.250% | | 2,000,000 | 2,287,540 |
| City of Jacksonville Enterprise System |
| Refunding Revenue Bonds |
| Series 2016 |
| 05/01/2028 | 5.250% | | 250,000 | 303,088 |
| City of Raleigh Combined Enterprise System |
| Refunding Revenue Bonds |
| Series 2015B |
| 12/01/2025 | 5.000% | | 1,200,000 | 1,416,876 |
| City of Thomasville Combined Enterprise System |
| Refunding Revenue Bonds |
| Series 2012 |
| 05/01/2026 | 4.000% | | 860,000 | 897,780 |
| City of Winston-Salem Water & Sewer System |
| Refunding Revenue Bonds |
| Series 2016A |
| 06/01/2033 | 4.000% | | 2,165,000 | 2,306,483 |
| Revenue Bonds |
| Series 2017 |
| 06/01/2031 | 4.000% | | 400,000 | 432,244 |
| County of Brunswick Enterprise Systems |
| Refunding Revenue Bonds |
| Series 2015 |
| 04/01/2027 | 5.000% | | 1,500,000 | 1,726,440 |
| County of Dare Utilities System |
| Refunding Revenue Bonds |
| Series 2017 |
| 02/01/2032 | 4.000% | | 300,000 | 319,116 |
| County of Union Enterprise System |
| Revenue Bonds |
| Series 2015 |
| 06/01/2029 | 5.000% | | 500,000 | 576,125 |
| Onslow Water & Sewer Authority |
| Refunding Revenue Bonds |
| Series 2016 |
| 12/01/2031 | 4.000% | | 1,640,000 | 1,747,879 |
| Town of Fuquay-Varina Combined Utilities System |
| Revenue Bonds |
| Series 2016 |
| 04/01/2030 | 5.000% | | 335,000 | 387,756 |
| 04/01/2031 | 5.000% | | 450,000 | 518,450 |
| Total | 23,659,027 |
Total Municipal Bonds
(Cost $157,978,161) | 160,157,401 |
The accompanying Notes to Financial Statements are an integral part of this statement.
Columbia AMT-Free North Carolina Intermediate Muni Bond Fund | Annual Report 2018
| 11 |
Portfolio of Investments (continued)
April 30, 2018
| Money Market Funds 2.4% |
| | Shares | Value ($) |
| Dreyfus Tax-Exempt Cash Management Fund, Institutional Shares, 1.450%(c) | 4,003,554 | 4,003,554 |
Total Money Market Funds
(Cost $4,003,554) | 4,003,554 |
Total Investments in Securities
(Cost: $161,981,715) | 164,160,955 |
| Other Assets & Liabilities, Net | | 4,525,789 |
| Net Assets | 168,686,744 |
Notes to Portfolio of Investments
| (a) | Represents a security purchased on a when-issued basis. |
| (b) | Zero coupon bond. |
| (c) | The rate shown is the seven-day current annualized yield at April 30, 2018. |
Abbreviation Legend
| AGM | Assured Guaranty Municipal Corporation |
| IBC | Insurance Bond Certificate |
| NPFGC | National Public Finance Guarantee Corporation |
Fair value measurements
The Fund categorizes its fair value measurements according to a three-level hierarchy that maximizes the use of observable inputs and minimizes the use of unobservable inputs by prioritizing that the most observable input be used when available. Observable inputs are those that market participants would use in pricing an investment based on market data obtained from sources independent of the reporting entity. Unobservable inputs are those that reflect the Fund’s assumptions about the information market participants would use in pricing an investment. An investment’s level within the fair value hierarchy is based on the lowest level of any input that is deemed significant to the asset’s or liability’s fair value measurement. The input levels are not necessarily an indication of the risk or liquidity associated with investments at that level. For example, certain U.S. government securities are generally high quality and liquid, however, they are reflected as Level 2 because the inputs used to determine fair value may not always be quoted prices in an active market.
Fair value inputs are summarized in the three broad levels listed below:
| ■ | Level 1 — Valuations based on quoted prices for investments in active markets that the Fund has the ability to access at the measurement date. Valuation adjustments are not applied to Level 1 investments. |
| ■ | Level 2 — Valuations based on other significant observable inputs (including quoted prices for similar securities, interest rates, prepayment speeds, credit risks, etc.). |
| ■ | Level 3 — Valuations based on significant unobservable inputs (including the Fund’s own assumptions and judgment in determining the fair value of investments). |
Inputs that are used in determining fair value of an investment may include price information, credit data, volatility statistics, and other factors. These inputs can be either observable or unobservable. The availability of observable inputs can vary between investments, and is affected by various factors such as the type of investment, and the volume and level of activity for that investment or similar investments in the marketplace. The inputs will be considered by the Investment Manager, along with any other relevant factors in the calculation of an investment’s fair value. The Fund uses prices and inputs that are current as of the measurement date, which may include periods of market dislocations. During these periods, the availability of prices and inputs may be reduced for many investments. This condition could cause an investment to be reclassified between the various levels within the hierarchy.
Investments falling into the Level 3 category are primarily supported by quoted prices from brokers and dealers participating in the market for those investments. However, these may be classified as Level 3 investments due to lack of market transparency and corroboration to support these quoted prices. Additionally, valuation models may be used as the pricing source for any remaining investments classified as Level 3. These models may rely on one or more significant unobservable inputs and/or significant assumptions by the Investment Manager. Inputs used in valuations may include, but are not limited to, financial statement analysis, capital account balances, discount rates and estimated cash flows, and comparable company data.
Under the direction of the Fund’s Board of Trustees (the Board), the Investment Manager’s Valuation Committee (the Committee) is responsible for overseeing the valuation procedures approved by the Board. The Committee consists of voting and non-voting members from various groups within the Investment Manager’s organization, including operations and accounting, trading and investments, compliance, risk management and legal.
The Committee meets at least monthly to review and approve valuation matters, which may include a description of specific valuation determinations, data regarding pricing information received from approved pricing vendors and brokers and the results of Board-approved valuation control policies and procedures (the Policies). The Policies address, among other things, instances when market quotations are or are not readily available, including recommendations of third party pricing vendors and a determination of appropriate pricing methodologies; events that require specific valuation determinations and assessment of fair value techniques; securities with a potential for stale pricing, including those that are illiquid, restricted, or in default; and the effectiveness of third party pricing vendors, including periodic reviews of vendors. The Committee meets more frequently, as needed, to discuss additional valuation matters, which may include the need to review back-testing results, review time-sensitive information or approve related valuation actions. The Committee reports to the Board, with members of the Committee meeting with the Board at each of its regularly scheduled meetings to discuss valuation matters and actions during the period, similar to those described earlier.
The accompanying Notes to Financial Statements are an integral part of this statement.
| 12 | Columbia AMT-Free North Carolina Intermediate Muni Bond Fund | Annual Report 2018 |
Portfolio of Investments (continued)
April 30, 2018
Fair value measurements (continued)
For investments categorized as Level 3, the Committee monitors information similar to that described above, which may include: (i) data specific to the issuer or comparable issuers, (ii) general market or specific sector news and (iii) quoted prices and specific or similar security transactions. The Committee considers this data and any changes from prior periods in order to assess the reasonableness of observable and unobservable inputs, any assumptions or internal models used to value those securities and changes in fair value. This data is also used to corroborate, when available, information received from approved pricing vendors and brokers. Various factors impact the frequency of monitoring this information (which may occur as often as daily). However, the Committee may determine that changes to inputs, assumptions and models are not required as a result of the monitoring procedures performed.
The following table is a summary of the inputs used to value the Fund’s investments at April 30, 2018:
| | Level 1
quoted prices in active
markets for identical
assets ($) | Level 2
other significant
observable inputs ($) | Level 3
significant
unobservable inputs ($) | Total ($) |
| Investments in Securities | | | | |
| Municipal Bonds | — | 160,157,401 | — | 160,157,401 |
| Money Market Funds | 4,003,554 | — | — | 4,003,554 |
| Total Investments in Securities | 4,003,554 | 160,157,401 | — | 164,160,955 |
See the Portfolio of Investments for all investment classifications not indicated in the table.
The Fund’s assets assigned to the Level 2 input category are generally valued using the market approach, in which a security’s value is determined through reference to prices and information from market transactions for similar or identical assets.
There were no transfers of financial assets between levels during the period.
The accompanying Notes to Financial Statements are an integral part of this statement.
Columbia AMT-Free North Carolina Intermediate Muni Bond Fund | Annual Report 2018
| 13 |
Statement of Assets and Liabilities
April 30, 2018
| Assets | |
| Investments in securities, at value | |
| Unaffiliated issuers (cost $161,981,715) | $164,160,955 |
| Cash | 4,750,075 |
| Receivable for: | |
| Capital shares sold | 138,088 |
| Interest | 1,949,315 |
| Expense reimbursement due from Investment Manager | 711 |
| Prepaid expenses | 633 |
| Total assets | 170,999,777 |
| Liabilities | |
| Payable for: | |
| Investments purchased on a delayed delivery basis | 1,580,410 |
| Capital shares purchased | 221,453 |
| Distributions to shareholders | 352,365 |
| Management services fees | 6,513 |
| Distribution and/or service fees | 808 |
| Transfer agent fees | 4,436 |
| Compensation of board members | 110,355 |
| Other expenses | 36,693 |
| Total liabilities | 2,313,033 |
| Net assets applicable to outstanding capital stock | $168,686,744 |
| Represented by | |
| Paid in capital | 166,294,200 |
| Undistributed net investment income | 737,022 |
| Accumulated net realized loss | (523,718) |
| Unrealized appreciation (depreciation) on: | |
| Investments - unaffiliated issuers | 2,179,240 |
| Total - representing net assets applicable to outstanding capital stock | $168,686,744 |
| Class A | |
| Net assets | $18,035,294 |
| Shares outstanding | 1,779,308 |
| Net asset value per share | $10.14 |
| Maximum sales charge | 3.00% |
| Maximum offering price per share (calculated by dividing the net asset value per share by 1.0 minus the maximum sales charge for Class A shares) | $10.45 |
| Advisor Class | |
| Net assets | $4,588,608 |
| Shares outstanding | 453,344 |
| Net asset value per share | $10.12 |
| Class C | |
| Net assets | $5,337,840 |
| Shares outstanding | 526,790 |
| Net asset value per share | $10.13 |
| Institutional Class | |
| Net assets | $22,984,384 |
| Shares outstanding | 2,269,774 |
| Net asset value per share | $10.13 |
| Institutional 3 Class | |
| Net assets | $117,740,618 |
| Shares outstanding | 11,592,339 |
| Net asset value per share | $10.16 |
The accompanying Notes to Financial Statements are an integral part of this statement.
| 14 | Columbia AMT-Free North Carolina Intermediate Muni Bond Fund | Annual Report 2018 |
Statement of Operations
Year Ended April 30, 2018
| Net investment income | |
| Income: | |
| Dividends — unaffiliated issuers | $3,554 |
| Interest | 5,540,735 |
| Total income | 5,544,289 |
| Expenses: | |
| Management services fees | 830,014 |
| Distribution and/or service fees | |
| Class A | 46,806 |
| Class B | 27 |
| Class C | 57,256 |
| Transfer agent fees | |
| Class A | 19,608 |
| Advisor Class | 3,427 |
| Class B | 4 |
| Class C | 6,108 |
| Institutional Class | 88,780 |
| Institutional 3 Class | 6,559 |
| Compensation of board members | 24,294 |
| Custodian fees | 2,307 |
| Printing and postage fees | 11,576 |
| Registration fees | 9,380 |
| Audit fees | 31,520 |
| Legal fees | 8,641 |
| Compensation of chief compliance officer | 38 |
| Other | 12,172 |
| Total expenses | 1,158,517 |
| Fees waived or expenses reimbursed by Investment Manager and its affiliates | (126,744) |
| Total net expenses | 1,031,773 |
| Net investment income | 4,512,516 |
| Realized and unrealized gain (loss) — net | |
| Net realized gain (loss) on: | |
| Investments — unaffiliated issuers | 317,651 |
| Net realized gain | 317,651 |
| Net change in unrealized appreciation (depreciation) on: | |
| Investments — unaffiliated issuers | (3,422,166) |
| Net change in unrealized appreciation (depreciation) | (3,422,166) |
| Net realized and unrealized loss | (3,104,515) |
| Net increase in net assets resulting from operations | $1,408,001 |
The accompanying Notes to Financial Statements are an integral part of this statement.
Columbia AMT-Free North Carolina Intermediate Muni Bond Fund | Annual Report 2018
| 15 |
Statement of Changes in Net Assets
| | Year Ended
April 30, 2018 | Year Ended
April 30, 2017 (a) |
| Operations | | |
| Net investment income | $4,512,516 | $5,710,366 |
| Net realized gain (loss) | 317,651 | (660,541) |
| Net change in unrealized appreciation (depreciation) | (3,422,166) | (8,001,562) |
| Net increase (decrease) in net assets resulting from operations | 1,408,001 | (2,951,737) |
| Distributions to shareholders | | |
| Net investment income | | |
| Class A | (434,002) | (569,495) |
| Advisor Class | (87,808) | (82,476) |
| Class B | (43) | (1,236) |
| Class C | (89,726) | (124,781) |
| Institutional Class | (1,704,355) | (4,943,178) |
| Institutional 3 Class | (2,169,888) | (47) |
| Total distributions to shareholders | (4,485,822) | (5,721,213) |
| Decrease in net assets from capital stock activity | (13,745,957) | (36,679,708) |
| Total decrease in net assets | (16,823,778) | (45,352,658) |
| Net assets at beginning of year | 185,510,522 | 230,863,180 |
| Net assets at end of year | $168,686,744 | $185,510,522 |
| Undistributed net investment income | $737,022 | $710,338 |
| (a) | Institutional 3 Class shares are based on operations from March 1, 2017 (commencement of operations) through the stated period end. |
The accompanying Notes to Financial Statements are an integral part of this statement.
| 16 | Columbia AMT-Free North Carolina Intermediate Muni Bond Fund | Annual Report 2018 |
Statement of Changes in Net Assets (continued)
| | Year Ended | Year Ended |
| | April 30, 2018 | April 30, 2017 (a) |
| | Shares | Dollars ($) | Shares | Dollars ($) |
| Capital stock activity |
| Class A | | | | |
| Subscriptions | 312,821 | 3,253,670 | 225,286 | 2,349,062 |
| Distributions reinvested | 31,969 | 330,562 | 43,081 | 452,531 |
| Redemptions | (331,461) | (3,440,215) | (1,083,668) | (11,218,615) |
| Net increase (decrease) | 13,329 | 144,017 | (815,301) | (8,417,022) |
| Advisor Class | | | | |
| Subscriptions | 393,222 | 4,073,654 | 48,806 | 510,683 |
| Distributions reinvested | 8,502 | 87,554 | 7,846 | 82,211 |
| Redemptions | (165,042) | (1,698,820) | (163,597) | (1,693,297) |
| Net increase (decrease) | 236,682 | 2,462,388 | (106,945) | (1,100,403) |
| Class B | | | | |
| Distributions reinvested | — | — | 101 | 1,061 |
| Redemptions | (951) | (10,034) | (9,001) | (92,943) |
| Net decrease | (951) | (10,034) | (8,900) | (91,882) |
| Class C | | | | |
| Subscriptions | 60,057 | 619,419 | 100,590 | 1,059,458 |
| Distributions reinvested | 7,823 | 80,884 | 9,937 | 104,109 |
| Redemptions | (187,979) | (1,951,783) | (213,792) | (2,219,056) |
| Net decrease | (120,099) | (1,251,480) | (103,265) | (1,055,489) |
| Institutional Class | | | | |
| Subscriptions | 982,194 | 10,197,292 | 4,436,223 | 46,507,866 |
| Distributions reinvested | 58,965 | 609,718 | 65,139 | 681,191 |
| Redemptions | (14,109,130) | (147,200,886) | (7,095,034) | (73,213,969) |
| Net decrease | (13,067,971) | (136,393,876) | (2,593,672) | (26,024,912) |
| Institutional 3 Class | | | | |
| Subscriptions | 14,062,000 | 146,913,622 | 973 | 10,000 |
| Distributions reinvested | 6,574 | 67,724 | — | — |
| Redemptions | (2,477,208) | (25,678,318) | — | — |
| Net increase | 11,591,366 | 121,303,028 | 973 | 10,000 |
| Total net decrease | (1,347,644) | (13,745,957) | (3,627,110) | (36,679,708) |
| (a) | Institutional 3 Class shares are based on operations from March 1, 2017 (commencement of operations) through the stated period end. |
The accompanying Notes to Financial Statements are an integral part of this statement.
Columbia AMT-Free North Carolina Intermediate Muni Bond Fund | Annual Report 2018
| 17 |
The following table is intended to help you understand the Fund’s financial performance. Certain information reflects financial results for a single share of a class held for the periods shown. Per share net investment income (loss) amounts are calculated based on average shares outstanding during the period. Total return assumes reinvestment of all dividends and distributions, if any. Total return does not reflect payment of sales charges, if any. Total return and portfolio turnover are not annualized for periods of less than one year. The portfolio turnover rate is calculated without regard to purchase and sales transactions of short-term instruments and certain derivatives, if any. If such transactions were included, the Fund’s portfolio turnover rate may be higher.
| | Net asset value,
beginning of
period | Net
investment
income | Net
realized
and
unrealized
gain (loss) | Total from
investment
operations | Distributions
from net
investment
income |
| Class A |
| Year Ended 4/30/2018 | $10.33 | 0.24 | (0.19) | 0.05 | (0.24) |
| Year Ended 4/30/2017 | $10.70 | 0.25 | (0.37) | (0.12) | (0.25) |
| Year Ended 4/30/2016 | $10.58 | 0.27 | 0.12 | 0.39 | (0.27) |
| Year Ended 4/30/2015 | $10.61 | 0.28 | (0.03) | 0.25 | (0.28) |
| Year Ended 4/30/2014 | $10.94 | 0.30 | (0.33) | (0.03) | (0.30) |
| Advisor Class |
| Year Ended 4/30/2018 | $10.32 | 0.27 | (0.20) | 0.07 | (0.27) |
| Year Ended 4/30/2017 | $10.69 | 0.28 | (0.37) | (0.09) | (0.28) |
| Year Ended 4/30/2016 | $10.57 | 0.30 | 0.12 | 0.42 | (0.30) |
| Year Ended 4/30/2015 | $10.60 | 0.31 | (0.03) | 0.28 | (0.31) |
| Year Ended 4/30/2014 | $10.93 | 0.33 | (0.33) | 0.00 (c) | (0.33) |
| Class C |
| Year Ended 4/30/2018 | $10.33 | 0.16 | (0.20) | (0.04) | (0.16) |
| Year Ended 4/30/2017 | $10.70 | 0.17 | (0.37) | (0.20) | (0.17) |
| Year Ended 4/30/2016 | $10.58 | 0.19 | 0.12 | 0.31 | (0.19) |
| Year Ended 4/30/2015 | $10.61 | 0.20 | (0.03) | 0.17 | (0.20) |
| Year Ended 4/30/2014 | $10.94 | 0.22 | (0.33) | (0.11) | (0.22) |
| Institutional Class |
| Year Ended 4/30/2018 | $10.32 | 0.27 | (0.19) | 0.08 | (0.27) |
| Year Ended 4/30/2017 | $10.69 | 0.28 | (0.37) | (0.09) | (0.28) |
| Year Ended 4/30/2016 | $10.57 | 0.30 | 0.12 | 0.42 | (0.30) |
| Year Ended 4/30/2015 | $10.60 | 0.31 | (0.03) | 0.28 | (0.31) |
| Year Ended 4/30/2014 | $10.93 | 0.32 | (0.32) | 0.00 (c) | (0.33) |
| Institutional 3 Class |
| Year Ended 4/30/2018 | $10.35 | 0.28 | (0.19) | 0.09 | (0.28) |
| Year Ended 4/30/2017(d) | $10.28 | 0.05 | 0.07 (e) | 0.12 | (0.05) |
| Notes to Financial Highlights |
| (a) | In addition to the fees and expenses that the Fund bears directly, the Fund indirectly bears a pro rata share of the fees and expenses of any other funds in which it invests. Such indirect expenses are not included in the Fund’s reported expense ratios. |
| (b) | Total net expenses include the impact of certain fee waivers/expense reimbursements made by the Investment Manager and certain of its affiliates, if applicable. |
| (c) | Rounds to zero. |
| (d) | Institutional 3 Class shares commenced operations on March 1, 2017. Per share data and total return reflect activity from that date. |
| (e) | Calculation of the net gain (loss) per share (both realized and unrealized) does not correlate to the aggregate realized and unrealized gain (loss) presented in the Statement of Operations due to the timing of subscriptions and redemptions of Fund shares in relation to fluctuations in the market value of the portfolio. |
| (f) | Annualized. |
The accompanying Notes to Financial Statements are an integral part of this statement.
| 18 | Columbia AMT-Free North Carolina Intermediate Muni Bond Fund | Annual Report 2018 |
Total
distributions to
shareholders | Net
asset
value,
end of
period | Total
return | Total gross
expense
ratio to
average
net assets(a) | Total net
expense
ratio to
average
net assets(a),(b) | Net investment
income
ratio to
average
net assets | Portfolio
turnover | Net
assets,
end of
period
(000’s) |
| |
| (0.24) | $10.14 | 0.48% | 0.88% | 0.81% | 2.33% | 10% | $18,035 |
| (0.25) | $10.33 | (1.11%) | 0.96% | 0.81% | 2.39% | 12% | $18,246 |
| (0.27) | $10.70 | 3.77% | 0.97% | 0.81% | 2.57% | 11% | $27,616 |
| (0.28) | $10.58 | 2.41% | 0.98% | 0.81% | 2.67% | 6% | $24,948 |
| (0.30) | $10.61 | (0.22%) | 0.99% | 0.81% | 2.84% | 3% | $27,797 |
| |
| (0.27) | $10.12 | 0.63% | 0.63% | 0.56% | 2.57% | 10% | $4,589 |
| (0.28) | $10.32 | (0.86%) | 0.71% | 0.56% | 2.64% | 12% | $2,236 |
| (0.30) | $10.69 | 4.03% | 0.72% | 0.56% | 2.83% | 11% | $3,458 |
| (0.31) | $10.57 | 2.67% | 0.74% | 0.56% | 2.92% | 6% | $3,675 |
| (0.33) | $10.60 | 0.03% | 0.76% | 0.56% | 3.17% | 3% | $1,737 |
| |
| (0.16) | $10.13 | (0.38%) | 1.63% | 1.56% | 1.58% | 10% | $5,338 |
| (0.17) | $10.33 | (1.85%) | 1.71% | 1.56% | 1.65% | 12% | $6,682 |
| (0.19) | $10.70 | 3.00% | 1.73% | 1.56% | 1.82% | 11% | $8,023 |
| (0.20) | $10.58 | 1.65% | 1.73% | 1.56% | 1.92% | 6% | $7,227 |
| (0.22) | $10.61 | (0.96%) | 1.74% | 1.56% | 2.09% | 3% | $7,015 |
| |
| (0.27) | $10.13 | 0.72% | 0.65% | 0.56% | 2.55% | 10% | $22,984 |
| (0.28) | $10.32 | (0.86%) | 0.71% | 0.56% | 2.65% | 12% | $158,327 |
| (0.30) | $10.69 | 4.03% | 0.73% | 0.56% | 2.82% | 11% | $191,661 |
| (0.31) | $10.57 | 2.67% | 0.73% | 0.56% | 2.92% | 6% | $149,878 |
| (0.33) | $10.60 | 0.03% | 0.74% | 0.56% | 3.09% | 3% | $125,420 |
| |
| (0.28) | $10.16 | 0.83% | 0.54% | 0.48% | 2.68% | 10% | $117,741 |
| (0.05) | $10.35 | 1.15% | 0.55% (f) | 0.42% (f) | 2.87% (f) | 12% | $10 |
Columbia AMT-Free North Carolina Intermediate Muni Bond Fund | Annual Report 2018
| 19 |
Notes to Financial Statements
April 30, 2018
Note 1. Organization
Columbia AMT-Free North Carolina Intermediate Muni Bond Fund (the Fund), a series of Columbia Funds Series Trust (the Trust), is a diversified fund. The Trust is registered under the Investment Company Act of 1940, as amended (the 1940 Act), as an open-end management investment company organized as a Delaware statutory trust.
Fund shares
The Trust may issue an unlimited number of shares (without par value). Although all share classes generally have identical voting, dividend and liquidation rights, each share class votes separately when required by the Trust’s organizational documents or by law. Different share classes pay different distribution amounts to the extent the expenses of such share classes differ, and distributions in liquidation will be proportional to the net asset value of each share class. Each share class has its own expense and sales charge structure. The Fund offers each of the share classes identified below.
Class A shares are subject to a maximum front-end sales charge of 3.00% based on the initial investment amount. Class A shares purchased without an initial sales charge are subject to a contingent deferred sales charge (CDSC) of 0.75% on certain investments of $500,000 or more if redeemed within 12 months after purchase.
Advisor Class shares are not subject to sales charges and are generally available only to omnibus retirement plans and certain investors as described in the Fund’s prospectus. Prior to November 1, 2017, Advisor Class shares were known as Class R4 shares.
Class B shares of the Fund are no longer offered for sale. When available, Class B shares were subject to a maximum CDSC of 3.00% based upon the holding period after purchase. Effective July 17, 2017, Class B shares were automatically converted to Class A shares without a CDSC. On August 4, 2017, the capital owned by Columbia Management Investment Advisers, LLC in Class B shares was redeemed without a CDSC.
Class C shares are subject to a 1.00% CDSC on shares redeemed within 12 months after purchase.
Institutional Class shares are not subject to sales charges and are generally available only to eligible investors, which are subject to different investment minimums as described in the Fund’s prospectus. Prior to November 1, 2017, Institutional Class shares were known as Class Z shares.
Institutional 3 Class shares are not subject to sales charges and are available to institutional and certain other investors as described in the Fund’s prospectus. Prior to November 1, 2017, Institutional 3 Class shares were known as Class Y shares.
Note 2. Summary of significant accounting policies
Basis of preparation
The Fund is an investment company that applies the accounting and reporting guidance in the Financial Accounting Standards Board (FASB) Accounting Standards Codification Topic 946, Financial Services - Investment Companies (ASC 946). The financial statements are prepared in accordance with U.S. generally accepted accounting principles (GAAP), which requires management to make certain estimates and assumptions that affect the reported amounts of assets and liabilities, the disclosure of contingent assets and liabilities at the date of the financial statements and the reported amounts of income and expenses during the reporting period. Actual results could differ from those estimates.
The following is a summary of significant accounting policies followed by the Fund in the preparation of its financial statements.
Security valuation
Debt securities generally are valued by pricing services approved by the Board of Trustees based upon market transactions for normal, institutional-size trading units of similar securities. The services may use various pricing techniques that take into account, as applicable, factors such as yield, quality, coupon rate, maturity, type of issue, trading characteristics and other data, as well as approved independent broker-dealer quotes. Debt securities for which quotations are not readily available or
| 20 | Columbia AMT-Free North Carolina Intermediate Muni Bond Fund | Annual Report 2018 |
Notes to Financial Statements (continued)
April 30, 2018
not believed to be reflective of market value may also be valued based upon a bid quote from an approved independent broker-dealer. Debt securities maturing in 60 days or less are valued primarily at amortized cost value, unless this method results in a valuation that management believes does not approximate market value.
Investments in open-end investment companies, including money market funds, are valued at their latest net asset value.
Investments for which market quotations are not readily available, or that have quotations which management believes are not reflective of market value or reliable, are valued at fair value as determined in good faith under procedures approved by and under the general supervision of the Board of Trustees. If a security or class of securities (such as foreign securities) is valued at fair value, such value is likely to be different from the quoted or published price for the security.
The determination of fair value often requires significant judgment. To determine fair value, management may use assumptions including but not limited to future cash flows and estimated risk premiums. Multiple inputs from various sources may be used to determine fair value.
GAAP requires disclosure regarding the inputs and valuation techniques used to measure fair value and any changes in valuation inputs or techniques. In addition, investments shall be disclosed by major category. This information is disclosed following the Fund’s Portfolio of Investments.
Delayed delivery securities
The Fund may trade securities on other than normal settlement terms, including securities purchased or sold on a “when-issued” or "forward commitment" basis. This may increase risk to the Fund since the other party to the transaction may fail to deliver, which could cause the Fund to subsequently invest at less advantageous prices. The Fund designates cash or liquid securities in an amount equal to the delayed delivery commitment.
Security transactions
Security transactions are accounted for on the trade date. Cost is determined and gains (losses) are based upon the specific identification method for both financial statement and federal income tax purposes.
Income recognition
Interest income is recorded on an accrual basis. Market premiums and discounts, including original issue discounts, are amortized and accreted, respectively, over the expected life of the security on all debt securities, unless otherwise noted.
The Fund may place a debt security on non-accrual status and reduce related interest income when it becomes probable that the interest will not be collected and the amount of uncollectible interest can be reasonably estimated. A defaulted debt security is removed from non-accrual status when the issuer resumes interest payments or when collectibility of interest is reasonably assured.
Dividend income is recorded on the ex-dividend date.
Expenses
General expenses of the Trust are allocated to the Fund and other funds of the Trust based upon relative net assets or other expense allocation methodologies determined by the nature of the expense. Expenses directly attributable to the Fund are charged to the Fund. Expenses directly attributable to a specific class of shares are charged to that share class.
Determination of class net asset value
All income, expenses (other than class-specific expenses, which are charged to that share class, as shown in the Statement of Operations) and realized and unrealized gains (losses) are allocated to each class of the Fund on a daily basis, based on the relative net assets of each class, for purposes of determining the net asset value of each class.
Columbia AMT-Free North Carolina Intermediate Muni Bond Fund | Annual Report 2018
| 21 |
Notes to Financial Statements (continued)
April 30, 2018
Federal income tax status
The Fund intends to qualify each year as a regulated investment company under Subchapter M of the Internal Revenue Code, as amended, and will distribute substantially all of its net tax-exempt and investment company taxable income and net capital gain, if any, for its tax year, and as such will not be subject to federal income taxes. In addition, the Fund intends to distribute in each calendar year substantially all of its ordinary income, capital gain net income and certain other amounts, if any, such that the Fund should not be subject to federal excise tax. Therefore, no federal income or excise tax provision is recorded.
Distributions to shareholders
Distributions from net investment income, if any, are declared daily and paid monthly. Net realized capital gains, if any, are distributed at least annually. Income distributions and capital gain distributions are determined in accordance with federal income tax regulations, which may differ from GAAP.
Guarantees and indemnifications
Under the Trust’s organizational documents and, in some cases, by contract, its officers and trustees are indemnified against certain liabilities arising out of the performance of their duties to the Trust or its funds. In addition, certain of the Fund’s contracts with its service providers contain general indemnification clauses. The Fund’s maximum exposure under these arrangements is unknown since the amount of any future claims that may be made against the Fund cannot be determined, and the Fund has no historical basis for predicting the likelihood of any such claims.
Recent accounting pronouncement
Accounting Standards Update 2017-08 Premium Amortization on Purchased Callable Debt Securities
In March 2017, the Financial Accounting Standards Board issued Accounting Standards Update (ASU) No. 2017-08 Premium Amortization on Purchased Callable Debt Securities. ASU No. 2017-08 updates the accounting standards to shorten the amortization period for certain purchased callable debt securities, held at a premium, to be amortized to the earliest call date. The update applies to securities with explicit, noncontingent call features that are callable at fixed prices and on preset dates. The standard is effective for annual periods beginning after December 15, 2018 and interim periods within those fiscal years. At this time, management is evaluating the implication of this guidance and the impact it will have on the financial statement amounts and footnote disclosures, if any.
Note 3. Fees and other transactions with affiliates
Management services fees
The Fund has entered into a Management Agreement with Columbia Management Investment Advisers, LLC (the Investment Manager), a wholly-owned subsidiary of Ameriprise Financial, Inc. (Ameriprise Financial). Under the Management Agreement, the Investment Manager provides the Fund with investment research and advice, as well as administrative and accounting services. The management services fee is an annual fee that is equal to a percentage of the Fund’s daily net assets that declines from 0.47% to 0.31% as the Fund’s net assets increase. The effective management services fee rate for the year ended April 30, 2018 was 0.47% of the Fund’s average daily net assets.
Compensation of board members
Members of the Board of Trustees who are not officers or employees of the Investment Manager or Ameriprise Financial are compensated for their services to the Fund as disclosed in the Statement of Operations. Under a Deferred Compensation Plan (the Plan), these members of the Board of Trustees may elect to defer payment of up to 100% of their compensation. Deferred amounts are treated as though equivalent dollar amounts had been invested in shares of certain funds managed by the Investment Manager. The Fund’s liability for these amounts is adjusted for market value changes and remains in the Fund until distributed in accordance with the Plan. All amounts payable under the Plan constitute a general unsecured obligation of the Fund.
| 22 | Columbia AMT-Free North Carolina Intermediate Muni Bond Fund | Annual Report 2018 |
Notes to Financial Statements (continued)
April 30, 2018
Compensation of Chief Compliance Officer
The Board of Trustees has appointed a Chief Compliance Officer to the Fund in accordance with federal securities regulations. As disclosed in the Statement of Operations, a portion of the Chief Compliance Officer’s total compensation is allocated to the Fund, along with other allocations to affiliated funds governed by the Board of Trustees, based on relative net assets.
Transfer agency fees
Under a Transfer and Dividend Disbursing Agent Agreement, Columbia Management Investment Services Corp. (the Transfer Agent), an affiliate of the Investment Manager and a wholly-owned subsidiary of Ameriprise Financial, is responsible for providing transfer agency services to the Fund. The Transfer Agent has contracted with DST Asset Manager Solutions, Inc. (DST) to serve as sub-transfer agent. The Transfer Agent pays the fees of DST for services as sub-transfer agent and DST is not entitled to reimbursement for such fees from the Fund (with the exception of out-of-pocket fees).
The Fund pays the Transfer Agent a monthly transfer agency fee based on the number or the average value of accounts, depending on the type of account. In addition, the Fund pays the Transfer Agent a fee for shareholder services based on the number of accounts or on a percentage of the average aggregate value of the Fund’s shares maintained in omnibus accounts up to the lesser of the amount charged by the financial intermediary or a cap established by the Board of Trustees from time to time.
The Transfer Agent also receives compensation from the Fund for various shareholder services and reimbursements for certain out-of-pocket fees. Effective August 1, 2017, total transfer agency fees for Institutional 3 Class shares are subject to an annual limitation of not more than 0.02% of the average daily net assets attributable to Institutional 3 Class shares. Prior to August 1, 2017, the limitation was 0.025% for Institutional 3 Class shares.
For the year ended April 30, 2018, the Fund’s effective transfer agency fee rates as a percentage of average daily net assets of each class were as follows:
| | Effective rate (%) |
| Class A | 0.10 |
| Advisor Class | 0.10 |
| Class B | 0.04 (a) |
| Class C | 0.11 |
| Institutional Class | 0.13 |
| Institutional 3 Class | 0.01 |
An annual minimum account balance fee of $20 may apply to certain accounts with a value below the applicable share class’s initial minimum investment requirements to reduce the impact of small accounts on transfer agency fees. These minimum account balance fees are remitted to the Fund and recorded as part of expense reductions in the Statement of Operations. For the year ended April 30, 2018, no minimum account balance fees were charged by the Fund.
Distribution and service fees
The Fund has entered into an agreement with Columbia Management Investment Distributors, Inc. (the Distributor), an affiliate of the Investment Manager and a wholly-owned subsidiary of Ameriprise Financial, for distribution and shareholder services. The Board of Trustees has approved, and the Fund has adopted, distribution and shareholder service plans (the Plans) applicable to certain share classes, which set the distribution and service fees for the Fund. These fees are calculated daily and are intended to compensate the Distributor and/or eligible selling and/or servicing agents for selling shares of the Fund and providing services to investors.
Under the Plans, the Fund pays a monthly combined distribution and service fee to the Distributor at the maximum annual rate of 0.25% of the average daily net assets attributable to Class A shares of the Fund. Also under the Plans, the Fund pays a monthly service fee to the Distributor at the maximum annual rate of 0.25% of the average daily net assets attributable to Class B and Class C shares of the Fund and a monthly distribution fee to the Distributor at the maximum annual rate of
Columbia AMT-Free North Carolina Intermediate Muni Bond Fund | Annual Report 2018
| 23 |
Notes to Financial Statements (continued)
April 30, 2018
0.75% of the average daily net assets attributable to Class B and Class C shares of the Fund. As a result of all Class B shares of the Fund being redeemed or converted to Class A shares, August 4, 2017 was the last day the Fund paid a distribution and service fee for Class B shares.
Sales charges (unaudited)
Sales charges, including front-end charges and CDSCs, received by the Distributor for distributing Fund shares for the year ended April 30, 2018, if any, are listed below:
| | Amount ($) |
| Class A | 12,894 |
| Class C | 119 |
Expenses waived/reimbursed by the Investment Manager and its affiliates
The Investment Manager and certain of its affiliates have contractually agreed to waive fees and/or reimburse expenses (excluding certain fees and expenses described below) for the period(s) disclosed below, unless sooner terminated at the sole discretion of the Board of Trustees, so that the Fund’s net operating expenses, after giving effect to fees waived/expenses reimbursed and any balance credits and/or overdraft charges from the Fund’s custodian, do not exceed the following annual rate(s) as a percentage of the class’ average daily net assets:
| | September 1, 2017
through
August 31, 2018 | Prior to
September 1, 2017 |
| Class A | 0.81% | 0.81% |
| Advisor Class | 0.56 | 0.56 |
| Class C | 1.56 | 1.56 |
| Institutional Class | 0.56 | 0.56 |
| Institutional 3 Class | 0.49 | 0.42 |
Under the agreement governing these fee waivers and/or expense reimbursement arrangements, the following fees and expenses are excluded from the waiver/reimbursement commitment, and therefore will be paid by the Fund, if applicable: taxes (including foreign transaction taxes), expenses associated with investments in affiliated and non-affiliated pooled investment vehicles (including mutual funds and exchange-traded funds), transaction costs and brokerage commissions, costs related to any securities lending program, dividend expenses associated with securities sold short, inverse floater program fees and expenses, transaction charges and interest on borrowed money, interest, infrequent and/or unusual expenses and any other expenses the exclusion of which is specifically approved by the Board of Trustees. This agreement may be modified or amended only with approval from the Investment Manager, certain of its affiliates and the Fund. Any fees waived and/or expenses reimbursed under the expense reimbursement arrangements described above are not recoverable by the Investment Manager or its affiliates in future periods.
Note 4. Federal tax information
The timing and character of income and capital gain distributions are determined in accordance with income tax regulations, which may differ from GAAP because of temporary or permanent book to tax differences.
At April 30, 2018, these differences were primarily due to differing treatment for capital loss carryforwards, trustees’ deferred compensation and distributions. To the extent these differences were permanent, reclassifications were made among the components of the Fund’s net assets in the Statement of Assets and Liabilities. Temporary differences do not require reclassifications.
In the Statement of Assets and Liabilities the following reclassifications were made:
Undistributed net
investment
income ($) | Accumulated
net realized
(loss) ($) | Paid in
capital ($) |
| (10) | 11 | (1) |
| 24 | Columbia AMT-Free North Carolina Intermediate Muni Bond Fund | Annual Report 2018 |
Notes to Financial Statements (continued)
April 30, 2018
Net investment income (loss) and net realized gains (losses), as disclosed in the Statement of Operations, and net assets were not affected by this reclassification.
The tax character of distributions paid during the years indicated was as follows:
| Year Ended April 30, 2018 | Year Ended April 30, 2017 |
Ordinary
income ($) | Tax-exempt
income ($) | Long-term
capital gains ($) | Total ($) | Ordinary
income ($) | Tax-exempt
income ($) | Long-term
capital gains ($) | Total ($) |
| 2 | 4,485,820 | — | 4,485,822 | 7,936 | 5,713,277 | — | 5,721,213 |
Short-term capital gain distributions, if any, are considered ordinary income distributions for tax purposes.
At April 30, 2018, the components of distributable earnings on a tax basis were as follows:
Undistributed
ordinary income ($) | Undistributed tax-
exempt income ($) | Undistributed
long-term
capital gains ($) | Capital loss
carryforwards ($) | Net unrealized
appreciation ($) |
| — | 1,172,892 | — | (523,718) | 2,204,992 |
At April 30, 2018, the cost of all investments for federal income tax purposes along with the aggregate gross unrealized appreciation and depreciation based on that cost was:
Federal
tax cost ($) | Gross unrealized
appreciation ($) | Gross unrealized
(depreciation) ($) | Net unrealized
appreciation ($) |
| 161,955,963 | 3,517,464 | (1,312,472) | 2,204,992 |
Tax cost of investments and unrealized appreciation/(depreciation) may also include timing differences that do not constitute adjustments to tax basis.
The following capital loss carryforwards, determined at April 30, 2018, may be available to reduce taxable income arising from future net realized gains on investments, if any, to the extent permitted by the Internal Revenue Code. Capital loss carryforwards with no expiration are required to be utilized prior to any capital losses which carry an expiration date. As a result of this ordering rule, capital loss carryforwards which carry an expiration date may be more likely to expire unused. In addition, for the year ended April 30, 2018, capital loss carryforwards utilized, expired unused and permanently lost, if any, were as follows:
| 2019 ($) | No expiration
short-term ($) | No expiration
long-term ($) | Total ($) | Utilized ($) | Expired ($) | Permanently
lost ($) |
| — | 523,718 | — | 523,718 | 317,662 | — | — |
Management of the Fund has concluded that there are no significant uncertain tax positions in the Fund that would require recognition in the financial statements. However, management’s conclusion may be subject to review and adjustment at a later date based on factors including, but not limited to, new tax laws, regulations, and administrative interpretations (including relevant court decisions). Generally, the Fund’s federal tax returns for the prior three fiscal years remain subject to examination by the Internal Revenue Service.
Note 5. Portfolio information
The cost of purchases and proceeds from sales of securities, excluding short-term investments and derivatives, if any, aggregated to $16,470,587 and $31,345,472, respectively, for the year ended April 30, 2018. The amount of purchase and sale activity impacts the portfolio turnover rate reported in the Financial Highlights.
Note 6. Line of credit
The Fund has access to a revolving credit facility with a syndicate of banks led by Citibank, N.A., HSBC Bank USA, N.A. and JPMorgan Chase Bank, N.A. whereby the Fund may borrow for the temporary funding of shareholder redemptions or for other temporary or emergency purposes. The credit facility, which is a collective agreement between the Fund and certain other
Columbia AMT-Free North Carolina Intermediate Muni Bond Fund | Annual Report 2018
| 25 |
Notes to Financial Statements (continued)
April 30, 2018
funds managed by the Investment Manager, severally and not jointly, permits collective borrowings up to $1 billion. Interest is charged to each participating fund based on its borrowings at a rate equal to the higher of (i) the overnight federal funds rate plus 1.00% or (ii) the one-month LIBOR rate plus 1.00%. Each borrowing under the credit facility matures no later than 60 days after the date of borrowing. The Fund also pays a commitment fee equal to its pro rata share of the amount of the credit facility at a rate of 0.15% per annum. The commitment fee is included in other expenses in the Statement of Operations.
The Fund had no borrowings during the year ended April 30, 2018.
Note 7. Significant risks
Credit risk
Credit risk is the risk that the value of debt securities in the Fund’s portfolio may decline because the issuer may default and fail to pay interest or repay principal when due. Rating agencies assign credit ratings to debt securities to indicate their credit risk. Lower rated or unrated debt securities held by the Fund may present increased credit risk as compared to higher-rated debt securities.
Geographic concentration risk
Because the Fund invests substantially in municipal securities issued by the state identified in the Fund’s name and political sub-divisions of that state, the Fund will be particularly affected by adverse tax, legislative, regulatory, demographic or political changes as well as changes impacting the state’s financial, economic or other condition and prospects. In addition, because of the relatively small number of issuers of tax-exempt securities in the state, the Fund may invest a higher percentage of assets in a single issuer and, therefore, be more exposed to the risk of loss than a fund that invests more broadly. The value of municipal and other securities owned by the Fund also may be adversely affected by future changes in federal or state income tax laws.
Interest rate risk
Interest rate risk is the risk of losses attributable to changes in interest rates. In general, if prevailing interest rates rise, the values of debt securities tend to fall, and if interest rates fall, the values of debt securities tend to rise. Actions by governments and central banking authorities can result in increases in interest rates. Increasing interest rates may negatively affect the value of debt securities held by the Fund, resulting in a negative impact on the Fund’s performance and net asset value per share. In general, the longer the maturity or duration of a debt security, the greater its sensitivity to changes in interest rates.
Liquidity risk
Liquidity risk is the risk associated with a lack of marketability of investments which may make it difficult to sell the investment at a desirable time or price. Changing regulatory, market or other conditions or environments (for example, the interest rate or credit environments) may adversely affect the liquidity of the Fund’s investments. The Fund may have to accept a lower selling price for the holding, sell other investments, or forego another, more appealing investment opportunity. Generally, the less liquid the market at the time the Fund sells a portfolio investment, the greater the risk of loss or decline of value to the Fund. A less liquid market can lead to an increase in Fund redemptions, which may negatively impact Fund performance and net asset value per share, including, for example, if the Fund is forced to sell securities in a down market.
Shareholder concentration risk
At April 30, 2018, two unaffiliated shareholders of record owned 82.4% of the outstanding shares of the Fund in one or more accounts. The Fund has no knowledge about whether any portion of those shares was owned beneficially. Subscription and redemption activity by concentrated accounts may have a significant effect on the operations of the Fund. In the case of a large redemption, the Fund may be forced to sell investments at inopportune times, including its liquid positions, which may result in Fund losses and the Fund holding a higher percentage of less liquid positions. Large redemptions could result in decreased economies of scale and increased operating expenses for non-redeeming Fund shareholders.
| 26 | Columbia AMT-Free North Carolina Intermediate Muni Bond Fund | Annual Report 2018 |
Notes to Financial Statements (continued)
April 30, 2018
Note 8. Subsequent events
Management has evaluated the events and transactions that have occurred through the date the financial statements were issued and noted no items requiring adjustment of the financial statements or additional disclosure.
Note 9. Information regarding pending and settled legal proceedings
Ameriprise Financial and certain of its affiliates have historically been involved in a number of legal, arbitration and regulatory proceedings, including routine litigation, class actions, and governmental actions, concerning matters arising in connection with the conduct of their business activities. Ameriprise Financial believes that the Fund is not currently the subject of, and that neither Ameriprise Financial nor any of its affiliates are the subject of, any pending legal, arbitration or regulatory proceedings that are likely to have a material adverse effect on the Fund or the ability of Ameriprise Financial or its affiliates to perform under their contracts with the Fund. Ameriprise Financial is required to make quarterly (10-Q), annual (10-K) and, as necessary, 8-K filings with the Securities and Exchange Commission (SEC) on legal and regulatory matters that relate to Ameriprise Financial and its affiliates. Copies of these filings may be obtained by accessing the SEC website at www.sec.gov.
There can be no assurance that these matters, or the adverse publicity associated with them, will not result in increased Fund redemptions, reduced sale of Fund shares or other adverse consequences to the Fund. Further, although we believe proceedings are not likely to have a material adverse effect on the Fund or the ability of Ameriprise Financial or its affiliates to perform under their contracts with the Fund, these proceedings are subject to uncertainties and, as such, we are unable to estimate the possible loss or range of loss that may result. An adverse outcome in one or more of these proceedings could result in adverse judgments, settlements, fines, penalties or other relief that could have a material adverse effect on the consolidated financial condition or results of operations of Ameriprise Financial.
Columbia AMT-Free North Carolina Intermediate Muni Bond Fund | Annual Report 2018
| 27 |
Report of Independent Registered Public Accounting Firm
To the Board of Trustees of Columbia Funds Series Trust and Shareholders of Columbia AMT-Free North Carolina Intermediate Muni Bond Fund
Opinion on the Financial Statements
We have audited the accompanying statement of assets and liabilities, including the portfolio of investments, of Columbia AMT-Free North Carolina Intermediate Muni Bond Fund (one of the funds constituting Columbia Funds Series Trust, referred to hereafter as the "Fund") as of April 30, 2018, the related statement of operations for the year ended April 30, 2018, the statement of changes in net assets for each of the two years in the period ended April 30, 2018, including the related notes, and the financial highlights for each of the periods indicated therein (collectively referred to as the “financial statements”). In our opinion, the financial statements present fairly, in all material respects, the financial position of the Fund as of April 30, 2018, the results of its operations for the year then ended, the changes in its net assets for each of the two years in the period ended April 30, 2018 and the financial highlights for each of the periods indicated therein in conformity with accounting principles generally accepted in the United States of America.
Basis for Opinion
These financial statements are the responsibility of the Fund’s management. Our responsibility is to express an opinion on the Fund’s financial statements based on our audits. We are a public accounting firm registered with the Public Company Accounting Oversight Board (United States) (“PCAOB”) and are required to be independent with respect to the Fund in accordance with the U.S. federal securities laws and the applicable rules and regulations of the Securities and Exchange Commission and the PCAOB.
We conducted our audits of these financial statements in accordance with the standards of the PCAOB. Those standards require that we plan and perform the audit to obtain reasonable assurance about whether the financial statements are free of material misstatement, whether due to error or fraud.
Our audits included performing procedures to assess the risks of material misstatement of the financial statements, whether due to error or fraud, and performing procedures that respond to those risks. Such procedures included examining, on a test basis, evidence regarding the amounts and disclosures in the financial statements. Our audits also included evaluating the accounting principles used and significant estimates made by management, as well as evaluating the overall presentation of the financial statements. Our procedures included confirmation of securities owned as of April 30, 2018 by correspondence with the custodian and brokers; when replies were not received from brokers, we performed other auditing procedures. We believe that our audits provide a reasonable basis for our opinion.
/s/PricewaterhouseCoopers LLP
Minneapolis, Minnesota
June 21, 2018
We have served as auditors of one or more investment companies within the Columbia Funds Complex since 1977.
| 28 | Columbia AMT-Free North Carolina Intermediate Muni Bond Fund | Annual Report 2018 |
Federal Income Tax Information
(Unaudited)
The Fund hereby designates the following tax attributes for the fiscal year ended April 30, 2018. Shareholders will be notified in early 2019 of the amounts for use in preparing 2018 income tax returns.
Exempt-
interest
dividends | |
| 100.00% | |
Exempt-interest dividends. The percentage of net investment income distributed during the fiscal year that qualifies as exempt-interest dividends for federal income tax purposes.
Columbia AMT-Free North Carolina Intermediate Muni Bond Fund | Annual Report 2018
| 29 |
Shareholders elect the Board that oversees the Fund’s operations. The Board appoints officers who are responsible for day-to-day business decisions based on policies set by the Board. The following table provides basic biographical information about the Fund’s Trustees, including their principal occupations during the past five years, although specific titles for individuals may have varied over the period. Under current Board policy, Trustees not affiliated with the Investment Manager generally may serve through the end of the calendar year in which they reach either the mandatory retirement age established by the Board or the fifteenth anniversary of the first Columbia Funds board meeting they attended as a member of the Board.
Independent trustees
Name,
address,
year of birth | Position held
with the Trust and
length of service | Principal occupation(s)
during past five years
and other relevant
professional experience | Number of
Funds in the
Columbia Funds
complex
overseen | Other directorships
held by Trustee
during the past
five years |
George S. Batejan
c/o Columbia Management
Investment Advisers, LLC
225 Franklin Street
Mail Drop BX32 05228
Boston, MA 02110
1953 | Trustee since 1/17 | Executive Vice President, Global Head of Technology and Operations, Janus Capital Group, Inc., 2010-2016 | 125 | Advisory Board Member, University of Colorado Business School since November 2015; former Chairman of the Board, NICSA (National Investment Company Services Association) (Executive Committee, Nominating Committee and Governance Committee), 2014-2016; former Director, Intech Investment Management, 2011- 2016; former Board Member, Metro Denver Chamber of Commerce, 2015-2016 |
Kathleen Blatz
c/o Columbia Management
Investment Advisers, LLC
225 Franklin Street
Mail Drop BX32 05228
Boston, MA 02110
1954 | Trustee since 1/06 for RiverSource Funds and since 6/11 for Nations Funds | Attorney; specializing in arbitration and mediation; Interim President and Chief Executive Officer, Blue Cross and Blue Shield of Minnesota (health care insurance) since February 2018; Chief Justice, Minnesota Supreme Court, 1998-2006; Associate Justice, Minnesota Supreme Court, 1996-1998; Fourth Judicial District Court Judge, Hennepin County, 1994-1996; Attorney in private practice and public service, 1984-1993; State Representative, Minnesota House of Representatives, 1979-1993, which included service on the Tax and Financial Institutions and Insurance Committees; Interim Chair, Minnesota Sports Facilities Authority, March 2017-July 2017 | 125 | Trustee, BlueCross BlueShield of Minnesota since 2009 (Chair of the Business Development Committee, 2014-2017; Chair of the Governance Committee since 2017); Chair of the Robina Foundation since August 2013; former Member of the Board, Minnesota Sports Facilities Authority, January 2017-July 2017 |
Edward J. Boudreau, Jr.
c/o Columbia Management
Investment Advisers, LLC
225 Franklin Street
Mail Drop BX32 05228
Boston, MA 02110
1944 | Chair of the Board since 1/18; Trustee since 6/11 for RiverSource Funds and since 1/05 for Nations Funds | Managing Director, E.J. Boudreau & Associates (consulting) since 2000; FINRA Industry Arbitrator, 2002-present; Chairman and Chief Executive Officer, John Hancock Investments (asset management), Chairman and Interested Trustee for open-end and closed-end funds offered by John Hancock, 1989-2000; John Hancock Mutual Life Insurance Company, including Senior Vice President and Treasurer and Senior Vice President Information Technology, 1968-1988 | 125 | Former Trustee, Boston Museum of Science (Chair of Finance Committee) 1985-2013; former Trustee, BofA Funds Series Trust (11 funds), 2005-2011 |
| 30 | Columbia AMT-Free North Carolina Intermediate Muni Bond Fund | Annual Report 2018 |
TRUSTEES AND OFFICERS (continued)
Independent trustees (continued)
Name,
address,
year of birth | Position held
with the Trust and
length of service | Principal occupation(s)
during past five years
and other relevant
professional experience | Number of
Funds in the
Columbia Funds
complex
overseen | Other directorships
held by Trustee
during the past
five years |
Pamela G. Carlton
c/o Columbia Management
Investment Advisers, LLC
225 Franklin Street
Mail Drop BX32 05228
Boston, MA 02110
1954 | Trustee since 7/07 for RiverSource Funds and since 6/11 for Nations Funds | President, Springboard — Partners in Cross Cultural Leadership (consulting company) since 2003; Managing Director of US Equity Research, JP Morgan Chase, 1999-2003; Director of US Equity Research, Chase Asset Management, 1996-1999; Co-Director Latin America Research, 1993-1996, COO Global Research, 1992-1996, Co-Director of US Research, 1991-1992, Investment Banker, Morgan Stanley, 1982-1991 | 125 | Trustee, New York Presbyterian Hospital Board (Executive Committee and Chair of Human Resources Committee) since 1996; Director, Darien Rowayton Bank (Audit Committee) since 2017 |
William P. Carmichael
c/o Columbia Management
Investment Advisers, LLC
225 Franklin Street
Mail Drop BX32 05228
Boston, MA 02110
1943 | Trustee since 6/11 for RiverSource Funds and since 2003 for Nations Funds | Retired; Co-founder, The Succession Fund (provides exit strategies to owners of privately held companies), 1998-2007; Adjunct Professor of Finance, Kelley School of Business, Indiana University, 1993-2007; Senior Vice President, Sara Lee Corporation, 1991-1993; Senior Vice President and Chief Financial Officer, Beatrice Foods Company, 1984-1990; Vice President, Esmark, Inc., 1973-1984; Associate, Price Waterhouse, 1968-1972 | 125 | Director, The Finish Line (athletic shoes and apparel) since July 2003; former Director, Cobra Electronics Corporation (electronic equipment manufacturer), 1994-August 2014; former Director, Spectrum Brands, Inc. (consumer products), 2002-2009; former Director, Simmons Company (bedding), 2004-2010; former Trustee, BofA Funds Series Trust (11 funds) 2003-2011; former Director, McMoRan Exploration Company (oil and gas exploration and development) 2010 - 2013; former Director, International Textile Corp., 2012-2016; former Director, hhgregg, 2015-2017 |
Patricia M. Flynn
c/o Columbia Management
Investment Advisers, LLC
225 Franklin Street
Mail Drop BX32 05228
Boston, MA 02110
1950 | Trustee since 11/04 for RiverSource Funds and since 6/11 for Nations Funds | Trustee Professor of Economics and Management, Bentley University since 1976 (also teaches and conducts research on corporate governance); Dean, McCallum Graduate School of Business, Bentley University, 1992-2002 | 125 | Trustee, MA Taxpayers Foundation since 1997; Board of Directors, The MA Business Roundtable since 2003; Board of Governors, Innovation Institute, MA Technology Collaborative since 2010 |
Brian J. Gallagher
c/o Columbia Management
Investment Advisers, LLC
225 Franklin Street
Mail Drop BX32 05228
Boston, MA 02110
1954 | Trustee since 12/17 | Retired; Partner with Deloitte & Touche LLP and its predecessors, 1977-2016 | 123 | Trustee, Catholic Schools Foundation since 2004 |
Catherine James Paglia
c/o Columbia Management
Investment Advisers, LLC
225 Franklin Street
Mail Drop BX32 05228
Boston, MA 02110
1952 | Trustee since 11/04 for RiverSource Funds and since 6/11 for Nations Funds | Director, Enterprise Asset Management, Inc. (private real estate and asset management company) since September 1998; Managing Director and Partner, Interlaken Capital, Inc., 1989-1997; Managing Director, Morgan Stanley, 1982-1989; Vice President, Investment Banking, 1980-1982, Associate, Investment Banking, 1976-1980, Dean Witter Reynolds, Inc. | 125 | Director, Valmont Industries, Inc. (irrigation systems manufacturer) since 2012; Trustee, Carleton College (on the Investment Committee); Trustee, Carnegie Endowment for International Peace (on the Investment Committee) |
Columbia AMT-Free North Carolina Intermediate Muni Bond Fund | Annual Report 2018
| 31 |
TRUSTEES AND OFFICERS (continued)
Independent trustees (continued)
Name,
address,
year of birth | Position held
with the Trust and
length of service | Principal occupation(s)
during past five years
and other relevant
professional experience | Number of
Funds in the
Columbia Funds
complex
overseen | Other directorships
held by Trustee
during the past
five years |
Minor M. Shaw
c/o Columbia Management
Investment Advisers, LLC
225 Franklin Street
Mail Drop BX32 05228
Boston, MA 02110
1947 | Trustee since 6/11 for RiverSource Funds and since 2003 for Nations Funds | President, Micco LLC (private investments) since 2011; President, Micco Corp. (family investment business), 1998-2011 | 125 | Director, BlueCross BlueShield of South Carolina since April 2008; Director, National Association of Corporate Directors, Carolinas Chapter, since 2013; Board Chair, Hollingsworth Funds since 2016; Advisory Board member, Duke Energy Corp. since October 2016; Chair of the Duke Endowment; Chair of Greenville – Spartanburg Airport Commission; former Trustee, BofA Funds Series Trust (11 funds), 2003-2011; former Director, Piedmont Natural Gas, 2004-2016 |
Sandra Yeager
c/o Columbia Management
Investment Advisers, LLC
225 Franklin Street
Mail Drop BX32 05228
Boston, MA 02110
1964 | Trustee since 12/17 | Retired; President and founder, Hanoverian Capital, LLC (SEC registered investment advisor firm), 2008-2016 | 123 | Director, NAPE Education Foundation since October 2016 |
Interested trustee not affiliated with Investment Manager*
Name,
address,
year of birth | Position held
with the Trust and
length of service | Principal occupation(s) during the
past five years and other relevant
professional experience | Number of
Funds in the
Columbia Funds
complex overseen | Other directorships/
held by Trustee
during the past
five years |
Anthony M. Santomero
c/o Columbia Management
Investment Advisers, LLC
225 Franklin Street
Mail Drop BX32 05228
Boston, MA 02110
1946 | Trustee since 6/11 for RiverSource Funds and since 1/08 for Nations Funds | Richard K. Mellon Professor Emeritus of Finance, The Wharton School, University of Pennsylvania, since 2002; Senior Advisor, McKinsey & Company (consulting), 2006-2008; President, Federal Reserve Bank of Philadelphia, 2000-2006, Professor of Finance, The Wharton School, University of Pennsylvania, 1972-2002 | 123 | Trustee, Penn Mutual Life Insurance Company since March 2008; Director, Renaissance Reinsurance Ltd. since May 2008; Director, Citigroup Inc. since 2009; Director, Citibank, N.A. since 2009; former Trustee, BofA Funds Series Trust (11 funds), 2008-2011 |
| * | Dr. Santomero is not an affiliated person of the Investment Manager or Ameriprise Financial. However, he is currently deemed by the Funds to be an “interested person” (as defined in the 1940 Act) of the Funds because he serves as a Director of Citigroup Inc. and Citibank, N.A., companies that may directly or through subsidiaries and affiliates engage from time-to-time in brokerage execution, principal transactions and lending relationships with the Funds or accounts advised/managed by the Investment Manager. |
| 32 | Columbia AMT-Free North Carolina Intermediate Muni Bond Fund | Annual Report 2018 |
TRUSTEES AND OFFICERS (continued)
Interested trustee affiliated with Investment Manager*
Name,
address,
year of birth | Position held with the Trusts and length of service | Principal occupation(s) during the
past five years and other relevant
professional experience | Number of
Funds in the
Columbia Funds
complex overseen | Other directorships
held by Trustee
during the past
five years |
William F. Truscott
c/o Columbia Management
Investment Advisers, LLC
225 Franklin St.
Boston, MA 02110
1960 | Trustee since 11/01 for RiverSource Funds and since 6/11 for Nations Funds; Senior Vice President since 2002 for RiverSource Funds and since 5/10 for Nations Funds | Chairman of the Board and President, Columbia Management Investment Advisers, LLC since May 2010 and February 2012, respectively; Chief Executive Officer, Global Asset Management, Ameriprise Financial, Inc. since September 2012 (previously Chief Executive Officer, U.S. Asset Management & President, Annuities, May 2010 - September 2012); Director and Chief Executive Officer, Columbia Management Investment Distributors, Inc. since May 2010 and February 2012, respectively; Chairman of the Board and Chief Executive Officer, RiverSource Distributors, Inc. since 2006; Director, Threadneedle Asset Management Holdings, SARL since 2014; President and Chief Executive Officer, Ameriprise Certificate Company, 2006 - August 2012. | 196 | Chairman of the Board, Columbia Management Investment Advisers, LLC since May 2010; Director, Columbia Management Investment Distributors, Inc. since May 2010; former Director, Ameriprise Certificate Company, 2006-January 2013 |
| * | Interested person (as defined under the 1940 Act) by reason of being an officer, director, security holder and/or employee of the Investment Manager or Ameriprise Financial. |
Nations Funds refer to the Funds within the Columbia Funds Complex that historically bore the Nations brand and includes series of Columbia Funds Series Trust. RiverSource Funds refer to the Funds within the Columbia Funds Complex that historically bore the RiverSource brand and includes series of Columbia Funds Series Trust II.
The Statement of Additional Information has additional information about the Fund’s Board members and is available, without charge, upon request by calling 800.345.6611, visiting columbiathreadneedleus.com/investor/ or contacting your financial intermediary.
Columbia AMT-Free North Carolina Intermediate Muni Bond Fund | Annual Report 2018
| 33 |
TRUSTEES AND OFFICERS (continued)
The Board has appointed officers who are responsible for day-to-day business decisions based on policies it has established. The officers serve at the pleasure of the Board. The following table provides basic information about the Officers of the Fund, including principal occupations during the past five years, although their specific titles may have varied over the period. In addition to Mr. Truscott, who is Senior Vice President, the Fund’s other officers are:
Fund officers
Name,
address and
year of birth | Position and year
first appointed to
position for any Fund
in the Columbia
Funds complex or a
predecessor thereof | Principal occupation(s) during past five years |
Christopher O. Petersen
5228 Ameriprise
Financial Center
Minneapolis, MN 55474
Born 1970 | President and Principal Executive Officer (2015) | Vice President and Lead Chief Counsel, Ameriprise Financial, Inc. since January 2015 (previously, Vice President and Chief Counsel, January 2010 - December 2014; officer of Columbia Funds and affiliated funds since 2007. |
Michael G. Clarke
225 Franklin Street
Boston, MA 02110
Born 1969 | Treasurer (2011), Chief Financial Officer (2009) and Chief Accounting Officer (2015) | Vice President — Mutual Fund Administration, Columbia Management Investment Advisers, LLC, since May 2010; senior officer of Columbia Funds and affiliated funds since 2002. |
Paul B. Goucher
100 Park Avenue
New York, NY 10017
Born 1968 | Senior Vice President (2011) and Assistant Secretary (2008) | Senior Vice President and Assistant General Counsel, Ameriprise Financial, Inc. since January 2017 (previously Vice President and Lead Chief Counsel, November 2008 - January 2017 and January 2013 - January 2017, respectively; and Chief Counsel, January 2010 - January 2013); Vice President, Chief Legal Officer and Assistant Secretary, Columbia Management Investment Advisers, LLC since May 2010. |
Thomas P. McGuire
225 Franklin Street
Boston, MA 02110
Born 1972 | Senior Vice President and Chief Compliance Officer (2012) | Vice President — Asset Management Compliance, Ameriprise Financial, Inc., since May 2010; Chief Compliance Officer, Ameriprise Certificate Company since September 2010. |
Colin Moore
225 Franklin Street
Boston, MA 02110
Born 1958 | Senior Vice President (2010) | Executive Vice President and Global Chief Investment Officer, Ameriprise Financial, Inc., since July 2013; Executive Vice President and Global Chief Investment Officer, Columbia Management Investment Advisers, LLC since July 2013 (previously Director and Global Chief Investment Officer, 2010 - 2013). |
Ryan C. Larrenaga
225 Franklin Street
Boston, MA 02110
Born 1970 | Senior Vice President (2017), Chief Legal Officer (2017) and Secretary (2015) | Vice President and Group Counsel, Ameriprise Financial, Inc. since August 2011; officer of Columbia Funds and affiliated funds since 2005. |
Michael E. DeFao
225 Franklin Street
Boston, MA 02110
Born 1968 | Vice President (2011) and Assistant Secretary (2010) | Vice President and Chief Counsel, Ameriprise Financial, Inc. since May 2010. |
Amy Johnson
5228 Ameriprise
Financial Center
Minneapolis, MN 55474
Born 1965 | Vice President (2006) | Managing Director and Global Head of Operations, Columbia Management Investment Advisers, LLC since April 2016 (previously Managing Director and Chief Operating Officer, 2010 - 2016). |
Lyn Kephart-Strong
5228 Ameriprise
Financial Center
Minneapolis, MN 55474
Born 1960 | Vice President (2015) | President, Columbia Management Investment Services Corp. since October 2014; Vice President & Resolution Officer, Ameriprise Trust Company since August 2009. |
| 34 | Columbia AMT-Free North Carolina Intermediate Muni Bond Fund | Annual Report 2018 |
The Fund mails one shareholder report to each shareholder address. If you would like more than one report, please call shareholder services at 800.345.6611 and additional reports will be sent to you.
Proxy voting policies and procedures
The policy of the Board of Trustees is to vote the proxies of the companies in which the Fund holds investments consistent with the procedures as stated in the Statement of Additional Information (SAI). You may obtain a copy of the SAI without charge by calling 800.345.6611; contacting your financial intermediary; visiting columbiathreadneedleus.com/investor/; or searching the website of the Securities and Exchange Commission (SEC) at sec.gov. Information regarding how the Fund voted proxies relating to portfolio securities is filed with the SEC by August 31st for the most recent 12-month period ending June 30th of that year, and is available without charge by visiting columbiathreadneedleus.com/investor/, or searching the website of the SEC at sec.gov.
Quarterly schedule of investments
The Fund files a complete schedule of portfolio holdings with the SEC for the first and third quarters of each fiscal year on Form N-Q. The Fund’s Form N-Q is available on the SEC’s website at sec.gov and may be reviewed and copied at the SEC’s Public Reference Room in Washington, D.C. Information on the operation of the Public Reference Room may be obtained by calling 800.SEC.0330. The Fund’s complete schedule of portfolio holdings, as filed on Form N-Q, can also be obtained without charge, upon request, by calling 800.345.6611.
Additional Fund information
For more information about the Fund, please visit columbiathreadneedleus.com/investor/ or call 800.345.6611. Customer Service Representatives are available to answer your questions Monday through Friday from 8 a.m. to 7 p.m. Eastern time.
Fund investment manager
Columbia Management Investment Advisers, LLC
225 Franklin Street
Boston, MA 02110
Fund distributor
Columbia Management Investment Distributors, Inc.
225 Franklin Street
Boston, MA 02110
Fund transfer agent
Columbia Management Investment Services Corp.
P.O. Box 8081
Boston, MA 02266-8081
Columbia AMT-Free North Carolina Intermediate Muni Bond Fund | Annual Report 2018
| 35 |
[THIS PAGE INTENTIONALLY LEFT BLANK]
[THIS PAGE INTENTIONALLY LEFT BLANK]
Columbia AMT-Free North Carolina Intermediate Muni Bond Fund
P.O. Box 8081
Boston, MA 02266-8081
Please read and consider the investment objectives, risks, charges and expenses for any fund carefully before investing. For a prospectus and summary prospectus, which contains this and other important information about the Fund, go to
columbiathreadneedleus.com/investor/. The Fund is distributed by Columbia Management Investment Distributors, Inc., member FINRA, and managed by Columbia Management Investment Advisers, LLC.
Columbia Threadneedle Investments (Columbia Threadneedle) is the global brand name of the Columbia and Threadneedle group of companies. All rights reserved. Columbia Management Investment Distributors, Inc., 225 Franklin Street, Boston, MA 02110-2804
© 2018 Columbia Management Investment Advisers, LLC.
columbiathreadneedleus .com/investor/

Annual Report
April 30, 2018
Columbia AMT-Free Maryland Intermediate Muni Bond Fund
Not FDIC Insured • No bank guarantee • May lose value
Dear Shareholders,
The year 2017 was an extraordinary year in the financial markets. The S&P 500 Index didn’t experience a single down month and returned over 20%. Continuing this trend, January 2018 marked the fastest start for the index ever. Low volatility, which had been a feature of the U.S. equity market for several years, along with the surge in the S&P 500 Index, drove investor sentiment to very high levels. This arguably set the stage for an overdue correction, which we witnessed in February 2018.
A return to volatility
There have been few periods of market upheaval such as were experienced in the first part of 2018. While investors were taken by surprise by the sudden and pronounced market swings, the return to some level of volatility actually marked a resumption of relatively normal market conditions. Having said that, it’s important to distinguish between a good technical correction where excess enthusiasm in the marketplace is being let out, versus a real change in the underlying fundamentals – things like an underperforming economy or weaker corporate earnings. Our view is that the recent market volatility falls into the former category, and the fundamentals remain strong. We’re continuing to see improvements in global economic activity, and we’re seeing corporate earnings expectations continue to rise – and not just because of tax reform.
Consistency is more important than ever
It’s important to keep in mind that when it comes to long-term investing, it’s the destination, not the journey that matters most. If you have a financial goal that you’ve worked out with your financial advisor, and you have a good asset allocation plan to reach it, it’s a question of sticking with your plan rather than become focused on near-term volatility. Bouts of volatility are normal. After all, it’s hard to cross the ocean without hitting an occasional rough patch. You need to focus on the destination.
One final thought. In weathering volatility, it’s the consistency of the return that is essential. Investors who chase higher returns are usually the first to sell when an investment goes through a bad patch, and they therefore don’t tend to benefit from the recovery. More disciplined investors who perhaps panic less or not at all during periods of volatility, tend to have improved long-term results and are more likely to reach their financial goals. Nothing is more important to us than making sure those who have entrusted us to protect and grow their assets are able to do what matters most to them.
Your success is our priority. Talk to your financial advisor about how working with Columbia Threadneedle Investments may help you position your portfolio for consistent, sustainable outcomes, no matter the market conditions.
Sincerely,
Christopher O. Petersen
President, Columbia Funds
The S&P 500 Index, an unmanaged index, measures the performance of 500 widely held, large-capitalization U.S. stocks and is frequently used as a general measure of market performance. Past performance is no guarantee of future results.
Columbia Funds are distributed by Columbia Management Investment Distributors, Inc., member FINRA, and managed by Columbia Management Investment Advisers, LLC.
© 2018 Columbia Management Investment Advisers, LLC. All rights reserved.
Columbia AMT-Free Maryland Intermediate Muni Bond Fund | Annual Report 2018
Columbia AMT-Free Maryland Intermediate Muni Bond Fund | Annual Report 2018
Investment objective
Columbia AMT-Free Maryland Intermediate Muni Bond Fund (the Fund) seeks current income exempt from U.S. federal income tax and Maryland individual income tax, consistent with moderate fluctuation of principal.
Portfolio management
Paul Fuchs, CFA
Co-Portfolio Manager
Managed Fund since 2016
Deborah Vargo
Co-Portfolio Manager
Managed Fund since December 2017
| Average annual total returns (%) (for the period ended April 30, 2018) |
| | | Inception | 1 Year | 5 Years | 10 Years |
| Class A | Excluding sales charges | 09/01/90 | 0.65 | 1.37 | 2.94 |
| | Including sales charges | | -2.39 | 0.76 | 2.63 |
| Advisor Class* | 03/19/13 | 0.90 | 1.62 | 3.07 |
| Class C | Excluding sales charges | 06/17/92 | -0.10 | 0.61 | 2.17 |
| | Including sales charges | | -1.08 | 0.61 | 2.17 |
| Institutional Class | 09/01/90 | 0.89 | 1.62 | 3.20 |
| Institutional 3 Class* | 03/01/17 | 1.02 | 1.45 | 2.99 |
| Bloomberg Barclays 3-15 Year Blend Municipal Bond Index | | 0.87 | 2.10 | 3.99 |
Returns for Class A shares are shown with and without the maximum initial sales charge of 3.00%. Returns for Class C shares are shown with and without the 1.00% contingent deferred sales charge for the first year only. The Fund’s other classes are not subject to sales charges and have limited eligibility. Effective November 1, 2017, Class R4, Class Y and Class Z shares were renamed Advisor Class, Institutional 3 Class and Institutional Class shares, respectively. Please see the Fund’s prospectus for details. Performance for different share classes will vary based on differences in sales charges and fees associated with each class. All results shown assume reinvestment of distributions during the period. Returns do not reflect the deduction of taxes that a shareholder may pay on Fund distributions or on the redemption of Fund shares. Performance results reflect the effect of any fee waivers or reimbursements of Fund expenses by Columbia Management Investment Advisers, LLC and/or any of its affiliates. Absent these fee waivers or expense reimbursement arrangements, performance results would have been lower.
The performance information shown represents past performance and is not a guarantee of future results. The investment return and principal value of your investment will fluctuate so that your shares, when redeemed, may be worth more or less than their original cost. Current performance may be lower or higher than the performance information shown. You may obtain performance information current to the most recent month-end by contacting your financial intermediary, visiting columbiathreadneedleus.com/investor/ or calling 800.345.6611.
| * | The returns shown for periods prior to the share class inception date (including returns for the Life of the Fund, if shown, which are since Fund inception) include the returns of the Fund’s oldest share class. These returns are adjusted to reflect any higher class-related operating expenses of the newer share classes, as applicable. Please visit columbiathreadneedleus.com/investor/investment-products /mutual-funds/appended-performance for more information. |
The Bloomberg Barclays 3–15 Year Blend Municipal Bond Index is an unmanaged index that tracks the performance of municipal bonds issued after December 31, 1990, with remaining maturities between 2 and 17 years and at least $7 million in principal amount outstanding.
Indices are not available for investment, are not professionally managed and do not reflect sales charges, fees, brokerage commissions, taxes or other expenses of investing. Securities in the Fund may not match those in an index.
| 2 | Columbia AMT-Free Maryland Intermediate Muni Bond Fund | Annual Report 2018 |
Fund at a Glance (continued)
Performance of a hypothetical $10,000 investment (April 30, 2008 — April 30, 2018)
The chart above shows the change in value of a hypothetical $10,000 investment in Class A shares of Columbia AMT-Free Maryland Intermediate Muni Bond Fund during the stated time period, and does not reflect the deduction of taxes that a shareholder may pay on Fund distributions or on the redemption of Fund shares.
| Quality breakdown (%) (at April 30, 2018) |
| AAA rating | 10.7 |
| AA rating | 34.1 |
| A rating | 37.8 |
| BBB rating | 15.2 |
| BB rating | 1.4 |
| Not rated | 0.8 |
| Total | 100.0 |
Percentages indicated are based upon total fixed income investments.
Bond ratings apply to the underlying holdings of the Fund and not the Fund itself and are divided into categories ranging from highest to lowest credit quality, determined by using the middle rating of Moody’s, S&P and Fitch, after dropping the highest and lowest available ratings. When ratings are available from only two rating agencies, the lower rating is used. When a rating is available from only one rating agency, that rating is used. When a bond is not rated by any rating agency, it is designated as “Not rated.” Credit quality ratings assigned by a rating agency are subjective opinions, not statements of fact, and are subject to change, including daily. The ratings assigned by credit rating agencies are but one of the considerations that the Investment Manager and/or Fund’s subadviser incorporates into its credit analysis process, along with such other issuer-specific factors as cash flows, capital structure and leverage ratios, ability to de-leverage (repay) through free cash flow, quality of management, market positioning and access to capital, as well as such security-specific factors as the terms of the security (e.g., interest rate and time to maturity) and the amount and type of any collateral.
Columbia AMT-Free Maryland Intermediate Muni Bond Fund | Annual Report 2018
| 3 |
Manager Discussion of Fund Performance
For the 12-month period that ended April 30, 2018, the Fund’s Class A shares returned 0.65% excluding sales charges. Institutional Class shares of the Fund returned 0.89%. During the same time period, the Fund’s benchmark, the Bloomberg Barclays 3-15 Year Blend Municipal Bond Index, returned 0.87%. The Fund benefited from its overweight in lower rated investment-grade bonds, but its allocations to local general obligation and state appropriation debt detracted.
Market overview
The national municipal bond market posted a small gain in the 12-month period, as the contribution from income helped offset a moderate decline in prices. The period began on a positive note, reflecting the ongoing rebound from the post-election sell-off of late 2016. During this time, prices were supported by a generally positive tone to the financial markets, muted concerns about U.S. Federal Reserve (Fed) policy and a favorable balance of supply and demand stemming from strong mutual fund inflows and lower new issuance. Although unfunded pension liabilities and budgetary stress among notable issuers such as Illinois, New Jersey, Pennsylvania, Connecticut and Kentucky persisted, overall credit conditions for municipal bonds remained on a sound footing. In addition, Illinois passed a budget for the first time in two years in July 2017, preventing the state from being downgraded to a below investment-grade rating. The passage of Illinois’ budget took some risk out of the broader market, providing additional support for prices through the middle of 2017.
The market landscape became more challenging in the autumn after Republican legislators unveiled a preliminary outline for overhauling the nation’s tax code. The initial proposals eliminated municipal issuers’ ability to advance refund outstanding debt, and it stripped private activity bonds (PABs) of their tax-exempt status. The surprise inclusion of the two provisions initially fueled a market rally as investors anticipated a dramatic reduction in future supply. However, municipalities responded to the proposed tax bill by pulling forward an estimated $35 billion of new bond issuance into December in an effort to beat any negative consequences from the potential changes. Fourth-quarter supply therefore jumped to the highest level in history, weighing on prices. The final bill, signed into law on December 22, spared PABs and only marginally reduced top personal tax rates.
Municipal bonds nevertheless remained under pressure in early 2018 as expectations for higher inflation weighed heavily on all segments of the fixed-income market. Investors worried that the introduction of fiscal stimulus, coming at a time when the economy appeared to be operating near full capacity, would force the Fed to raise interest rates further and faster than expected in order to tame inflation. The 10-year U.S. Treasury yield rose sharply during the first half of the quarter as a result, and municipal yields followed suit. Tax reform lessened the value proposition of municipals for banks and insurance companies, leading some to reduce their holdings of municipal bonds, but this potential headwind was offset by a sharp reduction in supply stemming from the surge of new issuance in December. This factor, together with a slowing rate of increase in Treasury yields late in the period, helped stabilize the municipal bond market in March and April. Still, the broad-based national indexes closed roughly flat for the full 12 months due to the earlier sell-off. Lower quality bonds outpaced higher quality issues, reflecting investors’ ongoing search for yield.
Maryland continued to experience slow growth
Maryland’s economy continued to expand at a rate ahead of other states in the northeast, but at a somewhat lackluster pace compared to the nation as a whole. The combination of federal spending cuts and slow population growth offset the benefit of an expanding technology sector, slowing state’s growth rate.
Maryland intermediate municipal bonds significantly underperformed the national intermediate market. Nearly two-thirds of Maryland’s intermediate index is comprised of the highest-quality state and local general obligation issues, which lagged both their national counterparts and the U.S. market as a whole. The state’s debt underperformed the national benchmark by a wide margin within the BBB category due to the strong outperformance of Illinois and New Jersey.
Contributors and detractors
The Fund benefited from its overweight in lower rated investment-grade bonds due to their outperformance versus higher quality securities. At the sector level, the Fund was aided by having a substantial allocation to hospital issues. The sector, which is rated A on average, produced strong relative performance. Similarly, the Fund’s exposure to A rated housing issues contributed positively.
| 4 | Columbia AMT-Free Maryland Intermediate Muni Bond Fund | Annual Report 2018 |
Manager Discussion of Fund Performance (continued)
The Fund’s allocations to local general obligation and state appropriation debt underperformed during the period due in large part to their three- to four-year maturities. The yield curve flattened, with shorter rates increasing more than longer rates, leading to underperformance in the two- to eight-year maturity range. The Fund’s weighting in pre-refunded bonds, which also have an average maturity of about four years, was an additional drag on performance. Refunded bonds are of very high credit quality and contribute relatively less yield to total return.
Fund positioning
Our strategy was largely unchanged during the period. We retained an overweight in A and BBB rated securities, as we did not anticipate a dramatic widening of yield spreads versus higher quality debt. However, given that spreads are very tight for lower rated investment-grade issues, we remained on the lookout for opportunities to increase the portfolio’s credit quality when reinvesting the proceeds of maturing securities. We targeted a neutral duration profile — i.e., an interest-rate sensitivity in line with the benchmark — in order to maintain a balanced stance within the portfolio. The Fund’s positioning continues to reflect our expectation for gradual Fed tightening and a flattening bias to the yield curve.
At the period’s end, Maryland’s credit profile was generally stable at both the state and local level, and the state had passed a balanced budget for the 2019 fiscal year. We believe Maryland also stands to benefit from the changes to federal tax law, which reduce deductions on state tax returns without a commensurate decrease in state tax rates. On the other hand, changes to deductions for state and local taxes and mortgage interest disproportionately affect Maryland residents, as a high proportion have historically itemized those deductions. Such changes may also impact real estate markets, particularly in the suburbs of Baltimore and Washington, D.C. We intend to watch these issues closely as we move through 2018.
Fixed-income securities present issuer default risk. The Fund invests substantially in municipal securities and will be affected by tax, legislative, regulatory, demographic or political changes, as well as changes impacting a state’s financial, economic or other conditions. A relatively small number of tax-exempt issuers may necessitate the Fund investing more heavily in a single issuer and, therefore, be more exposed to the risk of loss than a fund that invests more broadly. The value of the Fund’s portfolio may be more volatile than a more geographically-diversified fund. Prepayment and extension risk exists because the timing of payments on a loan, bond or other investment may accelerate when interest rates fall or decelerate when interest rates rise which may reduce investment opportunities and potential returns. A rise in interest rates may result in a price decline of fixed-income (debt) instruments held by the Fund, negatively affecting its performance and NAV. Falling rates may result in the Fund investing in lower yielding debt instruments, lowering the Fund’s income and yield. Debt instruments with longer maturity and duration have greater sensitivity to interest rate changes. Interest rates can change due to local government and banking regulation changes. Non-investment-grade (high-yield or junk) securities present greater price volatility and more risk to principal and income than higher rated securities. Market risk may affect a single issuer, sector of the economy, industry or the market as a whole. Federal and state tax rules apply to capital gain distributions and any gains or losses on sales. Income may be subject to state or local taxes. Liquidity risk is associated with the difficulty of selling underlying investments at a desirable time or price. See the Fund’s prospectus for more information on these and other risks.
The views expressed in this report reflect the current views of the respective parties. These views are not guarantees of future performance and involve certain risks, uncertainties and assumptions that are difficult to predict, so actual outcomes and results may differ significantly from the views expressed. These views are subject to change at any time based upon economic, market or other conditions and the respective parties disclaim any responsibility to update such views. These views may not be relied on as investment advice and, because investment decisions for a Columbia fund are based on numerous factors, may not be relied on as an indication of trading intent on behalf of any particular Columbia fund. References to specific securities should not be construed as a recommendation or investment advice.
Columbia AMT-Free Maryland Intermediate Muni Bond Fund | Annual Report 2018
| 5 |
Understanding Your Fund’s Expenses
(Unaudited)
As an investor, you incur two types of costs. There are transaction costs, which generally include sales charges on purchases and may include redemption fees. There are also ongoing costs, which generally include management fees, distribution and/or service fees, and other fund expenses. The following information is intended to help you understand your ongoing costs (in dollars) of investing in the Fund and to help you compare these costs with the ongoing costs of investing in other mutual funds.
Analyzing your Fund’s expenses
To illustrate these ongoing costs, we have provided examples and calculated the expenses paid by investors in each share class of the Fund during the period. The actual and hypothetical information in the table is based on an initial investment of $1,000 at the beginning of the period indicated and held for the entire period. Expense information is calculated two ways and each method provides you with different information. The amount listed in the “Actual” column is calculated using the Fund’s actual operating expenses and total return for the period. You may use the Actual information, together with the amount invested, to estimate the expenses that you paid over the period. Simply divide your account value by $1,000 (for example, an $8,600 account value divided by $1,000 = 8.6), then multiply the results by the expenses paid during the period under the “Actual” column. The amount listed in the “Hypothetical” column assumes a 5% annual rate of return before expenses (which is not the Fund’s actual return) and then applies the Fund’s actual expense ratio for the period to the hypothetical return. You should not use the hypothetical account values and expenses to estimate either your actual account balance at the end of the period or the expenses you paid during the period. See “Compare with other funds” below for details on how to use the hypothetical data.
Compare with other funds
Since all mutual funds are required to include the same hypothetical calculations about expenses in shareholder reports, you can use this information to compare the ongoing cost of investing in the Fund with other funds. To do so, compare the hypothetical example with the 5% hypothetical examples that appear in the shareholder reports of other funds. As you compare hypothetical examples of other funds, it is important to note that hypothetical examples are meant to highlight the ongoing costs of investing in a fund only and do not reflect any transaction costs, such as sales charges, or redemption or exchange fees. Therefore, the hypothetical calculations are useful in comparing ongoing costs only, and will not help you determine the relative total costs of owning different funds. If transaction costs were included in these calculations, your costs would be higher.
| November 1, 2017 — April 30, 2018 |
| | Account value at the
beginning of the
period ($) | Account value at the
end of the
period ($) | Expenses paid during
the period ($) | Fund’s annualized
expense ratio (%) |
| | Actual | Hypothetical | Actual | Hypothetical | Actual | Hypothetical | Actual |
| Class A | 1,000.00 | 1,000.00 | 987.10 | 1,020.88 | 3.89 | 3.96 | 0.79 |
| Advisor Class | 1,000.00 | 1,000.00 | 988.30 | 1,022.12 | 2.66 | 2.71 | 0.54 |
| Class C | 1,000.00 | 1,000.00 | 983.40 | 1,017.16 | 7.57 | 7.70 | 1.54 |
| Institutional Class | 1,000.00 | 1,000.00 | 989.20 | 1,022.12 | 2.66 | 2.71 | 0.54 |
| Institutional 3 Class | 1,000.00 | 1,000.00 | 988.90 | 1,022.66 | 2.12 | 2.16 | 0.43 |
Expenses paid during the period are equal to the annualized expense ratio for each class as indicated above, multiplied by the average account value over the period and then multiplied by the number of days in the Fund’s most recent fiscal half year and divided by 365.
Expenses do not include fees and expenses incurred indirectly by the Fund from its investment in underlying funds, including affiliated and non-affiliated pooled investment vehicles, such as mutual funds and exchange-traded funds.
Had Columbia Management Investment Advisers, LLC and/or certain of its affiliates not waived/reimbursed certain fees and expenses, account value at the end of the period would have been reduced.
| 6 | Columbia AMT-Free Maryland Intermediate Muni Bond Fund | Annual Report 2018 |
Portfolio of Investments
April 30, 2018
(Percentages represent value of investments compared to net assets)
Investments in securities
| Municipal Bonds 97.1% |
| Issue Description | Coupon
Rate | | Principal
Amount ($) | Value ($) |
| Disposal 1.8% |
| Maryland Environmental Service |
| Revenue Bonds |
| Mid Shore II Regional Landfill |
| Series 2011 |
| 11/01/2024 | 5.000% | | 1,030,000 | 1,103,604 |
| Higher Education 2.9% |
| Maryland Health & Higher Educational Facilities Authority |
| Revenue Bonds |
| Maryland Institute College of Art |
| Series 2012 |
| 06/01/2029 | 5.000% | | 1,000,000 | 1,089,200 |
| Montgomery County Authority |
| Refunding Revenue Bonds |
| Series 2014 |
| 05/01/2027 | 5.000% | | 500,000 | 560,340 |
| Morgan State University |
| Refunding Revenue Bonds |
| Series 2012 |
| 07/01/2030 | 5.000% | | 150,000 | 163,250 |
| Total | 1,812,790 |
| Hospital 23.7% |
| Maryland Health & Higher Educational Facilities Authority |
| Refunding Revenue Bonds |
| Anne Arundel Health System |
| Series 2014 |
| 07/01/2029 | 5.000% | | 750,000 | 840,083 |
| Series 2017 |
| 07/01/2029 | 5.000% | | 250,000 | 286,555 |
| MedStar Health, Inc. |
| Series 2015 |
| 08/15/2033 | 5.000% | | 500,000 | 554,485 |
| Mercy Medical Center |
| Series 2016A |
| 07/01/2032 | 5.000% | | 600,000 | 663,852 |
| Meritus Medical Center Issue |
| Series 2015 |
| 07/01/2027 | 5.000% | | 1,000,000 | 1,117,090 |
| Peninsula Regional Medical Center |
| Series 2015 |
| 07/01/2034 | 5.000% | | 1,000,000 | 1,092,910 |
| Series 2017B |
| 07/01/2031 | 5.000% | | 1,000,000 | 1,136,840 |
| University of Maryland Medical System |
| Series 2015 |
| 07/01/2028 | 5.000% | | 500,000 | 567,460 |
| Municipal Bonds (continued) |
| Issue Description | Coupon
Rate | | Principal
Amount ($) | Value ($) |
| Western Maryland Health System |
| Series 2014 |
| 07/01/2034 | 5.250% | | 1,500,000 | 1,628,745 |
| Revenue Bonds |
| Carroll Hospital |
| Series 2012A |
| 07/01/2026 | 5.000% | | 1,210,000 | 1,327,370 |
| 07/01/2027 | 5.000% | | 1,000,000 | 1,094,930 |
| Johns Hopkins Health System |
| Series 2012 |
| 07/01/2028 | 5.000% | | 1,000,000 | 1,106,590 |
| Johns Hopkins Health System |
| Series 2013C |
| 05/15/2033 | 5.000% | | 1,500,000 | 1,673,385 |
| MedStar Health |
| Series 2011 |
| 08/15/2022 | 5.000% | | 1,620,000 | 1,760,308 |
| Total | 14,850,603 |
| Investor Owned 4.1% |
| Maryland Economic Development Corp. |
| Refunding Revenue Bonds |
| Potomac |
| Series 2009 |
| 09/01/2022 | 6.200% | | 2,500,000 | 2,586,400 |
| Local Appropriation 2.3% |
| Howard County Housing Commission |
| Revenue Bonds |
| Roger Carter Recreation Center Project |
| Series 2011 |
| 06/01/2026 | 5.000% | | 585,000 | 631,162 |
| Maryland State Transportation Authority |
| Refunding Revenue Bonds |
| Metrorail Parking Projects |
| Series 2014 |
| 07/01/2023 | 4.000% | | 750,000 | 799,410 |
| Total | 1,430,572 |
| Local General Obligation 10.2% |
| City of Baltimore |
| Unlimited General Obligation Bonds |
| Series 2017A |
| 10/15/2033 | 5.000% | | 750,000 | 877,365 |
| County of Anne Arundel |
| Limited General Obligation Bonds |
| Consolidated General Improvement |
| Series 2015 |
| 04/01/2027 | 5.000% | | 1,500,000 | 1,733,625 |
The accompanying Notes to Financial Statements are an integral part of this statement.
Columbia AMT-Free Maryland Intermediate Muni Bond Fund | Annual Report 2018
| 7 |
Portfolio of Investments (continued)
April 30, 2018
| Municipal Bonds (continued) |
| Issue Description | Coupon
Rate | | Principal
Amount ($) | Value ($) |
| County of Frederick |
| Unlimited General Obligation Refunding Bonds |
| Public Facilities |
| Series 2006 |
| 11/01/2021 | 5.250% | | 2,500,000 | 2,765,100 |
| County of Prince George’s |
| Unlimited General Obligation Bonds |
| Series 2017A |
| 09/15/2029 | 3.000% | | 1,000,000 | 1,007,310 |
| Total | 6,383,400 |
| Multi-Family 9.7% |
| Howard County Housing Commission |
| Revenue Bonds |
| Gateway Village Apartments |
| Series 2016 |
| 06/01/2031 | 4.000% | | 870,000 | 907,845 |
| General Capital Improvement Program |
| Series 2015 |
| 06/01/2032 | 4.000% | | 750,000 | 769,530 |
| Woodfield Oxford Square Apartments |
| Series 2017 |
| 12/01/2029 | 5.000% | | 555,000 | 639,826 |
| Maryland Economic Development Corp. |
| Refunding Revenue Bonds |
| University of Maryland Baltimore County Student Housing |
| Series 2016 (AGM) |
| 07/01/2030 | 5.000% | | 725,000 | 829,842 |
| University of Maryland College Park Student Housing |
| Series 2016 (AGM) |
| 06/01/2030 | 5.000% | | 875,000 | 1,000,405 |
| Revenue Bonds |
| Salisbury University Project |
| Series 2012 |
| 06/01/2027 | 5.000% | | 1,100,000 | 1,180,377 |
| Towson University Project |
| Senior Series 2012 |
| 07/01/2027 | 5.000% | | 700,000 | 762,692 |
| Total | 6,090,517 |
| Other Bond Issue 4.8% |
| City of Baltimore |
| Refunding Revenue Bonds |
| Convention Center Hotel |
| Series 2017 |
| 09/01/2028 | 5.000% | | 750,000 | 854,227 |
| County of Montgomery |
| Revenue Bonds |
| Department of Liquor Control |
| Series 2009A |
| 04/01/2022 | 5.000% | | 2,055,000 | 2,113,547 |
| Municipal Bonds (continued) |
| Issue Description | Coupon
Rate | | Principal
Amount ($) | Value ($) |
| Maryland Community Development Administration |
| Revenue Bonds |
| Capital Fund Securitization |
| Series 2003 (AGM) |
| 07/01/2021 | 4.400% | | 40,000 | 40,078 |
| Total | 3,007,852 |
| Other Industrial Development Bond 1.3% |
| Maryland Economic Development Corp. |
| Refunding Revenue Bonds |
| CNX Marine Terminals, Inc. |
| Series 2010 |
| 09/01/2025 | 5.750% | | 800,000 | 834,616 |
| Refunded / Escrowed 6.7% |
| City of Baltimore |
| Prerefunded 10/15/18 Unlimited General Obligation Bonds |
| Consolidated Public Improvement |
| Series 2008A (AGM) |
| 10/15/2022 | 5.000% | | 1,000,000 | 1,014,760 |
| Revenue Bonds |
| Water Project |
| Series 1994A Escrowed to Maturity (FGIC) |
| 07/01/2024 | 5.000% | | 1,400,000 | 1,565,228 |
| State of Maryland |
| Prerefunded 03/01/23 Unlimited General Obligation Bonds |
| Series 2015A |
| 03/01/2027 | 4.000% | | 1,500,000 | 1,616,625 |
| Total | 4,196,613 |
| Retirement Communities 5.7% |
| City of Gaithersburg |
| Refunding Revenue Bonds |
| Asbury Obligation Group |
| Series 2009B |
| 01/01/2023 | 6.000% | | 1,250,000 | 1,327,987 |
| County of Baltimore |
| Refunding Revenue Bonds |
| Oak Crest Village, Inc. |
| Series 2016 |
| 01/01/2029 | 5.000% | | 500,000 | 560,720 |
| County of Howard |
| Refunding Revenue Bonds |
| Columbia Vantage House Corp. |
| Series 2017 |
| 04/01/2026 | 5.000% | | 500,000 | 529,505 |
| Maryland Health & Higher Educational Facilities Authority |
| Refunding Revenue Bonds |
| Charlestown Community |
| Series 2016A |
| 01/01/2028 | 5.000% | | 1,000,000 | 1,141,500 |
| Total | 3,559,712 |
The accompanying Notes to Financial Statements are an integral part of this statement.
| 8 | Columbia AMT-Free Maryland Intermediate Muni Bond Fund | Annual Report 2018 |
Portfolio of Investments (continued)
April 30, 2018
| Municipal Bonds (continued) |
| Issue Description | Coupon
Rate | | Principal
Amount ($) | Value ($) |
| Single Family 1.0% |
| Maryland Community Development Administration Housing |
| Revenue Bonds |
| Series 2016 |
| 03/01/2036 | 3.250% | | 600,000 | 598,368 |
| Special Non Property Tax 3.6% |
| Maryland Stadium Authority |
| Revenue Bonds |
| Construction and Revitalization |
| Series 2018 |
| 05/01/2033 | 5.000% | | 1,000,000 | 1,154,820 |
| State of Maryland Department of Transportation |
| Revenue Bonds |
| 3rd Series 2015 |
| 12/15/2026 | 4.000% | | 1,000,000 | 1,076,530 |
| Total | 2,231,350 |
| Special Property Tax 7.3% |
| Anne Arundel County Consolidated District |
| Special Tax Refunding Bonds |
| Villages of Dorchester & Farmington |
| Series 2013 |
| 07/01/2023 | 5.000% | | 225,000 | 251,852 |
| 07/01/2024 | 5.000% | | 500,000 | 557,365 |
| City of Baltimore |
| Refunding Tax Allocation Bonds |
| Consolidated Tax Projects |
| Series 2015 |
| 06/15/2027 | 5.000% | | 520,000 | 578,037 |
| County of Frederick |
| Special Tax Bonds |
| Urbana Community Development Authority |
| Series 2010A |
| 07/01/2025 | 5.000% | | 2,500,000 | 2,659,625 |
| County of Montgomery |
| Refunding Special Tax Bonds |
| West Germantown Development District |
| Series 2014 |
| 07/01/2025 | 4.000% | | 485,000 | 519,711 |
| Total | 4,566,590 |
| Municipal Bonds (continued) |
| Issue Description | Coupon
Rate | | Principal
Amount ($) | Value ($) |
| State Appropriated 4.7% |
| Maryland Economic Development Corp. |
| Refunding Revenue Bonds |
| Department of Transportation Headquarters |
| Series 2010 |
| 06/01/2022 | 4.500% | | 2,675,000 | 2,910,534 |
| State General Obligation 1.7% |
| State of Maryland |
| Unlimited General Obligation Bonds |
| Series 2017A |
| 08/01/2030 | 4.000% | | 500,000 | 543,890 |
| Unlimited General Obligation Refunding Bonds |
| Series 2015B |
| 08/01/2024 | 4.000% | | 500,000 | 546,140 |
| Total | 1,090,030 |
| Transportation 1.9% |
| Washington Metropolitan Area Transit Authority |
| Refunding Revenue Bonds |
| Series 2017A-1 |
| 07/01/2029 | 5.000% | | 1,000,000 | 1,180,240 |
| Water & Sewer 3.7% |
| City of Baltimore |
| Subordinated Revenue Bonds |
| Series 2014A |
| 07/01/2032 | 5.000% | | 1,000,000 | 1,127,030 |
| Wastewater Project |
| Series 2017A |
| 07/01/2031 | 5.000% | | 1,000,000 | 1,155,680 |
| Total | 2,282,710 |
Total Municipal Bonds
(Cost $59,555,945) | 60,716,501 |
Total Investments in Securities
(Cost: $59,555,945) | 60,716,501 |
| Other Assets & Liabilities, Net | | 1,812,904 |
| Net Assets | 62,529,405 |
Abbreviation Legend
| AGM | Assured Guaranty Municipal Corporation |
| FGIC | Financial Guaranty Insurance Corporation |
Fair value measurements
The Fund categorizes its fair value measurements according to a three-level hierarchy that maximizes the use of observable inputs and minimizes the use of unobservable inputs by prioritizing that the most observable input be used when available. Observable inputs are those that market participants would use in pricing an investment based on market data obtained from sources independent of the reporting entity. Unobservable inputs are those that reflect the Fund’s assumptions about the information market participants would use in
The accompanying Notes to Financial Statements are an integral part of this statement.
Columbia AMT-Free Maryland Intermediate Muni Bond Fund | Annual Report 2018
| 9 |
Portfolio of Investments (continued)
April 30, 2018
Fair value measurements (continued)
pricing an investment. An investment’s level within the fair value hierarchy is based on the lowest level of any input that is deemed significant to the asset’s or liability’s fair value measurement. The input levels are not necessarily an indication of the risk or liquidity associated with investments at that level. For example, certain U.S. government securities are generally high quality and liquid, however, they are reflected as Level 2 because the inputs used to determine fair value may not always be quoted prices in an active market.
Fair value inputs are summarized in the three broad levels listed below:
| ■ | Level 1 — Valuations based on quoted prices for investments in active markets that the Fund has the ability to access at the measurement date. Valuation adjustments are not applied to Level 1 investments. |
| ■ | Level 2 — Valuations based on other significant observable inputs (including quoted prices for similar securities, interest rates, prepayment speeds, credit risks, etc.). |
| ■ | Level 3 — Valuations based on significant unobservable inputs (including the Fund’s own assumptions and judgment in determining the fair value of investments). |
Inputs that are used in determining fair value of an investment may include price information, credit data, volatility statistics, and other factors. These inputs can be either observable or unobservable. The availability of observable inputs can vary between investments, and is affected by various factors such as the type of investment, and the volume and level of activity for that investment or similar investments in the marketplace. The inputs will be considered by the Investment Manager, along with any other relevant factors in the calculation of an investment’s fair value. The Fund uses prices and inputs that are current as of the measurement date, which may include periods of market dislocations. During these periods, the availability of prices and inputs may be reduced for many investments. This condition could cause an investment to be reclassified between the various levels within the hierarchy.
Investments falling into the Level 3 category are primarily supported by quoted prices from brokers and dealers participating in the market for those investments. However, these may be classified as Level 3 investments due to lack of market transparency and corroboration to support these quoted prices. Additionally, valuation models may be used as the pricing source for any remaining investments classified as Level 3. These models may rely on one or more significant unobservable inputs and/or significant assumptions by the Investment Manager. Inputs used in valuations may include, but are not limited to, financial statement analysis, capital account balances, discount rates and estimated cash flows, and comparable company data.
Under the direction of the Fund’s Board of Trustees (the Board), the Investment Manager’s Valuation Committee (the Committee) is responsible for overseeing the valuation procedures approved by the Board. The Committee consists of voting and non-voting members from various groups within the Investment Manager’s organization, including operations and accounting, trading and investments, compliance, risk management and legal.
The Committee meets at least monthly to review and approve valuation matters, which may include a description of specific valuation determinations, data regarding pricing information received from approved pricing vendors and brokers and the results of Board-approved valuation control policies and procedures (the Policies). The Policies address, among other things, instances when market quotations are or are not readily available, including recommendations of third party pricing vendors and a determination of appropriate pricing methodologies; events that require specific valuation determinations and assessment of fair value techniques; securities with a potential for stale pricing, including those that are illiquid, restricted, or in default; and the effectiveness of third party pricing vendors, including periodic reviews of vendors. The Committee meets more frequently, as needed, to discuss additional valuation matters, which may include the need to review back-testing results, review time-sensitive information or approve related valuation actions. The Committee reports to the Board, with members of the Committee meeting with the Board at each of its regularly scheduled meetings to discuss valuation matters and actions during the period, similar to those described earlier.
For investments categorized as Level 3, the Committee monitors information similar to that described above, which may include: (i) data specific to the issuer or comparable issuers, (ii) general market or specific sector news and (iii) quoted prices and specific or similar security transactions. The Committee considers this data and any changes from prior periods in order to assess the reasonableness of observable and unobservable inputs, any assumptions or internal models used to value those securities and changes in fair value. This data is also used to corroborate, when available, information received from approved pricing vendors and brokers. Various factors impact the frequency of monitoring this information (which may occur as often as daily). However, the Committee may determine that changes to inputs, assumptions and models are not required as a result of the monitoring procedures performed.
The following table is a summary of the inputs used to value the Fund’s investments at April 30, 2018:
| | Level 1
quoted prices in active
markets for identical
assets ($) | Level 2
other significant
observable inputs ($) | Level 3
significant
unobservable inputs ($) | Total ($) |
| Investments in Securities | | | | |
| Municipal Bonds | — | 60,716,501 | — | 60,716,501 |
| Total Investments in Securities | — | 60,716,501 | — | 60,716,501 |
See the Portfolio of Investments for all investment classifications not indicated in the table.
The Fund’s assets assigned to the Level 2 input category are generally valued using the market approach, in which a security’s value is determined through reference to prices and information from market transactions for similar or identical assets.
There were no transfers of financial assets between levels during the period.
The accompanying Notes to Financial Statements are an integral part of this statement.
| 10 | Columbia AMT-Free Maryland Intermediate Muni Bond Fund | Annual Report 2018 |
Statement of Assets and Liabilities
April 30, 2018
| Assets | |
| Investments in securities, at value | |
| Unaffiliated issuers (cost $59,555,945) | $60,716,501 |
| Cash | 1,137,670 |
| Receivable for: | |
| Capital shares sold | 147,848 |
| Interest | 831,026 |
| Expense reimbursement due from Investment Manager | 824 |
| Prepaid expenses | 563 |
| Total assets | 62,834,432 |
| Liabilities | |
| Payable for: | |
| Capital shares purchased | 8,933 |
| Distributions to shareholders | 146,822 |
| Management services fees | 2,411 |
| Distribution and/or service fees | 482 |
| Transfer agent fees | 2,434 |
| Compensation of board members | 108,341 |
| Audit fees | 31,520 |
| Other expenses | 4,084 |
| Total liabilities | 305,027 |
| Net assets applicable to outstanding capital stock | $62,529,405 |
| Represented by | |
| Paid in capital | 60,815,627 |
| Undistributed net investment income | 238,451 |
| Accumulated net realized gain | 314,771 |
| Unrealized appreciation (depreciation) on: | |
| Investments - unaffiliated issuers | 1,160,556 |
| Total - representing net assets applicable to outstanding capital stock | $62,529,405 |
| Class A | |
| Net assets | $13,494,252 |
| Shares outstanding | 1,302,677 |
| Net asset value per share | $10.36 |
| Maximum sales charge | 3.00% |
| Maximum offering price per share (calculated by dividing the net asset value per share by 1.0 minus the maximum sales charge for Class A shares) | $10.68 |
| Advisor Class | |
| Net assets | $274,498 |
| Shares outstanding | 26,487 |
| Net asset value per share | $10.36 |
| Class C | |
| Net assets | $2,496,543 |
| Shares outstanding | 240,937 |
| Net asset value per share | $10.36 |
| Institutional Class | |
| Net assets | $7,147,864 |
| Shares outstanding | 690,144 |
| Net asset value per share | $10.36 |
| Institutional 3 Class | |
| Net assets | $39,116,248 |
| Shares outstanding | 3,764,047 |
| Net asset value per share | $10.39 |
The accompanying Notes to Financial Statements are an integral part of this statement.
Columbia AMT-Free Maryland Intermediate Muni Bond Fund | Annual Report 2018
| 11 |
Statement of Operations
Year Ended April 30, 2018
| Net investment income | |
| Income: | |
| Interest | $2,329,046 |
| Total income | 2,329,046 |
| Expenses: | |
| Management services fees | 328,101 |
| Distribution and/or service fees | |
| Class A | 36,494 |
| Class B | 27 |
| Class C | 27,411 |
| Transfer agent fees | |
| Class A | 17,910 |
| Advisor Class | 280 |
| Class B | 4 |
| Class C | 3,359 |
| Institutional Class | 32,102 |
| Institutional 3 Class | 2,399 |
| Compensation of board members | 22,546 |
| Custodian fees | 1,551 |
| Printing and postage fees | 10,955 |
| Registration fees | 8,826 |
| Audit fees | 31,520 |
| Legal fees | 7,719 |
| Compensation of chief compliance officer | 15 |
| Other | 10,762 |
| Total expenses | 541,981 |
| Fees waived or expenses reimbursed by Investment Manager and its affiliates | (131,322) |
| Expense reduction | (20) |
| Total net expenses | 410,639 |
| Net investment income | 1,918,407 |
| Realized and unrealized gain (loss) — net | |
| Net realized gain (loss) on: | |
| Investments — unaffiliated issuers | 655,064 |
| Net realized gain | 655,064 |
| Net change in unrealized appreciation (depreciation) on: | |
| Investments — unaffiliated issuers | (1,815,996) |
| Net change in unrealized appreciation (depreciation) | (1,815,996) |
| Net realized and unrealized loss | (1,160,932) |
| Net increase in net assets resulting from operations | $757,475 |
The accompanying Notes to Financial Statements are an integral part of this statement.
| 12 | Columbia AMT-Free Maryland Intermediate Muni Bond Fund | Annual Report 2018 |
Statement of Changes in Net Assets
| | Year Ended
April 30, 2018 | Year Ended
April 30, 2017 (a) |
| Operations | | |
| Net investment income | $1,918,407 | $2,425,412 |
| Net realized gain | 655,064 | 83,953 |
| Net change in unrealized appreciation (depreciation) | (1,815,996) | (3,079,707) |
| Net increase (decrease) in net assets resulting from operations | 757,475 | (570,342) |
| Distributions to shareholders | | |
| Net investment income | | |
| Class A | (370,117) | (432,259) |
| Advisor Class | (6,742) | (857) |
| Class B | (48) | (513) |
| Class C | (49,028) | (48,648) |
| Institutional Class | (625,161) | (1,947,621) |
| Institutional 3 Class | (855,839) | (49) |
| Net realized gains | | |
| Class A | (68,715) | — |
| Advisor Class | (1,463) | — |
| Class C | (12,828) | — |
| Institutional Class | (37,642) | — |
| Institutional 3 Class | (203,316) | — |
| Total distributions to shareholders | (2,230,899) | (2,429,947) |
| Decrease in net assets from capital stock activity | (11,738,743) | (14,715,705) |
| Total decrease in net assets | (13,212,167) | (17,715,994) |
| Net assets at beginning of year | 75,741,572 | 93,457,566 |
| Net assets at end of year | $62,529,405 | $75,741,572 |
| Undistributed net investment income | $238,451 | $226,979 |
| (a) | Institutional 3 Class shares are based on operations from March 1, 2017 (commencement of operations) through the stated period end. |
The accompanying Notes to Financial Statements are an integral part of this statement.
Columbia AMT-Free Maryland Intermediate Muni Bond Fund | Annual Report 2018
| 13 |
Statement of Changes in Net Assets (continued)
| | Year Ended | Year Ended |
| | April 30, 2018 | April 30, 2017 (a) |
| | Shares | Dollars ($) | Shares | Dollars ($) |
| Capital stock activity |
| Class A | | | | |
| Subscriptions | 85,503 | 907,957 | 106,251 | 1,147,040 |
| Distributions reinvested | 17,445 | 184,585 | 17,202 | 184,611 |
| Redemptions | (226,319) | (2,401,454) | (381,477) | (4,045,942) |
| Net decrease | (123,371) | (1,308,912) | (258,024) | (2,714,291) |
| Advisor Class | | | | |
| Subscriptions | 27,261 | 290,484 | 8,087 | 85,000 |
| Distributions reinvested | 746 | 7,880 | 55 | 579 |
| Redemptions | (9,587) | (99,919) | (1,011) | (10,679) |
| Net increase | 18,420 | 198,445 | 7,131 | 74,900 |
| Class B | | | | |
| Subscriptions | — | — | 7 | 85 |
| Distributions reinvested | — | — | 23 | 245 |
| Redemptions | (932) | (10,068) | (3,043) | (31,891) |
| Net decrease | (932) | (10,068) | (3,013) | (31,561) |
| Class C | | | | |
| Subscriptions | 17,933 | 189,029 | 54,263 | 582,482 |
| Distributions reinvested | 4,449 | 47,094 | 3,534 | 37,881 |
| Redemptions | (46,116) | (486,467) | (35,049) | (371,820) |
| Net increase (decrease) | (23,734) | (250,344) | 22,748 | 248,543 |
| Institutional Class | | | | |
| Subscriptions | 128,919 | 1,369,506 | 1,563,041 | 16,864,850 |
| Distributions reinvested | 19,642 | 207,942 | 16,480 | 176,823 |
| Redemptions | (4,898,845) | (52,510,963) | (2,779,018) | (29,344,969) |
| Net decrease | (4,750,284) | (50,933,515) | (1,199,497) | (12,303,296) |
| Institutional 3 Class | | | | |
| Subscriptions | 4,509,797 | 48,484,322 | 948 | 10,000 |
| Distributions reinvested | 621 | 6,549 | — | — |
| Redemptions | (747,319) | (7,925,220) | — | — |
| Net increase | 3,763,099 | 40,565,651 | 948 | 10,000 |
| Total net decrease | (1,116,802) | (11,738,743) | (1,429,707) | (14,715,705) |
| (a) | Institutional 3 Class shares are based on operations from March 1, 2017 (commencement of operations) through the stated period end. |
The accompanying Notes to Financial Statements are an integral part of this statement.
| 14 | Columbia AMT-Free Maryland Intermediate Muni Bond Fund | Annual Report 2018 |
[THIS PAGE INTENTIONALLY LEFT BLANK]
Columbia AMT-Free Maryland Intermediate Muni Bond Fund | Annual Report 2018
| 15 |
The following table is intended to help you understand the Fund’s financial performance. Certain information reflects financial results for a single share of a class held for the periods shown. Per share net investment income (loss) amounts are calculated based on average shares outstanding during the period. Total return assumes reinvestment of all dividends and distributions, if any. Total return does not reflect payment of sales charges, if any. Total return and portfolio turnover are not annualized for periods of less than one year. The portfolio turnover rate is calculated without regard to purchase and sales transactions of short-term instruments and certain derivatives, if any. If such transactions were included, the Fund’s portfolio turnover rate may be higher.
| | Net asset value,
beginning of
period | Net
investment
income | Net
realized
and
unrealized
gain (loss) | Total from
investment
operations | Distributions
from net
investment
income | Distributions
from net
realized
gains |
| Class A |
| Year Ended 4/30/2018 | $10.61 | 0.27 | (0.20) | 0.07 | (0.27) | (0.05) |
| Year Ended 4/30/2017 | $10.90 | 0.27 | (0.29) | (0.02) | (0.27) | — |
| Year Ended 4/30/2016 | $10.81 | 0.29 | 0.09 | 0.38 | (0.29) | — |
| Year Ended 4/30/2015 | $10.80 | 0.31 | 0.01 | 0.32 | (0.31) | — |
| Year Ended 4/30/2014 | $11.14 | 0.32 | (0.34) | (0.02) | (0.32) | — |
| Advisor Class |
| Year Ended 4/30/2018 | $10.61 | 0.30 | (0.20) | 0.10 | (0.30) | (0.05) |
| Year Ended 4/30/2017 | $10.90 | 0.30 | (0.29) | 0.01 | (0.30) | — |
| Year Ended 4/30/2016 | $10.81 | 0.32 | 0.09 | 0.41 | (0.32) | — |
| Year Ended 4/30/2015 | $10.80 | 0.34 | 0.01 | 0.35 | (0.34) | — |
| Year Ended 4/30/2014 | $11.14 | 0.34 | (0.34) | 0.00 (d) | (0.34) | — |
| Class C |
| Year Ended 4/30/2018 | $10.61 | 0.19 | (0.20) | (0.01) | (0.19) | (0.05) |
| Year Ended 4/30/2017 | $10.90 | 0.19 | (0.29) | (0.10) | (0.19) | — |
| Year Ended 4/30/2016 | $10.81 | 0.21 | 0.09 | 0.30 | (0.21) | — |
| Year Ended 4/30/2015 | $10.80 | 0.23 | 0.01 | 0.24 | (0.23) | — |
| Year Ended 4/30/2014 | $11.14 | 0.24 | (0.34) | (0.10) | (0.24) | — |
| Institutional Class |
| Year Ended 4/30/2018 | $10.61 | 0.30 | (0.20) | 0.10 | (0.30) | (0.05) |
| Year Ended 4/30/2017 | $10.90 | 0.29 | (0.28) | 0.01 | (0.30) | — |
| Year Ended 4/30/2016 | $10.81 | 0.32 | 0.09 | 0.41 | (0.32) | — |
| Year Ended 4/30/2015 | $10.80 | 0.34 | 0.01 | 0.35 | (0.34) | — |
| Year Ended 4/30/2014 | $11.14 | 0.34 | (0.34) | 0.00 (d) | (0.34) | — |
| Institutional 3 Class |
| Year Ended 4/30/2018 | $10.64 | 0.31 | (0.20) | 0.11 | (0.31) | (0.05) |
| Year Ended 4/30/2017(e) | $10.55 | 0.05 | 0.09 (f) | 0.14 | (0.05) | — |
| Notes to Financial Highlights |
| (a) | In addition to the fees and expenses that the Fund bears directly, the Fund indirectly bears a pro rata share of the fees and expenses of any other funds in which it invests. Such indirect expenses are not included in the Fund’s reported expense ratios. |
| (b) | Total net expenses include the impact of certain fee waivers/expense reimbursements made by the Investment Manager and certain of its affiliates, if applicable. |
| (c) | The benefits derived from expense reductions had an impact of less than 0.01%. |
| (d) | Rounds to zero. |
| (e) | Institutional 3 Class shares commenced operations on March 1, 2017. Per share data and total return reflect activity from that date. |
| (f) | Calculation of the net gain (loss) per share (both realized and unrealized) does not correlate to the aggregate realized and unrealized gain (loss) presented in the Statement of Operations due to the timing of subscriptions and redemptions of Fund shares in relation to fluctuations in the market value of the portfolio. |
| (g) | Annualized. |
The accompanying Notes to Financial Statements are an integral part of this statement.
| 16 | Columbia AMT-Free Maryland Intermediate Muni Bond Fund | Annual Report 2018 |
Total
distributions to
shareholders | Net
asset
value,
end of
period | Total
return | Total gross
expense
ratio to
average
net assets(a) | Total net
expense
ratio to
average
net assets(a),(b) | Net investment
income
ratio to
average
net assets | Portfolio
turnover | Net
assets,
end of
period
(000’s) |
| |
| (0.32) | $10.36 | 0.65% | 0.98% | 0.79% (c) | 2.55% | 9% | $13,494 |
| (0.27) | $10.61 | (0.19%) | 1.01% | 0.81% | 2.50% | 20% | $15,125 |
| (0.29) | $10.90 | 3.60% | 1.04% | 0.81% (c) | 2.72% | 13% | $18,362 |
| (0.31) | $10.81 | 3.00% | 1.04% | 0.81% (c) | 2.87% | 10% | $20,593 |
| (0.32) | $10.80 | (0.16%) | 1.05% | 0.81% (c) | 2.94% | 2% | $20,973 |
| |
| (0.35) | $10.36 | 0.90% | 0.72% | 0.54% (c) | 2.79% | 9% | $274 |
| (0.30) | $10.61 | 0.07% | 0.72% | 0.54% | 2.87% | 20% | $86 |
| (0.32) | $10.90 | 3.86% | 0.77% | 0.56% (c) | 2.97% | 13% | $10 |
| (0.34) | $10.81 | 3.25% | 0.78% | 0.56% (c) | 3.12% | 10% | $10 |
| (0.34) | $10.80 | 0.08% | 0.81% | 0.56% (c) | 3.24% | 2% | $10 |
| |
| (0.24) | $10.36 | (0.10%) | 1.73% | 1.54% (c) | 1.80% | 9% | $2,497 |
| (0.19) | $10.61 | (0.93%) | 1.76% | 1.56% | 1.76% | 20% | $2,807 |
| (0.21) | $10.90 | 2.83% | 1.79% | 1.56% (c) | 1.97% | 13% | $2,638 |
| (0.23) | $10.81 | 2.23% | 1.79% | 1.56% (c) | 2.11% | 10% | $2,796 |
| (0.24) | $10.80 | (0.90%) | 1.80% | 1.56% (c) | 2.19% | 2% | $2,666 |
| |
| (0.35) | $10.36 | 0.89% | 0.74% | 0.55% (c) | 2.76% | 9% | $7,148 |
| (0.30) | $10.61 | 0.06% | 0.76% | 0.56% | 2.75% | 20% | $57,704 |
| (0.32) | $10.90 | 3.86% | 0.79% | 0.56% (c) | 2.97% | 13% | $72,405 |
| (0.34) | $10.81 | 3.26% | 0.79% | 0.56% (c) | 3.12% | 10% | $68,033 |
| (0.34) | $10.80 | 0.09% | 0.79% | 0.56% (c) | 3.17% | 2% | $63,765 |
| |
| (0.36) | $10.39 | 1.02% | 0.62% | 0.43% | 2.93% | 9% | $39,116 |
| (0.05) | $10.64 | 1.35% | 0.58% (g) | 0.42% (g) | 3.05% (g) | 20% | $10 |
Columbia AMT-Free Maryland Intermediate Muni Bond Fund | Annual Report 2018
| 17 |
Notes to Financial Statements
April 30, 2018
Note 1. Organization
Columbia AMT-Free Maryland Intermediate Muni Bond Fund (the Fund), a series of Columbia Funds Series Trust (the Trust), is a non-diversified fund. The Trust is registered under the Investment Company Act of 1940, as amended (the 1940 Act), as an open-end management investment company organized as a Delaware statutory trust.
Fund shares
The Trust may issue an unlimited number of shares (without par value). Although all share classes generally have identical voting, dividend and liquidation rights, each share class votes separately when required by the Trust’s organizational documents or by law. Different share classes pay different distribution amounts to the extent the expenses of such share classes differ, and distributions in liquidation will be proportional to the net asset value of each share class. Each share class has its own expense and sales charge structure. The Fund offers each of the share classes identified below.
Class A shares are subject to a maximum front-end sales charge of 3.00% based on the initial investment amount. Class A shares purchased without an initial sales charge are subject to a contingent deferred sales charge (CDSC) of 0.75% on certain investments of $500,000 or more if redeemed within 12 months after purchase.
Advisor Class shares are not subject to sales charges and are generally available only to omnibus retirement plans and certain investors as described in the Fund’s prospectus. Prior to November 1, 2017, Advisor Class shares were known as Class R4 shares.
Class B shares of the Fund are no longer offered for sale. When available, Class B shares were subject to a maximum CDSC of 3.00% based upon the holding period after purchase. Effective July 17, 2017, Class B shares were automatically converted to Class A shares without a CDSC. On August 4, 2017, the capital owned by Columbia Management Investment Advisers, LLC in Class B shares was redeemed without a CDSC.
Class C shares are subject to a 1.00% CDSC on shares redeemed within 12 months after purchase.
Institutional Class shares are not subject to sales charges and are generally available only to eligible investors, which are subject to different investment minimums as described in the Fund’s prospectus. Prior to November 1, 2017, Institutional Class shares were known as Class Z shares.
Institutional 3 Class shares are not subject to sales charges and are available to institutional and certain other investors as described in the Fund’s prospectus. Prior to November 1, 2017, Institutional 3 Class shares were known as Class Y shares.
Note 2. Summary of significant accounting policies
Basis of preparation
The Fund is an investment company that applies the accounting and reporting guidance in the Financial Accounting Standards Board (FASB) Accounting Standards Codification Topic 946, Financial Services - Investment Companies (ASC 946). The financial statements are prepared in accordance with U.S. generally accepted accounting principles (GAAP), which requires management to make certain estimates and assumptions that affect the reported amounts of assets and liabilities, the disclosure of contingent assets and liabilities at the date of the financial statements and the reported amounts of income and expenses during the reporting period. Actual results could differ from those estimates.
The following is a summary of significant accounting policies followed by the Fund in the preparation of its financial statements.
Security valuation
Debt securities generally are valued by pricing services approved by the Board of Trustees based upon market transactions for normal, institutional-size trading units of similar securities. The services may use various pricing techniques that take into account, as applicable, factors such as yield, quality, coupon rate, maturity, type of issue, trading characteristics and other data, as well as approved independent broker-dealer quotes. Debt securities for which quotations are not readily available or
| 18 | Columbia AMT-Free Maryland Intermediate Muni Bond Fund | Annual Report 2018 |
Notes to Financial Statements (continued)
April 30, 2018
not believed to be reflective of market value may also be valued based upon a bid quote from an approved independent broker-dealer. Debt securities maturing in 60 days or less are valued primarily at amortized cost value, unless this method results in a valuation that management believes does not approximate market value.
Investments for which market quotations are not readily available, or that have quotations which management believes are not reflective of market value or reliable, are valued at fair value as determined in good faith under procedures approved by and under the general supervision of the Board of Trustees. If a security or class of securities (such as foreign securities) is valued at fair value, such value is likely to be different from the quoted or published price for the security.
The determination of fair value often requires significant judgment. To determine fair value, management may use assumptions including but not limited to future cash flows and estimated risk premiums. Multiple inputs from various sources may be used to determine fair value.
GAAP requires disclosure regarding the inputs and valuation techniques used to measure fair value and any changes in valuation inputs or techniques. In addition, investments shall be disclosed by major category. This information is disclosed following the Fund’s Portfolio of Investments.
Security transactions
Security transactions are accounted for on the trade date. Cost is determined and gains (losses) are based upon the specific identification method for both financial statement and federal income tax purposes.
Income recognition
Interest income is recorded on an accrual basis. Market premiums and discounts, including original issue discounts, are amortized and accreted, respectively, over the expected life of the security on all debt securities, unless otherwise noted.
The Fund may place a debt security on non-accrual status and reduce related interest income when it becomes probable that the interest will not be collected and the amount of uncollectible interest can be reasonably estimated. A defaulted debt security is removed from non-accrual status when the issuer resumes interest payments or when collectibility of interest is reasonably assured.
Expenses
General expenses of the Trust are allocated to the Fund and other funds of the Trust based upon relative net assets or other expense allocation methodologies determined by the nature of the expense. Expenses directly attributable to the Fund are charged to the Fund. Expenses directly attributable to a specific class of shares are charged to that share class.
Determination of class net asset value
All income, expenses (other than class-specific expenses, which are charged to that share class, as shown in the Statement of Operations) and realized and unrealized gains (losses) are allocated to each class of the Fund on a daily basis, based on the relative net assets of each class, for purposes of determining the net asset value of each class.
Federal income tax status
The Fund intends to qualify each year as a regulated investment company under Subchapter M of the Internal Revenue Code, as amended, and will distribute substantially all of its net tax-exempt and investment company taxable income and net capital gain, if any, for its tax year, and as such will not be subject to federal income taxes. In addition, the Fund intends to distribute in each calendar year substantially all of its ordinary income, capital gain net income and certain other amounts, if any, such that the Fund should not be subject to federal excise tax. Therefore, no federal income or excise tax provision is recorded.
Distributions to shareholders
Distributions from net investment income, if any, are declared daily and paid monthly. Net realized capital gains, if any, are distributed at least annually. Income distributions and capital gain distributions are determined in accordance with federal income tax regulations, which may differ from GAAP.
Columbia AMT-Free Maryland Intermediate Muni Bond Fund | Annual Report 2018
| 19 |
Notes to Financial Statements (continued)
April 30, 2018
Guarantees and indemnifications
Under the Trust’s organizational documents and, in some cases, by contract, its officers and trustees are indemnified against certain liabilities arising out of the performance of their duties to the Trust or its funds. In addition, certain of the Fund’s contracts with its service providers contain general indemnification clauses. The Fund’s maximum exposure under these arrangements is unknown since the amount of any future claims that may be made against the Fund cannot be determined, and the Fund has no historical basis for predicting the likelihood of any such claims.
Recent accounting pronouncement
Accounting Standards Update 2017-08 Premium Amortization on Purchased Callable Debt Securities
In March 2017, the Financial Accounting Standards Board issued Accounting Standards Update (ASU) No. 2017-08 Premium Amortization on Purchased Callable Debt Securities. ASU No. 2017-08 updates the accounting standards to shorten the amortization period for certain purchased callable debt securities, held at a premium, to be amortized to the earliest call date. The update applies to securities with explicit, noncontingent call features that are callable at fixed prices and on preset dates. The standard is effective for annual periods beginning after December 15, 2018 and interim periods within those fiscal years. At this time, management is evaluating the implication of this guidance and the impact it will have on the financial statement amounts and footnote disclosures, if any.
Note 3. Fees and other transactions with affiliates
Management services fees
The Fund has entered into a Management Agreement with Columbia Management Investment Advisers, LLC (the Investment Manager), a wholly-owned subsidiary of Ameriprise Financial, Inc. (Ameriprise Financial). Under the Management Agreement, the Investment Manager provides the Fund with investment research and advice, as well as administrative and accounting services. The management services fee is an annual fee that is equal to a percentage of the Fund’s daily net assets that declines from 0.47% to 0.31% as the Fund’s net assets increase. The effective management services fee rate for the year ended April 30, 2018 was 0.47% of the Fund’s average daily net assets.
Compensation of board members
Members of the Board of Trustees who are not officers or employees of the Investment Manager or Ameriprise Financial are compensated for their services to the Fund as disclosed in the Statement of Operations. Under a Deferred Compensation Plan (the Plan), these members of the Board of Trustees may elect to defer payment of up to 100% of their compensation. Deferred amounts are treated as though equivalent dollar amounts had been invested in shares of certain funds managed by the Investment Manager. The Fund’s liability for these amounts is adjusted for market value changes and remains in the Fund until distributed in accordance with the Plan. All amounts payable under the Plan constitute a general unsecured obligation of the Fund.
Compensation of Chief Compliance Officer
The Board of Trustees has appointed a Chief Compliance Officer to the Fund in accordance with federal securities regulations. As disclosed in the Statement of Operations, a portion of the Chief Compliance Officer’s total compensation is allocated to the Fund, along with other allocations to affiliated funds governed by the Board of Trustees, based on relative net assets.
Transfer agency fees
Under a Transfer and Dividend Disbursing Agent Agreement, Columbia Management Investment Services Corp. (the Transfer Agent), an affiliate of the Investment Manager and a wholly-owned subsidiary of Ameriprise Financial, is responsible for providing transfer agency services to the Fund. The Transfer Agent has contracted with DST Asset Manager Solutions, Inc. (DST) to serve as sub-transfer agent. The Transfer Agent pays the fees of DST for services as sub-transfer agent and DST is not entitled to reimbursement for such fees from the Fund (with the exception of out-of-pocket fees).
| 20 | Columbia AMT-Free Maryland Intermediate Muni Bond Fund | Annual Report 2018 |
Notes to Financial Statements (continued)
April 30, 2018
The Fund pays the Transfer Agent a monthly transfer agency fee based on the number or the average value of accounts, depending on the type of account. In addition, the Fund pays the Transfer Agent a fee for shareholder services based on the number of accounts or on a percentage of the average aggregate value of the Fund’s shares maintained in omnibus accounts up to the lesser of the amount charged by the financial intermediary or a cap established by the Board of Trustees from time to time.
The Transfer Agent also receives compensation from the Fund for various shareholder services and reimbursements for certain out-of-pocket fees. Effective August 1, 2017, total transfer agency fees for Institutional 3 Class shares are subject to an annual limitation of not more than 0.02% of the average daily net assets attributable to Institutional 3 Class shares. Prior to August 1, 2017, the limitation was 0.025% for Institutional 3 Class shares.
For the year ended April 30, 2018, the Fund’s effective transfer agency fee rates as a percentage of average daily net assets of each class were as follows:
| | Effective rate (%) |
| Class A | 0.12 |
| Advisor Class | 0.12 |
| Class B | 0.04 (a) |
| Class C | 0.12 |
| Institutional Class | 0.14 |
| Institutional 3 Class | 0.01 |
An annual minimum account balance fee of $20 may apply to certain accounts with a value below the applicable share class’s initial minimum investment requirements to reduce the impact of small accounts on transfer agency fees. These minimum account balance fees are remitted to the Fund and recorded as part of expense reductions in the Statement of Operations. For the year ended April 30, 2018, these minimum account balance fees reduced total expenses of the Fund by $20.
Distribution and service fees
The Fund has entered into an agreement with Columbia Management Investment Distributors, Inc. (the Distributor), an affiliate of the Investment Manager and a wholly-owned subsidiary of Ameriprise Financial, for distribution and shareholder services. The Board of Trustees has approved, and the Fund has adopted, distribution and shareholder service plans (the Plans) applicable to certain share classes, which set the distribution and service fees for the Fund. These fees are calculated daily and are intended to compensate the Distributor and/or eligible selling and/or servicing agents for selling shares of the Fund and providing services to investors.
Under the Plans, the Fund pays a monthly combined distribution and service fee to the Distributor at the maximum annual rate of 0.25% of the average daily net assets attributable to Class A shares of the Fund. Also under the Plans, the Fund pays a monthly service fee to the Distributor at the maximum annual rate of 0.25% of the average daily net assets attributable to Class B and Class C shares of the Fund and a monthly distribution fee to the Distributor at the maximum annual rate of 0.75% of the average daily net assets attributable to Class B and Class C shares of the Fund. As a result of all Class B shares of the Fund being redeemed or converted to Class A shares, August 4, 2017 was the last day the Fund paid a distribution and service fee for Class B shares.
Sales charges (unaudited)
Sales charges, including front-end charges and CDSCs, received by the Distributor for distributing Fund shares for the year ended April 30, 2018, if any, are listed below:
Columbia AMT-Free Maryland Intermediate Muni Bond Fund | Annual Report 2018
| 21 |
Notes to Financial Statements (continued)
April 30, 2018
Expenses waived/reimbursed by the Investment Manager and its affiliates
The Investment Manager and certain of its affiliates have contractually agreed to waive fees and/or reimburse expenses (excluding certain fees and expenses described below) for the period(s) disclosed below, unless sooner terminated at the sole discretion of the Board of Trustees, so that the Fund’s net operating expenses, after giving effect to fees waived/expenses reimbursed and any balance credits and/or overdraft charges from the Fund’s custodian, do not exceed the following annual rate(s) as a percentage of the class’ average daily net assets:
| | September 1, 2017
through
August 31, 2018 | Prior to
September 1, 2017 |
| Class A | 0.81% | 0.81% |
| Advisor Class | 0.56 | 0.56 |
| Class C | 1.56 | 1.56 |
| Institutional Class | 0.56 | 0.56 |
| Institutional 3 Class | 0.43 | 0.42 |
Under the agreement governing these fee waivers and/or expense reimbursement arrangements, the following fees and expenses are excluded from the waiver/reimbursement commitment, and therefore will be paid by the Fund, if applicable: taxes (including foreign transaction taxes), expenses associated with investments in affiliated and non-affiliated pooled investment vehicles (including mutual funds and exchange-traded funds), transaction costs and brokerage commissions, costs related to any securities lending program, dividend expenses associated with securities sold short, inverse floater program fees and expenses, transaction charges and interest on borrowed money, interest, infrequent and/or unusual expenses and any other expenses the exclusion of which is specifically approved by the Board of Trustees. This agreement may be modified or amended only with approval from the Investment Manager, certain of its affiliates and the Fund. In addition to the contractual agreement, the Investment Manager and certain of its affiliates have voluntarily agreed to waive fees and/or reimburse Fund expenses (excluding certain fees and expenses described above) so that Fund level expenses (expenses directly attributable to the Fund and not to a specific share class) are waived proportionately across all share classes, but the Fund’s net operating expenses shall not exceed the contractual annual rates listed in the table above. This arrangement may be revised or discontinued at any time. Any fees waived and/or expenses reimbursed under the expense reimbursement arrangements described above are not recoverable by the Investment Manager or its affiliates in future periods.
Note 4. Federal tax information
The timing and character of income and capital gain distributions are determined in accordance with income tax regulations, which may differ from GAAP because of temporary or permanent book to tax differences.
At April 30, 2018, these differences were primarily due to differing treatment for trustees’ deferred compensation and distributions. To the extent these differences were permanent, reclassifications were made among the components of the Fund’s net assets in the Statement of Assets and Liabilities. Temporary differences do not require reclassifications.
The Fund did not have any permanent differences; therefore, no reclassifications were made to the Statement of Assets and Liabilities.
The tax character of distributions paid during the years indicated was as follows:
| Year Ended April 30, 2018 | Year Ended April 30, 2017 |
Ordinary
income ($) | Tax-exempt
income ($) | Long-term
capital gains ($) | Total ($) | Ordinary
income ($) | Tax-exempt
income ($) | Long-term
capital gains ($) | Total ($) |
| 10,622 | 1,896,313 | 323,964 | 2,230,899 | 16,878 | 2,413,069 | — | 2,429,947 |
Short-term capital gain distributions, if any, are considered ordinary income distributions for tax purposes.
| 22 | Columbia AMT-Free Maryland Intermediate Muni Bond Fund | Annual Report 2018 |
Notes to Financial Statements (continued)
April 30, 2018
At April 30, 2018, the components of distributable earnings on a tax basis were as follows:
Undistributed
ordinary income ($) | Undistributed tax-
exempt income ($) | Undistributed
long-term
capital gains ($) | Capital loss
carryforwards ($) | Net unrealized
appreciation ($) |
| — | 492,632 | 314,771 | — | 1,160,556 |
At April 30, 2018, the cost of all investments for federal income tax purposes along with the aggregate gross unrealized appreciation and depreciation based on that cost was:
Federal
tax cost ($) | Gross unrealized
appreciation ($) | Gross unrealized
(depreciation) ($) | Net unrealized
appreciation ($) |
| 59,555,945 | 1,453,472 | (292,916) | 1,160,556 |
Tax cost of investments and unrealized appreciation/(depreciation) may also include timing differences that do not constitute adjustments to tax basis.
Management of the Fund has concluded that there are no significant uncertain tax positions in the Fund that would require recognition in the financial statements. However, management’s conclusion may be subject to review and adjustment at a later date based on factors including, but not limited to, new tax laws, regulations, and administrative interpretations (including relevant court decisions). Generally, the Fund’s federal tax returns for the prior three fiscal years remain subject to examination by the Internal Revenue Service.
Note 5. Portfolio information
The cost of purchases and proceeds from sales of securities, excluding short-term investments and derivatives, if any, aggregated to $6,077,323 and $16,796,291, respectively, for the year ended April 30, 2018. The amount of purchase and sale activity impacts the portfolio turnover rate reported in the Financial Highlights.
Note 6. Line of credit
The Fund has access to a revolving credit facility with a syndicate of banks led by Citibank, N.A., HSBC Bank USA, N.A. and JPMorgan Chase Bank, N.A. whereby the Fund may borrow for the temporary funding of shareholder redemptions or for other temporary or emergency purposes. The credit facility, which is a collective agreement between the Fund and certain other funds managed by the Investment Manager, severally and not jointly, permits collective borrowings up to $1 billion. Interest is charged to each participating fund based on its borrowings at a rate equal to the higher of (i) the overnight federal funds rate plus 1.00% or (ii) the one-month LIBOR rate plus 1.00%. Each borrowing under the credit facility matures no later than 60 days after the date of borrowing. The Fund also pays a commitment fee equal to its pro rata share of the amount of the credit facility at a rate of 0.15% per annum. The commitment fee is included in other expenses in the Statement of Operations.
The Fund had no borrowings during the year ended April 30, 2018.
Note 7. Significant risks
Credit risk
Credit risk is the risk that the value of debt securities in the Fund’s portfolio may decline because the issuer may default and fail to pay interest or repay principal when due. Rating agencies assign credit ratings to debt securities to indicate their credit risk. Lower rated or unrated debt securities held by the Fund may present increased credit risk as compared to higher-rated debt securities.
Geographic concentration risk
Because the Fund invests substantially in municipal securities issued by the state identified in the Fund’s name and political sub-divisions of that state, the Fund will be particularly affected by adverse tax, legislative, regulatory, demographic or political changes as well as changes impacting the state’s financial, economic or other condition and prospects. In addition, because
Columbia AMT-Free Maryland Intermediate Muni Bond Fund | Annual Report 2018
| 23 |
Notes to Financial Statements (continued)
April 30, 2018
of the relatively small number of issuers of tax-exempt securities in the state, the Fund may invest a higher percentage of assets in a single issuer and, therefore, be more exposed to the risk of loss than a fund that invests more broadly. The value of municipal and other securities owned by the Fund also may be adversely affected by future changes in federal or state income tax laws.
Interest rate risk
Interest rate risk is the risk of losses attributable to changes in interest rates. In general, if prevailing interest rates rise, the values of debt securities tend to fall, and if interest rates fall, the values of debt securities tend to rise. Actions by governments and central banking authorities can result in increases in interest rates. Increasing interest rates may negatively affect the value of debt securities held by the Fund, resulting in a negative impact on the Fund’s performance and net asset value per share. In general, the longer the maturity or duration of a debt security, the greater its sensitivity to changes in interest rates.
Liquidity risk
Liquidity risk is the risk associated with a lack of marketability of investments which may make it difficult to sell the investment at a desirable time or price. Changing regulatory, market or other conditions or environments (for example, the interest rate or credit environments) may adversely affect the liquidity of the Fund’s investments. The Fund may have to accept a lower selling price for the holding, sell other investments, or forego another, more appealing investment opportunity. Generally, the less liquid the market at the time the Fund sells a portfolio investment, the greater the risk of loss or decline of value to the Fund. A less liquid market can lead to an increase in Fund redemptions, which may negatively impact Fund performance and net asset value per share, including, for example, if the Fund is forced to sell securities in a down market.
Non-diversification risk
A non-diversified fund is permitted to invest a greater percentage of its total assets in fewer issuers than a diversified fund. The Fund may, therefore, have a greater risk of loss from a few issuers than a similar fund that invests more broadly.
Shareholder concentration risk
At April 30, 2018, one unaffiliated shareholder of record owned 76.3% of the outstanding shares of the Fund in one or more accounts. The Fund has no knowledge about whether any portion of those shares was owned beneficially. Subscription and redemption activity by concentrated accounts may have a significant effect on the operations of the Fund. In the case of a large redemption, the Fund may be forced to sell investments at inopportune times, including its liquid positions, which may result in Fund losses and the Fund holding a higher percentage of less liquid positions. Large redemptions could result in decreased economies of scale and increased operating expenses for non-redeeming Fund shareholders.
Note 8. Subsequent events
Management has evaluated the events and transactions that have occurred through the date the financial statements were issued and noted no items requiring adjustment of the financial statements or additional disclosure.
Note 9. Information regarding pending and settled legal proceedings
Ameriprise Financial and certain of its affiliates have historically been involved in a number of legal, arbitration and regulatory proceedings, including routine litigation, class actions, and governmental actions, concerning matters arising in connection with the conduct of their business activities. Ameriprise Financial believes that the Fund is not currently the subject of, and that neither Ameriprise Financial nor any of its affiliates are the subject of, any pending legal, arbitration or regulatory proceedings that are likely to have a material adverse effect on the Fund or the ability of Ameriprise Financial or its affiliates to perform under their contracts with the Fund. Ameriprise Financial is required to make quarterly (10-Q), annual (10-K) and, as necessary, 8-K filings with the Securities and Exchange Commission (SEC) on legal and regulatory matters that relate to Ameriprise Financial and its affiliates. Copies of these filings may be obtained by accessing the SEC website at www.sec.gov.
There can be no assurance that these matters, or the adverse publicity associated with them, will not result in increased Fund redemptions, reduced sale of Fund shares or other adverse consequences to the Fund. Further, although we believe proceedings are not likely to have a material adverse effect on the Fund or the ability of Ameriprise Financial or its affiliates to
| 24 | Columbia AMT-Free Maryland Intermediate Muni Bond Fund | Annual Report 2018 |
Notes to Financial Statements (continued)
April 30, 2018
perform under their contracts with the Fund, these proceedings are subject to uncertainties and, as such, we are unable to estimate the possible loss or range of loss that may result. An adverse outcome in one or more of these proceedings could result in adverse judgments, settlements, fines, penalties or other relief that could have a material adverse effect on the consolidated financial condition or results of operations of Ameriprise Financial.
Columbia AMT-Free Maryland Intermediate Muni Bond Fund | Annual Report 2018
| 25 |
Report of Independent Registered Public Accounting Firm
To the Board of Trustees of Columbia Funds Series Trust and Shareholders of Columbia AMT-Free Maryland Intermediate Muni Bond Fund
Opinion on the Financial Statements
We have audited the accompanying statement of assets and liabilities, including the portfolio of investments, of Columbia AMT-Free Maryland Intermediate Muni Bond Fund (one of the funds constituting Columbia Funds Series Trust, referred to hereafter as the "Fund") as of April 30, 2018, the related statement of operations for the year ended April 30, 2018, the statement of changes in net assets for each of the two years in the period ended April 30, 2018, including the related notes, and the financial highlights for each of the periods indicated therein (collectively referred to as the “financial statements”). In our opinion, the financial statements present fairly, in all material respects, the financial position of the Fund as of April 30, 2018, the results of its operations for the year then ended, the changes in its net assets for each of the two years in the period ended April 30, 2018 and the financial highlights for each of the periods indicated therein in conformity with accounting principles generally accepted in the United States of America.
Basis for Opinion
These financial statements are the responsibility of the Fund’s management. Our responsibility is to express an opinion on the Fund’s financial statements based on our audits. We are a public accounting firm registered with the Public Company Accounting Oversight Board (United States) (“PCAOB”) and are required to be independent with respect to the Fund in accordance with the U.S. federal securities laws and the applicable rules and regulations of the Securities and Exchange Commission and the PCAOB.
We conducted our audits of these financial statements in accordance with the standards of the PCAOB. Those standards require that we plan and perform the audit to obtain reasonable assurance about whether the financial statements are free of material misstatement, whether due to error or fraud.
Our audits included performing procedures to assess the risks of material misstatement of the financial statements, whether due to error or fraud, and performing procedures that respond to those risks. Such procedures included examining, on a test basis, evidence regarding the amounts and disclosures in the financial statements. Our audits also included evaluating the accounting principles used and significant estimates made by management, as well as evaluating the overall presentation of the financial statements. Our procedures included confirmation of securities owned as of April 30, 2018 by correspondence with the custodian. We believe that our audits provide a reasonable basis for our opinion.
/s/PricewaterhouseCoopers LLP
Minneapolis, Minnesota
June 21, 2018
We have served as the auditor of one or more investment companies in the Columbia Funds Complex since 1977.
| 26 | Columbia AMT-Free Maryland Intermediate Muni Bond Fund | Annual Report 2018 |
Federal Income Tax Information
(Unaudited)
The Fund hereby designates the following tax attributes for the fiscal year ended April 30, 2018. Shareholders will be notified in early 2019 of the amounts for use in preparing 2018 income tax returns.
Capital
gain
dividend | Exempt-
interest
dividends |
| $670,672 | 99.44% |
Capital gain dividend. The Fund designates as a capital gain dividend the amount reflected above, or if subsequently determined to be different, the net capital gain of such fiscal period.
Exempt-interest dividends. The percentage of net investment income distributed during the fiscal year that qualifies as exempt-interest dividends for federal income tax purposes.
Columbia AMT-Free Maryland Intermediate Muni Bond Fund | Annual Report 2018
| 27 |
Shareholders elect the Board that oversees the Fund’s operations. The Board appoints officers who are responsible for day-to-day business decisions based on policies set by the Board. The following table provides basic biographical information about the Fund’s Trustees, including their principal occupations during the past five years, although specific titles for individuals may have varied over the period. Under current Board policy, Trustees not affiliated with the Investment Manager generally may serve through the end of the calendar year in which they reach either the mandatory retirement age established by the Board or the fifteenth anniversary of the first Columbia Funds board meeting they attended as a member of the Board.
Independent trustees
Name,
address,
year of birth | Position held
with the Trust and
length of service | Principal occupation(s)
during past five years
and other relevant
professional experience | Number of
Funds in the
Columbia Funds
complex
overseen | Other directorships
held by Trustee
during the past
five years |
George S. Batejan
c/o Columbia Management
Investment Advisers, LLC
225 Franklin Street
Mail Drop BX32 05228
Boston, MA 02110
1953 | Trustee since 1/17 | Executive Vice President, Global Head of Technology and Operations, Janus Capital Group, Inc., 2010-2016 | 125 | Advisory Board Member, University of Colorado Business School since November 2015; former Chairman of the Board, NICSA (National Investment Company Services Association) (Executive Committee, Nominating Committee and Governance Committee), 2014-2016; former Director, Intech Investment Management, 2011- 2016; former Board Member, Metro Denver Chamber of Commerce, 2015-2016 |
Kathleen Blatz
c/o Columbia Management
Investment Advisers, LLC
225 Franklin Street
Mail Drop BX32 05228
Boston, MA 02110
1954 | Trustee since 1/06 for RiverSource Funds and since 6/11 for Nations Funds | Attorney; specializing in arbitration and mediation; Interim President and Chief Executive Officer, Blue Cross and Blue Shield of Minnesota (health care insurance) since February 2018; Chief Justice, Minnesota Supreme Court, 1998-2006; Associate Justice, Minnesota Supreme Court, 1996-1998; Fourth Judicial District Court Judge, Hennepin County, 1994-1996; Attorney in private practice and public service, 1984-1993; State Representative, Minnesota House of Representatives, 1979-1993, which included service on the Tax and Financial Institutions and Insurance Committees; Interim Chair, Minnesota Sports Facilities Authority, March 2017-July 2017 | 125 | Trustee, BlueCross BlueShield of Minnesota since 2009 (Chair of the Business Development Committee, 2014-2017; Chair of the Governance Committee since 2017); Chair of the Robina Foundation since August 2013; former Member of the Board, Minnesota Sports Facilities Authority, January 2017-July 2017 |
Edward J. Boudreau, Jr.
c/o Columbia Management
Investment Advisers, LLC
225 Franklin Street
Mail Drop BX32 05228
Boston, MA 02110
1944 | Chair of the Board since 1/18; Trustee since 6/11 for RiverSource Funds and since 1/05 for Nations Funds | Managing Director, E.J. Boudreau & Associates (consulting) since 2000; FINRA Industry Arbitrator, 2002-present; Chairman and Chief Executive Officer, John Hancock Investments (asset management), Chairman and Interested Trustee for open-end and closed-end funds offered by John Hancock, 1989-2000; John Hancock Mutual Life Insurance Company, including Senior Vice President and Treasurer and Senior Vice President Information Technology, 1968-1988 | 125 | Former Trustee, Boston Museum of Science (Chair of Finance Committee) 1985-2013; former Trustee, BofA Funds Series Trust (11 funds), 2005-2011 |
| 28 | Columbia AMT-Free Maryland Intermediate Muni Bond Fund | Annual Report 2018 |
TRUSTEES AND OFFICERS (continued)
Independent trustees (continued)
Name,
address,
year of birth | Position held
with the Trust and
length of service | Principal occupation(s)
during past five years
and other relevant
professional experience | Number of
Funds in the
Columbia Funds
complex
overseen | Other directorships
held by Trustee
during the past
five years |
Pamela G. Carlton
c/o Columbia Management
Investment Advisers, LLC
225 Franklin Street
Mail Drop BX32 05228
Boston, MA 02110
1954 | Trustee since 7/07 for RiverSource Funds and since 6/11 for Nations Funds | President, Springboard — Partners in Cross Cultural Leadership (consulting company) since 2003; Managing Director of US Equity Research, JP Morgan Chase, 1999-2003; Director of US Equity Research, Chase Asset Management, 1996-1999; Co-Director Latin America Research, 1993-1996, COO Global Research, 1992-1996, Co-Director of US Research, 1991-1992, Investment Banker, Morgan Stanley, 1982-1991 | 125 | Trustee, New York Presbyterian Hospital Board (Executive Committee and Chair of Human Resources Committee) since 1996; Director, Darien Rowayton Bank (Audit Committee) since 2017 |
William P. Carmichael
c/o Columbia Management
Investment Advisers, LLC
225 Franklin Street
Mail Drop BX32 05228
Boston, MA 02110
1943 | Trustee since 6/11 for RiverSource Funds and since 2003 for Nations Funds | Retired; Co-founder, The Succession Fund (provides exit strategies to owners of privately held companies), 1998-2007; Adjunct Professor of Finance, Kelley School of Business, Indiana University, 1993-2007; Senior Vice President, Sara Lee Corporation, 1991-1993; Senior Vice President and Chief Financial Officer, Beatrice Foods Company, 1984-1990; Vice President, Esmark, Inc., 1973-1984; Associate, Price Waterhouse, 1968-1972 | 125 | Director, The Finish Line (athletic shoes and apparel) since July 2003; former Director, Cobra Electronics Corporation (electronic equipment manufacturer), 1994-August 2014; former Director, Spectrum Brands, Inc. (consumer products), 2002-2009; former Director, Simmons Company (bedding), 2004-2010; former Trustee, BofA Funds Series Trust (11 funds) 2003-2011; former Director, McMoRan Exploration Company (oil and gas exploration and development) 2010 - 2013; former Director, International Textile Corp., 2012-2016; former Director, hhgregg, 2015-2017 |
Patricia M. Flynn
c/o Columbia Management
Investment Advisers, LLC
225 Franklin Street
Mail Drop BX32 05228
Boston, MA 02110
1950 | Trustee since 11/04 for RiverSource Funds and since 6/11 for Nations Funds | Trustee Professor of Economics and Management, Bentley University since 1976 (also teaches and conducts research on corporate governance); Dean, McCallum Graduate School of Business, Bentley University, 1992-2002 | 125 | Trustee, MA Taxpayers Foundation since 1997; Board of Directors, The MA Business Roundtable since 2003; Board of Governors, Innovation Institute, MA Technology Collaborative since 2010 |
Brian J. Gallagher
c/o Columbia Management
Investment Advisers, LLC
225 Franklin Street
Mail Drop BX32 05228
Boston, MA 02110
1954 | Trustee since 12/17 | Retired; Partner with Deloitte & Touche LLP and its predecessors, 1977-2016 | 123 | Trustee, Catholic Schools Foundation since 2004 |
Catherine James Paglia
c/o Columbia Management
Investment Advisers, LLC
225 Franklin Street
Mail Drop BX32 05228
Boston, MA 02110
1952 | Trustee since 11/04 for RiverSource Funds and since 6/11 for Nations Funds | Director, Enterprise Asset Management, Inc. (private real estate and asset management company) since September 1998; Managing Director and Partner, Interlaken Capital, Inc., 1989-1997; Managing Director, Morgan Stanley, 1982-1989; Vice President, Investment Banking, 1980-1982, Associate, Investment Banking, 1976-1980, Dean Witter Reynolds, Inc. | 125 | Director, Valmont Industries, Inc. (irrigation systems manufacturer) since 2012; Trustee, Carleton College (on the Investment Committee); Trustee, Carnegie Endowment for International Peace (on the Investment Committee) |
Columbia AMT-Free Maryland Intermediate Muni Bond Fund | Annual Report 2018
| 29 |
TRUSTEES AND OFFICERS (continued)
Independent trustees (continued)
Name,
address,
year of birth | Position held
with the Trust and
length of service | Principal occupation(s)
during past five years
and other relevant
professional experience | Number of
Funds in the
Columbia Funds
complex
overseen | Other directorships
held by Trustee
during the past
five years |
Minor M. Shaw
c/o Columbia Management
Investment Advisers, LLC
225 Franklin Street
Mail Drop BX32 05228
Boston, MA 02110
1947 | Trustee since 6/11 for RiverSource Funds and since 2003 for Nations Funds | President, Micco LLC (private investments) since 2011; President, Micco Corp. (family investment business), 1998-2011 | 125 | Director, BlueCross BlueShield of South Carolina since April 2008; Director, National Association of Corporate Directors, Carolinas Chapter, since 2013; Board Chair, Hollingsworth Funds since 2016; Advisory Board member, Duke Energy Corp. since October 2016; Chair of the Duke Endowment; Chair of Greenville – Spartanburg Airport Commission; former Trustee, BofA Funds Series Trust (11 funds), 2003-2011; former Director, Piedmont Natural Gas, 2004-2016 |
Sandra Yeager
c/o Columbia Management
Investment Advisers, LLC
225 Franklin Street
Mail Drop BX32 05228
Boston, MA 02110
1964 | Trustee since 12/17 | Retired; President and founder, Hanoverian Capital, LLC (SEC registered investment advisor firm), 2008-2016 | 123 | Director, NAPE Education Foundation since October 2016 |
Interested trustee not affiliated with Investment Manager*
Name,
address,
year of birth | Position held
with the Trust and
length of service | Principal occupation(s) during the
past five years and other relevant
professional experience | Number of
Funds in the
Columbia Funds
complex overseen | Other directorships/
held by Trustee
during the past
five years |
Anthony M. Santomero
c/o Columbia Management
Investment Advisers, LLC
225 Franklin Street
Mail Drop BX32 05228
Boston, MA 02110
1946 | Trustee since 6/11 for RiverSource Funds and since 1/08 for Nations Funds | Richard K. Mellon Professor Emeritus of Finance, The Wharton School, University of Pennsylvania, since 2002; Senior Advisor, McKinsey & Company (consulting), 2006-2008; President, Federal Reserve Bank of Philadelphia, 2000-2006, Professor of Finance, The Wharton School, University of Pennsylvania, 1972-2002 | 123 | Trustee, Penn Mutual Life Insurance Company since March 2008; Director, Renaissance Reinsurance Ltd. since May 2008; Director, Citigroup Inc. since 2009; Director, Citibank, N.A. since 2009; former Trustee, BofA Funds Series Trust (11 funds), 2008-2011 |
| * | Dr. Santomero is not an affiliated person of the Investment Manager or Ameriprise Financial. However, he is currently deemed by the Funds to be an “interested person” (as defined in the 1940 Act) of the Funds because he serves as a Director of Citigroup Inc. and Citibank, N.A., companies that may directly or through subsidiaries and affiliates engage from time-to-time in brokerage execution, principal transactions and lending relationships with the Funds or accounts advised/managed by the Investment Manager. |
| 30 | Columbia AMT-Free Maryland Intermediate Muni Bond Fund | Annual Report 2018 |
TRUSTEES AND OFFICERS (continued)
Interested trustee affiliated with Investment Manager*
Name,
address,
year of birth | Position held with the Trusts and length of service | Principal occupation(s) during the
past five years and other relevant
professional experience | Number of
Funds in the
Columbia Funds
complex overseen | Other directorships
held by Trustee
during the past
five years |
William F. Truscott
c/o Columbia Management
Investment Advisers, LLC
225 Franklin St.
Boston, MA 02110
1960 | Trustee since 11/01 for RiverSource Funds and since 6/11 for Nations Funds; Senior Vice President since 2002 for RiverSource Funds and since 5/10 for Nations Funds | Chairman of the Board and President, Columbia Management Investment Advisers, LLC since May 2010 and February 2012, respectively; Chief Executive Officer, Global Asset Management, Ameriprise Financial, Inc. since September 2012 (previously Chief Executive Officer, U.S. Asset Management & President, Annuities, May 2010 - September 2012); Director and Chief Executive Officer, Columbia Management Investment Distributors, Inc. since May 2010 and February 2012, respectively; Chairman of the Board and Chief Executive Officer, RiverSource Distributors, Inc. since 2006; Director, Threadneedle Asset Management Holdings, SARL since 2014; President and Chief Executive Officer, Ameriprise Certificate Company, 2006 - August 2012. | 196 | Chairman of the Board, Columbia Management Investment Advisers, LLC since May 2010; Director, Columbia Management Investment Distributors, Inc. since May 2010; former Director, Ameriprise Certificate Company, 2006-January 2013 |
| * | Interested person (as defined under the 1940 Act) by reason of being an officer, director, security holder and/or employee of the Investment Manager or Ameriprise Financial. |
Nations Funds refer to the Funds within the Columbia Funds Complex that historically bore the Nations brand and includes series of Columbia Funds Series Trust. RiverSource Funds refer to the Funds within the Columbia Funds Complex that historically bore the RiverSource brand and includes series of Columbia Funds Series Trust II.
The Statement of Additional Information has additional information about the Fund’s Board members and is available, without charge, upon request by calling 800.345.6611, visiting columbiathreadneedleus.com/investor/ or contacting your financial intermediary.
Columbia AMT-Free Maryland Intermediate Muni Bond Fund | Annual Report 2018
| 31 |
TRUSTEES AND OFFICERS (continued)
The Board has appointed officers who are responsible for day-to-day business decisions based on policies it has established. The officers serve at the pleasure of the Board. The following table provides basic information about the Officers of the Fund, including principal occupations during the past five years, although their specific titles may have varied over the period. In addition to Mr. Truscott, who is Senior Vice President, the Fund’s other officers are:
Fund officers
Name,
address and
year of birth | Position and year
first appointed to
position for any Fund
in the Columbia
Funds complex or a
predecessor thereof | Principal occupation(s) during past five years |
Christopher O. Petersen
5228 Ameriprise
Financial Center
Minneapolis, MN 55474
Born 1970 | President and Principal Executive Officer (2015) | Vice President and Lead Chief Counsel, Ameriprise Financial, Inc. since January 2015 (previously, Vice President and Chief Counsel, January 2010 - December 2014; officer of Columbia Funds and affiliated funds since 2007. |
Michael G. Clarke
225 Franklin Street
Boston, MA 02110
Born 1969 | Treasurer (2011), Chief Financial Officer (2009) and Chief Accounting Officer (2015) | Vice President — Mutual Fund Administration, Columbia Management Investment Advisers, LLC, since May 2010; senior officer of Columbia Funds and affiliated funds since 2002. |
Paul B. Goucher
100 Park Avenue
New York, NY 10017
Born 1968 | Senior Vice President (2011) and Assistant Secretary (2008) | Senior Vice President and Assistant General Counsel, Ameriprise Financial, Inc. since January 2017 (previously Vice President and Lead Chief Counsel, November 2008 - January 2017 and January 2013 - January 2017, respectively; and Chief Counsel, January 2010 - January 2013); Vice President, Chief Legal Officer and Assistant Secretary, Columbia Management Investment Advisers, LLC since May 2010. |
Thomas P. McGuire
225 Franklin Street
Boston, MA 02110
Born 1972 | Senior Vice President and Chief Compliance Officer (2012) | Vice President — Asset Management Compliance, Ameriprise Financial, Inc., since May 2010; Chief Compliance Officer, Ameriprise Certificate Company since September 2010. |
Colin Moore
225 Franklin Street
Boston, MA 02110
Born 1958 | Senior Vice President (2010) | Executive Vice President and Global Chief Investment Officer, Ameriprise Financial, Inc., since July 2013; Executive Vice President and Global Chief Investment Officer, Columbia Management Investment Advisers, LLC since July 2013 (previously Director and Global Chief Investment Officer, 2010 - 2013). |
Ryan C. Larrenaga
225 Franklin Street
Boston, MA 02110
Born 1970 | Senior Vice President (2017), Chief Legal Officer (2017) and Secretary (2015) | Vice President and Group Counsel, Ameriprise Financial, Inc. since August 2011; officer of Columbia Funds and affiliated funds since 2005. |
Michael E. DeFao
225 Franklin Street
Boston, MA 02110
Born 1968 | Vice President (2011) and Assistant Secretary (2010) | Vice President and Chief Counsel, Ameriprise Financial, Inc. since May 2010. |
Amy Johnson
5228 Ameriprise
Financial Center
Minneapolis, MN 55474
Born 1965 | Vice President (2006) | Managing Director and Global Head of Operations, Columbia Management Investment Advisers, LLC since April 2016 (previously Managing Director and Chief Operating Officer, 2010 - 2016). |
Lyn Kephart-Strong
5228 Ameriprise
Financial Center
Minneapolis, MN 55474
Born 1960 | Vice President (2015) | President, Columbia Management Investment Services Corp. since October 2014; Vice President & Resolution Officer, Ameriprise Trust Company since August 2009. |
| 32 | Columbia AMT-Free Maryland Intermediate Muni Bond Fund | Annual Report 2018 |
The Fund mails one shareholder report to each shareholder address. If you would like more than one report, please call shareholder services at 800.345.6611 and additional reports will be sent to you.
Proxy voting policies and procedures
The policy of the Board of Trustees is to vote the proxies of the companies in which the Fund holds investments consistent with the procedures as stated in the Statement of Additional Information (SAI). You may obtain a copy of the SAI without charge by calling 800.345.6611; contacting your financial intermediary; visiting columbiathreadneedleus.com/investor/; or searching the website of the Securities and Exchange Commission (SEC) at sec.gov. Information regarding how the Fund voted proxies relating to portfolio securities is filed with the SEC by August 31st for the most recent 12-month period ending June 30th of that year, and is available without charge by visiting columbiathreadneedleus.com/investor/, or searching the website of the SEC at sec.gov.
Quarterly schedule of investments
The Fund files a complete schedule of portfolio holdings with the SEC for the first and third quarters of each fiscal year on Form N-Q. The Fund’s Form N-Q is available on the SEC’s website at sec.gov and may be reviewed and copied at the SEC’s Public Reference Room in Washington, D.C. Information on the operation of the Public Reference Room may be obtained by calling 800.SEC.0330. The Fund’s complete schedule of portfolio holdings, as filed on Form N-Q, can also be obtained without charge, upon request, by calling 800.345.6611.
Additional Fund information
For more information about the Fund, please visit columbiathreadneedleus.com/investor/ or call 800.345.6611. Customer Service Representatives are available to answer your questions Monday through Friday from 8 a.m. to 7 p.m. Eastern time.
Fund investment manager
Columbia Management Investment Advisers, LLC
225 Franklin Street
Boston, MA 02110
Fund distributor
Columbia Management Investment Distributors, Inc.
225 Franklin Street
Boston, MA 02110
Fund transfer agent
Columbia Management Investment Services Corp.
P.O. Box 8081
Boston, MA 02266-8081
Columbia AMT-Free Maryland Intermediate Muni Bond Fund | Annual Report 2018
| 33 |
Columbia AMT-Free Maryland Intermediate Muni Bond Fund
P.O. Box 8081
Boston, MA 02266-8081
Please read and consider the investment objectives, risks, charges and expenses for any fund carefully before investing. For a prospectus and summary prospectus, which contains this and other important information about the Fund, go to
columbiathreadneedleus.com/investor/. The Fund is distributed by Columbia Management Investment Distributors, Inc., member FINRA, and managed by Columbia Management Investment Advisers, LLC.
Columbia Threadneedle Investments (Columbia Threadneedle) is the global brand name of the Columbia and Threadneedle group of companies. All rights reserved. Columbia Management Investment Distributors, Inc., 225 Franklin Street, Boston, MA 02110-2804
© 2018 Columbia Management Investment Advisers, LLC.
columbiathreadneedleus .com/investor/

Annual Report
April 30, 2018
Columbia AMT-Free Georgia Intermediate Muni Bond Fund
Not FDIC Insured • No bank guarantee • May lose value
Dear Shareholders,
The year 2017 was an extraordinary year in the financial markets. The S&P 500 Index didn’t experience a single down month and returned over 20%. Continuing this trend, January 2018 marked the fastest start for the index ever. Low volatility, which had been a feature of the U.S. equity market for several years, along with the surge in the S&P 500 Index, drove investor sentiment to very high levels. This arguably set the stage for an overdue correction, which we witnessed in February 2018.
A return to volatility
There have been few periods of market upheaval such as were experienced in the first part of 2018. While investors were taken by surprise by the sudden and pronounced market swings, the return to some level of volatility actually marked a resumption of relatively normal market conditions. Having said that, it’s important to distinguish between a good technical correction where excess enthusiasm in the marketplace is being let out, versus a real change in the underlying fundamentals – things like an underperforming economy or weaker corporate earnings. Our view is that the recent market volatility falls into the former category, and the fundamentals remain strong. We’re continuing to see improvements in global economic activity, and we’re seeing corporate earnings expectations continue to rise – and not just because of tax reform.
Consistency is more important than ever
It’s important to keep in mind that when it comes to long-term investing, it’s the destination, not the journey that matters most. If you have a financial goal that you’ve worked out with your financial advisor, and you have a good asset allocation plan to reach it, it’s a question of sticking with your plan rather than become focused on near-term volatility. Bouts of volatility are normal. After all, it’s hard to cross the ocean without hitting an occasional rough patch. You need to focus on the destination.
One final thought. In weathering volatility, it’s the consistency of the return that is essential. Investors who chase higher returns are usually the first to sell when an investment goes through a bad patch, and they therefore don’t tend to benefit from the recovery. More disciplined investors who perhaps panic less or not at all during periods of volatility, tend to have improved long-term results and are more likely to reach their financial goals. Nothing is more important to us than making sure those who have entrusted us to protect and grow their assets are able to do what matters most to them.
Your success is our priority. Talk to your financial advisor about how working with Columbia Threadneedle Investments may help you position your portfolio for consistent, sustainable outcomes, no matter the market conditions.
Sincerely,
Christopher O. Petersen
President, Columbia Funds
The S&P 500 Index, an unmanaged index, measures the performance of 500 widely held, large-capitalization U.S. stocks and is frequently used as a general measure of market performance. Past performance is no guarantee of future results.
Columbia Funds are distributed by Columbia Management Investment Distributors, Inc., member FINRA, and managed by Columbia Management Investment Advisers, LLC.
© 2018 Columbia Management Investment Advisers, LLC. All rights reserved.
Columbia AMT-Free Georgia Intermediate Muni Bond Fund | Annual Report 2018
Columbia AMT-Free Georgia Intermediate Muni Bond Fund | Annual Report 2018
Investment objective
Columbia AMT-Free Georgia Intermediate Muni Bond Fund (the Fund) seeks current income exempt from U.S. federal income tax and Georgia individual income tax, consistent with moderate fluctuation of principal.
Portfolio management
Paul Fuchs, CFA
Co-Portfolio Manager
Managed Fund since 2016
Deborah Vargo
Co-Portfolio Manager
Managed Fund since December 2017
| Average annual total returns (%) (for the period ended April 30, 2018) |
| | | Inception | 1 Year | 5 Years | 10 Years |
| Class A | Excluding sales charges | 05/04/92 | 0.12 | 1.18 | 2.97 |
| | Including sales charges | | -2.85 | 0.56 | 2.66 |
| Advisor Class* | 03/19/13 | 0.27 | 1.41 | 3.22 |
| Class C | Excluding sales charges | 06/17/92 | -0.72 | 0.40 | 2.20 |
| | Including sales charges | | -1.69 | 0.40 | 2.20 |
| Institutional Class | 03/01/92 | 0.28 | 1.39 | 3.22 |
| Institutional 3 Class* | 03/01/17 | 0.39 | 1.42 | 3.23 |
| Bloomberg Barclays 3-15 Year Blend Municipal Bond Index | | 0.87 | 2.10 | 3.99 |
Returns for Class A shares are shown with and without the maximum initial sales charge of 3.00%. Returns for Class C shares are shown with and without the 1.00% contingent deferred sales charge for the first year only. The Fund’s other classes are not subject to sales charges and have limited eligibility. Effective November 1, 2017, Class R4, Class Y and Class Z shares were renamed Advisor Class, Institutional 3 Class and Institutional Class shares, respectively. Please see the Fund’s prospectus for details. Performance for different share classes will vary based on differences in sales charges and fees associated with each class. All results shown assume reinvestment of distributions during the period. Returns do not reflect the deduction of taxes that a shareholder may pay on Fund distributions or on the redemption of Fund shares. Performance results reflect the effect of any fee waivers or reimbursements of Fund expenses by Columbia Management Investment Advisers, LLC and/or any of its affiliates. Absent these fee waivers or expense reimbursement arrangements, performance results would have been lower.
The performance information shown represents past performance and is not a guarantee of future results. The investment return and principal value of your investment will fluctuate so that your shares, when redeemed, may be worth more or less than their original cost. Current performance may be lower or higher than the performance information shown. You may obtain performance information current to the most recent month-end by contacting your financial intermediary, visiting columbiathreadneedleus.com/investor/ or calling 800.345.6611.
| * | The returns shown for periods prior to the share class inception date (including returns for the Life of the Fund, if shown, which are since Fund inception) include the returns of the Fund’s oldest share class. These returns are adjusted to reflect any higher class-related operating expenses of the newer share classes, as applicable. Please visit columbiathreadneedleus.com/investor/investment-products /mutual-funds/appended-performance for more information. |
The Bloomberg Barclays 3–15 Year Blend Municipal Bond Index is an unmanaged index that tracks the performance of municipal bonds issued after December 31, 1990, with remaining maturities between 2 and 17 years and at least $7 million in principal amount outstanding.
Indices are not available for investment, are not professionally managed and do not reflect sales charges, fees, brokerage commissions, taxes or other expenses of investing. Securities in the Fund may not match those in an index.
| 2 | Columbia AMT-Free Georgia Intermediate Muni Bond Fund | Annual Report 2018 |
Fund at a Glance (continued)
Performance of a hypothetical $10,000 investment (April 30, 2008 — April 30, 2018)
The chart above shows the change in value of a hypothetical $10,000 investment in Class A shares of Columbia AMT-Free Georgia Intermediate Muni Bond Fund during the stated time period, and does not reflect the deduction of taxes that a shareholder may pay on Fund distributions or on the redemption of Fund shares.
| Quality breakdown (%) (at April 30, 2018) |
| AAA rating | 5.8 |
| AA rating | 51.1 |
| A rating | 35.0 |
| BBB rating | 5.7 |
| Not rated | 2.4 |
| Total | 100.0 |
Percentages indicated are based upon total fixed income investments (excluding Money Market Funds).
Bond ratings apply to the underlying holdings of the Fund and not the Fund itself and are divided into categories ranging from highest to lowest credit quality, determined by using the middle rating of Moody’s, S&P and Fitch, after dropping the highest and lowest available ratings. When ratings are available from only two rating agencies, the lower rating is used. When a rating is available from only one rating agency, that rating is used. When a bond is not rated by any rating agency, it is designated as “Not rated.” Credit quality ratings assigned by a rating agency are subjective opinions, not statements of fact, and are subject to change, including daily. The ratings assigned by credit rating agencies are but one of the considerations that the Investment Manager and/or Fund’s subadviser incorporates into its credit analysis process, along with such other issuer-specific factors as cash flows, capital structure and leverage ratios, ability to de-leverage (repay) through free cash flow, quality of management, market positioning and access to capital, as well as such security-specific factors as the terms of the security (e.g., interest rate and time to maturity) and the amount and type of any collateral.
Columbia AMT-Free Georgia Intermediate Muni Bond Fund | Annual Report 2018
| 3 |
Manager Discussion of Fund Performance
For the 12-month period that ended April 30, 2018, the Fund’s Class A shares returned 0.12% excluding sales charges. Institutional Class shares of the Fund returned 0.28%. During the same time period, the Fund’s benchmark, the Bloomberg Barclays 3-15 Year Blend Municipal Bond Index, returned 0.87%. The Fund’s underperformance largely stemmed from its higher average credit quality in relation to the national benchmark.
Market overview
The national municipal bond market posted a small gain in the 12-month period, as the contribution from income helped offset a moderate decline in prices. The period began on a positive note, reflecting the ongoing rebound from the post-election sell-off of late 2016. During this time, prices were supported by a generally positive tone to the financial markets, muted concerns about U.S. Federal Reserve (Fed) policy and a favorable balance of supply and demand stemming from strong mutual fund inflows and lower new issuance. Although unfunded pension liabilities and budgetary stress among notable issuers such as Illinois, New Jersey, Pennsylvania, Connecticut and Kentucky persisted, overall credit conditions for municipal bonds remained on a sound footing. In addition, Illinois passed a budget for the first time in two years in July 2017, preventing the state from being downgraded to a below investment-grade rating. The passage of Illinois’ budget took some risk out of the broader market, providing additional support for prices through the middle of 2017.
The market landscape became more challenging in the autumn after Republican legislators unveiled a preliminary outline for overhauling the nation’s tax code. The initial proposals eliminated municipal issuers’ ability to advance refund outstanding debt, and it stripped private activity bonds (PABs) of their tax-exempt status. The surprise inclusion of the two provisions initially fueled a market rally as investors anticipated a dramatic reduction in future supply. However, municipalities responded to the proposed tax bill by pulling forward an estimated $35 billion of new bond issuance into December in an effort to beat any negative consequences from the potential changes. Fourth-quarter supply therefore jumped to the highest level in history, weighing on prices. The final bill, signed into law on December 22, spared PABs and only marginally reduced top personal tax rates.
Municipal bonds nevertheless remained under pressure in early 2018 as expectations for higher inflation weighed heavily on all segments of the fixed-income market. Investors worried that the introduction of fiscal stimulus, coming at a time when the economy appeared to be operating near full capacity, would force the Fed to raise interest rates further and faster than expected in order to tame inflation. The 10-year U.S. Treasury yield rose sharply during the first half of the quarter as a result, and municipal yields followed suit. Tax reform lessened the value proposition of municipals for banks and insurance companies, leading some to reduce their holdings of municipal bonds, but this potential headwind was offset by a sharp reduction in supply stemming from the surge of new issuance in December. This factor, together with a slowing rate of increase in Treasury yields late in the period, helped stabilize the municipal bond market in March and April. Still, the broad-based national indexes closed roughly flat for the full 12 months due to the earlier sell-off. Lower-quality bonds outpaced higher quality issues, reflecting investors’ ongoing search for yield.
Georgia’s higher average credit quality was a headwind
Georgia’s economy continued to perform well in the past year, with strong population growth, an improving job market, rising wages and favorable economic trends in the Atlanta metropolitan area. Despite these positive developments, Georgia intermediate-term municipal issues trailed the national intermediate market. Georgia has a higher concentration in higher quality state general obligation bonds, which underperformed the national indexes amid the rally in lower quality debt.
Contributors and detractors
Given the relative strength in lower quality issues, the Fund benefited from its overweight in lower rated investment-grade bonds in the A and BBB credit tiers. Overweights in A rated hospital bonds and longer maturity education-related issues also boosted performance, as these were two of the larger sector weights in the Fund. Conversely, the Fund was hurt by its large weighting in local general obligation bonds, where the average credit rating is AA+. The Fund was also pressured by its positioning in the water and sewer sector, where the timing of a specific purchase weighed on results.
| 4 | Columbia AMT-Free Georgia Intermediate Muni Bond Fund | Annual Report 2018 |
Manager Discussion of Fund Performance (continued)
At the individual security level, the bonds of Eagles Trace Apartments — an operator of affordable housing units located in Columbus, Georgia — was a notable detractor. The apartment complex has struggled with its occupancy level, and it recently disclosed a draw on its debt-service reserves to make its most recent debt payment. The issuer has a sinking fund that allows it to retire bonds on a schedule, which reduces the size of the Fund’s position every six months.
Fund positioning
Our strategy was largely unchanged during the period. We retained an overweight in A and BBB rated securities, as we did not anticipate a dramatic widening of yield spreads versus higher quality debt. However, given that spreads are very tight for lower rated investment-grade issues, we remained on the lookout for opportunities to increase the portfolio’s credit quality when reinvesting the proceeds of maturing securities. We targeted a neutral duration profile — i.e., an interest-rate sensitivity in line with the benchmark — in order to maintain a balanced stance within the portfolio. The Fund’s positioning continues to reflect our expectation for gradual Fed tightening and a flattening bias to the yield curve.
We did not have any concerns about Georgia’s credit profile at the close of the period, but recent legislation may present a potential risk for local issuers. The legislation allowed a portion of the city of Stockbridge to be de-annexed and incorporated into a new municipality called Eagle’s Landing without appropriate reapportionment of the existing entity’s debt. In addition to increasing leverage for Stockbridge, we believe the de-annexation would weaken wealth levels within the existing municipality since the proposed Eagle’s Landing would take about half of the property tax base but only a third of the population. We believe the decision sets a bad precedent for municipalities that have a wide range of wealth levels and the ability to rationally carve out stronger portions of their tax base. While there is a precedent for the law to be struck down if it is challenged in court, we will be closely watching developments on this front.
Fixed-income securities present issuer default risk. The Fund invests substantially in municipal securities and will be affected by tax, legislative, regulatory, demographic or political changes, as well as changes impacting a state’s financial, economic or other conditions. A relatively small number of tax-exempt issuers may necessitate the Fund investing more heavily in a single issuer and, therefore, be more exposed to the risk of loss than a fund that invests more broadly. The value of the Fund’s portfolio may be more volatile than a more geographically-diversified fund. Prepayment and extension risk exists because the timing of payments on a loan, bond or other investment may accelerate when interest rates fall or decelerate when interest rates rise which may reduce investment opportunities and potential returns. A rise in interest rates may result in a price decline of fixed-income (debt) instruments held by the Fund, negatively affecting its performance and NAV. Falling rates may result in the Fund investing in lower yielding debt instruments, lowering the Fund’s income and yield. Debt instruments with longer maturity and duration have greater sensitivity to interest rate changes. Interest rates can change due to local government and banking regulation changes. Non-investment-grade (high-yield or junk) securities present greater price volatility and more risk to principal and income than higher rated securities. Market risk may affect a single issuer, sector of the economy, industry or the market as a whole. Federal and state tax rules apply to capital gain distributions and any gains or losses on sales. Income may be subject to state or local taxes. Liquidity risk is associated with the difficulty of selling underlying investments at a desirable time or price. See the Fund’s prospectus for more information on these and other risks.
The views expressed in this report reflect the current views of the respective parties. These views are not guarantees of future performance and involve certain risks, uncertainties and assumptions that are difficult to predict, so actual outcomes and results may differ significantly from the views expressed. These views are subject to change at any time based upon economic, market or other conditions and the respective parties disclaim any responsibility to update such views. These views may not be relied on as investment advice and, because investment decisions for a Columbia fund are based on numerous factors, may not be relied on as an indication of trading intent on behalf of any particular Columbia fund. References to specific securities should not be construed as a recommendation or investment advice.
Columbia AMT-Free Georgia Intermediate Muni Bond Fund | Annual Report 2018
| 5 |
Understanding Your Fund’s Expenses
(Unaudited)
As an investor, you incur two types of costs. There are transaction costs, which generally include sales charges on purchases and may include redemption fees. There are also ongoing costs, which generally include management fees, distribution and/or service fees, and other fund expenses. The following information is intended to help you understand your ongoing costs (in dollars) of investing in the Fund and to help you compare these costs with the ongoing costs of investing in other mutual funds.
Analyzing your Fund’s expenses
To illustrate these ongoing costs, we have provided examples and calculated the expenses paid by investors in each share class of the Fund during the period. The actual and hypothetical information in the table is based on an initial investment of $1,000 at the beginning of the period indicated and held for the entire period. Expense information is calculated two ways and each method provides you with different information. The amount listed in the “Actual” column is calculated using the Fund’s actual operating expenses and total return for the period. You may use the Actual information, together with the amount invested, to estimate the expenses that you paid over the period. Simply divide your account value by $1,000 (for example, an $8,600 account value divided by $1,000 = 8.6), then multiply the results by the expenses paid during the period under the “Actual” column. The amount listed in the “Hypothetical” column assumes a 5% annual rate of return before expenses (which is not the Fund’s actual return) and then applies the Fund’s actual expense ratio for the period to the hypothetical return. You should not use the hypothetical account values and expenses to estimate either your actual account balance at the end of the period or the expenses you paid during the period. See “Compare with other funds” below for details on how to use the hypothetical data.
Compare with other funds
Since all mutual funds are required to include the same hypothetical calculations about expenses in shareholder reports, you can use this information to compare the ongoing cost of investing in the Fund with other funds. To do so, compare the hypothetical example with the 5% hypothetical examples that appear in the shareholder reports of other funds. As you compare hypothetical examples of other funds, it is important to note that hypothetical examples are meant to highlight the ongoing costs of investing in a fund only and do not reflect any transaction costs, such as sales charges, or redemption or exchange fees. Therefore, the hypothetical calculations are useful in comparing ongoing costs only, and will not help you determine the relative total costs of owning different funds. If transaction costs were included in these calculations, your costs would be higher.
| November 1, 2017 — April 30, 2018 |
| | Account value at the
beginning of the
period ($) | Account value at the
end of the
period ($) | Expenses paid during
the period ($) | Fund’s annualized
expense ratio (%) |
| | Actual | Hypothetical | Actual | Hypothetical | Actual | Hypothetical | Actual |
| Class A | 1,000.00 | 1,000.00 | 985.20 | 1,020.78 | 3.99 | 4.06 | 0.81 |
| Advisor Class | 1,000.00 | 1,000.00 | 985.50 | 1,022.02 | 2.76 | 2.81 | 0.56 |
| Class C | 1,000.00 | 1,000.00 | 981.60 | 1,017.06 | 7.66 | 7.80 | 1.56 |
| Institutional Class | 1,000.00 | 1,000.00 | 985.50 | 1,022.02 | 2.76 | 2.81 | 0.56 |
| Institutional 3 Class | 1,000.00 | 1,000.00 | 987.00 | 1,022.51 | 2.27 | 2.31 | 0.46 |
Expenses paid during the period are equal to the annualized expense ratio for each class as indicated above, multiplied by the average account value over the period and then multiplied by the number of days in the Fund’s most recent fiscal half year and divided by 365.
Expenses do not include fees and expenses incurred indirectly by the Fund from its investment in underlying funds, including affiliated and non-affiliated pooled investment vehicles, such as mutual funds and exchange-traded funds.
Had Columbia Management Investment Advisers, LLC and/or certain of its affiliates not waived/reimbursed certain fees and expenses, account value at the end of the period would have been reduced.
| 6 | Columbia AMT-Free Georgia Intermediate Muni Bond Fund | Annual Report 2018 |
Portfolio of Investments
April 30, 2018
(Percentages represent value of investments compared to net assets)
Investments in securities
| Municipal Bonds 98.0% |
| Issue Description | Coupon
Rate | | Principal
Amount ($) | Value ($) |
| Airport 5.1% |
| City of Atlanta Department of Aviation |
| Refunding Revenue Bonds |
| General |
| Series 2010C |
| 01/01/2025 | 5.000% | | 1,500,000 | 1,605,630 |
| Revenue Bonds |
| Series 2012B |
| 01/01/2027 | 5.000% | | 1,000,000 | 1,092,850 |
| Total | 2,698,480 |
| Higher Education 13.6% |
| Atlanta Development Authority |
| Refunding Revenue Bonds |
| Panther Place LLC |
| Series 2017A |
| 07/01/2028 | 5.000% | | 500,000 | 589,675 |
| Bulloch County Development Authority |
| Refunding Revenue Bonds |
| Georgia Southern University Housing Foundation |
| Series 2012 (AGM) |
| 08/01/2027 | 5.000% | | 500,000 | 546,045 |
| Georgia Southern University Housing Foundation Four LLC |
| Series 2017 |
| 07/01/2034 | 5.000% | | 500,000 | 561,675 |
| Carrollton Payroll Development Authority |
| Refunding Revenue Bonds |
| Anticipation Certificates - UWG Campus Center |
| Series 2012 (AGM) |
| 08/01/2025 | 5.000% | | 800,000 | 875,016 |
| Dahlonega Downtown Development Authority |
| Refunding Revenue Bonds |
| North Georgia MAC LLC Project |
| Series 2017 |
| 07/01/2032 | 4.000% | | 1,000,000 | 1,049,280 |
| Fulton County Development Authority |
| Refunding Revenue Bonds |
| Spelman College |
| Series 2015 |
| 06/01/2032 | 5.000% | | 1,000,000 | 1,130,110 |
| Gwinnett County Development Authority |
| Refunding Revenue Bonds |
| Georgia Gwinnett College Student Housing |
| Series 2017 |
| 07/01/2034 | 5.000% | | 1,000,000 | 1,131,760 |
| Municipal Bonds (continued) |
| Issue Description | Coupon
Rate | | Principal
Amount ($) | Value ($) |
| Richmond County Development Authority |
| Refunding Revenue Bonds |
| ASU Jaguar Student Housing |
| Series 2012 (AGM) |
| 02/01/2027 | 5.000% | | 750,000 | 822,135 |
| Georgia Regents University Cancer Center |
| Series 2014 (AGM) |
| 12/15/2032 | 5.000% | | 425,000 | 482,775 |
| Total | 7,188,471 |
| Hospital 12.1% |
| Carroll City-County Hospital Authority |
| Refunding Revenue Bonds |
| Tanner Medical Center, Inc. Project |
| Series 2016 |
| 07/01/2030 | 4.000% | | 1,000,000 | 1,054,100 |
| Cedartown Polk County Hospital Authority |
| Revenue Bonds |
| Floyd Healthcare Polk Medical Center |
| RAC Series 2016 |
| 07/01/2034 | 5.000% | | 490,000 | 533,066 |
| Dalton Whitfield County Joint Development Authority |
| Revenue Bonds |
| Hamilton Health Care System Obligation |
| Series 2017 |
| 08/15/2033 | 5.000% | | 300,000 | 343,692 |
| Fayette County Hospital Authority |
| Revenue Bonds |
| Fayette Community Hospital |
| Series 2009A |
| 06/15/2023 | 5.250% | | 2,000,000 | 2,073,360 |
| Gainesville & Hall County Hospital Authority |
| Refunding Revenue Bonds |
| Northeast Georgia Health System Project |
| Series 2017 |
| 02/15/2030 | 5.000% | | 300,000 | 340,323 |
| Gwinnett County Hospital Authority |
| Revenue Bonds |
| Gwinnet Hospital System |
| Series 2007A (AGM) |
| 07/01/2023 | 5.000% | | 2,000,000 | 2,068,640 |
| Total | 6,413,181 |
| Joint Power Authority 4.9% |
| Municipal Electric Authority of Georgia |
| Refunding Revenue Bonds |
| Project One |
| Subordinated Series 2015A |
| 01/01/2032 | 5.000% | | 1,000,000 | 1,098,400 |
The accompanying Notes to Financial Statements are an integral part of this statement.
Columbia AMT-Free Georgia Intermediate Muni Bond Fund | Annual Report 2018
| 7 |
Portfolio of Investments (continued)
April 30, 2018
| Municipal Bonds (continued) |
| Issue Description | Coupon
Rate | | Principal
Amount ($) | Value ($) |
| Revenue Bonds |
| Project One |
| Subordinated Series 2008A |
| 01/01/2021 | 5.250% | | 1,395,000 | 1,498,453 |
| Total | 2,596,853 |
| Local Appropriation 0.5% |
| Macon-Bibb County Urban Development Authority |
| Refunding Revenue Bonds |
| Macon-Bibb County Public Project |
| Series 2017 |
| 12/01/2032 | 5.000% | | 200,000 | 230,746 |
| Local General Obligation 21.4% |
| Cherokee County Board of Education |
| Unlimited General Obligation Bonds |
| Series 2014A |
| 08/01/2030 | 5.000% | | 1,000,000 | 1,129,530 |
| City of Atlanta |
| Unlimited General Obligation Refunding Bonds |
| Series 2014A |
| 12/01/2026 | 5.000% | | 500,000 | 574,425 |
| County of Columbia |
| Unlimited General Obligation Bonds |
| Sales Tax |
| Series 2015 |
| 04/01/2022 | 5.000% | | 285,000 | 316,119 |
| County of DeKalb |
| Unlimited General Obligation Refunding Bonds |
| Special Transportation - Parks Greenspace |
| Series 2016 |
| 12/01/2027 | 5.000% | | 750,000 | 882,570 |
| Forsyth County School District |
| Unlimited General Obligation Bonds |
| Series 2014 |
| 02/01/2028 | 5.000% | | 1,000,000 | 1,129,600 |
| Gwinnett County School District |
| Unlimited General Obligation Refunding Bonds |
| Series 2010 |
| 02/01/2024 | 5.000% | | 1,500,000 | 1,715,955 |
| Jefferson City School District |
| Unlimited General Obligation Refunding Bonds |
| Series 2017 |
| 02/01/2031 | 4.000% | | 500,000 | 536,335 |
| Pierce County School District |
| Unlimited General Obligation Bonds |
| Series 2017 |
| 01/01/2032 | 4.000% | | 425,000 | 451,456 |
| Municipal Bonds (continued) |
| Issue Description | Coupon
Rate | | Principal
Amount ($) | Value ($) |
| Polk School District |
| Unlimited General Obligation Bonds |
| Sales Tax |
| Series 2018 |
| 03/01/2026 | 5.000% | | 200,000 | 233,802 |
| Sandy Springs Public Facilities Authority |
| Revenue Bonds |
| City Center Project |
| Series 2015 |
| 05/01/2028 | 5.000% | | 1,000,000 | 1,173,080 |
| South Fulton Municipal Regional Water & Sewer Authority |
| Refunding Revenue Bonds |
| Series 2014 |
| 01/01/2031 | 5.000% | | 1,000,000 | 1,115,010 |
| Winder-Barrow Industrial Building Authority |
| Refunding Revenue Bonds |
| City of Winder Project |
| Series 2012 (AGM) |
| 12/01/2024 | 5.000% | | 1,900,000 | 2,066,440 |
| Total | 11,324,322 |
| Multi-Family 2.0% |
| Cobb County Development Authority |
| Refunding Revenue Bonds |
| Kennesaw State University |
| Junior Subordinated Series 2014 |
| 07/15/2029 | 5.000% | | 980,000 | 1,054,480 |
| Other Bond Issue 1.0% |
| Columbus Housing Authority |
| Revenue Bonds |
| Eagles Trace Apartments Project |
| Series 2015 |
| 12/01/2025 | 3.250% | | 620,000 | 524,793 |
| Prep School 1.0% |
| Gainesville & Hall County Development Authority |
| Refunding Revenue Bonds |
| Riverside Military Academy |
| Series 2017 |
| 03/01/2027 | 5.000% | | 500,000 | 545,410 |
| Prepaid Gas 0.6% |
| Main Street Natural Gas, Inc. |
| Revenue Bonds |
| Series 2007A |
| 09/15/2019 | 5.250% | | 295,000 | 306,983 |
| Refunded / Escrowed 10.1% |
| DeKalb Newton & Gwinnett Counties Joint Development Authority |
| Prerefunded 07/01/19 Revenue Bonds |
| GGC Foundation LLC Project |
| Series 2009 |
| 07/01/2024 | 5.500% | | 2,500,000 | 2,602,450 |
The accompanying Notes to Financial Statements are an integral part of this statement.
| 8 | Columbia AMT-Free Georgia Intermediate Muni Bond Fund | Annual Report 2018 |
Portfolio of Investments (continued)
April 30, 2018
| Municipal Bonds (continued) |
| Issue Description | Coupon
Rate | | Principal
Amount ($) | Value ($) |
| Georgia State Road & Tollway Authority |
| Prerefunded 01/01/19 Revenue Bonds |
| Federal Highway Grant |
| Series 2009A |
| 06/01/2021 | 5.000% | | 1,000,000 | 1,033,420 |
| Metropolitan Atlanta Rapid Transit Authority |
| Prerefunded 07/01/22 Revenue Bonds |
| Third Indenture |
| Series 2012A |
| 07/01/2030 | 5.000% | | 1,500,000 | 1,669,995 |
| Total | 5,305,865 |
| Retirement Communities 1.0% |
| Fulton County Residential Care Facilities for the Elderly Authority |
| Refunding Revenue Bonds |
| Lenbrook Square Foundation, Inc. |
| Series 2016 |
| 07/01/2025 | 4.000% | | 500,000 | 532,665 |
| Sales Tax 1.6% |
| Metropolitan Atlanta Rapid Transit Authority |
| Refunding Revenue Bonds |
| 3rd Indenture |
| Series 2014A |
| 07/01/2024 | 5.000% | | 750,000 | 849,608 |
| Single Family 1.9% |
| Georgia Housing & Finance Authority |
| Revenue Bonds |
| Series 2014B-1 |
| 12/01/2029 | 3.000% | | 1,000,000 | 987,440 |
| Special Property Tax 3.8% |
| Atlanta & Fulton County Recreation Authority |
| Refunding Revenue Bonds |
| Park Improvement |
| Series 2014A |
| 12/01/2028 | 5.000% | | 525,000 | 598,022 |
| 12/01/2033 | 5.000% | | 1,000,000 | 1,130,720 |
| City of Atlanta |
| Refunding Tax Allocation Bonds |
| Atlantic Station Project |
| Series 2017 |
| 12/01/2024 | 5.000% | | 250,000 | 281,560 |
| Total | 2,010,302 |
| Turnpike / Bridge / Toll Road 1.3% |
| Georgia State Road & Tollway Authority(a),(b) |
| Revenue Bonds |
| I-75 S Express Lanes Project |
| Series 2014 |
| 06/01/2024 | 0.000% | | 1,000,000 | 704,330 |
| Municipal Bonds (continued) |
| Issue Description | Coupon
Rate | | Principal
Amount ($) | Value ($) |
| Water & Sewer 16.1% |
| Augusta Water & Sewerage Revenue |
| Refunding Revenue Bonds |
| Series 2017 |
| 10/01/2029 | 3.000% | | 750,000 | 732,930 |
| Cherokee County Water & Sewer Authority |
| Refunding Revenue Bonds |
| Series 2016 |
| 08/01/2031 | 5.000% | | 250,000 | 288,650 |
| City of Atlanta Water & Wastewater |
| Refunding Revenue Bonds |
| Series 2015 |
| 11/01/2030 | 5.000% | | 1,000,000 | 1,146,440 |
| Series 2017A |
| 11/01/2034 | 5.000% | | 1,000,000 | 1,159,740 |
| City of Columbus Water & Sewerage |
| Refunding Revenue Bonds |
| Series 2016 |
| 05/01/2032 | 5.000% | | 350,000 | 402,934 |
| City of Gainesville Water & Sewerage |
| Refunding Revenue Bonds |
| Series 2014 |
| 11/15/2026 | 5.000% | | 1,500,000 | 1,722,870 |
| County of DeKalb Water & Sewage |
| Refunding Revenue Bonds |
| Series 2006B |
| 10/01/2021 | 5.250% | | 2,000,000 | 2,204,380 |
| Villa Rica Public Facilities Authority |
| Refunding Revenue Bonds |
| Water & Sewer Project |
| Series 2015 |
| 03/01/2031 | 5.000% | | 750,000 | 837,705 |
| Total | 8,495,649 |
Total Municipal Bonds
(Cost $50,987,283) | 51,769,578 |
Total Investments in Securities
(Cost: $50,987,283) | 51,769,578 |
| Other Assets & Liabilities, Net | | 1,080,682 |
| Net Assets | 52,850,260 |
The accompanying Notes to Financial Statements are an integral part of this statement.
Columbia AMT-Free Georgia Intermediate Muni Bond Fund | Annual Report 2018
| 9 |
Portfolio of Investments (continued)
April 30, 2018
Notes to Portfolio of Investments
| (a) | Represents privately placed and other securities and instruments exempt from SEC registration (collectively, private placements), such as Section 4(a)(2) and Rule 144A eligible securities, which are often sold only to qualified institutional buyers. The Fund may invest in private placements determined to be liquid as well as those determined to be illiquid. Private placements may be determined to be liquid under guidelines established by the Fund’s Board of Trustees. At April 30, 2018, the value of these securities amounted to $704,330, which represents 1.33% of net assets. |
| (b) | Zero coupon bond. |
Abbreviation Legend
| AGM | Assured Guaranty Municipal Corporation |
Fair value measurements
The Fund categorizes its fair value measurements according to a three-level hierarchy that maximizes the use of observable inputs and minimizes the use of unobservable inputs by prioritizing that the most observable input be used when available. Observable inputs are those that market participants would use in pricing an investment based on market data obtained from sources independent of the reporting entity. Unobservable inputs are those that reflect the Fund’s assumptions about the information market participants would use in pricing an investment. An investment’s level within the fair value hierarchy is based on the lowest level of any input that is deemed significant to the asset’s or liability’s fair value measurement. The input levels are not necessarily an indication of the risk or liquidity associated with investments at that level. For example, certain U.S. government securities are generally high quality and liquid, however, they are reflected as Level 2 because the inputs used to determine fair value may not always be quoted prices in an active market.
Fair value inputs are summarized in the three broad levels listed below:
| ■ | Level 1 — Valuations based on quoted prices for investments in active markets that the Fund has the ability to access at the measurement date. Valuation adjustments are not applied to Level 1 investments. |
| ■ | Level 2 — Valuations based on other significant observable inputs (including quoted prices for similar securities, interest rates, prepayment speeds, credit risks, etc.). |
| ■ | Level 3 — Valuations based on significant unobservable inputs (including the Fund’s own assumptions and judgment in determining the fair value of investments). |
Inputs that are used in determining fair value of an investment may include price information, credit data, volatility statistics, and other factors. These inputs can be either observable or unobservable. The availability of observable inputs can vary between investments, and is affected by various factors such as the type of investment, and the volume and level of activity for that investment or similar investments in the marketplace. The inputs will be considered by the Investment Manager, along with any other relevant factors in the calculation of an investment’s fair value. The Fund uses prices and inputs that are current as of the measurement date, which may include periods of market dislocations. During these periods, the availability of prices and inputs may be reduced for many investments. This condition could cause an investment to be reclassified between the various levels within the hierarchy.
Investments falling into the Level 3 category are primarily supported by quoted prices from brokers and dealers participating in the market for those investments. However, these may be classified as Level 3 investments due to lack of market transparency and corroboration to support these quoted prices. Additionally, valuation models may be used as the pricing source for any remaining investments classified as Level 3. These models may rely on one or more significant unobservable inputs and/or significant assumptions by the Investment Manager. Inputs used in valuations may include, but are not limited to, financial statement analysis, capital account balances, discount rates and estimated cash flows, and comparable company data.
Under the direction of the Fund’s Board of Trustees (the Board), the Investment Manager’s Valuation Committee (the Committee) is responsible for overseeing the valuation procedures approved by the Board. The Committee consists of voting and non-voting members from various groups within the Investment Manager’s organization, including operations and accounting, trading and investments, compliance, risk management and legal.
The Committee meets at least monthly to review and approve valuation matters, which may include a description of specific valuation determinations, data regarding pricing information received from approved pricing vendors and brokers and the results of Board-approved valuation control policies and procedures (the Policies). The Policies address, among other things, instances when market quotations are or are not readily available, including recommendations of third party pricing vendors and a determination of appropriate pricing methodologies; events that require specific valuation determinations and assessment of fair value techniques; securities with a potential for stale pricing, including those that are illiquid, restricted, or in default; and the effectiveness of third party pricing vendors, including periodic reviews of vendors. The Committee meets more frequently, as needed, to discuss additional valuation matters, which may include the need to review back-testing results, review time-sensitive information or approve related valuation actions. The Committee reports to the Board, with members of the Committee meeting with the Board at each of its regularly scheduled meetings to discuss valuation matters and actions during the period, similar to those described earlier.
For investments categorized as Level 3, the Committee monitors information similar to that described above, which may include: (i) data specific to the issuer or comparable issuers, (ii) general market or specific sector news and (iii) quoted prices and specific or similar security transactions. The Committee considers this data and any changes from prior periods in order to assess the reasonableness of observable and unobservable inputs, any assumptions or internal models used to value those securities and changes in fair value. This data is also used to corroborate, when available, information received from approved pricing vendors and brokers. Various factors impact the frequency of monitoring this information (which may occur as often as daily). However, the Committee may determine that changes to inputs, assumptions and models are not required as a result of the monitoring procedures performed.
The following table is a summary of the inputs used to value the Fund’s investments at April 30, 2018:
| | Level 1
quoted prices in active
markets for identical
assets ($) | Level 2
other significant
observable inputs ($) | Level 3
significant
unobservable inputs ($) | Total ($) |
| Investments in Securities | | | | |
| Municipal Bonds | — | 51,769,578 | — | 51,769,578 |
| Total Investments in Securities | — | 51,769,578 | — | 51,769,578 |
The accompanying Notes to Financial Statements are an integral part of this statement.
| 10 | Columbia AMT-Free Georgia Intermediate Muni Bond Fund | Annual Report 2018 |
Portfolio of Investments (continued)
April 30, 2018
Fair value measurements (continued)
See the Portfolio of Investments for all investment classifications not indicated in the table.
The Fund’s assets assigned to the Level 2 input category are generally valued using the market approach, in which a security’s value is determined through reference to prices and information from market transactions for similar or identical assets.
There were no transfers of financial assets between levels during the period.
The accompanying Notes to Financial Statements are an integral part of this statement.
Columbia AMT-Free Georgia Intermediate Muni Bond Fund | Annual Report 2018
| 11 |
Statement of Assets and Liabilities
April 30, 2018
| Assets | |
| Investments in securities, at value | |
| Unaffiliated issuers (cost $50,987,283) | $51,769,578 |
| Cash | 570,543 |
| Receivable for: | |
| Capital shares sold | 58,996 |
| Interest | 752,208 |
| Expense reimbursement due from Investment Manager | 769 |
| Prepaid expenses | 559 |
| Total assets | 53,152,653 |
| Liabilities | |
| Payable for: | |
| Capital shares purchased | 29,279 |
| Distributions to shareholders | 121,860 |
| Management services fees | 2,040 |
| Distribution and/or service fees | 495 |
| Transfer agent fees | 6,980 |
| Compensation of board members | 106,303 |
| Audit fees | 31,520 |
| Other expenses | 3,916 |
| Total liabilities | 302,393 |
| Net assets applicable to outstanding capital stock | $52,850,260 |
| Represented by | |
| Paid in capital | 52,094,205 |
| Undistributed net investment income | 95,765 |
| Accumulated net realized loss | (122,005) |
| Unrealized appreciation (depreciation) on: | |
| Investments - unaffiliated issuers | 782,295 |
| Total - representing net assets applicable to outstanding capital stock | $52,850,260 |
| Class A | |
| Net assets | $11,818,718 |
| Shares outstanding | 1,162,596 |
| Net asset value per share | $10.17 |
| Maximum sales charge | 3.00% |
| Maximum offering price per share (calculated by dividing the net asset value per share by 1.0 minus the maximum sales charge for Class A shares) | $10.48 |
| Advisor Class | |
| Net assets | $126,233 |
| Shares outstanding | 12,432 |
| Net asset value per share | $10.15 |
| Class C | |
| Net assets | $3,067,855 |
| Shares outstanding | 301,712 |
| Net asset value per share | $10.17 |
| Institutional Class | |
| Net assets | $37,697,915 |
| Shares outstanding | 3,708,734 |
| Net asset value per share | $10.16 |
| Institutional 3 Class | |
| Net assets | $139,539 |
| Shares outstanding | 13,692 |
| Net asset value per share | $10.19 |
The accompanying Notes to Financial Statements are an integral part of this statement.
| 12 | Columbia AMT-Free Georgia Intermediate Muni Bond Fund | Annual Report 2018 |
Statement of Operations
Year Ended April 30, 2018
| Net investment income | |
| Income: | |
| Interest | $2,076,358 |
| Total income | 2,076,358 |
| Expenses: | |
| Management services fees | 299,260 |
| Distribution and/or service fees | |
| Class A | 40,732 |
| Class B | 92 |
| Class C | 34,459 |
| Transfer agent fees | |
| Class A | 22,165 |
| Advisor Class | 280 |
| Class B | 14 |
| Class C | 4,697 |
| Institutional Class | 59,519 |
| Institutional 3 Class | 17 |
| Compensation of board members | 22,261 |
| Custodian fees | 1,549 |
| Printing and postage fees | 10,017 |
| Audit fees | 31,520 |
| Legal fees | 7,668 |
| Compensation of chief compliance officer | 14 |
| Other | 6,805 |
| Total expenses | 541,069 |
| Fees waived or expenses reimbursed by Investment Manager and its affiliates | (109,359) |
| Total net expenses | 431,710 |
| Net investment income | 1,644,648 |
| Realized and unrealized gain (loss) — net | |
| Net realized gain (loss) on: | |
| Investments — unaffiliated issuers | 258,785 |
| Net realized gain | 258,785 |
| Net change in unrealized appreciation (depreciation) on: | |
| Investments — unaffiliated issuers | (1,666,397) |
| Net change in unrealized appreciation (depreciation) | (1,666,397) |
| Net realized and unrealized loss | (1,407,612) |
| Net increase in net assets resulting from operations | $237,036 |
The accompanying Notes to Financial Statements are an integral part of this statement.
Columbia AMT-Free Georgia Intermediate Muni Bond Fund | Annual Report 2018
| 13 |
Statement of Changes in Net Assets
| | Year Ended
April 30, 2018 | Year Ended
April 30, 2017 (a) |
| Operations | | |
| Net investment income | $1,644,648 | $2,020,144 |
| Net realized gain (loss) | 258,785 | (33,598) |
| Net change in unrealized appreciation (depreciation) | (1,666,397) | (2,837,667) |
| Net increase (decrease) in net assets resulting from operations | 237,036 | (851,121) |
| Distributions to shareholders | | |
| Net investment income | | |
| Class A | (396,122) | (538,681) |
| Advisor Class | (5,484) | (7,498) |
| Class B | (158) | (1,564) |
| Class C | (58,378) | (82,024) |
| Institutional Class | (1,171,724) | (1,394,944) |
| Institutional 3 Class | (2,280) | (49) |
| Net realized gains | | |
| Class A | (65,350) | (121,817) |
| Advisor Class | (821) | (1,501) |
| Class B | — | (505) |
| Class C | (13,533) | (26,364) |
| Institutional Class | (165,368) | (281,718) |
| Institutional 3 Class | (440) | — |
| Total distributions to shareholders | (1,879,658) | (2,456,665) |
| Decrease in net assets from capital stock activity | (14,939,103) | (5,348,816) |
| Total decrease in net assets | (16,581,725) | (8,656,602) |
| Net assets at beginning of year | 69,431,985 | 78,088,587 |
| Net assets at end of year | $52,850,260 | $69,431,985 |
| Undistributed net investment income | $95,765 | $105,247 |
| (a) | Institutional 3 Class shares are based on operations from March 1, 2017 (commencement of operations) through the stated period end. |
The accompanying Notes to Financial Statements are an integral part of this statement.
| 14 | Columbia AMT-Free Georgia Intermediate Muni Bond Fund | Annual Report 2018 |
Statement of Changes in Net Assets (continued)
| | Year Ended | Year Ended |
| | April 30, 2018 | April 30, 2017 (a) |
| | Shares | Dollars ($) | Shares | Dollars ($) |
| Capital stock activity |
| Class A | | | | |
| Subscriptions | 85,581 | 897,415 | 324,953 | 3,540,943 |
| Distributions reinvested | 22,228 | 231,255 | 36,799 | 389,042 |
| Redemptions | (756,201) | (7,814,717) | (423,385) | (4,422,404) |
| Net decrease | (648,392) | (6,686,047) | (61,633) | (492,419) |
| Advisor Class | | | | |
| Subscriptions | 10,245 | 108,285 | 2,695 | 29,187 |
| Distributions reinvested | 576 | 6,003 | 822 | 8,668 |
| Redemptions | (24,721) | (259,236) | (160) | (1,678) |
| Net increase (decrease) | (13,900) | (144,948) | 3,357 | 36,177 |
| Class B | | | | |
| Subscriptions | — | — | 8 | 89 |
| Distributions reinvested | 10 | 111 | 159 | 1,681 |
| Redemptions | (5,638) | (59,614) | (8,459) | (90,569) |
| Net decrease | (5,628) | (59,503) | (8,292) | (88,799) |
| Class C | | | | |
| Subscriptions | 32,404 | 342,275 | 32,466 | 349,629 |
| Distributions reinvested | 6,147 | 63,966 | 8,148 | 86,019 |
| Redemptions | (93,795) | (981,559) | (142,622) | (1,490,856) |
| Net decrease | (55,244) | (575,318) | (102,008) | (1,055,208) |
| Institutional Class | | | | |
| Subscriptions | 531,354 | 5,555,575 | 890,510 | 9,547,486 |
| Distributions reinvested | 22,580 | 235,000 | 23,091 | 244,108 |
| Redemptions | (1,286,237) | (13,398,103) | (1,280,672) | (13,550,161) |
| Net decrease | (732,303) | (7,607,528) | (367,071) | (3,758,567) |
| Institutional 3 Class | | | | |
| Subscriptions | 13,467 | 141,914 | 961 | 10,000 |
| Distributions reinvested | 232 | 2,399 | — | — |
| Redemptions | (968) | (10,072) | — | — |
| Net increase | 12,731 | 134,241 | 961 | 10,000 |
| Total net decrease | (1,442,736) | (14,939,103) | (534,686) | (5,348,816) |
| (a) | Institutional 3 Class shares are based on operations from March 1, 2017 (commencement of operations) through the stated period end. |
The accompanying Notes to Financial Statements are an integral part of this statement.
Columbia AMT-Free Georgia Intermediate Muni Bond Fund | Annual Report 2018
| 15 |
The following table is intended to help you understand the Fund’s financial performance. Certain information reflects financial results for a single share of a class held for the periods shown. Per share net investment income (loss) amounts are calculated based on average shares outstanding during the period. Total return assumes reinvestment of all dividends and distributions, if any. Total return does not reflect payment of sales charges, if any. Total return and portfolio turnover are not annualized for periods of less than one year. The portfolio turnover rate is calculated without regard to purchase and sales transactions of short-term instruments and certain derivatives, if any. If such transactions were included, the Fund’s portfolio turnover rate may be higher.
| | Net asset value,
beginning of
period | Net
investment
income | Net
realized
and
unrealized
gain (loss) | Total from
investment
operations | Distributions
from net
investment
income | Distributions
from net
realized
gains |
| Class A |
| Year Ended 4/30/2018 | $10.45 | 0.26 | (0.24) | 0.02 | (0.26) | (0.04) |
| Year Ended 4/30/2017 | $10.88 | 0.27 | (0.37) | (0.10) | (0.27) | (0.06) |
| Year Ended 4/30/2016 | $10.81 | 0.29 | 0.11 | 0.40 | (0.29) | (0.04) |
| Year Ended 4/30/2015 | $10.82 | 0.31 | 0.01 | 0.32 | (0.31) | (0.02) |
| Year Ended 4/30/2014 | $11.21 | 0.31 | (0.32) | (0.01) | (0.31) | (0.07) |
| Advisor Class |
| Year Ended 4/30/2018 | $10.44 | 0.28 | (0.25) | 0.03 | (0.28) | (0.04) |
| Year Ended 4/30/2017 | $10.87 | 0.30 | (0.38) | (0.08) | (0.29) | (0.06) |
| Year Ended 4/30/2016 | $10.79 | 0.32 | 0.12 | 0.44 | (0.32) | (0.04) |
| Year Ended 4/30/2015 | $10.80 | 0.33 | 0.02 | 0.35 | (0.34) | (0.02) |
| Year Ended 4/30/2014 | $11.20 | 0.34 | (0.33) | 0.01 | (0.34) | (0.07) |
| Class C |
| Year Ended 4/30/2018 | $10.46 | 0.18 | (0.25) | (0.07) | (0.18) | (0.04) |
| Year Ended 4/30/2017 | $10.88 | 0.19 | (0.36) | (0.17) | (0.19) | (0.06) |
| Year Ended 4/30/2016 | $10.81 | 0.21 | 0.11 | 0.32 | (0.21) | (0.04) |
| Year Ended 4/30/2015 | $10.82 | 0.23 | 0.01 | 0.24 | (0.23) | (0.02) |
| Year Ended 4/30/2014 | $11.22 | 0.23 | (0.33) | (0.10) | (0.23) | (0.07) |
| Institutional Class |
| Year Ended 4/30/2018 | $10.45 | 0.28 | (0.25) | 0.03 | (0.28) | (0.04) |
| Year Ended 4/30/2017 | $10.88 | 0.30 | (0.37) | (0.07) | (0.30) | (0.06) |
| Year Ended 4/30/2016 | $10.81 | 0.32 | 0.11 | 0.43 | (0.32) | (0.04) |
| Year Ended 4/30/2015 | $10.82 | 0.34 | 0.01 | 0.35 | (0.34) | (0.02) |
| Year Ended 4/30/2014 | $11.22 | 0.34 | (0.33) | 0.01 | (0.34) | (0.07) |
| Institutional 3 Class |
| Year Ended 4/30/2018 | $10.48 | 0.29 | (0.25) | 0.04 | (0.29) | (0.04) |
| Year Ended 4/30/2017(c) | $10.41 | 0.05 | 0.07 | 0.12 | (0.05) | — |
| Notes to Financial Highlights |
| (a) | In addition to the fees and expenses that the Fund bears directly, the Fund indirectly bears a pro rata share of the fees and expenses of any other funds in which it invests. Such indirect expenses are not included in the Fund’s reported expense ratios. |
| (b) | Total net expenses include the impact of certain fee waivers/expense reimbursements made by the Investment Manager and certain of its affiliates, if applicable. |
| (c) | Institutional 3 Class shares commenced operations on March 1, 2017. Per share data and total return reflect activity from that date. |
| (d) | Annualized. |
The accompanying Notes to Financial Statements are an integral part of this statement.
| 16 | Columbia AMT-Free Georgia Intermediate Muni Bond Fund | Annual Report 2018 |
Total
distributions to
shareholders | Net
asset
value,
end of
period | Total
return | Total gross
expense
ratio to
average
net assets(a) | Total net
expense
ratio to
average
net assets(a),(b) | Net investment
income
ratio to
average
net assets | Portfolio
turnover | Net
assets,
end of
period
(000’s) |
| |
| (0.30) | $10.17 | 0.12% | 0.98% | 0.81% | 2.45% | 12% | $11,819 |
| (0.33) | $10.45 | (0.93%) | 1.03% | 0.81% | 2.54% | 14% | $18,934 |
| (0.33) | $10.88 | 3.78% | 1.04% | 0.81% | 2.73% | 13% | $20,377 |
| (0.33) | $10.81 | 2.98% | 1.06% | 0.81% | 2.83% | 19% | $20,060 |
| (0.38) | $10.82 | 0.02% | 1.07% | 0.81% | 2.89% | 5% | $16,728 |
| |
| (0.32) | $10.15 | 0.27% | 0.73% | 0.56% | 2.69% | 12% | $126 |
| (0.35) | $10.44 | (0.68%) | 0.77% | 0.56% | 2.79% | 14% | $275 |
| (0.36) | $10.87 | 4.14% | 0.79% | 0.56% | 2.98% | 13% | $250 |
| (0.36) | $10.79 | 3.24% | 0.81% | 0.56% | 3.09% | 19% | $220 |
| (0.41) | $10.80 | 0.18% | 0.88% | 0.56% | 3.21% | 5% | $37 |
| |
| (0.22) | $10.17 | (0.72%) | 1.73% | 1.56% | 1.70% | 12% | $3,068 |
| (0.25) | $10.46 | (1.57%) | 1.78% | 1.56% | 1.78% | 14% | $3,733 |
| (0.25) | $10.88 | 3.01% | 1.79% | 1.56% | 1.98% | 13% | $4,996 |
| (0.25) | $10.81 | 2.21% | 1.81% | 1.56% | 2.08% | 19% | $4,612 |
| (0.30) | $10.82 | (0.82%) | 1.82% | 1.56% | 2.14% | 5% | $3,501 |
| |
| (0.32) | $10.16 | 0.28% | 0.73% | 0.56% | 2.70% | 12% | $37,698 |
| (0.36) | $10.45 | (0.68%) | 0.78% | 0.56% | 2.79% | 14% | $46,421 |
| (0.36) | $10.88 | 4.04% | 0.79% | 0.56% | 2.98% | 13% | $52,315 |
| (0.36) | $10.81 | 3.24% | 0.81% | 0.56% | 3.09% | 19% | $54,037 |
| (0.41) | $10.82 | 0.18% | 0.82% | 0.56% | 3.14% | 5% | $58,973 |
| |
| (0.33) | $10.19 | 0.39% | 0.61% | 0.46% | 2.82% | 12% | $140 |
| (0.05) | $10.48 | 1.17% | 0.64% (d) | 0.43% (d) | 3.04% (d) | 14% | $10 |
Columbia AMT-Free Georgia Intermediate Muni Bond Fund | Annual Report 2018
| 17 |
Notes to Financial Statements
April 30, 2018
Note 1. Organization
Columbia AMT-Free Georgia Intermediate Muni Bond Fund (the Fund), a series of Columbia Funds Series Trust (the Trust), is a diversified fund. The Trust is registered under the Investment Company Act of 1940, as amended (the 1940 Act), as an open-end management investment company organized as a Delaware statutory trust.
Fund shares
The Trust may issue an unlimited number of shares (without par value). Although all share classes generally have identical voting, dividend and liquidation rights, each share class votes separately when required by the Trust’s organizational documents or by law. Different share classes pay different distribution amounts to the extent the expenses of such share classes differ, and distributions in liquidation will be proportional to the net asset value of each share class. Each share class has its own expense and sales charge structure. The Fund offers each of the share classes identified below.
Class A shares are subject to a maximum front-end sales charge of 3.00% based on the initial investment amount. Class A shares purchased without an initial sales charge are subject to a contingent deferred sales charge (CDSC) of 0.75% on certain investments of $500,000 or more if redeemed within 12 months after purchase.
Advisor Class shares are not subject to sales charges and are generally available only to omnibus retirement plans and certain investors as described in the Fund’s prospectus. Prior to November 1, 2017, Advisor Class shares were known as Class R4 shares.
Class B shares of the Fund are no longer offered for sale. When available, Class B shares were subject to a maximum CDSC of 3.00% based upon the holding period after purchase. Effective July 17, 2017, Class B shares were automatically converted to Class A shares without a CDSC. On August 4, 2017, the capital owned by Columbia Management Investment Advisers, LLC in Class B shares was redeemed without a CDSC.
Class C shares are subject to a 1.00% CDSC on shares redeemed within 12 months after purchase.
Institutional Class shares are not subject to sales charges and are generally available only to eligible investors, which are subject to different investment minimums as described in the Fund’s prospectus. Prior to November 1, 2017, Institutional Class shares were known as Class Z shares.
Institutional 3 Class shares are not subject to sales charges and are available to institutional and certain other investors as described in the Fund’s prospectus. Prior to November 1, 2017, Institutional 3 Class shares were known as Class Y shares.
Note 2. Summary of significant accounting policies
Basis of preparation
The Fund is an investment company that applies the accounting and reporting guidance in the Financial Accounting Standards Board (FASB) Accounting Standards Codification Topic 946, Financial Services - Investment Companies (ASC 946). The financial statements are prepared in accordance with U.S. generally accepted accounting principles (GAAP), which requires management to make certain estimates and assumptions that affect the reported amounts of assets and liabilities, the disclosure of contingent assets and liabilities at the date of the financial statements and the reported amounts of income and expenses during the reporting period. Actual results could differ from those estimates.
The following is a summary of significant accounting policies followed by the Fund in the preparation of its financial statements.
Security valuation
Debt securities generally are valued by pricing services approved by the Board of Trustees based upon market transactions for normal, institutional-size trading units of similar securities. The services may use various pricing techniques that take into account, as applicable, factors such as yield, quality, coupon rate, maturity, type of issue, trading characteristics and other data, as well as approved independent broker-dealer quotes. Debt securities for which quotations are not readily available or
| 18 | Columbia AMT-Free Georgia Intermediate Muni Bond Fund | Annual Report 2018 |
Notes to Financial Statements (continued)
April 30, 2018
not believed to be reflective of market value may also be valued based upon a bid quote from an approved independent broker-dealer. Debt securities maturing in 60 days or less are valued primarily at amortized cost value, unless this method results in a valuation that management believes does not approximate market value.
Investments for which market quotations are not readily available, or that have quotations which management believes are not reflective of market value or reliable, are valued at fair value as determined in good faith under procedures approved by and under the general supervision of the Board of Trustees. If a security or class of securities (such as foreign securities) is valued at fair value, such value is likely to be different from the quoted or published price for the security.
The determination of fair value often requires significant judgment. To determine fair value, management may use assumptions including but not limited to future cash flows and estimated risk premiums. Multiple inputs from various sources may be used to determine fair value.
GAAP requires disclosure regarding the inputs and valuation techniques used to measure fair value and any changes in valuation inputs or techniques. In addition, investments shall be disclosed by major category. This information is disclosed following the Fund’s Portfolio of Investments.
Security transactions
Security transactions are accounted for on the trade date. Cost is determined and gains (losses) are based upon the specific identification method for both financial statement and federal income tax purposes.
Income recognition
Interest income is recorded on an accrual basis. Market premiums and discounts, including original issue discounts, are amortized and accreted, respectively, over the expected life of the security on all debt securities, unless otherwise noted.
The Fund may place a debt security on non-accrual status and reduce related interest income when it becomes probable that the interest will not be collected and the amount of uncollectible interest can be reasonably estimated. A defaulted debt security is removed from non-accrual status when the issuer resumes interest payments or when collectibility of interest is reasonably assured.
Expenses
General expenses of the Trust are allocated to the Fund and other funds of the Trust based upon relative net assets or other expense allocation methodologies determined by the nature of the expense. Expenses directly attributable to the Fund are charged to the Fund. Expenses directly attributable to a specific class of shares are charged to that share class.
Determination of class net asset value
All income, expenses (other than class-specific expenses, which are charged to that share class, as shown in the Statement of Operations) and realized and unrealized gains (losses) are allocated to each class of the Fund on a daily basis, based on the relative net assets of each class, for purposes of determining the net asset value of each class.
Federal income tax status
The Fund intends to qualify each year as a regulated investment company under Subchapter M of the Internal Revenue Code, as amended, and will distribute substantially all of its net tax-exempt and investment company taxable income and net capital gain, if any, for its tax year, and as such will not be subject to federal income taxes. In addition, the Fund intends to distribute in each calendar year substantially all of its ordinary income, capital gain net income and certain other amounts, if any, such that the Fund should not be subject to federal excise tax. Therefore, no federal income or excise tax provision is recorded.
Distributions to shareholders
Distributions from net investment income, if any, are declared daily and paid monthly. Net realized capital gains, if any, are distributed at least annually. Income distributions and capital gain distributions are determined in accordance with federal income tax regulations, which may differ from GAAP.
Columbia AMT-Free Georgia Intermediate Muni Bond Fund | Annual Report 2018
| 19 |
Notes to Financial Statements (continued)
April 30, 2018
Guarantees and indemnifications
Under the Trust’s organizational documents and, in some cases, by contract, its officers and trustees are indemnified against certain liabilities arising out of the performance of their duties to the Trust or its funds. In addition, certain of the Fund’s contracts with its service providers contain general indemnification clauses. The Fund’s maximum exposure under these arrangements is unknown since the amount of any future claims that may be made against the Fund cannot be determined, and the Fund has no historical basis for predicting the likelihood of any such claims.
Recent accounting pronouncement
Accounting Standards Update 2017-08 Premium Amortization on Purchased Callable Debt Securities
In March 2017, the Financial Accounting Standards Board issued Accounting Standards Update (ASU) No. 2017-08 Premium Amortization on Purchased Callable Debt Securities. ASU No. 2017-08 updates the accounting standards to shorten the amortization period for certain purchased callable debt securities, held at a premium, to be amortized to the earliest call date. The update applies to securities with explicit, noncontingent call features that are callable at fixed prices and on preset dates. The standard is effective for annual periods beginning after December 15, 2018 and interim periods within those fiscal years. At this time, management is evaluating the implication of this guidance and the impact it will have on the financial statement amounts and footnote disclosures, if any.
Note 3. Fees and other transactions with affiliates
Management services fees
The Fund has entered into a Management Agreement with Columbia Management Investment Advisers, LLC (the Investment Manager), a wholly-owned subsidiary of Ameriprise Financial, Inc. (Ameriprise Financial). Under the Management Agreement, the Investment Manager provides the Fund with investment research and advice, as well as administrative and accounting services. The management services fee is an annual fee that is equal to a percentage of the Fund’s daily net assets that declines from 0.47% to 0.31% as the Fund’s net assets increase. The effective management services fee rate for the year ended April 30, 2018 was 0.47% of the Fund’s average daily net assets.
Compensation of board members
Members of the Board of Trustees who are not officers or employees of the Investment Manager or Ameriprise Financial are compensated for their services to the Fund as disclosed in the Statement of Operations. Under a Deferred Compensation Plan (the Plan), these members of the Board of Trustees may elect to defer payment of up to 100% of their compensation. Deferred amounts are treated as though equivalent dollar amounts had been invested in shares of certain funds managed by the Investment Manager. The Fund’s liability for these amounts is adjusted for market value changes and remains in the Fund until distributed in accordance with the Plan. All amounts payable under the Plan constitute a general unsecured obligation of the Fund.
Compensation of Chief Compliance Officer
The Board of Trustees has appointed a Chief Compliance Officer to the Fund in accordance with federal securities regulations. As disclosed in the Statement of Operations, a portion of the Chief Compliance Officer’s total compensation is allocated to the Fund, along with other allocations to affiliated funds governed by the Board of Trustees, based on relative net assets.
Transfer agency fees
Under a Transfer and Dividend Disbursing Agent Agreement, Columbia Management Investment Services Corp. (the Transfer Agent), an affiliate of the Investment Manager and a wholly-owned subsidiary of Ameriprise Financial, is responsible for providing transfer agency services to the Fund. The Transfer Agent has contracted with DST Asset Manager Solutions, Inc. (DST) to serve as sub-transfer agent. The Transfer Agent pays the fees of DST for services as sub-transfer agent and DST is not entitled to reimbursement for such fees from the Fund (with the exception of out-of-pocket fees).
| 20 | Columbia AMT-Free Georgia Intermediate Muni Bond Fund | Annual Report 2018 |
Notes to Financial Statements (continued)
April 30, 2018
The Fund pays the Transfer Agent a monthly transfer agency fee based on the number or the average value of accounts, depending on the type of account. In addition, the Fund pays the Transfer Agent a fee for shareholder services based on the number of accounts or on a percentage of the average aggregate value of the Fund’s shares maintained in omnibus accounts up to the lesser of the amount charged by the financial intermediary or a cap established by the Board of Trustees from time to time.
The Transfer Agent also receives compensation from the Fund for various shareholder services and reimbursements for certain out-of-pocket fees. Effective August 1, 2017, total transfer agency fees for Institutional 3 Class shares are subject to an annual limitation of not more than 0.02% of the average daily net assets attributable to Institutional 3 Class shares. Prior to August 1, 2017, the limitation was 0.025% for Institutional 3 Class shares.
For the year ended April 30, 2018, the Fund’s effective transfer agency fee rates as a percentage of average daily net assets of each class were as follows:
| | Effective rate (%) |
| Class A | 0.14 |
| Advisor Class | 0.14 |
| Class B | 0.04 (a) |
| Class C | 0.14 |
| Institutional Class | 0.14 |
| Institutional 3 Class | 0.02 |
An annual minimum account balance fee of $20 may apply to certain accounts with a value below the applicable share class’s initial minimum investment requirements to reduce the impact of small accounts on transfer agency fees. These minimum account balance fees are remitted to the Fund and recorded as part of expense reductions in the Statement of Operations. For the year ended April 30, 2018, no minimum account balance fees were charged by the Fund.
Distribution and service fees
The Fund has entered into an agreement with Columbia Management Investment Distributors, Inc. (the Distributor), an affiliate of the Investment Manager and a wholly-owned subsidiary of Ameriprise Financial, for distribution and shareholder services. The Board of Trustees has approved, and the Fund has adopted, distribution and shareholder service plans (the Plans) applicable to certain share classes, which set the distribution and service fees for the Fund. These fees are calculated daily and are intended to compensate the Distributor and/or eligible selling and/or servicing agents for selling shares of the Fund and providing services to investors.
Under the Plans, the Fund pays a monthly combined distribution and service fee to the Distributor at the maximum annual rate of 0.25% of the average daily net assets attributable to Class A shares of the Fund. Also under the Plans, the Fund pays a monthly service fee to the Distributor at the maximum annual rate of 0.25% of the average daily net assets attributable to Class B and Class C shares of the Fund and a monthly distribution fee to the Distributor at the maximum annual rate of 0.75% of the average daily net assets attributable to Class B and Class C shares of the Fund. As a result of all Class B shares of the Fund being redeemed or converted to Class A shares, August 4, 2017 was the last day the Fund paid a distribution and service fee for Class B shares.
Sales charges (unaudited)
Sales charges, including front-end charges and CDSCs, received by the Distributor for distributing Fund shares for the year ended April 30, 2018, if any, are listed below:
Columbia AMT-Free Georgia Intermediate Muni Bond Fund | Annual Report 2018
| 21 |
Notes to Financial Statements (continued)
April 30, 2018
Expenses waived/reimbursed by the Investment Manager and its affiliates
The Investment Manager and certain of its affiliates have contractually agreed to waive fees and/or reimburse expenses (excluding certain fees and expenses described below) for the period(s) disclosed below, unless sooner terminated at the sole discretion of the Board of Trustees, so that the Fund’s net operating expenses, after giving effect to fees waived/expenses reimbursed and any balance credits and/or overdraft charges from the Fund’s custodian, do not exceed the following annual rate(s) as a percentage of the class’ average daily net assets:
| | September 1, 2017
through
August 31, 2018 | Prior to
September 1, 2017 |
| Class A | 0.81% | 0.81% |
| Advisor Class | 0.56 | 0.56 |
| Class C | 1.56 | 1.56 |
| Institutional Class | 0.56 | 0.56 |
| Institutional 3 Class | 0.46 | 0.43 |
Under the agreement governing these fee waivers and/or expense reimbursement arrangements, the following fees and expenses are excluded from the waiver/reimbursement commitment, and therefore will be paid by the Fund, if applicable: taxes (including foreign transaction taxes), expenses associated with investments in affiliated and non-affiliated pooled investment vehicles (including mutual funds and exchange-traded funds), transaction costs and brokerage commissions, costs related to any securities lending program, dividend expenses associated with securities sold short, inverse floater program fees and expenses, transaction charges and interest on borrowed money, interest, infrequent and/or unusual expenses and any other expenses the exclusion of which is specifically approved by the Board of Trustees. This agreement may be modified or amended only with approval from the Investment Manager, certain of its affiliates and the Fund. Any fees waived and/or expenses reimbursed under the expense reimbursement arrangements described above are not recoverable by the Investment Manager or its affiliates in future periods.
Note 4. Federal tax information
The timing and character of income and capital gain distributions are determined in accordance with income tax regulations, which may differ from GAAP because of temporary or permanent book to tax differences.
At April 30, 2018, these differences were primarily due to differing treatment for post-October capital losses, trustees’ deferred compensation, distributions and distribution reclassifications. To the extent these differences were permanent, reclassifications were made among the components of the Fund’s net assets in the Statement of Assets and Liabilities. Temporary differences do not require reclassifications.
In the Statement of Assets and Liabilities the following reclassifications were made:
Undistributed net
investment
income ($) | Accumulated
net realized
(loss) ($) | Paid in
capital ($) |
| (19,984) | 19,984 | — |
Net investment income (loss) and net realized gains (losses), as disclosed in the Statement of Operations, and net assets were not affected by this reclassification.
The tax character of distributions paid during the years indicated was as follows:
| Year Ended April 30, 2018 | Year Ended April 30, 2017 |
Ordinary
income ($) | Tax-exempt
income ($) | Long-term
capital gains ($) | Total ($) | Ordinary
income ($) | Tax-exempt
income ($) | Long-term
capital gains ($) | Total ($) |
| — | 1,654,130 | 225,528 | 1,879,658 | — | 2,049,778 | 406,887 | 2,456,665 |
Short-term capital gain distributions, if any, are considered ordinary income distributions for tax purposes.
| 22 | Columbia AMT-Free Georgia Intermediate Muni Bond Fund | Annual Report 2018 |
Notes to Financial Statements (continued)
April 30, 2018
At April 30, 2018, the components of distributable earnings on a tax basis were as follows:
Undistributed
ordinary income ($) | Undistributed tax-
exempt income ($) | Undistributed
long-term
capital gains ($) | Capital loss
carryforwards ($) | Net unrealized
appreciation ($) |
| — | 322,955 | — | — | 782,295 |
At April 30, 2018, the cost of all investments for federal income tax purposes along with the aggregate gross unrealized appreciation and depreciation based on that cost was:
Federal
tax cost ($) | Gross unrealized
appreciation ($) | Gross unrealized
(depreciation) ($) | Net unrealized
appreciation ($) |
| 50,987,282 | 1,241,882 | (459,587) | 782,295 |
Under current tax rules, regulated investment companies can elect to treat certain late-year ordinary losses incurred and post-October capital losses (capital losses realized after October 31) as arising on the first day of the following taxable year. As of April 30, 2018, the Fund will elect to treat the following late-year ordinary losses and post-October capital losses as arising on May 1, 2018.
Late year
ordinary losses ($) | Post-October
capital losses ($) |
| — | 122,005 |
Management of the Fund has concluded that there are no significant uncertain tax positions in the Fund that would require recognition in the financial statements. However, management’s conclusion may be subject to review and adjustment at a later date based on factors including, but not limited to, new tax laws, regulations, and administrative interpretations (including relevant court decisions). Generally, the Fund’s federal tax returns for the prior three fiscal years remain subject to examination by the Internal Revenue Service.
Note 5. Portfolio information
The cost of purchases and proceeds from sales of securities, excluding short-term investments and derivatives, if any, aggregated to $7,526,807 and $22,390,306, respectively, for the year ended April 30, 2018. The amount of purchase and sale activity impacts the portfolio turnover rate reported in the Financial Highlights.
Note 6. Line of credit
The Fund has access to a revolving credit facility with a syndicate of banks led by Citibank, N.A., HSBC Bank USA, N.A. and JPMorgan Chase Bank, N.A. whereby the Fund may borrow for the temporary funding of shareholder redemptions or for other temporary or emergency purposes. The credit facility, which is a collective agreement between the Fund and certain other funds managed by the Investment Manager, severally and not jointly, permits collective borrowings up to $1 billion. Interest is charged to each participating fund based on its borrowings at a rate equal to the higher of (i) the overnight federal funds rate plus 1.00% or (ii) the one-month LIBOR rate plus 1.00%. Each borrowing under the credit facility matures no later than 60 days after the date of borrowing. The Fund also pays a commitment fee equal to its pro rata share of the amount of the credit facility at a rate of 0.15% per annum. The commitment fee is included in other expenses in the Statement of Operations.
The Fund had no borrowings during the year ended April 30, 2018.
Note 7. Significant risks
Credit risk
Credit risk is the risk that the value of debt securities in the Fund’s portfolio may decline because the issuer may default and fail to pay interest or repay principal when due. Rating agencies assign credit ratings to debt securities to indicate their credit risk. Lower rated or unrated debt securities held by the Fund may present increased credit risk as compared to higher-rated debt securities.
Columbia AMT-Free Georgia Intermediate Muni Bond Fund | Annual Report 2018
| 23 |
Notes to Financial Statements (continued)
April 30, 2018
Geographic concentration risk
Because the Fund invests substantially in municipal securities issued by the state identified in the Fund’s name and political sub-divisions of that state, the Fund will be particularly affected by adverse tax, legislative, regulatory, demographic or political changes as well as changes impacting the state’s financial, economic or other condition and prospects. In addition, because of the relatively small number of issuers of tax-exempt securities in the state, the Fund may invest a higher percentage of assets in a single issuer and, therefore, be more exposed to the risk of loss than a fund that invests more broadly. The value of municipal and other securities owned by the Fund also may be adversely affected by future changes in federal or state income tax laws.
Interest rate risk
Interest rate risk is the risk of losses attributable to changes in interest rates. In general, if prevailing interest rates rise, the values of debt securities tend to fall, and if interest rates fall, the values of debt securities tend to rise. Actions by governments and central banking authorities can result in increases in interest rates. Increasing interest rates may negatively affect the value of debt securities held by the Fund, resulting in a negative impact on the Fund’s performance and net asset value per share. In general, the longer the maturity or duration of a debt security, the greater its sensitivity to changes in interest rates.
Liquidity risk
Liquidity risk is the risk associated with a lack of marketability of investments which may make it difficult to sell the investment at a desirable time or price. Changing regulatory, market or other conditions or environments (for example, the interest rate or credit environments) may adversely affect the liquidity of the Fund’s investments. The Fund may have to accept a lower selling price for the holding, sell other investments, or forego another, more appealing investment opportunity. Generally, the less liquid the market at the time the Fund sells a portfolio investment, the greater the risk of loss or decline of value to the Fund. A less liquid market can lead to an increase in Fund redemptions, which may negatively impact Fund performance and net asset value per share, including, for example, if the Fund is forced to sell securities in a down market.
Shareholder concentration risk
At April 30, 2018, one unaffiliated shareholder of record owned 66.7% of the outstanding shares of the Fund in one or more accounts. The Fund has no knowledge about whether any portion of those shares was owned beneficially. Subscription and redemption activity by concentrated accounts may have a significant effect on the operations of the Fund. In the case of a large redemption, the Fund may be forced to sell investments at inopportune times, including its liquid positions, which may result in Fund losses and the Fund holding a higher percentage of less liquid positions. Large redemptions could result in decreased economies of scale and increased operating expenses for non-redeeming Fund shareholders.
Note 8. Subsequent events
Management has evaluated the events and transactions that have occurred through the date the financial statements were issued and noted no items requiring adjustment of the financial statements or additional disclosure.
Note 9. Information regarding pending and settled legal proceedings
Ameriprise Financial and certain of its affiliates have historically been involved in a number of legal, arbitration and regulatory proceedings, including routine litigation, class actions, and governmental actions, concerning matters arising in connection with the conduct of their business activities. Ameriprise Financial believes that the Fund is not currently the subject of, and that neither Ameriprise Financial nor any of its affiliates are the subject of, any pending legal, arbitration or regulatory proceedings that are likely to have a material adverse effect on the Fund or the ability of Ameriprise Financial or its affiliates to perform under their contracts with the Fund. Ameriprise Financial is required to make quarterly (10-Q), annual (10-K) and, as necessary, 8-K filings with the Securities and Exchange Commission (SEC) on legal and regulatory matters that relate to Ameriprise Financial and its affiliates. Copies of these filings may be obtained by accessing the SEC website at www.sec.gov.
There can be no assurance that these matters, or the adverse publicity associated with them, will not result in increased Fund redemptions, reduced sale of Fund shares or other adverse consequences to the Fund. Further, although we believe proceedings are not likely to have a material adverse effect on the Fund or the ability of Ameriprise Financial or its affiliates to
| 24 | Columbia AMT-Free Georgia Intermediate Muni Bond Fund | Annual Report 2018 |
Notes to Financial Statements (continued)
April 30, 2018
perform under their contracts with the Fund, these proceedings are subject to uncertainties and, as such, we are unable to estimate the possible loss or range of loss that may result. An adverse outcome in one or more of these proceedings could result in adverse judgments, settlements, fines, penalties or other relief that could have a material adverse effect on the consolidated financial condition or results of operations of Ameriprise Financial.
Columbia AMT-Free Georgia Intermediate Muni Bond Fund | Annual Report 2018
| 25 |
Report of Independent Registered Public Accounting Firm
To the Board of Trustees of Columbia Funds Series Trust and Shareholders of Columbia AMT-Free Georgia Intermediate Muni Bond Fund
Opinion on the Financial Statements
We have audited the accompanying statement of assets and liabilities, including the portfolio of investments, of Columbia AMT-Free Georgia Intermediate Muni Bond Fund (one of the funds constituting Columbia Funds Series Trust, referred to hereafter as the "Fund") as of April 30, 2018, the related statement of operations for the year ended April 30, 2018, the statement of changes in net assets for each of the two years in the period ended April 30, 2018, including the related notes, and the financial highlights for each of the periods indicated therein (collectively referred to as the “financial statements”). In our opinion, the financial statements present fairly, in all material respects, the financial position of the Fund as of April 30, 2018, the results of its operations for the year then ended, the changes in its net assets for each of the two years in the period ended April 30, 2018 and the financial highlights for each of the periods indicated therein in conformity with accounting principles generally accepted in the United States of America.
Basis for Opinion
These financial statements are the responsibility of the Fund’s management. Our responsibility is to express an opinion on the Fund’s financial statements based on our audits. We are a public accounting firm registered with the Public Company Accounting Oversight Board (United States) (“PCAOB”) and are required to be independent with respect to the Fund in accordance with the U.S. federal securities laws and the applicable rules and regulations of the Securities and Exchange Commission and the PCAOB.
We conducted our audits of these financial statements in accordance with the standards of the PCAOB. Those standards require that we plan and perform the audit to obtain reasonable assurance about whether the financial statements are free of material misstatement, whether due to error or fraud.
Our audits included performing procedures to assess the risks of material misstatement of the financial statements, whether due to error or fraud, and performing procedures that respond to those risks. Such procedures included examining, on a test basis, evidence regarding the amounts and disclosures in the financial statements. Our audits also included evaluating the accounting principles used and significant estimates made by management, as well as evaluating the overall presentation of the financial statements. Our procedures included confirmation of securities owned as of April 30, 2018 by correspondence with the custodian. We believe that our audits provide a reasonable basis for our opinion.
/s/PricewaterhouseCoopers LLP
Minneapolis, Minnesota
June 21, 2018
We have served as auditors of one or more investment companies within the Columbia Funds Complex since 1977.
| 26 | Columbia AMT-Free Georgia Intermediate Muni Bond Fund | Annual Report 2018 |
Federal Income Tax Information
(Unaudited)
The Fund hereby designates the following tax attributes for the fiscal year ended April 30, 2018. Shareholders will be notified in early 2019 of the amounts for use in preparing 2018 income tax returns.
Capital
gain
dividend | Exempt-
interest
dividends |
| $236,804 | 100.00% |
Capital gain dividend. The Fund designates as a capital gain dividend the amount reflected above, or if subsequently determined to be different, the net capital gain of such fiscal period.
Exempt-interest dividends. The percentage of net investment income distributed during the fiscal year that qualifies as exempt-interest dividends for federal income tax purposes.
Columbia AMT-Free Georgia Intermediate Muni Bond Fund | Annual Report 2018
| 27 |
Shareholders elect the Board that oversees the Fund’s operations. The Board appoints officers who are responsible for day-to-day business decisions based on policies set by the Board. The following table provides basic biographical information about the Fund’s Trustees, including their principal occupations during the past five years, although specific titles for individuals may have varied over the period. Under current Board policy, Trustees not affiliated with the Investment Manager generally may serve through the end of the calendar year in which they reach either the mandatory retirement age established by the Board or the fifteenth anniversary of the first Columbia Funds board meeting they attended as a member of the Board.
Independent trustees
Name,
address,
year of birth | Position held
with the Trust and
length of service | Principal occupation(s)
during past five years
and other relevant
professional experience | Number of
Funds in the
Columbia Funds
complex
overseen | Other directorships
held by Trustee
during the past
five years |
George S. Batejan
c/o Columbia Management
Investment Advisers, LLC
225 Franklin Street
Mail Drop BX32 05228
Boston, MA 02110
1953 | Trustee since 1/17 | Executive Vice President, Global Head of Technology and Operations, Janus Capital Group, Inc., 2010-2016 | 125 | Advisory Board Member, University of Colorado Business School since November 2015; former Chairman of the Board, NICSA (National Investment Company Services Association) (Executive Committee, Nominating Committee and Governance Committee), 2014-2016; former Director, Intech Investment Management, 2011- 2016; former Board Member, Metro Denver Chamber of Commerce, 2015-2016 |
Kathleen Blatz
c/o Columbia Management
Investment Advisers, LLC
225 Franklin Street
Mail Drop BX32 05228
Boston, MA 02110
1954 | Trustee since 1/06 for RiverSource Funds and since 6/11 for Nations Funds | Attorney; specializing in arbitration and mediation; Interim President and Chief Executive Officer, Blue Cross and Blue Shield of Minnesota (health care insurance) since February 2018; Chief Justice, Minnesota Supreme Court, 1998-2006; Associate Justice, Minnesota Supreme Court, 1996-1998; Fourth Judicial District Court Judge, Hennepin County, 1994-1996; Attorney in private practice and public service, 1984-1993; State Representative, Minnesota House of Representatives, 1979-1993, which included service on the Tax and Financial Institutions and Insurance Committees; Interim Chair, Minnesota Sports Facilities Authority, March 2017-July 2017 | 125 | Trustee, BlueCross BlueShield of Minnesota since 2009 (Chair of the Business Development Committee, 2014-2017; Chair of the Governance Committee since 2017); Chair of the Robina Foundation since August 2013; former Member of the Board, Minnesota Sports Facilities Authority, January 2017-July 2017 |
Edward J. Boudreau, Jr.
c/o Columbia Management
Investment Advisers, LLC
225 Franklin Street
Mail Drop BX32 05228
Boston, MA 02110
1944 | Chair of the Board since 1/18; Trustee since 6/11 for RiverSource Funds and since 1/05 for Nations Funds | Managing Director, E.J. Boudreau & Associates (consulting) since 2000; FINRA Industry Arbitrator, 2002-present; Chairman and Chief Executive Officer, John Hancock Investments (asset management), Chairman and Interested Trustee for open-end and closed-end funds offered by John Hancock, 1989-2000; John Hancock Mutual Life Insurance Company, including Senior Vice President and Treasurer and Senior Vice President Information Technology, 1968-1988 | 125 | Former Trustee, Boston Museum of Science (Chair of Finance Committee) 1985-2013; former Trustee, BofA Funds Series Trust (11 funds), 2005-2011 |
| 28 | Columbia AMT-Free Georgia Intermediate Muni Bond Fund | Annual Report 2018 |
TRUSTEES AND OFFICERS (continued)
Independent trustees (continued)
Name,
address,
year of birth | Position held
with the Trust and
length of service | Principal occupation(s)
during past five years
and other relevant
professional experience | Number of
Funds in the
Columbia Funds
complex
overseen | Other directorships
held by Trustee
during the past
five years |
Pamela G. Carlton
c/o Columbia Management
Investment Advisers, LLC
225 Franklin Street
Mail Drop BX32 05228
Boston, MA 02110
1954 | Trustee since 7/07 for RiverSource Funds and since 6/11 for Nations Funds | President, Springboard — Partners in Cross Cultural Leadership (consulting company) since 2003; Managing Director of US Equity Research, JP Morgan Chase, 1999-2003; Director of US Equity Research, Chase Asset Management, 1996-1999; Co-Director Latin America Research, 1993-1996, COO Global Research, 1992-1996, Co-Director of US Research, 1991-1992, Investment Banker, Morgan Stanley, 1982-1991 | 125 | Trustee, New York Presbyterian Hospital Board (Executive Committee and Chair of Human Resources Committee) since 1996; Director, Darien Rowayton Bank (Audit Committee) since 2017 |
William P. Carmichael
c/o Columbia Management
Investment Advisers, LLC
225 Franklin Street
Mail Drop BX32 05228
Boston, MA 02110
1943 | Trustee since 6/11 for RiverSource Funds and since 2003 for Nations Funds | Retired; Co-founder, The Succession Fund (provides exit strategies to owners of privately held companies), 1998-2007; Adjunct Professor of Finance, Kelley School of Business, Indiana University, 1993-2007; Senior Vice President, Sara Lee Corporation, 1991-1993; Senior Vice President and Chief Financial Officer, Beatrice Foods Company, 1984-1990; Vice President, Esmark, Inc., 1973-1984; Associate, Price Waterhouse, 1968-1972 | 125 | Director, The Finish Line (athletic shoes and apparel) since July 2003; former Director, Cobra Electronics Corporation (electronic equipment manufacturer), 1994-August 2014; former Director, Spectrum Brands, Inc. (consumer products), 2002-2009; former Director, Simmons Company (bedding), 2004-2010; former Trustee, BofA Funds Series Trust (11 funds) 2003-2011; former Director, McMoRan Exploration Company (oil and gas exploration and development) 2010 - 2013; former Director, International Textile Corp., 2012-2016; former Director, hhgregg, 2015-2017 |
Patricia M. Flynn
c/o Columbia Management
Investment Advisers, LLC
225 Franklin Street
Mail Drop BX32 05228
Boston, MA 02110
1950 | Trustee since 11/04 for RiverSource Funds and since 6/11 for Nations Funds | Trustee Professor of Economics and Management, Bentley University since 1976 (also teaches and conducts research on corporate governance); Dean, McCallum Graduate School of Business, Bentley University, 1992-2002 | 125 | Trustee, MA Taxpayers Foundation since 1997; Board of Directors, The MA Business Roundtable since 2003; Board of Governors, Innovation Institute, MA Technology Collaborative since 2010 |
Brian J. Gallagher
c/o Columbia Management
Investment Advisers, LLC
225 Franklin Street
Mail Drop BX32 05228
Boston, MA 02110
1954 | Trustee since 12/17 | Retired; Partner with Deloitte & Touche LLP and its predecessors, 1977-2016 | 123 | Trustee, Catholic Schools Foundation since 2004 |
Catherine James Paglia
c/o Columbia Management
Investment Advisers, LLC
225 Franklin Street
Mail Drop BX32 05228
Boston, MA 02110
1952 | Trustee since 11/04 for RiverSource Funds and since 6/11 for Nations Funds | Director, Enterprise Asset Management, Inc. (private real estate and asset management company) since September 1998; Managing Director and Partner, Interlaken Capital, Inc., 1989-1997; Managing Director, Morgan Stanley, 1982-1989; Vice President, Investment Banking, 1980-1982, Associate, Investment Banking, 1976-1980, Dean Witter Reynolds, Inc. | 125 | Director, Valmont Industries, Inc. (irrigation systems manufacturer) since 2012; Trustee, Carleton College (on the Investment Committee); Trustee, Carnegie Endowment for International Peace (on the Investment Committee) |
Columbia AMT-Free Georgia Intermediate Muni Bond Fund | Annual Report 2018
| 29 |
TRUSTEES AND OFFICERS (continued)
Independent trustees (continued)
Name,
address,
year of birth | Position held
with the Trust and
length of service | Principal occupation(s)
during past five years
and other relevant
professional experience | Number of
Funds in the
Columbia Funds
complex
overseen | Other directorships
held by Trustee
during the past
five years |
Minor M. Shaw
c/o Columbia Management
Investment Advisers, LLC
225 Franklin Street
Mail Drop BX32 05228
Boston, MA 02110
1947 | Trustee since 6/11 for RiverSource Funds and since 2003 for Nations Funds | President, Micco LLC (private investments) since 2011; President, Micco Corp. (family investment business), 1998-2011 | 125 | Director, BlueCross BlueShield of South Carolina since April 2008; Director, National Association of Corporate Directors, Carolinas Chapter, since 2013; Board Chair, Hollingsworth Funds since 2016; Advisory Board member, Duke Energy Corp. since October 2016; Chair of the Duke Endowment; Chair of Greenville – Spartanburg Airport Commission; former Trustee, BofA Funds Series Trust (11 funds), 2003-2011; former Director, Piedmont Natural Gas, 2004-2016 |
Sandra Yeager
c/o Columbia Management
Investment Advisers, LLC
225 Franklin Street
Mail Drop BX32 05228
Boston, MA 02110
1964 | Trustee since 12/17 | Retired; President and founder, Hanoverian Capital, LLC (SEC registered investment advisor firm), 2008-2016 | 123 | Director, NAPE Education Foundation since October 2016 |
Interested trustee not affiliated with Investment Manager*
Name,
address,
year of birth | Position held
with the Trust and
length of service | Principal occupation(s) during the
past five years and other relevant
professional experience | Number of
Funds in the
Columbia Funds
complex overseen | Other directorships/
held by Trustee
during the past
five years |
Anthony M. Santomero
c/o Columbia Management
Investment Advisers, LLC
225 Franklin Street
Mail Drop BX32 05228
Boston, MA 02110
1946 | Trustee since 6/11 for RiverSource Funds and since 1/08 for Nations Funds | Richard K. Mellon Professor Emeritus of Finance, The Wharton School, University of Pennsylvania, since 2002; Senior Advisor, McKinsey & Company (consulting), 2006-2008; President, Federal Reserve Bank of Philadelphia, 2000-2006, Professor of Finance, The Wharton School, University of Pennsylvania, 1972-2002 | 123 | Trustee, Penn Mutual Life Insurance Company since March 2008; Director, Renaissance Reinsurance Ltd. since May 2008; Director, Citigroup Inc. since 2009; Director, Citibank, N.A. since 2009; former Trustee, BofA Funds Series Trust (11 funds), 2008-2011 |
| * | Dr. Santomero is not an affiliated person of the Investment Manager or Ameriprise Financial. However, he is currently deemed by the Funds to be an “interested person” (as defined in the 1940 Act) of the Funds because he serves as a Director of Citigroup Inc. and Citibank, N.A., companies that may directly or through subsidiaries and affiliates engage from time-to-time in brokerage execution, principal transactions and lending relationships with the Funds or accounts advised/managed by the Investment Manager. |
| 30 | Columbia AMT-Free Georgia Intermediate Muni Bond Fund | Annual Report 2018 |
TRUSTEES AND OFFICERS (continued)
Interested trustee affiliated with Investment Manager*
Name,
address,
year of birth | Position held with the Trusts and length of service | Principal occupation(s) during the
past five years and other relevant
professional experience | Number of
Funds in the
Columbia Funds
complex overseen | Other directorships
held by Trustee
during the past
five years |
William F. Truscott
c/o Columbia Management
Investment Advisers, LLC
225 Franklin St.
Boston, MA 02110
1960 | Trustee since 11/01 for RiverSource Funds and since 6/11 for Nations Funds; Senior Vice President since 2002 for RiverSource Funds and since 5/10 for Nations Funds | Chairman of the Board and President, Columbia Management Investment Advisers, LLC since May 2010 and February 2012, respectively; Chief Executive Officer, Global Asset Management, Ameriprise Financial, Inc. since September 2012 (previously Chief Executive Officer, U.S. Asset Management & President, Annuities, May 2010 - September 2012); Director and Chief Executive Officer, Columbia Management Investment Distributors, Inc. since May 2010 and February 2012, respectively; Chairman of the Board and Chief Executive Officer, RiverSource Distributors, Inc. since 2006; Director, Threadneedle Asset Management Holdings, SARL since 2014; President and Chief Executive Officer, Ameriprise Certificate Company, 2006 - August 2012. | 196 | Chairman of the Board, Columbia Management Investment Advisers, LLC since May 2010; Director, Columbia Management Investment Distributors, Inc. since May 2010; former Director, Ameriprise Certificate Company, 2006-January 2013 |
| * | Interested person (as defined under the 1940 Act) by reason of being an officer, director, security holder and/or employee of the Investment Manager or Ameriprise Financial. |
Nations Funds refer to the Funds within the Columbia Funds Complex that historically bore the Nations brand and includes series of Columbia Funds Series Trust. RiverSource Funds refer to the Funds within the Columbia Funds Complex that historically bore the RiverSource brand and includes series of Columbia Funds Series Trust II.
The Statement of Additional Information has additional information about the Fund’s Board members and is available, without charge, upon request by calling 800.345.6611, visiting columbiathreadneedleus.com/investor/ or contacting your financial intermediary.
Columbia AMT-Free Georgia Intermediate Muni Bond Fund | Annual Report 2018
| 31 |
TRUSTEES AND OFFICERS (continued)
The Board has appointed officers who are responsible for day-to-day business decisions based on policies it has established. The officers serve at the pleasure of the Board. The following table provides basic information about the Officers of the Fund, including principal occupations during the past five years, although their specific titles may have varied over the period. In addition to Mr. Truscott, who is Senior Vice President, the Fund’s other officers are:
Fund officers
Name,
address and
year of birth | Position and year
first appointed to
position for any Fund
in the Columbia
Funds complex or a
predecessor thereof | Principal occupation(s) during past five years |
Christopher O. Petersen
5228 Ameriprise
Financial Center
Minneapolis, MN 55474
Born 1970 | President and Principal Executive Officer (2015) | Vice President and Lead Chief Counsel, Ameriprise Financial, Inc. since January 2015 (previously, Vice President and Chief Counsel, January 2010 - December 2014; officer of Columbia Funds and affiliated funds since 2007. |
Michael G. Clarke
225 Franklin Street
Boston, MA 02110
Born 1969 | Treasurer (2011), Chief Financial Officer (2009) and Chief Accounting Officer (2015) | Vice President — Mutual Fund Administration, Columbia Management Investment Advisers, LLC, since May 2010; senior officer of Columbia Funds and affiliated funds since 2002. |
Paul B. Goucher
100 Park Avenue
New York, NY 10017
Born 1968 | Senior Vice President (2011) and Assistant Secretary (2008) | Senior Vice President and Assistant General Counsel, Ameriprise Financial, Inc. since January 2017 (previously Vice President and Lead Chief Counsel, November 2008 - January 2017 and January 2013 - January 2017, respectively; and Chief Counsel, January 2010 - January 2013); Vice President, Chief Legal Officer and Assistant Secretary, Columbia Management Investment Advisers, LLC since May 2010. |
Thomas P. McGuire
225 Franklin Street
Boston, MA 02110
Born 1972 | Senior Vice President and Chief Compliance Officer (2012) | Vice President — Asset Management Compliance, Ameriprise Financial, Inc., since May 2010; Chief Compliance Officer, Ameriprise Certificate Company since September 2010. |
Colin Moore
225 Franklin Street
Boston, MA 02110
Born 1958 | Senior Vice President (2010) | Executive Vice President and Global Chief Investment Officer, Ameriprise Financial, Inc., since July 2013; Executive Vice President and Global Chief Investment Officer, Columbia Management Investment Advisers, LLC since July 2013 (previously Director and Global Chief Investment Officer, 2010 - 2013). |
Ryan C. Larrenaga
225 Franklin Street
Boston, MA 02110
Born 1970 | Senior Vice President (2017), Chief Legal Officer (2017) and Secretary (2015) | Vice President and Group Counsel, Ameriprise Financial, Inc. since August 2011; officer of Columbia Funds and affiliated funds since 2005. |
Michael E. DeFao
225 Franklin Street
Boston, MA 02110
Born 1968 | Vice President (2011) and Assistant Secretary (2010) | Vice President and Chief Counsel, Ameriprise Financial, Inc. since May 2010. |
Amy Johnson
5228 Ameriprise
Financial Center
Minneapolis, MN 55474
Born 1965 | Vice President (2006) | Managing Director and Global Head of Operations, Columbia Management Investment Advisers, LLC since April 2016 (previously Managing Director and Chief Operating Officer, 2010 - 2016). |
Lyn Kephart-Strong
5228 Ameriprise
Financial Center
Minneapolis, MN 55474
Born 1960 | Vice President (2015) | President, Columbia Management Investment Services Corp. since October 2014; Vice President & Resolution Officer, Ameriprise Trust Company since August 2009. |
| 32 | Columbia AMT-Free Georgia Intermediate Muni Bond Fund | Annual Report 2018 |
The Fund mails one shareholder report to each shareholder address. If you would like more than one report, please call shareholder services at 800.345.6611 and additional reports will be sent to you.
Proxy voting policies and procedures
The policy of the Board of Trustees is to vote the proxies of the companies in which the Fund holds investments consistent with the procedures as stated in the Statement of Additional Information (SAI). You may obtain a copy of the SAI without charge by calling 800.345.6611; contacting your financial intermediary; visiting columbiathreadneedleus.com/investor/; or searching the website of the Securities and Exchange Commission (SEC) at sec.gov. Information regarding how the Fund voted proxies relating to portfolio securities is filed with the SEC by August 31st for the most recent 12-month period ending June 30th of that year, and is available without charge by visiting columbiathreadneedleus.com/investor/, or searching the website of the SEC at sec.gov.
Quarterly schedule of investments
The Fund files a complete schedule of portfolio holdings with the SEC for the first and third quarters of each fiscal year on Form N-Q. The Fund’s Form N-Q is available on the SEC’s website at sec.gov and may be reviewed and copied at the SEC’s Public Reference Room in Washington, D.C. Information on the operation of the Public Reference Room may be obtained by calling 800.SEC.0330. The Fund’s complete schedule of portfolio holdings, as filed on Form N-Q, can also be obtained without charge, upon request, by calling 800.345.6611.
Additional Fund information
For more information about the Fund, please visit columbiathreadneedleus.com/investor/ or call 800.345.6611. Customer Service Representatives are available to answer your questions Monday through Friday from 8 a.m. to 7 p.m. Eastern time.
Fund investment manager
Columbia Management Investment Advisers, LLC
225 Franklin Street
Boston, MA 02110
Fund distributor
Columbia Management Investment Distributors, Inc.
225 Franklin Street
Boston, MA 02110
Fund transfer agent
Columbia Management Investment Services Corp.
P.O. Box 8081
Boston, MA 02266-8081
Columbia AMT-Free Georgia Intermediate Muni Bond Fund | Annual Report 2018
| 33 |
Columbia AMT-Free Georgia Intermediate Muni Bond Fund
P.O. Box 8081
Boston, MA 02266-8081
Please read and consider the investment objectives, risks, charges and expenses for any fund carefully before investing. For a prospectus and summary prospectus, which contains this and other important information about the Fund, go to
columbiathreadneedleus.com/investor/. The Fund is distributed by Columbia Management Investment Distributors, Inc., member FINRA, and managed by Columbia Management Investment Advisers, LLC.
Columbia Threadneedle Investments (Columbia Threadneedle) is the global brand name of the Columbia and Threadneedle group of companies. All rights reserved. Columbia Management Investment Distributors, Inc., 225 Franklin Street, Boston, MA 02110-2804
© 2018 Columbia Management Investment Advisers, LLC.
columbiathreadneedleus .com/investor/
Item 2. Code of Ethics.
| | (a) | The registrant has adopted a code of ethics that applies to the registrant’s principal executive officer, principal financial officer, principal accounting officer or controller, or persons performing similar functions, regardless of whether these individuals are employed by the registrant or a third party. |
| | (b) | During the period covered by this report, there were not any amendments to a provision of the code of ethics adopted in 2(a) above. |
| | (c) | During the period covered by this report, there were no waivers, including any implicit waivers, from a provision of the code of ethics described in 2(a) above that relates to one or more of the items set forth in paragraph (b) of this item’s instructions. |
Item 3. Audit Committee Financial Expert.
The registrant’s Board of Trustees has determined that Pamela G. Carlton, William P. Carmichael, Brian J. Gallagher and Catherine James Paglia, each of whom are members of the registrant’s Board of Trustees and Audit Committee, each qualify as an audit committee financial expert. Ms. Carlton, Mr. Carmichael, Mr. Gallagher and Ms. Paglia are each independent trustees, as defined in paragraph (a)(2) of this item’s instructions.
Item 4. Principal Accountant Fees and Services.
Fee information below is disclosed for the seven series of the registrant whose reports to stockholders are included in this annual filing.
(a) Audit Fees. Aggregate Audit Fees billed by the principal accountant for professional services rendered during the fiscal years ended April 30, 2018 and April 30, 2017 are approximately as follows:
| | | | |
| 2018 | | 2017 | |
$205,000 | | $ | 188,000 | |
Audit Fees include amounts related to the audit of the registrant’s annual financial statements or services that are normally provided by the accountant in connection with statutory and regulatory filings or engagements for those fiscal years.
(b) Audit-Related Fees. Aggregate Audit-Related Fees billed to the registrant by the principal accountant for professional services rendered during the fiscal years ended April 30, 2018 and April 30, 2017 are approximately as follows:
Audit-Related Fees include amounts for assurance and related services by the principal accountant that are reasonably related to the performance of the audit of the registrant’s financial statements and are not reported in Audit Fees above. In fiscal year 2017, Audit-Related Fees consist of agreed-upon procedures performed for semi-annual shareholder reports.
During the fiscal years ended April 30, 2018 and April 30, 2017, there were no Audit-Related Fees billed by the registrant’s principal accountant to the registrant’s investment adviser (not including any sub-adviser whose role is primarily portfolio management and is subcontracted with or overseen by another investment adviser) and any entity controlling, controlled by, or under common control with the adviser that provides ongoing services to the registrant for an engagement that related directly to the operations and financial reporting of the registrant.
(c) Tax Fees. Aggregate Tax Fees billed by the principal accountant to the registrant for professional services rendered during the fiscal years ended April 30, 2018 and April 30, 2017 are approximately as follows:
| | | | |
| 2018 | | 2017 | |
$20,200 | | $ | 25,800 | |
Tax Fees include amounts for the review of annual tax returns, the review of required shareholder distribution calculations and typically include amounts for professional services by the principal accountant for tax compliance, tax advice and tax planning.
During the fiscal years ended April 30, 2018 and April 30, 2017, there were no Tax Fees billed by the registrant’s principal accountant to the registrant’s investment adviser (not including any sub-adviser whose role is primarily portfolio management and is subcontracted with or overseen by another investment adviser) and any entity controlling, controlled by, or under common control with the adviser that provides ongoing services to the registrant for an engagement that related directly to the operations and financial reporting of the registrant.
(d) All Other Fees. Aggregate All Other Fees billed by the principal accountant to the registrant for professional services rendered during the fiscal years ended April 30, 2018 and April 30, 2017 are approximately as follows:
All Other Fees include amounts for products and services provided by the principal accountant, other than the services reported in paragraphs (a) through (c) above.
Aggregate All Other Fees billed by the registrant’s principal accountant to the registrant’s investment adviser (not including any sub-adviser whose role is primarily portfolio management and is subcontracted with or overseen by another investment adviser) and any entity controlling, controlled by, or under common control with the adviser that provides ongoing services to the registrant for an engagement that related directly to the operations and financial reporting of the registrant during the fiscal years ended April 30, 2018 and April 30, 2017 are approximately as follows:
| | | | |
| 2018 | | 2017 | |
$225,000 | | $ | 225,000 | |
In fiscal years 2018 and 2017, All Other Fees primarily consists of fees billed for internal control examinations of the registrant’s transfer agent and investment adviser.
(e)(1) Audit Committee Pre-Approval Policies and Procedures
The registrant’s Audit Committee is required to pre-approve the engagement of the registrant’s independent auditors to provide audit and non-audit services to the registrant and non-audit services to its investment adviser (excluding any sub-adviser whose role is primarily portfolio management and is sub-contracted or overseen by another investment adviser (the “Adviser”) or any entity controlling, controlled by or under common control with the Adviser that provides ongoing services to the Fund (a “Control Affiliate”) if the engagement relates directly to the operations and financial reporting of the registrant.
The Audit Committee has adopted a Policy for Engagement of Independent Auditors for Audit and Non-Audit Services (the “Policy”). The Policy sets forth the understanding of the Audit Committee regarding the engagement of the registrant’s independent accountants to provide (i) audit and permissible audit-related, tax and other services to the registrant (“Fund Services”); (ii) non-audit services to the registrant’s Adviser and any Control Affiliates, that relates directly to the operations and financial reporting of a Fund (“Fund-related Adviser Services”); and (iii) certain other audit and non-audit services to the registrant’s Adviser and its Control Affiliates. A service will require specific pre-approval by the Audit Committee if it is to be provided by the Fund’s independent auditor; provided, however, that pre-approval of non-audit services to the Fund, the Adviser or Control Affiliates may be waived if certain de minimis requirements set forth in the SEC’s rules are met.
Under the Policy, the Audit Committee may delegate pre-approval authority to any pre-designated member or members who are independent board members. The member(s) to whom such authority is delegated must report, for informational purposes only, any pre-approval decisions to the Audit Committee at its next regular meeting. The Audit Committee’s responsibilities with respect to the pre-approval of services performed by the independent auditor may not be delegated to management.
On an annual basis, at a regularly scheduled Audit Committee meeting, the Fund’s Treasurer or other Fund officer shall submit to the Audit Committee a schedule of the types of Fund Services and Fund-related Adviser Services that are subject to specific pre-approval.
This schedule will provide a description of each type of service that is subject to specific pre-approval, along with total projected fees for each service. The pre-approval will generally cover a one-year period. The Audit Committee will review and approve the types of services and the projected fees for the next one-year period and may add to, or subtract from, the list of pre-approved services from time to time, based on subsequent determinations. This specific approval acknowledges that the Audit Committee is in agreement with the specific types of services that the independent auditor will be permitted to perform and the projected fees for each service.
The Fund’s Treasurer or other Fund officer shall report to the Audit Committee at each of its regular meetings regarding all Fund Services or Fund-related Adviser Services provided since the last such report was rendered, including a description of the services, by category, with forecasted fees for the annual reporting period, proposed changes requiring specific pre-approval and a description of services provided by the independent auditor, by category, with actual fees during the current reporting period.
*****
(e)(2) 100% of the services performed for items (b) through (d) above during 2018 and 2017 were pre-approved by the registrant’s Audit Committee.
(f) Not applicable.
(g) The aggregate non-audit fees billed by the registrant’s accountant for services rendered to the registrant, and rendered to the registrant’s investment adviser (not including any sub-adviser whose role is primarily portfolio management and is subcontracted with or overseen by another investment adviser), and any entity controlling, controlled by, or under common control with the adviser that provides ongoing services to the registrant for the fiscal years ended April 30, 2018 and April 30, 2017 are approximately as follows:
| | | | |
| 2018 | | 2017 | |
$245,200 | | $ | 253,600 | |
(h) The registrant’s Audit Committee of the Board of Directors has considered whether the provision of non-audit services that were rendered to the registrant’s adviser (not including any sub-adviser whose role is primarily portfolio management and is subcontracted with or overseen by another investment adviser), and any entity controlling, controlled by, or under common control with the investment adviser that provides ongoing services to the registrant that were not pre-approved pursuant to paragraph (c)(7)(ii) of Rule 2-01 of Regulation S-X, is compatible with maintaining the principal accountant’s independence.
Item 5. Audit Committee of Listed Registrants.
Not applicable.
Item 6. Investments
| | (a) | The registrant’s “Schedule I – Investments in securities of unaffiliated issuers” (as set forth in 17 CFR 210.12-12) is included in Item 1 of this Form N-CSR. |
Item 7. Disclosure of Proxy Voting Policies and Procedures for Closed-End Management Investment Companies.
Not applicable.
Item 8. Portfolio Managers of Closed-End Management Investment Companies.
Not applicable.
Item 9. Purchases of Equity Securities by Closed-End Management Investment Company and Affiliated Purchasers.
Not applicable.
Item 10. Submission of Matters to a Vote of Security Holders.
There were no material changes to the procedures by which shareholders may recommend nominees to the registrant’s board of directors.
Item 11. Controls and Procedures.
| | (a) | The registrant’s principal executive officer and principal financial officer, based on their evaluation of the registrant’s disclosure controls and procedures as of a date within 90 days of the filing of this report, have concluded that such controls and procedures are adequately designed to ensure that material information required to be disclosed by the registrant in Form N-CSR is accumulated and communicated to the registrant’s management, including the principal executive officer and principal financial officer, or persons performing similar functions, as appropriate to allow timely decisions regarding required disclosure. |
| | (b) | There was no change in the registrant’s internal control over financial reporting that occurred during the registrant’s second fiscal quarter of the period covered by this report that has materially affected, or is reasonably likely to materially affect, the registrant’s internal control over financial reporting. |
Item 12. Disclosure of Securities Lending Activities for Closed-End Management Investment Companies
Not applicable.
Item 13. Exhibits.
(a)(1) Code of ethics required to be disclosed under Item 2 of Form N-CSR attached hereto as Exhibit 99.CODE ETH.
(a)(2) Certifications pursuant to Rule 30a-2(a) under the Investment Company Act of 1940 (17 CFR 270.30a-2(a)) attached hereto as Exhibit 99.CERT.
(a)(3) Not applicable.
(b) Certification pursuant to Rule 30a-2(b) under the Investment Company Act of 1940 (17 CFR 270.30a-2(b)) attached hereto as Exhibit 99.906CERT.
SIGNATURES
Pursuant to the requirements of the Securities Exchange Act of 1934 and the Investment Company Act of 1940, the registrant has duly caused this report to be signed on its behalf by the undersigned, thereunto duly authorized.
| | | | |
| (registrant) | | Columbia Funds Series Trust |
| | | | |
| By (Signature and Title) | | /s/ Christopher O. Petersen |
| | Christopher O. Petersen, President and Principal Executive Officer | | |
Pursuant to the requirements of the Securities Exchange Act of 1934 and the Investment Company Act of 1940, this report has been signed below by the following persons on behalf of the registrant and in the capacities and on the dates indicated.
| | | | |
| By (Signature and Title) | | /s/ Christopher O. Petersen |
| | Christopher O. Petersen, President and Principal Executive Officer | | |
| | | | |
| By (Signature and Title) | | /s/ Michael G. Clarke |
| | Michael G. Clarke, Treasurer and Chief Financial Officer | | |