UNITED STATES
SECURITIES AND EXCHANGE COMMISSION
Washington, D.C. 20549
FORM N-CSR
CERTIFIED SHAREHOLDER REPORT OF REGISTERED
MANAGEMENT INVESTMENT COMPANIES
Investment Company Act file number 811-09645
Columbia Funds Series Trust
(Exact name of registrant as specified in charter)
225 Franklin Street
Boston, Massachusetts 02110
(Address of principal executive offices) (Zip code)
Ryan Larrenaga
c/o Columbia Management Investment Advisers, LLC
225 Franklin Street
Boston, MA 02110
(Name and address of agent for service)
Registrant’s telephone number, including area code: (800) 345-6611
Date of fiscal year end: January 31
Date of reporting period: January 31, 2018
Form N-CSR is to be used by management investment companies to file reports with the Commission not later than 10 days after the transmission to stockholders of any report that is required to be transmitted to stockholders under Rule 30e-1 under the Investment Company Act of 1940 (17 CFR 270.30e-1). The Commission may use the information provided on Form N-CSR in its regulatory, disclosure review, inspection, and policymaking roles.
A registrant is required to disclose the information specified by Form N-CSR, and the Commission will make this information public. A registrant is not required to respond to the collection of information contained in Form N-CSR unless the Form displays a currently valid Office of Management and Budget (“OMB”) control number. Please direct comments concerning the accuracy of the information collection burden estimate and any suggestions for reducing the burden to Secretary, Securities and Exchange Commission, 450 Fifth Street, NW, Washington, DC 20549-0609. The OMB has reviewed this collection of information under the clearance requirements of 44 U.S.C. § 3507.
Item 1. Reports to Stockholders.

Annual Report
January 31, 2018
Columbia Capital Allocation Portfolios
Columbia Capital Allocation Conservative Portfolio
Columbia Capital Allocation Moderate Conservative Portfolio
Columbia Capital Allocation Moderate Portfolio
Columbia Capital Allocation Moderate Aggressive Portfolio
Columbia Capital Allocation Aggressive Portfolio
Not FDIC Insured • No bank guarantee • May lose value
Dear Shareholders,
The current outlook for financial markets is clouded by two primary concerns: the high valuation of equities and the direction of interest rates. Following the U.S. presidential election, U.S. equities rallied based on the assumption that the new administration’s policies would stimulate growth quickly. Unfortunately it’s unclear whether those measures will get passed, much less passed quickly. In fixed income, uncertainty stems from the possibility that interest rates won’t rise as rapidly as expected if the administration’s proposed growth policies are not implemented.
Given this uncertainty, investors value a consistent approach more than ever. Investors want strong, repeatable risk-adjusted returns. Consistency — not surprises. As a leading global asset manager, we believe our consistent, collaborative investment approach enables us to deliver the dependable experience your portfolio demands. So, how do we strive to deliver a consistent investment experience?
Better insights
Your portfolio benefits from the investment insights uncovered by our talented investment teams around the world.
Better decisions
Our collaborative, interactive environment enables our investment teams to construct portfolios that take advantage of the best investment ideas.
Better outcomes
We aim to deliver a consistent experience, which means fewer surprises, dependable insights, and products designed to do the thing you want.
Whether you’re trying to save money to help your children go to college or for your own retirement, it’s the consistency of the return that is most essential. People who chase higher returns are usually also the first to sell when that investment goes through a bad patch. We try to combat this behavioral tendency by offering strategies that aim for a more consistent return. Our goal is for investors to panic less during periods of volatility, which can have a significant effect on their long-term results.
Nothing is more important to us than making sure those who have entrusted us to protect and grow their assets can do what matters most to them: build a nest egg, leave a legacy, and live confidently — now and throughout retirement. It’s why our talented professionals around the world work together to uncover uncommon opportunities and why our process encourages challenge and debate around our most compelling ideas to ensure better informed investment decisions, which hopefully lead to better outcomes for you.
Your success is our priority. Talk to your financial advisor about how working with Columbia Threadneedle Investments may help you position your portfolio for consistent, sustainable outcomes, no matter the market conditions.
Sincerely,
Christopher O. Petersen
President, Columbia Funds
Investors should consider the investment objectives, risks, charges and expenses of a mutual fund carefully before investing. For a free prospectus and summary prospectus, which contains this and other important information about a fund, visit investor.columbiathreadneedleus.com. The prospectus should be read carefully before investing.
Columbia Funds are distributed by Columbia Management Investment Distributors, Inc., member FINRA, and managed by Columbia Management Investment Advisers, LLC.
© 2018 Columbia Management Investment Advisers, LLC. All rights reserved.
Columbia Capital Allocation Portfolios | Annual Report 2018
| 2 |
| 4 |
| 6 |
| 8 |
| 10 |
| 12 |
| 15 |
| 18 |
| 89 |
| 93 |
| 97 |
| 106 |
| 126 |
| 150 |
| 152 |
| 153 |
| 158 |
Columbia Capital Allocation Portfolios | Annual Report 2018
Fund at a Glance
Columbia Capital Allocation Conservative Portfolio
Investment objective
Columbia Capital Allocation Conservative Portfolio (the Fund) is designed for investors seeking the highest level of total return that is consistent with a conservative level of risk.
Portfolio management
Jeffrey Knight, CFA
Co-Portfolio Manager
Managed Fund since 2013
Anwiti Bahuguna, Ph.D.
Co-Portfolio Manager
Managed Fund since 2010
Joshua Kutin, CFA
Co-Portfolio Manager
Managed Fund since January 2017
Dan Boncarosky, CFA
Co-Portfolio Manager
Managed Fund since January 2017
| Average annual total returns (%) (for the period ended January 31, 2018) |
| | | Inception | 1 Year | 5 Years | 10 Years |
| Class A | Excluding sales charges | 03/04/04 | 7.90 | 3.99 | 4.30 |
| | Including sales charges | | 2.78 | 2.98 | 3.79 |
| Advisor Class* | 06/13/13 | 8.11 | 4.20 | 4.40 |
| Class C | Excluding sales charges | 03/04/04 | 7.14 | 3.21 | 3.53 |
| | Including sales charges | | 6.14 | 3.21 | 3.53 |
| Institutional Class* | 09/27/10 | 8.06 | 4.22 | 4.48 |
| Institutional 2 Class* | 06/13/13 | 8.15 | 4.27 | 4.44 |
| Institutional 3 Class* | 06/13/13 | 8.22 | 4.32 | 4.46 |
| Class K | 03/04/04 | 7.92 | 4.07 | 4.42 |
| Class R* | 09/27/10 | 7.53 | 3.71 | 4.06 |
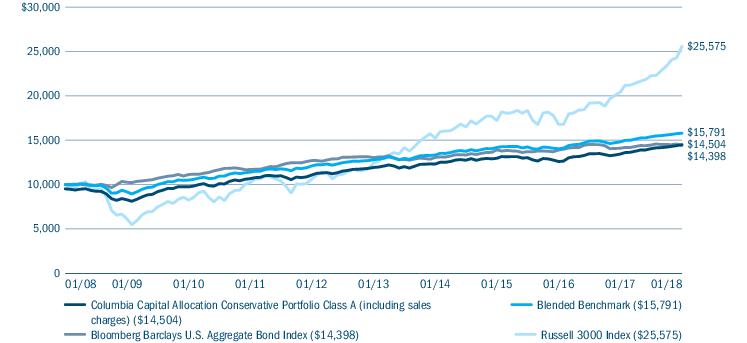
| Blended Benchmark | | 6.61 | 4.29 | 4.67 |
| Bloomberg Barclays U.S. Aggregate Bond Index | | 2.15 | 2.01 | 3.71 |
| Russell 3000 Index | | 25.16 | 15.53 | 9.85 |
Returns for Class A are shown with and without the maximum initial sales charge of 4.75%. Returns for Class C are shown with and without the 1.00% contingent deferred sales charge for the first year only. The Fund’s other classes are not subject to sales charges and have limited eligibility. Effective November 1, 2017, Class R4, Class R5, Class Y and Class Z shares were renamed Advisor Class, Institutional 2 Class, Institutional 3 Class and Institutional Class shares, respectively. Please see the Fund’s prospectus for details. Performance for different share classes will vary based on differences in sales charges and fees associated with each class. All results shown assume reinvestment of distributions during the period. Returns do not reflect the deduction of taxes that a shareholder may pay on Fund distributions or on the redemption of Fund shares. Performance results reflect the effect of any fee waivers or reimbursements of Fund expenses by Columbia Management Investment Advisers, LLC and/or any of its affiliates. Absent these fee waivers or expense reimbursement arrangements, performance results would have been lower.
The performance information shown represents past performance and is not a guarantee of future results. The investment return and principal value of your investment will fluctuate so that your shares, when redeemed, may be worth more or less than their original cost. Current performance may be lower or higher than the performance information shown. You may obtain performance information current to the most recent month-end by contacting your financial intermediary, visiting investor.columbiathreadneedleus.com or calling 800.345.6611.
| * | The returns shown for periods prior to the share class inception date (including returns for the Life of the Fund, if shown, which are since Fund inception) include the returns of the Fund’s oldest share class. Since the Fund launched more than one share class at its inception, Class A shares were used. These returns are adjusted to reflect any higher class-related operating expenses of the newer share classes, as applicable. Please visit investor.columbiathreadneedleus.com/investment-products/mutual-funds/appended-performance for more information. |
The Blended Benchmark consists of 66% Bloomberg Barclays U.S. Aggregate Bond Index, 15% Russell 3000 Index, 10% FTSE Three-Month U.S. Treasury Bill Index, 5% MSCI EAFE Index (Net) and 4% Bloomberg Barclays U.S. Corporate High-Yield Index. The FTSE Three-Month U.S. Treasury Bill Index, an unmanaged index, is representative of the performance of three-month Treasury bills. The MSCI EAFE Index (Net) is a free float-adjusted market capitalization index that is designed to measure the equity market performance of developed markets, excluding the U.S. and Canada. The Bloomberg Barclays U.S. Corporate High-Yield Index is a market value-weighted index, which covers the U.S. non-investment-grade fixed-rate debt market.
The Bloomberg Barclays U.S. Aggregate Bond Index is a broad-based benchmark that measures the investment-grade, U.S. dollar-denominated, fixed-rate taxable bond market, including Treasuries, government-related and corporate securities, mortgage-backed securities (agency fixed-rate and hybrid adjustable-rate mortgage passthroughs), asset-backed securities, and commercial mortgage-backed securities.
The Russell 3000 Index, an unmanaged index, measures the performance of the 3,000 largest U.S. companies based on total market capitalization, which represents approximately 98% of the investable U.S. equity market.
Indices are not available for investment, are not professionally managed and do not reflect sales charges, fees, brokerage commissions, taxes (except the MSCI EAFE Index (Net), which reflects reinvested dividends net of withholding taxes) or other expenses of investing. Securities in the Fund may not match those in an index.
| 2 | Columbia Capital Allocation Portfolios | Annual Report 2018 |
Fund at a Glance (continued)
Columbia Capital Allocation Conservative Portfolio
Performance of a hypothetical $10,000 investment (January 31, 2008 — January 31, 2018)
The chart above shows the change in value of a hypothetical $10,000 investment in Class A shares of Columbia Capital Allocation Conservative Portfolio during the stated time period, and does not reflect the deduction of taxes that a shareholder may pay on Fund distributions or on the redemption of Fund shares.
| Portfolio breakdown (%) (at January 31, 2018) |
| Alternative Strategies Funds | 7.9 |
| Common Stocks | 4.0 |
| Equity Funds | 18.7 |
| Fixed-Income Funds | 58.2 |
| Money Market Funds | 11.1 |
| Preferred Stocks | 0.1 |
| Rights | 0.0 (a) |
| Total | 100.0 |
Percentages indicated are based upon total investments. The Fund’s portfolio composition is subject to change.
Columbia Capital Allocation Portfolios | Annual Report 2018
| 3 |
Fund at a Glance
Columbia Capital Allocation Moderate Conservative Portfolio
Investment objective
Columbia Capital Allocation Moderate Conservative Portfolio (the Fund) is designed for investors seeking the highest level of total return that is consistent with a moderate conservative level of risk.
Portfolio management
Jeffrey Knight, CFA
Co-Portfolio Manager
Managed Fund since 2013
Anwiti Bahuguna, Ph.D.
Co-Portfolio Manager
Managed Fund since 2009
Joshua Kutin, CFA
Co-Portfolio Manager
Managed Fund since January 2017
Dan Boncarosky, CFA
Co-Portfolio Manager
Managed Fund since January 2017
| Average annual total returns (%) (for the period ended January 31, 2018) |
| | | Inception | 1 Year | 5 Years | 10 Years |
| Class A | Excluding sales charges | 10/15/96 | 11.79 | 5.86 | 5.75 |
| | Including sales charges | | 5.34 | 4.62 | 5.13 |
| Advisor Class* | 11/08/12 | 12.07 | 6.14 | 5.89 |
| Class C | Excluding sales charges | 10/15/96 | 10.92 | 5.06 | 4.96 |
| | Including sales charges | | 9.92 | 5.06 | 4.96 |
| Institutional Class | 10/15/96 | 12.03 | 6.12 | 6.01 |
| Institutional 2 Class* | 11/08/12 | 12.12 | 6.20 | 5.93 |
| Institutional 3 Class* | 06/13/13 | 12.12 | 6.24 | 5.94 |
| Class K* | 02/28/13 | 11.82 | 5.94 | 5.79 |
| Class R | 01/23/06 | 11.50 | 5.59 | 5.49 |
| Blended Benchmark | | 10.11 | 6.12 | 5.62 |
| Bloomberg Barclays U.S. Aggregate Bond Index | | 2.15 | 2.01 | 3.71 |
| Russell 3000 Index | | 25.16 | 15.53 | 9.85 |
Returns for Class A are shown with and without the maximum initial sales charge of 5.75%. Returns for Class C are shown with and without the 1.00% contingent deferred sales charge for the first year only. The Fund’s other classes are not subject to sales charges and have limited eligibility. Effective November 1, 2017, Class R4, Class R5, Class Y and Class Z shares were renamed Advisor Class, Institutional 2 Class, Institutional 3 Class and Institutional Class shares, respectively. Please see the Fund’s prospectus for details. Performance for different share classes will vary based on differences in sales charges and fees associated with each class. All results shown assume reinvestment of distributions during the period. Returns do not reflect the deduction of taxes that a shareholder may pay on Fund distributions or on the redemption of Fund shares. Performance results reflect the effect of any fee waivers or reimbursements of Fund expenses by Columbia Management Investment Advisers, LLC and/or any of its affiliates. Absent these fee waivers or expense reimbursement arrangements, performance results would have been lower.
The performance information shown represents past performance and is not a guarantee of future results. The investment return and principal value of your investment will fluctuate so that your shares, when redeemed, may be worth more or less than their original cost. Current performance may be lower or higher than the performance information shown. You may obtain performance information current to the most recent month-end by contacting your financial intermediary, visiting investor.columbiathreadneedleus.com or calling 800.345.6611.
| * | The returns shown for periods prior to the share class inception date (including returns for the Life of the Fund, if shown, which are since Fund inception) include the returns of the Fund’s oldest share class. Since the Fund launched more than one share class at its inception, Class A shares were used. These returns are adjusted to reflect any higher class-related operating expenses of the newer share classes, as applicable. Please visit investor.columbiathreadneedleus.com/investment-products/mutual-funds/appended-performance for more information. |
The Blended Benchmark consists of 55.5% Bloomberg Barclays U.S. Aggregate Bond Index, 26% Russell 3000 Index, 9% MSCI EAFE Index (Net), 5% FTSE Three-Month U.S. Treasury Bill Index and 4.5% Bloomberg Barclays U.S. Corporate High-Yield Index. The MSCI EAFE Index (Net) is a free float-adjusted market capitalization index that is designed to measure the equity market performance of developed markets, excluding the U.S. and Canada. The FTSE Three-Month U.S. Treasury Bill Index, an unmanaged index, is representative of the performance of three-month Treasury bills. The Bloomberg Barclays U.S. Corporate High-Yield Index is a market value-weighted index, which covers the U.S. non-investment-grade fixed-rate debt market.
The Bloomberg Barclays U.S. Aggregate Bond Index is a broad-based benchmark that measures the investment-grade, U.S. dollar-denominated, fixed-rate taxable bond market, including Treasuries, government-related and corporate securities, mortgage-backed securities (agency fixed-rate and hybrid adjustable-rate mortgage passthroughs), asset-backed securities, and commercial mortgage-backed securities.
The Russell 3000 Index, an unmanaged index, measures the performance of the 3,000 largest U.S. companies based on total market capitalization, which represents approximately 98% of the investable U.S. equity market.
Indices are not available for investment, are not professionally managed and do not reflect sales charges, fees, brokerage commissions, taxes (except the MSCI EAFE Index (Net), which reflects reinvested dividends net of withholding taxes) or other expenses of investing. Securities in the Fund may not match those in an index.
| 4 | Columbia Capital Allocation Portfolios | Annual Report 2018 |
Fund at a Glance (continued)
Columbia Capital Allocation Moderate Conservative Portfolio
Performance of a hypothetical $10,000 investment (January 31, 2008 — January 31, 2018)
The chart above shows the change in value of a hypothetical $10,000 investment in Class A shares of Columbia Capital Allocation Moderate Conservative Portfolio during the stated time period, and does not reflect the deduction of taxes that a shareholder may pay on Fund distributions or on the redemption of Fund shares.
| Portfolio breakdown (%) (at January 31, 2018) |
| Alternative Strategies Funds | 7.0 |
| Common Stocks | 2.7 |
| Equity Funds | 33.0 |
| Fixed-Income Funds | 47.4 |
| Money Market Funds | 9.9 |
| Preferred Stocks | 0.0 (a) |
| Rights | 0.0 (a) |
| Total | 100.0 |
Percentages indicated are based upon total investments. The Fund’s portfolio composition is subject to change.
Columbia Capital Allocation Portfolios | Annual Report 2018
| 5 |
Fund at a Glance
Columbia Capital Allocation Moderate Portfolio
Investment objective
Columbia Capital Allocation Moderate Portfolio (the Fund) is designed for investors seeking the highest level of total return that is consistent with a moderate level of risk.
Portfolio management
Jeffrey Knight, CFA
Co-Portfolio Manager
Managed Fund since 2013
Anwiti Bahuguna, Ph.D.
Co-Portfolio Manager
Managed Fund since 2010
Joshua Kutin, CFA
Co-Portfolio Manager
Managed Fund since January 2017
Dan Boncarosky, CFA
Co-Portfolio Manager
Managed Fund since January 2017
| Average annual total returns (%) (for the period ended January 31, 2018) |
| | | Inception | 1 Year | 5 Years | 10 Years |
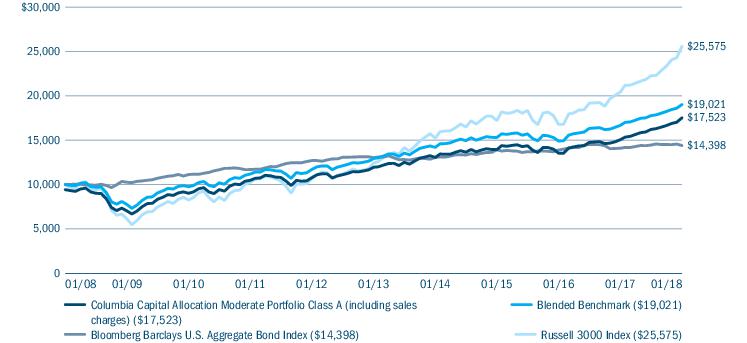
| Class A | Excluding sales charges | 03/04/04 | 16.39 | 7.95 | 6.40 |
| | Including sales charges | | 9.70 | 6.68 | 5.77 |
| Advisor Class* | 06/13/13 | 16.68 | 8.21 | 6.53 |
| Class C | Excluding sales charges | 03/04/04 | 15.46 | 7.16 | 5.61 |
| | Including sales charges | | 14.46 | 7.16 | 5.61 |
| Institutional Class* | 09/27/10 | 16.60 | 8.23 | 6.59 |
| Institutional 2 Class* | 06/13/13 | 16.62 | 8.27 | 6.56 |
| Institutional 3 Class* | 06/13/13 | 16.68 | 8.34 | 6.59 |
| Class K | 03/04/04 | 16.35 | 8.02 | 6.52 |
| Class R* | 09/27/10 | 16.05 | 7.68 | 6.13 |
| Blended Benchmark | | 14.06 | 8.01 | 6.64 |
| Russell 3000 Index | | 25.16 | 15.53 | 9.85 |
| Bloomberg Barclays U.S. Aggregate Bond Index | | 2.15 | 2.01 | 3.71 |
Returns for Class A are shown with and without the maximum initial sales charge of 5.75%. Returns for Class C are shown with and without the 1.00% contingent deferred sales charge for the first year only. The Fund’s other classes are not subject to sales charges and have limited eligibility. Effective November 1, 2017, Class R4, Class R5, Class Y and Class Z shares were renamed Advisor Class, Institutional 2 Class, Institutional 3 Class and Institutional Class shares, respectively. Please see the Fund’s prospectus for details. Performance for different share classes will vary based on differences in sales charges and fees associated with each class. All results shown assume reinvestment of distributions during the period. Returns do not reflect the deduction of taxes that a shareholder may pay on Fund distributions or on the redemption of Fund shares. Performance results reflect the effect of any fee waivers or reimbursements of Fund expenses by Columbia Management Investment Advisers, LLC and/or any of its affiliates. Absent these fee waivers or expense reimbursement arrangements, performance results would have been lower.
The performance information shown represents past performance and is not a guarantee of future results. The investment return and principal value of your investment will fluctuate so that your shares, when redeemed, may be worth more or less than their original cost. Current performance may be lower or higher than the performance information shown. You may obtain performance information current to the most recent month-end by contacting your financial intermediary, visiting investor.columbiathreadneedleus.com or calling 800.345.6611.
| * | The returns shown for periods prior to the share class inception date (including returns for the Life of the Fund, if shown, which are since Fund inception) include the returns of the Fund’s oldest share class. Since the Fund launched more than one share class at its inception, Class A shares were used. These returns are adjusted to reflect any higher class-related operating expenses of the newer share classes, as applicable. Please visit investor.columbiathreadneedleus.com/investment-products/mutual-funds/appended-performance for more information. |
The Blended Benchmark consists of 42.5% Bloomberg Barclays U.S. Aggregate Bond Index, 37% Russell 3000 Index, 11% MSCI EAFE Index (Net), 7.5% Bloomberg Barclays U.S. Corporate High-Yield Index and 2% MSCI Emerging Markets Index (Net). The MSCI EAFE Index (Net) is a free float-adjusted market capitalization index that is designed to measure the equity market performance of developed markets, excluding the U.S. and Canada. The Bloomberg Barclays U.S. Corporate High-Yield Index is a market value-weighted index, which covers the U.S. non-investment-grade fixed-rate debt market. The MSCI Emerging Markets Index (Net) is a free float-adjusted market capitalization index that is designed to measure equity market performance of emerging markets.
The Russell 3000 Index, an unmanaged index, measures the performance of the 3,000 largest U.S. companies based on total market capitalization, which represents approximately 98% of the investable U.S. equity market.
The Bloomberg Barclays U.S. Aggregate Bond Index is a broad-based benchmark that measures the investment-grade, U.S. dollar-denominated, fixed-rate taxable bond market, including Treasuries, government-related and corporate securities, mortgage-backed securities (agency fixed-rate and hybrid adjustable-rate mortgage passthroughs), asset-backed securities, and commercial mortgage-backed securities.
Indices are not available for investment, are not professionally managed and do not reflect sales charges, fees, brokerage commissions, taxes (except the MSCI EAFE Index (Net) and the MSCI Emerging Markets Index (Net), which reflect reinvested dividends net of withholding taxes) or other expenses of investing. Securities in the Fund may not match those in an index.
| 6 | Columbia Capital Allocation Portfolios | Annual Report 2018 |
Fund at a Glance (continued)
Columbia Capital Allocation Moderate Portfolio
Performance of a hypothetical $10,000 investment (January 31, 2008 — January 31, 2018)
The chart above shows the change in value of a hypothetical $10,000 investment in Class A shares of Columbia Capital Allocation Moderate Portfolio during the stated time period, and does not reflect the deduction of taxes that a shareholder may pay on Fund distributions or on the redemption of Fund shares.
| Portfolio breakdown (%) (at January 31, 2018) |
| Alternative Strategies Funds | 6.4 |
| Common Stocks | 2.2 |
| Equity Funds | 44.5 |
| Fixed-Income Funds | 40.1 |
| Money Market Funds | 6.8 |
| Rights | 0.0 (a) |
| Total | 100.0 |
Percentages indicated are based upon total investments. The Fund’s portfolio composition is subject to change.
Columbia Capital Allocation Portfolios | Annual Report 2018
| 7 |
Fund at a Glance
Columbia Capital Allocation Moderate Aggressive Portfolio
Investment objective
Columbia Capital Allocation Moderate Aggressive Portfolio (the Fund) is designed for investors seeking the highest level of total return that is consistent with a moderate aggressive level of risk.
Portfolio management
Jeffrey Knight, CFA
Co-Portfolio Manager
Managed Fund since 2013
Anwiti Bahuguna, Ph.D.
Co-Portfolio Manager
Managed Fund since 2009
Joshua Kutin, CFA
Co-Portfolio Manager
Managed Fund since January 2017
Dan Boncarosky, CFA
Co-Portfolio Manager
Managed Fund since January 2017
| Average annual total returns (%) (for the period ended January 31, 2018) |
| | | Inception | 1 Year | 5 Years | 10 Years |
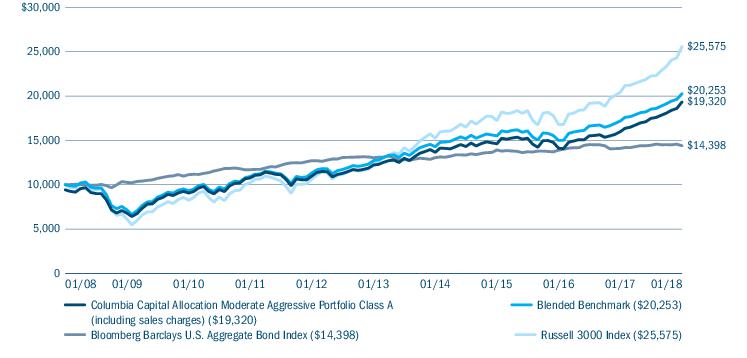
| Class A | Excluding sales charges | 10/15/96 | 20.88 | 9.58 | 7.45 |
| | Including sales charges | | 13.95 | 8.30 | 6.81 |
| Advisor Class* | 11/08/12 | 21.09 | 9.87 | 7.59 |
| Class C | Excluding sales charges | 10/15/96 | 19.91 | 8.75 | 6.63 |
| | Including sales charges | | 18.91 | 8.75 | 6.63 |
| Institutional Class | 10/15/96 | 21.13 | 9.84 | 7.70 |
| Institutional 2 Class* | 11/08/12 | 21.18 | 9.96 | 7.64 |
| Institutional 3 Class* | 06/13/13 | 21.26 | 9.98 | 7.64 |
| Class K* | 02/28/13 | 21.00 | 9.69 | 7.50 |
| Class R | 01/23/06 | 20.51 | 9.30 | 7.18 |
| Class V* | Excluding sales charges | 03/07/11 | 20.88 | 9.56 | 7.41 |
| | Including sales charges | | 13.95 | 8.28 | 6.77 |
| Blended Benchmark | | 17.84 | 9.74 | 7.31 |
| Bloomberg Barclays U.S. Aggregate Bond Index | | 2.15 | 2.01 | 3.71 |
| Russell 3000 Index | | 25.16 | 15.53 | 9.85 |
Returns for Class A and Class V are shown with and without the maximum initial sales charge of 5.75%. Returns for Class C are shown with and without the 1.00% contingent deferred sales charge for the first year only. The Fund’s other classes are not subject to sales charges and have limited eligibility. Effective November 1, 2017, Class R4, Class R5, Class Y and Class Z shares were renamed Advisor Class, Institutional 2 Class, Institutional 3 Class and Institutional Class shares, respectively. Please see the Fund’s prospectus for details. Performance for different share classes will vary based on differences in sales charges and fees associated with each class. All results shown assume reinvestment of distributions during the period. Returns do not reflect the deduction of taxes that a shareholder may pay on Fund distributions or on the redemption of Fund shares. Performance results reflect the effect of any fee waivers or reimbursements of Fund expenses by Columbia Management Investment Advisers, LLC and/or any of its affiliates. Absent these fee waivers or expense reimbursement arrangements, performance results would have been lower.
The performance information shown represents past performance and is not a guarantee of future results. The investment return and principal value of your investment will fluctuate so that your shares, when redeemed, may be worth more or less than their original cost. Current performance may be lower or higher than the performance information shown. You may obtain performance information current to the most recent month-end by contacting your financial intermediary, visiting investor.columbiathreadneedleus.com or calling 800.345.6611.
| * | The returns shown for periods prior to the share class inception date (including returns for the Life of the Fund, if shown, which are since Fund inception) include the returns of the Fund’s oldest share class. Since the Fund launched more than one share class at its inception, Class A shares were used. These returns are adjusted to reflect any higher class-related operating expenses of the newer share classes, as applicable. Please visit investor.columbiathreadneedleus.com/investment-products/mutual-funds/appended-performance for more information. |
The Blended Benchmark consists of 49% Russell 3000 Index, 28.5% Bloomberg Barclays U.S. Aggregate Bond Index, 12% MSCI EAFE Index (Net), 6.5% Bloomberg Barclays U.S. Corporate High-Yield Index and 4% MSCI Emerging Markets Index (Net). The MSCI EAFE Index (Net) is a free float-adjusted market capitalization index that is designed to measure the equity market performance of developed markets, excluding the U.S. and Canada. The Bloomberg Barclays U.S. Corporate High-Yield Index is a market value-weighted index, which covers the U.S. non-investment-grade fixed-rate debt market. The MSCI Emerging Markets Index (Net) is a free float-adjusted market capitalization index that is designed to measure equity market performance of emerging markets.
The Bloomberg Barclays U.S. Aggregate Bond Index is a broad-based benchmark that measures the investment-grade, U.S. dollar-denominated, fixed-rate taxable bond market, including Treasuries, government-related and corporate securities, mortgage-backed securities (agency fixed-rate and hybrid adjustable-rate mortgage passthroughs), asset-backed securities, and commercial mortgage-backed securities.
The Russell 3000 Index, an unmanaged index, measures the performance of the 3,000 largest U.S. companies based on total market capitalization, which represents approximately 98% of the investable U.S. equity market.
| 8 | Columbia Capital Allocation Portfolios | Annual Report 2018 |
Fund at a Glance (continued)
Columbia Capital Allocation Moderate Aggressive Portfolio
Indices are not available for investment, are not professionally managed and do not reflect sales charges, fees, brokerage commissions, taxes (except the MSCI EAFE Index (Net) and the MSCI Emerging Markets Index (Net), which reflect reinvested dividends net of withholding taxes) or other expenses of investing. Securities in the Fund may not match those in an index.
Performance of a hypothetical $10,000 investment (January 31, 2008 — January 31, 2018)
The chart above shows the change in value of a hypothetical $10,000 investment in Class A shares of Columbia Capital Allocation Moderate Aggressive Portfolio during the stated time period, and does not reflect the deduction of taxes that a shareholder may pay on Fund distributions or on the redemption of Fund shares.
| Portfolio breakdown (%) (at January 31, 2018) |
| Alternative Strategies Funds | 6.3 |
| Common Stocks | 1.6 |
| Equity Funds | 56.6 |
| Fixed-Income Funds | 22.8 |
| Money Market Funds | 12.7 |
| Rights | 0.0 (a) |
| Total | 100.0 |
Percentages indicated are based upon total investments. The Fund’s portfolio composition is subject to change.
Columbia Capital Allocation Portfolios | Annual Report 2018
| 9 |
Fund at a Glance
Columbia Capital Allocation Aggressive Portfolio
Investment objective
Columbia Capital Allocation Aggressive Portfolio (the Fund) is designed for investors seeking the highest level of total return that is consistent with an aggressive level of risk.
Portfolio management
Jeffrey Knight, CFA
Co-Portfolio Manager
Managed Fund since 2013
Anwiti Bahuguna, Ph.D.
Co-Portfolio Manager
Managed Fund since 2010
Joshua Kutin, CFA
Co-Portfolio Manager
Managed Fund since January 2017
Dan Boncarosky, CFA
Co-Portfolio Manager
Managed Fund since January 2017
| Average annual total returns (%) (for the period ended January 31, 2018) |
| | | Inception | 1 Year | 5 Years | 10 Years |
| Class A | Excluding sales charges | 03/04/04 | 25.45 | 11.25 | 7.31 |
| | Including sales charges | | 18.22 | 9.93 | 6.68 |
| Advisor Class* | 06/13/13 | 25.76 | 11.50 | 7.43 |
| Class C | Excluding sales charges | 03/04/04 | 24.61 | 10.42 | 6.52 |
| | Including sales charges | | 23.61 | 10.42 | 6.52 |
| Institutional Class* | 09/27/10 | 25.73 | 11.54 | 7.52 |
| Institutional 2 Class* | 06/13/13 | 25.83 | 11.59 | 7.48 |
| Institutional 3 Class* | 06/13/13 | 25.89 | 11.64 | 7.50 |
| Class K | 03/04/04 | 25.51 | 11.34 | 7.48 |
| Class R* | 09/27/10 | 25.21 | 10.98 | 7.07 |
| Blended Benchmark | | 21.73 | 11.37 | 7.84 |
| Russell 3000 Index | | 25.16 | 15.53 | 9.85 |
| Bloomberg Barclays U.S. Aggregate Bond Index | | 2.15 | 2.01 | 3.71 |
Returns for Class A are shown with and without the maximum initial sales charge of 5.75%. Returns for Class C are shown with and without the 1.00% contingent deferred sales charge for the first year only. The Fund’s other classes are not subject to sales charges and have limited eligibility. Effective November 1, 2017, Class R4, Class R5, Class Y and Class Z shares were renamed Advisor Class, Institutional 2 Class, Institutional 3 Class and Institutional Class shares, respectively. Please see the Fund’s prospectus for details. Performance for different share classes will vary based on differences in sales charges and fees associated with each class. All results shown assume reinvestment of distributions during the period. Returns do not reflect the deduction of taxes that a shareholder may pay on Fund distributions or on the redemption of Fund shares. Performance results reflect the effect of any fee waivers or reimbursements of Fund expenses by Columbia Management Investment Advisers, LLC and/or any of its affiliates. Absent these fee waivers or expense reimbursement arrangements, performance results would have been lower.
The performance information shown represents past performance and is not a guarantee of future results. The investment return and principal value of your investment will fluctuate so that your shares, when redeemed, may be worth more or less than their original cost. Current performance may be lower or higher than the performance information shown. You may obtain performance information current to the most recent month-end by contacting your financial intermediary, visiting investor.columbiathreadneedleus.com or calling 800.345.6611.
| * | The returns shown for periods prior to the share class inception date (including returns for the Life of the Fund, if shown, which are since Fund inception) include the returns of the Fund’s oldest share class. Since the Fund launched more than one share class at its inception, Class A shares were used. These returns are adjusted to reflect any higher class-related operating expenses of the newer share classes, as applicable. Please visit investor.columbiathreadneedleus.com/investment-products/mutual-funds/appended-performance for more information. |
The Blended Benchmark consists of 60% Russell 3000 Index, 15% Bloomberg Barclays U.S. Aggregate Bond Index, 14% MSCI EAFE Index (Net), 6% MSCI Emerging Markets Index (Net) and 5% Bloomberg Barclays U.S. Corporate High-Yield Index. The MSCI EAFE Index (Net) is a free float-adjusted market capitalization index that is designed to measure the equity market performance of developed markets, excluding the U.S. and Canada. The MSCI Emerging Markets Index (Net) is a free float-adjusted market capitalization index that is designed to measure equity market performance of emerging markets. The Bloomberg Barclays U.S. Corporate High-Yield Index is a market value-weighted index, which covers the U.S. non-investment-grade fixed-rate debt market.
The Russell 3000 Index, an unmanaged index, measures the performance of the 3,000 largest U.S. companies based on total market capitalization, which represents approximately 98% of the investable U.S. equity market.
The Bloomberg Barclays U.S. Aggregate Bond Index is a broad-based benchmark that measures the investment-grade, U.S. dollar-denominated, fixed-rate taxable bond market, including Treasuries, government-related and corporate securities, mortgage-backed securities (agency fixed-rate and hybrid adjustable-rate mortgage passthroughs), asset-backed securities, and commercial mortgage-backed securities.
Indices are not available for investment, are not professionally managed and do not reflect sales charges, fees, brokerage commissions, taxes (except the MSCI EAFE Index (Net) and the MSCI Emerging Markets Index (Net), which reflect reinvested dividends net of withholding taxes) or other expenses of investing. Securities in the Fund may not match those in an index.
| 10 | Columbia Capital Allocation Portfolios | Annual Report 2018 |
Fund at a Glance (continued)
Columbia Capital Allocation Aggressive Portfolio
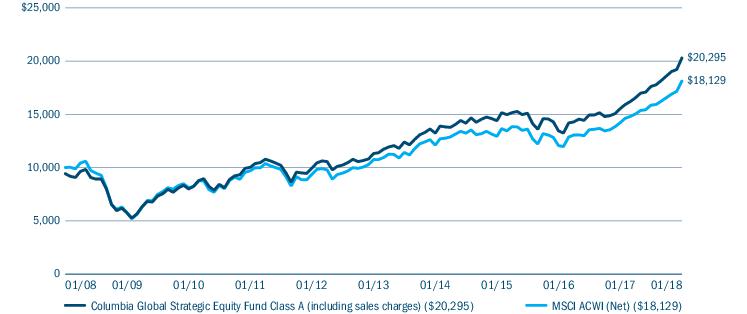
Performance of a hypothetical $10,000 investment (January 31, 2008 — January 31, 2018)
The chart above shows the change in value of a hypothetical $10,000 investment in Class A shares of Columbia Capital Allocation Aggressive Portfolio during the stated time period, and does not reflect the deduction of taxes that a shareholder may pay on Fund distributions or on the redemption of Fund shares.
| Portfolio breakdown (%) (at January 31, 2018) |
| Alternative Strategies Funds | 6.5 |
| Common Stocks | 2.8 |
| Equity Funds | 72.0 |
| Fixed-Income Funds | 11.2 |
| Money Market Funds | 7.5 |
| Rights | 0.0 (a) |
| Total | 100.0 |
Percentages indicated are based upon total investments. The Fund’s portfolio composition is subject to change.
Columbia Capital Allocation Portfolios | Annual Report 2018
| 11 |
Manager Discussion of Fund Performance
All returns listed below are for Class A shares excluding sales charges for the 12-month period that ended January 31, 2018. We attribute the Funds’ relative performance to strong results from asset class allocation and underlying fund performance overall.
| • | Columbia Capital Allocation Conservative Portfolio returned 7.90%. The Fund outperformed its Blended Benchmark, which returned 6.61%. |
| • | Columbia Capital Allocation Moderate Conservative Portfolio returned 11.79%. The Fund outperformed its Blended Benchmark, which returned 10.11%. |
| • | Columbia Capital Allocation Moderate Portfolio returned 16.39%. The Fund outperformed its Blended Benchmark, which returned 14.06%. |
| • | Columbia Capital Allocation Moderate Aggressive Portfolio returned 20.88%. The Fund outperformed its Blended Benchmark, which returned 17.84%. |
| • | Columbia Capital Allocation Aggressive Portfolio returned 25.45%. The Fund outperformed its Blended Benchmark, which returned 21.73%. |
During the same time frame, the Russell 3000 Index, which measures domestic equities, returned 25.16%; the Bloomberg Barclays U.S. Aggregate Bond Index, which measures the U.S. fixed-income market, returned 2.15%; the Bloomberg Barclays U.S. Corporate High-Yield Index, which measures the U.S. high-yield corporate bond market, returned 6.60%; the MSCI EAFE Index (Net), which measures international equities, returned 27.60%; the MSCI Emerging Markets Index (Net), which measures emerging market equities, returned 41.01%; and the FTSE Three-Month U.S. Treasury Bill Index advanced 0.91% for the period.
Global capital markets gained during period amid economic expectations
During the 12-month period, major asset classes ascended, with stocks outperforming bonds. The Russell 3000 Index and S&P 500 Index, each a broad proxy for the U.S. equity market, rose 25.16% and 26.41%, respectively, advancing each month in the 12-month period. Within the U.S. equity market, large-cap stocks outperformed smaller cap stocks, and growth stocks significantly outperformed value stocks. Emerging markets equities performed even better, with the MSCI Emerging Markets Index (Net) gaining 41.01%. International developed market equities also fared well, as measured by the 27.60% return of the MSCI EAFE Index (Net). Local currency returns for international equity markets were also positive but not as good as U.S. dollar-based returns, as the U.S. dollar declined approximately 10% against a basket of foreign market currencies, as measured by the U.S. Dollar Index.
The U.S. fixed-income market, as measured by the Bloomberg Barclays U.S. Aggregate Bond Index, may have overthought the perceived weakness across the economy. At the end of the 12-month period, the yield on the 10-year U.S. Treasury bond was near 2.45%. The yield on this bellwether U.S. Treasury declined materially following the middle part of 2017, as worries about economic growth began to filter into the investment backdrop. By September 2017, the 10-year U.S. Treasury yield had fallen to just more than 2%, and the probability of a December 2017 interest rate hike by the Federal Reserve (the Fed) priced into fed funds futures was barely 20%. Yet neither the real economy nor the Fed itself ratified these soft and dovish expectations, and equity markets marched forward to claim their highest levels of the calendar year. During the fourth quarter of 2017, bond investors seemed to reconsider their forecasts for economic growth and inflation, and market patterns favored prosperity-linked assets at the expense of interest-rate-sensitive assets. Thus, leading the way for fixed-income investors during the period overall were global inflation-protected securities, as measured by the 8.58% return of the Bloomberg Barclays Global Inflation-Linked Bond Index (Unhedged). High-yield corporate bonds and investment-grade corporate bonds, as measured by the 6.60% return of the Bloomberg Barclays U.S. Corporate High-Yield Index and the 5.08% return of the Bloomberg Barclays U.S. Corporate Investment Grade Bond Index, also performed well during the period. Conversely, U.S. Treasuries, as measured by the 0.69% return of the Bloomberg Barclays U.S. Treasury Index, posted more pedestrian performance. Still, U.S. Treasury bonds with long duration profiles performed notably better, with the Bloomberg Barclays U.S. Long Treasury Index returning 4.62% for the period.
| 12 | Columbia Capital Allocation Portfolios | Annual Report 2018 |
Manager Discussion of Fund Performance (continued)
The Fed raised the targeted federal funds rate three times during the period — in March, June and December 2017 — and also began normalizing its balance sheet in October 2017. (Balance sheet normalization refers to the steps the Fed takes to reverse quantitative easing and remove the substantial monetary accommodation it has provided to the economy since the financial crisis began in 2007.)
Allocation positioning and underlying fund performance supported relative results
Absolute returns in all five Funds were positive, and all five outperformed their respective Blended Benchmark. Asset allocation decisions overall contributed positively to returns in all five Funds, especially having an overweight to equities and an underweight to fixed income in each. Underlying fund performance also contributed positively to returns in all five Funds. On the equity side, allocation positioning in emerging market equities, developed market equities and U.S. large- and mid-cap equities aided results as did underlying fund performance within each of these market segments. Positioning in U.S. small-cap equities, which lagged these other market segments, detracted from relative results. Within fixed income, an underweight to core fixed income within all five Funds added the most value. Conversely, allocations to and underlying fund performance in high-yield corporate bonds detracted from relative returns in the two most aggressive Funds, although the sector generated strong positive absolute returns. Exposure to emerging markets bonds, not a component of the Blended Benchmarks, also detracted from relative results in all but the most conservative Fund, though underlying fund performance within this sector contributed positively. Despite posting positive absolute returns, out-of-benchmark allocations to absolute return strategies detracted from results in all five Funds, as they were not able to keep pace with the strong returns posted by other segments of the market.
Portfolio changes
Asset class changes within the Funds can be driven by active trading, by directing allocations to select asset classes or by market appreciation or depreciation within a given asset class. While remaining overweight equities in all five Funds, during the period, we increased allocations to equities in the three most aggressive Funds, especially to emerging markets equities, and decreased equity overweights in the two most conservative Funds. We increased all five Funds’ allocations to fixed income but remained underweight relative to the Blended Benchmarks. Specifically, we increased allocations to U.S. Treasuries and high-yield corporate bonds in all five Funds. Among alternative investment strategies, we increased allocations to commodities in the three most aggressive Funds based on our view that momentum dynamics remained favorable and economic strength should bolster returns of real assets. We maintained exposure to alternative strategies in all five Funds, a position largely centered on seeking to help reduce volatility and offer diversification benefits.
Derivatives usage
During the period, the use of derivatives positions on equity indices, fixed-income indices and currencies was implemented via an overlay to the Funds to efficiently allocate capital across the Funds and to allow greater flexibility in establishing exposure to a given market than might otherwise be possible. Futures and credit default swaps were used, as they can offer both a liquid and cost efficient means of establishing exposure in a given market and can be used to hedge duration and/or to reduce, or hedge, exposure to risk. The Funds benefited from the use of derivatives overall during the period. Also, some of the underlying funds used derivatives during the period to attempt to enhance portfolio return and for hedging purposes as market conditions warranted.
Market risk may affect a single issuer, sector of the economy, industry or the market as a whole. The fund’s investment in other funds subjects it to the investment performance (positive or negative), risks and expenses of these underlying funds. There are risks associated with fixed-income investments, including credit risk, interest rate risk, and prepayment and extension risk. In general, bond prices rise when interest rates fall and vice versa. This effect is usually more pronounced for longer term securities. Foreign investments subject the fund to risks, including political, economic, market, social and others within a particular country, as well as to currency instabilities and less stringent financial and accounting standards generally applicable to U.S. issuers. Investing in derivatives is a specialized activity that involves special risks that subject the fund to significant loss potential, including when used as leverage, and may result in greater fluctuation in fund value. Asset allocation does not assure a profit or protect against loss. See the Fund’s prospectus for more information on these and other risks.
The views expressed in this report reflect the current views of the respective parties. These views are not guarantees of future performance and involve certain risks, uncertainties and assumptions that are difficult to predict, so actual outcomes and results may differ significantly from the views expressed. These views are subject to change at any time based upon economic, market or other conditions and the respective parties disclaim any responsibility to
Columbia Capital Allocation Portfolios | Annual Report 2018
| 13 |
Manager Discussion of Fund Performance (continued)
update such views. These views may not be relied on as investment advice and, because investment decisions for a Columbia fund are based on numerous factors, may not be relied on as an indication of trading intent on behalf of any particular Columbia fund. References to specific securities should not be construed as a recommendation or investment advice.
| 14 | Columbia Capital Allocation Portfolios | Annual Report 2018 |
Understanding Your Fund’s Expenses
(Unaudited)
As an investor, you incur two types of costs. There are transaction costs, which generally include sales charges on purchases and may include redemption fees. There are also ongoing costs, which generally include management fees, distribution and/or service fees, and other fund expenses. The following information is intended to help you understand your ongoing costs (in dollars) of investing in the Fund and to help you compare these costs with the ongoing costs of investing in other mutual funds.
Analyzing your Fund’s expenses
To illustrate these ongoing costs, we have provided examples and calculated the expenses paid by investors in each share class of the Fund during the period. The actual and hypothetical information in the table is based on an initial investment of $1,000 at the beginning of the period indicated and held for the entire period. Expense information is calculated two ways and each method provides you with different information. The amount listed in the “Actual” column is calculated using the Fund’s actual operating expenses and total return for the period. You may use the Actual information, together with the amount invested, to estimate the expenses that you paid over the period. Simply divide your account value by $1,000 (for example, an $8,600 account value divided by $1,000 = 8.6), then multiply the results by the expenses paid during the period under the “Actual” column. The amount listed in the “Hypothetical” column assumes a 5% annual rate of return before expenses (which is not the Fund’s actual return) and then applies the Fund’s actual expense ratio for the period to the hypothetical return. You should not use the hypothetical account values and expenses to estimate either your actual account balance at the end of the period or the expenses you paid during the period. See “Compare with other funds” below for details on how to use the hypothetical data.
In addition to the ongoing expenses which the Fund bears directly, the Fund’s shareholders indirectly bear the Fund’s allocable share of the costs and expenses of each underlying fund in which the Fund invests. You can also estimate the effective expenses paid during the period, which includes the indirect fees associated with investing in the underlying funds, by using the amounts listed in the “Effective expenses paid during the period” column.
Compare with other funds
Since all mutual funds are required to include the same hypothetical calculations about expenses in shareholder reports, you can use this information to compare the ongoing cost of investing in the Fund with other funds. To do so, compare the hypothetical example with the 5% hypothetical examples that appear in the shareholder reports of other funds. As you compare hypothetical examples of other funds, it is important to note that hypothetical examples are meant to highlight the ongoing costs of investing in a fund only and do not reflect any transaction costs, such as sales charges, or redemption or exchange fees. Therefore, the hypothetical calculations are useful in comparing ongoing costs only, and will not help you determine the relative total costs of owning different funds. If transaction costs were included in these calculations, your costs would be higher.
| August 1, 2017 — January 31, 2018 |
| | Account value at the
beginning of the
period ($) | Account value at the
end of the
period ($) | Expenses paid during
the period ($) | Fund’s annualized
expense ratio (%) | Effective expenses
paid during the
period ($) | Fund’s effective
annualized
expense ratio (%) |
| | Actual | Hypothetical | Actual | Hypothetical | Actual | Hypothetical | Actual | Actual | Hypothetical | Actual |
| Columbia Capital Allocation Conservative Portfolio |
| Class A | 1,000.00 | 1,000.00 | 1,032.90 | 1,022.43 | 2.82 | 2.80 | 0.55 | 5.33 | 5.30 | 1.04 |
| Advisor Class (formerly Class R4) | 1,000.00 | 1,000.00 | 1,034.40 | 1,023.69 | 1.54 | 1.53 | 0.30 | 4.05 | 4.03 | 0.79 |
| Class C | 1,000.00 | 1,000.00 | 1,029.20 | 1,018.65 | 6.65 | 6.61 | 1.30 | 9.16 | 9.11 | 1.79 |
| Institutional Class (formerly Class Z) | 1,000.00 | 1,000.00 | 1,034.20 | 1,023.69 | 1.54 | 1.53 | 0.30 | 4.05 | 4.03 | 0.79 |
| Institutional 2 Class (formerly Class R5) | 1,000.00 | 1,000.00 | 1,034.60 | 1,023.79 | 1.44 | 1.43 | 0.28 | 3.95 | 3.93 | 0.77 |
| Institutional 3 Class (formerly Class Y) | 1,000.00 | 1,000.00 | 1,034.90 | 1,024.05 | 1.18 | 1.17 | 0.23 | 3.69 | 3.67 | 0.72 |
| Class K | 1,000.00 | 1,000.00 | 1,033.40 | 1,022.53 | 2.72 | 2.70 | 0.53 | 5.23 | 5.20 | 1.02 |
| Class R | 1,000.00 | 1,000.00 | 1,031.60 | 1,021.17 | 4.10 | 4.08 | 0.80 | 6.61 | 6.57 | 1.29 |
Columbia Capital Allocation Portfolios | Annual Report 2018
| 15 |
Understanding Your Fund’s Expenses (continued)
(Unaudited)
| August 1, 2017 — January 31, 2018 |
| | Account value at the
beginning of the
period ($) | Account value at the
end of the
period ($) | Expenses paid during
the period ($) | Fund’s annualized
expense ratio (%) | Effective expenses
paid during the
period ($) | Fund’s effective
annualized
expense ratio (%) |
| | Actual | Hypothetical | Actual | Hypothetical | Actual | Hypothetical | Actual | Actual | Hypothetical | Actual |
| Columbia Capital Allocation Moderate Conservative Portfolio |
| Class A | 1,000.00 | 1,000.00 | 1,055.90 | 1,022.79 | 2.49 | 2.45 | 0.48 | 5.39 | 5.30 | 1.04 |
| Advisor Class (formerly Class R4) | 1,000.00 | 1,000.00 | 1,057.70 | 1,024.05 | 1.19 | 1.17 | 0.23 | 4.10 | 4.03 | 0.79 |
| Class C | 1,000.00 | 1,000.00 | 1,050.80 | 1,019.00 | 6.36 | 6.26 | 1.23 | 9.25 | 9.11 | 1.79 |
| Institutional Class (formerly Class Z) | 1,000.00 | 1,000.00 | 1,057.00 | 1,024.05 | 1.19 | 1.17 | 0.23 | 4.10 | 4.03 | 0.79 |
| Institutional 2 Class (formerly Class R5) | 1,000.00 | 1,000.00 | 1,057.00 | 1,024.15 | 1.09 | 1.07 | 0.21 | 3.99 | 3.93 | 0.77 |
| Institutional 3 Class (formerly Class Y) | 1,000.00 | 1,000.00 | 1,057.00 | 1,024.40 | 0.83 | 0.82 | 0.16 | 3.73 | 3.67 | 0.72 |
| Class K | 1,000.00 | 1,000.00 | 1,056.00 | 1,022.89 | 2.38 | 2.35 | 0.46 | 5.29 | 5.20 | 1.02 |
| Class R | 1,000.00 | 1,000.00 | 1,053.50 | 1,021.53 | 3.78 | 3.72 | 0.73 | 6.68 | 6.57 | 1.29 |
| Columbia Capital Allocation Moderate Portfolio |
| Class A | 1,000.00 | 1,000.00 | 1,080.90 | 1,023.04 | 2.26 | 2.19 | 0.43 | 5.61 | 5.46 | 1.07 |
| Advisor Class (formerly Class R4) | 1,000.00 | 1,000.00 | 1,082.40 | 1,024.30 | 0.94 | 0.92 | 0.18 | 4.30 | 4.18 | 0.82 |
| Class C | 1,000.00 | 1,000.00 | 1,076.60 | 1,019.26 | 6.18 | 6.01 | 1.18 | 9.53 | 9.26 | 1.82 |
| Institutional Class (formerly Class Z) | 1,000.00 | 1,000.00 | 1,081.50 | 1,024.30 | 0.94 | 0.92 | 0.18 | 4.30 | 4.18 | 0.82 |
| Institutional 2 Class (formerly Class R5) | 1,000.00 | 1,000.00 | 1,081.60 | 1,024.40 | 0.84 | 0.82 | 0.16 | 4.20 | 4.08 | 0.80 |
| Institutional 3 Class (formerly Class Y) | 1,000.00 | 1,000.00 | 1,081.90 | 1,024.60 | 0.63 | 0.61 | 0.12 | 3.99 | 3.88 | 0.76 |
| Class K | 1,000.00 | 1,000.00 | 1,080.30 | 1,023.14 | 2.15 | 2.09 | 0.41 | 5.51 | 5.35 | 1.05 |
| Class R | 1,000.00 | 1,000.00 | 1,078.90 | 1,021.78 | 3.56 | 3.47 | 0.68 | 6.92 | 6.73 | 1.32 |
| Columbia Capital Allocation Moderate Aggressive Portfolio |
| Class A | 1,000.00 | 1,000.00 | 1,105.60 | 1,022.79 | 2.55 | 2.45 | 0.48 | 6.05 | 5.81 | 1.14 |
| Advisor Class (formerly Class R4) | 1,000.00 | 1,000.00 | 1,106.90 | 1,024.05 | 1.22 | 1.17 | 0.23 | 4.73 | 4.54 | 0.89 |
| Class C | 1,000.00 | 1,000.00 | 1,101.80 | 1,019.00 | 6.52 | 6.26 | 1.23 | 10.01 | 9.62 | 1.89 |
| Institutional Class (formerly Class Z) | 1,000.00 | 1,000.00 | 1,107.20 | 1,024.05 | 1.22 | 1.17 | 0.23 | 4.73 | 4.54 | 0.89 |
| Institutional 2 Class (formerly Class R5) | 1,000.00 | 1,000.00 | 1,107.30 | 1,024.25 | 1.01 | 0.97 | 0.19 | 4.51 | 4.34 | 0.85 |
| Institutional 3 Class (formerly Class Y) | 1,000.00 | 1,000.00 | 1,107.50 | 1,024.50 | 0.74 | 0.71 | 0.14 | 4.25 | 4.08 | 0.80 |
| Class K | 1,000.00 | 1,000.00 | 1,105.80 | 1,022.99 | 2.34 | 2.24 | 0.44 | 5.84 | 5.61 | 1.10 |
| Class R | 1,000.00 | 1,000.00 | 1,104.40 | 1,021.53 | 3.87 | 3.72 | 0.73 | 7.37 | 7.08 | 1.39 |
| Class V | 1,000.00 | 1,000.00 | 1,105.60 | 1,022.79 | 2.55 | 2.45 | 0.48 | 6.05 | 5.81 | 1.14 |
| 16 | Columbia Capital Allocation Portfolios | Annual Report 2018 |
Understanding Your Fund’s Expenses (continued)
(Unaudited)
| August 1, 2017 — January 31, 2018 |
| | Account value at the
beginning of the
period ($) | Account value at the
end of the
period ($) | Expenses paid during
the period ($) | Fund’s annualized
expense ratio (%) | Effective expenses
paid during the
period ($) | Fund’s effective
annualized
expense ratio (%) |
| | Actual | Hypothetical | Actual | Hypothetical | Actual | Hypothetical | Actual | Actual | Hypothetical | Actual |
| Columbia Capital Allocation Aggressive Portfolio |
| Class A | 1,000.00 | 1,000.00 | 1,131.10 | 1,022.89 | 2.47 | 2.35 | 0.46 | 6.39 | 6.07 | 1.19 |
| Advisor Class (formerly Class R4) | 1,000.00 | 1,000.00 | 1,132.80 | 1,024.15 | 1.13 | 1.07 | 0.21 | 5.05 | 4.80 | 0.94 |
| Class C | 1,000.00 | 1,000.00 | 1,127.20 | 1,019.11 | 6.49 | 6.16 | 1.21 | 10.40 | 9.87 | 1.94 |
| Institutional Class (formerly Class Z) | 1,000.00 | 1,000.00 | 1,132.40 | 1,024.15 | 1.13 | 1.07 | 0.21 | 5.05 | 4.80 | 0.94 |
| Institutional 2 Class (formerly Class R5) | 1,000.00 | 1,000.00 | 1,132.40 | 1,024.20 | 1.07 | 1.02 | 0.20 | 5.00 | 4.74 | 0.93 |
| Institutional 3 Class (formerly Class Y) | 1,000.00 | 1,000.00 | 1,133.00 | 1,024.50 | 0.75 | 0.71 | 0.14 | 4.68 | 4.44 | 0.87 |
| Class K | 1,000.00 | 1,000.00 | 1,131.20 | 1,022.94 | 2.42 | 2.29 | 0.45 | 6.34 | 6.02 | 1.18 |
| Class R | 1,000.00 | 1,000.00 | 1,129.90 | 1,021.63 | 3.81 | 3.62 | 0.71 | 7.73 | 7.34 | 1.44 |
Expenses paid during the period are equal to the annualized expense ratio for each class as indicated above, multiplied by the average account value over the period and then multiplied by the number of days in the Fund’s most recent fiscal half year and divided by 365.
Effective expenses paid during the period and the Fund’s effective annualized expense ratio include expenses borne directly to the class plus the Fund’s pro rata portion of the ongoing expenses charged by the underlying funds using the expense ratio of each class of the underlying funds as of the underlying fund’s most recent shareholder report.
Columbia Capital Allocation Portfolios | Annual Report 2018
| 17 |
Portfolio of Investments
Columbia Capital Allocation Conservative Portfolio, January 31, 2018
(Percentages represent value of investments compared to net assets)
| Alternative Strategies Funds 7.9% |
| | Shares | Value ($) |
| Columbia Absolute Return Currency and Income Fund, Institutional 3 Class(a),(b) | 52,691 | 539,026 |
| Columbia Alternative Beta Fund, Institutional 3 Class(a) | 468,857 | 4,411,947 |
| Columbia Commodity Strategy Fund, Institutional 3 Class(a) | 400,513 | 2,351,012 |
| Columbia Diversified Absolute Return Fund, Institutional 3 Class(a),(b) | 404,687 | 3,937,607 |
| Columbia Multi-Asset Income Fund, Institutional 3 Class(a) | 904,167 | 8,987,418 |
Total Alternative Strategies Funds
(Cost $20,403,787) | 20,227,010 |
|
| Common Stocks 4.0% |
| Issuer | Shares | Value ($) |
| Consumer Discretionary 0.5% |
| Auto Components —% |
| Dana, Inc. | 320 | 10,557 |
| Dorman Products, Inc.(b) | 275 | 20,746 |
| Faurecia | 241 | 21,657 |
| Total | | 52,960 |
| Automobiles 0.2% |
| Fiat Chrysler Automobiles NV(b) | 1,597 | 38,588 |
| Peugeot SA | 5,258 | 118,093 |
| Subaru Corp. | 3,700 | 123,241 |
| Suzuki Motor Corp. | 2,100 | 120,614 |
| Winnebago Industries, Inc. | 25 | 1,136 |
| Total | | 401,672 |
| Diversified Consumer Services —% |
| Adtalem Global Education, Inc.(b) | 450 | 20,700 |
| Sotheby’s (b) | 275 | 14,509 |
| Weight Watchers International, Inc.(b) | 246 | 15,815 |
| Total | | 51,024 |
| Hotels, Restaurants & Leisure 0.1% |
| Bloomin’ Brands, Inc. | 375 | 8,261 |
| Brinker International, Inc. | 100 | 3,634 |
| Cracker Barrel Old Country Store, Inc. | 100 | 17,648 |
| Dave & Buster’s Entertainment, Inc.(b) | 60 | 2,820 |
| Ruth’s Hospitality Group, Inc. | 777 | 18,415 |
| Sonic Corp. | 400 | 10,336 |
| TUI AG | 4,554 | 103,003 |
| Total | | 164,117 |
| Common Stocks (continued) |
| Issuer | Shares | Value ($) |
| Household Durables 0.1% |
| Electrolux AB, Class B | 1,690 | 59,666 |
| La-Z-Boy, Inc. | 540 | 16,281 |
| MDC Holdings, Inc. | 124 | 4,180 |
| Persimmon PLC | 2,959 | 105,117 |
| Taylor Wimpey PLC | 41,973 | 113,589 |
| Zagg, Inc.(b) | 900 | 15,030 |
| Total | | 313,863 |
| Internet & Direct Marketing Retail —% |
| Nutrisystem, Inc. | 75 | 3,244 |
| PetMed Express, Inc. | 375 | 16,950 |
| Total | | 20,194 |
| Leisure Products —% |
| Sturm Ruger & Co., Inc. | 204 | 10,802 |
| Media —% |
| Entravision Communications Corp., Class A | 2,100 | 14,595 |
| Gannett Co., Inc. | 1,620 | 19,116 |
| Gray Television, Inc.(b) | 480 | 7,848 |
| New York Times Co. (The), Class A | 280 | 6,510 |
| Total | | 48,069 |
| Specialty Retail 0.1% |
| Buckle, Inc. (The) | 200 | 4,010 |
| Finish Line, Inc., Class A (The) | 1,200 | 13,596 |
| Hibbett Sports, Inc.(b) | 500 | 11,300 |
| Restoration Hardware Holdings, Inc.(b) | 195 | 18,328 |
| Sleep Number Corp.(b) | 500 | 18,820 |
| Tailored Brands, Inc. | 150 | 3,629 |
| Tilly’s, Inc. | 300 | 4,476 |
| Total | | 74,159 |
| Textiles, Apparel & Luxury Goods —% |
| Deckers Outdoor Corp.(b) | 257 | 22,027 |
| Movado Group, Inc. | 585 | 17,901 |
| Total | | 39,928 |
| Total Consumer Discretionary | 1,176,788 |
| Consumer Staples 0.3% |
| Beverages —% |
| Boston Beer Co., Inc. (The), Class A(b) | 70 | 13,289 |
The accompanying Notes to Financial Statements are an integral part of this statement.
| 18 | Columbia Capital Allocation Portfolios | Annual Report 2018 |
Portfolio of Investments (continued)
Columbia Capital Allocation Conservative Portfolio, January 31, 2018
| Common Stocks (continued) |
| Issuer | Shares | Value ($) |
| Food & Staples Retailing 0.1% |
| Ingles Markets, Inc., Class A | 150 | 5,040 |
| J. Sainsbury PLC | 20,214 | 72,470 |
| Jeronimo Martins SGPS SA | 3,992 | 85,025 |
| SUPERVALU, Inc.(b) | 322 | 5,100 |
| United Natural Foods, Inc.(b) | 225 | 10,710 |
| Wesfarmers Ltd. | 1,654 | 58,341 |
| Woolworths Group Ltd. | 3,440 | 74,712 |
| Total | | 311,398 |
| Food Products 0.1% |
| Dean Foods Co. | 267 | 2,769 |
| John B. Sanfilippo & Son, Inc. | 225 | 14,090 |
| Marine Harvest ASA | 1,059 | 18,333 |
| Nestlé SA, Registered Shares | 784 | 67,740 |
| Sanderson Farms, Inc. | 146 | 18,527 |
| WH Group Ltd. | 94,500 | 116,840 |
| Total | | 238,299 |
| Household Products —% |
| Central Garden & Pet Co., Class A(b) | 250 | 9,430 |
| Personal Products —% |
| Unilever NV-CVA | 1,361 | 78,827 |
| Usana Health Sciences, Inc.(b) | 140 | 10,451 |
| Total | | 89,278 |
| Tobacco 0.1% |
| Imperial Brands PLC | 2,866 | 117,948 |
| Swedish Match AB | 2,274 | 92,116 |
| Total | | 210,064 |
| Total Consumer Staples | 871,758 |
| Energy 0.2% |
| Energy Equipment & Services —% |
| Archrock, Inc. | 1,340 | 12,462 |
| Exterran Corp.(b) | 550 | 15,884 |
| McDermott International, Inc.(b) | 1,800 | 15,804 |
| Rowan Companies PLC, Class A(b) | 1,300 | 19,136 |
| Total | | 63,286 |
| Common Stocks (continued) |
| Issuer | Shares | Value ($) |
| Oil, Gas & Consumable Fuels 0.2% |
| Caltex Australia Ltd. | 358 | 10,020 |
| CVR Energy, Inc. | 150 | 5,369 |
| OMV AG | 1,701 | 109,522 |
| Par Pacific Holdings, Inc.(b) | 210 | 3,828 |
| Peabody Energy Corp.(b) | 150 | 6,061 |
| Repsol SA | 6,435 | 121,079 |
| REX American Resources Corp.(b) | 172 | 14,044 |
| Royal Dutch Shell PLC, Class B | 4,223 | 149,661 |
| Ultra Petroleum Corp.(b) | 2,100 | 14,658 |
| W&T Offshore, Inc.(b) | 1,800 | 8,712 |
| Total | | 442,954 |
| Total Energy | 506,240 |
| Financials 0.8% |
| Banks 0.4% |
| BancFirst Corp. | 43 | 2,397 |
| Bancorp, Inc. (The)(b) | 200 | 2,114 |
| BancorpSouth Bank | 100 | 3,355 |
| Bank Hapoalim BM | 14,640 | 109,600 |
| Banner Corp. | 96 | 5,217 |
| Cathay General Bancorp | 480 | 20,995 |
| Central Pacific Financial Corp. | 205 | 6,062 |
| CoBiz Financial, Inc. | 100 | 2,006 |
| Customers Bancorp, Inc.(b) | 514 | 15,754 |
| Enterprise Financial Services Corp. | 125 | 6,081 |
| First Citizens BancShares Inc., Class A | 50 | 21,270 |
| First Financial Bancorp | 625 | 17,813 |
| First Merchants Corp. | 375 | 16,185 |
| Hancock Holding Co. | 425 | 22,822 |
| Heritage Financial Corp. | 300 | 9,240 |
| ING Groep NV | 1,670 | 32,822 |
| International Bancshares Corp. | 340 | 14,110 |
| Intesa Sanpaolo SpA | 19,909 | 78,121 |
| Japan Post Bank Co., Ltd. | 2,100 | 28,424 |
| KBC Group NV | 707 | 67,940 |
| Lloyds Banking Group PLC | 97,313 | 96,042 |
| Preferred Bank/Los Angeles | 275 | 17,716 |
| S&T Bancorp, Inc. | 425 | 17,153 |
| Sandy Spring Bancorp, Inc. | 195 | 7,375 |
The accompanying Notes to Financial Statements are an integral part of this statement.
Columbia Capital Allocation Portfolios | Annual Report 2018
| 19 |
Portfolio of Investments (continued)
Columbia Capital Allocation Conservative Portfolio, January 31, 2018
| Common Stocks (continued) |
| Issuer | Shares | Value ($) |
| Societe Generale SA | 2,427 | 141,185 |
| Swedbank AB, Class A | 3,582 | 91,551 |
| Triumph Bancorp, Inc.(b) | 80 | 3,080 |
| Valley National Bancorp | 1,600 | 20,112 |
| WesBanco, Inc. | 50 | 2,051 |
| Westpac Banking Corp. | 3,025 | 75,368 |
| Wintrust Financial Corp. | 264 | 22,678 |
| Total | | 976,639 |
| Capital Markets 0.1% |
| 3i Group PLC | 9,224 | 121,983 |
| Arlington Asset Investment Corp., Class A | 173 | 1,817 |
| Cohen & Steers, Inc. | 285 | 11,619 |
| Houlihan Lokey, Inc. | 325 | 15,502 |
| Total | | 150,921 |
| Consumer Finance —% |
| Green Dot Corp., Class A(b) | 300 | 18,378 |
| Nelnet, Inc., Class A | 286 | 14,904 |
| Total | | 33,282 |
| Diversified Financial Services —% |
| ORIX Corp. | 6,700 | 125,502 |
| Insurance 0.3% |
| Allianz SE, Registered Shares | 645 | 162,963 |
| American Equity Investment Life Holding Co. | 600 | 19,800 |
| Assicurazioni Generali SpA | 6,122 | 121,384 |
| AXA SA | 4,372 | 143,816 |
| CNO Financial Group, Inc. | 800 | 19,672 |
| CNP Assurances | 2,166 | 55,505 |
| Health Insurance Innovations, Inc., Class A(b) | 400 | 10,380 |
| Legal & General Group PLC | 6,555 | 25,185 |
| MS&AD Insurance Group Holdings, Inc. | 1,400 | 47,823 |
| Swiss Life Holding AG, Registered Shares | 171 | 64,211 |
| Third Point Reinsurance Ltd.(b) | 100 | 1,425 |
| Universal Insurance Holdings, Inc. | 468 | 13,759 |
| Total | | 685,923 |
| Common Stocks (continued) |
| Issuer | Shares | Value ($) |
| Mortgage Real Estate Investment Trusts (REITS) —% |
| AG Mortgage Investment Trust, Inc. | 200 | 3,488 |
| ARMOUR Residential REIT, Inc. | 550 | 12,875 |
| Invesco Mortgage Capital, Inc. | 970 | 15,753 |
| Total | | 32,116 |
| Thrifts & Mortgage Finance —% |
| Essent Group Ltd.(b) | 490 | 22,795 |
| Federal Agricultural Mortgage Corp. | 225 | 18,056 |
| Flagstar Bancorp, Inc.(b) | 444 | 16,539 |
| MGIC Investment Corp.(b) | 1,599 | 23,697 |
| Radian Group, Inc. | 300 | 6,621 |
| Walker & Dunlop, Inc.(b) | 350 | 16,258 |
| Washington Federal, Inc. | 500 | 17,950 |
| Total | | 121,916 |
| Total Financials | 2,126,299 |
| Health Care 0.5% |
| Biotechnology 0.1% |
| Alder Biopharmaceuticals, Inc.(b) | 883 | 12,494 |
| Atara Biotherapeutics, Inc.(b) | 330 | 12,474 |
| bluebird bio, Inc.(b) | 75 | 15,367 |
| Blueprint Medicines Corp.(b) | 105 | 8,258 |
| Clovis Oncology, Inc.(b) | 95 | 5,747 |
| Coherus Biosciences, Inc.(b) | 165 | 1,667 |
| Dynavax Technologies Corp.(b) | 380 | 6,118 |
| Eagle Pharmaceuticals, Inc.(b) | 35 | 2,092 |
| Global Blood Therapeutics, Inc.(b) | 80 | 4,632 |
| Immunomedics, Inc.(b) | 630 | 10,502 |
| Insmed, Inc.(b) | 333 | 8,472 |
| Jounce Therapeutics, Inc.(b) | 348 | 8,415 |
| Keryx Biopharmaceuticals, Inc.(b) | 975 | 4,514 |
| Loxo Oncology, Inc.(b) | 95 | 9,640 |
| NewLink Genetics Corp.(b) | 690 | 5,692 |
| Nightstar Therapeutics PLC, ADR(b) | 360 | 5,123 |
| OncoMed Pharmaceuticals, Inc.(b) | 1,025 | 2,563 |
| Ovid Therapeutics, Inc.(b) | 700 | 5,950 |
| Puma Biotechnology, Inc.(b) | 156 | 10,429 |
| Sage Therapeutics, Inc.(b) | 85 | 16,133 |
| Shire PLC | 573 | 27,072 |
The accompanying Notes to Financial Statements are an integral part of this statement.
| 20 | Columbia Capital Allocation Portfolios | Annual Report 2018 |
Portfolio of Investments (continued)
Columbia Capital Allocation Conservative Portfolio, January 31, 2018
| Common Stocks (continued) |
| Issuer | Shares | Value ($) |
| Spark Therapeutics, Inc.(b) | 166 | 9,304 |
| TESARO, Inc.(b) | 170 | 11,468 |
| Total | | 204,126 |
| Health Care Equipment & Supplies —% |
| Analogic Corp. | 214 | 17,741 |
| Angiodynamics, Inc.(b) | 715 | 12,448 |
| CONMED Corp. | 50 | 2,889 |
| Haemonetics Corp.(b) | 275 | 17,779 |
| Integer Holdings Corp.(b) | 350 | 17,552 |
| Lantheus Holdings, Inc.(b) | 771 | 17,733 |
| Masimo Corp.(b) | 222 | 20,921 |
| Total | | 107,063 |
| Health Care Providers & Services 0.1% |
| Alfresa Holdings Corp. | 4,000 | 97,360 |
| Diplomat Pharmacy, Inc.(b) | 760 | 20,512 |
| Kindred Healthcare, Inc. | 350 | 3,220 |
| Molina Healthcare, Inc.(b) | 263 | 24,028 |
| Providence Service Corp. (The)(b) | 275 | 17,691 |
| Tivity Health, Inc.(b) | 450 | 17,438 |
| Triple-S Management Corp., Class B(b) | 627 | 14,408 |
| Total | | 194,657 |
| Life Sciences Tools & Services —% |
| Pra Health Sciences, Inc.(b) | 267 | 24,313 |
| Pharmaceuticals 0.3% |
| Aerie Pharmaceuticals, Inc.(b) | 170 | 9,325 |
| Bayer AG, Registered Shares | 766 | 100,257 |
| Corcept Therapeutics, Inc.(b) | 870 | 20,023 |
| GlaxoSmithKline PLC | 8,176 | 153,281 |
| Lannett Co., Inc.(b) | 715 | 14,550 |
| Novartis AG, Registered Shares | 945 | 85,489 |
| Novo Nordisk A/S, Class B | 272 | 15,128 |
| Odonate Therapeutics, Inc.(b) | 300 | 6,234 |
| Pacira Pharmaceuticals, Inc.(b) | 215 | 7,826 |
| Phibro Animal Health Corp., Class A | 400 | 13,620 |
| Roche Holding AG, Genusschein Shares | 777 | 191,547 |
| Common Stocks (continued) |
| Issuer | Shares | Value ($) |
| Sanofi | 912 | 80,529 |
| Supernus Pharmaceuticals, Inc.(b) | 190 | 7,420 |
| Total | | 705,229 |
| Total Health Care | 1,235,388 |
| Industrials 0.6% |
| Aerospace & Defense —% |
| Curtiss-Wright Corp. | 200 | 26,132 |
| Moog, Inc., Class A(b) | 31 | 2,792 |
| Total | | 28,924 |
| Air Freight & Logistics —% |
| Deutsche Post AG | 143 | 6,759 |
| Forward Air Corp. | 130 | 7,892 |
| Total | | 14,651 |
| Airlines 0.1% |
| Deutsche Lufthansa AG, Registered Shares | 3,641 | 129,919 |
| International Consolidated Airlines Group SA | 9,593 | 87,183 |
| Japan Airlines Co., Ltd. | 200 | 7,557 |
| Total | | 224,659 |
| Building Products —% |
| Caesarstone Ltd.(b) | 525 | 11,130 |
| Continental Building Product(b) | 690 | 19,631 |
| Total | | 30,761 |
| Commercial Services & Supplies —% |
| ACCO Brands Corp.(b) | 1,230 | 14,576 |
| Brady Corp., Class A | 115 | 4,399 |
| Essendant, Inc. | 1,200 | 10,860 |
| MSA Safety, Inc. | 240 | 18,794 |
| SP Plus Corp.(b) | 400 | 15,420 |
| Total | | 64,049 |
| Construction & Engineering 0.2% |
| ACS Actividades de Construccion y Servicios SA | 2,330 | 93,322 |
| CIMIC Group Ltd. | 1,820 | 69,112 |
| Comfort Systems U.S.A., Inc. | 150 | 6,390 |
| EMCOR Group, Inc. | 275 | 22,352 |
| Kajima Corp. | 12,000 | 119,137 |
| KBR, Inc. | 500 | 10,170 |
| Obayashi Corp. | 9,600 | 115,906 |
The accompanying Notes to Financial Statements are an integral part of this statement.
Columbia Capital Allocation Portfolios | Annual Report 2018
| 21 |
Portfolio of Investments (continued)
Columbia Capital Allocation Conservative Portfolio, January 31, 2018
| Common Stocks (continued) |
| Issuer | Shares | Value ($) |
| Primoris Services Corp. | 645 | 16,770 |
| Taisei Corp. | 2,200 | 112,289 |
| Total | | 565,448 |
| Electrical Equipment 0.1% |
| Atkore International Group, Inc.(b) | 650 | 15,197 |
| Generac Holdings, Inc.(b) | 405 | 19,817 |
| Vestas Wind Systems A/S | 1,023 | 69,798 |
| Total | | 104,812 |
| Machinery 0.1% |
| Alamo Group, Inc. | 160 | 18,405 |
| Briggs & Stratton Corp. | 250 | 6,045 |
| EnPro Industries, Inc. | 50 | 4,400 |
| Global Brass & Copper Holdings, Inc. | 500 | 16,075 |
| Harsco Corp.(b) | 800 | 14,320 |
| Hillenbrand, Inc. | 425 | 18,827 |
| Kadant, Inc. | 138 | 13,834 |
| Mueller Industries, Inc. | 195 | 6,453 |
| RBC Bearings, Inc.(b) | 78 | 9,828 |
| Wabash National Corp. | 680 | 17,564 |
| Total | | 125,751 |
| Professional Services —% |
| Adecco Group AG, Registered Shares | 32 | 2,634 |
| Korn/Ferry International | 125 | 5,570 |
| RPX Corp. | 1,210 | 16,988 |
| TrueBlue, Inc.(b) | 250 | 6,837 |
| Total | | 32,029 |
| Road & Rail —% |
| ArcBest Corp. | 527 | 18,735 |
| Saia, Inc.(b) | 150 | 11,332 |
| Total | | 30,067 |
| Trading Companies & Distributors 0.1% |
| Applied Industrial Technologies, Inc. | 294 | 21,682 |
| Beacon Roofing Supply, Inc.(b) | 325 | 19,663 |
| ITOCHU Corp. | 7,000 | 137,737 |
| Marubeni Corp. | 16,500 | 124,096 |
| Total | | 303,178 |
| Total Industrials | 1,524,329 |
| Common Stocks (continued) |
| Issuer | Shares | Value ($) |
| Information Technology 0.4% |
| Communications Equipment —% |
| CalAmp Corp.(b) | 330 | 8,078 |
| Comtech Telecommunications Corp. | 750 | 16,223 |
| Netscout Systems, Inc.(b) | 700 | 19,950 |
| Total | | 44,251 |
| Electronic Equipment, Instruments & Components 0.1% |
| Anixter International, Inc.(b) | 175 | 14,648 |
| Benchmark Electronics, Inc.(b) | 540 | 15,633 |
| ePlus, Inc.(b) | 120 | 9,264 |
| Hitachi Ltd. | 18,000 | 143,636 |
| KEMET Corp.(b) | 530 | 10,791 |
| Methode Electronics, Inc. | 165 | 6,740 |
| Sanmina Corp.(b) | 495 | 12,944 |
| Scansource, Inc.(b) | 265 | 9,063 |
| Tech Data Corp.(b) | 200 | 20,054 |
| Vishay Intertechnology, Inc. | 960 | 21,072 |
| Total | | 263,845 |
| Internet Software & Services 0.1% |
| j2 Global, Inc. | 248 | 19,838 |
| Mixi, Inc. | 2,300 | 101,559 |
| New Relic, Inc.(b) | 200 | 11,946 |
| Stamps.com, Inc.(b) | 105 | 21,404 |
| Web.com Group, Inc.(b) | 505 | 11,741 |
| Total | | 166,488 |
| IT Services 0.1% |
| CACI International, Inc., Class A(b) | 50 | 7,028 |
| CSG Systems International, Inc. | 200 | 9,034 |
| EVERTEC, Inc. | 280 | 4,382 |
| Fujitsu Ltd. | 6,000 | 44,302 |
| MAXIMUS, Inc. | 325 | 22,158 |
| Perficient, Inc.(b) | 220 | 4,261 |
| Travelport Worldwide Ltd. | 1,330 | 18,101 |
| TTEC Holdings, Inc. | 350 | 13,895 |
| Total | | 123,161 |
The accompanying Notes to Financial Statements are an integral part of this statement.
| 22 | Columbia Capital Allocation Portfolios | Annual Report 2018 |
Portfolio of Investments (continued)
Columbia Capital Allocation Conservative Portfolio, January 31, 2018
| Common Stocks (continued) |
| Issuer | Shares | Value ($) |
| Semiconductors & Semiconductor Equipment —% |
| Amkor Technology, Inc.(b) | 1,619 | 16,287 |
| Cirrus Logic, Inc.(b) | 325 | 16,110 |
| Diodes, Inc.(b) | 584 | 16,463 |
| Formfactor, Inc.(b) | 1,000 | 14,350 |
| Rudolph Technologies, Inc.(b) | 295 | 7,729 |
| Synaptics, Inc.(b) | 410 | 17,770 |
| Xcerra Corp.(b) | 1,338 | 13,353 |
| Total | | 102,062 |
| Software —% |
| Aspen Technology, Inc.(b) | 359 | 27,805 |
| Imperva, Inc.(b) | 400 | 17,500 |
| Paycom Software, Inc.(b) | 60 | 5,499 |
| Paylocity Holding Corp.(b) | 225 | 11,765 |
| Progress Software Corp. | 440 | 21,925 |
| Proofpoint, Inc.(b) | 218 | 22,240 |
| VASCO Data Security International, Inc.(b) | 355 | 5,112 |
| Verint Systems, Inc.(b) | 100 | 4,175 |
| Total | | 116,021 |
| Technology Hardware, Storage & Peripherals 0.1% |
| Brother Industries Ltd. | 1,900 | 48,809 |
| Canon, Inc. | 3,500 | 139,650 |
| Total | | 188,459 |
| Total Information Technology | 1,004,287 |
| Materials 0.3% |
| Chemicals 0.1% |
| BASF SE | 384 | 44,968 |
| Covestro AG | 170 | 19,540 |
| Ferro Corp.(b) | 110 | 2,587 |
| Innospec, Inc. | 245 | 17,591 |
| Kronos Worldwide, Inc. | 590 | 16,196 |
| Mitsubishi Chemical Holdings Corp. | 11,900 | 129,785 |
| Quaker Chemical Corp. | 30 | 4,617 |
| Trinseo SA | 270 | 22,261 |
| Total | | 257,545 |
| Containers & Packaging —% |
| Greif, Inc., Class A | 215 | 12,711 |
| Common Stocks (continued) |
| Issuer | Shares | Value ($) |
| Metals & Mining 0.1% |
| Fortescue Metals Group Ltd. | 30,247 | 120,117 |
| Materion Corp. | 338 | 16,798 |
| Rio Tinto PLC | 2,671 | 148,739 |
| South32 Ltd. | 4,807 | 14,762 |
| Warrior Met Coal, Inc. | 600 | 16,782 |
| Total | | 317,198 |
| Paper & Forest Products 0.1% |
| Boise Cascade Co. | 450 | 20,003 |
| Louisiana-Pacific Corp.(b) | 750 | 22,207 |
| UPM-Kymmene OYJ | 4,358 | 146,846 |
| Total | | 189,056 |
| Total Materials | 776,510 |
| Real Estate 0.2% |
| Equity Real Estate Investment Trusts (REITS) 0.1% |
| CareTrust REIT, Inc. | 290 | 4,608 |
| CorEnergy Infrastructure Trust, Inc. | 437 | 16,750 |
| DiamondRock Hospitality Co. | 1,100 | 12,936 |
| Four Corners Property Trust, Inc. | 100 | 2,360 |
| Getty Realty Corp. | 50 | 1,312 |
| Lexington Realty Trust | 950 | 8,569 |
| National Health Investors, Inc. | 260 | 18,338 |
| Pebblebrook Hotel Trust | 500 | 19,500 |
| Potlatch Corp. | 100 | 5,290 |
| Preferred Apartment Communities, Inc., Class A | 270 | 4,501 |
| PS Business Parks, Inc. | 146 | 17,828 |
| Ryman Hospitality Properties, Inc. | 249 | 19,061 |
| Summit Hotel Properties, Inc. | 990 | 15,335 |
| Sunstone Hotel Investors, Inc. | 390 | 6,571 |
| Tier REIT, Inc. | 400 | 7,764 |
| Xenia Hotels & Resorts, Inc. | 815 | 18,093 |
| Total | | 178,816 |
The accompanying Notes to Financial Statements are an integral part of this statement.
Columbia Capital Allocation Portfolios | Annual Report 2018
| 23 |
Portfolio of Investments (continued)
Columbia Capital Allocation Conservative Portfolio, January 31, 2018
| Common Stocks (continued) |
| Issuer | Shares | Value ($) |
| Real Estate Management & Development 0.1% |
| CK Asset Holdings Ltd. | 1,555 | 14,797 |
| HFF, Inc., Class A | 140 | 6,890 |
| Kerry Properties Ltd. | 21,500 | 102,791 |
| Sun Hung Kai Properties Ltd. | 6,873 | 118,826 |
| Total | | 243,304 |
| Total Real Estate | 422,120 |
| Telecommunication Services 0.1% |
| Diversified Telecommunication Services 0.1% |
| ATN International, Inc. | 25 | 1,484 |
| Nippon Telegraph & Telephone Corp. | 2,000 | 95,769 |
| Orange SA | 443 | 8,000 |
| Telefonica SA | 3,830 | 39,244 |
| Telenor ASA | 5,061 | 118,501 |
| Total | | 262,998 |
| Wireless Telecommunication Services —% |
| Boingo Wireless, Inc.(b) | 700 | 16,975 |
| Total Telecommunication Services | 279,973 |
| Utilities 0.1% |
| Electric Utilities 0.1% |
| Allete, Inc. | 175 | 12,677 |
| El Paso Electric Co. | 125 | 6,525 |
| Enel SpA | 15,090 | 95,736 |
| IDACORP, Inc. | 30 | 2,588 |
| PNM Resources, Inc. | 50 | 1,905 |
| Portland General Electric Co. | 414 | 17,533 |
| Total | | 136,964 |
| Gas Utilities —% |
| Chesapeake Utilities Corp. | 192 | 14,112 |
| Southwest Gas Corp. | 148 | 10,890 |
| Total | | 25,002 |
| Independent Power and Renewable Electricity Producers —% |
| Ormat Technologies, Inc. | 225 | 15,768 |
| Multi-Utilities —% |
| Engie SA | 6,246 | 108,411 |
| Common Stocks (continued) |
| Issuer | Shares | Value ($) |
| Water Utilities —% |
| SJW Corp. | 169 | 10,113 |
| Total Utilities | 296,258 |
Total Common Stocks
(Cost $8,522,094) | 10,219,950 |
|
| Equity Funds 18.7% |
| | Shares | Value ($) |
| International 3.9% |
| Columbia Contrarian Europe Fund, Institutional 3 Class(a) | 177,322 | 1,352,965 |
| Columbia Emerging Markets Fund, Institutional 3 Class(a) | 235,570 | 3,498,215 |
| Columbia Overseas Value Fund, Institutional 3 Class(a) | 462,157 | 5,019,023 |
| Total | 9,870,203 |
| U.S. Large Cap 14.7% |
| Columbia Contrarian Core Fund, Institutional 3 Class(a) | 145,442 | 4,030,200 |
| Columbia Disciplined Core Fund, Institutional 3 Class(a) | 848,827 | 10,771,618 |
| Columbia Disciplined Growth Fund, Institutional 3 Class(a) | 749,257 | 7,545,015 |
| Columbia Disciplined Value Fund, Institutional 3 Class(a) | 685,269 | 7,702,423 |
| Columbia Select Large Cap Equity Fund, Institutional 3 Class(a) | 503,728 | 7,601,257 |
| Total | 37,650,513 |
| U.S. Small Cap 0.1% |
| Columbia Disciplined Small Core Fund, Institutional 3 Class(a) | 18,600 | 166,844 |
Total Equity Funds
(Cost $37,943,214) | 47,687,560 |
|
| Fixed-Income Funds 58.1% |
| | |
| Emerging Markets 1.5% |
| Columbia Emerging Markets Bond Fund, Institutional 3 Class(a) | 317,745 | 3,793,872 |
| High Yield 2.1% |
| Columbia Income Opportunities Fund, Institutional 3 Class(a) | 532,001 | 5,277,452 |
| Inflation Protected Securities 1.9% |
| Columbia Inflation Protected Securities Fund, Institutional 3 Class(a) | 518,143 | 4,917,182 |
The accompanying Notes to Financial Statements are an integral part of this statement.
| 24 | Columbia Capital Allocation Portfolios | Annual Report 2018 |
Portfolio of Investments (continued)
Columbia Capital Allocation Conservative Portfolio, January 31, 2018
| Fixed-Income Funds (continued) |
| | Shares | Value ($) |
| Investment Grade 52.6% |
| Columbia Corporate Income Fund, Institutional 3 Class(a) | 3,565,014 | 36,398,796 |
| Columbia Limited Duration Credit Fund, Institutional 3 Class(a) | 1,226,761 | 11,985,458 |
| Columbia Mortgage Opportunities Fund, Institutional 3 Class(a) | 386,780 | 3,778,843 |
| Columbia Total Return Bond Fund, Institutional 3 Class(a) | 1,742,878 | 15,616,184 |
| Columbia U.S. Government Mortgage Fund, Institutional 3 Class(a) | 6,961,590 | 37,174,891 |
| Columbia U.S. Treasury Index Fund, Institutional 3 Class(a) | 2,707,372 | 29,618,645 |
| Total | 134,572,817 |
Total Fixed-Income Funds
(Cost $151,305,054) | 148,561,323 |
| Preferred Stocks —% |
| Issuer | Coupon
Rate | Shares | Value ($) |
| Consumer Discretionary —% |
| Auto Components —% |
| Schaeffler AG | — | 6,068 | 120,652 |
| Total Consumer Discretionary | 120,652 |
Total Preferred Stocks
(Cost $88,430) | 120,652 |
| Rights —% |
| Issuer | Shares | Value ($) |
| Industrials —% |
| Construction & Engineering —% |
| ACS Actividades de Construccion y Servicios SA(b) | 2,330 | 1,221 |
| Total Industrials | 1,221 |
Total Rights
(Cost $1,278) | 1,221 |
|
| Money Market Funds 11.1% |
| | Shares | Value ($) |
| Columbia Short-Term Cash Fund, 1.475%(a),(c) | 28,353,621 | 28,353,621 |
Total Money Market Funds
(Cost $28,353,546) | 28,353,621 |
Total Investments
(Cost: $246,617,403) | 255,171,337 |
| Other Assets & Liabilities, Net | | 499,892 |
| Net Assets | 255,671,229 |
At January 31, 2018, securities and/or cash totaling $553,998 were pledged as collateral.
Investments in derivatives
| Forward foreign currency exchange contracts |
Currency to
be sold | Currency to
be purchased | Counterparty | Settlement
date | Unrealized
appreciation ($) | Unrealized
depreciation ($) |
| 253,000 ILS | 73,720 USD | JPMorgan | 03/14/2018 | — | (395) |
| 8,127,000 JPY | 73,302 USD | JPMorgan | 03/14/2018 | — | (1,301) |
| 578,000 NOK | 73,582 USD | JPMorgan | 03/14/2018 | — | (1,485) |
| 295,000 SEK | 36,827 USD | JPMorgan | 03/14/2018 | — | (708) |
| 66,314 USD | 83,000 AUD | JPMorgan | 03/14/2018 | 557 | — |
| 139,671 USD | 134,000 CHF | JPMorgan | 03/14/2018 | 4,730 | — |
| 44,115 USD | 268,000 DKK | JPMorgan | 03/14/2018 | 712 | — |
| 44,402 USD | 32,000 GBP | JPMorgan | 03/14/2018 | 1,100 | — |
| 96,064 USD | 127,000 SGD | JPMorgan | 03/14/2018 | 827 | — |
| Total | | | | 7,926 | (3,889) |
The accompanying Notes to Financial Statements are an integral part of this statement.
Columbia Capital Allocation Portfolios | Annual Report 2018
| 25 |
Portfolio of Investments (continued)
Columbia Capital Allocation Conservative Portfolio, January 31, 2018
| Long futures contracts |
| Description | Number of
contracts | Expiration
date | Trading
currency | Notional
amount | Value/Unrealized
appreciation ($) | Value/Unrealized
depreciation ($) |
| MSCI Emerging Markets Index | 39 | 03/2018 | USD | 2,452,710 | 74,597 | — |
| U.S. Long Bond | 73 | 03/2018 | USD | 11,030,414 | — | (345,150) |
| U.S. Ultra Bond | 4 | 03/2018 | USD | 654,989 | — | (16,689) |
| Total | | | | | 74,597 | (361,839) |
| Short futures contracts |
| Description | Number of
contracts | Expiration
date | Trading
currency | Notional
amount | Value/Unrealized
appreciation ($) | Value/Unrealized
depreciation ($) |
| FTSE 100 Index | (13) | 03/2018 | GBP | (970,710) | — | (10,139) |
| S&P 500 E-mini | (15) | 03/2018 | USD | (2,119,350) | — | (145,786) |
| Total | | | | | — | (155,925) |
| Cleared credit default swap contracts - sell protection |
Reference
entity | Counterparty | Maturity
date | Receive
fixed
rate
(%) | Payment
frequency | Implied
credit
spread
(%) | Notional
currency | Notional
amount | Value
($) | Upfront
payments
($) | Upfront
receipts
($) | Unrealized
appreciation
($) | Unrealized
depreciation
($) |
| Markit CDX North America High Yield Index, Series 29 | Morgan Stanley | 12/20/2022 | 5.000 | Quarterly | 3.011 | USD | 3,000,000 | 23,173 | — | — | 23,173 | — |
Notes to Portfolio of Investments
| (a) | As defined in the Investment Company Act of 1940, an affiliated company is one in which the Fund owns 5% or more of the company’s outstanding voting securities, or a company which is under common ownership or control with the Fund. Holdings and transactions in these affiliated companies during the year ended January 31, 2018 are as follows: |
| Issuer | Beginning
shares | Shares
purchased | Shares
sold | Ending
shares | Capital gain
distributions —
affiliated
issuers ($) | Realized gain
(loss) —
affiliated
issuers ($) | Net change in
unrealized
appreciation
(depreciation) —
affiliated
issuers ($) | Dividends —
affiliated
issuers ($) | Value —
affiliated
issuers
at end of
period ($) |
| Columbia Absolute Return Currency and Income Fund, Class I Shares |
| | 58,152 | 85 | (58,237)* | — | — | 4,490 | (23,010) | — | — |
| Columbia Absolute Return Currency and Income Fund, Institutional 3 Class |
| | — | 64,424* | (11,733) | 52,691 | — | 7,393 | (29,388) | — | 539,026 |
| Columbia Alternative Beta Fund, Class I Shares |
| | 458,101 | — | (458,101)* | — | — | — | 389,274 | — | — |
| Columbia Alternative Beta Fund, Institutional 3 Class |
| | — | 468,857* | — | 468,857 | — | — | (253,934) | 103,305 | 4,411,947 |
| Columbia Commodity Strategy Fund, Class I Shares |
| | 436,338 | 1,104 | (437,442)* | — | — | (1,177) | 20,184 | — | — |
| Columbia Commodity Strategy Fund, Institutional 3 Class |
| | — | 490,962* | (90,449) | 400,513 | — | (26,891) | 82,477 | 3,634 | 2,351,012 |
| Columbia Contrarian Core Fund, Class I Shares |
| | 181,515 | 90 | (181,605)* | — | — | 71,868 | (531,570) | — | — |
| Columbia Contrarian Core Fund, Institutional 3 Class |
| | — | 175,855* | (30,413) | 145,442 | 180,207 | 222,911 | 961,347 | 39,993 | 4,030,200 |
| Columbia Contrarian Europe Fund, Class I Shares |
| | 236,309 | — | (236,309)* | — | — | — | 101,789 | — | — |
| Columbia Contrarian Europe Fund, Institutional 3 Class |
| | — | 260,466* | (83,144) | 177,322 | — | 14,286 | 256,017 | 27,743 | 1,352,965 |
The accompanying Notes to Financial Statements are an integral part of this statement.
| 26 | Columbia Capital Allocation Portfolios | Annual Report 2018 |
Portfolio of Investments (continued)
Columbia Capital Allocation Conservative Portfolio, January 31, 2018
Notes to Portfolio of Investments (continued)
| Issuer | Beginning
shares | Shares
purchased | Shares
sold | Ending
shares | Capital gain
distributions —
affiliated
issuers ($) | Realized gain
(loss) —
affiliated
issuers ($) | Net change in
unrealized
appreciation
(depreciation) —
affiliated
issuers ($) | Dividends —
affiliated
issuers ($) | Value —
affiliated
issuers
at end of
period ($) |
| Columbia Corporate Income Fund, Class I Shares |
| | 3,326,072 | 534,501 | (3,860,573)* | — | — | (62,371) | 504,758 | 143,653 | — |
| Columbia Corporate Income Fund, Institutional 3 Class |
| | — | 3,884,350* | (319,336) | 3,565,014 | — | (8,612) | 274,113 | 904,801 | 36,398,796 |
| Columbia Disciplined Core Fund, Class I Shares |
| | 1,061,097 | 218 | (1,061,315)* | — | — | 289,734 | (1,719,170) | — | — |
| Columbia Disciplined Core Fund, Institutional 3 Class |
| | — | 1,070,985* | (222,158) | 848,827 | 472,269 | 1,207,090 | 2,417,396 | 188,546 | 10,771,618 |
| Columbia Disciplined Growth Fund, Class I Shares |
| | 888,892 | 554 | (889,446)* | — | — | 29,451 | 76,292 | — | — |
| Columbia Disciplined Growth Fund, Institutional 3 Class |
| | — | 947,819* | (198,562) | 749,257 | 864,705 | 215,736 | 996,283 | 47,045 | 7,545,015 |
| Columbia Disciplined Small Core Fund, Class I Shares |
| | 21,571 | 238 | (21,809)* | — | — | (11,501) | 24,717 | — | — |
| Columbia Disciplined Small Core Fund, Institutional 3 Class |
| | — | 18,600* | — | 18,600 | 26,138 | — | (23,679) | 899 | 166,844 |
| Columbia Disciplined Value Fund, Class I Shares |
| | 810,791 | 297 | (811,088)* | — | — | 41,341 | (623,431) | — | — |
| Columbia Disciplined Value Fund, Institutional 3 Class |
| | — | 849,747* | (164,478) | 685,269 | 377,132 | 327,197 | 1,392,126 | 167,831 | 7,702,423 |
| Columbia Diversified Absolute Return Fund, Class I Shares |
| | 482,091 | 299 | (482,390)* | — | — | (16,491) | 205,782 | — | — |
| Columbia Diversified Absolute Return Fund, Institutional 3 Class |
| | — | 492,401* | (87,714) | 404,687 | — | (33,294) | (39,548) | — | 3,937,607 |
| Columbia Emerging Markets Bond Fund, Class I Shares |
| | 336,531 | 2,300 | (338,831)* | — | — | (1,111) | 76,024 | 23,904 | — |
| Columbia Emerging Markets Bond Fund, Institutional 3 Class |
| | — | 353,410* | (35,665) | 317,745 | — | (15,687) | 137,925 | 191,097 | 3,793,872 |
| Columbia Emerging Markets Fund, Class I Shares |
| | 355,075 | — | (355,075)* | — | — | — | (246,654) | — | — |
| Columbia Emerging Markets Fund, Institutional 3 Class |
| | — | 360,006* | (124,436) | 235,570 | — | 358,120 | 1,253,098 | 16,507 | 3,498,215 |
| Columbia Income Opportunities Fund, Class I Shares |
| | 566,540 | 2,444 | (568,984)* | — | — | (4,129) | 4,778 | 40,159 | — |
| Columbia Income Opportunities Fund, Institutional 3 Class |
| | — | 582,159* | (50,158) | 532,001 | — | 3,248 | 27,822 | 219,880 | 5,277,452 |
| Columbia Inflation Protected Securities Fund, Class I Shares |
| | 1,097,800 | 836 | (1,098,636)* | — | — | (837,899) | 1,022,442 | — | — |
| Columbia Inflation Protected Securities Fund, Institutional 3 Class |
| | — | 558,047* | (39,904) | 518,143 | — | (66,371) | (121,318) | 127,548 | 4,917,182 |
| Columbia Limited Duration Credit Fund, Class I Shares |
| | 1,325,664 | 2,384 | (1,328,048)* | — | — | (4,176) | 218,772 | 32,234 | — |
The accompanying Notes to Financial Statements are an integral part of this statement.
Columbia Capital Allocation Portfolios | Annual Report 2018
| 27 |
Portfolio of Investments (continued)
Columbia Capital Allocation Conservative Portfolio, January 31, 2018
Notes to Portfolio of Investments (continued)
| Issuer | Beginning
shares | Shares
purchased | Shares
sold | Ending
shares | Capital gain
distributions —
affiliated
issuers ($) | Realized gain
(loss) —
affiliated
issuers ($) | Net change in
unrealized
appreciation
(depreciation) —
affiliated
issuers ($) | Dividends —
affiliated
issuers ($) | Value —
affiliated
issuers
at end of
period ($) |
| Columbia Limited Duration Credit Fund, Institutional 3 Class |
| | — | 1,320,105* | (93,344) | 1,226,761 | — | (4,995) | (275,297) | 196,522 | 11,985,458 |
| Columbia Mortgage Opportunities Fund, Class I Shares |
| | 378,711 | 2,824 | (381,535)* | — | — | (1,447) | 52,604 | 22,726 | — |
| Columbia Mortgage Opportunities Fund, Institutional 3 Class |
| | — | 415,379* | (28,599) | 386,780 | 124,063 | (2,304) | (75,998) | 134,642 | 3,778,843 |
| Columbia Multi-Asset Income Fund, Class I Shares |
| | 857,137 | 7,406 | (864,543)* | — | — | — | 233,576 | 71,870 | — |
| Columbia Multi-Asset Income Fund, Institutional 3 Class |
| | — | 904,167* | — | 904,167 | — | — | 63,617 | 372,702 | 8,987,418 |
| Columbia Overseas Value Fund, Class I Shares |
| | 584,161 | 844 | (585,005)* | — | — | (5,084) | 48,216 | — | — |
| Columbia Overseas Value Fund, Institutional 3 Class |
| | — | 599,711* | (137,554) | 462,157 | 83,118 | 136,661 | 1,076,552 | 90,291 | 5,019,023 |
| Columbia Select Large Cap Equity Fund, Class I Shares |
| | 599,736 | — | (599,736)* | — | — | — | (67,938) | — | — |
| Columbia Select Large Cap Equity Fund, Institutional 3 Class |
| | — | 645,776* | (142,048) | 503,728 | 367,349 | 177,422 | 1,415,206 | 68,666 | 7,601,257 |
| Columbia Short-Term Cash Fund, 1.475% |
| | 28,203,510 | 9,424,487 | (9,274,376) | 28,353,621 | — | (108) | 87 | 300,430 | 28,353,621 |
| Columbia Total Return Bond Fund, Class I Shares |
| | 1,865,478 | 3,809 | (1,869,287)* | — | — | — | 373,228 | 63,999 | — |
| Columbia Total Return Bond Fund, Institutional 3 Class |
| | — | 1,957,284* | (214,406) | 1,742,878 | — | (24,270) | (365,272) | 388,884 | 15,616,184 |
| Columbia U.S. Government Mortgage Fund, Class I Shares |
| | 7,437,116 | 14,914 | (7,452,030)* | — | — | (27,810) | 1,157,295 | 144,003 | — |
| Columbia U.S. Government Mortgage Fund, Institutional 3 Class |
| | — | 7,602,355* | (640,765) | 6,961,590 | — | (42,605) | (1,254,613) | 1,017,448 | 37,174,891 |
| Columbia U.S. Treasury Index Fund, Class I Shares |
| | 2,950,514 | 3,506 | (2,954,020)* | — | — | (63,965) | 1,081,282 | 67,506 | — |
| Columbia U.S. Treasury Index Fund, Institutional 3 Class |
| | — | 3,001,904* | (294,532) | 2,707,372 | — | (202,238) | (1,091,093) | 406,325 | 29,618,645 |
| Total | | | | | 2,494,981 | 1,642,412 | 9,203,166 | 5,624,793 | 244,829,514 |
| * | Includes the effect of underlying share class exchange. |
| (b) | Non-income producing investment. |
| (c) | The rate shown is the seven-day current annualized yield at January 31, 2018. |
Abbreviation Legend
| ADR | American Depositary Receipt |
The accompanying Notes to Financial Statements are an integral part of this statement.
| 28 | Columbia Capital Allocation Portfolios | Annual Report 2018 |
Portfolio of Investments (continued)
Columbia Capital Allocation Conservative Portfolio, January 31, 2018
Currency Legend
| AUD | Australian Dollar |
| CHF | Swiss Franc |
| DKK | Danish Krone |
| GBP | British Pound |
| ILS | New Israeli Sheqel |
| JPY | Japanese Yen |
| NOK | Norwegian Krone |
| SEK | Swedish Krona |
| SGD | Singapore Dollar |
| USD | US Dollar |
Fair value measurements
The Fund categorizes its fair value measurements according to a three-level hierarchy that maximizes the use of observable inputs and minimizes the use of unobservable inputs by prioritizing that the most observable input be used when available. Observable inputs are those that market participants would use in pricing an investment based on market data obtained from sources independent of the reporting entity. Unobservable inputs are those that reflect the Fund’s assumptions about the information market participants would use in pricing an investment. An investment’s level within the fair value hierarchy is based on the lowest level of any input that is deemed significant to the asset’s or liability’s fair value measurement. The input levels are not necessarily an indication of the risk or liquidity associated with investments at that level. For example, certain U.S. government securities are generally high quality and liquid, however, they are reflected as Level 2 because the inputs used to determine fair value may not always be quoted prices in an active market.
Fair value inputs are summarized in the three broad levels listed below:
| ¦ | Level 1 — Valuations based on quoted prices for investments in active markets that the Fund has the ability to access at the measurement date. Valuation adjustments are not applied to Level 1 investments. |
| ¦ | Level 2 — Valuations based on other significant observable inputs (including quoted prices for similar securities, interest rates, prepayment speeds, credit risks, etc.). |
| ¦ | Level 3 — Valuations based on significant unobservable inputs (including the Fund’s own assumptions and judgment in determining the fair value of investments). |
Inputs that are used in determining fair value of an investment may include price information, credit data, volatility statistics, and other factors. These inputs can be either observable or unobservable. The availability of observable inputs can vary between investments, and is affected by various factors such as the type of investment, and the volume and level of activity for that investment or similar investments in the marketplace. The inputs will be considered by the Investment Manager, along with any other relevant factors in the calculation of an investment’s fair value. The Fund uses prices and inputs that are current as of the measurement date, which may include periods of market dislocations. During these periods, the availability of prices and inputs may be reduced for many investments. This condition could cause an investment to be reclassified between the various levels within the hierarchy.
Foreign equity securities actively traded in markets where there is a significant delay in the local close relative to the New York Stock Exchange are classified as Level 2. The values of these securities may include an adjustment to reflect the impact of significant market movements following the close of local trading, as described in Note 2 to the financial statements – Security valuation.
Certain investments that have been measured at fair value using the net asset value (NAV) per share (or its equivalent) are not categorized in the fair value hierarchy. The fair value amounts presented in the table are intended to reconcile the fair value hierarchy to the amounts presented in the Portfolio of Investments. The Columbia Short-Term Cash Fund seeks to provide shareholders with maximum current income consistent with liquidity and stability of principal. Columbia Short-Term Cash Fund prices its shares with a floating NAV and no longer seeks to maintain a stable NAV.
Investments falling into the Level 3 category are primarily supported by quoted prices from brokers and dealers participating in the market for those investments. However, these may be classified as Level 3 investments due to lack of market transparency and corroboration to support these quoted prices. Additionally, valuation models may be used as the pricing source for any remaining investments classified as Level 3. These models may rely on one or more significant unobservable inputs and/or significant assumptions by the Investment Manager. Inputs used in valuations may include, but are not limited to, financial statement analysis, capital account balances, discount rates and estimated cash flows, and comparable company data.
Under the direction of the Fund’s Board of Trustees (the Board), the Investment Manager’s Valuation Committee (the Committee) is responsible for overseeing the valuation procedures approved by the Board. The Committee consists of voting and non-voting members from various groups within the Investment Manager’s organization, including operations and accounting, trading and investments, compliance, risk management and legal.
The Committee meets at least monthly to review and approve valuation matters, which may include a description of specific valuation determinations, data regarding pricing information received from approved pricing vendors and brokers and the results of Board-approved valuation control policies and procedures (the Policies). The Policies address, among other things, instances when market quotations are or are not readily available, including recommendations of third party pricing vendors and a determination of appropriate pricing methodologies; events that require specific valuation determinations and assessment of fair value techniques; securities with a potential for stale pricing, including those that are illiquid, restricted, or in default; and the effectiveness of third party pricing vendors, including periodic reviews of vendors. The Committee meets more frequently, as needed, to discuss additional valuation matters, which may include the need to review back-testing results, review time-sensitive information or approve related valuation actions. The Committee reports to the Board, with members of the Committee meeting with the Board at each of its regularly scheduled meetings to discuss valuation matters and actions during the period, similar to those described earlier.
For investments categorized as Level 3, the Committee monitors information similar to that described above, which may include: (i) data specific to the issuer or comparable issuers, (ii) general market or specific sector news and (iii) quoted prices and specific or similar security transactions. The Committee considers this data and any changes from prior periods in order to assess the reasonableness of observable and unobservable inputs, any assumptions or internal models used to value those securities and changes in fair value. This data is also used to corroborate, when available, information received from approved pricing vendors and brokers. Various factors impact the frequency of monitoring this information (which may occur as often as daily). However, the Committee may determine that changes to inputs, assumptions and models are not required as a result of the monitoring procedures performed.
The accompanying Notes to Financial Statements are an integral part of this statement.
Columbia Capital Allocation Portfolios | Annual Report 2018
| 29 |
Portfolio of Investments (continued)
Columbia Capital Allocation Conservative Portfolio, January 31, 2018
Fair value measurements (continued)
The following table is a summary of the inputs used to value the Fund’s investments at January 31, 2018:
| | Level 1
quoted prices
in active
markets for
identical
assets ($) | Level 2
other
significant
observable
inputs ($) | Level 3
significant
unobservable
inputs ($) | Investments
measured at
net asset
value ($) | Total ($) |
| Investments | | | | | |
| Alternative Strategies Funds | 20,227,010 | — | — | — | 20,227,010 |
| Common Stocks | | | | | |
| Consumer Discretionary | 373,220 | 803,568 | — | — | 1,176,788 |
| Consumer Staples | 89,406 | 782,352 | — | — | 871,758 |
| Energy | 115,958 | 390,282 | — | — | 506,240 |
| Financials | 536,874 | 1,589,425 | — | — | 2,126,299 |
| Health Care | 484,725 | 750,663 | — | — | 1,235,388 |
| Industrials | 448,880 | 1,075,449 | — | — | 1,524,329 |
| Information Technology | 526,331 | 477,956 | — | — | 1,004,287 |
| Materials | 151,753 | 624,757 | — | — | 776,510 |
| Real Estate | 185,706 | 236,414 | — | — | 422,120 |
| Telecommunication Services | 18,459 | 261,514 | — | — | 279,973 |
| Utilities | 92,111 | 204,147 | — | — | 296,258 |
| Total Common Stocks | 3,023,423 | 7,196,527 | — | — | 10,219,950 |
| Equity Funds | 47,687,560 | — | — | — | 47,687,560 |
| Fixed-Income Funds | 148,561,323 | — | — | — | 148,561,323 |
| Preferred Stocks | | | | | |
| Consumer Discretionary | — | 120,652 | — | — | 120,652 |
| Rights | | | | | |
| Industrials | — | 1,221 | — | — | 1,221 |
| Money Market Funds | — | — | — | 28,353,621 | 28,353,621 |
| Total Investments | 219,499,316 | 7,318,400 | — | 28,353,621 | 255,171,337 |
| Derivatives | | | | | |
| Asset | | | | | |
| Forward Foreign Currency Exchange Contracts | — | 7,926 | — | — | 7,926 |
| Futures Contracts | 74,597 | — | — | — | 74,597 |
| Swap Contracts | — | 23,173 | — | — | 23,173 |
| Liability | | | | | |
| Forward Foreign Currency Exchange Contracts | — | (3,889) | — | — | (3,889) |
| Futures Contracts | (517,764) | — | — | — | (517,764) |
| Total | 219,056,149 | 7,345,610 | — | 28,353,621 | 254,755,380 |
See the Portfolio of Investments for all investment classifications not indicated in the table.
The Fund’s assets assigned to the Level 2 input category are generally valued using the market approach, in which a security’s value is determined through reference to prices and information from market transactions for similar or identical assets. These assets include certain foreign securities for which a third party statistical pricing service may be employed for purposes of fair market valuation. The model utilized by such third party statistical pricing service takes into account a security’s correlation to available market data including, but not limited to, intraday index, ADR, and exchange-traded fund movements.
Derivative instruments are valued at unrealized appreciation (depreciation).
There were no transfers of financial assets between levels during the period.
The accompanying Notes to Financial Statements are an integral part of this statement.
| 30 | Columbia Capital Allocation Portfolios | Annual Report 2018 |
Portfolio of Investments
Columbia Capital Allocation Moderate Conservative Portfolio, January 31, 2018
(Percentages represent value of investments compared to net assets)
| Alternative Strategies Funds 7.0% |
| | Shares | Value ($) |
| Columbia Absolute Return Currency and Income Fund, Institutional 3 Class(a),(b) | 179,129 | 1,832,496 |
| Columbia Alternative Beta Fund, Institutional 3 Class(a) | 468,857 | 4,411,947 |
| Columbia Commodity Strategy Fund, Institutional 3 Class(a) | 1,229,507 | 7,217,204 |
| Columbia Diversified Absolute Return Fund, Institutional 3 Class(a),(b) | 948,150 | 9,225,497 |
| Columbia Multi-Asset Income Fund, Institutional 3 Class(a) | 2,003,128 | 19,911,089 |
Total Alternative Strategies Funds
(Cost $42,753,171) | 42,598,233 |
|
| Common Stocks 2.6% |
| Issuer | Shares | Value ($) |
| Consumer Discretionary 0.3% |
| Auto Components —% |
| Dana, Inc. | 540 | 17,815 |
| Dorman Products, Inc.(b) | 450 | 33,948 |
| Faurecia | 369 | 33,159 |
| Total | | 84,922 |
| Automobiles 0.1% |
| Fiat Chrysler Automobiles NV(b) | 2,443 | 59,030 |
| Peugeot SA | 8,045 | 180,688 |
| Subaru Corp. | 5,700 | 189,858 |
| Suzuki Motor Corp. | 3,200 | 183,792 |
| Winnebago Industries, Inc. | 50 | 2,273 |
| Total | | 615,641 |
| Diversified Consumer Services —% |
| Adtalem Global Education, Inc.(b) | 750 | 34,500 |
| Sotheby’s (b) | 450 | 23,742 |
| Weight Watchers International, Inc.(b) | 410 | 26,359 |
| Total | | 84,601 |
| Hotels, Restaurants & Leisure 0.1% |
| Bloomin’ Brands, Inc. | 580 | 12,777 |
| Brinker International, Inc. | 150 | 5,451 |
| Cracker Barrel Old Country Store, Inc. | 165 | 29,119 |
| Dave & Buster’s Entertainment, Inc.(b) | 95 | 4,465 |
| Ruth’s Hospitality Group, Inc. | 1,322 | 31,332 |
| Common Stocks (continued) |
| Issuer | Shares | Value ($) |
| Sonic Corp. | 670 | 17,313 |
| TUI AG | 6,972 | 157,694 |
| Total | | 258,151 |
| Household Durables 0.1% |
| Electrolux AB, Class B | 2,583 | 91,193 |
| La-Z-Boy, Inc. | 945 | 28,492 |
| MDC Holdings, Inc. | 194 | 6,539 |
| Persimmon PLC | 4,527 | 160,820 |
| Taylor Wimpey PLC | 64,204 | 173,751 |
| Zagg, Inc.(b) | 1,500 | 25,050 |
| Total | | 485,845 |
| Internet & Direct Marketing Retail —% |
| Nutrisystem, Inc. | 100 | 4,325 |
| PetMed Express, Inc. | 650 | 29,380 |
| Total | | 33,705 |
| Leisure Products —% |
| Sturm Ruger & Co., Inc. | 340 | 18,003 |
| Media —% |
| Entravision Communications Corp., Class A | 3,500 | 24,325 |
| Gannett Co., Inc. | 2,685 | 31,683 |
| Gray Television, Inc.(b) | 800 | 13,080 |
| New York Times Co. (The), Class A | 495 | 11,509 |
| Total | | 80,597 |
| Specialty Retail —% |
| Buckle, Inc. (The) | 300 | 6,015 |
| Finish Line, Inc., Class A (The) | 2,000 | 22,660 |
| Hibbett Sports, Inc.(b) | 800 | 18,080 |
| Restoration Hardware Holdings, Inc.(b) | 325 | 30,547 |
| Sleep Number Corp.(b) | 850 | 31,994 |
| Tailored Brands, Inc. | 300 | 7,257 |
| Tilly’s, Inc. | 500 | 7,460 |
| Total | | 124,013 |
| Textiles, Apparel & Luxury Goods —% |
| Deckers Outdoor Corp.(b) | 427 | 36,598 |
| Movado Group, Inc. | 955 | 29,223 |
| Total | | 65,821 |
| Total Consumer Discretionary | 1,851,299 |
The accompanying Notes to Financial Statements are an integral part of this statement.
Columbia Capital Allocation Portfolios | Annual Report 2018
| 31 |
Portfolio of Investments (continued)
Columbia Capital Allocation Moderate Conservative Portfolio, January 31, 2018
| Common Stocks (continued) |
| Issuer | Shares | Value ($) |
| Consumer Staples 0.2% |
| Beverages —% |
| Boston Beer Co., Inc. (The), Class A(b) | 110 | 20,883 |
| Food & Staples Retailing 0.1% |
| Ingles Markets, Inc., Class A | 250 | 8,400 |
| J. Sainsbury PLC | 30,930 | 110,888 |
| Jeronimo Martins SGPS SA | 6,106 | 130,050 |
| SUPERVALU, Inc.(b) | 540 | 8,554 |
| United Natural Foods, Inc.(b) | 350 | 16,660 |
| Wesfarmers Ltd. | 2,530 | 89,240 |
| Woolworths Group Ltd. | 5,264 | 114,327 |
| Total | | 478,119 |
| Food Products 0.1% |
| Dean Foods Co. | 377 | 3,910 |
| John B. Sanfilippo & Son, Inc. | 350 | 21,917 |
| Marine Harvest ASA | 1,621 | 28,061 |
| Nestlé SA, Registered Shares | 1,200 | 103,684 |
| Sanderson Farms, Inc. | 244 | 30,964 |
| WH Group Ltd. | 144,500 | 178,660 |
| Total | | 367,196 |
| Household Products —% |
| Central Garden & Pet Co., Class A(b) | 400 | 15,088 |
| Personal Products —% |
| Unilever NV-CVA | 2,081 | 120,528 |
| Usana Health Sciences, Inc.(b) | 240 | 17,916 |
| Total | | 138,444 |
| Tobacco —% |
| Imperial Brands PLC | 4,382 | 180,339 |
| Swedish Match AB | 3,480 | 140,968 |
| Total | | 321,307 |
| Total Consumer Staples | 1,341,037 |
| Energy 0.1% |
| Energy Equipment & Services —% |
| Archrock, Inc. | 2,245 | 20,878 |
| Exterran Corp.(b) | 950 | 27,436 |
| McDermott International, Inc.(b) | 2,900 | 25,462 |
| Rowan Companies PLC, Class A(b) | 2,100 | 30,912 |
| Total | | 104,688 |
| Common Stocks (continued) |
| Issuer | Shares | Value ($) |
| Oil, Gas & Consumable Fuels 0.1% |
| Caltex Australia Ltd. | 548 | 15,338 |
| CVR Energy, Inc. | 300 | 10,737 |
| OMV AG | 2,600 | 167,406 |
| Par Pacific Holdings, Inc.(b) | 350 | 6,381 |
| Peabody Energy Corp.(b) | 300 | 12,123 |
| Repsol SA | 9,847 | 185,278 |
| REX American Resources Corp.(b) | 280 | 22,862 |
| Royal Dutch Shell PLC, Class B | 6,456 | 228,797 |
| Ultra Petroleum Corp.(b) | 3,400 | 23,732 |
| W&T Offshore, Inc.(b) | 2,900 | 14,036 |
| Total | | 686,690 |
| Total Energy | 791,378 |
| Financials 0.5% |
| Banks 0.3% |
| BancFirst Corp. | 70 | 3,903 |
| Bancorp, Inc. (The)(b) | 400 | 4,228 |
| BancorpSouth Bank | 150 | 5,033 |
| Bank Hapoalim BM | 22,387 | 167,597 |
| Banner Corp. | 160 | 8,694 |
| Cathay General Bancorp | 775 | 33,898 |
| Central Pacific Financial Corp. | 360 | 10,645 |
| CoBiz Financial, Inc. | 200 | 4,012 |
| Customers Bancorp, Inc.(b) | 841 | 25,777 |
| Enterprise Financial Services Corp. | 205 | 9,973 |
| First Citizens BancShares Inc., Class A | 85 | 36,160 |
| First Financial Bancorp | 1,040 | 29,640 |
| First Merchants Corp. | 600 | 25,896 |
| Hancock Holding Co. | 700 | 37,590 |
| Heritage Financial Corp. | 500 | 15,400 |
| ING Groep NV | 2,557 | 50,255 |
| International Bancshares Corp. | 585 | 24,277 |
| Intesa Sanpaolo SpA | 30,438 | 119,436 |
| Japan Post Bank Co., Ltd. | 3,200 | 43,312 |
| KBC Group NV | 1,081 | 103,880 |
| Lloyds Banking Group PLC | 148,760 | 146,817 |
| Preferred Bank/Los Angeles | 450 | 28,989 |
| S&T Bancorp, Inc. | 700 | 28,252 |
| Sandy Spring Bancorp, Inc. | 325 | 12,292 |
The accompanying Notes to Financial Statements are an integral part of this statement.
| 32 | Columbia Capital Allocation Portfolios | Annual Report 2018 |
Portfolio of Investments (continued)
Columbia Capital Allocation Moderate Conservative Portfolio, January 31, 2018
| Common Stocks (continued) |
| Issuer | Shares | Value ($) |
| Societe Generale SA | 3,710 | 215,821 |
| Swedbank AB, Class A | 5,482 | 140,113 |
| Triumph Bancorp, Inc.(b) | 135 | 5,198 |
| Valley National Bancorp | 2,700 | 33,939 |
| WesBanco, Inc. | 100 | 4,101 |
| Westpac Banking Corp. | 4,624 | 115,207 |
| Wintrust Financial Corp. | 445 | 38,225 |
| Total | | 1,528,560 |
| Capital Markets —% |
| 3i Group PLC | 14,100 | 186,465 |
| Arlington Asset Investment Corp., Class A | 288 | 3,024 |
| Cohen & Steers, Inc. | 480 | 19,570 |
| Houlihan Lokey, Inc. | 550 | 26,235 |
| Total | | 235,294 |
| Consumer Finance —% |
| Green Dot Corp., Class A(b) | 500 | 30,630 |
| Nelnet, Inc., Class A | 485 | 25,273 |
| Total | | 55,903 |
| Diversified Financial Services —% |
| ORIX Corp. | 10,300 | 192,936 |
| Insurance 0.2% |
| Allianz SE, Registered Shares | 986 | 249,118 |
| American Equity Investment Life Holding Co. | 1,000 | 33,000 |
| Assicurazioni Generali SpA | 9,368 | 185,745 |
| AXA SA | 6,683 | 219,836 |
| CNO Financial Group, Inc. | 1,400 | 34,426 |
| CNP Assurances | 3,314 | 84,923 |
| Health Insurance Innovations, Inc., Class A(b) | 700 | 18,165 |
| Legal & General Group PLC | 10,019 | 38,494 |
| MS&AD Insurance Group Holdings, Inc. | 2,100 | 71,734 |
| Swiss Life Holding AG, Registered Shares | 261 | 98,007 |
| Third Point Reinsurance Ltd.(b) | 200 | 2,850 |
| Universal Insurance Holdings, Inc. | 756 | 22,226 |
| Total | | 1,058,524 |
| Common Stocks (continued) |
| Issuer | Shares | Value ($) |
| Mortgage Real Estate Investment Trusts (REITS) —% |
| AG Mortgage Investment Trust, Inc. | 400 | 6,976 |
| ARMOUR Residential REIT, Inc. | 900 | 21,069 |
| Invesco Mortgage Capital, Inc. | 1,610 | 26,146 |
| Total | | 54,191 |
| Thrifts & Mortgage Finance —% |
| Essent Group Ltd.(b) | 840 | 39,077 |
| Federal Agricultural Mortgage Corp. | 350 | 28,088 |
| Flagstar Bancorp, Inc.(b) | 760 | 28,310 |
| MGIC Investment Corp.(b) | 2,755 | 40,829 |
| Radian Group, Inc. | 500 | 11,035 |
| Walker & Dunlop, Inc.(b) | 570 | 26,477 |
| Washington Federal, Inc. | 795 | 28,540 |
| Total | | 202,356 |
| Total Financials | 3,327,764 |
| Health Care 0.3% |
| Biotechnology 0.1% |
| Alder Biopharmaceuticals, Inc.(b) | 1,444 | 20,433 |
| Atara Biotherapeutics, Inc.(b) | 550 | 20,790 |
| bluebird bio, Inc.(b) | 125 | 25,612 |
| Blueprint Medicines Corp.(b) | 175 | 13,764 |
| Clovis Oncology, Inc.(b) | 155 | 9,377 |
| Coherus Biosciences, Inc.(b) | 275 | 2,778 |
| Dynavax Technologies Corp.(b) | 640 | 10,304 |
| Eagle Pharmaceuticals, Inc.(b) | 55 | 3,287 |
| Global Blood Therapeutics, Inc.(b) | 135 | 7,817 |
| Immunomedics, Inc.(b) | 1,050 | 17,503 |
| Insmed, Inc.(b) | 558 | 14,196 |
| Jounce Therapeutics, Inc.(b) | 588 | 14,218 |
| Keryx Biopharmaceuticals, Inc.(b) | 1,630 | 7,547 |
| Loxo Oncology, Inc.(b) | 160 | 16,235 |
| NewLink Genetics Corp.(b) | 1,150 | 9,487 |
| Nightstar Therapeutics PLC, ADR(b) | 608 | 8,652 |
| OncoMed Pharmaceuticals, Inc.(b) | 1,700 | 4,250 |
| Ovid Therapeutics, Inc.(b) | 1,154 | 9,809 |
| Puma Biotechnology, Inc.(b) | 260 | 17,381 |
| Sage Therapeutics, Inc.(b) | 140 | 26,572 |
| Shire PLC | 876 | 41,387 |
The accompanying Notes to Financial Statements are an integral part of this statement.
Columbia Capital Allocation Portfolios | Annual Report 2018
| 33 |
Portfolio of Investments (continued)
Columbia Capital Allocation Moderate Conservative Portfolio, January 31, 2018
| Common Stocks (continued) |
| Issuer | Shares | Value ($) |
| Spark Therapeutics, Inc.(b) | 279 | 15,638 |
| TESARO, Inc.(b) | 285 | 19,226 |
| Total | | 336,263 |
| Health Care Equipment & Supplies —% |
| Analogic Corp. | 366 | 30,341 |
| Angiodynamics, Inc.(b) | 1,110 | 19,325 |
| CONMED Corp. | 100 | 5,778 |
| Haemonetics Corp.(b) | 500 | 32,325 |
| Integer Holdings Corp.(b) | 600 | 30,090 |
| Lantheus Holdings, Inc.(b) | 1,312 | 30,176 |
| Masimo Corp.(b) | 365 | 34,398 |
| Total | | 182,433 |
| Health Care Providers & Services —% |
| Alfresa Holdings Corp. | 6,100 | 148,474 |
| Diplomat Pharmacy, Inc.(b) | 1,270 | 34,277 |
| Kindred Healthcare, Inc. | 575 | 5,290 |
| Molina Healthcare, Inc.(b) | 431 | 39,376 |
| Providence Service Corp. (The)(b) | 450 | 28,949 |
| Tivity Health, Inc.(b) | 800 | 31,000 |
| Triple-S Management Corp., Class B(b) | 1,030 | 23,669 |
| Total | | 311,035 |
| Life Sciences Tools & Services —% |
| Pra Health Sciences, Inc.(b) | 436 | 39,702 |
| Pharmaceuticals 0.2% |
| Aerie Pharmaceuticals, Inc.(b) | 290 | 15,907 |
| Bayer AG, Registered Shares | 1,172 | 153,396 |
| Corcept Therapeutics, Inc.(b) | 1,450 | 33,372 |
| GlaxoSmithKline PLC | 12,498 | 234,309 |
| Lannett Co., Inc.(b) | 1,190 | 24,216 |
| Novartis AG, Registered Shares | 1,446 | 130,812 |
| Novo Nordisk A/S, Class B | 416 | 23,137 |
| Odonate Therapeutics, Inc.(b) | 475 | 9,871 |
| Pacira Pharmaceuticals, Inc.(b) | 360 | 13,104 |
| Phibro Animal Health Corp., Class A | 650 | 22,132 |
| Roche Holding AG, Genusschein Shares | 1,188 | 292,868 |
| Common Stocks (continued) |
| Issuer | Shares | Value ($) |
| Sanofi | 1,395 | 123,177 |
| Supernus Pharmaceuticals, Inc.(b) | 325 | 12,691 |
| Total | | 1,088,992 |
| Total Health Care | 1,958,425 |
| Industrials 0.4% |
| Aerospace & Defense —% |
| Curtiss-Wright Corp. | 341 | 44,555 |
| Moog, Inc., Class A(b) | 51 | 4,593 |
| Total | | 49,148 |
| Air Freight & Logistics —% |
| Deutsche Post AG | 219 | 10,351 |
| Forward Air Corp. | 250 | 15,178 |
| Total | | 25,529 |
| Airlines 0.1% |
| Deutsche Lufthansa AG, Registered Shares | 5,572 | 198,821 |
| International Consolidated Airlines Group SA | 14,678 | 133,396 |
| Japan Airlines Co., Ltd. | 300 | 11,336 |
| Total | | 343,553 |
| Building Products —% |
| Caesarstone Ltd.(b) | 900 | 19,080 |
| Continental Building Product(b) | 1,115 | 31,722 |
| Total | | 50,802 |
| Commercial Services & Supplies —% |
| ACCO Brands Corp.(b) | 2,040 | 24,174 |
| Brady Corp., Class A | 175 | 6,694 |
| Essendant, Inc. | 1,900 | 17,195 |
| MSA Safety, Inc. | 400 | 31,324 |
| SP Plus Corp.(b) | 650 | 25,057 |
| Total | | 104,444 |
| Construction & Engineering 0.2% |
| ACS Actividades de Construccion y Servicios SA | 3,566 | 142,827 |
| CIMIC Group Ltd. | 2,782 | 105,642 |
| Comfort Systems U.S.A., Inc. | 250 | 10,650 |
| EMCOR Group, Inc. | 475 | 38,608 |
| Kajima Corp. | 18,000 | 178,706 |
| KBR, Inc. | 800 | 16,272 |
| Obayashi Corp. | 14,700 | 177,481 |
The accompanying Notes to Financial Statements are an integral part of this statement.
| 34 | Columbia Capital Allocation Portfolios | Annual Report 2018 |
Portfolio of Investments (continued)
Columbia Capital Allocation Moderate Conservative Portfolio, January 31, 2018
| Common Stocks (continued) |
| Issuer | Shares | Value ($) |
| Primoris Services Corp. | 1,080 | 28,080 |
| Taisei Corp. | 3,400 | 173,538 |
| Total | | 871,804 |
| Electrical Equipment —% |
| Atkore International Group, Inc.(b) | 1,100 | 25,718 |
| Generac Holdings, Inc.(b) | 705 | 34,495 |
| Vestas Wind Systems A/S | 1,565 | 106,779 |
| Total | | 166,992 |
| Machinery —% |
| Alamo Group, Inc. | 275 | 31,633 |
| Briggs & Stratton Corp. | 400 | 9,672 |
| EnPro Industries, Inc. | 100 | 8,799 |
| Global Brass & Copper Holdings, Inc. | 860 | 27,649 |
| Harsco Corp.(b) | 1,300 | 23,270 |
| Hillenbrand, Inc. | 700 | 31,010 |
| Kadant, Inc. | 229 | 22,957 |
| Mueller Industries, Inc. | 320 | 10,589 |
| RBC Bearings, Inc.(b) | 129 | 16,254 |
| Wabash National Corp. | 1,114 | 28,775 |
| Total | | 210,608 |
| Professional Services —% |
| Adecco Group AG, Registered Shares | 49 | 4,033 |
| Korn/Ferry International | 250 | 11,140 |
| RPX Corp. | 2,040 | 28,641 |
| TrueBlue, Inc.(b) | 400 | 10,940 |
| Total | | 54,754 |
| Road & Rail —% |
| ArcBest Corp. | 890 | 31,639 |
| Saia, Inc.(b) | 250 | 18,888 |
| Total | | 50,527 |
| Trading Companies & Distributors 0.1% |
| Applied Industrial Technologies, Inc. | 505 | 37,244 |
| Beacon Roofing Supply, Inc.(b) | 550 | 33,275 |
| ITOCHU Corp. | 10,700 | 210,540 |
| Marubeni Corp. | 25,200 | 189,528 |
| Total | | 470,587 |
| Total Industrials | 2,398,748 |
| Common Stocks (continued) |
| Issuer | Shares | Value ($) |
| Information Technology 0.3% |
| Communications Equipment —% |
| CalAmp Corp.(b) | 550 | 13,464 |
| Comtech Telecommunications Corp. | 1,200 | 25,956 |
| Netscout Systems, Inc.(b) | 1,200 | 34,200 |
| Total | | 73,620 |
| Electronic Equipment, Instruments & Components 0.1% |
| Anixter International, Inc.(b) | 275 | 23,018 |
| Benchmark Electronics, Inc.(b) | 910 | 26,345 |
| ePlus, Inc.(b) | 200 | 15,440 |
| Hitachi Ltd. | 28,000 | 223,434 |
| KEMET Corp.(b) | 890 | 18,120 |
| Methode Electronics, Inc. | 275 | 11,234 |
| Sanmina Corp.(b) | 855 | 22,358 |
| Scansource, Inc.(b) | 440 | 15,048 |
| Tech Data Corp.(b) | 325 | 32,588 |
| Vishay Intertechnology, Inc. | 1,590 | 34,900 |
| Total | | 422,485 |
| Internet Software & Services 0.1% |
| j2 Global, Inc. | 404 | 32,316 |
| Mixi, Inc. | 3,500 | 154,546 |
| New Relic, Inc.(b) | 350 | 20,906 |
| Stamps.com, Inc.(b) | 180 | 36,693 |
| Web.com Group, Inc.(b) | 840 | 19,530 |
| Total | | 263,991 |
| IT Services —% |
| CACI International, Inc., Class A(b) | 80 | 11,244 |
| CSG Systems International, Inc. | 350 | 15,810 |
| EVERTEC, Inc. | 462 | 7,230 |
| Fujitsu Ltd. | 9,000 | 66,452 |
| MAXIMUS, Inc. | 525 | 35,795 |
| Perficient, Inc.(b) | 360 | 6,973 |
| Travelport Worldwide Ltd. | 2,220 | 30,214 |
| TTEC Holdings, Inc. | 550 | 21,835 |
| Total | | 195,553 |
The accompanying Notes to Financial Statements are an integral part of this statement.
Columbia Capital Allocation Portfolios | Annual Report 2018
| 35 |
Portfolio of Investments (continued)
Columbia Capital Allocation Moderate Conservative Portfolio, January 31, 2018
| Common Stocks (continued) |
| Issuer | Shares | Value ($) |
| Semiconductors & Semiconductor Equipment —% |
| Amkor Technology, Inc.(b) | 2,630 | 26,458 |
| Cirrus Logic, Inc.(b) | 550 | 27,264 |
| Diodes, Inc.(b) | 1,009 | 28,444 |
| Formfactor, Inc.(b) | 1,700 | 24,395 |
| Rudolph Technologies, Inc.(b) | 490 | 12,838 |
| Synaptics, Inc.(b) | 680 | 29,471 |
| Xcerra Corp.(b) | 2,233 | 22,285 |
| Total | | 171,155 |
| Software —% |
| Aspen Technology, Inc.(b) | 580 | 44,921 |
| Imperva, Inc.(b) | 650 | 28,437 |
| Paycom Software, Inc.(b) | 100 | 9,164 |
| Paylocity Holding Corp.(b) | 400 | 20,916 |
| Progress Software Corp. | 735 | 36,625 |
| Proofpoint, Inc.(b) | 362 | 36,931 |
| VASCO Data Security International, Inc.(b) | 595 | 8,568 |
| Verint Systems, Inc.(b) | 150 | 6,263 |
| Total | | 191,825 |
| Technology Hardware, Storage & Peripherals 0.1% |
| Brother Industries Ltd. | 2,900 | 74,498 |
| Canon, Inc. | 5,400 | 215,460 |
| Total | | 289,958 |
| Total Information Technology | 1,608,587 |
| Materials 0.2% |
| Chemicals 0.1% |
| BASF SE | 588 | 68,857 |
| Covestro AG | 260 | 29,885 |
| Ferro Corp.(b) | 100 | 2,352 |
| Innospec, Inc. | 395 | 28,361 |
| Kronos Worldwide, Inc. | 980 | 26,901 |
| Mitsubishi Chemical Holdings Corp. | 18,200 | 198,495 |
| Quaker Chemical Corp. | 50 | 7,695 |
| Trinseo SA | 460 | 37,927 |
| Total | | 400,473 |
| Containers & Packaging —% |
| Greif, Inc., Class A | 360 | 21,283 |
| Common Stocks (continued) |
| Issuer | Shares | Value ($) |
| Metals & Mining 0.1% |
| Fortescue Metals Group Ltd. | 46,281 | 183,792 |
| Materion Corp. | 560 | 27,832 |
| Rio Tinto PLC | 4,083 | 227,368 |
| South32 Ltd. | 7,356 | 22,589 |
| Warrior Met Coal, Inc. | 1,000 | 27,970 |
| Total | | 489,551 |
| Paper & Forest Products —% |
| Boise Cascade Co. | 700 | 31,115 |
| Louisiana-Pacific Corp.(b) | 1,200 | 35,532 |
| UPM-Kymmene OYJ | 6,663 | 224,514 |
| Total | | 291,161 |
| Total Materials | 1,202,468 |
| Real Estate 0.1% |
| Equity Real Estate Investment Trusts (REITS) —% |
| CareTrust REIT, Inc. | 480 | 7,627 |
| CorEnergy Infrastructure Trust, Inc. | 708 | 27,138 |
| DiamondRock Hospitality Co. | 1,900 | 22,344 |
| Four Corners Property Trust, Inc. | 200 | 4,720 |
| Getty Realty Corp. | 100 | 2,624 |
| Lexington Realty Trust | 1,500 | 13,530 |
| National Health Investors, Inc. | 450 | 31,738 |
| Pebblebrook Hotel Trust | 800 | 31,200 |
| Potlatch Corp. | 200 | 10,580 |
| Preferred Apartment Communities, Inc., Class A | 440 | 7,335 |
| PS Business Parks, Inc. | 240 | 29,306 |
| Ryman Hospitality Properties, Inc. | 415 | 31,768 |
| Summit Hotel Properties, Inc. | 1,570 | 24,319 |
| Sunstone Hotel Investors, Inc. | 650 | 10,953 |
| Tier REIT, Inc. | 700 | 13,587 |
| Xenia Hotels & Resorts, Inc. | 1,380 | 30,636 |
| Total | | 299,405 |
The accompanying Notes to Financial Statements are an integral part of this statement.
| 36 | Columbia Capital Allocation Portfolios | Annual Report 2018 |
Portfolio of Investments (continued)
Columbia Capital Allocation Moderate Conservative Portfolio, January 31, 2018
| Common Stocks (continued) |
| Issuer | Shares | Value ($) |
| Real Estate Management & Development 0.1% |
| CK Asset Holdings Ltd. | 2,547 | 24,236 |
| HFF, Inc., Class A | 230 | 11,318 |
| Kerry Properties Ltd. | 33,000 | 157,773 |
| Sun Hung Kai Properties Ltd. | 10,863 | 187,809 |
| Total | | 381,136 |
| Total Real Estate | 680,541 |
| Telecommunication Services 0.1% |
| Diversified Telecommunication Services 0.1% |
| ATN International, Inc. | 50 | 2,968 |
| Nippon Telegraph & Telephone Corp. | 3,100 | 148,443 |
| Orange SA | 678 | 12,244 |
| Telefonica SA | 5,859 | 60,034 |
| Telenor ASA | 7,745 | 181,345 |
| Total | | 405,034 |
| Wireless Telecommunication Services —% |
| Boingo Wireless, Inc.(b) | 1,100 | 26,675 |
| Total Telecommunication Services | 431,709 |
| Utilities 0.1% |
| Electric Utilities 0.1% |
| Allete, Inc. | 275 | 19,921 |
| El Paso Electric Co. | 200 | 10,440 |
| Enel SpA | 23,086 | 146,465 |
| IDACORP, Inc. | 50 | 4,314 |
| PNM Resources, Inc. | 100 | 3,810 |
| Portland General Electric Co. | 721 | 30,535 |
| Total | | 215,485 |
| Gas Utilities —% |
| Chesapeake Utilities Corp. | 315 | 23,153 |
| Southwest Gas Corp. | 261 | 19,204 |
| Total | | 42,357 |
| Independent Power and Renewable Electricity Producers —% |
| Ormat Technologies, Inc. | 400 | 28,032 |
| Multi-Utilities —% |
| Engie SA | 9,556 | 165,862 |
| Common Stocks (continued) |
| Issuer | Shares | Value ($) |
| Water Utilities —% |
| SJW Corp. | 280 | 16,755 |
| Total Utilities | 468,491 |
Total Common Stocks
(Cost $13,468,969) | 16,060,447 |
|
| Equity Funds 33.0% |
| | Shares | Value ($) |
| International 8.0% |
| Columbia Contrarian Europe Fund, Institutional 3 Class(a) | 2,000,650 | 15,264,957 |
| Columbia Emerging Markets Fund, Institutional 3 Class(a) | 618,126 | 9,179,176 |
| Columbia Overseas Value Fund, Institutional 3 Class(a) | 2,040,703 | 22,162,030 |
| Columbia Pacific/Asia Fund, Institutional 3 Class(a) | 141,474 | 1,706,179 |
| Total | 48,312,342 |
| U.S. Large Cap 24.0% |
| Columbia Contrarian Core Fund, Institutional 3 Class(a) | 714,178 | 19,789,872 |
| Columbia Disciplined Core Fund, Institutional 3 Class(a) | 2,645,533 | 33,571,816 |
| Columbia Disciplined Growth Fund, Institutional 3 Class(a) | 1,973,248 | 19,870,604 |
| Columbia Disciplined Value Fund, Institutional 3 Class(a) | 3,032,102 | 34,080,824 |
| Columbia Large Cap Growth Fund, Institutional 3 Class(a) | 295,972 | 13,158,927 |
| Columbia Select Large Cap Equity Fund, Institutional 3 Class(a) | 1,677,191 | 25,308,814 |
| Total | 145,780,857 |
| U.S. Small Cap 1.0% |
| Columbia Disciplined Small Core Fund, Institutional 3 Class(a) | 669,585 | 6,006,175 |
Total Equity Funds
(Cost $160,266,991) | 200,099,374 |
|
| Fixed-Income Funds 47.2% |
| | |
| Emerging Markets 2.1% |
| Columbia Emerging Markets Bond Fund, Institutional 3 Class(a) | 1,055,273 | 12,599,967 |
| High Yield 3.5% |
| Columbia Income Opportunities Fund, Institutional 3 Class(a) | 2,142,454 | 21,253,141 |
The accompanying Notes to Financial Statements are an integral part of this statement.
Columbia Capital Allocation Portfolios | Annual Report 2018
| 37 |
Portfolio of Investments (continued)
Columbia Capital Allocation Moderate Conservative Portfolio, January 31, 2018
| Fixed-Income Funds (continued) |
| | Shares | Value ($) |
| Inflation Protected Securities 0.9% |
| Columbia Inflation Protected Securities Fund, Institutional 3 Class(a) | 597,419 | 5,669,510 |
| Investment Grade 40.7% |
| Columbia Corporate Income Fund, Institutional 3 Class(a) | 5,783,333 | 59,047,826 |
| Columbia Limited Duration Credit Fund, Institutional 3 Class(a) | 1,384,400 | 13,525,586 |
| Columbia Mortgage Opportunities Fund, Institutional 3 Class(a) | 918,629 | 8,975,009 |
| Columbia Total Return Bond Fund, Institutional 3 Class(a) | 3,424,403 | 30,682,653 |
| Columbia U.S. Government Mortgage Fund, Institutional 3 Class(a) | 15,250,681 | 81,438,634 |
| Columbia U.S. Treasury Index Fund, Institutional 3 Class(a) | 4,906,987 | 53,682,440 |
| Total | 247,352,148 |
Total Fixed-Income Funds
(Cost $291,310,323) | 286,874,766 |
| Preferred Stocks —% |
| Issuer | Coupon
Rate | Shares | Value ($) |
| Consumer Discretionary —% |
| Auto Components —% |
| Schaeffler AG | — | 9,285 | 184,618 |
| Total Consumer Discretionary | 184,618 |
Total Preferred Stocks
(Cost $135,333) | 184,618 |
| Rights —% |
| Issuer | Shares | Value ($) |
| Industrials —% |
| Construction & Engineering —% |
| ACS Actividades de Construccion y Servicios SA(b) | 3,566 | 1,868 |
| Total Industrials | 1,868 |
Total Rights
(Cost $1,957) | 1,868 |
|
| Money Market Funds 9.9% |
| | Shares | Value ($) |
| Columbia Short-Term Cash Fund, 1.475%(a),(c) | 59,800,964 | 59,800,964 |
Total Money Market Funds
(Cost $59,800,730) | 59,800,964 |
Total Investments
(Cost: $567,737,474) | 605,620,270 |
| Other Assets & Liabilities, Net | | 1,748,791 |
| Net Assets | 607,369,061 |
At January 31, 2018, securities and/or cash totaling $1,655,145 were pledged as collateral.
Investments in derivatives
| Forward foreign currency exchange contracts |
Currency to
be sold | Currency to
be purchased | Counterparty | Settlement
date | Unrealized
appreciation ($) | Unrealized
depreciation ($) |
| 387,000 ILS | 112,765 USD | JPMorgan | 03/14/2018 | — | (604) |
| 12,417,000 JPY | 111,997 USD | JPMorgan | 03/14/2018 | — | (1,988) |
| 884,000 NOK | 112,538 USD | JPMorgan | 03/14/2018 | — | (2,272) |
| 450,000 SEK | 56,176 USD | JPMorgan | 03/14/2018 | — | (1,080) |
| 101,469 USD | 127,000 AUD | JPMorgan | 03/14/2018 | 853 | — |
| 213,676 USD | 205,000 CHF | JPMorgan | 03/14/2018 | 7,236 | — |
| 67,490 USD | 410,000 DKK | JPMorgan | 03/14/2018 | 1,088 | — |
| 73,541 USD | 53,000 GBP | JPMorgan | 03/14/2018 | 1,822 | — |
| 145,986 USD | 193,000 SGD | JPMorgan | 03/14/2018 | 1,257 | — |
| Total | | | | 12,256 | (5,944) |
The accompanying Notes to Financial Statements are an integral part of this statement.
| 38 | Columbia Capital Allocation Portfolios | Annual Report 2018 |
Portfolio of Investments (continued)
Columbia Capital Allocation Moderate Conservative Portfolio, January 31, 2018
| Long futures contracts |
| Description | Number of
contracts | Expiration
date | Trading
currency | Notional
amount | Value/Unrealized
appreciation ($) | Value/Unrealized
depreciation ($) |
| MSCI Emerging Markets Index | 100 | 03/2018 | USD | 6,289,000 | 191,275 | — |
| Russell 2000 E-mini | 24 | 03/2018 | USD | 1,891,200 | 62,101 | — |
| S&P 500 E-mini | 52 | 03/2018 | USD | 7,347,080 | 506,481 | — |
| TOPIX Index | 30 | 03/2018 | JPY | 551,850,000 | 155,969 | — |
| U.S. Long Bond | 161 | 03/2018 | USD | 24,327,351 | — | (761,221) |
| U.S. Ultra Bond | 10 | 03/2018 | USD | 1,637,472 | — | (41,721) |
| Total | | | | | 915,826 | (802,942) |
| Short futures contracts |
| Description | Number of
contracts | Expiration
date | Trading
currency | Notional
amount | Value/Unrealized
appreciation ($) | Value/Unrealized
depreciation ($) |
| FTSE 100 Index | (28) | 03/2018 | GBP | (2,090,760) | — | (21,838) |
| Cleared credit default swap contracts - sell protection |
Reference
entity | Counterparty | Maturity
date | Receive
fixed
rate
(%) | Payment
frequency | Implied
credit
spread
(%) | Notional
currency | Notional
amount | Value
($) | Upfront
payments
($) | Upfront
receipts
($) | Unrealized
appreciation
($) | Unrealized
depreciation
($) |
| Markit CDX North America High Yield Index, Series 29 | Morgan Stanley | 12/20/2022 | 5.000 | Quarterly | 3.011 | USD | 9,000,000 | 69,490 | — | — | 69,490 | — |
Notes to Portfolio of Investments
| (a) | As defined in the Investment Company Act of 1940, an affiliated company is one in which the Fund owns 5% or more of the company’s outstanding voting securities, or a company which is under common ownership or control with the Fund. Holdings and transactions in these affiliated companies during the year ended January 31, 2018 are as follows: |
| Issuer | Beginning
shares | Shares
purchased | Shares
sold | Ending
shares | Capital gain
distributions —
affiliated
issuers ($) | Realized gain
(loss) —
affiliated
issuers ($) | Net change in
unrealized
appreciation
(depreciation) —
affiliated
issuers ($) | Dividends —
affiliated
issuers ($) | Value —
affiliated
issuers
at end of
period ($) |
| Columbia Absolute Return Currency and Income Fund, Class I Shares |
| | 187,205 | 16 | (187,221)* | — | — | 9,070 | (143,072) | — | — |
| Columbia Absolute Return Currency and Income Fund, Institutional 3 Class |
| | — | 197,044* | (17,915) | 179,129 | — | 8,393 | (10,764) | — | 1,832,496 |
| Columbia Alternative Beta Fund, Class I Shares |
| | 458,101 | — | (458,101)* | — | — | — | 389,274 | — | — |
| Columbia Alternative Beta Fund, Institutional 3 Class |
| | — | 468,857* | — | 468,857 | — | — | (253,934) | 103,305 | 4,411,947 |
| Columbia Commodity Strategy Fund, Class I Shares |
| | 1,327,610 | 17 | (1,327,627)* | — | — | (1,881) | 104,472 | — | — |
| Columbia Commodity Strategy Fund, Institutional 3 Class |
| | — | 1,353,414* | (123,907) | 1,229,507 | — | (38,121) | 171,540 | 11,037 | 7,217,204 |
| Columbia Contrarian Core Fund, Class I Shares |
| | 880,130 | 5 | (880,135)* | — | — | 537,634 | (4,282,617) | — | — |
| Columbia Contrarian Core Fund, Institutional 3 Class |
| | — | 853,161* | (138,983) | 714,178 | 890,864 | 1,524,779 | 5,706,048 | 197,707 | 19,789,872 |
| Columbia Contrarian Europe Fund, Class I Shares |
| | 2,509,671 | — | (2,509,671)* | — | — | — | 2,180,232 | — | — |
| Columbia Contrarian Europe Fund, Institutional 3 Class |
| | — | 2,655,921* | (655,271) | 2,000,650 | — | 122,313 | 1,549,272 | 275,765 | 15,264,957 |
The accompanying Notes to Financial Statements are an integral part of this statement.
Columbia Capital Allocation Portfolios | Annual Report 2018
| 39 |
Portfolio of Investments (continued)
Columbia Capital Allocation Moderate Conservative Portfolio, January 31, 2018
Notes to Portfolio of Investments (continued)
| Issuer | Beginning
shares | Shares
purchased | Shares
sold | Ending
shares | Capital gain
distributions —
affiliated
issuers ($) | Realized gain
(loss) —
affiliated
issuers ($) | Net change in
unrealized
appreciation
(depreciation) —
affiliated
issuers ($) | Dividends —
affiliated
issuers ($) | Value —
affiliated
issuers
at end of
period ($) |
| Columbia Corporate Income Fund, Class I Shares |
| | 5,559,903 | 627,784 | (6,187,687)* | — | — | (36,571) | 703,697 | 237,778 | — |
| Columbia Corporate Income Fund, Institutional 3 Class |
| | — | 6,266,987* | (483,654) | 5,783,333 | — | (17,304) | 495,141 | 1,458,618 | 59,047,826 |
| Columbia Disciplined Core Fund, Class I Shares |
| | 3,202,201 | 19 | (3,202,220)* | — | — | 867,467 | (6,166,317) | — | — |
| Columbia Disciplined Core Fund, Institutional 3 Class |
| | — | 3,194,370* | (548,837) | 2,645,533 | 1,422,307 | 3,104,898 | 8,924,624 | 567,834 | 33,571,816 |
| Columbia Disciplined Growth Fund, Class I Shares |
| | 2,258,281 | 27 | (2,258,308)* | — | — | 33,162 | (20,104) | — | — |
| Columbia Disciplined Growth Fund, Institutional 3 Class |
| | — | 2,441,135* | (467,887) | 1,973,248 | 2,214,193 | 791,074 | 2,586,160 | 120,464 | 19,870,604 |
| Columbia Disciplined Small Core Fund, Class I Shares |
| | 618,263 | 9 | (618,272)* | — | — | (129,646) | 1,708,331 | — | — |
| Columbia Disciplined Small Core Fund, Institutional 3 Class |
| | — | 717,925* | (48,340) | 669,585 | 943,476 | (454,865) | (1,518,974) | 32,445 | 6,006,175 |
| Columbia Disciplined Value Fund, Class I Shares |
| | 3,515,184 | 17 | (3,515,201)* | — | — | 200,384 | (2,308,690) | — | — |
| Columbia Disciplined Value Fund, Institutional 3 Class |
| | — | 3,607,561* | (575,459) | 3,032,102 | 1,661,055 | 1,143,666 | 5,784,109 | 739,200 | 34,080,824 |
| Columbia Diversified Absolute Return Fund, Class I Shares |
| | 1,053,957 | 9 | (1,053,966)* | — | — | (17,036) | 520,432 | — | — |
| Columbia Diversified Absolute Return Fund, Institutional 3 Class |
| | — | 1,050,692* | (102,542) | 948,150 | — | (39,768) | (196,754) | — | 9,225,497 |
| Columbia Emerging Markets Bond Fund, Class I Shares |
| | 1,169,445 | 7,182 | (1,176,627)* | — | — | 18,149 | 72,395 | 82,628 | — |
| Columbia Emerging Markets Bond Fund, Institutional 3 Class |
| | — | 1,201,254* | (145,981) | 1,055,273 | — | 109,464 | 477,859 | 631,728 | 12,599,967 |
| Columbia Emerging Markets Fund, Class I Shares |
| | 883,010 | — | (883,010)* | — | — | — | (604,514) | — | — |
| Columbia Emerging Markets Fund, Institutional 3 Class |
| | — | 895,233* | (277,107) | 618,126 | — | 779,433 | 3,274,459 | 40,924 | 9,179,176 |
| Columbia Income Opportunities Fund, Class I Shares |
| | 2,252,027 | 9,065 | (2,261,092)* | — | — | 11,496 | 53,696 | 161,147 | — |
| Columbia Income Opportunities Fund, Institutional 3 Class |
| | — | 2,356,154* | (213,700) | 2,142,454 | — | 77,812 | (18,670) | 874,406 | 21,253,141 |
| Columbia Inflation Protected Securities Fund, Class I Shares |
| | 1,253,786 | 25 | (1,253,811)* | — | — | (639,137) | 533,185 | — | — |
| Columbia Inflation Protected Securities Fund, Institutional 3 Class |
| | — | 623,556* | (26,137) | 597,419 | — | (1,243) | 7,991 | 143,120 | 5,669,510 |
| Columbia Large Cap Growth Fund, Class I Shares |
| | 384,154 | 2 | (384,156)* | — | — | 472,247 | (2,465,266) | — | — |
The accompanying Notes to Financial Statements are an integral part of this statement.
| 40 | Columbia Capital Allocation Portfolios | Annual Report 2018 |
Portfolio of Investments (continued)
Columbia Capital Allocation Moderate Conservative Portfolio, January 31, 2018
Notes to Portfolio of Investments (continued)
| Issuer | Beginning
shares | Shares
purchased | Shares
sold | Ending
shares | Capital gain
distributions —
affiliated
issuers ($) | Realized gain
(loss) —
affiliated
issuers ($) | Net change in
unrealized
appreciation
(depreciation) —
affiliated
issuers ($) | Dividends —
affiliated
issuers ($) | Value —
affiliated
issuers
at end of
period ($) |
| Columbia Large Cap Growth Fund, Institutional 3 Class |
| | — | 370,736* | (74,764) | 295,972 | 723,221 | 1,178,033 | 3,713,217 | 31,357 | 13,158,927 |
| Columbia Limited Duration Credit Fund, Class I Shares |
| | 1,466,606 | 2,075 | (1,468,681)* | — | — | (7,090) | 235,325 | 36,061 | — |
| Columbia Limited Duration Credit Fund, Institutional 3 Class |
| | — | 1,458,550* | (74,150) | 1,384,400 | — | (2,455) | (299,927) | 220,725 | 13,525,586 |
| Columbia Mortgage Opportunities Fund, Class I Shares |
| | 960,409 | 5,766 | (966,175)* | — | — | (9,568) | 143,773 | 56,954 | — |
| Columbia Mortgage Opportunities Fund, Institutional 3 Class |
| | — | 994,424* | (75,795) | 918,629 | 291,814 | (931) | (187,980) | 317,975 | 8,975,009 |
| Columbia Multi-Asset Income Fund, Class I Shares |
| | 1,898,935 | 16,407 | (1,915,342)* | — | — | — | 523,438 | 159,224 | — |
| Columbia Multi-Asset Income Fund, Institutional 3 Class |
| | — | 2,003,128* | — | 2,003,128 | — | — | 134,975 | 825,699 | 19,911,089 |
| Columbia Overseas Value Fund, Class I Shares |
| | 2,641,904 | 38 | (2,641,942)* | — | — | (6,261) | 478,418 | — | — |
| Columbia Overseas Value Fund, Institutional 3 Class |
| | — | 2,601,328* | (560,625) | 2,040,703 | 362,363 | 642,149 | 4,497,238 | 393,633 | 22,162,030 |
| Columbia Pacific/Asia Fund, Class I Shares |
| | 191,401 | 16 | (191,417)* | — | — | 4,792 | (75,754) | — | — |
| Columbia Pacific/Asia Fund, Institutional 3 Class |
| | — | 206,763* | (65,289) | 141,474 | 116,699 | 160,673 | 379,790 | 16,551 | 1,706,179 |
| Columbia Select Large Cap Equity Fund, Class I Shares |
| | 1,964,141 | — | (1,964,141)* | — | — | — | (367,708) | — | — |
| Columbia Select Large Cap Equity Fund, Institutional 3 Class |
| | — | 2,107,923* | (430,732) | 1,677,191 | 1,193,273 | 409,985 | 4,936,441 | 223,095 | 25,308,814 |
| Columbia Short-Term Cash Fund, 1.475% |
| | 55,877,563 | 25,932,233 | (22,008,832) | 59,800,964 | — | (259) | 273 | 615,375 | 59,800,964 |
| Columbia Total Return Bond Fund, Class I Shares |
| | 3,592,336 | 7,334 | (3,599,670)* | — | — | — | 700,466 | 123,242 | — |
| Columbia Total Return Bond Fund, Institutional 3 Class |
| | — | 3,748,457* | (324,054) | 3,424,403 | — | (32,794) | (701,848) | 759,072 | 30,682,653 |
| Columbia U.S. Government Mortgage Fund, Class I Shares |
| | 15,922,919 | 31,627 | (15,954,546)* | — | — | (46,697) | 2,449,497 | 310,652 | — |
| Columbia U.S. Government Mortgage Fund, Institutional 3 Class |
| | — | 16,231,401* | (980,720) | 15,250,681 | — | (61,494) | (2,720,494) | 2,212,649 | 81,438,634 |
| Columbia U.S. Treasury Index Fund, Class I Shares |
| | 5,241,913 | 5,930 | (5,247,843)* | — | — | (118,985) | 1,179,178 | 120,685 | — |
| Columbia U.S. Treasury Index Fund, Institutional 3 Class |
| | — | 5,209,612* | (302,625) | 4,906,987 | — | (81,217) | (1,487,630) | 734,071 | 53,682,440 |
| Total | | | | | 9,819,265 | 10,563,750 | 30,783,929 | 12,835,126 | 589,373,337 |
| * | Includes the effect of underlying share class exchange. |
The accompanying Notes to Financial Statements are an integral part of this statement.
Columbia Capital Allocation Portfolios | Annual Report 2018
| 41 |
Portfolio of Investments (continued)
Columbia Capital Allocation Moderate Conservative Portfolio, January 31, 2018
Notes to Portfolio of Investments (continued)
| (b) | Non-income producing investment. |
| (c) | The rate shown is the seven-day current annualized yield at January 31, 2018. |
Abbreviation Legend
| ADR | American Depositary Receipt |
Currency Legend
| AUD | Australian Dollar |
| CHF | Swiss Franc |
| DKK | Danish Krone |
| GBP | British Pound |
| ILS | New Israeli Sheqel |
| JPY | Japanese Yen |
| NOK | Norwegian Krone |
| SEK | Swedish Krona |
| SGD | Singapore Dollar |
| USD | US Dollar |
Fair value measurements
The Fund categorizes its fair value measurements according to a three-level hierarchy that maximizes the use of observable inputs and minimizes the use of unobservable inputs by prioritizing that the most observable input be used when available. Observable inputs are those that market participants would use in pricing an investment based on market data obtained from sources independent of the reporting entity. Unobservable inputs are those that reflect the Fund’s assumptions about the information market participants would use in pricing an investment. An investment’s level within the fair value hierarchy is based on the lowest level of any input that is deemed significant to the asset’s or liability’s fair value measurement. The input levels are not necessarily an indication of the risk or liquidity associated with investments at that level. For example, certain U.S. government securities are generally high quality and liquid, however, they are reflected as Level 2 because the inputs used to determine fair value may not always be quoted prices in an active market.
Fair value inputs are summarized in the three broad levels listed below:
| ¦ | Level 1 — Valuations based on quoted prices for investments in active markets that the Fund has the ability to access at the measurement date. Valuation adjustments are not applied to Level 1 investments. |
| ¦ | Level 2 — Valuations based on other significant observable inputs (including quoted prices for similar securities, interest rates, prepayment speeds, credit risks, etc.). |
| ¦ | Level 3 — Valuations based on significant unobservable inputs (including the Fund’s own assumptions and judgment in determining the fair value of investments). |
Inputs that are used in determining fair value of an investment may include price information, credit data, volatility statistics, and other factors. These inputs can be either observable or unobservable. The availability of observable inputs can vary between investments, and is affected by various factors such as the type of investment, and the volume and level of activity for that investment or similar investments in the marketplace. The inputs will be considered by the Investment Manager, along with any other relevant factors in the calculation of an investment’s fair value. The Fund uses prices and inputs that are current as of the measurement date, which may include periods of market dislocations. During these periods, the availability of prices and inputs may be reduced for many investments. This condition could cause an investment to be reclassified between the various levels within the hierarchy.
Foreign equity securities actively traded in markets where there is a significant delay in the local close relative to the New York Stock Exchange are classified as Level 2. The values of these securities may include an adjustment to reflect the impact of significant market movements following the close of local trading, as described in Note 2 to the financial statements – Security valuation.
Certain investments that have been measured at fair value using the net asset value (NAV) per share (or its equivalent) are not categorized in the fair value hierarchy. The fair value amounts presented in the table are intended to reconcile the fair value hierarchy to the amounts presented in the Portfolio of Investments. The Columbia Short-Term Cash Fund seeks to provide shareholders with maximum current income consistent with liquidity and stability of principal. Columbia Short-Term Cash Fund prices its shares with a floating NAV and no longer seeks to maintain a stable NAV.
Investments falling into the Level 3 category are primarily supported by quoted prices from brokers and dealers participating in the market for those investments. However, these may be classified as Level 3 investments due to lack of market transparency and corroboration to support these quoted prices. Additionally, valuation models may be used as the pricing source for any remaining investments classified as Level 3. These models may rely on one or more significant unobservable inputs and/or significant assumptions by the Investment Manager. Inputs used in valuations may include, but are not limited to, financial statement analysis, capital account balances, discount rates and estimated cash flows, and comparable company data.
Under the direction of the Fund’s Board of Trustees (the Board), the Investment Manager’s Valuation Committee (the Committee) is responsible for overseeing the valuation procedures approved by the Board. The Committee consists of voting and non-voting members from various groups within the Investment Manager’s organization, including operations and accounting, trading and investments, compliance, risk management and legal.
The Committee meets at least monthly to review and approve valuation matters, which may include a description of specific valuation determinations, data regarding pricing information received from approved pricing vendors and brokers and the results of Board-approved valuation control policies and procedures (the Policies). The Policies address, among other things, instances when market quotations are or are not readily available, including recommendations of third party pricing vendors and a determination of appropriate pricing methodologies; events that require specific valuation determinations and assessment of fair value techniques; securities with a potential for stale pricing, including those that are
The accompanying Notes to Financial Statements are an integral part of this statement.
| 42 | Columbia Capital Allocation Portfolios | Annual Report 2018 |
Portfolio of Investments (continued)
Columbia Capital Allocation Moderate Conservative Portfolio, January 31, 2018
Fair value measurements (continued)
illiquid, restricted, or in default; and the effectiveness of third party pricing vendors, including periodic reviews of vendors. The Committee meets more frequently, as needed, to discuss additional valuation matters, which may include the need to review back-testing results, review time-sensitive information or approve related valuation actions. The Committee reports to the Board, with members of the Committee meeting with the Board at each of its regularly scheduled meetings to discuss valuation matters and actions during the period, similar to those described earlier.
For investments categorized as Level 3, the Committee monitors information similar to that described above, which may include: (i) data specific to the issuer or comparable issuers, (ii) general market or specific sector news and (iii) quoted prices and specific or similar security transactions. The Committee considers this data and any changes from prior periods in order to assess the reasonableness of observable and unobservable inputs, any assumptions or internal models used to value those securities and changes in fair value. This data is also used to corroborate, when available, information received from approved pricing vendors and brokers. Various factors impact the frequency of monitoring this information (which may occur as often as daily). However, the Committee may determine that changes to inputs, assumptions and models are not required as a result of the monitoring procedures performed.
The following table is a summary of the inputs used to value the Fund’s investments at January 31, 2018:
| | Level 1
quoted prices
in active
markets for
identical
assets ($) | Level 2
other
significant
observable
inputs ($) | Level 3
significant
unobservable
inputs ($) | Investments
measured at
net asset
value ($) | Total ($) |
| Investments | | | | | |
| Alternative Strategies Funds | 42,598,233 | — | — | — | 42,598,233 |
| Common Stocks | | | | | |
| Consumer Discretionary | 621,314 | 1,229,985 | — | — | 1,851,299 |
| Consumer Staples | 144,292 | 1,196,745 | — | — | 1,341,037 |
| Energy | 194,559 | 596,819 | — | — | 791,378 |
| Financials | 898,068 | 2,429,696 | — | — | 3,327,764 |
| Health Care | 810,865 | 1,147,560 | — | — | 1,958,425 |
| Industrials | 755,770 | 1,642,978 | — | — | 2,398,748 |
| Information Technology | 874,197 | 734,390 | — | — | 1,608,587 |
| Materials | 246,968 | 955,500 | — | — | 1,202,468 |
| Real Estate | 310,723 | 369,818 | — | — | 680,541 |
| Telecommunication Services | 29,643 | 402,066 | — | — | 431,709 |
| Utilities | 156,164 | 312,327 | — | — | 468,491 |
| Total Common Stocks | 5,042,563 | 11,017,884 | — | — | 16,060,447 |
| Equity Funds | 200,099,374 | — | — | — | 200,099,374 |
| Fixed-Income Funds | 286,874,766 | — | — | — | 286,874,766 |
| Preferred Stocks | | | | | |
| Consumer Discretionary | — | 184,618 | — | — | 184,618 |
| Rights | | | | | |
| Industrials | — | 1,868 | — | — | 1,868 |
| Money Market Funds | — | — | — | 59,800,964 | 59,800,964 |
| Total Investments | 534,614,936 | 11,204,370 | — | 59,800,964 | 605,620,270 |
| Derivatives | | | | | |
| Asset | | | | | |
| Forward Foreign Currency Exchange Contracts | — | 12,256 | — | — | 12,256 |
| Futures Contracts | 915,826 | — | — | — | 915,826 |
| Swap Contracts | — | 69,490 | — | — | 69,490 |
| Liability | | | | | |
| Forward Foreign Currency Exchange Contracts | — | (5,944) | — | — | (5,944) |
| Futures Contracts | (824,780) | — | — | — | (824,780) |
| Total | 534,705,982 | 11,280,172 | — | 59,800,964 | 605,787,118 |
See the Portfolio of Investments for all investment classifications not indicated in the table.
The Fund’s assets assigned to the Level 2 input category are generally valued using the market approach, in which a security’s value is determined through reference to prices and information from market transactions for similar or identical assets. These assets include certain foreign securities for which a third party statistical pricing service may be employed for purposes of fair market valuation. The model utilized by such third party statistical pricing service takes into account a security’s correlation to available market data including, but not limited to, intraday index, ADR, and exchange-traded fund movements.
Derivative instruments are valued at unrealized appreciation (depreciation).
There were no transfers of financial assets between levels during the period.
The accompanying Notes to Financial Statements are an integral part of this statement.
Columbia Capital Allocation Portfolios | Annual Report 2018
| 43 |
Portfolio of Investments
Columbia Capital Allocation Moderate Portfolio, January 31, 2018
(Percentages represent value of investments compared to net assets)
| Alternative Strategies Funds 6.4% |
| | Shares | Value ($) |
| Columbia Absolute Return Currency and Income Fund, Institutional 3 Class(a),(b) | 877,566 | 8,977,503 |
| Columbia Alternative Beta Fund, Institutional 3 Class(a) | 468,858 | 4,411,947 |
| Columbia Commodity Strategy Fund, Institutional 3 Class(a) | 5,606,313 | 32,909,059 |
| Columbia Diversified Absolute Return Fund, Institutional 3 Class(a),(b) | 2,193,131 | 21,339,165 |
| Columbia Multi-Asset Income Fund, Institutional 3 Class(a) | 3,820,772 | 37,978,474 |
Total Alternative Strategies Funds
(Cost $105,115,203) | 105,616,148 |
|
| Common Stocks 2.2% |
| Issuer | Shares | Value ($) |
| Consumer Discretionary 0.3% |
| Auto Components —% |
| Dana, Inc. | 2,650 | 87,423 |
| Dorman Products, Inc.(b) | 2,200 | 165,968 |
| Magna International, Inc. | 3,672 | 209,752 |
| Total | | 463,143 |
| Automobiles 0.1% |
| Fiat Chrysler Automobiles NV(b) | 1,166 | 28,174 |
| Peugeot SA | 8,517 | 191,289 |
| Subaru Corp. | 4,900 | 163,211 |
| Suzuki Motor Corp. | 3,700 | 212,510 |
| Winnebago Industries, Inc. | 300 | 13,635 |
| Total | | 608,819 |
| Diversified Consumer Services —% |
| Adtalem Global Education, Inc.(b) | 3,800 | 174,800 |
| Sotheby’s (b) | 2,300 | 121,348 |
| Weight Watchers International, Inc.(b) | 2,025 | 130,187 |
| Total | | 426,335 |
| Hotels, Restaurants & Leisure —% |
| Bloomin’ Brands, Inc. | 3,100 | 68,293 |
| Brinker International, Inc. | 700 | 25,438 |
| Compass Group PLC | 1,351 | 28,438 |
| Cracker Barrel Old Country Store, Inc. | 825 | 145,596 |
| Dave & Buster’s Entertainment, Inc.(b) | 475 | 22,325 |
| Common Stocks (continued) |
| Issuer | Shares | Value ($) |
| Ruth’s Hospitality Group, Inc. | 6,270 | 148,599 |
| Sonic Corp. | 3,300 | 85,272 |
| Total | | 523,961 |
| Household Durables 0.1% |
| Electrolux AB, Class B | 3,226 | 113,894 |
| La-Z-Boy, Inc. | 4,600 | 138,690 |
| MDC Holdings, Inc. | 1,116 | 37,621 |
| Persimmon PLC | 3,214 | 114,176 |
| Taylor Wimpey PLC | 62,434 | 168,961 |
| Zagg, Inc.(b) | 7,300 | 121,910 |
| Total | | 695,252 |
| Internet & Direct Marketing Retail —% |
| Nutrisystem, Inc. | 600 | 25,950 |
| PetMed Express, Inc. | 3,100 | 140,120 |
| Total | | 166,070 |
| Leisure Products —% |
| Sturm Ruger & Co., Inc. | 1,675 | 88,691 |
| Media —% |
| Entravision Communications Corp., Class A | 17,400 | 120,930 |
| Gannett Co., Inc. | 13,250 | 156,350 |
| Gray Television, Inc.(b) | 3,950 | 64,583 |
| New York Times Co. (The), Class A | 2,505 | 58,241 |
| Total | | 400,104 |
| Multiline Retail —% |
| Next PLC | 1,428 | 103,243 |
| Specialty Retail 0.1% |
| Buckle, Inc. (The) | 1,400 | 28,070 |
| Finish Line, Inc., Class A (The) | 9,800 | 111,034 |
| Hibbett Sports, Inc.(b) | 4,200 | 94,920 |
| Restoration Hardware Holdings, Inc.(b) | 1,600 | 150,384 |
| Sleep Number Corp.(b) | 4,100 | 154,324 |
| Tailored Brands, Inc. | 1,300 | 31,447 |
| Tilly’s, Inc. | 2,600 | 38,792 |
| Total | | 608,971 |
The accompanying Notes to Financial Statements are an integral part of this statement.
| 44 | Columbia Capital Allocation Portfolios | Annual Report 2018 |
Portfolio of Investments (continued)
Columbia Capital Allocation Moderate Portfolio, January 31, 2018
| Common Stocks (continued) |
| Issuer | Shares | Value ($) |
| Textiles, Apparel & Luxury Goods —% |
| Deckers Outdoor Corp.(b) | 2,110 | 180,848 |
| Movado Group, Inc. | 4,605 | 140,913 |
| Total | | 321,761 |
| Total Consumer Discretionary | 4,406,350 |
| Consumer Staples 0.1% |
| Beverages —% |
| Boston Beer Co., Inc. (The), Class A(b) | 550 | 104,418 |
| Food & Staples Retailing 0.1% |
| BIM Birlesik Magazalar AS | 1,091 | 21,825 |
| Distribuidora Internacional de Alimentacion SA | 8,517 | 45,480 |
| George Weston Ltd. | 100 | 8,758 |
| Ingles Markets, Inc., Class A | 1,100 | 36,960 |
| Jeronimo Martins SGPS SA | 6,029 | 128,410 |
| Loblaw Companies Ltd. | 400 | 21,668 |
| SUPERVALU, Inc.(b) | 2,662 | 42,166 |
| United Natural Foods, Inc.(b) | 1,800 | 85,680 |
| Wal-Mart de Mexico SAB de CV, Class V | 45,856 | 114,716 |
| Wm Morrison Supermarkets PLC | 14,226 | 44,841 |
| Woolworths Group Ltd. | 868 | 18,852 |
| Total | | 569,356 |
| Food Products —% |
| Dean Foods Co. | 2,080 | 21,570 |
| John B. Sanfilippo & Son, Inc. | 1,800 | 112,716 |
| Sanderson Farms, Inc. | 1,165 | 147,838 |
| Uni-President Enterprises Corp. | 13,000 | 31,206 |
| WH Group Ltd. | 190,500 | 235,535 |
| Total | | 548,865 |
| Household Products —% |
| Central Garden & Pet Co., Class A(b) | 2,000 | 75,440 |
| Personal Products —% |
| Unilever NV-CVA | 989 | 57,281 |
| Usana Health Sciences, Inc.(b) | 1,040 | 77,636 |
| Total | | 134,917 |
| Common Stocks (continued) |
| Issuer | Shares | Value ($) |
| Tobacco —% |
| Imperial Brands PLC | 3,855 | 158,650 |
| Swedish Match AB | 4,620 | 187,148 |
| Total | | 345,798 |
| Total Consumer Staples | 1,778,794 |
| Energy 0.1% |
| Energy Equipment & Services —% |
| Archrock, Inc. | 11,000 | 102,300 |
| Exterran Corp.(b) | 4,700 | 135,736 |
| McDermott International, Inc.(b) | 14,400 | 126,432 |
| Rowan Companies PLC, Class A(b) | 10,400 | 153,088 |
| Total | | 517,556 |
| Oil, Gas & Consumable Fuels 0.1% |
| China Petroleum & Chemical Corp., Class H | 132,000 | 114,103 |
| China Shenhua Energy Co., Ltd., Class H | 70,500 | 219,061 |
| CVR Energy, Inc. | 1,300 | 46,527 |
| Lukoil PJSC | 103 | 6,831 |
| MOL Hungarian Oil & Gas PLC | 10,467 | 127,868 |
| OMV AG | 2,087 | 134,375 |
| Par Pacific Holdings, Inc.(b) | 1,700 | 30,991 |
| Peabody Energy Corp.(b) | 1,400 | 56,574 |
| Polski Koncern Naftowy Orlen SA | 1,588 | 51,503 |
| PTT PCL, Foreign Registered Shares | 13,600 | 213,529 |
| REX American Resources Corp.(b) | 1,400 | 114,310 |
| Ultra Petroleum Corp.(b) | 17,000 | 118,660 |
| W&T Offshore, Inc.(b) | 14,500 | 70,180 |
| Total | | 1,304,512 |
| Total Energy | 1,822,068 |
| Financials 0.4% |
| Banks 0.2% |
| Agricultural Bank of China Ltd., Class H | 367,000 | 224,545 |
| BancFirst Corp. | 350 | 19,513 |
| Bancorp, Inc. (The)(b) | 1,800 | 19,026 |
| BancorpSouth Bank | 800 | 26,840 |
| Bank Hapoalim BM | 1,501 | 11,237 |
| Bank of China Ltd., Class H | 152,000 | 91,099 |
| Bank of Nova Scotia (The) | 2,939 | 195,264 |
| Banner Corp. | 775 | 42,113 |
The accompanying Notes to Financial Statements are an integral part of this statement.
Columbia Capital Allocation Portfolios | Annual Report 2018
| 45 |
Portfolio of Investments (continued)
Columbia Capital Allocation Moderate Portfolio, January 31, 2018
| Common Stocks (continued) |
| Issuer | Shares | Value ($) |
| Cathay General Bancorp | 3,900 | 170,586 |
| Central Pacific Financial Corp. | 1,710 | 50,565 |
| China Construction Bank Corp., Class H | 27,000 | 30,998 |
| CoBiz Financial, Inc. | 900 | 18,054 |
| CTBC Financial Holding Co., Ltd. | 90,000 | 65,765 |
| Customers Bancorp, Inc.(b) | 4,250 | 130,262 |
| Dubai Islamic Bank PJSC | 59,351 | 98,462 |
| Enterprise Financial Services Corp. | 1,025 | 49,866 |
| First Citizens BancShares Inc., Class A | 425 | 180,799 |
| First Financial Bancorp | 5,150 | 146,775 |
| First Merchants Corp. | 3,000 | 129,480 |
| Grupo Financiero Banorte SAB de CV, Class O | 31,148 | 199,489 |
| Hana Financial Group, Inc. | 4,222 | 205,738 |
| Hancock Holding Co. | 3,400 | 182,580 |
| Heritage Financial Corp. | 2,700 | 83,160 |
| International Bancshares Corp. | 2,865 | 118,897 |
| Japan Post Bank Co., Ltd. | 3,400 | 46,019 |
| Malayan Banking Bhd | 16,800 | 43,533 |
| Preferred Bank/Los Angeles | 2,200 | 141,724 |
| S&T Bancorp, Inc. | 3,400 | 137,224 |
| Sandy Spring Bancorp, Inc. | 1,600 | 60,512 |
| Societe Generale SA | 3,638 | 211,633 |
| Standard Bank Group Ltd. | 3,909 | 66,213 |
| Triumph Bancorp, Inc.(b) | 675 | 25,988 |
| Turkiye Is Bankasi AS | 69,178 | 148,241 |
| Valley National Bancorp | 13,200 | 165,924 |
| WesBanco, Inc. | 400 | 16,404 |
| Wintrust Financial Corp. | 2,150 | 184,685 |
| Woori Finance Holdings Co., Ltd. | 8,153 | 128,543 |
| Total | | 3,867,756 |
| Capital Markets —% |
| Arlington Asset Investment Corp., Class A | 1,370 | 14,385 |
| China Huarong Asset Management Co., Ltd., Class H | 135,000 | 68,110 |
| Cohen & Steers, Inc. | 2,350 | 95,809 |
| Houlihan Lokey, Inc. | 2,700 | 128,790 |
| Total | | 307,094 |
| Common Stocks (continued) |
| Issuer | Shares | Value ($) |
| Consumer Finance —% |
| Green Dot Corp., Class A(b) | 2,500 | 153,150 |
| Nelnet, Inc., Class A | 2,375 | 123,761 |
| Total | | 276,911 |
| Diversified Financial Services —% |
| EXOR NV | 361 | 27,887 |
| Insurance 0.1% |
| Allianz SE, Registered Shares | 1,110 | 280,447 |
| American Equity Investment Life Holding Co. | 4,900 | 161,700 |
| Assicurazioni Generali SpA | 9,709 | 192,506 |
| AXA SA | 6,612 | 217,501 |
| CNO Financial Group, Inc. | 6,700 | 164,753 |
| CNP Assurances | 1,181 | 30,264 |
| Health Insurance Innovations, Inc., Class A(b) | 3,500 | 90,825 |
| Legal & General Group PLC | 19,488 | 74,875 |
| Mapfre SA | 38,754 | 137,657 |
| Swiss Re AG | 66 | 6,509 |
| Third Point Reinsurance Ltd.(b) | 1,000 | 14,250 |
| Universal Insurance Holdings, Inc. | 3,817 | 112,220 |
| Total | | 1,483,507 |
| Mortgage Real Estate Investment Trusts (REITS) —% |
| AG Mortgage Investment Trust, Inc. | 1,800 | 31,392 |
| ARMOUR Residential REIT, Inc. | 4,600 | 107,686 |
| Invesco Mortgage Capital, Inc. | 7,900 | 128,296 |
| Total | | 267,374 |
| Thrifts & Mortgage Finance 0.1% |
| Essent Group Ltd.(b) | 4,050 | 188,406 |
| Federal Agricultural Mortgage Corp. | 1,800 | 144,450 |
| Flagstar Bancorp, Inc.(b) | 3,800 | 141,550 |
| MGIC Investment Corp.(b) | 13,500 | 200,070 |
| Radian Group, Inc. | 2,300 | 50,761 |
| Walker & Dunlop, Inc.(b) | 2,900 | 134,705 |
| Washington Federal, Inc. | 4,075 | 146,293 |
| Total | | 1,006,235 |
| Total Financials | 7,236,764 |
The accompanying Notes to Financial Statements are an integral part of this statement.
| 46 | Columbia Capital Allocation Portfolios | Annual Report 2018 |
Portfolio of Investments (continued)
Columbia Capital Allocation Moderate Portfolio, January 31, 2018
| Common Stocks (continued) |
| Issuer | Shares | Value ($) |
| Health Care 0.3% |
| Biotechnology 0.1% |
| Alder Biopharmaceuticals, Inc.(b) | 7,215 | 102,092 |
| Atara Biotherapeutics, Inc.(b) | 2,700 | 102,060 |
| bluebird bio, Inc.(b) | 620 | 127,038 |
| Blueprint Medicines Corp.(b) | 825 | 64,886 |
| Clovis Oncology, Inc.(b) | 750 | 45,375 |
| Coherus Biosciences, Inc.(b) | 1,345 | 13,585 |
| Dynavax Technologies Corp.(b) | 3,095 | 49,829 |
| Eagle Pharmaceuticals, Inc.(b) | 275 | 16,437 |
| Global Blood Therapeutics, Inc.(b) | 650 | 37,635 |
| Immunomedics, Inc.(b) | 5,200 | 86,684 |
| Insmed, Inc.(b) | 2,710 | 68,942 |
| Jounce Therapeutics, Inc.(b) | 2,806 | 67,849 |
| Keryx Biopharmaceuticals, Inc.(b) | 8,065 | 37,341 |
| Loxo Oncology, Inc.(b) | 775 | 78,639 |
| NewLink Genetics Corp.(b) | 5,600 | 46,200 |
| Nightstar Therapeutics PLC, ADR(b) | 2,909 | 41,395 |
| OncoMed Pharmaceuticals, Inc.(b) | 8,200 | 20,500 |
| Ovid Therapeutics, Inc.(b) | 5,667 | 48,170 |
| Puma Biotechnology, Inc.(b) | 1,275 | 85,234 |
| Sage Therapeutics, Inc.(b) | 700 | 132,860 |
| Shire PLC | 651 | 30,757 |
| Spark Therapeutics, Inc.(b) | 1,355 | 75,948 |
| TESARO, Inc.(b) | 1,420 | 95,793 |
| Total | | 1,475,249 |
| Health Care Equipment & Supplies 0.1% |
| Analogic Corp. | 1,790 | 148,391 |
| Angiodynamics, Inc.(b) | 5,500 | 95,755 |
| CONMED Corp. | 400 | 23,112 |
| Haemonetics Corp.(b) | 2,400 | 155,160 |
| Integer Holdings Corp.(b) | 2,900 | 145,435 |
| Lantheus Holdings, Inc.(b) | 6,431 | 147,913 |
| Masimo Corp.(b) | 1,870 | 176,229 |
| Total | | 891,995 |
| Common Stocks (continued) |
| Issuer | Shares | Value ($) |
| Health Care Providers & Services —% |
| Diplomat Pharmacy, Inc.(b) | 6,250 | 168,687 |
| Kindred Healthcare, Inc. | 2,900 | 26,680 |
| Molina Healthcare, Inc.(b) | 2,180 | 199,165 |
| Providence Service Corp. (The)(b) | 2,300 | 147,959 |
| Tivity Health, Inc.(b) | 3,900 | 151,125 |
| Triple-S Management Corp., Class B(b) | 5,185 | 119,151 |
| Total | | 812,767 |
| Life Sciences Tools & Services —% |
| Pra Health Sciences, Inc.(b) | 2,110 | 192,137 |
| Pharmaceuticals 0.1% |
| Aerie Pharmaceuticals, Inc.(b) | 1,415 | 77,613 |
| Bayer AG, Registered Shares | 515 | 67,405 |
| Corcept Therapeutics, Inc.(b) | 7,150 | 164,557 |
| GlaxoSmithKline PLC | 11,959 | 224,204 |
| Lannett Co., Inc.(b) | 5,900 | 120,065 |
| Novo Nordisk A/S, Class B | 2,245 | 124,862 |
| Odonate Therapeutics, Inc.(b) | 2,400 | 49,872 |
| Pacira Pharmaceuticals, Inc.(b) | 1,750 | 63,700 |
| Phibro Animal Health Corp., Class A | 3,200 | 108,960 |
| Roche Holding AG, Genusschein Shares | 1,080 | 266,243 |
| Sanofi | 2,139 | 188,871 |
| Supernus Pharmaceuticals, Inc.(b) | 1,575 | 61,504 |
| Total | | 1,517,856 |
| Total Health Care | 4,890,004 |
| Industrials 0.3% |
| Aerospace & Defense —% |
| Curtiss-Wright Corp. | 1,650 | 215,589 |
| Moog, Inc., Class A(b) | 250 | 22,515 |
| Total | | 238,104 |
| Air Freight & Logistics —% |
| Forward Air Corp. | 1,150 | 69,817 |
| Airlines —% |
| Deutsche Lufthansa AG, Registered Shares | 5,976 | 213,237 |
| International Consolidated Airlines Group SA | 4,687 | 42,596 |
| Qantas Airways Ltd. | 25,271 | 107,096 |
| Total | | 362,929 |
The accompanying Notes to Financial Statements are an integral part of this statement.
Columbia Capital Allocation Portfolios | Annual Report 2018
| 47 |
Portfolio of Investments (continued)
Columbia Capital Allocation Moderate Portfolio, January 31, 2018
| Common Stocks (continued) |
| Issuer | Shares | Value ($) |
| Building Products —% |
| Caesarstone Ltd.(b) | 4,500 | 95,400 |
| Continental Building Product(b) | 5,565 | 158,324 |
| Total | | 253,724 |
| Commercial Services & Supplies 0.1% |
| ACCO Brands Corp.(b) | 10,300 | 122,055 |
| Brady Corp., Class A | 925 | 35,381 |
| Essendant, Inc. | 9,600 | 86,880 |
| MSA Safety, Inc. | 1,900 | 148,789 |
| SP Plus Corp.(b) | 3,300 | 127,215 |
| Total | | 520,320 |
| Construction & Engineering 0.1% |
| ACS Actividades de Construccion y Servicios SA | 1,269 | 50,827 |
| Comfort Systems U.S.A., Inc. | 1,200 | 51,120 |
| EMCOR Group, Inc. | 2,300 | 186,944 |
| Kajima Corp. | 17,000 | 168,777 |
| KBR, Inc. | 3,800 | 77,292 |
| Obayashi Corp. | 15,200 | 183,518 |
| Primoris Services Corp. | 5,300 | 137,800 |
| Taisei Corp. | 3,900 | 199,058 |
| Total | | 1,055,336 |
| Electrical Equipment —% |
| ABB Ltd. | 3,033 | 84,562 |
| Atkore International Group, Inc.(b) | 5,400 | 126,252 |
| Generac Holdings, Inc.(b) | 3,375 | 165,139 |
| Total | | 375,953 |
| Industrial Conglomerates —% |
| CITIC Ltd. | 116,000 | 182,563 |
| Shanghai Industrial Holdings Ltd. | 7,000 | 20,450 |
| Total | | 203,013 |
| Machinery 0.1% |
| Alamo Group, Inc. | 1,300 | 149,539 |
| Briggs & Stratton Corp. | 1,900 | 45,942 |
| EnPro Industries, Inc. | 500 | 43,995 |
| Global Brass & Copper Holdings, Inc. | 4,200 | 135,030 |
| Harsco Corp.(b) | 6,500 | 116,350 |
| Hillenbrand, Inc. | 3,400 | 150,620 |
| Kadant, Inc. | 1,130 | 113,282 |
| Common Stocks (continued) |
| Issuer | Shares | Value ($) |
| Mueller Industries, Inc. | 1,625 | 53,771 |
| RBC Bearings, Inc.(b) | 640 | 80,640 |
| Volvo AB B Shares | 1,080 | 22,046 |
| Wabash National Corp. | 5,630 | 145,423 |
| Total | | 1,056,638 |
| Professional Services —% |
| Korn/Ferry International | 1,100 | 49,016 |
| RPX Corp. | 10,360 | 145,455 |
| TrueBlue, Inc.(b) | 2,000 | 54,700 |
| Total | | 249,171 |
| Road & Rail —% |
| ArcBest Corp. | 4,345 | 154,465 |
| Saia, Inc.(b) | 1,300 | 98,215 |
| Total | | 252,680 |
| Trading Companies & Distributors —% |
| Applied Industrial Technologies, Inc. | 2,520 | 185,850 |
| Beacon Roofing Supply, Inc.(b) | 2,700 | 163,350 |
| ITOCHU Corp. | 6,500 | 127,898 |
| Mitsubishi Corp. | 300 | 8,408 |
| Total | | 485,506 |
| Total Industrials | 5,123,191 |
| Information Technology 0.4% |
| Communications Equipment —% |
| CalAmp Corp.(b) | 2,700 | 66,096 |
| Comtech Telecommunications Corp. | 6,100 | 131,943 |
| Netscout Systems, Inc.(b) | 5,700 | 162,450 |
| Total | | 360,489 |
| Electronic Equipment, Instruments & Components 0.1% |
| Anixter International, Inc.(b) | 1,300 | 108,810 |
| AU Optronics Corp. | 10,000 | 4,756 |
| Benchmark Electronics, Inc.(b) | 4,550 | 131,722 |
| ePlus, Inc.(b) | 1,000 | 77,200 |
| Hitachi Ltd. | 29,000 | 231,414 |
| KEMET Corp.(b) | 4,400 | 89,584 |
| Kingboard Chemical Holdings Ltd. | 9,500 | 51,981 |
| Methode Electronics, Inc. | 1,350 | 55,148 |
| Sanmina Corp.(b) | 4,090 | 106,954 |
| Scansource, Inc.(b) | 2,175 | 74,385 |
The accompanying Notes to Financial Statements are an integral part of this statement.
| 48 | Columbia Capital Allocation Portfolios | Annual Report 2018 |
Portfolio of Investments (continued)
Columbia Capital Allocation Moderate Portfolio, January 31, 2018
| Common Stocks (continued) |
| Issuer | Shares | Value ($) |
| Tech Data Corp.(b) | 1,600 | 160,432 |
| Vishay Intertechnology, Inc. | 8,000 | 175,600 |
| Total | | 1,267,986 |
| Internet Software & Services 0.1% |
| j2 Global, Inc. | 2,005 | 160,380 |
| Mixi, Inc. | 3,400 | 150,131 |
| New Relic, Inc.(b) | 1,600 | 95,568 |
| Stamps.com, Inc.(b) | 900 | 183,465 |
| Web.com Group, Inc.(b) | 4,150 | 96,487 |
| Total | | 686,031 |
| IT Services —% |
| CACI International, Inc., Class A(b) | 400 | 56,220 |
| CSG Systems International, Inc. | 1,700 | 76,789 |
| EVERTEC, Inc. | 2,335 | 36,543 |
| MAXIMUS, Inc. | 2,600 | 177,268 |
| Perficient, Inc.(b) | 1,800 | 34,866 |
| Travelport Worldwide Ltd. | 10,700 | 145,627 |
| TTEC Holdings, Inc. | 2,800 | 111,160 |
| Total | | 638,473 |
| Semiconductors & Semiconductor Equipment 0.1% |
| Amkor Technology, Inc.(b) | 13,070 | 131,484 |
| Cirrus Logic, Inc.(b) | 2,800 | 138,796 |
| Diodes, Inc.(b) | 4,840 | 136,439 |
| Formfactor, Inc.(b) | 8,400 | 120,540 |
| Phison Electronics Corp. | 11,000 | 112,082 |
| Rudolph Technologies, Inc.(b) | 2,400 | 62,880 |
| Synaptics, Inc.(b) | 3,350 | 145,189 |
| Tokyo Electron Ltd. | 900 | 169,778 |
| Xcerra Corp.(b) | 11,005 | 109,830 |
| Total | | 1,127,018 |
| Software 0.1% |
| Aspen Technology, Inc.(b) | 2,870 | 222,281 |
| Check Point Software Technologies Ltd.(b) | 682 | 70,526 |
| Imperva, Inc.(b) | 3,300 | 144,375 |
| Paycom Software, Inc.(b) | 500 | 45,820 |
| Paylocity Holding Corp.(b) | 1,900 | 99,351 |
| Progress Software Corp. | 3,625 | 180,634 |
| Proofpoint, Inc.(b) | 1,790 | 182,616 |
| Common Stocks (continued) |
| Issuer | Shares | Value ($) |
| VASCO Data Security International, Inc.(b) | 3,000 | 43,200 |
| Verint Systems, Inc.(b) | 800 | 33,400 |
| Total | | 1,022,203 |
| Technology Hardware, Storage & Peripherals —% |
| Compal Electronics, Inc. | 69,000 | 51,366 |
| Pegatron Corp. | 63,000 | 170,448 |
| Samsung Electronics Co., Ltd. | 123 | 287,492 |
| Total | | 509,306 |
| Total Information Technology | 5,611,506 |
| Materials 0.1% |
| Chemicals 0.1% |
| Covestro AG | 207 | 23,793 |
| Ferro Corp.(b) | 700 | 16,464 |
| Innospec, Inc. | 1,935 | 138,933 |
| Kronos Worldwide, Inc. | 4,850 | 133,133 |
| Mitsubishi Chemical Holdings Corp. | 11,500 | 125,423 |
| Quaker Chemical Corp. | 300 | 46,170 |
| Sinopec Shanghai Petrochemical Co., Ltd. | 244,000 | 148,979 |
| Trinseo SA | 2,225 | 183,451 |
| Total | | 816,346 |
| Containers & Packaging —% |
| Greif, Inc., Class A | 1,775 | 104,938 |
| Metals & Mining —% |
| Fortescue Metals Group Ltd. | 44,216 | 175,591 |
| Materion Corp. | 2,925 | 145,373 |
| Rio Tinto PLC | 3,597 | 200,304 |
| Teck Resources Ltd., Class B | 4,400 | 127,779 |
| Warrior Met Coal, Inc. | 5,100 | 142,647 |
| Total | | 791,694 |
| Paper & Forest Products —% |
| Boise Cascade Co. | 3,500 | 155,575 |
| Louisiana-Pacific Corp.(b) | 6,100 | 180,621 |
| UPM-Kymmene OYJ | 6,240 | 210,261 |
| Total | | 546,457 |
| Total Materials | 2,259,435 |
The accompanying Notes to Financial Statements are an integral part of this statement.
Columbia Capital Allocation Portfolios | Annual Report 2018
| 49 |
Portfolio of Investments (continued)
Columbia Capital Allocation Moderate Portfolio, January 31, 2018
| Common Stocks (continued) |
| Issuer | Shares | Value ($) |
| Real Estate 0.1% |
| Equity Real Estate Investment Trusts (REITS) 0.1% |
| CareTrust REIT, Inc. | 2,400 | 38,136 |
| CorEnergy Infrastructure Trust, Inc. | 3,641 | 139,560 |
| DiamondRock Hospitality Co. | 9,100 | 107,016 |
| Four Corners Property Trust, Inc. | 1,000 | 23,600 |
| Getty Realty Corp. | 500 | 13,120 |
| Growthpoint Properties Ltd. | 6,241 | 14,625 |
| Lexington Realty Trust | 7,600 | 68,552 |
| National Health Investors, Inc. | 2,200 | 155,166 |
| Pebblebrook Hotel Trust | 4,000 | 156,000 |
| Potlatch Corp. | 900 | 47,610 |
| Preferred Apartment Communities, Inc., Class A | 2,200 | 36,674 |
| PS Business Parks, Inc. | 1,228 | 149,951 |
| Ryman Hospitality Properties, Inc. | 2,060 | 157,693 |
| Stockland | 4,733 | 16,143 |
| Summit Hotel Properties, Inc. | 7,700 | 119,273 |
| Sunstone Hotel Investors, Inc. | 3,200 | 53,920 |
| Tier REIT, Inc. | 3,300 | 64,053 |
| Xenia Hotels & Resorts, Inc. | 6,850 | 152,070 |
| Total | | 1,513,162 |
| Real Estate Management & Development —% |
| Aldar Properties PJSC | 58,673 | 36,581 |
| CK Asset Holdings Ltd. | 13,500 | 128,461 |
| HFF, Inc., Class A | 1,125 | 55,361 |
| Kerry Properties Ltd. | 3,000 | 14,343 |
| Shimao Property Holdings Ltd. | 32,500 | 96,440 |
| Sun Hung Kai Properties Ltd. | 1,000 | 17,289 |
| Wheelock & Co., Ltd. | 2,402 | 18,785 |
| Total | | 367,260 |
| Total Real Estate | 1,880,422 |
| Telecommunication Services —% |
| Diversified Telecommunication Services —% |
| ATN International, Inc. | 200 | 11,872 |
| Nippon Telegraph & Telephone Corp. | 3,900 | 186,750 |
| Orange SA | 648 | 11,702 |
| Telefonica SA | 2,592 | 26,559 |
| Common Stocks (continued) |
| Issuer | Shares | Value ($) |
| Telenor ASA | 7,445 | 174,321 |
| Telstra Corp., Ltd. | 8,142 | 24,072 |
| Total | | 435,276 |
| Wireless Telecommunication Services —% |
| Boingo Wireless, Inc.(b) | 5,600 | 135,800 |
| Mobile Telesystems PJSC, ADR | 1,182 | 14,350 |
| Total | | 150,150 |
| Total Telecommunication Services | 585,426 |
| Utilities 0.1% |
| Electric Utilities 0.1% |
| Allete, Inc. | 1,400 | 101,416 |
| El Paso Electric Co. | 1,100 | 57,420 |
| Enel SpA | 28,307 | 179,589 |
| IDACORP, Inc. | 200 | 17,256 |
| Inter RAO UES PJSC(b) | 1,510,000 | 101,807 |
| PNM Resources, Inc. | 400 | 15,240 |
| Portland General Electric Co. | 3,510 | 148,649 |
| Scottish & Southern Energy PLC | 607 | 11,243 |
| Transmissora Alianca de Energia Eletrica SA | 3,443 | 21,775 |
| Total | | 654,395 |
| Gas Utilities —% |
| Chesapeake Utilities Corp. | 1,550 | 113,925 |
| Southwest Gas Corp. | 1,225 | 90,135 |
| Total | | 204,060 |
| Independent Power and Renewable Electricity Producers —% |
| Ormat Technologies, Inc. | 1,975 | 138,408 |
| Multi-Utilities —% |
| Engie SA | 631 | 10,952 |
| Water Utilities —% |
| SJW Corp. | 1,325 | 79,288 |
| Total Utilities | 1,087,103 |
Total Common Stocks
(Cost $31,082,095) | 36,681,063 |
|
The accompanying Notes to Financial Statements are an integral part of this statement.
| 50 | Columbia Capital Allocation Portfolios | Annual Report 2018 |
Portfolio of Investments (continued)
Columbia Capital Allocation Moderate Portfolio, January 31, 2018
| Equity Funds 44.3% |
| | Shares | Value ($) |
| International 12.5% |
| Columbia Contrarian Europe Fund, Institutional 3 Class(a) | 7,084,152 | 54,052,080 |
| Columbia Emerging Markets Fund, Institutional 3 Class(a) | 3,251,073 | 48,278,429 |
| Columbia Overseas Value Fund, Institutional 3 Class(a) | 5,431,422 | 58,985,244 |
| Columbia Pacific/Asia Fund, Institutional 3 Class(a) | 3,752,261 | 45,252,270 |
| Total | 206,568,023 |
| U.S. Large Cap 30.5% |
| Columbia Contrarian Core Fund, Institutional 3 Class(a) | 3,040,747 | 84,259,105 |
| Columbia Disciplined Core Fund, Institutional 3 Class(a) | 5,534,235 | 70,229,440 |
| Columbia Disciplined Growth Fund, Institutional 3 Class(a) | 7,154,635 | 72,047,171 |
| Columbia Disciplined Value Fund, Institutional 3 Class(a) | 9,372,113 | 105,342,552 |
| Columbia Large Cap Growth Fund, Institutional 3 Class(a) | 572,781 | 25,465,844 |
| Columbia Select Large Cap Equity Fund, Institutional 3 Class(a) | 4,459,948 | 67,300,617 |
| Columbia Select Large Cap Growth Fund, Institutional 3 Class(a),(b) | 2,282,544 | 42,729,224 |
| Columbia Select Large-Cap Value Fund, Institutional 3 Class(a) | 1,251,639 | 35,959,604 |
| Total | 503,333,557 |
| U.S. Small Cap 1.3% |
| Columbia Disciplined Small Core Fund, Institutional 3 Class(a) | 2,464,721 | 22,108,546 |
Total Equity Funds
(Cost $562,746,052) | 732,010,126 |
|
| Fixed-Income Funds 39.9% |
| | |
| Emerging Markets 1.7% |
| Columbia Emerging Markets Bond Fund, Institutional 3 Class(a) | 2,279,821 | 27,221,060 |
| High Yield 6.7% |
| Columbia High Yield Bond Fund, Institutional 3 Class(a) | 2,694,594 | 7,949,051 |
| Columbia Income Opportunities Fund, Institutional 3 Class(a) | 10,390,515 | 103,073,909 |
| Total | 111,022,960 |
| Fixed-Income Funds (continued) |
| | Shares | Value ($) |
| Inflation Protected Securities 1.0% |
| Columbia Inflation Protected Securities Fund, Institutional 3 Class(a) | 1,670,355 | 15,851,671 |
| Investment Grade 30.5% |
| Columbia Corporate Income Fund, Institutional 3 Class(a) | 12,777,530 | 130,458,585 |
| Columbia Limited Duration Credit Fund, Institutional 3 Class(a) | 3,606,288 | 35,233,434 |
| Columbia Mortgage Opportunities Fund, Institutional 3 Class(a) | 2,726,182 | 26,634,799 |
| Columbia Total Return Bond Fund, Institutional 3 Class(a) | 22,091,229 | 197,937,412 |
| Columbia U.S. Government Mortgage Fund, Institutional 3 Class(a) | 12,765,970 | 68,170,277 |
| Columbia U.S. Treasury Index Fund, Institutional 3 Class(a) | 4,245,118 | 46,441,594 |
| Total | 504,876,101 |
Total Fixed-Income Funds
(Cost $669,046,203) | 658,971,792 |
|
| Rights —% |
| Issuer | Shares | Value ($) |
| Industrials —% |
| Construction & Engineering —% |
| ACS Actividades de Construccion y Servicios SA(b) | 1,269 | 665 |
| Total Industrials | 665 |
Total Rights
(Cost $696) | 665 |
|
| Money Market Funds 6.7% |
| | Shares | Value ($) |
| Columbia Short-Term Cash Fund, 1.475%(a),(c) | 111,082,902 | 111,082,902 |
Total Money Market Funds
(Cost $111,081,527) | 111,082,902 |
Total Investments
(Cost: $1,479,071,776) | 1,644,362,696 |
| Other Assets & Liabilities, Net | | 8,879,772 |
| Net Assets | 1,653,242,468 |
At January 31, 2018, securities and/or cash totaling $7,157,812 were pledged as collateral.
The accompanying Notes to Financial Statements are an integral part of this statement.
Columbia Capital Allocation Portfolios | Annual Report 2018
| 51 |
Portfolio of Investments (continued)
Columbia Capital Allocation Moderate Portfolio, January 31, 2018
Investments in derivatives
| Forward foreign currency exchange contracts |
Currency to
be sold | Currency to
be purchased | Counterparty | Settlement
date | Unrealized
appreciation ($) | Unrealized
depreciation ($) |
| 1,409,000 CNY | 218,237 USD | JPMorgan | 03/14/2018 | — | (4,895) |
| 29,695,000 HUF | 117,800 USD | JPMorgan | 03/14/2018 | — | (1,267) |
| 162,000 ILS | 47,204 USD | JPMorgan | 03/14/2018 | — | (253) |
| 1,302,000 JPY | 11,744 USD | JPMorgan | 03/14/2018 | — | (208) |
| 189,027,000 KRW | 177,427 USD | JPMorgan | 03/14/2018 | 560 | — |
| 2,896,000 MXN | 153,320 USD | JPMorgan | 03/14/2018 | — | (1,304) |
| 927,000 NOK | 118,012 USD | JPMorgan | 03/14/2018 | — | (2,382) |
| 756,000 SEK | 94,376 USD | JPMorgan | 03/14/2018 | — | (1,814) |
| 4,138,000 THB | 129,566 USD | JPMorgan | 03/14/2018 | — | (2,672) |
| 229,000 TRY | 59,010 USD | JPMorgan | 03/14/2018 | — | (1,256) |
| 2,954,000 TWD | 100,231 USD | JPMorgan | 03/14/2018 | — | (1,406) |
| 201,340 USD | 252,000 AUD | JPMorgan | 03/14/2018 | 1,692 | — |
| 177,453 USD | 575,000 BRL | JPMorgan | 03/14/2018 | 2,291 | — |
| 183,550 USD | 228,000 CAD | JPMorgan | 03/14/2018 | 1,899 | — |
| 224,099 USD | 215,000 CHF | JPMorgan | 03/14/2018 | 7,589 | — |
| 224,787 USD | 162,000 GBP | JPMorgan | 03/14/2018 | 5,569 | — |
| 59,015 USD | 788,668,000 IDR | JPMorgan | 03/14/2018 | — | (97) |
| 247,695 USD | 15,906,000 INR | JPMorgan | 03/14/2018 | 992 | — |
| 46,897 USD | 62,000 SGD | JPMorgan | 03/14/2018 | 404 | — |
| 129,649 USD | 1,606,000 ZAR | JPMorgan | 03/14/2018 | 5,138 | — |
| Total | | | | 26,134 | (17,554) |
| Long futures contracts |
| Description | Number of
contracts | Expiration
date | Trading
currency | Notional
amount | Value/Unrealized
appreciation ($) | Value/Unrealized
depreciation ($) |
| MSCI EAFE Index | 229 | 03/2018 | USD | 24,565,975 | 1,469,260 | — |
| MSCI Emerging Markets Index | 364 | 03/2018 | USD | 22,891,960 | 696,242 | — |
| Russell 2000 E-mini | 3 | 03/2018 | USD | 236,400 | 7,777 | — |
| S&P 500 E-mini | 613 | 03/2018 | USD | 86,610,770 | 5,970,633 | — |
| TOPIX Index | 30 | 03/2018 | JPY | 551,850,000 | 155,970 | — |
| U.S. Long Bond | 196 | 03/2018 | USD | 29,615,906 | — | (926,705) |
| U.S. Treasury 5-Year Note | 199 | 03/2018 | USD | 22,921,698 | — | (371,978) |
| Total | | | | | 8,299,882 | (1,298,683) |
| Short futures contracts |
| Description | Number of
contracts | Expiration
date | Trading
currency | Notional
amount | Value/Unrealized
appreciation ($) | Value/Unrealized
depreciation ($) |
| FTSE 100 Index | (80) | 03/2018 | GBP | (5,973,600) | — | (62,395) |
| Cleared credit default swap contracts - buy protection |
Reference
entity | Counterparty | Maturity
date | Pay
fixed
rate
(%) | Payment
frequency | Notional
currency | Notional
amount | Value
($) | Upfront
payments
($) | Upfront
receipts
($) | Unrealized
appreciation
($) | Unrealized
depreciation
($) |
| Markit CDX North America Investment Grade Index, Series 29 | Morgan Stanley | 12/20/2022 | 1.000 | Quarterly | USD | 9,250,000 | (54,902) | — | — | — | (54,902) |
The accompanying Notes to Financial Statements are an integral part of this statement.
| 52 | Columbia Capital Allocation Portfolios | Annual Report 2018 |
Portfolio of Investments (continued)
Columbia Capital Allocation Moderate Portfolio, January 31, 2018
| Cleared credit default swap contracts - sell protection |
Reference
entity | Counterparty | Maturity
date | Receive
fixed
rate
(%) | Payment
frequency | Implied
credit
spread
(%) | Notional
currency | Notional
amount | Value
($) | Upfront
payments
($) | Upfront
receipts
($) | Unrealized
appreciation
($) | Unrealized
depreciation
($) |
| Markit CDX North America High Yield Index, Series 29 | Morgan Stanley | 12/20/2022 | 5.000 | Quarterly | 3.011 | USD | 29,000,000 | 222,710 | — | — | 222,710 | — |
Notes to Portfolio of Investments
| (a) | As defined in the Investment Company Act of 1940, an affiliated company is one in which the Fund owns 5% or more of the company’s outstanding voting securities, or a company which is under common ownership or control with the Fund. Holdings and transactions in these affiliated companies during the year ended January 31, 2018 are as follows: |
| Issuer | Beginning
shares | Shares
purchased | Shares
sold | Ending
shares | Capital gain
distributions —
affiliated
issuers ($) | Realized gain
(loss) —
affiliated
issuers ($) | Net change in
unrealized
appreciation
(depreciation) —
affiliated
issuers ($) | Dividends —
affiliated
issuers ($) | Value —
affiliated
issuers
at end of
period ($) |
| Columbia Absolute Return Currency and Income Fund, Class I Shares |
| | 828,427 | 2,077 | (830,504)* | — | — | 28,473 | (735,665) | — | — |
| Columbia Absolute Return Currency and Income Fund, Institutional 3 Class |
| | — | 884,219* | (6,653) | 877,566 | — | 6,761 | 56,409 | — | 8,977,503 |
| Columbia Alternative Beta Fund, Class I Shares |
| | 458,101 | — | (458,101)* | — | — | — | 389,274 | — | — |
| Columbia Alternative Beta Fund, Institutional 3 Class |
| | — | 468,858* | — | 468,858 | — | — | (253,934) | 103,305 | 4,411,947 |
| Columbia Commodity Strategy Fund, Class I Shares |
| | 3,978,653 | 1,620,200 | (5,598,853)* | — | — | — | 365,224 | — | — |
| Columbia Commodity Strategy Fund, Institutional 3 Class |
| | — | 5,775,677* | (169,364) | 5,606,313 | — | (36,083) | 927,080 | 51,253 | 32,909,059 |
| Columbia Contrarian Core Fund, Class I Shares |
| | 3,326,676 | — | (3,326,676)* | — | — | 1,411,009 | (9,266,080) | — | — |
| Columbia Contrarian Core Fund, Institutional 3 Class |
| | — | 3,301,871* | (261,124) | 3,040,747 | 3,730,591 | 2,859,398 | 18,856,236 | 827,920 | 84,259,105 |
| Columbia Contrarian Europe Fund, Class I Shares |
| | 8,065,814 | — | (8,065,814)* | — | — | — | (214,088) | — | — |
| Columbia Contrarian Europe Fund, Institutional 3 Class |
| | — | 8,458,077* | (1,373,925) | 7,084,152 | — | 1,964,496 | 11,114,220 | 966,481 | 54,052,080 |
| Columbia Corporate Income Fund, Class I Shares |
| | 12,719,884 | 138,114 | (12,857,998)* | — | — | 37,948 | 1,117,662 | 528,132 | — |
| Columbia Corporate Income Fund, Institutional 3 Class |
| | — | 13,190,213* | (412,683) | 12,777,530 | — | 147,848 | 1,094,286 | 3,152,294 | 130,458,585 |
| Columbia Disciplined Core Fund, Class I Shares |
| | 6,078,758 | 6,235 | (6,084,993)* | — | — | 1,544,791 | (24,881,034) | — | — |
| Columbia Disciplined Core Fund, Institutional 3 Class |
| | — | 6,169,569* | (635,334) | 5,534,235 | 2,949,046 | 3,803,031 | 32,784,350 | 1,177,361 | 70,229,440 |
| Columbia Disciplined Growth Fund, Class I Shares |
| | 7,476,584 | — | (7,476,584)* | — | — | (70,157) | 788,781 | — | — |
| Columbia Disciplined Growth Fund, Institutional 3 Class |
| | — | 8,043,628* | (888,993) | 7,154,635 | 7,848,089 | 1,967,865 | 8,721,251 | 426,979 | 72,047,171 |
| Columbia Disciplined Small Core Fund, Class I Shares |
| | 2,144,006 | 21,449 | (2,165,455)* | — | — | (128,670) | 7,846,671 | — | — |
The accompanying Notes to Financial Statements are an integral part of this statement.
Columbia Capital Allocation Portfolios | Annual Report 2018
| 53 |
Portfolio of Investments (continued)
Columbia Capital Allocation Moderate Portfolio, January 31, 2018
Notes to Portfolio of Investments (continued)
| Issuer | Beginning
shares | Shares
purchased | Shares
sold | Ending
shares | Capital gain
distributions —
affiliated
issuers ($) | Realized gain
(loss) —
affiliated
issuers ($) | Net change in
unrealized
appreciation
(depreciation) —
affiliated
issuers ($) | Dividends —
affiliated
issuers ($) | Value —
affiliated
issuers
at end of
period ($) |
| Columbia Disciplined Small Core Fund, Institutional 3 Class |
| | — | 2,577,918* | (113,197) | 2,464,721 | 3,479,359 | (798,200) | (8,350,506) | 119,651 | 22,108,546 |
| Columbia Disciplined Value Fund, Class I Shares |
| | 9,648,447 | 10,689 | (9,659,136)* | — | — | 493,658 | (6,580,610) | — | — |
| Columbia Disciplined Value Fund, Institutional 3 Class |
| | — | 10,102,784* | (730,671) | 9,372,113 | 5,062,706 | 1,520,635 | 18,521,369 | 2,252,997 | 105,342,552 |
| Columbia Diversified Absolute Return Fund, Class I Shares |
| | 2,169,972 | 13,110 | (2,183,082)* | — | — | (13,934) | 1,118,282 | — | — |
| Columbia Diversified Absolute Return Fund, Institutional 3 Class |
| | — | 2,220,084* | (26,953) | 2,193,131 | — | (10,515) | (508,002) | — | 21,339,165 |
| Columbia Emerging Markets Bond Fund, Class I Shares |
| | 2,406,864 | 24,106 | (2,430,970)* | — | — | 65,128 | (432,817) | 170,957 | — |
| Columbia Emerging Markets Bond Fund, Institutional 3 Class |
| | — | 2,513,989* | (234,168) | 2,279,821 | — | 266,467 | 1,518,346 | 1,354,397 | 27,221,060 |
| Columbia Emerging Markets Fund, Class I Shares |
| | 4,286,289 | — | (4,286,289)* | — | — | — | (2,950,183) | — | — |
| Columbia Emerging Markets Fund, Institutional 3 Class |
| | — | 4,294,239* | (1,043,166) | 3,251,073 | — | 2,541,472 | 17,732,268 | 214,016 | 48,278,429 |
| Columbia High Yield Bond Fund, Class I Shares |
| | 2,607,520 | 19,234 | (2,626,754)* | — | — | (575) | 54,065 | 56,056 | — |
| Columbia High Yield Bond Fund, Institutional 3 Class |
| | — | 2,738,687* | (44,093) | 2,694,594 | — | 144 | (208) | 335,871 | 7,949,051 |
| Columbia Income Opportunities Fund, Class I Shares |
| | 10,084,407 | 76,268 | (10,160,675)* | — | — | 78,483 | (42,652) | 720,722 | — |
| Columbia Income Opportunities Fund, Institutional 3 Class |
| | — | 10,564,632* | (174,117) | 10,390,515 | — | 88,780 | 399,049 | 4,166,777 | 103,073,909 |
| Columbia Inflation Protected Securities Fund, Class I Shares |
| | 1,614,603 | 13,698 | (1,628,301)* | — | — | 60,952 | 742,101 | — | — |
| Columbia Inflation Protected Securities Fund, Institutional 3 Class |
| | — | 1,692,774* | (22,419) | 1,670,355 | — | (15,394) | (993,810) | 409,312 | 15,851,671 |
| Columbia Large Cap Growth Fund, Class I Shares |
| | 597,790 | 762 | (598,552)* | — | — | 423,636 | (5,612,813) | — | — |
| Columbia Large Cap Growth Fund, Institutional 3 Class |
| | — | 615,079* | (42,298) | 572,781 | 1,377,437 | 931,279 | 9,351,710 | 59,722 | 25,465,844 |
| Columbia Limited Duration Credit Fund, Class I Shares |
| | 3,496,211 | 31,386 | (3,527,597)* | — | — | (3,049) | 506,650 | 87,222 | — |
| Columbia Limited Duration Credit Fund, Institutional 3 Class |
| | — | 3,642,120* | (35,832) | 3,606,288 | — | (2,796) | (699,678) | 562,349 | 35,233,434 |
| Columbia Mortgage Opportunities Fund, Class I Shares |
| | 2,631,105 | 32,559 | (2,663,664)* | — | — | (15,447) | 408,993 | 159,063 | — |
| Columbia Mortgage Opportunities Fund, Institutional 3 Class |
| | — | 2,811,361* | (85,179) | 2,726,182 | 869,851 | (5,911) | (582,772) | 934,021 | 26,634,799 |
The accompanying Notes to Financial Statements are an integral part of this statement.
| 54 | Columbia Capital Allocation Portfolios | Annual Report 2018 |
Portfolio of Investments (continued)
Columbia Capital Allocation Moderate Portfolio, January 31, 2018
Notes to Portfolio of Investments (continued)
| Issuer | Beginning
shares | Shares
purchased | Shares
sold | Ending
shares | Capital gain
distributions —
affiliated
issuers ($) | Realized gain
(loss) —
affiliated
issuers ($) | Net change in
unrealized
appreciation
(depreciation) —
affiliated
issuers ($) | Dividends —
affiliated
issuers ($) | Value —
affiliated
issuers
at end of
period ($) |
| Columbia Multi-Asset Income Fund, Class I Shares |
| | 3,622,034 | 31,296 | (3,653,330)* | — | — | — | 976,466 | 303,704 | — |
| Columbia Multi-Asset Income Fund, Institutional 3 Class |
| | — | 3,820,772* | — | 3,820,772 | — | — | 279,392 | 1,574,941 | 37,978,474 |
| Columbia Overseas Value Fund, Class I Shares |
| | 6,296,658 | 2,293 | (6,298,951)* | — | — | (38,149) | 2,069,995 | — | — |
| Columbia Overseas Value Fund, Institutional 3 Class |
| | — | 6,359,292* | (927,870) | 5,431,422 | 941,030 | 758,243 | 11,241,701 | 1,022,237 | 58,985,244 |
| Columbia Pacific/Asia Fund, Class I Shares |
| | 4,369,094 | 36,266 | (4,405,360)* | — | — | 300,171 | (5,907,817) | — | — |
| Columbia Pacific/Asia Fund, Institutional 3 Class |
| | — | 4,639,500* | (887,239) | 3,752,261 | 3,187,898 | 3,024,061 | 13,670,364 | 464,233 | 45,252,270 |
| Columbia Select Large Cap Equity Fund, Class I Shares |
| | 4,848,903 | — | (4,848,903)* | — | — | 91,567 | (1,758,568) | — | — |
| Columbia Select Large Cap Equity Fund, Institutional 3 Class |
| | — | 4,965,016* | (505,068) | 4,459,948 | 3,080,221 | 789,432 | 13,449,099 | 576,838 | 67,300,617 |
| Columbia Select Large Cap Growth Fund, Class I Shares |
| | 2,560,754 | 3,672 | (2,564,426)* | — | — | 516,242 | (1,680,015) | — | — |
| Columbia Select Large Cap Growth Fund, Institutional 3 Class |
| | — | 2,629,326* | (346,782) | 2,282,544 | 4,103,688 | 1,771,477 | 7,610,394 | — | 42,729,224 |
| Columbia Select Large-Cap Value Fund, Class I Shares |
| | 1,372,678 | — | (1,372,678)* | — | — | 543,853 | (10,772,086) | — | — |
| Columbia Select Large-Cap Value Fund, Institutional 3 Class |
| | — | 1,364,075* | (112,436) | 1,251,639 | 1,245,136 | 1,546,753 | 14,561,617 | 406,133 | 35,959,604 |
| Columbia Short-Term Cash Fund, 1.475% |
| | 93,238,902 | 86,934,012 | (69,090,012) | 111,082,902 | — | (1,277) | 1,512 | 1,046,410 | 111,082,902 |
| Columbia Total Return Bond Fund, Class I Shares |
| | 21,679,684 | 371,659 | (22,051,343)* | — | — | (17,203) | 7,377,080 | 745,774 | — |
| Columbia Total Return Bond Fund, Institutional 3 Class |
| | — | 22,691,185* | (599,956) | 22,091,229 | — | (25,698) | (7,712,791) | 4,790,660 | 197,937,412 |
| Columbia U.S. Government Mortgage Fund, Class I Shares |
| | 12,503,810 | 232,003 | (12,735,813)* | — | — | (56,605) | 1,892,807 | 246,705 | — |
| Columbia U.S. Government Mortgage Fund, Institutional 3 Class |
| | — | 13,082,747* | (316,777) | 12,765,970 | — | (36,004) | (2,162,795) | 1,817,869 | 68,170,277 |
| Columbia U.S. Treasury Index Fund, Class I Shares |
| | 4,273,125 | 4,818 | (4,277,943)* | — | — | — | 482,808 | 99,384 | — |
| Columbia U.S. Treasury Index Fund, Institutional 3 Class |
| | — | 4,410,708* | (165,590) | 4,245,118 | — | (6,342) | (934,037) | 623,261 | 46,441,594 |
| Total | | | | | 37,875,052 | 28,302,044 | 114,994,551 | 32,555,007 | 1,607,680,968 |
| * | Includes the effect of underlying share class exchange. |
| (b) | Non-income producing investment. |
| (c) | The rate shown is the seven-day current annualized yield at January 31, 2018. |
The accompanying Notes to Financial Statements are an integral part of this statement.
Columbia Capital Allocation Portfolios | Annual Report 2018
| 55 |
Portfolio of Investments (continued)
Columbia Capital Allocation Moderate Portfolio, January 31, 2018
Abbreviation Legend
| ADR | American Depositary Receipt |
Currency Legend
| AUD | Australian Dollar |
| BRL | Brazilian Real |
| CAD | Canada Dollar |
| CHF | Swiss Franc |
| CNY | China Yuan Renminbi |
| GBP | British Pound |
| HUF | Hungarian Forint |
| IDR | Indonesian Rupiah |
| ILS | New Israeli Sheqel |
| INR | Indian Rupee |
| JPY | Japanese Yen |
| KRW | South Korean Won |
| MXN | Mexican Peso |
| NOK | Norwegian Krone |
| SEK | Swedish Krona |
| SGD | Singapore Dollar |
| THB | Thailand Baht |
| TRY | Turkish Lira |
| TWD | New Taiwan Dollar |
| USD | US Dollar |
| ZAR | South African Rand |
Fair value measurements
The Fund categorizes its fair value measurements according to a three-level hierarchy that maximizes the use of observable inputs and minimizes the use of unobservable inputs by prioritizing that the most observable input be used when available. Observable inputs are those that market participants would use in pricing an investment based on market data obtained from sources independent of the reporting entity. Unobservable inputs are those that reflect the Fund’s assumptions about the information market participants would use in pricing an investment. An investment’s level within the fair value hierarchy is based on the lowest level of any input that is deemed significant to the asset’s or liability’s fair value measurement. The input levels are not necessarily an indication of the risk or liquidity associated with investments at that level. For example, certain U.S. government securities are generally high quality and liquid, however, they are reflected as Level 2 because the inputs used to determine fair value may not always be quoted prices in an active market.
Fair value inputs are summarized in the three broad levels listed below:
| ¦ | Level 1 — Valuations based on quoted prices for investments in active markets that the Fund has the ability to access at the measurement date. Valuation adjustments are not applied to Level 1 investments. |
| ¦ | Level 2 — Valuations based on other significant observable inputs (including quoted prices for similar securities, interest rates, prepayment speeds, credit risks, etc.). |
| ¦ | Level 3 — Valuations based on significant unobservable inputs (including the Fund’s own assumptions and judgment in determining the fair value of investments). |
Inputs that are used in determining fair value of an investment may include price information, credit data, volatility statistics, and other factors. These inputs can be either observable or unobservable. The availability of observable inputs can vary between investments, and is affected by various factors such as the type of investment, and the volume and level of activity for that investment or similar investments in the marketplace. The inputs will be considered by the Investment Manager, along with any other relevant factors in the calculation of an investment’s fair value. The Fund uses prices and inputs that are current as of the measurement date, which may include periods of market dislocations. During these periods, the availability of prices and inputs may be reduced for many investments. This condition could cause an investment to be reclassified between the various levels within the hierarchy.
Foreign equity securities actively traded in markets where there is a significant delay in the local close relative to the New York Stock Exchange are classified as Level 2. The values of these securities may include an adjustment to reflect the impact of significant market movements following the close of local trading, as described in Note 2 to the financial statements – Security valuation.
Certain investments that have been measured at fair value using the net asset value (NAV) per share (or its equivalent) are not categorized in the fair value hierarchy. The fair value amounts presented in the table are intended to reconcile the fair value hierarchy to the amounts presented in the Portfolio of Investments. The Columbia Short-Term Cash Fund seeks to provide shareholders with maximum current income consistent with liquidity and stability of principal. Columbia Short-Term Cash Fund prices its shares with a floating NAV and no longer seeks to maintain a stable NAV.
Investments falling into the Level 3 category are primarily supported by quoted prices from brokers and dealers participating in the market for those investments. However, these may be classified as Level 3 investments due to lack of market transparency and corroboration to support these quoted prices. Additionally, valuation models may be used as the pricing source for any remaining investments classified as Level 3. These models may rely on one or more significant unobservable inputs and/or significant assumptions by the Investment Manager. Inputs used in valuations may include, but are not limited to, financial statement analysis, capital account balances, discount rates and estimated cash flows, and comparable company data.
The accompanying Notes to Financial Statements are an integral part of this statement.
| 56 | Columbia Capital Allocation Portfolios | Annual Report 2018 |
Portfolio of Investments (continued)
Columbia Capital Allocation Moderate Portfolio, January 31, 2018
Fair value measurements (continued)
Under the direction of the Fund’s Board of Trustees (the Board), the Investment Manager’s Valuation Committee (the Committee) is responsible for overseeing the valuation procedures approved by the Board. The Committee consists of voting and non-voting members from various groups within the Investment Manager’s organization, including operations and accounting, trading and investments, compliance, risk management and legal.
The Committee meets at least monthly to review and approve valuation matters, which may include a description of specific valuation determinations, data regarding pricing information received from approved pricing vendors and brokers and the results of Board-approved valuation control policies and procedures (the Policies). The Policies address, among other things, instances when market quotations are or are not readily available, including recommendations of third party pricing vendors and a determination of appropriate pricing methodologies; events that require specific valuation determinations and assessment of fair value techniques; securities with a potential for stale pricing, including those that are illiquid, restricted, or in default; and the effectiveness of third party pricing vendors, including periodic reviews of vendors. The Committee meets more frequently, as needed, to discuss additional valuation matters, which may include the need to review back-testing results, review time-sensitive information or approve related valuation actions. The Committee reports to the Board, with members of the Committee meeting with the Board at each of its regularly scheduled meetings to discuss valuation matters and actions during the period, similar to those described earlier.
For investments categorized as Level 3, the Committee monitors information similar to that described above, which may include: (i) data specific to the issuer or comparable issuers, (ii) general market or specific sector news and (iii) quoted prices and specific or similar security transactions. The Committee considers this data and any changes from prior periods in order to assess the reasonableness of observable and unobservable inputs, any assumptions or internal models used to value those securities and changes in fair value. This data is also used to corroborate, when available, information received from approved pricing vendors and brokers. Various factors impact the frequency of monitoring this information (which may occur as often as daily). However, the Committee may determine that changes to inputs, assumptions and models are not required as a result of the monitoring procedures performed.
The following table is a summary of the inputs used to value the Fund’s investments at January 31, 2018:
| | Level 1
quoted prices
in active
markets for
identical
assets ($) | Level 2
other
significant
observable
inputs ($) | Level 3
significant
unobservable
inputs ($) | Investments
measured at
net asset
value ($) | Total ($) |
| Investments | | | | | |
| Alternative Strategies Funds | 105,616,148 | — | — | — | 105,616,148 |
| Common Stocks | | | | | |
| Consumer Discretionary | 3,282,454 | 1,123,896 | — | — | 4,406,350 |
| Consumer Staples | 849,566 | 929,228 | — | — | 1,778,794 |
| Energy | 954,798 | 867,270 | — | — | 1,822,068 |
| Financials | 4,828,982 | 2,407,782 | — | — | 7,236,764 |
| Health Care | 3,987,662 | 902,342 | — | — | 4,890,004 |
| Industrials | 3,712,155 | 1,411,036 | — | — | 5,123,191 |
| Information Technology | 4,382,058 | 1,229,448 | — | — | 5,611,506 |
| Materials | 1,375,084 | 884,351 | — | — | 2,259,435 |
| Real Estate | 1,537,755 | 342,667 | — | — | 1,880,422 |
| Telecommunication Services | 162,022 | 423,404 | — | — | 585,426 |
| Utilities | 783,512 | 303,591 | — | — | 1,087,103 |
| Total Common Stocks | 25,856,048 | 10,825,015 | — | — | 36,681,063 |
| Equity Funds | 732,010,126 | — | — | — | 732,010,126 |
| Fixed-Income Funds | 658,971,792 | — | — | — | 658,971,792 |
| Rights | | | | | |
| Industrials | — | 665 | — | — | 665 |
| Money Market Funds | — | — | — | 111,082,902 | 111,082,902 |
| Total Investments | 1,522,454,114 | 10,825,680 | — | 111,082,902 | 1,644,362,696 |
| Derivatives | | | | | |
| Asset | | | | | |
| Forward Foreign Currency Exchange Contracts | — | 26,134 | — | — | 26,134 |
| Futures Contracts | 8,299,882 | — | — | — | 8,299,882 |
| Swap Contracts | — | 222,710 | — | — | 222,710 |
| Liability | | | | | |
| Forward Foreign Currency Exchange Contracts | — | (17,554) | — | — | (17,554) |
| Futures Contracts | (1,361,078) | — | — | — | (1,361,078) |
| Swap Contracts | — | (54,902) | — | — | (54,902) |
| Total | 1,529,392,918 | 11,002,068 | — | 111,082,902 | 1,651,477,888 |
See the Portfolio of Investments for all investment classifications not indicated in the table.
The accompanying Notes to Financial Statements are an integral part of this statement.
Columbia Capital Allocation Portfolios | Annual Report 2018
| 57 |
Portfolio of Investments (continued)
Columbia Capital Allocation Moderate Portfolio, January 31, 2018
Fair value measurements (continued)
The Fund’s assets assigned to the Level 2 input category are generally valued using the market approach, in which a security’s value is determined through reference to prices and information from market transactions for similar or identical assets. These assets include certain foreign securities for which a third party statistical pricing service may be employed for purposes of fair market valuation. The model utilized by such third party statistical pricing service takes into account a security’s correlation to available market data including, but not limited to, intraday index, ADR, and exchange-traded fund movements.
Derivative instruments are valued at unrealized appreciation (depreciation).
There were no transfers of financial assets between levels during the period.
The accompanying Notes to Financial Statements are an integral part of this statement.
| 58 | Columbia Capital Allocation Portfolios | Annual Report 2018 |
Portfolio of Investments
Columbia Capital Allocation Moderate Aggressive Portfolio, January 31, 2018
(Percentages represent value of investments compared to net assets)
| Alternative Strategies Funds 6.3% |
| | Shares | Value ($) |
| Columbia Absolute Return Currency and Income Fund, Institutional 3 Class(a),(b) | 1,079,795 | 11,046,301 |
| Columbia Alternative Beta Fund, Institutional 3 Class(a) | 468,857 | 4,411,947 |
| Columbia Commodity Strategy Fund, Institutional 3 Class(a) | 9,257,066 | 54,338,980 |
| Columbia Diversified Absolute Return Fund, Institutional 3 Class(a),(b) | 2,571,926 | 25,024,841 |
| Columbia Multi-Asset Income Fund, Institutional 3 Class(a) | 5,179,971 | 51,488,908 |
Total Alternative Strategies Funds
(Cost $145,277,719) | 146,310,977 |
|
| Common Stocks 1.5% |
| Issuer | Shares | Value ($) |
| Consumer Discretionary 0.2% |
| Auto Components —% |
| Dana, Inc. | 2,950 | 97,321 |
| Dorman Products, Inc.(b) | 2,400 | 181,056 |
| Magna International, Inc. | 2,578 | 147,260 |
| Total | | 425,637 |
| Automobiles —% |
| Fiat Chrysler Automobiles NV(b) | 812 | 19,620 |
| Peugeot SA | 5,933 | 133,253 |
| Subaru Corp. | 3,400 | 113,249 |
| Suzuki Motor Corp. | 2,600 | 149,331 |
| Winnebago Industries, Inc. | 300 | 13,635 |
| Total | | 429,088 |
| Diversified Consumer Services —% |
| Adtalem Global Education, Inc.(b) | 4,200 | 193,200 |
| Sotheby’s (b) | 2,500 | 131,900 |
| Weight Watchers International, Inc.(b) | 2,250 | 144,652 |
| Total | | 469,752 |
| Hotels, Restaurants & Leisure —% |
| Bloomin’ Brands, Inc. | 3,400 | 74,902 |
| Brinker International, Inc. | 800 | 29,072 |
| Compass Group PLC | 942 | 19,828 |
| Cracker Barrel Old Country Store, Inc. | 885 | 156,185 |
| Dave & Buster’s Entertainment, Inc.(b) | 525 | 24,675 |
| Common Stocks (continued) |
| Issuer | Shares | Value ($) |
| Ruth’s Hospitality Group, Inc. | 7,005 | 166,019 |
| Sonic Corp. | 3,650 | 94,316 |
| Total | | 564,997 |
| Household Durables 0.1% |
| Electrolux AB, Class B | 2,249 | 79,401 |
| La-Z-Boy, Inc. | 5,125 | 154,519 |
| MDC Holdings, Inc. | 1,232 | 41,531 |
| Persimmon PLC | 2,239 | 79,539 |
| Taylor Wimpey PLC | 43,522 | 117,781 |
| Zagg, Inc.(b) | 8,100 | 135,270 |
| Total | | 608,041 |
| Internet & Direct Marketing Retail —% |
| Nutrisystem, Inc. | 600 | 25,950 |
| PetMed Express, Inc. | 3,400 | 153,680 |
| Total | | 179,630 |
| Leisure Products —% |
| Sturm Ruger & Co., Inc. | 1,850 | 97,958 |
| Media —% |
| Entravision Communications Corp., Class A | 19,300 | 134,135 |
| Gannett Co., Inc. | 14,700 | 173,460 |
| Gray Television, Inc.(b) | 4,400 | 71,940 |
| New York Times Co. (The), Class A | 2,820 | 65,565 |
| Total | | 445,100 |
| Multiline Retail —% |
| Next PLC | 996 | 72,010 |
| Specialty Retail 0.1% |
| Buckle, Inc. (The) | 1,500 | 30,075 |
| Finish Line, Inc., Class A (The) | 10,900 | 123,497 |
| Hibbett Sports, Inc.(b) | 4,600 | 103,960 |
| Restoration Hardware Holdings, Inc.(b) | 1,800 | 169,182 |
| Sleep Number Corp.(b) | 4,600 | 173,144 |
| Tailored Brands, Inc. | 1,400 | 33,866 |
| Tilly’s, Inc. | 2,900 | 43,268 |
| Total | | 676,992 |
The accompanying Notes to Financial Statements are an integral part of this statement.
Columbia Capital Allocation Portfolios | Annual Report 2018
| 59 |
Portfolio of Investments (continued)
Columbia Capital Allocation Moderate Aggressive Portfolio, January 31, 2018
| Common Stocks (continued) |
| Issuer | Shares | Value ($) |
| Textiles, Apparel & Luxury Goods —% |
| Deckers Outdoor Corp.(b) | 2,340 | 200,561 |
| Movado Group, Inc. | 5,125 | 156,825 |
| Total | | 357,386 |
| Total Consumer Discretionary | 4,326,591 |
| Consumer Staples 0.1% |
| Beverages —% |
| Boston Beer Co., Inc. (The), Class A(b) | 650 | 123,402 |
| Food & Staples Retailing —% |
| BIM Birlesik Magazalar AS | 761 | 15,224 |
| Distribuidora Internacional de Alimentacion SA | 5,940 | 31,719 |
| George Weston Ltd. | 100 | 8,758 |
| Ingles Markets, Inc., Class A | 1,300 | 43,680 |
| Jeronimo Martins SGPS SA | 4,205 | 89,561 |
| Loblaw Companies Ltd. | 300 | 16,251 |
| SUPERVALU, Inc.(b) | 2,954 | 46,791 |
| United Natural Foods, Inc.(b) | 2,000 | 95,200 |
| Wal-Mart de Mexico SAB de CV, Class V | 31,974 | 79,988 |
| Wm Morrison Supermarkets PLC | 9,922 | 31,275 |
| Woolworths Group Ltd. | 605 | 13,140 |
| Total | | 471,587 |
| Food Products 0.1% |
| China Milk Products Group Ltd.(b),(c),(d),(e) | 322,000 | 0 |
| Dean Foods Co. | 2,280 | 23,644 |
| John B. Sanfilippo & Son, Inc. | 2,000 | 125,240 |
| Sanderson Farms, Inc. | 1,335 | 169,411 |
| Uni-President Enterprises Corp. | 9,000 | 21,604 |
| WH Group Ltd. | 133,000 | 164,442 |
| Total | | 504,341 |
| Household Products —% |
| Central Garden & Pet Co., Class A(b) | 2,200 | 82,984 |
| Personal Products —% |
| Unilever NV-CVA | 689 | 39,906 |
| Usana Health Sciences, Inc.(b) | 1,145 | 85,474 |
| Total | | 125,380 |
| Common Stocks (continued) |
| Issuer | Shares | Value ($) |
| Tobacco —% |
| Imperial Brands PLC | 2,687 | 110,582 |
| Swedish Match AB | 3,220 | 130,436 |
| Total | | 241,018 |
| Total Consumer Staples | 1,548,712 |
| Energy 0.1% |
| Energy Equipment & Services —% |
| Archrock, Inc. | 12,200 | 113,460 |
| Exterran Corp.(b) | 5,200 | 150,176 |
| McDermott International, Inc.(b) | 16,000 | 140,480 |
| Rowan Companies PLC, Class A(b) | 11,500 | 169,280 |
| Total | | 573,396 |
| Oil, Gas & Consumable Fuels 0.1% |
| China Petroleum & Chemical Corp., Class H | 92,000 | 79,526 |
| China Shenhua Energy Co., Ltd., Class H | 49,000 | 152,255 |
| CVR Energy, Inc. | 1,500 | 53,685 |
| Lukoil PJSC | 72 | 4,775 |
| MOL Hungarian Oil & Gas PLC | 7,300 | 89,179 |
| OMV AG | 1,455 | 93,683 |
| Par Pacific Holdings, Inc.(b) | 1,900 | 34,637 |
| Peabody Energy Corp.(b) | 1,600 | 64,656 |
| Polski Koncern Naftowy Orlen SA | 1,107 | 35,903 |
| PTT PCL, Foreign Registered Shares | 9,500 | 149,156 |
| REX American Resources Corp.(b) | 1,607 | 131,212 |
| Ultra Petroleum Corp.(b) | 18,800 | 131,224 |
| W&T Offshore, Inc.(b) | 16,100 | 77,924 |
| Total | | 1,097,815 |
| Total Energy | 1,671,211 |
| Financials 0.3% |
| Banks 0.2% |
| Agricultural Bank of China Ltd., Class H | 256,000 | 156,631 |
| BancFirst Corp. | 400 | 22,300 |
| Bancorp, Inc. (The)(b) | 2,000 | 21,140 |
| BancorpSouth Bank | 900 | 30,195 |
| Bank Hapoalim BM | 1,046 | 7,831 |
| Bank of China Ltd., Class H | 106,000 | 63,529 |
| Bank of Nova Scotia (The) | 2,049 | 136,134 |
| Banner Corp. | 875 | 47,548 |
The accompanying Notes to Financial Statements are an integral part of this statement.
| 60 | Columbia Capital Allocation Portfolios | Annual Report 2018 |
Portfolio of Investments (continued)
Columbia Capital Allocation Moderate Aggressive Portfolio, January 31, 2018
| Common Stocks (continued) |
| Issuer | Shares | Value ($) |
| Cathay General Bancorp | 4,300 | 188,082 |
| Central Pacific Financial Corp. | 1,940 | 57,366 |
| China Construction Bank Corp., Class H | 19,000 | 21,813 |
| CoBiz Financial, Inc. | 1,000 | 20,060 |
| CTBC Financial Holding Co., Ltd. | 63,000 | 46,035 |
| Customers Bancorp, Inc.(b) | 4,740 | 145,281 |
| Dubai Islamic Bank PJSC | 41,396 | 68,675 |
| Enterprise Financial Services Corp. | 1,125 | 54,731 |
| First Citizens BancShares Inc., Class A | 450 | 191,434 |
| First Financial Bancorp | 5,700 | 162,450 |
| First Merchants Corp. | 3,300 | 142,428 |
| Grupo Financiero Banorte SAB de CV, Class O | 21,724 | 139,133 |
| Hana Financial Group, Inc. | 2,943 | 143,412 |
| Hancock Holding Co. | 3,800 | 204,060 |
| Heritage Financial Corp. | 3,000 | 92,400 |
| International Bancshares Corp. | 3,190 | 132,385 |
| Japan Post Bank Co., Ltd. | 2,400 | 32,484 |
| Malayan Banking Bhd | 11,700 | 30,317 |
| Preferred Bank/Los Angeles | 2,500 | 161,050 |
| S&T Bancorp, Inc. | 3,800 | 153,368 |
| Sandy Spring Bancorp, Inc. | 1,775 | 67,131 |
| Societe Generale SA | 2,537 | 147,584 |
| Standard Bank Group Ltd. | 2,726 | 46,175 |
| Triumph Bancorp, Inc.(b) | 750 | 28,875 |
| Turkiye Is Bankasi AS | 48,236 | 103,365 |
| Valley National Bancorp | 14,600 | 183,522 |
| WesBanco, Inc. | 500 | 20,505 |
| Wintrust Financial Corp. | 2,385 | 204,871 |
| Woori Finance Holdings Co., Ltd. | 5,684 | 89,616 |
| Total | | 3,563,916 |
| Capital Markets —% |
| Arlington Asset Investment Corp., Class A | 1,590 | 16,695 |
| China Huarong Asset Management Co., Ltd., Class H(f) | 94,000 | 47,425 |
| Cohen & Steers, Inc. | 2,625 | 107,021 |
| Houlihan Lokey, Inc. | 3,000 | 143,100 |
| Total | | 314,241 |
| Common Stocks (continued) |
| Issuer | Shares | Value ($) |
| Consumer Finance —% |
| Green Dot Corp., Class A(b) | 2,800 | 171,528 |
| Nelnet, Inc., Class A | 2,650 | 138,092 |
| Total | | 309,620 |
| Diversified Financial Services —% |
| EXOR NV | 252 | 19,467 |
| Insurance 0.1% |
| Allianz SE, Registered Shares | 774 | 195,555 |
| American Equity Investment Life Holding Co. | 5,400 | 178,200 |
| Assicurazioni Generali SpA | 6,772 | 134,272 |
| AXA SA | 4,606 | 151,514 |
| CNO Financial Group, Inc. | 7,500 | 184,425 |
| CNP Assurances | 823 | 21,090 |
| Health Insurance Innovations, Inc., Class A(b) | 3,900 | 101,205 |
| Legal & General Group PLC | 13,585 | 52,195 |
| Mapfre SA | 26,989 | 95,867 |
| Swiss Re AG | 46 | 4,537 |
| Third Point Reinsurance Ltd.(b) | 1,100 | 15,675 |
| Universal Insurance Holdings, Inc. | 4,248 | 124,891 |
| Total | | 1,259,426 |
| Mortgage Real Estate Investment Trusts (REITS) —% |
| AG Mortgage Investment Trust, Inc. | 2,000 | 34,880 |
| ARMOUR Residential REIT, Inc. | 5,100 | 119,391 |
| Invesco Mortgage Capital, Inc. | 8,800 | 142,912 |
| Total | | 297,183 |
| Thrifts & Mortgage Finance —% |
| Essent Group Ltd.(b) | 4,500 | 209,340 |
| Federal Agricultural Mortgage Corp. | 2,000 | 160,500 |
| Flagstar Bancorp, Inc.(b) | 4,250 | 158,312 |
| MGIC Investment Corp.(b) | 14,990 | 222,152 |
| Radian Group, Inc. | 2,500 | 55,175 |
| Walker & Dunlop, Inc.(b) | 3,140 | 145,853 |
| Washington Federal, Inc. | 4,450 | 159,755 |
| Total | | 1,111,087 |
| Total Financials | 6,874,940 |
The accompanying Notes to Financial Statements are an integral part of this statement.
Columbia Capital Allocation Portfolios | Annual Report 2018
| 61 |
Portfolio of Investments (continued)
Columbia Capital Allocation Moderate Aggressive Portfolio, January 31, 2018
| Common Stocks (continued) |
| Issuer | Shares | Value ($) |
| Health Care 0.2% |
| Biotechnology 0.1% |
| Alder Biopharmaceuticals, Inc.(b) | 8,007 | 113,299 |
| Atara Biotherapeutics, Inc.(b) | 3,000 | 113,400 |
| bluebird bio, Inc.(b) | 680 | 139,332 |
| Blueprint Medicines Corp.(b) | 950 | 74,718 |
| Clovis Oncology, Inc.(b) | 850 | 51,425 |
| Coherus Biosciences, Inc.(b) | 1,495 | 15,100 |
| Dynavax Technologies Corp.(b) | 3,495 | 56,270 |
| Eagle Pharmaceuticals, Inc.(b) | 300 | 17,931 |
| Global Blood Therapeutics, Inc.(b) | 750 | 43,425 |
| Immunomedics, Inc.(b) | 5,700 | 95,019 |
| Insmed, Inc.(b) | 3,029 | 77,058 |
| Jounce Therapeutics, Inc.(b) | 3,195 | 77,255 |
| Keryx Biopharmaceuticals, Inc.(b) | 8,975 | 41,554 |
| Loxo Oncology, Inc.(b) | 875 | 88,786 |
| NewLink Genetics Corp.(b) | 6,200 | 51,150 |
| Nightstar Therapeutics PLC, ADR(b) | 3,263 | 46,432 |
| OncoMed Pharmaceuticals, Inc.(b) | 9,100 | 22,750 |
| Ovid Therapeutics, Inc.(b) | 6,327 | 53,780 |
| Puma Biotechnology, Inc.(b) | 1,415 | 94,593 |
| Sage Therapeutics, Inc.(b) | 780 | 148,044 |
| Shire PLC | 454 | 21,449 |
| Spark Therapeutics, Inc.(b) | 1,506 | 84,411 |
| TESARO, Inc.(b) | 1,585 | 106,924 |
| Total | | 1,634,105 |
| Health Care Equipment & Supplies —% |
| Analogic Corp. | 1,970 | 163,313 |
| Angiodynamics, Inc.(b) | 6,100 | 106,201 |
| CONMED Corp. | 400 | 23,112 |
| Haemonetics Corp.(b) | 2,600 | 168,090 |
| Integer Holdings Corp.(b) | 3,200 | 160,480 |
| Lantheus Holdings, Inc.(b) | 7,112 | 163,576 |
| Masimo Corp.(b) | 2,075 | 195,548 |
| Total | | 980,320 |
| Common Stocks (continued) |
| Issuer | Shares | Value ($) |
| Health Care Providers & Services —% |
| Diplomat Pharmacy, Inc.(b) | 6,950 | 187,580 |
| Kindred Healthcare, Inc. | 3,200 | 29,440 |
| Molina Healthcare, Inc.(b) | 2,381 | 217,528 |
| Providence Service Corp. (The)(b) | 2,600 | 167,258 |
| Tivity Health, Inc.(b) | 4,300 | 166,625 |
| Triple-S Management Corp., Class B(b) | 5,770 | 132,595 |
| Total | | 901,026 |
| Life Sciences Tools & Services —% |
| Pra Health Sciences, Inc.(b) | 2,341 | 213,172 |
| Pharmaceuticals 0.1% |
| Aerie Pharmaceuticals, Inc.(b) | 1,565 | 85,840 |
| Bayer AG, Registered Shares | 359 | 46,987 |
| Corcept Therapeutics, Inc.(b) | 7,950 | 182,969 |
| GlaxoSmithKline PLC | 8,341 | 156,374 |
| Lannett Co., Inc.(b) | 6,550 | 133,293 |
| Novo Nordisk A/S, Class B | 1,565 | 87,042 |
| Odonate Therapeutics, Inc.(b) | 2,700 | 56,106 |
| Pacira Pharmaceuticals, Inc.(b) | 1,950 | 70,980 |
| Phibro Animal Health Corp., Class A | 3,600 | 122,580 |
| Roche Holding AG, Genusschein Shares | 753 | 185,631 |
| Sanofi | 1,492 | 131,742 |
| Supernus Pharmaceuticals, Inc.(b) | 1,720 | 67,166 |
| Total | | 1,326,710 |
| Total Health Care | 5,055,333 |
| Industrials 0.2% |
| Aerospace & Defense —% |
| Curtiss-Wright Corp. | 1,880 | 245,641 |
| Moog, Inc., Class A(b) | 280 | 25,217 |
| Total | | 270,858 |
| Air Freight & Logistics —% |
| Forward Air Corp. | 1,275 | 77,405 |
| Airlines —% |
| Deutsche Lufthansa AG, Registered Shares | 4,167 | 148,687 |
| International Consolidated Airlines Group SA | 3,268 | 29,700 |
| Qantas Airways Ltd. | 17,611 | 74,634 |
| Total | | 253,021 |
The accompanying Notes to Financial Statements are an integral part of this statement.
| 62 | Columbia Capital Allocation Portfolios | Annual Report 2018 |
Portfolio of Investments (continued)
Columbia Capital Allocation Moderate Aggressive Portfolio, January 31, 2018
| Common Stocks (continued) |
| Issuer | Shares | Value ($) |
| Building Products —% |
| Caesarstone Ltd.(b) | 5,000 | 106,000 |
| Continental Building Product(b) | 6,215 | 176,817 |
| Total | | 282,817 |
| Commercial Services & Supplies —% |
| ACCO Brands Corp.(b) | 11,400 | 135,090 |
| Brady Corp., Class A | 1,025 | 39,206 |
| Essendant, Inc. | 10,700 | 96,835 |
| MSA Safety, Inc. | 2,100 | 164,451 |
| SP Plus Corp.(b) | 3,600 | 138,780 |
| Total | | 574,362 |
| Construction & Engineering 0.1% |
| ACS Actividades de Construccion y Servicios SA | 885 | 35,446 |
| Comfort Systems U.S.A., Inc. | 1,300 | 55,380 |
| EMCOR Group, Inc. | 2,600 | 211,328 |
| Kajima Corp. | 12,000 | 119,137 |
| KBR, Inc. | 4,200 | 85,428 |
| Obayashi Corp. | 10,600 | 127,980 |
| Primoris Services Corp. | 5,900 | 153,400 |
| Taisei Corp. | 2,700 | 137,810 |
| Total | | 925,909 |
| Electrical Equipment —% |
| ABB Ltd. | 2,114 | 58,940 |
| Atkore International Group, Inc.(b) | 6,000 | 140,280 |
| Generac Holdings, Inc.(b) | 3,750 | 183,487 |
| Total | | 382,707 |
| Industrial Conglomerates —% |
| CITIC Ltd. | 81,000 | 127,480 |
| Shanghai Industrial Holdings Ltd. | 5,000 | 14,607 |
| Total | | 142,087 |
| Machinery 0.1% |
| Alamo Group, Inc. | 1,400 | 161,042 |
| Briggs & Stratton Corp. | 2,100 | 50,778 |
| EnPro Industries, Inc. | 500 | 43,995 |
| Global Brass & Copper Holdings, Inc. | 4,600 | 147,890 |
| Harsco Corp.(b) | 7,200 | 128,880 |
| Hillenbrand, Inc. | 3,800 | 168,340 |
| Kadant, Inc. | 1,250 | 125,312 |
| Common Stocks (continued) |
| Issuer | Shares | Value ($) |
| Mueller Industries, Inc. | 1,825 | 60,389 |
| RBC Bearings, Inc.(b) | 710 | 89,460 |
| Volvo AB B Shares | 753 | 15,371 |
| Wabash National Corp. | 6,230 | 160,921 |
| Total | | 1,152,378 |
| Professional Services —% |
| Korn/Ferry International | 1,200 | 53,472 |
| RPX Corp. | 11,470 | 161,039 |
| TrueBlue, Inc.(b) | 2,200 | 60,170 |
| Total | | 274,681 |
| Road & Rail —% |
| ArcBest Corp. | 4,790 | 170,285 |
| Saia, Inc.(b) | 1,400 | 105,770 |
| Total | | 276,055 |
| Trading Companies & Distributors —% |
| Applied Industrial Technologies, Inc. | 2,780 | 205,025 |
| Beacon Roofing Supply, Inc.(b) | 3,000 | 181,500 |
| ITOCHU Corp. | 4,500 | 88,545 |
| Mitsubishi Corp. | 200 | 5,605 |
| Total | | 480,675 |
| Total Industrials | 5,092,955 |
| Information Technology 0.2% |
| Communications Equipment —% |
| CalAmp Corp.(b) | 3,000 | 73,440 |
| Comtech Telecommunications Corp. | 6,800 | 147,084 |
| Netscout Systems, Inc.(b) | 6,300 | 179,550 |
| Total | | 400,074 |
| Electronic Equipment, Instruments & Components 0.1% |
| Anixter International, Inc.(b) | 1,500 | 125,550 |
| AU Optronics Corp. | 7,000 | 3,329 |
| Benchmark Electronics, Inc.(b) | 5,100 | 147,645 |
| ePlus, Inc.(b) | 1,100 | 84,920 |
| Hitachi Ltd. | 20,000 | 159,596 |
| KEMET Corp.(b) | 4,850 | 98,746 |
| Kingboard Chemical Holdings Ltd. | 6,500 | 35,566 |
| Methode Electronics, Inc. | 1,500 | 61,275 |
| Sanmina Corp.(b) | 4,510 | 117,937 |
| Scansource, Inc.(b) | 2,425 | 82,935 |
The accompanying Notes to Financial Statements are an integral part of this statement.
Columbia Capital Allocation Portfolios | Annual Report 2018
| 63 |
Portfolio of Investments (continued)
Columbia Capital Allocation Moderate Aggressive Portfolio, January 31, 2018
| Common Stocks (continued) |
| Issuer | Shares | Value ($) |
| Tech Data Corp.(b) | 1,800 | 180,486 |
| Vishay Intertechnology, Inc. | 8,800 | 193,160 |
| Total | | 1,291,145 |
| Internet Software & Services —% |
| j2 Global, Inc. | 2,200 | 175,978 |
| Mixi, Inc. | 2,400 | 105,975 |
| New Relic, Inc.(b) | 1,800 | 107,514 |
| Stamps.com, Inc.(b) | 950 | 193,657 |
| Web.com Group, Inc.(b) | 4,600 | 106,950 |
| Total | | 690,074 |
| IT Services —% |
| CACI International, Inc., Class A(b) | 400 | 56,220 |
| CSG Systems International, Inc. | 1,900 | 85,823 |
| EVERTEC, Inc. | 2,523 | 39,485 |
| MAXIMUS, Inc. | 2,800 | 190,904 |
| Perficient, Inc.(b) | 2,000 | 38,740 |
| Travelport Worldwide Ltd. | 11,900 | 161,959 |
| TTEC Holdings, Inc. | 3,100 | 123,070 |
| Total | | 696,201 |
| Semiconductors & Semiconductor Equipment 0.1% |
| Amkor Technology, Inc.(b) | 14,545 | 146,323 |
| Cirrus Logic, Inc.(b) | 3,100 | 153,667 |
| Diodes, Inc.(b) | 5,385 | 151,803 |
| Formfactor, Inc.(b) | 9,300 | 133,455 |
| Phison Electronics Corp. | 8,000 | 81,514 |
| Rudolph Technologies, Inc.(b) | 2,700 | 70,740 |
| Synaptics, Inc.(b) | 3,725 | 161,442 |
| Tokyo Electron Ltd. | 600 | 113,185 |
| Xcerra Corp.(b) | 12,171 | 121,467 |
| Total | | 1,133,596 |
| Software —% |
| Aspen Technology, Inc.(b) | 3,230 | 250,163 |
| Check Point Software Technologies Ltd.(b) | 476 | 49,223 |
| Imperva, Inc.(b) | 3,700 | 161,875 |
| Paycom Software, Inc.(b) | 550 | 50,402 |
| Paylocity Holding Corp.(b) | 2,100 | 109,809 |
| Progress Software Corp. | 4,025 | 200,566 |
| Proofpoint, Inc.(b) | 1,980 | 202,000 |
| Common Stocks (continued) |
| Issuer | Shares | Value ($) |
| VASCO Data Security International, Inc.(b) | 3,350 | 48,240 |
| Verint Systems, Inc.(b) | 800 | 33,400 |
| Total | | 1,105,678 |
| Technology Hardware, Storage & Peripherals —% |
| Compal Electronics, Inc. | 48,000 | 35,733 |
| Pegatron Corp. | 44,000 | 119,043 |
| Samsung Electronics Co., Ltd. | 86 | 201,010 |
| Total | | 355,786 |
| Total Information Technology | 5,672,554 |
| Materials 0.1% |
| Chemicals 0.1% |
| Covestro AG | 144 | 16,552 |
| Ferro Corp.(b) | 700 | 16,464 |
| Innospec, Inc. | 2,205 | 158,319 |
| Kronos Worldwide, Inc. | 5,400 | 148,230 |
| Mitsubishi Chemical Holdings Corp. | 8,000 | 87,250 |
| Quaker Chemical Corp. | 300 | 46,170 |
| Sinopec Shanghai Petrochemical Co., Ltd. | 170,000 | 103,797 |
| Trinseo SA | 2,570 | 211,896 |
| Total | | 788,678 |
| Containers & Packaging —% |
| Greif, Inc., Class A | 1,975 | 116,762 |
| Metals & Mining —% |
| Fortescue Metals Group Ltd. | 30,831 | 122,437 |
| Materion Corp. | 3,205 | 159,288 |
| Rio Tinto PLC | 2,508 | 139,662 |
| Teck Resources Ltd., Class B | 3,100 | 90,026 |
| Warrior Met Coal, Inc. | 5,600 | 156,632 |
| Total | | 668,045 |
| Paper & Forest Products —% |
| Boise Cascade Co. | 3,900 | 173,355 |
| Louisiana-Pacific Corp.(b) | 6,800 | 201,348 |
| UPM-Kymmene OYJ | 4,351 | 146,610 |
| Total | | 521,313 |
| Total Materials | 2,094,798 |
The accompanying Notes to Financial Statements are an integral part of this statement.
| 64 | Columbia Capital Allocation Portfolios | Annual Report 2018 |
Portfolio of Investments (continued)
Columbia Capital Allocation Moderate Aggressive Portfolio, January 31, 2018
| Common Stocks (continued) |
| Issuer | Shares | Value ($) |
| Real Estate 0.1% |
| Equity Real Estate Investment Trusts (REITS) 0.1% |
| CareTrust REIT, Inc. | 2,600 | 41,314 |
| CorEnergy Infrastructure Trust, Inc. | 4,043 | 154,968 |
| DiamondRock Hospitality Co. | 10,100 | 118,776 |
| Four Corners Property Trust, Inc. | 1,100 | 25,960 |
| Getty Realty Corp. | 600 | 15,744 |
| Growthpoint Properties Ltd. | 4,352 | 10,198 |
| Lexington Realty Trust | 8,500 | 76,670 |
| National Health Investors, Inc. | 2,400 | 169,272 |
| Pebblebrook Hotel Trust | 4,500 | 175,500 |
| Potlatch Corp. | 1,000 | 52,900 |
| Preferred Apartment Communities, Inc., Class A | 2,400 | 40,008 |
| PS Business Parks, Inc. | 1,296 | 158,255 |
| Ryman Hospitality Properties, Inc. | 2,300 | 176,065 |
| Stockland | 3,300 | 11,256 |
| Summit Hotel Properties, Inc. | 8,600 | 133,214 |
| Sunstone Hotel Investors, Inc. | 3,500 | 58,975 |
| Tier REIT, Inc. | 3,700 | 71,817 |
| Xenia Hotels & Resorts, Inc. | 7,700 | 170,940 |
| Total | | 1,661,832 |
| Real Estate Management & Development —% |
| Aldar Properties PJSC | 40,900 | 25,500 |
| CK Asset Holdings Ltd. | 9,500 | 90,398 |
| HFF, Inc., Class A | 1,250 | 61,513 |
| Kerry Properties Ltd. | 2,000 | 9,562 |
| Shimao Property Holdings Ltd. | 22,500 | 66,766 |
| Sun Hung Kai Properties Ltd. | 1,000 | 17,289 |
| Wheelock & Co., Ltd. | 1,336 | 10,448 |
| Total | | 281,476 |
| Total Real Estate | 1,943,308 |
| Telecommunication Services —% |
| Diversified Telecommunication Services —% |
| ATN International, Inc. | 200 | 11,872 |
| Nippon Telegraph & Telephone Corp. | 2,700 | 129,289 |
| Orange SA | 452 | 8,162 |
| Telefonica SA | 1,808 | 18,526 |
| Common Stocks (continued) |
| Issuer | Shares | Value ($) |
| Telenor ASA | 5,191 | 121,545 |
| Telstra Corp., Ltd. | 5,677 | 16,784 |
| Total | | 306,178 |
| Wireless Telecommunication Services —% |
| Boingo Wireless, Inc.(b) | 6,200 | 150,350 |
| Mobile Telesystems PJSC, ADR | 824 | 10,003 |
| Total | | 160,353 |
| Total Telecommunication Services | 466,531 |
| Utilities —% |
| Electric Utilities —% |
| Allete, Inc. | 1,500 | 108,660 |
| El Paso Electric Co. | 1,200 | 62,640 |
| Enel SpA | 19,738 | 125,224 |
| IDACORP, Inc. | 300 | 25,884 |
| Inter RAO UES PJSC(b) | 1,053,000 | 70,995 |
| PNM Resources, Inc. | 400 | 15,240 |
| Portland General Electric Co. | 3,820 | 161,777 |
| Scottish & Southern Energy PLC | 423 | 7,835 |
| Transmissora Alianca de Energia Eletrica SA | 2,400 | 15,179 |
| Total | | 593,434 |
| Gas Utilities —% |
| Chesapeake Utilities Corp. | 1,675 | 123,113 |
| Southwest Gas Corp. | 1,400 | 103,012 |
| Total | | 226,125 |
| Independent Power and Renewable Electricity Producers —% |
| Ormat Technologies, Inc. | 2,150 | 150,672 |
| Multi-Utilities —% |
| Engie SA | 440 | 7,637 |
| Water Utilities —% |
| SJW Corp. | 1,485 | 88,862 |
| Total Utilities | 1,066,730 |
Total Common Stocks
(Cost $30,835,588) | 35,813,663 |
|
The accompanying Notes to Financial Statements are an integral part of this statement.
Columbia Capital Allocation Portfolios | Annual Report 2018
| 65 |
Portfolio of Investments (continued)
Columbia Capital Allocation Moderate Aggressive Portfolio, January 31, 2018
| Equity Funds 56.3% |
| | Shares | Value ($) |
| International 16.6% |
| Columbia Contrarian Europe Fund, Institutional 3 Class(a) | 9,628,851 | 73,468,133 |
| Columbia Emerging Markets Fund, Institutional 3 Class(a) | 8,152,466 | 121,064,124 |
| Columbia Overseas Value Fund, Institutional 3 Class(a) | 10,009,973 | 108,708,305 |
| Columbia Pacific/Asia Fund, Institutional 3 Class(a) | 6,715,411 | 80,987,855 |
| Total | 384,228,417 |
| U.S. Large Cap 38.4% |
| Columbia Contrarian Core Fund, Institutional 3 Class(a) | 5,115,562 | 141,752,217 |
| Columbia Disciplined Core Fund, Institutional 3 Class(a) | 11,023,846 | 139,892,610 |
| Columbia Disciplined Growth Fund, Institutional 3 Class(a) | 9,636,834 | 97,042,918 |
| Columbia Disciplined Value Fund, Institutional 3 Class(a) | 16,530,865 | 185,806,923 |
| Columbia Large Cap Growth Fund, Institutional 3 Class(a) | 1,580,124 | 70,252,288 |
| Columbia Select Large Cap Equity Fund, Institutional 3 Class(a) | 6,949,940 | 104,874,598 |
| Columbia Select Large Cap Growth Fund, Institutional 3 Class(a),(b) | 4,369,718 | 81,801,121 |
| Columbia Select Large-Cap Value Fund, Institutional 3 Class(a) | 2,413,643 | 69,343,960 |
| Total | 890,766,635 |
| U.S. Small Cap 1.3% |
| Columbia Disciplined Small Core Fund, Institutional 3 Class(a) | 1,244,035 | 11,158,995 |
| Columbia Select Smaller-Cap Value Fund, Institutional 3 Class(a) | 303,390 | 6,789,861 |
| Columbia Small Cap Growth Fund I, Institutional 3 Class(a),(b) | 535,718 | 10,966,151 |
| Total | 28,915,007 |
Total Equity Funds
(Cost $989,348,259) | 1,303,910,059 |
|
| Fixed-Income Funds 22.6% |
| | |
| Emerging Markets 1.2% |
| Columbia Emerging Markets Bond Fund, Institutional 3 Class(a) | 2,266,469 | 27,061,640 |
| Fixed-Income Funds (continued) |
| | Shares | Value ($) |
| High Yield 7.0% |
| Columbia High Yield Bond Fund, Institutional 3 Class(a) | 20,909,613 | 61,683,358 |
| Columbia Income Opportunities Fund, Institutional 3 Class(a) | 10,112,626 | 100,317,254 |
| Total | 162,000,612 |
| Inflation Protected Securities 0.4% |
| Columbia Inflation Protected Securities Fund, Institutional 3 Class(a) | 1,117,062 | 10,600,917 |
| Investment Grade 14.0% |
| Columbia Corporate Income Fund, Institutional 3 Class(a) | 16,435,982 | 167,811,369 |
| Columbia Mortgage Opportunities Fund, Institutional 3 Class(a) | 1,996,078 | 19,501,683 |
| Columbia U.S. Government Mortgage Fund, Institutional 3 Class(a) | 22,731,787 | 121,387,742 |
| Columbia U.S. Treasury Index Fund, Institutional 3 Class(a) | 1,462,553 | 16,000,331 |
| Total | 324,701,125 |
Total Fixed-Income Funds
(Cost $525,584,905) | 524,364,294 |
|
| Rights —% |
| Issuer | Shares | Value ($) |
| Industrials —% |
| Construction & Engineering —% |
| ACS Actividades de Construccion y Servicios SA(b) | 885 | 464 |
| Total Industrials | 464 |
Total Rights
(Cost $486) | 464 |
|
| Money Market Funds 12.7% |
| | Shares | Value ($) |
| Columbia Short-Term Cash Fund, 1.475%(a),(g) | 293,866,699 | 293,866,699 |
Total Money Market Funds
(Cost $293,863,336) | 293,866,699 |
Total Investments
(Cost: $1,984,910,293) | 2,304,266,156 |
| Other Assets & Liabilities, Net | | 13,431,944 |
| Net Assets | 2,317,698,100 |
At January 31, 2018, securities and/or cash totaling $13,941,065 were pledged as collateral.
The accompanying Notes to Financial Statements are an integral part of this statement.
| 66 | Columbia Capital Allocation Portfolios | Annual Report 2018 |
Portfolio of Investments (continued)
Columbia Capital Allocation Moderate Aggressive Portfolio, January 31, 2018
Investments in derivatives
| Forward foreign currency exchange contracts |
Currency to
be sold | Currency to
be purchased | Counterparty | Settlement
date | Unrealized
appreciation ($) | Unrealized
depreciation ($) |
| 957,000 CNY | 148,227 USD | JPMorgan | 03/14/2018 | — | (3,325) |
| 20,716,000 HUF | 82,181 USD | JPMorgan | 03/14/2018 | — | (884) |
| 113,000 ILS | 32,926 USD | JPMorgan | 03/14/2018 | — | (176) |
| 131,870,000 KRW | 123,778 USD | JPMorgan | 03/14/2018 | 390 | — |
| 2,020,000 MXN | 106,943 USD | JPMorgan | 03/14/2018 | — | (909) |
| 647,000 NOK | 82,366 USD | JPMorgan | 03/14/2018 | — | (1,663) |
| 527,000 SEK | 65,789 USD | JPMorgan | 03/14/2018 | — | (1,265) |
| 2,887,000 THB | 90,396 USD | JPMorgan | 03/14/2018 | — | (1,864) |
| 160,000 TRY | 41,230 USD | JPMorgan | 03/14/2018 | — | (878) |
| 2,182,000 TWD | 74,036 USD | JPMorgan | 03/14/2018 | — | (1,038) |
| 140,618 USD | 176,000 AUD | JPMorgan | 03/14/2018 | 1,182 | — |
| 123,754 USD | 401,000 BRL | JPMorgan | 03/14/2018 | 1,598 | — |
| 123,977 USD | 154,000 CAD | JPMorgan | 03/14/2018 | 1,283 | — |
| 156,348 USD | 150,000 CHF | JPMorgan | 03/14/2018 | 5,295 | — |
| 156,796 USD | 113,000 GBP | JPMorgan | 03/14/2018 | 3,884 | — |
| 41,170 USD | 550,194,000 IDR | JPMorgan | 03/14/2018 | — | (67) |
| 172,792 USD | 11,096,000 INR | JPMorgan | 03/14/2018 | 692 | — |
| 33,282 USD | 44,000 SGD | JPMorgan | 03/14/2018 | 287 | — |
| 90,496 USD | 1,121,000 ZAR | JPMorgan | 03/14/2018 | 3,586 | — |
| Total | | | | 18,197 | (12,069) |
| Long futures contracts |
| Description | Number of
contracts | Expiration
date | Trading
currency | Notional
amount | Value/Unrealized
appreciation ($) | Value/Unrealized
depreciation ($) |
| MSCI EAFE Index | 221 | 03/2018 | USD | 23,707,775 | 1,417,933 | — |
| MSCI Emerging Markets Index | 627 | 03/2018 | USD | 39,432,030 | 1,199,295 | — |
| Russell 2000 E-mini | 419 | 03/2018 | USD | 33,017,200 | 1,084,186 | — |
| S&P 500 E-mini | 1,352 | 03/2018 | USD | 191,024,080 | 13,168,507 | — |
| TOPIX Index | 22 | 03/2018 | JPY | 404,690,000 | 114,377 | — |
| U.S. Long Bond | 282 | 03/2018 | USD | 42,610,640 | — | (1,333,320) |
| U.S. Treasury 10-Year Note | 12 | 03/2018 | USD | 1,469,373 | — | (34,243) |
| U.S. Treasury 5-Year Note | 499 | 03/2018 | USD | 57,477,021 | — | (932,749) |
| Total | | | | | 16,984,298 | (2,300,312) |
| Short futures contracts |
| Description | Number of
contracts | Expiration
date | Trading
currency | Notional
amount | Value/Unrealized
appreciation ($) | Value/Unrealized
depreciation ($) |
| FTSE 100 Index | (112) | 03/2018 | GBP | (8,363,040) | — | (87,352) |
| Cleared credit default swap contracts - buy protection |
Reference
entity | Counterparty | Maturity
date | Pay
fixed
rate
(%) | Payment
frequency | Notional
currency | Notional
amount | Value
($) | Upfront
payments
($) | Upfront
receipts
($) | Unrealized
appreciation
($) | Unrealized
depreciation
($) |
| Markit CDX North America Investment Grade Index, Series 29 | Morgan Stanley | 12/20/2022 | 1.000 | Quarterly | USD | 12,500,000 | (74,192) | — | — | — | (74,192) |
The accompanying Notes to Financial Statements are an integral part of this statement.
Columbia Capital Allocation Portfolios | Annual Report 2018
| 67 |
Portfolio of Investments (continued)
Columbia Capital Allocation Moderate Aggressive Portfolio, January 31, 2018
| Cleared credit default swap contracts - sell protection |
Reference
entity | Counterparty | Maturity
date | Receive
fixed
rate
(%) | Payment
frequency | Implied
credit
spread
(%) | Notional
currency | Notional
amount | Value
($) | Upfront
payments
($) | Upfront
receipts
($) | Unrealized
appreciation
($) | Unrealized
depreciation
($) |
| Markit CDX North America High Yield Index, Series 29 | Morgan Stanley | 12/20/2022 | 5.000 | Quarterly | 3.011 | USD | 46,000,000 | 356,662 | — | — | 356,662 | — |
Notes to Portfolio of Investments
| (a) | As defined in the Investment Company Act of 1940, an affiliated company is one in which the Fund owns 5% or more of the company’s outstanding voting securities, or a company which is under common ownership or control with the Fund. Holdings and transactions in these affiliated companies during the year ended January 31, 2018 are as follows: |
| Issuer | Beginning
shares | Shares
purchased | Shares
sold | Ending
shares | Capital gain
distributions —
affiliated
issuers ($) | Realized gain
(loss) —
affiliated
issuers ($) | Net change in
unrealized
appreciation
(depreciation) —
affiliated
issuers ($) | Dividends —
affiliated
issuers ($) | Value —
affiliated
issuers
at end of
period ($) |
| Columbia Absolute Return Currency and Income Fund, Class I Shares |
| | 1,144,206 | 22,453 | (1,166,659)* | — | — | 58,453 | (947,606) | — | — |
| Columbia Absolute Return Currency and Income Fund, Institutional 3 Class |
| | — | 1,118,056* | (38,261) | 1,079,795 | — | 18,930 | 1,356 | — | 11,046,301 |
| Columbia Alternative Beta Fund, Class I Shares |
| | 458,101 | — | (458,101)* | — | — | — | 389,274 | — | — |
| Columbia Alternative Beta Fund, Institutional 3 Class |
| | — | 468,857* | — | 468,857 | — | — | (253,934) | 103,305 | 4,411,947 |
| Columbia Commodity Strategy Fund, Class I Shares |
| | 6,297,489 | 3,655,781 | (9,953,270)* | — | — | (211) | 596,222 | — | — |
| Columbia Commodity Strategy Fund, Institutional 3 Class |
| | — | 9,951,908* | (694,842) | 9,257,066 | — | (202,592) | 1,546,282 | 84,681 | 54,338,980 |
| Columbia Contrarian Core Fund, Class I Shares |
| | 5,538,551 | 23,077 | (5,561,628)* | — | — | 1,668,309 | (18,933,080) | — | — |
| Columbia Contrarian Core Fund, Institutional 3 Class |
| | — | 5,591,978* | (476,416) | 5,115,562 | 6,326,613 | 5,268,776 | 35,442,774 | 1,404,048 | 141,752,217 |
| Columbia Contrarian Europe Fund, Class I Shares |
| | 11,039,188 | — | (11,039,188)* | — | — | — | 8,928,380 | — | — |
| Columbia Contrarian Europe Fund, Institutional 3 Class |
| | — | 11,519,684* | (1,890,833) | 9,628,851 | — | 1,913,472 | 6,626,586 | 1,314,462 | 73,468,133 |
| Columbia Corporate Income Fund, Class I Shares |
| | 16,421,977 | 400,095 | (16,822,072)* | — | — | 34,293 | 810,120 | 687,244 | — |
| Columbia Corporate Income Fund, Institutional 3 Class |
| | — | 17,130,307* | (694,325) | 16,435,982 | — | 262,144 | 2,065,325 | 4,107,020 | 167,811,369 |
| Columbia Disciplined Core Fund, Class I Shares |
| | 12,173,141 | 43,997 | (12,217,138)* | — | — | 3,090,684 | (47,557,324) | — | — |
| Columbia Disciplined Core Fund, Institutional 3 Class |
| | — | 12,288,742* | (1,264,896) | 11,023,846 | 5,919,802 | 7,276,680 | 63,743,315 | 2,363,390 | 139,892,610 |
| Columbia Disciplined Growth Fund, Class I Shares |
| | 10,209,743 | 31,675 | (10,241,418)* | — | — | 314,029 | 3,346,418 | — | — |
| Columbia Disciplined Growth Fund, Institutional 3 Class |
| | — | 10,929,308* | (1,292,474) | 9,636,834 | 10,628,915 | 2,328,085 | 9,521,073 | 578,271 | 97,042,918 |
| Columbia Disciplined Small Core Fund, Class I Shares |
| | 1,093,755 | 14,513 | (1,108,268)* | — | — | (25,206) | 4,060,914 | — | — |
The accompanying Notes to Financial Statements are an integral part of this statement.
| 68 | Columbia Capital Allocation Portfolios | Annual Report 2018 |
Portfolio of Investments (continued)
Columbia Capital Allocation Moderate Aggressive Portfolio, January 31, 2018
Notes to Portfolio of Investments (continued)
| Issuer | Beginning
shares | Shares
purchased | Shares
sold | Ending
shares | Capital gain
distributions —
affiliated
issuers ($) | Realized gain
(loss) —
affiliated
issuers ($) | Net change in
unrealized
appreciation
(depreciation) —
affiliated
issuers ($) | Dividends —
affiliated
issuers ($) | Value —
affiliated
issuers
at end of
period ($) |
| Columbia Disciplined Small Core Fund, Institutional 3 Class |
| | — | 1,292,046* | (48,011) | 1,244,035 | 1,753,405 | (346,095) | (4,430,399) | 60,297 | 11,158,995 |
| Columbia Disciplined Value Fund, Class I Shares |
| | 17,188,273 | 60,161 | (17,248,434)* | — | — | 634,667 | (11,052,007) | — | — |
| Columbia Disciplined Value Fund, Institutional 3 Class |
| | — | 17,799,391* | (1,268,526) | 16,530,865 | 8,993,667 | 2,658,231 | 32,452,039 | 4,002,346 | 185,806,923 |
| Columbia Diversified Absolute Return Fund, Class I Shares |
| | 2,730,823 | 44,508 | (2,775,331)* | — | — | (44,356) | 1,404,586 | — | — |
| Columbia Diversified Absolute Return Fund, Institutional 3 Class |
| | — | 2,688,370* | (116,444) | 2,571,926 | — | (46,278) | (604,703) | — | 25,024,841 |
| Columbia Emerging Markets Bond Fund, Class I Shares |
| | 2,339,511 | 47,896 | (2,387,407)* | — | — | 15,605 | (87,711) | 166,054 | — |
| Columbia Emerging Markets Bond Fund, Institutional 3 Class |
| | — | 2,377,327* | (110,858) | 2,266,469 | — | 61,773 | 1,385,120 | 1,355,509 | 27,061,640 |
| Columbia Emerging Markets Fund, Class I Shares |
| | 10,936,948 | — | (10,936,948)* | — | — | 279,400 | (5,948,571) | — | — |
| Columbia Emerging Markets Fund, Institutional 3 Class |
| | — | 10,113,238* | (1,960,772) | 8,152,466 | — | 5,007,307 | 44,119,009 | 534,157 | 121,064,124 |
| Columbia High Yield Bond Fund, Class I Shares |
| | 20,742,021 | 225,198 | (20,967,219)* | — | — | 72,785 | 759,947 | 448,270 | — |
| Columbia High Yield Bond Fund, Institutional 3 Class |
| | — | 21,604,764* | (695,151) | 20,909,613 | — | 35,039 | (434,721) | 2,638,665 | 61,683,358 |
| Columbia Income Opportunities Fund, Class I Shares |
| | 10,242,330 | 151,682 | (10,394,012)* | — | — | 164,132 | (384,978) | 728,867 | — |
| Columbia Income Opportunities Fund, Institutional 3 Class |
| | — | 10,555,204* | (442,578) | 10,112,626 | — | 166,889 | 587,280 | 4,108,657 | 100,317,254 |
| Columbia Inflation Protected Securities Fund, Class I Shares |
| | 1,097,533 | 22,742 | (1,120,275)* | — | — | 117 | (277,312) | — | — |
| Columbia Inflation Protected Securities Fund, Institutional 3 Class |
| | — | 1,143,929* | (26,867) | 1,117,062 | — | 32,925 | 248,346 | 277,429 | 10,600,917 |
| Columbia Large Cap Growth Fund, Class I Shares |
| | 1,775,975 | 13,798 | (1,789,773)* | — | — | 1,189,591 | (14,841,915) | — | — |
| Columbia Large Cap Growth Fund, Institutional 3 Class |
| | — | 1,805,434* | (225,310) | 1,580,124 | 3,818,410 | 4,200,524 | 23,970,548 | 165,555 | 70,252,288 |
| Columbia Mortgage Opportunities Fund, Class I Shares |
| | 1,906,382 | 41,624 | (1,948,006)* | — | — | (993) | 242,471 | 117,447 | — |
| Columbia Mortgage Opportunities Fund, Institutional 3 Class |
| | — | 2,078,096* | (82,018) | 1,996,078 | 639,054 | (2,258) | (378,206) | 692,584 | 19,501,683 |
| Columbia Multi-Asset Income Fund, Class I Shares |
| | 4,910,534 | 42,429 | (4,952,963)* | — | — | — | 1,358,358 | 411,744 | — |
| Columbia Multi-Asset Income Fund, Institutional 3 Class |
| | — | 5,179,971* | — | 5,179,971 | — | — | 344,258 | 2,135,210 | 51,488,908 |
The accompanying Notes to Financial Statements are an integral part of this statement.
Columbia Capital Allocation Portfolios | Annual Report 2018
| 69 |
Portfolio of Investments (continued)
Columbia Capital Allocation Moderate Aggressive Portfolio, January 31, 2018
Notes to Portfolio of Investments (continued)
| Issuer | Beginning
shares | Shares
purchased | Shares
sold | Ending
shares | Capital gain
distributions —
affiliated
issuers ($) | Realized gain
(loss) —
affiliated
issuers ($) | Net change in
unrealized
appreciation
(depreciation) —
affiliated
issuers ($) | Dividends —
affiliated
issuers ($) | Value —
affiliated
issuers
at end of
period ($) |
| Columbia Overseas Value Fund, Class I Shares |
| | 11,780,932 | 77,649 | (11,858,581)* | — | — | (134,590) | 4,070,287 | — | — |
| Columbia Overseas Value Fund, Institutional 3 Class |
| | — | 11,832,660* | (1,822,687) | 10,009,973 | 1,762,162 | 1,597,726 | 20,614,570 | 1,914,230 | 108,708,305 |
| Columbia Pacific/Asia Fund, Class I Shares |
| | 7,855,521 | 99,589 | (7,955,110)* | — | — | 899,900 | (10,414,398) | — | — |
| Columbia Pacific/Asia Fund, Institutional 3 Class |
| | — | 8,231,074* | (1,515,663) | 6,715,411 | 5,699,022 | 5,308,235 | 24,140,928 | 827,162 | 80,987,855 |
| Columbia Select Large Cap Equity Fund, Class I Shares |
| | 7,525,844 | 22,942 | (7,548,786)* | — | — | 180,324 | (3,089,042) | — | — |
| Columbia Select Large Cap Equity Fund, Institutional 3 Class |
| | — | 7,682,330* | (732,390) | 6,949,940 | 4,816,988 | 1,191,926 | 21,341,864 | 902,113 | 104,874,598 |
| Columbia Select Large Cap Growth Fund, Class I Shares |
| | 4,948,254 | 19,591 | (4,967,845)* | — | — | 449,835 | (2,042,107) | — | — |
| Columbia Select Large Cap Growth Fund, Institutional 3 Class |
| | — | 5,083,381* | (713,663) | 4,369,718 | 7,969,366 | 2,736,038 | 14,723,500 | — | 81,801,121 |
| Columbia Select Large-Cap Value Fund, Class I Shares |
| | 2,665,211 | 20,745 | (2,685,956)* | — | — | 1,269,767 | (15,308,952) | — | — |
| Columbia Select Large-Cap Value Fund, Institutional 3 Class |
| | — | 2,644,300* | (230,657) | 2,413,643 | 2,406,034 | 2,928,738 | 22,478,025 | 784,789 | 69,343,960 |
| Columbia Select Smaller-Cap Value Fund, Class I Shares |
| | 302,708 | 3,815 | (306,523)* | — | — | 13,020 | 113,607 | — | — |
| Columbia Select Smaller-Cap Value Fund, Institutional 3 Class |
| | — | 328,609* | (25,219) | 303,390 | 666,945 | 142,133 | 77,883 | — | 6,789,861 |
| Columbia Short-Term Cash Fund, 1.475% |
| | 250,600,424 | 174,164,825 | (130,898,550) | 293,866,699 | — | (2,046) | 3,543 | 2,822,592 | 293,866,699 |
| Columbia Small Cap Growth Fund I, Class I Shares |
| | 570,788 | 25,428 | (596,216)* | — | — | (799,727) | 3,152,582 | — | — |
| Columbia Small Cap Growth Fund I, Institutional 3 Class |
| | — | 614,483* | (78,765) | 535,718 | 1,469,594 | (852,285) | (259,916) | — | 10,966,151 |
| Columbia U.S. Government Mortgage Fund, Class I Shares |
| | 22,484,505 | 752,493 | (23,236,998)* | — | — | (18,267) | 3,737,800 | 448,111 | — |
| Columbia U.S. Government Mortgage Fund, Institutional 3 Class |
| | — | 23,841,135* | (1,109,348) | 22,731,787 | — | (69,140) | (4,222,831) | 3,294,835 | 121,387,742 |
| Columbia U.S. Treasury Index Fund, Class I Shares |
| | 1,573,968 | 61,583 | (1,635,551)* | — | — | (71,000) | 485,225 | 36,663 | — |
| Columbia U.S. Treasury Index Fund, Institutional 3 Class |
| | — | 1,563,554* | (101,001) | 1,462,553 | — | (68,333) | (499,905) | 219,466 | 16,000,331 |
| Total | | | | | 62,869,977 | 50,787,105 | 216,920,197 | 39,735,131 | 2,268,452,029 |
| * | Includes the effect of underlying share class exchange. |
The accompanying Notes to Financial Statements are an integral part of this statement.
| 70 | Columbia Capital Allocation Portfolios | Annual Report 2018 |
Portfolio of Investments (continued)
Columbia Capital Allocation Moderate Aggressive Portfolio, January 31, 2018
Notes to Portfolio of Investments (continued)
| (b) | Non-income producing investment. |
| (c) | Represents fair value as determined in good faith under procedures approved by the Board of Trustees. At January 31, 2018, the value of these securities amounted to $0, which represents less than 0.01% of net assets. |
| (d) | Negligible market value. |
| (e) | Valuation based on significant unobservable inputs. |
| (f) | Represents privately placed and other securities and instruments exempt from SEC registration (collectively, private placements), such as Section 4(a)(2) and Rule 144A eligible securities, which are often sold only to qualified institutional buyers. The Fund may invest in private placements determined to be liquid as well as those determined to be illiquid. Private placements may be determined to be liquid under guidelines established by the Fund’s Board of Trustees. At January 31, 2018, the value of these securities amounted to $47,425, which represents less than 0.01% of net assets. |
| (g) | The rate shown is the seven-day current annualized yield at January 31, 2018. |
Abbreviation Legend
| ADR | American Depositary Receipt |
Currency Legend
| AUD | Australian Dollar |
| BRL | Brazilian Real |
| CAD | Canada Dollar |
| CHF | Swiss Franc |
| CNY | China Yuan Renminbi |
| GBP | British Pound |
| HUF | Hungarian Forint |
| IDR | Indonesian Rupiah |
| ILS | New Israeli Sheqel |
| INR | Indian Rupee |
| JPY | Japanese Yen |
| KRW | South Korean Won |
| MXN | Mexican Peso |
| NOK | Norwegian Krone |
| SEK | Swedish Krona |
| SGD | Singapore Dollar |
| THB | Thailand Baht |
| TRY | Turkish Lira |
| TWD | New Taiwan Dollar |
| USD | US Dollar |
| ZAR | South African Rand |
Fair value measurements
The Fund categorizes its fair value measurements according to a three-level hierarchy that maximizes the use of observable inputs and minimizes the use of unobservable inputs by prioritizing that the most observable input be used when available. Observable inputs are those that market participants would use in pricing an investment based on market data obtained from sources independent of the reporting entity. Unobservable inputs are those that reflect the Fund’s assumptions about the information market participants would use in pricing an investment. An investment’s level within the fair value hierarchy is based on the lowest level of any input that is deemed significant to the asset’s or liability’s fair value measurement. The input levels are not necessarily an indication of the risk or liquidity associated with investments at that level. For example, certain U.S. government securities are generally high quality and liquid, however, they are reflected as Level 2 because the inputs used to determine fair value may not always be quoted prices in an active market.
Fair value inputs are summarized in the three broad levels listed below:
| ¦ | Level 1 — Valuations based on quoted prices for investments in active markets that the Fund has the ability to access at the measurement date. Valuation adjustments are not applied to Level 1 investments. |
| ¦ | Level 2 — Valuations based on other significant observable inputs (including quoted prices for similar securities, interest rates, prepayment speeds, credit risks, etc.). |
| ¦ | Level 3 — Valuations based on significant unobservable inputs (including the Fund’s own assumptions and judgment in determining the fair value of investments). |
The accompanying Notes to Financial Statements are an integral part of this statement.
Columbia Capital Allocation Portfolios | Annual Report 2018
| 71 |
Portfolio of Investments (continued)
Columbia Capital Allocation Moderate Aggressive Portfolio, January 31, 2018
Fair value measurements (continued)
Inputs that are used in determining fair value of an investment may include price information, credit data, volatility statistics, and other factors. These inputs can be either observable or unobservable. The availability of observable inputs can vary between investments, and is affected by various factors such as the type of investment, and the volume and level of activity for that investment or similar investments in the marketplace. The inputs will be considered by the Investment Manager, along with any other relevant factors in the calculation of an investment’s fair value. The Fund uses prices and inputs that are current as of the measurement date, which may include periods of market dislocations. During these periods, the availability of prices and inputs may be reduced for many investments. This condition could cause an investment to be reclassified between the various levels within the hierarchy.
Foreign equity securities actively traded in markets where there is a significant delay in the local close relative to the New York Stock Exchange are classified as Level 2. The values of these securities may include an adjustment to reflect the impact of significant market movements following the close of local trading, as described in Note 2 to the financial statements – Security valuation.
Certain investments that have been measured at fair value using the net asset value (NAV) per share (or its equivalent) are not categorized in the fair value hierarchy. The fair value amounts presented in the table are intended to reconcile the fair value hierarchy to the amounts presented in the Portfolio of Investments. The Columbia Short-Term Cash Fund seeks to provide shareholders with maximum current income consistent with liquidity and stability of principal. Columbia Short-Term Cash Fund prices its shares with a floating NAV and no longer seeks to maintain a stable NAV.
Investments falling into the Level 3 category are primarily supported by quoted prices from brokers and dealers participating in the market for those investments. However, these may be classified as Level 3 investments due to lack of market transparency and corroboration to support these quoted prices. Additionally, valuation models may be used as the pricing source for any remaining investments classified as Level 3. These models may rely on one or more significant unobservable inputs and/or significant assumptions by the Investment Manager. Inputs used in valuations may include, but are not limited to, financial statement analysis, capital account balances, discount rates and estimated cash flows, and comparable company data.
Under the direction of the Fund’s Board of Trustees (the Board), the Investment Manager’s Valuation Committee (the Committee) is responsible for overseeing the valuation procedures approved by the Board. The Committee consists of voting and non-voting members from various groups within the Investment Manager’s organization, including operations and accounting, trading and investments, compliance, risk management and legal.
The Committee meets at least monthly to review and approve valuation matters, which may include a description of specific valuation determinations, data regarding pricing information received from approved pricing vendors and brokers and the results of Board-approved valuation control policies and procedures (the Policies). The Policies address, among other things, instances when market quotations are or are not readily available, including recommendations of third party pricing vendors and a determination of appropriate pricing methodologies; events that require specific valuation determinations and assessment of fair value techniques; securities with a potential for stale pricing, including those that are illiquid, restricted, or in default; and the effectiveness of third party pricing vendors, including periodic reviews of vendors. The Committee meets more frequently, as needed, to discuss additional valuation matters, which may include the need to review back-testing results, review time-sensitive information or approve related valuation actions. The Committee reports to the Board, with members of the Committee meeting with the Board at each of its regularly scheduled meetings to discuss valuation matters and actions during the period, similar to those described earlier.
For investments categorized as Level 3, the Committee monitors information similar to that described above, which may include: (i) data specific to the issuer or comparable issuers, (ii) general market or specific sector news and (iii) quoted prices and specific or similar security transactions. The Committee considers this data and any changes from prior periods in order to assess the reasonableness of observable and unobservable inputs, any assumptions or internal models used to value those securities and changes in fair value. This data is also used to corroborate, when available, information received from approved pricing vendors and brokers. Various factors impact the frequency of monitoring this information (which may occur as often as daily). However, the Committee may determine that changes to inputs, assumptions and models are not required as a result of the monitoring procedures performed.
The following table is a summary of the inputs used to value the Fund’s investments at January 31, 2018:
| | Level 1
quoted prices
in active
markets for
identical
assets ($) | Level 2
other
significant
observable
inputs ($) | Level 3
significant
unobservable
inputs ($) | Investments
measured at
net asset
value ($) | Total ($) |
| Investments | | | | | |
| Alternative Strategies Funds | 146,310,977 | — | — | — | 146,310,977 |
| Common Stocks | | | | | |
| Consumer Discretionary | 3,542,579 | 784,012 | — | — | 4,326,591 |
| Consumer Staples | 900,823 | 647,889 | 0* | — | 1,548,712 |
| Energy | 1,066,734 | 604,477 | — | — | 1,671,211 |
| Financials | 5,195,551 | 1,679,389 | — | — | 6,874,940 |
| Health Care | 4,426,108 | 629,225 | — | — | 5,055,333 |
| Industrials | 4,109,013 | 983,942 | — | — | 5,092,955 |
| Information Technology | 4,817,603 | 854,951 | — | — | 5,672,554 |
| Materials | 1,478,490 | 616,308 | — | — | 2,094,798 |
| Real Estate | 1,701,891 | 241,417 | — | — | 1,943,308 |
| Telecommunication Services | 172,225 | 294,306 | — | — | 466,531 |
| Utilities | 855,039 | 211,691 | — | — | 1,066,730 |
| Total Common Stocks | 28,266,056 | 7,547,607 | 0* | — | 35,813,663 |
| Equity Funds | 1,303,910,059 | — | — | — | 1,303,910,059 |
| Fixed-Income Funds | 524,364,294 | — | — | — | 524,364,294 |
The accompanying Notes to Financial Statements are an integral part of this statement.
| 72 | Columbia Capital Allocation Portfolios | Annual Report 2018 |
Portfolio of Investments (continued)
Columbia Capital Allocation Moderate Aggressive Portfolio, January 31, 2018
Fair value measurements (continued)
| | Level 1
quoted prices
in active
markets for
identical
assets ($) | Level 2
other
significant
observable
inputs ($) | Level 3
significant
unobservable
inputs ($) | Investments
measured at
net asset
value ($) | Total ($) |
| Rights | | | | | |
| Industrials | — | 464 | — | — | 464 |
| Money Market Funds | — | — | — | 293,866,699 | 293,866,699 |
| Total Investments | 2,002,851,386 | 7,548,071 | 0* | 293,866,699 | 2,304,266,156 |
| Derivatives | | | | | |
| Asset | | | | | |
| Forward Foreign Currency Exchange Contracts | — | 18,197 | — | — | 18,197 |
| Futures Contracts | 16,984,298 | — | — | — | 16,984,298 |
| Swap Contracts | — | 356,662 | — | — | 356,662 |
| Liability | | | | | |
| Forward Foreign Currency Exchange Contracts | — | (12,069) | — | — | (12,069) |
| Futures Contracts | (2,387,664) | — | — | — | (2,387,664) |
| Swap Contracts | — | (74,192) | — | — | (74,192) |
| Total | 2,017,448,020 | 7,836,669 | 0* | 293,866,699 | 2,319,151,388 |
See the Portfolio of Investments for all investment classifications not indicated in the table.
The Fund’s assets assigned to the Level 2 input category are generally valued using the market approach, in which a security’s value is determined through reference to prices and information from market transactions for similar or identical assets. These assets include certain foreign securities for which a third party statistical pricing service may be employed for purposes of fair market valuation. The model utilized by such third party statistical pricing service takes into account a security’s correlation to available market data including, but not limited to, intraday index, ADR, and exchange-traded fund movements.
Derivative instruments are valued at unrealized appreciation (depreciation).
There were no transfers of financial assets between levels during the period.
The Fund does not hold any significant investments (greater than one percent of net assets) categorized as Level 3.
The Fund’s assets assigned to the Level 3 category are valued utilizing the valuation technique deemed the most appropriate in the circumstances. Certain common stock classified as Level 3 securities are valued using the market approach. To determine fair value for these securities, management considered various factors which may have included, but were not limited to, the halt price of the security, the movement in observed market prices for other securities from the issuer, the movement in certain foreign or domestic market indices, and the position of the security within the respective company’s capital structure. Significant increases (decreases) to any of these inputs would result in a significantly lower (higher) fair value measurement.
The accompanying Notes to Financial Statements are an integral part of this statement.
Columbia Capital Allocation Portfolios | Annual Report 2018
| 73 |
Portfolio of Investments
Columbia Capital Allocation Aggressive Portfolio, January 31, 2018
(Percentages represent value of investments compared to net assets)
| Alternative Strategies Funds 6.5% |
| | Shares | Value ($) |
| Columbia Absolute Return Currency and Income Fund, Institutional 3 Class(a),(b) | 200,397 | 2,050,061 |
| Columbia Alternative Beta Fund, Institutional 3 Class(a) | 468,857 | 4,411,947 |
| Columbia Commodity Strategy Fund, Institutional 3 Class(a) | 3,894,485 | 22,860,626 |
| Columbia Diversified Absolute Return Fund, Institutional 3 Class(a),(b) | 748,403 | 7,281,955 |
| Columbia Multi-Asset Income Fund, Institutional 3 Class(a) | 1,493,485 | 14,845,243 |
Total Alternative Strategies Funds
(Cost $51,004,367) | 51,449,832 |
|
| Common Stocks 2.8% |
| Issuer | Shares | Value ($) |
| Consumer Discretionary 0.3% |
| Auto Components 0.1% |
| Dana, Inc. | 1,300 | 42,887 |
| Dorman Products, Inc.(b) | 1,100 | 82,984 |
| Magna International, Inc. | 3,103 | 177,249 |
| Total | | 303,120 |
| Automobiles 0.1% |
| Fiat Chrysler Automobiles NV(b) | 963 | 23,269 |
| Peugeot SA | 7,035 | 158,003 |
| Subaru Corp. | 4,000 | 133,234 |
| Suzuki Motor Corp. | 3,100 | 178,049 |
| Winnebago Industries, Inc. | 100 | 4,545 |
| Total | | 497,100 |
| Diversified Consumer Services —% |
| Adtalem Global Education, Inc.(b) | 1,900 | 87,400 |
| Sotheby’s (b) | 1,100 | 58,036 |
| Weight Watchers International, Inc.(b) | 1,000 | 64,290 |
| Total | | 209,726 |
| Hotels, Restaurants & Leisure —% |
| Bloomin’ Brands, Inc. | 1,525 | 33,596 |
| Brinker International, Inc. | 400 | 14,536 |
| Compass Group PLC | 1,116 | 23,491 |
| Cracker Barrel Old Country Store, Inc. | 385 | 67,945 |
| Dave & Buster’s Entertainment, Inc.(b) | 240 | 11,280 |
| Common Stocks (continued) |
| Issuer | Shares | Value ($) |
| Ruth’s Hospitality Group, Inc. | 3,096 | 73,375 |
| Sonic Corp. | 1,625 | 41,990 |
| Total | | 266,213 |
| Household Durables 0.1% |
| Electrolux AB, Class B | 2,665 | 94,088 |
| La-Z-Boy, Inc. | 2,275 | 68,591 |
| MDC Holdings, Inc. | 504 | 16,990 |
| Persimmon PLC | 2,655 | 94,318 |
| Taylor Wimpey PLC | 51,579 | 139,585 |
| Zagg, Inc.(b) | 3,600 | 60,120 |
| Total | | 473,692 |
| Internet & Direct Marketing Retail —% |
| Nutrisystem, Inc. | 300 | 12,975 |
| PetMed Express, Inc. | 1,500 | 67,800 |
| Total | | 80,775 |
| Leisure Products —% |
| Sturm Ruger & Co., Inc. | 830 | 43,949 |
| Media —% |
| Entravision Communications Corp., Class A | 8,600 | 59,770 |
| Gannett Co., Inc. | 6,550 | 77,290 |
| Gray Television, Inc.(b) | 1,950 | 31,882 |
| New York Times Co. (The), Class A | 1,295 | 30,109 |
| Total | | 199,051 |
| Multiline Retail —% |
| Next PLC | 1,180 | 85,313 |
| Specialty Retail —% |
| Buckle, Inc. (The) | 700 | 14,035 |
| Finish Line, Inc., Class A (The) | 4,800 | 54,384 |
| Hibbett Sports, Inc.(b) | 2,100 | 47,460 |
| Restoration Hardware Holdings, Inc.(b) | 800 | 75,192 |
| Sleep Number Corp.(b) | 2,000 | 75,280 |
| Tailored Brands, Inc. | 600 | 14,514 |
| Tilly’s, Inc. | 1,300 | 19,396 |
| Total | | 300,261 |
The accompanying Notes to Financial Statements are an integral part of this statement.
| 74 | Columbia Capital Allocation Portfolios | Annual Report 2018 |
Portfolio of Investments (continued)
Columbia Capital Allocation Aggressive Portfolio, January 31, 2018
| Common Stocks (continued) |
| Issuer | Shares | Value ($) |
| Textiles, Apparel & Luxury Goods —% |
| Deckers Outdoor Corp.(b) | 1,040 | 89,138 |
| Movado Group, Inc. | 2,265 | 69,309 |
| Total | | 158,447 |
| Total Consumer Discretionary | 2,617,647 |
| Consumer Staples 0.2% |
| Beverages —% |
| Boston Beer Co., Inc. (The), Class A(b) | 275 | 52,209 |
| Food & Staples Retailing 0.1% |
| BIM Birlesik Magazalar AS | 902 | 18,044 |
| Distribuidora Internacional de Alimentacion SA | 7,037 | 37,577 |
| George Weston Ltd. | 100 | 8,758 |
| Ingles Markets, Inc., Class A | 600 | 20,160 |
| Jeronimo Martins SGPS SA | 4,982 | 106,111 |
| Loblaw Companies Ltd. | 400 | 21,668 |
| SUPERVALU, Inc.(b) | 1,304 | 20,655 |
| United Natural Foods, Inc.(b) | 900 | 42,840 |
| Wal-Mart de Mexico SAB de CV, Class V | 37,885 | 94,775 |
| Wm Morrison Supermarkets PLC | 11,752 | 37,043 |
| Woolworths Group Ltd. | 717 | 15,572 |
| Total | | 423,203 |
| Food Products 0.1% |
| Dean Foods Co. | 983 | 10,194 |
| John B. Sanfilippo & Son, Inc. | 900 | 56,358 |
| Sanderson Farms, Inc. | 570 | 72,333 |
| Uni-President Enterprises Corp. | 11,000 | 26,405 |
| WH Group Ltd. | 157,500 | 194,734 |
| Total | | 360,024 |
| Household Products —% |
| Central Garden & Pet Co., Class A(b) | 1,000 | 37,720 |
| Personal Products —% |
| Unilever NV-CVA | 817 | 47,319 |
| Usana Health Sciences, Inc.(b) | 560 | 41,804 |
| Total | | 89,123 |
| Common Stocks (continued) |
| Issuer | Shares | Value ($) |
| Tobacco —% |
| Imperial Brands PLC | 3,184 | 131,035 |
| Swedish Match AB | 3,815 | 154,539 |
| Total | | 285,574 |
| Total Consumer Staples | 1,247,853 |
| Energy 0.1% |
| Energy Equipment & Services —% |
| Archrock, Inc. | 5,400 | 50,220 |
| Exterran Corp.(b) | 2,300 | 66,424 |
| McDermott International, Inc.(b) | 7,100 | 62,338 |
| Rowan Companies PLC, Class A(b) | 5,100 | 75,072 |
| Total | | 254,054 |
| Oil, Gas & Consumable Fuels 0.1% |
| China Petroleum & Chemical Corp., Class H | 108,000 | 93,357 |
| China Shenhua Energy Co., Ltd., Class H | 58,000 | 180,221 |
| CVR Energy, Inc. | 700 | 25,053 |
| Lukoil PJSC | 85 | 5,637 |
| MOL Hungarian Oil & Gas PLC | 8,648 | 105,646 |
| OMV AG | 1,724 | 111,003 |
| Par Pacific Holdings, Inc.(b) | 850 | 15,495 |
| Peabody Energy Corp.(b) | 700 | 28,287 |
| Polski Koncern Naftowy Orlen SA | 1,312 | 42,552 |
| PTT PCL, Foreign Registered Shares | 11,300 | 177,417 |
| REX American Resources Corp.(b) | 674 | 55,032 |
| Ultra Petroleum Corp.(b) | 8,400 | 58,632 |
| W&T Offshore, Inc.(b) | 7,100 | 34,364 |
| Total | | 932,696 |
| Total Energy | 1,186,750 |
| Financials 0.6% |
| Banks 0.3% |
| Agricultural Bank of China Ltd., Class H | 303,000 | 185,387 |
| BancFirst Corp. | 170 | 9,478 |
| Bancorp, Inc. (The)(b) | 900 | 9,513 |
| BancorpSouth Bank | 400 | 13,420 |
| Bank Hapoalim BM | 1,240 | 9,283 |
| Bank of China Ltd., Class H | 126,000 | 75,516 |
| Bank of Nova Scotia (The) | 2,426 | 161,181 |
| Banner Corp. | 390 | 21,193 |
The accompanying Notes to Financial Statements are an integral part of this statement.
Columbia Capital Allocation Portfolios | Annual Report 2018
| 75 |
Portfolio of Investments (continued)
Columbia Capital Allocation Aggressive Portfolio, January 31, 2018
| Common Stocks (continued) |
| Issuer | Shares | Value ($) |
| Cathay General Bancorp | 1,925 | 84,199 |
| Central Pacific Financial Corp. | 815 | 24,100 |
| China Construction Bank Corp., Class H | 23,000 | 26,406 |
| CoBiz Financial, Inc. | 400 | 8,024 |
| CTBC Financial Holding Co., Ltd. | 75,000 | 54,804 |
| Customers Bancorp, Inc.(b) | 2,091 | 64,089 |
| Dubai Islamic Bank PJSC | 49,033 | 81,345 |
| Enterprise Financial Services Corp. | 500 | 24,325 |
| First Citizens BancShares Inc., Class A | 200 | 85,082 |
| First Financial Bancorp | 2,525 | 71,962 |
| First Merchants Corp. | 1,500 | 64,740 |
| Grupo Financiero Banorte SAB de CV, Class O | 25,737 | 164,834 |
| Hana Financial Group, Inc. | 3,487 | 169,921 |
| Hancock Holding Co. | 1,700 | 91,290 |
| Heritage Financial Corp. | 1,300 | 40,040 |
| International Bancshares Corp. | 1,395 | 57,892 |
| Japan Post Bank Co., Ltd. | 2,800 | 37,898 |
| Malayan Banking Bhd | 13,900 | 36,018 |
| Preferred Bank/Los Angeles | 1,100 | 70,862 |
| S&T Bancorp, Inc. | 1,700 | 68,612 |
| Sandy Spring Bancorp, Inc. | 790 | 29,878 |
| Societe Generale SA | 3,004 | 174,751 |
| Standard Bank Group Ltd. | 3,230 | 54,712 |
| Triumph Bancorp, Inc.(b) | 330 | 12,705 |
| Turkiye Is Bankasi AS | 57,153 | 122,473 |
| Valley National Bancorp | 6,500 | 81,705 |
| WesBanco, Inc. | 200 | 8,202 |
| Wintrust Financial Corp. | 1,060 | 91,054 |
| Woori Finance Holdings Co., Ltd. | 6,735 | 106,186 |
| Total | | 2,493,080 |
| Capital Markets —% |
| Arlington Asset Investment Corp., Class A | 685 | 7,193 |
| China Huarong Asset Management Co., Ltd., Class H(c) | 111,000 | 56,001 |
| Cohen & Steers, Inc. | 1,170 | 47,701 |
| Houlihan Lokey, Inc. | 1,300 | 62,010 |
| Total | | 172,905 |
| Common Stocks (continued) |
| Issuer | Shares | Value ($) |
| Consumer Finance —% |
| Green Dot Corp., Class A(b) | 1,200 | 73,512 |
| Nelnet, Inc., Class A | 1,165 | 60,708 |
| Total | | 134,220 |
| Diversified Financial Services —% |
| EXOR NV | 299 | 23,098 |
| Insurance 0.2% |
| Allianz SE, Registered Shares | 916 | 231,432 |
| American Equity Investment Life Holding Co. | 2,400 | 79,200 |
| Assicurazioni Generali SpA | 8,021 | 159,037 |
| AXA SA | 5,457 | 179,507 |
| CNO Financial Group, Inc. | 3,300 | 81,147 |
| CNP Assurances | 975 | 24,985 |
| Health Insurance Innovations, Inc., Class A(b) | 1,700 | 44,115 |
| Legal & General Group PLC | 16,100 | 61,858 |
| Mapfre SA | 32,011 | 113,706 |
| Swiss Re AG | 54 | 5,326 |
| Third Point Reinsurance Ltd.(b) | 500 | 7,125 |
| Universal Insurance Holdings, Inc. | 1,906 | 56,036 |
| Total | | 1,043,474 |
| Mortgage Real Estate Investment Trusts (REITS) —% |
| AG Mortgage Investment Trust, Inc. | 900 | 15,696 |
| ARMOUR Residential REIT, Inc. | 2,200 | 51,502 |
| Invesco Mortgage Capital, Inc. | 3,900 | 63,336 |
| Total | | 130,534 |
| Thrifts & Mortgage Finance 0.1% |
| Essent Group Ltd.(b) | 2,025 | 94,203 |
| Federal Agricultural Mortgage Corp. | 900 | 72,225 |
| Flagstar Bancorp, Inc.(b) | 1,925 | 71,706 |
| MGIC Investment Corp.(b) | 6,635 | 98,331 |
| Radian Group, Inc. | 1,100 | 24,277 |
| Walker & Dunlop, Inc.(b) | 1,445 | 67,120 |
| Washington Federal, Inc. | 1,945 | 69,826 |
| Total | | 497,688 |
| Total Financials | 4,494,999 |
The accompanying Notes to Financial Statements are an integral part of this statement.
| 76 | Columbia Capital Allocation Portfolios | Annual Report 2018 |
Portfolio of Investments (continued)
Columbia Capital Allocation Aggressive Portfolio, January 31, 2018
| Common Stocks (continued) |
| Issuer | Shares | Value ($) |
| Health Care 0.3% |
| Biotechnology 0.1% |
| Alder Biopharmaceuticals, Inc.(b) | 3,540 | 50,091 |
| Atara Biotherapeutics, Inc.(b) | 1,350 | 51,030 |
| bluebird bio, Inc.(b) | 305 | 62,494 |
| Blueprint Medicines Corp.(b) | 425 | 33,426 |
| Clovis Oncology, Inc.(b) | 375 | 22,688 |
| Coherus Biosciences, Inc.(b) | 665 | 6,717 |
| Dynavax Technologies Corp.(b) | 1,525 | 24,552 |
| Eagle Pharmaceuticals, Inc.(b) | 140 | 8,368 |
| Global Blood Therapeutics, Inc.(b) | 325 | 18,818 |
| Immunomedics, Inc.(b) | 2,550 | 42,508 |
| Insmed, Inc.(b) | 1,355 | 34,471 |
| Jounce Therapeutics, Inc.(b) | 1,387 | 33,538 |
| Keryx Biopharmaceuticals, Inc.(b) | 3,980 | 18,427 |
| Loxo Oncology, Inc.(b) | 390 | 39,573 |
| NewLink Genetics Corp.(b) | 2,750 | 22,688 |
| Nightstar Therapeutics PLC, ADR(b) | 1,439 | 20,477 |
| OncoMed Pharmaceuticals, Inc.(b) | 4,000 | 10,000 |
| Ovid Therapeutics, Inc.(b) | 2,749 | 23,367 |
| Puma Biotechnology, Inc.(b) | 630 | 42,115 |
| Sage Therapeutics, Inc.(b) | 345 | 65,481 |
| Shire PLC | 538 | 25,418 |
| Spark Therapeutics, Inc.(b) | 675 | 37,834 |
| TESARO, Inc.(b) | 700 | 47,222 |
| Total | | 741,303 |
| Health Care Equipment & Supplies 0.1% |
| Analogic Corp. | 890 | 73,781 |
| Angiodynamics, Inc.(b) | 2,700 | 47,007 |
| CONMED Corp. | 200 | 11,556 |
| Haemonetics Corp.(b) | 1,200 | 77,580 |
| Integer Holdings Corp.(b) | 1,400 | 70,210 |
| Lantheus Holdings, Inc.(b) | 3,165 | 72,795 |
| Masimo Corp.(b) | 915 | 86,229 |
| Total | | 439,158 |
| Common Stocks (continued) |
| Issuer | Shares | Value ($) |
| Health Care Providers & Services —% |
| Diplomat Pharmacy, Inc.(b) | 3,075 | 82,994 |
| Kindred Healthcare, Inc. | 1,400 | 12,880 |
| Molina Healthcare, Inc.(b) | 1,060 | 96,842 |
| Providence Service Corp. (The)(b) | 1,200 | 77,196 |
| Tivity Health, Inc.(b) | 1,900 | 73,625 |
| Triple-S Management Corp., Class B(b) | 2,545 | 58,484 |
| Total | | 402,021 |
| Life Sciences Tools & Services —% |
| Pra Health Sciences, Inc.(b) | 985 | 89,694 |
| Pharmaceuticals 0.1% |
| Aerie Pharmaceuticals, Inc.(b) | 700 | 38,395 |
| Bayer AG, Registered Shares | 425 | 55,626 |
| Corcept Therapeutics, Inc.(b) | 3,525 | 81,128 |
| GlaxoSmithKline PLC | 9,880 | 185,227 |
| Lannett Co., Inc.(b) | 2,900 | 59,015 |
| Novo Nordisk A/S, Class B | 1,855 | 103,171 |
| Odonate Therapeutics, Inc.(b) | 1,200 | 24,936 |
| Pacira Pharmaceuticals, Inc.(b) | 875 | 31,850 |
| Phibro Animal Health Corp., Class A | 1,600 | 54,480 |
| Roche Holding AG, Genusschein Shares | 892 | 219,897 |
| Sanofi | 1,767 | 156,024 |
| Supernus Pharmaceuticals, Inc.(b) | 775 | 30,264 |
| Total | | 1,040,013 |
| Total Health Care | 2,712,189 |
| Industrials 0.4% |
| Aerospace & Defense —% |
| Curtiss-Wright Corp. | 815 | 106,488 |
| Moog, Inc., Class A(b) | 125 | 11,257 |
| Total | | 117,745 |
| Air Freight & Logistics —% |
| Forward Air Corp. | 520 | 31,569 |
| Airlines 0.1% |
| Deutsche Lufthansa AG, Registered Shares | 4,937 | 176,163 |
| International Consolidated Airlines Group SA | 3,872 | 35,189 |
| Qantas Airways Ltd. | 20,870 | 88,445 |
| Total | | 299,797 |
The accompanying Notes to Financial Statements are an integral part of this statement.
Columbia Capital Allocation Portfolios | Annual Report 2018
| 77 |
Portfolio of Investments (continued)
Columbia Capital Allocation Aggressive Portfolio, January 31, 2018
| Common Stocks (continued) |
| Issuer | Shares | Value ($) |
| Building Products —% |
| Caesarstone Ltd.(b) | 2,200 | 46,640 |
| Continental Building Product(b) | 2,790 | 79,376 |
| Total | | 126,016 |
| Commercial Services & Supplies —% |
| ACCO Brands Corp.(b) | 5,050 | 59,842 |
| Brady Corp., Class A | 480 | 18,360 |
| Essendant, Inc. | 4,700 | 42,535 |
| MSA Safety, Inc. | 1,000 | 78,310 |
| SP Plus Corp.(b) | 1,600 | 61,680 |
| Total | | 260,727 |
| Construction & Engineering 0.1% |
| ACS Actividades de Construccion y Servicios SA | 1,048 | 41,975 |
| Comfort Systems U.S.A., Inc. | 600 | 25,560 |
| EMCOR Group, Inc. | 1,200 | 97,536 |
| Kajima Corp. | 14,000 | 138,993 |
| KBR, Inc. | 1,900 | 38,646 |
| Obayashi Corp. | 12,600 | 152,127 |
| Primoris Services Corp. | 2,625 | 68,250 |
| Taisei Corp. | 3,200 | 163,330 |
| Total | | 726,417 |
| Electrical Equipment —% |
| ABB Ltd. | 2,505 | 69,841 |
| Atkore International Group, Inc.(b) | 2,700 | 63,126 |
| Generac Holdings, Inc.(b) | 1,630 | 79,756 |
| Total | | 212,723 |
| Industrial Conglomerates —% |
| CITIC Ltd. | 96,000 | 151,087 |
| Shanghai Industrial Holdings Ltd. | 6,000 | 17,529 |
| Total | | 168,616 |
| Machinery 0.1% |
| Alamo Group, Inc. | 650 | 74,769 |
| Briggs & Stratton Corp. | 900 | 21,762 |
| EnPro Industries, Inc. | 250 | 21,997 |
| Global Brass & Copper Holdings, Inc. | 2,020 | 64,943 |
| Harsco Corp.(b) | 3,200 | 57,280 |
| Hillenbrand, Inc. | 1,700 | 75,310 |
| Kadant, Inc. | 560 | 56,140 |
| Common Stocks (continued) |
| Issuer | Shares | Value ($) |
| Mueller Industries, Inc. | 795 | 26,307 |
| RBC Bearings, Inc.(b) | 315 | 39,690 |
| Volvo AB B Shares | 892 | 18,208 |
| Wabash National Corp. | 2,790 | 72,066 |
| Total | | 528,472 |
| Professional Services —% |
| Korn/Ferry International | 500 | 22,280 |
| RPX Corp. | 5,120 | 71,885 |
| TrueBlue, Inc.(b) | 1,000 | 27,350 |
| Total | | 121,515 |
| Road & Rail —% |
| ArcBest Corp. | 2,130 | 75,722 |
| Saia, Inc.(b) | 600 | 45,330 |
| Total | | 121,052 |
| Trading Companies & Distributors 0.1% |
| Applied Industrial Technologies, Inc. | 1,190 | 87,763 |
| Beacon Roofing Supply, Inc.(b) | 1,300 | 78,650 |
| ITOCHU Corp. | 5,300 | 104,286 |
| Mitsubishi Corp. | 200 | 5,605 |
| Total | | 276,304 |
| Total Industrials | 2,990,953 |
| Information Technology 0.4% |
| Communications Equipment —% |
| CalAmp Corp.(b) | 1,325 | 32,436 |
| Comtech Telecommunications Corp. | 3,000 | 64,890 |
| Netscout Systems, Inc.(b) | 2,800 | 79,800 |
| Total | | 177,126 |
| Electronic Equipment, Instruments & Components 0.1% |
| Anixter International, Inc.(b) | 700 | 58,590 |
| AU Optronics Corp. | 8,000 | 3,805 |
| Benchmark Electronics, Inc.(b) | 2,275 | 65,861 |
| ePlus, Inc.(b) | 450 | 34,740 |
| Hitachi Ltd. | 24,000 | 191,515 |
| KEMET Corp.(b) | 2,175 | 44,283 |
| Kingboard Chemical Holdings Ltd. | 7,500 | 41,038 |
| Methode Electronics, Inc. | 660 | 26,961 |
| Sanmina Corp.(b) | 2,000 | 52,300 |
| Scansource, Inc.(b) | 1,080 | 36,936 |
The accompanying Notes to Financial Statements are an integral part of this statement.
| 78 | Columbia Capital Allocation Portfolios | Annual Report 2018 |
Portfolio of Investments (continued)
Columbia Capital Allocation Aggressive Portfolio, January 31, 2018
| Common Stocks (continued) |
| Issuer | Shares | Value ($) |
| Tech Data Corp.(b) | 800 | 80,216 |
| Vishay Intertechnology, Inc. | 3,875 | 85,057 |
| Total | | 721,302 |
| Internet Software & Services —% |
| j2 Global, Inc. | 983 | 78,630 |
| Mixi, Inc. | 2,800 | 123,637 |
| New Relic, Inc.(b) | 800 | 47,784 |
| Stamps.com, Inc.(b) | 425 | 86,636 |
| Web.com Group, Inc.(b) | 2,050 | 47,663 |
| Total | | 384,350 |
| IT Services —% |
| CACI International, Inc., Class A(b) | 200 | 28,110 |
| CSG Systems International, Inc. | 800 | 36,136 |
| EVERTEC, Inc. | 1,115 | 17,450 |
| MAXIMUS, Inc. | 1,300 | 88,634 |
| Perficient, Inc.(b) | 900 | 17,433 |
| Travelport Worldwide Ltd. | 5,250 | 71,452 |
| TTEC Holdings, Inc. | 1,400 | 55,580 |
| Total | | 314,795 |
| Semiconductors & Semiconductor Equipment 0.1% |
| Amkor Technology, Inc.(b) | 6,420 | 64,585 |
| Cirrus Logic, Inc.(b) | 1,400 | 69,398 |
| Diodes, Inc.(b) | 2,445 | 68,925 |
| Formfactor, Inc.(b) | 4,200 | 60,270 |
| Phison Electronics Corp. | 9,000 | 91,703 |
| Rudolph Technologies, Inc.(b) | 1,200 | 31,440 |
| Synaptics, Inc.(b) | 1,650 | 71,511 |
| Tokyo Electron Ltd. | 700 | 132,050 |
| Xcerra Corp.(b) | 5,427 | 54,161 |
| Total | | 644,043 |
| Software 0.1% |
| Aspen Technology, Inc.(b) | 1,455 | 112,690 |
| Check Point Software Technologies Ltd.(b) | 564 | 58,323 |
| Imperva, Inc.(b) | 1,600 | 70,000 |
| Paycom Software, Inc.(b) | 245 | 22,452 |
| Paylocity Holding Corp.(b) | 900 | 47,061 |
| Progress Software Corp. | 1,785 | 88,946 |
| Proofpoint, Inc.(b) | 880 | 89,778 |
| Common Stocks (continued) |
| Issuer | Shares | Value ($) |
| VASCO Data Security International, Inc.(b) | 1,525 | 21,960 |
| Verint Systems, Inc.(b) | 400 | 16,700 |
| Total | | 527,910 |
| Technology Hardware, Storage & Peripherals 0.1% |
| Compal Electronics, Inc. | 57,000 | 42,433 |
| Pegatron Corp. | 52,000 | 140,687 |
| Samsung Electronics Co., Ltd. | 102 | 238,408 |
| Total | | 421,528 |
| Total Information Technology | 3,191,054 |
| Materials 0.2% |
| Chemicals 0.1% |
| Covestro AG | 171 | 19,655 |
| Ferro Corp.(b) | 325 | 7,644 |
| Innospec, Inc. | 980 | 70,364 |
| Kronos Worldwide, Inc. | 2,400 | 65,880 |
| Mitsubishi Chemical Holdings Corp. | 9,500 | 103,610 |
| Quaker Chemical Corp. | 150 | 23,085 |
| Sinopec Shanghai Petrochemical Co., Ltd. | 202,000 | 123,335 |
| Trinseo SA | 1,150 | 94,818 |
| Total | | 508,391 |
| Containers & Packaging —% |
| Greif, Inc., Class A | 870 | 51,435 |
| Metals & Mining 0.1% |
| Fortescue Metals Group Ltd. | 36,531 | 145,073 |
| Materion Corp. | 1,450 | 72,065 |
| Rio Tinto PLC | 2,972 | 165,500 |
| Teck Resources Ltd., Class B | 3,700 | 107,450 |
| Warrior Met Coal, Inc. | 2,500 | 69,925 |
| Total | | 560,013 |
| Paper & Forest Products —% |
| Boise Cascade Co. | 1,700 | 75,565 |
| Louisiana-Pacific Corp.(b) | 3,000 | 88,830 |
| UPM-Kymmene OYJ | 5,155 | 173,701 |
| Total | | 338,096 |
| Total Materials | 1,457,935 |
The accompanying Notes to Financial Statements are an integral part of this statement.
Columbia Capital Allocation Portfolios | Annual Report 2018
| 79 |
Portfolio of Investments (continued)
Columbia Capital Allocation Aggressive Portfolio, January 31, 2018
| Common Stocks (continued) |
| Issuer | Shares | Value ($) |
| Real Estate 0.1% |
| Equity Real Estate Investment Trusts (REITS) 0.1% |
| CareTrust REIT, Inc. | 1,150 | 18,274 |
| CorEnergy Infrastructure Trust, Inc. | 1,758 | 67,384 |
| DiamondRock Hospitality Co. | 4,500 | 52,920 |
| Four Corners Property Trust, Inc. | 500 | 11,800 |
| Getty Realty Corp. | 300 | 7,872 |
| Growthpoint Properties Ltd. | 5,157 | 12,085 |
| Lexington Realty Trust | 3,800 | 34,276 |
| National Health Investors, Inc. | 1,050 | 74,056 |
| Pebblebrook Hotel Trust | 2,000 | 78,000 |
| Potlatch Corp. | 500 | 26,450 |
| Preferred Apartment Communities, Inc., Class A | 1,075 | 17,920 |
| PS Business Parks, Inc. | 603 | 73,632 |
| Ryman Hospitality Properties, Inc. | 1,025 | 78,464 |
| Stockland | 3,910 | 13,336 |
| Summit Hotel Properties, Inc. | 3,850 | 59,637 |
| Sunstone Hotel Investors, Inc. | 1,575 | 26,539 |
| Tier REIT, Inc. | 1,600 | 31,056 |
| Xenia Hotels & Resorts, Inc. | 3,375 | 74,925 |
| Total | | 758,626 |
| Real Estate Management & Development —% |
| Aldar Properties PJSC | 48,472 | 30,221 |
| CK Asset Holdings Ltd. | 11,500 | 109,429 |
| HFF, Inc., Class A | 560 | 27,558 |
| Kerry Properties Ltd. | 2,500 | 11,952 |
| Shimao Property Holdings Ltd. | 26,500 | 78,636 |
| Sun Hung Kai Properties Ltd. | 1,000 | 17,289 |
| Wheelock & Co., Ltd. | 2,060 | 16,110 |
| Total | | 291,195 |
| Total Real Estate | 1,049,821 |
| Telecommunication Services 0.1% |
| Diversified Telecommunication Services 0.1% |
| ATN International, Inc. | 100 | 5,936 |
| Nippon Telegraph & Telephone Corp. | 3,200 | 153,231 |
| Orange SA | 536 | 9,679 |
| Telefonica SA | 2,142 | 21,948 |
| Common Stocks (continued) |
| Issuer | Shares | Value ($) |
| Telenor ASA | 6,151 | 144,022 |
| Telstra Corp., Ltd. | 6,727 | 19,889 |
| Total | | 354,705 |
| Wireless Telecommunication Services —% |
| Boingo Wireless, Inc.(b) | 2,800 | 67,900 |
| Mobile Telesystems PJSC, ADR | 976 | 11,849 |
| Total | | 79,749 |
| Total Telecommunication Services | 434,454 |
| Utilities 0.1% |
| Electric Utilities 0.1% |
| Allete, Inc. | 700 | 50,708 |
| El Paso Electric Co. | 500 | 26,100 |
| Enel SpA | 23,387 | 148,375 |
| IDACORP, Inc. | 100 | 8,628 |
| Inter RAO UES PJSC(b) | 1,247,000 | 84,075 |
| PNM Resources, Inc. | 200 | 7,620 |
| Portland General Electric Co. | 1,659 | 70,259 |
| Scottish & Southern Energy PLC | 501 | 9,279 |
| Transmissora Alianca de Energia Eletrica SA | 2,844 | 17,987 |
| Total | | 423,031 |
| Gas Utilities —% |
| Chesapeake Utilities Corp. | 765 | 56,227 |
| Southwest Gas Corp. | 645 | 47,459 |
| Total | | 103,686 |
| Independent Power and Renewable Electricity Producers —% |
| Ormat Technologies, Inc. | 920 | 64,474 |
| Multi-Utilities —% |
| Engie SA | 521 | 9,043 |
| Water Utilities —% |
| SJW Corp. | 695 | 41,589 |
| Total Utilities | 641,823 |
Total Common Stocks
(Cost $18,626,631) | 22,025,478 |
|
The accompanying Notes to Financial Statements are an integral part of this statement.
| 80 | Columbia Capital Allocation Portfolios | Annual Report 2018 |
Portfolio of Investments (continued)
Columbia Capital Allocation Aggressive Portfolio, January 31, 2018
| Equity Funds 71.5% |
| | Shares | Value ($) |
| International 19.5% |
| Columbia Contrarian Europe Fund, Institutional 3 Class(a) | 3,110,561 | 23,733,582 |
| Columbia Emerging Markets Fund, Institutional 3 Class(a) | 3,859,637 | 57,315,606 |
| Columbia Overseas Value Fund, Institutional 3 Class(a) | 3,725,108 | 40,454,675 |
| Columbia Pacific/Asia Fund, Institutional 3 Class(a) | 2,717,982 | 32,778,864 |
| Total | 154,282,727 |
| U.S. Large Cap 48.9% |
| Columbia Contrarian Core Fund, Institutional 3 Class(a) | 2,280,805 | 63,201,102 |
| Columbia Disciplined Core Fund, Institutional 3 Class(a) | 3,740,211 | 47,463,276 |
| Columbia Disciplined Growth Fund, Institutional 3 Class(a) | 5,277,195 | 53,141,349 |
| Columbia Disciplined Value Fund, Institutional 3 Class(a) | 6,905,201 | 77,614,461 |
| Columbia Large Cap Growth Fund, Institutional 3 Class(a) | 535,320 | 23,800,331 |
| Columbia Select Large Cap Equity Fund, Institutional 3 Class(a) | 3,662,887 | 55,272,963 |
| Columbia Select Large Cap Growth Fund, Institutional 3 Class(a),(b) | 2,007,531 | 37,580,985 |
| Columbia Select Large-Cap Value Fund, Institutional 3 Class(a) | 1,011,108 | 29,049,144 |
| Total | 387,123,611 |
| U.S. Small Cap 3.1% |
| Columbia Disciplined Small Core Fund, Institutional 3 Class(a) | 1,317,552 | 11,818,437 |
| Columbia Select Smaller-Cap Value Fund, Institutional 3 Class(a) | 394,348 | 8,825,516 |
| Columbia Small Cap Growth Fund I, Institutional 3 Class(a),(b) | 190,083 | 3,891,005 |
| Total | 24,534,958 |
Total Equity Funds
(Cost $434,844,072) | 565,941,296 |
|
| Fixed-Income Funds 11.1% |
| | |
| Emerging Markets 0.4% |
| Columbia Emerging Markets Bond Fund, Institutional 3 Class(a) | 292,151 | 3,488,287 |
| Fixed-Income Funds (continued) |
| | Shares | Value ($) |
| High Yield 5.3% |
| Columbia High Yield Bond Fund, Institutional 3 Class(a) | 8,606,423 | 25,388,948 |
| Columbia Income Opportunities Fund, Institutional 3 Class(a) | 1,629,027 | 16,159,945 |
| Total | 41,548,893 |
| Investment Grade 5.4% |
| Columbia Corporate Income Fund, Institutional 3 Class(a) | 2,867,280 | 29,274,932 |
| Columbia Mortgage Opportunities Fund, Institutional 3 Class(a) | 456,503 | 4,460,034 |
| Columbia U.S. Government Mortgage Fund, Institutional 3 Class(a) | 1,690,128 | 9,025,284 |
| Total | 42,760,250 |
Total Fixed-Income Funds
(Cost $87,086,316) | 87,797,430 |
|
| Rights —% |
| Issuer | Shares | Value ($) |
| Industrials —% |
| Construction & Engineering —% |
| ACS Actividades de Construccion y Servicios SA(b) | 1,048 | 549 |
| Total Industrials | 549 |
Total Rights
(Cost $575) | 549 |
|
| Money Market Funds 7.5% |
| | Shares | Value ($) |
| Columbia Short-Term Cash Fund, 1.475%(a),(d) | 59,237,314 | 59,237,314 |
Total Money Market Funds
(Cost $59,236,336) | 59,237,314 |
Total Investments
(Cost: $650,798,297) | 786,451,899 |
| Other Assets & Liabilities, Net | | 4,610,102 |
| Net Assets | 791,062,001 |
At January 31, 2018, securities and/or cash totaling $4,289,560 were pledged as collateral.
The accompanying Notes to Financial Statements are an integral part of this statement.
Columbia Capital Allocation Portfolios | Annual Report 2018
| 81 |
Portfolio of Investments (continued)
Columbia Capital Allocation Aggressive Portfolio, January 31, 2018
Investments in derivatives
| Forward foreign currency exchange contracts |
Currency to
be sold | Currency to
be purchased | Counterparty | Settlement
date | Unrealized
appreciation ($) | Unrealized
depreciation ($) |
| 1,101,000 CNY | 170,531 USD | JPMorgan | 03/14/2018 | — | (3,825) |
| 24,537,000 HUF | 97,338 USD | JPMorgan | 03/14/2018 | — | (1,047) |
| 134,000 ILS | 39,045 USD | JPMorgan | 03/14/2018 | — | (209) |
| 156,189,000 KRW | 146,604 USD | JPMorgan | 03/14/2018 | 462 | — |
| 2,393,000 MXN | 126,691 USD | JPMorgan | 03/14/2018 | — | (1,077) |
| 766,000 NOK | 97,516 USD | JPMorgan | 03/14/2018 | — | (1,968) |
| 624,000 SEK | 77,898 USD | JPMorgan | 03/14/2018 | — | (1,498) |
| 3,420,000 THB | 107,085 USD | JPMorgan | 03/14/2018 | — | (2,208) |
| 189,000 TRY | 48,703 USD | JPMorgan | 03/14/2018 | — | (1,037) |
| 2,441,000 TWD | 82,824 USD | JPMorgan | 03/14/2018 | — | (1,161) |
| 166,185 USD | 208,000 AUD | JPMorgan | 03/14/2018 | 1,397 | — |
| 146,591 USD | 475,000 BRL | JPMorgan | 03/14/2018 | 1,893 | — |
| 141,688 USD | 176,000 CAD | JPMorgan | 03/14/2018 | 1,466 | — |
| 184,491 USD | 177,000 CHF | JPMorgan | 03/14/2018 | 6,248 | — |
| 185,935 USD | 134,000 GBP | JPMorgan | 03/14/2018 | 4,606 | — |
| 48,763 USD | 651,661,000 IDR | JPMorgan | 03/14/2018 | — | (81) |
| 204,653 USD | 13,142,000 INR | JPMorgan | 03/14/2018 | 820 | — |
| 39,333 USD | 52,000 SGD | JPMorgan | 03/14/2018 | 339 | — |
| 107,126 USD | 1,327,000 ZAR | JPMorgan | 03/14/2018 | 4,245 | — |
| Total | | | | 21,476 | (14,111) |
| Long futures contracts |
| Description | Number of
contracts | Expiration
date | Trading
currency | Notional
amount | Value/Unrealized
appreciation ($) | Value/Unrealized
depreciation ($) |
| MSCI EAFE Index | 109 | 03/2018 | USD | 11,692,975 | 699,343 | — |
| MSCI Emerging Markets Index | 262 | 03/2018 | USD | 16,477,180 | 501,141 | — |
| Russell 2000 E-mini | 2 | 03/2018 | USD | 157,600 | 5,185 | — |
| S&P 500 E-mini | 453 | 03/2018 | USD | 64,004,370 | 4,127,189 | — |
| U.S. Long Bond | 27 | 03/2018 | USD | 4,079,742 | — | (127,658) |
| U.S. Treasury 5-Year Note | 28 | 03/2018 | USD | 3,225,163 | — | (52,339) |
| Total | | | | | 5,332,858 | (179,997) |
| Short futures contracts |
| Description | Number of
contracts | Expiration
date | Trading
currency | Notional
amount | Value/Unrealized
appreciation ($) | Value/Unrealized
depreciation ($) |
| FTSE 100 Index | (37) | 03/2018 | GBP | (2,762,790) | — | (28,858) |
| U.S. Treasury 10-Year Note | (13) | 03/2018 | USD | (1,591,821) | 36,943 | — |
| Total | | | | | 36,943 | (28,858) |
| Cleared credit default swap contracts - buy protection |
Reference
entity | Counterparty | Maturity
date | Pay
fixed
rate
(%) | Payment
frequency | Notional
currency | Notional
amount | Value
($) | Upfront
payments
($) | Upfront
receipts
($) | Unrealized
appreciation
($) | Unrealized
depreciation
($) |
| Markit CDX North America Investment Grade Index, Series 29 | Morgan Stanley | 12/20/2022 | 1.000 | Quarterly | USD | 3,750,000 | (22,258) | — | — | — | (22,258) |
The accompanying Notes to Financial Statements are an integral part of this statement.
| 82 | Columbia Capital Allocation Portfolios | Annual Report 2018 |
Portfolio of Investments (continued)
Columbia Capital Allocation Aggressive Portfolio, January 31, 2018
| Cleared credit default swap contracts - sell protection |
Reference
entity | Counterparty | Maturity
date | Receive
fixed
rate
(%) | Payment
frequency | Implied
credit
spread
(%) | Notional
currency | Notional
amount | Value
($) | Upfront
payments
($) | Upfront
receipts
($) | Unrealized
appreciation
($) | Unrealized
depreciation
($) |
| Markit CDX North America High Yield Index, Series 29 | Morgan Stanley | 12/20/2022 | 5.000 | Quarterly | 3.011 | USD | 17,000,000 | 131,829 | — | — | 131,829 | — |
Notes to Portfolio of Investments
| (a) | As defined in the Investment Company Act of 1940, an affiliated company is one in which the Fund owns 5% or more of the company’s outstanding voting securities, or a company which is under common ownership or control with the Fund. Holdings and transactions in these affiliated companies during the year ended January 31, 2018 are as follows: |
| Issuer | Beginning
shares | Shares
purchased | Shares
sold | Ending
shares | Capital gain
distributions —
affiliated
issuers ($) | Realized gain
(loss) —
affiliated
issuers ($) | Net change in
unrealized
appreciation
(depreciation) —
affiliated
issuers ($) | Dividends —
affiliated
issuers ($) | Value —
affiliated
issuers
at end of
period ($) |
| Columbia Absolute Return Currency and Income Fund, Class I Shares |
| | 182,646 | 4,900 | (187,546)* | — | — | 8,599 | (184,892) | — | — |
| Columbia Absolute Return Currency and Income Fund, Institutional 3 Class |
| | — | 201,583* | (1,186) | 200,397 | — | 922 | 27,683 | — | 2,050,061 |
| Columbia Alternative Beta Fund, Class I Shares |
| | 458,101 | — | (458,101)* | — | — | — | 389,274 | — | — |
| Columbia Alternative Beta Fund, Institutional 3 Class |
| | — | 468,857* | — | 468,857 | — | — | (253,934) | 103,305 | 4,411,947 |
| Columbia Commodity Strategy Fund, Class I Shares |
| | 2,253,467 | 1,637,230 | (3,890,697)* | — | — | — | 207,916 | — | — |
| Columbia Commodity Strategy Fund, Institutional 3 Class |
| | — | 4,077,630* | (183,145) | 3,894,485 | — | (44,651) | 722,225 | 35,268 | 22,860,626 |
| Columbia Contrarian Core Fund, Class I Shares |
| | 2,356,416 | 7,244 | (2,363,660)* | — | — | 895,548 | (8,499,935) | — | — |
| Columbia Contrarian Core Fund, Institutional 3 Class |
| | — | 2,389,927* | (109,122) | 2,280,805 | 2,762,889 | 1,269,830 | 16,444,998 | 613,160 | 63,201,102 |
| Columbia Contrarian Europe Fund, Class I Shares |
| | 3,339,381 | — | (3,339,381)* | — | — | — | 757,374 | — | — |
| Columbia Contrarian Europe Fund, Institutional 3 Class |
| | — | 3,537,789* | (427,228) | 3,110,561 | — | 455,314 | 4,282,712 | 419,862 | 23,733,582 |
| Columbia Corporate Income Fund, Class I Shares |
| | 2,706,318 | 177,382 | (2,883,700)* | — | — | 6,450 | 270,237 | 114,438 | — |
| Columbia Corporate Income Fund, Institutional 3 Class |
| | — | 2,947,466* | (80,186) | 2,867,280 | — | 13,018 | 229,485 | 695,044 | 29,274,932 |
| Columbia Disciplined Core Fund, Class I Shares |
| | 3,924,285 | 16,780 | (3,941,065)* | — | — | 1,138,497 | (17,376,076) | — | — |
| Columbia Disciplined Core Fund, Institutional 3 Class |
| | — | 4,062,526* | (322,315) | 3,740,211 | 1,971,952 | 2,615,302 | 22,411,944 | 787,271 | 47,463,276 |
| Columbia Disciplined Growth Fund, Class I Shares |
| | 5,243,123 | 17,027 | (5,260,150)* | — | — | (2,148) | 2,057,441 | — | — |
| Columbia Disciplined Growth Fund, Institutional 3 Class |
| | — | 5,775,223* | (498,028) | 5,277,195 | 5,737,894 | 1,053,439 | 5,086,777 | 312,173 | 53,141,349 |
| Columbia Disciplined Small Core Fund, Class I Shares |
| | 1,112,999 | 26,739 | (1,139,738)* | — | — | (158,311) | 4,104,464 | — | — |
The accompanying Notes to Financial Statements are an integral part of this statement.
Columbia Capital Allocation Portfolios | Annual Report 2018
| 83 |
Portfolio of Investments (continued)
Columbia Capital Allocation Aggressive Portfolio, January 31, 2018
Notes to Portfolio of Investments (continued)
| Issuer | Beginning
shares | Shares
purchased | Shares
sold | Ending
shares | Capital gain
distributions —
affiliated
issuers ($) | Realized gain
(loss) —
affiliated
issuers ($) | Net change in
unrealized
appreciation
(depreciation) —
affiliated
issuers ($) | Dividends —
affiliated
issuers ($) | Value —
affiliated
issuers
at end of
period ($) |
| Columbia Disciplined Small Core Fund, Institutional 3 Class |
| | — | 1,352,796* | (35,244) | 1,317,552 | 1,842,533 | (246,485) | (4,469,323) | 63,362 | 11,818,437 |
| Columbia Disciplined Value Fund, Class I Shares |
| | 6,774,725 | 31,154 | (6,805,879)* | — | — | 301,919 | (3,798,502) | — | — |
| Columbia Disciplined Value Fund, Institutional 3 Class |
| | — | 7,257,789* | (352,588) | 6,905,201 | 3,689,290 | 770,507 | 12,792,232 | 1,641,801 | 77,614,461 |
| Columbia Diversified Absolute Return Fund, Class I Shares |
| | 759,504 | 29,136 | (788,640)* | — | — | (24,929) | 381,084 | — | — |
| Columbia Diversified Absolute Return Fund, Institutional 3 Class |
| | — | 771,698* | (23,295) | 748,403 | — | (9,484) | (146,630) | — | 7,281,955 |
| Columbia Emerging Markets Bond Fund, Class I Shares |
| | 286,806 | 11,895 | (298,701)* | — | — | 1,612 | (68,732) | 21,002 | — |
| Columbia Emerging Markets Bond Fund, Institutional 3 Class |
| | — | 329,584* | (37,433) | 292,151 | — | 35,507 | 212,126 | 172,033 | 3,488,287 |
| Columbia Emerging Markets Fund, Class I Shares |
| | 4,840,561 | — | (4,840,561)* | — | — | 370,009 | (2,259,665) | — | — |
| Columbia Emerging Markets Fund, Institutional 3 Class |
| | — | 4,660,697* | (801,060) | 3,859,637 | — | 2,204,405 | 19,716,330 | 250,718 | 57,315,606 |
| Columbia High Yield Bond Fund, Class I Shares |
| | 7,993,252 | 189,170 | (8,182,422)* | — | — | (4,737) | (218,233) | 173,746 | — |
| Columbia High Yield Bond Fund, Institutional 3 Class |
| | — | 8,710,921* | (104,498) | 8,606,423 | — | (4,455) | 386,955 | 1,055,637 | 25,388,948 |
| Columbia Income Opportunities Fund, Class I Shares |
| | 1,524,750 | 37,696 | (1,562,446)* | — | — | 8,869 | (148,810) | 110,349 | — |
| Columbia Income Opportunities Fund, Institutional 3 Class |
| | — | 1,654,942* | (25,915) | 1,629,027 | — | 8,683 | 206,671 | 643,154 | 16,159,945 |
| Columbia Large Cap Growth Fund, Class I Shares |
| | 584,150 | 2,985 | (587,135)* | — | — | 707,875 | (7,632,010) | — | — |
| Columbia Large Cap Growth Fund, Institutional 3 Class |
| | — | 596,058* | (60,738) | 535,320 | 1,277,041 | 1,582,225 | 10,161,405 | 55,369 | 23,800,331 |
| Columbia Mortgage Opportunities Fund, Class I Shares |
| | 400,112 | 16,006 | (416,118)* | — | — | (666) | 51,540 | 24,749 | — |
| Columbia Mortgage Opportunities Fund, Institutional 3 Class |
| | — | 459,351* | (2,848) | 456,503 | 143,927 | (64) | (84,657) | 153,992 | 4,460,034 |
| Columbia Multi-Asset Income Fund, Class I Shares |
| | 1,415,801 | 12,233 | (1,428,034)* | — | — | — | 394,776 | 118,714 | — |
| Columbia Multi-Asset Income Fund, Institutional 3 Class |
| | — | 1,493,485* | — | 1,493,485 | — | — | 96,121 | 615,622 | 14,845,243 |
| Columbia Overseas Value Fund, Class I Shares |
| | 4,182,488 | 49,260 | (4,231,748)* | — | — | (35,697) | 1,310,612 | — | — |
| Columbia Overseas Value Fund, Institutional 3 Class |
| | — | 4,243,487* | (518,379) | 3,725,108 | 645,059 | 429,692 | 7,757,132 | 700,725 | 40,454,675 |
The accompanying Notes to Financial Statements are an integral part of this statement.
| 84 | Columbia Capital Allocation Portfolios | Annual Report 2018 |
Portfolio of Investments (continued)
Columbia Capital Allocation Aggressive Portfolio, January 31, 2018
Notes to Portfolio of Investments (continued)
| Issuer | Beginning
shares | Shares
purchased | Shares
sold | Ending
shares | Capital gain
distributions —
affiliated
issuers ($) | Realized gain
(loss) —
affiliated
issuers ($) | Net change in
unrealized
appreciation
(depreciation) —
affiliated
issuers ($) | Dividends —
affiliated
issuers ($) | Value —
affiliated
issuers
at end of
period ($) |
| Columbia Pacific/Asia Fund, Class I Shares |
| | 3,013,695 | 72,723 | (3,086,418)* | — | — | 242,787 | (3,629,296) | — | — |
| Columbia Pacific/Asia Fund, Institutional 3 Class |
| | — | 3,285,330* | (567,348) | 2,717,982 | 2,273,893 | 1,987,203 | 9,311,931 | 331,601 | 32,778,864 |
| Columbia Select Large Cap Equity Fund, Class I Shares |
| | 3,739,016 | 9,825 | (3,748,841)* | — | — | (131,288) | (162,226) | — | — |
| Columbia Select Large Cap Equity Fund, Institutional 3 Class |
| | — | 3,916,923* | (254,036) | 3,662,887 | 2,497,213 | 155,674 | 10,169,911 | 467,985 | 55,272,963 |
| Columbia Select Large Cap Growth Fund, Class I Shares |
| | 2,103,732 | 13,690 | (2,117,422)* | — | — | 237,602 | (1,036,779) | — | — |
| Columbia Select Large Cap Growth Fund, Institutional 3 Class |
| | — | 2,250,003* | (242,472) | 2,007,531 | 3,580,095 | 1,267,021 | 6,617,684 | — | 37,580,985 |
| Columbia Select Large-Cap Value Fund, Class I Shares |
| | 1,033,460 | 1,095 | (1,034,555)* | — | — | 416,343 | (6,507,450) | — | — |
| Columbia Select Large-Cap Value Fund, Institutional 3 Class |
| | — | 1,059,117* | (48,009) | 1,011,108 | 987,926 | 542,642 | 10,140,333 | 322,237 | 29,049,144 |
| Columbia Select Smaller-Cap Value Fund, Class I Shares |
| | 372,495 | 8,221 | (380,716)* | — | — | 16,774 | (551,165) | — | — |
| Columbia Select Smaller-Cap Value Fund, Institutional 3 Class |
| | — | 418,700* | (24,352) | 394,348 | 860,374 | 87,436 | 889,220 | — | 8,825,516 |
| Columbia Short-Term Cash Fund |
| | 49,253,436 | 47,688,153 | (37,704,275) | 59,237,314 | — | (581) | 1,026 | 542,457 | 59,237,314 |
| Columbia Small Cap Growth Fund I, Class I Shares |
| | 146,015 | 2,485 | (148,500)* | — | — | (54,911) | 635,473 | — | — |
| Columbia Small Cap Growth Fund I, Institutional 3 Class |
| | — | 191,745* | (1,662) | 190,083 | 520,727 | (20,073) | (216,063) | — | 3,891,005 |
| Columbia U.S. Government Mortgage Fund, Class I Shares |
| | 1,522,026 | 161,784 | (1,683,810)* | — | — | (9,185) | 205,606 | 30,996 | — |
| Columbia U.S. Government Mortgage Fund, Institutional 3 Class |
| | — | 1,737,600* | (47,472) | 1,690,128 | — | (3,905) | (239,466) | 236,785 | 9,025,284 |
| Total | | | | | 28,790,813 | 18,080,134 | 90,946,854 | 10,813,555 | 764,425,872 |
| * | Includes the effect of underlying share class exchange. |
| (b) | Non-income producing investment. |
| (c) | Represents privately placed and other securities and instruments exempt from SEC registration (collectively, private placements), such as Section 4(a)(2) and Rule 144A eligible securities, which are often sold only to qualified institutional buyers. The Fund may invest in private placements determined to be liquid as well as those determined to be illiquid. Private placements may be determined to be liquid under guidelines established by the Fund’s Board of Trustees. At January 31, 2018, the value of these securities amounted to $56,001, which represents less than 0.01% of net assets. |
| (d) | The rate shown is the seven-day current annualized yield at January 31, 2018. |
Abbreviation Legend
| ADR | American Depositary Receipt |
The accompanying Notes to Financial Statements are an integral part of this statement.
Columbia Capital Allocation Portfolios | Annual Report 2018
| 85 |
Portfolio of Investments (continued)
Columbia Capital Allocation Aggressive Portfolio, January 31, 2018
Currency Legend
| AUD | Australian Dollar |
| BRL | Brazilian Real |
| CAD | Canada Dollar |
| CHF | Swiss Franc |
| CNY | China Yuan Renminbi |
| GBP | British Pound |
| HUF | Hungarian Forint |
| IDR | Indonesian Rupiah |
| ILS | New Israeli Sheqel |
| INR | Indian Rupee |
| KRW | South Korean Won |
| MXN | Mexican Peso |
| NOK | Norwegian Krone |
| SEK | Swedish Krona |
| SGD | Singapore Dollar |
| THB | Thailand Baht |
| TRY | Turkish Lira |
| TWD | New Taiwan Dollar |
| USD | US Dollar |
| ZAR | South African Rand |
Fair value measurements
The Fund categorizes its fair value measurements according to a three-level hierarchy that maximizes the use of observable inputs and minimizes the use of unobservable inputs by prioritizing that the most observable input be used when available. Observable inputs are those that market participants would use in pricing an investment based on market data obtained from sources independent of the reporting entity. Unobservable inputs are those that reflect the Fund’s assumptions about the information market participants would use in pricing an investment. An investment’s level within the fair value hierarchy is based on the lowest level of any input that is deemed significant to the asset’s or liability’s fair value measurement. The input levels are not necessarily an indication of the risk or liquidity associated with investments at that level. For example, certain U.S. government securities are generally high quality and liquid, however, they are reflected as Level 2 because the inputs used to determine fair value may not always be quoted prices in an active market.
Fair value inputs are summarized in the three broad levels listed below:
| ¦ | Level 1 — Valuations based on quoted prices for investments in active markets that the Fund has the ability to access at the measurement date. Valuation adjustments are not applied to Level 1 investments. |
| ¦ | Level 2 — Valuations based on other significant observable inputs (including quoted prices for similar securities, interest rates, prepayment speeds, credit risks, etc.). |
| ¦ | Level 3 — Valuations based on significant unobservable inputs (including the Fund’s own assumptions and judgment in determining the fair value of investments). |
Inputs that are used in determining fair value of an investment may include price information, credit data, volatility statistics, and other factors. These inputs can be either observable or unobservable. The availability of observable inputs can vary between investments, and is affected by various factors such as the type of investment, and the volume and level of activity for that investment or similar investments in the marketplace. The inputs will be considered by the Investment Manager, along with any other relevant factors in the calculation of an investment’s fair value. The Fund uses prices and inputs that are current as of the measurement date, which may include periods of market dislocations. During these periods, the availability of prices and inputs may be reduced for many investments. This condition could cause an investment to be reclassified between the various levels within the hierarchy.
Foreign equity securities actively traded in markets where there is a significant delay in the local close relative to the New York Stock Exchange are classified as Level 2. The values of these securities may include an adjustment to reflect the impact of significant market movements following the close of local trading, as described in Note 2 to the financial statements – Security valuation.
Certain investments that have been measured at fair value using the net asset value (NAV) per share (or its equivalent) are not categorized in the fair value hierarchy. The fair value amounts presented in the table are intended to reconcile the fair value hierarchy to the amounts presented in the Portfolio of Investments. The Columbia Short-Term Cash Fund seeks to provide shareholders with maximum current income consistent with liquidity and stability of principal. Columbia Short-Term Cash Fund prices its shares with a floating NAV and no longer seeks to maintain a stable NAV.
Investments falling into the Level 3 category are primarily supported by quoted prices from brokers and dealers participating in the market for those investments. However, these may be classified as Level 3 investments due to lack of market transparency and corroboration to support these quoted prices. Additionally, valuation models may be used as the pricing source for any remaining investments classified as Level 3. These models may rely on one or more significant unobservable inputs and/or significant assumptions by the Investment Manager. Inputs used in valuations may include, but are not limited to, financial statement analysis, capital account balances, discount rates and estimated cash flows, and comparable company data.
Under the direction of the Fund’s Board of Trustees (the Board), the Investment Manager’s Valuation Committee (the Committee) is responsible for overseeing the valuation procedures approved by the Board. The Committee consists of voting and non-voting members from various groups within the Investment Manager’s organization, including operations and accounting, trading and investments, compliance, risk management and legal.
The accompanying Notes to Financial Statements are an integral part of this statement.
| 86 | Columbia Capital Allocation Portfolios | Annual Report 2018 |
Portfolio of Investments (continued)
Columbia Capital Allocation Aggressive Portfolio, January 31, 2018
Fair value measurements (continued)
The Committee meets at least monthly to review and approve valuation matters, which may include a description of specific valuation determinations, data regarding pricing information received from approved pricing vendors and brokers and the results of Board-approved valuation control policies and procedures (the Policies). The Policies address, among other things, instances when market quotations are or are not readily available, including recommendations of third party pricing vendors and a determination of appropriate pricing methodologies; events that require specific valuation determinations and assessment of fair value techniques; securities with a potential for stale pricing, including those that are illiquid, restricted, or in default; and the effectiveness of third party pricing vendors, including periodic reviews of vendors. The Committee meets more frequently, as needed, to discuss additional valuation matters, which may include the need to review back-testing results, review time-sensitive information or approve related valuation actions. The Committee reports to the Board, with members of the Committee meeting with the Board at each of its regularly scheduled meetings to discuss valuation matters and actions during the period, similar to those described earlier.
For investments categorized as Level 3, the Committee monitors information similar to that described above, which may include: (i) data specific to the issuer or comparable issuers, (ii) general market or specific sector news and (iii) quoted prices and specific or similar security transactions. The Committee considers this data and any changes from prior periods in order to assess the reasonableness of observable and unobservable inputs, any assumptions or internal models used to value those securities and changes in fair value. This data is also used to corroborate, when available, information received from approved pricing vendors and brokers. Various factors impact the frequency of monitoring this information (which may occur as often as daily). However, the Committee may determine that changes to inputs, assumptions and models are not required as a result of the monitoring procedures performed.
The following table is a summary of the inputs used to value the Fund’s investments at January 31, 2018:
| | Level 1
quoted prices
in active
markets for
identical
assets ($) | Level 2
other
significant
observable
inputs ($) | Level 3
significant
unobservable
inputs ($) | Investments
measured at
net asset
value ($) | Total ($) |
| Investments | | | | | |
| Alternative Strategies Funds | 51,449,832 | — | — | — | 51,449,832 |
| Common Stocks | | | | | |
| Consumer Discretionary | 1,688,297 | 929,350 | — | — | 2,617,647 |
| Consumer Staples | 479,474 | 768,379 | — | — | 1,247,853 |
| Energy | 470,917 | 715,833 | — | — | 1,186,750 |
| Financials | 2,505,349 | 1,989,650 | — | — | 4,494,999 |
| Health Care | 1,966,826 | 745,363 | — | — | 2,712,189 |
| Industrials | 1,828,175 | 1,162,778 | — | — | 2,990,953 |
| Information Technology | 2,185,778 | 1,005,276 | — | — | 3,191,054 |
| Materials | 727,061 | 730,874 | — | — | 1,457,935 |
| Real Estate | 760,763 | 289,058 | — | — | 1,049,821 |
| Telecommunication Services | 85,685 | 348,769 | — | — | 434,454 |
| Utilities | 391,051 | 250,772 | — | — | 641,823 |
| Total Common Stocks | 13,089,376 | 8,936,102 | — | — | 22,025,478 |
| Equity Funds | 565,941,296 | — | — | — | 565,941,296 |
| Fixed-Income Funds | 87,797,430 | — | — | — | 87,797,430 |
| Rights | | | | | |
| Industrials | — | 549 | — | — | 549 |
| Money Market Funds | — | — | — | 59,237,314 | 59,237,314 |
| Total Investments | 718,277,934 | 8,936,651 | — | 59,237,314 | 786,451,899 |
| Derivatives | | | | | |
| Asset | | | | | |
| Forward Foreign Currency Exchange Contracts | — | 21,476 | — | — | 21,476 |
| Futures Contracts | 5,369,801 | — | — | — | 5,369,801 |
| Swap Contracts | — | 131,829 | — | — | 131,829 |
| Liability | | | | | |
| Forward Foreign Currency Exchange Contracts | — | (14,111) | — | — | (14,111) |
| Futures Contracts | (208,855) | — | — | — | (208,855) |
| Swap Contracts | — | (22,258) | — | — | (22,258) |
| Total | 723,438,880 | 9,053,587 | — | 59,237,314 | 791,729,781 |
See the Portfolio of Investments for all investment classifications not indicated in the table.
The Fund’s assets assigned to the Level 2 input category are generally valued using the market approach, in which a security’s value is determined through reference to prices and information from market transactions for similar or identical assets. These assets include certain foreign securities for which a third party statistical pricing service may be employed for purposes of fair market valuation. The model utilized by such third party statistical pricing service takes into account a security’s correlation to available market data including, but not limited to, intraday index, ADR, and exchange-traded fund movements.
The accompanying Notes to Financial Statements are an integral part of this statement.
Columbia Capital Allocation Portfolios | Annual Report 2018
| 87 |
Portfolio of Investments (continued)
Columbia Capital Allocation Aggressive Portfolio, January 31, 2018
Fair value measurements (continued)
Derivative instruments are valued at unrealized appreciation (depreciation).
There were no transfers of financial assets between levels during the period.
The accompanying Notes to Financial Statements are an integral part of this statement.
| 88 | Columbia Capital Allocation Portfolios | Annual Report 2018 |
Statement of Assets and Liabilities
January 31, 2018
| | Columbia
Capital
Allocation
Conservative
Portfolio | Columbia
Capital
Allocation
Moderate
Conservative
Portfolio | Columbia
Capital
Allocation
Moderate
Portfolio |
| Assets | | | |
| Investments in unaffiliated issuers, at cost | $8,611,802 | $13,606,259 | $31,082,791 |
| Investments in affiliated issuers, at cost | 238,005,601 | 554,131,215 | 1,447,988,985 |
| Investments in unaffiliated issuers, at value | 10,341,823 | 16,246,933 | 36,681,728 |
| Investments in affiliated issuers, at value | 244,829,514 | 589,373,337 | 1,607,680,968 |
| Cash | 2,220 | 3,885 | 18,500 |
| Margin deposits on: | | | |
| Futures contracts | 419,392 | 1,251,326 | 5,881,883 |
| Swap contracts | 134,606 | 403,819 | 1,275,929 |
| Unrealized appreciation on forward foreign currency exchange contracts | 7,926 | 12,256 | 26,134 |
| Receivable for: | | | |
| Investments sold | 205,437 | 600,197 | 977,041 |
| Capital shares sold | 152,700 | 622,770 | 2,770,459 |
| Dividends | 358,112 | 724,361 | 1,673,555 |
| Foreign tax reclaims | 11,409 | 24,210 | 10,528 |
| Variation margin for futures contracts | 70,723 | 167,271 | 402,454 |
| Variation margin for swap contracts | 1,612 | 4,835 | 15,578 |
| Prepaid expenses | 1,690 | 2,241 | 3,753 |
| Total assets | 256,537,164 | 609,437,441 | 1,657,418,510 |
| Liabilities | | | |
| Unrealized depreciation on forward foreign currency exchange contracts | 3,889 | 5,944 | 17,554 |
| Payable for: | | | |
| Investments purchased | 320,899 | 647,737 | 1,533,624 |
| Capital shares purchased | 394,782 | 1,215,320 | 2,225,126 |
| Variation margin for futures contracts | 975 | 56,928 | 123,133 |
| Variation margin for swap contracts | — | — | 510 |
| Management services fees | 729 | 1,507 | 3,265 |
| Distribution and/or service fees | 2,430 | 5,612 | 15,243 |
| Transfer agent fees | 19,863 | 40,784 | 101,775 |
| Plan administration fees | 1 | — | 1 |
| Compensation of board members | 83,717 | 44,141 | 59,244 |
| Compensation of chief compliance officer | 55 | 129 | 333 |
| Other expenses | 38,595 | 50,278 | 96,234 |
| Total liabilities | 865,935 | 2,068,380 | 4,176,042 |
| Net assets applicable to outstanding capital stock | $255,671,229 | $607,369,061 | $1,653,242,468 |
| Represented by | | | |
| Paid in capital | 244,476,779 | 555,932,311 | 1,439,759,224 |
| Undistributed net investment income | 146,047 | 822,969 | 1,195,430 |
| Accumulated net realized gain | 2,906,060 | 12,547,190 | 39,852,679 |
| Unrealized appreciation (depreciation) on: | | | |
| Investments - unaffiliated issuers | 1,730,021 | 2,640,674 | 5,598,937 |
| Investments - affiliated issuers | 6,823,913 | 35,242,122 | 159,691,983 |
| Foreign currency translations | 4,366 | 16,947 | 29,023 |
| Forward foreign currency exchange contracts | 4,037 | 6,312 | 8,580 |
| Futures contracts | (443,167) | 91,046 | 6,938,804 |
| Swap contracts | 23,173 | 69,490 | 167,808 |
| Total - representing net assets applicable to outstanding capital stock | $255,671,229 | $607,369,061 | $1,653,242,468 |
The accompanying Notes to Financial Statements are an integral part of this statement.
Columbia Capital Allocation Portfolios | Annual Report 2018
| 89 |
Statement of Assets and Liabilities (continued)
January 31, 2018
| | Columbia
Capital
Allocation
Conservative
Portfolio | Columbia
Capital
Allocation
Moderate
Conservative
Portfolio | Columbia
Capital
Allocation
Moderate
Portfolio |
| Class A | | | |
| Net assets | $198,471,047 | $486,407,796 | $1,389,746,992 |
| Shares outstanding | 19,127,600 | 42,752,394 | 115,941,531 |
| Net asset value per share | $10.38 | $11.38 | $11.99 |
| Maximum offering price per share(a) | $10.90 | $12.07 | $12.72 |
| Advisor Class(b) | | | |
| Net assets | $6,063,489 | $4,591,886 | $1,021,419 |
| Shares outstanding | 588,097 | 407,153 | 86,231 |
| Net asset value per share | $10.31 | $11.28 | $11.85 |
| Class C | | | |
| Net assets | $38,764,614 | $82,191,555 | $207,421,432 |
| Shares outstanding | 3,757,823 | 7,328,824 | 17,451,220 |
| Net asset value per share | $10.32 | $11.21 | $11.89 |
| Institutional Class(c) | | | |
| Net assets | $9,559,389 | $28,795,618 | $39,872,394 |
| Shares outstanding | 921,664 | 2,565,884 | 3,330,352 |
| Net asset value per share | $10.37 | $11.22 | $11.97 |
| Institutional 2 Class(d) | | | |
| Net assets | $571,356 | $2,654,836 | $7,323,135 |
| Shares outstanding | 55,426 | 235,578 | 618,482 |
| Net asset value per share | $10.31 | $11.27 | $11.84 |
| Institutional 3 Class(e) | | | |
| Net assets | $1,384,850 | $800,936 | $4,932,798 |
| Shares outstanding | 134,514 | 71,972 | 416,578 |
| Net asset value per share | $10.30 | $11.13 | $11.84 |
| Class K | | | |
| Net assets | $109,193 | $2,643 | $137,827 |
| Shares outstanding | 10,637 | 236 | 11,514 |
| Net asset value per share | $10.27 | $11.20 | $11.97 |
| Class R | | | |
| Net assets | $747,291 | $1,923,791 | $2,786,471 |
| Shares outstanding | 72,055 | 168,837 | 233,140 |
| Net asset value per share | $10.37 | $11.39 | $11.95 |
| (a) | The maximum offering price per share is calculated by dividing the net asset value per share by 1.0 minus the maximum sales charge of 4.75% for Columbia Capital Allocation Conservative Portfolio and dividing the net asset value by 1.0 minus the maximum sales charge of 5.75% for Columbia Capital Allocation Moderate Conservative Portfolio and Columbia Capital Allocation Moderate Portfolio. |
| (b) | Prior to November 1, 2017, Advisor Class shares were known as Class R4 shares. |
| (c) | Prior to November 1, 2017, Institutional Class shares were known as Class Z shares. |
| (d) | Prior to November 1, 2017, Institutional 2 Class shares were known as Class R5 shares. |
| (e) | Prior to November 1, 2017, Institutional 3 Class shares were known as Class Y shares. |
The accompanying Notes to Financial Statements are an integral part of this statement.
| 90 | Columbia Capital Allocation Portfolios | Annual Report 2018 |
Statement of Assets and Liabilities (continued)
January 31, 2018
| | Columbia
Capital
Allocation
Moderate
Aggressive
Portfolio | Columbia
Capital
Allocation
Aggressive
Portfolio |
| Assets | | |
| Investments in unaffiliated issuers, at cost | $30,836,074 | $18,627,206 |
| Investments in affiliated issuers, at cost | 1,954,074,219 | 632,171,091 |
| Investments in unaffiliated issuers, at value | 35,814,127 | 22,026,027 |
| Investments in affiliated issuers, at value | 2,268,452,029 | 764,425,872 |
| Cash | 20,350 | 9,250 |
| Foreign currency (identified cost $900, $—) | 891 | — |
| Margin deposits on: | | |
| Futures contracts | 11,911,272 | 3,537,033 |
| Swap contracts | 2,029,793 | 752,527 |
| Unrealized appreciation on forward foreign currency exchange contracts | 18,197 | 21,476 |
| Receivable for: | | |
| Investments sold | 552,491 | — |
| Capital shares sold | 1,569,722 | 930,418 |
| Dividends | 1,809,078 | 339,275 |
| Foreign tax reclaims | 7,607 | 8,101 |
| Variation margin for futures contracts | 660,492 | 219,283 |
| Variation margin for swap contracts | 24,711 | 9,132 |
| Prepaid expenses | 4,752 | 2,404 |
| Trustees’ deferred compensation plan | 19,136 | — |
| Total assets | 2,322,894,648 | 792,280,798 |
| Liabilities | | |
| Unrealized depreciation on forward foreign currency exchange contracts | 12,069 | 14,111 |
| Payable for: | | |
| Investments purchased | 1,452,810 | 348,064 |
| Capital shares purchased | 2,826,238 | 656,845 |
| Variation margin for futures contracts | 372,458 | 29,650 |
| Variation margin for swap contracts | 689 | 207 |
| Management services fees | 6,460 | 1,726 |
| Distribution and/or service fees | 19,121 | 7,063 |
| Transfer agent fees | 163,597 | 55,089 |
| Plan administration fees | — | 1 |
| Compensation of board members | 198,100 | 38,568 |
| Compensation of chief compliance officer | 466 | 152 |
| Other expenses | 125,404 | 67,321 |
| Trustees’ deferred compensation plan | 19,136 | — |
| Total liabilities | 5,196,548 | 1,218,797 |
| Net assets applicable to outstanding capital stock | $2,317,698,100 | $791,062,001 |
| Represented by | | |
| Paid in capital | 1,909,387,967 | 622,477,477 |
| Undistributed net investment income | 1,825,858 | 220,085 |
| Accumulated net realized gain | 72,207,967 | 27,422,584 |
| Unrealized appreciation (depreciation) on: | | |
| Investments - unaffiliated issuers | 4,978,053 | 3,398,821 |
| Investments - affiliated issuers | 314,377,810 | 132,254,781 |
| Foreign currency translations | 35,213 | 10,371 |
| Forward foreign currency exchange contracts | 6,128 | 7,365 |
| Futures contracts | 14,596,634 | 5,160,946 |
| Swap contracts | 282,470 | 109,571 |
| Total - representing net assets applicable to outstanding capital stock | $2,317,698,100 | $791,062,001 |
The accompanying Notes to Financial Statements are an integral part of this statement.
Columbia Capital Allocation Portfolios | Annual Report 2018
| 91 |
Statement of Assets and Liabilities (continued)
January 31, 2018
| | Columbia
Capital
Allocation
Moderate
Aggressive
Portfolio | Columbia
Capital
Allocation
Aggressive
Portfolio |
| Class A | | |
| Net assets | $1,826,697,892 | $670,782,719 |
| Shares outstanding | 135,332,017 | 47,577,256 |
| Net asset value per share | $13.50 | $14.10 |
| Maximum offering price per share(a) | $14.32 | $14.96 |
| Advisor Class(b) | | |
| Net assets | $11,216,480 | $1,662,412 |
| Shares outstanding | 824,113 | 120,195 |
| Net asset value per share | $13.61 | $13.83 |
| Class C | | |
| Net assets | $215,267,503 | $88,717,274 |
| Shares outstanding | 15,921,443 | 6,443,828 |
| Net asset value per share | $13.52 | $13.77 |
| Institutional Class(c) | | |
| Net assets | $136,761,486 | $20,762,555 |
| Shares outstanding | 10,150,264 | 1,478,413 |
| Net asset value per share | $13.47 | $14.04 |
| Institutional 2 Class(d) | | |
| Net assets | $8,880,596 | $2,642,301 |
| Shares outstanding | 652,958 | 191,136 |
| Net asset value per share | $13.60 | $13.82 |
| Institutional 3 Class(e) | | |
| Net assets | $20,776,152 | $3,722,459 |
| Shares outstanding | 1,561,968 | 269,376 |
| Net asset value per share | $13.30 | $13.82 |
| Class K | | |
| Net assets | $2,674 | $101,015 |
| Shares outstanding | 199 | 7,145 |
| Net asset value per share | $13.44 | $14.14 |
| Class R | | |
| Net assets | $4,816,072 | $2,671,266 |
| Shares outstanding | 357,155 | 190,980 |
| Net asset value per share | $13.48 | $13.99 |
| Class V | | |
| Net assets | $93,279,245 | $— |
| Shares outstanding | 6,910,526 | — |
| Net asset value per share | $13.50 | $— |
| Maximum offering price per share(f) | $14.32 | $— |
| (a) | The maximum offering price per share is calculated by dividing the net asset value per share by 1.0 minus the maximum sales charge of 5.75% for Class A shares. |
| (b) | Prior to November 1, 2017, Advisor Class shares were known as Class R4 shares. |
| (c) | Prior to November 1, 2017, Institutional Class shares were known as Class Z shares. |
| (d) | Prior to November 1, 2017, Institutional 2 Class shares were known as Class R5 shares. |
| (e) | Prior to November 1, 2017, Institutional 3 Class shares were known as Class Y shares. |
| (f) | The maximum offering price per share is calculated by dividing the net asset value per share by 1.0 minus the maximum sales charge of 5.75% for Class V shares. |
The accompanying Notes to Financial Statements are an integral part of this statement.
| 92 | Columbia Capital Allocation Portfolios | Annual Report 2018 |
Statement of Operations
Year Ended January 31, 2018
| | Columbia
Capital
Allocation
Conservative
Portfolio | Columbia
Capital
Allocation
Moderate
Conservative
Portfolio | Columbia
Capital
Allocation
Moderate
Portfolio |
| Net investment income | | | |
| Income: | | | |
| Dividends — unaffiliated issuers | $271,919 | $422,265 | $759,366 |
| Dividends — affiliated issuers | 5,624,793 | 12,835,126 | 32,555,007 |
| Interest | 5,111 | 11,701 | 42,553 |
| Foreign taxes withheld | (21,004) | (32,072) | (41,923) |
| Total income | 5,880,819 | 13,237,020 | 33,315,003 |
| Expenses: | | | |
| Management services fees | 262,528 | 529,708 | 1,072,621 |
| Distribution and/or service fees | | | |
| Class A | 508,744 | 1,207,249 | 3,325,578 |
| Class B(a) | 5,689 | 13,617 | 49,351 |
| Class C | 396,932 | 828,768 | 1,924,191 |
| Class R | 3,578 | 11,790 | 12,281 |
| Transfer agent fees | | | |
| Class A | 204,983 | 449,962 | 1,201,455 |
| Advisor Class(b) | 3,074 | 3,090 | 608 |
| Class B(a) | 643 | 1,427 | 5,328 |
| Class C | 40,019 | 77,354 | 173,297 |
| Institutional Class(c) | 8,474 | 24,865 | 20,056 |
| Institutional 2 Class(d) | 287 | 1,565 | 4,653 |
| Institutional 3 Class(e) | 184 | 129 | 793 |
| Class K | 76 | 31 | 66 |
| Class R | 712 | 2,236 | 2,204 |
| Plan administration fees | | | |
| Class K | 263 | 116 | 269 |
| Compensation of board members | 25,979 | 25,018 | 40,096 |
| Custodian fees | 42,721 | 44,129 | 75,055 |
| Printing and postage fees | 30,688 | 57,212 | 141,525 |
| Registration fees | 122,437 | 133,461 | 162,416 |
| Audit fees | 21,050 | 21,050 | 23,484 |
| Legal fees | 9,190 | 12,140 | 20,329 |
| Compensation of chief compliance officer | 55 | 128 | 329 |
| Other | 15,253 | 20,489 | 34,175 |
| Total expenses | 1,703,559 | 3,465,534 | 8,290,160 |
| Expense reduction | — | (100) | (100) |
| Total net expenses | 1,703,559 | 3,465,434 | 8,290,060 |
| Net investment income | 4,177,260 | 9,771,586 | 25,024,943 |
The accompanying Notes to Financial Statements are an integral part of this statement.
Columbia Capital Allocation Portfolios | Annual Report 2018
| 93 |
Statement of Operations (continued)
Year Ended January 31, 2018
| | Columbia
Capital
Allocation
Conservative
Portfolio | Columbia
Capital
Allocation
Moderate
Conservative
Portfolio | Columbia
Capital
Allocation
Moderate
Portfolio |
| Realized and unrealized gain (loss) — net | | | |
| Net realized gain (loss) on: | | | |
| Investments — unaffiliated issuers | $818,351 | $1,253,046 | $2,483,109 |
| Investments — affiliated issuers | 1,642,412 | 10,563,750 | 28,302,044 |
| Capital gain distributions from underlying affiliated funds | 2,494,981 | 9,819,265 | 37,875,052 |
| Foreign currency translations | (11,162) | (23,767) | (46,931) |
| Forward foreign currency exchange contracts | 7,963 | 13,817 | (20,275) |
| Futures contracts | 412,558 | 3,005,275 | 19,073,176 |
| Swap contracts | (187,543) | (477,425) | (912,869) |
| Net realized gain | 5,177,560 | 24,153,961 | 86,753,306 |
| Net change in unrealized appreciation (depreciation) on: | | | |
| Investments — unaffiliated issuers | 966,109 | 1,512,389 | 2,300,794 |
| Investments — affiliated issuers | 9,203,166 | 30,783,929 | 114,994,551 |
| Foreign currency translations | 9,244 | 22,464 | 46,177 |
| Forward foreign currency exchange contracts | 1,134 | 1,873 | 9,204 |
| Futures contracts | (404,750) | 263,278 | 6,650,723 |
| Swap contracts | 98,240 | 258,776 | 541,438 |
| Net change in unrealized appreciation (depreciation) | 9,873,143 | 32,842,709 | 124,542,887 |
| Net realized and unrealized gain | 15,050,703 | 56,996,670 | 211,296,193 |
| Net increase in net assets resulting from operations | $19,227,963 | $66,768,256 | $236,321,136 |
| (a) | Effective July 17, 2017, Class B shares were automatically converted to Class A shares. |
| (b) | Prior to November 1, 2017, Advisor Class shares were known as Class R4 shares. |
| (c) | Prior to November 1, 2017, Institutional Class shares were known as Class Z shares. |
| (d) | Prior to November 1, 2017, Institutional 2 Class shares were known as Class R5 shares. |
| (e) | Prior to November 1, 2017, Institutional 3 Class shares were known as Class Y shares. |
The accompanying Notes to Financial Statements are an integral part of this statement.
| 94 | Columbia Capital Allocation Portfolios | Annual Report 2018 |
Statement of Operations (continued)
Year Ended January 31, 2018
| | Columbia
Capital
Allocation
Moderate
Aggressive
Portfolio | Columbia
Capital
Allocation
Aggressive
Portfolio |
| Net investment income | | |
| Income: | | |
| Dividends — unaffiliated issuers | $673,788 | $501,051 |
| Dividends — affiliated issuers | 39,735,131 | 10,813,555 |
| Interest | 75,366 | 20,597 |
| Foreign taxes withheld | (29,167) | (34,927) |
| Total income | 40,455,118 | 11,300,276 |
| Expenses: | | |
| Management services fees | 2,140,761 | 550,729 |
| Distribution and/or service fees | | |
| Class A | 4,314,774 | 1,535,332 |
| Class B(a) | 54,709 | 26,019 |
| Class C | 2,112,672 | 807,797 |
| Class R | 22,890 | 11,402 |
| Class V | 223,206 | — |
| Transfer agent fees | | |
| Class A | 2,025,463 | 661,539 |
| Advisor Class(b) | 7,777 | 1,257 |
| Class B(a) | 7,297 | 3,482 |
| Class C | 249,001 | 87,026 |
| Institutional Class(c) | 153,534 | 12,651 |
| Institutional 2 Class(d) | 4,509 | 1,421 |
| Institutional 3 Class(e) | 943 | 482 |
| Class K | — | 60 |
| Class R | 5,341 | 2,440 |
| Class V | 104,863 | — |
| Plan administration fees | | |
| Class K | 6 | 214 |
| Compensation of board members | 67,476 | 25,625 |
| Custodian fees | 75,673 | 72,199 |
| Printing and postage fees | 219,915 | 80,223 |
| Registration fees | 155,802 | 132,433 |
| Audit fees | 24,497 | 23,934 |
| Legal fees | 25,663 | 13,102 |
| Compensation of chief compliance officer | 461 | 148 |
| Other | 45,578 | 22,034 |
| Total expenses | 12,042,811 | 4,071,549 |
| Expense reduction | (10,264) | (140) |
| Total net expenses | 12,032,547 | 4,071,409 |
| Net investment income | 28,422,571 | 7,228,867 |
The accompanying Notes to Financial Statements are an integral part of this statement.
Columbia Capital Allocation Portfolios | Annual Report 2018
| 95 |
Statement of Operations (continued)
Year Ended January 31, 2018
| | Columbia
Capital
Allocation
Moderate
Aggressive
Portfolio | Columbia
Capital
Allocation
Aggressive
Portfolio |
| Realized and unrealized gain (loss) — net | | |
| Net realized gain (loss) on: | | |
| Investments — unaffiliated issuers | $2,538,992 | $1,546,723 |
| Investments — affiliated issuers | 50,787,105 | 18,080,134 |
| Capital gain distributions from underlying affiliated funds | 62,869,977 | 28,790,813 |
| Foreign currency translations | (56,049) | (13,863) |
| Forward foreign currency exchange contracts | (11,164) | (12,632) |
| Futures contracts | 37,374,429 | 11,052,101 |
| Swap contracts | (974,625) | (137,485) |
| Net realized gain | 152,528,665 | 59,305,791 |
| Net change in unrealized appreciation (depreciation) on: | | |
| Investments — unaffiliated issuers | 1,827,374 | 1,499,522 |
| Investments — affiliated issuers | 216,920,197 | 90,946,854 |
| Foreign currency translations | 53,021 | 14,364 |
| Forward foreign currency exchange contracts | 5,421 | 8,280 |
| Futures contracts | 14,812,249 | 4,977,791 |
| Swap contracts | 745,017 | 230,633 |
| Net change in unrealized appreciation (depreciation) | 234,363,279 | 97,677,444 |
| Net realized and unrealized gain | 386,891,944 | 156,983,235 |
| Net increase in net assets resulting from operations | $415,314,515 | $164,212,102 |
| (a) | Effective July 17, 2017, Class B shares were automatically converted to Class A shares. |
| (b) | Prior to November 1, 2017, Advisor Class shares were known as Class R4 shares. |
| (c) | Prior to November 1, 2017, Institutional Class shares were known as Class Z shares. |
| (d) | Prior to November 1, 2017, Institutional 2 Class shares were known as Class R5 shares. |
| (e) | Prior to November 1, 2017, Institutional 3 Class shares were known as Class Y shares. |
The accompanying Notes to Financial Statements are an integral part of this statement.
| 96 | Columbia Capital Allocation Portfolios | Annual Report 2018 |
Statement of Changes in Net Assets
| | Columbia Capital Allocation
Conservative Portfolio | Columbia Capital Allocation
Moderate Conservative Portfolio |
| | Year Ended
January 31, 2018 | Year Ended
January 31, 2017 | Year Ended
January 31, 2018 | Year Ended
January 31, 2017 |
| Operations | | | | |
| Net investment income | $4,177,260 | $3,833,610 | $9,771,586 | $9,323,666 |
| Net realized gain (loss) | 5,177,560 | (100,707) | 24,153,961 | 6,421,525 |
| Net change in unrealized appreciation (depreciation) | 9,873,143 | 13,485,461 | 32,842,709 | 34,704,628 |
| Net increase in net assets resulting from operations | 19,227,963 | 17,218,364 | 66,768,256 | 50,449,819 |
| Distributions to shareholders | | | | |
| Net investment income | | | | |
| Class A | (4,353,776) | (3,381,022) | (10,394,435) | (7,758,691) |
| Advisor Class(a) | (83,759) | (9,373) | (86,167) | (26,712) |
| Class B(b) | (6,124) | (18,407) | (13,741) | (42,600) |
| Class C | (561,182) | (354,966) | (1,188,375) | (705,691) |
| Institutional Class(c) | (220,122) | (65,500) | (684,241) | (401,349) |
| Institutional 2 Class(d) | (9,633) | (8,416) | (56,849) | (36,323) |
| Institutional 3 Class(e) | (25,050) | (9,897) | (15,809) | (9,366) |
| Class K | (2,342) | (1,597) | (771) | (700) |
| Class R | (14,575) | (6,627) | (43,855) | (34,021) |
| Net realized gains | | | | |
| Class A | (186,346) | (1,943,762) | (9,806,462) | (9,926,178) |
| Advisor Class(a) | (3,920) | (3,795) | (78,715) | (15,373) |
| Class B(b) | — | (21,611) | (14,546) | (120,025) |
| Class C | (36,388) | (403,214) | (1,688,041) | (1,739,288) |
| Institutional Class(c) | (8,915) | (30,895) | (579,472) | (462,330) |
| Institutional 2 Class(d) | (394) | (4,277) | (49,099) | (36,592) |
| Institutional 3 Class(e) | (1,303) | (4,552) | (14,380) | (10,714) |
| Class K | (102) | (866) | (440) | (1,059) |
| Class R | (757) | (5,220) | (41,759) | (48,866) |
| Total distributions to shareholders | (5,514,688) | (6,273,997) | (24,757,157) | (21,375,878) |
| Decrease in net assets from capital stock activity | (22,006,729) | (14,749,960) | (49,336,256) | (34,133,689) |
| Total decrease in net assets | (8,293,454) | (3,805,593) | (7,325,157) | (5,059,748) |
| Net assets at beginning of year | 263,964,683 | 267,770,276 | 614,694,218 | 619,753,966 |
| Net assets at end of year | $255,671,229 | $263,964,683 | $607,369,061 | $614,694,218 |
| Undistributed net investment income | $146,047 | $832,330 | $822,969 | $2,187,893 |
| (a) | Prior to November 1, 2017, Advisor Class shares were known as Class R4 shares. |
| (b) | Effective July 17, 2017, Class B shares were automatically converted to Class A shares. |
| (c) | Prior to November 1, 2017, Institutional Class shares were known as Class Z shares. |
| (d) | Prior to November 1, 2017, Institutional 2 Class shares were known as Class R5 shares. |
| (e) | Prior to November 1, 2017, Institutional 3 Class shares were known as Class Y shares. |
The accompanying Notes to Financial Statements are an integral part of this statement.
Columbia Capital Allocation Portfolios | Annual Report 2018
| 97 |
Statement of Changes in Net Assets (continued)
| | Columbia Capital Allocation
Moderate Portfolio | Columbia Capital Allocation
Moderate Aggressive Portfolio |
| | Year Ended
January 31, 2018 | Year Ended
January 31, 2017 | Year Ended
January 31, 2018 | Year Ended
January 31, 2017 |
| Operations | | | | |
| Net investment income | $25,024,943 | $23,885,456 | $28,422,571 | $26,354,194 |
| Net realized gain | 86,753,306 | 41,701,686 | 152,528,665 | 83,632,364 |
| Net change in unrealized appreciation (depreciation) | 124,542,887 | 95,586,886 | 234,363,279 | 153,420,497 |
| Net increase in net assets resulting from operations | 236,321,136 | 161,174,028 | 415,314,515 | 263,407,055 |
| Distributions to shareholders | | | | |
| Net investment income | | | | |
| Class A | (26,582,173) | (25,546,421) | (27,435,182) | (22,345,765) |
| Advisor Class(a) | (24,417) | (5,209) | (157,254) | (21,568) |
| Class B(b) | (14,106) | (192,397) | — | (130,865) |
| Class C | (2,500,429) | (2,250,044) | (2,002,393) | (1,662,664) |
| Institutional Class(c) | (599,128) | (88,153) | (2,361,582) | (1,861,033) |
| Institutional 2 Class(d) | (166,972) | (123,308) | (149,915) | (82,643) |
| Institutional 3 Class(e) | (118,854) | (69,291) | (301,499) | (17,488) |
| Class K | (2,402) | (2,961) | (44) | (144) |
| Class R | (44,348) | (34,446) | (64,586) | (38,439) |
| Class V | — | — | (1,413,771) | (1,156,475) |
| Net realized gains | | | | |
| Class A | (58,730,658) | (32,907,743) | (95,979,290) | (61,207,186) |
| Advisor Class(a) | (42,542) | (5,430) | (451,594) | (48,999) |
| Class B(b) | (176,261) | (481,470) | (224,541) | (785,428) |
| Class C | (8,646,074) | (4,653,822) | (11,413,841) | (7,800,757) |
| Institutional Class(c) | (1,151,950) | (89,876) | (7,298,358) | (4,282,177) |
| Institutional 2 Class(d) | (342,217) | (138,173) | (424,543) | (176,327) |
| Institutional 3 Class(e) | (230,022) | (71,478) | (689,718) | (29,260) |
| Class K | (5,148) | (6,319) | (145) | (90) |
| Class R | (110,450) | (41,694) | (263,876) | (119,631) |
| Class V | — | — | (4,955,110) | (3,168,524) |
| Total distributions to shareholders | (99,488,151) | (66,708,235) | (155,587,242) | (104,935,463) |
| Decrease in net assets from capital stock activity | (9,457,625) | (75,066,971) | (64,115,421) | (127,731,803) |
| Total increase in net assets | 127,375,360 | 19,398,822 | 195,611,852 | 30,739,789 |
| Net assets at beginning of year | 1,525,867,108 | 1,506,468,286 | 2,122,086,248 | 2,091,346,459 |
| Net assets at end of year | $1,653,242,468 | $1,525,867,108 | $2,317,698,100 | $2,122,086,248 |
| Undistributed net investment income | $1,195,430 | $1,535,844 | $1,825,858 | $866,359 |
| (a) | Prior to November 1, 2017, Advisor Class shares were known as Class R4 shares. |
| (b) | Effective July 17, 2017, Class B shares were automatically converted to Class A shares. |
| (c) | Prior to November 1, 2017, Institutional Class shares were known as Class Z shares. |
| (d) | Prior to November 1, 2017, Institutional 2 Class shares were known as Class R5 shares. |
| (e) | Prior to November 1, 2017, Institutional 3 Class shares were known as Class Y shares. |
The accompanying Notes to Financial Statements are an integral part of this statement.
| 98 | Columbia Capital Allocation Portfolios | Annual Report 2018 |
Statement of Changes in Net Assets (continued)
| | Columbia Capital Allocation
Aggressive Portfolio |
| | Year Ended
January 31, 2018 | Year Ended
January 31, 2017 |
| Operations | | |
| Net investment income | $7,228,867 | $6,468,853 |
| Net realized gain | 59,305,791 | 27,019,761 |
| Net change in unrealized appreciation (depreciation) | 97,677,444 | 57,721,663 |
| Net increase in net assets resulting from operations | 164,212,102 | 91,210,277 |
| Distributions to shareholders | | |
| Net investment income | | |
| Class A | (9,048,448) | (6,715,750) |
| Advisor Class(a) | (23,930) | (9,014) |
| Class B(b) | — | (37,944) |
| Class C | (679,694) | (383,582) |
| Institutional Class(c) | (305,148) | (44,934) |
| Institutional 2 Class(d) | (38,834) | (22,254) |
| Institutional 3 Class(e) | (59,852) | (32,328) |
| Class K | (1,376) | (872) |
| Class R | (28,394) | (18,790) |
| Net realized gains | | |
| Class A | (36,768,115) | (21,486,728) |
| Advisor Class(a) | (74,404) | (22,129) |
| Class B(b) | (123,096) | (356,433) |
| Class C | (5,002,125) | (2,751,643) |
| Institutional Class(c) | (815,717) | (102,972) |
| Institutional 2 Class(d) | (126,891) | (48,687) |
| Institutional 3 Class(e) | (212,671) | (62,134) |
| Class K | (5,277) | (2,445) |
| Class R | (135,737) | (46,212) |
| Total distributions to shareholders | (53,449,709) | (32,144,851) |
| Increase (decrease) in net assets from capital stock activity | 5,038,252 | (17,318,215) |
| Total increase in net assets | 115,800,645 | 41,747,211 |
| Net assets at beginning of year | 675,261,356 | 633,514,145 |
| Net assets at end of year | $791,062,001 | $675,261,356 |
| Undistributed (excess of distributions over) net investment income | $220,085 | $(40,748) |
| (a) | Prior to November 1, 2017, Advisor Class shares were known as Class R4 shares. |
| (b) | Effective July 17, 2017, Class B shares were automatically converted to Class A shares. |
| (c) | Prior to November 1, 2017, Institutional Class shares were known as Class Z shares. |
| (d) | Prior to November 1, 2017, Institutional 2 Class shares were known as Class R5 shares. |
| (e) | Prior to November 1, 2017, Institutional 3 Class shares were known as Class Y shares. |
The accompanying Notes to Financial Statements are an integral part of this statement.
Columbia Capital Allocation Portfolios | Annual Report 2018
| 99 |
Statement of Changes in Net Assets (continued)
| | Columbia Capital Allocation
Conservative Portfolio | Columbia Capital Allocation
Moderate Conservative Portfolio |
| | Year Ended | Year Ended | Year Ended | Year Ended |
| | January 31, 2018 | January 31, 2017 | January 31, 2018 | January 31, 2017 |
| | Shares | Dollars ($) | Shares | Dollars ($) | Shares | Dollars ($) | Shares | Dollars ($) |
| Capital stock activity |
| Class A(a) | | | | | | | | |
| Subscriptions (b) | 1,869,570 | 18,977,560 | 3,453,730 | 33,841,486 | 4,308,753 | 47,787,141 | 5,244,058 | 55,106,729 |
| Distributions reinvested | 424,125 | 4,301,273 | 516,173 | 5,032,734 | 1,678,379 | 18,548,273 | 1,566,725 | 16,243,578 |
| Redemptions | (4,884,815) | (49,390,028) | (5,146,261) | (50,412,406) | (9,857,770) | (108,575,283) | (9,094,068) | (95,614,956) |
| Net decrease | (2,591,120) | (26,111,195) | (1,176,358) | (11,538,186) | (3,870,638) | (42,239,869) | (2,283,285) | (24,264,649) |
| Advisor Class(c) | | | | | | | | |
| Subscriptions | 674,464 | 6,814,164 | 95,705 | 931,733 | 163,414 | 1,814,917 | 205,466 | 2,156,698 |
| Distributions reinvested | 3,964 | 39,810 | 1,349 | 13,104 | 15,020 | 164,773 | 4,068 | 41,999 |
| Redemptions | (182,722) | (1,839,271) | (20,119) | (195,719) | (28,274) | (313,779) | (60,148) | (606,465) |
| Net increase | 495,706 | 5,014,703 | 76,935 | 749,118 | 150,160 | 1,665,911 | 149,386 | 1,592,232 |
| Class B(a) | | | | | | | | |
| Subscriptions | 783 | 7,762 | 18,485 | 179,248 | 1,057 | 11,322 | 24,012 | 250,585 |
| Distributions reinvested | 604 | 5,991 | 3,955 | 38,414 | 2,475 | 26,753 | 14,335 | 147,454 |
| Redemptions (b) | (165,367) | (1,662,667) | (215,499) | (2,091,112) | (379,768) | (4,128,607) | (446,898) | (4,653,023) |
| Net decrease | (163,980) | (1,648,914) | (193,059) | (1,873,450) | (376,236) | (4,090,532) | (408,551) | (4,254,984) |
| Class C | | | | | | | | |
| Subscriptions | 518,012 | 5,244,571 | 838,245 | 8,143,830 | 916,864 | 10,022,460 | 1,384,265 | 14,325,161 |
| Distributions reinvested | 57,237 | 578,204 | 74,314 | 720,321 | 254,420 | 2,777,385 | 221,186 | 2,259,044 |
| Redemptions | (1,139,128) | (11,461,143) | (1,241,525) | (12,084,646) | (2,198,776) | (23,879,550) | (1,755,249) | (18,210,715) |
| Net decrease | (563,879) | (5,638,368) | (328,966) | (3,220,495) | (1,027,492) | (11,079,705) | (149,798) | (1,626,510) |
| Institutional Class(d) | | | | | | | | |
| Subscriptions | 918,978 | 9,216,994 | 227,542 | 2,228,637 | 1,691,923 | 18,271,190 | 571,146 | 5,922,134 |
| Distributions reinvested | 19,235 | 194,975 | 8,487 | 82,751 | 62,399 | 680,288 | 38,011 | 388,976 |
| Redemptions | (420,460) | (4,275,044) | (154,482) | (1,513,422) | (1,142,598) | (12,452,013) | (1,062,959) | (11,041,712) |
| Net increase (decrease) | 517,753 | 5,136,925 | 81,547 | 797,966 | 611,724 | 6,499,465 | (453,802) | (4,730,602) |
| Institutional 2 Class(e) | | | | | | | | |
| Subscriptions | 25,625 | 261,798 | 28,267 | 269,522 | 61,841 | 682,295 | 156,819 | 1,618,245 |
| Distributions reinvested | 988 | 9,965 | 1,304 | 12,630 | 9,664 | 105,837 | 7,081 | 72,827 |
| Redemptions | (13,863) | (138,961) | (21,142) | (206,959) | (34,035) | (370,789) | (34,031) | (356,911) |
| Net increase | 12,750 | 132,802 | 8,429 | 75,193 | 37,470 | 417,343 | 129,869 | 1,334,161 |
| Institutional 3 Class(f) | | | | | | | | |
| Subscriptions | 98,322 | 997,950 | 60,831 | 588,974 | 52,750 | 577,645 | 60,918 | 606,952 |
| Distributions reinvested | 2,602 | 26,290 | 1,483 | 14,385 | 2,778 | 30,077 | 1,968 | 19,991 |
| Redemptions | (27,351) | (276,718) | (19,091) | (186,664) | (22,895) | (253,446) | (24,524) | (252,259) |
| Net increase | 73,573 | 747,522 | 43,223 | 416,695 | 32,633 | 354,276 | 38,362 | 374,684 |
| Class K | | | | | | | | |
| Subscriptions | 71 | 716 | 65 | 641 | 306 | 3,306 | 5,157 | 53,755 |
| Distributions reinvested | 238 | 2,386 | 249 | 2,402 | 102 | 1,099 | 163 | 1,670 |
| Redemptions | — | — | (40) | (392) | (5,728) | (63,437) | (41) | (424) |
| Net increase (decrease) | 309 | 3,102 | 274 | 2,651 | (5,320) | (59,032) | 5,279 | 55,001 |
| Class R | | | | | | | | |
| Subscriptions | 46,839 | 467,557 | 22,966 | 222,201 | 84,727 | 923,578 | 112,849 | 1,186,379 |
| Distributions reinvested | 1,236 | 12,550 | 1,045 | 10,192 | 6,157 | 68,047 | 6,830 | 70,914 |
| Redemptions | (12,126) | (123,413) | (39,802) | (391,845) | (161,825) | (1,795,738) | (372,938) | (3,870,315) |
| Net increase (decrease) | 35,949 | 356,694 | (15,791) | (159,452) | (70,941) | (804,113) | (253,259) | (2,613,022) |
| Total net decrease | (2,182,939) | (22,006,729) | (1,503,766) | (14,749,960) | (4,518,640) | (49,336,256) | (3,225,799) | (34,133,689) |
The accompanying Notes to Financial Statements are an integral part of this statement.
| 100 | Columbia Capital Allocation Portfolios | Annual Report 2018 |
Statement of Changes in Net Assets (continued)
| (a) | Effective July 17, 2017, Class B shares were automatically converted to Class A shares. |
| (b) | Includes conversions of Class B shares to Class A shares, if any. |
| (c) | Prior to November 1, 2017, Advisor Class shares were known as Class R4 shares. |
| (d) | Prior to November 1, 2017, Institutional Class shares were known as Class Z shares. |
| (e) | Prior to November 1, 2017, Institutional 2 Class shares were known as Class R5 shares. |
| (f) | Prior to November 1, 2017, Institutional 3 Class shares were known as Class Y shares. |
The accompanying Notes to Financial Statements are an integral part of this statement.
Columbia Capital Allocation Portfolios | Annual Report 2018
| 101 |
Statement of Changes in Net Assets (continued)
| | Columbia Capital Allocation
Moderate Portfolio | Columbia Capital Allocation
Moderate Aggressive Portfolio |
| | Year Ended | Year Ended | Year Ended | Year Ended |
| | January 31, 2018 | January 31, 2017 | January 31, 2018 | January 31, 2017 |
| | Shares | Dollars ($) | Shares | Dollars ($) | Shares | Dollars ($) | Shares | Dollars ($) |
| Capital stock activity |
| Class A(a) | | | | | | | | |
| Subscriptions (b) | 10,693,101 | 123,704,358 | 9,418,177 | 101,647,267 | 10,248,676 | 130,953,672 | 8,889,781 | 104,260,537 |
| Distributions reinvested | 7,347,550 | 84,534,924 | 5,439,534 | 57,678,903 | 8,320,226 | 106,374,225 | 6,231,650 | 72,007,188 |
| Redemptions | (21,275,717) | (244,960,004) | (20,915,655) | (225,993,157) | (22,498,754) | (286,744,328) | (23,465,811) | (276,406,424) |
| Net decrease | (3,235,066) | (36,720,722) | (6,057,944) | (66,666,987) | (3,929,852) | (49,416,431) | (8,344,380) | (100,138,699) |
| Advisor Class(c) | | | | | | | | |
| Subscriptions | 134,546 | 1,553,500 | 12,499 | 135,270 | 900,946 | 11,563,928 | 84,234 | 1,009,531 |
| Distributions reinvested | 5,835 | 66,793 | 1,003 | 10,531 | 20,571 | 265,636 | 6,045 | 70,443 |
| Redemptions | (86,773) | (1,016,126) | (594) | (6,378) | (273,313) | (3,467,897) | (13,979) | (165,325) |
| Net increase | 53,608 | 604,167 | 12,908 | 139,423 | 648,204 | 8,361,667 | 76,300 | 914,649 |
| Class B(a) | | | | | | | | |
| Subscriptions | 7,234 | 80,934 | 38,186 | 408,896 | 5,190 | 64,239 | 21,777 | 249,110 |
| Distributions reinvested | 16,825 | 189,679 | 63,797 | 670,795 | 17,729 | 218,061 | 73,563 | 835,816 |
| Redemptions (b) | (1,249,742) | (14,172,361) | (1,207,783) | (12,929,186) | (1,327,501) | (16,438,960) | (1,624,713) | (18,766,142) |
| Net decrease | (1,225,683) | (13,901,748) | (1,105,800) | (11,849,495) | (1,304,582) | (16,156,660) | (1,529,373) | (17,681,216) |
| Class C | | | | | | | | |
| Subscriptions | 3,221,855 | 37,041,236 | 2,766,131 | 29,626,140 | 2,061,621 | 26,439,992 | 2,452,238 | 28,887,441 |
| Distributions reinvested | 972,414 | 11,113,112 | 652,731 | 6,857,159 | 994,435 | 12,750,764 | 699,901 | 8,115,443 |
| Redemptions | (3,814,330) | (43,575,822) | (3,740,196) | (40,096,834) | (5,101,246) | (65,334,591) | (3,585,302) | (42,353,594) |
| Net increase (decrease) | 379,939 | 4,578,526 | (321,334) | (3,613,535) | (2,045,190) | (26,143,835) | (433,163) | (5,350,710) |
| Institutional Class(d) | | | | | | | | |
| Subscriptions | 4,721,422 | 54,229,815 | 701,757 | 7,595,019 | 3,823,847 | 48,463,748 | 1,636,520 | 19,281,751 |
| Distributions reinvested | 138,061 | 1,587,384 | 14,566 | 154,545 | 499,068 | 6,364,312 | 335,582 | 3,872,455 |
| Redemptions | (1,947,895) | (22,502,463) | (533,965) | (5,800,954) | (4,173,970) | (53,071,502) | (2,195,072) | (25,796,028) |
| Net increase (decrease) | 2,911,588 | 33,314,736 | 182,358 | 1,948,610 | 148,945 | 1,756,558 | (222,970) | (2,641,822) |
| Institutional 2 Class(e) | | | | | | | | |
| Subscriptions | 413,507 | 4,716,122 | 247,126 | 2,579,993 | 322,083 | 4,206,967 | 178,372 | 2,078,780 |
| Distributions reinvested | 44,843 | 509,022 | 24,913 | 261,372 | 44,503 | 574,279 | 22,221 | 258,853 |
| Redemptions | (347,878) | (4,016,032) | (135,707) | (1,458,706) | (185,667) | (2,455,297) | (43,525) | (520,989) |
| Net increase | 110,472 | 1,209,112 | 136,332 | 1,382,659 | 180,919 | 2,325,949 | 157,068 | 1,816,644 |
| Institutional 3 Class(f) | | | | | | | | |
| Subscriptions | 274,979 | 3,167,170 | 291,628 | 3,078,927 | 1,531,157 | 19,146,051 | 83,261 | 959,302 |
| Distributions reinvested | 30,666 | 348,708 | 13,388 | 140,658 | 14,644 | 184,698 | 4,064 | 46,628 |
| Redemptions | (207,359) | (2,391,607) | (22,709) | (244,877) | (79,077) | (1,008,472) | (26,539) | (309,609) |
| Net increase | 98,286 | 1,124,271 | 282,307 | 2,974,708 | 1,466,724 | 18,322,277 | 60,786 | 696,321 |
| Class K | | | | | | | | |
| Subscriptions | 2,912 | 33,923 | 1,593 | 17,166 | — | — | — | — |
| Distributions reinvested | 642 | 7,387 | 871 | 9,175 | — | — | 10 | 113 |
| Redemptions | — | — | (22,657) | (245,793) | — | — | (7,915) | (92,153) |
| Net increase (decrease) | 3,554 | 41,310 | (20,193) | (219,452) | — | — | (7,905) | (92,040) |
| Class R | | | | | | | | |
| Subscriptions | 52,785 | 608,377 | 106,526 | 1,144,940 | 122,737 | 1,564,805 | 113,401 | 1,334,387 |
| Distributions reinvested | 10,201 | 117,124 | 6,305 | 66,676 | 22,885 | 292,614 | 12,659 | 146,306 |
| Redemptions | (37,984) | (432,778) | (34,733) | (374,518) | (100,653) | (1,313,458) | (133,089) | (1,545,330) |
| Net increase (decrease) | 25,002 | 292,723 | 78,098 | 837,098 | 44,969 | 543,961 | (7,029) | (64,637) |
The accompanying Notes to Financial Statements are an integral part of this statement.
| 102 | Columbia Capital Allocation Portfolios | Annual Report 2018 |
Statement of Changes in Net Assets (continued)
| | Columbia Capital Allocation
Moderate Portfolio | Columbia Capital Allocation
Moderate Aggressive Portfolio |
| | Year Ended | Year Ended | Year Ended | Year Ended |
| | January 31, 2018 | January 31, 2017 | January 31, 2018 | January 31, 2017 |
| | Shares | Dollars ($) | Shares | Dollars ($) | Shares | Dollars ($) | Shares | Dollars ($) |
| Class V | | | | | | | | |
| Subscriptions | — | — | — | — | 29,595 | 375,936 | 59,203 | 689,816 |
| Distributions reinvested | — | — | — | — | 406,210 | 5,192,682 | 301,723 | 3,486,496 |
| Redemptions | — | — | — | — | (724,294) | (9,277,525) | (794,994) | (9,366,605) |
| Net decrease | — | — | — | — | (288,489) | (3,708,907) | (434,068) | (5,190,293) |
| Total net decrease | (878,300) | (9,457,625) | (6,813,268) | (75,066,971) | (5,078,352) | (64,115,421) | (10,684,734) | (127,731,803) |
| (a) | Effective July 17, 2017, Class B shares were automatically converted to Class A shares. |
| (b) | Includes conversions of Class B shares to Class A shares, if any. |
| (c) | Prior to November 1, 2017, Advisor Class shares were known as Class R4 shares. |
| (d) | Prior to November 1, 2017, Institutional Class shares were known as Class Z shares. |
| (e) | Prior to November 1, 2017, Institutional 2 Class shares were known as Class R5 shares. |
| (f) | Prior to November 1, 2017, Institutional 3 Class shares were known as Class Y shares. |
The accompanying Notes to Financial Statements are an integral part of this statement.
Columbia Capital Allocation Portfolios | Annual Report 2018
| 103 |
Statement of Changes in Net Assets (continued)
| | Columbia Capital Allocation
Aggressive Portfolio |
| | Year Ended | Year Ended |
| | January 31, 2018 | January 31, 2017 |
| | Shares | Dollars ($) | Shares | Dollars ($) |
| Capital stock activity |
| Class A(a) | | | | |
| Subscriptions (b) | 3,913,966 | 51,299,396 | 3,963,603 | 46,514,139 |
| Distributions reinvested | 3,454,759 | 45,482,165 | 2,436,608 | 27,934,275 |
| Redemptions | (7,880,095) | (102,852,542) | (7,914,776) | (93,238,477) |
| Net decrease | (511,370) | (6,070,981) | (1,514,565) | (18,790,063) |
| Advisor Class(c) | | | | |
| Subscriptions | 57,324 | 761,988 | 67,448 | 790,402 |
| Distributions reinvested | 7,565 | 98,131 | 2,746 | 31,022 |
| Redemptions | (49,178) | (622,056) | (37,246) | (430,882) |
| Net increase | 15,711 | 238,063 | 32,948 | 390,542 |
| Class B(a) | | | | |
| Subscriptions | 269 | 3,352 | 18,514 | 216,717 |
| Distributions reinvested | 9,699 | 122,687 | 34,660 | 392,427 |
| Redemptions (b) | (584,355) | (7,468,460) | (560,280) | (6,543,431) |
| Net decrease | (574,387) | (7,342,421) | (507,106) | (5,934,287) |
| Class C | | | | |
| Subscriptions | 1,096,594 | 14,081,822 | 1,223,203 | 14,035,333 |
| Distributions reinvested | 440,703 | 5,654,610 | 278,739 | 3,109,704 |
| Redemptions | (1,474,614) | (18,879,666) | (1,277,999) | (14,688,342) |
| Net increase | 62,683 | 856,766 | 223,943 | 2,456,695 |
| Institutional Class(d) | | | | |
| Subscriptions | 1,844,027 | 23,781,501 | 309,403 | 3,663,467 |
| Distributions reinvested | 82,870 | 1,096,118 | 12,344 | 141,617 |
| Redemptions | (724,545) | (9,518,305) | (209,618) | (2,481,452) |
| Net increase | 1,202,352 | 15,359,314 | 112,129 | 1,323,632 |
| Institutional 2 Class(e) | | | | |
| Subscriptions | 65,592 | 856,394 | 62,924 | 728,417 |
| Distributions reinvested | 12,794 | 165,522 | 6,258 | 70,819 |
| Redemptions | (25,076) | (325,608) | (27,030) | (309,906) |
| Net increase | 53,310 | 696,308 | 42,152 | 489,330 |
| Institutional 3 Class(f) | | | | |
| Subscriptions | 183,316 | 2,292,486 | 167,020 | 1,887,192 |
| Distributions reinvested | 21,109 | 272,318 | 8,326 | 94,339 |
| Redemptions | (112,819) | (1,483,177) | (17,213) | (201,690) |
| Net increase | 91,606 | 1,081,627 | 158,133 | 1,779,841 |
| Class K | | | | |
| Subscriptions | 615 | 8,085 | 677 | 7,978 |
| Distributions reinvested | 488 | 6,447 | 278 | 3,196 |
| Redemptions | — | — | (2) | (29) |
| Net increase | 1,103 | 14,532 | 953 | 11,145 |
| Class R | | | | |
| Subscriptions | 67,393 | 890,113 | 100,385 | 1,181,008 |
| Distributions reinvested | 10,565 | 137,972 | 4,416 | 50,662 |
| Redemptions | (61,591) | (823,041) | (23,630) | (276,720) |
| Net increase | 16,367 | 205,044 | 81,171 | 954,950 |
| Total net increase (decrease) | 357,375 | 5,038,252 | (1,370,242) | (17,318,215) |
The accompanying Notes to Financial Statements are an integral part of this statement.
| 104 | Columbia Capital Allocation Portfolios | Annual Report 2018 |
Statement of Changes in Net Assets (continued)
| (a) | Effective July 17, 2017, Class B shares were automatically converted to Class A shares. |
| (b) | Includes conversions of Class B shares to Class A shares, if any. |
| (c) | Prior to November 1, 2017, Advisor Class shares were known as Class R4 shares. |
| (d) | Prior to November 1, 2017, Institutional Class shares were known as Class Z shares. |
| (e) | Prior to November 1, 2017, Institutional 2 Class shares were known as Class R5 shares. |
| (f) | Prior to November 1, 2017, Institutional 3 Class shares were known as Class Y shares. |
The accompanying Notes to Financial Statements are an integral part of this statement.
Columbia Capital Allocation Portfolios | Annual Report 2018
| 105 |
Financial Highlights
Columbia Capital Allocation Conservative Portfolio
The following table is intended to help you understand the Fund’s financial performance. Certain information reflects financial results for a single share of a class held for the periods shown. Per share net investment income (loss) amounts are calculated based on average shares outstanding during the period. Total return assumes reinvestment of all dividends and distributions, if any. Total return does not reflect payment of sales charges, if any. Total return and portfolio turnover are not annualized for periods of less than one year. The portfolio turnover rate is calculated without regard to purchase and sales transactions of short-term instruments and certain derivatives, if any. If such transactions were included, the Fund’s portfolio turnover rate may be higher.
| Year ended | Net asset value,
beginning of
period | Net
investment
income | Net
realized
and
unrealized
gain (loss) | Total from
investment
operations | Distributions
from net
investment
income | Distributions
from net
realized
gains |
| Class A |
| 1/31/2018 | $9.84 | 0.18 | 0.59 | 0.77 | (0.22) | (0.01) |
| 1/31/2017 | $9.45 | 0.15 | 0.48 | 0.63 | (0.15) | (0.09) |
| 1/31/2016 | $10.10 | 0.18 | (0.46) | (0.28) | (0.19) | (0.18) |
| 1/31/2015 | $10.34 | 0.18 | 0.35 | 0.53 | (0.19) | (0.58) |
| 1/31/2014 | $10.63 | 0.20 | 0.14 | 0.34 | (0.27) | (0.36) |
| Advisor Class(d) |
| 1/31/2018 | $9.78 | 0.21 | 0.58 | 0.79 | (0.25) | (0.01) |
| 1/31/2017 | $9.39 | 0.17 | 0.48 | 0.65 | (0.17) | (0.09) |
| 1/31/2016 | $10.04 | 0.20 | (0.45) | (0.25) | (0.22) | (0.18) |
| 1/31/2015 | $10.29 | 0.25 | 0.30 | 0.55 | (0.22) | (0.58) |
| 1/31/2014 (e) | $10.53 | 0.18 | 0.09 | 0.27 | (0.26) | (0.25) |
| Class C |
| 1/31/2018 | $9.78 | 0.10 | 0.59 | 0.69 | (0.14) | (0.01) |
| 1/31/2017 | $9.40 | 0.07 | 0.47 | 0.54 | (0.07) | (0.09) |
| 1/31/2016 | $10.05 | 0.11 | (0.46) | (0.35) | (0.12) | (0.18) |
| 1/31/2015 | $10.28 | 0.10 | 0.37 | 0.47 | (0.12) | (0.58) |
| 1/31/2014 | $10.58 | 0.12 | 0.13 | 0.25 | (0.19) | (0.36) |
| Institutional Class(g) |
| 1/31/2018 | $9.84 | 0.21 | 0.58 | 0.79 | (0.25) | (0.01) |
| 1/31/2017 | $9.45 | 0.18 | 0.47 | 0.65 | (0.17) | (0.09) |
| 1/31/2016 | $10.10 | 0.21 | (0.46) | (0.25) | (0.22) | (0.18) |
| 1/31/2015 | $10.33 | 0.20 | 0.37 | 0.57 | (0.22) | (0.58) |
| 1/31/2014 | $10.63 | 0.24 | 0.12 | 0.36 | (0.30) | (0.36) |
| Institutional 2 Class(h) |
| 1/31/2018 | $9.78 | 0.20 | 0.59 | 0.79 | (0.25) | (0.01) |
| 1/31/2017 | $9.39 | 0.18 | 0.48 | 0.66 | (0.18) | (0.09) |
| 1/31/2016 | $10.05 | 0.25 | (0.50) | (0.25) | (0.23) | (0.18) |
| 1/31/2015 | $10.29 | 0.17 | 0.40 | 0.57 | (0.23) | (0.58) |
| 1/31/2014 (i) | $10.53 | 0.18 | 0.09 | 0.27 | (0.26) | (0.25) |
| Institutional 3 Class(j) |
| 1/31/2018 | $9.77 | 0.23 | 0.56 | 0.79 | (0.25) | (0.01) |
| 1/31/2017 | $9.39 | 0.18 | 0.47 | 0.65 | (0.18) | (0.09) |
| 1/31/2016 | $10.04 | 0.20 | (0.43) | (0.23) | (0.24) | (0.18) |
| 1/31/2015 | $10.29 | 0.20 | 0.36 | 0.56 | (0.23) | (0.58) |
| 1/31/2014 (k) | $10.53 | 0.19 | 0.09 | 0.28 | (0.27) | (0.25) |
The accompanying Notes to Financial Statements are an integral part of this statement.
| 106 | Columbia Capital Allocation Portfolios | Annual Report 2018 |
Total
distributions to
shareholders | Net
asset
value,
end of
period | Total
return | Total gross
expense
ratio to
average
net assets(a) | Total net
expense
ratio to
average
net assets(a),(b) | Net investment
income
ratio to
average
net assets | Portfolio
turnover | Net
assets,
end of
period
(000’s) |
| |
| (0.23) | $10.38 | 7.90% | 0.56% | 0.56% | 1.72% | 12% | $198,471 |
| (0.24) | $9.84 | 6.67% | 0.55% | 0.55% | 1.51% | 24% | $213,725 |
| (0.37) | $9.45 | (2.81%) | 0.52% | 0.52% (c) | 1.83% | 24% | $216,423 |
| (0.77) | $10.10 | 5.24% | 0.55% | 0.55% (c) | 1.69% | 12% | $245,212 |
| (0.63) | $10.34 | 3.28% | 0.50% | 0.50% (c) | 1.91% | 22% | $263,334 |
| |
| (0.26) | $10.31 | 8.11% | 0.30% | 0.30% | 2.13% | 12% | $6,063 |
| (0.26) | $9.78 | 6.98% | 0.31% | 0.31% | 1.76% | 24% | $903 |
| (0.40) | $9.39 | (2.57%) | 0.27% | 0.27% (c) | 2.06% | 24% | $145 |
| (0.80) | $10.04 | 5.41% | 0.31% | 0.31% (c) | 2.44% | 12% | $156 |
| (0.51) | $10.29 | 2.56% | 0.23% (f) | 0.23% (c),(f) | 2.67% (f) | 22% | $2 |
| |
| (0.15) | $10.32 | 7.14% | 1.31% | 1.31% | 0.97% | 12% | $38,765 |
| (0.16) | $9.78 | 5.80% | 1.30% | 1.30% | 0.76% | 24% | $42,286 |
| (0.30) | $9.40 | (3.56%) | 1.27% | 1.27% (c) | 1.08% | 24% | $43,719 |
| (0.70) | $10.05 | 4.57% | 1.30% | 1.30% (c) | 0.95% | 12% | $47,899 |
| (0.55) | $10.28 | 2.43% | 1.26% | 1.26% (c) | 1.18% | 22% | $47,435 |
| |
| (0.26) | $10.37 | 8.06% | 0.31% | 0.31% | 2.03% | 12% | $9,559 |
| (0.26) | $9.84 | 6.94% | 0.30% | 0.30% | 1.79% | 24% | $3,974 |
| (0.40) | $9.45 | (2.56%) | 0.27% | 0.27% (c) | 2.09% | 24% | $3,046 |
| (0.80) | $10.10 | 5.60% | 0.30% | 0.30% (c) | 1.96% | 12% | $3,067 |
| (0.66) | $10.33 | 3.42% | 0.26% | 0.26% (c) | 2.26% | 22% | $2,719 |
| |
| (0.26) | $10.31 | 8.15% | 0.28% | 0.28% | 2.02% | 12% | $571 |
| (0.27) | $9.78 | 7.05% | 0.24% | 0.24% | 1.84% | 24% | $417 |
| (0.41) | $9.39 | (2.60%) | 0.21% | 0.21% | 2.66% | 24% | $322 |
| (0.81) | $10.05 | 5.60% | 0.25% | 0.25% | 1.80% | 12% | $61 |
| (0.51) | $10.29 | 2.64% | 0.12% (f) | 0.12% (f) | 2.78% (f) | 22% | $2 |
| |
| (0.26) | $10.30 | 8.22% | 0.23% | 0.23% | 2.27% | 12% | $1,385 |
| (0.27) | $9.77 | 6.99% | 0.20% | 0.20% | 1.86% | 24% | $595 |
| (0.42) | $9.39 | (2.37%) | 0.15% | 0.15% | 2.13% | 24% | $166 |
| (0.81) | $10.04 | 5.55% | 0.17% | 0.17% | 2.08% | 12% | $2 |
| (0.52) | $10.29 | 2.68% | 0.07% (f) | 0.07% (f) | 2.83% (f) | 22% | $2 |
Columbia Capital Allocation Portfolios | Annual Report 2018
| 107 |
Financial Highlights (continued)
Columbia Capital Allocation Conservative Portfolio
| Year ended | Net asset value,
beginning of
period | Net
investment
income | Net
realized
and
unrealized
gain (loss) | Total from
investment
operations | Distributions
from net
investment
income | Distributions
from net
realized
gains |
| Class K |
| 1/31/2018 | $9.74 | 0.18 | 0.58 | 0.76 | (0.22) | (0.01) |
| 1/31/2017 | $9.36 | 0.15 | 0.47 | 0.62 | (0.15) | (0.09) |
| 1/31/2016 | $10.01 | 0.19 | (0.46) | (0.27) | (0.20) | (0.18) |
| 1/31/2015 | $10.24 | 0.18 | 0.37 | 0.55 | (0.20) | (0.58) |
| 1/31/2014 | $10.54 | 0.23 | 0.12 | 0.35 | (0.29) | (0.36) |
| Class R |
| 1/31/2018 | $9.84 | 0.16 | 0.58 | 0.74 | (0.20) | (0.01) |
| 1/31/2017 | $9.45 | 0.12 | 0.48 | 0.60 | (0.12) | (0.09) |
| 1/31/2016 | $10.10 | 0.17 | (0.47) | (0.30) | (0.17) | (0.18) |
| 1/31/2015 | $10.33 | 0.15 | 0.37 | 0.52 | (0.17) | (0.58) |
| 1/31/2014 | $10.63 | 0.20 | 0.11 | 0.31 | (0.25) | (0.36) |
| Notes to Financial Highlights |
| (a) | In addition to the fees and expenses that the Fund bears directly, the Fund indirectly bears a pro rata share of the fees and expenses of any other funds in which it invests. Such indirect expenses are not included in the Fund’s reported expense ratios. |
| (b) | Total net expenses include the impact of certain fee waivers/expense reimbursements made by the Investment Manager and certain of its affiliates, if applicable. |
| (c) | The benefits derived from expense reductions had an impact of less than 0.01%. |
| (d) | Prior to November 1, 2017, Advisor Class shares were known as Class R4 shares. |
| (e) | Advisor Class shares commenced operations on June 13, 2013. Per share data and total return reflect activity from that date. |
| (f) | Annualized. |
| (g) | Prior to November 1, 2017, Institutional Class shares were known as Class Z shares. |
| (h) | Prior to November 1, 2017, Institutional 2 Class shares were known as Class R5 shares. |
| (i) | Institutional 2 Class shares commenced operations on June 13, 2013. Per share data and total return reflect activity from that date. |
| (j) | Prior to November 1, 2017, Institutional 3 Class shares were known as Class Y shares. |
| (k) | Institutional 3 Class shares commenced operations on June 13, 2013. Per share data and total return reflect activity from that date. |
The accompanying Notes to Financial Statements are an integral part of this statement.
| 108 | Columbia Capital Allocation Portfolios | Annual Report 2018 |
Total
distributions to
shareholders | Net
asset
value,
end of
period | Total
return | Total gross
expense
ratio to
average
net assets(a) | Total net
expense
ratio to
average
net assets(a),(b) | Net investment
income
ratio to
average
net assets | Portfolio
turnover | Net
assets,
end of
period
(000’s) |
| |
| (0.23) | $10.27 | 7.92% | 0.53% | 0.53% | 1.77% | 12% | $109 |
| (0.24) | $9.74 | 6.70% | 0.49% | 0.49% | 1.58% | 24% | $101 |
| (0.38) | $9.36 | (2.76%) | 0.46% | 0.46% | 1.91% | 24% | $94 |
| (0.78) | $10.01 | 5.48% | 0.47% | 0.47% | 1.79% | 12% | $96 |
| (0.65) | $10.24 | 3.35% | 0.41% | 0.41% | 2.16% | 22% | $99 |
| |
| (0.21) | $10.37 | 7.53% | 0.81% | 0.81% | 1.54% | 12% | $747 |
| (0.21) | $9.84 | 6.41% | 0.80% | 0.80% | 1.19% | 24% | $355 |
| (0.35) | $9.45 | (3.05%) | 0.77% | 0.77% (c) | 1.72% | 24% | $490 |
| (0.75) | $10.10 | 5.07% | 0.80% | 0.80% (c) | 1.46% | 12% | $206 |
| (0.61) | $10.33 | 2.94% | 0.76% | 0.76% (c) | 1.91% | 22% | $179 |
Columbia Capital Allocation Portfolios | Annual Report 2018
| 109 |
Financial Highlights
Columbia Capital Allocation Moderate Conservative Portfolio
| Year ended | Net asset value,
beginning of
period | Net
investment
income | Net
realized
and
unrealized
gain (loss) | Total from
investment
operations | Distributions
from net
investment
income | Distributions
from net
realized
gains |
| Class A |
| 1/31/2018 | $10.62 | 0.19 | 1.04 | 1.23 | (0.24) | (0.23) |
| 1/31/2017 | $10.14 | 0.17 | 0.68 | 0.85 | (0.16) | (0.21) |
| 1/31/2016 | $10.98 | 0.20 | (0.49) | (0.29) | (0.22) | (0.33) |
| 1/31/2015 | $11.37 | 0.19 | 0.51 | 0.70 | (0.23) | (0.86) |
| 1/31/2014 | $11.33 | 0.25 | 0.44 | 0.69 | (0.33) | (0.32) |
| Advisor Class(d) |
| 1/31/2018 | $10.53 | 0.23 | 1.02 | 1.25 | (0.27) | (0.23) |
| 1/31/2017 | $10.06 | 0.24 | 0.62 | 0.86 | (0.18) | (0.21) |
| 1/31/2016 | $10.89 | 0.23 | (0.48) | (0.25) | (0.25) | (0.33) |
| 1/31/2015 | $11.29 | 0.24 | 0.48 | 0.72 | (0.26) | (0.86) |
| 1/31/2014 | $11.25 | 0.27 | 0.46 | 0.73 | (0.37) | (0.32) |
| Class C |
| 1/31/2018 | $10.47 | 0.10 | 1.03 | 1.13 | (0.16) | (0.23) |
| 1/31/2017 | $10.00 | 0.09 | 0.67 | 0.76 | (0.08) | (0.21) |
| 1/31/2016 | $10.84 | 0.12 | (0.49) | (0.37) | (0.14) | (0.33) |
| 1/31/2015 | $11.23 | 0.11 | 0.50 | 0.61 | (0.14) | (0.86) |
| 1/31/2014 | $11.20 | 0.16 | 0.44 | 0.60 | (0.25) | (0.32) |
| Institutional Class(e) |
| 1/31/2018 | $10.48 | 0.22 | 1.02 | 1.24 | (0.27) | (0.23) |
| 1/31/2017 | $10.01 | 0.19 | 0.67 | 0.86 | (0.18) | (0.21) |
| 1/31/2016 | $10.85 | 0.23 | (0.49) | (0.26) | (0.25) | (0.33) |
| 1/31/2015 | $11.25 | 0.22 | 0.50 | 0.72 | (0.26) | (0.86) |
| 1/31/2014 | $11.21 | 0.28 | 0.44 | 0.72 | (0.36) | (0.32) |
| Institutional 2 Class(f) |
| 1/31/2018 | $10.52 | 0.22 | 1.03 | 1.25 | (0.27) | (0.23) |
| 1/31/2017 | $10.05 | 0.20 | 0.67 | 0.87 | (0.19) | (0.21) |
| 1/31/2016 | $10.89 | 0.30 | (0.55) | (0.25) | (0.26) | (0.33) |
| 1/31/2015 | $11.28 | 0.26 | 0.48 | 0.74 | (0.27) | (0.86) |
| 1/31/2014 | $11.25 | 0.38 | 0.35 | 0.73 | (0.38) | (0.32) |
| Institutional 3 Class(g) |
| 1/31/2018 | $10.40 | 0.23 | 1.01 | 1.24 | (0.28) | (0.23) |
| 1/31/2017 | $9.94 | 0.19 | 0.67 | 0.86 | (0.19) | (0.21) |
| 1/31/2016 | $10.77 | 0.26 | (0.50) | (0.24) | (0.26) | (0.33) |
| 1/31/2015 | $11.18 | 0.25 | 0.48 | 0.73 | (0.28) | (0.86) |
| 1/31/2014 (h) | $11.32 | 0.22 | 0.28 | 0.50 | (0.32) | (0.32) |
| Class K |
| 1/31/2018 | $10.46 | 0.14 | 1.08 | 1.22 | (0.25) | (0.23) |
| 1/31/2017 | $9.99 | 0.18 | 0.67 | 0.85 | (0.17) | (0.21) |
| 1/31/2016 | $10.82 | 0.21 | (0.48) | (0.27) | (0.23) | (0.33) |
| 1/31/2015 | $11.22 | 0.18 | 0.52 | 0.70 | (0.24) | (0.86) |
| 1/31/2014 (j) | $11.25 | 0.32 | 0.32 | 0.64 | (0.35) | (0.32) |
The accompanying Notes to Financial Statements are an integral part of this statement.
| 110 | Columbia Capital Allocation Portfolios | Annual Report 2018 |
Total
distributions to
shareholders | Net
asset
value,
end of
period | Total
return | Total gross
expense
ratio to
average
net assets(a) | Total net
expense
ratio to
average
net assets(a),(b) | Net investment
income
ratio to
average
net assets | Portfolio
turnover | Net
assets,
end of
period
(000’s) |
| |
| (0.47) | $11.38 | 11.79% | 0.48% | 0.48% (c) | 1.71% | 9% | $486,408 |
| (0.37) | $10.62 | 8.47% | 0.49% | 0.49% (c) | 1.57% | 18% | $494,948 |
| (0.55) | $10.14 | (2.78%) | 0.48% | 0.48% (c) | 1.86% | 21% | $495,849 |
| (1.09) | $10.98 | 6.23% | 0.51% | 0.51% (c) | 1.70% | 14% | $545,696 |
| (0.65) | $11.37 | 6.18% | 0.47% | 0.47% (c) | 2.15% | 30% | $553,593 |
| |
| (0.50) | $11.28 | 12.07% | 0.23% | 0.23% (c) | 2.09% | 9% | $4,592 |
| (0.39) | $10.53 | 8.71% | 0.24% | 0.24% (c) | 2.28% | 18% | $2,705 |
| (0.58) | $10.06 | (2.46%) | 0.23% | 0.23% (c) | 2.15% | 21% | $1,082 |
| (1.12) | $10.89 | 6.44% | 0.26% | 0.26% (c) | 2.19% | 14% | $966 |
| (0.69) | $11.29 | 6.52% | 0.19% | 0.19% (c) | 2.36% | 30% | $2 |
| |
| (0.39) | $11.21 | 10.92% | 1.23% | 1.23% (c) | 0.95% | 9% | $82,192 |
| (0.29) | $10.47 | 7.67% | 1.24% | 1.24% (c) | 0.83% | 18% | $87,493 |
| (0.47) | $10.00 | (3.56%) | 1.23% | 1.23% (c) | 1.12% | 21% | $85,097 |
| (1.00) | $10.84 | 5.50% | 1.26% | 1.26% (c) | 0.96% | 14% | $90,199 |
| (0.57) | $11.23 | 5.35% | 1.23% | 1.23% (c) | 1.38% | 30% | $85,756 |
| |
| (0.50) | $11.22 | 12.03% | 0.23% | 0.23% (c) | 2.00% | 9% | $28,796 |
| (0.39) | $10.48 | 8.75% | 0.24% | 0.24% (c) | 1.78% | 18% | $20,476 |
| (0.58) | $10.01 | (2.56%) | 0.23% | 0.23% (c) | 2.11% | 21% | $24,108 |
| (1.12) | $10.85 | 6.47% | 0.26% | 0.26% (c) | 1.97% | 14% | $26,084 |
| (0.68) | $11.25 | 6.49% | 0.24% | 0.24% (c) | 2.46% | 30% | $25,287 |
| |
| (0.50) | $11.27 | 12.12% | 0.21% | 0.21% | 2.01% | 9% | $2,655 |
| (0.40) | $10.52 | 8.78% | 0.18% | 0.18% | 1.93% | 18% | $2,084 |
| (0.59) | $10.05 | (2.48%) | 0.16% | 0.16% | 2.89% | 21% | $686 |
| (1.13) | $10.89 | 6.63% | 0.18% | 0.18% | 2.33% | 14% | $217 |
| (0.70) | $11.28 | 6.53% | 0.13% | 0.13% | 3.35% | 30% | $74 |
| |
| (0.51) | $11.13 | 12.12% | 0.16% | 0.16% | 2.15% | 9% | $801 |
| (0.40) | $10.40 | 8.84% | 0.13% | 0.13% | 1.83% | 18% | $409 |
| (0.59) | $9.94 | (2.38%) | 0.12% | 0.12% | 2.48% | 21% | $10 |
| (1.14) | $10.77 | 6.66% | 0.09% | 0.09% | 2.24% | 14% | $4 |
| (0.64) | $11.18 | 4.51% | 0.08% (i) | 0.08% (i) | 3.02% (i) | 30% | $2 |
| |
| (0.48) | $11.20 | 11.82% | 0.46% | 0.46% | 1.25% | 9% | $3 |
| (0.38) | $10.46 | 8.59% | 0.43% | 0.43% | 1.71% | 18% | $58 |
| (0.56) | $9.99 | (2.65%) | 0.41% | 0.41% | 1.92% | 21% | $3 |
| (1.10) | $10.82 | 6.31% | 0.41% | 0.41% | 1.53% | 14% | $3 |
| (0.67) | $11.22 | 5.72% | 0.38% (i) | 0.38% (i) | 3.10% (i) | 30% | $56 |
Columbia Capital Allocation Portfolios | Annual Report 2018
| 111 |
Financial Highlights (continued)
Columbia Capital Allocation Moderate Conservative Portfolio
| Year ended | Net asset value,
beginning of
period | Net
investment
income | Net
realized
and
unrealized
gain (loss) | Total from
investment
operations | Distributions
from net
investment
income | Distributions
from net
realized
gains |
| Class R |
| 1/31/2018 | $10.63 | 0.15 | 1.05 | 1.20 | (0.21) | (0.23) |
| 1/31/2017 | $10.16 | 0.14 | 0.67 | 0.81 | (0.13) | (0.21) |
| 1/31/2016 | $10.99 | 0.21 | (0.52) | (0.31) | (0.19) | (0.33) |
| 1/31/2015 | $11.38 | 0.17 | 0.50 | 0.67 | (0.20) | (0.86) |
| 1/31/2014 | $11.34 | 0.21 | 0.45 | 0.66 | (0.30) | (0.32) |
| Notes to Financial Highlights |
| (a) | In addition to the fees and expenses that the Fund bears directly, the Fund indirectly bears a pro rata share of the fees and expenses of any other funds in which it invests. Such indirect expenses are not included in the Fund’s reported expense ratios. |
| (b) | Total net expenses include the impact of certain fee waivers/expense reimbursements made by the Investment Manager and certain of its affiliates, if applicable. |
| (c) | The benefits derived from expense reductions had an impact of less than 0.01%. |
| (d) | Prior to November 1, 2017, Advisor Class shares were known as Class R4 shares. |
| (e) | Prior to November 1, 2017, Institutional Class shares were known as Class Z shares. |
| (f) | Prior to November 1, 2017, Institutional 2 Class shares were known as Class R5 shares. |
| (g) | Prior to November 1, 2017, Institutional 3 Class shares were known as Class Y shares. |
| (h) | Institutional 3 Class shares commenced operations on June 13, 2013. Per share data and total return reflect activity from that date. |
| (i) | Annualized. |
| (j) | Class K shares commenced operations on February 28, 2013. Per share data and total return reflect activity from that date. |
The accompanying Notes to Financial Statements are an integral part of this statement.
| 112 | Columbia Capital Allocation Portfolios | Annual Report 2018 |
Total
distributions to
shareholders | Net
asset
value,
end of
period | Total
return | Total gross
expense
ratio to
average
net assets(a) | Total net
expense
ratio to
average
net assets(a),(b) | Net investment
income
ratio to
average
net assets | Portfolio
turnover | Net
assets,
end of
period
(000’s) |
| |
| (0.44) | $11.39 | 11.50% | 0.73% | 0.73% (c) | 1.40% | 9% | $1,924 |
| (0.34) | $10.63 | 8.09% | 0.73% | 0.73% (c) | 1.30% | 18% | $2,549 |
| (0.52) | $10.16 | (2.93%) | 0.73% | 0.73% (c) | 1.92% | 21% | $5,007 |
| (1.06) | $10.99 | 5.95% | 0.76% | 0.76% (c) | 1.46% | 14% | $2,230 |
| (0.62) | $11.38 | 5.87% | 0.74% | 0.74% (c) | 1.85% | 30% | $2,243 |
Columbia Capital Allocation Portfolios | Annual Report 2018
| 113 |
Financial Highlights
Columbia Capital Allocation Moderate Portfolio
| Year ended | Net asset value,
beginning of
period | Net
investment
income | Net
realized
and
unrealized
gain (loss) | Total from
investment
operations | Distributions
from net
investment
income | Distributions
from net
realized
gains |
| Class A |
| 1/31/2018 | $10.99 | 0.19 | 1.56 | 1.75 | (0.23) | (0.52) |
| 1/31/2017 | $10.34 | 0.18 | 0.95 | 1.13 | (0.21) | (0.27) |
| 1/31/2016 | $11.50 | 0.19 | (0.49) | (0.30) | (0.22) | (0.64) |
| 1/31/2015 | $12.00 | 0.18 | 0.63 | 0.81 | (0.24) | (1.07) |
| 1/31/2014 | $11.61 | 0.20 | 0.86 | 1.06 | (0.31) | (0.36) |
| Advisor Class(d) |
| 1/31/2018 | $10.87 | 0.30 | 1.46 | 1.76 | (0.26) | (0.52) |
| 1/31/2017 | $10.24 | 0.21 | 0.93 | 1.14 | (0.24) | (0.27) |
| 1/31/2016 | $11.39 | 0.28 | (0.54) | (0.26) | (0.25) | (0.64) |
| 1/31/2015 | $11.90 | 0.26 | 0.57 | 0.83 | (0.27) | (1.07) |
| 1/31/2014 (e) | $11.82 | 0.18 | 0.53 | 0.71 | (0.27) | (0.36) |
| Class C |
| 1/31/2018 | $10.91 | 0.11 | 1.54 | 1.65 | (0.15) | (0.52) |
| 1/31/2017 | $10.27 | 0.10 | 0.94 | 1.04 | (0.13) | (0.27) |
| 1/31/2016 | $11.41 | 0.11 | (0.47) | (0.36) | (0.14) | (0.64) |
| 1/31/2015 | $11.92 | 0.09 | 0.62 | 0.71 | (0.15) | (1.07) |
| 1/31/2014 | $11.53 | 0.11 | 0.86 | 0.97 | (0.22) | (0.36) |
| Institutional Class(g) |
| 1/31/2018 | $10.98 | 0.24 | 1.53 | 1.77 | (0.26) | (0.52) |
| 1/31/2017 | $10.33 | 0.22 | 0.94 | 1.16 | (0.24) | (0.27) |
| 1/31/2016 | $11.49 | 0.22 | (0.49) | (0.27) | (0.25) | (0.64) |
| 1/31/2015 | $11.99 | 0.21 | 0.63 | 0.84 | (0.27) | (1.07) |
| 1/31/2014 | $11.59 | 0.23 | 0.87 | 1.10 | (0.34) | (0.36) |
| Institutional 2 Class(h) |
| 1/31/2018 | $10.87 | 0.22 | 1.54 | 1.76 | (0.27) | (0.52) |
| 1/31/2017 | $10.23 | 0.21 | 0.94 | 1.15 | (0.24) | (0.27) |
| 1/31/2016 | $11.39 | 0.51 | (0.77) | (0.26) | (0.26) | (0.64) |
| 1/31/2015 | $11.90 | 0.39 | 0.46 | 0.85 | (0.29) | (1.07) |
| 1/31/2014 (i) | $11.82 | 0.19 | 0.53 | 0.72 | (0.28) | (0.36) |
| Institutional 3 Class(j) |
| 1/31/2018 | $10.87 | 0.24 | 1.52 | 1.76 | (0.27) | (0.52) |
| 1/31/2017 | $10.23 | 0.23 | 0.93 | 1.16 | (0.25) | (0.27) |
| 1/31/2016 | $11.38 | 0.16 | (0.40) | (0.24) | (0.27) | (0.64) |
| 1/31/2015 | $11.90 | 0.23 | 0.61 | 0.84 | (0.29) | (1.07) |
| 1/31/2014 (k) | $11.82 | 0.19 | 0.54 | 0.73 | (0.29) | (0.36) |
| Class K |
| 1/31/2018 | $10.98 | 0.21 | 1.54 | 1.75 | (0.24) | (0.52) |
| 1/31/2017 | $10.33 | 0.15 | 0.99 | 1.14 | (0.22) | (0.27) |
| 1/31/2016 | $11.49 | 0.20 | (0.49) | (0.29) | (0.23) | (0.64) |
| 1/31/2015 | $11.99 | 0.19 | 0.63 | 0.82 | (0.25) | (1.07) |
| 1/31/2014 | $11.60 | 0.21 | 0.86 | 1.07 | (0.32) | (0.36) |
The accompanying Notes to Financial Statements are an integral part of this statement.
| 114 | Columbia Capital Allocation Portfolios | Annual Report 2018 |
Total
distributions to
shareholders | Net
asset
value,
end of
period | Total
return | Total gross
expense
ratio to
average
net assets(a) | Total net
expense
ratio to
average
net assets(a),(b) | Net investment
income
ratio to
average
net assets | Portfolio
turnover | Net
assets,
end of
period
(000’s) |
| |
| (0.75) | $11.99 | 16.39% | 0.44% | 0.44% (c) | 1.68% | 9% | $1,389,747 |
| (0.48) | $10.99 | 11.19% | 0.44% | 0.44% (c) | 1.64% | 10% | $1,309,998 |
| (0.86) | $10.34 | (2.89%) | 0.46% | 0.46% (c) | 1.68% | 17% | $1,295,482 |
| (1.31) | $11.50 | 6.77% | 0.48% | 0.48% (c) | 1.49% | 16% | $1,437,972 |
| (0.67) | $12.00 | 9.26% | 0.46% | 0.46% (c) | 1.64% | 23% | $1,425,904 |
| |
| (0.78) | $11.85 | 16.68% | 0.18% | 0.18% (c) | 2.60% | 9% | $1,021 |
| (0.51) | $10.87 | 11.39% | 0.19% | 0.19% (c) | 1.98% | 10% | $355 |
| (0.89) | $10.24 | (2.58%) | 0.21% | 0.21% (c) | 2.61% | 17% | $202 |
| (1.34) | $11.39 | 7.06% | 0.23% | 0.23% (c) | 2.22% | 16% | $29 |
| (0.63) | $11.90 | 6.11% | 0.21% (f) | 0.21% (c),(f) | 2.36% (f) | 23% | $3 |
| |
| (0.67) | $11.89 | 15.46% | 1.19% | 1.19% (c) | 0.95% | 9% | $207,421 |
| (0.40) | $10.91 | 10.34% | 1.19% | 1.19% (c) | 0.90% | 10% | $186,170 |
| (0.78) | $10.27 | (3.48%) | 1.21% | 1.21% (c) | 0.95% | 17% | $178,548 |
| (1.22) | $11.41 | 5.92% | 1.23% | 1.23% (c) | 0.77% | 16% | $180,143 |
| (0.58) | $11.92 | 8.51% | 1.21% | 1.21% (c) | 0.92% | 23% | $162,357 |
| |
| (0.78) | $11.97 | 16.60% | 0.19% | 0.19% (c) | 2.09% | 9% | $39,872 |
| (0.51) | $10.98 | 11.48% | 0.19% | 0.19% (c) | 2.02% | 10% | $4,598 |
| (0.89) | $10.33 | (2.65%) | 0.21% | 0.21% (c) | 1.92% | 17% | $2,443 |
| (1.34) | $11.49 | 7.05% | 0.23% | 0.23% (c) | 1.77% | 16% | $2,989 |
| (0.70) | $11.99 | 9.65% | 0.21% | 0.21% (c) | 1.90% | 23% | $3,352 |
| |
| (0.79) | $11.84 | 16.62% | 0.16% | 0.16% | 1.95% | 9% | $7,323 |
| (0.51) | $10.87 | 11.55% | 0.14% | 0.14% | 1.94% | 10% | $5,521 |
| (0.90) | $10.23 | (2.61%) | 0.15% | 0.15% | 4.80% | 17% | $3,803 |
| (1.36) | $11.39 | 7.21% | 0.16% | 0.16% | 3.39% | 16% | $78 |
| (0.64) | $11.90 | 6.21% | 0.11% (f) | 0.11% (f) | 2.51% (f) | 23% | $3 |
| |
| (0.79) | $11.84 | 16.68% | 0.12% | 0.12% | 2.11% | 9% | $4,933 |
| (0.52) | $10.87 | 11.61% | 0.09% | 0.09% | 2.15% | 10% | $3,459 |
| (0.91) | $10.23 | (2.42%) | 0.09% | 0.09% | 1.59% | 17% | $368 |
| (1.36) | $11.38 | 7.16% | 0.06% | 0.06% | 1.92% | 16% | $2 |
| (0.65) | $11.90 | 6.25% | 0.07% (f) | 0.07% (f) | 2.56% (f) | 23% | $3 |
| |
| (0.76) | $11.97 | 16.35% | 0.41% | 0.41% | 1.82% | 9% | $138 |
| (0.49) | $10.98 | 11.26% | 0.39% | 0.39% | 1.43% | 10% | $87 |
| (0.87) | $10.33 | (2.83%) | 0.40% | 0.40% | 1.76% | 17% | $291 |
| (1.32) | $11.49 | 6.88% | 0.40% | 0.40% | 1.55% | 16% | $292 |
| (0.68) | $11.99 | 9.39% | 0.36% | 0.36% | 1.77% | 23% | $359 |
Columbia Capital Allocation Portfolios | Annual Report 2018
| 115 |
Financial Highlights (continued)
Columbia Capital Allocation Moderate Portfolio
| Year ended | Net asset value,
beginning of
period | Net
investment
income | Net
realized
and
unrealized
gain (loss) | Total from
investment
operations | Distributions
from net
investment
income | Distributions
from net
realized
gains |
| Class R |
| 1/31/2018 | $10.96 | 0.17 | 1.55 | 1.72 | (0.21) | (0.52) |
| 1/31/2017 | $10.32 | 0.16 | 0.93 | 1.09 | (0.18) | (0.27) |
| 1/31/2016 | $11.47 | 0.16 | (0.47) | (0.31) | (0.20) | (0.64) |
| 1/31/2015 | $11.97 | 0.15 | 0.63 | 0.78 | (0.21) | (1.07) |
| 1/31/2014 | $11.58 | 0.23 | 0.80 | 1.03 | (0.28) | (0.36) |
| Notes to Financial Highlights |
| (a) | In addition to the fees and expenses that the Fund bears directly, the Fund indirectly bears a pro rata share of the fees and expenses of the underlying funds in which the Fund invests. Such indirect expenses are not included in the Fund’s reported expense ratios. |
| (b) | Total net expenses include the impact of certain fee waivers/expense reimbursements made by the Investment Manager and certain of its affiliates, if applicable. |
| (c) | The benefits derived from expense reductions had an impact of less than 0.01%. |
| (d) | Prior to November 1, 2017, Advisor Class shares were known as Class R4 shares. |
| (e) | Advisor Class shares commenced operations on June 13, 2013. Per share data and total return reflect activity from that date. |
| (f) | Annualized. |
| (g) | Prior to November 1, 2017, Institutional Class shares were known as Class Z shares. |
| (h) | Prior to November 1, 2017, Institutional 2 Class shares were known as Class R5 shares. |
| (i) | Institutional 2 Class shares commenced operations on June 13, 2013. Per share data and total return reflect activity from that date. |
| (j) | Prior to November 1, 2017, Institutional 3 Class shares were known as Class Y shares. |
| (k) | Institutional 3 Class shares commenced operations on June 13, 2013. Per share data and total return reflect activity from that date. |
The accompanying Notes to Financial Statements are an integral part of this statement.
| 116 | Columbia Capital Allocation Portfolios | Annual Report 2018 |
Total
distributions to
shareholders | Net
asset
value,
end of
period | Total
return | Total gross
expense
ratio to
average
net assets(a) | Total net
expense
ratio to
average
net assets(a),(b) | Net investment
income
ratio to
average
net assets | Portfolio
turnover | Net
assets,
end of
period
(000’s) |
| |
| (0.73) | $11.95 | 16.05% | 0.69% | 0.69% (c) | 1.46% | 9% | $2,786 |
| (0.45) | $10.96 | 10.84% | 0.69% | 0.69% (c) | 1.48% | 10% | $2,282 |
| (0.84) | $10.32 | (3.06%) | 0.71% | 0.71% (c) | 1.37% | 17% | $1,342 |
| (1.28) | $11.47 | 6.52% | 0.73% | 0.73% (c) | 1.29% | 16% | $1,610 |
| (0.64) | $11.97 | 9.02% | 0.72% | 0.72% (c) | 1.92% | 23% | $1,147 |
Columbia Capital Allocation Portfolios | Annual Report 2018
| 117 |
Financial Highlights
Columbia Capital Allocation Moderate Aggressive Portfolio
| Year ended | Net asset value,
beginning of
period | Net
investment
income | Net
realized
and
unrealized
gain (loss) | Total from
investment
operations | Distributions
from net
investment
income | Distributions
from net
realized
gains |
| Class A |
| 1/31/2018 | $12.00 | 0.17 | 2.27 | 2.44 | (0.21) | (0.73) |
| 1/31/2017 | $11.15 | 0.15 | 1.30 | 1.45 | (0.16) | (0.44) |
| 1/31/2016 | $12.45 | 0.18 | (0.55) | (0.37) | (0.22) | (0.71) |
| 1/31/2015 | $13.01 | 0.16 | 0.76 | 0.92 | (0.25) | (1.23) |
| 1/31/2014 | $12.04 | 0.18 | 1.21 | 1.39 | (0.25) | (0.17) |
| Advisor Class(e) |
| 1/31/2018 | $12.10 | 0.24 | 2.24 | 2.48 | (0.24) | (0.73) |
| 1/31/2017 | $11.23 | 0.19 | 1.30 | 1.49 | (0.18) | (0.44) |
| 1/31/2016 | $12.54 | 0.21 | (0.56) | (0.35) | (0.25) | (0.71) |
| 1/31/2015 | $13.08 | 0.53 | 0.44 | 0.97 | (0.28) | (1.23) |
| 1/31/2014 | $12.11 | 0.18 | 1.25 | 1.43 | (0.29) | (0.17) |
| Class C |
| 1/31/2018 | $12.04 | 0.08 | 2.26 | 2.34 | (0.13) | (0.73) |
| 1/31/2017 | $11.21 | 0.07 | 1.29 | 1.36 | (0.09) | (0.44) |
| 1/31/2016 | $12.51 | 0.09 | (0.55) | (0.46) | (0.13) | (0.71) |
| 1/31/2015 | $13.07 | 0.06 | 0.77 | 0.83 | (0.16) | (1.23) |
| 1/31/2014 | $12.11 | 0.08 | 1.21 | 1.29 | (0.16) | (0.17) |
| Institutional Class(f) |
| 1/31/2018 | $11.98 | 0.20 | 2.26 | 2.46 | (0.24) | (0.73) |
| 1/31/2017 | $11.13 | 0.18 | 1.29 | 1.47 | (0.18) | (0.44) |
| 1/31/2016 | $12.44 | 0.21 | (0.56) | (0.35) | (0.25) | (0.71) |
| 1/31/2015 | $12.99 | 0.19 | 0.77 | 0.96 | (0.28) | (1.23) |
| 1/31/2014 | $12.03 | 0.19 | 1.23 | 1.42 | (0.29) | (0.17) |
| Institutional 2 Class(g) |
| 1/31/2018 | $12.09 | 0.23 | 2.26 | 2.49 | (0.25) | (0.73) |
| 1/31/2017 | $11.23 | 0.20 | 1.30 | 1.50 | (0.20) | (0.44) |
| 1/31/2016 | $12.53 | 0.38 | (0.71) | (0.33) | (0.26) | (0.71) |
| 1/31/2015 | $13.08 | 0.21 | 0.77 | 0.98 | (0.30) | (1.23) |
| 1/31/2014 | $12.11 | 0.33 | 1.12 | 1.45 | (0.31) | (0.17) |
| Institutional 3 Class(h) |
| 1/31/2018 | $11.84 | 0.31 | 2.13 | 2.44 | (0.25) | (0.73) |
| 1/31/2017 | $11.01 | 0.21 | 1.26 | 1.47 | (0.20) | (0.44) |
| 1/31/2016 | $12.31 | 0.13 | (0.45) | (0.32) | (0.27) | (0.71) |
| 1/31/2015 | $12.87 | 0.21 | 0.76 | 0.97 | (0.30) | (1.23) |
| 1/31/2014 (i) | $12.35 | 0.18 | 0.78 | 0.96 | (0.27) | (0.17) |
| Class K |
| 1/31/2018 | $11.95 | 0.19 | 2.25 | 2.44 | (0.22) | (0.73) |
| 1/31/2017 | $11.12 | 0.09 | 1.35 | 1.44 | (0.17) | (0.44) |
| 1/31/2016 | $12.42 | 0.19 | (0.55) | (0.36) | (0.23) | (0.71) |
| 1/31/2015 | $12.98 | 0.18 | 0.75 | 0.93 | (0.26) | (1.23) |
| 1/31/2014 (k) | $12.07 | 0.18 | 1.17 | 1.35 | (0.27) | (0.17) |
The accompanying Notes to Financial Statements are an integral part of this statement.
| 118 | Columbia Capital Allocation Portfolios | Annual Report 2018 |
Total
distributions to
shareholders | Net
asset
value,
end of
period | Total
return | Total gross
expense
ratio to
average
net assets(a) | Total net
expense
ratio to
average
net assets(a),(b) | Net investment
income
ratio to
average
net assets | Portfolio
turnover | Net
assets,
end of
period
(000’s) |
| |
| (0.94) | $13.50 | 20.88% | 0.49% | 0.49% (c) | 1.35% | 9% | $1,826,698 |
| (0.60) | $12.00 | 13.24% | 0.47% (d) | 0.47% (c),(d) | 1.30% | 9% | $1,671,442 |
| (0.93) | $11.15 | (3.42%) | 0.52% | 0.52% (c) | 1.42% | 16% | $1,646,276 |
| (1.48) | $12.45 | 7.03% | 0.52% | 0.52% (c) | 1.22% | 20% | $1,815,185 |
| (0.42) | $13.01 | 11.67% | 0.50% | 0.50% (c) | 1.38% | 22% | $1,805,239 |
| |
| (0.97) | $13.61 | 21.09% | 0.24% | 0.24% (c) | 1.86% | 9% | $11,216 |
| (0.62) | $12.10 | 13.61% | 0.22% (d) | 0.22% (c),(d) | 1.62% | 9% | $2,128 |
| (0.96) | $11.23 | (3.23%) | 0.27% | 0.27% (c) | 1.72% | 16% | $1,119 |
| (1.51) | $12.54 | 7.41% | 0.29% | 0.29% (c) | 4.16% | 20% | $1,054 |
| (0.46) | $13.08 | 11.95% | 0.22% | 0.22% (c) | 1.39% | 22% | $7 |
| |
| (0.86) | $13.52 | 19.91% | 1.24% | 1.24% (c) | 0.59% | 9% | $215,268 |
| (0.53) | $12.04 | 12.36% | 1.22% (d) | 1.22% (c),(d) | 0.55% | 9% | $216,271 |
| (0.84) | $11.21 | (4.08%) | 1.27% | 1.27% (c) | 0.69% | 16% | $206,181 |
| (1.39) | $12.51 | 6.30% | 1.27% | 1.27% (c) | 0.49% | 20% | $213,166 |
| (0.33) | $13.07 | 10.71% | 1.25% | 1.25% (c) | 0.63% | 22% | $198,837 |
| |
| (0.97) | $13.47 | 21.13% | 0.24% | 0.24% (c) | 1.59% | 9% | $136,761 |
| (0.62) | $11.98 | 13.55% | 0.22% (d) | 0.22% (c),(d) | 1.55% | 9% | $119,833 |
| (0.96) | $11.13 | (3.26%) | 0.27% | 0.27% (c) | 1.67% | 16% | $113,846 |
| (1.51) | $12.44 | 7.40% | 0.27% | 0.27% (c) | 1.47% | 20% | $128,314 |
| (0.46) | $12.99 | 11.87% | 0.25% | 0.25% (c) | 1.49% | 22% | $128,234 |
| |
| (0.98) | $13.60 | 21.18% | 0.19% | 0.19% | 1.80% | 9% | $8,881 |
| (0.64) | $12.09 | 13.63% | 0.13% (d) | 0.13% (d) | 1.68% | 9% | $5,706 |
| (0.97) | $11.23 | (3.05%) | 0.17% | 0.17% | 3.15% | 16% | $3,537 |
| (1.53) | $12.53 | 7.46% | 0.16% | 0.16% | 1.62% | 20% | $648 |
| (0.48) | $13.08 | 12.07% | 0.18% | 0.18% | 2.56% | 22% | $577 |
| |
| (0.98) | $13.30 | 21.26% | 0.14% | 0.14% | 2.47% | 9% | $20,776 |
| (0.64) | $11.84 | 13.68% | 0.07% (d) | 0.07% (d) | 1.81% | 9% | $1,128 |
| (0.98) | $11.01 | (3.09%) | 0.12% | 0.12% | 1.16% | 16% | $379 |
| (1.53) | $12.31 | 7.58% | 0.09% | 0.09% | 1.64% | 20% | $2 |
| (0.44) | $12.87 | 7.88% | 0.07% (j) | 0.07% (j) | 2.22% (j) | 22% | $3 |
| |
| (0.95) | $13.44 | 21.00% | 0.44% | 0.44% | 1.41% | 9% | $3 |
| (0.61) | $11.95 | 13.21% | 0.42% (d) | 0.42% (d) | 0.80% | 9% | $2 |
| (0.94) | $11.12 | (3.32%) | 0.41% | 0.41% | 1.53% | 16% | $90 |
| (1.49) | $12.42 | 7.17% | 0.41% | 0.41% | 1.34% | 20% | $98 |
| (0.44) | $12.98 | 11.31% | 0.38% (j) | 0.38% (j) | 1.57% (j) | 22% | $105 |
Columbia Capital Allocation Portfolios | Annual Report 2018
| 119 |
Financial Highlights (continued)
Columbia Capital Allocation Moderate Aggressive Portfolio
| Year ended | Net asset value,
beginning of
period | Net
investment
income | Net
realized
and
unrealized
gain (loss) | Total from
investment
operations | Distributions
from net
investment
income | Distributions
from net
realized
gains |
| Class R |
| 1/31/2018 | $11.99 | 0.15 | 2.24 | 2.39 | (0.17) | (0.73) |
| 1/31/2017 | $11.14 | 0.13 | 1.29 | 1.42 | (0.13) | (0.44) |
| 1/31/2016 | $12.44 | 0.14 | (0.54) | (0.40) | (0.19) | (0.71) |
| 1/31/2015 | $12.99 | 0.13 | 0.76 | 0.89 | (0.21) | (1.23) |
| 1/31/2014 | $12.03 | 0.13 | 1.22 | 1.35 | (0.22) | (0.17) |
| Class V(l) |
| 1/31/2018 | $12.00 | 0.17 | 2.27 | 2.44 | (0.21) | (0.73) |
| 1/31/2017 | $11.15 | 0.15 | 1.30 | 1.45 | (0.16) | (0.44) |
| 1/31/2016 | $12.45 | 0.18 | (0.55) | (0.37) | (0.22) | (0.71) |
| 1/31/2015 | $13.00 | 0.16 | 0.76 | 0.92 | (0.24) | (1.23) |
| 1/31/2014 | $12.04 | 0.16 | 1.22 | 1.38 | (0.25) | (0.17) |
| Notes to Financial Highlights |
| (a) | In addition to the fees and expenses that the Fund bears directly, the Fund indirectly bears a pro rata share of the fees and expenses of any other funds in which it invests. Such indirect expenses are not included in the Fund’s reported expense ratios. |
| (b) | Total net expenses include the impact of certain fee waivers/expense reimbursements made by the Investment Manager and certain of its affiliates, if applicable. |
| (c) | The benefits derived from expense reductions had an impact of less than 0.01%. |
| (d) | Expenses have been reduced due to a reimbursement of expenses overbilled by a third party. If the reimbursement had been excluded, the expense ratios would have been higher by the percentages shown for each class in the table below. All fee waivers and expense reimbursements by the Investment Manager and its affiliates were applied before giving effect to this third party reimbursement. |
| Year ended | Class A | Advisor
Class | Class C | Institutional
Class | Institutional 2
Class | Institutional 3
Class | Class K | Class R | Class V |
| 01/31/2017 | 0.04 % | 0.04 % | 0.04 % | 0.04 % | 0.04 % | 0.05 % | 0.01 % | 0.04 % | 0.04 % |
| (e) | Prior to November 1, 2017, Advisor Class shares were known as Class R4 shares. |
| (f) | Prior to November 1, 2017, Institutional Class shares were known as Class Z shares. |
| (g) | Prior to November 1, 2017, Institutional 2 Class shares were known as Class R5 shares. |
| (h) | Prior to November 1, 2017, Institutional 3 Class shares were known as Class Y shares. |
| (i) | Institutional 3 Class shares commenced operations on June 13, 2013. Per share data and total return reflect activity from that date. |
| (j) | Annualized. |
| (k) | Class K shares commenced operations on February 28, 2013. Per share data and total return reflect activity from that date. |
| (l) | Prior to January 24, 2017, Class V shares were known as Class T shares. |
The accompanying Notes to Financial Statements are an integral part of this statement.
| 120 | Columbia Capital Allocation Portfolios | Annual Report 2018 |
Total
distributions to
shareholders | Net
asset
value,
end of
period | Total
return | Total gross
expense
ratio to
average
net assets(a) | Total net
expense
ratio to
average
net assets(a),(b) | Net investment
income
ratio to
average
net assets | Portfolio
turnover | Net
assets,
end of
period
(000’s) |
| |
| (0.90) | $13.48 | 20.51% | 0.74% | 0.74% (c) | 1.14% | 9% | $4,816 |
| (0.57) | $11.99 | 12.97% | 0.72% (d) | 0.72% (c),(d) | 1.10% | 9% | $3,743 |
| (0.90) | $11.14 | (3.67%) | 0.77% | 0.77% (c) | 1.11% | 16% | $3,556 |
| (1.44) | $12.44 | 6.86% | 0.77% | 0.77% (c) | 1.01% | 20% | $4,270 |
| (0.39) | $12.99 | 11.31% | 0.75% | 0.75% (c) | 1.02% | 22% | $4,347 |
| |
| (0.94) | $13.50 | 20.88% | 0.49% | 0.49% (c) | 1.35% | 9% | $93,279 |
| (0.60) | $12.00 | 13.24% | 0.47% (d) | 0.47% (c),(d) | 1.30% | 9% | $86,404 |
| (0.93) | $11.15 | (3.42%) | 0.52% | 0.52% (c) | 1.42% | 16% | $85,135 |
| (1.47) | $12.45 | 7.07% | 0.56% | 0.54% (c) | 1.20% | 20% | $97,408 |
| (0.42) | $13.00 | 11.52% | 0.55% | 0.55% (c) | 1.24% | 22% | $101,766 |
Columbia Capital Allocation Portfolios | Annual Report 2018
| 121 |
Financial Highlights
Columbia Capital Allocation Aggressive Portfolio
| Year ended | Net asset value,
beginning of
period | Net
investment
income | Net
realized
and
unrealized
gain (loss) | Total from
investment
operations | Distributions
from net
investment
income | Distributions
from net
realized
gains |
| Class A |
| 1/31/2018 | $12.11 | 0.14 | 2.85 | 2.99 | (0.20) | (0.80) |
| 1/31/2017 | $11.08 | 0.13 | 1.49 | 1.62 | (0.14) | (0.45) |
| 1/31/2016 | $12.54 | 0.15 | (0.57) | (0.42) | (0.19) | (0.85) |
| 1/31/2015 | $12.82 | 0.12 | 0.86 | 0.98 | (0.30) | (0.96) |
| 1/31/2014 | $11.41 | 0.12 | 1.53 | 1.65 | (0.24) | — |
| Advisor Class(d) |
| 1/31/2018 | $11.89 | 0.14 | 2.83 | 2.97 | (0.23) | (0.80) |
| 1/31/2017 | $10.89 | 0.15 | 1.46 | 1.61 | (0.16) | (0.45) |
| 1/31/2016 | $12.34 | 0.24 | (0.61) | (0.37) | (0.23) | (0.85) |
| 1/31/2015 | $12.63 | 0.54 | 0.46 | 1.00 | (0.33) | (0.96) |
| 1/31/2014 (e) | $11.82 | 0.20 | 0.88 | 1.08 | (0.27) | — |
| Class C |
| 1/31/2018 | $11.85 | 0.04 | 2.79 | 2.83 | (0.11) | (0.80) |
| 1/31/2017 | $10.87 | 0.04 | 1.45 | 1.49 | (0.06) | (0.45) |
| 1/31/2016 | $12.32 | 0.06 | (0.55) | (0.49) | (0.11) | (0.85) |
| 1/31/2015 | $12.62 | 0.03 | 0.83 | 0.86 | (0.20) | (0.96) |
| 1/31/2014 | $11.24 | 0.03 | 1.50 | 1.53 | (0.15) | — |
| Institutional Class(g) |
| 1/31/2018 | $12.06 | 0.22 | 2.79 | 3.01 | (0.23) | (0.80) |
| 1/31/2017 | $11.03 | 0.16 | 1.48 | 1.64 | (0.16) | (0.45) |
| 1/31/2016 | $12.49 | 0.19 | (0.58) | (0.39) | (0.22) | (0.85) |
| 1/31/2015 | $12.78 | 0.17 | 0.83 | 1.00 | (0.33) | (0.96) |
| 1/31/2014 | $11.36 | 0.19 | 1.50 | 1.69 | (0.27) | — |
| Institutional 2 Class(h) |
| 1/31/2018 | $11.88 | 0.19 | 2.79 | 2.98 | (0.24) | (0.80) |
| 1/31/2017 | $10.88 | 0.17 | 1.45 | 1.62 | (0.17) | (0.45) |
| 1/31/2016 | $12.33 | 0.31 | (0.68) | (0.37) | (0.23) | (0.85) |
| 1/31/2015 | $12.63 | 0.16 | 0.85 | 1.01 | (0.35) | (0.96) |
| 1/31/2014 (i) | $11.82 | 0.04 | 1.06 | 1.10 | (0.29) | — |
| Institutional 3 Class(j) |
| 1/31/2018 | $11.88 | 0.18 | 2.80 | 2.98 | (0.24) | (0.80) |
| 1/31/2017 | $10.87 | 0.19 | 1.45 | 1.64 | (0.18) | (0.45) |
| 1/31/2016 | $12.32 | 0.08 | (0.44) | (0.36) | (0.24) | (0.85) |
| 1/31/2015 | $12.62 | 0.17 | 0.84 | 1.01 | (0.35) | (0.96) |
| 1/31/2014 (k) | $11.82 | 0.15 | 0.95 | 1.10 | (0.30) | — |
The accompanying Notes to Financial Statements are an integral part of this statement.
| 122 | Columbia Capital Allocation Portfolios | Annual Report 2018 |
Total
distributions to
shareholders | Net
asset
value,
end of
period | Total
return | Total gross
expense
ratio to
average
net assets(a) | Total net
expense
ratio to
average
net assets(a),(b) | Net investment
income
ratio to
average
net assets | Portfolio
turnover | Net
assets,
end of
period
(000’s) |
| |
| (1.00) | $14.10 | 25.45% | 0.49% | 0.49% (c) | 1.08% | 13% | $670,783 |
| (0.59) | $12.11 | 14.95% | 0.50% | 0.50% (c) | 1.06% | 12% | $582,182 |
| (1.04) | $11.08 | (3.92%) | 0.51% | 0.51% (c) | 1.18% | 12% | $549,678 |
| (1.26) | $12.54 | 7.50% | 0.54% | 0.54% (c) | 0.92% | 27% | $577,868 |
| (0.24) | $12.82 | 14.41% | 0.52% | 0.52% (c) | 0.98% | 29% | $554,189 |
| |
| (1.03) | $13.83 | 25.76% | 0.23% | 0.23% (c) | 1.10% | 13% | $1,662 |
| (0.61) | $11.89 | 15.20% | 0.25% | 0.25% (c) | 1.27% | 12% | $1,242 |
| (1.08) | $10.89 | (3.65%) | 0.26% | 0.26% (c) | 1.97% | 12% | $779 |
| (1.29) | $12.34 | 7.78% | 0.28% | 0.28% (c) | 4.28% | 27% | $497 |
| (0.27) | $12.63 | 9.08% | 0.29% (f) | 0.29% (c),(f) | 2.54% (f) | 29% | $26 |
| |
| (0.91) | $13.77 | 24.61% | 1.24% | 1.24% (c) | 0.34% | 13% | $88,717 |
| (0.51) | $11.85 | 14.01% | 1.25% | 1.25% (c) | 0.33% | 12% | $75,648 |
| (0.96) | $10.87 | (4.60%) | 1.25% | 1.25% (c) | 0.46% | 12% | $66,938 |
| (1.16) | $12.32 | 6.66% | 1.29% | 1.29% (c) | 0.22% | 27% | $62,488 |
| (0.15) | $12.62 | 13.56% | 1.27% | 1.27% (c) | 0.27% | 29% | $50,676 |
| |
| (1.03) | $14.04 | 25.73% | 0.23% | 0.23% (c) | 1.67% | 13% | $20,763 |
| (0.61) | $12.06 | 15.27% | 0.25% | 0.25% (c) | 1.39% | 12% | $3,329 |
| (1.07) | $11.03 | (3.69%) | 0.26% | 0.26% (c) | 1.55% | 12% | $1,809 |
| (1.29) | $12.49 | 7.70% | 0.29% | 0.29% (c) | 1.30% | 27% | $1,433 |
| (0.27) | $12.78 | 14.82% | 0.28% | 0.28% (c) | 1.51% | 29% | $951 |
| |
| (1.04) | $13.82 | 25.83% | 0.20% | 0.20% | 1.44% | 13% | $2,642 |
| (0.62) | $11.88 | 15.28% | 0.18% | 0.18% | 1.49% | 12% | $1,638 |
| (1.08) | $10.88 | (3.58%) | 0.18% | 0.18% | 2.61% | 12% | $1,041 |
| (1.31) | $12.33 | 7.83% | 0.18% | 0.18% | 1.22% | 27% | $381 |
| (0.29) | $12.63 | 9.27% | 0.19% (f) | 0.19% (f) | 0.47% (f) | 29% | $385 |
| |
| (1.04) | $13.82 | 25.89% | 0.14% | 0.14% | 1.40% | 13% | $3,722 |
| (0.63) | $11.88 | 15.44% | 0.13% | 0.13% | 1.66% | 12% | $2,111 |
| (1.09) | $10.87 | (3.54%) | 0.15% | 0.15% | 0.69% | 12% | $214 |
| (1.31) | $12.32 | 7.88% | 0.14% | 0.14% | 1.30% | 27% | $2 |
| (0.30) | $12.62 | 9.23% | 0.06% (f) | 0.06% (f) | 1.95% (f) | 29% | $3 |
Columbia Capital Allocation Portfolios | Annual Report 2018
| 123 |
Financial Highlights (continued)
Columbia Capital Allocation Aggressive Portfolio
| Year ended | Net asset value,
beginning of
period | Net
investment
income | Net
realized
and
unrealized
gain (loss) | Total from
investment
operations | Distributions
from net
investment
income | Distributions
from net
realized
gains |
| Class K |
| 1/31/2018 | $12.14 | 0.15 | 2.86 | 3.01 | (0.21) | (0.80) |
| 1/31/2017 | $11.11 | 0.14 | 1.48 | 1.62 | (0.14) | (0.45) |
| 1/31/2016 | $12.56 | 0.16 | (0.56) | (0.40) | (0.20) | (0.85) |
| 1/31/2015 | $12.84 | 0.10 | 0.89 | 0.99 | (0.31) | (0.96) |
| 1/31/2014 | $11.43 | 0.14 | 1.52 | 1.66 | (0.25) | — |
| Class R |
| 1/31/2018 | $12.02 | 0.11 | 2.83 | 2.94 | (0.17) | (0.80) |
| 1/31/2017 | $11.01 | 0.14 | 1.43 | 1.57 | (0.11) | (0.45) |
| 1/31/2016 | $12.46 | 0.12 | (0.56) | (0.44) | (0.16) | (0.85) |
| 1/31/2015 | $12.75 | 0.10 | 0.83 | 0.93 | (0.26) | (0.96) |
| 1/31/2014 | $11.35 | 0.14 | 1.47 | 1.61 | (0.21) | — |
| Notes to Financial Highlights |
| (a) | In addition to the fees and expenses that the Fund bears directly, the Fund indirectly bears a pro rata share of the fees and expenses of the underlying funds in which the Fund invests. Such indirect expenses are not included in the Fund’s reported expense ratios. |
| (b) | Total net expenses include the impact of certain fee waivers/expense reimbursements made by the Investment Manager and certain of its affiliates, if applicable. |
| (c) | The benefits derived from expense reductions had an impact of less than 0.01%. |
| (d) | Prior to November 1, 2017, Advisor Class shares were known as Class R4 shares. |
| (e) | Advisor Class shares commenced operations on June 13, 2013. Per share data and total return reflect activity from that date. |
| (f) | Annualized. |
| (g) | Prior to November 1, 2017, Institutional Class shares were known as Class Z shares. |
| (h) | Prior to November 1, 2017, Institutional 2 Class shares were known as Class R5 shares. |
| (i) | Institutional 2 Class shares commenced operations on June 13, 2013. Per share data and total return reflect activity from that date. |
| (j) | Prior to November 1, 2017, Institutional 3 Class shares were known as Class Y shares. |
| (k) | Institutional 3 Class shares commenced operations on June 13, 2013. Per share data and total return reflect activity from that date. |
The accompanying Notes to Financial Statements are an integral part of this statement.
| 124 | Columbia Capital Allocation Portfolios | Annual Report 2018 |
Total
distributions to
shareholders | Net
asset
value,
end of
period | Total
return | Total gross
expense
ratio to
average
net assets(a) | Total net
expense
ratio to
average
net assets(a),(b) | Net investment
income
ratio to
average
net assets | Portfolio
turnover | Net
assets,
end of
period
(000’s) |
| |
| (1.01) | $14.14 | 25.51% | 0.45% | 0.45% | 1.17% | 13% | $101 |
| (0.59) | $12.14 | 14.98% | 0.43% | 0.43% | 1.19% | 12% | $73 |
| (1.05) | $11.11 | (3.76%) | 0.43% | 0.43% | 1.25% | 12% | $57 |
| (1.27) | $12.56 | 7.60% | 0.43% | 0.43% | 0.72% | 27% | $68 |
| (0.25) | $12.84 | 14.52% | 0.40% | 0.40% | 1.13% | 29% | $152 |
| |
| (0.97) | $13.99 | 25.21% | 0.73% | 0.73% (c) | 0.83% | 13% | $2,671 |
| (0.56) | $12.02 | 14.61% | 0.75% | 0.75% (c) | 1.22% | 12% | $2,099 |
| (1.01) | $11.01 | (4.09%) | 0.76% | 0.76% (c) | 0.97% | 12% | $1,029 |
| (1.22) | $12.46 | 7.19% | 0.79% | 0.79% (c) | 0.72% | 27% | $912 |
| (0.21) | $12.75 | 14.13% | 0.78% | 0.78% (c) | 1.12% | 29% | $644 |
Columbia Capital Allocation Portfolios | Annual Report 2018
| 125 |
Notes to Financial Statements
January 31, 2018
Note 1. Organization
Columbia Funds Series Trust and Columbia Funds Series Trust II, (each, a Trust and collectively, the Trusts) are registered under the Investment Company Act of 1940, as amended (the 1940 Act), as open-end management investment companies. Columbia Funds Series Trust is organized as a Delaware statutory trust and Columbia Funds Series Trust II is organized as a Massachusetts business trust.
Information presented in these financial statements pertains to the following series of the Trusts (each, a Fund and collectively, the Funds): Columbia Capital Allocation Moderate Conservative Portfolio and Columbia Capital Allocation Moderate Aggressive Portfolio, each a series of Columbia Funds Series Trust, and Columbia Capital Allocation Conservative Portfolio, Columbia Capital Allocation Moderate Portfolio and Columbia Capital Allocation Aggressive Portfolio, each a series of Columbia Funds Series Trust II. Each Fund currently operates as a diversified fund.
Each Fund is a “fund-of-funds”, investing significantly in affiliated funds managed by Columbia Management Investment Advisers, LLC (the Investment Manager), a wholly-owned subsidiary of Ameriprise Financial, Inc. (Ameriprise Financial), or its affiliates, as well as third-party advised (unaffiliated) funds, including exchange-traded funds (collectively, Underlying Funds).
For information on the Underlying Funds, please refer to the Fund’s current prospectus and the prospectuses of the Underlying Funds, which are available, free of charge, from the Securities and Exchange Commission website, www.sec.gov.
Fund shares
Each Trust may issue an unlimited number of shares (without par value) that can be allocated among the separate series as designated by the Board of Trustees.
Columbia Capital Allocation Conservative Portfolio, Columbia Capital Allocation Moderate Conservative Portfolio, Columbia Capital Allocation Moderate Portfolio and Columbia Capital Allocation Aggressive Portfolio each offers Class A, Advisor Class, Class C, Institutional Class, Institutional 2 Class, Institutional 3 Class, Class K and Class R shares. Columbia Capital Allocation Moderate Aggressive Portfolio offers Class A, Advisor Class, Class C, Institutional Class, Institutional 2 Class, Institutional 3 Class, Class K, Class R and Class V shares. Although all share classes generally have identical voting, dividend and liquidation rights, each share class votes separately when required by the Trusts’ organizational documents and by law. Different share classes pay different distribution amounts to the extent the expenses of such share classes differ, and distributions in liquidation will be proportional to the net asset value of each share class. Each share class has its own expense structure and sales charges.
Class A shares are subject to a maximum front-end sales charge of 4.75% for Columbia Capital Allocation Conservative Portfolio. Class A shares of Columbia Capital Allocation Moderate Conservative Portfolio, Columbia Capital Allocation Moderate Portfolio, Columbia Capital Allocation Moderate Aggressive Portfolio and Columbia Capital Allocation Aggressive Portfolio are subject to a maximum front-end sales charge of 5.75% based on the initial investment amount. Class A shares purchased without an initial sales charge in accounts aggregating $1 million to $50 million at the time of purchase are subject to a contingent deferred sales charge (CDSC) if the shares are sold within 18 months after purchase, charged as follows: 1.00% CDSC if redeemed within 12 months after purchase, and 0.50% CDSC if redeemed more than 12, but less than 18, months after purchase.
Advisor Class shares are not subject to sales charges and are generally available only to omnibus retirement plans and certain investors as described in the Fund’s prospectus. Prior to November 1, 2017, Advisor Class shares were known as Class R4 shares.
Class B shares of the Fund are no longer offered for sale. When available, Class B shares were subject to a maximum CDSC of 5.00% based upon the holding period after purchase. Effective July 17, 2017, Class B shares were automatically converted to Class A shares without a CDSC. On August 4, 2017, the capital owned by Columbia Management Investment Advisers, LLC in Class B shares was redeemed without a CDSC.
Class C shares are subject to a 1.00% CDSC on shares redeemed within one year of purchase.
| 126 | Columbia Capital Allocation Portfolios | Annual Report 2018 |
Notes to Financial Statements (continued)
January 31, 2018
Institutional Class shares are not subject to sales charges and are generally available only to eligible investors, which are subject to different investment minimums as described in the Fund’s prospectus. Prior to November 1, 2017, Institutional Class shares were known as Class Z shares.
Institutional 2 Class shares are not subject to sales charges and are generally available only to investors purchasing through authorized investment professionals and omnibus retirement plans as described in the Fund’s prospectus. Prior to November 1, 2017, Institutional 2 Class shares were known as Class R5 shares.
Institutional 3 Class shares are not subject to sales charges and are generally available only to certain retirement plans as described in the Fund’s prospectus. Prior to November 1, 2017, Institutional 3 Class shares were known as Class Y shares.
Class K shares are not subject to sales charges and are closed to new investors. On March 9, 2018, Class K shares were redeemed or exchanged for Advisor Class shares of the same Fund in a tax free transaction that had no impact on fees and expenses paid by the shareholders.
Class R shares are not subject to sales charges and are generally available only to certain retirement plans and other investors as described in the Fund’s prospectus.
Class V shares are subject to a maximum front-end sales charge of 5.75% based on the investment amount. Class V shares purchased without an initial sales charge in accounts aggregating $1 million to $50 million at the time of purchase are subject to a CDSC if the shares are sold within 18 months of purchase, charged as follows: 1.00% CDSC if redeemed within 12 months of purchase, and 0.50% CDSC if redeemed more than 12, but less than 18, months after purchase. Class V shares are available only to investors who received (and who have continuously held) Class V shares in connection with previous fund reorganizations.
Note 2. Summary of significant accounting policies
Basis of preparation
Each Fund is an investment company that applies the accounting and reporting guidance in the Financial Accounting Standards Board (FASB) Accounting Standards Codification Topic 946, Financial Services - Investment Companies (ASC 946). The financial statements are prepared in accordance with U.S. generally accepted accounting principles (GAAP), which requires management to make certain estimates and assumptions that affect the reported amounts of assets and liabilities, the disclosure of contingent assets and liabilities at the date of the financial statements and the reported amounts of income and expenses during the reporting period. Actual results could differ from those estimates.
The following is a summary of significant accounting policies followed by the Funds in the preparation of their financial statements.
Security valuation
All equity securities are valued at the close of business of the New York Stock Exchange. Equity securities are valued at the last quoted sales price on the principal exchange or market on which they trade, except for securities traded on the NASDAQ Stock Market, which are valued at the NASDAQ official close price. Unlisted securities or listed securities for which there were no sales during the day are valued at the mean of the latest quoted bid and ask prices on such exchanges or markets.
Foreign equity securities are valued based on the closing price on the foreign exchange in which such securities are primarily traded. If any foreign equity security closing prices are not readily available, the securities are valued at the mean of the latest quoted bid and ask prices on such exchanges or markets. Foreign currency exchange rates are generally determined at 4:00 p.m. Eastern (U.S.) time. Many securities markets and exchanges outside the U.S. close prior to the close of the New York Stock Exchange; therefore, the closing prices for securities in such markets or on such exchanges may not fully reflect events that occur after such close but before the close of the New York Stock Exchange. In those situations, foreign securities will be fair valued pursuant to a policy adopted by the Board of Trustees, including, if available, utilizing a third party pricing service to determine these fair values. The third party pricing service takes into account multiple factors, including, but not limited to, movements in the U.S. securities markets, certain depositary receipts, futures contracts and foreign exchange
Columbia Capital Allocation Portfolios | Annual Report 2018
| 127 |
Notes to Financial Statements (continued)
January 31, 2018
rates that have occurred subsequent to the close of the foreign exchange or market, to determine a good faith estimate that reasonably reflects the current market conditions as of the close of the New York Stock Exchange. The fair value of a security is likely to be different from the quoted or published price, if available.
Investments in the Underlying Funds are valued at the net asset value of the applicable class of the Underlying Fund determined as of the close of the New York Stock Exchange on the valuation date.
Forward foreign currency exchange contracts are marked-to-market based upon foreign currency exchange rates provided by a pricing service.
Futures and options on futures contracts are valued based upon the settlement price at the close of regular trading on their principal exchanges or, in the absence of transactions, at the mean of the latest quoted bid and ask prices.
Swap transactions are valued through an independent pricing service or broker, or if neither is available, through an internal model based upon observable inputs.
Investments for which market quotations are not readily available, or that have quotations which management believes are not reflective of market value or reliable, are valued at fair value as determined in good faith under procedures approved by and under the general supervision of the Board of Trustees. If a security or class of securities (such as foreign securities) is valued at fair value, such value is likely to be different from the quoted or published price for the security.
The determination of fair value often requires significant judgment. To determine fair value, management may use assumptions including but not limited to future cash flows and estimated risk premiums. Multiple inputs from various sources may be used to determine fair value.
GAAP requires disclosure regarding the inputs and valuation techniques used to measure fair value and any changes in valuation inputs or techniques. In addition, investments shall be disclosed by major category. This information is disclosed following the Fund’s Portfolio of Investments.
Foreign currency transactions and translations
The values of all assets and liabilities denominated in foreign currencies are generally translated into U.S. dollars at exchange rates determined at the close of regular trading on the New York Stock Exchange. Net realized and unrealized gains (losses) on foreign currency transactions and translations include gains (losses) arising from the fluctuation in exchange rates between trade and settlement dates on securities transactions, gains (losses) arising from the disposition of foreign currency and currency gains (losses) between the accrual and payment dates on dividends, interest income and foreign withholding taxes.
For financial statement purposes, the Funds do not distinguish that portion of gains (losses) on investments which is due to changes in foreign exchange rates from that which is due to changes in market prices of the investments. Such fluctuations are included with the net realized and unrealized gains (losses) on investments in the Statement of Operations.
Derivative instruments
Certain Funds invest in certain derivative instruments, as detailed below, to meet its investment objectives. Derivatives are instruments whose values depend on, or are derived from, in whole or in part, the value of one or more securities, currencies, commodities, indices, or other assets or instruments. Derivatives may be used to increase investment flexibility (including to maintain cash reserves while maintaining desired exposure to certain assets), for risk management (hedging) purposes, to facilitate trading, to reduce transaction costs and to pursue higher investment returns. The Fund may also use derivative instruments to mitigate certain investment risks, such as foreign currency exchange rate risk, interest rate risk and credit risk. Derivatives may involve various risks, including the potential inability of the counterparty to fulfill its obligations under the terms of the contract, the potential for an illiquid secondary market (making it difficult for the Fund to sell or terminate, including at favorable prices) and the potential for market movements which may expose the Fund to gains or losses in excess of the amount shown in the Statement of Assets and Liabilities. The notional amounts of derivative instruments, if applicable, are not recorded in the financial statements.
| 128 | Columbia Capital Allocation Portfolios | Annual Report 2018 |
Notes to Financial Statements (continued)
January 31, 2018
A derivative instrument may suffer a marked-to-market loss if the value of the contract decreases due to an unfavorable change in the market rates or values of the underlying instrument. Losses can also occur if the counterparty does not perform its obligations under the contract. The Fund’s risk of loss from counterparty credit risk on over-the-counter derivatives is generally limited to the aggregate unrealized gain netted against any collateral held by the Fund and the amount of any variation margin held by the counterparty, plus any replacement costs or related amounts. With exchange-traded or centrally cleared derivatives, there is reduced counterparty credit risk to the Fund since the clearinghouse or central counterparty (CCP) provides some protection in the case of clearing member default. The clearinghouse or CCP stands between the buyer and the seller of the contract; therefore, additional counterparty credit risk is failure of the clearinghouse or CCP. However, credit risk still exists in exchange-traded or centrally cleared derivatives with respect to initial and variation margin that is held in a broker’s customer account. While brokers are required to segregate customer margin from their own assets, in the event that a broker becomes insolvent or goes into bankruptcy and at that time there is a shortfall in the aggregate amount of margin held by the broker for all its clients, U.S. bankruptcy laws will typically allocate that shortfall on a pro-rata basis across all the broker’s customers (including the Fund), potentially resulting in losses to the Fund.
In order to better define its contractual rights and to secure rights that will help the Fund mitigate its counterparty risk, the Fund may enter into an International Swaps and Derivatives Association, Inc. Master Agreement (ISDA Master Agreement) or similar agreement with its derivatives contract counterparties. An ISDA Master Agreement is an agreement between the Fund and a counterparty that governs over-the-counter derivatives and typically contains, among other things, collateral posting terms and netting provisions in the event of a default and/or termination event. Under an ISDA Master Agreement, the Fund may, under certain circumstances, offset with the counterparty certain derivative instrument’s payables and/or receivables with collateral held and/or posted and create one single net payment. The provisions of the ISDA Master Agreement typically permit a single net payment in the event of default (close-out netting), including the bankruptcy or insolvency of the counterparty. Note, however, that bankruptcy or insolvency laws of a particular jurisdiction may impose restrictions on or prohibitions against the right of offset or netting in bankruptcy, insolvency or other events.
Collateral (margin) requirements differ by type of derivative. Margin requirements are established by the clearinghouse or CCP for exchange-traded and centrally cleared derivatives. Brokers can ask for margin in excess of the minimum in certain circumstances. Collateral terms are contract specific for over-the-counter derivatives. For over-the-counter derivatives traded under an ISDA Master Agreement, the collateral requirements are typically calculated by netting the marked-to-market amount for each transaction under such agreement and comparing that amount to the value of any variation margin currently pledged by the Fund and/or the counterparty. Generally, the amount of collateral due from or to a party has to exceed a minimum transfer amount threshold (e.g., $250,000) before a transfer has to be made. To the extent amounts due to the Fund from its counterparties are not fully collateralized, contractually or otherwise, the Fund bears the risk of loss from counterparty nonperformance. The Fund attempts to mitigate counterparty risk by only entering into agreements with counterparties that it believes have the financial resources to honor their obligations and by monitoring the financial stability of those counterparties.
Certain ISDA Master Agreements allow counterparties of over-the-counter derivatives transactions to terminate derivatives contracts prior to maturity in the event the Fund’s net asset value declines by a stated percentage over a specified time period or if the Fund fails to meet certain terms of the ISDA Master Agreement, which would cause the Fund to accelerate payment of any net liability owed to the counterparty. The Fund also has termination rights if the counterparty fails to meet certain terms of the ISDA Master Agreement. In addition to considering counterparty credit risk, the Fund would consider terminating the derivatives contracts based on whether termination would result in a net liability owed from the counterparty.
For financial reporting purposes, the Fund does not offset derivative assets and derivative liabilities that are subject to netting arrangements in the Statement of Assets and Liabilities.
Forward foreign currency exchange contracts
Forward foreign currency exchange contracts are over-the-counter agreements between two parties to buy and sell a currency at a set price on a future date. The Fund utilized forward foreign currency exchange contracts to hedge the currency exposure associated with some or all of the Fund’s securities, to shift foreign currency exposure back to U.S. dollars, to shift investment exposure from one currency to another and to shift U.S. dollar exposure to achieve a representative weighted mix of major currencies in its benchmark and to recover an underweight country exposure in its portfolio. These instruments may be used for other purposes in future periods.
Columbia Capital Allocation Portfolios | Annual Report 2018
| 129 |
Notes to Financial Statements (continued)
January 31, 2018
The values of forward foreign currency exchange contracts fluctuate daily with changes in foreign currency exchange rates. Changes in the value of these contracts are recorded as unrealized appreciation or depreciation until the contract is exercised or has expired. The Fund will realize a gain or loss when the forward foreign currency exchange contract is closed or expires.
The use of forward foreign currency exchange contracts does not eliminate fluctuations in the prices of the Fund’s portfolio securities. The risks of forward foreign currency exchange contracts include movement in the values of the foreign currencies relative to the U.S. dollar (or other foreign currencies) and the possibility that counterparties will not complete their contractual obligations, which may be in excess of the amount reflected, if any, in the Statement of Assets and Liabilities.
Futures contracts
Futures contracts are exchange-traded and represent commitments for the future purchase or sale of an asset at a specified price on a specified date. The Fund bought and sold futures contracts to produce incremental earnings, to manage the duration and yield curve exposure of the Fund versus the benchmark, to manage exposure to movements in interest rates, to manage exposure to the securities market and to maintain appropriate equity market exposure while keeping sufficient cash to accommodate daily redemptions. These instruments may be used for other purposes in future periods. Upon entering into futures contracts, the Fund bears risks that it may not achieve the anticipated benefits of the futures contracts and may realize a loss. Additional risks include counterparty credit risk, the possibility of an illiquid market, and that a change in the value of the contract or option may not correlate with changes in the value of the underlying asset.
Upon entering into a futures contract, the Fund deposits cash or securities with the broker, known as a futures commission merchant (FCM), in an amount sufficient to meet the initial margin requirement. The initial margin deposit must be maintained at an established level over the life of the contract. Cash deposited as initial margin is recorded in the Statement of Assets and Liabilities as margin deposits. Securities deposited as initial margin are designated in the Portfolio of Investments. Subsequent payments (variation margin) are made or received by the Fund each day. The variation margin payments are equal to the daily change in the contract value and are recorded as variation margin receivable or payable and are offset in unrealized gains or losses. The Fund recognizes a realized gain or loss when the contract is closed or expires. Futures contracts involve, to varying degrees, risk of loss in excess of the variation margin disclosed in the Statement of Assets and Liabilities.
Swap contracts
Swap contracts are negotiated in the over-the-counter market and may be entered into as a bilateral contract or centrally cleared (centrally cleared swap contract). In a centrally cleared swap contract, immediately following execution of the swap contract with a broker, the swap contract is novated to a central counterparty (the CCP) and the CCP becomes the Fund’s counterparty to the centrally cleared swap contract. The Fund is required to deposit initial margin with the futures commission merchant (FCM), which pledges it through to the CCP in the form of cash or securities in an amount that varies depending on the size and risk profile of the particular swap contract. Securities deposited as initial margin are designated in the Portfolio of Investments and cash deposited is recorded in the Statement of Assets and Liabilities as margin deposits. Unlike a bilateral swap contract, for centrally cleared swap contracts, the Fund has minimal credit exposure to the FCM because the CCP stands between the Fund and the relevant buyer/seller on the other side of the contract. Swap contracts are marked-to-market daily and changes in value are recorded as unrealized appreciation (depreciation). The daily change in valuation of centrally cleared swap contracts, if any, is recorded as a receivable or payable for variation margin in the Statement of Assets and Liabilities.
Entering into these contracts involves, to varying degrees, elements of interest, liquidity and counterparty credit risk in excess of the amounts recognized in the Statement of Assets and Liabilities. Such risks involve the possibility that there may be unfavorable changes in interest rates, market conditions or other conditions, it may be difficult to initiate a swap transaction or liquidate a position at an advantageous time or price which may result in significant losses, and that the FCM or CCP may not fulfill its obligation under the contract.
| 130 | Columbia Capital Allocation Portfolios | Annual Report 2018 |
Notes to Financial Statements (continued)
January 31, 2018
Credit default swap contracts
The Fund entered into credit default swap contracts to increase or decrease its credit exposure to an index and increase or decrease its credit exposure to a specific debt security or a basket of debt securities, as a protection buyer to reduce overall credit exposure. These instruments may be used for other purposes in future periods. Credit default swap contracts are agreements in which one party pays fixed periodic payments to a counterparty in consideration for an agreement from the counterparty to make a specific payment should a specified credit event(s) take place. Although specified credit events are contract specific, credit events are generally defined as bankruptcy, failure to pay, restructuring, obligation acceleration, obligation default, or repudiation/moratorium.
As the purchaser of a credit default swap contract, the Fund purchases protection by paying a periodic interest rate on the notional amount to the counterparty. The interest amount is accrued daily as a component of unrealized appreciation (depreciation) and is recorded as a realized loss upon payment. If a credit event as specified in the contract occurs, the Fund may have the option either to deliver the reference obligation to the seller in exchange for a cash payment of its par amount, or to receive a net cash settlement equal to the par amount less an agreed-upon value of the reference obligation as of the date of the credit event. The difference between the value of the obligation or cash delivered and the notional amount received will be recorded as a realized gain (loss).
As the seller of a credit default swap contract, the Fund sells protection to a buyer and will generally receive a periodic interest rate on a notional amount. The interest amount is accrued daily as a component of unrealized appreciation (depreciation) and is recorded as a realized gain upon receipt of the payment. If a credit event as specified in the contract with the counterparty occurs, the Fund may either be required to accept the reference obligation from the buyer in exchange for a cash payment of its notional amount, or to pay the buyer a net cash settlement equal to the notional amount less an agreed-upon value of the reference obligation (recovery value) as of the date of the credit event. The difference between the value of the obligation or cash received and the notional amount paid will be recorded as a realized gain (loss). The maximum potential amount of undiscounted future payments the Fund could be required to make as the seller of protection under a credit default swap contract is equal to the notional amount of the reference obligation. These potential amounts may be partially offset by any recovery values of the respective reference obligations or upfront receipts upon entering into the agreement. The notional amounts and market values of all credit default swap contracts in which the Fund is the seller of protection, if any, are disclosed in the Credit Default Swap Contracts Outstanding schedule following the Portfolio of Investments.
As a protection seller, the Fund bears the risk of loss from the credit events specified in the contract with the counterparty. For credit default swap contracts on credit indices, quoted market prices and resulting market values serve as an indicator of the current status of the payment/performance risk. Increasing market values, in absolute terms when compared to the notional amount of the swap, represent a deterioration of the reference entity’s credit soundness and a greater likelihood or risk of default or other credit event occurring as defined under the terms of the contract.
Any upfront payments or receipts by the Fund upon entering into a credit default swap contract is recorded as an asset or liability, respectively, and amortized daily as a component of realized gain (loss) in the Statement of Operations. Credit default swap contracts are valued daily, and the change in value is recorded as unrealized appreciation (depreciation) until the termination of the swap, at which time a realized gain (loss) is recorded.
Credit default swap contracts can involve greater risks than if a fund had invested in the reference obligation directly since, in addition to general market risks, credit default swaps are subject to counterparty credit risk, leverage risk, hedging risk, correlation risk and liquidity risk.
Effects of derivative transactions in the financial statements
The following tables are intended to provide additional information about the effect of derivatives on the financial statements of the Funds, including: the fair value of derivatives by risk category and the location of those fair values in the Statements of Assets and Liabilities; and the impact of derivative transactions over the period in the Statements of Operations, including realized gains or losses and unrealized gains or losses. The derivative schedules following the Portfolio of Investments present additional information regarding derivative instruments outstanding at the end of the period, if any.
Columbia Capital Allocation Portfolios | Annual Report 2018
| 131 |
Notes to Financial Statements (continued)
January 31, 2018
Columbia Capital Allocation Conservative Portfolio
The following table is a summary of the fair value of derivative instruments (not considered to be hedging instruments for accounting disclosure purposes) at January 31, 2018:
| | Asset derivatives | |
Risk exposure
category | Statement
of assets and liabilities
location | Fair value ($) |
| Credit risk | Net assets — unrealized appreciation on swap contracts | 23,173* |
| Equity risk | Net assets — unrealized appreciation on futures contracts | 74,597* |
| Foreign exchange risk | Unrealized appreciation on forward foreign currency exchange contracts | 7,926 |
| Total | | 105,696 |
| | Liability derivatives | |
Risk exposure
category | Statement
of assets and liabilities
location | Fair value ($) |
| Equity risk | Net assets — unrealized depreciation on futures contracts | 155,925* |
| Foreign exchange risk | Unrealized depreciation on forward foreign currency exchange contracts | 3,889 |
| Interest rate risk | Net assets — unrealized depreciation on futures contracts | 361,839* |
| Total | | 521,653 |
| * | Includes cumulative appreciation (depreciation) as reported in the tables following the Portfolio of Investments. Only the current day’s variation margin is reported in receivables or payables in the Statement of Assets and Liabilities. |
The following table indicates the effect of derivative instruments (not considered to be hedging instruments for accounting disclosure purposes) in the Statement of Operations for the year ended January 31, 2018:
| Amount of realized gain (loss) on derivatives recognized in income |
| Risk exposure category | Forward
foreign
currency
exchange
contracts
($) | Futures
contracts
($) | Swap
contracts
($) | Total
($) |
| Credit risk | — | — | (187,543) | (187,543) |
| Equity risk | — | 180,282 | — | 180,282 |
| Foreign exchange risk | 7,963 | — | — | 7,963 |
| Interest rate risk | — | 232,276 | — | 232,276 |
| Total | 7,963 | 412,558 | (187,543) | 232,978 |
| |
| Change in unrealized appreciation (depreciation) on derivatives recognized in income |
| Risk exposure category | Forward
foreign
currency
exchange
contracts
($) | Futures
contracts
($) | Swap
contracts
($) | Total
($) |
| Credit risk | — | — | 98,240 | 98,240 |
| Equity risk | — | (71,002) | — | (71,002) |
| Foreign exchange risk | 1,134 | — | — | 1,134 |
| Interest rate risk | — | (333,748) | — | (333,748) |
| Total | 1,134 | (404,750) | 98,240 | (305,376) |
| 132 | Columbia Capital Allocation Portfolios | Annual Report 2018 |
Notes to Financial Statements (continued)
January 31, 2018
The following table is a summary of the average outstanding volume by derivative instrument for the year ended January 31, 2018:
| Derivative instrument | Average notional
amounts ($)* |
| Futures contracts — long | 16,287,503 |
| Futures contracts — short | 5,332,765 |
| Credit default swap contracts — buy protection | 5,625,000 |
| Credit default swap contracts — sell protection | 750,000 |
| Derivative instrument | Average unrealized
appreciation ($)* | Average unrealized
depreciation ($)* |
| Forward foreign currency exchange contracts | 8,481 | (6,705) |
| * | Based on the ending quarterly outstanding amounts for the year ended January 31, 2018. |
Columbia Capital Allocation Moderate Conservative Portfolio
The following table is a summary of the fair value of derivative instruments (not considered to be hedging instruments for accounting disclosure purposes) at January 31, 2018:
| | Asset derivatives | |
Risk exposure
category | Statement
of assets and liabilities
location | Fair value ($) |
| Credit risk | Net assets — unrealized appreciation on swap contracts | 69,490* |
| Equity risk | Net assets — unrealized appreciation on futures contracts | 915,826* |
| Foreign exchange risk | Unrealized appreciation on forward foreign currency exchange contracts | 12,256 |
| Total | | 997,572 |
| | Liability derivatives | |
Risk exposure
category | Statement
of assets and liabilities
location | Fair value ($) |
| Equity risk | Net assets — unrealized depreciation on futures contracts | 21,838* |
| Foreign exchange risk | Unrealized depreciation on forward foreign currency exchange contracts | 5,944 |
| Interest rate risk | Net assets — unrealized depreciation on futures contracts | 802,942* |
| Total | | 830,724 |
| * | Includes cumulative appreciation (depreciation) as reported in the tables following the Portfolio of Investments. Only the current day’s variation margin is reported in receivables or payables in the Statement of Assets and Liabilities. |
Columbia Capital Allocation Portfolios | Annual Report 2018
| 133 |
Notes to Financial Statements (continued)
January 31, 2018
The following table indicates the effect of derivative instruments (not considered to be hedging instruments for accounting disclosure purposes) in the Statement of Operations for the year ended January 31, 2018:
| Amount of realized gain (loss) on derivatives recognized in income |
| Risk exposure category | Forward
foreign
currency
exchange
contracts
($) | Futures
contracts
($) | Swap
contracts
($) | Total
($) |
| Credit risk | — | — | (477,425) | (477,425) |
| Equity risk | — | 2,588,100 | — | 2,588,100 |
| Foreign exchange risk | 13,817 | — | — | 13,817 |
| Interest rate risk | — | 417,175 | — | 417,175 |
| Total | 13,817 | 3,005,275 | (477,425) | 2,541,667 |
| |
| Change in unrealized appreciation (depreciation) on derivatives recognized in income |
| Risk exposure category | Forward
foreign
currency
exchange
contracts
($) | Futures
contracts
($) | Swap
contracts
($) | Total
($) |
| Credit risk | — | — | 258,776 | 258,776 |
| Equity risk | — | 970,997 | — | 970,997 |
| Foreign exchange risk | 1,873 | — | — | 1,873 |
| Interest rate risk | — | (707,719) | — | (707,719) |
| Total | 1,873 | 263,278 | 258,776 | 523,927 |
The following table is a summary of the average outstanding volume by derivative instrument for the year ended January 31, 2018:
| Derivative instrument | Average notional
amounts ($)* |
| Futures contracts — long | 49,287,844 |
| Futures contracts — short | 7,958,346 |
| Credit default swap contracts — buy protection | 11,287,500 |
| Credit default swap contracts — sell protection | 2,250,000 |
| Derivative instrument | Average unrealized
appreciation ($)* | Average unrealized
depreciation ($)* |
| Forward foreign currency exchange contracts | 12,958 | (10,232) |
| * | Based on the ending quarterly outstanding amounts for the year ended January 31, 2018. |
Columbia Capital Allocation Moderate Portfolio
The following table is a summary of the fair value of derivative instruments (not considered to be hedging instruments for accounting disclosure purposes) at January 31, 2018:
| | Asset derivatives | |
Risk exposure
category | Statement
of assets and liabilities
location | Fair value ($) |
| Credit risk | Net assets — unrealized appreciation on swap contracts | 222,710* |
| Equity risk | Net assets — unrealized appreciation on futures contracts | 8,299,882* |
| Foreign exchange risk | Unrealized appreciation on forward foreign currency exchange contracts | 26,134 |
| Total | | 8,548,726 |
| 134 | Columbia Capital Allocation Portfolios | Annual Report 2018 |
Notes to Financial Statements (continued)
January 31, 2018
| | Liability derivatives | |
Risk exposure
category | Statement
of assets and liabilities
location | Fair value ($) |
| Credit risk | Net assets — unrealized depreciation on swap contracts | 54,902* |
| Equity risk | Net assets — unrealized depreciation on futures contracts | 62,395* |
| Foreign exchange risk | Unrealized depreciation on forward foreign currency exchange contracts | 17,554 |
| Interest rate risk | Net assets — unrealized depreciation on futures contracts | 1,298,683* |
| Total | | 1,433,534 |
| * | Includes cumulative appreciation (depreciation) as reported in the tables following the Portfolio of Investments. Only the current day’s variation margin is reported in receivables or payables in the Statement of Assets and Liabilities. |
The following table indicates the effect of derivative instruments (not considered to be hedging instruments for accounting disclosure purposes) in the Statement of Operations for the year ended January 31, 2018:
| Amount of realized gain (loss) on derivatives recognized in income |
| Risk exposure category | Forward
foreign
currency
exchange
contracts
($) | Futures
contracts
($) | Swap
contracts
($) | Total
($) |
| Credit risk | — | — | (912,869) | (912,869) |
| Equity risk | — | 19,055,798 | — | 19,055,798 |
| Foreign exchange risk | (20,275) | — | — | (20,275) |
| Interest rate risk | — | 17,378 | — | 17,378 |
| Total | (20,275) | 19,073,176 | (912,869) | 18,140,032 |
| |
| Change in unrealized appreciation (depreciation) on derivatives recognized in income |
| Risk exposure category | Forward
foreign
currency
exchange
contracts
($) | Futures
contracts
($) | Swap
contracts
($) | Total
($) |
| Credit risk | — | — | 541,438 | 541,438 |
| Equity risk | — | 7,742,326 | — | 7,742,326 |
| Foreign exchange risk | 9,204 | — | — | 9,204 |
| Interest rate risk | — | (1,091,603) | — | (1,091,603) |
| Total | 9,204 | 6,650,723 | 541,438 | 7,201,365 |
The following table is a summary of the average outstanding volume by derivative instrument for the year ended January 31, 2018:
| Derivative instrument | Average notional
amounts ($)* |
| Futures contracts — long | 185,060,955 |
| Futures contracts — short | 8,448,415 |
| Credit default swap contracts — buy protection | 18,125,000 |
| Credit default swap contracts — sell protection | 7,250,000 |
| Derivative instrument | Average unrealized
appreciation ($)* | Average unrealized
depreciation ($)* |
| Forward foreign currency exchange contracts | 19,452 | (21,886) |
| * | Based on the ending quarterly outstanding amounts for the year ended January 31, 2018. |
Columbia Capital Allocation Portfolios | Annual Report 2018
| 135 |
Notes to Financial Statements (continued)
January 31, 2018
Columbia Capital Allocation Moderate Aggressive Portfolio
The following table is a summary of the fair value of derivative instruments (not considered to be hedging instruments for accounting disclosure purposes) at January 31, 2018:
| | Asset derivatives | |
Risk exposure
category | Statement
of assets and liabilities
location | Fair value ($) |
| Credit risk | Net assets — unrealized appreciation on swap contracts | 356,662* |
| Equity risk | Net assets — unrealized appreciation on futures contracts | 16,984,298* |
| Foreign exchange risk | Unrealized appreciation on forward foreign currency exchange contracts | 18,197 |
| Total | | 17,359,157 |
| | Liability derivatives | |
Risk exposure
category | Statement
of assets and liabilities
location | Fair value ($) |
| Credit risk | Net assets — unrealized depreciation on swap contracts | 74,192* |
| Equity risk | Net assets — unrealized depreciation on futures contracts | 87,352* |
| Foreign exchange risk | Unrealized depreciation on forward foreign currency exchange contracts | 12,069 |
| Interest rate risk | Net assets — unrealized depreciation on futures contracts | 2,300,312* |
| Total | | 2,473,925 |
| * | Includes cumulative appreciation (depreciation) as reported in the tables following the Portfolio of Investments. Only the current day’s variation margin is reported in receivables or payables in the Statement of Assets and Liabilities. |
The following table indicates the effect of derivative instruments (not considered to be hedging instruments for accounting disclosure purposes) in the Statement of Operations for the year ended January 31, 2018:
| Amount of realized gain (loss) on derivatives recognized in income |
| Risk exposure category | Forward
foreign
currency
exchange
contracts
($) | Futures
contracts
($) | Swap
contracts
($) | Total
($) |
| Credit risk | — | — | (974,625) | (974,625) |
| Equity risk | — | 36,659,573 | — | 36,659,573 |
| Foreign exchange risk | (11,164) | — | — | (11,164) |
| Interest rate risk | — | 714,856 | — | 714,856 |
| Total | (11,164) | 37,374,429 | (974,625) | 36,388,640 |
| |
| Change in unrealized appreciation (depreciation) on derivatives recognized in income |
| Risk exposure category | Forward
foreign
currency
exchange
contracts
($) | Futures
contracts
($) | Swap
contracts
($) | Total
($) |
| Credit risk | — | — | 745,017 | 745,017 |
| Equity risk | — | 16,757,704 | — | 16,757,704 |
| Foreign exchange risk | 5,421 | — | — | 5,421 |
| Interest rate risk | — | (1,945,455) | — | (1,945,455) |
| Total | 5,421 | 14,812,249 | 745,017 | 15,562,687 |
| 136 | Columbia Capital Allocation Portfolios | Annual Report 2018 |
Notes to Financial Statements (continued)
January 31, 2018
The following table is a summary of the average outstanding volume by derivative instrument for the year ended January 31, 2018:
| Derivative instrument | Average notional
amounts ($)* |
| Futures contracts — long | 366,301,857 |
| Futures contracts — short | 5,745,593 |
| Credit default swap contracts — buy protection | 24,875,000 |
| Credit default swap contracts — sell protection | 11,500,000 |
| * | Based on the ending quarterly outstanding amounts for the year ended January 31, 2018. |
| Derivative instrument | Average unrealized
appreciation ($)* | Average unrealized
depreciation ($)* |
| Forward foreign currency exchange contracts | 13,480 | (15,229) |
| * | Based on the ending quarterly outstanding amounts for the year ended January 31, 2018. |
Columbia Capital Allocation Aggressive Portfolio
The following table is a summary of the fair value of derivative instruments (not considered to be hedging instruments for accounting disclosure purposes) at January 31, 2018:
| | Asset derivatives | |
Risk exposure
category | Statement
of assets and liabilities
location | Fair value ($) |
| Credit risk | Net assets — unrealized appreciation on swap contracts | 131,829* |
| Equity risk | Net assets — unrealized appreciation on futures contracts | 5,332,858* |
| Foreign exchange risk | Unrealized appreciation on forward foreign currency exchange contracts | 21,476 |
| Interest rate risk | Net assets — unrealized appreciation on futures contracts | 36,943* |
| Total | | 5,523,106 |
| | Liability derivatives | |
Risk exposure
category | Statement
of assets and liabilities
location | Fair value ($) |
| Credit risk | Net assets — unrealized depreciation on swap contracts | 22,258* |
| Equity risk | Net assets — unrealized depreciation on futures contracts | 28,858* |
| Foreign exchange risk | Unrealized depreciation on forward foreign currency exchange contracts | 14,111 |
| Interest rate risk | Net assets — unrealized depreciation on futures contracts | 179,997* |
| Total | | 245,224 |
| * | Includes cumulative appreciation (depreciation) as reported in the tables following the Portfolio of Investments. Only the current day’s variation margin is reported in receivables or payables in the Statement of Assets and Liabilities. |
Columbia Capital Allocation Portfolios | Annual Report 2018
| 137 |
Notes to Financial Statements (continued)
January 31, 2018
The following table indicates the effect of derivative instruments (not considered to be hedging instruments for accounting disclosure purposes) in the Statement of Operations for the year ended January 31, 2018:
| Amount of realized gain (loss) on derivatives recognized in income |
| Risk exposure category | Forward
foreign
currency
exchange
contracts
($) | Futures
contracts
($) | Swap
contracts
($) | Total
($) |
| Credit risk | — | — | (137,485) | (137,485) |
| Equity risk | — | 10,686,640 | — | 10,686,640 |
| Foreign exchange risk | (12,632) | — | — | (12,632) |
| Interest rate risk | — | 365,461 | — | 365,461 |
| Total | (12,632) | 11,052,101 | (137,485) | 10,901,984 |
| |
| Change in unrealized appreciation (depreciation) on derivatives recognized in income |
| Risk exposure category | Forward
foreign
currency
exchange
contracts
($) | Futures
contracts
($) | Swap
contracts
($) | Total
($) |
| Credit risk | — | — | 230,633 | 230,633 |
| Equity risk | — | 5,095,921 | — | 5,095,921 |
| Foreign exchange risk | 8,280 | — | — | 8,280 |
| Interest rate risk | — | (118,130) | — | (118,130) |
| Total | 8,280 | 4,977,791 | 230,633 | 5,216,704 |
The following table is a summary of the average outstanding volume by derivative instrument for the year ended January 31, 2018:
| Derivative instrument | Average notional
amounts ($)* |
| Futures contracts — long | 88,885,473 |
| Futures contracts — short | 6,423,899 |
| Credit default swap contracts — buy protection | 7,250,000 |
| Credit default swap contracts — sell protection | 4,250,000 |
| Derivative instrument | Average unrealized
appreciation ($)* | Average unrealized
depreciation ($)* |
| Forward foreign currency exchange contracts | 15,912 | (17,942) |
| * | Based on the ending quarterly outstanding amounts for the year ended January 31, 2018. |
Offsetting of assets and liabilities
The following table presents the Fund’s gross and net amount of assets and liabilities available for offset under netting arrangements as well as any related collateral received or pledged by the Fund as of January 31, 2018:
| 138 | Columbia Capital Allocation Portfolios | Annual Report 2018 |
Notes to Financial Statements (continued)
January 31, 2018
Columbia Capital Allocation Conservative Portfolio
| | JPMorgan ($) | Morgan
Stanley ($) | Total ($) |
| Assets | | | |
| Centrally cleared credit default swap contracts (a) | - | 1,612 | 1,612 |
| Forward foreign currency exchange contracts | 7,926 | - | 7,926 |
| Total assets | 7,926 | 1,612 | 9,538 |
| Liabilities | | | |
| Forward foreign currency exchange contracts | 3,889 | - | 3,889 |
| Total liabilities | 3,889 | - | 3,889 |
| Total financial and derivative net assets | 4,037 | 1,612 | 5,649 |
| Total collateral received (pledged) (b) | - | - | - |
| Net amount (c) | 4,037 | 1,612 | 5,649 |
| (a) | Centrally cleared swaps are included within payable/receivable for variation margin on the Statement of Assets and Liabilities. |
| (b) | In some instances, the actual collateral received and/or pledged may be more than the amount shown due to overcollateralization. |
| (c) | Represents the net amount due from/(to) counterparties in the event of default. |
Columbia Capital Allocation Moderate Conservative Portfolio
| | JPMorgan ($) | Morgan
Stanley ($) | Total ($) |
| Assets | | | |
| Centrally cleared credit default swap contracts (a) | - | 4,835 | 4,835 |
| Forward foreign currency exchange contracts | 12,256 | - | 12,256 |
| Total assets | 12,256 | 4,835 | 17,091 |
| Liabilities | | | |
| Forward foreign currency exchange contracts | 5,944 | - | 5,944 |
| Total liabilities | 5,944 | - | 5,944 |
| Total financial and derivative net assets | 6,312 | 4,835 | 11,147 |
| Total collateral received (pledged) (b) | - | - | - |
| Net amount (c) | 6,312 | 4,835 | 11,147 |
| (a) | Centrally cleared swaps are included within payable/receivable for variation margin on the Statement of Assets and Liabilities. |
| (b) | In some instances, the actual collateral received and/or pledged may be more than the amount shown due to overcollateralization. |
| (c) | Represents the net amount due from/(to) counterparties in the event of default. |
Columbia Capital Allocation Moderate Portfolio
| | JPMorgan ($) | Morgan
Stanley ($) | Total ($) |
| Assets | | | |
| Centrally cleared credit default swap contracts (a) | - | 15,578 | 15,578 |
| Forward foreign currency exchange contracts | 26,134 | - | 26,134 |
| Total assets | 26,134 | 15,578 | 41,712 |
| Liabilities | | | |
| Centrally cleared credit default swap contracts (a) | - | 510 | 510 |
| Forward foreign currency exchange contracts | 17,554 | - | 17,554 |
| Total liabilities | 17,554 | 510 | 18,064 |
| Total financial and derivative net assets | 8,580 | 15,068 | 23,648 |
| Total collateral received (pledged) (b) | - | - | - |
| Net amount (c) | 8,580 | 15,068 | 23,648 |
| (a) | Centrally cleared swaps are included within payable/receivable for variation margin on the Statement of Assets and Liabilities. |
| (b) | In some instances, the actual collateral received and/or pledged may be more than the amount shown due to overcollateralization. |
| (c) | Represents the net amount due from/(to) counterparties in the event of default. |
Columbia Capital Allocation Portfolios | Annual Report 2018
| 139 |
Notes to Financial Statements (continued)
January 31, 2018
Columbia Capital Allocation Moderate Aggressive Portfolio
| | JPMorgan ($) | Morgan
Stanley ($) | Total ($) |
| Assets | | | |
| Centrally cleared credit default swap contracts (a) | - | 24,711 | 24,711 |
| Forward foreign currency exchange contracts | 18,197 | - | 18,197 |
| Total assets | 18,197 | 24,711 | 42,908 |
| Liabilities | | | |
| Centrally cleared credit default swap contracts (a) | - | 689 | 689 |
| Forward foreign currency exchange contracts | 12,069 | - | 12,069 |
| Total liabilities | 12,069 | 689 | 12,758 |
| Total financial and derivative net assets | 6,128 | 24,022 | 30,150 |
| Total collateral received (pledged) (b) | - | - | - |
| Net amount (c) | 6,128 | 24,022 | 30,150 |
| (a) | Centrally cleared swaps are included within payable/receivable for variation margin on the Statement of Assets and Liabilities. |
| (b) | In some instances, the actual collateral received and/or pledged may be more than the amount shown due to overcollateralization. |
| (c) | Represents the net amount due from/(to) counterparties in the event of default. |
Columbia Capital Allocation Aggressive Portfolio
| | JPMorgan ($) | Morgan
Stanley ($) | Total ($) |
| Assets | | | |
| Centrally cleared credit default swap contracts (a) | - | 9,132 | 9,132 |
| Forward foreign currency exchange contracts | 21,476 | - | 21,476 |
| Total assets | 21,476 | 9,132 | 30,608 |
| Liabilities | | | |
| Centrally cleared credit default swap contracts (a) | - | 207 | 207 |
| Forward foreign currency exchange contracts | 14,111 | - | 14,111 |
| Total liabilities | 14,111 | 207 | 14,318 |
| Total financial and derivative net assets | 7,365 | 8,925 | 16,290 |
| Total collateral received (pledged) (b) | - | - | - |
| Net amount (c) | 7,365 | 8,925 | 16,290 |
| (a) | Centrally cleared swaps are included within payable/receivable for variation margin on the Statement of Assets and Liabilities. |
| (b) | In some instances, the actual collateral received and/or pledged may be more than the amount shown due to overcollateralization. |
| (c) | Represents the net amount due from/(to) counterparties in the event of default. |
Security transactions
Security transactions are accounted for on the trade date. Cost is determined and gains (losses) are based upon the specific identification method for both financial statement and federal income tax purposes.
Income recognition
Corporate actions and dividend income are generally recorded net of any non-reclaimable tax withholdings, on the ex-dividend date or upon receipt of ex-dividend notification in the case of certain foreign securities.
The Funds may receive distributions from holdings in equity securities, business development companies (BDCs), exchange-traded funds (ETFs), limited partnerships (LPs), other regulated investment companies (RICs), and real estate investment trusts (REITs), which report information on the tax character of their distributions annually. These distributions are allocated to dividend income, capital gain and return of capital based on actual information reported. Return of capital is recorded as a reduction of the cost basis of securities held. If the Fund no longer owns the applicable securities, return of capital is recorded as a realized gain. With respect to REITs, to the extent actual information has not yet been reported,
| 140 | Columbia Capital Allocation Portfolios | Annual Report 2018 |
Notes to Financial Statements (continued)
January 31, 2018
estimates for return of capital are made by the Fund’s management. Management’s estimates are subsequently adjusted when the actual character of the distributions is disclosed by the REITs, which could result in a proportionate change in return of capital to shareholders.
Awards from class action litigation are recorded as a reduction of cost basis if the Fund still owns the applicable securities on the payment date. If the Fund no longer owns the applicable securities, the proceeds are recorded as realized gains.
Income and capital gain distributions from the Underlying Funds, if any, are recorded on the ex-dividend date.
Expenses
General expenses of the Trusts are allocated to the Funds and other funds of the Trust based upon relative net assets or other expense allocation methodologies determined by the nature of the expense. Expenses directly attributable to a Fund are charged to that Fund. Expenses directly attributable to a specific class of shares are charged to that share class.
Determination of class net asset value
All income, expenses (other than class-specific expenses which are charged directly to that share class, as shown in the Statement of Operations) and realized and unrealized gains (losses) are allocated to each class of a Fund on a daily basis, based on the relative net assets of each class, for purposes of determining the net asset value of each class.
Federal income tax status
For federal income tax purposes, each Fund is treated as a separate entity. The Funds intend to qualify each year as separate regulated investment companies under Subchapter M of the Internal Revenue Code, as amended, and will distribute substantially all of their investment company taxable income and net capital gain, if any, for their tax year, and as such will not be subject to federal income taxes. In addition, the Funds intend to distribute in each calendar year substantially all of their ordinary income, capital gain and net income and certain other amounts, if any, such that the Funds should not be subject to federal excise tax. Therefore, no federal income or excise tax provisions are recorded.
Foreign taxes
The Funds may be subject to foreign taxes on income, gains on investments or currency repatriation, a portion of which may be recoverable. The Fund will accrue such taxes and recoveries, as applicable, based upon its current interpretation of tax rules and regulations that exist in the markets in which it invests.
Realized gains in certain countries may be subject to foreign taxes at the Fund level, based on statutory rates. The Fund accrues for such foreign taxes on realized and unrealized gains at the appropriate rate for each jurisdiction, as applicable. The amount, if any, is disclosed as a liability on the Statement of Assets and Liabilities.
Distributions to shareholders
Distributions from net investment income, if any, are declared and paid quarterly for Columbia Capital Allocation Conservative Portfolio, Columbia Capital Allocation Moderate Conservative Portfolio, Columbia Capital Allocation Moderate Portfolio and Columbia Capital Allocation Moderate Aggressive Portfolio. Distributions from net investment income, if any, are declared and paid annually for Columbia Capital Allocation Aggressive Portfolio. Net realized capital gains, if any, are distributed at least annually. Income distributions and capital gain distributions are determined in accordance with federal income tax regulations, which may differ from GAAP.
Guarantees and indemnifications
Under the Trusts’ organizational documents and, in some cases, by contract, its officers and trustees are indemnified against certain liabilities arising out of the performance of their duties to the Trust or its funds. In addition, certain of the Funds’ contracts with their service providers contain general indemnification clauses. The Funds’ maximum exposure under these arrangements is unknown since the amount of any future claims that may be made against the Funds cannot be determined, and the Funds have no historical basis for predicting the likelihood of any such claims.
Columbia Capital Allocation Portfolios | Annual Report 2018
| 141 |
Notes to Financial Statements (continued)
January 31, 2018
Recent accounting pronouncement
Accounting Standards Update 2017-08 Premium Amortization on Purchased Callable Debt Securities
In March 2017, the Financial Accounting Standards Board issued Accounting Standards Update (ASU) No. 2017-08 Premium Amortization on Purchased Callable Debt Securities. ASU No. 2017-08 updates the accounting standards to shorten the amortization period for certain purchased callable debt securities, held at a premium, to be amortized to the earliest call date. The update applies to securities with explicit, noncontingent call features that are callable at fixed prices and on preset dates. The standard is effective for annual periods beginning after December 15, 2018 and interim periods within those fiscal years. At this time, management is evaluating the implication of this guidance and the impact it will have on the financial statement amounts and footnote disclosures, if any.
Note 3. Fees and other transactions with affiliates
Management services fees and underlying fund fees
The Funds have entered into a Management Agreement with Columbia Management Investment Advisers, LLC (the Investment Manager). Under the Management Agreement, the Investment Manager provides the Fund with investment research and advice, as well as administrative and accounting services. The management services fee is an annual fee that is a blend of (i) 0.02% on assets invested in Columbia proprietary funds (excluding any underlying funds that do not pay a management services fee (or investment advisory services fee, as applicable) to the Investment Manager), (ii) 0.12% on assets invested in non-exchange-traded third-party advised mutual funds and (iii) 0.57% on assets invested in all other securities, including other funds advised by the Investment Manager that do not pay a management services fee (or investment advisory services fee, as applicable), exchange-traded funds, derivatives and individual securities.
The effective management services fee rates, net of any waiver, based on each Fund’s average daily net assets for the year ended January 31, 2018 were as follows:
| | Effective management services fee rate (%) |
| Columbia Capital Allocation Conservative Portfolio | 0.10 |
| Columbia Capital Allocation Moderate Conservative Portfolio | 0.09 |
| Columbia Capital Allocation Moderate Portfolio | 0.07 |
| Columbia Capital Allocation Moderate Aggressive Portfolio | 0.10 |
| Columbia Capital Allocation Aggressive Portfolio | 0.08 |
In addition to the fees and expenses which the Funds bear directly, the Funds indirectly bear a pro rata share of the fees and expenses of the Underlying Funds in which the Funds invest. Because the Underlying Funds have varied expense and fee levels and the Funds may own different proportions of Underlying Funds at different times, the amount of fees and expenses incurred indirectly by the Funds will vary. These expenses are not reflected in the expenses shown in Statement of Operations and are not included in the ratios to average net assets shown in the Financial Highlights.
Other expenses
Other expenses are for, among other things, miscellaneous expenses of the Funds or the Board of Trustees, including payments to Board Services Corp., a company that dissolved on August 25, 2017, which had provided limited administrative services to the Funds and the Board of Trustees. That company’s expenses included boardroom and office expense, employee compensation, employee health and retirement benefits, and certain other expenses. For the year ended January 31, 2018, other expenses paid by the Fund to this company were as follows:
| Fund | Amount ($) |
| Columbia Capital Allocation Conservative Portfolio | 851 |
| Columbia Capital Allocation Moderate Conservative Portfolio | 1,145 |
| Columbia Capital Allocation Moderate Portfolio | 1,910 |
| Columbia Capital Allocation Moderate Aggressive Portfolio | 2,412 |
| Columbia Capital Allocation Aggressive Portfolio | 1,199 |
| 142 | Columbia Capital Allocation Portfolios | Annual Report 2018 |
Notes to Financial Statements (continued)
January 31, 2018
Compensation of board members
Members of the Board of Trustees, who are not officers or employees of the Investment Manager or Ameriprise Financial, are compensated for their services to the Funds as disclosed in the Statement of Operations. Under a Deferred Compensation Plan (the Plan), these members of the Board of Trustees may elect to defer payment of up to 100% of their compensation. Deferred amounts are treated as though equivalent dollar amounts had been invested in shares of certain funds managed by the Investment Manager. Each Fund’s liability for these amounts is adjusted for market value changes and remains in the Funds until distributed in accordance with the Plan. All amounts payable under the Plan constitute a general unsecured obligation of the Funds.
Compensation of Chief Compliance Officer
The Board of Trustees has appointed a Chief Compliance Officer to the Funds in accordance with federal securities regulations. A portion of the Chief Compliance Officer’s total compensation is allocated to the Funds as disclosed in the Statement of Operations, along with other affiliated funds governed by the Board of Trustees, based on relative net assets.
Transfer agency fees
Under a Transfer and Dividend Disbursing Agent Agreement, Columbia Management Investment Services Corp. (the Transfer Agent), an affiliate of the Investment Manager and a wholly-owned subsidiary of Ameriprise Financial, is responsible for providing transfer agency services to the Fund. The Transfer Agent has contracted with DST Asset Manager Solutions, Inc. (DST) to serve as sub-transfer agent. The Transfer Agent pays the fees of DST for services as sub-transfer agent and DST is not entitled to reimbursement for such fees from the Fund (with the exception of out-of-pocket fees).
The Fund pays the Transfer Agent a monthly transfer agency fee based on the number or the average value of accounts, depending on the type of account. In addition, the Fund pays the Transfer Agent a fee for shareholder services based on the number of accounts or on a percentage of the average aggregate value of the Fund’s shares maintained in omnibus accounts up to the lesser of the amount charged by the financial intermediary or a cap established by the Board of Trustees from time to time.
The Transfer Agent also receives compensation from the Fund for various shareholder services and reimbursements for certain out-of-pocket fees. Effective August 1, 2017, total transfer agency fees for Class K, Institutional 2 Class and Institutional 3 Class shares are subject to an annual limitation of not more than 0.07%, 0.07% and 0.02%, respectively, of the average daily net assets attributable to each share class. Prior to August 1, 2017, these limitations were 0.075% for Class K and Institutional 2 Class shares and 0.025% for Institutional 3 Class shares.
For the year ended January 31, 2018, the Funds’ effective transfer agency fee rates as a percentage of average daily net assets of each class were as follows:
| Fund | Class A
(%) | Advisor
Class (%) | Class B
(%) | Class C
(%) | Institutional
Class (%) | Institutional 2
Class (%) | Institutional 3
Class (%) | Class K
(%) | Class R
(%) | Class V
(%) |
| Columbia Capital Allocation Conservative Portfolio | 0.10 | 0.10 | 0.06 | 0.10 | 0.10 | 0.07 | 0.02 | 0.072 | 0.10 | — |
| Columbia Capital Allocation Moderate Conservative Portfolio | 0.09 | 0.09 | 0.05 | 0.09 | 0.09 | 0.07 | 0.02 | 0.068 | 0.09 | — |
| Columbia Capital Allocation Moderate Portfolio | 0.09 | 0.08 | 0.05 | 0.09 | 0.09 | 0.06 | 0.02 | 0.061 | 0.09 | — |
| Columbia Capital Allocation Moderate Aggressive Portfolio | 0.12 | 0.11 | 0.07 | 0.12 | 0.12 | 0.06 | 0.01 | 0.060 | 0.12 | 0.12 |
| Columbia Capital Allocation Aggressive Portfolio | 0.11 | 0.11 | 0.07 | 0.11 | 0.10 | 0.07 | 0.01 | 0.070 | 0.11 | — |
Columbia Capital Allocation Portfolios | Annual Report 2018
| 143 |
Notes to Financial Statements (continued)
January 31, 2018
An annual minimum account balance fee of $20 may apply to certain accounts with a value below the applicable share class’s initial minimum investment requirements to reduce the impact of small accounts on transfer agency fees. These minimum account balance fees are remitted to the Funds and recorded as part of expense reductions in the Statement of Operations.
For the year ended January 31, 2018, these minimum account balance fees reduced total expenses as follows:
| Fund | Amount ($) |
| Columbia Capital Allocation Conservative Portfolio | — |
| Columbia Capital Allocation Moderate Conservative Portfolio | 100 |
| Columbia Capital Allocation Moderate Portfolio | 100 |
| Columbia Capital Allocation Moderate Aggressive Portfolio | 10,264 |
| Columbia Capital Allocation Aggressive Portfolio | 140 |
Plan administration fees
Under a Plan Administration Services Agreement with the Transfer Agent, each Fund pays an annual fee at a rate of 0.25% of the Fund’s average daily net assets attributable to Class K shares for the provision of various administrative, recordkeeping, communication and educational services.
Distribution and service fees
The Funds have entered into an agreement with Columbia Management Investment Distributors, Inc. (the Distributor), an affiliate of the Investment Manager and a wholly-owned subsidiary of Ameriprise Financial, for distribution and shareholder services. The Board of Trustees has approved and the Fund has adopted, distribution and shareholder service plans (the Plans) applicable to certain share classes, which set the distribution and service fees for the Fund. These fees are calculated daily and are intended to compensate the Distributor and/or eligible selling and/or servicing agents for selling shares of the Funds and providing services to investors.
Under the Plans, each Fund pays a monthly fee to the Distributor at the annual rates of up to 0.25% of each Fund’s average daily net assets attributable to Class A shares, up to 1.00% of each Fund’s average daily net assets attributable to Class B and Class C shares and up to 0.50% of each Fund’s average daily net assets attributable to Class R shares (of which up to 0.25% may be used for shareholder services for Columbia Capital Allocation Conservative Portfolio, Columbia Capital Allocation Moderate Portfolio and Columbia Capital Allocation Aggressive Portfolio). As a result of all Class B shares of the Fund being redeemed or converted to Class A shares, August 4, 2017 was the last day the Fund paid a distribution and service fee for Class B shares.
For Class B and Class C shares of the Funds, of 1.00% fee, up to 0.75% is reimbursed for distribution expenses.
The amount of distribution expenses incurred by the Distributor and not yet reimbursed (unreimbursed expense) for each Fund was approximately as follows:
| Fund | Class C ($) |
| Columbia Capital Allocation Conservative Portfolio | 283,000 |
| Columbia Capital Allocation Moderate Conservative Portfolio | 480,000 |
| Columbia Capital Allocation Moderate Portfolio | 1,676,000 |
| Columbia Capital Allocation Moderate Aggressive Portfolio | 1,215,000 |
| Columbia Capital Allocation Aggressive Portfolio | 296,000 |
These amounts are based on the most recent information available as of December 31, 2017, and may be recovered from future payments under the distribution plan or CDSCs. To the extent the unreimbursed expense has been fully recovered, the distribution fee is reduced.
| 144 | Columbia Capital Allocation Portfolios | Annual Report 2018 |
Notes to Financial Statements (continued)
January 31, 2018
Shareholder services fees
Columbia Capital Allocation Moderate Aggressive Portfolio has adopted a shareholder services plan that permits it to pay for certain services provided to Class V shareholders by their selling and/or servicing agents. The Fund may pay shareholder servicing fees up to an aggregate annual rate of 0.50% of the Fund’s average daily net assets attributable to Class V shares (comprised of up to 0.25% for shareholder liaison services and up to 0.25% for administrative support services). These fees are currently limited to an aggregate annual rate of not more than 0.25% of the Fund’s average daily net assets attributable to Class V shares.
Sales charges (unaudited)
Sales charges, including front-end and CDSCs, received by the Distributor for distributing each Fund’s shares for the year ended January 31, 2018, if any, are as follows:
| Fund | Class A
($) | Class B
($) | Class C
($) | Class V
($) |
| Columbia Capital Allocation Conservative Portfolio | 176,343 | — | 3,245 | — |
| Columbia Capital Allocation Moderate Conservative Portfolio | 425,581 | — | 7,162 | — |
| Columbia Capital Allocation Moderate Portfolio | 1,587,384 | 4,017 | 19,024 | — |
| Columbia Capital Allocation Moderate Aggressive Portfolio | 1,826,958 | — | 24,655 | 5,841 |
| Columbia Capital Allocation Aggressive Portfolio | 966,484 | — | 11,095 | — |
Expenses waived/reimbursed by the Investment Manager and its affiliates
The Investment Manager and certain of its affiliates have contractually agreed to waive fees and/or reimburse expenses (excluding certain fees and expenses described below) for the period(s) disclosed below, unless sooner terminated at the sole discretion of the Board of Trustees, so that each Fund’s net operating expenses, after giving effect to fees waived/expenses reimbursed and any balance credits and/or overdraft charges from the Funds’ custodian, do not exceed the following annual rate(s) as a percentage of the class’ average daily net assets:
| | June 1, 2017 through May 31, 2018 |
| Fund | Class A
(%) | Advisor
Class (%) | Class C
(%) | Institutional
Class (%) | Institutional 2
Class (%) | Institutional 3
Class (%) | Class K
(%) | Class R
(%) | Class V
(%) |
| Columbia Capital Allocation Conservative Portfolio | 0.49 | 0.24 | 1.24 | 0.24 | 0.235 | 0.185 | 0.485 | 0.74 | N/A |
| Columbia Capital Allocation Moderate Conservative Portfolio | 0.49 | 0.24 | 1.24 | 0.24 | 0.235 | 0.185 | 0.485 | 0.74 | N/A |
| Columbia Capital Allocation Moderate Portfolio | 0.47 | 0.22 | 1.22 | 0.22 | 0.215 | 0.165 | 0.465 | 0.72 | N/A |
| Columbia Capital Allocation Moderate Aggressive Portfolio | 0.51 | 0.26 | 1.26 | 0.26 | 0.235 | 0.185 | 0.485 | 0.76 | 0.51 |
| Columbia Capital Allocation Aggressive Portfolio | 0.51 | 0.26 | 1.26 | 0.26 | 0.235 | 0.185 | 0.485 | 0.76 | N/A |
| | Prior to June 1, 2017 |
| Fund | Class A
(%) | Advisor
Class (%) | Class C
(%) | Institutional
Class (%) | Institutional 2
Class (%) | Institutional 3
Class (%) | Class K
(%) | Class R
(%) | Class V
(%) |
| Columbia Capital Allocation Conservative Portfolio | 0.49 | 0.24 | 1.24 | 0.24 | 0.19 | 0.14 | 0.44 | 0.74 | N/A |
| Columbia Capital Allocation Moderate Conservative Portfolio | 0.49 | 0.24 | 1.24 | 0.24 | 0.19 | 0.14 | 0.44 | 0.74 | N/A |
| Columbia Capital Allocation Moderate Portfolio | 0.47 | 0.22 | 1.22 | 0.22 | 0.17 | 0.12 | 0.42 | 0.72 | N/A |
| Columbia Capital Allocation Moderate Aggressive Portfolio | 0.51 | 0.26 | 1.26 | 0.26 | 0.21 | 0.16 | 0.46 | 0.76 | 0.51 |
| Columbia Capital Allocation Aggressive Portfolio | 0.51 | 0.26 | 1.26 | 0.26 | 0.21 | 0.16 | 0.46 | 0.76 | N/A |
Under the agreement governing these fee waivers and/or expense reimbursement arrangements, the following fees and expenses are excluded from the waiver/reimbursement commitment, and therefore will be paid by the Fund, if applicable: taxes (including foreign transaction taxes), expenses associated with investments in affiliated and non-affiliated pooled investment vehicles (including mutual funds and exchange-traded funds), transaction costs and brokerage commissions, costs related to any securities lending program, dividend expenses associated with securities sold short, inverse floater program fees and expenses, transaction charges and interest on borrowed money, interest, infrequent and/or unusual expenses and any other expenses the exclusion of which is specifically approved by the Board of Trustees. Each
Columbia Capital Allocation Portfolios | Annual Report 2018
| 145 |
Notes to Financial Statements (continued)
January 31, 2018
Fund’s management services fee is also excluded from the waiver/reimbursement commitment and is therefore paid by the Funds. This agreement may be modified or amended only with approval from the Investment Manager, certain of its affiliates and the Fund. Any fees waived and/or expenses reimbursed under the expense reimbursement arrangements described above are not recoverable by the Investment Manager or its affiliates in future periods.
Note 4. Federal tax information
The timing and character of income and capital gain distributions are determined in accordance with income tax regulations, which may differ from GAAP because of temporary or permanent book to tax differences.
At January 31, 2018, these differences were primarily due to differing treatment for deferral/reversal of wash sale losses, passive foreign investment company (PFIC) holdings, re-characterization of distributions for investments, derivative investments, trustees’ deferred compensation and foreign currency transactions. To the extent these differences were permanent, reclassifications were made among the components of the Fund’s net assets in the Statement of Assets and Liabilities. Temporary differences do not require reclassifications.
In the Statement of Assets and Liabilities the following reclassifications were made:
| Fund | Undistributed net
investment
income ($) | Accumulated
net realized
gain ($) | Paid in capital
increase
increase ($) |
| Columbia Capital Allocation Conservative Portfolio | 413,020 | (413,020) | — |
| Columbia Capital Allocation Moderate Conservative Portfolio | 1,347,733 | (1,347,733) | — |
| Columbia Capital Allocation Moderate Portfolio | 4,687,472 | (4,687,473) | 1 |
| Columbia Capital Allocation Moderate Aggressive Portfolio | 6,423,154 | (6,423,154) | — |
| Columbia Capital Allocation Aggressive Portfolio | 3,217,642 | (3,217,642) | — |
Net investment income (loss) and net realized gains (losses), as disclosed in the Statement of Operations, and net assets were not affected by these reclassifications.
The tax character of distributions paid during the years indicated was as follows:
| | Year Ended January 31, 2018 | Year Ended January 31, 2017 |
| Fund | Ordinary
income ($) | Long-term
capital gains ($) | Total ($) | Ordinary
income ($) | Long-term
capital gains ($) | Total ($) |
| Columbia Capital Allocation Conservative Portfolio | 5,276,563 | 238,125 | 5,514,688 | 4,117,122 | 2,156,875 | 6,273,997 |
| Columbia Capital Allocation Moderate Conservative Portfolio | 13,127,567 | 11,629,590 | 24,757,157 | 9,766,303 | 11,609,575 | 21,375,878 |
| Columbia Capital Allocation Moderate Portfolio | 35,210,863 | 64,277,288 | 99,488,151 | 28,811,684 | 37,896,551 | 66,708,235 |
| Columbia Capital Allocation Moderate Aggressive Portfolio | 51,258,055 | 104,329,187 | 155,587,242 | 28,654,252 | 76,281,211 | 104,935,463 |
| Columbia Capital Allocation Aggressive Portfolio | 14,814,073 | 38,635,635 | 53,449,708 | 7,265,468 | 24,879,383 | 32,144,851 |
Short-term capital gain distributions, if any, are considered ordinary income distributions for tax purposes.
At January 31, 2018, the components of distributable earnings on a tax basis were as follows:
| Fund | Undistributed
ordinary
income ($) | Undistributed
long-term
capital gains ($) | Capital loss
carryforwards ($) | Net unrealized
appreciation ($) |
| Columbia Capital Allocation Conservative Portfolio | 289,087 | 3,436,441 | — | 7,547,513 |
| Columbia Capital Allocation Moderate Conservative Portfolio | 2,528,285 | 12,458,610 | — | 36,476,047 |
| Columbia Capital Allocation Moderate Portfolio | 8,217,047 | 42,564,900 | — | 162,729,815 |
| Columbia Capital Allocation Moderate Aggressive Portfolio | 15,117,984 | 77,006,019 | — | 316,366,004 |
| Columbia Capital Allocation Aggressive Portfolio | 5,009,024 | 31,127,126 | — | 132,475,469 |
| 146 | Columbia Capital Allocation Portfolios | Annual Report 2018 |
Notes to Financial Statements (continued)
January 31, 2018
At January 31, 2018, the cost of all investments for federal income tax purposes along with the aggregate gross unrealized appreciation and depreciation based on that cost was:
| Fund | Tax cost ($) | Gross
unrealized
appreciation ($) | Gross
unrealized
(depreciation) ($) | Net unrealized
appreciation ($) |
| Columbia Capital Allocation Conservative Portfolio | 247,207,867 | 11,672,598 | (4,125,085) | 7,547,513 |
| Columbia Capital Allocation Moderate Conservative Portfolio | 569,311,071 | 44,128,320 | (7,652,273) | 36,476,047 |
| Columbia Capital Allocation Moderate Portfolio | 1,488,748,073 | 185,799,010 | (23,069,195) | 162,729,815 |
| Columbia Capital Allocation Moderate Aggressive Portfolio | 2,002,785,384 | 328,547,075 | (12,181,071) | 316,366,004 |
| Columbia Capital Allocation Aggressive Portfolio | 659,254,312 | 138,347,881 | (5,872,412) | 132,475,469 |
Tax cost of investments and unrealized appreciation/(depreciation) may also include timing differences that do not constitute adjustments to tax basis.
The following capital loss carryforwards, determined at January 31, 2018, may be available to reduce taxable income arising from future net realized gains on investments, if any, to the extent permitted by the Internal Revenue Code. Capital loss carryforwards with no expiration are required to be utilized prior to any capital losses which carry an expiration date. As a result of this ordering rule, capital loss carryforwards which carry an expiration date may be more likely to expire unused. In addition, for the year ended January 31, 2018, capital loss carryforwards utilized, expired unused and permanently lost, if any, were as follows:
| Fund | 2018 ($) | 2019 ($) | No expiration
short-term ($) | No expiration
long-term ($) | Total ($) | Utilized ($) | Expired ($) | Permanently
lost ($) |
| Columbia Capital Allocation Conservative Portfolio | — | — | — | — | — | 869,431 | — | — |
Management of the Funds has concluded that there are no significant uncertain tax positions in the Funds that would require recognition in the financial statements. However, management’s conclusion may be subject to review and adjustment at a later date based on factors including, but not limited to, new tax laws, regulations, and administrative interpretations (including relevant court decisions). Generally, the Funds’ federal tax returns for the prior three fiscal years remain subject to examination by the Internal Revenue Service.
Note 5. Portfolio information
For the year ended January 31, 2018, the cost of purchases and proceeds from sales of securities, excluding short-term investments and derivatives, if any, for each Fund aggregated to:
| | Purchases
($) | Proceeds
from sales
($) |
| Columbia Capital Allocation Conservative Portfolio | 27,216,014 | 48,961,948 |
| Columbia Capital Allocation Moderate Conservative Portfolio | 47,626,721 | 103,319,177 |
| Columbia Capital Allocation Moderate Portfolio | 133,317,372 | 175,132,654 |
| Columbia Capital Allocation Moderate Aggressive Portfolio | 167,195,699 | 288,446,315 |
| Columbia Capital Allocation Aggressive Portfolio | 86,452,166 | 94,252,803 |
The amount of purchase and sale activity impacts the portfolio turnover rate reported in the Financial Highlights.
Note 6. Affiliated money market fund
Each Fund may invest in Columbia Short-Term Cash Fund, an affiliated money market fund established for the exclusive use by each Fund and other affiliated funds (the Affiliated MMF). The income earned by the Funds from such investments is included as Dividends - affiliated issuers in the Statement of Operations. As an investing fund, each Fund indirectly bears its proportionate share of the expenses of the Affiliated MMF. The Affiliated MMF prices its shares with a floating net asset
Columbia Capital Allocation Portfolios | Annual Report 2018
| 147 |
Notes to Financial Statements (continued)
January 31, 2018
value. In addition, the Board of Trustees of the Affiliated MMF may impose a fee on redemptions (sometimes referred to as a liquidity fee) or temporarily suspend redemptions (sometimes referred to as imposing a redemption gate) in the event its liquidity falls below regulatory limits.
Note 7. Line of credit
Each Fund has access to a revolving credit facility with a syndicate of banks led by Citibank, N.A., HSBC Bank USA, N.A. and JPMorgan Chase Bank, N.A. whereby the Funds may borrow for the temporary funding of shareholder redemptions or for other temporary or emergency purposes. The credit facility, which is a collective agreement between the Funds and certain other funds managed by the Investment Manager, severally and not jointly, permits collective borrowings up to $1 billion. Interest is charged to each participating fund based on its borrowings at a rate equal to the higher of (i) the overnight federal funds rate plus 1.00% or (ii) the one-month LIBOR rate plus 1.00%. Each borrowing under the credit facility matures no later than 60 days after the date of borrowing. Each Fund also pays a commitment fee equal to its pro rata share of the amount of the credit facility at a rate of 0.15% per annum. The commitment fee is included in other expenses in the Statement of Operations.
No Fund had borrowings during the year ended January 31, 2018.
Note 8. Significant risks
Shareholder concentration risk
At January 31, 2018, certain shareholder accounts owned more than 10% of the outstanding shares of one or more of the Funds. For unaffiliated shareholder accounts, the Funds have no knowledge about whether any portion of those shares were owned beneficially. Subscription and redemption activity of these accounts may have a significant effect on the operations of the Funds. In the case of a large redemption, the Fund may be forced to sell investments at inopportune times, including its liquid positions, which may result in Fund losses and the Fund holding a higher percentage of less liquid positions. Large redemptions could result in decreased economies of scale and increased operating expenses for non-redeeming Fund shareholders.
The number of accounts and aggregate percentages of shares outstanding held therein were as follows:
| Fund | Number of
unaffiliated
accounts | Percentage of
shares
outstanding
held —
unaffiliated (%) | Percentage of
shares
outstanding
held —
affiliated (%) |
| Columbia Capital Allocation Conservative Portfolio | — | — | 79.6 |
| Columbia Capital Allocation Moderate Conservative Portfolio | — | — | 78.6 |
| Columbia Capital Allocation Moderate Portfolio | — | — | 90.0 |
| Columbia Capital Allocation Moderate Aggressive Portfolio | 1 | 14.2 | 57.5 |
| Columbia Capital Allocation Aggressive Portfolio | — | — | 88.4 |
Note 9. Subsequent events
Management has evaluated the events and transactions that have occurred through the date the financial statements were issued and noted no items requiring adjustment of the financial statements or additional disclosure.
Note 10. Information regarding pending and settled legal proceedings
Ameriprise Financial and certain of its affiliates have historically been involved in a number of legal, arbitration and regulatory proceedings, including routine litigation, class actions, and governmental actions, concerning matters arising in connection with the conduct of their business activities. Ameriprise Financial believes that the Funds are not currently the subject of, and that neither Ameriprise Financial nor any of its affiliates are the subject of, any pending legal, arbitration or regulatory proceedings that are likely to have a material adverse effect on the Funds or the ability of Ameriprise Financial or its affiliates
| 148 | Columbia Capital Allocation Portfolios | Annual Report 2018 |
Notes to Financial Statements (continued)
January 31, 2018
to perform under their contracts with the Funds. Ameriprise Financial is required to make quarterly (10-Q), annual (10-K) and, as necessary, 8-K filings with the Securities and Exchange Commission (SEC) on legal and regulatory matters that relate to Ameriprise Financial and its affiliates. Copies of these filings may be obtained by accessing the SEC website at www.sec.gov.
There can be no assurance that these matters, or the adverse publicity associated with them, will not result in increased Fund redemptions, reduced sale of Fund shares or other adverse consequences to the Funds. Further, although we believe proceedings are not likely to have a material adverse effect on the Funds or the ability of Ameriprise Financial or its affiliates to perform under their contracts with the Funds, these proceedings are subject to uncertainties and, as such, we are unable to estimate the possible loss or range of loss that may result. An adverse outcome in one or more of these proceedings could result in adverse judgments, settlements, fines, penalties or other relief that could have a material adverse effect on the consolidated financial condition or results of operations of Ameriprise Financial.
Columbia Capital Allocation Portfolios | Annual Report 2018
| 149 |
Report of Independent Registered Public Accounting Firm
To the Trustees of Columbia Funds Series Trust and Shareholders of Columbia Capital Allocation Moderate Conservative Portfolio and Columbia Capital Allocation Moderate Aggressive Portfolio
Opinions on the Financial Statements
We have audited the accompanying statements of assets and liabilities, including the portfolio of investments, of Columbia Capital Allocation Moderate Conservative Portfolio and Columbia Capital Allocation Moderate Aggressive Portfolio (two of the funds constituting Columbia Funds Series Trust, hereafter collectively referred to as the "Funds") as of January 31, 2018, the related statements of operations for the year ended January 31, 2018, the statements of changes in net assets for each of the two years in the period ended January 31, 2018, including the related notes, and the financial highlights for each of the periods indicated therein (collectively referred to as the “financial statements”). In our opinion, the financial statements present fairly, in all material respects, the financial position of each of the Funds as of January 31, 2018, the results of each of their operations for the year then ended, the changes in each of their net assets for each of the two years in the period ended January 31, 2018 and each of the financial highlights for each of the periods indicated therein in conformity with accounting principles generally accepted in the United States of America.
Basis for Opinion
These financial statements are the responsibility of the Funds’ management. Our responsibility is to express an opinion on the Funds’ financial statements based on our audits. We are a public accounting firm registered with the Public Company Accounting Oversight Board (United States) (“PCAOB”) and are required to be independent with respect to the Funds in accordance with the U.S. federal securities laws and the applicable rules and regulations of the Securities and Exchange Commission and the PCAOB.
We conducted our audits of these financial statements in accordance with the standards of the PCAOB. Those standards require that we plan and perform the audit to obtain reasonable assurance about whether the financial statements are free of material misstatement, whether due to error or fraud.
Our audits included performing procedures to assess the risks of material misstatement of the financial statements, whether due to error or fraud, and performing procedures that respond to those risks. Such procedures included examining, on a test basis, evidence regarding the amounts and disclosures in the financial statements. Our audits also included evaluating the accounting principles used and significant estimates made by management, as well as evaluating the overall presentation of the financial statements. Our procedures included confirmation of securities owned as of January 31, 2018 by correspondence with the custodian, transfer agent and brokers. We believe that our audits provide a reasonable basis for our opinions.
/s/PricewaterhouseCoopers LLP
Minneapolis, Minnesota
March 23, 2018
We have served as auditors of one or more investment companies within the Columbia Funds Complex since 1977.
To the Trustees of Columbia Funds Series Trust II and Shareholders of Columbia Capital Allocation Conservative Portfolio, Columbia Capital Allocation Moderate Portfolio and Columbia Capital Allocation Aggressive Portfolio
Opinions on the Financial Statements
We have audited the accompanying statements of assets and liabilities, including the portfolio of investments, of Columbia Capital Allocation Conservative Portfolio, Columbia Capital Allocation Moderate Portfolio and Columbia Capital Allocation Aggressive Portfolio (three of the funds constituting Columbia Funds Series Trust II, hereafter collectively referred to as the "Funds") as of January 31, 2018, the related statements of operations for the year ended January 31, 2018, the statements of changes in net assets for each of the two years in the period ended January 31, 2018, including the related notes, and the financial highlights for each of the periods indicated therein (collectively referred to as the “financial statements”). In our
| 150 | Columbia Capital Allocation Portfolios | Annual Report 2018 |
Report of Independent Registered Public Accounting Firm (continued)
opinion, the financial statements present fairly, in all material respects, the financial position of each of the Funds as of January 31, 2018, the results of each of their operations for the year then ended, the changes in each of their net assets for each of the two years in the period ended January 31, 2018 and each of the financial highlights for each of the periods indicated therein in conformity with accounting principles generally accepted in the United States of America.
Basis for Opinion
These financial statements are the responsibility of the Funds’ management. Our responsibility is to express an opinion on the Funds’ financial statements based on our audits. We are a public accounting firm registered with the Public Company Accounting Oversight Board (United States) (“PCAOB”) and are required to be independent with respect to the Funds in accordance with the U.S. federal securities laws and the applicable rules and regulations of the Securities and Exchange Commission and the PCAOB.
We conducted our audits of these financial statements in accordance with the standards of the PCAOB. Those standards require that we plan and perform the audit to obtain reasonable assurance about whether the financial statements are free of material misstatement, whether due to error or fraud.
Our audits included performing procedures to assess the risks of material misstatement of the financial statements, whether due to error or fraud, and performing procedures that respond to those risks. Such procedures included examining, on a test basis, evidence regarding the amounts and disclosures in the financial statements. Our audits also included evaluating the accounting principles used and significant estimates made by management, as well as evaluating the overall presentation of the financial statements. Our procedures included confirmation of securities owned as of January 31, 2018 by correspondence with the custodian, transfer agent and brokers. We believe that our audits provide a reasonable basis for our opinions.
/s/PricewaterhouseCoopers LLP
Minneapolis, Minnesota
March 23, 2018
We have served as auditors of one or more investment companies within the Columbia Funds Complex since 1977.
Columbia Capital Allocation Portfolios | Annual Report 2018
| 151 |
Federal Income Tax Information
(Unaudited)
The Funds hereby designate the following tax attributes for the fiscal year ended January 31, 2018. Shareholders will be notified in early 2019 of the amounts for use in preparing 2018 income tax returns.
| | Qualified
dividend
income | Dividends
received
deduction | Capital
gain
dividend | Foreign
taxes paid
to foreign
countries | Foreign
taxes paid
per share
to foreign
countries | Foreign
source
income | Foreign
source
income per
share |
| Columbia Capital Allocation Conservative Portfolio | 18.23% | 11.79% | $3,858,294 | $43,244 | $0.00 | $567,568 | $0.02 |
| Columbia Capital Allocation Moderate Conservative Portfolio | 26.23% | 18.02% | $21,489,393 | $135,978 | $0.00 | $1,753,671 | $0.03 |
| Columbia Capital Allocation Moderate Portfolio | 25.73% | 18.32% | $79,063,283 | $439,202 | $0.00 | $4,521,431 | $0.03 |
| Columbia Capital Allocation Moderate Aggressive Portfolio | 39.45% | 28.56% | $143,078,248 | $752,876 | $0.00 | $6,308,925 | $0.04 |
| Columbia Capital Allocation Aggressive Portfolio | 51.80% | 37.92% | $54,963,805 | $315,729 | $0.01 | $2,208,007 | $0.04 |
Qualified dividend income. For taxable, non-corporate shareholders, the percentage of ordinary income distributed during the fiscal year that represents qualified dividend income subject to reduced tax rates.
Dividends received deduction. The percentage of ordinary income distributed during the fiscal year that qualifies for the corporate dividends received deduction.
Capital gain dividend. The Fund designates as a capital gain dividend the amount reflected above, or if subsequently determined to be different, the net capital gain of such fiscal period.
Foreign taxes. The Fund makes the election to pass through to shareholders the foreign taxes paid. Eligible shareholders may claim a foreign tax credit. These taxes, and the corresponding foreign source income, are provided.
| 152 | Columbia Capital Allocation Portfolios | Annual Report 2018 |
Shareholders elect the Board that oversees the Fund’s operations. The Board appoints officers who are responsible for day-to-day business decisions based on policies set by the Board. The following table provides basic biographical information about the Fund’s Trustees, including their principal occupations during the past five years, although specific titles for individuals may have varied over the period. Under current Board policy, Trustees not affiliated with the Investment Manager generally may serve through the end of the calendar year in which they reach either the mandatory retirement age established by the Board or the fifteenth anniversary of the first Columbia Funds board meeting they attended as a member of the Board.
Independent trustees
Name,
address,
year of birth | Position held
with the Trust and
length of service | Principal occupation(s)
during past five years
and other relevant
professional experience | Number of
Funds in the
Columbia Funds
complex
overseen | Other directorships
held by Trustee
during the past
five years |
George S. Batejan
c/o Columbia Management
Investment Advisers, LLC
225 Franklin Street
Mail Drop BX32 05228
Boston, MA 02110
1953 | Trustee since 1/17 | Executive Vice President, Global Head of Technology and Operations, Janus Capital Group, Inc., 2010-2016 | 125 | Advisory Board Member, University of Colorado Business School since November 2015; former Chairman of the Board, NICSA (National Investment Company Services Association) (Executive Committee, Nominating Committee and Governance Committee), 2014-2016; former Director, Intech Investment Management, 2011- 2016; former Board Member, Metro Denver Chamber of Commerce, 2015-2016 |
Kathleen Blatz
c/o Columbia Management
Investment Advisers, LLC
225 Franklin Street
Mail Drop BX32 05228
Boston, MA 02110
1954 | Trustee since 1/06 for RiverSource Funds and since 6/11 for Nations Funds | Attorney; specializing in arbitration and mediation; Interim President and Chief Executive Officer, Blue Cross and Blue Shield of Minnesota (health care insurance) since February 2018; Chief Justice, Minnesota Supreme Court, 1998-2006; Associate Justice, Minnesota Supreme Court, 1996-1998; Fourth Judicial District Court Judge, Hennepin County, 1994-1996; Attorney in private practice and public service, 1984-1993; State Representative, Minnesota House of Representatives, 1979-1993, which included service on the Tax and Financial Institutions and Insurance Committees; Interim Chari, Minnesota Sports Facilities Authority, March 2017-July 2017 | 125 | Trustee, BlueCross BlueShield of Minnesota since 2009 (Chair of the Business Development Committee, 2014-2017; Chair of the Governance Committee since 2017); Chair of the Robina Foundation since August 2013; former Member of the Board, Minnesota Sports Facilities Authority, January 2017-July 2017 |
Edward J. Boudreau, Jr.
c/o Columbia Management
Investment Advisers, LLC
225 Franklin Street
Mail Drop BX32 05228
Boston, MA 02110
1944 | Chair of the Board since 1/18; Trustee since 6/11 for RiverSource Funds and since 1/05 for Nations Funds | Managing Director, E.J. Boudreau & Associates (consulting) since 2000; FINRA Industry Arbitrator, 2002-present; Chairman and Chief Executive Officer, John Hancock Investments (asset management), Chairman and Interested Trustee for open-end and closed-end funds offered by John Hancock, 1989-2000; John Hancock Mutual Life Insurance Company, including Senior Vice President and Treasurer and Senior Vice President Information Technology, 1968-1988 | 125 | Former Trustee, Boston Museum of Science (Chair of Finance Committee) 1985-2013; former Trustee, BofA Funds Series Trust (11 funds), 2005-2011 |
Columbia Capital Allocation Portfolios | Annual Report 2018
| 153 |
TRUSTEES AND OFFICERS (continued)
Independent trustees (continued)
Name,
address,
year of birth | Position held
with the Trust and
length of service | Principal occupation(s)
during past five years
and other relevant
professional experience | Number of
Funds in the
Columbia Funds
complex
overseen | Other directorships
held by Trustee
during the past
five years |
Pamela G. Carlton
c/o Columbia Management
Investment Advisers, LLC
225 Franklin Street
Mail Drop BX32 05228
Boston, MA 02110
1954 | Trustee since 7/07 for RiverSource Funds and since 6/11 for Nations Funds | President, Springboard — Partners in Cross Cultural Leadership (consulting company) since 2003; Managing Director of US Equity Research, JP Morgan Chase, 1999-2003; Director of US Equity Research, Chase Asset Management, 1996-1999; Co-Director Latin America Research, 1993-1996, COO Global Research, 1992-1996, Co-Director of US Research, 1991-1992, Investment Banker, Morgan Stanley, 1982-1991 | 125 | Trustee, New York Presbyterian Hospital Board (Executive Committee and Chair of Human Resources Committee) since 1996; Director, Darien Rowayton Bank (Audit Committee) since 2017 |
William P. Carmichael
c/o Columbia Management
Investment Advisers, LLC
225 Franklin Street
Mail Drop BX32 05228
Boston, MA 02110
1943 | Trustee since 6/11 for RiverSource Funds and since 2003 for Nations Funds | Retired; Co-founder, The Succession Fund (provides exit strategies to owners of privately held companies), 1998-2007; Adjunct Professor of Finance, Kelley School of Business, Indiana University, 1993-2007; Senior Vice President, Sara Lee Corporation, 1991-1993; Senior Vice President and Chief Financial Officer, Beatrice Foods Company, 1984-1990; Vice President, Esmark, Inc., 1973-1984; Associate, Price Waterhouse, 1968-1972 | 125 | Director, The Finish Line (athletic shoes and apparel) since July 2003; former Director, Cobra Electronics Corporation (electronic equipment manufacturer), 1994-August 2014; former Director, Spectrum Brands, Inc. (consumer products), 2002-2009; former Director, Simmons Company (bedding), 2004-2010; former Trustee, BofA Funds Series Trust (11 funds) 2003-2011; former Director, McMoRan Exploration Company (oil and gas exploration and development) 2010 - 2013; former Director, International Textile Corp., 2012-2016; former Director, hhgregg, 2015-2017 |
Patricia M. Flynn
c/o Columbia Management
Investment Advisers, LLC
225 Franklin Street
Mail Drop BX32 05228
Boston, MA 02110
1950 | Trustee since 11/04 for RiverSource Funds and since 6/11 for Nations Funds | Trustee Professor of Economics and Management, Bentley University since 1976 (also teaches and conducts research on corporate governance); Dean, McCallum Graduate School of Business, Bentley University, 1992-2002 | 125 | Trustee, MA Taxpayers Foundation since 1997; Board of Directors, The MA Business Roundtable since 2003; Board of Governors, Innovation Institute, MA Technology Collaborative since 2010 |
Brian J. Gallagher
c/o Columbia Management
Investment Advisers, LLC
225 Franklin Street
Mail Drop BX32 05228
Boston, MA 02110
1954 | Trustee since 12/17 | Retired; Partner with Deloitte & Touche LLP and its predecessors, 1968-2016 | 123 | None |
Catherine James Paglia
c/o Columbia Management
Investment Advisers, LLC
225 Franklin Street
Mail Drop BX32 05228
Boston, MA 02110
1952 | Trustee since 11/04 for RiverSource Funds and since 6/11 for Nations Funds | Director, Enterprise Asset Management, Inc. (private real estate and asset management company) since September 1998; Managing Director and Partner, Interlaken Capital, Inc., 1989-1997; Managing Director, Morgan Stanley, 1982-1989; Vice President, Investment Banking, 1980-1982, Associate, Investment Banking, 1976-1980, Dean Witter Reynolds, Inc. | 125 | Director, Valmont Industries, Inc. (irrigation systems manufacturer) since 2012; Trustee, Carleton College (on the Investment Committee); Trustee, Carnegie Endowment for International Peace (on the Investment Committee) |
| 154 | Columbia Capital Allocation Portfolios | Annual Report 2018 |
TRUSTEES AND OFFICERS (continued)
Independent trustees (continued)
Name,
address,
year of birth | Position held
with the Trust and
length of service | Principal occupation(s)
during past five years
and other relevant
professional experience | Number of
Funds in the
Columbia Funds
complex
overseen | Other directorships
held by Trustee
during the past
five years |
Minor M. Shaw
c/o Columbia Management
Investment Advisers, LLC
225 Franklin Street
Mail Drop BX32 05228
Boston, MA 02110
1947 | Trustee since 6/11 for RiverSource Funds and since 2003 for Nations Funds | President, Micco LLC (private investments) since 2011; President, Micco Corp. (family investment business), 1998-2011 | 125 | Director, BlueCross BlueShield of South Carolina since April 2008; Director, National Association of Corporate Directors, Carolinas Chapter, since 2013; Board Chair, Hollingsworth Funds since 2016; Advisory Board member, Duke Energy Corp. since October 2016; Chair of the Duke Endowment; Chair of Greenville – Spartanburg Airport Commission; former Trustee, BofA Funds Series Trust (11 funds), 2003-2011; former Director, Piedmont Natural Gas, 2004-2016 |
Sandra Yeager
c/o Columbia Management
Investment Advisers, LLC
225 Franklin Street
Mail Drop BX32 05228
Boston, MA 02110
1964 | Trustee since 12/17 | Retired; President and founder, Hanoverian Capital, LLC (SEC registered investment advisor firm), 2008-2016 | 123 | Director, NAPE Education Foundation since October 2016 |
Interested trustee not affiliated with Investment Manager*
Name,
address,
year of birth | Position held
with the Trust and
length of service | Principal occupation(s) during the
past five years and other relevant
professional experience | Number of
Funds in the
Columbia Funds
complex overseen | Other directorships/
held by Trustee
during the past
five years |
Anthony M. Santomero
c/o Columbia Management
Investment Advisers, LLC
225 Franklin Street
Mail Drop BX32 05228
Boston, MA 02110
1946 | Trustee since 6/11 for RiverSource Funds and since 1/08 for Nations Funds | Richard K. Mellon Professor Emeritus of Finance, The Wharton School, University of Pennsylvania, since 2002; Senior Advisor, McKinsey & Company (consulting), 2006-2008; President, Federal Reserve Bank of Philadelphia, 2000-2006, Professor of Finance, The Wharton School, University of Pennsylvania, 1972-2002 | 123 | Trustee, Penn Mutual Life Insurance Company since March 2008; Director, Renaissance Reinsurance Ltd. since May 2008; Director, Citigroup Inc. since 2009; Director, Citibank, N.A. since 2009; former Trustee, BofA Funds Series Trust (11 funds), 2008-2011 |
| * | Dr. Santomero is not an affiliated person of the Investment Manager or Ameriprise Financial. However, he is currently deemed by the Funds to be an “interested person” (as defined in the 1940 Act) of the Funds because he serves as a Director of Citigroup Inc. and Citibank, N.A., companies that may directly or through subsidiaries and affiliates engage from time-to-time in brokerage execution, principal transactions and lending relationships with the Funds or accounts advised/managed by the Investment Manager. |
Columbia Capital Allocation Portfolios | Annual Report 2018
| 155 |
TRUSTEES AND OFFICERS (continued)
Interested trustee affiliated with Investment Manager*
Name,
address,
year of birth | Position held with the Trusts and length of service | Principal occupation(s) during the
past five years and other relevant
professional experience | Number of
Funds in the
Columbia Funds
complex overseen | Other directorships
held by Trustee
during the past
five years |
William F. Truscott
c/o Columbia Management
Investment Advisers, LLC
225 Franklin St.
Boston, MA 02110
1960 | Trustee since 11/01 for RiverSource Funds and since 6/11 for Nations Funds; Senior Vice President since 2002 for RiverSource Funds and since 5/10 for Nations Funds | Chairman of the Board and President, Columbia Management Investment Advisers, LLC since May 2010 and February 2012, respectively; Chief Executive Officer, Global Asset Management, Ameriprise Financial, Inc. since September 2012 (previously Chief Executive Officer, U.S. Asset Management & President, Annuities, May 2010 - September 2012); Director and Chief Executive Officer, Columbia Management Investment Distributors, Inc. since May 2010 and February 2012, respectively; Chairman of the Board and Chief Executive Officer, RiverSource Distributors, Inc. since 2006; Director, Threadneedle Asset Management Holdings, SARL since 2014; President and Chief Executive Officer, Ameriprise Certificate Company, 2006 - August 2012. | 195 | Chairman of the Board, Columbia Management Investment Advisers, LLC since May 2010; Director, Columbia Management Investment Distributors, Inc. since May 2010; former Director, Ameriprise Certificate Company, 2006-January 2013 |
| * | Interested person (as defined under the 1940 Act) by reason of being an officer, director, security holder and/or employee of the Investment Manager or Ameriprise Financial. |
Nations Funds refer to the Funds within the Columbia Funds Complex that historically bore the Nations brand and includes series of Columbia Funds Series Trust. RiverSource Funds refer to the Funds within the Columbia Funds Complex that historically bore the RiverSource brand and includes series of Columbia Funds Series Trust II.
The Statement of Additional Information has additional information about the Fund’s Board members and is available, without charge, upon request by calling 800.345.6611, visiting investor.columbiathreadneedleus.com or contacting your financial intermediary.
| 156 | Columbia Capital Allocation Portfolios | Annual Report 2018 |
TRUSTEES AND OFFICERS (continued)
The Board has appointed officers who are responsible for day-to-day business decisions based on policies it has established. The officers serve at the pleasure of the Board. The following table provides basic information about the Officers of the Fund, including principal occupations during the past five years, although their specific titles may have varied over the period. In addition to Mr. Truscott, who is Senior Vice President, the Fund’s other officers are:
Fund officers
Name,
address and
year of birth | Position and year
first appointed to
position for any Fund
in the Columbia
Funds complex or a
predecessor thereof | Principal occupation(s) during past five years |
Christopher O. Petersen
5228 Ameriprise
Financial Center
Minneapolis, MN 55474
Born 1970 | President and Principal Executive Officer (2015) | Vice President and Lead Chief Counsel, Ameriprise Financial, Inc. since January 2015 (previously, Vice President and Chief Counsel, January 2010 - December 2014; officer of Columbia Funds and affiliated funds since 2007. |
Michael G. Clarke
225 Franklin Street
Boston, MA 02110
Born 1969 | Treasurer (2011), Chief Financial Officer (2009) and Chief Accounting Officer (2015) | Vice President — Mutual Fund Administration, Columbia Management Investment Advisers, LLC, since May 2010; senior officer of Columbia Funds and affiliated funds since 2002. |
Paul B. Goucher
100 Park Avenue
New York, NY 10017
Born 1968 | Senior Vice President (2011) and Assistant Secretary (2008) | Senior Vice President and Assistant General Counsel, Ameriprise Financial, Inc. since January 2017 (previously Vice President and Lead Chief Counsel, November 2008 - January 2017 and January 2013 - January 2017, respectively; and Chief Counsel, January 2010 - January 2013); Vice President, Chief Legal Officer and Assistant Secretary, Columbia Management Investment Advisers, LLC since May 2010. |
Thomas P. McGuire
225 Franklin Street
Boston, MA 02110
Born 1972 | Senior Vice President and Chief Compliance Officer (2012) | Vice President — Asset Management Compliance, Ameriprise Financial, Inc., since May 2010; Chief Compliance Officer, Ameriprise Certificate Company since September 2010. |
Colin Moore
225 Franklin Street
Boston, MA 02110
Born 1958 | Senior Vice President (2010) | Executive Vice President and Global Chief Investment Officer, Ameriprise Financial, Inc., since July 2013; Executive Vice President and Global Chief Investment Officer, Columbia Management Investment Advisers, LLC since July 2013 (previously Director and Global Chief Investment Officer, 2010 - 2013). |
Ryan C. Larrenaga
225 Franklin Street
Boston, MA 02110
Born 1970 | Senior Vice President (2017), Chief Legal Officer (2017) and Secretary (2015) | Vice President and Group Counsel, Ameriprise Financial, Inc. since August 2011; officer of Columbia Funds and affiliated funds since 2005. |
Michael E. DeFao
225 Franklin Street
Boston, MA 02110
Born 1968 | Vice President (2011) and Assistant Secretary (2010) | Vice President and Chief Counsel, Ameriprise Financial, Inc. since May 2010. |
Amy Johnson
5228 Ameriprise
Financial Center
Minneapolis, MN 55474
Born 1965 | Vice President (2006) | Managing Director and Global Head of Operations, Columbia Management Investment Advisers, LLC since April 2016 (previously Managing Director and Chief Operating Officer, 2010 - 2016). |
Lyn Kephart-Strong
5228 Ameriprise
Financial Center
Minneapolis, MN 55474
Born 1960 | Vice President (2015) | President, Columbia Management Investment Services Corp. since October 2014; Vice President & Resolution Officer, Ameriprise Trust Company since August 2009. |
Columbia Capital Allocation Portfolios | Annual Report 2018
| 157 |
The Fund mails one shareholder report to each shareholder address. If you would like more than one report, please call shareholder services at 800.345.6611 and additional reports will be sent to you.
Proxy voting policies and procedures
The policy of the Board of Trustees is to vote the proxies of the companies in which the Fund holds investments consistent with the procedures as stated in the Statement of Additional Information (SAI). You may obtain a copy of the SAI without charge by calling 800.345.6611; contacting your financial intermediary; visiting investor.columbiathreadneedleus.com; or searching the website of the Securities and Exchange Commission (SEC) at sec.gov. Information regarding how the Fund voted proxies relating to portfolio securities is filed with the SEC by August 31st for the most recent 12-month period ending June 30th of that year, and is available without charge by visiting investor.columbiathreadneedleus.com, or searching the website of the SEC at sec.gov.
Quarterly schedule of investments
The Fund files a complete schedule of portfolio holdings with the SEC for the first and third quarters of each fiscal year on Form N-Q. The Fund’s Form N-Q is available on the SEC’s website at sec.gov and may be reviewed and copied at the SEC’s Public Reference Room in Washington, D.C. Information on the operation of the Public Reference Room may be obtained by calling 800.SEC.0330. The Fund’s complete schedule of portfolio holdings, as filed on Form N-Q, can also be obtained without charge, upon request, by calling 800.345.6611.
Additional Fund information
For more information about the Fund, please visit investor.columbiathreadneedleus.com or call 800.345.6611. Customer Service Representatives are available to answer your questions Monday through Friday from 8 a.m. to 7 p.m. Eastern time.
Fund investment manager
Columbia Management Investment Advisers, LLC
225 Franklin Street
Boston, MA 02110
Fund distributor
Columbia Management Investment Distributors, Inc.
225 Franklin Street
Boston, MA 02110
Fund transfer agent
Columbia Management Investment Services Corp.
P.O. Box 8081
Boston, MA 02266-8081
| 158 | Columbia Capital Allocation Portfolios | Annual Report 2018 |
[THIS PAGE INTENTIONALLY LEFT BLANK]
[THIS PAGE INTENTIONALLY LEFT BLANK]
[THIS PAGE INTENTIONALLY LEFT BLANK]
Columbia Capital Allocation Portfolios
P.O. Box 8081
Boston, MA 02266-8081
Please read and consider the investment objectives, risks, charges and expenses for any fund carefully before investing. For a prospectus and summary prospectus, which contains this and other important information about the Funds, go to
investor.columbiathreadneedleus.com. The Funds are distributed by Columbia Management Investment Distributors, Inc., member FINRA, and managed by Columbia Management Investment Advisers, LLC.
Columbia Threadneedle Investments (Columbia Threadneedle) is the global brand name of the Columbia and Threadneedle group of companies. All rights reserved. Columbia Management Investment Distributors, Inc., 225 Franklin Street, Boston, MA 02110-2804
© 2018 Columbia Management Investment Advisers, LLC.
investor.columbiathreadneedleus.com

Annual Report
January 31, 2018
Columbia Global Strategic Equity Fund
Not FDIC Insured • No bank guarantee • May lose value
Dear Shareholders,
The current outlook for financial markets is clouded by two primary concerns: the high valuation of equities and the direction of interest rates. Following the U.S. presidential election, U.S. equities rallied based on the assumption that the new administration’s policies would stimulate growth quickly. Unfortunately it’s unclear whether those measures will get passed, much less passed quickly. In fixed income, uncertainty stems from the possibility that interest rates won’t rise as rapidly as expected if the administration’s proposed growth policies are not implemented.
Given this uncertainty, investors value a consistent approach more than ever. Investors want strong, repeatable risk-adjusted returns. Consistency — not surprises. As a leading global asset manager, we believe our consistent, collaborative investment approach enables us to deliver the dependable experience your portfolio demands. So, how do we strive to deliver a consistent investment experience?
Better insights
Your portfolio benefits from the investment insights uncovered by our talented investment teams around the world.
Better decisions
Our collaborative, interactive environment enables our investment teams to construct portfolios that take advantage of the best investment ideas.
Better outcomes
We aim to deliver a consistent experience, which means fewer surprises, dependable insights, and products designed to do the thing you want.
Whether you’re trying to save money to help your children go to college or for your own retirement, it’s the consistency of the return that is most essential. People who chase higher returns are usually also the first to sell when that investment goes through a bad patch. We try to combat this behavioral tendency by offering strategies that aim for a more consistent return. Our goal is for investors to panic less during periods of volatility, which can have a significant effect on their long-term results.
Nothing is more important to us than making sure those who have entrusted us to protect and grow their assets can do what matters most to them: build a nest egg, leave a legacy, and live confidently — now and throughout retirement. It’s why our talented professionals around the world work together to uncover uncommon opportunities and why our process encourages challenge and debate around our most compelling ideas to ensure better informed investment decisions, which hopefully lead to better outcomes for you.
Your success is our priority. Talk to your financial advisor about how working with Columbia Threadneedle Investments may help you position your portfolio for consistent, sustainable outcomes, no matter the market conditions.
Sincerely,
Christopher O. Petersen
President, Columbia Funds
Investors should consider the investment objectives, risks, charges and expenses of a mutual fund carefully before investing. For a free prospectus and summary prospectus, which contains this and other important information about a fund, visit investor.columbiathreadneedleus.com. The prospectus should be read carefully before investing.
Columbia Funds are distributed by Columbia Management Investment Distributors, Inc., member FINRA, and managed by Columbia Management Investment Advisers, LLC.
© 2018 Columbia Management Investment Advisers, LLC. All rights reserved.
Columbia Global Strategic Equity Fund | Annual Report 2018
Columbia Global Strategic Equity Fund | Annual Report 2018
Investment objective
Columbia Global Strategic Equity Fund (the Fund) seeks capital appreciation.
Portfolio management
Mark Burgess
Co-manager
Managed Fund since 2015
Melda Mergen, CFA, CAIA
Co-manager
Managed Fund since 2016
Morningstar style boxTM
The Morningstar Style Box is based on a fund’s portfolio holdings. For equity funds, the vertical axis shows the market capitalization of the stocks owned, and the horizontal axis shows investment style (value, blend, or growth). Information shown is based on the most recent data provided by Morningstar.
© 2018 Morningstar, Inc. All rights reserved. The Morningstar information contained herein: (1) is proprietary to Morningstar and/or its content providers; (2) may not be copied or distributed; and (3) is not warranted to be accurate, complete or timely. Neither Morningstar nor its content providers are responsible for any damages or losses arising from any use of this information.
| Average annual total returns (%) (for the period ended January 31, 2018) |
| | | Inception | 1 Year | 5 Years | 10 Years |
| Class A | Excluding sales charges | 10/15/96 | 30.57 | 12.39 | 7.97 |
| | Including sales charges | | 23.04 | 11.06 | 7.33 |
| Advisor Class* | 11/08/12 | 30.86 | 12.66 | 8.11 |
| Class C | Excluding sales charges | 10/15/96 | 29.48 | 11.55 | 7.17 |
| | Including sales charges | | 28.48 | 11.55 | 7.17 |
| Institutional Class | 10/15/96 | 30.79 | 12.65 | 8.24 |
| Institutional 2 Class* | 11/08/12 | 30.88 | 12.78 | 8.18 |
| Institutional 3 Class* | 03/01/17 | 30.93 | 12.45 | 8.00 |
| Class K* | 03/07/11 | 30.55 | 12.50 | 8.05 |
| Class R | 01/23/06 | 30.21 | 12.10 | 7.70 |
| MSCI ACWI (Net) | | 27.48 | 11.02 | 6.13 |
Returns for Class A are shown with and without the maximum initial sales charge of 5.75%. Returns for Class C are shown with and without the 1.00% contingent deferred sales charge for the first year only. The Fund’s other classes are not subject to sales charges and have limited eligibility. Effective November 1, 2017, Class R4, Class R5, Class Y and Class Z shares were renamed Advisor Class, Institutional 2 Class, Institutional 3 Class and Institutional Class shares, respectively. Please see the Fund’s prospectus for details. Performance for different share classes will vary based on differences in sales charges and fees associated with each class. All results shown assume reinvestment of distributions during the period. Returns do not reflect the deduction of taxes that a shareholder may pay on Fund distributions or on the redemption of Fund shares. Performance results reflect the effect of any fee waivers or reimbursements of Fund expenses by Columbia Management Investment Advisers, LLC and/or any of its affiliates. Absent these fee waivers or expense reimbursement arrangements, performance results would have been lower.
The Fund’s performance prior to June 2, 2015 reflects returns achieved pursuant to different principal investment strategies. If the Fund’s current strategies had been in place for the prior periods, results shown may have been different.
The performance information shown represents past performance and is not a guarantee of future results. The investment return and principal value of your investment will fluctuate so that your shares, when redeemed, may be worth more or less than their original cost. Current performance may be lower or higher than the performance information shown. You may obtain performance information current to the most recent month-end by contacting your financial intermediary, visiting investor.columbiathreadneedleus.com or calling 800.345.6611.
| * | The returns shown for periods prior to the share class inception date (including returns for the Life of the Fund, if shown, which are since Fund inception) include the returns of the Fund’s oldest share class. Since the Fund launched more than one share class at its inception, Class A shares were used. These returns are adjusted to reflect any higher class-related operating expenses of the newer share classes, as applicable. Please visit investor.columbiathreadneedleus.com/investment-products/mutual-funds/appended-performance for more information. |
The MSCI ACWI (Net) is a free float-adjusted market capitalization weighted index that is designed to measure the equity market performance of developed and emerging markets. The index consists of 45 country indices comprising 24 developed and 21 emerging market country indices.
Indices are not available for investment, are not professionally managed and do not reflect sales charges, fees, brokerage commissions, taxes (except the MSCI ACWI (Net), which reflects reinvested dividends net of withholding taxes) or other expenses of investing. Securities in the Fund may not match those in an index.
| 2 | Columbia Global Strategic Equity Fund | Annual Report 2018 |
Fund at a Glance (continued)
Performance of a hypothetical $10,000 investment (January 31, 2008 — January 31, 2018)
The chart above shows the change in value of a hypothetical $10,000 investment in Class A shares of Columbia Global Strategic Equity Fund during the stated time period, and does not reflect the deduction of taxes that a shareholder may pay on Fund distributions or on the redemption of Fund shares.
| Portfolio breakdown (%) (at January 31, 2018) |
| Alternative Strategies Funds | 3.5 |
| Common Stocks | 13.4 |
| Equity Funds | 82.9 |
| Money Market Funds | 0.2 |
| Total | 100.0 |
Percentages indicated are based upon total investments. The Fund’s portfolio composition is subject to change.
Columbia Global Strategic Equity Fund | Annual Report 2018
| 3 |
Manager Discussion of Fund Performance
For the 12-month period that ended January 31, 2018, the Fund’s Class A shares returned 30.57% excluding sales charges. The Fund outperformed its benchmark, the MSCI ACWI (Net), which returned 27.48% during the period. We attribute the portfolio’s outperformance of the benchmark primarily to positioning, via underlying funds, in Japanese and value-oriented equities, which more than offset positioning in European, U.S. large cap growth and commodity stocks, which detracted.
Synchronized upswing in economic growth supported global equities
Global equity markets enjoyed strong gains in U.S. dollar terms during the 12-month period ended January 31, 2018, particularly Japan, Europe and the emerging markets. Robust returns were supported by positive corporate earnings results and strong economic data, especially during the second half of the period when synchronized global economic growth began to accelerate. Markets also rallied boosted by enhanced monetary and fiscal stimulus measures, unfazed by a backdrop of heightened geopolitical tensions. The Asian equity markets’ rally, weakness in the U.S. dollar, global liquidity and a supportive macro outlook further underpinned inflows to the global equity markets. Also notable was that virtually all major international equity markets posted double-digit returns in local currency terms as well.
From a regional perspective, U.S. equities performed strongly throughout the period, repeatedly hitting record highs along the way. Buoyant corporate earnings results, especially in the information technology sector, along with an improving domestic economy and a strengthening global economy, were among those factors boosting investor sentiment. During the first half of the period, growth stocks outperformed value stocks due to some softer domestic economic data points and skepticism that the current U.S. Administration would be able to deliver on its growth agenda. Despite declining inflation, the Federal Reserve (the Fed) raised interest rates twice in the first half of the period. The third quarter 2017 Gross Domestic Product growth rate then came in well ahead of consensus forecasts. Consumer confidence was buoyant, and jobs data remained strong. Such data paved the way for a third 2017 interest rate increase by the Fed in December 2017. U.S. equities also benefited from anticipation during the second half of the period that Congress would approve a tax reform bill. The bill, eventually passed on December 20, 2017, featured a cut in corporate tax rates from 35% to 21%.
European equities performed well during the period, boosted by a more encouraging political and economic backdrop after the twin shocks of Brexit and the U.S. presidential election results in 2016. Election results in France and Germany favored market-friendly centrists. Holland, Austria and Norway elected center-right coalitions. The European equity markets benefited from better domestic economic growth and from the region’s exposure to world trade, with encouraging trends apparent with major partners, such as the U.S., boosted by potential fiscal stimulus, and China, where economic growth appears to have stabilized. Double-digit corporate earnings growth buoyed European stocks as well.
In the U.K., both market sentiment and the British pound sterling were influenced by the ongoing exit negotiations between the U.K. government and the European Union. The inconclusive outcome of June 2017’s snap election, called by Prime Minister May, created further unrest, doing little to allay investor concerns about the U.K.’s political and economic outlook. After a strong start, the fallout from the election stifled equity market momentum, initially spurred by the sterling’s devaluation in the wake of the Brexit vote. While stocks of U.K. domestic companies tended to underperform those of more internationally focused businesses, the U.K. equity market still posted modest double-digit gains and hit record highs in absolute terms for the period overall.
Japanese equities had a positive year, as its economic indicators were generally positive surprises. Japanese corporate earnings tend to be driven by global economic growth, and the synchronized upswings experienced during the annual period were therefore beneficial to the region. As part of a broader trend of improving corporate governance in Japan, several companies additionally reaped the benefits of efforts to reduce costs and improve profitability as global demand rose. While political uncertainty caused market volatility to heighten at certain times through the first three quarters of 2017, Prime Minister Abe’s landslide election in October 2017 reassured markets, propelling them to a strong finish for the annual period.
Emerging market equities shrugged off geopolitical tensions, as well as concerns about the economic slowdown in China and protectionism in the U.S., to register their best performance overall since 2009, outperforming developed markets equities. The emerging market equities rally, backed by strong corporate earnings growth, was led by the information technology sector, while more traditionally defensive sectors lagged. Asia was the best performing emerging markets region, with China in particular outperforming broader global indices. Investor inflows to emerging market equity funds validated the strong performance, following four consecutive years of withdrawals.
| 4 | Columbia Global Strategic Equity Fund | Annual Report 2018 |
Manager Discussion of Fund Performance (continued)
All told, for the period overall, the broad global equity market, as measured by benchmarks, outperformed the broad U.S. equity market, as measured by the S&P 500 Index, which rose 26.41%. As measured by the MSCI EAFE Index (Net) and the MSCI Emerging Markets Index (Net), respectively, international developed market equities and emerging market equities returned 27.60% and 41.01%, respectively.
Positioning in Japanese and value equities boosted relative results
Underlying fund selection overall was the primary driver of the Fund’s performance during the period, as most underlying funds significantly outperformed their respective benchmarks during the period. From a sector perspective, information technology stood out as the top positive contributor to relative results across different strategies. From regional and style perspectives, positive contributors included Japanese equities and value-oriented equities, via positions in underlying funds. Positions in underlying funds Columbia Overseas Value Fund and Columbia Disciplined Value Fund especially boosted relative results.
Conversely, via underlying funds, positioning in European equities, U.S. large-cap growth equities and commodity equities detracted from relative results. More specifically, positions in Columbia Contrarian Europe Fund (formerly named Columbia European Fund), Columbia Large Cap Growth Fund and Columbia Global Energy and Natural Resources Fund dampened the Fund’s relative results during the period.
Risk management analysis drove portfolio changes
Changes within the portfolio can be driven by active trading, by directing allocations to select market segments or by market appreciation or depreciation within a given market segment, all via investments in underlying funds. Throughout the period, we rebalanced the Fund’s portfolio as we sought to manage risk and achieve the Fund’s investment objective. For example, during the period, we believed valuations in U.S. equities were generally stretched. We focused on stock-specific stories instead of timing sectors or factors, such as value, yield or growth. Underlying funds continued to invest in long-term secular trends as their core holdings, but we added some cyclical exposure given consensus expectations for higher U.S. economic growth due to anticipated fiscal stimulus. We also became more bullish on emerging markets equities, as we started seeing signs of corporate earnings recovery. We found more emerging markets names in which to deploy capital, particularly in the financials sector, which had been underweight the benchmark in the last several years.
Market risk may affect a single issuer, sector of the economy, industry or the market as a whole. Asset allocation does not assure a profit or protect against loss. The Fund’s investment in other funds subjects it to the investment performance (positive or negative), risks and expenses of these underlying funds. Fixed-income securities present issuer default risk. A rise in interest rates may result in a price decline of fixed-income (debt) instruments held by the Fund, negatively affecting its performance and NAV. Falling rates may result in the Fund investing in lower yielding debt instruments, lowering the Fund’s income and yield. Debt instruments with longer maturity and duration have greater sensitivity to interest rate changes. Interest rates can change due to local government and banking regulation changes. International investing involves certain risks and volatility due to potential political, economic or currency instabilities and different financial and accounting standards. Investing in derivatives is a specialized activity that involves special risks, which may result in significant losses or limited gains. See the Fund’s prospectus for more information on these and other risks.
The views expressed in this report reflect the current views of the respective parties. These views are not guarantees of future performance and involve certain risks, uncertainties and assumptions that are difficult to predict, so actual outcomes and results may differ significantly from the views expressed. These views are subject to change at any time based upon economic, market or other conditions and the respective parties disclaim any responsibility to update such views. These views may not be relied on as investment advice and, because investment decisions for a Columbia fund are based on numerous factors, may not be relied on as an indication of trading intent on behalf of any particular Columbia fund. References to specific securities should not be construed as a recommendation or investment advice.
Columbia Global Strategic Equity Fund | Annual Report 2018
| 5 |
Understanding Your Fund’s Expenses
(Unaudited)
As an investor, you incur two types of costs. There are transaction costs, which generally include sales charges on purchases and may include redemption fees. There are also ongoing costs, which generally include management fees, distribution and/or service fees, and other fund expenses. The following information is intended to help you understand your ongoing costs (in dollars) of investing in the Fund and to help you compare these costs with the ongoing costs of investing in other mutual funds.
Analyzing your Fund’s expenses
To illustrate these ongoing costs, we have provided examples and calculated the expenses paid by investors in each share class of the Fund during the period. The actual and hypothetical information in the table is based on an initial investment of $1,000 at the beginning of the period indicated and held for the entire period. Expense information is calculated two ways and each method provides you with different information. The amount listed in the “Actual” column is calculated using the Fund’s actual operating expenses and total return for the period. You may use the Actual information, together with the amount invested, to estimate the expenses that you paid over the period. Simply divide your account value by $1,000 (for example, an $8,600 account value divided by $1,000 = 8.6), then multiply the results by the expenses paid during the period under the “Actual” column. The amount listed in the “Hypothetical” column assumes a 5% annual rate of return before expenses (which is not the Fund’s actual return) and then applies the Fund’s actual expense ratio for the period to the hypothetical return. You should not use the hypothetical account values and expenses to estimate either your actual account balance at the end of the period or the expenses you paid during the period. See “Compare with other funds” below for details on how to use the hypothetical data.
In addition to the ongoing expenses which the Fund bears directly, the Fund’s shareholders indirectly bear the Fund’s allocable share of the costs and expenses of each underlying fund in which the Fund invests. You can also estimate the effective expenses paid during the period, which includes the indirect fees associated with investing in the underlying funds, by using the amounts listed in the “Effective expenses paid during the period” column.
Compare with other funds
Since all mutual funds are required to include the same hypothetical calculations about expenses in shareholder reports, you can use this information to compare the ongoing cost of investing in the Fund with other funds. To do so, compare the hypothetical example with the 5% hypothetical examples that appear in the shareholder reports of other funds. As you compare hypothetical examples of other funds, it is important to note that hypothetical examples are meant to highlight the ongoing costs of investing in a fund only and do not reflect any transaction costs, such as sales charges, or redemption or exchange fees. Therefore, the hypothetical calculations are useful in comparing ongoing costs only, and will not help you determine the relative total costs of owning different funds. If transaction costs were included in these calculations, your costs would be higher.
| August 1, 2017 — January 31, 2018 |
| | Account value at the
beginning of the
period ($) | Account value at the
end of the
period ($) | Expenses paid during
the period ($) | Fund’s annualized
expense ratio (%) | Effective expenses
paid during the
period ($) | Fund’s effective
annualized
expense ratio (%) |
| | Actual | Hypothetical | Actual | Hypothetical | Actual | Hypothetical | Actual | Actual | Hypothetical | Actual |
| Class A | 1,000.00 | 1,000.00 | 1,152.20 | 1,022.68 | 2.71 | 2.55 | 0.50 | 6.84 | 6.42 | 1.26 |
| Advisor Class (formerly Class R4) | 1,000.00 | 1,000.00 | 1,153.70 | 1,023.95 | 1.36 | 1.28 | 0.25 | 5.48 | 5.15 | 1.01 |
| Class C | 1,000.00 | 1,000.00 | 1,147.70 | 1,018.90 | 6.77 | 6.36 | 1.25 | 10.88 | 10.23 | 2.01 |
| Institutional Class (formerly Class Z) | 1,000.00 | 1,000.00 | 1,153.40 | 1,023.95 | 1.36 | 1.28 | 0.25 | 5.48 | 5.15 | 1.01 |
| Institutional 2 Class (formerly Class R5) | 1,000.00 | 1,000.00 | 1,153.00 | 1,024.10 | 1.19 | 1.12 | 0.22 | 5.32 | 5.00 | 0.98 |
| Institutional 3 Class (formerly Class Y) | 1,000.00 | 1,000.00 | 1,153.70 | 1,024.35 | 0.92 | 0.87 | 0.17 | 5.05 | 4.75 | 0.93 |
| Class K | 1,000.00 | 1,000.00 | 1,152.00 | 1,022.84 | 2.55 | 2.40 | 0.47 | 6.67 | 6.27 | 1.23 |
| Class R | 1,000.00 | 1,000.00 | 1,150.50 | 1,021.42 | 4.07 | 3.82 | 0.75 | 8.18 | 7.69 | 1.51 |
| 6 | Columbia Global Strategic Equity Fund | Annual Report 2018 |
Understanding Your Fund’s Expenses (continued)
(Unaudited)
Expenses paid during the period are equal to the annualized expense ratio for each class as indicated above, multiplied by the average account value over the period and then multiplied by the number of days in the Fund’s most recent fiscal half year and divided by 365.
Effective expenses paid during the period and the Fund’s effective annualized expense ratio include expenses borne directly to the class plus the Fund’s pro rata portion of the ongoing expenses charged by the underlying funds using the expense ratio of each class of the underlying funds as of the underlying fund’s most recent shareholder report.
Columbia Global Strategic Equity Fund | Annual Report 2018
| 7 |
Portfolio of Investments
January 31, 2018
(Percentages represent value of investments compared to net assets)
| Alternative Strategies Funds 3.5% |
| | Shares | Value ($) |
| Columbia Convertible Securities Fund, Institutional 3 Class(a) | 1,223,813 | 25,638,901 |
Total Alternative Strategies Funds
(Cost $20,162,058) | 25,638,901 |
|
| Common Stocks 13.4% |
| Issuer | Shares | Value ($) |
| Consumer Discretionary 1.8% |
| Auto Components 0.6% |
| Koito Manufacturing Co., Ltd. | 43,500 | 3,072,756 |
| Lear Corp. | 1,100 | 212,454 |
| Shoei Co., Ltd. | 32,500 | 1,492,144 |
| Total | | 4,777,354 |
| Automobiles 0.2% |
| Fiat Chrysler Automobiles NV(b) | 2,284 | 55,188 |
| Ford Motor Co. | 15,233 | 167,106 |
| General Motors Co. | 1,011 | 42,877 |
| Isuzu Motors Ltd. | 36,300 | 614,705 |
| Peugeot SA | 8,868 | 199,172 |
| Subaru Corp. | 11,500 | 383,048 |
| Total | | 1,462,096 |
| Hotels, Restaurants & Leisure 0.2% |
| Round One Corp. | 71,800 | 1,331,499 |
| Household Durables 0.3% |
| Persimmon PLC | 5,200 | 184,728 |
| Sony Corp. | 40,400 | 1,937,628 |
| Taylor Wimpey PLC | 67,788 | 183,450 |
| Total | | 2,305,806 |
| Internet & Direct Marketing Retail 0.1% |
| Start Today Co., Ltd. | 31,200 | 921,876 |
| Multiline Retail 0.3% |
| Seria Co., Ltd. | 27,600 | 1,646,615 |
| Target Corp. | 2,659 | 200,010 |
| Total | | 1,846,625 |
| Common Stocks (continued) |
| Issuer | Shares | Value ($) |
| Specialty Retail 0.1% |
| Best Buy Co., Inc. | 2,603 | 190,175 |
| Gap, Inc. (The) | 4,111 | 136,650 |
| Home Depot, Inc. (The) | 254 | 51,029 |
| TJX Companies, Inc. (The) | 1,882 | 151,162 |
| Total | | 529,016 |
| Total Consumer Discretionary | 13,174,272 |
| Consumer Staples 0.4% |
| Beverages —% |
| PepsiCo, Inc. | 1,978 | 237,953 |
| Food & Staples Retailing 0.1% |
| Costco Wholesale Corp. | 869 | 169,342 |
| CVS Health Corp. | 2,602 | 204,752 |
| Walmart, Inc. | 2,600 | 277,160 |
| Total | | 651,254 |
| Household Products 0.3% |
| Kimberly-Clark Corp. | 425 | 49,725 |
| Pigeon Corp. | 50,900 | 1,990,229 |
| Total | | 2,039,954 |
| Tobacco —% |
| Philip Morris International, Inc. | 1,956 | 209,742 |
| Swedish Match AB | 3,044 | 123,307 |
| Total | | 333,049 |
| Total Consumer Staples | 3,262,210 |
| Energy 0.1% |
| Oil, Gas & Consumable Fuels 0.1% |
| China Petroleum & Chemical Corp., Class H | 144,000 | 124,476 |
| China Shenhua Energy Co., Ltd., Class H | 72,000 | 223,722 |
| MOL Hungarian Oil & Gas PLC | 12,800 | 156,368 |
| OMV AG | 2,355 | 151,631 |
| Polski Koncern Naftowy Orlen SA | 467 | 15,146 |
| PTT PCL, Foreign Registered Shares | 4,300 | 67,513 |
| Tupras Turkiye Petrol Rafinerileri AS | 2,778 | 85,338 |
| Valero Energy Corp. | 1,768 | 169,675 |
| Total | | 993,869 |
| Total Energy | 993,869 |
The accompanying Notes to Financial Statements are an integral part of this statement.
| 8 | Columbia Global Strategic Equity Fund | Annual Report 2018 |
Portfolio of Investments (continued)
January 31, 2018
| Common Stocks (continued) |
| Issuer | Shares | Value ($) |
| Financials 2.1% |
| Banks 0.9% |
| Agricultural Bank of China Ltd., Class H | 377,000 | 230,663 |
| Bank of Nova Scotia (The) | 3,000 | 199,317 |
| China Construction Bank Corp., Class H | 18,000 | 20,665 |
| Citigroup, Inc. | 3,134 | 245,957 |
| Dubai Islamic Bank PJSC | 76,253 | 126,502 |
| Hana Financial Group, Inc. | 4,304 | 209,734 |
| JPMorgan Chase & Co. | 163 | 18,854 |
| Mitsubishi UFJ Financial Group, Inc. | 662,800 | 5,011,678 |
| Royal Bank of Canada | 1,700 | 145,564 |
| Toronto-Dominion Bank (The) | 3,300 | 200,737 |
| Turkiye Garanti Bankasi AS | 5,921 | 19,371 |
| Turkiye Is Bankasi AS | 30,675 | 65,733 |
| Woori Finance Holdings Co., Ltd. | 7,202 | 113,549 |
| Total | | 6,608,324 |
| Capital Markets —% |
| China Huarong Asset Management Co., Ltd., Class H(c) | 310,000 | 156,400 |
| Diversified Financial Services 0.5% |
| EXOR NV | 540 | 41,715 |
| ORIX Corp. | 195,300 | 3,658,297 |
| Total | | 3,700,012 |
| Insurance 0.7% |
| Allianz SE, Registered Shares | 69 | 17,433 |
| Assicurazioni Generali SpA | 10,100 | 200,258 |
| AXA SA | 6,500 | 213,817 |
| CNP Assurances | 4,555 | 116,724 |
| Dai-ichi Life Holdings, Inc. | 176,600 | 3,724,070 |
| Mapfre SA | 46,821 | 166,312 |
| Principal Financial Group, Inc. | 392 | 26,499 |
| Prudential Financial, Inc. | 960 | 114,067 |
| Swiss Life Holding AG, Registered Shares | 188 | 70,595 |
| Total | | 4,649,775 |
| Total Financials | 15,114,511 |
| Common Stocks (continued) |
| Issuer | Shares | Value ($) |
| Health Care 0.9% |
| Biotechnology —% |
| Alexion Pharmaceuticals, Inc.(b) | 350 | 41,762 |
| Biogen, Inc.(b) | 200 | 69,562 |
| BioMarin Pharmaceutical, Inc.(b) | 350 | 31,581 |
| Celgene Corp.(b) | 450 | 45,522 |
| Vertex Pharmaceuticals, Inc.(b) | 350 | 58,404 |
| Total | | 246,831 |
| Health Care Equipment & Supplies 0.5% |
| Asahi Intecc Co., Ltd. | 18,000 | 691,505 |
| Hoya Corp. | 63,000 | 3,235,870 |
| Total | | 3,927,375 |
| Health Care Providers & Services 0.3% |
| AmerisourceBergen Corp. | 128 | 12,758 |
| Anthem, Inc. | 74 | 18,341 |
| CIGNA Corp. | 1,038 | 216,267 |
| Express Scripts Holding Co.(b) | 3,127 | 247,596 |
| McKesson Corp. | 775 | 130,882 |
| Solasto Corp. | 38,400 | 1,020,851 |
| UnitedHealth Group, Inc. | 1,225 | 290,056 |
| Total | | 1,936,751 |
| Pharmaceuticals 0.1% |
| GlaxoSmithKline PLC | 1,425 | 26,715 |
| Johnson & Johnson | 1,077 | 148,831 |
| Pfizer, Inc. | 6,505 | 240,945 |
| Roche Holding AG, Genusschein Shares | 74 | 18,243 |
| Total | | 434,734 |
| Total Health Care | 6,545,691 |
| Industrials 3.6% |
| Aerospace & Defense —% |
| Boeing Co. (The) | 1,005 | 356,142 |
| Airlines 0.1% |
| Deutsche Lufthansa AG, Registered Shares | 6,717 | 239,677 |
| International Consolidated Airlines Group SA | 7,849 | 71,333 |
| Japan Airlines Co., Ltd. | 2,200 | 83,132 |
| Total | | 394,142 |
The accompanying Notes to Financial Statements are an integral part of this statement.
Columbia Global Strategic Equity Fund | Annual Report 2018
| 9 |
Portfolio of Investments (continued)
January 31, 2018
| Common Stocks (continued) |
| Issuer | Shares | Value ($) |
| Building Products 0.4% |
| Daikin Industries Ltd. | 15,300 | 1,846,110 |
| Maeda Kosen Co., Ltd. | 70,200 | 1,317,402 |
| Total | | 3,163,512 |
| Construction & Engineering 0.1% |
| Kajima Corp. | 19,000 | 188,634 |
| Obayashi Corp. | 15,900 | 191,969 |
| Taisei Corp. | 3,600 | 183,746 |
| Total | | 564,349 |
| Electrical Equipment 0.4% |
| Nidec Corp. | 20,100 | 3,234,971 |
| Industrial Conglomerates —% |
| CITIC Ltd. | 76,000 | 119,610 |
| Machinery 1.0% |
| Fujitec Co., Ltd. | 23,800 | 328,428 |
| Komatsu Ltd. | 53,000 | 2,083,032 |
| Nittoku Engineering Co., Ltd. | 23,899 | 1,156,366 |
| PACCAR, Inc. | 2,570 | 191,619 |
| Rheon Automatic Machinery Co., Ltd. | 38,800 | 787,865 |
| Takuma Co., Ltd. | 188,700 | 2,564,163 |
| Total | | 7,111,473 |
| Professional Services 0.9% |
| BayCurrent Consulting, Inc. | 33,600 | 1,065,691 |
| Benefit One, Inc. | 41,000 | 1,035,969 |
| Nihon M&A Center, Inc. | 34,400 | 2,052,613 |
| Persol Holdings Co., Ltd. | 43,700 | 1,091,861 |
| Tanseisha Co., Ltd. | 97,553 | 1,098,948 |
| Total | | 6,345,082 |
| Trading Companies & Distributors 0.7% |
| ITOCHU Corp. | 151,400 | 2,979,052 |
| MISUMI Group, Inc. | 54,500 | 1,650,062 |
| Mitsubishi Corp. | 29,200 | 818,341 |
| Total | | 5,447,455 |
| Total Industrials | 26,736,736 |
| Information Technology 2.3% |
| Communications Equipment 0.1% |
| Cisco Systems, Inc. | 6,100 | 253,394 |
| Common Stocks (continued) |
| Issuer | Shares | Value ($) |
| Electronic Equipment, Instruments & Components 1.0% |
| Amano Corp. | 89,400 | 2,429,682 |
| Hitachi Ltd. | 30,000 | 239,394 |
| Keyence Corp. | 7,400 | 4,522,195 |
| Total | | 7,191,271 |
| Internet Software & Services —% |
| Mixi, Inc. | 3,800 | 167,793 |
| IT Services 0.2% |
| International Business Machines Corp. | 1,298 | 212,483 |
| ITOCHU Techno-Solutions Corp. | 32,100 | 1,414,674 |
| Total | | 1,627,157 |
| Semiconductors & Semiconductor Equipment 0.3% |
| Applied Materials, Inc. | 4,200 | 225,246 |
| Disco Corp. | 4,500 | 1,061,267 |
| Intel Corp. | 5,810 | 279,693 |
| Lam Research Corp. | 991 | 189,796 |
| Phison Electronics Corp. | 4,000 | 40,757 |
| Rohm Co., Ltd. | 4,700 | 517,778 |
| Total | | 2,314,537 |
| Software 0.3% |
| Digital Arts, Inc. | 29,400 | 1,093,858 |
| Microsoft Corp. | 1,747 | 165,982 |
| Nintendo Co., Ltd. | 2,600 | 1,177,579 |
| Total | | 2,437,419 |
| Technology Hardware, Storage & Peripherals 0.4% |
| Apple, Inc. | 1,223 | 204,767 |
| Compal Electronics, Inc. | 263,000 | 195,787 |
| Elecom Co., Ltd. | 77,500 | 1,851,064 |
| HP, Inc. | 9,300 | 216,876 |
| Pegatron Corp. | 67,000 | 181,270 |
| Samsung Electronics Co., Ltd. | 7 | 16,361 |
| Total | | 2,666,125 |
| Total Information Technology | 16,657,696 |
The accompanying Notes to Financial Statements are an integral part of this statement.
| 10 | Columbia Global Strategic Equity Fund | Annual Report 2018 |
Portfolio of Investments (continued)
January 31, 2018
| Common Stocks (continued) |
| Issuer | Shares | Value ($) |
| Materials 0.7% |
| Chemicals 0.6% |
| Covestro AG | 123 | 14,138 |
| JCU Corp. | 28,800 | 1,387,037 |
| LyondellBasell Industries NV, Class A | 1,995 | 239,081 |
| Mitsubishi Chemical Holdings Corp. | 1,300 | 14,178 |
| Mitsui Chemicals, Inc. | 52,200 | 1,645,861 |
| Nitto Denko Corp. | 10,500 | 964,739 |
| Total | | 4,265,034 |
| Metals & Mining 0.1% |
| Fortescue Metals Group Ltd. | 50,355 | 199,971 |
| Rio Tinto PLC | 2,629 | 146,400 |
| Total | | 346,371 |
| Paper & Forest Products —% |
| UPM-Kymmene OYJ | 5,870 | 197,793 |
| Total Materials | 4,809,198 |
| Real Estate 0.7% |
| Equity Real Estate Investment Trusts (REITS) —% |
| Duke Realty Corp. | 5,426 | 143,301 |
| Real Estate Management & Development 0.7% |
| DAMAC Properties Dubai Co. PJSC | 19,302 | 17,516 |
| Katitas Co., Ltd.(b) | 96,900 | 2,813,712 |
| Open House Co., Ltd. | 27,000 | 1,585,326 |
| Shimao Property Holdings Ltd. | 25,500 | 75,668 |
| Sun Hung Kai Properties Ltd. | 9,000 | 155,600 |
| Total | | 4,647,822 |
| Total Real Estate | 4,791,123 |
| Telecommunication Services 0.8% |
| Diversified Telecommunication Services 0.4% |
| Nippon Telegraph & Telephone Corp. | 49,400 | 2,365,503 |
| Orange SA | 1,737 | 31,367 |
| Telenor ASA | 7,818 | 183,055 |
| Total | | 2,579,925 |
| Wireless Telecommunication Services 0.4% |
| SoftBank Group Corp. | 36,500 | 3,032,709 |
| Total Telecommunication Services | 5,612,634 |
| Common Stocks (continued) |
| Issuer | Shares | Value ($) |
| Utilities —% |
| Electric Utilities —% |
| FirstEnergy Corp. | 916 | 30,136 |
| Inter RAO UES PJSC(b) | 901,000 | 60,747 |
| PG&E Corp. | 288 | 12,220 |
| Total | | 103,103 |
| Multi-Utilities —% |
| CenterPoint Energy, Inc. | 3,841 | 108,240 |
| Engie SA | 9,113 | 158,173 |
| Total | | 266,413 |
| Total Utilities | 369,516 |
Total Common Stocks
(Cost $76,354,493) | 98,067,456 |
|
| Equity Funds 82.9% |
| | Shares | Value ($) |
| Dividend Income 11.2% |
| Columbia Dividend Income Fund, Institutional 3 Class(a) | 1,695,971 | 39,600,933 |
| Columbia Global Dividend Opportunity Fund, Institutional 3 Class(a) | 2,113,359 | 42,858,915 |
| Total | 82,459,848 |
| International 43.0% |
| Columbia Contrarian Asia Pacific Fund, Institutional 3 Class(a) | 1,033,538 | 15,668,440 |
| Columbia Contrarian Europe Fund, Institutional 3 Class(a) | 7,530,826 | 57,460,201 |
| Columbia Emerging Markets Fund, Institutional 3 Class(a) | 2,075,355 | 30,819,024 |
| Columbia Global Energy and Natural Resources Fund, Institutional 3 Class(a) | 925,437 | 18,878,908 |
| Columbia Global Infrastructure Fund, Institutional 3 Class(a) | 2,018,226 | 27,568,969 |
| Columbia Global Technology Growth Fund, Institutional 3 Class(a),(b) | 1,161,109 | 40,580,763 |
| Columbia Overseas Value Fund, Institutional 3 Class(a) | 5,976,775 | 64,907,776 |
| Columbia Select Global Equity Fund, Institutional 3 Class(a) | 4,292,190 | 59,618,516 |
| Total | 315,502,597 |
The accompanying Notes to Financial Statements are an integral part of this statement.
Columbia Global Strategic Equity Fund | Annual Report 2018
| 11 |
Portfolio of Investments (continued)
January 31, 2018
| Equity Funds (continued) |
| | Shares | Value ($) |
| U.S. Large Cap 25.2% |
| Columbia Disciplined Value Fund, Institutional 3 Class(a) | 6,563,402 | 73,772,636 |
| Columbia Large Cap Growth Fund, Institutional 3 Class(a) | 602,186 | 26,773,178 |
| Columbia Select Large Cap Equity Fund, Institutional 3 Class(a) | 4,786,204 | 72,223,826 |
| Columbia Select Large Cap Growth Fund, Institutional 3 Class(a),(b) | 626,547 | 11,728,960 |
| Total | 184,498,600 |
| U.S. Small Cap 3.5% |
| Columbia Small Cap Growth Fund I, Institutional 3 Class(a),(b) | 1,270,877 | 26,014,852 |
Total Equity Funds
(Cost $487,724,128) | 608,475,897 |
|
| Money Market Funds 0.2% |
| | Shares | Value ($) |
| Columbia Short-Term Cash Fund, 1.475%(a),(d) | 1,354,410 | 1,354,410 |
Total Money Market Funds
(Cost $1,354,328) | 1,354,410 |
Total Investments
(Cost: $585,595,007) | 733,536,664 |
| Other Assets & Liabilities, Net | | 151,378 |
| Net Assets | 733,688,042 |
Investments in derivatives
| Forward foreign currency exchange contracts |
Currency to
be sold | Currency to
be purchased | Counterparty | Settlement
date | Unrealized
appreciation ($) | Unrealized
depreciation ($) |
| 91,000 CAD | 73,259 USD | JPMorgan | 03/14/2018 | — | (758) |
| 1,780,000 CNY | 275,700 USD | JPMorgan | 03/14/2018 | — | (6,184) |
| 237,000 EUR | 290,332 USD | JPMorgan | 03/14/2018 | — | (4,656) |
| 36,521,000 HUF | 144,879 USD | JPMorgan | 03/14/2018 | — | (1,559) |
| 8,006,000 JPY | 72,211 USD | JPMorgan | 03/14/2018 | — | (1,282) |
| 92,990,000 KRW | 87,283 USD | JPMorgan | 03/14/2018 | 275 | — |
| 1,026,000 NOK | 130,615 USD | JPMorgan | 03/14/2018 | — | (2,636) |
| 225,000 TRY | 57,979 USD | JPMorgan | 03/14/2018 | — | (1,234) |
| 5,984,000 TWD | 203,040 USD | JPMorgan | 03/14/2018 | — | (2,847) |
| 116,649 USD | 146,000 AUD | JPMorgan | 03/14/2018 | 981 | — |
| 116,347 USD | 377,000 BRL | JPMorgan | 03/14/2018 | 1,502 | — |
| 217,845 USD | 209,000 CHF | JPMorgan | 03/14/2018 | 7,377 | — |
| 86,914 USD | 528,000 DKK | JPMorgan | 03/14/2018 | 1,401 | — |
| 262,252 USD | 189,000 GBP | JPMorgan | 03/14/2018 | 6,497 | — |
| 145,057 USD | 9,315,000 INR | JPMorgan | 03/14/2018 | 581 | — |
| 43,518 USD | 822,000 MXN | JPMorgan | 03/14/2018 | 370 | — |
| 116,006 USD | 1,437,000 ZAR | JPMorgan | 03/14/2018 | 4,597 | — |
| Total | | | | 23,581 | (21,156) |
The accompanying Notes to Financial Statements are an integral part of this statement.
| 12 | Columbia Global Strategic Equity Fund | Annual Report 2018 |
Portfolio of Investments (continued)
January 31, 2018
Notes to Portfolio of Investments
| (a) | As defined in the Investment Company Act of 1940, an affiliated company is one in which the Fund owns 5% or more of the company’s outstanding voting securities, or a company which is under common ownership or control with the Fund. Holdings and transactions in these affiliated companies during the year ended January 31, 2018 are as follows: |
| Issuer | Beginning
shares | Shares
purchased | Shares
sold | Ending
shares | Capital gain
distributions —
affiliated
issuers ($) | Realized gain
(loss) —
affiliated
issuers ($) | Net change in
unrealized
appreciation
(depreciation) —
affiliated
issuers ($) | Dividends —
affiliated
issuers ($) | Value —
affiliated
issuers
at end of
period ($) |
| Columbia Contrarian Asia Pacific Fund, Class I Shares |
| | 1,258,054 | 16,560 | (1,274,614)* | — | — | (161,107) | 2,656,618 | — | — |
| Columbia Contrarian Asia Pacific Fund, Institutional 3 Class |
| | — | 1,256,563* | (223,025) | 1,033,538 | — | (319,780) | 3,023,407 | 174,211 | 15,668,440 |
| Columbia Contrarian Europe Fund, Class I Shares |
| | 8,191,787 | 125,641 | (8,317,428)* | — | — | (115,392) | 9,321,474 | — | — |
| Columbia Contrarian Europe Fund, Institutional 3 Class |
| | — | 8,622,546* | (1,091,720) | 7,530,826 | — | (356,036) | 4,599,594 | 1,021,290 | 57,460,201 |
| Columbia Convertible Securities Fund, Class I Shares |
| | 1,207,665 | 28,408 | (1,236,073)* | — | — | 50,026 | (2,945,308) | 177,481 | — |
| Columbia Convertible Securities Fund, Institutional 3 Class |
| | — | 1,273,347* | (49,534) | 1,223,813 | — | 194,271 | 5,476,844 | 559,786 | 25,638,901 |
| Columbia Disciplined Value Fund, Class I Shares |
| | 6,433,238 | 54,421 | (6,487,659)* | — | — | 107,584 | (5,397,906) | — | — |
| Columbia Disciplined Value Fund, Institutional 3 Class |
| | — | 6,945,398* | (381,996) | 6,563,402 | 3,536,119 | 766,404 | 14,091,685 | 1,573,637 | 73,772,636 |
| Columbia Dividend Income Fund, Class I Shares |
| | 1,756,531 | 26,310 | (1,782,841)* | — | — | 367,520 | (3,170,384) | 183,745 | — |
| Columbia Dividend Income Fund, Institutional 3 Class |
| | — | 1,792,128* | (96,157) | 1,695,971 | 981,540 | 767,802 | 8,448,464 | 524,687 | 39,600,933 |
| Columbia Emerging Markets Fund, Class I Shares |
| | 2,612,421 | 29,161 | (2,641,582)* | — | — | 43,543 | (1,103,023) | — | — |
| Columbia Emerging Markets Fund, Institutional 3 Class |
| | — | 2,573,749* | (498,394) | 2,075,355 | — | 1,265,501 | 10,524,075 | 134,700 | 30,819,024 |
| Columbia Global Dividend Opportunity Fund, Class I Shares |
| | 2,211,783 | 45,265 | (2,257,048)* | — | — | (84,035) | 1,989,543 | 273,332 | — |
| Columbia Global Dividend Opportunity Fund, Institutional 3 Class |
| | — | 2,281,807* | (168,448) | 2,113,359 | — | 50,525 | 4,825,217 | 1,020,826 | 42,858,915 |
| Columbia Global Energy and Natural Resources Fund, Class I Shares |
| | 919,902 | 19,182 | (939,084)* | — | — | (1,912) | 947,484 | — | — |
| Columbia Global Energy and Natural Resources Fund, Institutional 3 Class |
| | — | 987,689* | (62,252) | 925,437 | — | (196,399) | 1,513,099 | 389,531 | 18,878,908 |
| Columbia Global Infrastructure Fund, Class I Shares |
| | 2,019,699 | 23,913 | (2,043,612)* | — | — | (104,013) | 8,159,223 | — | — |
| Columbia Global Infrastructure Fund, Institutional 3 Class |
| | — | 2,169,801* | (151,575) | 2,018,226 | 779,957 | (1,086,088) | (3,852,237) | 211,602 | 27,568,969 |
| Columbia Global Technology Growth Fund, Class I Shares |
| | 1,347,797 | 10,017 | (1,357,814)* | — | — | 383,346 | (7,062,011) | — | — |
| Columbia Global Technology Growth Fund, Institutional 3 Class |
| | — | 1,407,361* | (246,252) | 1,161,109 | 1,279,841 | 2,307,090 | 17,235,503 | — | 40,580,763 |
The accompanying Notes to Financial Statements are an integral part of this statement.
Columbia Global Strategic Equity Fund | Annual Report 2018
| 13 |
Portfolio of Investments (continued)
January 31, 2018
Notes to Portfolio of Investments (continued)
| Issuer | Beginning
shares | Shares
purchased | Shares
sold | Ending
shares | Capital gain
distributions —
affiliated
issuers ($) | Realized gain
(loss) —
affiliated
issuers ($) | Net change in
unrealized
appreciation
(depreciation) —
affiliated
issuers ($) | Dividends —
affiliated
issuers ($) | Value —
affiliated
issuers
at end of
period ($) |
| Columbia Large Cap Growth Fund, Class I Shares |
| | 640,010 | 7,820 | (647,830)* | — | — | 51,848 | 1,184,577 | — | — |
| Columbia Large Cap Growth Fund, Institutional 3 Class |
| | — | 665,883* | (63,697) | 602,186 | 1,430,824 | 196,776 | 3,932,739 | 62,036 | 26,773,178 |
| Columbia Overseas Value Fund, Class I Shares |
| | 6,704,822 | 72,715 | (6,777,537)* | — | — | (44,365) | (2,094,119) | — | — |
| Columbia Overseas Value Fund, Institutional 3 Class |
| | — | 6,940,692* | (963,917) | 5,976,775 | 1,031,664 | 1,569,018 | 15,832,221 | 1,120,693 | 64,907,776 |
| Columbia Select Global Equity Fund, Class I Shares |
| | 5,959,628 | 52,564 | (6,012,192)* | — | — | 201,044 | (1,311,732) | — | — |
| Columbia Select Global Equity Fund, Institutional 3 Class |
| | — | 5,933,725* | (1,641,535) | 4,292,190 | 229,968 | 2,114,795 | 15,741,307 | 187,964 | 59,618,516 |
| Columbia Select Large Cap Equity Fund, Class I Shares |
| | 4,962,502 | — | (4,962,502)* | — | — | — | (4,023,392) | — | — |
| Columbia Select Large Cap Equity Fund, Institutional 3 Class |
| | — | 5,350,307* | (564,103) | 4,786,204 | 3,252,334 | 1,157,809 | 15,946,967 | 609,479 | 72,223,826 |
| Columbia Select Large Cap Growth Fund, Class I Shares |
| | 696,729 | 8,523 | (705,252)* | — | — | 75,086 | (1,136,631) | — | — |
| Columbia Select Large Cap Growth Fund, Institutional 3 Class |
| | — | 730,885* | (104,338) | 626,547 | 1,148,333 | 402,395 | 2,925,175 | — | 11,728,960 |
| Columbia Short-Term Cash Fund, 1.475% |
| | 2,660,125 | 40,722,950 | (42,028,665) | 1,354,410 | — | (223) | 81 | 21,335 | 1,354,410 |
| Columbia Small Cap Growth Fund I, Class I Shares |
| | 1,231,528 | 15,074 | (1,246,602)* | — | — | 44,977 | (3,715,735) | — | — |
| Columbia Small Cap Growth Fund I, Institutional 3 Class |
| | — | 1,411,024* | (140,147) | 1,270,877 | 3,501,819 | 443,796 | 5,964,553 | — | 26,014,852 |
| Total | | | | | 17,172,399 | 10,091,806 | 118,527,372 | 8,246,335 | 635,469,208 |
| * | Includes the effect of underlying share class exchange. |
| (b) | Non-income producing investment. |
| (c) | Represents privately placed and other securities and instruments exempt from SEC registration (collectively, private placements), such as Section 4(a)(2) and Rule 144A eligible securities, which are often sold only to qualified institutional buyers. The Fund may invest in private placements determined to be liquid as well as those determined to be illiquid. Private placements may be determined to be liquid under guidelines established by the Fund’s Board of Trustees. At January 31, 2018, the value of these securities amounted to $156,400, which represents 0.02% of net assets. |
| (d) | The rate shown is the seven-day current annualized yield at January 31, 2018. |
Currency Legend
| AUD | Australian Dollar |
| BRL | Brazilian Real |
| CAD | Canada Dollar |
| CHF | Swiss Franc |
| CNY | China Yuan Renminbi |
| DKK | Danish Krone |
| EUR | Euro |
The accompanying Notes to Financial Statements are an integral part of this statement.
| 14 | Columbia Global Strategic Equity Fund | Annual Report 2018 |
Portfolio of Investments (continued)
January 31, 2018
Currency Legend (continued)
| GBP | British Pound |
| HUF | Hungarian Forint |
| INR | Indian Rupee |
| JPY | Japanese Yen |
| KRW | South Korean Won |
| MXN | Mexican Peso |
| NOK | Norwegian Krone |
| TRY | Turkish Lira |
| TWD | New Taiwan Dollar |
| USD | US Dollar |
| ZAR | South African Rand |
Fair value measurements
The Fund categorizes its fair value measurements according to a three-level hierarchy that maximizes the use of observable inputs and minimizes the use of unobservable inputs by prioritizing that the most observable input be used when available. Observable inputs are those that market participants would use in pricing an investment based on market data obtained from sources independent of the reporting entity. Unobservable inputs are those that reflect the Fund’s assumptions about the information market participants would use in pricing an investment. An investment’s level within the fair value hierarchy is based on the lowest level of any input that is deemed significant to the asset’s or liability’s fair value measurement. The input levels are not necessarily an indication of the risk or liquidity associated with investments at that level. For example, certain U.S. government securities are generally high quality and liquid, however, they are reflected as Level 2 because the inputs used to determine fair value may not always be quoted prices in an active market.
Fair value inputs are summarized in the three broad levels listed below:
| ¦ | Level 1 — Valuations based on quoted prices for investments in active markets that the Fund has the ability to access at the measurement date. Valuation adjustments are not applied to Level 1 investments. |
| ¦ | Level 2 — Valuations based on other significant observable inputs (including quoted prices for similar securities, interest rates, prepayment speeds, credit risks, etc.). |
| ¦ | Level 3 — Valuations based on significant unobservable inputs (including the Fund’s own assumptions and judgment in determining the fair value of investments). |
Inputs that are used in determining fair value of an investment may include price information, credit data, volatility statistics, and other factors. These inputs can be either observable or unobservable. The availability of observable inputs can vary between investments, and is affected by various factors such as the type of investment, and the volume and level of activity for that investment or similar investments in the marketplace. The inputs will be considered by the Investment Manager, along with any other relevant factors in the calculation of an investment’s fair value. The Fund uses prices and inputs that are current as of the measurement date, which may include periods of market dislocations. During these periods, the availability of prices and inputs may be reduced for many investments. This condition could cause an investment to be reclassified between the various levels within the hierarchy.
Foreign equity securities actively traded in markets where there is a significant delay in the local close relative to the New York Stock Exchange are classified as Level 2. The values of these securities may include an adjustment to reflect the impact of significant market movements following the close of local trading, as described in Note 2 to the financial statements – Security valuation.
Certain investments that have been measured at fair value using the net asset value (NAV) per share (or its equivalent) are not categorized in the fair value hierarchy. The fair value amounts presented in the table are intended to reconcile the fair value hierarchy to the amounts presented in the Portfolio of Investments. The Columbia Short-Term Cash Fund seeks to provide shareholders with maximum current income consistent with liquidity and stability of principal. Columbia Short-Term Cash Fund prices its shares with a floating NAV and no longer seeks to maintain a stable NAV.
Investments falling into the Level 3 category are primarily supported by quoted prices from brokers and dealers participating in the market for those investments. However, these may be classified as Level 3 investments due to lack of market transparency and corroboration to support these quoted prices. Additionally, valuation models may be used as the pricing source for any remaining investments classified as Level 3. These models may rely on one or more significant unobservable inputs and/or significant assumptions by the Investment Manager. Inputs used in valuations may include, but are not limited to, financial statement analysis, capital account balances, discount rates and estimated cash flows, and comparable company data.
Under the direction of the Fund’s Board of Trustees (the Board), the Investment Manager’s Valuation Committee (the Committee) is responsible for overseeing the valuation procedures approved by the Board. The Committee consists of voting and non-voting members from various groups within the Investment Manager’s organization, including operations and accounting, trading and investments, compliance, risk management and legal.
The Committee meets at least monthly to review and approve valuation matters, which may include a description of specific valuation determinations, data regarding pricing information received from approved pricing vendors and brokers and the results of Board-approved valuation control policies and procedures (the Policies). The Policies address, among other things, instances when market quotations are or are not readily available, including recommendations of third party pricing vendors and a determination of appropriate pricing methodologies; events that require specific valuation determinations and assessment of fair value techniques; securities with a potential for stale pricing, including those that are illiquid, restricted, or in default; and the effectiveness of third party pricing vendors, including periodic reviews of vendors. The Committee meets more frequently, as needed, to discuss additional valuation matters, which may include the need to review back-testing results, review time-sensitive information or approve related valuation actions. The Committee reports to the Board, with members of the Committee meeting with the Board at each of its regularly scheduled meetings to discuss valuation matters and actions during the period, similar to those described earlier.
The accompanying Notes to Financial Statements are an integral part of this statement.
Columbia Global Strategic Equity Fund | Annual Report 2018
| 15 |
Portfolio of Investments (continued)
January 31, 2018
Fair value measurements (continued)
For investments categorized as Level 3, the Committee monitors information similar to that described above, which may include: (i) data specific to the issuer or comparable issuers, (ii) general market or specific sector news and (iii) quoted prices and specific or similar security transactions. The Committee considers this data and any changes from prior periods in order to assess the reasonableness of observable and unobservable inputs, any assumptions or internal models used to value those securities and changes in fair value. This data is also used to corroborate, when available, information received from approved pricing vendors and brokers. Various factors impact the frequency of monitoring this information (which may occur as often as daily). However, the Committee may determine that changes to inputs, assumptions and models are not required as a result of the monitoring procedures performed.
The following table is a summary of the inputs used to value the Fund’s investments at January 31, 2018:
| | Level 1
quoted prices
in active
markets for
identical
assets ($) | Level 2
other
significant
observable
inputs ($) | Level 3
significant
unobservable
inputs ($) | Investments
measured at
net asset
value ($) | Total ($) |
| Investments | | | | | |
| Alternative Strategies Funds | 25,638,901 | — | — | — | 25,638,901 |
| Common Stocks | | | | | |
| Consumer Discretionary | 1,151,463 | 12,022,809 | — | — | 13,174,272 |
| Consumer Staples | 1,148,674 | 2,113,536 | — | — | 3,262,210 |
| Energy | 169,675 | 824,194 | — | — | 993,869 |
| Financials | 950,995 | 14,163,516 | — | — | 15,114,511 |
| Health Care | 1,552,507 | 4,993,184 | — | — | 6,545,691 |
| Industrials | 547,761 | 26,188,975 | — | — | 26,736,736 |
| Information Technology | 1,748,237 | 14,909,459 | — | — | 16,657,696 |
| Materials | 239,081 | 4,570,117 | — | — | 4,809,198 |
| Real Estate | 143,301 | 4,647,822 | — | — | 4,791,123 |
| Telecommunication Services | — | 5,612,634 | — | — | 5,612,634 |
| Utilities | 150,596 | 218,920 | — | — | 369,516 |
| Total Common Stocks | 7,802,290 | 90,265,166 | — | — | 98,067,456 |
| Equity Funds | 608,475,897 | — | — | — | 608,475,897 |
| Money Market Funds | — | — | — | 1,354,410 | 1,354,410 |
| Total Investments | 641,917,088 | 90,265,166 | — | 1,354,410 | 733,536,664 |
| Derivatives | | | | | |
| Asset | | | | | |
| Forward Foreign Currency Exchange Contracts | — | 23,581 | — | — | 23,581 |
| Liability | | | | | |
| Forward Foreign Currency Exchange Contracts | — | (21,156) | — | — | (21,156) |
| Total | 641,917,088 | 90,267,591 | — | 1,354,410 | 733,539,089 |
See the Portfolio of Investments for all investment classifications not indicated in the table.
The Fund’s assets assigned to the Level 2 input category are generally valued using the market approach, in which a security’s value is determined through reference to prices and information from market transactions for similar or identical assets. These assets include certain foreign securities for which a third party statistical pricing service may be employed for purposes of fair market valuation. The model utilized by such third party statistical pricing service takes into account a security’s correlation to available market data including, but not limited to, intraday index, ADR, and exchange-traded fund movements.
Derivative instruments are valued at unrealized appreciation (depreciation).
There were no transfers of financial assets between levels during the period.
The accompanying Notes to Financial Statements are an integral part of this statement.
| 16 | Columbia Global Strategic Equity Fund | Annual Report 2018 |
Statement of Assets and Liabilities
January 31, 2018
| Assets | |
| Investments in unaffiliated issuers, at cost | $76,354,493 |
| Investments in affiliated issuers, at cost | 509,240,514 |
| Investments in unaffiliated issuers, at value | 98,067,456 |
| Investments in affiliated issuers, at value | 635,469,208 |
| Unrealized appreciation on forward foreign currency exchange contracts | 23,581 |
| Receivable for: | |
| Investments sold | 1,051,724 |
| Capital shares sold | 361,387 |
| Dividends | 39,346 |
| Foreign tax reclaims | 62,436 |
| Prepaid expenses | 2,316 |
| Other assets | 1,251 |
| Total assets | 735,078,705 |
| Liabilities | |
| Foreign currency (identified cost $181) | 180 |
| Unrealized depreciation on forward foreign currency exchange contracts | 21,156 |
| Payable for: | |
| Investments purchased | 339,121 |
| Capital shares purchased | 872,711 |
| Management services fees | 1,910 |
| Distribution and/or service fees | 6,141 |
| Transfer agent fees | 55,631 |
| Plan administration fees | 1 |
| Compensation of board members | 40,398 |
| Compensation of chief compliance officer | 140 |
| Other expenses | 53,274 |
| Total liabilities | 1,390,663 |
| Net assets applicable to outstanding capital stock | $733,688,042 |
| Represented by | |
| Paid in capital | 572,938,687 |
| Undistributed net investment income | 6,328,504 |
| Accumulated net realized gain | 6,473,560 |
| Unrealized appreciation (depreciation) on: | |
| Investments - unaffiliated issuers | 21,712,963 |
| Investments - affiliated issuers | 126,228,694 |
| Foreign currency translations | 3,209 |
| Forward foreign currency exchange contracts | 2,425 |
| Total - representing net assets applicable to outstanding capital stock | $733,688,042 |
The accompanying Notes to Financial Statements are an integral part of this statement.
Columbia Global Strategic Equity Fund | Annual Report 2018
| 17 |
Statement of Assets and Liabilities (continued)
January 31, 2018
| Class A | |
| Net assets | $611,507,560 |
| Shares outstanding | 37,271,578 |
| Net asset value per share | $16.41 |
| Maximum offering price per share(a) | $17.41 |
| Advisor Class(b) | |
| Net assets | $8,276,817 |
| Shares outstanding | 482,958 |
| Net asset value per share | $17.14 |
| Class C | |
| Net assets | $71,030,244 |
| Shares outstanding | 5,059,073 |
| Net asset value per share | $14.04 |
| Institutional Class(c) | |
| Net assets | $40,391,202 |
| Shares outstanding | 2,394,194 |
| Net asset value per share | $16.87 |
| Institutional 2 Class(d) | |
| Net assets | $602,601 |
| Shares outstanding | 35,114 |
| Net asset value per share | $17.16 |
| Institutional 3 Class(e) | |
| Net assets | $1,535,286 |
| Shares outstanding | 90,515 |
| Net asset value per share | $16.96 |
| Class K | |
| Net assets | $134,865 |
| Shares outstanding | 8,015 |
| Net asset value per share | $16.83 |
| Class R | |
| Net assets | $209,467 |
| Shares outstanding | 12,983 |
| Net asset value per share | $16.13 |
| (a) | The maximum offering price per share is calculated by dividing the net asset value per share by 1.0 minus the maximum sales charge of 5.75% for Class A shares. |
| (b) | Prior to November 1, 2017, Advisor Class shares were known as Class R4 shares. |
| (c) | Prior to November 1, 2017, Institutional Class shares were known as Class Z shares. |
| (d) | Prior to November 1, 2017, Institutional 2 Class shares were known as Class R5 shares. |
| (e) | Prior to November 1, 2017, Institutional 3 Class shares were known as Class Y shares. |
The accompanying Notes to Financial Statements are an integral part of this statement.
| 18 | Columbia Global Strategic Equity Fund | Annual Report 2018 |
Statement of Operations
Year Ended January 31, 2018
| Net investment income | |
| Income: | |
| Dividends — unaffiliated issuers | $1,468,416 |
| Dividends — affiliated issuers | 8,246,335 |
| Foreign taxes withheld | (135,108) |
| Total income | 9,579,643 |
| Expenses: | |
| Management services fees | 579,896 |
| Distribution and/or service fees | |
| Class A | 1,386,043 |
| Class B(a) | 17,527 |
| Class C | 697,811 |
| Class R | 4,081 |
| Transfer agent fees | |
| Class A | 627,832 |
| Advisor Class(b) | 4,278 |
| Class B(a) | 2,292 |
| Class C | 79,767 |
| Institutional Class(c) | 32,949 |
| Institutional 2 Class(d) | 423 |
| Institutional 3 Class(e),(f) | 64 |
| Class K | 86 |
| Class R | 947 |
| Plan administration fees | |
| Class K | 295 |
| Compensation of board members | 25,116 |
| Custodian fees | 70,125 |
| Printing and postage fees | 75,689 |
| Registration fees | 120,025 |
| Audit fees | 17,493 |
| Legal fees | 12,593 |
| Compensation of chief compliance officer | 142 |
| Other | 34,987 |
| Total expenses | 3,790,461 |
| Expense reduction | (650) |
| Total net expenses | 3,789,811 |
| Net investment income | 5,789,832 |
| Realized and unrealized gain (loss) — net | |
| Net realized gain (loss) on: | |
| Investments — unaffiliated issuers | 8,362,065 |
| Investments — affiliated issuers | 10,091,806 |
| Capital gain distributions from underlying affiliated funds | 17,172,399 |
| Foreign currency translations | (14,218) |
| Forward foreign currency exchange contracts | (39,143) |
| Net realized gain | 35,572,909 |
| Net change in unrealized appreciation (depreciation) on: | |
| Investments — unaffiliated issuers | 16,956,337 |
| Investments — affiliated issuers | 118,527,372 |
| Foreign currency translations | 5,780 |
| Forward foreign currency exchange contracts | 2,425 |
| Net change in unrealized appreciation (depreciation) | 135,491,914 |
| Net realized and unrealized gain | 171,064,823 |
| Net increase in net assets resulting from operations | $176,854,655 |
The accompanying Notes to Financial Statements are an integral part of this statement.
Columbia Global Strategic Equity Fund | Annual Report 2018
| 19 |
Statement of Operations (continued)
Year Ended January 31, 2018
| (a) | Effective July 17, 2017, Class B shares were automatically converted to Class A shares. |
| (b) | Prior to November 1, 2017, Advisor Class shares were known as Class R4 shares. |
| (c) | Prior to November 1, 2017, Institutional Class shares were known as Class Z shares. |
| (d) | Prior to November 1, 2017, Institutional 2 Class shares were known as Class R5 shares. |
| (e) | Prior to November 1, 2017, Institutional 3 Class shares were known as Class Y shares. |
| (f) | Institutional 3 Class shares are based on operations from March 1, 2017 (commencement of operations) through the stated period end. |
The accompanying Notes to Financial Statements are an integral part of this statement.
| 20 | Columbia Global Strategic Equity Fund | Annual Report 2018 |
Statement of Changes in Net Assets
| | Year Ended
January 31, 2018 (a) | Year Ended
January 31, 2017 |
| Operations | | |
| Net investment income | $5,789,832 | $6,093,798 |
| Net realized gain (loss) | 35,572,909 | (21,052,119) |
| Net change in unrealized appreciation (depreciation) | 135,491,914 | 107,053,863 |
| Net increase in net assets resulting from operations | 176,854,655 | 92,095,542 |
| Distributions to shareholders | | |
| Net investment income | | |
| Class A | (7,802,494) | (566,248) |
| Advisor Class(b) | (66,485) | (244) |
| Class B(c) | (37,946) | — |
| Class C | (725,833) | — |
| Institutional Class(d) | (462,496) | (52,857) |
| Institutional 2 Class(e) | (9,573) | (678) |
| Institutional 3 Class(f) | (6,321) | — |
| Class K | (1,672) | (151) |
| Class R | (10,236) | (160) |
| Net realized gains | | |
| Class A | — | (14,097,120) |
| Advisor Class(b) | — | (3,387) |
| Class B(c) | — | (272,449) |
| Class C | — | (2,457,719) |
| Institutional Class(d) | — | (622,281) |
| Institutional 2 Class(e) | — | (4,845) |
| Class K | — | (2,547) |
| Class R | — | (22,501) |
| Total distributions to shareholders | (9,123,056) | (18,103,187) |
| Decrease in net assets from capital stock activity | (53,379,401) | (97,374,176) |
| Total increase (decrease) in net assets | 114,352,198 | (23,381,821) |
| Net assets at beginning of year | 619,335,844 | 642,717,665 |
| Net assets at end of year | $733,688,042 | $619,335,844 |
| Undistributed net investment income | $6,328,504 | $5,865,259 |
| (a) | Institutional 3 Class shares are based on operations from March 1, 2017 (commencement of operations) through the stated period end. |
| (b) | Prior to November 1, 2017, Advisor Class shares were known as Class R4 shares. |
| (c) | Effective July 17, 2017, Class B shares were automatically converted to Class A shares. |
| (d) | Prior to November 1, 2017, Institutional Class shares were known as Class Z shares. |
| (e) | Prior to November 1, 2017, Institutional 2 Class shares were known as Class R5 shares. |
| (f) | Prior to November 1, 2017, Institutional 3 Class shares were known as Class Y shares. |
The accompanying Notes to Financial Statements are an integral part of this statement.
Columbia Global Strategic Equity Fund | Annual Report 2018
| 21 |
Statement of Changes in Net Assets (continued)
| | Year Ended | Year Ended |
| | January 31, 2018 (a) | January 31, 2017 |
| | Shares | Dollars ($) | Shares | Dollars ($) |
| Capital stock activity |
| Class A(b) | | | | |
| Subscriptions (c) | 3,331,650 | 46,636,686 | 2,815,693 | 33,990,935 |
| Distributions reinvested | 454,933 | 6,285,811 | 1,019,455 | 11,716,563 |
| Redemptions | (6,919,184) | (97,562,374) | (9,497,922) | (115,002,064) |
| Net decrease | (3,132,601) | (44,639,877) | (5,662,774) | (69,294,566) |
| Advisor Class(d) | | | | |
| Subscriptions | 649,347 | 9,672,472 | 16,288 | 210,418 |
| Distributions reinvested | 2,720 | 38,678 | 299 | 3,575 |
| Redemptions | (190,417) | (2,755,641) | (1,324) | (17,029) |
| Net increase | 461,650 | 6,955,509 | 15,263 | 196,964 |
| Class B(b) | | | | |
| Subscriptions | 1,630 | 19,363 | 3,747 | 37,619 |
| Distributions reinvested | 3,073 | 35,124 | 23,027 | 230,730 |
| Redemptions (c) | (488,031) | (5,796,457) | (776,055) | (8,129,868) |
| Net decrease | (483,328) | (5,741,970) | (749,281) | (7,861,519) |
| Class C | | | | |
| Subscriptions | 449,557 | 5,577,125 | 485,835 | 5,042,575 |
| Distributions reinvested | 49,204 | 560,844 | 184,438 | 1,825,941 |
| Redemptions | (2,205,666) | (26,595,745) | (2,040,310) | (21,308,973) |
| Net decrease | (1,706,905) | (20,457,776) | (1,370,037) | (14,440,457) |
| Institutional Class(e) | | | | |
| Subscriptions | 1,305,606 | 19,724,203 | 478,869 | 5,919,766 |
| Distributions reinvested | 14,245 | 204,352 | 21,656 | 255,508 |
| Redemptions | (662,588) | (9,821,389) | (895,297) | (10,897,228) |
| Net increase (decrease) | 657,263 | 10,107,166 | (394,772) | (4,721,954) |
| Institutional 2 Class(f) | | | | |
| Subscriptions | 4,095 | 61,702 | 39,992 | 521,412 |
| Distributions reinvested | 655 | 9,534 | 455 | 5,467 |
| Redemptions | (15,205) | (224,777) | (23,635) | (300,237) |
| Net increase (decrease) | (10,455) | (153,541) | 16,812 | 226,642 |
| Institutional 3 Class(g) | | | | |
| Subscriptions | 99,172 | 1,550,718 | — | — |
| Distributions reinvested | 391 | 6,276 | — | — |
| Redemptions | (9,048) | (146,413) | — | — |
| Net increase | 90,515 | 1,410,581 | — | — |
| Class K | | | | |
| Distributions reinvested | 116 | 1,636 | 224 | 2,637 |
| Redemptions | (182) | (2,578) | — | — |
| Net increase (decrease) | (66) | (942) | 224 | 2,637 |
| Class R | | | | |
| Subscriptions | 10,207 | 139,979 | 9,268 | 108,658 |
| Distributions reinvested | 508 | 6,900 | 1,267 | 14,329 |
| Redemptions | (67,256) | (1,005,430) | (142,500) | (1,604,910) |
| Net decrease | (56,541) | (858,551) | (131,965) | (1,481,923) |
| Total net decrease | (4,180,468) | (53,379,401) | (8,276,530) | (97,374,176) |
The accompanying Notes to Financial Statements are an integral part of this statement.
| 22 | Columbia Global Strategic Equity Fund | Annual Report 2018 |
Statement of Changes in Net Assets (continued)
| (a) | Institutional 3 Class shares are based on operations from March 1, 2017 (commencement of operations) through the stated period end. |
| (b) | Effective July 17, 2017, Class B shares were automatically converted to Class A shares. |
| (c) | Includes conversions of Class B shares to Class A shares, if any. |
| (d) | Prior to November 1, 2017, Advisor Class shares were known as Class R4 shares. |
| (e) | Prior to November 1, 2017, Institutional Class shares were known as Class Z shares. |
| (f) | Prior to November 1, 2017, Institutional 2 Class shares were known as Class R5 shares. |
| (g) | Prior to November 1, 2017, Institutional 3 Class shares were known as Class Y shares. |
The accompanying Notes to Financial Statements are an integral part of this statement.
Columbia Global Strategic Equity Fund | Annual Report 2018
| 23 |
The following table is intended to help you understand the Fund’s financial performance. Certain information reflects financial results for a single share of a class held for the periods shown. Per share net investment income (loss) amounts are calculated based on average shares outstanding during the period. Total return assumes reinvestment of all dividends and distributions, if any. Total return does not reflect payment of sales charges, if any. Total return and portfolio turnover are not annualized for periods of less than one year. The portfolio turnover rate is calculated without regard to purchase and sales transactions of short-term instruments and certain derivatives, if any. If such transactions were included, the Fund’s portfolio turnover rate may be higher.
| Year ended | Net asset value,
beginning of
period | Net
investment
income | Net
realized
and
unrealized
gain (loss) | Total from
investment
operations | Distributions
from net
investment
income | Distributions
from net
realized
gains |
| Class A |
| 1/31/2018 | $12.75 | 0.14 | 3.72 | 3.86 | (0.20) | — |
| 1/31/2017 | $11.35 | 0.13 | 1.61 | 1.74 | (0.02) | (0.32) |
| 1/31/2016 | $15.35 | 0.24 | (1.00) | (0.76) | (0.33) | (2.91) |
| 1/31/2015 | $14.83 | 0.17 | 1.16 | 1.33 | (0.35) | (0.46) |
| 1/31/2014 | $12.96 | 0.16 | 2.02 | 2.18 | (0.31) | — |
| Advisor Class(d) |
| 1/31/2018 | $13.31 | 0.24 | 3.82 | 4.06 | (0.23) | — |
| 1/31/2017 | $11.81 | 0.19 | 1.66 | 1.85 | (0.03) | (0.32) |
| 1/31/2016 | $15.85 | 0.39 | (1.16) | (0.77) | (0.36) | (2.91) |
| 1/31/2015 | $15.29 | 0.20 | 1.21 | 1.41 | (0.39) | (0.46) |
| 1/31/2014 | $13.35 | 0.27 | 2.02 | 2.29 | (0.35) | — |
| Class C |
| 1/31/2018 | $10.95 | 0.02 | 3.18 | 3.20 | (0.11) | — |
| 1/31/2017 | $9.85 | 0.03 | 1.39 | 1.42 | — | (0.32) |
| 1/31/2016 | $13.76 | 0.12 | (0.87) | (0.75) | (0.25) | (2.91) |
| 1/31/2015 | $13.36 | 0.05 | 1.04 | 1.09 | (0.23) | (0.46) |
| 1/31/2014 | $11.69 | 0.05 | 1.83 | 1.88 | (0.21) | — |
| Institutional Class(e) |
| 1/31/2018 | $13.11 | 0.18 | 3.81 | 3.99 | (0.23) | — |
| 1/31/2017 | $11.64 | 0.16 | 1.66 | 1.82 | (0.03) | (0.32) |
| 1/31/2016 | $15.66 | 0.26 | (1.01) | (0.75) | (0.36) | (2.91) |
| 1/31/2015 | $15.11 | 0.22 | 1.18 | 1.40 | (0.39) | (0.46) |
| 1/31/2014 | $13.20 | 0.20 | 2.05 | 2.25 | (0.34) | — |
| Institutional 2 Class(f) |
| 1/31/2018 | $13.33 | 0.19 | 3.88 | 4.07 | (0.24) | — |
| 1/31/2017 | $11.83 | 0.19 | 1.67 | 1.86 | (0.04) | (0.32) |
| 1/31/2016 | $15.85 | 0.32 | (1.06) | (0.74) | (0.37) | (2.91) |
| 1/31/2015 | $15.29 | 0.32 | 1.10 | 1.42 | (0.40) | (0.46) |
| 1/31/2014 | $13.35 | 0.29 | 2.02 | 2.31 | (0.37) | — |
| Institutional 3 Class(g) |
| 1/31/2018 (h) | $13.64 | 0.36 | 3.21 | 3.57 | (0.25) | — |
The accompanying Notes to Financial Statements are an integral part of this statement.
| 24 | Columbia Global Strategic Equity Fund | Annual Report 2018 |
Total
distributions to
shareholders | Net
asset
value,
end of
period | Total
return | Total gross
expense
ratio to
average
net assets(a) | Total net
expense
ratio to
average
net assets(a),(b) | Net investment
income
ratio to
average
net assets | Portfolio
turnover | Net
assets,
end of
period
(000’s) |
| |
| (0.20) | $16.41 | 30.57% | 0.50% | 0.50% (c) | 0.95% | 18% | $611,508 |
| (0.34) | $12.75 | 15.63% | 0.52% | 0.52% (c) | 1.05% | 54% | $515,290 |
| (3.24) | $11.35 | (6.66%) | 0.50% | 0.50% (c) | 1.66% | 75% | $522,769 |
| (0.81) | $15.35 | 8.88% | 0.48% | 0.48% (c) | 1.10% | 16% | $622,508 |
| (0.31) | $14.83 | 16.86% | 0.50% | 0.50% (c) | 1.17% | 18% | $605,625 |
| |
| (0.23) | $17.14 | 30.86% | 0.25% | 0.25% (c) | 1.58% | 18% | $8,277 |
| (0.35) | $13.31 | 16.01% | 0.27% | 0.27% (c) | 1.52% | 54% | $284 |
| (3.27) | $11.81 | (6.55%) | 0.27% | 0.27% (c) | 2.73% | 75% | $71 |
| (0.85) | $15.85 | 9.15% | 0.22% | 0.22% (c) | 1.23% | 16% | $11 |
| (0.35) | $15.29 | 17.19% | 0.24% | 0.24% (c) | 1.84% | 18% | $15 |
| |
| (0.11) | $14.04 | 29.48% | 1.25% | 1.25% (c) | 0.14% | 18% | $71,030 |
| (0.32) | $10.95 | 14.81% | 1.27% | 1.27% (c) | 0.28% | 54% | $74,057 |
| (3.16) | $9.85 | (7.38%) | 1.25% | 1.25% (c) | 0.90% | 75% | $80,104 |
| (0.69) | $13.76 | 8.08% | 1.23% | 1.23% (c) | 0.34% | 16% | $98,125 |
| (0.21) | $13.36 | 16.06% | 1.25% | 1.25% (c) | 0.42% | 18% | $96,989 |
| |
| (0.23) | $16.87 | 30.79% | 0.26% | 0.26% (c) | 1.23% | 18% | $40,391 |
| (0.35) | $13.11 | 15.98% | 0.27% | 0.27% (c) | 1.27% | 54% | $22,765 |
| (3.27) | $11.64 | (6.48%) | 0.24% | 0.24% (c) | 1.73% | 75% | $24,809 |
| (0.85) | $15.66 | 9.18% | 0.23% | 0.23% (c) | 1.40% | 16% | $51,428 |
| (0.34) | $15.11 | 17.14% | 0.25% | 0.25% (c) | 1.42% | 18% | $53,613 |
| |
| (0.24) | $17.16 | 30.88% | 0.21% | 0.21% | 1.27% | 18% | $603 |
| (0.36) | $13.33 | 16.04% | 0.18% | 0.18% | 1.53% | 54% | $607 |
| (3.28) | $11.83 | (6.32%) | 0.14% | 0.14% | 2.15% | 75% | $340 |
| (0.86) | $15.85 | 9.26% | 0.10% | 0.10% | 2.03% | 16% | $316 |
| (0.37) | $15.29 | 17.39% | 0.10% | 0.10% | 1.96% | 18% | $29 |
| |
| (0.25) | $16.96 | 26.47% | 0.17% (i) | 0.17% (i) | 2.52% (i) | 18% | $1,535 |
Columbia Global Strategic Equity Fund | Annual Report 2018
| 25 |
Financial Highlights (continued)
| Year ended | Net asset value,
beginning of
period | Net
investment
income | Net
realized
and
unrealized
gain (loss) | Total from
investment
operations | Distributions
from net
investment
income | Distributions
from net
realized
gains |
| Class K |
| 1/31/2018 | $13.08 | 0.15 | 3.81 | 3.96 | (0.21) | — |
| 1/31/2017 | $11.62 | 0.15 | 1.65 | 1.80 | (0.02) | (0.32) |
| 1/31/2016 | $15.64 | 0.27 | (1.03) | (0.76) | (0.35) | (2.91) |
| 1/31/2015 | $15.10 | 0.19 | 1.18 | 1.37 | (0.37) | (0.46) |
| 1/31/2014 | $13.19 | 0.19 | 2.05 | 2.24 | (0.33) | — |
| Class R |
| 1/31/2018 | $12.54 | 0.08 | 3.68 | 3.76 | (0.17) | — |
| 1/31/2017 | $11.19 | 0.08 | 1.60 | 1.68 | (0.01) | (0.32) |
| 1/31/2016 | $15.19 | 0.19 | (0.98) | (0.79) | (0.30) | (2.91) |
| 1/31/2015 | $14.68 | 0.13 | 1.15 | 1.28 | (0.31) | (0.46) |
| 1/31/2014 | $12.83 | 0.13 | 2.00 | 2.13 | (0.28) | — |
| Notes to Financial Highlights |
| (a) | In addition to the fees and expenses that the Fund bears directly, the Fund indirectly bears a pro rata share of the fees and expenses of any other funds in which it invests. Such indirect expenses are not included in the Fund’s reported expense ratios. |
| (b) | Total net expenses include the impact of certain fee waivers/expense reimbursements made by the Investment Manager and certain of its affiliates, if applicable. |
| (c) | The benefits derived from expense reductions had an impact of less than 0.01%. |
| (d) | Prior to November 1, 2017, Advisor Class shares were known as Class R4 shares. |
| (e) | Prior to November 1, 2017, Institutional Class shares were known as Class Z shares. |
| (f) | Prior to November 1, 2017, Institutional 2 Class shares were known as Class R5 shares. |
| (g) | Prior to November 1, 2017, Institutional 3 Class shares were known as Class Y shares. |
| (h) | Institutional 3 Class shares commenced operations on March 1, 2017. Per share data and total return reflect activity from that date. |
| (i) | Annualized. |
The accompanying Notes to Financial Statements are an integral part of this statement.
| 26 | Columbia Global Strategic Equity Fund | Annual Report 2018 |
Total
distributions to
shareholders | Net
asset
value,
end of
period | Total
return | Total gross
expense
ratio to
average
net assets(a) | Total net
expense
ratio to
average
net assets(a),(b) | Net investment
income
ratio to
average
net assets | Portfolio
turnover | Net
assets,
end of
period
(000’s) |
| |
| (0.21) | $16.83 | 30.55% | 0.46% | 0.46% | 1.01% | 18% | $135 |
| (0.34) | $13.08 | 15.85% | 0.42% | 0.42% | 1.20% | 54% | $106 |
| (3.26) | $11.62 | (6.59%) | 0.39% | 0.39% | 1.80% | 75% | $91 |
| (0.83) | $15.64 | 8.98% | 0.35% | 0.35% | 1.18% | 16% | $98 |
| (0.33) | $15.10 | 17.04% | 0.36% | 0.36% | 1.32% | 18% | $158 |
| |
| (0.17) | $16.13 | 30.21% | 0.76% | 0.76% (c) | 0.56% | 18% | $209 |
| (0.33) | $12.54 | 15.30% | 0.77% | 0.77% (c) | 0.68% | 54% | $872 |
| (3.21) | $11.19 | (6.91%) | 0.75% | 0.75% (c) | 1.35% | 75% | $2,254 |
| (0.77) | $15.19 | 8.64% | 0.73% | 0.73% (c) | 0.81% | 16% | $2,681 |
| (0.28) | $14.68 | 16.59% | 0.75% | 0.75% (c) | 0.93% | 18% | $3,131 |
Columbia Global Strategic Equity Fund | Annual Report 2018
| 27 |
Notes to Financial Statements
January 31, 2018
Note 1. Organization
Columbia Global Strategic Equity Fund (the Fund), a series of Columbia Funds Series Trust (the Trust), is a diversified fund. The Trust is registered under the Investment Company Act of 1940, as amended (the 1940 Act), as an open-end management investment company organized as a Delaware statutory trust.
The Fund is a “fund-of-funds”, investing significantly in affiliated funds managed by Columbia Management Investment Advisers, LLC (the Investment Manager), a wholly-owned subsidiary of Ameriprise Financial, Inc. (Ameriprise Financial), its affiliates, or third-party advised (unaffiliated) funds, including exchange-traded funds (collectively, Underlying Funds).
For information on the Underlying Funds, please refer to the Fund’s current prospectus and the prospectuses of the Underlying Funds, which are available, free of charge, from the Securities and Exchange Commission website at www.sec.gov.
Fund shares
The Trust may issue an unlimited number of shares (without par value). Although all share classes generally have identical voting, dividend and liquidation rights, each share class votes separately when required by the Trust’s organizational documents or by law. Different share classes pay different distribution amounts to the extent the expenses of such share classes differ, and distributions in liquidation will be proportional to the net asset value of each share class. Each share class has its own expense and sales charge structure. The Fund offers each of the share classes identified below.
Class A shares are subject to a maximum front-end sales charge of 5.75% based on the initial investment amount. Class A shares purchased without an initial sales charge in accounts aggregating $1 million to $50 million at the time of purchase are subject to a contingent deferred sales charge (CDSC) if the shares are sold within 18 months after purchase, charged as follows: 1.00% CDSC if redeemed within 12 months after purchase, and 0.50% CDSC if redeemed more than 12, but less than 18, months after purchase.
Advisor Class shares are not subject to sales charges and are generally available only to omnibus retirement plans and certain investors as described in the Fund’s prospectus. Prior to November 1, 2017, Advisor Class shares were known as Class R4 shares.
Class B shares of the Fund are no longer offered for sale. When available, Class B shares were subject to a maximum CDSC of 5.00% based upon the holding period after purchase. Effective July 17, 2017, Class B shares were automatically converted to Class A shares without a CDSC. On August 4, 2017, the capital owned by Columbia Management Investment Advisers, LLC in Class B shares was redeemed without a CDSC.
Class C shares are subject to a 1.00% CDSC on shares redeemed within 12 months after purchase.
Institutional Class shares are not subject to sales charges and are generally available only to eligible investors, which are subject to different investment minimums as described in the Fund’s prospectus. Prior to November 1, 2017, Institutional Class shares were known as Class Z shares.
Institutional 2 Class shares are not subject to sales charges and are generally available only to investors purchasing through authorized investment professionals and omnibus retirement plans as described in the Fund’s prospectus. Prior to November 1, 2017, Institutional 2 Class shares were known as Class R5 shares.
Institutional 3 Class shares are not subject to sales charges and are available to institutional and certain other investors as described in the Fund’s prospectus. Institutional 3 Class shares commenced operations on March 1, 2017. Prior to November 1, 2017, Institutional 3 Class shares were known as Class Y shares.
The Fund no longer accepts investments by existing investors in Class K shares. When available, Class K shares were not subject to sales charges and were made available only to existing investors in Class K shares. On March 9, 2018, Class K shares were redeemed or exchanged for Advisor Class shares of the Fund in a tax free transaction that had no impact on fees and expenses paid by the shareholders.
| 28 | Columbia Global Strategic Equity Fund | Annual Report 2018 |
Notes to Financial Statements (continued)
January 31, 2018
Class R shares are not subject to sales charges and are generally available only to certain retirement plans and other investors as described in the Fund’s prospectus.
Note 2. Summary of significant accounting policies
Basis of preparation
The Fund is an investment company that applies the accounting and reporting guidance in the Financial Accounting Standards Board (FASB) Accounting Standards Codification Topic 946, Financial Services - Investment Companies (ASC 946). The financial statements are prepared in accordance with U.S. generally accepted accounting principles (GAAP), which requires management to make certain estimates and assumptions that affect the reported amounts of assets and liabilities, the disclosure of contingent assets and liabilities at the date of the financial statements and the reported amounts of income and expenses during the reporting period. Actual results could differ from those estimates.
The following is a summary of significant accounting policies followed by the Fund in the preparation of its financial statements.
Security valuation
All equity securities are valued at the close of business of the New York Stock Exchange. Equity securities are valued at the last quoted sales price on the principal exchange or market on which they trade, except for securities traded on the NASDAQ Stock Market, which are valued at the NASDAQ official close price. Unlisted securities or listed securities for which there were no sales during the day are valued at the mean of the latest quoted bid and ask prices on such exchanges or markets.
Foreign equity securities are valued based on the closing price on the foreign exchange in which such securities are primarily traded. If any foreign equity security closing prices are not readily available, the securities are valued at the mean of the latest quoted bid and ask prices on such exchanges or markets. Foreign currency exchange rates are generally determined at 4:00 p.m. Eastern (U.S.) time. Many securities markets and exchanges outside the U.S. close prior to the close of the New York Stock Exchange; therefore, the closing prices for securities in such markets or on such exchanges may not fully reflect events that occur after such close but before the close of the New York Stock Exchange. In those situations, foreign securities will be fair valued pursuant to a policy adopted by the Board of Trustees, including, if available, utilizing a third party pricing service to determine these fair values. The third party pricing service takes into account multiple factors, including, but not limited to, movements in the U.S. securities markets, certain depositary receipts, futures contracts and foreign exchange rates that have occurred subsequent to the close of the foreign exchange or market, to determine a good faith estimate that reasonably reflects the current market conditions as of the close of the New York Stock Exchange. The fair value of a security is likely to be different from the quoted or published price, if available.
Investments in the Underlying Funds are valued at the net asset value of the applicable class of the Underlying Fund determined as of the close of the New York Stock Exchange on the valuation date.
Forward foreign currency exchange contracts are marked-to-market based upon foreign currency exchange rates provided by a pricing service.
Investments for which market quotations are not readily available, or that have quotations which management believes are not reflective of market value or reliable, are valued at fair value as determined in good faith under procedures approved by and under the general supervision of the Board of Trustees. If a security or class of securities (such as foreign securities) is valued at fair value, such value is likely to be different from the quoted or published price for the security.
The determination of fair value often requires significant judgment. To determine fair value, management may use assumptions including but not limited to future cash flows and estimated risk premiums. Multiple inputs from various sources may be used to determine fair value.
GAAP requires disclosure regarding the inputs and valuation techniques used to measure fair value and any changes in valuation inputs or techniques. In addition, investments shall be disclosed by major category. This information is disclosed following the Fund’s Portfolio of Investments.
Columbia Global Strategic Equity Fund | Annual Report 2018
| 29 |
Notes to Financial Statements (continued)
January 31, 2018
Foreign currency transactions and translations
The values of all assets and liabilities denominated in foreign currencies are generally translated into U.S. dollars at exchange rates determined at the close of regular trading on the New York Stock Exchange. Net realized and unrealized gains (losses) on foreign currency transactions and translations include gains (losses) arising from the fluctuation in exchange rates between trade and settlement dates on securities transactions, gains (losses) arising from the disposition of foreign currency and currency gains (losses) between the accrual and payment dates on dividends, interest income and foreign withholding taxes.
For financial statement purposes, the Fund does not distinguish that portion of gains (losses) on investments which is due to changes in foreign exchange rates from that which is due to changes in market prices of the investments. Such fluctuations are included with the net realized and unrealized gains (losses) on investments in the Statement of Operations.
Derivative instruments
The Fund invests in certain derivative instruments, as detailed below, to meet its investment objectives. Derivatives are instruments whose values depend on, or are derived from, in whole or in part, the value of one or more securities, currencies, commodities, indices, or other assets or instruments. Derivatives may be used to increase investment flexibility (including to maintain cash reserves while maintaining desired exposure to certain assets), for risk management (hedging) purposes, to facilitate trading, to reduce transaction costs and to pursue higher investment returns. The Fund may also use derivative instruments to mitigate certain investment risks, such as foreign currency exchange rate risk, interest rate risk and credit risk. Derivatives may involve various risks, including the potential inability of the counterparty to fulfill its obligations under the terms of the contract, the potential for an illiquid secondary market (making it difficult for the Fund to sell or terminate, including at favorable prices) and the potential for market movements which may expose the Fund to gains or losses in excess of the amount shown in the Statement of Assets and Liabilities. The notional amounts of derivative instruments, if applicable, are not recorded in the financial statements.
A derivative instrument may suffer a marked-to-market loss if the value of the contract decreases due to an unfavorable change in the market rates or values of the underlying instrument. Losses can also occur if the counterparty does not perform its obligations under the contract. The Fund’s risk of loss from counterparty credit risk on over-the-counter derivatives is generally limited to the aggregate unrealized gain netted against any collateral held by the Fund and the amount of any variation margin held by the counterparty, plus any replacement costs or related amounts. With exchange-traded or centrally cleared derivatives, there is reduced counterparty credit risk to the Fund since the clearinghouse or central counterparty (CCP) provides some protection in the case of clearing member default. The clearinghouse or CCP stands between the buyer and the seller of the contract; therefore, additional counterparty credit risk is failure of the clearinghouse or CCP. However, credit risk still exists in exchange-traded or centrally cleared derivatives with respect to initial and variation margin that is held in a broker’s customer account. While brokers are required to segregate customer margin from their own assets, in the event that a broker becomes insolvent or goes into bankruptcy and at that time there is a shortfall in the aggregate amount of margin held by the broker for all its clients, U.S. bankruptcy laws will typically allocate that shortfall on a pro-rata basis across all the broker’s customers (including the Fund), potentially resulting in losses to the Fund.
In order to better define its contractual rights and to secure rights that will help the Fund mitigate its counterparty risk, the Fund may enter into an International Swaps and Derivatives Association, Inc. Master Agreement (ISDA Master Agreement) or similar agreement with its derivatives contract counterparties. An ISDA Master Agreement is an agreement between the Fund and a counterparty that governs over-the-counter derivatives and typically contains, among other things, collateral posting terms and netting provisions in the event of a default and/or termination event. Under an ISDA Master Agreement, the Fund may, under certain circumstances, offset with the counterparty certain derivative instrument’s payables and/or receivables with collateral held and/or posted and create one single net payment. The provisions of the ISDA Master Agreement typically permit a single net payment in the event of default (close-out netting), including the bankruptcy or insolvency of the counterparty. Note, however, that bankruptcy or insolvency laws of a particular jurisdiction may impose restrictions on or prohibitions against the right of offset or netting in bankruptcy, insolvency or other events.
Collateral (margin) requirements differ by type of derivative. Margin requirements are established by the clearinghouse or CCP for exchange-traded and centrally cleared derivatives. Brokers can ask for margin in excess of the minimum in certain circumstances. Collateral terms are contract specific for over-the-counter derivatives. For over-the-counter derivatives traded
| 30 | Columbia Global Strategic Equity Fund | Annual Report 2018 |
Notes to Financial Statements (continued)
January 31, 2018
under an ISDA Master Agreement, the collateral requirements are typically calculated by netting the marked-to-market amount for each transaction under such agreement and comparing that amount to the value of any variation margin currently pledged by the Fund and/or the counterparty. Generally, the amount of collateral due from or to a party has to exceed a minimum transfer amount threshold (e.g., $250,000) before a transfer has to be made. To the extent amounts due to the Fund from its counterparties are not fully collateralized, contractually or otherwise, the Fund bears the risk of loss from counterparty nonperformance. The Fund attempts to mitigate counterparty risk by only entering into agreements with counterparties that it believes have the financial resources to honor their obligations and by monitoring the financial stability of those counterparties.
Certain ISDA Master Agreements allow counterparties of over-the-counter derivatives transactions to terminate derivatives contracts prior to maturity in the event the Fund’s net asset value declines by a stated percentage over a specified time period or if the Fund fails to meet certain terms of the ISDA Master Agreement, which would cause the Fund to accelerate payment of any net liability owed to the counterparty. The Fund also has termination rights if the counterparty fails to meet certain terms of the ISDA Master Agreement. In addition to considering counterparty credit risk, the Fund would consider terminating the derivatives contracts based on whether termination would result in a net liability owed from the counterparty.
For financial reporting purposes, the Fund does not offset derivative assets and derivative liabilities that are subject to netting arrangements in the Statement of Assets and Liabilities.
Forward foreign currency exchange contracts
Forward foreign currency exchange contracts are over-the-counter agreements between two parties to buy and sell a currency at a set price on a future date. Underlying funds might be using forward currency contracts to hedge and/or shift foreign currency exposure back to US dollars. These instruments may be used for other purposes in future periods.
The values of forward foreign currency exchange contracts fluctuate daily with changes in foreign currency exchange rates. Changes in the value of these contracts are recorded as unrealized appreciation or depreciation until the contract is exercised or has expired. The Fund will realize a gain or loss when the forward foreign currency exchange contract is closed or expires.
The use of forward foreign currency exchange contracts does not eliminate fluctuations in the prices of the Fund’s portfolio securities. The risks of forward foreign currency exchange contracts include movement in the values of the foreign currencies relative to the U.S. dollar (or other foreign currencies) and the possibility that counterparties will not complete their contractual obligations, which may be in excess of the amount reflected, if any, in the Statement of Assets and Liabilities.
Effects of derivative transactions in the financial statements
The following tables are intended to provide additional information about the effect of derivatives on the financial statements of the Fund, including: the fair value of derivatives by risk category and the location of those fair values in the Statement of Assets and Liabilities; and the impact of derivative transactions over the period in the Statement of Operations, including realized and unrealized gains (losses). The derivative instrument schedules following the Portfolio of Investments present additional information regarding derivative instruments outstanding at the end of the period, if any.
The following table is a summary of the fair value of derivative instruments (not considered to be hedging instruments for accounting disclosure purposes) at January 31, 2018:
| | Asset derivatives | |
Risk exposure
category | Statement
of assets and liabilities
location | Fair value ($) |
| Foreign exchange risk | Unrealized appreciation on forward foreign currency exchange contracts | 23,581 |
Columbia Global Strategic Equity Fund | Annual Report 2018
| 31 |
Notes to Financial Statements (continued)
January 31, 2018
| | Liability derivatives | |
Risk exposure
category | Statement
of assets and liabilities
location | Fair value ($) |
| Foreign exchange risk | Unrealized depreciation on forward foreign currency exchange contracts | 21,156 |
The following table indicates the effect of derivative instruments (not considered to be hedging instruments for accounting disclosure purposes) in the Statement of Operations for the year ended January 31, 2018:
| Amount of realized gain (loss) on derivatives recognized in income |
| Risk exposure category | Forward
foreign
currency
exchange
contracts
($) |
| Foreign exchange risk | (39,143) |
| |
| Change in unrealized appreciation (depreciation) on derivatives recognized in income |
| Risk exposure category | Forward
foreign
currency
exchange
contracts
($) |
| Foreign exchange risk | 2,425 |
The following table is a summary of the average outstanding volume by derivative instrument for the year ended January 31, 2018:
| Derivative instrument | Average unrealized
appreciation ($)* | Average unrealized
depreciation ($)* |
| Forward foreign currency exchange contracts | 22,625 | (23,092) |
| * | Based on the ending quarterly outstanding amounts for the year ended January 31, 2018. |
Offsetting of assets and liabilities
The following table presents the Fund’s gross and net amount of assets and liabilities available for offset under netting arrangements as well as any related collateral received or pledged by the Fund as of January 31, 2018:
| | JPMorgan ($) |
| Assets | |
| Forward foreign currency exchange contracts | 23,581 |
| Liabilities | |
| Forward foreign currency exchange contracts | 21,156 |
| Total financial and derivative net assets | 2,425 |
| Total collateral received (pledged) (a) | - |
| Net amount (b) | 2,425 |
| (a) | In some instances, the actual collateral received and/or pledged may be more than the amount shown due to overcollateralization. |
| (b) | Represents the net amount due from/(to) counterparties in the event of default. |
Security transactions
Security transactions are accounted for on the trade date. Cost is determined and gains (losses) are based upon the specific identification method for both financial statement and federal income tax purposes.
| 32 | Columbia Global Strategic Equity Fund | Annual Report 2018 |
Notes to Financial Statements (continued)
January 31, 2018
Income recognition
Corporate actions and dividend income are generally recorded net of any non-reclaimable tax withholdings, on the ex-dividend date or upon receipt of ex-dividend notification in the case of certain foreign securities.
The Fund may receive distributions from holdings in equity securities, business development companies (BDCs), exchange-traded funds (ETFs), limited partnerships (LPs), other regulated investment companies (RICs), and real estate investment trusts (REITs), which report information on the tax character of their distributions annually. These distributions are allocated to dividend income, capital gain and return of capital based on actual information reported. Return of capital is recorded as a reduction of the cost basis of securities held. If the Fund no longer owns the applicable securities, return of capital is recorded as a realized gain. With respect to REITs, to the extent actual information has not yet been reported, estimates for return of capital are made by the Fund’s management. Management’s estimates are subsequently adjusted when the actual character of the distributions is disclosed by the REITs, which could result in a proportionate change in return of capital to shareholders.
Awards from class action litigation are recorded as a reduction of cost basis if the Fund still owns the applicable securities on the payment date. If the Fund no longer owns the applicable securities, the proceeds are recorded as realized gains.
Income and capital gain distributions from the Underlying Funds, if any, are recorded on the ex-dividend date.
Expenses
General expenses of the Trust are allocated to the Fund and other funds of the Trust based upon relative net assets or other expense allocation methodologies determined by the nature of the expense. Expenses directly attributable to the Fund are charged to the Fund. Expenses directly attributable to a specific class of shares are charged to that share class.
Determination of class net asset value
All income, expenses (other than class-specific expenses, which are charged to that share class, as shown in the Statement of Operations) and realized and unrealized gains (losses) are allocated to each class of the Fund on a daily basis, based on the relative net assets of each class, for purposes of determining the net asset value of each class.
Federal income tax status
The Fund intends to qualify each year as a regulated investment company under Subchapter M of the Internal Revenue Code, as amended, and will distribute substantially all of its investment company net taxable income and net capital gain, if any, for its tax year, and as such will not be subject to federal income taxes. In addition, the Fund intends to distribute in each calendar year substantially all of its ordinary income, capital gain net income and certain other amounts, if any, such that the Fund should not be subject to federal excise tax. Therefore, no federal income or excise tax provision is recorded.
Foreign taxes
The Fund may be subject to foreign taxes on income, gains on investments or currency repatriation, a portion of which may be recoverable. The Fund will accrue such taxes and recoveries, as applicable, based upon its current interpretation of tax rules and regulations that exist in the markets in which it invests.
Realized gains in certain countries may be subject to foreign taxes at the Fund level, based on statutory rates. The Fund accrues for such foreign taxes on realized and unrealized gains at the appropriate rate for each jurisdiction, as applicable. The amount, if any, is disclosed as a liability on the Statement of Assets and Liabilities.
Distributions to shareholders
Distributions from net investment income, if any, are declared and paid each calendar quarter. Net realized capital gains, if any, are distributed at least annually. Income distributions and capital gain distributions are determined in accordance with federal income tax regulations, which may differ from GAAP.
Columbia Global Strategic Equity Fund | Annual Report 2018
| 33 |
Notes to Financial Statements (continued)
January 31, 2018
Guarantees and indemnifications
Under the Trust’s organizational documents and, in some cases, by contract, its officers and trustees are indemnified against certain liabilities arising out of the performance of their duties to the Trust or its funds. In addition, certain of the Fund’s contracts with its service providers contain general indemnification clauses. The Fund’s maximum exposure under these arrangements is unknown since the amount of any future claims that may be made against the Fund cannot be determined, and the Fund has no historical basis for predicting the likelihood of any such claims.
Recent accounting pronouncement
Accounting Standards Update 2017-08 Premium Amortization on Purchased Callable Debt Securities
In March 2017, the Financial Accounting Standards Board issued Accounting Standards Update (ASU) No. 2017-08 Premium Amortization on Purchased Callable Debt Securities. ASU No. 2017-08 updates the accounting standards to shorten the amortization period for certain purchased callable debt securities, held at a premium, to be amortized to the earliest call date. The update applies to securities with explicit, noncontingent call features that are callable at fixed prices and on preset dates. The standard is effective for annual periods beginning after December 15, 2018 and interim periods within those fiscal years. At this time, management is evaluating the implication of this guidance and the impact it will have on the financial statement amounts and footnote disclosures, if any.
Note 3. Fees and other transactions with affiliates
Management services fees and underlying fund fees
The Fund has entered into a Management Agreement with Columbia Management Investment Advisers, LLC (the Investment Manager). Under the Management Agreement, the Investment Manager provides the Fund with investment research and advice, as well as administrative and accounting services. The management services fee is an annual fee that is a blend of (i) 0.02% on net assets invested in Columbia proprietary funds (excluding any underlying funds that do not pay a management services fee (or investment advisory services fee, as applicable) to the Investment Manager), (ii) 0.12% on net assets invested in non-exchange-traded third-party advised mutual funds and (iii) 0.57% on net assets invested in all other securities, instruments and other assets not described above, including other funds advised by the Investment Manager that do not pay a management services fee (or investment advisory services fee, as applicable), exchange-traded funds, derivatives and individual securities. The effective management services fee rate for the year ended January 31, 2018 was 0.09% of the Fund’s average daily net assets.
In addition to the fees and expenses which the Fund bears directly, the Fund indirectly bears a pro rata share of the fees and expenses of the Underlying Funds in which the Fund invests. Because the Underlying Funds have varied expense and fee levels and the Fund may own different proportions of Underlying Funds at different times, the amount of fees and expenses incurred indirectly by the Fund will vary. These expenses are not reflected in the expenses shown in Statement of Operations and are not included in the ratios to average net assets shown in the Financial Highlights.
Participating Affiliates
The Investment Manager and its investment advisory affiliates (Participating Affiliates) around the world may coordinate in providing services to their clients. From time to time the Investment Manager (or any affiliated investment subadviser to the Fund, as the case may be) may engage its Participating Affiliates to provide a variety of services such as investment research, investment monitoring, trading and discretionary investment management (including portfolio management) to certain accounts managed by the Investment Manager, including the Fund. These Participating Affiliates will provide services to the Investment Manager (or any affiliated investment subadviser to the Fund as the case may be) either pursuant to subadvisory agreements, personnel-sharing agreements or similar inter-company arrangements and the Fund will pay no additional fees and expenses as a result of any such arrangements.
These Participating Affiliates, like the Investment Manager, are direct or indirect subsidiaries of Ameriprise Financial and are registered with appropriate respective regulators in their home jurisdictions and, where required, the Securities and Exchange Commission and the Commodity Futures Trading Commission in the United States.
| 34 | Columbia Global Strategic Equity Fund | Annual Report 2018 |
Notes to Financial Statements (continued)
January 31, 2018
Pursuant to some of these arrangements, certain employees of these Participating Affiliates may serve as "associated persons" of the Investment Manager and, in this capacity, subject to the oversight and supervision of the Investment Manager and consistent with the investment objectives, policies and limitations set forth in the Fund’s prospectus and Statement of Additional Information (SAI), may provide such services to the Fund on behalf of the Investment Manager.
Other expenses
Other expenses are for, among other things, miscellaneous expenses of the Fund or the Board of Trustees, including payments to Board Services Corp., a company that dissolved on August 25, 2017, which had provided limited administrative services to the Fund and the Board of Trustees. That company’s expenses included boardroom and office expense, employee compensation, employee health and retirement benefits, and certain other expenses. For the year ended January 31, 2018, other expenses paid by the Fund to this company were $1,153.
Compensation of board members
Members of the Board of Trustees, who are not officers or employees of the Investment Manager or Ameriprise Financial, are compensated for their services to the Fund as disclosed in the Statement of Operations. Under a Deferred Compensation Plan (the Plan), these members of the Board of Trustees may elect to defer payment of up to 100% of their compensation. Deferred amounts are treated as though equivalent dollar amounts had been invested in shares of certain funds managed by the Investment Manager. The Fund’s liability for these amounts is adjusted for market value changes and remains in the Fund until distributed in accordance with the Plan. All amounts payable under the Plan constitute a general unsecured obligation of the Fund.
Compensation of Chief Compliance Officer
The Board of Trustees has appointed a Chief Compliance Officer to the Fund in accordance with federal securities regulations. A portion of the Chief Compliance Officer’s total compensation is allocated to the Fund as disclosed in the Statement of Operations, along with other affiliated funds governed by the Board of Trustees, based on relative net assets.
Transfer agency fees
Under a Transfer and Dividend Disbursing Agent Agreement, Columbia Management Investment Services Corp. (the Transfer Agent), an affiliate of the Investment Manager and a wholly-owned subsidiary of Ameriprise Financial, is responsible for providing transfer agency services to the Fund. The Transfer Agent has contracted with DST Asset Manager Solutions, Inc. (DST) to serve as sub-transfer agent. The Transfer Agent pays the fees of DST for services as sub-transfer agent and DST is not entitled to reimbursement for such fees from the Fund (with the exception of out-of-pocket fees).
The Fund pays the Transfer Agent a monthly transfer agency fee based on the number or the average value of accounts, depending on the type of account. In addition, the Fund pays the Transfer Agent a fee for shareholder services based on the number of accounts or on a percentage of the average aggregate value of the Fund’s shares maintained in omnibus accounts up to the lesser of the amount charged by the financial intermediary or a cap established by the Board of Trustees from time to time.
The Transfer Agent also receives compensation from the Fund for various shareholder services and reimbursements for certain out-of-pocket fees. Effective August 1, 2017, total transfer agency fees for Class K, Institutional 2 Class and Institutional 3 Class shares are subject to an annual limitation of not more than 0.07%, 0.07% and 0.02%, respectively, of the average daily net assets attributable to each share class. Prior to August 1, 2017, these limitations were 0.075% for Class K and Institutional 2 Class shares and 0.025% for Institutional 3 Class shares.
Columbia Global Strategic Equity Fund | Annual Report 2018
| 35 |
Notes to Financial Statements (continued)
January 31, 2018
For the year ended January 31, 2018, the Fund’s effective transfer agency fee rates as a percentage of average daily net assets of each class were as follows:
| | Effective rate (%) |
| Class A | 0.11 |
| Advisor Class | 0.11 |
| Class B | 0.07 (a),(b) |
| Class C | 0.11 |
| Institutional Class | 0.11 |
| Institutional 2 Class | 0.07 |
| Institutional 3 Class | 0.02 (c) |
| Class K | 0.07 |
| Class R | 0.12 |
| (a) | Effective July 17, 2017, Class B shares were automatically converted to Class A shares. |
| (b) | Unannualized. |
| (c) | Annualized. |
An annual minimum account balance fee of $20 may apply to certain accounts with a value below the applicable share class’s initial minimum investment requirements to reduce the impact of small accounts on transfer agency fees. These minimum account balance fees are remitted to the Fund and recorded as part of expense reductions in the Statement of Operations. For the year ended January 31, 2018, these minimum account balance fees reduced total expenses of the Fund by $650.
Plan administration fees
Under a Plan Administration Services Agreement with the Transfer Agent, the Fund pays an annual fee at a rate of 0.25% of the Fund’s average daily net assets attributable to Class K shares for the provision of various administrative, recordkeeping, communication and educational services.
Distribution and service fees
The Fund has entered into an agreement with Columbia Management Investment Distributors, Inc. (the Distributor), an affiliate of the Investment Manager and a wholly-owned subsidiary of Ameriprise Financial, for distribution and shareholder services. The Board of Trustees has approved, and the Fund has adopted, distribution and shareholder service plans (the Plans) applicable to certain share classes, which set the distribution and service fees for the Fund. These fees are calculated daily and are intended to compensate the Distributor and/or eligible selling and/or servicing agents for selling shares of the Fund and providing services to investors.
Under the Plans, the Fund pays a monthly combined distribution and service fee to the Distributor at the maximum annual rate of 0.25% of the average daily net assets attributable to Class A shares of the Fund. Also under the Plans, the Fund pays a monthly service fee at the maximum annual rate of 0.25% of the average daily net assets attributable to Class B and Class C shares of the Fund and a monthly distribution fee at the maximum annual rate of 0.75%, 0.75% and 0.50% of the average daily net assets attributable to Class B, Class C and Class R shares of the Fund, respectively. As a result of all Class B shares of the Fund being redeemed or converted to Class A shares, August 4, 2017 was the last day the Fund paid a distribution and service fee for Class B shares.
Sales charges (unaudited)
Sales charges, including front-end charges and CDSCs, received by the Distributor for distributing Fund shares for the year ended January 31, 2018, if any, are listed below:
| | Amount ($) |
| Class A | 463,739 |
| Class C | 2,565 |
| 36 | Columbia Global Strategic Equity Fund | Annual Report 2018 |
Notes to Financial Statements (continued)
January 31, 2018
Expenses waived/reimbursed by the Investment Manager and its affiliates
The Investment Manager and certain of its affiliates have contractually agreed to waive fees and/or reimburse expenses (excluding certain fees and expenses described below) for the period(s) disclosed below, unless sooner terminated at the sole discretion of the Board of Trustees, so that the Fund’s net operating expenses, after giving effect to fees waived/expenses reimbursed and any balance credits and/or overdraft charges from the Fund’s custodian, do not exceed the following annual rate(s) as a percentage of the class’ average daily net assets:
| | June 1, 2017
through
May 31, 2018 | Prior to
June 1, 2017 |
| Class A | 0.50% | 0.60% |
| Advisor Class | 0.25 | 0.35 |
| Class C | 1.25 | 1.35 |
| Institutional Class | 0.25 | 0.35 |
| Institutional 2 Class | 0.225 | 0.28 |
| Institutional 3 Class | 0.175 | 0.23 |
| Class K | 0.475 | 0.53 |
| Class R | 0.75 | 0.85 |
Under the agreement governing these fee waivers and/or expense reimbursement arrangements, the following fees and expenses are excluded from the waiver/reimbursement commitment, and therefore will be paid by the Fund, if applicable: taxes (including foreign transaction taxes), expenses associated with investments in affiliated and non-affiliated pooled investment vehicles (including mutual funds and exchange-traded funds), transaction costs and brokerage commissions, costs related to any securities lending program, dividend expenses associated with securities sold short, inverse floater program fees and expenses, transaction charges and interest on borrowed money, interest, infrequent and/or unusual expenses and any other expenses the exclusion of which is specifically approved by the Board of Trustees. This agreement may be modified or amended only with approval from the Investment Manager, certain of its affiliates and the Fund. The Fund’s management services fee is also excluded from the waiver/reimbursement commitment and is therefore paid by the Fund. Any fees waived and/or expenses reimbursed under the expense reimbursement arrangements described above are not recoverable by the Investment Manager or its affiliates in future periods.
Note 4. Federal tax information
The timing and character of income and capital gain distributions are determined in accordance with income tax regulations, which may differ from GAAP because of temporary or permanent book to tax differences.
At January 31, 2018, these differences were primarily due to differing treatment for deferral/reversal of wash sale losses, passive foreign investment company (PFIC) holdings, re-characterization of distributions for investments, derivative investments, trustees’ deferred compensation and foreign currency transactions. To the extent these differences were permanent, reclassifications were made among the components of the Fund’s net assets in the Statement of Assets and Liabilities. Temporary differences do not require reclassifications.
In the Statement of Assets and Liabilities the following reclassifications were made:
Undistributed net
investment
income ($) | Accumulated
net realized
gain ($) | Paid in
capital ($) |
| 3,796,469 | (3,796,469) | — |
Net investment income (loss) and net realized gains (losses), as disclosed in the Statement of Operations, and net assets were not affected by this reclassification.
Columbia Global Strategic Equity Fund | Annual Report 2018
| 37 |
Notes to Financial Statements (continued)
January 31, 2018
The tax character of distributions paid during the years indicated was as follows:
| January 31, 2018 | January 31, 2017 |
Ordinary
income ($) | Long-term
capital gains ($) | Total ($) | Ordinary
income ($) | Long-term
capital gains ($) | Total ($) |
| 9,123,056 | — | 9,123,056 | 770,554 | 17,332,633 | 18,103,187 |
Short-term capital gain distributions, if any, are considered ordinary income distributions for tax purposes.
At January 31, 2018, the components of distributable earnings on a tax basis were as follows:
Undistributed
ordinary income ($) | Undistributed
long-term
capital gains ($) | Capital loss
carryforwards ($) | Net unrealized
appreciation ($) |
| 7,386,003 | 10,623,914 | — | 142,775,565 |
At January 31, 2018, the cost of all investments for federal income tax purposes along with the aggregate gross unrealized appreciation and depreciation based on that cost was:
Federal
tax cost ($) | Gross unrealized
appreciation ($) | Gross unrealized
(depreciation) ($) | Net unrealized
appreciation ($) |
| 590,763,524 | 146,925,893 | (4,150,328) | 142,775,565 |
Tax cost of investments and unrealized appreciation/(depreciation) may also include timing differences that do not constitute adjustments to tax basis.
The following capital loss carryforwards, determined at January 31, 2018, may be available to reduce taxable income arising from future net realized gains on investments, if any, to the extent permitted by the Internal Revenue Code. Capital loss carryforwards with no expiration are required to be utilized prior to any capital losses which carry an expiration date. As a result of this ordering rule, capital loss carryforwards which carry an expiration date may be more likely to expire unused. In addition, for the year ended January 31, 2018, capital loss carryforwards utilized, expired unused and permanently lost, if any, were as follows:
| 2019 ($) | No expiration
short-term ($) | No expiration
long-term ($) | Total ($) | Utilized ($) | Expired ($) | Permanently
lost ($) |
| — | — | — | — | 20,718,902 | — | — |
Management of the Fund has concluded that there are no significant uncertain tax positions in the Fund that would require recognition in the financial statements. However, management’s conclusion may be subject to review and adjustment at a later date based on factors including, but not limited to, new tax laws, regulations, and administrative interpretations (including relevant court decisions). Generally, the Fund’s federal tax returns for the prior three fiscal years remain subject to examination by the Internal Revenue Service.
Note 5. Portfolio information
The cost of purchases and proceeds from sales of securities, excluding short-term investments and derivatives, if any, aggregated to $117,174,099 and $156,355,841, respectively, for the year ended January 31, 2018. The amount of purchase and sale activity impacts the portfolio turnover rate reported in the Financial Highlights.
Note 6. Affiliated money market fund
The Fund invests in Columbia Short-Term Cash Fund, an affiliated money market fund established for the exclusive use by the Fund and other affiliated funds (the Affiliated MMF). The income earned by the Fund from such investments is included as Dividends - affiliated issuers in the Statement of Operations. As an investing fund, the Fund indirectly bears its proportionate share of the expenses of the Affiliated MMF. The Affiliated MMF prices its shares with a floating net asset value. In addition,
| 38 | Columbia Global Strategic Equity Fund | Annual Report 2018 |
Notes to Financial Statements (continued)
January 31, 2018
the Board of Trustees of the Affiliated MMF may impose a fee on redemptions (sometimes referred to as a liquidity fee) or temporarily suspend redemptions (sometimes referred to as imposing a redemption gate) in the event its liquidity falls below regulatory limits.
Note 7. Line of credit
The Fund has access to a revolving credit facility with a syndicate of banks led by Citibank, N.A., HSBC Bank USA, N.A. and JPMorgan Chase Bank, N.A. whereby the Fund may borrow for the temporary funding of shareholder redemptions or for other temporary or emergency purposes. The credit facility, which is a collective agreement between the Fund and certain other funds managed by the Investment Manager, severally and not jointly, permits collective borrowings up to $1 billion. Interest is charged to each participating fund based on its borrowings at a rate equal to the higher of (i) the overnight federal funds rate plus 1.00% or (ii) the one-month LIBOR rate plus 1.00%. Each borrowing under the credit facility matures no later than 60 days after the date of borrowing. The Fund also pays a commitment fee equal to its pro rata share of the amount of the credit facility at a rate of 0.15% per annum. The commitment fee is included in other expenses in the Statement of Operations.
The Fund had no borrowings during the year ended January 31, 2018.
Note 8. Significant risks
Foreign securities and emerging market countries risk
Investing in foreign securities may include certain risks and considerations not typically associated with investing in U.S. securities, such as fluctuating currency values and changing local and regional economic, political and social conditions, which may result in greater market volatility. In addition, certain foreign securities may not be as liquid as U.S. securities. Investing in emerging markets may accentuate these risks. These countries are also more likely to experience high levels of inflation, deflation or currency devaluation which could hurt their economies and securities markets. To the extent that the Fund concentrates its investment exposure to any one or a few specific countries, the Fund will be particularly susceptible to the various conditions, events or other factors impacting those countries and may, therefore, have a greater risk than that of a fund which is more geographically diversified.
Shareholder concentration risk
At January 31, 2018, one unaffiliated shareholder of record owned 21.2% of the outstanding shares of the Fund in one or more accounts. The Fund has no knowledge about whether any portion of those shares was owned beneficially. Affiliated shareholders of record owned 57.9% of the outstanding shares of the Fund in one or more accounts. Subscription and redemption activity by concentrated accounts may have a significant effect on the operations of the Fund. In the case of a large redemption, the Fund may be forced to sell investments at inopportune times, including its liquid positions, which may result in Fund losses and the Fund holding a higher percentage of less liquid positions. Large redemptions could result in decreased economies of scale and increased operating expenses for non-redeeming Fund shareholders.
Note 9. Subsequent events
Management has evaluated the events and transactions that have occurred through the date the financial statements were issued and noted no items requiring adjustment of the financial statements or additional disclosure.
Note 10. Information regarding pending and settled legal proceedings
Ameriprise Financial and certain of its affiliates have historically been involved in a number of legal, arbitration and regulatory proceedings, including routine litigation, class actions, and governmental actions, concerning matters arising in connection with the conduct of their business activities. Ameriprise Financial believes that the Fund is not currently the subject of, and that neither Ameriprise Financial nor any of its affiliates are the subject of, any pending legal, arbitration or regulatory proceedings that are likely to have a material adverse effect on the Fund or the ability of Ameriprise Financial or its affiliates to perform under their contracts with the Fund. Ameriprise Financial is required to make quarterly (10-Q), annual (10-K) and, as necessary, 8-K filings with the Securities and Exchange Commission (SEC) on legal and regulatory matters that relate to Ameriprise Financial and its affiliates. Copies of these filings may be obtained by accessing the SEC website at www.sec.gov.
Columbia Global Strategic Equity Fund | Annual Report 2018
| 39 |
Notes to Financial Statements (continued)
January 31, 2018
There can be no assurance that these matters, or the adverse publicity associated with them, will not result in increased Fund redemptions, reduced sale of Fund shares or other adverse consequences to the Fund. Further, although we believe proceedings are not likely to have a material adverse effect on the Fund or the ability of Ameriprise Financial or its affiliates to perform under their contracts with the Fund, these proceedings are subject to uncertainties and, as such, we are unable to estimate the possible loss or range of loss that may result. An adverse outcome in one or more of these proceedings could result in adverse judgments, settlements, fines, penalties or other relief that could have a material adverse effect on the consolidated financial condition or results of operations of Ameriprise Financial.
| 40 | Columbia Global Strategic Equity Fund | Annual Report 2018 |
Report of Independent Registered Public Accounting Firm
To the Trustees of Columbia Funds Series Trust and Shareholders of Columbia Global Strategic Equity Fund
Opinion on the Financial Statements
We have audited the accompanying statement of assets and liabilities, including the portfolio of investments, of Columbia Global Strategic Equity Fund (one of the funds constituting Columbia Funds Series Trust, referred to hereafter as the "Fund") as of January 31, 2018, the related statement of operations for the year ended January 31, 2018, the statement of changes in net assets for each of the two years in the period ended January 31, 2018, including the related notes, and the financial highlights for each of the periods indicated therein (collectively referred to as the “financial statements”). In our opinion, the financial statements present fairly, in all material respects, the financial position of the Fund as of January 31, 2018, the results of its operations for the year then ended, the changes in its net assets for each of the two years in the period ended January 31, 2018 and financial highlights for each of the periods indicated therein in conformity with accounting principles generally accepted in the United States of America.
Basis for Opinion
These financial statements are the responsibility of the Fund’s management. Our responsibility is to express an opinion on the Fund’s financial statements based on our audits. We are a public accounting firm registered with the Public Company Accounting Oversight Board (United States) (“PCAOB”) and are required to be independent with respect to the Fund in accordance with the U.S. federal securities laws and the applicable rules and regulations of the Securities and Exchange Commission and the PCAOB.
We conducted our audits of these financial statements in accordance with the standards of the PCAOB. Those standards require that we plan and perform the audit to obtain reasonable assurance about whether the financial statements are free of material misstatement, whether due to error or fraud.
Our audits included performing procedures to assess the risks of material misstatement of the financial statements, whether due to error or fraud, and performing procedures that respond to those risks. Such procedures included examining, on a test basis, evidence regarding the amounts and disclosures in the financial statements. Our audits also included evaluating the accounting principles used and significant estimates made by management, as well as evaluating the overall presentation of the financial statements. Our procedures included confirmation of securities owned as of January 31, 2018 by correspondence with the custodian, transfer agent and brokers; when replies were not received from brokers, we performed other auditing procedures. We believe that our audits provide a reasonable basis for our opinion.
/s/PricewaterhouseCoopers LLP
Minneapolis, Minnesota
March 23, 2018
We have served as auditors of one or more investment companies within the Columbia Funds Complex since 1977.
Columbia Global Strategic Equity Fund | Annual Report 2018
| 41 |
Federal Income Tax Information
(Unaudited)
The Fund hereby designates the following tax attributes for the fiscal year ended January 31, 2018. Shareholders will be notified in early 2019 of the amounts for use in preparing 2018 income tax returns.
Qualified
dividend
income | Dividends
received
deduction | Capital
gain
dividend | Foreign
taxes paid
to foreign
countries | Foreign
taxes paid
per share
to foreign
countries | Foreign
source
income | Foreign
source
income per
share |
| 100.00% | 52.57% | $11,155,110 | $538,064 | $0.01 | $4,494,932 | $0.10 |
Qualified dividend income. For taxable, non-corporate shareholders, the percentage of ordinary income distributed during the fiscal year that represents qualified dividend income subject to reduced tax rates.
Dividends received deduction. The percentage of ordinary income distributed during the fiscal year that qualifies for the corporate dividends received deduction.
Capital gain dividend. The Fund designates as a capital gain dividend the amount reflected above, or if subsequently determined to be different, the net capital gain of such fiscal period.
Foreign taxes. The Fund makes the election to pass through to shareholders the foreign taxes paid. Eligible shareholders may claim a foreign tax credit. These taxes, and the corresponding foreign source income, are provided.
| 42 | Columbia Global Strategic Equity Fund | Annual Report 2018 |
Shareholders elect the Board that oversees the Fund’s operations. The Board appoints officers who are responsible for day-to-day business decisions based on policies set by the Board. The following table provides basic biographical information about the Fund’s Trustees, including their principal occupations during the past five years, although specific titles for individuals may have varied over the period. Under current Board policy, Trustees not affiliated with the Investment Manager generally may serve through the end of the calendar year in which they reach either the mandatory retirement age established by the Board or the fifteenth anniversary of the first Columbia Funds board meeting they attended as a member of the Board.
Independent trustees
Name,
address,
year of birth | Position held
with the Trust and
length of service | Principal occupation(s)
during past five years
and other relevant
professional experience | Number of
Funds in the
Columbia Funds
complex
overseen | Other directorships
held by Trustee
during the past
five years |
George S. Batejan
c/o Columbia Management
Investment Advisers, LLC
225 Franklin Street
Mail Drop BX32 05228
Boston, MA 02110
1953 | Trustee since 1/17 | Executive Vice President, Global Head of Technology and Operations, Janus Capital Group, Inc., 2010-2016 | 125 | Advisory Board Member, University of Colorado Business School since November 2015; former Chairman of the Board, NICSA (National Investment Company Services Association) (Executive Committee, Nominating Committee and Governance Committee), 2014-2016; former Director, Intech Investment Management, 2011- 2016; former Board Member, Metro Denver Chamber of Commerce, 2015-2016 |
Kathleen Blatz
c/o Columbia Management
Investment Advisers, LLC
225 Franklin Street
Mail Drop BX32 05228
Boston, MA 02110
1954 | Trustee since 1/06 for RiverSource Funds and since 6/11 for Nations Funds | Attorney; specializing in arbitration and mediation; Interim President and Chief Executive Officer, Blue Cross and Blue Shield of Minnesota (health care insurance) since February 2018; Chief Justice, Minnesota Supreme Court, 1998-2006; Associate Justice, Minnesota Supreme Court, 1996-1998; Fourth Judicial District Court Judge, Hennepin County, 1994-1996; Attorney in private practice and public service, 1984-1993; State Representative, Minnesota House of Representatives, 1979-1993, which included service on the Tax and Financial Institutions and Insurance Committees; Interim Chari, Minnesota Sports Facilities Authority, March 2017-July 2017 | 125 | Trustee, BlueCross BlueShield of Minnesota since 2009 (Chair of the Business Development Committee, 2014-2017; Chair of the Governance Committee since 2017); Chair of the Robina Foundation since August 2013; former Member of the Board, Minnesota Sports Facilities Authority, January 2017-July 2017 |
Edward J. Boudreau, Jr.
c/o Columbia Management
Investment Advisers, LLC
225 Franklin Street
Mail Drop BX32 05228
Boston, MA 02110
1944 | Chair of the Board since 1/18; Trustee since 6/11 for RiverSource Funds and since 1/05 for Nations Funds | Managing Director, E.J. Boudreau & Associates (consulting) since 2000; FINRA Industry Arbitrator, 2002-present; Chairman and Chief Executive Officer, John Hancock Investments (asset management), Chairman and Interested Trustee for open-end and closed-end funds offered by John Hancock, 1989-2000; John Hancock Mutual Life Insurance Company, including Senior Vice President and Treasurer and Senior Vice President Information Technology, 1968-1988 | 125 | Former Trustee, Boston Museum of Science (Chair of Finance Committee) 1985-2013; former Trustee, BofA Funds Series Trust (11 funds), 2005-2011 |
Columbia Global Strategic Equity Fund | Annual Report 2018
| 43 |
TRUSTEES AND OFFICERS (continued)
Independent trustees (continued)
Name,
address,
year of birth | Position held
with the Trust and
length of service | Principal occupation(s)
during past five years
and other relevant
professional experience | Number of
Funds in the
Columbia Funds
complex
overseen | Other directorships
held by Trustee
during the past
five years |
Pamela G. Carlton
c/o Columbia Management
Investment Advisers, LLC
225 Franklin Street
Mail Drop BX32 05228
Boston, MA 02110
1954 | Trustee since 7/07 for RiverSource Funds and since 6/11 for Nations Funds | President, Springboard — Partners in Cross Cultural Leadership (consulting company) since 2003; Managing Director of US Equity Research, JP Morgan Chase, 1999-2003; Director of US Equity Research, Chase Asset Management, 1996-1999; Co-Director Latin America Research, 1993-1996, COO Global Research, 1992-1996, Co-Director of US Research, 1991-1992, Investment Banker, Morgan Stanley, 1982-1991 | 125 | Trustee, New York Presbyterian Hospital Board (Executive Committee and Chair of Human Resources Committee) since 1996; Director, Darien Rowayton Bank (Audit Committee) since 2017 |
William P. Carmichael
c/o Columbia Management
Investment Advisers, LLC
225 Franklin Street
Mail Drop BX32 05228
Boston, MA 02110
1943 | Trustee since 6/11 for RiverSource Funds and since 2003 for Nations Funds | Retired; Co-founder, The Succession Fund (provides exit strategies to owners of privately held companies), 1998-2007; Adjunct Professor of Finance, Kelley School of Business, Indiana University, 1993-2007; Senior Vice President, Sara Lee Corporation, 1991-1993; Senior Vice President and Chief Financial Officer, Beatrice Foods Company, 1984-1990; Vice President, Esmark, Inc., 1973-1984; Associate, Price Waterhouse, 1968-1972 | 125 | Director, The Finish Line (athletic shoes and apparel) since July 2003; former Director, Cobra Electronics Corporation (electronic equipment manufacturer), 1994-August 2014; former Director, Spectrum Brands, Inc. (consumer products), 2002-2009; former Director, Simmons Company (bedding), 2004-2010; former Trustee, BofA Funds Series Trust (11 funds) 2003-2011; former Director, McMoRan Exploration Company (oil and gas exploration and development) 2010 - 2013; former Director, International Textile Corp., 2012-2016; former Director, hhgregg, 2015-2017 |
Patricia M. Flynn
c/o Columbia Management
Investment Advisers, LLC
225 Franklin Street
Mail Drop BX32 05228
Boston, MA 02110
1950 | Trustee since 11/04 for RiverSource Funds and since 6/11 for Nations Funds | Trustee Professor of Economics and Management, Bentley University since 1976 (also teaches and conducts research on corporate governance); Dean, McCallum Graduate School of Business, Bentley University, 1992-2002 | 125 | Trustee, MA Taxpayers Foundation since 1997; Board of Directors, The MA Business Roundtable since 2003; Board of Governors, Innovation Institute, MA Technology Collaborative since 2010 |
Brian J. Gallagher
c/o Columbia Management
Investment Advisers, LLC
225 Franklin Street
Mail Drop BX32 05228
Boston, MA 02110
1954 | Trustee since 12/17 | Retired; Partner with Deloitte & Touche LLP and its predecessors, 1968-2016 | 123 | None |
Catherine James Paglia
c/o Columbia Management
Investment Advisers, LLC
225 Franklin Street
Mail Drop BX32 05228
Boston, MA 02110
1952 | Trustee since 11/04 for RiverSource Funds and since 6/11 for Nations Funds | Director, Enterprise Asset Management, Inc. (private real estate and asset management company) since September 1998; Managing Director and Partner, Interlaken Capital, Inc., 1989-1997; Managing Director, Morgan Stanley, 1982-1989; Vice President, Investment Banking, 1980-1982, Associate, Investment Banking, 1976-1980, Dean Witter Reynolds, Inc. | 125 | Director, Valmont Industries, Inc. (irrigation systems manufacturer) since 2012; Trustee, Carleton College (on the Investment Committee); Trustee, Carnegie Endowment for International Peace (on the Investment Committee) |
| 44 | Columbia Global Strategic Equity Fund | Annual Report 2018 |
TRUSTEES AND OFFICERS (continued)
Independent trustees (continued)
Name,
address,
year of birth | Position held
with the Trust and
length of service | Principal occupation(s)
during past five years
and other relevant
professional experience | Number of
Funds in the
Columbia Funds
complex
overseen | Other directorships
held by Trustee
during the past
five years |
Minor M. Shaw
c/o Columbia Management
Investment Advisers, LLC
225 Franklin Street
Mail Drop BX32 05228
Boston, MA 02110
1947 | Trustee since 6/11 for RiverSource Funds and since 2003 for Nations Funds | President, Micco LLC (private investments) since 2011; President, Micco Corp. (family investment business), 1998-2011 | 125 | Director, BlueCross BlueShield of South Carolina since April 2008; Director, National Association of Corporate Directors, Carolinas Chapter, since 2013; Board Chair, Hollingsworth Funds since 2016; Advisory Board member, Duke Energy Corp. since October 2016; Chair of the Duke Endowment; Chair of Greenville – Spartanburg Airport Commission; former Trustee, BofA Funds Series Trust (11 funds), 2003-2011; former Director, Piedmont Natural Gas, 2004-2016 |
Sandra Yeager
c/o Columbia Management
Investment Advisers, LLC
225 Franklin Street
Mail Drop BX32 05228
Boston, MA 02110
1964 | Trustee since 12/17 | Retired; President and founder, Hanoverian Capital, LLC (SEC registered investment advisor firm), 2008-2016 | 123 | Director, NAPE Education Foundation since October 2016 |
Interested trustee not affiliated with Investment Manager*
Name,
address,
year of birth | Position held
with the Trust and
length of service | Principal occupation(s) during the
past five years and other relevant
professional experience | Number of
Funds in the
Columbia Funds
complex overseen | Other directorships/
held by Trustee
during the past
five years |
Anthony M. Santomero
c/o Columbia Management
Investment Advisers, LLC
225 Franklin Street
Mail Drop BX32 05228
Boston, MA 02110
1946 | Trustee since 6/11 for RiverSource Funds and since 1/08 for Nations Funds | Richard K. Mellon Professor Emeritus of Finance, The Wharton School, University of Pennsylvania, since 2002; Senior Advisor, McKinsey & Company (consulting), 2006-2008; President, Federal Reserve Bank of Philadelphia, 2000-2006, Professor of Finance, The Wharton School, University of Pennsylvania, 1972-2002 | 123 | Trustee, Penn Mutual Life Insurance Company since March 2008; Director, Renaissance Reinsurance Ltd. since May 2008; Director, Citigroup Inc. since 2009; Director, Citibank, N.A. since 2009; former Trustee, BofA Funds Series Trust (11 funds), 2008-2011 |
| * | Dr. Santomero is not an affiliated person of the Investment Manager or Ameriprise Financial. However, he is currently deemed by the Funds to be an “interested person” (as defined in the 1940 Act) of the Funds because he serves as a Director of Citigroup Inc. and Citibank, N.A., companies that may directly or through subsidiaries and affiliates engage from time-to-time in brokerage execution, principal transactions and lending relationships with the Funds or accounts advised/managed by the Investment Manager. |
Columbia Global Strategic Equity Fund | Annual Report 2018
| 45 |
TRUSTEES AND OFFICERS (continued)
Interested trustee affiliated with Investment Manager*
Name,
address,
year of birth | Position held with the Trusts and length of service | Principal occupation(s) during the
past five years and other relevant
professional experience | Number of
Funds in the
Columbia Funds
complex overseen | Other directorships
held by Trustee
during the past
five years |
William F. Truscott
c/o Columbia Management
Investment Advisers, LLC
225 Franklin St.
Boston, MA 02110
1960 | Trustee since 11/01 for RiverSource Funds and since 6/11 for Nations Funds; Senior Vice President since 2002 for RiverSource Funds and since 5/10 for Nations Funds | Chairman of the Board and President, Columbia Management Investment Advisers, LLC since May 2010 and February 2012, respectively; Chief Executive Officer, Global Asset Management, Ameriprise Financial, Inc. since September 2012 (previously Chief Executive Officer, U.S. Asset Management & President, Annuities, May 2010 - September 2012); Director and Chief Executive Officer, Columbia Management Investment Distributors, Inc. since May 2010 and February 2012, respectively; Chairman of the Board and Chief Executive Officer, RiverSource Distributors, Inc. since 2006; Director, Threadneedle Asset Management Holdings, SARL since 2014; President and Chief Executive Officer, Ameriprise Certificate Company, 2006 - August 2012. | 195 | Chairman of the Board, Columbia Management Investment Advisers, LLC since May 2010; Director, Columbia Management Investment Distributors, Inc. since May 2010; former Director, Ameriprise Certificate Company, 2006-January 2013 |
| * | Interested person (as defined under the 1940 Act) by reason of being an officer, director, security holder and/or employee of the Investment Manager or Ameriprise Financial. |
Nations Funds refer to the Funds within the Columbia Funds Complex that historically bore the Nations brand and includes series of Columbia Funds Series Trust. RiverSource Funds refer to the Funds within the Columbia Funds Complex that historically bore the RiverSource brand and includes series of Columbia Funds Series Trust II.
The Statement of Additional Information has additional information about the Fund’s Board members and is available, without charge, upon request by calling 800.345.6611, visiting investor.columbiathreadneedleus.com or contacting your financial intermediary.
| 46 | Columbia Global Strategic Equity Fund | Annual Report 2018 |
TRUSTEES AND OFFICERS (continued)
The Board has appointed officers who are responsible for day-to-day business decisions based on policies it has established. The officers serve at the pleasure of the Board. The following table provides basic information about the Officers of the Fund, including principal occupations during the past five years, although their specific titles may have varied over the period. In addition to Mr. Truscott, who is Senior Vice President, the Fund’s other officers are:
Fund officers
Name,
address and
year of birth | Position and year
first appointed to
position for any Fund
in the Columbia
Funds complex or a
predecessor thereof | Principal occupation(s) during past five years |
Christopher O. Petersen
5228 Ameriprise
Financial Center
Minneapolis, MN 55474
Born 1970 | President and Principal Executive Officer (2015) | Vice President and Lead Chief Counsel, Ameriprise Financial, Inc. since January 2015 (previously, Vice President and Chief Counsel, January 2010 - December 2014; officer of Columbia Funds and affiliated funds since 2007. |
Michael G. Clarke
225 Franklin Street
Boston, MA 02110
Born 1969 | Treasurer (2011), Chief Financial Officer (2009) and Chief Accounting Officer (2015) | Vice President — Mutual Fund Administration, Columbia Management Investment Advisers, LLC, since May 2010; senior officer of Columbia Funds and affiliated funds since 2002. |
Paul B. Goucher
100 Park Avenue
New York, NY 10017
Born 1968 | Senior Vice President (2011) and Assistant Secretary (2008) | Senior Vice President and Assistant General Counsel, Ameriprise Financial, Inc. since January 2017 (previously Vice President and Lead Chief Counsel, November 2008 - January 2017 and January 2013 - January 2017, respectively; and Chief Counsel, January 2010 - January 2013); Vice President, Chief Legal Officer and Assistant Secretary, Columbia Management Investment Advisers, LLC since May 2010. |
Thomas P. McGuire
225 Franklin Street
Boston, MA 02110
Born 1972 | Senior Vice President and Chief Compliance Officer (2012) | Vice President — Asset Management Compliance, Ameriprise Financial, Inc., since May 2010; Chief Compliance Officer, Ameriprise Certificate Company since September 2010. |
Colin Moore
225 Franklin Street
Boston, MA 02110
Born 1958 | Senior Vice President (2010) | Executive Vice President and Global Chief Investment Officer, Ameriprise Financial, Inc., since July 2013; Executive Vice President and Global Chief Investment Officer, Columbia Management Investment Advisers, LLC since July 2013 (previously Director and Global Chief Investment Officer, 2010 - 2013). |
Ryan C. Larrenaga
225 Franklin Street
Boston, MA 02110
Born 1970 | Senior Vice President (2017), Chief Legal Officer (2017) and Secretary (2015) | Vice President and Group Counsel, Ameriprise Financial, Inc. since August 2011; officer of Columbia Funds and affiliated funds since 2005. |
Michael E. DeFao
225 Franklin Street
Boston, MA 02110
Born 1968 | Vice President (2011) and Assistant Secretary (2010) | Vice President and Chief Counsel, Ameriprise Financial, Inc. since May 2010. |
Amy Johnson
5228 Ameriprise
Financial Center
Minneapolis, MN 55474
Born 1965 | Vice President (2006) | Managing Director and Global Head of Operations, Columbia Management Investment Advisers, LLC since April 2016 (previously Managing Director and Chief Operating Officer, 2010 - 2016). |
Lyn Kephart-Strong
5228 Ameriprise
Financial Center
Minneapolis, MN 55474
Born 1960 | Vice President (2015) | President, Columbia Management Investment Services Corp. since October 2014; Vice President & Resolution Officer, Ameriprise Trust Company since August 2009. |
Columbia Global Strategic Equity Fund | Annual Report 2018
| 47 |
The Fund mails one shareholder report to each shareholder address. If you would like more than one report, please call shareholder services at 800.345.6611 and additional reports will be sent to you.
Proxy voting policies and procedures
The policy of the Board of Trustees is to vote the proxies of the companies in which the Fund holds investments consistent with the procedures as stated in the Statement of Additional Information (SAI). You may obtain a copy of the SAI without charge by calling 800.345.6611; contacting your financial intermediary; visiting investor.columbiathreadneedleus.com; or searching the website of the Securities and Exchange Commission (SEC) at sec.gov. Information regarding how the Fund voted proxies relating to portfolio securities is filed with the SEC by August 31st for the most recent 12-month period ending June 30th of that year, and is available without charge by visiting investor.columbiathreadneedleus.com, or searching the website of the SEC at sec.gov.
Quarterly schedule of investments
The Fund files a complete schedule of portfolio holdings with the SEC for the first and third quarters of each fiscal year on Form N-Q. The Fund’s Form N-Q is available on the SEC’s website at sec.gov and may be reviewed and copied at the SEC’s Public Reference Room in Washington, D.C. Information on the operation of the Public Reference Room may be obtained by calling 800.SEC.0330. The Fund’s complete schedule of portfolio holdings, as filed on Form N-Q, can also be obtained without charge, upon request, by calling 800.345.6611.
Additional Fund information
For more information about the Fund, please visit investor.columbiathreadneedleus.com or call 800.345.6611. Customer Service Representatives are available to answer your questions Monday through Friday from 8 a.m. to 7 p.m. Eastern time.
Fund investment manager
Columbia Management Investment Advisers, LLC
225 Franklin Street
Boston, MA 02110
Fund distributor
Columbia Management Investment Distributors, Inc.
225 Franklin Street
Boston, MA 02110
Fund transfer agent
Columbia Management Investment Services Corp.
P.O. Box 8081
Boston, MA 02266-8081
| 48 | Columbia Global Strategic Equity Fund | Annual Report 2018 |
[THIS PAGE INTENTIONALLY LEFT BLANK]
Columbia Global Strategic Equity Fund
P.O. Box 8081
Boston, MA 02266-8081
Please read and consider the investment objectives, risks, charges and expenses for any fund carefully before investing. For a prospectus and summary prospectus, which contains this and other important information about the Fund, go to
investor.columbiathreadneedleus.com. The Fund is distributed by Columbia Management Investment Distributors, Inc., member FINRA, and managed by Columbia Management Investment Advisers, LLC.
Columbia Threadneedle Investments (Columbia Threadneedle) is the global brand name of the Columbia and Threadneedle group of companies. All rights reserved. Columbia Management Investment Distributors, Inc., 225 Franklin Street, Boston, MA 02110-2804
© 2018 Columbia Management Investment Advisers, LLC.
investor.columbiathreadneedleus.com
Item 2. Code of Ethics.
| | (a) | The registrant has adopted a code of ethics that applies to the registrant’s principal executive officer, principal financial officer, principal accounting officer or controller, or persons performing similar functions, regardless of whether these individuals are employed by the registrant or a third party. |
| | (b) | During the period covered by this report, there were not any amendments to a provision of the code of ethics adopted in 2(a) above. |
| | (c) | During the period covered by this report, there were no waivers, including any implicit waivers, from a provision of the code of ethics described in 2(a) above that relates to one or more of the items set forth in paragraph (b) of this item’s instructions. |
Item 3. Audit Committee Financial Expert.
The registrant’s Board of Trustees has determined that Pamela G. Carlton, William P. Carmichael, Brian J. Gallagher and Catherine James Paglia, each of whom are members of the registrant’s Board of Trustees and Audit Committee, each qualify as an audit committee financial expert. Ms. Carlton, Mr. Carmichael, Ms. Gallagher and Ms. Paglia are each independent trustees, as defined in paragraph (a)(2) of this item’s instructions.
Item 4. Principal Accountant Fees and Services.
Fee information below is disclosed for the three series of the registrant whose reports to stockholders are included in this annual filing.
(a) Audit Fees. Aggregate Audit Fees billed by the principal accountant for professional services rendered during the fiscal years ended January 31, 2018 and January 31, 2017 are approximately as follows:
| | | | | | |
| 2018 | | | 2017 | |
| $ | 52,500 | | | $ | 50,100 | |
Audit Fees include amounts related to the audit of the registrant’s annual financial statements or services that are normally provided by the accountant in connection with statutory and regulatory filings or engagements for those fiscal years.
(b) Audit-Related Fees. Aggregate Audit-Related Fees billed to the registrant by the principal accountant for professional services rendered during the fiscal years ended January 31, 2018 and January 31, 2017 are approximately as follows:
Audit-Related Fees include amounts for assurance and related services by the principal accountant that are reasonably related to the performance of the audit of the registrant’s financial statements and are not reported in Audit Fees above. In fiscal year 2017, Audit-Related Fees consist of agreed-upon procedures performed for semi-annual shareholder reports.
During the fiscal years ended January 31, 2018 and January 31, 2017, there were no Audit-Related Fees billed by the registrant’s principal accountant to the registrant’s investment adviser (not including any sub-adviser whose role is primarily portfolio management and is subcontracted with or overseen by another investment adviser) and any entity controlling, controlled by, or under common control with the adviser that provides ongoing services to the registrant for an engagement that related directly to the operations and financial reporting of the registrant.
(c) Tax Fees. Aggregate Tax Fees billed by the principal accountant to the registrant for professional services rendered during the fiscal years ended January 31, 2018 and January 31, 2017 are approximately as follows:
Tax Fees include amounts for the review of annual tax returns, the review of required shareholder distribution calculations and typically include amounts for professional services by the principal accountant for tax compliance, tax advice and tax planning.
During the fiscal years ended January 31, 2018 and January 31, 2017, there were no Tax Fees billed by the registrant’s principal accountant to the registrant’s investment adviser (not including any sub-adviser whose role is primarily portfolio management and is subcontracted with or overseen by another investment adviser) and any entity controlling, controlled by, or under common control with the adviser that provides ongoing services to the registrant for an engagement that related directly to the operations and financial reporting of the registrant.
(d) All Other Fees. Aggregate All Other Fees billed by the principal accountant to the registrant for professional services rendered during the fiscal years ended January 31, 2018 and January 31, 2017 are approximately as follows:
All Other Fees include amounts for products and services provided by the principal accountant, other than the services reported in paragraphs (a) through (c) above.
Aggregate All Other Fees billed by the registrant’s principal accountant to the registrant’s investment adviser (not including any sub-adviser whose role is primarily portfolio management and is subcontracted with or overseen by another investment adviser) and any entity controlling, controlled by, or under common control with the adviser that provides ongoing services to the registrant for an engagement that related directly to the operations and financial reporting of the registrant during the fiscal years ended January 31, 2018 and January 31, 2017 are approximately as follows:
| | | | | | |
| 2018 | | | 2017 | |
| $ | 225,000 | | | $ | 225,000 | |
In fiscal years 2018 and 2017, All Other Fees primarily consists of fees billed for internal control examinations of the registrant’s transfer agent and investment adviser.
(e)(1) Audit Committee Pre-Approval Policies and Procedures
The registrant’s Audit Committee is required to pre-approve the engagement of the registrant’s independent auditors to provide audit and non-audit services to the registrant and non-audit services to its investment adviser (excluding any sub-adviser whose role is primarily portfolio management and is sub-contracted or overseen by another investment adviser (the “Adviser”) or any entity controlling, controlled by or under common control with the Adviser that provides ongoing services to the Fund (a “Control Affiliate”) if the engagement relates directly to the operations and financial reporting of the registrant.
The Audit Committee has adopted a Policy for Engagement of Independent Auditors for Audit and Non-Audit Services (the “Policy”). The Policy sets forth the understanding of the Audit Committee regarding the engagement of the registrant’s independent accountants to provide (i) audit and permissible audit-related, tax and other services to the registrant (“Fund Services”); (ii) non-audit services to the registrant’s Adviser and any Control Affiliates, that relates directly to the operations and financial reporting of a Fund (“Fund-related Adviser Services”); and (iii) certain other audit and non-audit services to the registrant’s Adviser and its Control Affiliates. A service will require specific pre-approval by the Audit Committee if it is to be provided by the Fund’s independent auditor; provided, however, that pre-approval of non-audit services to the Fund, the Adviser or Control Affiliates may be waived if certain de minimis requirements set forth in the SEC’s rules are met.
Under the Policy, the Audit Committee may delegate pre-approval authority to any pre-designated member or members who are independent board members. The member(s) to whom such authority is delegated must report, for informational purposes only, any pre-approval decisions to the Audit Committee at its next regular meeting. The Audit Committee’s responsibilities with respect to the pre-approval of services performed by the independent auditor may not be delegated to management.
On an annual basis, at a regularly scheduled Audit Committee meeting, the Fund’s Treasurer or other Fund officer shall submit to the Audit Committee a schedule of the types of Fund Services and Fund-related Adviser Services that are subject to specific pre-approval. This schedule will provide a description of each type of service that is subject to specific pre-approval, along with total projected fees for each service. The pre-approval will generally cover a one-year period. The Audit Committee will review and approve the types of services and the projected fees for the next one-year period and may add to, or subtract from, the list of pre-approved services from time to time, based on subsequent determinations. This specific approval acknowledges that the Audit Committee is in agreement with the specific types of services that the independent auditor will be permitted to perform and the projected fees for each service.
The Fund’s Treasurer or other Fund officer shall report to the Audit Committee at each of its regular meetings regarding all Fund Services or Fund-related Adviser Services provided since the last such report was rendered, including a description of the services, by category, with forecasted fees for the annual reporting period, proposed changes requiring specific pre-approval and a description of services provided by the independent auditor, by category, with actual fees during the current reporting period.
*****
(e)(2) 100% of the services performed for items (b) through (d) above during 2018 and 2017 were pre-approved by the registrant’s Audit Committee.
(f) Not applicable.
(g) The aggregate non-audit fees billed by the registrant’s accountant for services rendered to the registrant, and rendered to the registrant’s investment adviser (not including any sub-adviser whose role is primarily portfolio management and is subcontracted with or overseen by another investment adviser), and any entity controlling, controlled by, or under common control with the adviser that provides ongoing services to the registrant for the fiscal years ended January 31, 2018 and January 31, 2017 are approximately as follows:
| | | | | | |
| 2018 | | | 2017 | |
| $ | 239,300 | | | $ | 235,800 | |
(h) The registrant’s Audit Committee of the Board of Directors has considered whether the provision of non-audit services that were rendered to the registrant’s adviser (not including any sub-adviser whose role is primarily portfolio management and is subcontracted with or overseen by another investment adviser), and any entity controlling, controlled by, or under common control with the investment adviser that provides ongoing services to the registrant that were not pre-approved pursuant to paragraph (c)(7)(ii) of Rule 2-01 of Regulation S-X, is compatible with maintaining the principal accountant’s independence.
Item 5. Audit Committee of Listed Registrants.
Not applicable.
Item 6. Investments
| | (a) | The registrant’s “Schedule I – Investments in securities of unaffiliated issuers” (as set forth in 17 CFR 210.12-12) is included in Item 1 of this Form N-CSR. |
Item 7. Disclosure of Proxy Voting Policies and Procedures for Closed-End Management Investment Companies.
Not applicable.
Item 8. Portfolio Managers of Closed-End Management Investment Companies.
Not applicable.
Item 9. Purchases of Equity Securities by Closed-End Management Investment Company and Affiliated Purchasers.
Not applicable.
Item 10. Submission of Matters to a Vote of Security Holders.
There were no material changes to the procedures by which shareholders may recommend nominees to the registrant’s board of directors.
Item 11. Controls and Procedures.
| | (a) | The registrant’s principal executive officer and principal financial officer, based on their evaluation of the registrant’s disclosure controls and procedures as of a date within 90 days of the filing of this report, have concluded that such controls and procedures are adequately designed to ensure that material information required to be disclosed by the registrant in Form N-CSR is accumulated and communicated to the registrant’s management, including the principal executive officer and principal financial officer, or persons performing similar functions, as appropriate to allow timely decisions regarding required disclosure. |
| | (b) | There was no change in the registrant’s internal control over financial reporting that occurred during the registrant’s second fiscal quarter of the period covered by this report that has materially affected, or is reasonably likely to materially affect, the registrant’s internal control over financial reporting. |
Item 12. Disclosure of Securities Lending Activities for Closed-End Management Investment Companies
Not applicable.
Item 13. Exhibits.
(a)(1) Code of ethics required to be disclosed under Item 2 of Form N-CSR attached hereto as Exhibit 99.CODE ETH.
(a)(2) Certifications pursuant to Rule 30a-2(a) under the Investment Company Act of 1940 (17 CFR 270.30a-2(a)) attached hereto as Exhibit 99.CERT.
(a)(3) Not applicable.
(b) Certification pursuant to Rule 30a-2(b) under the Investment Company Act of 1940 (17 CFR 270.30a-2(b)) attached hereto as Exhibit 99.906CERT.
SIGNATURES
Pursuant to the requirements of the Securities Exchange Act of 1934 and the Investment Company Act of 1940, the registrant has duly caused this report to be signed on its behalf by the undersigned, thereunto duly authorized.
| | |
(registrant) | | Columbia Funds Series Trust |
| | |
| | |
By (Signature and Title) | | /s/ Christopher O. Petersen |
| | Christopher O. Petersen, President and Principal Executive Officer |
Pursuant to the requirements of the Securities Exchange Act of 1934 and the Investment Company Act of 1940, this report has been signed below by the following persons on behalf of the registrant and in the capacities and on the dates indicated.
| | |
By (Signature and Title) | | /s/ Christopher O. Petersen |
| | Christopher O. Petersen, President and Principal Executive Officer |
| | |
By (Signature and Title) | | /s/ Michael G. Clarke |
| | Michael G. Clarke, Treasurer and Chief Financial Officer |