UNITED STATES
SECURITIES AND EXCHANGE COMMISSION
Washington, D.C. 20549
FORM N-CSR
CERTIFIED SHAREHOLDER REPORT OF REGISTERED MANAGEMENT INVESTMENT COMPANIES
Investment Company Act file number 811-09645
Columbia Funds Series Trust
(Exact name of registrant as specified in charter)
290 Congress Street
Boston, MA 02210
(Address of principal executive offices) (Zip code)
Daniel J. Beckman
c/o Columbia Management Investment Advisers, LLC
290 Congress Street
Boston, MA 02210
Ryan C. Larrenaga, Esq.
c/o Columbia Management Investment Advisers, LLC
290 Congress Street
Boston, MA 02210
(Name and address of agent for service)
Registrant's telephone number, including area code: (800) 345-6611
Date of fiscal year end: April 30
Date of reporting period: April 30, 2023
Form N-CSR is to be used by management investment companies to file reports with the Commission not later than 10 days after the transmission to stockholders of any report that is required to be transmitted to stockholders under Rule 30e-1 under the Investment Company Act of 1940 (17 CFR 270.30e-1). The Commission may use the information provided on Form N-CSR in its regulatory, disclosure review, inspection, and policymaking roles.
A registrant is required to disclose the information specified by Form N-CSR, and the Commission will make this information public. A registrant is not required to respond to the collection of information contained in Form N-CSR unless the Form displays a currently valid Office of Management and Budget ("OMB") control number. Please direct comments concerning the accuracy of the information collection burden estimate and any suggestions for reducing the burden to Secretary, Securities and Exchange Commission, 100 F Street, NE, Washington, DC 20549. The OMB has reviewed this collection of information under the clearance requirements of 44 U.S.C. § 3507.
Item 1. Reports to Stockholders.

Annual Report
April 30, 2023
Columbia North Carolina Intermediate Municipal Bond Fund
Not FDIC or NCUA Insured • No Financial Institution Guarantee • May Lose Value
If you elect to receive the shareholder report for Columbia North Carolina Intermediate Municipal Bond Fund (the Fund) in paper, mailed to you, the Fund mails one shareholder report to each shareholder address, unless such shareholder elects to receive shareholder reports from the Fund electronically via e-mail or by having a paper notice mailed to you (Postcard Notice) that your Fund’s shareholder report is available at the Columbia funds’ website (columbiathreadneedleus.com/investor/). If you would like more than one report in paper to be mailed to you, or would like to elect to receive reports via e-mail or access them through Postcard Notice, please call shareholder services at 800.345.6611 and additional reports will be sent to you.
Proxy voting policies and procedures
The policy of the Board of Trustees is to vote the proxies of the companies in which the Fund holds investments consistent with the procedures as stated in the Statement of Additional Information (SAI). You may obtain a copy of the SAI without charge by calling 800.345.6611; contacting your financial intermediary; visiting columbiathreadneedleus.com/investor/; or searching the website of the Securities and Exchange Commission (SEC) at sec.gov. Information regarding how the Fund voted proxies relating to portfolio securities is filed with the SEC by August 31st for the most recent 12-month period ending June 30th of that year, and is available without charge by visiting columbiathreadneedleus.com/investor/, or searching the website of the SEC at sec.gov.
Quarterly schedule of investments
The Fund files a complete schedule of portfolio holdings with the SEC for the first and third quarters of each fiscal year on Form N-PORT. The Fund’s Form N-PORT filings are available on the SEC’s website at sec.gov. The Fund’s complete schedule of portfolio holdings, as filed on Form N-PORT, is available on columbiathreadneedleus.com/investor/ or can also be obtained without charge, upon request, by calling 800.345.6611.
Additional Fund information
For more information about the Fund, please visit columbiathreadneedleus.com/investor/ or call 800.345.6611. Customer Service Representatives are available to answer your questions Monday through Friday from 8 a.m. to 7 p.m. Eastern time.
Fund investment manager
Columbia Management Investment Advisers, LLC (the Investment Manager)
290 Congress Street
Boston, MA 02210
Fund distributor
Columbia Management Investment Distributors, Inc.
290 Congress Street
Boston, MA 02210
Fund transfer agent
Columbia Management Investment Services Corp.
P.O. Box 219104
Kansas City, MO 64121-9104
Columbia North Carolina Intermediate Municipal Bond Fund | Annual Report 2023
Fund at a Glance
(Unaudited)
Investment objective
The Fund seeks current income exempt from U.S. federal income tax and North Carolina individual income tax, consistent with moderate fluctuation of principal.
Portfolio management
Paul Fuchs, CFA
Lead Portfolio Manager
Managed Fund since 2016
Douglas Rangel, CFA
Portfolio Manager
Managed the Fund since June 2022
| Average annual total returns (%) (for the period ended April 30, 2023) |
| | | Inception | 1 Year | 5 Years | 10 Years | |
| Class A | Excluding sales charges | 12/14/92 | 2.37 | 1.16 | 1.11 | |
| | Including sales charges | | -0.70 | 0.55 | 0.80 | |
| Advisor Class | 03/19/13 | 2.72 | 1.43 | 1.36 | |
| Class C | Excluding sales charges | 12/16/92 | 1.62 | 0.43 | 0.35 | |
| | Including sales charges | | 0.62 | 0.43 | 0.35 | |
| Institutional Class | 12/11/92 | 2.62 | 1.41 | 1.36 | |
| Institutional 3 Class* | 03/01/17 | 2.68 | 1.49 | 1.41 | |
| Bloomberg 3-15 Year Blend Municipal Bond Index | | 3.71 | 2.18 | 2.14 | |
Returns for Class A shares are shown with and without the maximum initial sales charge of 3.00%. Returns for Class C shares are shown with and without the 1.00% contingent deferred sales charge for the first year only. The Fund’s other share classes are not subject to sales charges and have limited eligibility. Please see the Fund’s prospectus for details. Performance for different share classes will vary based on differences in sales charges and fees associated with each share class. All results shown assume reinvestment of distributions during the period. Returns do not reflect the deduction of taxes that a shareholder may pay on Fund distributions or on the redemption of Fund shares. Performance results reflect the effect of any fee waivers or reimbursements of Fund expenses by Columbia Management Investment Advisers, LLC and/or any of its affiliates. Absent these fee waivers or expense reimbursement arrangements, performance results would have been lower.
The performance information shown represents past performance and is not a guarantee of future results. The investment return and principal value of your investment will fluctuate so that your shares, when redeemed, may be worth more or less than their original cost. Current performance may be lower or higher than the performance information shown. You may obtain performance information current to the most recent month-end by contacting your financial intermediary, visiting columbiathreadneedleus.com/investor/ or calling 800.345.6611.
| * | The returns shown for periods prior to the share class inception date (including returns for the Life of the Fund, if shown, which are since Fund inception) include the returns of the Fund’s oldest share class. These returns are adjusted to reflect any higher class-related operating expenses of the newer share classes, as applicable. Please visit columbiathreadneedleus.com/investor/investment-products /mutual-funds/appended-performance for more information. |
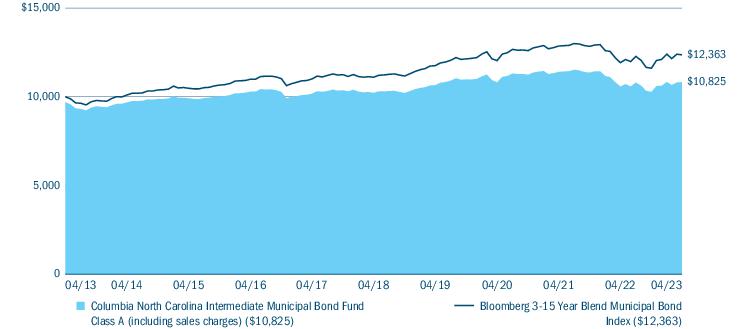
The Bloomberg 3–15 Year Blend Municipal Bond Index is an unmanaged index that tracks the performance of municipal bonds issued after December 31, 1990, with remaining maturities between 2 and 17 years and at least $7 million in principal amount outstanding.
Indices are not available for investment, are not professionally managed and do not reflect sales charges, fees, brokerage commissions, taxes or other expenses of investing. Securities in the Fund may not match those in an index.
Columbia North Carolina Intermediate Municipal Bond Fund | Annual Report 2023
| 3 |
Fund at a Glance (continued)
(Unaudited)
Performance of a hypothetical $10,000 investment (April 30, 2013 — April 30, 2023)
The chart above shows the change in value of a hypothetical $10,000 investment in Class A shares of Columbia North Carolina Intermediate Municipal Bond Fund during the stated time period, and does not reflect the deduction of taxes that a shareholder may pay on Fund distributions or on the redemption of Fund shares.
| Portfolio breakdown (%) (at April 30, 2023) |
| Money Market Funds | 100.0 |
| Total | 100.0 |
Percentages indicated are based upon total investments excluding investments in derivatives, if any. The Fund’s portfolio composition is subject to change.
| 4 | Columbia North Carolina Intermediate Municipal Bond Fund | Annual Report 2023 |
Manager Discussion of Fund Performance
(Unaudited)
On May 5, 2023, the Fund was liquidated in accordance with the Plan of Liquidation and Termination approved by the Board of Trustees of the Funds.
For the 12-month period that ended April 30, 2023, Class A shares of Columbia North Carolina Intermediate Municipal Bond Fund returned 2.37% excluding sales charges. Institutional Class shares of the Fund returned 2.62%. During the same time period, the Fund’s benchmark, the Bloomberg 3-15 Year Blend Municipal Bond Index, which is national in scope, returned 3.71%.
Market overview
For fixed-income markets, the period was dominated by the U.S. Federal Reserve’s (Fed) efforts to return inflation to its target levels and the resultant dramatic increase in interest rates. Indeed, the Fed ratcheted its targeted federal funds rate higher by 450 basis points, and municipal bond yields followed suit with yields across most of its spectrum of maturities rising as well. (A basis point is 1/100th of a percentage point.) Municipal bond yields peaked in October 2022, however, and subsequently retraced somewhat, returning most segments of the municipal bond market to positive total returns for the period overall. Still, for the period as a whole, yields on one-year and two-year municipal bonds increased 106 basis points and 47 basis points, respectively. Yields on municipal bonds with maturities of less than one year rose even more significantly, driving an inversion of the short-term end of the yield curve for much of the period. Yields for municipal bonds with maturities of between five years and 13 years declined modestly, and longer term maturity yields rose moderately.
Amid these conditions, investor sentiment within the municipal bond market was negative for much of the period. Rising rates and negative total returns through much of 2022 precipitated the largest outflow cycle ever experienced by the municipal bond market. Fund flows then stabilized and slowed into year-end but any optimism around a resumption of inflows in 2023 was quashed as another $6 billion of outflows through the end of April showed investors were still cautious about returning to the market. Consequently, technicals, or supply/demand dynamics, were not favorable within the municipal bond market during the period, largely driven by this lack of demand. Short-term municipal bond funds were not spared the effects of the outflow cycle. However, they were less impacted than their long-term, high-yield and intermediate fund counterparts, as short-term municipal bond funds generally hold more liquid positions, and shorter maturities inherently provide ample cash flow. Supply, or lack thereof during the period, proved a bright spot. Rate volatility coupled with healthy balance sheets sidelined many issuers, with tax-exempt issuance approximately 10% to 15% lower during the period than long-term averages. Not having to contend with an oversupply of new issuance likely buoyed the market as whatever new issues did come to market were well received.
All that said, fundamental factors were broadly supportive of the municipal bond market during the period. Municipal credit health benefited from positive U.S. economic growth, outperformance of tax collections, and strong reserve positions by most state and local governments, owing partly to COVID-19 policies stimulus. Revenue sectors, however, were more mixed. Essential services, such as water & sewer and utilities, held steady, and transportation sectors, such as airports and toll roads, rebounded strongly with increased traffic levels. Public mass transit was the exception, as subway/bus traffic across most major cities remained well below pre-pandemic levels. Fundamental credit health for hospitals and other health care sectors, such as senior living facilities and continuing care retirement communities (CCRCs), was modestly weaker overall. Higher labor costs, lighter balance sheets due to repayment of Medicare acceleration payments and investment market losses served to weaken health care fundamentals as did the full expenditure of any COVID-19 funding. As a whole, higher quality municipal bonds outperformed lower quality securities during the period.
The Fund’s notable detractors during the period
| • | During the second half of the period, the Fund’s below benchmark duration prevented the Fund from fully participating in the sharp turn in interest rates and market rally. As yields declined from November 2022 through April 2023, the Fund’s benchmark returned an impressive 6.52% as the 10-year municipal benchmark yield declined by roughly 80 basis points. |
| • | The Fund’s underweighted allocation, relative to its benchmark, to maturities on the long portion (15+ years) of the yield curve also hampered returns. |
| • | The Fund’s underweighted allocation to airports, special tax and state and local general obligation (GO) bonds also detracted from relative returns during the period, as did Fund holdings within those sectors. |
Columbia North Carolina Intermediate Municipal Bond Fund | Annual Report 2023
| 5 |
Manager Discussion of Fund Performance (continued)
(Unaudited)
| • | Persistent outflows across the municipal bond market also detracted from Fund performance as the funding of shareholder liquidity required price concessions at times. Related to this, the Fund was liquidated soon after the close of the period due to lack of interest. |
The Fund’s notable contributors during the period
| • | During the first half of the period, the Fund’s below benchmark duration helped to limit price declines. As yields rose from May 2022 through October 2022, the Fund’s benchmark returned -2.64% as the 10 year municipal benchmark yield rose roughly 70 basis points. |
| • | The Fund’s allocation to shorter maturities was additive, as were Fund holdings in the 12-15 year portion of the yield curve. |
| • | The Fund’s sector allocation saw positive contributions from overweights within education, water & sewer and leasing. While issue selection was largely negative, the Fund did realize some modest contributions from performance within leasing and local GOs. |
Fixed-income securities present issuer default risk. The Fund invests substantially in municipal securities and will be affected by tax, legislative, regulatory, demographic or political changes, as well as changes impacting a state’s financial, economic or other conditions. A relatively small number of tax-exempt issuers may necessitate the Fund investing more heavily in a single issuer and, therefore, be more exposed to the risk of loss than a fund that invests more broadly. The value of the Fund’s portfolio may be more volatile than a more geographically diversified fund. Prepayment and extension risk exists because the timing of payments on a loan, bond or other investment may accelerate when interest rates fall or decelerate when interest rates rise which may reduce investment opportunities and potential returns. A rise in interest rates may result in a price decline of fixed-income instruments held by the Fund, negatively impacting its performance and NAV. Falling rates may result in the Fund investing in lower yielding debt instruments, lowering the Fund’s income and yield. These risks may be heightened for longer maturity and duration securities. Non-investment-grade (high-yield or junk) securities present greater price volatility and more risk to principal and income than higher rated securities. Market risk may affect a single issuer, sector of the economy, industry or the market as a whole. Federal and state tax rules apply to capital gain distributions and any gains or losses on sales. Income may be subject to state or local taxes. Liquidity risk is associated with the difficulty of selling underlying investments at a desirable time or price. See the Fund’s prospectus for more information on these and other risks.
The views expressed in this report reflect the current views of the respective parties who have contributed to this report. These views are not guarantees of future performance and involve certain risks, uncertainties and assumptions that are difficult to predict, so actual outcomes and results may differ significantly from the views expressed. These views are subject to change at any time based upon economic, market or other conditions and the respective parties disclaim any responsibility to update such views. These views may not be relied on as investment advice and, because investment decisions for a Columbia fund are based on numerous factors, may not be relied on as an indication of trading intent on behalf of any particular Columbia fund. References to specific securities should not be construed as a recommendation or investment advice.
| 6 | Columbia North Carolina Intermediate Municipal Bond Fund | Annual Report 2023 |
Understanding Your Fund’s Expenses
(Unaudited)
As an investor, you incur two types of costs. There are shareholder transaction costs, which generally include sales charges on purchases and may include redemption fees. There are also ongoing fund costs, which generally include management fees, distribution and/or service fees, and other fund expenses. The following information is intended to help you understand your ongoing costs (in dollars) of investing in the Fund and to help you compare these costs with the ongoing costs of investing in other mutual funds.
Analyzing your Fund’s expenses
To illustrate these ongoing costs, we have provided examples and calculated the expenses paid by investors in each share class of the Fund during the period. The actual and hypothetical information in the table is based on an initial investment of $1,000 at the beginning of the period indicated and held for the entire period. Expense information is calculated two ways and each method provides you with different information. The amount listed in the “Actual” column is calculated using the Fund’s actual operating expenses and total return for the period. You may use the Actual information, together with the amount invested, to estimate the expenses that you paid over the period. Simply divide your account value by $1,000 (for example, an $8,600 account value divided by $1,000 = 8.6), then multiply the results by the expenses paid during the period under the “Actual” column. The amount listed in the “Hypothetical” column assumes a 5% annual rate of return before expenses (which is not the Fund’s actual return) and then applies the Fund’s actual expense ratio for the period to the hypothetical return. You should not use the hypothetical account values and expenses to estimate either your actual account balance at the end of the period or the expenses you paid during the period. See “Compare with other funds” below for details on how to use the hypothetical data.
Compare with other funds
Since all mutual funds are required to include the same hypothetical calculations about expenses in shareholder reports, you can use this information to compare the ongoing cost of investing in the Fund with other funds. To do so, compare the hypothetical example with the 5% hypothetical examples that appear in the shareholder reports of other funds. As you compare hypothetical examples of other funds, it is important to note that hypothetical examples are meant to highlight the ongoing costs of investing in a fund only and do not reflect any transaction costs, such as sales charges, or redemption or exchange fees. Therefore, the hypothetical calculations are useful in comparing ongoing costs only, and will not help you determine the relative total costs of owning different funds. If transaction costs were included in these calculations, your costs would be higher.
| November 1, 2022 — April 30, 2023 |
| | Account value at the
beginning of the
period ($) | Account value at the
end of the
period ($) | Expenses paid during
the period ($) | Fund’s annualized
expense ratio (%) |
| | Actual | Hypothetical | Actual | Hypothetical | Actual | Hypothetical | Actual |
| Class A | 1,000.00 | 1,000.00 | 1,053.50 | 1,020.55 | 4.08 | 4.01 | 0.81 |
| Advisor Class | 1,000.00 | 1,000.00 | 1,056.00 | 1,021.73 | 2.87 | 2.83 | 0.57 |
| Class C | 1,000.00 | 1,000.00 | 1,051.00 | 1,016.87 | 7.85 | 7.71 | 1.56 |
| Institutional Class | 1,000.00 | 1,000.00 | 1,054.80 | 1,021.73 | 2.87 | 2.83 | 0.57 |
| Institutional 3 Class | 1,000.00 | 1,000.00 | 1,055.00 | 1,022.07 | 2.52 | 2.48 | 0.50 |
Expenses paid during the period are equal to the annualized expense ratio for each class as indicated above, multiplied by the average account value over the period and then multiplied by the number of days in the Fund’s most recent fiscal half year and divided by 365.
Expenses do not include fees and expenses incurred indirectly by the Fund from its investment in underlying funds, including affiliated and non-affiliated pooled investment vehicles, such as mutual funds and exchange-traded funds.
Had Columbia Management Investment Advisers, LLC and/or certain of its affiliates not waived/reimbursed certain fees and expenses, account value at the end of the period would have been reduced.
Columbia North Carolina Intermediate Municipal Bond Fund | Annual Report 2023
| 7 |
Portfolio of Investments
April 30, 2023
(Percentages represent value of investments compared to net assets)
Investments in securities
| Money Market Funds 100.6% |
| | Shares | Value ($) |
| JPMorgan Institutional Tax Free Money Market Fund, Institutional Shares, 3.136%(a) | 47,254,525 | 47,265,877 |
Total Money Market Funds
(Cost $47,265,877) | 47,265,877 |
Total Investments in Securities
(Cost: $47,265,877) | 47,265,877 |
| Other Assets & Liabilities, Net | | (282,435) |
| Net Assets | 46,983,442 |
Notes to Portfolio of Investments
| (a) | The rate shown is the seven-day current annualized yield at April 30, 2023. |
Fair value measurements
The Fund categorizes its fair value measurements according to a three-level hierarchy that maximizes the use of observable inputs and minimizes the use of unobservable inputs by prioritizing that the most observable input be used when available. Observable inputs are those that market participants would use in pricing an investment based on market data obtained from sources independent of the reporting entity. Unobservable inputs are those that reflect the Fund’s assumptions about the information market participants would use in pricing an investment. An investment’s level within the fair value hierarchy is based on the lowest level of any input that is deemed significant to the asset’s or liability’s fair value measurement. The input levels are not necessarily an indication of the risk or liquidity associated with investments at that level. For example, certain U.S. government securities are generally high quality and liquid, however, they are reflected as Level 2 because the inputs used to determine fair value may not always be quoted prices in an active market.
Fair value inputs are summarized in the three broad levels listed below:
| ■ | Level 1 — Valuations based on quoted prices for investments in active markets that the Fund has the ability to access at the measurement date. Valuation adjustments are not applied to Level 1 investments. |
| ■ | Level 2 — Valuations based on other significant observable inputs (including quoted prices for similar securities, interest rates, prepayment speeds, credit risks, etc.). |
| ■ | Level 3 — Valuations based on significant unobservable inputs (including the Fund’s own assumptions and judgment in determining the fair value of investments). |
Inputs that are used in determining fair value of an investment may include price information, credit data, volatility statistics, and other factors. These inputs can be either observable or unobservable. The availability of observable inputs can vary between investments, and is affected by various factors such as the type of investment, and the volume and level of activity for that investment or similar investments in the marketplace. The inputs will be considered by the Investment Manager, along with any other relevant factors in the calculation of an investment’s fair value. The Fund uses prices and inputs that are current as of the measurement date, which may include periods of market dislocations. During these periods, the availability of prices and inputs may be reduced for many investments. This condition could cause an investment to be reclassified between the various levels within the hierarchy.
Investments falling into the Level 3 category are primarily supported by quoted prices from brokers and dealers participating in the market for those investments. However, these may be classified as Level 3 investments due to lack of market transparency and corroboration to support these quoted prices. Additionally, valuation models may be used as the pricing source for any remaining investments classified as Level 3. These models may rely on one or more significant unobservable inputs and/or significant assumptions by the Investment Manager. Inputs used in valuations may include, but are not limited to, financial statement analysis, capital account balances, discount rates and estimated cash flows, and comparable company data.
The Fund’s Board of Trustees (the Board) has designated the Investment Manager, through its Valuation Committee (the Committee), as valuation designee, responsible for determining the fair value of the assets of the Fund for which market quotations are not readily available using valuation procedures approved by the Board. The Committee consists of voting and non-voting members from various groups within the Investment Manager’s organization, including operations and accounting, trading and investments, compliance, risk management and legal.
The Committee meets at least monthly to review and approve valuation matters, which may include a description of specific valuation determinations, data regarding pricing information received from approved pricing vendors and brokers and the results of Board-approved valuation policies and procedures (the Policies). The Policies address, among other things, instances when market quotations are or are not readily available, including recommendations of third party pricing vendors and a determination of appropriate pricing methodologies; events that require specific valuation determinations and assessment of fair value techniques; securities with a potential for stale pricing, including those that are illiquid, restricted, or in default; and the effectiveness of third party pricing vendors, including periodic reviews of vendors. The Committee meets more frequently, as needed, to discuss additional valuation matters, which may include the need to review back-testing results, review time-sensitive information or approve related valuation actions. Representatives of Columbia Management Investment Advisers, LLC report to the Board at each of its regularly scheduled meetings to discuss valuation matters and actions during the period, similar to those described earlier.
The accompanying Notes to Financial Statements are an integral part of this statement.
| 8 | Columbia North Carolina Intermediate Municipal Bond Fund | Annual Report 2023 |
Portfolio of Investments (continued)
April 30, 2023
Fair value measurements (continued)
The following table is a summary of the inputs used to value the Fund’s investments at April 30, 2023:
| | Level 1 ($) | Level 2 ($) | Level 3 ($) | Total ($) |
| Investments in Securities | | | | |
| Money Market Funds | 47,265,877 | — | — | 47,265,877 |
| Total Investments in Securities | 47,265,877 | — | — | 47,265,877 |
See the Portfolio of Investments for all investment classifications not indicated in the table.
The accompanying Notes to Financial Statements are an integral part of this statement.
Columbia North Carolina Intermediate Municipal Bond Fund | Annual Report 2023
| 9 |
Statement of Assets and Liabilities
April 30, 2023
| Assets | |
| Investments in securities, at value | |
| Unaffiliated issuers (cost $47,265,877) | $47,265,877 |
| Receivable for: | |
| Capital shares sold | 38,247 |
| Dividends | 39,716 |
| Expense reimbursement due from Investment Manager | 316 |
| Prepaid expenses | 1,094 |
| Total assets | 47,345,250 |
| Liabilities | |
| Payable for: | |
| Capital shares purchased | 158,861 |
| Distributions to shareholders | 72,185 |
| Management services fees | 608 |
| Distribution and/or service fees | 87 |
| Transfer agent fees | 1,957 |
| Compensation of board members | 108,954 |
| Other expenses | 19,156 |
| Total liabilities | 361,808 |
| Net assets applicable to outstanding capital stock | $46,983,442 |
| Represented by | |
| Paid in capital | 53,267,217 |
| Total distributable earnings (loss) | (6,283,775) |
| Total - representing net assets applicable to outstanding capital stock | $46,983,442 |
| Class A | |
| Net assets | $9,412,818 |
| Shares outstanding | 965,138 |
| Net asset value per share | $9.75 |
| Maximum sales charge | 3.00% |
| Maximum offering price per share (calculated by dividing the net asset value per share by 1.0 minus the maximum sales charge for Class A shares) | $10.05 |
| Advisor Class | |
| Net assets | $2,601,721 |
| Shares outstanding | 267,176 |
| Net asset value per share | $9.74 |
| Class C | |
| Net assets | $824,213 |
| Shares outstanding | 84,551 |
| Net asset value per share | $9.75 |
| Institutional Class | |
| Net assets | $8,844,803 |
| Shares outstanding | 907,696 |
| Net asset value per share | $9.74 |
| Institutional 3 Class | |
| Net assets | $25,299,887 |
| Shares outstanding | 2,588,792 |
| Net asset value per share | $9.77 |
The accompanying Notes to Financial Statements are an integral part of this statement.
| 10 | Columbia North Carolina Intermediate Municipal Bond Fund | Annual Report 2023 |
Statement of Operations
Year Ended April 30, 2023
| Net investment income | |
| Income: | |
| Dividends — unaffiliated issuers | $62,968 |
| Interest | 2,881,990 |
| Total income | 2,944,958 |
| Expenses: | |
| Management services fees | 481,955 |
| Distribution and/or service fees | |
| Class A | 33,453 |
| Class C | 13,687 |
| Transfer agent fees | |
| Class A | 10,292 |
| Advisor Class | 2,022 |
| Class C | 1,048 |
| Institutional Class | 16,186 |
| Institutional 3 Class | 4,032 |
| Compensation of board members | 7,467 |
| Custodian fees | 1,420 |
| Printing and postage fees | 14,652 |
| Registration fees | 12,946 |
| Accounting services fees | 30,090 |
| Legal fees | 13,989 |
| Interest on interfund lending | 3,484 |
| Compensation of chief compliance officer | 17 |
| Other | 15,142 |
| Total expenses | 661,882 |
| Fees waived or expenses reimbursed by Investment Manager and its affiliates | (86,159) |
| Total net expenses | 575,723 |
| Net investment income | 2,369,235 |
| Realized and unrealized gain (loss) — net | |
| Net realized gain (loss) on: | |
| Investments — unaffiliated issuers | (5,529,752) |
| Net realized loss | (5,529,752) |
| Net change in unrealized appreciation (depreciation) on: | |
| Investments — unaffiliated issuers | 5,017,204 |
| Net change in unrealized appreciation (depreciation) | 5,017,204 |
| Net realized and unrealized loss | (512,548) |
| Net increase in net assets resulting from operations | $1,856,687 |
The accompanying Notes to Financial Statements are an integral part of this statement.
Columbia North Carolina Intermediate Municipal Bond Fund | Annual Report 2023
| 11 |
Statement of Changes in Net Assets
| | Year Ended
April 30, 2023 | Year Ended
April 30, 2022 |
| Operations | | |
| Net investment income | $2,369,235 | $3,630,876 |
| Net realized loss | (5,529,752) | (460,218) |
| Net change in unrealized appreciation (depreciation) | 5,017,204 | (16,041,904) |
| Net increase (decrease) in net assets resulting from operations | 1,856,687 | (12,871,246) |
| Distributions to shareholders | | |
| Net investment income and net realized gains | | |
| Class A | (271,980) | (283,914) |
| Advisor Class | (59,672) | (62,331) |
| Class C | (17,545) | (21,526) |
| Institutional Class | (483,641) | (495,087) |
| Institutional 3 Class | (1,489,096) | (2,777,311) |
| Total distributions to shareholders | (2,321,934) | (3,640,169) |
| Decrease in net assets from capital stock activity | (113,079,257) | (18,411,052) |
| Total decrease in net assets | (113,544,504) | (34,922,467) |
| Net assets at beginning of year | 160,527,946 | 195,450,413 |
| Net assets at end of year | $46,983,442 | $160,527,946 |
The accompanying Notes to Financial Statements are an integral part of this statement.
| 12 | Columbia North Carolina Intermediate Municipal Bond Fund | Annual Report 2023 |
Statement of Changes in Net Assets (continued)
| | Year Ended | Year Ended |
| | April 30, 2023 | April 30, 2022 |
| | Shares | Dollars ($) | Shares | Dollars ($) |
| Capital stock activity |
| Class A | | | | |
| Subscriptions | 143,852 | 1,383,785 | 131,657 | 1,339,765 |
| Distributions reinvested | 23,345 | 225,649 | 22,081 | 230,301 |
| Redemptions | (837,306) | (8,054,273) | (173,908) | (1,803,504) |
| Net decrease | (670,109) | (6,444,839) | (20,170) | (233,438) |
| Advisor Class | | | | |
| Subscriptions | 92,951 | 895,577 | 47,588 | 504,984 |
| Distributions reinvested | 6,162 | 59,463 | 5,963 | 62,141 |
| Redemptions | (129,707) | (1,250,529) | (75,134) | (789,925) |
| Net decrease | (30,594) | (295,489) | (21,583) | (222,800) |
| Class C | | | | |
| Subscriptions | 6,578 | 64,351 | 19,227 | 204,915 |
| Distributions reinvested | 1,577 | 15,237 | 1,840 | 19,188 |
| Redemptions | (118,345) | (1,140,428) | (64,901) | (666,623) |
| Net decrease | (110,190) | (1,060,840) | (43,834) | (442,520) |
| Institutional Class | | | | |
| Subscriptions | 642,739 | 6,201,569 | 516,703 | 5,310,747 |
| Distributions reinvested | 43,709 | 421,988 | 40,420 | 420,845 |
| Redemptions | (2,307,100) | (22,377,800) | (485,514) | (4,986,226) |
| Net increase (decrease) | (1,620,652) | (15,754,243) | 71,609 | 745,366 |
| Institutional 3 Class | | | | |
| Subscriptions | 325,313 | 3,146,858 | 662,796 | 7,037,929 |
| Distributions reinvested | 7,220 | 69,950 | 5,911 | 61,644 |
| Redemptions | (9,583,483) | (92,740,654) | (2,481,764) | (25,357,233) |
| Net decrease | (9,250,950) | (89,523,846) | (1,813,057) | (18,257,660) |
| Total net decrease | (11,682,495) | (113,079,257) | (1,827,035) | (18,411,052) |
The accompanying Notes to Financial Statements are an integral part of this statement.
Columbia North Carolina Intermediate Municipal Bond Fund | Annual Report 2023
| 13 |
The following table is intended to help you understand the Fund’s financial performance. Certain information reflects financial results for a single share of a class held for the periods shown. Per share net investment income (loss) amounts are calculated based on average shares outstanding during the period. Total return assumes reinvestment of all dividends and distributions, if any. Total return does not reflect payment of sales charges, if any. Total return and portfolio turnover are not annualized for periods of less than one year. The ratios of expenses and net investment income are annualized for periods of less than one year. The portfolio turnover rate is calculated without regard to purchase and sales transactions of short-term instruments and certain derivatives, if any. If such transactions were included, the Fund’s portfolio turnover rate may be higher.
| | Net asset value,
beginning of
period | Net
investment
income | Net
realized
and
unrealized
gain (loss) | Total from
investment
operations | Distributions
from net
investment
income | Total
distributions to
shareholders |
| Class A |
| Year Ended 4/30/2023 | $9.72 | 0.20 | 0.03(c) | 0.23 | (0.20) | (0.20) |
| Year Ended 4/30/2022 | $10.65 | 0.17 | (0.93) | (0.76) | (0.17) | (0.17) |
| Year Ended 4/30/2021 | $10.27 | 0.18 | 0.38 | 0.56 | (0.18) | (0.18) |
| Year Ended 4/30/2020 | $10.33 | 0.21 | (0.06) | 0.15 | (0.21) | (0.21) |
| Year Ended 4/30/2019 | $10.14 | 0.24 | 0.19 | 0.43 | (0.24) | (0.24) |
| Advisor Class |
| Year Ended 4/30/2023 | $9.70 | 0.23 | 0.03(c) | 0.26 | (0.22) | (0.22) |
| Year Ended 4/30/2022 | $10.64 | 0.20 | (0.94) | (0.74) | (0.20) | (0.20) |
| Year Ended 4/30/2021 | $10.26 | 0.20 | 0.38 | 0.58 | (0.20) | (0.20) |
| Year Ended 4/30/2020 | $10.32 | 0.24 | (0.06) | 0.18 | (0.24) | (0.24) |
| Year Ended 4/30/2019 | $10.12 | 0.26 | 0.20 | 0.46 | (0.26) | (0.26) |
| Class C |
| Year Ended 4/30/2023 | $9.72 | 0.13 | 0.03(c) | 0.16 | (0.13) | (0.13) |
| Year Ended 4/30/2022 | $10.65 | 0.09 | (0.93) | (0.84) | (0.09) | (0.09) |
| Year Ended 4/30/2021 | $10.27 | 0.10 | 0.38 | 0.48 | (0.10) | (0.10) |
| Year Ended 4/30/2020 | $10.33 | 0.13 | (0.06) | 0.07 | (0.13) | (0.13) |
| Year Ended 4/30/2019 | $10.13 | 0.16 | 0.20 | 0.36 | (0.16) | (0.16) |
| Institutional Class |
| Year Ended 4/30/2023 | $9.71 | 0.23 | 0.02(c) | 0.25 | (0.22) | (0.22) |
| Year Ended 4/30/2022 | $10.64 | 0.20 | (0.93) | (0.73) | (0.20) | (0.20) |
| Year Ended 4/30/2021 | $10.26 | 0.20 | 0.38 | 0.58 | (0.20) | (0.20) |
| Year Ended 4/30/2020 | $10.32 | 0.24 | (0.06) | 0.18 | (0.24) | (0.24) |
| Year Ended 4/30/2019 | $10.13 | 0.26 | 0.19 | 0.45 | (0.26) | (0.26) |
The accompanying Notes to Financial Statements are an integral part of this statement.
| 14 | Columbia North Carolina Intermediate Municipal Bond Fund | Annual Report 2023 |
Financial Highlights (continued)
| | Net
asset
value,
end of
period | Total
return | Total gross
expense
ratio to
average
net assets(a) | Total net
expense
ratio to
average
net assets(a),(b) | Net investment
income
ratio to
average
net assets | Portfolio
turnover | Net
assets,
end of
period
(000’s) |
| Class A |
| Year Ended 4/30/2023 | $9.75 | 2.37% | 0.90%(d) | 0.81%(d) | 2.09% | 2% | $9,413 |
| Year Ended 4/30/2022 | $9.72 | (7.20%) | 0.86%(d) | 0.80%(d) | 1.65% | 6% | $15,892 |
| Year Ended 4/30/2021 | $10.65 | 5.45% | 0.88% | 0.81% | 1.68% | 15% | $17,634 |
| Year Ended 4/30/2020 | $10.27 | 1.43% | 0.85% | 0.81% | 2.01% | 7% | $17,176 |
| Year Ended 4/30/2019 | $10.33 | 4.26% | 0.87%(e) | 0.81%(e) | 2.32% | 23% | $16,469 |
| Advisor Class |
| Year Ended 4/30/2023 | $9.74 | 2.72% | 0.66%(d) | 0.56%(d) | 2.36% | 2% | $2,602 |
| Year Ended 4/30/2022 | $9.70 | (7.07%) | 0.61%(d) | 0.55%(d) | 1.90% | 6% | $2,889 |
| Year Ended 4/30/2021 | $10.64 | 5.72% | 0.63% | 0.56% | 1.93% | 15% | $3,396 |
| Year Ended 4/30/2020 | $10.26 | 1.69% | 0.60% | 0.56% | 2.26% | 7% | $4,928 |
| Year Ended 4/30/2019 | $10.32 | 4.62% | 0.62%(e) | 0.56%(e) | 2.57% | 23% | $5,505 |
| Class C |
| Year Ended 4/30/2023 | $9.75 | 1.62% | 1.65%(d) | 1.56%(d) | 1.32% | 2% | $824 |
| Year Ended 4/30/2022 | $9.72 | (7.90%) | 1.61%(d) | 1.55%(d) | 0.90% | 6% | $1,892 |
| Year Ended 4/30/2021 | $10.65 | 4.67% | 1.62% | 1.55% | 0.93% | 15% | $2,541 |
| Year Ended 4/30/2020 | $10.27 | 0.68% | 1.60% | 1.56% | 1.26% | 7% | $3,070 |
| Year Ended 4/30/2019 | $10.33 | 3.58% | 1.62%(e) | 1.56%(e) | 1.57% | 23% | $4,096 |
| Institutional Class |
| Year Ended 4/30/2023 | $9.74 | 2.62% | 0.65%(d) | 0.56%(d) | 2.34% | 2% | $8,845 |
| Year Ended 4/30/2022 | $9.71 | (6.98%) | 0.61%(d) | 0.55%(d) | 1.90% | 6% | $24,549 |
| Year Ended 4/30/2021 | $10.64 | 5.72% | 0.63% | 0.56% | 1.93% | 15% | $26,145 |
| Year Ended 4/30/2020 | $10.26 | 1.69% | 0.60% | 0.56% | 2.26% | 7% | $23,700 |
| Year Ended 4/30/2019 | $10.32 | 4.52% | 0.62%(e) | 0.56%(e) | 2.57% | 23% | $22,897 |
The accompanying Notes to Financial Statements are an integral part of this statement.
Columbia North Carolina Intermediate Municipal Bond Fund | Annual Report 2023
| 15 |
Financial Highlights (continued)
| | Net asset value,
beginning of
period | Net
investment
income | Net
realized
and
unrealized
gain (loss) | Total from
investment
operations | Distributions
from net
investment
income | Total
distributions to
shareholders |
| Institutional 3 Class |
| Year Ended 4/30/2023 | $9.74 | 0.23 | 0.03(c) | 0.26 | (0.23) | (0.23) |
| Year Ended 4/30/2022 | $10.67 | 0.21 | (0.93) | (0.72) | (0.21) | (0.21) |
| Year Ended 4/30/2021 | $10.29 | 0.21 | 0.38 | 0.59 | (0.21) | (0.21) |
| Year Ended 4/30/2020 | $10.36 | 0.25 | (0.07) | 0.18 | (0.25) | (0.25) |
| Year Ended 4/30/2019 | $10.16 | 0.27 | 0.20 | 0.47 | (0.27) | (0.27) |
| Notes to Financial Highlights |
| (a) | In addition to the fees and expenses that the Fund bears directly, the Fund indirectly bears a pro rata share of the fees and expenses of any other funds in which it invests. Such indirect expenses are not included in the Fund’s reported expense ratios. |
| (b) | Total net expenses include the impact of certain fee waivers/expense reimbursements made by the Investment Manager and certain of its affiliates, if applicable. |
| (c) | Calculation of the net gain (loss) per share (both realized and unrealized) does not correlate to the aggregate realized and unrealized gain (loss) presented in the Statement of Operations due to the timing of subscriptions and redemptions of Fund shares in relation to fluctuations in the market value of the portfolio. |
| (d) | Ratios include interfund lending expense which is less than 0.01%. |
| (e) | Ratios include line of credit interest expense which is less than 0.01%. |
The accompanying Notes to Financial Statements are an integral part of this statement.
| 16 | Columbia North Carolina Intermediate Municipal Bond Fund | Annual Report 2023 |
Financial Highlights (continued)
| | Net
asset
value,
end of
period | Total
return | Total gross
expense
ratio to
average
net assets(a) | Total net
expense
ratio to
average
net assets(a),(b) | Net investment
income
ratio to
average
net assets | Portfolio
turnover | Net
assets,
end of
period
(000’s) |
| Institutional 3 Class |
| Year Ended 4/30/2023 | $9.77 | 2.68% | 0.57%(d) | 0.49%(d) | 2.36% | 2% | $25,300 |
| Year Ended 4/30/2022 | $9.74 | (6.88%) | 0.53%(d) | 0.48%(d) | 1.98% | 6% | $115,305 |
| Year Ended 4/30/2021 | $10.67 | 5.79% | 0.55% | 0.48% | 2.00% | 15% | $145,734 |
| Year Ended 4/30/2020 | $10.29 | 1.67% | 0.52% | 0.48% | 2.34% | 7% | $141,450 |
| Year Ended 4/30/2019 | $10.36 | 4.70% | 0.53%(e) | 0.48%(e) | 2.65% | 23% | $120,551 |
The accompanying Notes to Financial Statements are an integral part of this statement.
Columbia North Carolina Intermediate Municipal Bond Fund | Annual Report 2023
| 17 |
Notes to Financial Statements
April 30, 2023
Note 1. Organization
Columbia North Carolina Intermediate Municipal Bond Fund (the Fund), a series of Columbia Funds Series Trust (the Trust), is a diversified fund. The Trust is registered under the Investment Company Act of 1940, as amended (the 1940 Act), as an open-end management investment company organized as a Delaware statutory trust.
Fund shares
The Trust may issue an unlimited number of shares (without par value). The Fund offers each of the share classes listed in the Statement of Assets and Liabilities. Although all share classes generally have identical voting, dividend and liquidation rights, each share class votes separately when required by the Trust’s organizational documents or by law. Each share class has its own expense and sales charge structure. Different share classes may have different minimum initial investment amounts and pay different net investment income distribution amounts to the extent the expenses of distributing such share classes vary. Distributions to shareholders in a liquidation will be proportional to the net asset value of each share class.
As described in the Fund’s prospectus, Class A and Class C shares are offered to the general public for investment. Class C shares automatically convert to Class A shares after 8 years. Advisor Class, Institutional Class and Institutional 3 Class shares are available through authorized investment professionals to omnibus retirement plans or to institutional investors and to certain other investors as also described in the Fund’s prospectus.
The Board of Trustees of the Fund approved a Plan of Liquidation and Termination pursuant to which the Fund was liquidated and terminated. Effective at the open of business on April 14, 2023, the Fund was closed to new investors, and any applicable contingent deferred sales charges were waived on redemptions and exchanges out of the Fund. The Fund was liquidated on May 5, 2023, at which time the Fund’s shareholders received a liquidating distribution in an amount equal to the net asset value of their Fund shares.
Note 2. Summary of significant accounting policies
Basis of preparation
The Fund is an investment company that applies the accounting and reporting guidance in the Financial Accounting Standards Board (FASB) Accounting Standards Codification Topic 946, Financial Services - Investment Companies (ASC 946). The financial statements are prepared in accordance with U.S. generally accepted accounting principles (GAAP), which requires management to make certain estimates and assumptions that affect the reported amounts of assets and liabilities, the disclosure of contingent assets and liabilities at the date of the financial statements and the reported amounts of income and expenses during the reporting period. Actual results could differ from those estimates.
The following is a summary of significant accounting policies followed by the Fund in the preparation of its financial statements.
Security valuation
Investments in open-end investment companies (other than exchange-traded funds (ETFs)), are valued at the latest net asset value reported by those companies as of the valuation time.
Investments for which market quotations are not readily available, or that have quotations which management believes are not reflective of market value or reliable, are valued at fair value as determined in good faith under procedures approved by the Board of Trustees. If a security or class of securities (such as foreign securities) is valued at fair value, such value is likely to be different from the quoted or published price for the security, if available.
The determination of fair value often requires significant judgment. To determine fair value, management may use assumptions including but not limited to future cash flows and estimated risk premiums. Multiple inputs from various sources may be used to determine fair value.
GAAP requires disclosure regarding the inputs and valuation techniques used to measure fair value and any changes in valuation inputs or techniques. In addition, investments shall be disclosed by major category. This information is disclosed following the Fund’s Portfolio of Investments.
| 18 | Columbia North Carolina Intermediate Municipal Bond Fund | Annual Report 2023 |
Notes to Financial Statements (continued)
April 30, 2023
Security transactions
Security transactions are accounted for on the trade date. Cost is determined and gains (losses) are based upon the specific identification method for both financial statement and federal income tax purposes.
Income recognition
Interest income is recorded on an accrual basis. Market premiums and discounts, including original issue discounts, are amortized and accreted, respectively, over the expected life of the security on all debt securities, unless otherwise noted.
The Fund may place a debt security on non-accrual status and reduce related interest income when it becomes probable that the interest will not be collected and the amount of uncollectible interest can be reasonably estimated. The Fund may also adjust accrual rates when it becomes probable the full interest will not be collected and a partial payment will be received. A defaulted debt security is removed from non-accrual status when the issuer resumes interest payments or when collectability of interest is reasonably assured.
Dividend income is recorded on the ex-dividend date.
Expenses
General expenses of the Trust are allocated to the Fund and other funds of the Trust based upon relative net assets or other expense allocation methodologies determined by the nature of the expense. Expenses directly attributable to the Fund are charged to the Fund. Expenses directly attributable to a specific class of shares are charged to that share class.
Determination of class net asset value
All income, expenses (other than class-specific expenses, which are charged to that share class, as shown in the Statement of Operations) and realized and unrealized gains (losses) are allocated to each class of the Fund on a daily basis, based on the relative net assets of each class, for purposes of determining the net asset value of each class.
Federal income tax status
The Fund intends to qualify each year as a regulated investment company under Subchapter M of the Internal Revenue Code, as amended, and will distribute substantially all of its net tax-exempt and investment company taxable income and net capital gain, if any, for its tax year, and as such will not be subject to federal income taxes. In addition, the Fund intends to distribute in each calendar year substantially all of its ordinary income, capital gain net income and certain other amounts, if any, such that the Fund should not be subject to federal excise tax. Therefore, no federal income or excise tax provision is recorded.
Distributions to shareholders
Distributions from net investment income, if any, are declared daily and paid monthly. Net realized capital gains, if any, are distributed at least annually. Income distributions and capital gain distributions are determined in accordance with federal income tax regulations, which may differ from GAAP.
Guarantees and indemnifications
Under the Trust’s organizational documents and, in some cases, by contract, its officers and trustees are indemnified against certain liabilities arising out of the performance of their duties to the Trust or its funds. In addition, certain of the Fund’s contracts with its service providers contain general indemnification clauses. The Fund’s maximum exposure under these arrangements is unknown since the amount of any future claims that may be made against the Fund cannot be determined, and the Fund has no historical basis for predicting the likelihood of any such claims.
Recent accounting pronouncement
Tailored Shareholder Reports
In October 2022, the Securities and Exchange Commission (SEC) adopted a final rule relating to Tailored Shareholder Reports for Mutual Funds and Exchange-Traded Funds; Fee Information in Investment Company Advertisements. The rule and form amendments will, among other things, require the Fund to transmit concise and visually engaging shareholder reports
Columbia North Carolina Intermediate Municipal Bond Fund | Annual Report 2023
| 19 |
Notes to Financial Statements (continued)
April 30, 2023
that highlight key information. The amendments will require that funds tag information in a structured data format and that certain more in-depth information be made available online and available for delivery free of charge to investors on request. The amendments became effective January 24, 2023. There is an 18-month transition period after the effective date of the amendment.
Note 3. Fees and other transactions with affiliates
Management services fees
The Fund has entered into a Management Agreement with Columbia Management Investment Advisers, LLC (the Investment Manager), a wholly-owned subsidiary of Ameriprise Financial, Inc. (Ameriprise Financial). Under the Management Agreement, the Investment Manager provides the Fund with investment research and advice, as well as administrative and accounting services. The management services fee is an annual fee that is equal to a percentage of the Fund’s daily net assets that declines from 0.47% to 0.31% as the Fund’s net assets increase. The effective management services fee rate for the year ended April 30, 2023 was 0.47% of the Fund’s average daily net assets.
Compensation of board members
Members of the Board of Trustees who are not officers or employees of the Investment Manager or Ameriprise Financial are compensated for their services to the Fund as disclosed in the Statement of Operations. Under a Deferred Compensation Plan (the Deferred Plan), these members of the Board of Trustees may elect to defer payment of up to 100% of their compensation. Deferred amounts are treated as though equivalent dollar amounts had been invested in shares of certain funds managed by the Investment Manager. The Fund’s liability for these amounts is adjusted for market value changes and remains in the Fund until distributed in accordance with the Deferred Plan. All amounts payable under the Deferred Plan constitute a general unsecured obligation of the Fund. The expense for the Deferred Plan, which includes Trustees’ fees deferred during the current period as well as any gains or losses on the Trustees’ deferred compensation balances as a result of market fluctuations, is included in "Compensation of board members" in the Statement of Operations.
Compensation of Chief Compliance Officer
The Board of Trustees has appointed a Chief Compliance Officer for the Fund in accordance with federal securities regulations. As disclosed in the Statement of Operations, a portion of the Chief Compliance Officer’s total compensation is allocated to the Fund, along with other allocations to affiliated registered investment companies managed by the Investment Manager and its affiliates, based on relative net assets.
Transfer agency fees
Under a Transfer and Dividend Disbursing Agent Agreement, Columbia Management Investment Services Corp. (the Transfer Agent), an affiliate of the Investment Manager and a wholly-owned subsidiary of Ameriprise Financial, is responsible for providing transfer agency services to the Fund. The Transfer Agent has contracted with SS&C GIDS, Inc. (SS&C GIDS) to serve as sub-transfer agent. Prior to January 1, 2023, SS&C GIDS was known as DST Asset Manager Solutions, Inc. The Transfer Agent pays the fees of SS&C GIDS for services as sub-transfer agent and SS&C GIDS is not entitled to reimbursement for such fees from the Fund (with the exception of out-of-pocket fees).
The Fund pays the Transfer Agent a monthly transfer agency fee based on the number or the average value of accounts, depending on the type of account. In addition, the Fund pays the Transfer Agent a fee for shareholder services based on the number of accounts or on a percentage of the average aggregate value of the Fund’s shares maintained in omnibus accounts up to the lesser of the amount charged by the financial intermediary or a cap established by the Board of Trustees from time to time.
The Transfer Agent also receives compensation from the Fund for various shareholder services and reimbursements for certain out-of-pocket fees. Total transfer agency fees for Institutional 3 Class shares are subject to an annual limitation of not more than 0.02% of the average daily net assets attributable to Institutional 3 Class shares.
| 20 | Columbia North Carolina Intermediate Municipal Bond Fund | Annual Report 2023 |
Notes to Financial Statements (continued)
April 30, 2023
For the year ended April 30, 2023, the Fund’s effective transfer agency fee rates as a percentage of average daily net assets of each class were as follows:
| | Effective rate (%) |
| Class A | 0.08 |
| Advisor Class | 0.08 |
| Class C | 0.08 |
| Institutional Class | 0.08 |
| Institutional 3 Class | 0.01 |
An annual minimum account balance fee of $20 may apply to certain accounts with a value below the applicable share class’s initial minimum investment requirements to reduce the impact of small accounts on transfer agency fees. These minimum account balance fees are remitted to the Fund and recorded as part of expense reductions in the Statement of Operations. For the year ended April 30, 2023, no minimum account balance fees were charged by the Fund.
Distribution and service fees
The Fund has entered into an agreement with Columbia Management Investment Distributors, Inc. (the Distributor), an affiliate of the Investment Manager and a wholly-owned subsidiary of Ameriprise Financial, for distribution and shareholder services. The Board of Trustees has approved, and the Fund has adopted, distribution and shareholder service plans (the Plans) applicable to certain share classes, which set the distribution and service fees for the Fund. These fees are calculated daily and are intended to compensate the Distributor and/or eligible selling and/or servicing agents for selling shares of the Fund and providing services to investors.
Under the Plans, the Fund pays a monthly combined distribution and service fee to the Distributor at the maximum annual rate of 0.25% of the average daily net assets attributable to Class A shares of the Fund. Also under the Plans, the Fund pays a monthly service fee to the Distributor at the maximum annual rate of 0.25% of the average daily net assets attributable to Class C shares of the Fund and a monthly distribution fee to the Distributor at the maximum annual rate of 0.75% of the average daily net assets attributable to Class C shares of the Fund.
Sales charges (unaudited)
Sales charges, including front-end charges and contingent deferred sales charges (CDSCs), received by the Distributor for distributing Fund shares for the year ended April 30, 2023, if any, are listed below:
| | Front End (%) | CDSC (%) | Amount ($) |
| Class A | 3.00 | 0.75(a) | 1,986 |
| Class C | — | 1.00(b) | 11 |
| (a) | This charge is imposed on certain investments of $500,000 or more if redeemed within 12 months after purchase. |
| (b) | This charge applies to redemptions within 12 months after purchase, with certain limited exceptions. |
The Fund’s other share classes are not subject to sales charges.
Columbia North Carolina Intermediate Municipal Bond Fund | Annual Report 2023
| 21 |
Notes to Financial Statements (continued)
April 30, 2023
Expenses waived/reimbursed by the Investment Manager and its affiliates
The Investment Manager and certain of its affiliates have contractually agreed to waive fees and/or reimburse expenses (excluding certain fees and expenses described below) for the period(s) disclosed below, unless sooner terminated at the sole discretion of the Board of Trustees, so that the Fund’s net operating expenses, after giving effect to fees waived/expenses reimbursed and any balance credits and/or overdraft charges from the Fund’s custodian, do not exceed the following annual rate(s) as a percentage of the classes’ average daily net assets:
| | September 1, 2022
through
August 31, 2023 | Prior to
September 1, 2022 |
| Class A | 0.81% | 0.81% |
| Advisor Class | 0.56 | 0.56 |
| Class C | 1.56 | 1.56 |
| Institutional Class | 0.56 | 0.56 |
| Institutional 3 Class | 0.50 | 0.48 |
Under the agreement governing these fee waivers and/or expense reimbursement arrangements, the following fees and expenses are excluded from the waiver/reimbursement commitment, and therefore will be paid by the Fund, if applicable: taxes (including foreign transaction taxes), expenses associated with investments in affiliated and non-affiliated pooled investment vehicles (including mutual funds and exchange-traded funds), transaction costs and brokerage commissions, costs related to any securities lending program, dividend expenses associated with securities sold short, inverse floater program fees and expenses, transaction charges and interest on borrowed money, interest, costs associated with shareholder meetings, infrequent and/or unusual expenses and any other expenses the exclusion of which is specifically approved by the Board of Trustees. This agreement may be modified or amended only with approval from the Investment Manager, certain of its affiliates and the Fund. Any fees waived and/or expenses reimbursed under the expense reimbursement arrangements described above are not recoverable by the Investment Manager or its affiliates in future periods.
Note 4. Federal tax information
The timing and character of income and capital gain distributions are determined in accordance with income tax regulations, which may differ from GAAP because of temporary or permanent book to tax differences.
At April 30, 2023, these differences were primarily due to differing treatment for capital loss carryforwards, trustees’ deferred compensation, distributions and re-characterization of distributions for investments. To the extent these differences were permanent, reclassifications were made among the components of the Fund’s net assets. Temporary differences do not require reclassifications.
The following reclassifications were made:
Undistributed net
investment
income ($) | Accumulated
net realized
(loss) ($) | Paid in
capital ($) |
| (1) | 1 | — |
Net investment income (loss) and net realized gains (losses), as disclosed in the Statement of Operations, and net assets were not affected by this reclassification.
The tax character of distributions paid during the years indicated was as follows:
| Year Ended April 30, 2023 | Year Ended April 30, 2022 |
Ordinary
income ($) | Tax-exempt
income ($) | Long-term
capital gains ($) | Total ($) | Ordinary
income ($) | Tax-exempt
income ($) | Long-term
capital gains ($) | Total ($) |
| 19,498 | 2,302,436 | — | 2,321,934 | 667 | 3,639,502 | — | 3,640,169 |
Short-term capital gain distributions, if any, are considered ordinary income distributions for tax purposes.
| 22 | Columbia North Carolina Intermediate Municipal Bond Fund | Annual Report 2023 |
Notes to Financial Statements (continued)
April 30, 2023
At April 30, 2023, the components of distributable earnings on a tax basis were as follows:
Undistributed
ordinary income ($) | Undistributed tax-
exempt income ($) | Undistributed
long-term
capital gains ($) | Capital loss
carryforwards ($) | Net unrealized
appreciation ($) |
| — | 954,578 | — | (7,058,432) | — |
At April 30, 2023, the cost of all investments for federal income tax purposes along with the aggregate gross unrealized appreciation and depreciation based on that cost was:
Federal
tax cost ($) | Gross unrealized
appreciation ($) | Gross unrealized
(depreciation) ($) | Net unrealized
appreciation ($) |
| 47,265,877 | — | — | — |
Tax cost of investments and unrealized appreciation/(depreciation) may also include timing differences that do not constitute adjustments to tax basis.
The following capital loss carryforwards, determined at April 30, 2023, may be available to reduce future net realized gains on investments, if any, to the extent permitted by the Internal Revenue Code. In addition, for the year ended April 30, 2023, capital loss carryforwards utilized, if any, were as follows:
No expiration
short-term ($) | No expiration
long-term ($) | Total ($) | Utilized ($) |
| (637,155) | (6,421,277) | (7,058,432) | — |
Management of the Fund has concluded that there are no significant uncertain tax positions in the Fund that would require recognition in the financial statements. However, management’s conclusion may be subject to review and adjustment at a later date based on factors including, but not limited to, new tax laws, regulations, and administrative interpretations (including relevant court decisions). Generally, the Fund’s federal tax returns for the prior three fiscal years remain subject to examination by the Internal Revenue Service.
Note 5. Portfolio information
The cost of purchases and proceeds from sales of securities, excluding short-term investments and derivatives, if any, aggregated to $1,809,339 and $157,696,903, respectively, for the year ended April 30, 2023. The amount of purchase and sale activity impacts the portfolio turnover rate reported in the Financial Highlights.
Note 6. Interfund lending
Pursuant to an exemptive order granted by the Securities and Exchange Commission, the Fund participates in a program (the Interfund Program) allowing each participating Columbia Fund (each, a Participating Fund) to lend money directly to and, except for closed-end funds and money market funds, borrow money directly from other Participating Funds for temporary purposes. The amounts eligible for borrowing and lending under the Interfund Program are subject to certain restrictions.
Interfund loans are subject to the risk that the borrowing fund could be unable to repay the loan when due, and a delay in repayment to the lending fund could result in lost opportunities and/or additional lending costs. The exemptive order is subject to conditions intended to mitigate conflicts of interest arising from the Investment Manager’s relationship with each Participating Fund.
The Fund’s activity in the Interfund Program during the year ended April 30, 2023 was as follows:
| Borrower or lender | Average loan
balance ($) | Weighted average
interest rate (%) | Number of days
with outstanding loans |
| Borrower | 1,241,935 | 3.36 | 31 |
Interest expense incurred by the Fund is recorded as Interfund lending in the Statement of Operations. The Fund had no outstanding interfund loans at April 30, 2023.
Columbia North Carolina Intermediate Municipal Bond Fund | Annual Report 2023
| 23 |
Notes to Financial Statements (continued)
April 30, 2023
Note 7. Line of credit
The Fund has access to a revolving credit facility with a syndicate of banks led by JPMorgan Chase Bank, N.A., Citibank, N.A. and Wells Fargo Bank, N.A. whereby the Fund may borrow for the temporary funding of shareholder redemptions or for other temporary or emergency purposes. Pursuant to an October 27, 2022 amendment and restatement, the credit facility, which is an agreement between the Fund and certain other funds managed by the Investment Manager or an affiliated investment manager, severally and not jointly, permits aggregate borrowings up to $950 million. Interest is currently charged to each participating fund based on its borrowings at a rate equal to the higher of (i) the federal funds effective rate, (ii) the secured overnight financing rate plus 0.10% and (iii) the overnight bank funding rate, plus in each case, 1.00%. Each borrowing under the credit facility matures no later than 60 days after the date of borrowing. The Fund also pays a commitment fee equal to its pro rata share of the unused amount of the credit facility at a rate of 0.15% per annum. The commitment fee is included in other expenses in the Statement of Operations. This agreement expires annually in October unless extended or renewed. Prior to the October 27, 2022 amendment and restatement, the Fund had access to a revolving credit facility with a syndicate of banks led by JPMorgan Chase Bank, N.A., Citibank, N.A. and Wells Fargo Bank, N.A. which permitted collective borrowings up to $950 million. Interest was charged to each participating fund based on its borrowings at a rate equal to the higher of (i) the federal funds effective rate, (ii) the secured overnight financing rate plus 0.11448% and (iii) the overnight bank funding rate, plus in each case, 1.00%.
The Fund had no borrowings during the year ended April 30, 2023.
Note 8. Significant risks
Market risk
The Fund may incur losses due to declines in the value of one or more securities in which it invests. These declines may be due to factors affecting a particular issuer, or the result of, among other things, political, regulatory, market, economic or social developments affecting the relevant market(s) more generally. In addition, turbulence in financial markets and reduced liquidity in equity, credit and/or fixed income markets may negatively affect many issuers, which could adversely affect the Fund’s ability to price or value hard-to-value assets in thinly traded and closed markets and could cause significant redemptions and operational challenges. Global economies and financial markets are increasingly interconnected, and conditions and events in one country, region or financial market may adversely impact issuers in a different country, region or financial market. These risks may be magnified if certain events or developments adversely interrupt the global supply chain; in these and other circumstances, such risks might affect companies worldwide. As a result, local, regional or global events such as terrorism, war, natural disasters, disease/virus outbreaks and epidemics or other public health issues, recessions, depressions or other events – or the potential for such events – could have a significant negative impact on global economic and market conditions.
Money market fund investment risk
An investment in a money market fund is not a bank deposit and is not insured or guaranteed by any bank, the FDIC or any other government agency. Certain money market funds float their net asset value while others seek to preserve the value of investments at a stable net asset value (typically, $1.00 per share). An investment in a money market fund, even an investment in a fund seeking to maintain a stable net asset value per share, is not guaranteed and it is possible for the Fund to lose money by investing in these and other types of money market funds. If the liquidity of a money market fund’s portfolio deteriorates below certain levels, the money market fund may suspend redemptions (i.e., impose a redemption gate) and thereby prevent the Fund from selling its investment in the money market fund or impose a fee of up to 2% on amounts the Fund redeems from the money market fund (i.e., impose a liquidity fee). These measures may result in an investment loss or prohibit the Fund from redeeming shares when the Investment Manager would otherwise redeem shares. In addition to the fees and expenses that the Fund directly bears, the Fund indirectly bears the fees and expenses of any money market funds in which it invests, including affiliated money market funds. By investing in a money market fund, the Fund will be exposed to the investment risks of the money market fund in direct proportion to such investment. To the extent the Fund invests in instruments such as derivatives, the Fund may hold investments, which may be significant, in money market fund shares to cover its obligations resulting from the Fund’s investments in such instruments. Money market funds and the securities they
| 24 | Columbia North Carolina Intermediate Municipal Bond Fund | Annual Report 2023 |
Notes to Financial Statements (continued)
April 30, 2023
invest in are subject to comprehensive regulations. The enactment of new legislation or regulations, as well as changes in interpretation and enforcement of current laws, may affect the manner of operation, performance and/or yield of money market funds.
Shareholder concentration risk
At April 30, 2023, two unaffiliated shareholders of record owned 69.1% of the outstanding shares of the Fund in one or more accounts. The Fund has no knowledge about whether any portion of those shares was owned beneficially. Subscription and redemption activity by concentrated accounts may have a significant effect on the operations of the Fund. In the case of a large redemption, the Fund may be forced to sell investments at inopportune times, including its liquid positions, which may result in Fund losses and the Fund holding a higher percentage of less liquid positions. Large redemptions could result in decreased economies of scale and increased operating expenses for non-redeeming Fund shareholders.
Note 9. Subsequent events
Management has evaluated the events and transactions that have occurred through the date the financial statements were issued. Other than as noted in Note 1 above, there were no items requiring adjustment of the financial statements or additional disclosure.
Note 10. Information regarding pending and settled legal proceedings
Ameriprise Financial and certain of its affiliates are involved in the normal course of business in legal proceedings which include regulatory inquiries, arbitration and litigation, including class actions concerning matters arising in connection with the conduct of their activities as part of a diversified financial services firm. Ameriprise Financial believes that the Fund is not currently the subject of, and that neither Ameriprise Financial nor any of its affiliates are the subject of, any pending legal, arbitration or regulatory proceedings that are likely to have a material adverse effect on the Fund or the ability of Ameriprise Financial or its affiliates to perform under their contracts with the Fund. Ameriprise Financial is required to make quarterly (10-Q), annual (10-K) and, as necessary, 8-K filings with the Securities and Exchange Commission (SEC) on legal and regulatory matters that relate to Ameriprise Financial and its affiliates. Copies of these filings may be obtained by accessing the SEC website at www.sec.gov.
There can be no assurance that these matters, or the adverse publicity associated with them, will not result in increased Fund redemptions, reduced sale of Fund shares or other adverse consequences to the Fund. Further, although we believe proceedings are not likely to have a material adverse effect on the Fund or the ability of Ameriprise Financial or its affiliates to perform under their contracts with the Fund, these proceedings are subject to uncertainties and, as such, we are unable to estimate the possible loss or range of loss that may result. An adverse outcome in one or more of these proceedings could result in adverse judgments, settlements, fines, penalties or other relief that could have a material adverse effect on the consolidated financial condition or results of operations of Ameriprise Financial or one or more of its affiliates that provides services to the Fund.
Columbia North Carolina Intermediate Municipal Bond Fund | Annual Report 2023
| 25 |
Report of Independent Registered Public Accounting Firm
To the Board of Trustees of Columbia Funds Series Trust and Shareholders of Columbia North Carolina Intermediate Municipal Bond Fund
Opinion on the Financial Statements
We have audited the accompanying statement of assets and liabilities, including the portfolio of investments, of Columbia North Carolina Intermediate Municipal Bond Fund (one of the funds constituting Columbia Funds Series Trust, referred to hereafter as the "Fund") as of April 30, 2023, the related statement of operations for the year ended April 30, 2023, the statement of changes in net assets for each of the two years in the period ended April 30, 2023, including the related notes, and the financial highlights for each of the five years in the period ended April 30, 2023 (collectively referred to as the "financial statements"). In our opinion, the financial statements present fairly, in all material respects, the financial position of the Fund as of April 30, 2023, the results of its operations for the year then ended, the changes in its net assets for each of the two years in the period ended April 30, 2023 and the financial highlights for each of the five years in the period ended April 30, 2023 in conformity with accounting principles generally accepted in the United States of America.
Basis for Opinion
These financial statements are the responsibility of the Fund’s management. Our responsibility is to express an opinion on the Fund’s financial statements based on our audits. We are a public accounting firm registered with the Public Company Accounting Oversight Board (United States) (PCAOB) and are required to be independent with respect to the Fund in accordance with the U.S. federal securities laws and the applicable rules and regulations of the Securities and Exchange Commission and the PCAOB.
We conducted our audits of these financial statements in accordance with the standards of the PCAOB. Those standards require that we plan and perform the audit to obtain reasonable assurance about whether the financial statements are free of material misstatement, whether due to error or fraud.
Our audits included performing procedures to assess the risks of material misstatement of the financial statements, whether due to error or fraud, and performing procedures that respond to those risks. Such procedures included examining, on a test basis, evidence regarding the amounts and disclosures in the financial statements. Our audits also included evaluating the accounting principles used and significant estimates made by management, as well as evaluating the overall presentation of the financial statements. Our procedures included confirmation of securities owned as of April 30, 2023 by correspondence with the custodian and transfer agent. We believe that our audits provide a reasonable basis for our opinion.
/s/PricewaterhouseCoopers LLP
Minneapolis, Minnesota
June 22, 2023
We have served as the auditor of one or more investment companies within the Columbia Funds Complex since 1977.
| 26 | Columbia North Carolina Intermediate Municipal Bond Fund | Annual Report 2023 |
Federal Income Tax Information
(Unaudited)
The Fund hereby designates the following tax attributes for the fiscal year ended April 30, 2023. Shareholders will be notified in early 2024 of the amounts for use in preparing 2023 income tax returns.
Exempt-
interest
dividends | |
| 99.16% | |
Exempt-interest dividends. The percentage of net investment income distributed during the fiscal year that qualifies as exempt-interest dividends for federal income tax purposes. A portion of the income may be subject to federal alternative minimum tax.
TRUSTEES AND OFFICERS
(Unaudited)
The Board oversees the Fund’s operations and appoints officers who are responsible for day-to-day business decisions based on policies set by the Board. The following table provides basic biographical information about the Fund’s Trustees as of the printing of this report, including their principal occupations during the past five years, although specific titles for individuals may have varied over the period. The year set forth beneath Length of Service in the table below is the year in which the Trustee was first appointed or elected as Trustee to any Fund currently in the Columbia Funds Complex or a predecessor thereof. Under current Board policy, each Trustee generally serves until December 31 of the year such Trustee turns seventy-five (75).
Independent trustees
Name,
address,
year of birth | Position held
with the Columbia Funds and
length of service | Principal occupation(s)
during past five years
and other relevant
professional experience | Number of
Funds in the
Columbia Funds
Complex*
overseen | Other directorships
held by Trustee
during the past five years
and other relevant Board experience |
George S. Batejan
c/o Columbia Management
Investment Advisers, LLC
290 Congress Street
Boston, MA 02210
1954 | Trustee since 2017 | Executive Vice President, Global Head of Technology and Operations, Janus Capital Group, Inc., 2010-2016 | 174 | Former Chairman of the Board, NICSA (National Investment Company Services Association) (Executive Committee, Nominating Committee and Governance Committee), 2014-2016; former Director, Intech Investment Management, 2011-2016; former Board Member, Metro Denver Chamber of Commerce, 2015-2016; former Advisory Board Member, University of Colorado Business School, 2015-2018; former Board Member, Chase Bank International, 1993-1994 |
Columbia North Carolina Intermediate Municipal Bond Fund | Annual Report 2023
| 27 |
TRUSTEES AND OFFICERS (continued)
(Unaudited)
Independent trustees (continued)
Name,
address,
year of birth | Position held
with the Columbia Funds and
length of service | Principal occupation(s)
during past five years
and other relevant
professional experience | Number of
Funds in the
Columbia Funds
Complex*
overseen | Other directorships
held by Trustee
during the past five years
and other relevant Board experience |
Kathleen Blatz
c/o Columbia Management
Investment Advisers, LLC
290 Congress Street
Boston, MA 02210
1954 | Trustee since 2006 | Attorney, specializing in arbitration and mediation; Chief Justice, Minnesota Supreme Court, 1998-2006; Associate Justice, Minnesota Supreme Court, 1996-1998; Fourth Judicial District Court Judge, Hennepin County, 1994-1996; Attorney in private practice and public service, 1984-1993; State Representative, Minnesota House of Representatives, 1979-1993, which included service on the Tax and Financial Institutions and Insurance Committees; Member and Interim Chair, Minnesota Sports Facilities Authority, January-July 2017; Interim President and Chief Executive Officer, Blue Cross and Blue Shield of Minnesota (health care insurance), February-July 2018, April-October 2021 | 174 | Former Trustee, Blue Cross and Blue Shield of Minnesota, 2009-2021 (Chair of the Business Development Committee, 2014-2017; Chair of the Governance Committee, 2017-2019); former Member and Chair of the Board, Minnesota Sports Facilities Authority, January 2017-July 2017; former Director, Robina Foundation, 2009-2020 (Chair, 2014-2020); Director, Richard M. Schulze Family Foundation, since 2021 |
Pamela G. Carlton
c/o Columbia Management
Investment Advisers, LLC
290 Congress Street
Boston, MA 02210
1954 | Chair since 2023; Trustee since 2007 | President, Springboard — Partners in Cross Cultural Leadership (consulting company), since 2003; Managing Director of US Equity Research, JP Morgan Chase, 1999-2003; Director of US Equity Research, Chase Asset Management, 1996-1999; Co-Director Latin America Research, 1993-1996, COO Global Research, 1992-1996, Co-Director of US Research, 1991-1992, Investment Banker, 1982-1991, Morgan Stanley; Attorney, Cleary Gottlieb Steen & Hamilton LLP, 1980-1982 | 174 | Trustee, New York Presbyterian Hospital Board, since 1996; Director, DR Bank (Audit Committee) since 2017; Director, Evercore Inc. (Audit Committee, Nominating and Governance Committee), since 2019; Director, Apollo Commercial Real Estate Finance, Inc. (Chair, Nominating and Governance Committee) (financial services), since 2021; the Governing Council of the Independent Directors Council (IDC), since 2021 |
Janet Langford Carrig
c/o Columbia Management
Investment Advisers, LLC
290 Congress Street
Boston, MA 02210
1957 | Trustee since 1996 | Senior Vice President, General Counsel and Corporate Secretary, ConocoPhillips (independent energy company), September 2007-October 2018 | 174 | Director, EQT Corporation (natural gas producer), since 2019; former Director, Whiting Petroleum Corporation (independent oil and gas company), 2020-2022 |
J. Kevin Connaughton
c/o Columbia Management
Investment Advisers, LLC
290 Congress Street
Boston, MA 02210
1964 | Trustee since 2020 | CEO and President, RhodeWay Financial (non-profit financial planning firm), since December 2022; Member, FINRA National Adjudicatory Council, since January 2020; Adjunct Professor of Finance, Bentley University since January 2018; Consultant to Independent Trustees of CFVIT and CFST I from March 2016 to June 2020 with respect to CFVIT and to December 2020 with respect to CFST I; Managing Director and General Manager of Mutual Fund Products, Columbia Management Investment Advisers, LLC, May 2010-February 2015; President, Columbia Funds, 2008-2015; and senior officer of Columbia Funds and affiliated funds, 2003-2015 | 172 | Former Director, The Autism Project, March 2015-December 2021; former Member of the Investment Committee, St. Michael’s College, November 2015-February 2020; former Trustee, St. Michael’s College, June 2017-September 2019; former Trustee, New Century Portfolios (former mutual fund complex), January 2015-December 2017 |
| 28 | Columbia North Carolina Intermediate Municipal Bond Fund | Annual Report 2023 |
TRUSTEES AND OFFICERS (continued)
(Unaudited)
Independent trustees (continued)
Name,
address,
year of birth | Position held
with the Columbia Funds and
length of service | Principal occupation(s)
during past five years
and other relevant
professional experience | Number of
Funds in the
Columbia Funds
Complex*
overseen | Other directorships
held by Trustee
during the past five years
and other relevant Board experience |
Olive M. Darragh
c/o Columbia Management
Investment Advisers, LLC
290 Congress Street
Boston, MA 02210
1962 | Trustee since 2020 | Managing Director of Darragh Inc. (strategy and talent management consulting firm), since 2010; Founder and CEO, Zolio, Inc. (investment management talent identification platform), since 2004; Consultant to Independent Trustees of CFVIT and CFST I from June 2019 to June 2020 with respect to CFVIT and to December 2020 with respect to CFST I; Partner, Tudor Investments, 2004-2010; Senior Partner, McKinsey & Company (consulting), 1990-2004; Touche Ross CPA, 1985-1988 | 172 | Treasurer, Edinburgh University US Trust Board, since January 2023; Member, HBS Community Action Partners Board, since September 2022; former Director, University of Edinburgh Business School (Member of US Board), 2004-2019; former Director, Boston Public Library Foundation, 2008-2017 |
Patricia M. Flynn
c/o Columbia Management
Investment Advisers, LLC
290 Congress Street
Boston, MA 02210
1950 | Trustee since 2004 | Professor of Economics and Management, Bentley University, since 2002; Dean, McCallum Graduate School of Business, Bentley University, 1992-2002 | 174 | Former Trustee, MA Taxpayers Foundation, 1997-2022; former Director, The MA Business Roundtable, 2003-2019; former Chairperson, Innovation Index Advisory Committee, MA Technology Collaborative, 1997-2020 |
Brian J. Gallagher
c/o Columbia Management
Investment Advisers, LLC
290 Congress Street
Boston, MA 02210
1954 | Trustee since 2017 | Retired; Partner with Deloitte & Touche LLP and its predecessors, 1977-2016 | 174 | Trustee, Catholic Schools Foundation, since 2004 |
Douglas A. Hacker
c/o Columbia Management
Investment Advisers, LLC
290 Congress Street
Boston, MA 02210
1955 | Trustee since 1996 | Independent business executive, since May 2006; Executive Vice President – Strategy of United Airlines, December 2002 - May 2006; President of UAL Loyalty Services (airline marketing company), September 2001-December 2002; Executive Vice President and Chief Financial Officer of United Airlines, July 1999-September 2001 | 174 | Director, SpartanNash Company since November 2013 (Chair of the Board, since May 2021) (food distributor); Director, Aircastle Limited (Chair of Audit Committee) (aircraft leasing), since August 2006; former Director, Nash Finch Company (food distributor), 2005-2013; former Director, SeaCube Container Leasing Ltd. (container leasing), 2010-2013; and former Director, Travelport Worldwide Limited (travel information technology), 2014-2019 |
Nancy T. Lukitsh
c/o Columbia Management
Investment Advisers, LLC
290 Congress Street
Boston, MA 02210
1956 | Trustee since 2011 | Senior Vice President, Partner and Director of Marketing, Wellington Management Company, LLP (investment adviser), 1997-2010; Chair, Wellington Management Portfolios (commingled non-U.S. investment pools), 2007-2010; Director, Wellington Trust Company, NA and other Wellington affiliates, 1997-2010 | 172 | None |
Columbia North Carolina Intermediate Municipal Bond Fund | Annual Report 2023
| 29 |
TRUSTEES AND OFFICERS (continued)
(Unaudited)
Independent trustees (continued)
Name,
address,
year of birth | Position held
with the Columbia Funds and
length of service | Principal occupation(s)
during past five years
and other relevant
professional experience | Number of
Funds in the
Columbia Funds
Complex*
overseen | Other directorships
held by Trustee
during the past five years
and other relevant Board experience |
David M. Moffett
c/o Columbia Management
Investment Advisers, LLC
290 Congress Street
Boston, MA 02210
1952 | Trustee since 2011 | Retired; former Chief Executive Officer of Freddie Mac and Chief Financial Officer of U.S. Bank | 172 | Director, CSX Corporation (transportation suppliers); Director, PayPal Holdings Inc. (payment and data processing services); Trustee, University of Oklahoma Foundation; former Director, eBay Inc. (online trading community), 2007-2015; and former Director, CIT Bank, CIT Group Inc. (commercial and consumer finance), 2010-2016; former Senior Adviser to The Carlyle Group (financial services), March 2008-September 2008; former Governance Consultant to Bridgewater Associates, January 2013-December 2015 |
Catherine James Paglia
c/o Columbia Management
Investment Advisers, LLC
290 Congress Street
Boston, MA 02210
1952 | Trustee since 2004 | Director, Enterprise Asset Management, Inc. (private real estate and asset management company), since September 1998; Managing Director and Partner, Interlaken Capital, Inc., 1989-1997; Vice President, 1982-1985, Principal, 1985-1987, Managing Director, 1987-1989, Morgan Stanley; Vice President, Investment Banking, 1980-1982, Associate, Investment Banking, 1976-1980, Dean Witter Reynolds, Inc. | 174 | Director, Valmont Industries, Inc. (irrigation systems manufacturer), since 2012; Trustee, Carleton College (on the Investment Committee), since 1987; Trustee, Carnegie Endowment for International Peace (on the Investment Committee), since 2009 |
Natalie A. Trunow
c/o Columbia Management
Investment Advisers, LLC
290 Congress Street
Boston, MA 02210
1967 | Trustee since 2020 | Chief Executive Officer, Millennial Portfolio Solutions LLC (asset management and consulting services), January 2016-January 2021; Non-executive Member of the Investment Committee and Valuation Committee, Sarona Asset Management Inc. (private equity firm) since September 2019; Advisor, Horizon Investments (asset management and consulting services), August 2018-January 2022; Advisor, Paradigm Asset Management, November 2016-January 2022; Consultant to Independent Trustees of CFVIT and CFST I from September 2016 to June 2020 with respect to CFVIT and to December 2020 with respect to CFST I; Director of Investments/Consultant, Casey Family Programs, April 2016-November 2016; Senior Vice President and Chief Investment Officer, Calvert Investments, August 2008-January 2016; Section Head and Portfolio Manager, General Motors Asset Management, June 1997-August 2008 | 172 | Independent Director, Investment Committee, Health Services for Children with Special Needs, Inc., 2010-2021; Independent Director, (Executive Committee and Chair, Audit Committee), Consumer Credit Counseling Services (formerly Guidewell Financial Solutions), since 2016; Independent Director, (Investment Committee), Sarona Asset Management, since 2019 |
| 30 | Columbia North Carolina Intermediate Municipal Bond Fund | Annual Report 2023 |
TRUSTEES AND OFFICERS (continued)
(Unaudited)
Independent trustees (continued)
Name,
address,
year of birth | Position held
with the Columbia Funds and
length of service | Principal occupation(s)
during past five years
and other relevant
professional experience | Number of
Funds in the
Columbia Funds
Complex*
overseen | Other directorships
held by Trustee
during the past five years
and other relevant Board experience |
Sandra L. Yeager
c/o Columbia Management
Investment Advisers, LLC
290 Congress Street
Boston, MA 02210
1964 | Trustee since 2017 | Retired; President and founder, Hanoverian Capital, LLC (SEC registered investment advisor firm), 2008-2016; Managing Director, DuPont Capital, 2006-2008; Managing Director, Morgan Stanley Investment Management, 2004-2006; Senior Vice President, Alliance Bernstein, 1990-2004 | 174 | Former Director, NAPE (National Alliance for Partnerships in Equity) Education Foundation, October 2016-October 2020; Advisory Board, Jennersville YMCA, since 2022 |
Interested trustee affiliated with Investment Manager**
Name,
address,
year of birth | Position held with the Columbia Funds and length of service | Principal occupation(s) during the
past five years and other relevant
professional experience | Number of
Funds in the
Columbia Funds
Complex overseen | Other directorships
held by Trustee
during the past
five years and
other relevant Board experience |
Daniel J. Beckman
c/o Columbia Management
Investment Advisers, LLC
290 Congress Street
Boston, MA 02210
1962 | Trustee since November 2021 and President since June 2021 | Vice President – Head of North America Product, Columbia Management Investment Advisers, LLC, since April 2015; President and Principal Executive Officer of the Columbia Funds, since June 2021; officer of Columbia Funds and affiliated funds, 2020-2021 | 174 | Director, Ameriprise Trust Company, since October 2016; Director, Columbia Management Investment Distributors, Inc. since November 2018; Board of Governors, Columbia Wanger Asset Management, LLC since, January 2022; Director, Columbia Threadneedle Canada, Inc., since December 2022 |
| * | The term “Columbia Funds Complex” as used herein includes Columbia Seligman Premium Technology Growth Fund, Tri-Continental Corporation and each series of Columbia Funds Series Trust (CFST), Columbia Funds Series Trust I (CFST I), Columbia Funds Series Trust II (CFST II), Columbia ETF Trust I (CET I), Columbia ETF Trust II (CET II), Columbia Funds Variable Insurance Trust (CFVIT) and Columbia Funds Variable Series Trust II (CFVST II). Messrs. Batejan, Beckman, Gallagher and Hacker and Mses. Blatz, Carlton, Carrig, Flynn, Paglia, and Yeager serve as directors of Columbia Seligman Premium Technology Growth Fund and Tri-Continental Corporation. |
| ** | Interested person (as defined under the 1940 Act) by reason of being an officer, director, security holder and/or employee of the Investment Manager or Ameriprise Financial. |
The Statement of Additional Information has additional information about the Fund’s Board members and is available, without charge, upon request by calling 800.345.6611, visiting columbiathreadneedleus.com/investor/ or contacting your financial intermediary.
Columbia North Carolina Intermediate Municipal Bond Fund | Annual Report 2023
| 31 |
TRUSTEES AND OFFICERS (continued)
(Unaudited)
The Board has appointed officers who are responsible for day-to-day business decisions based on policies it has established. The officers serve at the pleasure of the Board. The following table provides basic information about the Officers of the Fund as of the printing of this report, including principal occupations during the past five years, although their specific titles may have varied over the period. In addition to Mr. Beckman, who is President and Principal Executive Officer, the Fund’s other officers are:
Fund officers
Name,
address and
year of birth | Position and year
first appointed to
position for any Fund
in the Columbia
Funds Complex or a
predecessor thereof | Principal occupation(s) during past five years |
Michael G. Clarke
290 Congress Street
Boston, MA 02210
1969 | Chief Financial Officer and Principal Financial Officer (2009) and Senior Vice President (2019) | Senior Vice President and Head of North America Operations & Investor Services, Columbia Management Investment Advisers, LLC, since June 2023 (previously Senior Vice President and Head of Global Operations, March 2022 – June 2023, Vice President, Head of North America Operations, and Co-Head of Global Operations, June 2019 - February 2022 and Vice President – Accounting and Tax, May 2010 - May 2019); senior officer of Columbia Funds and affiliated funds, since 2002. |
Joseph Beranek
5890 Ameriprise Financial Center
Minneapolis, MN 55474
1965 | Treasurer and Chief Accounting Officer (Principal Accounting Officer) (2019) and Principal Financial Officer (2020), CFST, CFST I, CFST II, CFVIT and CFVST II; Assistant Treasurer, CET I and CET II | Vice President – Mutual Fund Accounting and Financial Reporting, Columbia Management Investment Advisers, LLC, since December 2018 and March 2017, respectively. |
Marybeth Pilat
290 Congress Street
Boston, MA 02210
1968 | Treasurer and Chief Accounting Officer (Principal Accounting Officer) and Principal Financial Officer (2020) for CET I and CET II; Assistant Treasurer, CFST, CFST I, CFST II, CFVIT and CFVST II | Vice President – Product Pricing and Administration, Columbia Management Investment Advisers, LLC, since May 2017. |
William F. Truscott
290 Congress Street
Boston, MA 02210
1960 | Senior Vice President (2001) | Formerly, Trustee/Director of Columbia Funds Complex or legacy funds, November 2001-January 1, 2021; Chief Executive Officer, Global Asset Management, Ameriprise Financial, Inc., since September 2012; Chairman of the Board and President, Columbia Management Investment Advisers, LLC, since July 2004 and February 2012, respectively; Chairman of the Board and Chief Executive Officer, Columbia Management Investment Distributors, Inc., since November 2008 and February 2012, respectively; Chairman of the Board and Director, Threadneedle Asset Management Holdings, Sàrl, since March 2013 and December 2008, respectively; senior executive of various entities affiliated with Columbia Threadneedle. |
Christopher O. Petersen
5228 Ameriprise Financial Center
Minneapolis, MN 55474
1970 | Senior Vice President and Assistant Secretary (2021) | Formerly, Trustee/Director of funds within the Columbia Funds Complex, July 1, 2020 - November 22, 2021; Senior Vice President and Assistant General Counsel, Ameriprise Financial, Inc., since September 2021 (previously Vice President and Lead Chief Counsel, January 2015 - September 2021); formerly, President and Principal Executive Officer of the Columbia Funds, 2015 - 2021; officer of Columbia Funds and affiliated funds, since 2007. |
Thomas P. McGuire
290 Congress Street
Boston, MA 02210
1972 | Senior Vice President and Chief Compliance Officer (2012) | Vice President – Asset Management Compliance, Ameriprise Financial, Inc., since May 2010; Chief Compliance Officer, Columbia Acorn/Wanger Funds, since December 2015; formerly, Chief Compliance Officer, Ameriprise Certificate Company, September 2010 – September 2020. |
Ryan C. Larrenaga
290 Congress Street
Boston, MA 02210
1970 | Senior Vice President (2017), Chief Legal Officer (2017), and Secretary (2015) | Vice President and Chief Counsel, Ameriprise Financial, Inc., since August 2018 (previously Vice President and Group Counsel, August 2011 - August 2018); Chief Legal Officer, Columbia Acorn/Wanger Funds, since September 2020; officer of Columbia Funds and affiliated funds, since 2005. |
| 32 | Columbia North Carolina Intermediate Municipal Bond Fund | Annual Report 2023 |
TRUSTEES AND OFFICERS (continued)
(Unaudited)
Fund officers (continued)
Name,
address and
year of birth | Position and year
first appointed to
position for any Fund
in the Columbia
Funds Complex or a
predecessor thereof | Principal occupation(s) during past five years |
Michael E. DeFao
290 Congress Street
Boston, MA 02210
1968 | Vice President (2011) and Assistant Secretary (2010) | Vice President and Chief Counsel, Ameriprise Financial, Inc., since May 2010; Vice President, Chief Legal Officer and Assistant Secretary, Columbia Management Investment Advisers, LLC, since October 2021 (previously Vice President and Assistant Secretary, May 2010 – September 2021). |
Lyn Kephart-Strong
5228 Ameriprise Financial Center
Minneapolis, MN 55474
1960 | Vice President (2015) | Vice President, Global Investment Operations Services, Columbia Management Investment Advisers, LLC, since 2010; President, Columbia Management Investment Services Corp., since October 2014; President, Ameriprise Trust Company, since January 2017. |
Liquidity Risk Management Program
(Unaudited)
Pursuant to Rule 22e-4 under the 1940 Act, the Fund has adopted a liquidity risk management program (Program). The Program’s principal objectives include assessing, managing and periodically reviewing the Fund’s liquidity risk. Liquidity risk is defined as the risk that the Fund could not meet redemption requests without significant dilution of remaining investors’ interests in the Fund.
The Board has appointed the Investment Manager as the program administrator for the Fund’s Program. The Investment Manager has delegated oversight of the Program to its Liquidity Risk Management Committee (the Committee). At a board meeting during the fiscal period, the Committee provided the Board with a report addressing the operations of the program and assessing its adequacy and effectiveness of implementation for the period January 1, 2022, through December 31, 2022, including:
| • | the Fund had sufficient liquidity to both meet redemptions and operate effectively on behalf of shareholders; |
| • | there were no material changes to the Program during the period; |
| • | the implementation of the Program was effective to manage the Fund’s liquidity risk; and |
| • | the Program operated adequately during the period. |
There can be no assurance that the Program will achieve its objectives in the future. Please refer to the Fund’s prospectus for more information regarding the Fund’s exposure to liquidity risk and other principal risks to which an investment in the Fund may be subject.
Columbia North Carolina Intermediate Municipal Bond Fund | Annual Report 2023
| 33 |
[THIS PAGE INTENTIONALLY LEFT BLANK]
[THIS PAGE INTENTIONALLY LEFT BLANK]
Columbia North Carolina Intermediate Municipal Bond Fund
P.O. Box 219104
Kansas City, MO 64121-9104
Please read and consider the investment objectives, risks, charges and expenses for any fund carefully before investing. For a prospectus and summary prospectus, which contains this and other important information about the Fund, go to
columbiathreadneedleus.com/investor/. The Fund is distributed by Columbia Management Investment Distributors, Inc., member FINRA, and managed by Columbia Management Investment Advisers, LLC.
Columbia Threadneedle Investments (Columbia Threadneedle) is the global brand name of the Columbia and Threadneedle group of companies. All rights reserved.
© 2023 Columbia Management Investment Advisers, LLC.
columbiathreadneedleus.com/investor/

Annual Report
April 30, 2023
Columbia South Carolina Intermediate Municipal Bond Fund
Not FDIC or NCUA Insured • No Financial Institution Guarantee • May Lose Value
If you elect to receive the shareholder report for Columbia South Carolina Intermediate Municipal Bond Fund (the Fund) in paper, mailed to you, the Fund mails one shareholder report to each shareholder address, unless such shareholder elects to receive shareholder reports from the Fund electronically via e-mail or by having a paper notice mailed to you (Postcard Notice) that your Fund’s shareholder report is available at the Columbia funds’ website (columbiathreadneedleus.com/investor/). If you would like more than one report in paper to be mailed to you, or would like to elect to receive reports via e-mail or access them through Postcard Notice, please call shareholder services at 800.345.6611 and additional reports will be sent to you.
Proxy voting policies and procedures
The policy of the Board of Trustees is to vote the proxies of the companies in which the Fund holds investments consistent with the procedures as stated in the Statement of Additional Information (SAI). You may obtain a copy of the SAI without charge by calling 800.345.6611; contacting your financial intermediary; visiting columbiathreadneedleus.com/investor/; or searching the website of the Securities and Exchange Commission (SEC) at sec.gov. Information regarding how the Fund voted proxies relating to portfolio securities is filed with the SEC by August 31st for the most recent 12-month period ending June 30th of that year, and is available without charge by visiting columbiathreadneedleus.com/investor/, or searching the website of the SEC at sec.gov.
Quarterly schedule of investments
The Fund files a complete schedule of portfolio holdings with the SEC for the first and third quarters of each fiscal year on Form N-PORT. The Fund’s Form N-PORT filings are available on the SEC’s website at sec.gov. The Fund’s complete schedule of portfolio holdings, as filed on Form N-PORT, is available on columbiathreadneedleus.com/investor/ or can also be obtained without charge, upon request, by calling 800.345.6611.
Additional Fund information
For more information about the Fund, please visit columbiathreadneedleus.com/investor/ or call 800.345.6611. Customer Service Representatives are available to answer your questions Monday through Friday from 8 a.m. to 7 p.m. Eastern time.
Fund investment manager
Columbia Management Investment Advisers, LLC (the Investment Manager)
290 Congress Street
Boston, MA 02210
Fund distributor
Columbia Management Investment Distributors, Inc.
290 Congress Street
Boston, MA 02210
Fund transfer agent
Columbia Management Investment Services Corp.
P.O. Box 219104
Kansas City, MO 64121-9104
Columbia South Carolina Intermediate Municipal Bond Fund | Annual Report 2023
Fund at a Glance
(Unaudited)
Investment objective
The Fund seeks current income exempt from U.S. federal income tax and South Carolina individual income tax, consistent with moderate fluctuation of principal.
Portfolio management
Paul Fuchs, CFA
Lead Portfolio Manager
Managed Fund since 2016
Douglas Rangel, CFA
Portfolio Manager
Managed the Fund since June 2022
| Average annual total returns (%) (for the period ended April 30, 2023) |
| | | Inception | 1 Year | 5 Years | 10 Years | |
| Class A | Excluding sales charges | 05/05/92 | 1.23 | 1.15 | 1.18 | |
| | Including sales charges | | -1.85 | 0.53 | 0.87 | |
| Advisor Class | 03/19/13 | 1.48 | 1.40 | 1.44 | |
| Class C | Excluding sales charges | 06/17/92 | 0.59 | 0.42 | 0.44 | |
| | Including sales charges | | -0.40 | 0.42 | 0.44 | |
| Institutional Class | 01/06/92 | 1.59 | 1.42 | 1.45 | |
| Institutional 3 Class* | 03/01/17 | 1.67 | 1.51 | 1.51 | |
| Bloomberg 3-15 Year Blend Municipal Bond Index | | 3.71 | 2.18 | 2.14 | |
Returns for Class A shares are shown with and without the maximum initial sales charge of 3.00%. Returns for Class C shares are shown with and without the 1.00% contingent deferred sales charge for the first year only. The Fund’s other share classes are not subject to sales charges and have limited eligibility. Please see the Fund’s prospectus for details. Performance for different share classes will vary based on differences in sales charges and fees associated with each share class. All results shown assume reinvestment of distributions during the period. Returns do not reflect the deduction of taxes that a shareholder may pay on Fund distributions or on the redemption of Fund shares. Performance results reflect the effect of any fee waivers or reimbursements of Fund expenses by Columbia Management Investment Advisers, LLC and/or any of its affiliates. Absent these fee waivers or expense reimbursement arrangements, performance results would have been lower.
The performance information shown represents past performance and is not a guarantee of future results. The investment return and principal value of your investment will fluctuate so that your shares, when redeemed, may be worth more or less than their original cost. Current performance may be lower or higher than the performance information shown. You may obtain performance information current to the most recent month-end by contacting your financial intermediary, visiting columbiathreadneedleus.com/investor/ or calling 800.345.6611.
| * | The returns shown for periods prior to the share class inception date (including returns for the Life of the Fund, if shown, which are since Fund inception) include the returns of the Fund’s oldest share class. These returns are adjusted to reflect any higher class-related operating expenses of the newer share classes, as applicable. Please visit columbiathreadneedleus.com/investor/investment-products/mutual-funds/appended-performance for more information. |
The Bloomberg 3–15 Year Blend Municipal Bond Index is an unmanaged index that tracks the performance of municipal bonds issued after December 31, 1990, with remaining maturities between 2 and 17 years and at least $7 million in principal amount outstanding.
Indices are not available for investment, are not professionally managed and do not reflect sales charges, fees, brokerage commissions, taxes or other expenses of investing. Securities in the Fund may not match those in an index.
Columbia South Carolina Intermediate Municipal Bond Fund | Annual Report 2023
| 3 |
Fund at a Glance (continued)
(Unaudited)
Performance of a hypothetical $10,000 investment (April 30, 2013 — April 30, 2023)
The chart above shows the change in value of a hypothetical $10,000 investment in Class A shares of Columbia South Carolina Intermediate Municipal Bond Fund during the stated time period, and does not reflect the deduction of taxes that a shareholder may pay on Fund distributions or on the redemption of Fund shares.
| Portfolio breakdown (%) (at April 30, 2023) |
| Money Market Funds | 100.0 |
| Total | 100.0 |
Percentages indicated are based upon total investments excluding investments in derivatives, if any. The Fund’s portfolio composition is subject to change.
| 4 | Columbia South Carolina Intermediate Municipal Bond Fund | Annual Report 2023 |
Manager Discussion of Fund Performance
(Unaudited)
On May 5, 2023, the Fund was liquidated in accordance with the Plan of Liquidation and Termination approved by the Board of Trustees of the Funds.
For the 12-month period that ended April 30, 2023, Class A shares of Columbia South Carolina Intermediate Municipal Bond Fund returned 1.23% excluding sales charges. Institutional Class shares of the Fund returned 1.59%. During the same time period, the Fund’s benchmark, the Bloomberg 3-15 Year Blend Municipal Bond Index, which is national in scope, returned 3.71%.
Market overview
For fixed-income markets, the period was dominated by the U.S. Federal Reserve’s (Fed) efforts to return inflation to its target levels and the resultant dramatic increase in interest rates. Indeed, the Fed ratcheted its targeted federal funds rate higher by 450 basis points, and municipal bond yields followed suit with yields across most of its spectrum of maturities rising as well. (A basis point is 1/100th of a percentage point.) Municipal bond yields peaked in October 2022, however, and subsequently retraced somewhat, returning most segments of the municipal bond market to positive total returns for the period overall. Still, for the period as a whole, yields on one-year and two-year municipal bonds increased 106 basis points and 47 basis points, respectively. Yields on municipal bonds with maturities of less than one year rose even more significantly, driving an inversion of the short-term end of the yield curve for much of the period. Yields for municipal bonds with maturities of between five years and 13 years actually declined modestly, and longer term maturity yields rose only moderately.
Amid these conditions, investor sentiment within the municipal bond market was negative for much of the period. Rising rates and negative total returns through much of 2022 precipitated the largest outflow cycle ever experienced by the municipal bond market. Fund flows then stabilized and slowed into year-end but any optimism around a resumption of inflows in 2023 was quashed as another $6 billion of outflows through the end of April showed investors were still cautious about returning to the market. Consequently, technicals, or supply/demand dynamics, were not favorable within the municipal bond market during the period, largely driven by this lack of demand. Short-term municipal bond funds were not spared the effects of the outflow cycle. However, they were less impacted than their long-term, high-yield and intermediate fund counterparts, as short-term municipal bond funds generally hold more liquid positions, and shorter maturities inherently provide ample cash flow. Supply, or lack thereof during the period, proved a bright spot. Rate volatility coupled with healthy balance sheets sidelined many issuers, with tax-exempt issuance approximately 10% to 15% lower during the period than long-term averages. Not having to contend with an oversupply of new issuance likely buoyed the market as whatever new issues did come to market were well received.
All that said, fundamental factors were broadly supportive of the municipal bond market during the period. Municipal credit health benefited from positive U.S. economic growth, outperformance of tax collections, and strong reserve positions by most state and local governments, owing partly to COVID-19 stimulus policies. Revenue sectors, however, were more mixed. Essential services, such as water & sewer and utilities, held steady, and transportation sectors, such as airports and toll roads, rebounded strongly with increased traffic levels. Public mass transit was the exception, as subway/bus traffic across most major cities remained well below pre-pandemic levels. Fundamental credit health for hospitals and other health care sectors, such as senior living facilities and continuing care retirement communities (CCRCs), was modestly weaker overall. Higher labor costs, lighter balance sheets due to repayment of Medicare acceleration payments and investment market losses served to weaken health care fundamentals as did the full expenditure of any COVID-19 funding. As a whole, higher quality municipal bonds outperformed lower quality securities during the period.
The Fund’s notable detractors during the period
| • | During the second half of the period, the Fund’s below benchmark duration prevented the Fund from fully participating in the sharp turn in interest rates and market rally. As yields declined from November 2022 through April 2023, the Fund’s benchmark returned an impressive 6.52% as the 10-year municipal benchmark yield declined by roughly 80 basis points. |
| • | The Fund’s underweighted allocation to general obligation (GO) bonds detracted from performance as state GOs performed well at the national level. The Fund’s benchmark had a high weighting in state GOs. The strong performance of state GOs at the national level was supported by returns in Illinois state GOs as they benefited from a rating agency upgrade. |
Columbia South Carolina Intermediate Municipal Bond Fund | Annual Report 2023
| 5 |
Manager Discussion of Fund Performance (continued)
(Unaudited)
| • | The Fund’s relative underweighting in state GOs also translated to a shortfall in AA rated issues, as that is where Illinois state GOs fall. As higher quality bonds outperformed during the period, this also served as a detractor to relative performance. |
| • | The Fund’s overweighted allocation, relative to its primary benchmark, in bonds maturing in 0 to 2 years detracted from performance as these shorter term bonds underperformed their longer term counterparts. |
| • | Persistent outflows across the municipal bond market also detracted from Fund performance as the funding of shareholder liquidity required price concessions at times. Related to this, the Fund was liquidated soon after the close of the period due to lack of interest. |
The Fund’s notable contributors during the period
| • | During the first half of the period, the Fund’s below benchmark duration helped to limit price declines. As yields rose from May 2022 through October 2022, the Fund’s benchmark returned -2.64% as the 10-year municipal benchmark yield rose roughly 70 basis points. |
| • | The Fund’s underweighted allocation to bonds maturing in 2 to 8 years and its overweighting to bonds maturing in 8 years or longer contributed positively to performance as longer bonds outperformed shorter bonds during the period. |
| • | The Fund’s largest sector overweight in appropriation bonds was beneficial as this sector produced the highest returns in the national municipal bond market. While attribution does indicate this was a beneficial area to be overweight, we must acknowledge that, at the national level, the strong performance of these bonds in the national market was driven by the rating agency upgrade for New Jersey appropriation bonds. In particular, New Jersey appropriation issues with sub-5% or lower coupons were top performers at the national level. |
Fixed-income securities present issuer default risk. The Fund invests substantially in municipal securities and will be affected by tax, legislative, regulatory, demographic or political changes, as well as changes impacting a state’s financial, economic or other conditions. A relatively small number of tax-exempt issuers may necessitate the Fund investing more heavily in a single issuer and, therefore, be more exposed to the risk of loss than a fund that invests more broadly. The value of the Fund’s portfolio may be more volatile than a more geographically diversified fund. Prepayment and extension risk exists because the timing of payments on a loan, bond or other investment may accelerate when interest rates fall or decelerate when interest rates rise which may reduce investment opportunities and potential returns. A rise in interest rates may result in a price decline of fixed-income instruments held by the Fund, negatively impacting its performance and NAV. Falling rates may result in the Fund investing in lower yielding debt instruments, lowering the Fund’s income and yield. These risks may be heightened for longer maturity and duration securities. Non-investment-grade (high-yield or junk) securities present greater price volatility and more risk to principal and income than higher rated securities. Market risk may affect a single issuer, sector of the economy, industry or the market as a whole. Federal and state tax rules apply to capital gain distributions and any gains or losses on sales. Income may be subject to state or local taxes. Liquidity risk is associated with the difficulty of selling underlying investments at a desirable time or price. See the Fund’s prospectus for more information on these and other risks.
The views expressed in this report reflect the current views of the respective parties who have contributed to this report. These views are not guarantees of future performance and involve certain risks, uncertainties and assumptions that are difficult to predict, so actual outcomes and results may differ significantly from the views expressed. These views are subject to change at any time based upon economic, market or other conditions and the respective parties disclaim any responsibility to update such views. These views may not be relied on as investment advice and, because investment decisions for a Columbia fund are based on numerous factors, may not be relied on as an indication of trading intent on behalf of any particular Columbia fund. References to specific securities should not be construed as a recommendation or investment advice.
| 6 | Columbia South Carolina Intermediate Municipal Bond Fund | Annual Report 2023 |
Understanding Your Fund’s Expenses
(Unaudited)
As an investor, you incur two types of costs. There are shareholder transaction costs, which generally include sales charges on purchases and may include redemption fees. There are also ongoing fund costs, which generally include management fees, distribution and/or service fees, and other fund expenses. The following information is intended to help you understand your ongoing costs (in dollars) of investing in the Fund and to help you compare these costs with the ongoing costs of investing in other mutual funds.
Analyzing your Fund’s expenses
To illustrate these ongoing costs, we have provided examples and calculated the expenses paid by investors in each share class of the Fund during the period. The actual and hypothetical information in the table is based on an initial investment of $1,000 at the beginning of the period indicated and held for the entire period. Expense information is calculated two ways and each method provides you with different information. The amount listed in the “Actual” column is calculated using the Fund’s actual operating expenses and total return for the period. You may use the Actual information, together with the amount invested, to estimate the expenses that you paid over the period. Simply divide your account value by $1,000 (for example, an $8,600 account value divided by $1,000 = 8.6), then multiply the results by the expenses paid during the period under the “Actual” column. The amount listed in the “Hypothetical” column assumes a 5% annual rate of return before expenses (which is not the Fund’s actual return) and then applies the Fund’s actual expense ratio for the period to the hypothetical return. You should not use the hypothetical account values and expenses to estimate either your actual account balance at the end of the period or the expenses you paid during the period. See “Compare with other funds” below for details on how to use the hypothetical data.
Compare with other funds
Since all mutual funds are required to include the same hypothetical calculations about expenses in shareholder reports, you can use this information to compare the ongoing cost of investing in the Fund with other funds. To do so, compare the hypothetical example with the 5% hypothetical examples that appear in the shareholder reports of other funds. As you compare hypothetical examples of other funds, it is important to note that hypothetical examples are meant to highlight the ongoing costs of investing in a fund only and do not reflect any transaction costs, such as sales charges, or redemption or exchange fees. Therefore, the hypothetical calculations are useful in comparing ongoing costs only, and will not help you determine the relative total costs of owning different funds. If transaction costs were included in these calculations, your costs would be higher.
| November 1, 2022 — April 30, 2023 |
| | Account value at the
beginning of the
period ($) | Account value at the
end of the
period ($) | Expenses paid during
the period ($) | Fund’s annualized
expense ratio (%) |
| | Actual | Hypothetical | Actual | Hypothetical | Actual | Hypothetical | Actual |
| Class A | 1,000.00 | 1,000.00 | 1,044.20 | 1,020.55 | 4.06 | 4.01 | 0.81 |
| Advisor Class | 1,000.00 | 1,000.00 | 1,045.40 | 1,021.77 | 2.81 | 2.78 | 0.56 |
| Class C | 1,000.00 | 1,000.00 | 1,040.40 | 1,016.87 | 7.80 | 7.71 | 1.56 |
| Institutional Class | 1,000.00 | 1,000.00 | 1,046.50 | 1,021.77 | 2.81 | 2.78 | 0.56 |
| Institutional 3 Class | 1,000.00 | 1,000.00 | 1,046.90 | 1,022.22 | 2.36 | 2.33 | 0.47 |
Expenses paid during the period are equal to the annualized expense ratio for each class as indicated above, multiplied by the average account value over the period and then multiplied by the number of days in the Fund’s most recent fiscal half year and divided by 365.
Expenses do not include fees and expenses incurred indirectly by the Fund from its investment in underlying funds, including affiliated and non-affiliated pooled investment vehicles, such as mutual funds and exchange-traded funds.
Had Columbia Management Investment Advisers, LLC and/or certain of its affiliates not waived/reimbursed certain fees and expenses, account value at the end of the period would have been reduced.
Columbia South Carolina Intermediate Municipal Bond Fund | Annual Report 2023
| 7 |
Portfolio of Investments
April 30, 2023
(Percentages represent value of investments compared to net assets)
Investments in securities
| Money Market Funds 94.5% |
| | Shares | Value ($) |
| JPMorgan Institutional Tax Free Money Market Fund, Institutional Shares, 3.136%(a) | 54,422,563 | 54,432,104 |
Total Money Market Funds
(Cost $54,432,104) | 54,432,104 |
Total Investments in Securities
(Cost: $54,432,104) | 54,432,104 |
| Other Assets & Liabilities, Net | | 3,173,239 |
| Net Assets | 57,605,343 |
Notes to Portfolio of Investments
| (a) | The rate shown is the seven-day current annualized yield at April 30, 2023. |
Fair value measurements
The Fund categorizes its fair value measurements according to a three-level hierarchy that maximizes the use of observable inputs and minimizes the use of unobservable inputs by prioritizing that the most observable input be used when available. Observable inputs are those that market participants would use in pricing an investment based on market data obtained from sources independent of the reporting entity. Unobservable inputs are those that reflect the Fund’s assumptions about the information market participants would use in pricing an investment. An investment’s level within the fair value hierarchy is based on the lowest level of any input that is deemed significant to the asset’s or liability’s fair value measurement. The input levels are not necessarily an indication of the risk or liquidity associated with investments at that level. For example, certain U.S. government securities are generally high quality and liquid, however, they are reflected as Level 2 because the inputs used to determine fair value may not always be quoted prices in an active market.
Fair value inputs are summarized in the three broad levels listed below:
| ■ | Level 1 — Valuations based on quoted prices for investments in active markets that the Fund has the ability to access at the measurement date. Valuation adjustments are not applied to Level 1 investments. |
| ■ | Level 2 — Valuations based on other significant observable inputs (including quoted prices for similar securities, interest rates, prepayment speeds, credit risks, etc.). |
| ■ | Level 3 — Valuations based on significant unobservable inputs (including the Fund’s own assumptions and judgment in determining the fair value of investments). |
Inputs that are used in determining fair value of an investment may include price information, credit data, volatility statistics, and other factors. These inputs can be either observable or unobservable. The availability of observable inputs can vary between investments, and is affected by various factors such as the type of investment, and the volume and level of activity for that investment or similar investments in the marketplace. The inputs will be considered by the Investment Manager, along with any other relevant factors in the calculation of an investment’s fair value. The Fund uses prices and inputs that are current as of the measurement date, which may include periods of market dislocations. During these periods, the availability of prices and inputs may be reduced for many investments. This condition could cause an investment to be reclassified between the various levels within the hierarchy.
Investments falling into the Level 3 category are primarily supported by quoted prices from brokers and dealers participating in the market for those investments. However, these may be classified as Level 3 investments due to lack of market transparency and corroboration to support these quoted prices. Additionally, valuation models may be used as the pricing source for any remaining investments classified as Level 3. These models may rely on one or more significant unobservable inputs and/or significant assumptions by the Investment Manager. Inputs used in valuations may include, but are not limited to, financial statement analysis, capital account balances, discount rates and estimated cash flows, and comparable company data.
The Fund’s Board of Trustees (the Board) has designated the Investment Manager, through its Valuation Committee (the Committee), as valuation designee, responsible for determining the fair value of the assets of the Fund for which market quotations are not readily available using valuation procedures approved by the Board. The Committee consists of voting and non-voting members from various groups within the Investment Manager’s organization, including operations and accounting, trading and investments, compliance, risk management and legal.
The Committee meets at least monthly to review and approve valuation matters, which may include a description of specific valuation determinations, data regarding pricing information received from approved pricing vendors and brokers and the results of Board-approved valuation policies and procedures (the Policies). The Policies address, among other things, instances when market quotations are or are not readily available, including recommendations of third party pricing vendors and a determination of appropriate pricing methodologies; events that require specific valuation determinations and assessment of fair value techniques; securities with a potential for stale pricing, including those that are illiquid, restricted, or in default; and the effectiveness of third party pricing vendors, including periodic reviews of vendors. The Committee meets more frequently, as needed, to discuss additional valuation matters, which may include the need to review back-testing results, review time-sensitive information or approve related valuation actions. Representatives of Columbia Management Investment Advisers, LLC report to the Board at each of its regularly scheduled meetings to discuss valuation matters and actions during the period, similar to those described earlier.
The accompanying Notes to Financial Statements are an integral part of this statement.
| 8 | Columbia South Carolina Intermediate Municipal Bond Fund | Annual Report 2023 |
Portfolio of Investments (continued)
April 30, 2023
Fair value measurements (continued)
The following table is a summary of the inputs used to value the Fund’s investments at April 30, 2023:
| | Level 1 ($) | Level 2 ($) | Level 3 ($) | Total ($) |
| Investments in Securities | | | | |
| Money Market Funds | 54,432,104 | — | — | 54,432,104 |
| Total Investments in Securities | 54,432,104 | — | — | 54,432,104 |
See the Portfolio of Investments for all investment classifications not indicated in the table.
The accompanying Notes to Financial Statements are an integral part of this statement.
Columbia South Carolina Intermediate Municipal Bond Fund | Annual Report 2023
| 9 |
Statement of Assets and Liabilities
April 30, 2023
| Assets | |
| Investments in securities, at value | |
| Unaffiliated issuers (cost $54,432,104) | $54,432,104 |
| Receivable for: | |
| Investments sold | 3,498,184 |
| Capital shares sold | 54,102 |
| Dividends | 37,196 |
| Interest | 16,274 |
| Expense reimbursement due from Investment Manager | 327 |
| Prepaid expenses | 1,029 |
| Total assets | 58,039,216 |
| Liabilities | |
| Payable for: | |
| Capital shares purchased | 220,076 |
| Distributions to shareholders | 83,413 |
| Management services fees | 744 |
| Distribution and/or service fees | 167 |
| Transfer agent fees | 4,178 |
| Compensation of board members | 106,078 |
| Other expenses | 19,217 |
| Total liabilities | 433,873 |
| Net assets applicable to outstanding capital stock | $57,605,343 |
| Represented by | |
| Paid in capital | 62,099,976 |
| Total distributable earnings (loss) | (4,494,633) |
| Total - representing net assets applicable to outstanding capital stock | $57,605,343 |
| Class A | |
| Net assets | $19,386,763 |
| Shares outstanding | 2,044,605 |
| Net asset value per share | $9.48 |
| Maximum sales charge | 3.00% |
| Maximum offering price per share (calculated by dividing the net asset value per share by 1.0 minus the maximum sales charge for Class A shares) | $9.77 |
| Advisor Class | |
| Net assets | $2,117,719 |
| Shares outstanding | 223,369 |
| Net asset value per share | $9.48 |
| Class C | |
| Net assets | $1,225,715 |
| Shares outstanding | 129,161 |
| Net asset value per share | $9.49 |
| Institutional Class | |
| Net assets | $17,672,832 |
| Shares outstanding | 1,862,929 |
| Net asset value per share | $9.49 |
| Institutional 3 Class | |
| Net assets | $17,202,314 |
| Shares outstanding | 1,807,487 |
| Net asset value per share | $9.52 |
The accompanying Notes to Financial Statements are an integral part of this statement.
| 10 | Columbia South Carolina Intermediate Municipal Bond Fund | Annual Report 2023 |
Statement of Operations
Year Ended April 30, 2023
| Net investment income | |
| Income: | |
| Dividends — unaffiliated issuers | $67,112 |
| Interest | 2,318,314 |
| Total income | 2,385,426 |
| Expenses: | |
| Management services fees | 377,417 |
| Distribution and/or service fees | |
| Class A | 58,039 |
| Class C | 19,586 |
| Transfer agent fees | |
| Class A | 21,292 |
| Advisor Class | 1,741 |
| Class C | 1,791 |
| Institutional Class | 31,695 |
| Institutional 3 Class | 1,350 |
| Compensation of board members | 7,205 |
| Custodian fees | 1,196 |
| Printing and postage fees | 16,056 |
| Registration fees | 5,691 |
| Accounting services fees | 30,090 |
| Legal fees | 13,664 |
| Interest on interfund lending | 140 |
| Compensation of chief compliance officer | 14 |
| Other | 14,412 |
| Total expenses | 601,379 |
| Fees waived or expenses reimbursed by Investment Manager and its affiliates | (102,778) |
| Expense reduction | (20) |
| Total net expenses | 498,581 |
| Net investment income | 1,886,845 |
| Realized and unrealized gain (loss) — net | |
| Net realized gain (loss) on: | |
| Investments — unaffiliated issuers | (3,382,657) |
| Net realized loss | (3,382,657) |
| Net change in unrealized appreciation (depreciation) on: | |
| Investments — unaffiliated issuers | 2,352,449 |
| Net change in unrealized appreciation (depreciation) | 2,352,449 |
| Net realized and unrealized loss | (1,030,208) |
| Net increase in net assets resulting from operations | $856,637 |
The accompanying Notes to Financial Statements are an integral part of this statement.
Columbia South Carolina Intermediate Municipal Bond Fund | Annual Report 2023
| 11 |
Statement of Changes in Net Assets
| | Year Ended
April 30, 2023 | Year Ended
April 30, 2022 |
| Operations | | |
| Net investment income | $1,886,845 | $2,170,203 |
| Net realized loss | (3,382,657) | (534,992) |
| Net change in unrealized appreciation (depreciation) | 2,352,449 | (8,912,527) |
| Net increase (decrease) in net assets resulting from operations | 856,637 | (7,277,316) |
| Distributions to shareholders | | |
| Net investment income and net realized gains | | |
| Class A | (504,970) | (520,262) |
| Advisor Class | (45,849) | (45,827) |
| Class C | (28,000) | (26,727) |
| Institutional Class | (791,329) | (1,439,379) |
| Institutional 3 Class | (504,335) | (168,740) |
| Total distributions to shareholders | (1,874,483) | (2,200,935) |
| Decrease in net assets from capital stock activity | (40,184,105) | (10,767,276) |
| Total decrease in net assets | (41,201,951) | (20,245,527) |
| Net assets at beginning of year | 98,807,294 | 119,052,821 |
| Net assets at end of year | $57,605,343 | $98,807,294 |
| | Year Ended | Year Ended |
| | April 30, 2023 | April 30, 2022 |
| | Shares | Dollars ($) | Shares | Dollars ($) |
| Capital stock activity |
| Class A | | | | |
| Subscriptions | 716,015 | 6,798,309 | 258,794 | 2,666,032 |
| Distributions reinvested | 42,233 | 399,635 | 41,737 | 426,534 |
| Redemptions | (1,169,474) | (11,089,931) | (788,960) | (7,813,969) |
| Net decrease | (411,226) | (3,891,987) | (488,429) | (4,721,403) |
| Advisor Class | | | | |
| Subscriptions | 118,774 | 1,126,056 | 57,754 | 591,974 |
| Distributions reinvested | 4,821 | 45,629 | 4,458 | 45,633 |
| Redemptions | (30,522) | (290,323) | (223,370) | (2,250,609) |
| Net increase (decrease) | 93,073 | 881,362 | (161,158) | (1,613,002) |
| Class C | | | | |
| Subscriptions | 22,262 | 206,754 | 36,902 | 384,262 |
| Distributions reinvested | 2,846 | 26,952 | 2,474 | 25,287 |
| Redemptions | (152,431) | (1,446,626) | (64,961) | (670,935) |
| Net decrease | (127,323) | (1,212,920) | (25,585) | (261,386) |
| Institutional Class | | | | |
| Subscriptions | 435,703 | 4,197,999 | 789,145 | 8,118,864 |
| Distributions reinvested | 46,873 | 443,768 | 39,612 | 404,088 |
| Redemptions | (5,274,430) | (50,293,796) | (1,356,340) | (13,702,244) |
| Net decrease | (4,791,854) | (45,652,029) | (527,583) | (5,179,292) |
| Institutional 3 Class | | | | |
| Subscriptions | 3,561,276 | 34,023,159 | 260,869 | 2,669,058 |
| Distributions reinvested | 7,794 | 74,061 | 6,527 | 66,969 |
| Redemptions | (2,587,181) | (24,405,751) | (168,873) | (1,728,220) |
| Net increase | 981,889 | 9,691,469 | 98,523 | 1,007,807 |
| Total net decrease | (4,255,441) | (40,184,105) | (1,104,232) | (10,767,276) |
The accompanying Notes to Financial Statements are an integral part of this statement.
| 12 | Columbia South Carolina Intermediate Municipal Bond Fund | Annual Report 2023 |
[THIS PAGE INTENTIONALLY LEFT BLANK]
Columbia South Carolina Intermediate Municipal Bond Fund | Annual Report 2023
| 13 |
The following table is intended to help you understand the Fund’s financial performance. Certain information reflects financial results for a single share of a class held for the periods shown. Per share net investment income (loss) amounts are calculated based on average shares outstanding during the period. Total return assumes reinvestment of all dividends and distributions, if any. Total return does not reflect payment of sales charges, if any. Total return and portfolio turnover are not annualized for periods of less than one year. The ratios of expenses and net investment income are annualized for periods of less than one year. The portfolio turnover rate is calculated without regard to purchase and sales transactions of short-term instruments and certain derivatives, if any. If such transactions were included, the Fund’s portfolio turnover rate may be higher.
| | Net asset value,
beginning of
period | Net
investment
income | Net
realized
and
unrealized
gain (loss) | Total from
investment
operations | Distributions
from net
investment
income | Total
distributions to
shareholders |
| Class A |
| Year Ended 4/30/2023 | $9.57 | 0.21 | (0.09) | 0.12 | (0.21) | (0.21) |
| Year Ended 4/30/2022 | $10.41 | 0.17 | (0.83) | (0.66) | (0.18) | (0.18) |
| Year Ended 4/30/2021 | $10.09 | 0.19 | 0.32 | 0.51 | (0.19) | (0.19) |
| Year Ended 4/30/2020 | $10.17 | 0.22 | (0.07) | 0.15 | (0.23) | (0.23) |
| Year Ended 4/30/2019 | $9.94 | 0.24 | 0.24 | 0.48 | (0.25) | (0.25) |
| Advisor Class |
| Year Ended 4/30/2023 | $9.57 | 0.23 | (0.09) | 0.14 | (0.23) | (0.23) |
| Year Ended 4/30/2022 | $10.41 | 0.20 | (0.84) | (0.64) | (0.20) | (0.20) |
| Year Ended 4/30/2021 | $10.09 | 0.21 | 0.32 | 0.53 | (0.21) | (0.21) |
| Year Ended 4/30/2020 | $10.16 | 0.25 | (0.06) | 0.19 | (0.26) | (0.26) |
| Year Ended 4/30/2019 | $9.94 | 0.26 | 0.24 | 0.50 | (0.28) | (0.28) |
| Class C |
| Year Ended 4/30/2023 | $9.57 | 0.14 | (0.08) | 0.06 | (0.14) | (0.14) |
| Year Ended 4/30/2022 | $10.42 | 0.10 | (0.85) | (0.75) | (0.10) | (0.10) |
| Year Ended 4/30/2021 | $10.10 | 0.11 | 0.32 | 0.43 | (0.11) | (0.11) |
| Year Ended 4/30/2020 | $10.17 | 0.15 | (0.07) | 0.08 | (0.15) | (0.15) |
| Year Ended 4/30/2019 | $9.94 | 0.16 | 0.25 | 0.41 | (0.18) | (0.18) |
| Institutional Class |
| Year Ended 4/30/2023 | $9.57 | 0.23 | (0.08) | 0.15 | (0.23) | (0.23) |
| Year Ended 4/30/2022 | $10.42 | 0.20 | (0.85) | (0.65) | (0.20) | (0.20) |
| Year Ended 4/30/2021 | $10.09 | 0.21 | 0.33 | 0.54 | (0.21) | (0.21) |
| Year Ended 4/30/2020 | $10.17 | 0.25 | (0.07) | 0.18 | (0.26) | (0.26) |
| Year Ended 4/30/2019 | $9.94 | 0.26 | 0.25 | 0.51 | (0.28) | (0.28) |
| Institutional 3 Class |
| Year Ended 4/30/2023 | $9.60 | 0.24 | (0.08) | 0.16 | (0.24) | (0.24) |
| Year Ended 4/30/2022 | $10.45 | 0.21 | (0.85) | (0.64) | (0.21) | (0.21) |
| Year Ended 4/30/2021 | $10.13 | 0.23 | 0.32 | 0.55 | (0.23) | (0.23) |
| Year Ended 4/30/2020 | $10.21 | 0.26 | (0.07) | 0.19 | (0.27) | (0.27) |
| Year Ended 4/30/2019 | $9.98 | 0.27 | 0.25 | 0.52 | (0.29) | (0.29) |
| Notes to Financial Highlights |
| (a) | In addition to the fees and expenses that the Fund bears directly, the Fund indirectly bears a pro rata share of the fees and expenses of any other funds in which it invests. Such indirect expenses are not included in the Fund’s reported expense ratios. |
| (b) | Total net expenses include the impact of certain fee waivers/expense reimbursements made by the Investment Manager and certain of its affiliates, if applicable. |
| (c) | Ratios include interfund lending expense which is less than 0.01%. |
| (d) | The benefits derived from expense reductions had an impact of less than 0.01%. |
The accompanying Notes to Financial Statements are an integral part of this statement.
| 14 | Columbia South Carolina Intermediate Municipal Bond Fund | Annual Report 2023 |
Financial Highlights (continued)
| | Net
asset
value,
end of
period | Total
return | Total gross
expense
ratio to
average
net assets(a) | Total net
expense
ratio to
average
net assets(a),(b) | Net investment
income
ratio to
average
net assets | Portfolio
turnover | Net
assets,
end of
period
(000’s) |
| Class A |
| Year Ended 4/30/2023 | $9.48 | 1.23% | 0.93%(c) | 0.79%(c),(d) | 2.19% | 5% | $19,387 |
| Year Ended 4/30/2022 | $9.57 | (6.47%) | 0.92%(c) | 0.80%(c),(d) | 1.70% | 13% | $23,491 |
| Year Ended 4/30/2021 | $10.41 | 5.05% | 0.95% | 0.81%(d) | 1.80% | 10% | $30,657 |
| Year Ended 4/30/2020 | $10.09 | 1.46% | 0.91% | 0.81%(d) | 2.15% | 9% | $24,421 |
| Year Ended 4/30/2019 | $10.17 | 4.93% | 0.93% | 0.81%(d) | 2.37% | 9% | $21,999 |
| Advisor Class |
| Year Ended 4/30/2023 | $9.48 | 1.48% | 0.68%(c) | 0.55%(c),(d) | 2.46% | 5% | $2,118 |
| Year Ended 4/30/2022 | $9.57 | (6.24%) | 0.67%(c) | 0.55%(c),(d) | 1.93% | 13% | $1,246 |
| Year Ended 4/30/2021 | $10.41 | 5.31% | 0.70% | 0.56%(d) | 2.05% | 10% | $3,034 |
| Year Ended 4/30/2020 | $10.09 | 1.82% | 0.65% | 0.56%(d) | 2.40% | 9% | $2,322 |
| Year Ended 4/30/2019 | $10.16 | 5.09% | 0.68% | 0.56%(d) | 2.62% | 9% | $1,854 |
| Class C |
| Year Ended 4/30/2023 | $9.49 | 0.59% | 1.67%(c) | 1.54%(c),(d) | 1.42% | 5% | $1,226 |
| Year Ended 4/30/2022 | $9.57 | (7.26%) | 1.67%(c) | 1.55%(c),(d) | 0.95% | 13% | $2,456 |
| Year Ended 4/30/2021 | $10.42 | 4.26% | 1.70% | 1.56%(d) | 1.07% | 10% | $2,940 |
| Year Ended 4/30/2020 | $10.10 | 0.80% | 1.66% | 1.56%(d) | 1.41% | 9% | $5,039 |
| Year Ended 4/30/2019 | $10.17 | 4.14% | 1.68% | 1.56%(d) | 1.62% | 9% | $8,669 |
| Institutional Class |
| Year Ended 4/30/2023 | $9.49 | 1.59% | 0.65%(c) | 0.54%(c),(d) | 2.38% | 5% | $17,673 |
| Year Ended 4/30/2022 | $9.57 | (6.32%) | 0.67%(c) | 0.55%(c),(d) | 1.95% | 13% | $63,686 |
| Year Ended 4/30/2021 | $10.42 | 5.41% | 0.70% | 0.56%(d) | 2.05% | 10% | $74,822 |
| Year Ended 4/30/2020 | $10.09 | 1.72% | 0.66% | 0.56%(d) | 2.40% | 9% | $69,733 |
| Year Ended 4/30/2019 | $10.17 | 5.19% | 0.68% | 0.56%(d) | 2.62% | 9% | $70,343 |
| Institutional 3 Class |
| Year Ended 4/30/2023 | $9.52 | 1.67% | 0.62%(c) | 0.46%(c) | 2.57% | 5% | $17,202 |
| Year Ended 4/30/2022 | $9.60 | (6.20%) | 0.56%(c) | 0.45%(c) | 2.05% | 13% | $7,928 |
| Year Ended 4/30/2021 | $10.45 | 5.42% | 0.59% | 0.45% | 2.16% | 10% | $7,600 |
| Year Ended 4/30/2020 | $10.13 | 1.83% | 0.53% | 0.45% | 2.50% | 9% | $5,913 |
| Year Ended 4/30/2019 | $10.21 | 5.30% | 0.57% | 0.45% | 2.73% | 9% | $852 |
The accompanying Notes to Financial Statements are an integral part of this statement.
Columbia South Carolina Intermediate Municipal Bond Fund | Annual Report 2023
| 15 |
Notes to Financial Statements
April 30, 2023
Note 1. Organization
Columbia South Carolina Intermediate Municipal Bond Fund (the Fund), a series of Columbia Funds Series Trust (the Trust), is a diversified fund. The Trust is registered under the Investment Company Act of 1940, as amended (the 1940 Act), as an open-end management investment company organized as a Delaware statutory trust.
Fund shares
The Trust may issue an unlimited number of shares (without par value). The Fund offers each of the share classes listed in the Statement of Assets and Liabilities. Although all share classes generally have identical voting, dividend and liquidation rights, each share class votes separately when required by the Trust’s organizational documents or by law. Each share class has its own expense and sales charge structure. Different share classes may have different minimum initial investment amounts and pay different net investment income distribution amounts to the extent the expenses of distributing such share classes vary. Distributions to shareholders in a liquidation will be proportional to the net asset value of each share class.
As described in the Fund’s prospectus, Class A and Class C shares are offered to the general public for investment. Class C shares automatically convert to Class A shares after 8 years. Advisor Class, Institutional Class and Institutional 3 Class shares are available through authorized investment professionals to omnibus retirement plans or to institutional investors and to certain other investors as also described in the Fund’s prospectus.
The Board of Trustees of the Fund approved a Plan of Liquidation and Termination pursuant to which the Fund was liquidated and terminated. Effective at the open of business on April 14, 2023, the Fund was closed to new investors, and any applicable contingent deferred sales charges were waived on redemptions and exchanges out of the Fund. The Fund was liquidated on May 5, 2023, at which time the Fund’s shareholders received a liquidating distribution in an amount equal to the net asset value of their Fund shares.
Note 2. Summary of significant accounting policies
Basis of preparation
The Fund is an investment company that applies the accounting and reporting guidance in the Financial Accounting Standards Board (FASB) Accounting Standards Codification Topic 946, Financial Services - Investment Companies (ASC 946). The financial statements are prepared in accordance with U.S. generally accepted accounting principles (GAAP), which requires management to make certain estimates and assumptions that affect the reported amounts of assets and liabilities, the disclosure of contingent assets and liabilities at the date of the financial statements and the reported amounts of income and expenses during the reporting period. Actual results could differ from those estimates.
The following is a summary of significant accounting policies followed by the Fund in the preparation of its financial statements.
Security valuation
Investments in open-end investment companies (other than exchange-traded funds (ETFs)), are valued at the latest net asset value reported by those companies as of the valuation time.
Investments for which market quotations are not readily available, or that have quotations which management believes are not reflective of market value or reliable, are valued at fair value as determined in good faith under procedures approved by the Board of Trustees. If a security or class of securities (such as foreign securities) is valued at fair value, such value is likely to be different from the quoted or published price for the security, if available.
The determination of fair value often requires significant judgment. To determine fair value, management may use assumptions including but not limited to future cash flows and estimated risk premiums. Multiple inputs from various sources may be used to determine fair value.
GAAP requires disclosure regarding the inputs and valuation techniques used to measure fair value and any changes in valuation inputs or techniques. In addition, investments shall be disclosed by major category. This information is disclosed following the Fund’s Portfolio of Investments.
| 16 | Columbia South Carolina Intermediate Municipal Bond Fund | Annual Report 2023 |
Notes to Financial Statements (continued)
April 30, 2023
Security transactions
Security transactions are accounted for on the trade date. Cost is determined and gains (losses) are based upon the specific identification method for both financial statement and federal income tax purposes.
Income recognition
Interest income is recorded on an accrual basis. Market premiums and discounts, including original issue discounts, are amortized and accreted, respectively, over the expected life of the security on all debt securities, unless otherwise noted.
The Fund may place a debt security on non-accrual status and reduce related interest income when it becomes probable that the interest will not be collected and the amount of uncollectible interest can be reasonably estimated. The Fund may also adjust accrual rates when it becomes probable the full interest will not be collected and a partial payment will be received. A defaulted debt security is removed from non-accrual status when the issuer resumes interest payments or when collectability of interest is reasonably assured.
Dividend income is recorded on the ex-dividend date.
Expenses
General expenses of the Trust are allocated to the Fund and other funds of the Trust based upon relative net assets or other expense allocation methodologies determined by the nature of the expense. Expenses directly attributable to the Fund are charged to the Fund. Expenses directly attributable to a specific class of shares are charged to that share class.
Determination of class net asset value
All income, expenses (other than class-specific expenses, which are charged to that share class, as shown in the Statement of Operations) and realized and unrealized gains (losses) are allocated to each class of the Fund on a daily basis, based on the relative net assets of each class, for purposes of determining the net asset value of each class.
Federal income tax status
The Fund intends to qualify each year as a regulated investment company under Subchapter M of the Internal Revenue Code, as amended, and will distribute substantially all of its net tax-exempt and investment company taxable income and net capital gain, if any, for its tax year, and as such will not be subject to federal income taxes. In addition, the Fund intends to distribute in each calendar year substantially all of its ordinary income, capital gain net income and certain other amounts, if any, such that the Fund should not be subject to federal excise tax. Therefore, no federal income or excise tax provision is recorded.
Distributions to shareholders
Distributions from net investment income, if any, are declared daily and paid monthly. Net realized capital gains, if any, are distributed at least annually. Income distributions and capital gain distributions are determined in accordance with federal income tax regulations, which may differ from GAAP.
Guarantees and indemnifications
Under the Trust’s organizational documents and, in some cases, by contract, its officers and trustees are indemnified against certain liabilities arising out of the performance of their duties to the Trust or its funds. In addition, certain of the Fund’s contracts with its service providers contain general indemnification clauses. The Fund’s maximum exposure under these arrangements is unknown since the amount of any future claims that may be made against the Fund cannot be determined, and the Fund has no historical basis for predicting the likelihood of any such claims.
Recent accounting pronouncement
Tailored Shareholder Reports
In October 2022, the Securities and Exchange Commission (SEC) adopted a final rule relating to Tailored Shareholder Reports for Mutual Funds and Exchange-Traded Funds; Fee Information in Investment Company Advertisements. The rule and form amendments will, among other things, require the Fund to transmit concise and visually engaging shareholder reports
Columbia South Carolina Intermediate Municipal Bond Fund | Annual Report 2023
| 17 |
Notes to Financial Statements (continued)
April 30, 2023
that highlight key information. The amendments will require that funds tag information in a structured data format and that certain more in-depth information be made available online and available for delivery free of charge to investors on request. The amendments became effective January 24, 2023. There is an 18-month transition period after the effective date of the amendment.
Note 3. Fees and other transactions with affiliates
Management services fees
The Fund has entered into a Management Agreement with Columbia Management Investment Advisers, LLC (the Investment Manager), a wholly-owned subsidiary of Ameriprise Financial, Inc. (Ameriprise Financial). Under the Management Agreement, the Investment Manager provides the Fund with investment research and advice, as well as administrative and accounting services. The management services fee is an annual fee that is equal to a percentage of the Fund’s daily net assets that declines from 0.47% to 0.31% as the Fund’s net assets increase. The effective management services fee rate for the year ended April 30, 2023 was 0.47% of the Fund’s average daily net assets.
Compensation of board members
Members of the Board of Trustees who are not officers or employees of the Investment Manager or Ameriprise Financial are compensated for their services to the Fund as disclosed in the Statement of Operations. Under a Deferred Compensation Plan (the Deferred Plan), these members of the Board of Trustees may elect to defer payment of up to 100% of their compensation. Deferred amounts are treated as though equivalent dollar amounts had been invested in shares of certain funds managed by the Investment Manager. The Fund’s liability for these amounts is adjusted for market value changes and remains in the Fund until distributed in accordance with the Deferred Plan. All amounts payable under the Deferred Plan constitute a general unsecured obligation of the Fund. The expense for the Deferred Plan, which includes Trustees’ fees deferred during the current period as well as any gains or losses on the Trustees’ deferred compensation balances as a result of market fluctuations, is included in "Compensation of board members" in the Statement of Operations.
Compensation of Chief Compliance Officer
The Board of Trustees has appointed a Chief Compliance Officer for the Fund in accordance with federal securities regulations. As disclosed in the Statement of Operations, a portion of the Chief Compliance Officer’s total compensation is allocated to the Fund, along with other allocations to affiliated registered investment companies managed by the Investment Manager and its affiliates, based on relative net assets.
Transfer agency fees
Under a Transfer and Dividend Disbursing Agent Agreement, Columbia Management Investment Services Corp. (the Transfer Agent), an affiliate of the Investment Manager and a wholly-owned subsidiary of Ameriprise Financial, is responsible for providing transfer agency services to the Fund. The Transfer Agent has contracted with SS&C GIDS, Inc. (SS&C GIDS) to serve as sub-transfer agent. Prior to January 1, 2023, SS&C GIDS was known as DST Asset Manager Solutions, Inc. The Transfer Agent pays the fees of SS&C GIDS for services as sub-transfer agent and SS&C GIDS is not entitled to reimbursement for such fees from the Fund (with the exception of out-of-pocket fees).
The Fund pays the Transfer Agent a monthly transfer agency fee based on the number or the average value of accounts, depending on the type of account. In addition, the Fund pays the Transfer Agent a fee for shareholder services based on the number of accounts or on a percentage of the average aggregate value of the Fund’s shares maintained in omnibus accounts up to the lesser of the amount charged by the financial intermediary or a cap established by the Board of Trustees from time to time.
The Transfer Agent also receives compensation from the Fund for various shareholder services and reimbursements for certain out-of-pocket fees. Total transfer agency fees for Institutional 3 Class shares are subject to an annual limitation of not more than 0.02% of the average daily net assets attributable to Institutional 3 Class shares.
| 18 | Columbia South Carolina Intermediate Municipal Bond Fund | Annual Report 2023 |
Notes to Financial Statements (continued)
April 30, 2023
For the year ended April 30, 2023, the Fund’s effective transfer agency fee rates as a percentage of average daily net assets of each class were as follows:
| | Effective rate (%) |
| Class A | 0.09 |
| Advisor Class | 0.09 |
| Class C | 0.09 |
| Institutional Class | 0.09 |
| Institutional 3 Class | 0.01 |
An annual minimum account balance fee of $20 may apply to certain accounts with a value below the applicable share class’s initial minimum investment requirements to reduce the impact of small accounts on transfer agency fees. These minimum account balance fees are remitted to the Fund and recorded as part of expense reductions in the Statement of Operations. For the year ended April 30, 2023, these minimum account balance fees reduced total expenses of the Fund by $20.
Distribution and service fees
The Fund has entered into an agreement with Columbia Management Investment Distributors, Inc. (the Distributor), an affiliate of the Investment Manager and a wholly-owned subsidiary of Ameriprise Financial, for distribution and shareholder services. The Board of Trustees has approved, and the Fund has adopted, distribution and shareholder service plans (the Plans) applicable to certain share classes, which set the distribution and service fees for the Fund. These fees are calculated daily and are intended to compensate the Distributor and/or eligible selling and/or servicing agents for selling shares of the Fund and providing services to investors.
Under the Plans, the Fund pays a monthly combined distribution and service fee to the Distributor at the maximum annual rate of 0.25% of the average daily net assets attributable to Class A shares of the Fund. Also under the Plans, the Fund pays a monthly service fee to the Distributor at the maximum annual rate of 0.25% of the average daily net assets attributable to Class C shares of the Fund and a monthly distribution fee to the Distributor at the maximum annual rate of 0.75% of the average daily net assets attributable to Class C shares of the Fund.
Sales charges (unaudited)
Sales charges, including front-end charges and contingent deferred sales charges (CDSCs), received by the Distributor for distributing Fund shares for the year ended April 30, 2023, if any, are listed below:
| | Front End (%) | CDSC (%) | Amount ($) |
| Class A | 3.00 | 0.75(a) | 2,858 |
| Class C | — | 1.00(b) | — |
| (a) | This charge is imposed on certain investments of $500,000 or more if redeemed within 12 months after purchase. |
| (b) | This charge applies to redemptions within 12 months after purchase, with certain limited exceptions. |
The Fund’s other share classes are not subject to sales charges.
Columbia South Carolina Intermediate Municipal Bond Fund | Annual Report 2023
| 19 |
Notes to Financial Statements (continued)
April 30, 2023
Expenses waived/reimbursed by the Investment Manager and its affiliates
The Investment Manager and certain of its affiliates have contractually agreed to waive fees and/or reimburse expenses (excluding certain fees and expenses described below) for the period(s) disclosed below, unless sooner terminated at the sole discretion of the Board of Trustees, so that the Fund’s net operating expenses, after giving effect to fees waived/expenses reimbursed and any balance credits and/or overdraft charges from the Fund’s custodian, do not exceed the following annual rate(s) as a percentage of the classes’ average daily net assets:
| | September 1, 2022
through
August 31, 2023 | Prior to
September 1, 2022 |
| Class A | 0.81% | 0.81% |
| Advisor Class | 0.56 | 0.56 |
| Class C | 1.56 | 1.56 |
| Institutional Class | 0.56 | 0.56 |
| Institutional 3 Class | 0.47 | 0.45 |
Under the agreement governing these fee waivers and/or expense reimbursement arrangements, the following fees and expenses are excluded from the waiver/reimbursement commitment, and therefore will be paid by the Fund, if applicable: taxes (including foreign transaction taxes), expenses associated with investments in affiliated and non-affiliated pooled investment vehicles (including mutual funds and exchange-traded funds), transaction costs and brokerage commissions, costs related to any securities lending program, dividend expenses associated with securities sold short, inverse floater program fees and expenses, transaction charges and interest on borrowed money, interest, costs associated with shareholder meetings, infrequent and/or unusual expenses and any other expenses the exclusion of which is specifically approved by the Board of Trustees. This agreement may be modified or amended only with approval from the Investment Manager, certain of its affiliates and the Fund. In addition to the contractual agreement, the Investment Manager and certain of its affiliates have voluntarily agreed to waive fees and/or reimburse Fund expenses (excluding certain fees and expenses described above) so that Fund level expenses (expenses directly attributable to the Fund and not to a specific share class) are waived proportionately across all share classes. This arrangement may be revised or discontinued at any time. Any fees waived and/or expenses reimbursed under the expense reimbursement arrangements described above are not recoverable by the Investment Manager or its affiliates in future periods.
Note 4. Federal tax information
The timing and character of income and capital gain distributions are determined in accordance with income tax regulations, which may differ from GAAP because of temporary or permanent book to tax differences.
At April 30, 2023, these differences were primarily due to differing treatment for capital loss carryforwards, trustees’ deferred compensation, distributions and re-characterization of distributions for investments. To the extent these differences were permanent, reclassifications were made among the components of the Fund’s net assets. Temporary differences do not require reclassifications.
The following reclassifications were made:
Excess of distributions
over net investment
income ($) | Accumulated
net realized
(loss) ($) | Paid in
capital ($) |
| (1) | 1 | — |
Net investment income (loss) and net realized gains (losses), as disclosed in the Statement of Operations, and net assets were not affected by this reclassification.
| 20 | Columbia South Carolina Intermediate Municipal Bond Fund | Annual Report 2023 |
Notes to Financial Statements (continued)
April 30, 2023
The tax character of distributions paid during the years indicated was as follows:
| Year Ended April 30, 2023 | Year Ended April 30, 2022 |
Ordinary
income ($) | Tax-exempt
income ($) | Long-term
capital gains ($) | Total ($) | Ordinary
income ($) | Tax-exempt
income ($) | Long-term
capital gains ($) | Total ($) |
| 1,126 | 1,873,357 | — | 1,874,483 | 106 | 2,200,829 | — | 2,200,935 |
Short-term capital gain distributions, if any, are considered ordinary income distributions for tax purposes.
At April 30, 2023, the components of distributable earnings on a tax basis were as follows:
Undistributed
ordinary income ($) | Undistributed tax-
exempt income ($) | Undistributed
long-term
capital gains ($) | Capital loss
carryforwards ($) | Net unrealized
appreciation ($) |
| — | 140,502 | — | (4,446,864) | — |
At April 30, 2023, the cost of all investments for federal income tax purposes along with the aggregate gross unrealized appreciation and depreciation based on that cost was:
Federal
tax cost ($) | Gross unrealized
appreciation ($) | Gross unrealized
(depreciation) ($) | Net unrealized
appreciation ($) |
| 54,432,104 | — | — | — |
Tax cost of investments and unrealized appreciation/(depreciation) may also include timing differences that do not constitute adjustments to tax basis.
The following capital loss carryforwards, determined at April 30, 2023, may be available to reduce future net realized gains on investments, if any, to the extent permitted by the Internal Revenue Code. In addition, for the year ended April 30, 2023, capital loss carryforwards utilized, if any, were as follows:
No expiration
short-term ($) | No expiration
long-term ($) | Total ($) | Utilized ($) |
| (985,130) | (3,461,734) | (4,446,864) | — |
Management of the Fund has concluded that there are no significant uncertain tax positions in the Fund that would require recognition in the financial statements. However, management’s conclusion may be subject to review and adjustment at a later date based on factors including, but not limited to, new tax laws, regulations, and administrative interpretations (including relevant court decisions). Generally, the Fund’s federal tax returns for the prior three fiscal years remain subject to examination by the Internal Revenue Service.
Note 5. Portfolio information
The cost of purchases and proceeds from sales of securities, excluding short-term investments and derivatives, if any, aggregated to $3,705,275 and $99,288,072, respectively, for the year ended April 30, 2023. The amount of purchase and sale activity impacts the portfolio turnover rate reported in the Financial Highlights.
Note 6. Interfund lending
Pursuant to an exemptive order granted by the Securities and Exchange Commission, the Fund participates in a program (the Interfund Program) allowing each participating Columbia Fund (each, a Participating Fund) to lend money directly to and, except for closed-end funds and money market funds, borrow money directly from other Participating Funds for temporary purposes. The amounts eligible for borrowing and lending under the Interfund Program are subject to certain restrictions.
Interfund loans are subject to the risk that the borrowing fund could be unable to repay the loan when due, and a delay in repayment to the lending fund could result in lost opportunities and/or additional lending costs. The exemptive order is subject to conditions intended to mitigate conflicts of interest arising from the Investment Manager’s relationship with each Participating Fund.
Columbia South Carolina Intermediate Municipal Bond Fund | Annual Report 2023
| 21 |
Notes to Financial Statements (continued)
April 30, 2023
The Fund’s activity in the Interfund Program during the year ended April 30, 2023 was as follows:
| Borrower or lender | Average loan
balance ($) | Weighted average
interest rate (%) | Number of days
with outstanding loans |
| Borrower | 600,000 | 4.21 | 2 |
Interest expense incurred by the Fund is recorded as Interfund lending in the Statement of Operations. The Fund had no outstanding interfund loans at April 30, 2023.
Note 7. Line of credit
The Fund has access to a revolving credit facility with a syndicate of banks led by JPMorgan Chase Bank, N.A., Citibank, N.A. and Wells Fargo Bank, N.A. whereby the Fund may borrow for the temporary funding of shareholder redemptions or for other temporary or emergency purposes. Pursuant to an October 27, 2022 amendment and restatement, the credit facility, which is an agreement between the Fund and certain other funds managed by the Investment Manager or an affiliated investment manager, severally and not jointly, permits aggregate borrowings up to $950 million. Interest is currently charged to each participating fund based on its borrowings at a rate equal to the higher of (i) the federal funds effective rate, (ii) the secured overnight financing rate plus 0.10% and (iii) the overnight bank funding rate, plus in each case, 1.00%. Each borrowing under the credit facility matures no later than 60 days after the date of borrowing. The Fund also pays a commitment fee equal to its pro rata share of the unused amount of the credit facility at a rate of 0.15% per annum. The commitment fee is included in other expenses in the Statement of Operations. This agreement expires annually in October unless extended or renewed. Prior to the October 27, 2022 amendment and restatement, the Fund had access to a revolving credit facility with a syndicate of banks led by JPMorgan Chase Bank, N.A., Citibank, N.A. and Wells Fargo Bank, N.A. which permitted collective borrowings up to $950 million. Interest was charged to each participating fund based on its borrowings at a rate equal to the higher of (i) the federal funds effective rate, (ii) the secured overnight financing rate plus 0.11448% and (iii) the overnight bank funding rate, plus in each case, 1.00%.
The Fund had no borrowings during the year ended April 30, 2023.
Note 8. Significant risks
Market risk
The Fund may incur losses due to declines in the value of one or more securities in which it invests. These declines may be due to factors affecting a particular issuer, or the result of, among other things, political, regulatory, market, economic or social developments affecting the relevant market(s) more generally. In addition, turbulence in financial markets and reduced liquidity in equity, credit and/or fixed income markets may negatively affect many issuers, which could adversely affect the Fund’s ability to price or value hard-to-value assets in thinly traded and closed markets and could cause significant redemptions and operational challenges. Global economies and financial markets are increasingly interconnected, and conditions and events in one country, region or financial market may adversely impact issuers in a different country, region or financial market. These risks may be magnified if certain events or developments adversely interrupt the global supply chain; in these and other circumstances, such risks might affect companies worldwide. As a result, local, regional or global events such as terrorism, war, natural disasters, disease/virus outbreaks and epidemics or other public health issues, recessions, depressions or other events – or the potential for such events – could have a significant negative impact on global economic and market conditions.
Money market fund investment risk
An investment in a money market fund is not a bank deposit and is not insured or guaranteed by any bank, the FDIC or any other government agency. Certain money market funds float their net asset value while others seek to preserve the value of investments at a stable net asset value (typically, $1.00 per share). An investment in a money market fund, even an investment in a fund seeking to maintain a stable net asset value per share, is not guaranteed and it is possible for the Fund to lose money by investing in these and other types of money market funds. If the liquidity of a money market fund’s portfolio deteriorates below certain levels, the money market fund may suspend redemptions (i.e., impose a redemption gate) and thereby prevent the Fund from selling its investment in the money market fund or impose a fee of up to 2% on amounts the Fund redeems from the money market fund (i.e., impose a liquidity fee). These measures may result in an investment loss or
| 22 | Columbia South Carolina Intermediate Municipal Bond Fund | Annual Report 2023 |
Notes to Financial Statements (continued)
April 30, 2023
prohibit the Fund from redeeming shares when the Investment Manager would otherwise redeem shares. In addition to the fees and expenses that the Fund directly bears, the Fund indirectly bears the fees and expenses of any money market funds in which it invests, including affiliated money market funds. By investing in a money market fund, the Fund will be exposed to the investment risks of the money market fund in direct proportion to such investment. To the extent the Fund invests in instruments such as derivatives, the Fund may hold investments, which may be significant, in money market fund shares to cover its obligations resulting from the Fund’s investments in such instruments. Money market funds and the securities they invest in are subject to comprehensive regulations. The enactment of new legislation or regulations, as well as changes in interpretation and enforcement of current laws, may affect the manner of operation, performance and/or yield of money market funds.
Shareholder concentration risk
At April 30, 2023, three unaffiliated shareholders of record owned 50.0% of the outstanding shares of the Fund in one or more accounts. The Fund has no knowledge about whether any portion of those shares was owned beneficially. Subscription and redemption activity by concentrated accounts may have a significant effect on the operations of the Fund. In the case of a large redemption, the Fund may be forced to sell investments at inopportune times, including its liquid positions, which may result in Fund losses and the Fund holding a higher percentage of less liquid positions. Large redemptions could result in decreased economies of scale and increased operating expenses for non-redeeming Fund shareholders.
Note 9. Subsequent events
Management has evaluated the events and transactions that have occurred through the date the financial statements were issued. Other than as noted in Note 1 above, there were no items requiring adjustment of the financial statements or additional disclosure.
Note 10. Information regarding pending and settled legal proceedings
Ameriprise Financial and certain of its affiliates are involved in the normal course of business in legal proceedings which include regulatory inquiries, arbitration and litigation, including class actions concerning matters arising in connection with the conduct of their activities as part of a diversified financial services firm. Ameriprise Financial believes that the Fund is not currently the subject of, and that neither Ameriprise Financial nor any of its affiliates are the subject of, any pending legal, arbitration or regulatory proceedings that are likely to have a material adverse effect on the Fund or the ability of Ameriprise Financial or its affiliates to perform under their contracts with the Fund. Ameriprise Financial is required to make quarterly (10-Q), annual (10-K) and, as necessary, 8-K filings with the Securities and Exchange Commission (SEC) on legal and regulatory matters that relate to Ameriprise Financial and its affiliates. Copies of these filings may be obtained by accessing the SEC website at www.sec.gov.
There can be no assurance that these matters, or the adverse publicity associated with them, will not result in increased Fund redemptions, reduced sale of Fund shares or other adverse consequences to the Fund. Further, although we believe proceedings are not likely to have a material adverse effect on the Fund or the ability of Ameriprise Financial or its affiliates to perform under their contracts with the Fund, these proceedings are subject to uncertainties and, as such, we are unable to estimate the possible loss or range of loss that may result. An adverse outcome in one or more of these proceedings could result in adverse judgments, settlements, fines, penalties or other relief that could have a material adverse effect on the consolidated financial condition or results of operations of Ameriprise Financial or one or more of its affiliates that provides services to the Fund.
Columbia South Carolina Intermediate Municipal Bond Fund | Annual Report 2023
| 23 |
Report of Independent Registered Public Accounting Firm
To the Board of Trustees of Columbia Funds Series Trust and Shareholders of Columbia South Carolina Intermediate Municipal Bond Fund
Opinion on the Financial Statements
We have audited the accompanying statement of assets and liabilities, including the portfolio of investments, of Columbia South Carolina Intermediate Municipal Bond Fund (one of the funds constituting Columbia Funds Series Trust, referred to hereafter as the "Fund") as of April 30, 2023, the related statement of operations for the year ended April 30, 2023, the statement of changes in net assets for each of the two years in the period ended April 30, 2023, including the related notes, and the financial highlights for each of the five years in the period ended April 30, 2023 (collectively referred to as the "financial statements"). In our opinion, the financial statements present fairly, in all material respects, the financial position of the Fund as of April 30, 2023, the results of its operations for the year then ended, the changes in its net assets for each of the two years in the period ended April 30, 2023 and the financial highlights for each of the five years in the period ended April 30, 2023 in conformity with accounting principles generally accepted in the United States of America.
Basis for Opinion
These financial statements are the responsibility of the Fund’s management. Our responsibility is to express an opinion on the Fund’s financial statements based on our audits. We are a public accounting firm registered with the Public Company Accounting Oversight Board (United States) (PCAOB) and are required to be independent with respect to the Fund in accordance with the U.S. federal securities laws and the applicable rules and regulations of the Securities and Exchange Commission and the PCAOB.
We conducted our audits of these financial statements in accordance with the standards of the PCAOB. Those standards require that we plan and perform the audit to obtain reasonable assurance about whether the financial statements are free of material misstatement, whether due to error or fraud.
Our audits included performing procedures to assess the risks of material misstatement of the financial statements, whether due to error or fraud, and performing procedures that respond to those risks. Such procedures included examining, on a test basis, evidence regarding the amounts and disclosures in the financial statements. Our audits also included evaluating the accounting principles used and significant estimates made by management, as well as evaluating the overall presentation of the financial statements. Our procedures included confirmation of securities owned as of April 30, 2023 by correspondence with the custodian and transfer agent. We believe that our audits provide a reasonable basis for our opinion.
/s/PricewaterhouseCoopers LLP
Minneapolis, Minnesota
June 22, 2023
We have served as the auditor of one or more investment companies within the Columbia Funds Complex since 1977.
| 24 | Columbia South Carolina Intermediate Municipal Bond Fund | Annual Report 2023 |
Federal Income Tax Information
(Unaudited)
The Fund hereby designates the following tax attributes for the fiscal year ended April 30, 2023. Shareholders will be notified in early 2024 of the amounts for use in preparing 2023 income tax returns.
Exempt-
interest
dividends | |
| 99.94% | |
Exempt-interest dividends. The percentage of net investment income distributed during the fiscal year that qualifies as exempt-interest dividends for federal income tax purposes. A portion of the income may be subject to federal alternative minimum tax.
TRUSTEES AND OFFICERS
(Unaudited)
The Board oversees the Fund’s operations and appoints officers who are responsible for day-to-day business decisions based on policies set by the Board. The following table provides basic biographical information about the Fund’s Trustees as of the printing of this report, including their principal occupations during the past five years, although specific titles for individuals may have varied over the period. The year set forth beneath Length of Service in the table below is the year in which the Trustee was first appointed or elected as Trustee to any Fund currently in the Columbia Funds Complex or a predecessor thereof. Under current Board policy, each Trustee generally serves until December 31 of the year such Trustee turns seventy-five (75).
Independent trustees
Name,
address,
year of birth | Position held
with the Columbia Funds and
length of service | Principal occupation(s)
during past five years
and other relevant
professional experience | Number of
Funds in the
Columbia Funds
Complex*
overseen | Other directorships
held by Trustee
during the past five years
and other relevant Board experience |
George S. Batejan
c/o Columbia Management
Investment Advisers, LLC
290 Congress Street
Boston, MA 02210
1954 | Trustee since 2017 | Executive Vice President, Global Head of Technology and Operations, Janus Capital Group, Inc., 2010-2016 | 174 | Former Chairman of the Board, NICSA (National Investment Company Services Association) (Executive Committee, Nominating Committee and Governance Committee), 2014-2016; former Director, Intech Investment Management, 2011-2016; former Board Member, Metro Denver Chamber of Commerce, 2015-2016; former Advisory Board Member, University of Colorado Business School, 2015-2018; former Board Member, Chase Bank International, 1993-1994 |
Columbia South Carolina Intermediate Municipal Bond Fund | Annual Report 2023
| 25 |
TRUSTEES AND OFFICERS (continued)
(Unaudited)
Independent trustees (continued)
Name,
address,
year of birth | Position held
with the Columbia Funds and
length of service | Principal occupation(s)
during past five years
and other relevant
professional experience | Number of
Funds in the
Columbia Funds
Complex*
overseen | Other directorships
held by Trustee
during the past five years
and other relevant Board experience |
Kathleen Blatz
c/o Columbia Management
Investment Advisers, LLC
290 Congress Street
Boston, MA 02210
1954 | Trustee since 2006 | Attorney, specializing in arbitration and mediation; Chief Justice, Minnesota Supreme Court, 1998-2006; Associate Justice, Minnesota Supreme Court, 1996-1998; Fourth Judicial District Court Judge, Hennepin County, 1994-1996; Attorney in private practice and public service, 1984-1993; State Representative, Minnesota House of Representatives, 1979-1993, which included service on the Tax and Financial Institutions and Insurance Committees; Member and Interim Chair, Minnesota Sports Facilities Authority, January-July 2017; Interim President and Chief Executive Officer, Blue Cross and Blue Shield of Minnesota (health care insurance), February-July 2018, April-October 2021 | 174 | Former Trustee, Blue Cross and Blue Shield of Minnesota, 2009-2021 (Chair of the Business Development Committee, 2014-2017; Chair of the Governance Committee, 2017-2019); former Member and Chair of the Board, Minnesota Sports Facilities Authority, January 2017-July 2017; former Director, Robina Foundation, 2009-2020 (Chair, 2014-2020); Director, Richard M. Schulze Family Foundation, since 2021 |
Pamela G. Carlton
c/o Columbia Management
Investment Advisers, LLC
290 Congress Street
Boston, MA 02210
1954 | Chair since 2023; Trustee since 2007 | President, Springboard — Partners in Cross Cultural Leadership (consulting company), since 2003; Managing Director of US Equity Research, JP Morgan Chase, 1999-2003; Director of US Equity Research, Chase Asset Management, 1996-1999; Co-Director Latin America Research, 1993-1996, COO Global Research, 1992-1996, Co-Director of US Research, 1991-1992, Investment Banker, 1982-1991, Morgan Stanley; Attorney, Cleary Gottlieb Steen & Hamilton LLP, 1980-1982 | 174 | Trustee, New York Presbyterian Hospital Board, since 1996; Director, DR Bank (Audit Committee) since 2017; Director, Evercore Inc. (Audit Committee, Nominating and Governance Committee), since 2019; Director, Apollo Commercial Real Estate Finance, Inc. (Chair, Nominating and Governance Committee) (financial services), since 2021; the Governing Council of the Independent Directors Council (IDC), since 2021 |
Janet Langford Carrig
c/o Columbia Management
Investment Advisers, LLC
290 Congress Street
Boston, MA 02210
1957 | Trustee since 1996 | Senior Vice President, General Counsel and Corporate Secretary, ConocoPhillips (independent energy company), September 2007-October 2018 | 174 | Director, EQT Corporation (natural gas producer), since 2019; former Director, Whiting Petroleum Corporation (independent oil and gas company), 2020-2022 |
J. Kevin Connaughton
c/o Columbia Management
Investment Advisers, LLC
290 Congress Street
Boston, MA 02210
1964 | Trustee since 2020 | CEO and President, RhodeWay Financial (non-profit financial planning firm), since December 2022; Member, FINRA National Adjudicatory Council, since January 2020; Adjunct Professor of Finance, Bentley University since January 2018; Consultant to Independent Trustees of CFVIT and CFST I from March 2016 to June 2020 with respect to CFVIT and to December 2020 with respect to CFST I; Managing Director and General Manager of Mutual Fund Products, Columbia Management Investment Advisers, LLC, May 2010-February 2015; President, Columbia Funds, 2008-2015; and senior officer of Columbia Funds and affiliated funds, 2003-2015 | 172 | Former Director, The Autism Project, March 2015-December 2021; former Member of the Investment Committee, St. Michael’s College, November 2015-February 2020; former Trustee, St. Michael’s College, June 2017-September 2019; former Trustee, New Century Portfolios (former mutual fund complex), January 2015-December 2017 |
| 26 | Columbia South Carolina Intermediate Municipal Bond Fund | Annual Report 2023 |
TRUSTEES AND OFFICERS (continued)
(Unaudited)
Independent trustees (continued)
Name,
address,
year of birth | Position held
with the Columbia Funds and
length of service | Principal occupation(s)
during past five years
and other relevant
professional experience | Number of
Funds in the
Columbia Funds
Complex*
overseen | Other directorships
held by Trustee
during the past five years
and other relevant Board experience |
Olive M. Darragh
c/o Columbia Management
Investment Advisers, LLC
290 Congress Street
Boston, MA 02210
1962 | Trustee since 2020 | Managing Director of Darragh Inc. (strategy and talent management consulting firm), since 2010; Founder and CEO, Zolio, Inc. (investment management talent identification platform), since 2004; Consultant to Independent Trustees of CFVIT and CFST I from June 2019 to June 2020 with respect to CFVIT and to December 2020 with respect to CFST I; Partner, Tudor Investments, 2004-2010; Senior Partner, McKinsey & Company (consulting), 1990-2004; Touche Ross CPA, 1985-1988 | 172 | Treasurer, Edinburgh University US Trust Board, since January 2023; Member, HBS Community Action Partners Board, since September 2022; former Director, University of Edinburgh Business School (Member of US Board), 2004-2019; former Director, Boston Public Library Foundation, 2008-2017 |
Patricia M. Flynn
c/o Columbia Management
Investment Advisers, LLC
290 Congress Street
Boston, MA 02210
1950 | Trustee since 2004 | Professor of Economics and Management, Bentley University, since 2002; Dean, McCallum Graduate School of Business, Bentley University, 1992-2002 | 174 | Former Trustee, MA Taxpayers Foundation, 1997-2022; former Director, The MA Business Roundtable, 2003-2019; former Chairperson, Innovation Index Advisory Committee, MA Technology Collaborative, 1997-2020 |
Brian J. Gallagher
c/o Columbia Management
Investment Advisers, LLC
290 Congress Street
Boston, MA 02210
1954 | Trustee since 2017 | Retired; Partner with Deloitte & Touche LLP and its predecessors, 1977-2016 | 174 | Trustee, Catholic Schools Foundation, since 2004 |
Douglas A. Hacker
c/o Columbia Management
Investment Advisers, LLC
290 Congress Street
Boston, MA 02210
1955 | Trustee since 1996 | Independent business executive, since May 2006; Executive Vice President – Strategy of United Airlines, December 2002 - May 2006; President of UAL Loyalty Services (airline marketing company), September 2001-December 2002; Executive Vice President and Chief Financial Officer of United Airlines, July 1999-September 2001 | 174 | Director, SpartanNash Company since November 2013 (Chair of the Board, since May 2021) (food distributor); Director, Aircastle Limited (Chair of Audit Committee) (aircraft leasing), since August 2006; former Director, Nash Finch Company (food distributor), 2005-2013; former Director, SeaCube Container Leasing Ltd. (container leasing), 2010-2013; and former Director, Travelport Worldwide Limited (travel information technology), 2014-2019 |
Nancy T. Lukitsh
c/o Columbia Management
Investment Advisers, LLC
290 Congress Street
Boston, MA 02210
1956 | Trustee since 2011 | Senior Vice President, Partner and Director of Marketing, Wellington Management Company, LLP (investment adviser), 1997-2010; Chair, Wellington Management Portfolios (commingled non-U.S. investment pools), 2007-2010; Director, Wellington Trust Company, NA and other Wellington affiliates, 1997-2010 | 172 | None |
Columbia South Carolina Intermediate Municipal Bond Fund | Annual Report 2023
| 27 |
TRUSTEES AND OFFICERS (continued)
(Unaudited)
Independent trustees (continued)
Name,
address,
year of birth | Position held
with the Columbia Funds and
length of service | Principal occupation(s)
during past five years
and other relevant
professional experience | Number of
Funds in the
Columbia Funds
Complex*
overseen | Other directorships
held by Trustee
during the past five years
and other relevant Board experience |
David M. Moffett
c/o Columbia Management
Investment Advisers, LLC
290 Congress Street
Boston, MA 02210
1952 | Trustee since 2011 | Retired; former Chief Executive Officer of Freddie Mac and Chief Financial Officer of U.S. Bank | 172 | Director, CSX Corporation (transportation suppliers); Director, PayPal Holdings Inc. (payment and data processing services); Trustee, University of Oklahoma Foundation; former Director, eBay Inc. (online trading community), 2007-2015; and former Director, CIT Bank, CIT Group Inc. (commercial and consumer finance), 2010-2016; former Senior Adviser to The Carlyle Group (financial services), March 2008-September 2008; former Governance Consultant to Bridgewater Associates, January 2013-December 2015 |
Catherine James Paglia
c/o Columbia Management
Investment Advisers, LLC
290 Congress Street
Boston, MA 02210
1952 | Trustee since 2004 | Director, Enterprise Asset Management, Inc. (private real estate and asset management company), since September 1998; Managing Director and Partner, Interlaken Capital, Inc., 1989-1997; Vice President, 1982-1985, Principal, 1985-1987, Managing Director, 1987-1989, Morgan Stanley; Vice President, Investment Banking, 1980-1982, Associate, Investment Banking, 1976-1980, Dean Witter Reynolds, Inc. | 174 | Director, Valmont Industries, Inc. (irrigation systems manufacturer), since 2012; Trustee, Carleton College (on the Investment Committee), since 1987; Trustee, Carnegie Endowment for International Peace (on the Investment Committee), since 2009 |
Natalie A. Trunow
c/o Columbia Management
Investment Advisers, LLC
290 Congress Street
Boston, MA 02210
1967 | Trustee since 2020 | Chief Executive Officer, Millennial Portfolio Solutions LLC (asset management and consulting services), January 2016-January 2021; Non-executive Member of the Investment Committee and Valuation Committee, Sarona Asset Management Inc. (private equity firm) since September 2019; Advisor, Horizon Investments (asset management and consulting services), August 2018-January 2022; Advisor, Paradigm Asset Management, November 2016-January 2022; Consultant to Independent Trustees of CFVIT and CFST I from September 2016 to June 2020 with respect to CFVIT and to December 2020 with respect to CFST I; Director of Investments/Consultant, Casey Family Programs, April 2016-November 2016; Senior Vice President and Chief Investment Officer, Calvert Investments, August 2008-January 2016; Section Head and Portfolio Manager, General Motors Asset Management, June 1997-August 2008 | 172 | Independent Director, Investment Committee, Health Services for Children with Special Needs, Inc., 2010-2021; Independent Director, (Executive Committee and Chair, Audit Committee), Consumer Credit Counseling Services (formerly Guidewell Financial Solutions), since 2016; Independent Director, (Investment Committee), Sarona Asset Management, since 2019 |
| 28 | Columbia South Carolina Intermediate Municipal Bond Fund | Annual Report 2023 |
TRUSTEES AND OFFICERS (continued)
(Unaudited)
Independent trustees (continued)
Name,
address,
year of birth | Position held
with the Columbia Funds and
length of service | Principal occupation(s)
during past five years
and other relevant
professional experience | Number of
Funds in the
Columbia Funds
Complex*
overseen | Other directorships
held by Trustee
during the past five years
and other relevant Board experience |
Sandra L. Yeager
c/o Columbia Management
Investment Advisers, LLC
290 Congress Street
Boston, MA 02210
1964 | Trustee since 2017 | Retired; President and founder, Hanoverian Capital, LLC (SEC registered investment advisor firm), 2008-2016; Managing Director, DuPont Capital, 2006-2008; Managing Director, Morgan Stanley Investment Management, 2004-2006; Senior Vice President, Alliance Bernstein, 1990-2004 | 174 | Former Director, NAPE (National Alliance for Partnerships in Equity) Education Foundation, October 2016-October 2020; Advisory Board, Jennersville YMCA, since 2022 |
Interested trustee affiliated with Investment Manager**
Name,
address,
year of birth | Position held with the Columbia Funds and length of service | Principal occupation(s) during the
past five years and other relevant
professional experience | Number of
Funds in the
Columbia Funds
Complex overseen | Other directorships
held by Trustee
during the past
five years and
other relevant Board experience |
Daniel J. Beckman
c/o Columbia Management
Investment Advisers, LLC
290 Congress Street
Boston, MA 02210
1962 | Trustee since November 2021 and President since June 2021 | Vice President – Head of North America Product, Columbia Management Investment Advisers, LLC, since April 2015; President and Principal Executive Officer of the Columbia Funds, since June 2021; officer of Columbia Funds and affiliated funds, 2020-2021 | 174 | Director, Ameriprise Trust Company, since October 2016; Director, Columbia Management Investment Distributors, Inc. since November 2018; Board of Governors, Columbia Wanger Asset Management, LLC since, January 2022; Director, Columbia Threadneedle Canada, Inc., since December 2022 |
| * | The term “Columbia Funds Complex” as used herein includes Columbia Seligman Premium Technology Growth Fund, Tri-Continental Corporation and each series of Columbia Funds Series Trust (CFST), Columbia Funds Series Trust I (CFST I), Columbia Funds Series Trust II (CFST II), Columbia ETF Trust I (CET I), Columbia ETF Trust II (CET II), Columbia Funds Variable Insurance Trust (CFVIT) and Columbia Funds Variable Series Trust II (CFVST II). Messrs. Batejan, Beckman, Gallagher and Hacker and Mses. Blatz, Carlton, Carrig, Flynn, Paglia, and Yeager serve as directors of Columbia Seligman Premium Technology Growth Fund and Tri-Continental Corporation. |
| ** | Interested person (as defined under the 1940 Act) by reason of being an officer, director, security holder and/or employee of the Investment Manager or Ameriprise Financial. |
The Statement of Additional Information has additional information about the Fund’s Board members and is available, without charge, upon request by calling 800.345.6611, visiting columbiathreadneedleus.com/investor/ or contacting your financial intermediary.
Columbia South Carolina Intermediate Municipal Bond Fund | Annual Report 2023
| 29 |
TRUSTEES AND OFFICERS (continued)
(Unaudited)
The Board has appointed officers who are responsible for day-to-day business decisions based on policies it has established. The officers serve at the pleasure of the Board. The following table provides basic information about the Officers of the Fund as of the printing of this report, including principal occupations during the past five years, although their specific titles may have varied over the period. In addition to Mr. Beckman, who is President and Principal Executive Officer, the Fund’s other officers are:
Fund officers
Name,
address and
year of birth | Position and year
first appointed to
position for any Fund
in the Columbia
Funds Complex or a
predecessor thereof | Principal occupation(s) during past five years |
Michael G. Clarke
290 Congress Street
Boston, MA 02210
1969 | Chief Financial Officer and Principal Financial Officer (2009) and Senior Vice President (2019) | Senior Vice President and Head of North America Operations & Investor Services, Columbia Management Investment Advisers, LLC, since June 2023 (previously Senior Vice President and Head of Global Operations, March 2022 – June 2023, Vice President, Head of North America Operations, and Co-Head of Global Operations, June 2019 - February 2022 and Vice President – Accounting and Tax, May 2010 - May 2019); senior officer of Columbia Funds and affiliated funds, since 2002. |
Joseph Beranek
5890 Ameriprise Financial Center
Minneapolis, MN 55474
1965 | Treasurer and Chief Accounting Officer (Principal Accounting Officer) (2019) and Principal Financial Officer (2020), CFST, CFST I, CFST II, CFVIT and CFVST II; Assistant Treasurer, CET I and CET II | Vice President – Mutual Fund Accounting and Financial Reporting, Columbia Management Investment Advisers, LLC, since December 2018 and March 2017, respectively. |
Marybeth Pilat
290 Congress Street
Boston, MA 02210
1968 | Treasurer and Chief Accounting Officer (Principal Accounting Officer) and Principal Financial Officer (2020) for CET I and CET II; Assistant Treasurer, CFST, CFST I, CFST II, CFVIT and CFVST II | Vice President – Product Pricing and Administration, Columbia Management Investment Advisers, LLC, since May 2017. |
William F. Truscott
290 Congress Street
Boston, MA 02210
1960 | Senior Vice President (2001) | Formerly, Trustee/Director of Columbia Funds Complex or legacy funds, November 2001-January 1, 2021; Chief Executive Officer, Global Asset Management, Ameriprise Financial, Inc., since September 2012; Chairman of the Board and President, Columbia Management Investment Advisers, LLC, since July 2004 and February 2012, respectively; Chairman of the Board and Chief Executive Officer, Columbia Management Investment Distributors, Inc., since November 2008 and February 2012, respectively; Chairman of the Board and Director, Threadneedle Asset Management Holdings, Sàrl, since March 2013 and December 2008, respectively; senior executive of various entities affiliated with Columbia Threadneedle. |
Christopher O. Petersen
5228 Ameriprise Financial Center
Minneapolis, MN 55474
1970 | Senior Vice President and Assistant Secretary (2021) | Formerly, Trustee/Director of funds within the Columbia Funds Complex, July 1, 2020 - November 22, 2021; Senior Vice President and Assistant General Counsel, Ameriprise Financial, Inc., since September 2021 (previously Vice President and Lead Chief Counsel, January 2015 - September 2021); formerly, President and Principal Executive Officer of the Columbia Funds, 2015 - 2021; officer of Columbia Funds and affiliated funds, since 2007. |
Thomas P. McGuire
290 Congress Street
Boston, MA 02210
1972 | Senior Vice President and Chief Compliance Officer (2012) | Vice President – Asset Management Compliance, Ameriprise Financial, Inc., since May 2010; Chief Compliance Officer, Columbia Acorn/Wanger Funds, since December 2015; formerly, Chief Compliance Officer, Ameriprise Certificate Company, September 2010 – September 2020. |
Ryan C. Larrenaga
290 Congress Street
Boston, MA 02210
1970 | Senior Vice President (2017), Chief Legal Officer (2017), and Secretary (2015) | Vice President and Chief Counsel, Ameriprise Financial, Inc., since August 2018 (previously Vice President and Group Counsel, August 2011 - August 2018); Chief Legal Officer, Columbia Acorn/Wanger Funds, since September 2020; officer of Columbia Funds and affiliated funds, since 2005. |
| 30 | Columbia South Carolina Intermediate Municipal Bond Fund | Annual Report 2023 |
TRUSTEES AND OFFICERS (continued)
(Unaudited)
Fund officers (continued)
Name,
address and
year of birth | Position and year
first appointed to
position for any Fund
in the Columbia
Funds Complex or a
predecessor thereof | Principal occupation(s) during past five years |
Michael E. DeFao
290 Congress Street
Boston, MA 02210
1968 | Vice President (2011) and Assistant Secretary (2010) | Vice President and Chief Counsel, Ameriprise Financial, Inc., since May 2010; Vice President, Chief Legal Officer and Assistant Secretary, Columbia Management Investment Advisers, LLC, since October 2021 (previously Vice President and Assistant Secretary, May 2010 – September 2021). |
Lyn Kephart-Strong
5228 Ameriprise Financial Center
Minneapolis, MN 55474
1960 | Vice President (2015) | Vice President, Global Investment Operations Services, Columbia Management Investment Advisers, LLC, since 2010; President, Columbia Management Investment Services Corp., since October 2014; President, Ameriprise Trust Company, since January 2017. |
Liquidity Risk Management Program
(Unaudited)
Pursuant to Rule 22e-4 under the 1940 Act, the Fund has adopted a liquidity risk management program (Program). The Program’s principal objectives include assessing, managing and periodically reviewing the Fund’s liquidity risk. Liquidity risk is defined as the risk that the Fund could not meet redemption requests without significant dilution of remaining investors’ interests in the Fund.
The Board has appointed the Investment Manager as the program administrator for the Fund’s Program. The Investment Manager has delegated oversight of the Program to its Liquidity Risk Management Committee (the Committee). At a board meeting during the fiscal period, the Committee provided the Board with a report addressing the operations of the program and assessing its adequacy and effectiveness of implementation for the period January 1, 2022, through December 31, 2022, including:
| • | the Fund had sufficient liquidity to both meet redemptions and operate effectively on behalf of shareholders; |
| • | there were no material changes to the Program during the period; |
| • | the implementation of the Program was effective to manage the Fund’s liquidity risk; and |
| • | the Program operated adequately during the period. |
There can be no assurance that the Program will achieve its objectives in the future. Please refer to the Fund’s prospectus for more information regarding the Fund’s exposure to liquidity risk and other principal risks to which an investment in the Fund may be subject.
Columbia South Carolina Intermediate Municipal Bond Fund | Annual Report 2023
| 31 |
Columbia South Carolina Intermediate Municipal Bond Fund
P.O. Box 219104
Kansas City, MO 64121-9104
Please read and consider the investment objectives, risks, charges and expenses for any fund carefully before investing. For a prospectus and summary prospectus, which contains this and other important information about the Fund, go to
columbiathreadneedleus.com/investor/. The Fund is distributed by Columbia Management Investment Distributors, Inc., member FINRA, and managed by Columbia Management Investment Advisers, LLC.
Columbia Threadneedle Investments (Columbia Threadneedle) is the global brand name of the Columbia and Threadneedle group of companies. All rights reserved.
© 2023 Columbia Management Investment Advisers, LLC.
columbiathreadneedleus.com/investor/

Annual Report
April 30, 2023
Columbia Virginia Intermediate Municipal Bond Fund
Not FDIC or NCUA Insured • No Financial Institution Guarantee • May Lose Value
If you elect to receive the shareholder report for Columbia Virginia Intermediate Municipal Bond Fund (the Fund) in paper, mailed to you, the Fund mails one shareholder report to each shareholder address, unless such shareholder elects to receive shareholder reports from the Fund electronically via e-mail or by having a paper notice mailed to you (Postcard Notice) that your Fund’s shareholder report is available at the Columbia funds’ website (columbiathreadneedleus.com/investor/). If you would like more than one report in paper to be mailed to you, or would like to elect to receive reports via e-mail or access them through Postcard Notice, please call shareholder services at 800.345.6611 and additional reports will be sent to you.
Proxy voting policies and procedures
The policy of the Board of Trustees is to vote the proxies of the companies in which the Fund holds investments consistent with the procedures as stated in the Statement of Additional Information (SAI). You may obtain a copy of the SAI without charge by calling 800.345.6611; contacting your financial intermediary; visiting columbiathreadneedleus.com/investor/; or searching the website of the Securities and Exchange Commission (SEC) at sec.gov. Information regarding how the Fund voted proxies relating to portfolio securities is filed with the SEC by August 31st for the most recent 12-month period ending June 30th of that year, and is available without charge by visiting columbiathreadneedleus.com/investor/, or searching the website of the SEC at sec.gov.
Quarterly schedule of investments
The Fund files a complete schedule of portfolio holdings with the SEC for the first and third quarters of each fiscal year on Form N-PORT. The Fund’s Form N-PORT filings are available on the SEC’s website at sec.gov. The Fund’s complete schedule of portfolio holdings, as filed on Form N-PORT, is available on columbiathreadneedleus.com/investor/ or can also be obtained without charge, upon request, by calling 800.345.6611.
Additional Fund information
For more information about the Fund, please visit columbiathreadneedleus.com/investor/ or call 800.345.6611. Customer Service Representatives are available to answer your questions Monday through Friday from 8 a.m. to 7 p.m. Eastern time.
Fund investment manager
Columbia Management Investment Advisers, LLC (the Investment Manager)
290 Congress Street
Boston, MA 02210
Fund distributor
Columbia Management Investment Distributors, Inc.
290 Congress Street
Boston, MA 02210
Fund transfer agent
Columbia Management Investment Services Corp.
P.O. Box 219104
Kansas City, MO 64121-9104
Columbia Virginia Intermediate Municipal Bond Fund | Annual Report 2023
Fund at a Glance
(Unaudited)
Investment objective
The Fund seeks current income exempt from U.S. federal income tax and Virginia individual income tax, consistent with moderate fluctuation of principal.
Portfolio management
Paul Fuchs, CFA
Co-Portfolio Manager
Managed Fund since 2016
Douglas Rangel, CFA
Co-Portfolio Manager
Managed the Fund since June 2022
| Average annual total returns (%) (for the period ended April 30, 2023) |
| | | Inception | 1 Year | 5 Years | 10 Years | |
| Class A | Excluding sales charges | 12/05/89 | 0.07 | 0.74 | 0.90 | |
| | Including sales charges | | -2.92 | 0.13 | 0.59 | |
| Advisor Class | 03/19/13 | 0.32 | 1.01 | 1.18 | |
| Class C | Excluding sales charges | 06/17/92 | -0.66 | -0.01 | 0.16 | |
| | Including sales charges | | -1.64 | -0.01 | 0.16 | |
| Institutional Class | 09/20/89 | 0.32 | 0.99 | 1.16 | |
| Institutional 3 Class* | 03/01/17 | 0.41 | 1.08 | 1.21 | |
| Bloomberg 3-15 Year Blend Municipal Bond Index | | 3.71 | 2.18 | 2.14 | |
Returns for Class A shares are shown with and without the maximum initial sales charge of 3.00%. Returns for Class C shares are shown with and without the 1.00% contingent deferred sales charge for the first year only. The Fund’s other share classes are not subject to sales charges and have limited eligibility. Please see the Fund’s prospectus for details. Performance for different share classes will vary based on differences in sales charges and fees associated with each share class. All results shown assume reinvestment of distributions during the period. Returns do not reflect the deduction of taxes that a shareholder may pay on Fund distributions or on the redemption of Fund shares. Performance results reflect the effect of any fee waivers or reimbursements of Fund expenses by Columbia Management Investment Advisers, LLC and/or any of its affiliates. Absent these fee waivers or expense reimbursement arrangements, performance results would have been lower.
The performance information shown represents past performance and is not a guarantee of future results. The investment return and principal value of your investment will fluctuate so that your shares, when redeemed, may be worth more or less than their original cost. Current performance may be lower or higher than the performance information shown. You may obtain performance information current to the most recent month-end by contacting your financial intermediary, visiting columbiathreadneedleus.com/investor/ or calling 800.345.6611.
| * | The returns shown for periods prior to the share class inception date (including returns for the Life of the Fund, if shown, which are since Fund inception) include the returns of the Fund’s oldest share class. These returns are adjusted to reflect any higher class-related operating expenses of the newer share classes, as applicable. Please visit columbiathreadneedleus.com/investor/investment-products/mutual-funds/appended-performance for more information. |
The Bloomberg 3–15 Year Blend Municipal Bond Index is an unmanaged index that tracks the performance of municipal bonds issued after December 31, 1990, with remaining maturities between 2 and 17 years and at least $7 million in principal amount outstanding.
Indices are not available for investment, are not professionally managed and do not reflect sales charges, fees, brokerage commissions, taxes or other expenses of investing. Securities in the Fund may not match those in an index.
Columbia Virginia Intermediate Municipal Bond Fund | Annual Report 2023
| 3 |
Fund at a Glance (continued)
(Unaudited)
Performance of a hypothetical $10,000 investment (April 30, 2013 — April 30, 2023)
The chart above shows the change in value of a hypothetical $10,000 investment in Class A shares of Columbia Virginia Intermediate Municipal Bond Fund during the stated time period, and does not reflect the deduction of taxes that a shareholder may pay on Fund distributions or on the redemption of Fund shares.
| Portfolio breakdown (%) (at April 30, 2023) |
| Money Market Funds | 100.0 |
| Total | 100.0 |
Percentages indicated are based upon total investments excluding investments in derivatives, if any. The Fund’s portfolio composition is subject to change.
| 4 | Columbia Virginia Intermediate Municipal Bond Fund | Annual Report 2023 |
Manager Discussion of Fund Performance
(Unaudited)
On May 5, 2023, the Fund was liquidated in accordance with the Plan of Liquidation and Termination approved by the Board of Trustees of the Funds.
For the 12-month period that ended April 30, 2023, Class A shares of Columbia Virginia Intermediate Municipal Bond Fund returned 0.07% excluding sales charges. Institutional Class shares of the Fund returned 0.32%. During the same time period, the Fund’s benchmark, the Bloomberg 3-15 Year Blend Municipal Bond Index, which is national in scope, returned 3.71%.
Market overview
For fixed-income markets, the period was dominated by the U.S. Federal Reserve’s (Fed) efforts to return inflation to its target levels and the resultant dramatic increase in interest rates. Indeed, the Fed ratcheted its targeted federal funds rate higher by 450 basis points, and municipal bond yields followed suit with yields across most of its spectrum of maturities rising as well. (A basis point is 1/100th of a percentage point.) Municipal bond yields peaked in October 2022, however, and subsequently retraced somewhat, returning most segments of the municipal bond market to positive total returns for the period overall. Still, for the period as a whole, yields on one-year and two-year municipal bonds increased 106 basis points and 47 basis points, respectively. Yields on municipal bonds with maturities of less than one year rose even more significantly, driving an inversion of the short-term end of the yield curve for much of the period. Yields for municipal bonds with maturities of between five years and 13 years actually declined modestly, and longer term maturity yields rose only moderately.
Amid these conditions, investor sentiment within the municipal bond market was negative for much of the period. Rising rates and negative total returns through much of 2022 precipitated the largest outflow cycle ever experienced by the municipal bond market. Fund flows then stabilized and slowed into year-end but any optimism around a resumption of inflows in 2023 was quashed as another $6 billion of outflows through the end of April showed investors were still cautious about returning to the market. Consequently, technicals, or supply/demand dynamics, were not favorable within the municipal bond market during the period, largely driven by this lack of demand. Short-term municipal bond funds were not spared the effects of the outflow cycle. However, they were less impacted than their long-term, high-yield and intermediate fund counterparts, as short-term municipal bond funds generally hold more liquid positions, and shorter maturities inherently provide ample cash flow. Supply, or lack thereof during the period, proved a bright spot. Rate volatility coupled with healthy balance sheets sidelined many issuers, with tax-exempt issuance approximately 10% to 15% lower during the period than long-term averages. Not having to contend with an oversupply of new issuance likely buoyed the market as whatever new issues did come to market were well received.
All that said, fundamental factors were broadly supportive of the municipal bond market during the period. Municipal credit health benefited from positive U.S. economic growth, outperformance of tax collections, and strong reserve positions by most state and local governments, owing partly to COVID-19 stimulus. Revenue sectors, however, were more mixed. Essential services, such as water & sewer and utilities, held steady, and transportation sectors, such as airports and toll roads, rebounded strongly with increased traffic levels. Public mass transit was the exception, as subway/bus traffic across most major cities remained well below pre-pandemic levels. Fundamental credit health for hospitals and other health care sectors, such as senior living facilities and continuing care retirement communities (CCRCs), was modestly weaker overall. Higher labor costs, lighter balance sheets due to repayment of Medicare acceleration payments and investment market losses served to weaken health care fundamentals as did the full expenditure of any COVID-19 funding. As a whole, higher quality municipal bonds outperformed lower quality securities during the period.
The Fund’s notable detractors during the period
| • | During the second half of the period, the Fund’s below benchmark duration prevented the Fund from fully participating in the sharp turn in interest rates and market rally. As yields declined from November 2022 through April 2023, the Fund’s benchmark returned an impressive 6.62% as the 10-year municipal benchmark yield declined by roughly 80 basis points. |
| • | Sector allocation underweights to water & sewer and state and local general obligation (GO) bonds detracted from performance. Issue selection within special tax and continuing care retirement communities (CCRCs) were notable negatives. |
| • | The Fund’s overweighted allocation, relative to its benchmark, to maturities on the longer portion (12+ years) of the yield curve also detracted. This detracting effect was more pronounced during the second half of the period. |
Columbia Virginia Intermediate Municipal Bond Fund | Annual Report 2023
| 5 |
Manager Discussion of Fund Performance (continued)
(Unaudited)
| • | Persistent outflows across the municipal bond market also detracted from Fund performance as the funding of shareholder liquidity required price concessions at times. Related to this, the Fund was liquidated soon after the close of the period due to lack of interest. |
The Fund’s notable contributors during the period
| • | During the first half of the period, the Fund’s below benchmark duration helped to limit price declines. As yields rose from May 2022 through October 2022, the Fund’s benchmark returned -2.64% as the 10 year municipal benchmark yield rose roughly 70 basis points. |
| • | The Fund’s allocation to shorter maturities was additive during the first six months of the period, enough so that the effect remained positive for the full 12-month period. |
| • | Overweighted allocations to the airports and transportation sectors contributed to Fund performance during the period. |
| • | The relative outperformance of Fund holdings within transportation, housing, and water & sewer also contributed. |
Fixed-income securities present issuer default risk. The Fund invests substantially in municipal securities and will be affected by tax, legislative, regulatory, demographic or political changes, as well as changes impacting a state’s financial, economic or other conditions. A relatively small number of tax-exempt issuers may necessitate the Fund investing more heavily in a single issuer and, therefore, be more exposed to the risk of loss than a fund that invests more broadly. The value of the Fund’s portfolio may be more volatile than a more geographically diversified fund. Prepayment and extension risk exists because the timing of payments on a loan, bond or other investment may accelerate when interest rates fall or decelerate when interest rates rise which may reduce investment opportunities and potential returns. A rise in interest rates may result in a price decline of fixed-income instruments held by the Fund, negatively impacting its performance and NAV. Falling rates may result in the Fund investing in lower yielding debt instruments, lowering the Fund’s income and yield. These risks may be heightened for longer maturity and duration securities. Non-investment-grade (high-yield or junk) securities present greater price volatility and more risk to principal and income than higher rated securities. Market risk may affect a single issuer, sector of the economy, industry or the market as a whole. Federal and state tax rules apply to capital gain distributions and any gains or losses on sales. Income may be subject to state or local taxes. Liquidity risk is associated with the difficulty of selling underlying investments at a desirable time or price. See the Fund’s prospectus for more information on these and other risks.
The views expressed in this report reflect the current views of the respective parties who have contributed to this report. These views are not guarantees of future performance and involve certain risks, uncertainties and assumptions that are difficult to predict, so actual outcomes and results may differ significantly from the views expressed. These views are subject to change at any time based upon economic, market or other conditions and the respective parties disclaim any responsibility to update such views. These views may not be relied on as investment advice and, because investment decisions for a Columbia fund are based on numerous factors, may not be relied on as an indication of trading intent on behalf of any particular Columbia fund. References to specific securities should not be construed as a recommendation or investment advice.
| 6 | Columbia Virginia Intermediate Municipal Bond Fund | Annual Report 2023 |
Understanding Your Fund’s Expenses
(Unaudited)
As an investor, you incur two types of costs. There are shareholder transaction costs, which generally include sales charges on purchases and may include redemption fees. There are also ongoing fund costs, which generally include management fees, distribution and/or service fees, and other fund expenses. The following information is intended to help you understand your ongoing costs (in dollars) of investing in the Fund and to help you compare these costs with the ongoing costs of investing in other mutual funds.
Analyzing your Fund’s expenses
To illustrate these ongoing costs, we have provided examples and calculated the expenses paid by investors in each share class of the Fund during the period. The actual and hypothetical information in the table is based on an initial investment of $1,000 at the beginning of the period indicated and held for the entire period. Expense information is calculated two ways and each method provides you with different information. The amount listed in the “Actual” column is calculated using the Fund’s actual operating expenses and total return for the period. You may use the Actual information, together with the amount invested, to estimate the expenses that you paid over the period. Simply divide your account value by $1,000 (for example, an $8,600 account value divided by $1,000 = 8.6), then multiply the results by the expenses paid during the period under the “Actual” column. The amount listed in the “Hypothetical” column assumes a 5% annual rate of return before expenses (which is not the Fund’s actual return) and then applies the Fund’s actual expense ratio for the period to the hypothetical return. You should not use the hypothetical account values and expenses to estimate either your actual account balance at the end of the period or the expenses you paid during the period. See “Compare with other funds” below for details on how to use the hypothetical data.
Compare with other funds
Since all mutual funds are required to include the same hypothetical calculations about expenses in shareholder reports, you can use this information to compare the ongoing cost of investing in the Fund with other funds. To do so, compare the hypothetical example with the 5% hypothetical examples that appear in the shareholder reports of other funds. As you compare hypothetical examples of other funds, it is important to note that hypothetical examples are meant to highlight the ongoing costs of investing in a fund only and do not reflect any transaction costs, such as sales charges, or redemption or exchange fees. Therefore, the hypothetical calculations are useful in comparing ongoing costs only, and will not help you determine the relative total costs of owning different funds. If transaction costs were included in these calculations, your costs would be higher.
| November 1, 2022 — April 30, 2023 |
| | Account value at the
beginning of the
period ($) | Account value at the
end of the
period ($) | Expenses paid during
the period ($) | Fund’s annualized
expense ratio (%) |
| | Actual | Hypothetical | Actual | Hypothetical | Actual | Hypothetical | Actual |
| Class A | 1,000.00 | 1,000.00 | 1,029.70 | 1,020.55 | 4.03 | 4.01 | 0.81 |
| Advisor Class | 1,000.00 | 1,000.00 | 1,030.90 | 1,021.77 | 2.79 | 2.78 | 0.56 |
| Class C | 1,000.00 | 1,000.00 | 1,025.90 | 1,016.87 | 7.75 | 7.71 | 1.56 |
| Institutional Class | 1,000.00 | 1,000.00 | 1,030.90 | 1,021.77 | 2.79 | 2.78 | 0.56 |
| Institutional 3 Class | 1,000.00 | 1,000.00 | 1,031.30 | 1,022.17 | 2.39 | 2.38 | 0.48 |
Expenses paid during the period are equal to the annualized expense ratio for each class as indicated above, multiplied by the average account value over the period and then multiplied by the number of days in the Fund’s most recent fiscal half year and divided by 365.
Expenses do not include fees and expenses incurred indirectly by the Fund from its investment in underlying funds, including affiliated and non-affiliated pooled investment vehicles, such as mutual funds and exchange-traded funds.
Had Columbia Management Investment Advisers, LLC and/or certain of its affiliates not waived/reimbursed certain fees and expenses, account value at the end of the period would have been reduced.
Columbia Virginia Intermediate Municipal Bond Fund | Annual Report 2023
| 7 |
Portfolio of Investments
April 30, 2023
(Percentages represent value of investments compared to net assets)
Investments in securities
| Money Market Funds 101.9% |
| | Shares | Value ($) |
| JPMorgan Institutional Tax Free Money Market Fund, Institutional Shares, 3.136%(a) | 49,063,135 | 49,074,952 |
Total Money Market Funds
(Cost $49,074,952) | 49,074,952 |
Total Investments in Securities
(Cost: $49,074,952) | 49,074,952 |
| Other Assets & Liabilities, Net | | (908,415) |
| Net Assets | 48,166,537 |
Notes to Portfolio of Investments
| (a) | The rate shown is the seven-day current annualized yield at April 30, 2023. |
Fair value measurements
The Fund categorizes its fair value measurements according to a three-level hierarchy that maximizes the use of observable inputs and minimizes the use of unobservable inputs by prioritizing that the most observable input be used when available. Observable inputs are those that market participants would use in pricing an investment based on market data obtained from sources independent of the reporting entity. Unobservable inputs are those that reflect the Fund’s assumptions about the information market participants would use in pricing an investment. An investment’s level within the fair value hierarchy is based on the lowest level of any input that is deemed significant to the asset’s or liability’s fair value measurement. The input levels are not necessarily an indication of the risk or liquidity associated with investments at that level. For example, certain U.S. government securities are generally high quality and liquid, however, they are reflected as Level 2 because the inputs used to determine fair value may not always be quoted prices in an active market.
Fair value inputs are summarized in the three broad levels listed below:
| ■ | Level 1 — Valuations based on quoted prices for investments in active markets that the Fund has the ability to access at the measurement date. Valuation adjustments are not applied to Level 1 investments. |
| ■ | Level 2 — Valuations based on other significant observable inputs (including quoted prices for similar securities, interest rates, prepayment speeds, credit risks, etc.). |
| ■ | Level 3 — Valuations based on significant unobservable inputs (including the Fund’s own assumptions and judgment in determining the fair value of investments). |
Inputs that are used in determining fair value of an investment may include price information, credit data, volatility statistics, and other factors. These inputs can be either observable or unobservable. The availability of observable inputs can vary between investments, and is affected by various factors such as the type of investment, and the volume and level of activity for that investment or similar investments in the marketplace. The inputs will be considered by the Investment Manager, along with any other relevant factors in the calculation of an investment’s fair value. The Fund uses prices and inputs that are current as of the measurement date, which may include periods of market dislocations. During these periods, the availability of prices and inputs may be reduced for many investments. This condition could cause an investment to be reclassified between the various levels within the hierarchy.
Investments falling into the Level 3 category are primarily supported by quoted prices from brokers and dealers participating in the market for those investments. However, these may be classified as Level 3 investments due to lack of market transparency and corroboration to support these quoted prices. Additionally, valuation models may be used as the pricing source for any remaining investments classified as Level 3. These models may rely on one or more significant unobservable inputs and/or significant assumptions by the Investment Manager. Inputs used in valuations may include, but are not limited to, financial statement analysis, capital account balances, discount rates and estimated cash flows, and comparable company data.
The Fund’s Board of Trustees (the Board) has designated the Investment Manager, through its Valuation Committee (the Committee), as valuation designee, responsible for determining the fair value of the assets of the Fund for which market quotations are not readily available using valuation procedures approved by the Board. The Committee consists of voting and non-voting members from various groups within the Investment Manager’s organization, including operations and accounting, trading and investments, compliance, risk management and legal.
The Committee meets at least monthly to review and approve valuation matters, which may include a description of specific valuation determinations, data regarding pricing information received from approved pricing vendors and brokers and the results of Board-approved valuation policies and procedures (the Policies). The Policies address, among other things, instances when market quotations are or are not readily available, including recommendations of third party pricing vendors and a determination of appropriate pricing methodologies; events that require specific valuation determinations and assessment of fair value techniques; securities with a potential for stale pricing, including those that are illiquid, restricted, or in default; and the effectiveness of third party pricing vendors, including periodic reviews of vendors. The Committee meets more frequently, as needed, to discuss additional valuation matters, which may include the need to review back-testing results, review time-sensitive information or approve related valuation actions. Representatives of Columbia Management Investment Advisers, LLC report to the Board at each of its regularly scheduled meetings to discuss valuation matters and actions during the period, similar to those described earlier.
The accompanying Notes to Financial Statements are an integral part of this statement.
| 8 | Columbia Virginia Intermediate Municipal Bond Fund | Annual Report 2023 |
Portfolio of Investments (continued)
April 30, 2023
Fair value measurements (continued)
The following table is a summary of the inputs used to value the Fund’s investments at April 30, 2023:
| | Level 1 ($) | Level 2 ($) | Level 3 ($) | Total ($) |
| Investments in Securities | | | | |
| Money Market Funds | 49,074,952 | — | — | 49,074,952 |
| Total Investments in Securities | 49,074,952 | — | — | 49,074,952 |
See the Portfolio of Investments for all investment classifications not indicated in the table.
The accompanying Notes to Financial Statements are an integral part of this statement.
Columbia Virginia Intermediate Municipal Bond Fund | Annual Report 2023
| 9 |
Statement of Assets and Liabilities
April 30, 2023
| Assets | |
| Investments in securities, at value | |
| Unaffiliated issuers (cost $49,074,952) | $49,074,952 |
| Receivable for: | |
| Capital shares sold | 45,667 |
| Dividends | 34,796 |
| Expense reimbursement due from Investment Manager | 342 |
| Prepaid expenses | 1,047 |
| Total assets | 49,156,804 |
| Liabilities | |
| Payable for: | |
| Capital shares purchased | 787,582 |
| Distributions to shareholders | 65,888 |
| Management services fees | 629 |
| Distribution and/or service fees | 140 |
| Transfer agent fees | 3,156 |
| Compensation of board members | 113,591 |
| Other expenses | 19,281 |
| Total liabilities | 990,267 |
| Net assets applicable to outstanding capital stock | $48,166,537 |
| Represented by | |
| Paid in capital | 55,258,535 |
| Total distributable earnings (loss) | (7,091,998) |
| Total - representing net assets applicable to outstanding capital stock | $48,166,537 |
| Class A | |
| Net assets | $16,639,182 |
| Shares outstanding | 1,744,183 |
| Net asset value per share | $9.54 |
| Maximum sales charge | 3.00% |
| Maximum offering price per share (calculated by dividing the net asset value per share by 1.0 minus the maximum sales charge for Class A shares) | $9.84 |
| Advisor Class | |
| Net assets | $1,712,926 |
| Shares outstanding | 179,434 |
| Net asset value per share | $9.55 |
| Class C | |
| Net assets | $932,789 |
| Shares outstanding | 97,708 |
| Net asset value per share | $9.55 |
| Institutional Class | |
| Net assets | $18,260,076 |
| Shares outstanding | 1,914,624 |
| Net asset value per share | $9.54 |
| Institutional 3 Class | |
| Net assets | $10,621,564 |
| Shares outstanding | 1,111,061 |
| Net asset value per share | $9.56 |
The accompanying Notes to Financial Statements are an integral part of this statement.
| 10 | Columbia Virginia Intermediate Municipal Bond Fund | Annual Report 2023 |
Statement of Operations
Year Ended April 30, 2023
| Net investment income | |
| Income: | |
| Dividends — unaffiliated issuers | $70,916 |
| Interest | 2,672,425 |
| Total income | 2,743,341 |
| Expenses: | |
| Management services fees | 404,219 |
| Distribution and/or service fees | |
| Class A | 58,498 |
| Class C | 11,697 |
| Transfer agent fees | |
| Class A | 20,869 |
| Advisor Class | 2,254 |
| Class C | 1,044 |
| Institutional Class | 18,423 |
| Institutional 3 Class | 2,402 |
| Compensation of board members | 6,664 |
| Custodian fees | 1,445 |
| Printing and postage fees | 16,022 |
| Registration fees | 14,317 |
| Accounting services fees | 30,090 |
| Legal fees | 13,753 |
| Interest on interfund lending | 2,025 |
| Compensation of chief compliance officer | 15 |
| Other | 14,586 |
| Total expenses | 618,323 |
| Fees waived or expenses reimbursed by Investment Manager and its affiliates | (96,891) |
| Expense reduction | (20) |
| Total net expenses | 521,412 |
| Net investment income | 2,221,929 |
| Realized and unrealized gain (loss) — net | |
| Net realized gain (loss) on: | |
| Investments — unaffiliated issuers | (6,715,887) |
| Net realized loss | (6,715,887) |
| Net change in unrealized appreciation (depreciation) on: | |
| Investments — unaffiliated issuers | 4,832,018 |
| Net change in unrealized appreciation (depreciation) | 4,832,018 |
| Net realized and unrealized loss | (1,883,869) |
| Net increase in net assets resulting from operations | $338,060 |
The accompanying Notes to Financial Statements are an integral part of this statement.
Columbia Virginia Intermediate Municipal Bond Fund | Annual Report 2023
| 11 |
Statement of Changes in Net Assets
| | Year Ended
April 30, 2023 | Year Ended
April 30, 2022 |
| Operations | | |
| Net investment income | $2,221,929 | $2,659,708 |
| Net realized gain (loss) | (6,715,887) | 172,287 |
| Net change in unrealized appreciation (depreciation) | 4,832,018 | (11,605,134) |
| Net increase (decrease) in net assets resulting from operations | 338,060 | (8,773,139) |
| Distributions to shareholders | | |
| Net investment income and net realized gains | | |
| Class A | (524,932) | (662,548) |
| Advisor Class | (63,443) | (69,204) |
| Class C | (17,722) | (26,297) |
| Institutional Class | (518,008) | (566,719) |
| Institutional 3 Class | (985,092) | (1,925,905) |
| Total distributions to shareholders | (2,109,197) | (3,250,673) |
| Decrease in net assets from capital stock activity | (57,166,763) | (23,101,611) |
| Total decrease in net assets | (58,937,900) | (35,125,423) |
| Net assets at beginning of year | 107,104,437 | 142,229,860 |
| Net assets at end of year | $48,166,537 | $107,104,437 |
The accompanying Notes to Financial Statements are an integral part of this statement.
| 12 | Columbia Virginia Intermediate Municipal Bond Fund | Annual Report 2023 |
Statement of Changes in Net Assets (continued)
| | Year Ended | Year Ended |
| | April 30, 2023 | April 30, 2022 |
| | Shares | Dollars ($) | Shares | Dollars ($) |
| Capital stock activity |
| Class A | | | | |
| Subscriptions | 1,181,868 | 11,588,756 | 334,671 | 3,552,896 |
| Distributions reinvested | 37,460 | 362,089 | 43,654 | 459,916 |
| Redemptions | (2,103,316) | (20,291,598) | (483,983) | (5,010,014) |
| Net decrease | (883,988) | (8,340,753) | (105,658) | (997,202) |
| Advisor Class | | | | |
| Subscriptions | 88,069 | 840,116 | 212,914 | 2,282,013 |
| Distributions reinvested | 6,147 | 59,426 | 5,397 | 56,657 |
| Redemptions | (209,995) | (2,027,340) | (130,437) | (1,375,418) |
| Net increase (decrease) | (115,779) | (1,127,798) | 87,874 | 963,252 |
| Class C | | | | |
| Subscriptions | 22,551 | 217,283 | 10,425 | 112,380 |
| Distributions reinvested | 1,785 | 17,250 | 2,363 | 25,037 |
| Redemptions | (54,450) | (525,102) | (67,262) | (712,524) |
| Net decrease | (30,114) | (290,569) | (54,474) | (575,107) |
| Institutional Class | | | | |
| Subscriptions | 759,074 | 7,342,096 | 229,441 | 2,443,592 |
| Distributions reinvested | 43,297 | 418,007 | 42,088 | 443,610 |
| Redemptions | (923,495) | (8,921,052) | (488,357) | (5,156,820) |
| Net decrease | (121,124) | (1,160,949) | (216,828) | (2,269,618) |
| Institutional 3 Class | | | | |
| Subscriptions | 404,024 | 3,914,963 | 301,861 | 3,227,555 |
| Distributions reinvested | 9,656 | 93,428 | 8,388 | 88,741 |
| Redemptions | (5,185,932) | (50,255,085) | (2,246,602) | (23,539,232) |
| Net decrease | (4,772,252) | (46,246,694) | (1,936,353) | (20,222,936) |
| Total net decrease | (5,923,257) | (57,166,763) | (2,225,439) | (23,101,611) |
The accompanying Notes to Financial Statements are an integral part of this statement.
Columbia Virginia Intermediate Municipal Bond Fund | Annual Report 2023
| 13 |
The following table is intended to help you understand the Fund’s financial performance. Certain information reflects financial results for a single share of a class held for the periods shown. Per share net investment income (loss) amounts are calculated based on average shares outstanding during the period. Total return assumes reinvestment of all dividends and distributions, if any. Total return does not reflect payment of sales charges, if any. Total return and portfolio turnover are not annualized for periods of less than one year. The ratios of expenses and net investment income are annualized for periods of less than one year. The portfolio turnover rate is calculated without regard to purchase and sales transactions of short-term instruments and certain derivatives, if any. If such transactions were included, the Fund’s portfolio turnover rate may be higher.
| | Net asset value,
beginning of
period | Net
investment
income | Net
realized
and
unrealized
gain (loss) | Total from
investment
operations | Distributions
from net
investment
income | Distributions
from net
realized
gains | Total
distributions to
shareholders |
| Class A |
| Year Ended 4/30/2023 | $9.75 | 0.23 | (0.22) | 0.01 | (0.22) | — | (0.22) |
| Year Ended 4/30/2022 | $10.76 | 0.19 | (0.96) | (0.77) | (0.20) | (0.04) | (0.24) |
| Year Ended 4/30/2021 | $10.43 | 0.22 | 0.34 | 0.56 | (0.22) | (0.01) | (0.23) |
| Year Ended 4/30/2020 | $10.55 | 0.26 | (0.11) | 0.15 | (0.27) | (0.00)(e) | (0.27) |
| Year Ended 4/30/2019 | $10.44 | 0.27 | 0.21 | 0.48 | (0.29) | (0.08) | (0.37) |
| Advisor Class |
| Year Ended 4/30/2023 | $9.76 | 0.26 | (0.23) | 0.03 | (0.24) | — | (0.24) |
| Year Ended 4/30/2022 | $10.77 | 0.21 | (0.96) | (0.75) | (0.22) | (0.04) | (0.26) |
| Year Ended 4/30/2021 | $10.43 | 0.25 | 0.35 | 0.60 | (0.25) | (0.01) | (0.26) |
| Year Ended 4/30/2020 | $10.55 | 0.29 | (0.12) | 0.17 | (0.29) | (0.00)(e) | (0.29) |
| Year Ended 4/30/2019 | $10.44 | 0.30 | 0.20 | 0.50 | (0.31) | (0.08) | (0.39) |
| Class C |
| Year Ended 4/30/2023 | $9.76 | 0.16 | (0.22) | (0.06) | (0.15) | — | (0.15) |
| Year Ended 4/30/2022 | $10.77 | 0.11 | (0.96) | (0.85) | (0.12) | (0.04) | (0.16) |
| Year Ended 4/30/2021 | $10.44 | 0.14 | 0.34 | 0.48 | (0.14) | (0.01) | (0.15) |
| Year Ended 4/30/2020 | $10.55 | 0.18 | (0.10) | 0.08 | (0.19) | (0.00)(e) | (0.19) |
| Year Ended 4/30/2019 | $10.45 | 0.20 | 0.19 | 0.39 | (0.21) | (0.08) | (0.29) |
| Institutional Class |
| Year Ended 4/30/2023 | $9.75 | 0.26 | (0.23) | 0.03 | (0.24) | — | (0.24) |
| Year Ended 4/30/2022 | $10.76 | 0.22 | (0.97) | (0.75) | (0.22) | (0.04) | (0.26) |
| Year Ended 4/30/2021 | $10.43 | 0.25 | 0.34 | 0.59 | (0.25) | (0.01) | (0.26) |
| Year Ended 4/30/2020 | $10.54 | 0.29 | (0.11) | 0.18 | (0.29) | (0.00)(e) | (0.29) |
| Year Ended 4/30/2019 | $10.44 | 0.30 | 0.20 | 0.50 | (0.32) | (0.08) | (0.40) |
The accompanying Notes to Financial Statements are an integral part of this statement.
| 14 | Columbia Virginia Intermediate Municipal Bond Fund | Annual Report 2023 |
Financial Highlights (continued)
| | Net
asset
value,
end of
period | Total
return | Total gross
expense
ratio to
average
net assets(a) | Total net
expense
ratio to
average
net assets(a),(b) | Net investment
income
ratio to
average
net assets | Portfolio
turnover | Net
assets,
end of
period
(000’s) |
| Class A |
| Year Ended 4/30/2023 | $9.54 | 0.07% | 0.93%(c) | 0.81%(c),(d) | 2.38% | 9% | $16,639 |
| Year Ended 4/30/2022 | $9.75 | (7.32%) | 0.90% | 0.81%(d) | 1.80% | 11% | $25,627 |
| Year Ended 4/30/2021 | $10.76 | 5.42% | 0.91% | 0.81% | 2.07% | 10% | $29,427 |
| Year Ended 4/30/2020 | $10.43 | 1.35% | 0.87% | 0.81% | 2.47% | 12% | $24,036 |
| Year Ended 4/30/2019 | $10.55 | 4.69% | 0.88% | 0.81%(d) | 2.63% | 13% | $23,706 |
| Advisor Class |
| Year Ended 4/30/2023 | $9.55 | 0.32% | 0.68%(c) | 0.56%(c),(d) | 2.64% | 9% | $1,713 |
| Year Ended 4/30/2022 | $9.76 | (7.08%) | 0.64% | 0.56%(d) | 2.02% | 11% | $2,881 |
| Year Ended 4/30/2021 | $10.77 | 5.78% | 0.66% | 0.56% | 2.31% | 10% | $2,233 |
| Year Ended 4/30/2020 | $10.43 | 1.60% | 0.61% | 0.55% | 2.70% | 12% | $666 |
| Year Ended 4/30/2019 | $10.55 | 4.95% | 0.63% | 0.56%(d) | 2.87% | 13% | $274 |
| Class C |
| Year Ended 4/30/2023 | $9.55 | (0.66%) | 1.68%(c) | 1.56%(c),(d) | 1.64% | 9% | $933 |
| Year Ended 4/30/2022 | $9.76 | (8.01%) | 1.65% | 1.56%(d) | 1.08% | 11% | $1,248 |
| Year Ended 4/30/2021 | $10.77 | 4.63% | 1.66% | 1.56% | 1.32% | 10% | $1,964 |
| Year Ended 4/30/2020 | $10.44 | 0.69% | 1.62% | 1.56% | 1.73% | 12% | $1,976 |
| Year Ended 4/30/2019 | $10.55 | 3.81% | 1.63% | 1.56%(d) | 1.88% | 13% | $2,786 |
| Institutional Class |
| Year Ended 4/30/2023 | $9.54 | 0.32% | 0.69%(c) | 0.56%(c),(d) | 2.65% | 9% | $18,260 |
| Year Ended 4/30/2022 | $9.75 | (7.09%) | 0.65% | 0.56%(d) | 2.06% | 11% | $19,848 |
| Year Ended 4/30/2021 | $10.76 | 5.68% | 0.66% | 0.56% | 2.32% | 10% | $24,243 |
| Year Ended 4/30/2020 | $10.43 | 1.70% | 0.62% | 0.55% | 2.72% | 12% | $24,546 |
| Year Ended 4/30/2019 | $10.54 | 4.86% | 0.63% | 0.56%(d) | 2.88% | 13% | $22,698 |
The accompanying Notes to Financial Statements are an integral part of this statement.
Columbia Virginia Intermediate Municipal Bond Fund | Annual Report 2023
| 15 |
Financial Highlights (continued)
| | Net asset value,
beginning of
period | Net
investment
income | Net
realized
and
unrealized
gain (loss) | Total from
investment
operations | Distributions
from net
investment
income | Distributions
from net
realized
gains | Total
distributions to
shareholders |
| Institutional 3 Class |
| Year Ended 4/30/2023 | $9.77 | 0.26 | (0.22) | 0.04 | (0.25) | — | (0.25) |
| Year Ended 4/30/2022 | $10.79 | 0.23 | (0.98) | (0.75) | (0.23) | (0.04) | (0.27) |
| Year Ended 4/30/2021 | $10.45 | 0.26 | 0.35 | 0.61 | (0.26) | (0.01) | (0.27) |
| Year Ended 4/30/2020 | $10.57 | 0.30 | (0.12) | 0.18 | (0.30) | (0.00)(e) | (0.30) |
| Year Ended 4/30/2019 | $10.46 | 0.31 | 0.21 | 0.52 | (0.33) | (0.08) | (0.41) |
| Notes to Financial Highlights |
| (a) | In addition to the fees and expenses that the Fund bears directly, the Fund indirectly bears a pro rata share of the fees and expenses of any other funds in which it invests. Such indirect expenses are not included in the Fund’s reported expense ratios. |
| (b) | Total net expenses include the impact of certain fee waivers/expense reimbursements made by the Investment Manager and certain of its affiliates, if applicable. |
| (c) | Ratios include interfund lending expense which is less than 0.01%. |
| (d) | The benefits derived from expense reductions had an impact of less than 0.01%. |
| (e) | Rounds to zero. |
The accompanying Notes to Financial Statements are an integral part of this statement.
| 16 | Columbia Virginia Intermediate Municipal Bond Fund | Annual Report 2023 |
Financial Highlights (continued)
| | Net
asset
value,
end of
period | Total
return | Total gross
expense
ratio to
average
net assets(a) | Total net
expense
ratio to
average
net assets(a),(b) | Net investment
income
ratio to
average
net assets | Portfolio
turnover | Net
assets,
end of
period
(000’s) |
| Institutional 3 Class |
| Year Ended 4/30/2023 | $9.56 | 0.41% | 0.58%(c) | 0.48%(c) | 2.70% | 9% | $10,622 |
| Year Ended 4/30/2022 | $9.77 | (7.08%) | 0.56% | 0.48% | 2.14% | 11% | $57,501 |
| Year Ended 4/30/2021 | $10.79 | 5.86% | 0.58% | 0.47% | 2.40% | 10% | $84,363 |
| Year Ended 4/30/2020 | $10.45 | 1.69% | 0.53% | 0.47% | 2.81% | 12% | $87,804 |
| Year Ended 4/30/2019 | $10.57 | 5.04% | 0.54% | 0.47% | 2.97% | 13% | $88,421 |
The accompanying Notes to Financial Statements are an integral part of this statement.
Columbia Virginia Intermediate Municipal Bond Fund | Annual Report 2023
| 17 |
Notes to Financial Statements
April 30, 2023
Note 1. Organization
Columbia Virginia Intermediate Municipal Bond Fund (the Fund), a series of Columbia Funds Series Trust (the Trust), is a diversified fund. The Trust is registered under the Investment Company Act of 1940, as amended (the 1940 Act), as an open-end management investment company organized as a Delaware statutory trust.
Fund shares
The Trust may issue an unlimited number of shares (without par value). The Fund offers each of the share classes listed in the Statement of Assets and Liabilities. Although all share classes generally have identical voting, dividend and liquidation rights, each share class votes separately when required by the Trust’s organizational documents or by law. Each share class has its own expense and sales charge structure. Different share classes may have different minimum initial investment amounts and pay different net investment income distribution amounts to the extent the expenses of distributing such share classes vary. Distributions to shareholders in a liquidation will be proportional to the net asset value of each share class.
As described in the Fund’s prospectus, Class A and Class C shares are offered to the general public for investment. Class C shares automatically convert to Class A shares after 8 years. Advisor Class, Institutional Class and Institutional 3 Class shares are available through authorized investment professionals to omnibus retirement plans or to institutional investors and to certain other investors as also described in the Fund’s prospectus.
The Board of Trustees of the Fund approved a Plan of Liquidation and Termination pursuant to which the Fund was liquidated and terminated. Effective at the open of business on April 14, 2023, the Fund was closed to new investors, and any applicable contingent deferred sales charges were waived on redemptions and exchanges out of the Fund. The Fund was liquidated on May 5, 2023, at which time the Fund’s shareholders received a liquidating distribution in an amount equal to the net asset value of their Fund shares.
Note 2. Summary of significant accounting policies
Basis of preparation
The Fund is an investment company that applies the accounting and reporting guidance in the Financial Accounting Standards Board (FASB) Accounting Standards Codification Topic 946, Financial Services - Investment Companies (ASC 946). The financial statements are prepared in accordance with U.S. generally accepted accounting principles (GAAP), which requires management to make certain estimates and assumptions that affect the reported amounts of assets and liabilities, the disclosure of contingent assets and liabilities at the date of the financial statements and the reported amounts of income and expenses during the reporting period. Actual results could differ from those estimates.
The following is a summary of significant accounting policies followed by the Fund in the preparation of its financial statements.
Security valuation
Investments in open-end investment companies (other than exchange-traded funds (ETFs)), are valued at the latest net asset value reported by those companies as of the valuation time.
Investments for which market quotations are not readily available, or that have quotations which management believes are not reflective of market value or reliable, are valued at fair value as determined in good faith under procedures approved by the Board of Trustees. If a security or class of securities (such as foreign securities) is valued at fair value, such value is likely to be different from the quoted or published price for the security, if available.
The determination of fair value often requires significant judgment. To determine fair value, management may use assumptions including but not limited to future cash flows and estimated risk premiums. Multiple inputs from various sources may be used to determine fair value.
GAAP requires disclosure regarding the inputs and valuation techniques used to measure fair value and any changes in valuation inputs or techniques. In addition, investments shall be disclosed by major category. This information is disclosed following the Fund’s Portfolio of Investments.
| 18 | Columbia Virginia Intermediate Municipal Bond Fund | Annual Report 2023 |
Notes to Financial Statements (continued)
April 30, 2023
Security transactions
Security transactions are accounted for on the trade date. Cost is determined and gains (losses) are based upon the specific identification method for both financial statement and federal income tax purposes.
Income recognition
Interest income is recorded on an accrual basis. Market premiums and discounts, including original issue discounts, are amortized and accreted, respectively, over the expected life of the security on all debt securities, unless otherwise noted.
The Fund may place a debt security on non-accrual status and reduce related interest income when it becomes probable that the interest will not be collected and the amount of uncollectible interest can be reasonably estimated. The Fund may also adjust accrual rates when it becomes probable the full interest will not be collected and a partial payment will be received. A defaulted debt security is removed from non-accrual status when the issuer resumes interest payments or when collectability of interest is reasonably assured.
Dividend income is recorded on the ex-dividend date.
Expenses
General expenses of the Trust are allocated to the Fund and other funds of the Trust based upon relative net assets or other expense allocation methodologies determined by the nature of the expense. Expenses directly attributable to the Fund are charged to the Fund. Expenses directly attributable to a specific class of shares are charged to that share class.
Determination of class net asset value
All income, expenses (other than class-specific expenses, which are charged to that share class, as shown in the Statement of Operations) and realized and unrealized gains (losses) are allocated to each class of the Fund on a daily basis, based on the relative net assets of each class, for purposes of determining the net asset value of each class.
Federal income tax status
The Fund intends to qualify each year as a regulated investment company under Subchapter M of the Internal Revenue Code, as amended, and will distribute substantially all of its net tax-exempt and investment company taxable income and net capital gain, if any, for its tax year, and as such will not be subject to federal income taxes. In addition, the Fund intends to distribute in each calendar year substantially all of its ordinary income, capital gain net income and certain other amounts, if any, such that the Fund should not be subject to federal excise tax. Therefore, no federal income or excise tax provision is recorded.
Distributions to shareholders
Distributions from net investment income, if any, are declared daily and paid monthly. Net realized capital gains, if any, are distributed at least annually. Income distributions and capital gain distributions are determined in accordance with federal income tax regulations, which may differ from GAAP.
Guarantees and indemnifications
Under the Trust’s organizational documents and, in some cases, by contract, its officers and trustees are indemnified against certain liabilities arising out of the performance of their duties to the Trust or its funds. In addition, certain of the Fund’s contracts with its service providers contain general indemnification clauses. The Fund’s maximum exposure under these arrangements is unknown since the amount of any future claims that may be made against the Fund cannot be determined, and the Fund has no historical basis for predicting the likelihood of any such claims.
Recent accounting pronouncement
Tailored Shareholder Reports
In October 2022, the Securities and Exchange Commission (SEC) adopted a final rule relating to Tailored Shareholder Reports for Mutual Funds and Exchange-Traded Funds; Fee Information in Investment Company Advertisements. The rule and form amendments will, among other things, require the Fund to transmit concise and visually engaging shareholder reports
Columbia Virginia Intermediate Municipal Bond Fund | Annual Report 2023
| 19 |
Notes to Financial Statements (continued)
April 30, 2023
that highlight key information. The amendments will require that funds tag information in a structured data format and that certain more in-depth information be made available online and available for delivery free of charge to investors on request. The amendments became effective January 24, 2023. There is an 18-month transition period after the effective date of the amendment.
Note 3. Fees and other transactions with affiliates
Management services fees
The Fund has entered into a Management Agreement with Columbia Management Investment Advisers, LLC (the Investment Manager), a wholly-owned subsidiary of Ameriprise Financial, Inc. (Ameriprise Financial). Under the Management Agreement, the Investment Manager provides the Fund with investment research and advice, as well as administrative and accounting services. The management services fee is an annual fee that is equal to a percentage of the Fund’s daily net assets that declines from 0.47% to 0.31% as the Fund’s net assets increase. The effective management services fee rate for the year ended April 30, 2023 was 0.47% of the Fund’s average daily net assets.
Compensation of board members
Members of the Board of Trustees who are not officers or employees of the Investment Manager or Ameriprise Financial are compensated for their services to the Fund as disclosed in the Statement of Operations. Under a Deferred Compensation Plan (the Deferred Plan), these members of the Board of Trustees may elect to defer payment of up to 100% of their compensation. Deferred amounts are treated as though equivalent dollar amounts had been invested in shares of certain funds managed by the Investment Manager. The Fund’s liability for these amounts is adjusted for market value changes and remains in the Fund until distributed in accordance with the Deferred Plan. All amounts payable under the Deferred Plan constitute a general unsecured obligation of the Fund. The expense for the Deferred Plan, which includes Trustees’ fees deferred during the current period as well as any gains or losses on the Trustees’ deferred compensation balances as a result of market fluctuations, is included in "Compensation of board members" in the Statement of Operations.
Compensation of Chief Compliance Officer
The Board of Trustees has appointed a Chief Compliance Officer for the Fund in accordance with federal securities regulations. As disclosed in the Statement of Operations, a portion of the Chief Compliance Officer’s total compensation is allocated to the Fund, along with other allocations to affiliated registered investment companies managed by the Investment Manager and its affiliates, based on relative net assets.
Transfer agency fees
Under a Transfer and Dividend Disbursing Agent Agreement, Columbia Management Investment Services Corp. (the Transfer Agent), an affiliate of the Investment Manager and a wholly-owned subsidiary of Ameriprise Financial, is responsible for providing transfer agency services to the Fund. The Transfer Agent has contracted with SS&C GIDS, Inc. (SS&C GIDS) to serve as sub-transfer agent. Prior to January 1, 2023, SS&C GIDS was known as DST Asset Manager Solutions, Inc. The Transfer Agent pays the fees of SS&C GIDS for services as sub-transfer agent and SS&C GIDS is not entitled to reimbursement for such fees from the Fund (with the exception of out-of-pocket fees).
The Fund pays the Transfer Agent a monthly transfer agency fee based on the number or the average value of accounts, depending on the type of account. In addition, the Fund pays the Transfer Agent a fee for shareholder services based on the number of accounts or on a percentage of the average aggregate value of the Fund’s shares maintained in omnibus accounts up to the lesser of the amount charged by the financial intermediary or a cap established by the Board of Trustees from time to time.
The Transfer Agent also receives compensation from the Fund for various shareholder services and reimbursements for certain out-of-pocket fees. Total transfer agency fees for Institutional 3 Class shares are subject to an annual limitation of not more than 0.02% of the average daily net assets attributable to Institutional 3 Class shares.
| 20 | Columbia Virginia Intermediate Municipal Bond Fund | Annual Report 2023 |
Notes to Financial Statements (continued)
April 30, 2023
For the year ended April 30, 2023, the Fund’s effective transfer agency fee rates as a percentage of average daily net assets of each class were as follows:
| | Effective rate (%) |
| Class A | 0.09 |
| Advisor Class | 0.09 |
| Class C | 0.09 |
| Institutional Class | 0.09 |
| Institutional 3 Class | 0.01 |
An annual minimum account balance fee of $20 may apply to certain accounts with a value below the applicable share class’s initial minimum investment requirements to reduce the impact of small accounts on transfer agency fees. These minimum account balance fees are remitted to the Fund and recorded as part of expense reductions in the Statement of Operations. For the year ended April 30, 2023, these minimum account balance fees reduced total expenses of the Fund by $20.
Distribution and service fees
The Fund has entered into an agreement with Columbia Management Investment Distributors, Inc. (the Distributor), an affiliate of the Investment Manager and a wholly-owned subsidiary of Ameriprise Financial, for distribution and shareholder services. The Board of Trustees has approved, and the Fund has adopted, distribution and shareholder service plans (the Plans) applicable to certain share classes, which set the distribution and service fees for the Fund. These fees are calculated daily and are intended to compensate the Distributor and/or eligible selling and/or servicing agents for selling shares of the Fund and providing services to investors.
Under the Plans, the Fund pays a monthly combined distribution and service fee to the Distributor at the maximum annual rate of 0.25% of the average daily net assets attributable to Class A shares of the Fund. Also under the Plans, the Fund pays a monthly service fee to the Distributor at the maximum annual rate of 0.25% of the average daily net assets attributable to Class C shares of the Fund and a monthly distribution fee to the Distributor at the maximum annual rate of 0.75% of the average daily net assets attributable to Class C shares of the Fund.
Sales charges (unaudited)
Sales charges, including front-end charges and contingent deferred sales charges (CDSCs), received by the Distributor for distributing Fund shares for the year ended April 30, 2023, if any, are listed below:
| | Front End (%) | CDSC (%) | Amount ($) |
| Class A | 3.00 | 0.75(a) | 6,709 |
| Class C | — | 1.00(b) | — |
| (a) | This charge is imposed on certain investments of $500,000 or more if redeemed within 12 months after purchase. |
| (b) | This charge applies to redemptions within 12 months after purchase, with certain limited exceptions. |
The Fund’s other share classes are not subject to sales charges.
Columbia Virginia Intermediate Municipal Bond Fund | Annual Report 2023
| 21 |
Notes to Financial Statements (continued)
April 30, 2023
Expenses waived/reimbursed by the Investment Manager and its affiliates
The Investment Manager and certain of its affiliates have contractually agreed to waive fees and/or reimburse expenses (excluding certain fees and expenses described below) for the period(s) disclosed below, unless sooner terminated at the sole discretion of the Board of Trustees, so that the Fund’s net operating expenses, after giving effect to fees waived/expenses reimbursed and any balance credits and/or overdraft charges from the Fund’s custodian, do not exceed the following annual rate(s) as a percentage of the classes’ average daily net assets:
| | Fee rate(s) contractual
through
August 31, 2023 |
| Class A | 0.81% |
| Advisor Class | 0.56 |
| Class C | 1.56 |
| Institutional Class | 0.56 |
| Institutional 3 Class | 0.48 |
Under the agreement governing these fee waivers and/or expense reimbursement arrangements, the following fees and expenses are excluded from the waiver/reimbursement commitment, and therefore will be paid by the Fund, if applicable: taxes (including foreign transaction taxes), expenses associated with investments in affiliated and non-affiliated pooled investment vehicles (including mutual funds and exchange-traded funds), transaction costs and brokerage commissions, costs related to any securities lending program, dividend expenses associated with securities sold short, inverse floater program fees and expenses, transaction charges and interest on borrowed money, interest, costs associated with shareholder meetings, infrequent and/or unusual expenses and any other expenses the exclusion of which is specifically approved by the Board of Trustees. This agreement may be modified or amended only with approval from the Investment Manager, certain of its affiliates and the Fund. Any fees waived and/or expenses reimbursed under the expense reimbursement arrangements described above are not recoverable by the Investment Manager or its affiliates in future periods.
Note 4. Federal tax information
The timing and character of income and capital gain distributions are determined in accordance with income tax regulations, which may differ from GAAP because of temporary or permanent book to tax differences.
At April 30, 2023, these differences were primarily due to differing treatment for capital loss carryforwards, trustees’ deferred compensation, distributions, re-characterization of distributions for investments and defaulted securities/troubled debt. To the extent these differences were permanent, reclassifications were made among the components of the Fund’s net assets. Temporary differences do not require reclassifications.
The following reclassifications were made:
Excess of distributions
over net investment
income ($) | Accumulated
net realized
(loss) ($) | Paid in
capital ($) |
| 5,827 | (5,827) | — |
Net investment income (loss) and net realized gains (losses), as disclosed in the Statement of Operations, and net assets were not affected by this reclassification.
The tax character of distributions paid during the years indicated was as follows:
| Year Ended April 30, 2023 | Year Ended April 30, 2022 |
Ordinary
income ($) | Tax-exempt
income ($) | Long-term
capital gains ($) | Total ($) | Ordinary
income ($) | Tax-exempt
income ($) | Long-term
capital gains ($) | Total ($) |
| 50,134 | 2,059,063 | — | 2,109,197 | 61,990 | 2,708,940 | 479,743 | 3,250,673 |
Short-term capital gain distributions, if any, are considered ordinary income distributions for tax purposes.
| 22 | Columbia Virginia Intermediate Municipal Bond Fund | Annual Report 2023 |
Notes to Financial Statements (continued)
April 30, 2023
At April 30, 2023, the components of distributable earnings on a tax basis were as follows:
Undistributed
ordinary income ($) | Undistributed tax-
exempt income ($) | Undistributed
long-term
capital gains ($) | Capital loss
carryforwards ($) | Net unrealized
appreciation ($) |
| — | 107,314 | — | (7,021,053) | — |
At April 30, 2023, the cost of all investments for federal income tax purposes along with the aggregate gross unrealized appreciation and depreciation based on that cost was:
Federal
tax cost ($) | Gross unrealized
appreciation ($) | Gross unrealized
(depreciation) ($) | Net unrealized
appreciation ($) |
| 49,074,952 | — | — | — |
Tax cost of investments and unrealized appreciation/(depreciation) may also include timing differences that do not constitute adjustments to tax basis.
The following capital loss carryforwards, determined at April 30, 2023, may be available to reduce future net realized gains on investments, if any, to the extent permitted by the Internal Revenue Code. In addition, for the year ended April 30, 2023, capital loss carryforwards utilized, if any, were as follows:
No expiration
short-term ($) | No expiration
long-term ($) | Total ($) | Utilized ($) |
| (538,742) | (6,482,311) | (7,021,053) | — |
Under current tax rules, regulated investment companies can elect to treat certain late-year ordinary losses incurred and post-October capital losses (capital losses realized after October 31) as arising on the first day of the following taxable year. The Fund will elect to treat the following late-year ordinary losses and post-October capital losses at April 30, 2022 as arising on May 1, 2022.
Management of the Fund has concluded that there are no significant uncertain tax positions in the Fund that would require recognition in the financial statements. However, management’s conclusion may be subject to review and adjustment at a later date based on factors including, but not limited to, new tax laws, regulations, and administrative interpretations (including relevant court decisions). Generally, the Fund’s federal tax returns for the prior three fiscal years remain subject to examination by the Internal Revenue Service.
Note 5. Portfolio information
The cost of purchases and proceeds from sales of securities, excluding short-term investments and derivatives, if any, aggregated to $7,982,114 and $112,216,537, respectively, for the year ended April 30, 2023. The amount of purchase and sale activity impacts the portfolio turnover rate reported in the Financial Highlights.
Note 6. Interfund lending
Pursuant to an exemptive order granted by the Securities and Exchange Commission, the Fund participates in a program (the Interfund Program) allowing each participating Columbia Fund (each, a Participating Fund) to lend money directly to and, except for closed-end funds and money market funds, borrow money directly from other Participating Funds for temporary purposes. The amounts eligible for borrowing and lending under the Interfund Program are subject to certain restrictions.
Interfund loans are subject to the risk that the borrowing fund could be unable to repay the loan when due, and a delay in repayment to the lending fund could result in lost opportunities and/or additional lending costs. The exemptive order is subject to conditions intended to mitigate conflicts of interest arising from the Investment Manager’s relationship with each Participating Fund.
Columbia Virginia Intermediate Municipal Bond Fund | Annual Report 2023
| 23 |
Notes to Financial Statements (continued)
April 30, 2023
The Fund’s activity in the Interfund Program during the year ended April 30, 2023 was as follows:
| Borrower or lender | Average loan
balance ($) | Weighted average
interest rate (%) | Number of days
with outstanding loans |
| Borrower | 1,088,235 | 3.54 | 17 |
Interest expense incurred by the Fund is recorded as Interfund lending in the Statement of Operations. The Fund had no outstanding interfund loans at April 30, 2023.
Note 7. Line of credit
The Fund has access to a revolving credit facility with a syndicate of banks led by JPMorgan Chase Bank, N.A., Citibank, N.A. and Wells Fargo Bank, N.A. whereby the Fund may borrow for the temporary funding of shareholder redemptions or for other temporary or emergency purposes. Pursuant to an October 27, 2022 amendment and restatement, the credit facility, which is an agreement between the Fund and certain other funds managed by the Investment Manager or an affiliated investment manager, severally and not jointly, permits aggregate borrowings up to $950 million. Interest is currently charged to each participating fund based on its borrowings at a rate equal to the higher of (i) the federal funds effective rate, (ii) the secured overnight financing rate plus 0.10% and (iii) the overnight bank funding rate, plus in each case, 1.00%. Each borrowing under the credit facility matures no later than 60 days after the date of borrowing. The Fund also pays a commitment fee equal to its pro rata share of the unused amount of the credit facility at a rate of 0.15% per annum. The commitment fee is included in other expenses in the Statement of Operations. This agreement expires annually in October unless extended or renewed. Prior to the October 27, 2022 amendment and restatement, the Fund had access to a revolving credit facility with a syndicate of banks led by JPMorgan Chase Bank, N.A., Citibank, N.A. and Wells Fargo Bank, N.A. which permitted collective borrowings up to $950 million. Interest was charged to each participating fund based on its borrowings at a rate equal to the higher of (i) the federal funds effective rate, (ii) the secured overnight financing rate plus 0.11448% and (iii) the overnight bank funding rate, plus in each case, 1.00%.
The Fund had no borrowings during the year ended April 30, 2023.
Note 8. Significant risks
Market risk
The Fund may incur losses due to declines in the value of one or more securities in which it invests. These declines may be due to factors affecting a particular issuer, or the result of, among other things, political, regulatory, market, economic or social developments affecting the relevant market(s) more generally. In addition, turbulence in financial markets and reduced liquidity in equity, credit and/or fixed income markets may negatively affect many issuers, which could adversely affect the Fund’s ability to price or value hard-to-value assets in thinly traded and closed markets and could cause significant redemptions and operational challenges. Global economies and financial markets are increasingly interconnected, and conditions and events in one country, region or financial market may adversely impact issuers in a different country, region or financial market. These risks may be magnified if certain events or developments adversely interrupt the global supply chain; in these and other circumstances, such risks might affect companies worldwide. As a result, local, regional or global events such as terrorism, war, natural disasters, disease/virus outbreaks and epidemics or other public health issues, recessions, depressions or other events – or the potential for such events – could have a significant negative impact on global economic and market conditions.
Money market fund investment risk
An investment in a money market fund is not a bank deposit and is not insured or guaranteed by any bank, the FDIC or any other government agency. Certain money market funds float their net asset value while others seek to preserve the value of investments at a stable net asset value (typically, $1.00 per share). An investment in a money market fund, even an investment in a fund seeking to maintain a stable net asset value per share, is not guaranteed and it is possible for the Fund to lose money by investing in these and other types of money market funds. If the liquidity of a money market fund’s portfolio deteriorates below certain levels, the money market fund may suspend redemptions (i.e., impose a redemption gate) and thereby prevent the Fund from selling its investment in the money market fund or impose a fee of up to 2% on amounts the Fund redeems from the money market fund (i.e., impose a liquidity fee). These measures may result in an investment loss or
| 24 | Columbia Virginia Intermediate Municipal Bond Fund | Annual Report 2023 |
Notes to Financial Statements (continued)
April 30, 2023
prohibit the Fund from redeeming shares when the Investment Manager would otherwise redeem shares. In addition to the fees and expenses that the Fund directly bears, the Fund indirectly bears the fees and expenses of any money market funds in which it invests, including affiliated money market funds. By investing in a money market fund, the Fund will be exposed to the investment risks of the money market fund in direct proportion to such investment. To the extent the Fund invests in instruments such as derivatives, the Fund may hold investments, which may be significant, in money market fund shares to cover its obligations resulting from the Fund’s investments in such instruments. Money market funds and the securities they invest in are subject to comprehensive regulations. The enactment of new legislation or regulations, as well as changes in interpretation and enforcement of current laws, may affect the manner of operation, performance and/or yield of money market funds.
Shareholder concentration risk
At April 30, 2023, two unaffiliated shareholders of record owned 52.4% of the outstanding shares of the Fund in one or more accounts. The Fund has no knowledge about whether any portion of those shares was owned beneficially. Affiliated shareholders of record owned 10.7% of the outstanding shares of the Fund in one or more accounts. Subscription and redemption activity by concentrated accounts may have a significant effect on the operations of the Fund. In the case of a large redemption, the Fund may be forced to sell investments at inopportune times, including its liquid positions, which may result in Fund losses and the Fund holding a higher percentage of less liquid positions. Large redemptions could result in decreased economies of scale and increased operating expenses for non-redeeming Fund shareholders.
Note 9. Subsequent events
Management has evaluated the events and transactions that have occurred through the date the financial statements were issued. Other than as noted in Note 1 above, there were no items requiring adjustment of the financial statements or additional disclosure.
Note 10. Information regarding pending and settled legal proceedings
Ameriprise Financial and certain of its affiliates are involved in the normal course of business in legal proceedings which include regulatory inquiries, arbitration and litigation, including class actions concerning matters arising in connection with the conduct of their activities as part of a diversified financial services firm. Ameriprise Financial believes that the Fund is not currently the subject of, and that neither Ameriprise Financial nor any of its affiliates are the subject of, any pending legal, arbitration or regulatory proceedings that are likely to have a material adverse effect on the Fund or the ability of Ameriprise Financial or its affiliates to perform under their contracts with the Fund. Ameriprise Financial is required to make quarterly (10-Q), annual (10-K) and, as necessary, 8-K filings with the Securities and Exchange Commission (SEC) on legal and regulatory matters that relate to Ameriprise Financial and its affiliates. Copies of these filings may be obtained by accessing the SEC website at www.sec.gov.
There can be no assurance that these matters, or the adverse publicity associated with them, will not result in increased Fund redemptions, reduced sale of Fund shares or other adverse consequences to the Fund. Further, although we believe proceedings are not likely to have a material adverse effect on the Fund or the ability of Ameriprise Financial or its affiliates to perform under their contracts with the Fund, these proceedings are subject to uncertainties and, as such, we are unable to estimate the possible loss or range of loss that may result. An adverse outcome in one or more of these proceedings could result in adverse judgments, settlements, fines, penalties or other relief that could have a material adverse effect on the consolidated financial condition or results of operations of Ameriprise Financial or one or more of its affiliates that provides services to the Fund.
Columbia Virginia Intermediate Municipal Bond Fund | Annual Report 2023
| 25 |
Report of Independent Registered Public Accounting Firm
To the Board of Trustees of Columbia Funds Series Trust and Shareholders of Columbia Virginia Intermediate Municipal Bond Fund
Opinion on the Financial Statements
We have audited the accompanying statement of assets and liabilities, including the portfolio of investments, of Columbia Virginia Intermediate Municipal Bond Fund (one of the funds constituting Columbia Funds Series Trust, referred to hereafter as the "Fund") as of April 30, 2023, the related statement of operations for the year ended April 30, 2023, the statement of changes in net assets for each of the two years in the period ended April 30, 2023, including the related notes, and the financial highlights for each of the five years in the period ended April 30, 2023 (collectively referred to as the "financial statements"). In our opinion, the financial statements present fairly, in all material respects, the financial position of the Fund as of April 30, 2023, the results of its operations for the year then ended, the changes in its net assets for each of the two years in the period ended April 30, 2023 and the financial highlights for each of the five years in the period ended April 30, 2023 in conformity with accounting principles generally accepted in the United States of America.
Basis for Opinion
These financial statements are the responsibility of the Fund’s management. Our responsibility is to express an opinion on the Fund’s financial statements based on our audits. We are a public accounting firm registered with the Public Company Accounting Oversight Board (United States) (PCAOB) and are required to be independent with respect to the Fund in accordance with the U.S. federal securities laws and the applicable rules and regulations of the Securities and Exchange Commission and the PCAOB.
We conducted our audits of these financial statements in accordance with the standards of the PCAOB. Those standards require that we plan and perform the audit to obtain reasonable assurance about whether the financial statements are free of material misstatement, whether due to error or fraud.
Our audits included performing procedures to assess the risks of material misstatement of the financial statements, whether due to error or fraud, and performing procedures that respond to those risks. Such procedures included examining, on a test basis, evidence regarding the amounts and disclosures in the financial statements. Our audits also included evaluating the accounting principles used and significant estimates made by management, as well as evaluating the overall presentation of the financial statements. Our procedures included confirmation of securities owned as of April 30, 2023 by correspondence with the custodian and transfer agent. We believe that our audits provide a reasonable basis for our opinion.
/s/PricewaterhouseCoopers LLP
Minneapolis, Minnesota
June 22, 2023
We have served as the auditor of one or more investment companies within the Columbia Funds Complex since 1977.
| 26 | Columbia Virginia Intermediate Municipal Bond Fund | Annual Report 2023 |
Federal Income Tax Information
(Unaudited)
The Fund hereby designates the following tax attributes for the fiscal year ended April 30, 2023. Shareholders will be notified in early 2024 of the amounts for use in preparing 2023 income tax returns.
Exempt-
interest
dividends | |
| 97.62% | |
Exempt-interest dividends. The percentage of net investment income distributed during the fiscal year that qualifies as exempt-interest dividends for federal income tax purposes. A portion of the income may be subject to federal alternative minimum tax.
TRUSTEES AND OFFICERS
(Unaudited)
The Board oversees the Fund’s operations and appoints officers who are responsible for day-to-day business decisions based on policies set by the Board. The following table provides basic biographical information about the Fund’s Trustees as of the printing of this report, including their principal occupations during the past five years, although specific titles for individuals may have varied over the period. The year set forth beneath Length of Service in the table below is the year in which the Trustee was first appointed or elected as Trustee to any Fund currently in the Columbia Funds Complex or a predecessor thereof. Under current Board policy, each Trustee generally serves until December 31 of the year such Trustee turns seventy-five (75).
Independent trustees
Name,
address,
year of birth | Position held
with the Columbia Funds and
length of service | Principal occupation(s)
during past five years
and other relevant
professional experience | Number of
Funds in the
Columbia Funds
Complex*
overseen | Other directorships
held by Trustee
during the past five years
and other relevant Board experience |
George S. Batejan
c/o Columbia Management
Investment Advisers, LLC
290 Congress Street
Boston, MA 02210
1954 | Trustee since 2017 | Executive Vice President, Global Head of Technology and Operations, Janus Capital Group, Inc., 2010-2016 | 174 | Former Chairman of the Board, NICSA (National Investment Company Services Association) (Executive Committee, Nominating Committee and Governance Committee), 2014-2016; former Director, Intech Investment Management, 2011-2016; former Board Member, Metro Denver Chamber of Commerce, 2015-2016; former Advisory Board Member, University of Colorado Business School, 2015-2018; former Board Member, Chase Bank International, 1993-1994 |
Columbia Virginia Intermediate Municipal Bond Fund | Annual Report 2023
| 27 |
TRUSTEES AND OFFICERS (continued)
(Unaudited)
Independent trustees (continued)
Name,
address,
year of birth | Position held
with the Columbia Funds and
length of service | Principal occupation(s)
during past five years
and other relevant
professional experience | Number of
Funds in the
Columbia Funds
Complex*
overseen | Other directorships
held by Trustee
during the past five years
and other relevant Board experience |
Kathleen Blatz
c/o Columbia Management
Investment Advisers, LLC
290 Congress Street
Boston, MA 02210
1954 | Trustee since 2006 | Attorney, specializing in arbitration and mediation; Chief Justice, Minnesota Supreme Court, 1998-2006; Associate Justice, Minnesota Supreme Court, 1996-1998; Fourth Judicial District Court Judge, Hennepin County, 1994-1996; Attorney in private practice and public service, 1984-1993; State Representative, Minnesota House of Representatives, 1979-1993, which included service on the Tax and Financial Institutions and Insurance Committees; Member and Interim Chair, Minnesota Sports Facilities Authority, January-July 2017; Interim President and Chief Executive Officer, Blue Cross and Blue Shield of Minnesota (health care insurance), February-July 2018, April-October 2021 | 174 | Former Trustee, Blue Cross and Blue Shield of Minnesota, 2009-2021 (Chair of the Business Development Committee, 2014-2017; Chair of the Governance Committee, 2017-2019); former Member and Chair of the Board, Minnesota Sports Facilities Authority, January 2017-July 2017; former Director, Robina Foundation, 2009-2020 (Chair, 2014-2020); Director, Richard M. Schulze Family Foundation, since 2021 |
Pamela G. Carlton
c/o Columbia Management
Investment Advisers, LLC
290 Congress Street
Boston, MA 02210
1954 | Chair since 2023; Trustee since 2007 | President, Springboard — Partners in Cross Cultural Leadership (consulting company), since 2003; Managing Director of US Equity Research, JP Morgan Chase, 1999-2003; Director of US Equity Research, Chase Asset Management, 1996-1999; Co-Director Latin America Research, 1993-1996, COO Global Research, 1992-1996, Co-Director of US Research, 1991-1992, Investment Banker, 1982-1991, Morgan Stanley; Attorney, Cleary Gottlieb Steen & Hamilton LLP, 1980-1982 | 174 | Trustee, New York Presbyterian Hospital Board, since 1996; Director, DR Bank (Audit Committee) since 2017; Director, Evercore Inc. (Audit Committee, Nominating and Governance Committee), since 2019; Director, Apollo Commercial Real Estate Finance, Inc. (Chair, Nominating and Governance Committee) (financial services), since 2021; the Governing Council of the Independent Directors Council (IDC), since 2021 |
Janet Langford Carrig
c/o Columbia Management
Investment Advisers, LLC
290 Congress Street
Boston, MA 02210
1957 | Trustee since 1996 | Senior Vice President, General Counsel and Corporate Secretary, ConocoPhillips (independent energy company), September 2007-October 2018 | 174 | Director, EQT Corporation (natural gas producer), since 2019; former Director, Whiting Petroleum Corporation (independent oil and gas company), 2020-2022 |
J. Kevin Connaughton
c/o Columbia Management
Investment Advisers, LLC
290 Congress Street
Boston, MA 02210
1964 | Trustee since 2020 | CEO and President, RhodeWay Financial (non-profit financial planning firm), since December 2022; Member, FINRA National Adjudicatory Council, since January 2020; Adjunct Professor of Finance, Bentley University since January 2018; Consultant to Independent Trustees of CFVIT and CFST I from March 2016 to June 2020 with respect to CFVIT and to December 2020 with respect to CFST I; Managing Director and General Manager of Mutual Fund Products, Columbia Management Investment Advisers, LLC, May 2010-February 2015; President, Columbia Funds, 2008-2015; and senior officer of Columbia Funds and affiliated funds, 2003-2015 | 172 | Former Director, The Autism Project, March 2015-December 2021; former Member of the Investment Committee, St. Michael’s College, November 2015-February 2020; former Trustee, St. Michael’s College, June 2017-September 2019; former Trustee, New Century Portfolios (former mutual fund complex), January 2015-December 2017 |
| 28 | Columbia Virginia Intermediate Municipal Bond Fund | Annual Report 2023 |
TRUSTEES AND OFFICERS (continued)
(Unaudited)
Independent trustees (continued)
Name,
address,
year of birth | Position held
with the Columbia Funds and
length of service | Principal occupation(s)
during past five years
and other relevant
professional experience | Number of
Funds in the
Columbia Funds
Complex*
overseen | Other directorships
held by Trustee
during the past five years
and other relevant Board experience |
Olive M. Darragh
c/o Columbia Management
Investment Advisers, LLC
290 Congress Street
Boston, MA 02210
1962 | Trustee since 2020 | Managing Director of Darragh Inc. (strategy and talent management consulting firm), since 2010; Founder and CEO, Zolio, Inc. (investment management talent identification platform), since 2004; Consultant to Independent Trustees of CFVIT and CFST I from June 2019 to June 2020 with respect to CFVIT and to December 2020 with respect to CFST I; Partner, Tudor Investments, 2004-2010; Senior Partner, McKinsey & Company (consulting), 1990-2004; Touche Ross CPA, 1985-1988 | 172 | Treasurer, Edinburgh University US Trust Board, since January 2023; Member, HBS Community Action Partners Board, since September 2022; former Director, University of Edinburgh Business School (Member of US Board), 2004-2019; former Director, Boston Public Library Foundation, 2008-2017 |
Patricia M. Flynn
c/o Columbia Management
Investment Advisers, LLC
290 Congress Street
Boston, MA 02210
1950 | Trustee since 2004 | Professor of Economics and Management, Bentley University, since 2002; Dean, McCallum Graduate School of Business, Bentley University, 1992-2002 | 174 | Former Trustee, MA Taxpayers Foundation, 1997-2022; former Director, The MA Business Roundtable, 2003-2019; former Chairperson, Innovation Index Advisory Committee, MA Technology Collaborative, 1997-2020 |
Brian J. Gallagher
c/o Columbia Management
Investment Advisers, LLC
290 Congress Street
Boston, MA 02210
1954 | Trustee since 2017 | Retired; Partner with Deloitte & Touche LLP and its predecessors, 1977-2016 | 174 | Trustee, Catholic Schools Foundation, since 2004 |
Douglas A. Hacker
c/o Columbia Management
Investment Advisers, LLC
290 Congress Street
Boston, MA 02210
1955 | Trustee since 1996 | Independent business executive, since May 2006; Executive Vice President – Strategy of United Airlines, December 2002 - May 2006; President of UAL Loyalty Services (airline marketing company), September 2001-December 2002; Executive Vice President and Chief Financial Officer of United Airlines, July 1999-September 2001 | 174 | Director, SpartanNash Company since November 2013 (Chair of the Board, since May 2021) (food distributor); Director, Aircastle Limited (Chair of Audit Committee) (aircraft leasing), since August 2006; former Director, Nash Finch Company (food distributor), 2005-2013; former Director, SeaCube Container Leasing Ltd. (container leasing), 2010-2013; and former Director, Travelport Worldwide Limited (travel information technology), 2014-2019 |
Nancy T. Lukitsh
c/o Columbia Management
Investment Advisers, LLC
290 Congress Street
Boston, MA 02210
1956 | Trustee since 2011 | Senior Vice President, Partner and Director of Marketing, Wellington Management Company, LLP (investment adviser), 1997-2010; Chair, Wellington Management Portfolios (commingled non-U.S. investment pools), 2007-2010; Director, Wellington Trust Company, NA and other Wellington affiliates, 1997-2010 | 172 | None |
Columbia Virginia Intermediate Municipal Bond Fund | Annual Report 2023
| 29 |
TRUSTEES AND OFFICERS (continued)
(Unaudited)
Independent trustees (continued)
Name,
address,
year of birth | Position held
with the Columbia Funds and
length of service | Principal occupation(s)
during past five years
and other relevant
professional experience | Number of
Funds in the
Columbia Funds
Complex*
overseen | Other directorships
held by Trustee
during the past five years
and other relevant Board experience |
David M. Moffett
c/o Columbia Management
Investment Advisers, LLC
290 Congress Street
Boston, MA 02210
1952 | Trustee since 2011 | Retired; former Chief Executive Officer of Freddie Mac and Chief Financial Officer of U.S. Bank | 172 | Director, CSX Corporation (transportation suppliers); Director, PayPal Holdings Inc. (payment and data processing services); Trustee, University of Oklahoma Foundation; former Director, eBay Inc. (online trading community), 2007-2015; and former Director, CIT Bank, CIT Group Inc. (commercial and consumer finance), 2010-2016; former Senior Adviser to The Carlyle Group (financial services), March 2008-September 2008; former Governance Consultant to Bridgewater Associates, January 2013-December 2015 |
Catherine James Paglia
c/o Columbia Management
Investment Advisers, LLC
290 Congress Street
Boston, MA 02210
1952 | Trustee since 2004 | Director, Enterprise Asset Management, Inc. (private real estate and asset management company), since September 1998; Managing Director and Partner, Interlaken Capital, Inc., 1989-1997; Vice President, 1982-1985, Principal, 1985-1987, Managing Director, 1987-1989, Morgan Stanley; Vice President, Investment Banking, 1980-1982, Associate, Investment Banking, 1976-1980, Dean Witter Reynolds, Inc. | 174 | Director, Valmont Industries, Inc. (irrigation systems manufacturer), since 2012; Trustee, Carleton College (on the Investment Committee), since 1987; Trustee, Carnegie Endowment for International Peace (on the Investment Committee), since 2009 |
Natalie A. Trunow
c/o Columbia Management
Investment Advisers, LLC
290 Congress Street
Boston, MA 02210
1967 | Trustee since 2020 | Chief Executive Officer, Millennial Portfolio Solutions LLC (asset management and consulting services), January 2016-January 2021; Non-executive Member of the Investment Committee and Valuation Committee, Sarona Asset Management Inc. (private equity firm) since September 2019; Advisor, Horizon Investments (asset management and consulting services), August 2018-January 2022; Advisor, Paradigm Asset Management, November 2016-January 2022; Consultant to Independent Trustees of CFVIT and CFST I from September 2016 to June 2020 with respect to CFVIT and to December 2020 with respect to CFST I; Director of Investments/Consultant, Casey Family Programs, April 2016-November 2016; Senior Vice President and Chief Investment Officer, Calvert Investments, August 2008-January 2016; Section Head and Portfolio Manager, General Motors Asset Management, June 1997-August 2008 | 172 | Independent Director, Investment Committee, Health Services for Children with Special Needs, Inc., 2010-2021; Independent Director, (Executive Committee and Chair, Audit Committee), Consumer Credit Counseling Services (formerly Guidewell Financial Solutions), since 2016; Independent Director, (Investment Committee), Sarona Asset Management, since 2019 |
| 30 | Columbia Virginia Intermediate Municipal Bond Fund | Annual Report 2023 |
TRUSTEES AND OFFICERS (continued)
(Unaudited)
Independent trustees (continued)
Name,
address,
year of birth | Position held
with the Columbia Funds and
length of service | Principal occupation(s)
during past five years
and other relevant
professional experience | Number of
Funds in the
Columbia Funds
Complex*
overseen | Other directorships
held by Trustee
during the past five years
and other relevant Board experience |
Sandra L. Yeager
c/o Columbia Management
Investment Advisers, LLC
290 Congress Street
Boston, MA 02210
1964 | Trustee since 2017 | Retired; President and founder, Hanoverian Capital, LLC (SEC registered investment advisor firm), 2008-2016; Managing Director, DuPont Capital, 2006-2008; Managing Director, Morgan Stanley Investment Management, 2004-2006; Senior Vice President, Alliance Bernstein, 1990-2004 | 174 | Former Director, NAPE (National Alliance for Partnerships in Equity) Education Foundation, October 2016-October 2020; Advisory Board, Jennersville YMCA, since 2022 |
Interested trustee affiliated with Investment Manager**
Name,
address,
year of birth | Position held with the Columbia Funds and length of service | Principal occupation(s) during the
past five years and other relevant
professional experience | Number of
Funds in the
Columbia Funds
Complex overseen | Other directorships
held by Trustee
during the past
five years and
other relevant Board experience |
Daniel J. Beckman
c/o Columbia Management
Investment Advisers, LLC
290 Congress Street
Boston, MA 02210
1962 | Trustee since November 2021 and President since June 2021 | Vice President – Head of North America Product, Columbia Management Investment Advisers, LLC, since April 2015; President and Principal Executive Officer of the Columbia Funds, since June 2021; officer of Columbia Funds and affiliated funds, 2020-2021 | 174 | Director, Ameriprise Trust Company, since October 2016; Director, Columbia Management Investment Distributors, Inc. since November 2018; Board of Governors, Columbia Wanger Asset Management, LLC since, January 2022; Director, Columbia Threadneedle Canada, Inc., since December 2022 |
| * | The term “Columbia Funds Complex” as used herein includes Columbia Seligman Premium Technology Growth Fund, Tri-Continental Corporation and each series of Columbia Funds Series Trust (CFST), Columbia Funds Series Trust I (CFST I), Columbia Funds Series Trust II (CFST II), Columbia ETF Trust I (CET I), Columbia ETF Trust II (CET II), Columbia Funds Variable Insurance Trust (CFVIT) and Columbia Funds Variable Series Trust II (CFVST II). Messrs. Batejan, Beckman, Gallagher and Hacker and Mses. Blatz, Carlton, Carrig, Flynn, Paglia, and Yeager serve as directors of Columbia Seligman Premium Technology Growth Fund and Tri-Continental Corporation. |
| ** | Interested person (as defined under the 1940 Act) by reason of being an officer, director, security holder and/or employee of the Investment Manager or Ameriprise Financial. |
The Statement of Additional Information has additional information about the Fund’s Board members and is available, without charge, upon request by calling 800.345.6611, visiting columbiathreadneedleus.com/investor/ or contacting your financial intermediary.
Columbia Virginia Intermediate Municipal Bond Fund | Annual Report 2023
| 31 |
TRUSTEES AND OFFICERS (continued)
(Unaudited)
The Board has appointed officers who are responsible for day-to-day business decisions based on policies it has established. The officers serve at the pleasure of the Board. The following table provides basic information about the Officers of the Fund as of the printing of this report, including principal occupations during the past five years, although their specific titles may have varied over the period. In addition to Mr. Beckman, who is President and Principal Executive Officer, the Fund’s other officers are:
Fund officers
Name,
address and
year of birth | Position and year
first appointed to
position for any Fund
in the Columbia
Funds Complex or a
predecessor thereof | Principal occupation(s) during past five years |
Michael G. Clarke
290 Congress Street
Boston, MA 02210
1969 | Chief Financial Officer and Principal Financial Officer (2009) and Senior Vice President (2019) | Senior Vice President and Head of North America Operations & Investor Services, Columbia Management Investment Advisers, LLC, since June 2023 (previously Senior Vice President and Head of Global Operations, March 2022 – June 2023, Vice President, Head of North America Operations, and Co-Head of Global Operations, June 2019 - February 2022 and Vice President – Accounting and Tax, May 2010 - May 2019); senior officer of Columbia Funds and affiliated funds, since 2002. |
Joseph Beranek
5890 Ameriprise Financial Center
Minneapolis, MN 55474
1965 | Treasurer and Chief Accounting Officer (Principal Accounting Officer) (2019) and Principal Financial Officer (2020), CFST, CFST I, CFST II, CFVIT and CFVST II; Assistant Treasurer, CET I and CET II | Vice President – Mutual Fund Accounting and Financial Reporting, Columbia Management Investment Advisers, LLC, since December 2018 and March 2017, respectively. |
Marybeth Pilat
290 Congress Street
Boston, MA 02210
1968 | Treasurer and Chief Accounting Officer (Principal Accounting Officer) and Principal Financial Officer (2020) for CET I and CET II; Assistant Treasurer, CFST, CFST I, CFST II, CFVIT and CFVST II | Vice President – Product Pricing and Administration, Columbia Management Investment Advisers, LLC, since May 2017. |
William F. Truscott
290 Congress Street
Boston, MA 02210
1960 | Senior Vice President (2001) | Formerly, Trustee/Director of Columbia Funds Complex or legacy funds, November 2001-January 1, 2021; Chief Executive Officer, Global Asset Management, Ameriprise Financial, Inc., since September 2012; Chairman of the Board and President, Columbia Management Investment Advisers, LLC, since July 2004 and February 2012, respectively; Chairman of the Board and Chief Executive Officer, Columbia Management Investment Distributors, Inc., since November 2008 and February 2012, respectively; Chairman of the Board and Director, Threadneedle Asset Management Holdings, Sàrl, since March 2013 and December 2008, respectively; senior executive of various entities affiliated with Columbia Threadneedle. |
Christopher O. Petersen
5228 Ameriprise Financial Center
Minneapolis, MN 55474
1970 | Senior Vice President and Assistant Secretary (2021) | Formerly, Trustee/Director of funds within the Columbia Funds Complex, July 1, 2020 - November 22, 2021; Senior Vice President and Assistant General Counsel, Ameriprise Financial, Inc., since September 2021 (previously Vice President and Lead Chief Counsel, January 2015 - September 2021); formerly, President and Principal Executive Officer of the Columbia Funds, 2015 - 2021; officer of Columbia Funds and affiliated funds, since 2007. |
Thomas P. McGuire
290 Congress Street
Boston, MA 02210
1972 | Senior Vice President and Chief Compliance Officer (2012) | Vice President – Asset Management Compliance, Ameriprise Financial, Inc., since May 2010; Chief Compliance Officer, Columbia Acorn/Wanger Funds, since December 2015; formerly, Chief Compliance Officer, Ameriprise Certificate Company, September 2010 – September 2020. |
Ryan C. Larrenaga
290 Congress Street
Boston, MA 02210
1970 | Senior Vice President (2017), Chief Legal Officer (2017), and Secretary (2015) | Vice President and Chief Counsel, Ameriprise Financial, Inc., since August 2018 (previously Vice President and Group Counsel, August 2011 - August 2018); Chief Legal Officer, Columbia Acorn/Wanger Funds, since September 2020; officer of Columbia Funds and affiliated funds, since 2005. |
| 32 | Columbia Virginia Intermediate Municipal Bond Fund | Annual Report 2023 |
TRUSTEES AND OFFICERS (continued)
(Unaudited)
Fund officers (continued)
Name,
address and
year of birth | Position and year
first appointed to
position for any Fund
in the Columbia
Funds Complex or a
predecessor thereof | Principal occupation(s) during past five years |
Michael E. DeFao
290 Congress Street
Boston, MA 02210
1968 | Vice President (2011) and Assistant Secretary (2010) | Vice President and Chief Counsel, Ameriprise Financial, Inc., since May 2010; Vice President, Chief Legal Officer and Assistant Secretary, Columbia Management Investment Advisers, LLC, since October 2021 (previously Vice President and Assistant Secretary, May 2010 – September 2021). |
Lyn Kephart-Strong
5228 Ameriprise Financial Center
Minneapolis, MN 55474
1960 | Vice President (2015) | Vice President, Global Investment Operations Services, Columbia Management Investment Advisers, LLC, since 2010; President, Columbia Management Investment Services Corp., since October 2014; President, Ameriprise Trust Company, since January 2017. |
Liquidity Risk Management Program
(Unaudited)
Pursuant to Rule 22e-4 under the 1940 Act, the Fund has adopted a liquidity risk management program (Program). The Program’s principal objectives include assessing, managing and periodically reviewing the Fund’s liquidity risk. Liquidity risk is defined as the risk that the Fund could not meet redemption requests without significant dilution of remaining investors’ interests in the Fund.
The Board has appointed the Investment Manager as the program administrator for the Fund’s Program. The Investment Manager has delegated oversight of the Program to its Liquidity Risk Management Committee (the Committee). At a board meeting during the fiscal period, the Committee provided the Board with a report addressing the operations of the program and assessing its adequacy and effectiveness of implementation for the period January 1, 2022, through December 31, 2022, including:
| • | the Fund had sufficient liquidity to both meet redemptions and operate effectively on behalf of shareholders; |
| • | there were no material changes to the Program during the period; |
| • | the implementation of the Program was effective to manage the Fund’s liquidity risk; and |
| • | the Program operated adequately during the period. |
There can be no assurance that the Program will achieve its objectives in the future. Please refer to the Fund’s prospectus for more information regarding the Fund’s exposure to liquidity risk and other principal risks to which an investment in the Fund may be subject.
Columbia Virginia Intermediate Municipal Bond Fund | Annual Report 2023
| 33 |
[THIS PAGE INTENTIONALLY LEFT BLANK]
[THIS PAGE INTENTIONALLY LEFT BLANK]
Columbia Virginia Intermediate Municipal Bond Fund
P.O. Box 219104
Kansas City, MO 64121-9104
Please read and consider the investment objectives, risks, charges and expenses for any fund carefully before investing. For a prospectus and summary prospectus, which contains this and other important information about the Fund, go to
columbiathreadneedleus.com/investor/. The Fund is distributed by Columbia Management Investment Distributors, Inc., member FINRA, and managed by Columbia Management Investment Advisers, LLC.
Columbia Threadneedle Investments (Columbia Threadneedle) is the global brand name of the Columbia and Threadneedle group of companies. All rights reserved.
© 2023 Columbia Management Investment Advisers, LLC.
columbiathreadneedleus.com/investor/

Annual Report
April 30, 2023
Columbia California Intermediate Municipal Bond Fund
Not FDIC or NCUA Insured • No Financial Institution Guarantee • May Lose Value
If you elect to receive the shareholder report for Columbia California Intermediate Municipal Bond Fund (the Fund) in paper, mailed to you, the Fund mails one shareholder report to each shareholder address, unless such shareholder elects to receive shareholder reports from the Fund electronically via e-mail or by having a paper notice mailed to you (Postcard Notice) that your Fund’s shareholder report is available at the Columbia funds’ website (columbiathreadneedleus.com/investor/). If you would like more than one report in paper to be mailed to you, or would like to elect to receive reports via e-mail or access them through Postcard Notice, please call shareholder services at 800.345.6611 and additional reports will be sent to you.
Proxy voting policies and procedures
The policy of the Board of Trustees is to vote the proxies of the companies in which the Fund holds investments consistent with the procedures as stated in the Statement of Additional Information (SAI). You may obtain a copy of the SAI without charge by calling 800.345.6611; contacting your financial intermediary; visiting columbiathreadneedleus.com/investor/; or searching the website of the Securities and Exchange Commission (SEC) at sec.gov. Information regarding how the Fund voted proxies relating to portfolio securities is filed with the SEC by August 31st for the most recent 12-month period ending June 30th of that year, and is available without charge by visiting columbiathreadneedleus.com/investor/, or searching the website of the SEC at sec.gov.
Quarterly schedule of investments
The Fund files a complete schedule of portfolio holdings with the SEC for the first and third quarters of each fiscal year on Form N-PORT. The Fund’s Form N-PORT filings are available on the SEC’s website at sec.gov. The Fund’s complete schedule of portfolio holdings, as filed on Form N-PORT, is available on columbiathreadneedleus.com/investor/ or can also be obtained without charge, upon request, by calling 800.345.6611.
Additional Fund information
For more information about the Fund, please visit columbiathreadneedleus.com/investor/ or call 800.345.6611. Customer Service Representatives are available to answer your questions Monday through Friday from 8 a.m. to 7 p.m. Eastern time.
Fund investment manager
Columbia Management Investment Advisers, LLC (the Investment Manager)
290 Congress Street
Boston, MA 02210
Fund distributor
Columbia Management Investment Distributors, Inc.
290 Congress Street
Boston, MA 02210
Fund transfer agent
Columbia Management Investment Services Corp.
P.O. Box 219104
Kansas City, MO 64121-9104
Columbia California Intermediate Municipal Bond Fund | Annual Report 2023
Fund at a Glance
(Unaudited)
Investment objective
The Fund seeks current income exempt from U.S. federal income tax and California individual income tax, consistent with moderate fluctuation of principal.
Portfolio management
Paul Fuchs, CFA
Co-Portfolio Manager
Managed Fund since 2012
Douglas Rangel, CFA
Co-Portfolio Manager
Managed the Fund since June 2022
| Average annual total returns (%) (for the period ended April 30, 2023) |
| | | Inception | 1 Year | 5 Years | 10 Years | |
| Class A | Excluding sales charges | 09/09/02 | 2.76 | 1.44 | 1.64 | |
| | Including sales charges | | -0.30 | 0.82 | 1.33 | |
| Advisor Class | 03/19/13 | 2.92 | 1.69 | 1.91 | |
| Class C | Excluding sales charges | 09/11/02 | 1.89 | 0.68 | 0.88 | |
| | Including sales charges | | 0.89 | 0.68 | 0.88 | |
| Institutional Class | 08/19/02 | 3.02 | 1.69 | 1.91 | |
| Institutional 2 Class | 11/08/12 | 3.03 | 1.74 | 1.96 | |
| Institutional 3 Class* | 03/01/17 | 3.09 | 1.79 | 1.97 | |
| Bloomberg California 3-15 Year Blend Municipal Bond Index | | 4.00 | 2.02 | 2.15 | |
| Bloomberg 3-15 Year Blend Municipal Bond Index | | 3.71 | 2.18 | 2.14 | |
Returns for Class A shares are shown with and without the maximum initial sales charge of 3.00%. Returns for Class C shares are shown with and without the 1.00% contingent deferred sales charge for the first year only. The Fund’s other share classes are not subject to sales charges and have limited eligibility. Please see the Fund’s prospectus for details. Performance for different share classes will vary based on differences in sales charges and fees associated with each share class. All results shown assume reinvestment of distributions during the period. Returns do not reflect the deduction of taxes that a shareholder may pay on Fund distributions or on the redemption of Fund shares. Performance results reflect the effect of any fee waivers or reimbursements of Fund expenses by Columbia Management Investment Advisers, LLC and/or any of its affiliates. Absent these fee waivers or expense reimbursement arrangements, performance results would have been lower.
The performance information shown represents past performance and is not a guarantee of future results. The investment return and principal value of your investment will fluctuate so that your shares, when redeemed, may be worth more or less than their original cost. Current performance may be lower or higher than the performance information shown. You may obtain performance information current to the most recent month-end by contacting your financial intermediary, visiting columbiathreadneedleus.com/investor/ or calling 800.345.6611.
| * | The returns shown for periods prior to the share class inception date (including returns for the Life of the Fund, if shown, which are since Fund inception) include the returns of the Fund’s oldest share class. These returns are adjusted to reflect any higher class-related operating expenses of the newer share classes, as applicable. Please visit columbiathreadneedleus.com/investor/investment-products/mutual-funds/appended-performance for more information. |
The Bloomberg California 3-15 Year Blend Municipal Bond Index is an unmanaged index that tracks the performance of investment-grade bonds issued from the state of California and its municipalities.
The Bloomberg 3–15 Year Blend Municipal Bond Index is an unmanaged index that tracks the performance of municipal bonds issued after December 31, 1990, with remaining maturities between 2 and 17 years and at least $7 million in principal amount outstanding.
Indices are not available for investment, are not professionally managed and do not reflect sales charges, fees, brokerage commissions, taxes or other expenses of investing. Securities in the Fund may not match those in an index.
Columbia California Intermediate Municipal Bond Fund | Annual Report 2023
| 3 |
Fund at a Glance (continued)
(Unaudited)
Performance of a hypothetical $10,000 investment (April 30, 2013 — April 30, 2023)
The chart above shows the change in value of a hypothetical $10,000 investment in Class A shares of Columbia California Intermediate Municipal Bond Fund during the stated time period, and does not reflect the deduction of taxes that a shareholder may pay on Fund distributions or on the redemption of Fund shares.
| Quality breakdown (%) (at April 30, 2023) |
| AAA rating | 0.7 |
| AA rating | 49.4 |
| A rating | 27.7 |
| BBB rating | 13.9 |
| BB rating | 2.3 |
| Not rated | 6.0 |
| Total | 100.0 |
Percentages indicated are based upon total fixed income investments.
Bond ratings apply to the underlying holdings of the Fund and not the Fund itself and are divided into categories ranging from highest to lowest credit quality, determined by using the middle rating of Moody’s, S&P and Fitch, after dropping the highest and lowest available ratings. When ratings are available from only two rating agencies, the lower rating is used. When a rating is available from only one rating agency, that rating is used. If a security is not rated but has a rating by Kroll and/or DBRS, the same methodology is applied to those bonds that would otherwise be not rated. When a bond is not rated by any rating agency, it is designated as “Not rated.” Credit quality ratings assigned by a rating agency are subjective opinions, not statements of fact, and are subject to change, including daily. The ratings assigned by credit rating agencies are but one of the considerations that the Investment Manager and/or Fund’s subadviser incorporates into its credit analysis process, along with such other issuer-specific factors as cash flows, capital structure and leverage ratios, ability to de-leverage (repay) through free cash flow, quality of management, market positioning and access to capital, as well as such security-specific factors as the terms of the security (e.g., interest rate and time to maturity) and the amount and type of any collateral.
| 4 | Columbia California Intermediate Municipal Bond Fund | Annual Report 2023 |
Manager Discussion of Fund Performance
(Unaudited)
For the 12-month period that ended April 30, 2023, Class A shares of Columbia California Intermediate Municipal Bond Fund returned 2.76% excluding sales charges. Institutional Class shares of the Fund returned 3.02%. During the same time period, the Fund’s primary benchmark, the Bloomberg California 3-15 Year Blend Municipal Bond Index, returned 4.00% and the Bloomberg 3-15 Year Blend Municipal Bond Index, which is national in scope, returned 3.71%.
Market overview
For fixed-income markets, the period was dominated by the U.S. Federal Reserve’s (Fed) efforts to return inflation to its target levels and the resultant dramatic increase in interest rates. Indeed, the Fed ratcheted its targeted federal funds rate higher by 450 basis points, and municipal bond yields followed suit with yields across most of its spectrum of maturities rising as well. (A basis point is 1/100th of a percentage point.) Municipal bond yields peaked in October 2022, however, and subsequently retraced somewhat, returning most segments of the municipal bond market to positive total returns for the period overall. Still, for the period as a whole, yields on one-year and two-year municipal bonds increased 106 basis points and 47 basis points, respectively. Yields on municipal bonds with maturities of less than one year rose even more significantly, driving an inversion of the short-term end of the yield curve for much of the period. Yields for municipal bonds with maturities of between five years and 13 years actually declined modestly, and longer term maturity yields rose only moderately.
Amid these conditions, investor sentiment within the municipal bond market was negative for much of the period. Rising rates and negative total returns through much of 2022 precipitated the largest outflow cycle ever experienced by the municipal bond market. Fund flows then stabilized and slowed into year-end but any optimism around a resumption of inflows in 2023 was quashed as another $6 billion of outflows through the end of April showed investors were still cautious about returning to the market. Consequently, technicals, or supply/demand dynamics, were not favorable within the municipal bond market during the period, largely driven by this lack of demand. Short-term municipal bond funds were not spared the effects of the outflow cycle. However, they were less impacted than their long-term, high-yield and intermediate fund counterparts, as short-term municipal bond funds generally hold more liquid positions, and shorter maturities inherently tend to provide ample cash flow. Supply, or lack thereof during the period, proved a bright spot. Rate volatility coupled with healthy balance sheets sidelined many issuers, with tax-exempt issuance approximately 10% to 15% lower during the period than long-term averages. Not having to contend with an oversupply of new issuance likely buoyed the market as whatever new issues did come to market were well received.
All that said, fundamental factors were broadly supportive of the municipal bond market during the period. Municipal credit health benefited from positive U.S. economic growth, outperformance of tax collections, and strong reserve positions by most state and local governments, owing partly to COVID-19 stimulus. Revenue sectors, however, were more mixed. Essential services, such as water & sewer and utilities, held steady, and transportation sectors, such as airports and toll roads, rebounded strongly with increased traffic levels. Public mass transit was the exception, as subway/bus traffic across most major cities remained well below pre-pandemic levels. Fundamental credit health for hospitals and other health care sectors, such as senior living facilities and continuing care retirement communities (CCRCs), was modestly weaker overall. Higher labor costs, lighter balance sheets due to repayment of Medicare acceleration payments and investment market losses served to weaken health care fundamentals as did the depletion of any COVID-19 funding. As a whole, higher quality municipal bonds outperformed lower quality securities during the period.
California’s economy grew by 8.1% during the 12 months that ended April 30, 2023, driven by strong job gains, rising wages and increased consumer spending. The state’s unemployment rate fell to 3.9%, its lowest level since 2000. California’s population has declined since the onset of the COVID-19 pandemic. This negative trend continued slightly through the end of calendar year 2022, with a population loss of 0.3%. There have been no public rating actions taken on California state bonds. Several rating agencies had upgraded California state bonds in fiscal year 2021 on robust tax revenue growth and have been waiting to see how the state will respond to declining tax revenue performance in fiscal year 2022 and possibly fiscal year 2023 due to the decline in capital gains taxes from the wealthiest residents of the state. Drought remains an issue in California, despite the strongest snowpack and highest level of rainfall in recent years.
Columbia California Intermediate Municipal Bond Fund | Annual Report 2023
| 5 |
Manager Discussion of Fund Performance (continued)
(Unaudited)
The Fund’s notable detractors during the period
| • | During the second half of the period, the Fund’s below benchmark duration, prevented the Fund from fully participating in the sharp turn in interest rates and market rally. As yields declined from November 2022 through April 2023, the Fund’s primary benchmark returned an impressive 6.19% as the 10-year municipal benchmark yield declined by roughly 80 basis points. |
| • | The Fund’s underweighted allocation to California state general obligation (GO) bonds detracted from performance as state GOs performed well. |
| • | The Fund’s relative underweighting in state GOs also translated to a shortfall in AA rated issues, as that is where California state GO’s fall. As higher quality bonds outperformed during the period, this also served as a detractor to relative performance. |
| • | The Fund’s overweighted allocation, relative to its primary benchmark, in bonds maturing in 1 to 2 years detracted from performance as these shorter term bonds underperformed their longer term counterparts. |
| • | Persistent outflows across the municipal bond market also detracted from Fund performance as the funding of shareholder liquidity required price concessions at times. Conversely, renewed shareholder interest when the municipal bond market reversed course reduced the Fund’s market exposure when yields were declining. |
The Fund’s notable contributors during the period
| • | During the first half of the period, the Fund’s below benchmark duration helped to limit price declines. As yields rose from May 2022 through October 2022, the Fund’s primary benchmark returned -2.06% as the 10 year municipal benchmark yield rose roughly 70 basis points. |
| • | The Fund’s underweighted allocation to bonds maturing in 2 to 6 years and its overweighting to bonds maturing in 6 years or more contributed positively to performance as longer bonds outperformed shorter bonds during the period. |
| • | The Fund’s largest sector overweights — in special tax, transportation and education — were beneficial as these sectors produced the highest returns in the California municipal bond market. These sectors makeup over 40% of the Fund’s exposure. |
Fixed-income securities present issuer default risk. The Fund invests substantially in municipal securities and will be affected by tax, legislative, regulatory, demographic or political changes, as well as changes impacting a state’s financial, economic or other conditions. A relatively small number of tax-exempt issuers may necessitate the Fund investing more heavily in a single issuer and, therefore, be more exposed to the risk of loss than a fund that invests more broadly. The value of the Fund’s portfolio may be more volatile than a more geographically diversified fund. Prepayment and extension risk exists because the timing of payments on a loan, bond or other investment may accelerate when interest rates fall or decelerate when interest rates rise which may reduce investment opportunities and potential returns. A rise in interest rates may result in a price decline of fixed-income instruments held by the Fund, negatively impacting its performance and NAV. Falling rates may result in the Fund investing in lower yielding debt instruments, lowering the Fund’s income and yield. These risks may be heightened for longer maturity and duration securities. Non-investment-grade (high-yield or junk) securities present greater price volatility and more risk to principal and income than higher rated securities. Market risk may affect a single issuer, sector of the economy, industry or the market as a whole. Federal and state tax rules apply to capital gain distributions and any gains or losses on sales. Income may be subject to state or local taxes. Liquidity risk is associated with the difficulty of selling investments at a desirable time or price. See the Fund’s prospectus for more information on these and other risks.
The views expressed in this report reflect the current views of the respective parties who have contributed to this report. These views are not guarantees of future performance and involve certain risks, uncertainties and assumptions that are difficult to predict, so actual outcomes and results may differ significantly from the views expressed. These views are subject to change at any time based upon economic, market or other conditions and the respective parties disclaim any responsibility to update such views. These views may not be relied on as investment advice and, because investment decisions for a Columbia fund are based on numerous factors, may not be relied on as an indication of trading intent on behalf of any particular Columbia fund. References to specific securities should not be construed as a recommendation or investment advice.
| 6 | Columbia California Intermediate Municipal Bond Fund | Annual Report 2023 |
Understanding Your Fund’s Expenses
(Unaudited)
As an investor, you incur two types of costs. There are shareholder transaction costs, which generally include sales charges on purchases and may include redemption fees. There are also ongoing fund costs, which generally include management fees, distribution and/or service fees, and other fund expenses. The following information is intended to help you understand your ongoing costs (in dollars) of investing in the Fund and to help you compare these costs with the ongoing costs of investing in other mutual funds.
Analyzing your Fund’s expenses
To illustrate these ongoing costs, we have provided examples and calculated the expenses paid by investors in each share class of the Fund during the period. The actual and hypothetical information in the table is based on an initial investment of $1,000 at the beginning of the period indicated and held for the entire period. Expense information is calculated two ways and each method provides you with different information. The amount listed in the “Actual” column is calculated using the Fund’s actual operating expenses and total return for the period. You may use the Actual information, together with the amount invested, to estimate the expenses that you paid over the period. Simply divide your account value by $1,000 (for example, an $8,600 account value divided by $1,000 = 8.6), then multiply the results by the expenses paid during the period under the “Actual” column. The amount listed in the “Hypothetical” column assumes a 5% annual rate of return before expenses (which is not the Fund’s actual return) and then applies the Fund’s actual expense ratio for the period to the hypothetical return. You should not use the hypothetical account values and expenses to estimate either your actual account balance at the end of the period or the expenses you paid during the period. See “Compare with other funds” below for details on how to use the hypothetical data.
Compare with other funds
Since all mutual funds are required to include the same hypothetical calculations about expenses in shareholder reports, you can use this information to compare the ongoing cost of investing in the Fund with other funds. To do so, compare the hypothetical example with the 5% hypothetical examples that appear in the shareholder reports of other funds. As you compare hypothetical examples of other funds, it is important to note that hypothetical examples are meant to highlight the ongoing costs of investing in a fund only and do not reflect any transaction costs, such as sales charges, or redemption or exchange fees. Therefore, the hypothetical calculations are useful in comparing ongoing costs only, and will not help you determine the relative total costs of owning different funds. If transaction costs were included in these calculations, your costs would be higher.
| November 1, 2022 — April 30, 2023 |
| | Account value at the
beginning of the
period ($) | Account value at the
end of the
period ($) | Expenses paid during
the period ($) | Fund’s annualized
expense ratio (%) |
| | Actual | Hypothetical | Actual | Hypothetical | Actual | Hypothetical | Actual |
| Class A | 1,000.00 | 1,000.00 | 1,052.60 | 1,020.94 | 3.67 | 3.62 | 0.73 |
| Advisor Class | 1,000.00 | 1,000.00 | 1,054.00 | 1,022.17 | 2.42 | 2.38 | 0.48 |
| Class C | 1,000.00 | 1,000.00 | 1,048.70 | 1,017.26 | 7.43 | 7.32 | 1.48 |
| Institutional Class | 1,000.00 | 1,000.00 | 1,054.00 | 1,022.17 | 2.42 | 2.38 | 0.48 |
| Institutional 2 Class | 1,000.00 | 1,000.00 | 1,054.20 | 1,022.22 | 2.37 | 2.33 | 0.47 |
| Institutional 3 Class | 1,000.00 | 1,000.00 | 1,054.40 | 1,022.46 | 2.12 | 2.08 | 0.42 |
Expenses paid during the period are equal to the annualized expense ratio for each class as indicated above, multiplied by the average account value over the period and then multiplied by the number of days in the Fund’s most recent fiscal half year and divided by 365.
Expenses do not include fees and expenses incurred indirectly by the Fund from its investment in underlying funds, including affiliated and non-affiliated pooled investment vehicles, such as mutual funds and exchange-traded funds.
Had Columbia Management Investment Advisers, LLC and/or certain of its affiliates not waived/reimbursed certain fees and expenses, account value at the end of the period would have been reduced.
Columbia California Intermediate Municipal Bond Fund | Annual Report 2023
| 7 |
Portfolio of Investments
April 30, 2023
(Percentages represent value of investments compared to net assets)
Investments in securities
| Floating Rate Notes 0.2% |
| Issue Description | Yield | | Principal
Amount ($) | Value ($) |
| Variable Rate Demand Notes 0.2% |
| New York City Water & Sewer System(a),(b) |
| Revenue Bonds |
| 2nd General Resolution |
| Series 2013 (JPMorgan Chase Bank) |
| 06/15/2050 | 3.750% | | 500,000 | 500,000 |
Total Floating Rate Notes
(Cost $500,000) | 500,000 |
|
| Municipal Bonds 99.3% |
| Issue Description | Coupon
Rate | | Principal
Amount ($) | Value ($) |
| Airport 13.6% |
| City of Los Angeles Department of Airports(c) |
| Refunding Revenue Bonds |
| Series 2018B |
| 05/15/2028 | 5.000% | | 2,000,000 | 2,169,697 |
| Revenue Bonds |
| Los Angeles International Airport |
| Subordinated Series 2019 |
| 05/15/2038 | 5.000% | | 3,500,000 | 3,716,190 |
| Senior Series 2020C |
| 05/15/2038 | 5.000% | | 3,000,000 | 3,231,269 |
| City of Los Angeles Department of Airports |
| Refunding Revenue Bonds |
| Subordinated Series 2015C |
| 05/15/2029 | 5.000% | | 2,410,000 | 2,539,877 |
| Subordinated Series 2019 |
| 05/15/2035 | 5.000% | | 1,485,000 | 1,685,350 |
| 05/15/2037 | 5.000% | | 840,000 | 934,849 |
| Revenue Bonds |
| Subordinated Series 2017B |
| 05/15/2029 | 5.000% | | 330,000 | 364,476 |
| 05/15/2030 | 5.000% | | 500,000 | 552,285 |
| County of Sacramento Airport System(c) |
| Refunding Revenue Bonds |
| Series 2018C |
| 07/01/2028 | 5.000% | | 3,090,000 | 3,328,850 |
| County of Sacramento Airport System |
| Refunding Revenue Bonds |
| Subordinated Series 2016B |
| 07/01/2036 | 5.000% | | 1,750,000 | 1,844,672 |
| Subordinated Series 2018E |
| 07/01/2029 | 5.000% | | 1,035,000 | 1,158,756 |
| 07/01/2034 | 5.000% | | 1,000,000 | 1,101,584 |
| Municipal Bonds (continued) |
| Issue Description | Coupon
Rate | | Principal
Amount ($) | Value ($) |
| Norman Y. Mineta San Jose International Airport |
| Refunding Revenue Bonds |
| Series 2014C |
| 03/01/2030 | 5.000% | | 2,500,000 | 2,550,684 |
| San Diego County Regional Airport Authority |
| Refunding Revenue Bonds |
| Subordinated Series 2017A |
| 07/01/2033 | 5.000% | | 1,000,000 | 1,095,979 |
| 07/01/2034 | 5.000% | | 700,000 | 763,886 |
| San Diego County Regional Airport Authority(c) |
| Refunding Revenue Bonds |
| Subordinated Series 2019B |
| 07/01/2036 | 5.000% | | 1,540,000 | 1,642,592 |
| Subordinated Series 2020 |
| 07/01/2036 | 5.000% | | 495,000 | 535,230 |
| 07/01/2039 | 5.000% | | 400,000 | 426,211 |
| Revenue Bonds |
| Subordinated Series 2021B |
| 07/01/2039 | 4.000% | | 250,000 | 243,295 |
| San Francisco City & County Airport Commission - San Francisco International Airport |
| Refunding Revenue Bonds |
| 2nd Series 2016A |
| 05/01/2026 | 5.000% | | 1,975,000 | 2,112,978 |
| San Francisco Airport Commission Project |
| Series 2019 |
| 05/01/2036 | 5.000% | | 3,205,000 | 3,569,958 |
| San Francisco City & County Airport Commission - San Francisco International Airport(c) |
| Refunding Revenue Bonds |
| Series 2020A-2 |
| 05/01/2039 | 4.000% | | 750,000 | 740,365 |
| Revenue Bonds |
| Series 2019E |
| 05/01/2037 | 5.000% | | 4,450,000 | 4,728,748 |
| San Francisco City & County Airport Commission-San Francisco International Airport(c) |
| Revenue Bonds |
| Series 2019A |
| 05/01/2038 | 5.000% | | 1,470,000 | 1,556,264 |
| Total | 42,594,045 |
| Charter Schools 4.6% |
| California Infrastructure & Economic Development Bank |
| Revenue Bonds |
| Equitable School Revolving Fund |
| Series 2019 |
| 11/01/2039 | 5.000% | | 275,000 | 287,617 |
The accompanying Notes to Financial Statements are an integral part of this statement.
| 8 | Columbia California Intermediate Municipal Bond Fund | Annual Report 2023 |
Portfolio of Investments (continued)
April 30, 2023
| Municipal Bonds (continued) |
| Issue Description | Coupon
Rate | | Principal
Amount ($) | Value ($) |
| California School Finance Authority(d) |
| Refunding Revenue Bonds |
| Aspire Public Schools |
| Series 2016 |
| 07/31/2029 | 5.000% | | 1,000,000 | 1,021,543 |
| 07/31/2030 | 5.000% | | 1,380,000 | 1,408,580 |
| 07/31/2031 | 5.000% | | 850,000 | 866,970 |
| Revenue Bonds |
| Alliance College-Ready Public Schools |
| Series 2015 |
| 07/01/2030 | 5.000% | | 3,400,000 | 3,498,521 |
| Aspire Public Schools Obligation Group |
| Series 2021 |
| 08/01/2036 | 4.000% | | 325,000 | 304,940 |
| Green Dot Public School Project |
| Series 2015A |
| 08/01/2035 | 5.000% | | 1,010,000 | 1,030,048 |
| Series 2018 |
| 08/01/2038 | 5.000% | | 1,000,000 | 1,022,443 |
| KIPP Los Angeles Projects |
| Series 2015A |
| 07/01/2035 | 5.000% | | 1,250,000 | 1,281,302 |
| Series 2017 |
| 07/01/2037 | 5.000% | | 3,090,000 | 3,190,103 |
| California School Finance Authority |
| Revenue Bonds |
| KIPP Los Angeles Projects |
| Series 2014A |
| 07/01/2034 | 5.000% | | 600,000 | 609,334 |
| Total | 14,521,401 |
| Higher Education 6.3% |
| California Educational Facilities Authority |
| Refunding Revenue Bonds |
| Loma Linda University |
| Series 2017A |
| 04/01/2034 | 5.000% | | 1,485,000 | 1,581,759 |
| 04/01/2035 | 5.000% | | 2,000,000 | 2,122,597 |
| Series 2018-A |
| 12/01/2036 | 5.000% | | 1,000,000 | 1,039,921 |
| Revenue Bonds |
| Chapman University |
| Series 2015 |
| 04/01/2026 | 5.000% | | 1,000,000 | 1,041,729 |
| Green Bonds - Loyola Marymount University |
| Series 2018 |
| 10/01/2036 | 5.000% | | 760,000 | 816,971 |
| Municipal Bonds (continued) |
| Issue Description | Coupon
Rate | | Principal
Amount ($) | Value ($) |
| California Municipal Finance Authority |
| Refunding Revenue Bonds |
| Azusa Pacific University |
| Series 2015B |
| 04/01/2025 | 5.000% | | 395,000 | 395,197 |
| 04/01/2026 | 5.000% | | 1,000,000 | 1,003,392 |
| Biola University |
| Series 2017 |
| 10/01/2031 | 5.000% | | 540,000 | 571,249 |
| 10/01/2032 | 5.000% | | 615,000 | 649,701 |
| 10/01/2033 | 5.000% | | 625,000 | 659,669 |
| 10/01/2034 | 5.000% | | 570,000 | 600,192 |
| California Lutheran University |
| Series 2018 |
| 10/01/2035 | 5.000% | | 225,000 | 235,191 |
| 10/01/2036 | 5.000% | | 250,000 | 259,602 |
| Revenue Bonds |
| National University |
| Series 2019A |
| 04/01/2035 | 5.000% | | 1,780,000 | 1,945,697 |
| 04/01/2036 | 5.000% | | 1,120,000 | 1,211,857 |
| California Municipal Finance Authority(d) |
| Revenue Bonds |
| California Baptist University |
| Series 2016A |
| 11/01/2026 | 4.000% | | 1,000,000 | 981,451 |
| California Statewide Communities Development Authority(d) |
| Refunding Revenue Bonds |
| California Baptist University |
| Series 2017A |
| 11/01/2032 | 5.000% | | 1,135,000 | 1,160,653 |
| Revenue Bonds |
| California Baptist University |
| Series 2014A |
| 11/01/2023 | 5.125% | | 255,000 | 255,426 |
| Lancer Plaza Project |
| Series 2013 |
| 11/01/2023 | 5.125% | | 145,000 | 145,250 |
| University of California |
| Refunding Revenue Bonds |
| Series 2023BN |
| 05/15/2039 | 5.000% | | 2,500,000 | 2,925,700 |
| Total | 19,603,204 |
| Hospital 8.5% |
| California Health Facilities Financing Authority |
| Refunding Revenue Bonds |
| Cedars Sinai Medical Center |
| Series 2015 |
| 11/15/2028 | 5.000% | | 1,000,000 | 1,063,761 |
The accompanying Notes to Financial Statements are an integral part of this statement.
Columbia California Intermediate Municipal Bond Fund | Annual Report 2023
| 9 |
Portfolio of Investments (continued)
April 30, 2023
| Municipal Bonds (continued) |
| Issue Description | Coupon
Rate | | Principal
Amount ($) | Value ($) |
| El Camino Hospital |
| Series 2015A |
| 02/01/2027 | 5.000% | | 1,500,000 | 1,555,635 |
| Marshall Medical Center |
| Series 2015 |
| 11/01/2023 | 5.000% | | 325,000 | 327,774 |
| Sutter Health |
| Series 2017A |
| 11/15/2033 | 5.000% | | 1,000,000 | 1,091,561 |
| Revenue Bonds |
| El Camino Hospital |
| Series 2017 |
| 02/01/2033 | 5.000% | | 2,500,000 | 2,688,624 |
| 02/01/2034 | 5.000% | | 500,000 | 536,540 |
| Kaiser Permanente |
| Subordinated Series 2017A-1-G |
| 11/01/2027 | 5.000% | | 1,875,000 | 2,083,688 |
| Lucile Salter Packard Children’s Hospital |
| Series 2014 |
| 08/15/2028 | 5.000% | | 300,000 | 308,427 |
| Series 2017 |
| 11/15/2034 | 5.000% | | 250,000 | 269,817 |
| 11/15/2035 | 5.000% | | 270,000 | 289,802 |
| Providence Health & Services |
| Series 2014A |
| 10/01/2030 | 5.000% | | 1,500,000 | 1,545,097 |
| Sutter Health |
| Series 2018A |
| 11/15/2034 | 5.000% | | 1,000,000 | 1,087,652 |
| California Municipal Finance Authority |
| Refunding Revenue Bonds |
| Community Medical Centers |
| Series 2017A |
| 02/01/2033 | 5.000% | | 2,770,000 | 2,924,453 |
| Revenue Bonds |
| Clincas Del Camino Real, Inc. |
| Series 2020 |
| 03/01/2035 | 4.000% | | 500,000 | 457,969 |
| California Statewide Communities Development Authority |
| Revenue Bonds |
| Green - Marin General Hospital Project |
| Series 2018 |
| 08/01/2033 | 5.000% | | 425,000 | 450,556 |
| 08/01/2034 | 5.000% | | 650,000 | 687,942 |
| Loma Linda University Medical Center |
| Series 2014 |
| 12/01/2034 | 5.250% | | 3,000,000 | 3,063,371 |
| Methodist Hospital of Southern California |
| Series 2018 |
| 01/01/2036 | 5.000% | | 3,000,000 | 3,150,214 |
| Municipal Bonds (continued) |
| Issue Description | Coupon
Rate | | Principal
Amount ($) | Value ($) |
| California Statewide Communities Development Authority(e) |
| Revenue Bonds |
| Kaiser Permanente |
| Series 2019 (Mandatory Put 11/01/29) |
| 03/31/2036 | 5.000% | | 1,410,000 | 1,610,672 |
| City of Upland |
| Refunding Certificate of Participation |
| San Antonio Regional Hospital |
| Series 2017 |
| 01/01/2034 | 5.000% | | 500,000 | 531,306 |
| 01/01/2036 | 4.000% | | 1,000,000 | 978,868 |
| Total | 26,703,729 |
| Human Service Provider 0.4% |
| California Municipal Finance Authority |
| Refunding Revenue Bonds |
| Harbor Regional Center Project |
| Series 2015 |
| 11/01/2032 | 5.000% | | 1,120,000 | 1,190,552 |
| Joint Power Authority 0.5% |
| Northern California Transmission Agency |
| Refunding Revenue Bonds |
| California-Oregon Project |
| Series 2016 |
| 05/01/2032 | 5.000% | | 1,500,000 | 1,604,614 |
| Local Appropriation 2.3% |
| Anaheim Public Financing Authority |
| Refunding Revenue Bonds |
| Anaheim Public Improvement Projects |
| Series 2019 BAM |
| 09/01/2031 | 5.000% | | 1,470,000 | 1,654,595 |
| Fresno Joint Powers Financing Authority |
| Refunding Revenue Bonds |
| Master Lease Project |
| Series 2017A (AGM) |
| 04/01/2033 | 5.000% | | 1,000,000 | 1,092,091 |
| Los Angeles County Public Works Financing Authority |
| Revenue Bonds |
| Green Bonds - LACMA Building for the Permanent Collection Project |
| Series 2020A |
| 12/01/2037 | 4.000% | | 2,415,000 | 2,505,545 |
| San Rafael Joint Powers Financing Authority |
| Revenue Bonds |
| Public Safety Facilities Project |
| Series 2018 |
| 06/01/2033 | 5.000% | | 850,000 | 956,385 |
| 06/01/2034 | 5.000% | | 775,000 | 871,656 |
| Total | 7,080,272 |
The accompanying Notes to Financial Statements are an integral part of this statement.
| 10 | Columbia California Intermediate Municipal Bond Fund | Annual Report 2023 |
Portfolio of Investments (continued)
April 30, 2023
| Municipal Bonds (continued) |
| Issue Description | Coupon
Rate | | Principal
Amount ($) | Value ($) |
| Local General Obligation 7.8% |
| Bellevue Union School District(f) |
| Unlimited General Obligation Bonds |
| Capital Appreciation - Election of 2008 |
| Series 2011A (AGM) |
| 08/01/2030 | 0.000% | | 585,000 | 459,324 |
| 08/01/2031 | 0.000% | | 615,000 | 464,945 |
| City of San Jose |
| Unlimited General Obligation Bonds |
| Series 2021A |
| 09/01/2040 | 5.000% | | 1,000,000 | 1,122,295 |
| Compton Unified School District(f) |
| Unlimited General Obligation Bonds |
| Capital Appreciation - Election of 2002 |
| Series 2006C (AMBAC) |
| 06/01/2024 | 0.000% | | 1,925,000 | 1,853,023 |
| Conejo Valley Unified School District |
| Unlimited General Obligation Bonds |
| Series 2018B |
| 08/01/2032 | 4.000% | | 2,000,000 | 2,124,778 |
| Corona-Norco Unified School District |
| Unlimited General Obligation Bonds |
| Election of 2014 |
| Series 2018B |
| 08/01/2034 | 4.000% | | 500,000 | 523,021 |
| Encinitas Union School District(e) |
| Unlimited General Obligation Bonds |
| Capital Appreciation - Election of 2010 |
| Series 2011 |
| 08/01/2035 | 6.750% | | 500,000 | 647,877 |
| Long Beach Unified School District(f) |
| Unlimited General Obligation Bonds |
| Series 2015D-1 |
| 08/01/2031 | 0.000% | | 1,375,000 | 996,865 |
| Los Angeles Unified School District |
| Unlimited General Obligation Bonds |
| Election of 2008 |
| Series 2018B-1 |
| 07/01/2032 | 5.000% | | 4,000,000 | 4,457,947 |
| Monterey Peninsula Community College District(f) |
| Unlimited General Obligation Refunding Bonds |
| Series 2016 |
| 08/01/2028 | 0.000% | | 2,125,000 | 1,810,389 |
| Napa Valley Community College District(e) |
| Unlimited General Obligation Refunding Bonds |
| Series 2018 |
| 08/01/2034 | 4.000% | | 1,595,000 | 1,640,391 |
| Oakland Unified School District/Alameda County |
| Unlimited General Obligation Bonds |
| Series 2015A |
| 08/01/2025 | 5.000% | | 650,000 | 678,819 |
| Municipal Bonds (continued) |
| Issue Description | Coupon
Rate | | Principal
Amount ($) | Value ($) |
| Pomona Unified School District(f) |
| Unlimited General Obligation Bonds |
| Election of 2008 |
| Series 2016G (AGM) |
| 08/01/2032 | 0.000% | | 1,000,000 | 732,554 |
| Rancho Santiago Community College District(f) |
| Unlimited General Obligation Bonds |
| Capital Appreciation - Election of 2002 |
| Series 2006C (AGM) |
| 09/01/2031 | 0.000% | | 3,785,000 | 2,924,997 |
| Rescue Union School District(f) |
| Unlimited General Obligation Bonds |
| Capital Appreciation - Election of 1998 |
| Series 2005 (NPFGC) |
| 09/01/2026 | 0.000% | | 1,100,000 | 986,289 |
| Santa Monica Community College District |
| Unlimited General Obligation Bonds |
| Election of 2016 |
| Series 2018A |
| 08/01/2034 | 4.000% | | 500,000 | 529,616 |
| Sierra Kings Health Care District |
| Unlimited General Obligation Refunding Bonds |
| Series 2015 |
| 08/01/2028 | 5.000% | | 1,000,000 | 1,043,523 |
| 08/01/2032 | 5.000% | | 1,500,000 | 1,566,254 |
| Total | 24,562,907 |
| Multi-Family 1.3% |
| California Housing Finance |
| Revenue Bonds |
| Series 2019-2 Class A |
| 03/20/2033 | 4.000% | | 1,135,997 | 1,133,724 |
| California Municipal Finance Authority |
| Revenue Bonds |
| Bowles Hall Foundation |
| Series 2015A |
| 06/01/2035 | 5.000% | | 400,000 | 403,678 |
| Caritas Affordable Housing |
| Series 2014 |
| 08/15/2030 | 5.000% | | 1,000,000 | 1,019,106 |
| California Statewide Communities Development Authority |
| Revenue Bonds |
| Lancer Educational Student Housing Project |
| Series 2019 |
| 06/01/2034 | 5.000% | | 375,000 | 370,591 |
| Series 2017 |
| 05/15/2032 | 5.000% | | 1,000,000 | 1,034,278 |
| Total | 3,961,377 |
The accompanying Notes to Financial Statements are an integral part of this statement.
Columbia California Intermediate Municipal Bond Fund | Annual Report 2023
| 11 |
Portfolio of Investments (continued)
April 30, 2023
| Municipal Bonds (continued) |
| Issue Description | Coupon
Rate | | Principal
Amount ($) | Value ($) |
| Municipal Power 6.6% |
| City of Redding Electric System |
| Refunding Revenue Bonds |
| Series 2017 |
| 06/01/2029 | 5.000% | | 1,250,000 | 1,371,211 |
| City of Riverside Electric |
| Refunding Revenue Bonds |
| Series 2019A |
| 10/01/2037 | 5.000% | | 1,000,000 | 1,115,559 |
| City of Vernon Electric System |
| Refunding Revenue Bonds |
| Series 2022A |
| 08/01/2039 | 5.000% | | 425,000 | 447,462 |
| Los Angeles Department of Water & Power |
| Refunding Revenue Bonds |
| Power System |
| Series 2017B |
| 07/01/2029 | 5.000% | | 3,580,000 | 3,919,571 |
| Los Angeles Department of Water & Power System |
| Refunding Revenue Bonds |
| Series 2018A |
| 07/01/2035 | 5.000% | | 1,750,000 | 1,940,489 |
| Series 2019B |
| 07/01/2031 | 5.000% | | 2,500,000 | 2,846,847 |
| Revenue Bonds |
| Power System |
| Series 2014D |
| 07/01/2033 | 5.000% | | 1,700,000 | 1,740,293 |
| Redding Joint Powers Financing Authority |
| Refunding Revenue Bonds |
| Series 2015A |
| 06/01/2031 | 5.000% | | 1,045,000 | 1,109,699 |
| Sacramento Municipal Utility District |
| Revenue Bonds |
| Electric |
| Series 2020H |
| 08/15/2033 | 5.000% | | 2,000,000 | 2,361,579 |
| Turlock Irrigation District |
| Refunding Revenue Bonds |
| First Priority |
| Subordinated Series 2014 |
| 01/01/2030 | 5.000% | | 850,000 | 867,888 |
| 01/01/2031 | 5.000% | | 1,000,000 | 1,020,815 |
| Series 2020 |
| 01/01/2038 | 5.000% | | 1,650,000 | 1,844,392 |
| Total | 20,585,805 |
| Municipal Bonds (continued) |
| Issue Description | Coupon
Rate | | Principal
Amount ($) | Value ($) |
| Other Bond Issue 0.9% |
| California Infrastructure & Economic Development Bank |
| Refunding Revenue Bonds |
| Salvation Army Western Territory (The) |
| Series 2016 |
| 09/01/2033 | 4.000% | | 400,000 | 410,168 |
| 09/01/2034 | 4.000% | | 600,000 | 614,061 |
| Walt Disney Family Museum |
| Series 2016 |
| 02/01/2032 | 4.000% | | 350,000 | 358,171 |
| 02/01/2033 | 4.000% | | 500,000 | 510,961 |
| City of Long Beach Marina System |
| Revenue Bonds |
| Series 2015 |
| 05/15/2028 | 5.000% | | 635,000 | 652,875 |
| County of San Diego |
| Refunding Revenue Bonds |
| Sanford Burnham Prebys Medical Discovery Group |
| Series 2015 |
| 11/01/2025 | 5.000% | | 350,000 | 368,210 |
| Total | 2,914,446 |
| Ports 0.7% |
| City of Long Beach Harbor |
| Revenue Bonds |
| Series 2019A |
| 05/15/2036 | 5.000% | | 700,000 | 787,388 |
| Port Commission of the City & County of San Francisco |
| Refunding Revenue Bonds |
| Series 2020A |
| 03/01/2039 | 4.000% | | 1,260,000 | 1,268,003 |
| Total | 2,055,391 |
| Prepaid Gas 1.8% |
| California Community Choice Financing Authority |
| Revenue Bonds |
| Green Bonds - Clean Energy Project |
| Series 2023 (Mandatory Put 08/01/29) |
| 12/01/2053 | 5.000% | | 1,000,000 | 1,060,884 |
| M-S-R Energy Authority |
| Revenue Bonds |
| Series 2009B |
| 11/01/2029 | 6.125% | | 1,780,000 | 1,915,118 |
| Series 2009C |
| 10/31/2039 | 6.500% | | 2,350,000 | 2,754,381 |
| Total | 5,730,383 |
The accompanying Notes to Financial Statements are an integral part of this statement.
| 12 | Columbia California Intermediate Municipal Bond Fund | Annual Report 2023 |
Portfolio of Investments (continued)
April 30, 2023
| Municipal Bonds (continued) |
| Issue Description | Coupon
Rate | | Principal
Amount ($) | Value ($) |
| Recreation 0.5% |
| Del Mar Race Track Authority |
| Refunding Revenue Bonds |
| Series 2015 |
| 10/01/2025 | 5.000% | | 1,665,000 | 1,669,442 |
| Refunded / Escrowed 9.0% |
| California Educational Facilities Authority |
| Revenue Bonds |
| University of Southern California |
| Series 2009C Escrowed to Maturity |
| 10/01/2024 | 5.250% | | 3,000,000 | 3,099,620 |
| California Municipal Finance Authority |
| Prerefunded 02/01/25 Revenue Bonds |
| Community Medical Centers |
| Series 2015A |
| 02/01/2027 | 5.000% | | 1,200,000 | 1,245,800 |
| Refunding Revenue Bonds |
| Retirement Housing Foundation |
| Series 2017 Escrowed to Maturity |
| 11/15/2029 | 5.000% | | 390,000 | 451,644 |
| 11/15/2030 | 5.000% | | 600,000 | 708,113 |
| 11/15/2032 | 5.000% | | 850,000 | 1,036,026 |
| California School Finance Authority(d) |
| Revenue Bonds |
| River Springs Charter School Project |
| Series 2015 Escrowed to Maturity |
| 07/01/2025 | 5.250% | | 915,000 | 935,460 |
| California Statewide Communities Development Authority |
| Prerefunded 02/15/26 Revenue Bonds |
| Enloe Medical Center |
| Series 2015 |
| 08/15/2030 | 5.000% | | 1,990,000 | 2,119,674 |
| Prerefunded 07/01/24 Revenue Bonds |
| Huntington Memorial Hospital |
| Series 2014B |
| 07/01/2033 | 5.000% | | 2,300,000 | 2,352,120 |
| Prerefunded 10/01/24 Revenue Bonds |
| Henry Mayo Newhall Memorial Hospital |
| Series 2014A (AGM) |
| 10/01/2027 | 5.000% | | 1,000,000 | 1,028,503 |
| Prerefunded 11/15/23 Revenue Bonds |
| Insured Redwoods Project |
| Series 2013 |
| 11/15/2028 | 5.000% | | 1,000,000 | 1,009,984 |
| City of Los Angeles Department of Airports |
| Prerefunded 05/15/29 Refunding Revenue Bonds |
| Subordinated Series 2019 |
| 05/15/2035 | 5.000% | | 2,490,000 | 2,885,713 |
| 05/15/2037 | 5.000% | | 1,410,000 | 1,634,079 |
| Municipal Bonds (continued) |
| Issue Description | Coupon
Rate | | Principal
Amount ($) | Value ($) |
| Golden State Tobacco Securitization Corp. |
| Prerefunded 06/01/25 Asset-Backed Revenue Bonds |
| Series 2015A |
| 06/01/2033 | 5.000% | | 4,000,000 | 4,188,219 |
| Refunding Revenue Bonds |
| Series 2017A-1 Escrowed to Maturity |
| 06/01/2024 | 5.000% | | 4,000,000 | 4,083,235 |
| La Quinta Redevelopment Agency Successor Agency |
| Prerefunded 09/01/23 Tax Allocation Bonds |
| Redevelopment Project |
| Subordinated Series 2013A |
| 09/01/2030 | 5.000% | | 1,500,000 | 1,508,766 |
| Total | 28,286,956 |
| Retirement Communities 3.0% |
| California Health Facilities Financing Authority |
| Refunding Revenue Bonds |
| Northern California Presbyterian Homes |
| Series 2015 |
| 07/01/2028 | 5.000% | | 310,000 | 326,308 |
| 07/01/2029 | 5.000% | | 300,000 | 316,111 |
| California Municipal Finance Authority |
| Refunding Revenue Bonds |
| HumanGood Obligation Group |
| Series 2019A |
| 10/01/2034 | 4.000% | | 500,000 | 501,922 |
| 10/01/2035 | 4.000% | | 1,000,000 | 1,001,587 |
| California Public Finance Authority(d) |
| Revenue Bonds |
| Enso Village Project - Green Bonds - TEMPS 70 |
| Series 2021 |
| 11/15/2028 | 2.375% | | 2,000,000 | 1,882,812 |
| California Statewide Communities Development Authority |
| Refunding Revenue Bonds |
| American Baptist Homes West |
| Series 2015 |
| 10/01/2024 | 5.000% | | 2,575,000 | 2,610,481 |
| 10/01/2026 | 5.000% | | 1,000,000 | 1,030,424 |
| Front Porch Communities & Services |
| Series 2017 |
| 04/01/2030 | 5.000% | | 150,000 | 156,853 |
| Series 2021 |
| 04/01/2039 | 4.000% | | 750,000 | 723,369 |
| Revenue Bonds |
| Viamonte Senior Living 1, Inc. |
| Series 2018 |
| 07/01/2035 | 4.000% | | 300,000 | 308,295 |
| 07/01/2036 | 4.000% | | 430,000 | 438,875 |
| Total | 9,297,037 |
The accompanying Notes to Financial Statements are an integral part of this statement.
Columbia California Intermediate Municipal Bond Fund | Annual Report 2023
| 13 |
Portfolio of Investments (continued)
April 30, 2023
| Municipal Bonds (continued) |
| Issue Description | Coupon
Rate | | Principal
Amount ($) | Value ($) |
| Sales Tax 1.1% |
| California Statewide Communities Development Authority |
| Certificate of Participation |
| Total Road Improvement Program |
| Series 2018B (AGM) |
| 12/01/2035 | 5.000% | | 1,405,000 | 1,562,557 |
| City of Sacramento Transient Occupancy |
| Revenue Bonds |
| Convention Center Complex |
| Subordinated Series 2018 |
| 06/01/2035 | 5.000% | | 615,000 | 668,654 |
| 06/01/2036 | 5.000% | | 1,180,000 | 1,274,412 |
| Total | 3,505,623 |
| Special Non Property Tax 0.2% |
| Berkeley Joint Powers Financing Authority |
| Revenue Bonds |
| Series 2016 (BAM) |
| 06/01/2033 | 4.000% | | 415,000 | 428,492 |
| 06/01/2034 | 4.000% | | 250,000 | 257,197 |
| Total | 685,689 |
| Special Property Tax 14.8% |
| Carson Public Financing Authority |
| Revenue Bonds |
| Series 2019 |
| 09/02/2026 | 5.000% | | 650,000 | 682,065 |
| City & County of San Francisco Community Facilities District No. 2016-1 |
| Special Tax Bonds |
| Series 2021 |
| 09/01/2041 | 4.000% | | 745,000 | 685,846 |
| City of Irvine |
| Refunding Special Assessment Bonds |
| Limited Obligation Reassessment District |
| Series 2015 |
| 09/02/2025 | 5.000% | | 1,295,000 | 1,351,369 |
| Special Assessment Refunding Bonds |
| Series 2019 |
| 09/02/2032 | 5.000% | | 340,000 | 375,566 |
| Concord Redevelopment Agency Successor Agency |
| Refunding Tax Allocation Bonds |
| Series 2014 (BAM) |
| 03/01/2025 | 5.000% | | 840,000 | 866,938 |
| Emeryville Redevelopment Agency Successor Agency |
| Refunding Tax Allocation Bonds |
| Series 2014A (AGM) |
| 09/01/2026 | 5.000% | | 1,000,000 | 1,026,638 |
| 09/01/2027 | 5.000% | | 1,000,000 | 1,027,452 |
| 09/01/2030 | 5.000% | | 815,000 | 837,751 |
| 09/01/2031 | 5.000% | | 590,000 | 606,506 |
| Municipal Bonds (continued) |
| Issue Description | Coupon
Rate | | Principal
Amount ($) | Value ($) |
| Garden Grove Agency Community Development Successor Agency |
| Refunding Tax Allocation Bonds |
| Garden Grove Community Project |
| Series 2016 (BAM) |
| 10/01/2030 | 5.000% | | 1,040,000 | 1,111,268 |
| 10/01/2031 | 5.000% | | 1,640,000 | 1,752,089 |
| Inglewood Redevelopment Agency Successor Agency |
| Refunding Tax Allocation Bonds |
| Merged Redevelopment Project |
| Subordinated Series 2017 (BAM) |
| 05/01/2032 | 5.000% | | 500,000 | 546,522 |
| 05/01/2033 | 5.000% | | 1,000,000 | 1,091,916 |
| Irvine Facilities Financing Authority(g) |
| Special Tax Bonds |
| Irvine Great Park Infrastructure Project |
| Series 2023 |
| 09/01/2040 | 5.000% | | 2,000,000 | 2,280,334 |
| Irvine Unified School District |
| Refunding Special Tax Bonds |
| Series 2015 |
| 09/01/2030 | 5.000% | | 2,065,000 | 2,159,234 |
| 09/01/2031 | 5.000% | | 2,720,000 | 2,843,856 |
| Jurupa Public Financing Authority |
| Refunding Special Tax Bonds |
| Series 2014A |
| 09/01/2029 | 5.000% | | 530,000 | 543,770 |
| 09/01/2030 | 5.000% | | 625,000 | 640,002 |
| 09/01/2032 | 5.000% | | 625,000 | 637,950 |
| Los Angeles Community Facilities District |
| Refunding Special Tax Bonds |
| Playa Vista-Phase 1 |
| Series 2014 |
| 09/01/2030 | 5.000% | | 985,000 | 1,021,809 |
| Los Angeles County Redevelopment Authority |
| Refunding Tax Allocation Bonds |
| Los Angeles Bunker Hill Project |
| Series 2014C (AGM) |
| 12/01/2028 | 5.000% | | 3,000,000 | 3,118,266 |
| Oakley Redevelopment Agency |
| Refunding Tax Allocation Bonds |
| Oakley Redevelopment Project Area |
| Series 2018 (BAM) |
| 09/01/2032 | 5.000% | | 335,000 | 374,529 |
| 09/01/2033 | 5.000% | | 730,000 | 814,984 |
| 09/01/2034 | 5.000% | | 500,000 | 557,559 |
| Palm Desert Redevelopment Agency |
| Refunding Tax Allocation Bonds |
| Series 2017A (BAM) |
| 10/01/2029 | 5.000% | | 890,000 | 971,236 |
| 10/01/2030 | 5.000% | | 350,000 | 381,819 |
The accompanying Notes to Financial Statements are an integral part of this statement.
| 14 | Columbia California Intermediate Municipal Bond Fund | Annual Report 2023 |
Portfolio of Investments (continued)
April 30, 2023
| Municipal Bonds (continued) |
| Issue Description | Coupon
Rate | | Principal
Amount ($) | Value ($) |
| Poway Unified School District Public Financing Authority |
| Special Tax Refunding Bonds |
| Series 2015B |
| 09/01/2026 | 5.000% | | 995,000 | 1,048,842 |
| Rancho Cucamonga Redevelopment Agency Successor Agency |
| Tax Allocation Bonds |
| Rancho Redevelopment Project Area |
| Series 2014 |
| 09/01/2030 | 5.000% | | 700,000 | 722,606 |
| Series 2014 (AGM) |
| 09/01/2027 | 5.000% | | 2,200,000 | 2,267,684 |
| Riverside County Public Financing Authority |
| Tax Allocation Bonds |
| Project Area #1-Desert Communities |
| Series 2016 (BAM) |
| 10/01/2031 | 4.000% | | 2,500,000 | 2,557,860 |
| San Francisco City & County Redevelopment Agency |
| Refunding Tax Allocation Bonds |
| Mission Bay North Redevelopment Project |
| Series 2016 |
| 08/01/2030 | 5.000% | | 275,000 | 294,935 |
| 08/01/2031 | 5.000% | | 355,000 | 380,682 |
| Mission Bay South Redevelopment Project |
| Series 2016 |
| 08/01/2031 | 5.000% | | 670,000 | 718,470 |
| 08/01/2032 | 5.000% | | 580,000 | 620,586 |
| Tax Allocation Bonds |
| Mission Bay South Redevelopment Project |
| Series 2014A |
| 08/01/2029 | 5.000% | | 225,000 | 231,729 |
| 08/01/2030 | 5.000% | | 175,000 | 180,259 |
| San Mateo Redevelopment Agency Successor Agency |
| Refunding Tax Allocation Bonds |
| Series 2015A |
| 08/01/2028 | 5.000% | | 1,860,000 | 1,954,211 |
| 08/01/2029 | 5.000% | | 1,000,000 | 1,051,227 |
| Semitropic Improvement District |
| Refunding Revenue Bonds |
| Series 2015A 2nd Lien (AGM) |
| 12/01/2023 | 5.000% | | 300,000 | 303,197 |
| 12/01/2024 | 5.000% | | 400,000 | 412,842 |
| Transbay Joint Powers Authority |
| Senior Tax Allocation Bonds |
| Green Bonds |
| Series 2020A |
| 10/01/2033 | 5.000% | | 500,000 | 546,722 |
| Tustin Community Facilities District |
| Refunding Special Tax Bonds |
| Legacy Villages of Columbus #06-1 |
| Series 2015 |
| 09/01/2029 | 5.000% | | 1,200,000 | 1,258,141 |
| Municipal Bonds (continued) |
| Issue Description | Coupon
Rate | | Principal
Amount ($) | Value ($) |
| Tustin Community Redevelopment Agency Successor Agency |
| Refunding Tax Allocation Bonds |
| Series 2016 |
| 09/01/2032 | 4.000% | | 2,295,000 | 2,368,511 |
| Vista Redevelopment Agency Successor Agency |
| Tax Allocation Refunding Bonds |
| Series 2015B1 (AGM) |
| 09/01/2024 | 5.000% | | 580,000 | 592,474 |
| 09/01/2026 | 5.000% | | 700,000 | 734,796 |
| Total | 46,553,048 |
| State Appropriated 5.1% |
| California State Public Works Board |
| Refunding Revenue Bonds |
| Various Purpose |
| Series 2022A |
| 08/01/2036 | 5.000% | | 5,040,000 | 5,840,079 |
| Revenue Bonds |
| Department of Corrections and Rehabilitation |
| Series 2015A |
| 06/01/2028 | 5.000% | | 1,175,000 | 1,233,651 |
| Green Bonds |
| Series 2021 |
| 11/01/2037 | 4.000% | | 2,665,000 | 2,749,612 |
| Various Capital Projects |
| Series 2013I |
| 11/01/2028 | 5.250% | | 1,500,000 | 1,513,970 |
| Series 2014E |
| 09/01/2030 | 5.000% | | 1,500,000 | 1,533,836 |
| Various Correctional Facilities |
| Series 2014A |
| 09/01/2031 | 5.000% | | 3,000,000 | 3,067,671 |
| Total | 15,938,819 |
| State General Obligation 2.9% |
| State of California |
| Unlimited General Obligation Bonds |
| Series 2019 |
| 11/01/2029 | 5.000% | | 2,165,000 | 2,498,294 |
| 04/01/2031 | 5.000% | | 1,000,000 | 1,139,853 |
| Unlimited General Obligation Refunding Bonds |
| Series 2014 |
| 08/01/2032 | 5.000% | | 3,000,000 | 3,080,006 |
| Series 2023 |
| 10/01/2039 | 5.000% | | 1,000,000 | 1,154,580 |
| Various Purpose |
| Series 2021 |
| 10/01/2028 | 5.000% | | 1,205,000 | 1,359,166 |
| Total | 9,231,899 |
The accompanying Notes to Financial Statements are an integral part of this statement.
Columbia California Intermediate Municipal Bond Fund | Annual Report 2023
| 15 |
Portfolio of Investments (continued)
April 30, 2023
| Municipal Bonds (continued) |
| Issue Description | Coupon
Rate | | Principal
Amount ($) | Value ($) |
| Tobacco 0.7% |
| California County Tobacco Securitization Agency |
| Refunding Revenue Bonds |
| Series 2020A |
| 06/01/2032 | 5.000% | | 250,000 | 276,135 |
| 06/01/2033 | 5.000% | | 250,000 | 275,804 |
| 06/01/2034 | 4.000% | | 200,000 | 204,705 |
| Tobacco Securitization Authority of Southern California |
| Refunding Revenue Bonds |
| San Diego County Tobacco Asset Securitization Corp. |
| Series 2019 |
| 06/01/2030 | 5.000% | | 1,220,000 | 1,345,869 |
| Total | 2,102,513 |
| Transportation 0.2% |
| Peninsula Corridor Joint Powers Board |
| Refunding Revenue Bonds |
| Series 2019A |
| 10/01/2036 | 5.000% | | 315,000 | 352,111 |
| 10/01/2037 | 5.000% | | 300,000 | 332,702 |
| Total | 684,813 |
| Turnpike / Bridge / Toll Road 1.9% |
| Bay Area Toll Authority |
| Refunding Revenue Bonds |
| Subordinated Series 2017 |
| 04/01/2031 | 4.000% | | 2,000,000 | 2,102,954 |
| Foothill-Eastern Transportation Corridor Agency(f) |
| Refunding Revenue Bonds |
| Series 2015 |
| 01/15/2033 | 0.000% | | 5,000,000 | 3,479,967 |
| Riverside County Transportation Commission |
| Refunding Revenue Bonds |
| RCTC 91 Express Lanes |
| Series 2021 |
| 06/01/2038 | 4.000% | | 375,000 | 375,161 |
| Total | 5,958,082 |
| Water & Sewer 4.6% |
| Beaumont Public Improvement Authority |
| Revenue Bonds |
| Series 2018-A (AGM) |
| 09/01/2033 | 5.000% | | 500,000 | 541,270 |
| 09/01/2035 | 5.000% | | 830,000 | 894,691 |
| City of Riverside Water |
| Refunding Revenue Bonds |
| Series 2019A |
| 10/01/2032 | 5.000% | | 1,500,000 | 1,724,949 |
| Municipal Bonds (continued) |
| Issue Description | Coupon
Rate | | Principal
Amount ($) | Value ($) |
| City of Tulare Sewer |
| Refunding Revenue Bonds |
| Series 2015 (AGM) |
| 11/15/2025 | 5.000% | | 700,000 | 738,828 |
| 11/15/2026 | 5.000% | | 1,000,000 | 1,058,929 |
| Livermore Valley Water Financing Authority |
| Refunding Revenue Bonds |
| Series 2018A |
| 07/01/2034 | 4.000% | | 920,000 | 962,392 |
| Los Angeles County Sanitation Districts Financing Authority |
| Refunding Revenue Bonds |
| Capital Projects - District #14 |
| Subordinated Series 2015 |
| 10/01/2024 | 5.000% | | 1,050,000 | 1,080,960 |
| Los Angeles Department of Water & Power Water System |
| Refunding Revenue Bonds |
| Series 2022D |
| 07/01/2040 | 5.000% | | 2,500,000 | 2,857,012 |
| Mountain House Public Financing Authority |
| Revenue Bonds |
| Green Bonds |
| Subordinated Series 2020B (BAM) |
| 12/01/2035 | 4.000% | | 1,000,000 | 1,037,901 |
| Santa Paula Utility Authority |
| Refunding Revenue Bonds |
| Series 2019 (AGM) |
| 02/01/2034 | 4.000% | | 575,000 | 607,265 |
| 02/01/2036 | 4.000% | | 1,325,000 | 1,365,959 |
| Stockton Public Financing Authority |
| Refunding Revenue Bonds |
| Series 2014 (BAM) |
| 09/01/2028 | 5.000% | | 1,500,000 | 1,532,654 |
| Total | 14,402,810 |
Total Municipal Bonds
(Cost $313,245,254) | 311,424,857 |
| Money Market Funds 0.2% |
| | Shares | Value ($) |
| Dreyfus Tax Exempt Cash Management Fund, Institutional Shares, 3.321%(h) | 99,574 | 99,564 |
| JPMorgan Institutional Tax Free Money Market Fund, Institutional Shares, 3.136%(h) | 699,370 | 699,370 |
Total Money Market Funds
(Cost $798,944) | 798,934 |
Total Investments in Securities
(Cost: $314,544,198) | 312,723,791 |
| Other Assets & Liabilities, Net | | 989,388 |
| Net Assets | 313,713,179 |
The accompanying Notes to Financial Statements are an integral part of this statement.
| 16 | Columbia California Intermediate Municipal Bond Fund | Annual Report 2023 |
Portfolio of Investments (continued)
April 30, 2023
Notes to Portfolio of Investments
| (a) | The Fund is entitled to receive principal and interest from the guarantor after a day or a week’s notice or upon maturity. The maturity date disclosed represents the final maturity. |
| (b) | Represents a variable rate security where the coupon rate adjusts on specified dates (generally daily or weekly) using the prevailing money market rate. The interest rate shown was the current rate as of April 30, 2023. |
| (c) | Income from this security may be subject to alternative minimum tax. |
| (d) | Represents privately placed and other securities and instruments exempt from Securities and Exchange Commission registration (collectively, private placements), such as Section 4(a)(2) and Rule 144A eligible securities, which are often sold only to qualified institutional buyers. At April 30, 2023, the total value of these securities amounted to $18,985,502, which represents 6.05% of total net assets. |
| (e) | Represents a variable rate security with a step coupon where the rate adjusts according to a schedule for a series of periods, typically lower for an initial period and then increasing to a higher coupon rate thereafter. The interest rate shown was the current rate as of April 30, 2023. |
| (f) | Zero coupon bond. |
| (g) | Represents a security purchased on a when-issued basis. |
| (h) | The rate shown is the seven-day current annualized yield at April 30, 2023. |
Abbreviation Legend
| AGM | Assured Guaranty Municipal Corporation |
| AMBAC | Ambac Assurance Corporation |
| BAM | Build America Mutual Assurance Co. |
| NPFGC | National Public Finance Guarantee Corporation |
Fair value measurements
The Fund categorizes its fair value measurements according to a three-level hierarchy that maximizes the use of observable inputs and minimizes the use of unobservable inputs by prioritizing that the most observable input be used when available. Observable inputs are those that market participants would use in pricing an investment based on market data obtained from sources independent of the reporting entity. Unobservable inputs are those that reflect the Fund’s assumptions about the information market participants would use in pricing an investment. An investment’s level within the fair value hierarchy is based on the lowest level of any input that is deemed significant to the asset’s or liability’s fair value measurement. The input levels are not necessarily an indication of the risk or liquidity associated with investments at that level. For example, certain U.S. government securities are generally high quality and liquid, however, they are reflected as Level 2 because the inputs used to determine fair value may not always be quoted prices in an active market.
Fair value inputs are summarized in the three broad levels listed below:
| ■ | Level 1 — Valuations based on quoted prices for investments in active markets that the Fund has the ability to access at the measurement date. Valuation adjustments are not applied to Level 1 investments. |
| ■ | Level 2 — Valuations based on other significant observable inputs (including quoted prices for similar securities, interest rates, prepayment speeds, credit risks, etc.). |
| ■ | Level 3 — Valuations based on significant unobservable inputs (including the Fund’s own assumptions and judgment in determining the fair value of investments). |
Inputs that are used in determining fair value of an investment may include price information, credit data, volatility statistics, and other factors. These inputs can be either observable or unobservable. The availability of observable inputs can vary between investments, and is affected by various factors such as the type of investment, and the volume and level of activity for that investment or similar investments in the marketplace. The inputs will be considered by the Investment Manager, along with any other relevant factors in the calculation of an investment’s fair value. The Fund uses prices and inputs that are current as of the measurement date, which may include periods of market dislocations. During these periods, the availability of prices and inputs may be reduced for many investments. This condition could cause an investment to be reclassified between the various levels within the hierarchy.
Investments falling into the Level 3 category are primarily supported by quoted prices from brokers and dealers participating in the market for those investments. However, these may be classified as Level 3 investments due to lack of market transparency and corroboration to support these quoted prices. Additionally, valuation models may be used as the pricing source for any remaining investments classified as Level 3. These models may rely on one or more significant unobservable inputs and/or significant assumptions by the Investment Manager. Inputs used in valuations may include, but are not limited to, financial statement analysis, capital account balances, discount rates and estimated cash flows, and comparable company data.
The Fund’s Board of Trustees (the Board) has designated the Investment Manager, through its Valuation Committee (the Committee), as valuation designee, responsible for determining the fair value of the assets of the Fund for which market quotations are not readily available using valuation procedures approved by the Board. The Committee consists of voting and non-voting members from various groups within the Investment Manager’s organization, including operations and accounting, trading and investments, compliance, risk management and legal.
The Committee meets at least monthly to review and approve valuation matters, which may include a description of specific valuation determinations, data regarding pricing information received from approved pricing vendors and brokers and the results of Board-approved valuation policies and procedures (the Policies). The Policies address, among other things, instances when market quotations are or are not readily available, including recommendations of third party pricing vendors and a determination of appropriate pricing methodologies; events that require specific valuation determinations and assessment of fair value techniques; securities with a potential for stale pricing, including those that are illiquid, restricted, or in default; and the effectiveness of third party pricing vendors, including periodic reviews of vendors. The Committee meets more frequently, as needed, to discuss additional valuation matters, which may include the need to review back-testing results, review time-sensitive information or approve related valuation actions. Representatives of Columbia Management Investment Advisers, LLC report to the Board at each of its regularly scheduled meetings to discuss valuation matters and actions during the period, similar to those described earlier.
The accompanying Notes to Financial Statements are an integral part of this statement.
Columbia California Intermediate Municipal Bond Fund | Annual Report 2023
| 17 |
Portfolio of Investments (continued)
April 30, 2023
Fair value measurements (continued)
The following table is a summary of the inputs used to value the Fund’s investments at April 30, 2023:
| | Level 1 ($) | Level 2 ($) | Level 3 ($) | Total ($) |
| Investments in Securities | | | | |
| Floating Rate Notes | — | 500,000 | — | 500,000 |
| Municipal Bonds | — | 311,424,857 | — | 311,424,857 |
| Money Market Funds | 798,934 | — | — | 798,934 |
| Total Investments in Securities | 798,934 | 311,924,857 | — | 312,723,791 |
See the Portfolio of Investments for all investment classifications not indicated in the table.
The Fund’s assets assigned to the Level 2 input category are generally valued using the market approach, in which a security’s value is determined through reference to prices and information from market transactions for similar or identical assets.
The accompanying Notes to Financial Statements are an integral part of this statement.
| 18 | Columbia California Intermediate Municipal Bond Fund | Annual Report 2023 |
Statement of Assets and Liabilities
April 30, 2023
| Assets | |
| Investments in securities, at value | |
| Unaffiliated issuers (cost $314,544,198) | $312,723,791 |
| Cash | 1,221 |
| Receivable for: | |
| Capital shares sold | 846,991 |
| Interest | 3,915,985 |
| Expense reimbursement due from Investment Manager | 788 |
| Prepaid expenses | 6,173 |
| Total assets | 317,494,949 |
| Liabilities | |
| Payable for: | |
| Investments purchased on a delayed delivery basis | 2,325,780 |
| Capital shares purchased | 642,069 |
| Distributions to shareholders | 677,785 |
| Management services fees | 4,027 |
| Distribution and/or service fees | 387 |
| Transfer agent fees | 12,817 |
| Compensation of board members | 95,567 |
| Other expenses | 23,338 |
| Total liabilities | 3,781,770 |
| Net assets applicable to outstanding capital stock | $313,713,179 |
| Represented by | |
| Paid in capital | 326,659,689 |
| Total distributable earnings (loss) | (12,946,510) |
| Total - representing net assets applicable to outstanding capital stock | $313,713,179 |
| Class A | |
| Net assets | $43,751,769 |
| Shares outstanding | 4,460,190 |
| Net asset value per share | $9.81 |
| Maximum sales charge | 3.00% |
| Maximum offering price per share (calculated by dividing the net asset value per share by 1.0 minus the maximum sales charge for Class A shares) | $10.11 |
| Advisor Class | |
| Net assets | $11,806,241 |
| Shares outstanding | 1,207,213 |
| Net asset value per share | $9.78 |
| Class C | |
| Net assets | $3,187,763 |
| Shares outstanding | 325,171 |
| Net asset value per share | $9.80 |
| Institutional Class | |
| Net assets | $145,710,439 |
| Shares outstanding | 14,877,287 |
| Net asset value per share | $9.79 |
| Institutional 2 Class | |
| Net assets | $8,523,954 |
| Shares outstanding | 873,487 |
| Net asset value per share | $9.76 |
| Institutional 3 Class | |
| Net assets | $100,733,013 |
| Shares outstanding | 10,296,018 |
| Net asset value per share | $9.78 |
The accompanying Notes to Financial Statements are an integral part of this statement.
Columbia California Intermediate Municipal Bond Fund | Annual Report 2023
| 19 |
Statement of Operations
Year Ended April 30, 2023
| Net investment income | |
| Income: | |
| Dividends — unaffiliated issuers | $61,594 |
| Interest | 10,317,911 |
| Total income | 10,379,505 |
| Expenses: | |
| Management services fees | 1,603,806 |
| Distribution and/or service fees | |
| Class A | 109,921 |
| Class C | 39,251 |
| Transfer agent fees | |
| Class A | 32,561 |
| Advisor Class | 4,943 |
| Class C | 2,930 |
| Institutional Class | 152,364 |
| Institutional 2 Class | 4,709 |
| Institutional 3 Class | 5,765 |
| Compensation of board members | 12,827 |
| Custodian fees | 2,607 |
| Printing and postage fees | 20,209 |
| Registration fees | 18,657 |
| Accounting services fees | 30,090 |
| Legal fees | 17,199 |
| Interest on interfund lending | 6,751 |
| Compensation of chief compliance officer | 65 |
| Other | 16,011 |
| Total expenses | 2,080,666 |
| Fees waived or expenses reimbursed by Investment Manager and its affiliates | (344,007) |
| Expense reduction | (20) |
| Total net expenses | 1,736,639 |
| Net investment income | 8,642,866 |
| Realized and unrealized gain (loss) — net | |
| Net realized gain (loss) on: | |
| Investments — unaffiliated issuers | (6,312,604) |
| Net realized loss | (6,312,604) |
| Net change in unrealized appreciation (depreciation) on: | |
| Investments — unaffiliated issuers | 7,873,119 |
| Net change in unrealized appreciation (depreciation) | 7,873,119 |
| Net realized and unrealized gain | 1,560,515 |
| Net increase in net assets resulting from operations | $10,203,381 |
The accompanying Notes to Financial Statements are an integral part of this statement.
| 20 | Columbia California Intermediate Municipal Bond Fund | Annual Report 2023 |
Statement of Changes in Net Assets
| | Year Ended
April 30, 2023 | Year Ended
April 30, 2022 |
| Operations | | |
| Net investment income | $8,642,866 | $9,738,299 |
| Net realized loss | (6,312,604) | (73,035) |
| Net change in unrealized appreciation (depreciation) | 7,873,119 | (39,228,429) |
| Net increase (decrease) in net assets resulting from operations | 10,203,381 | (29,563,165) |
| Distributions to shareholders | | |
| Net investment income and net realized gains | | |
| Class A | (1,020,973) | (893,492) |
| Advisor Class | (187,364) | (66,714) |
| Class C | (61,373) | (70,128) |
| Institutional Class | (4,812,440) | (8,342,248) |
| Institutional 2 Class | (208,125) | (266,661) |
| Institutional 3 Class | (2,371,668) | (145,031) |
| Total distributions to shareholders | (8,661,943) | (9,784,274) |
| Increase (decrease) in net assets from capital stock activity | (100,881,238) | 862,463 |
| Total decrease in net assets | (99,339,800) | (38,484,976) |
| Net assets at beginning of year | 413,052,979 | 451,537,955 |
| Net assets at end of year | $313,713,179 | $413,052,979 |
The accompanying Notes to Financial Statements are an integral part of this statement.
Columbia California Intermediate Municipal Bond Fund | Annual Report 2023
| 21 |
Statement of Changes in Net Assets (continued)
| | Year Ended | Year Ended |
| | April 30, 2023 | April 30, 2022 |
| | Shares | Dollars ($) | Shares | Dollars ($) |
| Capital stock activity |
| Class A | | | | |
| Subscriptions | 1,388,101 | 13,484,325 | 3,518,053 | 36,648,752 |
| Distributions reinvested | 96,307 | 938,350 | 72,268 | 759,073 |
| Redemptions | (1,570,463) | (15,256,743) | (2,244,598) | (23,381,283) |
| Net increase (decrease) | (86,055) | (834,068) | 1,345,723 | 14,026,542 |
| Advisor Class | | | | |
| Subscriptions | 1,127,065 | 10,749,141 | 107,890 | 1,128,144 |
| Distributions reinvested | 19,271 | 187,120 | 6,354 | 66,486 |
| Redemptions | (114,264) | (1,106,916) | (216,260) | (2,167,760) |
| Net increase (decrease) | 1,032,072 | 9,829,345 | (102,016) | (973,130) |
| Class C | | | | |
| Subscriptions | 61,305 | 594,796 | 23,876 | 247,614 |
| Distributions reinvested | 5,920 | 57,628 | 6,267 | 65,936 |
| Redemptions | (188,806) | (1,846,248) | (298,587) | (3,176,633) |
| Net decrease | (121,581) | (1,193,824) | (268,444) | (2,863,083) |
| Institutional Class | | | | |
| Subscriptions | 11,042,139 | 107,049,493 | 6,833,501 | 70,244,123 |
| Distributions reinvested | 311,400 | 3,032,847 | 231,554 | 2,418,651 |
| Redemptions | (32,069,479) | (313,176,375) | (7,769,842) | (80,401,157) |
| Net decrease | (20,715,940) | (203,094,035) | (704,787) | (7,738,383) |
| Institutional 2 Class | | | | |
| Subscriptions | 679,936 | 6,601,469 | 81,308 | 863,980 |
| Distributions reinvested | 21,332 | 206,883 | 25,441 | 266,469 |
| Redemptions | (730,653) | (7,065,394) | (448,541) | (4,693,853) |
| Net decrease | (29,385) | (257,042) | (341,792) | (3,563,404) |
| Institutional 3 Class | | | | |
| Subscriptions | 17,610,722 | 172,173,489 | 304,843 | 3,163,361 |
| Distributions reinvested | 17,727 | 172,176 | 13,836 | 144,475 |
| Redemptions | (8,020,896) | (77,677,279) | (130,911) | (1,333,915) |
| Net increase | 9,607,553 | 94,668,386 | 187,768 | 1,973,921 |
| Total net increase (decrease) | (10,313,336) | (100,881,238) | 116,452 | 862,463 |
The accompanying Notes to Financial Statements are an integral part of this statement.
| 22 | Columbia California Intermediate Municipal Bond Fund | Annual Report 2023 |
[THIS PAGE INTENTIONALLY LEFT BLANK]
Columbia California Intermediate Municipal Bond Fund | Annual Report 2023
| 23 |
The following table is intended to help you understand the Fund’s financial performance. Certain information reflects financial results for a single share of a class held for the periods shown. Per share net investment income (loss) amounts are calculated based on average shares outstanding during the period. Total return assumes reinvestment of all dividends and distributions, if any. Total return does not reflect payment of sales charges, if any. Total return and portfolio turnover are not annualized for periods of less than one year. The ratios of expenses and net investment income are annualized for periods of less than one year. The portfolio turnover rate is calculated without regard to purchase and sales transactions of short-term instruments and certain derivatives, if any. If such transactions were included, the Fund’s portfolio turnover rate may be higher.
| | Net asset value,
beginning of
period | Net
investment
income | Net
realized
and
unrealized
gain (loss) | Total from
investment
operations | Distributions
from net
investment
income | Total
distributions to
shareholders |
| Class A |
| Year Ended 4/30/2023 | $9.77 | 0.23 | 0.04 | 0.27 | (0.23) | (0.23) |
| Year Ended 4/30/2022 | $10.71 | 0.21 | (0.94) | (0.73) | (0.21) | (0.21) |
| Year Ended 4/30/2021 | $10.24 | 0.22 | 0.47 | 0.69 | (0.22) | (0.22) |
| Year Ended 4/30/2020 | $10.46 | 0.24 | (0.22) | 0.02 | (0.24) | (0.24) |
| Year Ended 4/30/2019 | $10.23 | 0.27 | 0.23 | 0.50 | (0.27) | (0.27) |
| Advisor Class |
| Year Ended 4/30/2023 | $9.75 | 0.25 | 0.03 | 0.28 | (0.25) | (0.25) |
| Year Ended 4/30/2022 | $10.68 | 0.23 | (0.93) | (0.70) | (0.23) | (0.23) |
| Year Ended 4/30/2021 | $10.21 | 0.25 | 0.47 | 0.72 | (0.25) | (0.25) |
| Year Ended 4/30/2020 | $10.43 | 0.27 | (0.22) | 0.05 | (0.27) | (0.27) |
| Year Ended 4/30/2019 | $10.20 | 0.30 | 0.23 | 0.53 | (0.30) | (0.30) |
| Class C |
| Year Ended 4/30/2023 | $9.77 | 0.15 | 0.03 | 0.18 | (0.15) | (0.15) |
| Year Ended 4/30/2022 | $10.71 | 0.13 | (0.94) | (0.81) | (0.13) | (0.13) |
| Year Ended 4/30/2021 | $10.23 | 0.14 | 0.48 | 0.62 | (0.14) | (0.14) |
| Year Ended 4/30/2020 | $10.46 | 0.16 | (0.23) | (0.07) | (0.16) | (0.16) |
| Year Ended 4/30/2019 | $10.22 | 0.20 | 0.24 | 0.44 | (0.20) | (0.20) |
| Institutional Class |
| Year Ended 4/30/2023 | $9.75 | 0.25 | 0.04 | 0.29 | (0.25) | (0.25) |
| Year Ended 4/30/2022 | $10.69 | 0.23 | (0.94) | (0.71) | (0.23) | (0.23) |
| Year Ended 4/30/2021 | $10.21 | 0.25 | 0.48 | 0.73 | (0.25) | (0.25) |
| Year Ended 4/30/2020 | $10.44 | 0.27 | (0.23) | 0.04 | (0.27) | (0.27) |
| Year Ended 4/30/2019 | $10.21 | 0.30 | 0.23 | 0.53 | (0.30) | (0.30) |
| Institutional 2 Class |
| Year Ended 4/30/2023 | $9.72 | 0.25 | 0.04 | 0.29 | (0.25) | (0.25) |
| Year Ended 4/30/2022 | $10.66 | 0.24 | (0.94) | (0.70) | (0.24) | (0.24) |
| Year Ended 4/30/2021 | $10.18 | 0.26 | 0.48 | 0.74 | (0.26) | (0.26) |
| Year Ended 4/30/2020 | $10.41 | 0.27 | (0.22) | 0.05 | (0.28) | (0.28) |
| Year Ended 4/30/2019 | $10.18 | 0.30 | 0.23 | 0.53 | (0.30) | (0.30) |
The accompanying Notes to Financial Statements are an integral part of this statement.
| 24 | Columbia California Intermediate Municipal Bond Fund | Annual Report 2023 |
Financial Highlights (continued)
| | Net
asset
value,
end of
period | Total
return | Total gross
expense
ratio to
average
net assets(a) | Total net
expense
ratio to
average
net assets(a),(b) | Net investment
income
ratio to
average
net assets | Portfolio
turnover | Net
assets,
end of
period
(000’s) |
| Class A |
| Year Ended 4/30/2023 | $9.81 | 2.76% | 0.83%(c) | 0.73%(c),(d) | 2.31% | 12% | $43,752 |
| Year Ended 4/30/2022 | $9.77 | (6.96%) | 0.85% | 0.74%(d) | 1.96% | 8% | $44,427 |
| Year Ended 4/30/2021 | $10.71 | 6.80% | 0.87% | 0.75%(d) | 2.09% | 5% | $34,289 |
| Year Ended 4/30/2020 | $10.24 | 0.17% | 0.86% | 0.75%(d) | 2.30% | 6% | $31,402 |
| Year Ended 4/30/2019 | $10.46 | 5.00% | 0.87% | 0.74%(d) | 2.67% | 17% | $31,998 |
| Advisor Class |
| Year Ended 4/30/2023 | $9.78 | 2.92% | 0.58%(c) | 0.48%(c),(d) | 2.63% | 12% | $11,806 |
| Year Ended 4/30/2022 | $9.75 | (6.65%) | 0.60% | 0.49%(d) | 2.21% | 8% | $1,707 |
| Year Ended 4/30/2021 | $10.68 | 7.08% | 0.62% | 0.50%(d) | 2.34% | 5% | $2,961 |
| Year Ended 4/30/2020 | $10.21 | 0.41% | 0.61% | 0.50%(d) | 2.54% | 6% | $2,354 |
| Year Ended 4/30/2019 | $10.43 | 5.28% | 0.62% | 0.49%(d) | 2.92% | 17% | $2,254 |
| Class C |
| Year Ended 4/30/2023 | $9.80 | 1.89% | 1.58%(c) | 1.48%(c),(d) | 1.56% | 12% | $3,188 |
| Year Ended 4/30/2022 | $9.77 | (7.65%) | 1.60% | 1.49%(d) | 1.20% | 8% | $4,363 |
| Year Ended 4/30/2021 | $10.71 | 6.11% | 1.62% | 1.50%(d) | 1.35% | 5% | $7,658 |
| Year Ended 4/30/2020 | $10.23 | (0.68%) | 1.61% | 1.50%(d) | 1.54% | 6% | $10,387 |
| Year Ended 4/30/2019 | $10.46 | 4.32% | 1.62% | 1.49%(d) | 1.92% | 17% | $11,161 |
| Institutional Class |
| Year Ended 4/30/2023 | $9.79 | 3.02% | 0.58%(c) | 0.48%(c),(d) | 2.52% | 12% | $145,710 |
| Year Ended 4/30/2022 | $9.75 | (6.74%) | 0.60% | 0.49%(d) | 2.21% | 8% | $347,070 |
| Year Ended 4/30/2021 | $10.69 | 7.18% | 0.62% | 0.50%(d) | 2.34% | 5% | $388,017 |
| Year Ended 4/30/2020 | $10.21 | 0.31% | 0.61% | 0.50%(d) | 2.54% | 6% | $382,665 |
| Year Ended 4/30/2019 | $10.44 | 5.27% | 0.62% | 0.49%(d) | 2.92% | 17% | $343,276 |
| Institutional 2 Class |
| Year Ended 4/30/2023 | $9.76 | 3.03% | 0.56%(c) | 0.46%(c) | 2.58% | 12% | $8,524 |
| Year Ended 4/30/2022 | $9.72 | (6.72%) | 0.55% | 0.44% | 2.25% | 8% | $8,777 |
| Year Ended 4/30/2021 | $10.66 | 7.26% | 0.56% | 0.44% | 2.40% | 5% | $13,265 |
| Year Ended 4/30/2020 | $10.18 | 0.37% | 0.55% | 0.44% | 2.60% | 6% | $10,846 |
| Year Ended 4/30/2019 | $10.41 | 5.34% | 0.56% | 0.43% | 2.98% | 17% | $10,662 |
The accompanying Notes to Financial Statements are an integral part of this statement.
Columbia California Intermediate Municipal Bond Fund | Annual Report 2023
| 25 |
Financial Highlights (continued)
| | Net asset value,
beginning of
period | Net
investment
income | Net
realized
and
unrealized
gain (loss) | Total from
investment
operations | Distributions
from net
investment
income | Total
distributions to
shareholders |
| Institutional 3 Class |
| Year Ended 4/30/2023 | $9.74 | 0.26 | 0.04 | 0.30 | (0.26) | (0.26) |
| Year Ended 4/30/2022 | $10.68 | 0.24 | (0.94) | (0.70) | (0.24) | (0.24) |
| Year Ended 4/30/2021 | $10.21 | 0.26 | 0.47 | 0.73 | (0.26) | (0.26) |
| Year Ended 4/30/2020 | $10.43 | 0.28 | (0.22) | 0.06 | (0.28) | (0.28) |
| Year Ended 4/30/2019 | $10.20 | 0.31 | 0.23 | 0.54 | (0.31) | (0.31) |
| Notes to Financial Highlights |
| (a) | In addition to the fees and expenses that the Fund bears directly, the Fund indirectly bears a pro rata share of the fees and expenses of any other funds in which it invests. Such indirect expenses are not included in the Fund’s reported expense ratios. |
| (b) | Total net expenses include the impact of certain fee waivers/expense reimbursements made by the Investment Manager and certain of its affiliates, if applicable. |
| (c) | Ratios include interfund lending expense which is less than 0.01%. |
| (d) | The benefits derived from expense reductions had an impact of less than 0.01%. |
The accompanying Notes to Financial Statements are an integral part of this statement.
| 26 | Columbia California Intermediate Municipal Bond Fund | Annual Report 2023 |
Financial Highlights (continued)
| | Net
asset
value,
end of
period | Total
return | Total gross
expense
ratio to
average
net assets(a) | Total net
expense
ratio to
average
net assets(a),(b) | Net investment
income
ratio to
average
net assets | Portfolio
turnover | Net
assets,
end of
period
(000’s) |
| Institutional 3 Class |
| Year Ended 4/30/2023 | $9.78 | 3.09% | 0.52%(c) | 0.42%(c) | 2.68% | 12% | $100,733 |
| Year Ended 4/30/2022 | $9.74 | (6.66%) | 0.50% | 0.39% | 2.31% | 8% | $6,708 |
| Year Ended 4/30/2021 | $10.68 | 7.19% | 0.51% | 0.39% | 2.45% | 5% | $5,348 |
| Year Ended 4/30/2020 | $10.21 | 0.52% | 0.50% | 0.39% | 2.64% | 6% | $5,307 |
| Year Ended 4/30/2019 | $10.43 | 5.39% | 0.51% | 0.38% | 3.02% | 17% | $3,231 |
The accompanying Notes to Financial Statements are an integral part of this statement.
Columbia California Intermediate Municipal Bond Fund | Annual Report 2023
| 27 |
Notes to Financial Statements
April 30, 2023
Note 1. Organization
Columbia California Intermediate Municipal Bond Fund (the Fund), a series of Columbia Funds Series Trust (the Trust), is a diversified fund. The Trust is registered under the Investment Company Act of 1940, as amended (the 1940 Act), as an open-end management investment company organized as a Delaware statutory trust.
Fund shares
The Trust may issue an unlimited number of shares (without par value). The Fund offers each of the share classes listed in the Statement of Assets and Liabilities. Although all share classes generally have identical voting, dividend and liquidation rights, each share class votes separately when required by the Trust’s organizational documents or by law. Each share class has its own expense and sales charge structure. Different share classes may have different minimum initial investment amounts and pay different net investment income distribution amounts to the extent the expenses of distributing such share classes vary. Distributions to shareholders in a liquidation will be proportional to the net asset value of each share class.
As described in the Fund’s prospectus, Class A and Class C shares are offered to the general public for investment. Class C shares automatically convert to Class A shares after 8 years. Advisor Class, Institutional Class, Institutional 2 Class and Institutional 3 Class shares are available for purchase through authorized investment professionals to omnibus retirement plans or to institutional investors and to certain other investors as also described in the Fund’s prospectus.
Note 2. Summary of significant accounting policies
Basis of preparation
The Fund is an investment company that applies the accounting and reporting guidance in the Financial Accounting Standards Board (FASB) Accounting Standards Codification Topic 946, Financial Services - Investment Companies (ASC 946). The financial statements are prepared in accordance with U.S. generally accepted accounting principles (GAAP), which requires management to make certain estimates and assumptions that affect the reported amounts of assets and liabilities, the disclosure of contingent assets and liabilities at the date of the financial statements and the reported amounts of income and expenses during the reporting period. Actual results could differ from those estimates.
The following is a summary of significant accounting policies followed by the Fund in the preparation of its financial statements.
Security valuation
Debt securities generally are valued based on prices obtained from pricing services, which are intended to reflect market transactions for normal, institutional-size trading units of similar securities. The services may use various pricing techniques that take into account, as applicable, factors such as yield, quality, coupon rate, maturity, type of issue, trading characteristics and other data, as well as approved independent broker-dealer quotes. Debt securities for which quotations are not readily available or not believed to be reflective of market value may also be valued based upon a bid quote from an approved independent broker-dealer. Debt securities maturing in 60 days or less are valued primarily at amortized market value, unless this method results in a valuation that management believes does not approximate fair value.
Investments in open-end investment companies (other than exchange-traded funds (ETFs)), are valued at the latest net asset value reported by those companies as of the valuation time.
Investments for which market quotations are not readily available, or that have quotations which management believes are not reflective of market value or reliable, are valued at fair value as determined in good faith under procedures approved by the Board of Trustees. If a security or class of securities (such as foreign securities) is valued at fair value, such value is likely to be different from the quoted or published price for the security, if available.
The determination of fair value often requires significant judgment. To determine fair value, management may use assumptions including but not limited to future cash flows and estimated risk premiums. Multiple inputs from various sources may be used to determine fair value.
| 28 | Columbia California Intermediate Municipal Bond Fund | Annual Report 2023 |
Notes to Financial Statements (continued)
April 30, 2023
GAAP requires disclosure regarding the inputs and valuation techniques used to measure fair value and any changes in valuation inputs or techniques. In addition, investments shall be disclosed by major category. This information is disclosed following the Fund’s Portfolio of Investments.
Delayed delivery securities
The Fund may trade securities on other than normal settlement terms, including securities purchased or sold on a “when-issued” or "forward commitment" basis. This may increase risk to the Fund since the other party to the transaction may fail to deliver, which could cause the Fund to subsequently invest at less advantageous prices. The Fund designates cash or liquid securities in an amount equal to the delayed delivery commitment.
Security transactions
Security transactions are accounted for on the trade date. Cost is determined and gains (losses) are based upon the specific identification method for both financial statement and federal income tax purposes.
Income recognition
Interest income is recorded on an accrual basis. Market premiums and discounts, including original issue discounts, are amortized and accreted, respectively, over the expected life of the security on all debt securities, unless otherwise noted.
The Fund may place a debt security on non-accrual status and reduce related interest income when it becomes probable that the interest will not be collected and the amount of uncollectible interest can be reasonably estimated. The Fund may also adjust accrual rates when it becomes probable the full interest will not be collected and a partial payment will be received. A defaulted debt security is removed from non-accrual status when the issuer resumes interest payments or when collectability of interest is reasonably assured.
Dividend income is recorded on the ex-dividend date.
Expenses
General expenses of the Trust are allocated to the Fund and other funds of the Trust based upon relative net assets or other expense allocation methodologies determined by the nature of the expense. Expenses directly attributable to the Fund are charged to the Fund. Expenses directly attributable to a specific class of shares are charged to that share class.
Determination of class net asset value
All income, expenses (other than class-specific expenses, which are charged to that share class, as shown in the Statement of Operations) and realized and unrealized gains (losses) are allocated to each class of the Fund on a daily basis, based on the relative net assets of each class, for purposes of determining the net asset value of each class.
Federal income tax status
The Fund intends to qualify each year as a regulated investment company under Subchapter M of the Internal Revenue Code, as amended, and will distribute substantially all of its net tax-exempt and investment company taxable income and net capital gain, if any, for its tax year, and as such will not be subject to federal income taxes. In addition, the Fund intends to distribute in each calendar year substantially all of its ordinary income, capital gain net income and certain other amounts, if any, such that the Fund should not be subject to federal excise tax. Therefore, no federal income or excise tax provision is recorded.
Distributions to shareholders
Distributions from net investment income, if any, are declared daily and paid monthly. Net realized capital gains, if any, are distributed at least annually. Income distributions and capital gain distributions are determined in accordance with federal income tax regulations, which may differ from GAAP.
Columbia California Intermediate Municipal Bond Fund | Annual Report 2023
| 29 |
Notes to Financial Statements (continued)
April 30, 2023
Guarantees and indemnifications
Under the Trust’s organizational documents and, in some cases, by contract, its officers and trustees are indemnified against certain liabilities arising out of the performance of their duties to the Trust or its funds. In addition, certain of the Fund’s contracts with its service providers contain general indemnification clauses. The Fund’s maximum exposure under these arrangements is unknown since the amount of any future claims that may be made against the Fund cannot be determined, and the Fund has no historical basis for predicting the likelihood of any such claims.
Recent accounting pronouncement
Tailored Shareholder Reports
In October 2022, the Securities and Exchange Commission (SEC) adopted a final rule relating to Tailored Shareholder Reports for Mutual Funds and Exchange-Traded Funds; Fee Information in Investment Company Advertisements. The rule and form amendments will, among other things, require the Fund to transmit concise and visually engaging shareholder reports that highlight key information. The amendments will require that funds tag information in a structured data format and that certain more in-depth information be made available online and available for delivery free of charge to investors on request. The amendments became effective January 24, 2023. There is an 18-month transition period after the effective date of the amendment.
Note 3. Fees and other transactions with affiliates
Management services fees
The Fund has entered into a Management Agreement with Columbia Management Investment Advisers, LLC (the Investment Manager), a wholly-owned subsidiary of Ameriprise Financial, Inc. (Ameriprise Financial). Under the Management Agreement, the Investment Manager provides the Fund with investment research and advice, as well as administrative and accounting services. The management services fee is an annual fee that is equal to a percentage of the Fund’s daily net assets that declines from 0.47% to 0.31% as the Fund’s net assets increase. The effective management services fee rate for the year ended April 30, 2023 was 0.47% of the Fund’s average daily net assets.
Compensation of board members
Members of the Board of Trustees who are not officers or employees of the Investment Manager or Ameriprise Financial are compensated for their services to the Fund as disclosed in the Statement of Operations. Under a Deferred Compensation Plan (the Deferred Plan), these members of the Board of Trustees may elect to defer payment of up to 100% of their compensation. Deferred amounts are treated as though equivalent dollar amounts had been invested in shares of certain funds managed by the Investment Manager. The Fund’s liability for these amounts is adjusted for market value changes and remains in the Fund until distributed in accordance with the Deferred Plan. All amounts payable under the Deferred Plan constitute a general unsecured obligation of the Fund. The expense for the Deferred Plan, which includes Trustees’ fees deferred during the current period as well as any gains or losses on the Trustees’ deferred compensation balances as a result of market fluctuations, is included in "Compensation of board members" in the Statement of Operations.
Compensation of Chief Compliance Officer
The Board of Trustees has appointed a Chief Compliance Officer for the Fund in accordance with federal securities regulations. As disclosed in the Statement of Operations, a portion of the Chief Compliance Officer’s total compensation is allocated to the Fund, along with other allocations to affiliated registered investment companies managed by the Investment Manager and its affiliates, based on relative net assets.
Transactions with affiliates
The Fund is permitted to engage in purchase and/or sale transactions with affiliates and/or accounts that have a common investment manager (or affiliated investment managers), common directors/trustees, and/or common officers under specified conditions outlined in a policy adopted by the Board, pursuant to Rule 17a-7 under the 1940 Act (cross-trades). The Board relies on quarterly written representation from the Fund’s Chief Compliance Officer that cross-trades complied with approved policy.
| 30 | Columbia California Intermediate Municipal Bond Fund | Annual Report 2023 |
Notes to Financial Statements (continued)
April 30, 2023
For the year ended April 30, 2023, the Fund engaged in cross-trades as follows:
| Purchases ($) | Sales ($) | Net realized gain (loss) ($) |
| 1,081,160 | — | — |
Transfer agency fees
Under a Transfer and Dividend Disbursing Agent Agreement, Columbia Management Investment Services Corp. (the Transfer Agent), an affiliate of the Investment Manager and a wholly-owned subsidiary of Ameriprise Financial, is responsible for providing transfer agency services to the Fund. The Transfer Agent has contracted with SS&C GIDS, Inc. (SS&C GIDS) to serve as sub-transfer agent. Prior to January 1, 2023, SS&C GIDS was known as DST Asset Manager Solutions, Inc. The Transfer Agent pays the fees of SS&C GIDS for services as sub-transfer agent and SS&C GIDS is not entitled to reimbursement for such fees from the Fund (with the exception of out-of-pocket fees).
The Fund pays the Transfer Agent a monthly transfer agency fee based on the number or the average value of accounts, depending on the type of account. In addition, the Fund pays the Transfer Agent a fee for shareholder services based on the number of accounts or on a percentage of the average aggregate value of the Fund’s shares maintained in omnibus accounts up to the lesser of the amount charged by the financial intermediary or a cap established by the Board of Trustees from time to time.
The Transfer Agent also receives compensation from the Fund for various shareholder services and reimbursements for certain out-of-pocket fees. Total transfer agency fees for Institutional 2 Class and Institutional 3 Class shares are subject to an annual limitation of not more than 0.07% and 0.02%, respectively, of the average daily net assets attributable to each share class.
For the year ended April 30, 2023, the Fund’s effective transfer agency fee rates as a percentage of average daily net assets of each class were as follows:
| | Effective rate (%) |
| Class A | 0.07 |
| Advisor Class | 0.07 |
| Class C | 0.07 |
| Institutional Class | 0.08 |
| Institutional 2 Class | 0.06 |
| Institutional 3 Class | 0.01 |
An annual minimum account balance fee of $20 may apply to certain accounts with a value below the applicable share class’s initial minimum investment requirements to reduce the impact of small accounts on transfer agency fees. These minimum account balance fees are remitted to the Fund and recorded as part of expense reductions in the Statement of Operations. For the year ended April 30, 2023, these minimum account balance fees reduced total expenses of the Fund by $20.
Distribution and service fees
The Fund has entered into an agreement with Columbia Management Investment Distributors, Inc. (the Distributor), an affiliate of the Investment Manager and a wholly-owned subsidiary of Ameriprise Financial, for distribution and shareholder services. The Board of Trustees has approved, and the Fund has adopted, distribution and shareholder service plans (the Plans) applicable to certain share classes, which set the distribution and service fees for the Fund. These fees are calculated daily and are intended to compensate the Distributor and/or eligible selling and/or servicing agents for selling shares of the Fund and providing services to investors.
Under the Plans, the Fund pays a monthly combined distribution and service fee to the Distributor at the maximum annual rate of 0.25% of the average daily net assets attributable to Class A shares of the Fund. Also under the Plans, the Fund pays a monthly service fee to the Distributor at the maximum annual rate of 0.25% of the average daily net assets attributable to Class C shares of the Fund and a monthly distribution fee to the Distributor at the maximum annual rate of 0.75% of the average daily net assets attributable to Class C shares of the Fund.
Columbia California Intermediate Municipal Bond Fund | Annual Report 2023
| 31 |
Notes to Financial Statements (continued)
April 30, 2023
Sales charges (unaudited)
Sales charges, including front-end charges and contingent deferred sales charges (CDSCs), received by the Distributor for distributing Fund shares for the year ended April 30, 2023, if any, are listed below:
| | Front End (%) | CDSC (%) | Amount ($) |
| Class A | 3.00 | 0.75(a) | 8,760 |
| Class C | — | 1.00(b) | — |
| (a) | This charge is imposed on certain investments of $500,000 or more if redeemed within 12 months after purchase. |
| (b) | This charge applies to redemptions within 12 months after purchase, with certain limited exceptions. |
The Fund’s other share classes are not subject to sales charges.
Expenses waived/reimbursed by the Investment Manager and its affiliates
The Investment Manager and certain of its affiliates have contractually agreed to waive fees and/or reimburse expenses (excluding certain fees and expenses described below) for the period(s) disclosed below, unless sooner terminated at the sole discretion of the Board of Trustees, so that the Fund’s net operating expenses, after giving effect to fees waived/expenses reimbursed and any balance credits and/or overdraft charges from the Fund’s custodian, do not exceed the following annual rate(s) as a percentage of the classes’ average daily net assets:
| | September 1, 2022
through
August 31, 2023 | Prior to
September 1, 2022 |
| Class A | 0.75% | 0.75% |
| Advisor Class | 0.50 | 0.50 |
| Class C | 1.50 | 1.50 |
| Institutional Class | 0.50 | 0.50 |
| Institutional 2 Class | 0.47 | 0.45 |
| Institutional 3 Class | 0.42 | 0.40 |
Under the agreement governing these fee waivers and/or expense reimbursement arrangements, the following fees and expenses are excluded from the waiver/reimbursement commitment, and therefore will be paid by the Fund, if applicable: taxes (including foreign transaction taxes), expenses associated with investments in affiliated and non-affiliated pooled investment vehicles (including mutual funds and exchange-traded funds), transaction costs and brokerage commissions, costs related to any securities lending program, dividend expenses associated with securities sold short, inverse floater program fees and expenses, transaction charges and interest on borrowed money, interest, costs associated with shareholder meetings, infrequent and/or unusual expenses and any other expenses the exclusion of which is specifically approved by the Board of Trustees. This agreement may be modified or amended only with approval from the Investment Manager, certain of its affiliates and the Fund. In addition to the contractual agreement, the Investment Manager and certain of its affiliates have voluntarily agreed to waive fees and/or reimburse Fund expenses (excluding certain fees and expenses described above) so that Fund level expenses (expenses directly attributable to the Fund and not to a specific share class) are waived proportionately across all share classes. This arrangement may be revised or discontinued at any time. Any fees waived and/or expenses reimbursed under the expense reimbursement arrangements described above are not recoverable by the Investment Manager or its affiliates in future periods.
Note 4. Federal tax information
The timing and character of income and capital gain distributions are determined in accordance with income tax regulations, which may differ from GAAP because of temporary or permanent book to tax differences.
At April 30, 2023, these differences were primarily due to differing treatment for investments in partnerships and/or grantor trusts, capital loss carryforwards, trustees’ deferred compensation, distributions and re-characterization of distributions for investments. To the extent these differences were permanent, reclassifications were made among the components of the Fund’s net assets. Temporary differences do not require reclassifications.
| 32 | Columbia California Intermediate Municipal Bond Fund | Annual Report 2023 |
Notes to Financial Statements (continued)
April 30, 2023
The following reclassifications were made:
Excess of distributions
over net investment
income ($) | Accumulated
net realized
(loss) ($) | Paid in
capital ($) |
| 190 | (190) | — |
Net investment income (loss) and net realized gains (losses), as disclosed in the Statement of Operations, and net assets were not affected by this reclassification.
The tax character of distributions paid during the years indicated was as follows:
| Year Ended April 30, 2023 | Year Ended April 30, 2022 |
Ordinary
income ($) | Tax-exempt
income ($) | Long-term
capital gains ($) | Total ($) | Ordinary
income ($) | Tax-exempt
income ($) | Long-term
capital gains ($) | Total ($) |
| 14,808 | 8,647,135 | — | 8,661,943 | 12,611 | 9,771,663 | — | 9,784,274 |
Short-term capital gain distributions, if any, are considered ordinary income distributions for tax purposes.
At April 30, 2023, the components of distributable earnings on a tax basis were as follows:
Undistributed
ordinary income ($) | Undistributed tax-
exempt income ($) | Undistributed
long-term
capital gains ($) | Capital loss
carryforwards ($) | Net unrealized
(depreciation) ($) |
| — | 655,250 | — | (11,008,727) | (1,820,853) |
At April 30, 2023, the cost of all investments for federal income tax purposes along with the aggregate gross unrealized appreciation and depreciation based on that cost was:
Federal
tax cost ($) | Gross unrealized
appreciation ($) | Gross unrealized
(depreciation) ($) | Net unrealized
(depreciation) ($) |
| 314,544,644 | 3,311,437 | (5,132,290) | (1,820,853) |
Tax cost of investments and unrealized appreciation/(depreciation) may also include timing differences that do not constitute adjustments to tax basis.
The following capital loss carryforwards, determined at April 30, 2023, may be available to reduce future net realized gains on investments, if any, to the extent permitted by the Internal Revenue Code. In addition, for the year ended April 30, 2023, capital loss carryforwards utilized, if any, were as follows:
No expiration
short-term ($) | No expiration
long-term ($) | Total ($) | Utilized ($) |
| (5,259,899) | (5,748,828) | (11,008,727) | — |
Management of the Fund has concluded that there are no significant uncertain tax positions in the Fund that would require recognition in the financial statements. However, management’s conclusion may be subject to review and adjustment at a later date based on factors including, but not limited to, new tax laws, regulations, and administrative interpretations (including relevant court decisions). Generally, the Fund’s federal tax returns for the prior three fiscal years remain subject to examination by the Internal Revenue Service.
Note 5. Portfolio information
The cost of purchases and proceeds from sales of securities, excluding short-term investments and derivatives, if any, aggregated to $40,855,225 and $121,029,927, respectively, for the year ended April 30, 2023. The amount of purchase and sale activity impacts the portfolio turnover rate reported in the Financial Highlights.
Columbia California Intermediate Municipal Bond Fund | Annual Report 2023
| 33 |
Notes to Financial Statements (continued)
April 30, 2023
Note 6. Interfund lending
Pursuant to an exemptive order granted by the Securities and Exchange Commission, the Fund participates in a program (the Interfund Program) allowing each participating Columbia Fund (each, a Participating Fund) to lend money directly to and, except for closed-end funds and money market funds, borrow money directly from other Participating Funds for temporary purposes. The amounts eligible for borrowing and lending under the Interfund Program are subject to certain restrictions.
Interfund loans are subject to the risk that the borrowing fund could be unable to repay the loan when due, and a delay in repayment to the lending fund could result in lost opportunities and/or additional lending costs. The exemptive order is subject to conditions intended to mitigate conflicts of interest arising from the Investment Manager’s relationship with each Participating Fund.
The Fund’s activity in the Interfund Program during the year ended April 30, 2023 was as follows:
| Borrower or lender | Average loan
balance ($) | Weighted average
interest rate (%) | Number of days
with outstanding loans |
| Borrower | 5,675,000 | 3.75 | 16 |
Interest expense incurred by the Fund is recorded as Interfund lending in the Statement of Operations. The Fund had no outstanding interfund loans at April 30, 2023.
Note 7. Line of credit
The Fund has access to a revolving credit facility with a syndicate of banks led by JPMorgan Chase Bank, N.A., Citibank, N.A. and Wells Fargo Bank, N.A. whereby the Fund may borrow for the temporary funding of shareholder redemptions or for other temporary or emergency purposes. Pursuant to an October 27, 2022 amendment and restatement, the credit facility, which is an agreement between the Fund and certain other funds managed by the Investment Manager or an affiliated investment manager, severally and not jointly, permits aggregate borrowings up to $950 million. Interest is currently charged to each participating fund based on its borrowings at a rate equal to the higher of (i) the federal funds effective rate, (ii) the secured overnight financing rate plus 0.10% and (iii) the overnight bank funding rate, plus in each case, 1.00%. Each borrowing under the credit facility matures no later than 60 days after the date of borrowing. The Fund also pays a commitment fee equal to its pro rata share of the unused amount of the credit facility at a rate of 0.15% per annum. The commitment fee is included in other expenses in the Statement of Operations. This agreement expires annually in October unless extended or renewed. Prior to the October 27, 2022 amendment and restatement, the Fund had access to a revolving credit facility with a syndicate of banks led by JPMorgan Chase Bank, N.A., Citibank, N.A. and Wells Fargo Bank, N.A. which permitted collective borrowings up to $950 million. Interest was charged to each participating fund based on its borrowings at a rate equal to the higher of (i) the federal funds effective rate, (ii) the secured overnight financing rate plus 0.11448% and (iii) the overnight bank funding rate, plus in each case, 1.00%.
The Fund had no borrowings during the year ended April 30, 2023.
Note 8. Significant risks
Credit risk
Credit risk is the risk that the value of debt instruments in the Fund’s portfolio may decline because the issuer defaults or otherwise becomes unable or unwilling, or is perceived to be unable or unwilling, to honor its financial obligations, such as making payments to the Fund when due. Credit rating agencies assign credit ratings to certain debt instruments to indicate their credit risk. Lower-rated or unrated debt instruments held by the Fund may present increased credit risk as compared to higher-rated debt instruments.
Interest rate risk
Interest rate risk is the risk of losses attributable to changes in interest rates. In general, if interest rates rise, the values of debt instruments tend to fall, and if interest rates fall, the values of debt instruments tend to rise. Actions by governments and central banking authorities can result in increases or decreases in interest rates. Higher periods of inflation could lead such authorities to raise interest rates. Increasing interest rates may negatively affect the value of debt securities held by the
| 34 | Columbia California Intermediate Municipal Bond Fund | Annual Report 2023 |
Notes to Financial Statements (continued)
April 30, 2023
Fund, resulting in a negative impact on the Fund’s performance and net asset value per share. In general, the longer the maturity or duration of a debt security, the greater its sensitivity to changes in interest rates. The Fund is subject to the risk that the income generated by its investments may not keep pace with inflation.
Liquidity risk
Liquidity risk is the risk associated with a lack of marketability of investments which may make it difficult to sell the investment at a desirable time or price. Changing regulatory, market or other conditions or environments (for example, the interest rate or credit environments) may adversely affect the liquidity of the Fund’s investments. The Fund may have to accept a lower selling price for the holding, sell other investments, or forego another, more appealing investment opportunity. Generally, the less liquid the market at the time the Fund sells a portfolio investment, the greater the risk of loss or decline of value to the Fund. A less liquid market can lead to an increase in Fund redemptions, which may negatively impact Fund performance and net asset value per share, including, for example, if the Fund is forced to sell securities in a down market.
Market risk
The Fund may incur losses due to declines in the value of one or more securities in which it invests. These declines may be due to factors affecting a particular issuer, or the result of, among other things, political, regulatory, market, economic or social developments affecting the relevant market(s) more generally. In addition, turbulence in financial markets and reduced liquidity in equity, credit and/or fixed income markets may negatively affect many issuers, which could adversely affect the Fund’s ability to price or value hard-to-value assets in thinly traded and closed markets and could cause significant redemptions and operational challenges. Global economies and financial markets are increasingly interconnected, and conditions and events in one country, region or financial market may adversely impact issuers in a different country, region or financial market. These risks may be magnified if certain events or developments adversely interrupt the global supply chain; in these and other circumstances, such risks might affect companies worldwide. As a result, local, regional or global events such as terrorism, war, natural disasters, disease/virus outbreaks and epidemics or other public health issues, recessions, depressions or other events – or the potential for such events – could have a significant negative impact on global economic and market conditions.
Municipal securities risk
Municipal securities are debt obligations generally issued to obtain funds for various public purposes, including general financing for state and local governments, or financing for a specific project or public facility, and include obligations of the governments of the U.S. territories, commonwealths and possessions such as Guam, Puerto Rico and the U.S. Virgin Islands to the extent such obligations are exempt from state and U.S. federal income taxes. The value of municipal securities can be significantly affected by actual or expected political and legislative changes at the federal or state level. Municipal securities may be fully or partially backed by the taxing authority of the local government, by the credit of a private issuer, by the current or anticipated revenues from a specific project or specific assets or by domestic or foreign entities providing credit support, such as letters of credit, guarantees or insurance, and are generally classified into general obligation bonds and special revenue obligations. Because many municipal securities are issued to finance projects in sectors such as education, health care, transportation and utilities, conditions in those sectors can affect the overall municipal market.
Issuers in a state, territory, commonwealth or possession in which the Fund invests may experience significant financial difficulties for various reasons, including as the result of events that cannot be reasonably anticipated or controlled such as economic downturns or similar periods of economic stress, social conflict or unrest, labor disruption and natural disasters. Such financial difficulties may lead to credit rating downgrades or defaults of such issuers which in turn, could affect the market values and marketability of many or all municipal obligations of issuers in such state, territory, commonwealth or possession. The value of the Fund’s shares will be negatively impacted to the extent it invests in such securities. The Fund’s annual and semiannual reports show the Fund’s investment exposures at a point in time. The risk of investing in the Fund is directly correlated to the Fund’s investment exposures.
Because the Fund invests substantially in municipal securities issued by the state identified in the Fund’s name and political sub-divisions of that state, the Fund will be particularly affected by adverse tax, legislative, regulatory, demographic or political changes as well as changes impacting the state’s financial, economic or other condition and prospects. In addition, because of the relatively small number of issuers of tax-exempt securities in the state, the Fund may invest a higher percentage of
Columbia California Intermediate Municipal Bond Fund | Annual Report 2023
| 35 |
Notes to Financial Statements (continued)
April 30, 2023
assets in a single issuer and, therefore, be more exposed to the risk of loss than a fund that invests more broadly. The value of municipal and other securities owned by the Fund also may be adversely affected by future changes in federal or state income tax laws.
Shareholder concentration risk
At April 30, 2023, one unaffiliated shareholder of record owned 34.2% of the outstanding shares of the Fund in one or more accounts. The Fund has no knowledge about whether any portion of those shares was owned beneficially. Affiliated shareholders of record owned 24.2% of the outstanding shares of the Fund in one or more accounts. Subscription and redemption activity by concentrated accounts may have a significant effect on the operations of the Fund. In the case of a large redemption, the Fund may be forced to sell investments at inopportune times, including its liquid positions, which may result in Fund losses and the Fund holding a higher percentage of less liquid positions. Large redemptions could result in decreased economies of scale and increased operating expenses for non-redeeming Fund shareholders.
Note 9. Subsequent events
Management has evaluated the events and transactions that have occurred through the date the financial statements were issued and noted no items requiring adjustment of the financial statements or additional disclosure.
Note 10. Information regarding pending and settled legal proceedings
Ameriprise Financial and certain of its affiliates are involved in the normal course of business in legal proceedings which include regulatory inquiries, arbitration and litigation, including class actions concerning matters arising in connection with the conduct of their activities as part of a diversified financial services firm. Ameriprise Financial believes that the Fund is not currently the subject of, and that neither Ameriprise Financial nor any of its affiliates are the subject of, any pending legal, arbitration or regulatory proceedings that are likely to have a material adverse effect on the Fund or the ability of Ameriprise Financial or its affiliates to perform under their contracts with the Fund. Ameriprise Financial is required to make quarterly (10-Q), annual (10-K) and, as necessary, 8-K filings with the Securities and Exchange Commission (SEC) on legal and regulatory matters that relate to Ameriprise Financial and its affiliates. Copies of these filings may be obtained by accessing the SEC website at www.sec.gov.
There can be no assurance that these matters, or the adverse publicity associated with them, will not result in increased Fund redemptions, reduced sale of Fund shares or other adverse consequences to the Fund. Further, although we believe proceedings are not likely to have a material adverse effect on the Fund or the ability of Ameriprise Financial or its affiliates to perform under their contracts with the Fund, these proceedings are subject to uncertainties and, as such, we are unable to estimate the possible loss or range of loss that may result. An adverse outcome in one or more of these proceedings could result in adverse judgments, settlements, fines, penalties or other relief that could have a material adverse effect on the consolidated financial condition or results of operations of Ameriprise Financial or one or more of its affiliates that provides services to the Fund.
| 36 | Columbia California Intermediate Municipal Bond Fund | Annual Report 2023 |
Report of Independent Registered Public Accounting Firm
To the Board of Trustees of Columbia Funds Series Trust and Shareholders of Columbia California Intermediate Municipal Bond Fund
Opinion on the Financial Statements
We have audited the accompanying statement of assets and liabilities, including the portfolio of investments, of Columbia California Intermediate Municipal Bond Fund (one of the funds constituting Columbia Funds Series Trust, referred to hereafter as the "Fund") as of April 30, 2023, the related statement of operations for the year ended April 30, 2023, the statement of changes in net assets for each of the two years in the period ended April 30, 2023, including the related notes, and the financial highlights for each of the five years in the period ended April 30, 2023 (collectively referred to as the "financial statements"). In our opinion, the financial statements present fairly, in all material respects, the financial position of the Fund as of April 30, 2023, the results of its operations for the year then ended, the changes in its net assets for each of the two years in the period ended April 30, 2023 and the financial highlights for each of the five years in the period ended April 30, 2023 in conformity with accounting principles generally accepted in the United States of America.
Basis for Opinion
These financial statements are the responsibility of the Fund’s management. Our responsibility is to express an opinion on the Fund’s financial statements based on our audits. We are a public accounting firm registered with the Public Company Accounting Oversight Board (United States) (PCAOB) and are required to be independent with respect to the Fund in accordance with the U.S. federal securities laws and the applicable rules and regulations of the Securities and Exchange Commission and the PCAOB.
We conducted our audits of these financial statements in accordance with the standards of the PCAOB. Those standards require that we plan and perform the audit to obtain reasonable assurance about whether the financial statements are free of material misstatement, whether due to error or fraud.
Our audits included performing procedures to assess the risks of material misstatement of the financial statements, whether due to error or fraud, and performing procedures that respond to those risks. Such procedures included examining, on a test basis, evidence regarding the amounts and disclosures in the financial statements. Our audits also included evaluating the accounting principles used and significant estimates made by management, as well as evaluating the overall presentation of the financial statements. Our procedures included confirmation of securities owned as of April 30, 2023 by correspondence with the custodian, transfer agents and broker. We believe that our audits provide a reasonable basis for our opinion.
/s/PricewaterhouseCoopers LLP
Minneapolis, Minnesota
June 22, 2023
We have served as the auditor of one or more investment companies within the Columbia Funds Complex since 1977.
Columbia California Intermediate Municipal Bond Fund | Annual Report 2023
| 37 |
Federal Income Tax Information
(Unaudited)
The Fund hereby designates the following tax attributes for the fiscal year ended April 30, 2023. Shareholders will be notified in early 2024 of the amounts for use in preparing 2023 income tax returns.
Exempt-
interest
dividends | |
| 99.83% | |
Exempt-interest dividends. The percentage of net investment income distributed during the fiscal year that qualifies as exempt-interest dividends for federal income tax purposes. A portion of the income may be subject to federal alternative minimum tax.
TRUSTEES AND OFFICERS
(Unaudited)
The Board oversees the Fund’s operations and appoints officers who are responsible for day-to-day business decisions based on policies set by the Board. The following table provides basic biographical information about the Fund’s Trustees as of the printing of this report, including their principal occupations during the past five years, although specific titles for individuals may have varied over the period. The year set forth beneath Length of Service in the table below is the year in which the Trustee was first appointed or elected as Trustee to any Fund currently in the Columbia Funds Complex or a predecessor thereof. Under current Board policy, each Trustee generally serves until December 31 of the year such Trustee turns seventy-five (75).
Independent trustees
Name,
address,
year of birth | Position held
with the Columbia Funds and
length of service | Principal occupation(s)
during past five years
and other relevant
professional experience | Number of
Funds in the
Columbia Funds
Complex*
overseen | Other directorships
held by Trustee
during the past five years
and other relevant Board experience |
George S. Batejan
c/o Columbia Management
Investment Advisers, LLC
290 Congress Street
Boston, MA 02210
1954 | Trustee since 2017 | Executive Vice President, Global Head of Technology and Operations, Janus Capital Group, Inc., 2010-2016 | 174 | Former Chairman of the Board, NICSA (National Investment Company Services Association) (Executive Committee, Nominating Committee and Governance Committee), 2014-2016; former Director, Intech Investment Management, 2011-2016; former Board Member, Metro Denver Chamber of Commerce, 2015-2016; former Advisory Board Member, University of Colorado Business School, 2015-2018; former Board Member, Chase Bank International, 1993-1994 |
| 38 | Columbia California Intermediate Municipal Bond Fund | Annual Report 2023 |
TRUSTEES AND OFFICERS (continued)
(Unaudited)
Independent trustees (continued)
Name,
address,
year of birth | Position held
with the Columbia Funds and
length of service | Principal occupation(s)
during past five years
and other relevant
professional experience | Number of
Funds in the
Columbia Funds
Complex*
overseen | Other directorships
held by Trustee
during the past five years
and other relevant Board experience |
Kathleen Blatz
c/o Columbia Management
Investment Advisers, LLC
290 Congress Street
Boston, MA 02210
1954 | Trustee since 2006 | Attorney, specializing in arbitration and mediation; Chief Justice, Minnesota Supreme Court, 1998-2006; Associate Justice, Minnesota Supreme Court, 1996-1998; Fourth Judicial District Court Judge, Hennepin County, 1994-1996; Attorney in private practice and public service, 1984-1993; State Representative, Minnesota House of Representatives, 1979-1993, which included service on the Tax and Financial Institutions and Insurance Committees; Member and Interim Chair, Minnesota Sports Facilities Authority, January-July 2017; Interim President and Chief Executive Officer, Blue Cross and Blue Shield of Minnesota (health care insurance), February-July 2018, April-October 2021 | 174 | Former Trustee, Blue Cross and Blue Shield of Minnesota, 2009-2021 (Chair of the Business Development Committee, 2014-2017; Chair of the Governance Committee, 2017-2019); former Member and Chair of the Board, Minnesota Sports Facilities Authority, January 2017-July 2017; former Director, Robina Foundation, 2009-2020 (Chair, 2014-2020); Director, Richard M. Schulze Family Foundation, since 2021 |
Pamela G. Carlton
c/o Columbia Management
Investment Advisers, LLC
290 Congress Street
Boston, MA 02210
1954 | Chair since 2023; Trustee since 2007 | President, Springboard — Partners in Cross Cultural Leadership (consulting company), since 2003; Managing Director of US Equity Research, JP Morgan Chase, 1999-2003; Director of US Equity Research, Chase Asset Management, 1996-1999; Co-Director Latin America Research, 1993-1996, COO Global Research, 1992-1996, Co-Director of US Research, 1991-1992, Investment Banker, 1982-1991, Morgan Stanley; Attorney, Cleary Gottlieb Steen & Hamilton LLP, 1980-1982 | 174 | Trustee, New York Presbyterian Hospital Board, since 1996; Director, DR Bank (Audit Committee) since 2017; Director, Evercore Inc. (Audit Committee, Nominating and Governance Committee), since 2019; Director, Apollo Commercial Real Estate Finance, Inc. (Chair, Nominating and Governance Committee) (financial services), since 2021; the Governing Council of the Independent Directors Council (IDC), since 2021 |
Janet Langford Carrig
c/o Columbia Management
Investment Advisers, LLC
290 Congress Street
Boston, MA 02210
1957 | Trustee since 1996 | Senior Vice President, General Counsel and Corporate Secretary, ConocoPhillips (independent energy company), September 2007-October 2018 | 174 | Director, EQT Corporation (natural gas producer), since 2019; former Director, Whiting Petroleum Corporation (independent oil and gas company), 2020-2022 |
J. Kevin Connaughton
c/o Columbia Management
Investment Advisers, LLC
290 Congress Street
Boston, MA 02210
1964 | Trustee since 2020 | CEO and President, RhodeWay Financial (non-profit financial planning firm), since December 2022; Member, FINRA National Adjudicatory Council, since January 2020; Adjunct Professor of Finance, Bentley University since January 2018; Consultant to Independent Trustees of CFVIT and CFST I from March 2016 to June 2020 with respect to CFVIT and to December 2020 with respect to CFST I; Managing Director and General Manager of Mutual Fund Products, Columbia Management Investment Advisers, LLC, May 2010-February 2015; President, Columbia Funds, 2008-2015; and senior officer of Columbia Funds and affiliated funds, 2003-2015 | 172 | Former Director, The Autism Project, March 2015-December 2021; former Member of the Investment Committee, St. Michael’s College, November 2015-February 2020; former Trustee, St. Michael’s College, June 2017-September 2019; former Trustee, New Century Portfolios (former mutual fund complex), January 2015-December 2017 |
Columbia California Intermediate Municipal Bond Fund | Annual Report 2023
| 39 |
TRUSTEES AND OFFICERS (continued)
(Unaudited)
Independent trustees (continued)
Name,
address,
year of birth | Position held
with the Columbia Funds and
length of service | Principal occupation(s)
during past five years
and other relevant
professional experience | Number of
Funds in the
Columbia Funds
Complex*
overseen | Other directorships
held by Trustee
during the past five years
and other relevant Board experience |
Olive M. Darragh
c/o Columbia Management
Investment Advisers, LLC
290 Congress Street
Boston, MA 02210
1962 | Trustee since 2020 | Managing Director of Darragh Inc. (strategy and talent management consulting firm), since 2010; Founder and CEO, Zolio, Inc. (investment management talent identification platform), since 2004; Consultant to Independent Trustees of CFVIT and CFST I from June 2019 to June 2020 with respect to CFVIT and to December 2020 with respect to CFST I; Partner, Tudor Investments, 2004-2010; Senior Partner, McKinsey & Company (consulting), 1990-2004; Touche Ross CPA, 1985-1988 | 172 | Treasurer, Edinburgh University US Trust Board, since January 2023; Member, HBS Community Action Partners Board, since September 2022; former Director, University of Edinburgh Business School (Member of US Board), 2004-2019; former Director, Boston Public Library Foundation, 2008-2017 |
Patricia M. Flynn
c/o Columbia Management
Investment Advisers, LLC
290 Congress Street
Boston, MA 02210
1950 | Trustee since 2004 | Professor of Economics and Management, Bentley University, since 2002; Dean, McCallum Graduate School of Business, Bentley University, 1992-2002 | 174 | Former Trustee, MA Taxpayers Foundation, 1997-2022; former Director, The MA Business Roundtable, 2003-2019; former Chairperson, Innovation Index Advisory Committee, MA Technology Collaborative, 1997-2020 |
Brian J. Gallagher
c/o Columbia Management
Investment Advisers, LLC
290 Congress Street
Boston, MA 02210
1954 | Trustee since 2017 | Retired; Partner with Deloitte & Touche LLP and its predecessors, 1977-2016 | 174 | Trustee, Catholic Schools Foundation, since 2004 |
Douglas A. Hacker
c/o Columbia Management
Investment Advisers, LLC
290 Congress Street
Boston, MA 02210
1955 | Trustee since 1996 | Independent business executive, since May 2006; Executive Vice President – Strategy of United Airlines, December 2002 - May 2006; President of UAL Loyalty Services (airline marketing company), September 2001-December 2002; Executive Vice President and Chief Financial Officer of United Airlines, July 1999-September 2001 | 174 | Director, SpartanNash Company since November 2013 (Chair of the Board, since May 2021) (food distributor); Director, Aircastle Limited (Chair of Audit Committee) (aircraft leasing), since August 2006; former Director, Nash Finch Company (food distributor), 2005-2013; former Director, SeaCube Container Leasing Ltd. (container leasing), 2010-2013; and former Director, Travelport Worldwide Limited (travel information technology), 2014-2019 |
Nancy T. Lukitsh
c/o Columbia Management
Investment Advisers, LLC
290 Congress Street
Boston, MA 02210
1956 | Trustee since 2011 | Senior Vice President, Partner and Director of Marketing, Wellington Management Company, LLP (investment adviser), 1997-2010; Chair, Wellington Management Portfolios (commingled non-U.S. investment pools), 2007-2010; Director, Wellington Trust Company, NA and other Wellington affiliates, 1997-2010 | 172 | None |
| 40 | Columbia California Intermediate Municipal Bond Fund | Annual Report 2023 |
TRUSTEES AND OFFICERS (continued)
(Unaudited)
Independent trustees (continued)
Name,
address,
year of birth | Position held
with the Columbia Funds and
length of service | Principal occupation(s)
during past five years
and other relevant
professional experience | Number of
Funds in the
Columbia Funds
Complex*
overseen | Other directorships
held by Trustee
during the past five years
and other relevant Board experience |
David M. Moffett
c/o Columbia Management
Investment Advisers, LLC
290 Congress Street
Boston, MA 02210
1952 | Trustee since 2011 | Retired; former Chief Executive Officer of Freddie Mac and Chief Financial Officer of U.S. Bank | 172 | Director, CSX Corporation (transportation suppliers); Director, PayPal Holdings Inc. (payment and data processing services); Trustee, University of Oklahoma Foundation; former Director, eBay Inc. (online trading community), 2007-2015; and former Director, CIT Bank, CIT Group Inc. (commercial and consumer finance), 2010-2016; former Senior Adviser to The Carlyle Group (financial services), March 2008-September 2008; former Governance Consultant to Bridgewater Associates, January 2013-December 2015 |
Catherine James Paglia
c/o Columbia Management
Investment Advisers, LLC
290 Congress Street
Boston, MA 02210
1952 | Trustee since 2004 | Director, Enterprise Asset Management, Inc. (private real estate and asset management company), since September 1998; Managing Director and Partner, Interlaken Capital, Inc., 1989-1997; Vice President, 1982-1985, Principal, 1985-1987, Managing Director, 1987-1989, Morgan Stanley; Vice President, Investment Banking, 1980-1982, Associate, Investment Banking, 1976-1980, Dean Witter Reynolds, Inc. | 174 | Director, Valmont Industries, Inc. (irrigation systems manufacturer), since 2012; Trustee, Carleton College (on the Investment Committee), since 1987; Trustee, Carnegie Endowment for International Peace (on the Investment Committee), since 2009 |
Natalie A. Trunow
c/o Columbia Management
Investment Advisers, LLC
290 Congress Street
Boston, MA 02210
1967 | Trustee since 2020 | Chief Executive Officer, Millennial Portfolio Solutions LLC (asset management and consulting services), January 2016-January 2021; Non-executive Member of the Investment Committee and Valuation Committee, Sarona Asset Management Inc. (private equity firm) since September 2019; Advisor, Horizon Investments (asset management and consulting services), August 2018-January 2022; Advisor, Paradigm Asset Management, November 2016-January 2022; Consultant to Independent Trustees of CFVIT and CFST I from September 2016 to June 2020 with respect to CFVIT and to December 2020 with respect to CFST I; Director of Investments/Consultant, Casey Family Programs, April 2016-November 2016; Senior Vice President and Chief Investment Officer, Calvert Investments, August 2008-January 2016; Section Head and Portfolio Manager, General Motors Asset Management, June 1997-August 2008 | 172 | Independent Director, Investment Committee, Health Services for Children with Special Needs, Inc., 2010-2021; Independent Director, (Executive Committee and Chair, Audit Committee), Consumer Credit Counseling Services (formerly Guidewell Financial Solutions), since 2016; Independent Director, (Investment Committee), Sarona Asset Management, since 2019 |
Columbia California Intermediate Municipal Bond Fund | Annual Report 2023
| 41 |
TRUSTEES AND OFFICERS (continued)
(Unaudited)
Independent trustees (continued)
Name,
address,
year of birth | Position held
with the Columbia Funds and
length of service | Principal occupation(s)
during past five years
and other relevant
professional experience | Number of
Funds in the
Columbia Funds
Complex*
overseen | Other directorships
held by Trustee
during the past five years
and other relevant Board experience |
Sandra L. Yeager
c/o Columbia Management
Investment Advisers, LLC
290 Congress Street
Boston, MA 02210
1964 | Trustee since 2017 | Retired; President and founder, Hanoverian Capital, LLC (SEC registered investment advisor firm), 2008-2016; Managing Director, DuPont Capital, 2006-2008; Managing Director, Morgan Stanley Investment Management, 2004-2006; Senior Vice President, Alliance Bernstein, 1990-2004 | 174 | Former Director, NAPE (National Alliance for Partnerships in Equity) Education Foundation, October 2016-October 2020; Advisory Board, Jennersville YMCA, since 2022 |
Interested trustee affiliated with Investment Manager**
Name,
address,
year of birth | Position held with the Columbia Funds and length of service | Principal occupation(s) during the
past five years and other relevant
professional experience | Number of
Funds in the
Columbia Funds
Complex overseen | Other directorships
held by Trustee
during the past
five years and
other relevant Board experience |
Daniel J. Beckman
c/o Columbia Management
Investment Advisers, LLC
290 Congress Street
Boston, MA 02210
1962 | Trustee since November 2021 and President since June 2021 | Vice President – Head of North America Product, Columbia Management Investment Advisers, LLC, since April 2015; President and Principal Executive Officer of the Columbia Funds, since June 2021; officer of Columbia Funds and affiliated funds, 2020-2021 | 174 | Director, Ameriprise Trust Company, since October 2016; Director, Columbia Management Investment Distributors, Inc. since November 2018; Board of Governors, Columbia Wanger Asset Management, LLC since, January 2022; Director, Columbia Threadneedle Canada, Inc., since December 2022 |
| * | The term “Columbia Funds Complex” as used herein includes Columbia Seligman Premium Technology Growth Fund, Tri-Continental Corporation and each series of Columbia Funds Series Trust (CFST), Columbia Funds Series Trust I (CFST I), Columbia Funds Series Trust II (CFST II), Columbia ETF Trust I (CET I), Columbia ETF Trust II (CET II), Columbia Funds Variable Insurance Trust (CFVIT) and Columbia Funds Variable Series Trust II (CFVST II). Messrs. Batejan, Beckman, Gallagher and Hacker and Mses. Blatz, Carlton, Carrig, Flynn, Paglia, and Yeager serve as directors of Columbia Seligman Premium Technology Growth Fund and Tri-Continental Corporation. |
| ** | Interested person (as defined under the 1940 Act) by reason of being an officer, director, security holder and/or employee of the Investment Manager or Ameriprise Financial. |
The Statement of Additional Information has additional information about the Fund’s Board members and is available, without charge, upon request by calling 800.345.6611, visiting columbiathreadneedleus.com/investor/ or contacting your financial intermediary.
| 42 | Columbia California Intermediate Municipal Bond Fund | Annual Report 2023 |
TRUSTEES AND OFFICERS (continued)
(Unaudited)
The Board has appointed officers who are responsible for day-to-day business decisions based on policies it has established. The officers serve at the pleasure of the Board. The following table provides basic information about the Officers of the Fund as of the printing of this report, including principal occupations during the past five years, although their specific titles may have varied over the period. In addition to Mr. Beckman, who is President and Principal Executive Officer, the Fund’s other officers are:
Fund officers
Name,
address and
year of birth | Position and year
first appointed to
position for any Fund
in the Columbia
Funds Complex or a
predecessor thereof | Principal occupation(s) during past five years |
Michael G. Clarke
290 Congress Street
Boston, MA 02210
1969 | Chief Financial Officer and Principal Financial Officer (2009) and Senior Vice President (2019) | Senior Vice President and Head of North America Operations & Investor Services, Columbia Management Investment Advisers, LLC, since June 2023 (previously Senior Vice President and Head of Global Operations, March 2022 – June 2023, Vice President, Head of North America Operations, and Co-Head of Global Operations, June 2019 - February 2022 and Vice President – Accounting and Tax, May 2010 - May 2019); senior officer of Columbia Funds and affiliated funds, since 2002. |
Joseph Beranek
5890 Ameriprise Financial Center
Minneapolis, MN 55474
1965 | Treasurer and Chief Accounting Officer (Principal Accounting Officer) (2019) and Principal Financial Officer (2020), CFST, CFST I, CFST II, CFVIT and CFVST II; Assistant Treasurer, CET I and CET II | Vice President – Mutual Fund Accounting and Financial Reporting, Columbia Management Investment Advisers, LLC, since December 2018 and March 2017, respectively. |
Marybeth Pilat
290 Congress Street
Boston, MA 02210
1968 | Treasurer and Chief Accounting Officer (Principal Accounting Officer) and Principal Financial Officer (2020) for CET I and CET II; Assistant Treasurer, CFST, CFST I, CFST II, CFVIT and CFVST II | Vice President – Product Pricing and Administration, Columbia Management Investment Advisers, LLC, since May 2017. |
William F. Truscott
290 Congress Street
Boston, MA 02210
1960 | Senior Vice President (2001) | Formerly, Trustee/Director of Columbia Funds Complex or legacy funds, November 2001-January 1, 2021; Chief Executive Officer, Global Asset Management, Ameriprise Financial, Inc., since September 2012; Chairman of the Board and President, Columbia Management Investment Advisers, LLC, since July 2004 and February 2012, respectively; Chairman of the Board and Chief Executive Officer, Columbia Management Investment Distributors, Inc., since November 2008 and February 2012, respectively; Chairman of the Board and Director, Threadneedle Asset Management Holdings, Sàrl, since March 2013 and December 2008, respectively; senior executive of various entities affiliated with Columbia Threadneedle. |
Christopher O. Petersen
5228 Ameriprise Financial Center
Minneapolis, MN 55474
1970 | Senior Vice President and Assistant Secretary (2021) | Formerly, Trustee/Director of funds within the Columbia Funds Complex, July 1, 2020 - November 22, 2021; Senior Vice President and Assistant General Counsel, Ameriprise Financial, Inc., since September 2021 (previously Vice President and Lead Chief Counsel, January 2015 - September 2021); formerly, President and Principal Executive Officer of the Columbia Funds, 2015 - 2021; officer of Columbia Funds and affiliated funds, since 2007. |
Thomas P. McGuire
290 Congress Street
Boston, MA 02210
1972 | Senior Vice President and Chief Compliance Officer (2012) | Vice President – Asset Management Compliance, Ameriprise Financial, Inc., since May 2010; Chief Compliance Officer, Columbia Acorn/Wanger Funds, since December 2015; formerly, Chief Compliance Officer, Ameriprise Certificate Company, September 2010 – September 2020. |
Ryan C. Larrenaga
290 Congress Street
Boston, MA 02210
1970 | Senior Vice President (2017), Chief Legal Officer (2017), and Secretary (2015) | Vice President and Chief Counsel, Ameriprise Financial, Inc., since August 2018 (previously Vice President and Group Counsel, August 2011 - August 2018); Chief Legal Officer, Columbia Acorn/Wanger Funds, since September 2020; officer of Columbia Funds and affiliated funds, since 2005. |
Columbia California Intermediate Municipal Bond Fund | Annual Report 2023
| 43 |
TRUSTEES AND OFFICERS (continued)
(Unaudited)
Fund officers (continued)
Name,
address and
year of birth | Position and year
first appointed to
position for any Fund
in the Columbia
Funds Complex or a
predecessor thereof | Principal occupation(s) during past five years |
Michael E. DeFao
290 Congress Street
Boston, MA 02210
1968 | Vice President (2011) and Assistant Secretary (2010) | Vice President and Chief Counsel, Ameriprise Financial, Inc., since May 2010; Vice President, Chief Legal Officer and Assistant Secretary, Columbia Management Investment Advisers, LLC, since October 2021 (previously Vice President and Assistant Secretary, May 2010 – September 2021). |
Lyn Kephart-Strong
5228 Ameriprise Financial Center
Minneapolis, MN 55474
1960 | Vice President (2015) | Vice President, Global Investment Operations Services, Columbia Management Investment Advisers, LLC, since 2010; President, Columbia Management Investment Services Corp., since October 2014; President, Ameriprise Trust Company, since January 2017. |
Liquidity Risk Management Program
(Unaudited)
Pursuant to Rule 22e-4 under the 1940 Act, the Fund has adopted a liquidity risk management program (Program). The Program’s principal objectives include assessing, managing and periodically reviewing the Fund’s liquidity risk. Liquidity risk is defined as the risk that the Fund could not meet redemption requests without significant dilution of remaining investors’ interests in the Fund.
The Board has appointed the Investment Manager as the program administrator for the Fund’s Program. The Investment Manager has delegated oversight of the Program to its Liquidity Risk Management Committee (the Committee). At a board meeting during the fiscal period, the Committee provided the Board with a report addressing the operations of the program and assessing its adequacy and effectiveness of implementation for the period January 1, 2022, through December 31, 2022, including:
| • | the Fund had sufficient liquidity to both meet redemptions and operate effectively on behalf of shareholders; |
| • | there were no material changes to the Program during the period; |
| • | the implementation of the Program was effective to manage the Fund’s liquidity risk; and |
| • | the Program operated adequately during the period. |
There can be no assurance that the Program will achieve its objectives in the future. Please refer to the Fund’s prospectus for more information regarding the Fund’s exposure to liquidity risk and other principal risks to which an investment in the Fund may be subject.
| 44 | Columbia California Intermediate Municipal Bond Fund | Annual Report 2023 |
[THIS PAGE INTENTIONALLY LEFT BLANK]
[THIS PAGE INTENTIONALLY LEFT BLANK]
[THIS PAGE INTENTIONALLY LEFT BLANK]
Columbia California Intermediate Municipal Bond Fund
P.O. Box 219104
Kansas City, MO 64121-9104
Please read and consider the investment objectives, risks, charges and expenses for any fund carefully before investing. For a prospectus and summary prospectus, which contains this and other important information about the Fund, go to
columbiathreadneedleus.com/investor/. The Fund is distributed by Columbia Management Investment Distributors, Inc., member FINRA, and managed by Columbia Management Investment Advisers, LLC.
Columbia Threadneedle Investments (Columbia Threadneedle) is the global brand name of the Columbia and Threadneedle group of companies. All rights reserved.
© 2023 Columbia Management Investment Advisers, LLC.
columbiathreadneedleus.com/investor/

Annual Report
April 30, 2023
Columbia Short Duration Municipal Bond Fund
Not FDIC or NCUA Insured • No Financial Institution Guarantee • May Lose Value
If you elect to receive the shareholder report for Columbia Short Duration Municipal Bond Fund (the Fund) in paper, mailed to you, the Fund mails one shareholder report to each shareholder address, unless such shareholder elects to receive shareholder reports from the Fund electronically via e-mail or by having a paper notice mailed to you (Postcard Notice) that your Fund’s shareholder report is available at the Columbia funds’ website (columbiathreadneedleus.com/investor/). If you would like more than one report in paper to be mailed to you, or would like to elect to receive reports via e-mail or access them through Postcard Notice, please call shareholder services at 800.345.6611 and additional reports will be sent to you.
Proxy voting policies and procedures
The policy of the Board of Trustees is to vote the proxies of the companies in which the Fund holds investments consistent with the procedures as stated in the Statement of Additional Information (SAI). You may obtain a copy of the SAI without charge by calling 800.345.6611; contacting your financial intermediary; visiting columbiathreadneedleus.com/investor/; or searching the website of the Securities and Exchange Commission (SEC) at sec.gov. Information regarding how the Fund voted proxies relating to portfolio securities is filed with the SEC by August 31st for the most recent 12-month period ending June 30th of that year, and is available without charge by visiting columbiathreadneedleus.com/investor/, or searching the website of the SEC at sec.gov.
Quarterly schedule of investments
The Fund files a complete schedule of portfolio holdings with the SEC for the first and third quarters of each fiscal year on Form N-PORT. The Fund’s Form N-PORT filings are available on the SEC’s website at sec.gov. The Fund’s complete schedule of portfolio holdings, as filed on Form N-PORT, is available on columbiathreadneedleus.com/investor/ or can also be obtained without charge, upon request, by calling 800.345.6611.
Additional Fund information
For more information about the Fund, please visit columbiathreadneedleus.com/investor/ or call 800.345.6611. Customer Service Representatives are available to answer your questions Monday through Friday from 8 a.m. to 7 p.m. Eastern time.
Fund investment manager
Columbia Management Investment Advisers, LLC (the Investment Manager)
290 Congress Street
Boston, MA 02210
Fund distributor
Columbia Management Investment Distributors, Inc.
290 Congress Street
Boston, MA 02210
Fund transfer agent
Columbia Management Investment Services Corp.
P.O. Box 219104
Kansas City, MO 64121-9104
Columbia Short Duration Municipal Bond Fund | Annual Report 2023
Fund at a Glance
(Unaudited)
Investment objective
The Fund seeks current income exempt from federal income tax, consistent with minimal fluctuation of principal.
Portfolio management
Douglas Rangel, CFA
Lead Portfolio Manager
Managed the Fund since June 2022
Catherine Stienstra
Portfolio Manager
Managed Fund since 2012
| Average annual total returns (%) (for the period ended April 30, 2023) |
| | | Inception | 1 Year | 5 Years | 10 Years | |
| Class A | Excluding sales charges | 11/02/93 | 1.67 | 0.77 | 0.56 | |
| | Including sales charges | | 0.66 | 0.58 | 0.46 | |
| Advisor Class | 03/19/13 | 1.92 | 1.02 | 0.82 | |
| Class C | Excluding sales charges | 05/19/94 | 0.91 | 0.02 | -0.19 | |
| | Including sales charges | | -0.09 | 0.02 | -0.19 | |
| Institutional Class | 10/07/93 | 1.92 | 1.02 | 0.81 | |
| Institutional 2 Class | 11/08/12 | 1.97 | 1.07 | 0.88 | |
| Institutional 3 Class* | 03/01/17 | 2.02 | 1.14 | 0.87 | |
| Bloomberg 1-5 Year Municipal Bond Index | | 2.08 | 1.28 | 1.08 | |
| Bloomberg 1-3 Year Municipal Bond Index | | 1.73 | 1.13 | 0.92 | |
Returns for Class A shares are shown with and without the maximum initial sales charge of 1.00%. Returns for Class C shares are shown with and without the 1.00% contingent deferred sales charge for the first year only. The Fund’s other share classes are not subject to sales charges and have limited eligibility. Please see the Fund’s prospectus for details. Performance for different share classes will vary based on differences in sales charges and fees associated with each share class. All results shown assume reinvestment of distributions during the period. Returns do not reflect the deduction of taxes that a shareholder may pay on Fund distributions or on the redemption of Fund shares. Performance results reflect the effect of any fee waivers or reimbursements of Fund expenses by Columbia Management Investment Advisers, LLC and/or any of its affiliates. Absent these fee waivers or expense reimbursement arrangements, performance results would have been lower.
The performance information shown represents past performance and is not a guarantee of future results. The investment return and principal value of your investment will fluctuate so that your shares, when redeemed, may be worth more or less than their original cost. Current performance may be lower or higher than the performance information shown. You may obtain performance information current to the most recent month-end by contacting your financial intermediary, visiting columbiathreadneedleus.com/investor/ or calling 800.345.6611.
| * | The returns shown for periods prior to the share class inception date (including returns for the Life of the Fund, if shown, which are since Fund inception) include the returns of the Fund’s oldest share class. These returns are adjusted to reflect any higher class-related operating expenses of the newer share classes, as applicable. Please visit columbiathreadneedleus.com/investor/investment-products/mutual-funds/appended-performance for more information. |
Effective September 1, 2022, the Fund compares its performance to that of the Bloomberg 1-5 Year Municipal Bond Index (the New Index). Prior to this date, the Fund compared its performance to that of the Bloomberg 1-3 Year Municipal Bond Index (the Former Index). The Fund’s investment manager believes that the New Index provides a more appropriate basis for comparing the Fund’s performance in light of the changes made to the Fund’s name and principal investment strategies. Information on the Former Index also will be shown for a one-year transition period.
The Fund’s performance prior to September 1, 2022 reflects returns achieved according to different principal investment strategies. If the Fund’s current strategies had been in place for the prior periods, results shown may have been different.
The Bloomberg 1-5 Year Municipal Bond Index is an unmanaged index which consists of a broad selection of investment-grade general obligation and revenue municipal bonds of maturities ranging from one year to five years.
The Bloomberg 1-3 Year Municipal Bond Index is an unmanaged index which consists of a broad selection of investment-grade general obligation and revenue bonds of maturities ranging from one year to three years.
Indices are not available for investment, are not professionally managed and do not reflect sales charges, fees, brokerage commissions, taxes or other expenses of investing. Securities in the Fund may not match those in an index.
Columbia Short Duration Municipal Bond Fund | Annual Report 2023
| 3 |
Fund at a Glance (continued)
(Unaudited)
Performance of a hypothetical $10,000 investment (April 30, 2013 — April 30, 2023)
The chart above shows the change in value of a hypothetical $10,000 investment in Class A shares of Columbia Short Duration Municipal Bond Fund during the stated time period, and does not reflect the deduction of taxes that a shareholder may pay on Fund distributions or on the redemption of Fund shares.
| Quality breakdown (%) (at April 30, 2023) |
| AAA rating | 4.4 |
| AA rating | 35.7 |
| A rating | 36.1 |
| BBB rating | 9.7 |
| BB rating | 1.1 |
| B rating | 0.4 |
| Not rated | 12.6 |
| Total | 100.0 |
Percentages indicated are based upon total fixed income investments.
Bond ratings apply to the underlying holdings of the Fund and not the Fund itself and are divided into categories ranging from highest to lowest credit quality, determined by using the middle rating of Moody’s, S&P and Fitch, after dropping the highest and lowest available ratings. When ratings are available from only two rating agencies, the lower rating is used. When a rating is available from only one rating agency, that rating is used. If a security is not rated but has a rating by Kroll and/or DBRS, the same methodology is applied to those bonds that would otherwise be not rated. When a bond is not rated by any rating agency, it is designated as “Not rated.” Credit quality ratings assigned by a rating agency are subjective opinions, not statements of fact, and are subject to change, including daily. The ratings assigned by credit rating agencies are but one of the considerations that the Investment Manager and/or Fund’s subadviser incorporates into its credit analysis process, along with such other issuer-specific factors as cash flows, capital structure and leverage ratios, ability to de-leverage (repay) through free cash flow, quality of management, market positioning and access to capital, as well as such security-specific factors as the terms of the security (e.g., interest rate and time to maturity) and the amount and type of any collateral.
Top Ten States/Territories (%)
(at April 30, 2023) |
| New York | 18.0 |
| Illinois | 9.5 |
| New Jersey | 7.2 |
| Massachusetts | 5.1 |
| Pennsylvania | 4.3 |
| Florida | 3.7 |
| California | 3.7 |
| District of Columbia | 3.3 |
| Wisconsin | 3.2 |
| Kentucky | 2.8 |
Percentages indicated are based upon total investments excluding Money Market Funds and investments in derivatives, if any.
For further detail about these holdings, please refer to the section entitled “Portfolio of Investments.”
Fund holdings are as of the date given, are subject to change at any time, and are not recommendations to buy or sell any security.
| 4 | Columbia Short Duration Municipal Bond Fund | Annual Report 2023 |
Manager Discussion of Fund Performance
(Unaudited)
For the 12-month period that ended April 30, 2023, Class A of Columbia Short Duration Municipal Bond Fund returned 1.67% excluding sales charges. Institutional Class shares of the Fund returned 1.92%. The Fund underperformed its benchmark, the Bloomberg 1-5 Year Municipal Bond Index (Bloomberg Index), which returned 2.08% for the same period.
Market overview
For fixed-income markets, the period was dominated by the U.S. Federal Reserve’s (Fed) efforts to return inflation to its target levels and the resultant dramatic increase in interest rates. Indeed, the Fed increased its targeted federal funds rate by 450 basis points, and municipal bond yields followed suit with yields across most of its spectrum of maturities rising as well. (A basis point is 1/100th of a percentage point.) Municipal bond yields peaked in October 2022, however, and subsequently retraced somewhat, returning most segments of the municipal bond market to positive total returns for the period overall. Still, for the period as a whole, yields on one-year and two-year municipal bonds increased 106 basis points and 47 basis points, respectively. Yields on municipal bonds with maturities of less than one year rose even more significantly, driving an inversion of the short-term end of the yield curve for much of the period. Yields for municipal bonds with maturities of between five years and 13 years actually declined modestly, and longer term maturity yields rose only moderately.
Amid these conditions, investor sentiment within the municipal bond market was negative for much of the period. Rising rates and negative total returns through much of 2022 precipitated the largest outflow cycle ever experienced by the municipal bond market. Fund flows then stabilized and slowed into year-end but any optimism around a resumption of inflows in 2023 was quashed as another $6 billion of outflows through the end of April showed investors were still cautious about returning to the market. Consequently, technicals, or supply/demand dynamics, were not favorable within the municipal bond market during the period, largely driven by this lack of demand. Short-term municipal bond funds were not spared the effects of the outflow cycle. However, they were less impacted than their long-term, high-yield and intermediate fund counterparts, as short-term municipal bond funds generally hold more liquid positions, and shorter maturities inherently provide ample cash flow. Supply, or lack thereof during the period, proved a bright spot. Rate volatility coupled with healthy balance sheets sidelined many issuers, with tax-exempt issuance approximately 10% to 15% lower during the period than long-term averages. Not having to contend with an oversupply of new issuance likely buoyed the market as whatever new issues did come to market were well received.
All that said, fundamental factors were broadly supportive of the municipal bond market during the period. Municipal credit health benefited from positive U.S. economic growth, outperformance of tax collections, and strong reserve positions by most state and local governments, owing partly to COVID-19 stimulus. Revenue sectors, however, were more mixed. Essential services, such as water & sewer and utilities, held steady, and transportation sectors, such as airports and toll roads, rebounded strongly with increased traffic levels. Public mass transit was the exception, as subway/bus traffic across most major cities remained well below pre-pandemic levels. Fundamental credit health for hospitals and other health care sectors, such as senior living facilities and continuing care retirement communities (CCRCs), was modestly weaker overall. Higher labor costs, lighter balance sheets due to repayment of Medicare acceleration payments and investment market losses served to weaken health care fundamentals as did the full expenditure of any COVID-19 funding. As a whole, higher quality municipal bonds outperformed lower quality securities during the period.
For the period as a whole, the short-term municipal bond market underperformed the broader municipal bond market. However, the short-term municipal bond market outperformed U.S. Treasuries and the broad U.S. fixed-income market for the period. The benchmark returned 2.08% as compared to a 2.87% return for the Bloomberg Municipal Bond Index, a -0.93% return for the Bloomberg Treasury Index and a -0.43% return for the Bloomberg U.S. Aggregate Bond Index for the period.
The Fund’s notable detractors during the period
| • | Security selection as a whole detracted from the Fund’s relative results during the period. Issue selection within the airports, housing and industrial development revenue/pollution control revenue (IDR/PCR) sectors hurt most. |
| • | Having an underweighted allocation to state general obligation bonds and the toll roads sector detracted, as each outperformed the benchmark during the period. |
| • | The Fund’s exposure to securities with maturities of three to five years, which underperformed the benchmark during the period, dampened the Fund’s relative results. |
Columbia Short Duration Municipal Bond Fund | Annual Report 2023
| 5 |
Manager Discussion of Fund Performance (continued)
(Unaudited)
| • | Relative overweights to bonds rated A and BBB and to non-rated bonds detracted modestly, as lower quality bonds overall underperformed those with higher credit ratings during the period. |
The Fund’s notable contributors during the period
| • | Sector allocation positioning overall contributed positively to the Fund’s relative results. Overweighted allocations to the airports, transportation and prepaid gas sectors, which each outpaced the benchmark during the period, and an underweighted exposure to pre-refunded issues, which lagged the benchmark during the period, added the most value. |
| • | Security selection among local general obligation, transportation, pre-refunded and CCRC bonds boosted the Fund’s results. |
| • | A shift higher in the Fund’s overall credit quality during the period, via a reduction in holdings rated BBB and an increase in positions rated AA, proved beneficial, as higher quality bonds overall outperformed those with lower credit ratings. |
| • | Yield curve positioning as a whole added value, with positioning among municipal bonds with maturities of less than one year and longer than five years, which are not components of the benchmark, boosting results. |
| • | From a states’ perspective, exposure to Puerto Rico general obligation notes and Illinois state general obligation notes, which generally outperformed the benchmark during the period, contributed positively. |
Fixed-income securities present issuer default risk. The Fund invests substantially in municipal securities and will be affected by tax, legislative, regulatory, demographic or political changes, as well as changes impacting a state’s financial, economic or other conditions. A relatively small number of tax-exempt issuers may necessitate the Fund investing more heavily in a single issuer and, therefore, be more exposed to the risk of loss than a fund that invests more broadly. Prepayment and extension risk exists because the timing of payments on a loan, bond or other investment may accelerate when interest rates fall or decelerate when interest rates rise which may reduce investment opportunities and potential returns. Market risk may affect a single issuer, sector of the economy, industry or the market as a whole. A rise in interest rates may result in a price decline of fixed-income instruments held by the Fund, negatively impacting its performance and NAV. Falling rates may result in the Fund investing in lower yielding debt instruments, lowering the Fund’s income and yield. These risks may be heightened for longer maturity and duration securities. Federal and state tax rules apply to capital gain distributions and any gains or losses on sales. Income may be subject to state, local or alternative minimum taxes. See the Fund’s prospectus for more information on these and other risks.
The views expressed in this report reflect the current views of the respective parties who have contributed to this report. These views are not guarantees of future performance and involve certain risks, uncertainties and assumptions that are difficult to predict, so actual outcomes and results may differ significantly from the views expressed. These views are subject to change at any time based upon economic, market or other conditions and the respective parties disclaim any responsibility to update such views. These views may not be relied on as investment advice and, because investment decisions for a Columbia fund are based on numerous factors, may not be relied on as an indication of trading intent on behalf of any particular Columbia fund. References to specific securities should not be construed as a recommendation or investment advice.
| 6 | Columbia Short Duration Municipal Bond Fund | Annual Report 2023 |
Understanding Your Fund’s Expenses
(Unaudited)
As an investor, you incur two types of costs. There are shareholder transaction costs, which generally include sales charges on purchases and may include redemption fees. There are also ongoing fund costs, which generally include management fees, distribution and/or service fees, and other fund expenses. The following information is intended to help you understand your ongoing costs (in dollars) of investing in the Fund and to help you compare these costs with the ongoing costs of investing in other mutual funds.
Analyzing your Fund’s expenses
To illustrate these ongoing costs, we have provided examples and calculated the expenses paid by investors in each share class of the Fund during the period. The actual and hypothetical information in the table is based on an initial investment of $1,000 at the beginning of the period indicated and held for the entire period. Expense information is calculated two ways and each method provides you with different information. The amount listed in the “Actual” column is calculated using the Fund’s actual operating expenses and total return for the period. You may use the Actual information, together with the amount invested, to estimate the expenses that you paid over the period. Simply divide your account value by $1,000 (for example, an $8,600 account value divided by $1,000 = 8.6), then multiply the results by the expenses paid during the period under the “Actual” column. The amount listed in the “Hypothetical” column assumes a 5% annual rate of return before expenses (which is not the Fund’s actual return) and then applies the Fund’s actual expense ratio for the period to the hypothetical return. You should not use the hypothetical account values and expenses to estimate either your actual account balance at the end of the period or the expenses you paid during the period. See “Compare with other funds” below for details on how to use the hypothetical data.
Compare with other funds
Since all mutual funds are required to include the same hypothetical calculations about expenses in shareholder reports, you can use this information to compare the ongoing cost of investing in the Fund with other funds. To do so, compare the hypothetical example with the 5% hypothetical examples that appear in the shareholder reports of other funds. As you compare hypothetical examples of other funds, it is important to note that hypothetical examples are meant to highlight the ongoing costs of investing in a fund only and do not reflect any transaction costs, such as sales charges, or redemption or exchange fees. Therefore, the hypothetical calculations are useful in comparing ongoing costs only, and will not help you determine the relative total costs of owning different funds. If transaction costs were included in these calculations, your costs would be higher.
| November 1, 2022 — April 30, 2023 |
| | Account value at the
beginning of the
period ($) | Account value at the
end of the
period ($) | Expenses paid during
the period ($) | Fund’s annualized
expense ratio (%) |
| | Actual | Hypothetical | Actual | Hypothetical | Actual | Hypothetical | Actual |
| Class A | 1,000.00 | 1,000.00 | 1,027.00 | 1,021.33 | 3.23 | 3.22 | 0.65 |
| Advisor Class | 1,000.00 | 1,000.00 | 1,028.30 | 1,022.56 | 1.99 | 1.98 | 0.40 |
| Class C | 1,000.00 | 1,000.00 | 1,023.30 | 1,017.65 | 6.95 | 6.93 | 1.40 |
| Institutional Class | 1,000.00 | 1,000.00 | 1,028.30 | 1,022.56 | 1.99 | 1.98 | 0.40 |
| Institutional 2 Class | 1,000.00 | 1,000.00 | 1,029.60 | 1,022.85 | 1.69 | 1.69 | 0.34 |
| Institutional 3 Class | 1,000.00 | 1,000.00 | 1,029.90 | 1,023.10 | 1.44 | 1.44 | 0.29 |
Expenses paid during the period are equal to the annualized expense ratio for each class as indicated above, multiplied by the average account value over the period and then multiplied by the number of days in the Fund’s most recent fiscal half year and divided by 365.
Expenses do not include fees and expenses incurred indirectly by the Fund from its investment in underlying funds, including affiliated and non-affiliated pooled investment vehicles, such as mutual funds and exchange-traded funds.
Had Columbia Management Investment Advisers, LLC and/or certain of its affiliates not waived/reimbursed certain fees and expenses, account value at the end of the period would have been reduced.
Columbia Short Duration Municipal Bond Fund | Annual Report 2023
| 7 |
Portfolio of Investments
April 30, 2023
(Percentages represent value of investments compared to net assets)
Investments in securities
| Floating Rate Notes 2.8% |
| Issue Description | Yield | | Principal
Amount ($) | Value ($) |
| New York 1.2% |
| New York City Transitional Finance Authority(a),(b) |
| Revenue Bonds |
| Future Tax Secured |
| Subordinated Series 2012C (JPMorgan Chase Bank) |
| 11/01/2036 | 3.750% | | 2,000,000 | 2,000,000 |
| Subordinated Series 2018 (JPMorgan Chase Bank) |
| 08/01/2042 | 3.750% | | 4,000,000 | 4,000,000 |
| Total | 6,000,000 |
| Utah 1.6% |
| City of Murray(a),(b) |
| Revenue Bonds |
| IHC Health Services, Inc. |
| Series 2005A (JPMorgan Chase Bank) |
| 05/15/2037 | 3.800% | | 4,000,000 | 4,000,000 |
| Series 2005B (JPMorgan Chase Bank) |
| 05/15/2037 | 3.800% | | 4,000,000 | 4,000,000 |
| Total | 8,000,000 |
Total Floating Rate Notes
(Cost $14,000,000) | 14,000,000 |
|
| Municipal Bonds 94.4% |
| Issue Description | Coupon
Rate | | Principal
Amount ($) | Value ($) |
| Alabama 1.8% |
| Black Belt Energy Gas District |
| Refunding Revenue Bonds |
| Series 2022D1 (Mandatory Put 06/01/27) |
| 07/01/2052 | 4.000% | | 3,000,000 | 3,014,855 |
| Revenue Bonds |
| Project No. 4 |
| Series 2019A-1 (Mandatory Put 12/01/25) |
| 12/01/2049 | 4.000% | | 2,000,000 | 2,002,637 |
| Black Belt Energy Gas District(c) |
| Revenue Bonds |
| Series 2018B-1 (Mandatory Put 12/01/23) |
0.7 x 1-month USD LIBOR + 0.900%
12/01/2048 | 4.147% | | 1,000,000 | 998,873 |
| Industrial Development Board of the City of Mobile |
| Senior Revenue Bonds |
| Alabama Power Co. - Barry Plant Project |
| Series 2020 (Mandatory Put 06/26/25) |
| 06/01/2034 | 1.000% | | 1,150,000 | 1,091,206 |
| Municipal Bonds (continued) |
| Issue Description | Coupon
Rate | | Principal
Amount ($) | Value ($) |
| Lower Alabama Gas District (The) |
| Revenue Bonds |
| Gas Project |
| Series 2020 (Mandatory Put 12/01/25) |
| 12/01/2050 | 4.000% | | 600,000 | 599,918 |
| Southeast Energy Authority A Cooperative District |
| Revenue Bonds |
| Project #2 |
| Series 2021B |
| 06/01/2026 | 4.000% | | 1,265,000 | 1,269,963 |
| Total | 8,977,452 |
| Alaska 0.4% |
| Alaska Industrial Development & Export Authority |
| Refunding Revenue Bonds |
| Greater Fairbanks Community Hospital Foundation Project |
| Series 2019 |
| 04/01/2024 | 5.000% | | 1,800,000 | 1,825,460 |
| Arizona 2.1% |
| Chandler Industrial Development Authority(d) |
| Revenue Bonds |
| Intel Corp. |
| Series 2019 (Mandatory Put 06/03/24) |
| 06/01/2049 | 5.000% | | 1,450,000 | 1,461,782 |
| Intel Corp. Project |
| Series 2022-1 (Mandatory Put 09/01/27) |
| 09/01/2042 | 5.000% | | 5,000,000 | 5,208,757 |
| City of Phoenix Civic Improvement Corp.(d) |
| Revenue Bonds |
| Junior Lien - Airport |
| Series 2019B |
| 07/01/2026 | 5.000% | | 990,000 | 1,040,975 |
| Coconino County Pollution Control Corp. |
| Refunding Revenue Bonds |
| Nevada Power Co. |
| Series 2023 (Mandatory Put 03/31/26) |
| 08/31/2032 | 4.125% | | 500,000 | 505,206 |
| Maricopa County Industrial Development Authority(c) |
| Refunding Revenue Bonds |
| Banner Health Obligation |
| Series 2019 (Mandatory Put 10/18/24) |
Muni Swap Index Yield + 0.570%
01/01/2035 | 3.380% | | 1,325,000 | 1,320,494 |
| Maricopa County Pollution Control Corp. |
| Refunding Revenue Bonds |
| Palo Verde Project |
| Series 2021 (Mandatory Put 10/01/26) |
| 06/01/2043 | 0.875% | | 1,000,000 | 885,870 |
| Total | 10,423,084 |
The accompanying Notes to Financial Statements are an integral part of this statement.
| 8 | Columbia Short Duration Municipal Bond Fund | Annual Report 2023 |
Portfolio of Investments (continued)
April 30, 2023
| Municipal Bonds (continued) |
| Issue Description | Coupon
Rate | | Principal
Amount ($) | Value ($) |
| California 3.7% |
| Anaheim Public Financing Authority |
| Refunding Revenue Bonds |
| Anaheim Public Improvement Projects |
| Series 2019 |
| 08/31/2028 | 5.000% | | 1,000,000 | 1,094,399 |
| Bay Area Toll Authority(c) |
| Revenue Bonds |
| San Francisco Bay Area Toll Bridge |
| Series 2012 (Mandatory Put 04/01/24) |
Muni Swap Index Yield + 1.100%
04/01/2045 | 3.910% | | 500,000 | 501,372 |
| California County Tobacco Securitization Agency |
| Refunding Revenue Bonds |
| Series 2020A |
| 06/01/2023 | 4.000% | | 400,000 | 400,209 |
| California Public Finance Authority |
| Refunding Revenue Bonds |
| Henry Mayo Newhall Hospital |
| Series 2021 |
| 10/15/2024 | 4.000% | | 380,000 | 380,934 |
| 10/15/2025 | 4.000% | | 400,000 | 403,028 |
| 10/15/2026 | 4.000% | | 415,000 | 420,138 |
| California Public Finance Authority(e) |
| Revenue Bonds |
| Enso Village Project - TEMPS 50 |
| Series 2021 |
| 11/15/2027 | 2.125% | | 3,000,000 | 2,848,948 |
| City of Los Angeles Department of Airports(d) |
| Refunding Revenue Bonds |
| Los Angeles International Airport |
| Subordinated Series 2022 |
| 05/15/2025 | 5.000% | | 1,930,000 | 1,995,403 |
| City of Vernon Electric System |
| Refunding Revenue Bonds |
| Series 2022A |
| 08/01/2025 | 5.000% | | 500,000 | 514,579 |
| 08/01/2026 | 5.000% | | 600,000 | 625,841 |
| Corona-Norco Unified School District(f) |
| Unlimited General Obligation Bonds |
| Capital Appreciation |
| Series 2002D (AGM) |
| 09/01/2027 | 0.000% | | 2,000,000 | 1,751,798 |
| Pittsburg Successor Agency Redevelopment Agency(f) |
| Tax Allocation Bonds |
| Los Medanos Community Development Project |
| Series 1999 (AMBAC) |
| 08/01/2024 | 0.000% | | 2,000,000 | 1,911,519 |
| Municipal Bonds (continued) |
| Issue Description | Coupon
Rate | | Principal
Amount ($) | Value ($) |
| San Francisco City & County Airport Commission - San Francisco International Airport(d) |
| Refunding Revenue Bonds |
| Second Series 2023A |
| 05/01/2028 | 5.000% | | 5,000,000 | 5,399,089 |
| Total | 18,247,257 |
| Colorado 2.6% |
| City & County of Denver Airport System(d) |
| Refunding Revenue Bonds |
| Series 2017A |
| 11/15/2030 | 5.000% | | 1,925,000 | 2,056,398 |
| System |
| Subordinated Series 2018A |
| 12/01/2026 | 5.000% | | 1,500,000 | 1,579,778 |
| Revenue Bonds |
| Series 2022A |
| 11/15/2028 | 5.000% | | 5,000,000 | 5,470,919 |
| Colorado Health Facilities Authority |
| Refunding Revenue Bonds |
| CommonSpirit Health Services |
| Series 2019B (Mandatory Put 08/01/25) |
| 08/01/2049 | 5.000% | | 1,000,000 | 1,025,749 |
| Revenue Bonds |
| Aberdeen Ridge |
| Series 2021B |
| 05/15/2028 | 2.125% | | 1,750,000 | 1,582,978 |
| E-470 Public Highway Authority(c) |
| Refunding Revenue Bonds |
| Series 2021B (Mandatory Put 09/01/24) |
0.7 x SOFR + 0.350%
09/01/2039 | 3.573% | | 1,000,000 | 993,468 |
| Total | 12,709,290 |
| Connecticut 1.1% |
| City of New Haven |
| Unlimited General Obligation Bonds |
| Series 2019A (AGM) |
| 08/01/2024 | 5.000% | | 1,000,000 | 1,020,487 |
| Connecticut Housing Finance Authority(d) |
| Refunding Revenue Bonds |
| Housing Mortgage Finance Program |
| Series 2021 |
| 05/15/2023 | 0.350% | | 350,000 | 349,616 |
| 11/15/2023 | 0.400% | | 300,000 | 295,372 |
| State of Connecticut |
| Unlimited General Obligation Bonds |
| Series 2022F |
| 11/15/2026 | 5.000% | | 3,000,000 | 3,234,974 |
The accompanying Notes to Financial Statements are an integral part of this statement.
Columbia Short Duration Municipal Bond Fund | Annual Report 2023
| 9 |
Portfolio of Investments (continued)
April 30, 2023
| Municipal Bonds (continued) |
| Issue Description | Coupon
Rate | | Principal
Amount ($) | Value ($) |
| State of Connecticut Special Tax |
| Revenue Bonds |
| Series 2022A |
| 07/01/2027 | 5.000% | | 500,000 | 548,036 |
| Total | 5,448,485 |
| District of Columbia 3.4% |
| District of Columbia |
| Revenue Bonds |
| Federal Highway Grant Anticipation |
| Series 2011 |
| 12/01/2023 | 5.250% | | 1,750,000 | 1,752,914 |
| District of Columbia Housing Finance Agency |
| Revenue Bonds |
| Faircliff Plaza East Apartments Project |
| Series 2022 (FHA) (Mandatory Put 12/01/25) |
| 12/01/2026 | 5.000% | | 1,450,000 | 1,497,567 |
| Metropolitan Washington Airports Authority Aviation(d) |
| Refunding Revenue Bonds |
| Series 2014A |
| 10/01/2024 | 5.000% | | 5,865,000 | 5,980,640 |
| 10/01/2025 | 5.000% | | 1,725,000 | 1,752,707 |
| Series 2018A |
| 10/01/2027 | 5.000% | | 2,385,000 | 2,567,214 |
| Series 2020A |
| 10/01/2025 | 5.000% | | 3,000,000 | 3,115,922 |
| Total | 16,666,964 |
| Florida 3.7% |
| City of Jacksonville |
| Refunding Revenue Bonds |
| Series 2022A |
| 10/01/2025 | 5.000% | | 700,000 | 734,354 |
| City of Pompano Beach |
| Revenue Bonds |
| John Knox Village Project |
| Series 2021 |
| 01/01/2027 | 1.450% | | 2,000,000 | 1,758,170 |
| County of Lee Airport(d) |
| Refunding Revenue Bonds |
| Series 2021A |
| 10/01/2025 | 5.000% | | 1,850,000 | 1,907,162 |
| 10/01/2028 | 5.000% | | 2,035,000 | 2,199,832 |
| County of Miami-Dade Seaport Department(d) |
| Refunding Revenue Bonds |
| Series 2023A |
| 10/01/2027 | 5.000% | | 1,650,000 | 1,766,218 |
| Duval County Public Schools |
| Certificate of Participation |
| Series 2022 (AGM) |
| 07/01/2026 | 5.000% | | 2,125,000 | 2,264,061 |
| Municipal Bonds (continued) |
| Issue Description | Coupon
Rate | | Principal
Amount ($) | Value ($) |
| Florida Development Finance Corp.(e) |
| Revenue Bonds |
| Mayflower Retirement Community Center - TEMPS 50 |
| Series 2021 |
| 06/01/2026 | 1.750% | | 1,020,000 | 992,417 |
| Greater Orlando Aviation Authority(d) |
| Revenue Bonds |
| Series 2019A |
| 10/01/2025 | 5.000% | | 2,000,000 | 2,077,281 |
| Hillsborough County Aviation Authority(d) |
| Revenue Bonds |
| Tampa International Airport |
| Series 2022S |
| 10/01/2026 | 5.000% | | 3,250,000 | 3,433,364 |
| Seminole County Industrial Development Authority |
| Refunding Revenue Bonds |
| Legacy Pointe at UCF Project |
| Series 2019 |
| 11/15/2025 | 3.750% | | 200,000 | 200,025 |
| St. Johns County Industrial Development Authority |
| Refunding Revenue Bonds |
| Vicar’s Landing Project |
| Series 2021 |
| 12/15/2024 | 4.000% | | 145,000 | 142,324 |
| 12/15/2025 | 4.000% | | 180,000 | 174,551 |
| 12/15/2026 | 4.000% | | 185,000 | 176,871 |
| Village Community Development District No. 13 |
| Special Assessment Bonds |
| Series 2021 |
| 05/01/2026 | 1.800% | | 500,000 | 464,798 |
| Total | 18,291,428 |
| Georgia 1.7% |
| Burke County Development Authority |
| Revenue Bonds |
| Georgia Power Co. Plant Vogtle Project |
| Series 2019 (Mandatory Put 05/25/23) |
| 10/01/2032 | 2.250% | | 1,000,000 | 998,760 |
| City of Atlanta Department of Aviation(d) |
| Refunding Revenue Bonds |
| Series 2021C |
| 07/01/2025 | 5.000% | | 1,000,000 | 1,033,977 |
| Development Authority of Burke County (The) |
| Refunding Revenue Bonds |
| Georgia Power Co. Plant Vogtle Project |
| Series 2022 (Mandatory Put 08/19/25) |
| 12/01/2049 | 2.875% | | 750,000 | 730,236 |
| Revenue Bonds |
| Georgia Power Co. Plant Vogtle Project |
| Series 2019 (Mandatory Put 03/12/24) |
| 11/01/2048 | 2.925% | | 1,250,000 | 1,235,638 |
The accompanying Notes to Financial Statements are an integral part of this statement.
| 10 | Columbia Short Duration Municipal Bond Fund | Annual Report 2023 |
Portfolio of Investments (continued)
April 30, 2023
| Municipal Bonds (continued) |
| Issue Description | Coupon
Rate | | Principal
Amount ($) | Value ($) |
| Georgia State Road & Tollway Authority(e),(f) |
| Revenue Bonds |
| I-75 S Express Lanes Project |
| Series 2014 Escrowed to Maturity |
| 06/01/2024 | 0.000% | | 530,000 | 505,157 |
| Main Street Natural Gas, Inc.(c) |
| Revenue Bonds |
| Series 2018B (Mandatory Put 09/01/23) |
0.7 x 1-month USD LIBOR + 0.750%
04/01/2048 | 3.997% | | 1,500,000 | 1,500,883 |
| Main Street Natural Gas, Inc. |
| Revenue Bonds |
| Series 2019A |
| 05/15/2024 | 5.000% | | 1,250,000 | 1,255,373 |
| Series 2021C |
| 12/01/2027 | 4.000% | | 1,225,000 | 1,226,022 |
| Total | 8,486,046 |
| Guam 0.5% |
| Guam Power Authority(g) |
| Refunding Revenue Bonds |
| Series 2022A |
| 10/01/2025 | 5.000% | | 2,375,000 | 2,441,739 |
| Idaho 0.2% |
| Idaho Housing & Finance Association |
| Revenue Bonds |
| Sunset Landing Apartment Project |
| Series 2021 |
| 07/01/2024 | 0.700% | | 820,000 | 792,848 |
| Illinois 9.6% |
| Chicago Board of Education |
| Refunding Unlimited General Obligation Bonds |
| Series 2017F |
| 12/01/2024 | 5.000% | | 1,000,000 | 1,014,588 |
| Chicago Midway International Airport(d) |
| Refunding Revenue Bonds |
| Junior 2nd Lien |
| Series 2014A |
| 01/01/2030 | 5.000% | | 2,845,000 | 2,860,249 |
| Chicago O’Hare International Airport(d) |
| Refunding Revenue Bonds |
| Series 2015A |
| 01/01/2028 | 5.000% | | 2,515,000 | 2,565,018 |
| Chicago Park District |
| Refunding Limited General Obligation Bonds |
| Limited Tax |
| Series 2014C |
| 01/01/2026 | 5.000% | | 1,865,000 | 1,881,731 |
| Municipal Bonds (continued) |
| Issue Description | Coupon
Rate | | Principal
Amount ($) | Value ($) |
| City of Chicago |
| Refunding Unlimited General Obligation Bonds |
| Series 2015 |
| 01/01/2024 | 5.000% | | 2,090,000 | 2,107,689 |
| Unlimited General Obligation Refunding Bonds |
| Series 2020A |
| 01/01/2024 | 5.000% | | 340,000 | 342,878 |
| City of Chicago Wastewater Transmission |
| Refunding Revenue Bonds |
| 2nd Lien |
| Series 2008 |
| 01/01/2024 | 5.000% | | 2,200,000 | 2,219,984 |
| City of Joliet Waterworks & Sewerage |
| Revenue Bonds |
| Senior Lien |
| BAN Series 2022 |
| 01/01/2024 | 5.000% | | 1,380,000 | 1,388,557 |
| Cook County Community College District No. 535 Oakton |
| Prerefunded 12/01/24 Limited General Obligation Bonds |
| Limited Tax |
| Series 2014 |
| 12/01/2027 | 4.000% | | 200,000 | 203,075 |
| Cook County School District No. 99 Cicero |
| Unlimited General Obligation Refunding Bonds |
| Series 2019 |
| 12/01/2023 | 5.000% | | 575,000 | 579,505 |
| Illinois Development Finance Authority(f) |
| Revenue Bonds |
| Regency Park |
| Series 1991 Escrowed to Maturity |
| 07/15/2025 | 0.000% | | 2,010,000 | 1,874,779 |
| Illinois Finance Authority |
| Refunding Revenue Bonds |
| American Water Capital Corp. Project |
| Series 2020 (Mandatory Put 09/01/23) |
| 05/01/2040 | 0.700% | | 2,000,000 | 1,978,719 |
| Lifespace Communities, Inc. |
| Series 2015 |
| 05/14/2023 | 5.000% | | 250,000 | 249,944 |
| 05/14/2024 | 5.000% | | 450,000 | 443,504 |
| Illinois Finance Authority(b) |
| Refunding Revenue Bonds |
| OSF Healthcare System |
| Series 2020 (Mandatory Put 11/15/24) |
| 05/15/2050 | 5.000% | | 4,250,000 | 4,298,742 |
| Illinois Finance Authority(c) |
| Refunding Revenue Bonds |
| Presbyterian Homes |
| Series 2021 (Mandatory Put 05/01/26) |
Muni Swap Index Yield + 0.700%
05/01/2042 | 3.510% | | 1,250,000 | 1,217,264 |
The accompanying Notes to Financial Statements are an integral part of this statement.
Columbia Short Duration Municipal Bond Fund | Annual Report 2023
| 11 |
Portfolio of Investments (continued)
April 30, 2023
| Municipal Bonds (continued) |
| Issue Description | Coupon
Rate | | Principal
Amount ($) | Value ($) |
| Illinois Housing Development Authority |
| Revenue Bonds |
| Senior |
| Series 2016A |
| 10/01/2031 | 3.125% | | 915,000 | 906,145 |
| Series 2021C (FHA) |
| 07/01/2026 | 0.800% | | 1,000,000 | 919,447 |
| Metropolitan Pier & Exposition Authority |
| Refunding Revenue Bonds |
| McCormick Place Expansion |
| Series 2022 |
| 06/15/2025 | 3.000% | | 2,000,000 | 1,966,274 |
| Northern Illinois University |
| Refunding Revenue Bonds |
| Northern University of Illinois |
| Series 2020B (BAM) |
| 04/01/2025 | 5.000% | | 400,000 | 411,337 |
| Revenue Bonds |
| Board of Trustees |
| Series 2021 (BAM) |
| 10/01/2025 | 5.000% | | 310,000 | 322,052 |
| 10/01/2026 | 5.000% | | 250,000 | 263,195 |
| Railsplitter Tobacco Settlement Authority |
| Revenue Bonds |
| Series 2017 |
| 06/01/2024 | 5.000% | | 3,000,000 | 3,051,838 |
| State of Illinois |
| Unlimited General Obligation Bonds |
| Senior |
| Series 2014 |
| 05/01/2026 | 5.000% | | 2,000,000 | 2,027,780 |
| Series 2020C |
| 05/01/2023 | 5.375% | | 250,000 | 250,028 |
| Series 2020D |
| 10/01/2024 | 5.000% | | 2,000,000 | 2,039,129 |
| Series 2021A |
| 03/01/2025 | 5.000% | | 500,000 | 512,896 |
| 03/01/2028 | 5.000% | | 2,500,000 | 2,693,595 |
| Unlimited General Obligation Refunding Bonds |
| Series 2022B |
| 03/01/2025 | 5.000% | | 2,400,000 | 2,461,900 |
| State of Illinois(h) |
| Unlimited General Obligation Bonds |
| Series 2023B |
| 05/01/2028 | 5.000% | | 300,000 | 324,221 |
| 05/01/2032 | 5.000% | | 3,500,000 | 3,947,320 |
| Total | 47,323,383 |
| Municipal Bonds (continued) |
| Issue Description | Coupon
Rate | | Principal
Amount ($) | Value ($) |
| Indiana 2.5% |
| City of Whiting(d) |
| Refunding Revenue Bonds |
| BP Products North America |
| Series 2019 (Mandatory Put 06/05/26) |
| 12/01/2044 | 5.000% | | 1,000,000 | 1,028,481 |
| City of Whiting(b),(d) |
| Revenue Bonds |
| BP Products North America, Inc. Project |
| Series 2017 (Mandatory Put 11/01/24) |
| 11/01/2047 | 5.000% | | 5,000,000 | 5,078,507 |
| Indiana Finance Authority(d) |
| Refunding Revenue Bonds |
| Fulcrum Centerpoint LLC Project |
| Series 2022 (Mandatory Put 11/15/23) |
| 12/15/2046 | 4.500% | | 4,000,000 | 3,989,538 |
| Indiana Finance Authority |
| Refunding Revenue Bonds |
| Indianapolis Power & Light Co. Project |
| Series 2021 |
| 08/01/2025 | 0.650% | | 1,500,000 | 1,382,483 |
| Indianapolis Local Public Improvement Bond Bank(d) |
| Refunding Revenue Bonds |
| Indianapolis Airport |
| Series 2019 |
| 01/01/2026 | 5.000% | | 1,050,000 | 1,088,793 |
| Total | 12,567,802 |
| Iowa 0.1% |
| Iowa Student Loan Liquidity Corp.(d) |
| Refunding Revenue Bonds |
| Series 2019B |
| 12/01/2023 | 5.000% | | 580,000 | 584,345 |
| Kentucky 2.8% |
| City of Henderson(d),(e) |
| Revenue Bonds |
| Pratt Paper LLC Project |
| Series 2022 |
| 01/01/2032 | 3.700% | | 1,000,000 | 952,061 |
| County of Owen |
| Refunding Revenue Bonds |
| Kentucky-American Water Co. Project |
| Series 2020 (Mandatory Put 09/01/23) |
| 06/01/2040 | 0.700% | | 1,250,000 | 1,236,699 |
| Kenton County School District Finance Corp. |
| Refunding Revenue Bonds |
| Series 2015B |
| 10/01/2025 | 3.000% | | 1,995,000 | 1,989,383 |
The accompanying Notes to Financial Statements are an integral part of this statement.
| 12 | Columbia Short Duration Municipal Bond Fund | Annual Report 2023 |
Portfolio of Investments (continued)
April 30, 2023
| Municipal Bonds (continued) |
| Issue Description | Coupon
Rate | | Principal
Amount ($) | Value ($) |
| Kentucky Asset Liability Commission |
| Revenue Bonds |
| Project Notes - Federal Highway Trust Fund |
| Series 2015 |
| 09/01/2023 | 5.000% | | 500,000 | 502,690 |
| Kentucky Interlocal School Transportation Association |
| Refunding Certificate of Participation |
| Series 2021 |
| 03/01/2025 | 1.250% | | 1,335,000 | 1,256,864 |
| 03/01/2026 | 1.250% | | 1,085,000 | 1,003,345 |
| Kentucky Public Energy Authority |
| Revenue Bonds |
| Series 2018A (Mandatory Put 04/01/24) |
| 04/01/2048 | 4.000% | | 2,780,000 | 2,782,469 |
| Series 2018B |
| 07/01/2023 | 4.000% | | 750,000 | 750,077 |
| Series 2020A (Mandatory Put 06/01/26) |
| 12/01/2050 | 4.000% | | 1,355,000 | 1,358,297 |
| Kentucky Public Energy Authority(c) |
| Revenue Bonds |
| Series 2019A-2 (Mandatory Put 06/01/25) |
0.7 x 1-month USD LIBOR + 1.120%
12/01/2049 | 4.367% | | 1,000,000 | 998,938 |
| Louisville/Jefferson County Metropolitan Government |
| Unrefunded Revenue Bonds |
| Norton Healthcare, Inc. |
| Series 2020 (Mandatory Put 10/01/23) |
| 10/01/2047 | 5.000% | | 1,125,000 | 1,130,367 |
| Total | 13,961,190 |
| Louisiana 0.4% |
| Louisiana Local Government Environmental Facilities & Community Development Authority |
| Refunding Revenue Bonds |
| Entergy Louisiana LLC Project |
| Series 2021 |
| 06/01/2030 | 2.000% | | 1,250,000 | 1,106,876 |
| Louisiana Offshore Terminal Authority |
| Refunding Revenue Bonds |
| Loop LLC Project |
| Series 2019 (Mandatory Put 12/01/23) |
| 09/01/2027 | 1.650% | | 1,000,000 | 986,138 |
| Total | 2,093,014 |
| Maryland 2.5% |
| Maryland Community Development Administration |
| Refunding Revenue Bonds |
| Social Bonds |
| Series 2021C |
| 03/01/2029 | 1.550% | | 3,240,000 | 2,881,446 |
| Municipal Bonds (continued) |
| Issue Description | Coupon
Rate | | Principal
Amount ($) | Value ($) |
| Revenue Bonds |
| Series 2021B |
| 03/01/2027 | 0.900% | | 860,000 | 778,272 |
| Maryland Economic Development Corp.(d) |
| Revenue Bonds |
| Green Bonds - Purple Line Light Rail Project |
| Series 2022 |
| 11/12/2028 | 5.000% | | 2,000,000 | 2,057,252 |
| Maryland Health & Higher Educational Facilities Authority |
| Refunding Revenue Bonds |
| University of Maryland Medical System |
| Series 2020 (Mandatory Put 07/01/25) |
| 07/01/2045 | 5.000% | | 1,500,000 | 1,538,919 |
| State of Maryland Department of Transportation |
| Refunding Revenue Bonds |
| Series 2022B |
| 12/01/2027 | 5.000% | | 1,205,000 | 1,337,942 |
| Revenue Bonds |
| 2nd Issue |
| Series 2018 |
| 10/01/2024 | 5.000% | | 3,420,000 | 3,518,441 |
| Total | 12,112,272 |
| Massachusetts 3.7% |
| Berkshire Regional Transit Authority |
| Revenue Notes |
| RAN Series 2022 |
| 07/25/2023 | 4.000% | | 5,350,000 | 5,347,486 |
| Boston Housing Authority |
| Refunding Revenue Bonds |
| Series 2020A |
| 10/01/2023 | 0.700% | | 470,000 | 462,072 |
| Massachusetts Development Finance Agency |
| Refunding Revenue Bonds |
| Berklee College of Music |
| Series 2016 |
| 10/01/2029 | 5.000% | | 1,000,000 | 1,061,243 |
| Series 2019A |
| 07/01/2024 | 5.000% | | 260,000 | 264,158 |
| Massachusetts Educational Financing Authority(d) |
| Revenue Bonds |
| Education Loan |
| Series 2021 |
| 07/01/2025 | 5.000% | | 750,000 | 771,528 |
| 07/01/2026 | 5.000% | | 1,120,000 | 1,169,437 |
| Senior Series 2020B |
| 07/01/2026 | 5.000% | | 1,250,000 | 1,305,175 |
| Senior Series 2022B |
| 07/01/2025 | 5.000% | | 250,000 | 257,176 |
| 07/01/2029 | 5.000% | | 825,000 | 892,298 |
The accompanying Notes to Financial Statements are an integral part of this statement.
Columbia Short Duration Municipal Bond Fund | Annual Report 2023
| 13 |
Portfolio of Investments (continued)
April 30, 2023
| Municipal Bonds (continued) |
| Issue Description | Coupon
Rate | | Principal
Amount ($) | Value ($) |
| Senior Revenue Bonds |
| Series 2019B |
| 07/01/2023 | 5.000% | | 500,000 | 500,955 |
| Massachusetts Housing Finance Agency |
| Revenue Bonds |
| Series 2021A-2 (HUD) |
| 06/01/2024 | 0.400% | | 500,000 | 482,649 |
| Sustainability Bonds |
| Series 2022-D3 (FHA) |
| 12/01/2026 | 3.300% | | 1,000,000 | 999,022 |
| Massachusetts Port Authority(d) |
| Refunding Revenue Bonds |
| BosFuel Project |
| Series 2019A |
| 07/01/2026 | 5.000% | | 885,000 | 925,415 |
| Town of Orange |
| Limited General Obligation Notes |
| BAN Series 2022 |
| 08/24/2023 | 3.750% | | 4,000,000 | 4,001,969 |
| Total | 18,440,583 |
| Michigan 2.5% |
| Michigan Finance Authority |
| Refunding Revenue Bonds |
| McLaren Health Care |
| Series 2021D-1 |
| 10/15/2026 | 0.900% | | 2,495,000 | 2,316,189 |
| 10/15/2027 | 1.100% | | 1,650,000 | 1,520,275 |
| Michigan Finance Authority(i) |
| Refunding Revenue Bonds |
| Trinity Health |
| Series 2019 (Mandatory Put 02/01/25) |
| 12/01/2044 | 5.000% | | 1,605,000 | 1,655,146 |
| Michigan State Housing Development Authority |
| Revenue Bonds |
| Series 2021A |
| 04/01/2025 | 0.550% | | 1,000,000 | 930,840 |
| Michigan Strategic Fund(d) |
| Revenue Bonds |
| Consumers Energy Co. Project |
| Series 2021 (Mandatory Put 10/08/26) |
| 04/01/2035 | 0.875% | | 1,335,000 | 1,203,341 |
| Green Bonds |
| Series 2021 (Mandatory Put 10/01/26) |
| 10/01/2061 | 4.000% | | 2,000,000 | 1,986,714 |
| Wayne County Airport Authority(d) |
| Refunding Revenue Bonds |
| Series 2015F |
| 12/01/2027 | 5.000% | | 2,810,000 | 2,894,898 |
| Total | 12,507,403 |
| Municipal Bonds (continued) |
| Issue Description | Coupon
Rate | | Principal
Amount ($) | Value ($) |
| Minnesota 1.0% |
| City of Wayzata |
| Refunding Revenue Bonds |
| Folkstone Senior Living Co. |
| Series 2019 |
| 08/01/2023 | 3.000% | | 200,000 | 199,363 |
| 08/01/2024 | 3.000% | | 100,000 | 98,410 |
| 08/01/2025 | 3.000% | | 200,000 | 194,187 |
| 08/01/2026 | 3.000% | | 250,000 | 239,360 |
| Minnesota Housing Finance Agency(d) |
| Refunding Revenue Bonds |
| Series 2021C (GNMA) |
| 07/01/2023 | 0.450% | | 235,000 | 233,695 |
| 01/01/2024 | 0.600% | | 370,000 | 362,271 |
| Revenue Bonds |
| Series 2020A |
| 07/01/2023 | 1.350% | | 185,000 | 184,240 |
| Series 2020A (GNMA) |
| 07/01/2024 | 1.450% | | 115,000 | 111,974 |
| Series 2020D (GNMA) |
| 07/01/2026 | 1.650% | | 360,000 | 338,128 |
| Series 2020H |
| 07/01/2023 | 0.600% | | 210,000 | 208,884 |
| 01/01/2024 | 0.650% | | 175,000 | 171,401 |
| 07/01/2024 | 0.700% | | 190,000 | 183,395 |
| 01/01/2025 | 0.800% | | 340,000 | 324,331 |
| 07/01/2025 | 0.850% | | 360,000 | 339,515 |
| Minnesota Rural Water Finance Authority, Inc. |
| Revenue Notes |
| Public Projects Construction |
| Series 2022 |
| 12/01/2023 | 2.625% | | 1,700,000 | 1,681,160 |
| Total | 4,870,314 |
| Mississippi 0.6% |
| County of Warren(d) |
| Refunding Revenue Bonds |
| International Paper Co. Project |
| Series 2020 (Mandatory Put 06/16/25) |
| 08/01/2027 | 1.600% | | 1,000,000 | 952,593 |
| Mississippi Business Finance Corp.(d) |
| Revenue Bonds |
| Waste Management, Inc. Project |
| Series 2019 (Mandatory Put 06/03/24) |
| 03/01/2027 | 2.200% | | 1,250,000 | 1,224,482 |
| State of Mississippi Gaming Tax |
| Revenue Bonds |
| Series 2019A |
| 10/15/2024 | 5.000% | | 750,000 | 768,537 |
| Total | 2,945,612 |
The accompanying Notes to Financial Statements are an integral part of this statement.
| 14 | Columbia Short Duration Municipal Bond Fund | Annual Report 2023 |
Portfolio of Investments (continued)
April 30, 2023
| Municipal Bonds (continued) |
| Issue Description | Coupon
Rate | | Principal
Amount ($) | Value ($) |
| Missouri 1.0% |
| Kansas City Industrial Development Authority(d) |
| Revenue Bonds |
| Kansas City International Airport |
| Series 2019 |
| 03/01/2028 | 5.000% | | 3,810,000 | 4,063,638 |
| Missouri Development Finance Board |
| Refunding Revenue Bonds |
| Crackerneck Creek Project |
| Series 2021 |
| 03/01/2025 | 5.000% | | 425,000 | 431,429 |
| 03/01/2026 | 5.000% | | 300,000 | 307,307 |
| Total | 4,802,374 |
| Nebraska 0.8% |
| Central Plains Energy Project |
| Refunding Revenue Bonds |
| Project #3 |
| Series 2017A |
| 09/01/2026 | 5.000% | | 680,000 | 700,313 |
| Revenue Bonds |
| Project No. 4 |
| Series 2018 (Mandatory Put 01/01/24) |
| 03/01/2050 | 5.000% | | 1,000,000 | 1,007,320 |
| Gretna Public Schools |
| Unlimited General Obligation Bonds |
| Series 2022B |
| 12/15/2027 | 5.000% | | 2,080,000 | 2,190,476 |
| Total | 3,898,109 |
| Nevada 0.0% |
| City of Sparks(e) |
| Refunding Revenue Bonds |
| Sales Tax |
| Series 2019A |
| 06/15/2024 | 2.500% | | 145,000 | 141,803 |
| New Hampshire 0.7% |
| New Hampshire Business Finance Authority |
| Refunding Revenue Bonds |
| Springpoint Senior Living |
| Series 2021 |
| 01/01/2025 | 4.000% | | 290,000 | 286,818 |
| 01/01/2026 | 4.000% | | 265,000 | 260,133 |
| New Hampshire Business Finance Authority(c),(d) |
| Refunding Revenue Bonds |
| Waste Management, Inc. Project |
| Series 2018 (Mandatory Put 07/01/24) |
Muni Swap Index Yield + 0.375%
10/01/2033 | 3.185% | | 2,000,000 | 1,953,463 |
| Municipal Bonds (continued) |
| Issue Description | Coupon
Rate | | Principal
Amount ($) | Value ($) |
| New Hampshire Business Finance Authority(d) |
| Refunding Revenue Bonds |
| Waste Management, Inc. Project |
| Series 2019 (Mandatory Put 07/01/24) |
| 07/01/2027 | 2.150% | | 1,000,000 | 977,589 |
| Total | 3,478,003 |
| New Jersey 7.3% |
| New Jersey Economic Development Authority(d) |
| Refunding Revenue Bonds |
| American Water Co. |
| Series 2020B (Mandatory Put 06/01/23) |
| 11/01/2034 | 1.200% | | 3,000,000 | 2,992,905 |
| New Jersey-American Water Company, Inc. Project |
| Series 2020 |
| 12/01/2025 | 0.850% | | 2,750,000 | 2,488,771 |
| New Jersey Economic Development Authority |
| Refunding Revenue Bonds |
| Series 2015XX |
| 06/15/2026 | 4.250% | | 2,355,000 | 2,398,549 |
| New Jersey Health Care Facilities Financing Authority |
| Refunding Revenue Bonds |
| Hospital Asset Transformation Program |
| Series 2017 |
| 10/01/2031 | 5.000% | | 2,000,000 | 2,158,617 |
| Hospital Asset Transformation Project |
| Series 2017 |
| 10/01/2026 | 5.000% | | 650,000 | 685,166 |
| RWJ Barnabas Health Obligated Group |
| Series 2019 (Mandatory Put 07/01/25) |
| 07/01/2042 | 5.000% | | 3,370,000 | 3,500,951 |
| New Jersey Higher Education Student Assistance Authority(d) |
| Revenue Bonds |
| Senior Series 2016-1A |
| 12/01/2025 | 5.000% | | 1,000,000 | 1,033,553 |
| 12/01/2026 | 5.000% | | 1,000,000 | 1,032,307 |
| Series 2015-1A |
| 12/01/2027 | 4.000% | | 1,540,000 | 1,536,910 |
| Series 2017-1A |
| 12/01/2024 | 5.000% | | 3,750,000 | 3,820,858 |
| Senior Revenue Bonds |
| Series 2022B |
| 12/01/2024 | 5.000% | | 885,000 | 901,723 |
| New Jersey Higher Education Student Assistance Authority(d),(h) |
| Revenue Bonds |
| Series 2023B |
| 12/01/2028 | 5.000% | | 4,000,000 | 4,298,195 |
| New Jersey Housing & Mortgage Finance Agency(d) |
| Refunding Revenue Bonds |
| Series 2020F (HUD) |
| 04/01/2026 | 1.500% | | 3,000,000 | 2,823,543 |
The accompanying Notes to Financial Statements are an integral part of this statement.
Columbia Short Duration Municipal Bond Fund | Annual Report 2023
| 15 |
Portfolio of Investments (continued)
April 30, 2023
| Municipal Bonds (continued) |
| Issue Description | Coupon
Rate | | Principal
Amount ($) | Value ($) |
| New Jersey Transportation Trust Fund Authority |
| Refunding Revenue Bonds |
| Series 2021A |
| 06/15/2026 | 5.000% | | 250,000 | 263,345 |
| Series 2022AA |
| 06/15/2027 | 5.000% | | 3,185,000 | 3,417,783 |
| Transportation System |
| Series 2018A |
| 12/15/2023 | 5.000% | | 250,000 | 252,158 |
| Revenue Bonds |
| Transportation System |
| Series 2010D |
| 12/15/2023 | 5.000% | | 2,375,000 | 2,395,497 |
| Total | 36,000,831 |
| New Mexico 0.4% |
| City of Farmington |
| Refunding Revenue Bonds |
| Public Service Co. of New Mexico San Juan Project |
| Series 2020 (Mandatory Put 06/01/24) |
| 06/01/2040 | 1.150% | | 2,000,000 | 1,928,748 |
| New York 15.1% |
| City of New York |
| Unlimited General Obligation Refunding Bonds |
| Series 2023C |
| 08/01/2027 | 5.000% | | 6,999,999 | 7,675,357 |
| City of North Tonawanda |
| Limited General Obligation Notes |
| BAN Series 2022 |
| 05/18/2023 | 4.000% | | 4,894,375 | 4,897,010 |
| City of Schenectady |
| Limited General Obligation Notes |
| BAN Series 2022 |
| 05/05/2023 | 3.500% | | 4,985,778 | 4,985,682 |
| Huntington Local Development Corp. |
| Revenue Bonds |
| Fountaingate Garden Project |
| Series 2021 |
| 07/01/2025 | 3.000% | | 75,000 | 72,432 |
| Series 2021B |
| 07/01/2027 | 4.000% | | 2,000,000 | 1,898,138 |
| Long Island Power Authority(c) |
| Refunding Revenue Bonds |
| Series 2018C (Mandatory Put 10/01/23) |
0.7 x 1-month USD LIBOR + 0.750%
05/01/2033 | 4.143% | | 575,000 | 575,270 |
| Municipal Bonds (continued) |
| Issue Description | Coupon
Rate | | Principal
Amount ($) | Value ($) |
| Metropolitan Transportation Authority(c) |
| Refunding Revenue Bonds |
| Transportation |
| Subordinated Series 2021 (AGM) (Mandatory Put 04/01/24) |
0.7 x SOFR + 0.550%
11/01/2032 | 3.773% | | 500,000 | 497,430 |
| Metropolitan Transportation Authority |
| Revenue Bonds |
| Green Bonds |
| Subordinated Series 2019A (Mandatory Put 11/15/24) |
| 11/15/2048 | 5.000% | | 1,000,000 | 1,011,511 |
| New York City Transitional Finance Authority |
| Revenue Bonds |
| Subordinated Series 2018A-2 |
| 11/01/2027 | 5.000% | | 3,235,000 | 3,563,113 |
| New York Liberty Development Corp. |
| Refunding Revenue Bonds |
| Green Bonds - 4 World Trade Center Project |
| Series 2021 |
| 11/15/2031 | 1.900% | | 950,000 | 814,781 |
| New York Transportation Development Corp.(d) |
| Refunding Revenue Bonds |
| American Airlines, Inc. Project |
| Series 2021 |
| 08/01/2026 | 2.250% | | 2,035,000 | 1,902,590 |
| Revenue Bonds |
| LaGuardia Airport Terminal B Redevelopment Project |
| Series 2016 |
| 07/01/2030 | 5.000% | | 1,255,000 | 1,274,019 |
| Terminal 4 John F. Kennedy International Airport Project |
| Series 2022 |
| 12/01/2026 | 5.000% | | 2,500,000 | 2,607,242 |
| Owego Apalachin Central School District |
| Unlimited General Obligation Notes |
| BAN Series 2022 |
| 06/28/2023 | 4.000% | | 3,000,000 | 3,001,351 |
| Port Authority of New York & New Jersey(d) |
| Refunding Revenue Bonds |
| Series 2018-207 |
| 09/15/2029 | 5.000% | | 5,000,000 | 5,378,106 |
| Series 2021-223 |
| 07/15/2026 | 5.000% | | 4,130,000 | 4,330,390 |
| Series 2021-226 |
| 10/15/2027 | 5.000% | | 1,625,000 | 1,740,637 |
| 10/15/2028 | 5.000% | | 1,750,000 | 1,905,659 |
| Revenue Bonds |
| Consolidated One Hundred Eighty Four |
| Series 2014-25A |
| 09/01/2028 | 5.000% | | 1,275,000 | 1,296,420 |
The accompanying Notes to Financial Statements are an integral part of this statement.
| 16 | Columbia Short Duration Municipal Bond Fund | Annual Report 2023 |
Portfolio of Investments (continued)
April 30, 2023
| Municipal Bonds (continued) |
| Issue Description | Coupon
Rate | | Principal
Amount ($) | Value ($) |
| State of New York Mortgage Agency(d) |
| Refunding Revenue Bonds |
| Series 2019-221 |
| 04/01/2024 | 1.800% | | 2,000,000 | 1,962,774 |
| Social Bonds |
| Series 2021-235 |
| 04/01/2026 | 1.050% | | 1,275,000 | 1,189,314 |
| 10/01/2026 | 1.150% | | 1,335,000 | 1,237,715 |
| 04/01/2027 | 1.300% | | 2,705,000 | 2,515,813 |
| Revenue Bonds |
| Social Bonds |
| Series 2021-240 |
| 04/01/2024 | 0.750% | | 1,595,000 | 1,545,583 |
| 10/01/2024 | 0.850% | | 1,970,000 | 1,882,759 |
| 04/01/2025 | 0.950% | | 2,485,000 | 2,339,889 |
| 10/01/2025 | 1.050% | | 1,000,000 | 931,229 |
| 04/01/2026 | 1.200% | | 1,220,000 | 1,126,094 |
| Triborough Bridge & Tunnel Authority(c) |
| Refunding Revenue Bonds |
| MTA Bridges and Tunnels |
| Series 2021 (Mandatory Put 02/01/24) |
0.7 x SOFR + 0.380%
01/01/2032 | 3.603% | | 1,960,000 | 1,943,354 |
| Triborough Bridge & Tunnel Authority |
| Refunding Revenue Bonds |
| MTA Bridges and Tunnels |
| Series 2023 |
| 11/15/2028 | 5.000% | | 5,000,000 | 5,647,052 |
| Village of Endicott |
| Limited General Obligation Notes |
| BAN Series 2022 |
| 08/24/2023 | 3.750% | | 3,000,000 | 2,998,946 |
| Total | 74,747,660 |
| North Carolina 1.4% |
| City of Charlotte Airport(d) |
| Refunding Revenue Bonds |
| Series 2021B |
| 07/01/2025 | 5.000% | | 1,345,000 | 1,390,699 |
| North Carolina Eastern Municipal Power Agency(j) |
| Revenue Bonds |
| Series 1993 (FGIC) |
| 01/01/2025 | 3.100% | | 600,000 | 581,216 |
| North Carolina Housing Finance Agency |
| Revenue Bonds |
| Home Ownership |
| Series 2021-47 (GNMA) |
| 01/01/2028 | 1.050% | | 1,580,000 | 1,405,103 |
| North Carolina Turnpike Authority |
| Refunding Revenue Bonds |
| Senior Lien |
| Series 2017 |
| 01/01/2025 | 5.000% | | 1,500,000 | 1,540,145 |
| Municipal Bonds (continued) |
| Issue Description | Coupon
Rate | | Principal
Amount ($) | Value ($) |
| Series 2018 |
| 01/01/2025 | 5.000% | | 1,110,000 | 1,139,707 |
| North Carolina Turnpike Authority(f) |
| Refunding Revenue Bonds |
| Series 2016C |
| 07/01/2026 | 0.000% | | 780,000 | 682,357 |
| Total | 6,739,227 |
| North Dakota 0.9% |
| North Dakota Housing Finance Agency(d) |
| Refunding Revenue Bonds |
| Social Bonds |
| Series 2021C |
| 01/01/2024 | 0.700% | | 1,800,000 | 1,767,133 |
| 07/01/2024 | 0.800% | | 1,685,000 | 1,634,087 |
| 01/01/2025 | 0.950% | | 975,000 | 936,506 |
| Total | 4,337,726 |
| Ohio 1.7% |
| Ohio Air Quality Development Authority(d) |
| Refunding Revenue Bonds |
| Duke Energy Corp. Project |
| Series 2022 (Mandatory Put 06/01/27) |
| 11/01/2039 | 4.250% | | 2,500,000 | 2,503,732 |
| Ohio Turnpike & Infrastructure Commission |
| Refunding Revenue Bonds |
| Junior Lien - Infrastructure Projects |
| Series 2022 |
| 02/15/2026 | 5.000% | | 1,250,000 | 1,326,139 |
| 02/15/2027 | 5.000% | | 1,000,000 | 1,086,662 |
| Port of Greater Cincinnati Development Authority |
| Revenue Bonds |
| Convention Center Hotel Acquisition and Demolition Project |
| Series 2020A |
| 05/01/2023 | 3.000% | | 1,000,000 | 999,889 |
| State of Ohio |
| Unlimited General Obligation Refunding Bonds |
| Series 2022A |
| 06/15/2028 | 5.000% | | 2,250,000 | 2,526,869 |
| Total | 8,443,291 |
| Oklahoma 1.7% |
| Oklahoma County Independent School District No. 89 Oklahoma City |
| Unlimited General Obligation Bonds |
| Series 2023A |
| 07/01/2027 | 3.000% | | 6,000,000 | 6,037,898 |
| Tulsa Airports Improvement Trust(d) |
| Prerefunded 06/01/24 Revenue Bonds |
| Series 2015A (BAM) |
| 06/01/2035 | 5.000% | | 1,000,000 | 1,014,193 |
| 06/01/2045 | 5.000% | | 1,280,000 | 1,298,166 |
| Total | 8,350,257 |
The accompanying Notes to Financial Statements are an integral part of this statement.
Columbia Short Duration Municipal Bond Fund | Annual Report 2023
| 17 |
Portfolio of Investments (continued)
April 30, 2023
| Municipal Bonds (continued) |
| Issue Description | Coupon
Rate | | Principal
Amount ($) | Value ($) |
| Oregon 0.1% |
| State of Oregon Housing & Community Services Department(i) |
| Revenue Bonds |
| Plaza Los Amigos Apartments Project |
| Series 2022 (Mandatory Put 02/01/25) |
| 02/01/2026 | 3.000% | | 500,000 | 487,552 |
| Pennsylvania 4.3% |
| Allegheny County Airport Authority(d) |
| Revenue Bonds |
| Series 2021A |
| 01/01/2027 | 5.000% | | 1,155,000 | 1,214,120 |
| City of Philadelphia Airport(d) |
| Refunding Revenue Bonds |
| Series 2017B |
| 07/01/2026 | 5.000% | | 3,360,000 | 3,498,083 |
| Geisinger Authority |
| Refunding Revenue Bonds |
| Geisinger Health System Obligated Group |
| Series 2020 (Mandatory Put 02/15/27) |
| 04/01/2043 | 5.000% | | 3,350,000 | 3,516,620 |
| Montgomery County Industrial Development Authority |
| Refunding Revenue Bonds |
| Meadowood Senior Living Project |
| Series 2018 |
| 12/01/2023 | 5.000% | | 320,000 | 321,332 |
| Pennsylvania Economic Development Financing Authority(d) |
| Revenue Bonds |
| Pennsylvania Bridges Finco LP - P3 Project |
| Series 2015 |
| 12/31/2024 | 5.000% | | 2,450,000 | 2,484,967 |
| Pennsylvania Higher Education Assistance Agency(d) |
| Revenue Bonds |
| Series 2021A |
| 06/01/2027 | 5.000% | | 1,315,000 | 1,391,980 |
| Pennsylvania Housing Finance Agency(d) |
| Refunding Revenue Bonds |
| Social Bonds |
| Series 2021-134B |
| 10/01/2025 | 5.000% | | 800,000 | 826,215 |
| Pennsylvania Housing Finance Agency |
| Refunding Revenue Bonds |
| Social Bonds |
| Series 2021-136 |
| 10/01/2027 | 5.000% | | 175,000 | 189,798 |
| Revenue Bonds |
| Series 2019-129 |
| 10/01/2034 | 2.950% | | 1,500,000 | 1,383,067 |
| Series 2020-132A |
| 04/01/2026 | 1.450% | | 1,400,000 | 1,317,586 |
| 10/01/2026 | 1.500% | | 1,500,000 | 1,402,855 |
| Municipal Bonds (continued) |
| Issue Description | Coupon
Rate | | Principal
Amount ($) | Value ($) |
| Pennsylvania Turnpike Commission |
| Refunding Revenue Bonds |
| Series 2022B |
| 12/01/2026 | 5.000% | | 275,000 | 296,847 |
| Redevelopment Authority of the City of Philadelphia(d) |
| Refunding Revenue Bonds |
| Series 2015B |
| 04/15/2027 | 5.000% | | 2,010,000 | 2,077,129 |
| School District of Philadelphia (The) |
| Limited General Obligation Bonds |
| Series 2018A |
| 09/01/2023 | 5.000% | | 450,000 | 452,197 |
| Southeastern Pennsylvania Transportation Authority |
| Revenue Bonds |
| Asset Improvement Program |
| Series 2022 |
| 06/01/2027 | 5.000% | | 1,000,000 | 1,093,180 |
| Total | 21,465,976 |
| Puerto Rico 0.9% |
| Commonwealth of Puerto Rico(g) |
| Unlimited General Obligation Bonds |
| Series 2021-A1 |
| 07/01/2025 | 5.375% | | 4,500,000 | 4,584,680 |
| Rhode Island 1.5% |
| Rhode Island Health and Educational Building Corp. |
| Refunding Revenue Bonds |
| Providence Public Buildings Authority |
| Series 2015 (AGM) |
| 05/15/2024 | 4.000% | | 2,385,000 | 2,402,119 |
| Rhode Island Housing & Mortgage Finance Corp.(d) |
| Refunding Revenue Bonds |
| Homeownership Opportunity |
| Series 2016 |
| 04/01/2026 | 2.600% | | 1,235,000 | 1,206,260 |
| 10/01/2026 | 2.650% | | 1,575,000 | 1,538,195 |
| Rhode Island Student Loan Authority(d) |
| Revenue Bonds |
| Senior Program |
| Series 2019A |
| 12/01/2023 | 5.000% | | 650,000 | 654,683 |
| 12/01/2024 | 5.000% | | 875,000 | 893,559 |
| 12/01/2035 | 2.875% | | 630,000 | 612,617 |
| Total | 7,307,433 |
| South Carolina 1.3% |
| Patriots Energy Group Financing Agency(c) |
| Revenue Bonds |
| Series 2018B (Mandatory Put 02/01/24) |
0.7 x 1-month USD LIBOR + 0.860%
10/01/2048 | 4.107% | | 1,000,000 | 1,001,690 |
The accompanying Notes to Financial Statements are an integral part of this statement.
| 18 | Columbia Short Duration Municipal Bond Fund | Annual Report 2023 |
Portfolio of Investments (continued)
April 30, 2023
| Municipal Bonds (continued) |
| Issue Description | Coupon
Rate | | Principal
Amount ($) | Value ($) |
| South Carolina Jobs-Economic Development Authority(d) |
| Revenue Bonds |
| International Paper Co. Project |
| Series 2023 (Mandatory Put 04/01/26) |
| 03/31/2033 | 4.000% | | 850,000 | 851,135 |
| South Carolina Ports Authority(d) |
| Prerefunded 07/01/25 Revenue Bonds |
| Series 2015 |
| 07/01/2050 | 5.250% | | 3,000,000 | 3,115,542 |
| South Carolina State Housing Finance & Development Authority |
| Revenue Bonds |
| Series 2020A |
| 01/01/2024 | 1.500% | | 985,000 | 970,804 |
| 07/01/2024 | 1.550% | | 510,000 | 498,006 |
| Total | 6,437,177 |
| Texas 2.3% |
| Atascosa County Industrial Development Corp. |
| Refunding Revenue Bonds |
| San Miguel Electric Cooperative, Inc. Project |
| Series 2020 |
| 12/15/2024 | 5.000% | | 550,000 | 560,740 |
| 12/15/2026 | 5.000% | | 625,000 | 658,251 |
| Central Texas Regional Mobility Authority |
| Revenue Bonds |
| Subordinated Series 2021C |
| 01/01/2027 | 5.000% | | 2,000,000 | 2,102,752 |
| City of Houston Airport System(d) |
| Refunding Revenue Bonds |
| Subordinated Series 2018C |
| 07/01/2027 | 5.000% | | 1,890,000 | 2,010,756 |
| Harris County Cultural Education Facilities Finance Corp.(c) |
| Revenue Bonds |
| Natus Medical, Inc. |
| Series 2019 (Mandatory Put 12/04/24) |
Muni Swap Index Yield + 0.570%
12/01/2049 | 3.380% | | 2,000,000 | 1,988,309 |
| Plano Independent School District |
| Unlimited General Obligation Bonds |
| Series 2023 |
| 02/15/2028 | 5.000% | | 1,750,000 | 1,939,246 |
| Port Beaumont Navigation District(d),(e) |
| Revenue Bonds |
| Jefferson Gulf Coast Energy Project |
| Series 2021 |
| 01/01/2026 | 1.875% | | 700,000 | 638,702 |
| Spring Branch Independent School District |
| Unlimited General Obligation Bonds |
| Series 2022 |
| 02/01/2025 | 5.000% | | 1,000,000 | 1,036,257 |
| Municipal Bonds (continued) |
| Issue Description | Coupon
Rate | | Principal
Amount ($) | Value ($) |
| Texas Municipal Gas Acquisition & Supply Corp. III |
| Refunding Revenue Bonds |
| Senior |
| Series 2021 |
| 12/15/2028 | 5.000% | | 500,000 | 520,617 |
| Total | 11,455,630 |
| Vermont 0.7% |
| Vermont Student Assistance Corp.(d) |
| Revenue Bonds |
| Student Loan |
| Senior Series 2018A |
| 06/15/2025 | 5.000% | | 1,010,000 | 1,038,297 |
| 06/15/2026 | 5.000% | | 1,375,000 | 1,435,503 |
| Series 2022A |
| 06/15/2028 | 5.000% | | 985,000 | 1,040,009 |
| Total | 3,513,809 |
| Virginia 1.0% |
| Amelia County Industrial Development Authority(d) |
| Refunding Revenue Bonds |
| Waste Management, Inc. Project |
| Series 2021 |
| 04/01/2027 | 1.450% | | 1,750,000 | 1,572,655 |
| Arlington County Industrial Development Authority |
| Refunding Revenue Bonds |
| Virginia Hospital Center |
| Series 2020 |
| 07/01/2023 | 5.000% | | 740,000 | 741,548 |
| Henrico County Economic Development Authority |
| Refunding Revenue Bonds |
| Westminster-Canterbury Project |
| Series 2018 |
| 10/01/2023 | 5.000% | | 575,000 | 574,873 |
| Henrico County Economic Development Authority(j) |
| Revenue Bonds |
| Registered Savrs |
| Series 1992 Escrowed to Maturity (AGM) |
| 08/23/2027 | 8.503% | | 900,000 | 886,500 |
| Virginia Small Business Financing Authority |
| Refunding Revenue Bonds |
| LifeSpire of Virginia |
| Series 2021 |
| 12/01/2024 | 3.000% | | 220,000 | 213,873 |
| 12/01/2025 | 3.000% | | 230,000 | 219,521 |
| 12/01/2026 | 3.000% | | 235,000 | 220,126 |
| National Senior Campuses |
| Series 2020 |
| 01/01/2024 | 5.000% | | 500,000 | 502,741 |
| Total | 4,931,837 |
The accompanying Notes to Financial Statements are an integral part of this statement.
Columbia Short Duration Municipal Bond Fund | Annual Report 2023
| 19 |
Portfolio of Investments (continued)
April 30, 2023
| Municipal Bonds (continued) |
| Issue Description | Coupon
Rate | | Principal
Amount ($) | Value ($) |
| Washington 0.8% |
| Chelan County Public Utility District No. 1(d) |
| Refunding Revenue Bonds |
| Series 2020C |
| 07/01/2025 | 5.000% | | 1,170,000 | 1,215,962 |
| Douglas County Public Utility District No. 1 Wells Hydroelectric Project(d) |
| Refunding Revenue Bonds |
| Series 2015A |
| 09/01/2027 | 5.000% | | 830,000 | 857,553 |
| Port of Seattle(d) |
| Revenue Bonds |
| Series 2018A |
| 05/01/2028 | 5.000% | | 1,715,000 | 1,822,313 |
| Total | 3,895,828 |
| West Virginia 0.2% |
| West Virginia Economic Development Authority |
| Refunding Revenue Bonds |
| Appalachian Power Co. Amos Project |
| Series 2019 (Mandatory Put 04/01/24) |
| 03/01/2040 | 2.550% | | 1,000,000 | 982,697 |
| Wisconsin 3.2% |
| City of Milwaukee |
| Unlimited General Obligation Refunding Bonds |
| Promissory Notes |
| Series 2020N-4 |
| 04/01/2024 | 5.000% | | 1,500,000 | 1,519,052 |
| County of Milwaukee Airport(d) |
| Refunding Revenue Bonds |
| Series 2014A |
| 12/01/2027 | 5.000% | | 1,975,000 | 1,987,748 |
| Public Finance Authority(d) |
| Refunding Revenue Bonds |
| Waste Management, Inc. Project |
| Series 2016 |
| 05/01/2027 | 2.875% | | 5,350,000 | 5,084,063 |
| State of Wisconsin |
| Unlimited General Obligation Refunding Bonds |
| Series 2022-4 |
| 05/01/2026 | 5.000% | | 1,230,000 | 1,314,462 |
| Wisconsin Department of Transportation |
| Refunding Revenue Bonds |
| Series 2017-1 |
| 07/01/2028 | 5.000% | | 1,185,000 | 1,302,595 |
| Wisconsin Health & Educational Facilities Authority |
| Refunding Revenue Bonds |
| Marshfield Clinic Health System, Inc. |
| Series 2020 (Mandatory Put 02/15/25) |
| 02/15/2052 | 5.000% | | 3,500,000 | 3,546,163 |
| Municipal Bonds (continued) |
| Issue Description | Coupon
Rate | | Principal
Amount ($) | Value ($) |
| Revenue Bonds |
| Aspirus, Inc. Obligation Group |
| Series 2017 |
| 08/15/2023 | 5.000% | | 205,000 | 205,918 |
| Wisconsin Housing & Economic Development Authority |
| Revenue Bonds |
| Social Bonds |
| Series 2021C (GNMA) |
| 03/01/2025 | 0.700% | | 425,000 | 403,855 |
| 03/01/2028 | 1.400% | | 700,000 | 632,573 |
| Total | 15,996,429 |
| Wyoming 0.2% |
| Wyoming Community Development Authority(d) |
| Refunding Revenue Bonds |
| Series 2020-3 |
| 06/01/2023 | 5.000% | | 955,000 | 956,652 |
Total Municipal Bonds
(Cost $479,757,522) | 466,599,700 |
|
| Municipal Short Term 3.5% |
| Issue Description | Yield | | Principal
Amount ($) | Value ($) |
| Massachusetts 1.4% |
| Metrowest Regional Transit Authority |
| Revenue Notes |
| Series 2022 |
| 09/15/2023 | 3.870% | | 3,000,000 | 2,997,650 |
| Montachusett Regional Transit Authority |
| Revenue Notes |
| Regional Transit Authority |
| Series 2022 |
| 07/28/2023 | 3.980% | | 4,000,000 | 3,999,006 |
| Total | 6,996,656 |
| New York 1.8% |
| Board of Cooperative Educational Services for the Sole Supervisory District |
| Revenue Notes |
| RAN Series 2022 |
| 06/29/2023 | 3.460% | | 4,000,000 | 4,002,872 |
| Greater Southern Tier Board of Cooperative Educational Services District |
| Revenue Notes |
| RAN Series 2022 |
| 06/30/2023 | 4.260% | | 5,000,000 | 4,996,884 |
| Total | 8,999,756 |
The accompanying Notes to Financial Statements are an integral part of this statement.
| 20 | Columbia Short Duration Municipal Bond Fund | Annual Report 2023 |
Portfolio of Investments (continued)
April 30, 2023
| Municipal Short Term (continued) |
| Issue Description | Yield | | Principal
Amount ($) | Value ($) |
| Texas 0.3% |
| Mission Economic Development Corp.(d) |
| Refunding Revenue Bonds |
| Republic Services, Inc. Project |
| Series 2019 (Mandatory Put 05/01/23) |
| 01/01/2026 | 3.500% | | 1,350,000 | 1,350,000 |
Total Municipal Short Term
(Cost $17,383,463) | 17,346,412 |
| Money Market Funds 0.1% |
| | Shares | Value ($) |
| Dreyfus Tax Exempt Cash Management Fund, Institutional Shares, 3.321%(k) | 89,515 | 89,506 |
| JPMorgan Institutional Tax Free Money Market Fund, Institutional Shares, 3.136%(k) | 305,724 | 305,724 |
Total Money Market Funds
(Cost $395,230) | 395,230 |
Total Investments in Securities
(Cost $511,536,215) | 498,341,342 |
| Other Assets & Liabilities, Net | | (3,913,916) |
| Net Assets | $494,427,426 |
Notes to Portfolio of Investments
| (a) | The Fund is entitled to receive principal and interest from the guarantor after a day or a week’s notice or upon maturity. The maturity date disclosed represents the final maturity. |
| (b) | Represents a variable rate security where the coupon rate adjusts on specified dates (generally daily or weekly) using the prevailing money market rate. The interest rate shown was the current rate as of April 30, 2023. |
| (c) | Variable rate security. The interest rate shown was the current rate as of April 30, 2023. |
| (d) | Income from this security may be subject to alternative minimum tax. |
| (e) | Represents privately placed and other securities and instruments exempt from Securities and Exchange Commission registration (collectively, private placements), such as Section 4(a)(2) and Rule 144A eligible securities, which are often sold only to qualified institutional buyers. At April 30, 2023, the total value of these securities amounted to $6,079,088, which represents 1.23% of total net assets. |
| (f) | Zero coupon bond. |
| (g) | Municipal obligations include debt obligations issued by or on behalf of territories, possessions, or sovereign nations within the territorial boundaries of the United States. At April 30, 2023, the total value of these securities amounted to $7,026,419, which represents 1.42% of total net assets. |
| (h) | Represents a security purchased on a when-issued basis. |
| (i) | Represents a variable rate security with a step coupon where the rate adjusts according to a schedule for a series of periods, typically lower for an initial period and then increasing to a higher coupon rate thereafter. The interest rate shown was the current rate as of April 30, 2023. |
| (j) | Represents a variable rate security where the coupon adjusts periodically through an auction process. |
| (k) | The rate shown is the seven-day current annualized yield at April 30, 2023. |
Abbreviation Legend
| AGM | Assured Guaranty Municipal Corporation |
| AMBAC | Ambac Assurance Corporation |
| BAM | Build America Mutual Assurance Co. |
| BAN | Bond Anticipation Note |
| FGIC | Financial Guaranty Insurance Corporation |
| FHA | Federal Housing Authority |
The accompanying Notes to Financial Statements are an integral part of this statement.
Columbia Short Duration Municipal Bond Fund | Annual Report 2023
| 21 |
Portfolio of Investments (continued)
April 30, 2023
Abbreviation Legend (continued)
| GNMA | Government National Mortgage Association |
| HUD | U.S. Department of Housing and Urban Development |
| LIBOR | London Interbank Offered Rate |
| RAN | Revenue Anticipation Note |
| SOFR | Secured Overnight Financing Rate |
Fair value measurements
The Fund categorizes its fair value measurements according to a three-level hierarchy that maximizes the use of observable inputs and minimizes the use of unobservable inputs by prioritizing that the most observable input be used when available. Observable inputs are those that market participants would use in pricing an investment based on market data obtained from sources independent of the reporting entity. Unobservable inputs are those that reflect the Fund’s assumptions about the information market participants would use in pricing an investment. An investment’s level within the fair value hierarchy is based on the lowest level of any input that is deemed significant to the asset’s or liability’s fair value measurement. The input levels are not necessarily an indication of the risk or liquidity associated with investments at that level. For example, certain U.S. government securities are generally high quality and liquid, however, they are reflected as Level 2 because the inputs used to determine fair value may not always be quoted prices in an active market.
Fair value inputs are summarized in the three broad levels listed below:
| ■ | Level 1 — Valuations based on quoted prices for investments in active markets that the Fund has the ability to access at the measurement date. Valuation adjustments are not applied to Level 1 investments. |
| ■ | Level 2 — Valuations based on other significant observable inputs (including quoted prices for similar securities, interest rates, prepayment speeds, credit risks, etc.). |
| ■ | Level 3 — Valuations based on significant unobservable inputs (including the Fund’s own assumptions and judgment in determining the fair value of investments). |
Inputs that are used in determining fair value of an investment may include price information, credit data, volatility statistics, and other factors. These inputs can be either observable or unobservable. The availability of observable inputs can vary between investments, and is affected by various factors such as the type of investment, and the volume and level of activity for that investment or similar investments in the marketplace. The inputs will be considered by the Investment Manager, along with any other relevant factors in the calculation of an investment’s fair value. The Fund uses prices and inputs that are current as of the measurement date, which may include periods of market dislocations. During these periods, the availability of prices and inputs may be reduced for many investments. This condition could cause an investment to be reclassified between the various levels within the hierarchy.
Investments falling into the Level 3 category are primarily supported by quoted prices from brokers and dealers participating in the market for those investments. However, these may be classified as Level 3 investments due to lack of market transparency and corroboration to support these quoted prices. Additionally, valuation models may be used as the pricing source for any remaining investments classified as Level 3. These models may rely on one or more significant unobservable inputs and/or significant assumptions by the Investment Manager. Inputs used in valuations may include, but are not limited to, financial statement analysis, capital account balances, discount rates and estimated cash flows, and comparable company data.
The Fund’s Board of Trustees (the Board) has designated the Investment Manager, through its Valuation Committee (the Committee), as valuation designee, responsible for determining the fair value of the assets of the Fund for which market quotations are not readily available using valuation procedures approved by the Board. The Committee consists of voting and non-voting members from various groups within the Investment Manager’s organization, including operations and accounting, trading and investments, compliance, risk management and legal.
The Committee meets at least monthly to review and approve valuation matters, which may include a description of specific valuation determinations, data regarding pricing information received from approved pricing vendors and brokers and the results of Board-approved valuation policies and procedures (the Policies). The Policies address, among other things, instances when market quotations are or are not readily available, including recommendations of third party pricing vendors and a determination of appropriate pricing methodologies; events that require specific valuation determinations and assessment of fair value techniques; securities with a potential for stale pricing, including those that are illiquid, restricted, or in default; and the effectiveness of third party pricing vendors, including periodic reviews of vendors. The Committee meets more frequently, as needed, to discuss additional valuation matters, which may include the need to review back-testing results, review time-sensitive information or approve related valuation actions. Representatives of Columbia Management Investment Advisers, LLC report to the Board at each of its regularly scheduled meetings to discuss valuation matters and actions during the period, similar to those described earlier.
The following table is a summary of the inputs used to value the Fund’s investments at April 30, 2023:
| | Level 1 ($) | Level 2 ($) | Level 3 ($) | Total ($) |
| Investments in Securities | | | | |
| Floating Rate Notes | — | 14,000,000 | — | 14,000,000 |
| Municipal Bonds | — | 466,599,700 | — | 466,599,700 |
| Municipal Short Term | — | 17,346,412 | — | 17,346,412 |
| Money Market Funds | 395,230 | — | — | 395,230 |
| Total Investments in Securities | 395,230 | 497,946,112 | — | 498,341,342 |
See the Portfolio of Investments for all investment classifications not indicated in the table.
The Fund’s assets assigned to the Level 2 input category are generally valued using the market approach, in which a security’s value is determined through reference to prices and information from market transactions for similar or identical assets.
The accompanying Notes to Financial Statements are an integral part of this statement.
| 22 | Columbia Short Duration Municipal Bond Fund | Annual Report 2023 |
Statement of Assets and Liabilities
April 30, 2023
| Assets | |
| Investments in securities, at value | |
| Unaffiliated issuers (cost $511,536,215) | $498,341,342 |
| Cash | 6,684 |
| Receivable for: | |
| Capital shares sold | 564,804 |
| Interest | 5,808,387 |
| Expense reimbursement due from Investment Manager | 2,640 |
| Prepaid expenses | 7,409 |
| Total assets | 504,731,266 |
| Liabilities | |
| Payable for: | |
| Investments purchased on a delayed delivery basis | 8,505,710 |
| Capital shares purchased | 670,158 |
| Distributions to shareholders | 886,479 |
| Management services fees | 5,831 |
| Distribution and/or service fees | 542 |
| Transfer agent fees | 28,543 |
| Compensation of board members | 170,459 |
| Other expenses | 36,118 |
| Total liabilities | 10,303,840 |
| Net assets applicable to outstanding capital stock | $494,427,426 |
| Represented by | |
| Paid in capital | 523,390,651 |
| Total distributable earnings (loss) | (28,963,225) |
| Total - representing net assets applicable to outstanding capital stock | $494,427,426 |
| Class A | |
| Net assets | $70,963,473 |
| Shares outstanding | 7,074,178 |
| Net asset value per share | $10.03 |
| Maximum sales charge | 1.00% |
| Maximum offering price per share (calculated by dividing the net asset value per share by 1.0 minus the maximum sales charge for Class A shares) | $10.13 |
| Advisor Class | |
| Net assets | $53,125,240 |
| Shares outstanding | 5,290,881 |
| Net asset value per share | $10.04 |
| Class C | |
| Net assets | $2,043,886 |
| Shares outstanding | 204,157 |
| Net asset value per share | $10.01 |
| Institutional Class | |
| Net assets | $94,875,386 |
| Shares outstanding | 9,456,770 |
| Net asset value per share | $10.03 |
| Institutional 2 Class | |
| Net assets | $62,469,562 |
| Shares outstanding | 6,231,246 |
| Net asset value per share | $10.03 |
| Institutional 3 Class | |
| Net assets | $210,949,879 |
| Shares outstanding | 21,038,974 |
| Net asset value per share | $10.03 |
The accompanying Notes to Financial Statements are an integral part of this statement.
Columbia Short Duration Municipal Bond Fund | Annual Report 2023
| 23 |
Statement of Operations
Year Ended April 30, 2023
| Net investment income | |
| Income: | |
| Dividends — unaffiliated issuers | $214,608 |
| Interest | 13,197,452 |
| Total income | 13,412,060 |
| Expenses: | |
| Management services fees | 2,827,960 |
| Distribution and/or service fees | |
| Class A | 186,732 |
| Class C | 21,047 |
| Transfer agent fees | |
| Class A | 80,959 |
| Advisor Class | 75,130 |
| Class C | 2,281 |
| Institutional Class | 116,422 |
| Institutional 2 Class | 56,635 |
| Institutional 3 Class | 20,115 |
| Compensation of board members | 11,959 |
| Custodian fees | 18,753 |
| Printing and postage fees | 34,674 |
| Registration fees | 118,009 |
| Accounting services fees | 44,790 |
| Legal fees | 21,589 |
| Interest on interfund lending | 11,496 |
| Compensation of chief compliance officer | 120 |
| Other | 21,327 |
| Total expenses | 3,669,998 |
| Fees waived or expenses reimbursed by Investment Manager and its affiliates | (1,132,996) |
| Fees waived by transfer agent | |
| Institutional 2 Class | (953) |
| Institutional 3 Class | (20,115) |
| Expense reduction | (40) |
| Total net expenses | 2,515,894 |
| Net investment income | 10,896,166 |
| Realized and unrealized gain (loss) — net | |
| Net realized gain (loss) on: | |
| Investments — unaffiliated issuers | (11,141,013) |
| Futures contracts | 1,383,534 |
| Net realized loss | (9,757,479) |
| Net change in unrealized appreciation (depreciation) on: | |
| Investments — unaffiliated issuers | 11,539,674 |
| Futures contracts | (539,694) |
| Net change in unrealized appreciation (depreciation) | 10,999,980 |
| Net realized and unrealized gain | 1,242,501 |
| Net increase in net assets resulting from operations | $12,138,667 |
The accompanying Notes to Financial Statements are an integral part of this statement.
| 24 | Columbia Short Duration Municipal Bond Fund | Annual Report 2023 |
Statement of Changes in Net Assets
| | Year Ended
April 30, 2023 | Year Ended
April 30, 2022 |
| Operations | | |
| Net investment income | $10,896,166 | $7,112,067 |
| Net realized loss | (9,757,479) | (408,776) |
| Net change in unrealized appreciation (depreciation) | 10,999,980 | (35,630,751) |
| Net increase (decrease) in net assets resulting from operations | 12,138,667 | (28,927,460) |
| Distributions to shareholders | | |
| Net investment income and net realized gains | | |
| Class A | (1,082,213) | (487,335) |
| Advisor Class | (1,166,399) | (376,044) |
| Class C | (15,490) | (295) |
| Institutional Class | (1,802,650) | (939,542) |
| Institutional 2 Class | (1,919,571) | (1,125,097) |
| Institutional 3 Class | (5,127,128) | (4,250,161) |
| Total distributions to shareholders | (11,113,451) | (7,178,474) |
| Increase (decrease) in net assets from capital stock activity | (279,514,603) | 103,384,218 |
| Total increase (decrease) in net assets | (278,489,387) | 67,278,284 |
| Net assets at beginning of year | 772,916,813 | 705,638,529 |
| Net assets at end of year | $494,427,426 | $772,916,813 |
The accompanying Notes to Financial Statements are an integral part of this statement.
Columbia Short Duration Municipal Bond Fund | Annual Report 2023
| 25 |
Statement of Changes in Net Assets (continued)
| | Year Ended | Year Ended |
| | April 30, 2023 | April 30, 2022 |
| | Shares | Dollars ($) | Shares | Dollars ($) |
| Capital stock activity |
| Class A | | | | |
| Subscriptions | 4,585,621 | 45,834,971 | 4,360,164 | 45,064,367 |
| Fund reorganization | — | — | 329,765 | 3,440,076 |
| Distributions reinvested | 96,989 | 970,581 | 41,180 | 425,903 |
| Redemptions | (5,500,323) | (55,086,454) | (3,750,812) | (38,771,216) |
| Net increase (decrease) | (817,713) | (8,280,902) | 980,297 | 10,159,130 |
| Advisor Class | | | | |
| Subscriptions | 2,469,079 | 24,718,526 | 1,941,396 | 20,106,687 |
| Fund reorganization | — | — | 9,031,436 | 94,310,363 |
| Distributions reinvested | 37,417 | 374,803 | 14,451 | 148,451 |
| Redemptions | (4,874,214) | (48,813,606) | (3,509,949) | (35,966,043) |
| Net increase (decrease) | (2,367,718) | (23,720,277) | 7,477,334 | 78,599,458 |
| Class C | | | | |
| Subscriptions | 176,278 | 1,758,839 | 50,002 | 515,694 |
| Distributions reinvested | 1,550 | 15,472 | 28 | 291 |
| Redemptions | (134,605) | (1,349,669) | (58,838) | (606,710) |
| Net increase (decrease) | 43,223 | 424,642 | (8,808) | (90,725) |
| Institutional Class | | | | |
| Subscriptions | 8,779,942 | 88,100,889 | 6,967,017 | 71,906,809 |
| Distributions reinvested | 158,885 | 1,590,760 | 80,211 | 829,511 |
| Redemptions | (10,229,746) | (102,553,635) | (5,353,606) | (54,974,865) |
| Net increase (decrease) | (1,290,919) | (12,861,986) | 1,693,622 | 17,761,455 |
| Institutional 2 Class | | | | |
| Subscriptions | 3,513,896 | 35,210,315 | 7,090,797 | 73,918,172 |
| Distributions reinvested | 167,520 | 1,674,858 | 92,765 | 958,128 |
| Redemptions | (10,211,677) | (102,561,819) | (2,655,624) | (27,372,308) |
| Net increase (decrease) | (6,530,261) | (65,676,646) | 4,527,938 | 47,503,992 |
| Institutional 3 Class | | | | |
| Subscriptions | 1,365,780 | 13,631,656 | 5,335,308 | 55,479,193 |
| Distributions reinvested | 13,572 | 135,824 | 6,526 | 67,287 |
| Redemptions | (18,325,146) | (183,166,914) | (10,258,937) | (106,095,572) |
| Net decrease | (16,945,794) | (169,399,434) | (4,917,103) | (50,549,092) |
| Total net increase (decrease) | (27,909,182) | (279,514,603) | 9,753,280 | 103,384,218 |
The accompanying Notes to Financial Statements are an integral part of this statement.
| 26 | Columbia Short Duration Municipal Bond Fund | Annual Report 2023 |
[THIS PAGE INTENTIONALLY LEFT BLANK]
Columbia Short Duration Municipal Bond Fund | Annual Report 2023
| 27 |
The following table is intended to help you understand the Fund’s financial performance. Certain information reflects financial results for a single share of a class held for the periods shown. Per share net investment income (loss) amounts are calculated based on average shares outstanding during the period. Total return assumes reinvestment of all dividends and distributions, if any. Total return does not reflect payment of sales charges, if any. Total return and portfolio turnover are not annualized for periods of less than one year. The ratios of expenses and net investment income are annualized for periods of less than one year. The portfolio turnover rate is calculated without regard to purchase and sales transactions of short-term instruments and certain derivatives, if any. If such transactions were included, the Fund’s portfolio turnover rate may be higher.
| | Net asset value,
beginning of
period | Net
investment
income
(loss) | Net
realized
and
unrealized
gain (loss) | Total from
investment
operations | Distributions
from net
investment
income | Total
distributions to
shareholders |
| Class A |
| Year Ended 4/30/2023 | $10.01 | 0.14 | 0.03 | 0.17 | (0.15) | (0.15) |
| Year Ended 4/30/2022 | $10.46 | 0.07 | (0.45) | (0.38) | (0.07) | (0.07) |
| Year Ended 4/30/2021 | $10.26 | 0.11 | 0.20 | 0.31 | (0.11) | (0.11) |
| Year Ended 4/30/2020 | $10.35 | 0.15 | (0.08) | 0.07 | (0.16) | (0.16) |
| Year Ended 4/30/2019 | $10.26 | 0.15 | 0.09 | 0.24 | (0.15) | (0.15) |
| Advisor Class |
| Year Ended 4/30/2023 | $10.02 | 0.16 | 0.03 | 0.19 | (0.17) | (0.17) |
| Year Ended 4/30/2022 | $10.48 | 0.10 | (0.47) | (0.37) | (0.09) | (0.09) |
| Year Ended 4/30/2021 | $10.27 | 0.13 | 0.21 | 0.34 | (0.13) | (0.13) |
| Year Ended 4/30/2020 | $10.36 | 0.18 | (0.09) | 0.09 | (0.18) | (0.18) |
| Year Ended 4/30/2019 | $10.27 | 0.18 | 0.09 | 0.27 | (0.18) | (0.18) |
| Class C |
| Year Ended 4/30/2023 | $9.99 | 0.07 | 0.02 | 0.09 | (0.07) | (0.07) |
| Year Ended 4/30/2022 | $10.46 | (0.01) | (0.46) | (0.47) | (0.00)(e) | (0.00)(e) |
| Year Ended 4/30/2021 | $10.25 | 0.03 | 0.21 | 0.24 | (0.03) | (0.03) |
| Year Ended 4/30/2020 | $10.34 | 0.08 | (0.09) | (0.01) | (0.08) | (0.08) |
| Year Ended 4/30/2019 | $10.25 | 0.07 | 0.10 | 0.17 | (0.08) | (0.08) |
| Institutional Class |
| Year Ended 4/30/2023 | $10.01 | 0.16 | 0.03 | 0.19 | (0.17) | (0.17) |
| Year Ended 4/30/2022 | $10.46 | 0.09 | (0.45) | (0.36) | (0.09) | (0.09) |
| Year Ended 4/30/2021 | $10.26 | 0.13 | 0.20 | 0.33 | (0.13) | (0.13) |
| Year Ended 4/30/2020 | $10.35 | 0.18 | (0.09) | 0.09 | (0.18) | (0.18) |
| Year Ended 4/30/2019 | $10.26 | 0.18 | 0.09 | 0.27 | (0.18) | (0.18) |
| Institutional 2 Class |
| Year Ended 4/30/2023 | $10.01 | 0.17 | 0.03 | 0.20 | (0.18) | (0.18) |
| Year Ended 4/30/2022 | $10.46 | 0.09 | (0.44) | (0.35) | (0.10) | (0.10) |
| Year Ended 4/30/2021 | $10.25 | 0.14 | 0.21 | 0.35 | (0.14) | (0.14) |
| Year Ended 4/30/2020 | $10.35 | 0.18 | (0.09) | 0.09 | (0.19) | (0.19) |
| Year Ended 4/30/2019 | $10.26 | 0.18 | 0.09 | 0.27 | (0.18) | (0.18) |
The accompanying Notes to Financial Statements are an integral part of this statement.
| 28 | Columbia Short Duration Municipal Bond Fund | Annual Report 2023 |
Financial Highlights (continued)
| | Net
asset
value,
end of
period | Total
return | Total gross
expense
ratio to
average
net assets(a) | Total net
expense
ratio to
average
net assets(a),(b) | Net investment
income (loss)
ratio to
average
net assets | Portfolio
turnover | Net
assets,
end of
period
(000’s) |
| Class A |
| Year Ended 4/30/2023 | $10.03 | 1.67% | 0.83%(c) | 0.65%(c),(d) | 1.41% | 48% | $70,963 |
| Year Ended 4/30/2022 | $10.01 | (3.68%) | 0.81% | 0.66%(d) | 0.63% | 69% | $79,026 |
| Year Ended 4/30/2021 | $10.46 | 2.99% | 0.81% | 0.66%(d) | 1.02% | 46% | $72,327 |
| Year Ended 4/30/2020 | $10.26 | 0.63% | 0.80%(c) | 0.66%(c),(d) | 1.48% | 58% | $61,987 |
| Year Ended 4/30/2019 | $10.35 | 2.39% | 0.81% | 0.66%(d) | 1.44% | 55% | $68,355 |
| Advisor Class |
| Year Ended 4/30/2023 | $10.04 | 1.92% | 0.58%(c) | 0.40%(c),(d) | 1.65% | 48% | $53,125 |
| Year Ended 4/30/2022 | $10.02 | (3.53%) | 0.57% | 0.41%(d) | 0.93% | 69% | $76,764 |
| Year Ended 4/30/2021 | $10.48 | 3.34% | 0.56% | 0.41%(d) | 1.26% | 46% | $1,899 |
| Year Ended 4/30/2020 | $10.27 | 0.89% | 0.55%(c) | 0.41%(c),(d) | 1.72% | 58% | $1,701 |
| Year Ended 4/30/2019 | $10.36 | 2.64% | 0.56% | 0.41%(d) | 1.74% | 55% | $2,027 |
| Class C |
| Year Ended 4/30/2023 | $10.01 | 0.91% | 1.59%(c) | 1.40%(c),(d) | 0.70% | 48% | $2,044 |
| Year Ended 4/30/2022 | $9.99 | (4.48%) | 1.56% | 1.41%(d) | (0.11%) | 69% | $1,608 |
| Year Ended 4/30/2021 | $10.46 | 2.32% | 1.56% | 1.41%(d) | 0.30% | 46% | $1,775 |
| Year Ended 4/30/2020 | $10.25 | (0.12%) | 1.55%(c) | 1.41%(c),(d) | 0.74% | 58% | $3,464 |
| Year Ended 4/30/2019 | $10.34 | 1.62% | 1.55% | 1.41%(d) | 0.69% | 55% | $6,322 |
| Institutional Class |
| Year Ended 4/30/2023 | $10.03 | 1.92% | 0.58%(c) | 0.40%(c),(d) | 1.64% | 48% | $94,875 |
| Year Ended 4/30/2022 | $10.01 | (3.44%) | 0.56% | 0.41%(d) | 0.88% | 69% | $107,620 |
| Year Ended 4/30/2021 | $10.46 | 3.25% | 0.56% | 0.41%(d) | 1.27% | 46% | $94,743 |
| Year Ended 4/30/2020 | $10.26 | 0.89% | 0.55%(c) | 0.41%(c),(d) | 1.72% | 58% | $86,870 |
| Year Ended 4/30/2019 | $10.35 | 2.64% | 0.56% | 0.41%(d) | 1.70% | 55% | $104,300 |
| Institutional 2 Class |
| Year Ended 4/30/2023 | $10.03 | 1.97% | 0.52%(c) | 0.35%(c) | 1.69% | 48% | $62,470 |
| Year Ended 4/30/2022 | $10.01 | (3.40%) | 0.51% | 0.37% | 0.92% | 69% | $127,702 |
| Year Ended 4/30/2021 | $10.46 | 3.39% | 0.53% | 0.37% | 1.31% | 46% | $86,120 |
| Year Ended 4/30/2020 | $10.25 | 0.83% | 0.51%(c) | 0.37%(c) | 1.77% | 58% | $71,372 |
| Year Ended 4/30/2019 | $10.35 | 2.69% | 0.51% | 0.36% | 1.76% | 55% | $27,329 |
The accompanying Notes to Financial Statements are an integral part of this statement.
Columbia Short Duration Municipal Bond Fund | Annual Report 2023
| 29 |
Financial Highlights (continued)
| | Net asset value,
beginning of
period | Net
investment
income
(loss) | Net
realized
and
unrealized
gain (loss) | Total from
investment
operations | Distributions
from net
investment
income | Total
distributions to
shareholders |
| Institutional 3 Class |
| Year Ended 4/30/2023 | $10.01 | 0.17 | 0.03 | 0.20 | (0.18) | (0.18) |
| Year Ended 4/30/2022 | $10.46 | 0.10 | (0.45) | (0.35) | (0.10) | (0.10) |
| Year Ended 4/30/2021 | $10.25 | 0.14 | 0.21 | 0.35 | (0.14) | (0.14) |
| Year Ended 4/30/2020 | $10.35 | 0.19 | (0.10) | 0.09 | (0.19) | (0.19) |
| Year Ended 4/30/2019 | $10.25 | 0.18 | 0.11 | 0.29 | (0.19) | (0.19) |
| Notes to Financial Highlights |
| (a) | In addition to the fees and expenses that the Fund bears directly, the Fund indirectly bears a pro rata share of the fees and expenses of any other funds in which it invests. Such indirect expenses are not included in the Fund’s reported expense ratios. |
| (b) | Total net expenses include the impact of certain fee waivers/expense reimbursements made by the Investment Manager and certain of its affiliates, if applicable. |
| (c) | Ratios include interfund lending expense which is less than 0.01%. |
| (d) | The benefits derived from expense reductions had an impact of less than 0.01%. |
| (e) | Rounds to zero. |
The accompanying Notes to Financial Statements are an integral part of this statement.
| 30 | Columbia Short Duration Municipal Bond Fund | Annual Report 2023 |
Financial Highlights (continued)
| | Net
asset
value,
end of
period | Total
return | Total gross
expense
ratio to
average
net assets(a) | Total net
expense
ratio to
average
net assets(a),(b) | Net investment
income (loss)
ratio to
average
net assets | Portfolio
turnover | Net
assets,
end of
period
(000’s) |
| Institutional 3 Class |
| Year Ended 4/30/2023 | $10.03 | 2.02% | 0.48%(c) | 0.30%(c) | 1.71% | 48% | $210,950 |
| Year Ended 4/30/2022 | $10.01 | (3.36%) | 0.47% | 0.32% | 0.97% | 69% | $380,197 |
| Year Ended 4/30/2021 | $10.46 | 3.44% | 0.48% | 0.32% | 1.37% | 46% | $448,774 |
| Year Ended 4/30/2020 | $10.25 | 0.88% | 0.46%(c) | 0.32%(c) | 1.82% | 58% | $511,085 |
| Year Ended 4/30/2019 | $10.35 | 2.84% | 0.46% | 0.32% | 1.78% | 55% | $670,432 |
The accompanying Notes to Financial Statements are an integral part of this statement.
Columbia Short Duration Municipal Bond Fund | Annual Report 2023
| 31 |
Notes to Financial Statements
April 30, 2023
Note 1. Organization
Columbia Short Duration Municipal Bond Fund (formerly known as Columbia Short Term Municipal Bond Fund) (the Fund), a series of Columbia Funds Series Trust (the Trust), is a diversified fund. The Trust is registered under the Investment Company Act of 1940, as amended (the 1940 Act), as an open-end management investment company organized as a Delaware statutory trust.
Effective September 1, 2022, Columbia Short Term Municipal Bond Fund was renamed Columbia Short Duration Municipal Bond Fund.
Fund shares
The Trust may issue an unlimited number of shares (without par value). The Fund offers each of the share classes listed in the Statement of Assets and Liabilities. Although all share classes generally have identical voting, dividend and liquidation rights, each share class votes separately when required by the Trust’s organizational documents or by law. Each share class has its own expense and sales charge structure. Different share classes may have different minimum initial investment amounts and pay different net investment income distribution amounts to the extent the expenses of distributing such share classes vary. Distributions to shareholders in a liquidation will be proportional to the net asset value of each share class.
As described in the Fund’s prospectus, Class A and Class C shares are offered to the general public for investment. Class C shares automatically convert to Class A shares after 8 years. Advisor Class, Institutional Class, Institutional 2 Class and Institutional 3 Class shares are available for purchase through authorized investment professionals to omnibus retirement plans or to institutional investors and to certain other investors as also described in the Fund’s prospectus.
Note 2. Summary of significant accounting policies
Basis of preparation
The Fund is an investment company that applies the accounting and reporting guidance in the Financial Accounting Standards Board (FASB) Accounting Standards Codification Topic 946, Financial Services - Investment Companies (ASC 946). The financial statements are prepared in accordance with U.S. generally accepted accounting principles (GAAP), which requires management to make certain estimates and assumptions that affect the reported amounts of assets and liabilities, the disclosure of contingent assets and liabilities at the date of the financial statements and the reported amounts of income and expenses during the reporting period. Actual results could differ from those estimates.
The following is a summary of significant accounting policies followed by the Fund in the preparation of its financial statements.
Security valuation
Debt securities generally are valued based on prices obtained from pricing services, which are intended to reflect market transactions for normal, institutional-size trading units of similar securities. The services may use various pricing techniques that take into account, as applicable, factors such as yield, quality, coupon rate, maturity, type of issue, trading characteristics and other data, as well as approved independent broker-dealer quotes. Debt securities for which quotations are not readily available or not believed to be reflective of market value may also be valued based upon a bid quote from an approved independent broker-dealer. Debt securities maturing in 60 days or less are valued primarily at amortized market value, unless this method results in a valuation that management believes does not approximate fair value.
Investments in open-end investment companies (other than exchange-traded funds (ETFs)), are valued at the latest net asset value reported by those companies as of the valuation time.
Investments for which market quotations are not readily available, or that have quotations which management believes are not reflective of market value or reliable, are valued at fair value as determined in good faith under procedures approved by the Board of Trustees. If a security or class of securities (such as foreign securities) is valued at fair value, such value is likely to be different from the quoted or published price for the security, if available.
| 32 | Columbia Short Duration Municipal Bond Fund | Annual Report 2023 |
Notes to Financial Statements (continued)
April 30, 2023
The determination of fair value often requires significant judgment. To determine fair value, management may use assumptions including but not limited to future cash flows and estimated risk premiums. Multiple inputs from various sources may be used to determine fair value.
GAAP requires disclosure regarding the inputs and valuation techniques used to measure fair value and any changes in valuation inputs or techniques. In addition, investments shall be disclosed by major category. This information is disclosed following the Fund’s Portfolio of Investments.
Derivative instruments
The Fund invests in certain derivative instruments, as detailed below, in seeking to meet its investment objectives. Derivatives are instruments whose values depend on, or are derived from, in whole or in part, the value of one or more securities, currencies, commodities, indices, or other assets or instruments. Derivatives may be used to increase investment flexibility (including to maintain cash reserves while maintaining desired exposure to certain assets), for risk management (hedging) purposes, to facilitate trading, to reduce transaction costs and to pursue higher investment returns. The Fund may also use derivative instruments to mitigate certain investment risks, such as foreign currency exchange rate risk, interest rate risk and credit risk. Derivatives may involve various risks, including the potential inability of the counterparty to fulfill its obligations under the terms of the contract, the potential for an illiquid secondary market (making it difficult for the Fund to sell or terminate, including at favorable prices) and the potential for market movements which may expose the Fund to gains or losses in excess of the amount shown in the Statement of Assets and Liabilities. The notional amounts of derivative instruments, if applicable, are not recorded in the financial statements.
A derivative instrument may suffer a marked-to-market loss if the value of the contract decreases due to an unfavorable change in the market rates or values of the underlying instrument. Losses can also occur if the counterparty does not perform its obligations under the contract. The Fund’s risk of loss from counterparty credit risk on over-the-counter derivatives is generally limited to the aggregate unrealized gain netted against any collateral held by the Fund and the amount of any variation margin held by the counterparty, plus any replacement costs or related amounts. With exchange-traded or centrally cleared derivatives, there is reduced counterparty credit risk to the Fund since the clearinghouse or central counterparty (CCP) provides some protection in the case of clearing member default. The clearinghouse or CCP stands between the buyer and the seller of the contract; therefore, failure of the clearinghouse or CCP may pose additional counterparty credit risk. However, credit risk still exists in exchange-traded or centrally cleared derivatives with respect to initial and variation margin that is held in a broker’s customer account. While clearing brokers are required to segregate customer margin from their own assets, in the event that a clearing broker becomes insolvent or goes into bankruptcy and at that time there is a shortfall in the aggregate amount of margin held by the clearing broker for all its clients and such shortfall is remedied by the CCP or otherwise, U.S. bankruptcy laws will typically allocate that shortfall on a pro-rata basis across all the clearing broker’s customers (including the Fund), potentially resulting in losses to the Fund.
In order to better define its contractual rights and to secure rights that will help the Fund mitigate its counterparty risk, the Fund may enter into an International Swaps and Derivatives Association, Inc. Master Agreement (ISDA Master Agreement) or similar agreement with its derivatives counterparties. An ISDA Master Agreement is an agreement between the Fund and a counterparty that governs over-the-counter derivatives and foreign exchange forward contracts and contains, among other things, collateral posting terms and netting provisions in the event of a default and/or termination event. Under an ISDA Master Agreement, the Fund may, under certain circumstances, offset with the counterparty certain derivative instruments’ payables and/or receivables with collateral held and/or posted and create one single net payment. The provisions of the ISDA Master Agreement typically permit a single net payment in the event of default (close-out netting), including the bankruptcy or insolvency of the counterparty. Note, however, that bankruptcy or insolvency laws of a particular jurisdiction may impose restrictions on or prohibitions against the right of offset or netting in bankruptcy, insolvency or other events.
Collateral (margin) requirements differ by type of derivative. Margin requirements are established by the clearinghouse or CCP for exchange-traded and centrally cleared derivatives. Brokers can ask for margin in excess of the minimum in certain circumstances. Collateral terms for most over-the-counter derivatives are subject to regulatory requirements to exchange variation margin with trading counterparties and may have contract specific margin terms as well. For over-the-counter derivatives traded under an ISDA Master Agreement, the collateral requirements are typically calculated by netting the marked-to-market amount for each transaction under such agreement and comparing that amount to the value of any variation margin currently pledged by the Fund and/or the counterparty. Generally, the amount of collateral due from or to a
Columbia Short Duration Municipal Bond Fund | Annual Report 2023
| 33 |
Notes to Financial Statements (continued)
April 30, 2023
party has to exceed a minimum transfer amount threshold (e.g., $250,000) before a transfer has to be made. To the extent amounts due to the Fund from its counterparties are not fully collateralized, contractually or otherwise, the Fund bears the risk of loss from counterparty nonperformance. The Fund may also pay interest expense on cash collateral received from the broker or receive interest income on cash collateral pledged to the broker. The Fund attempts to mitigate counterparty risk by only entering into agreements with counterparties that it believes have the financial resources to honor their obligations and by monitoring the financial stability of those counterparties.
Certain ISDA Master Agreements allow counterparties of over-the-counter derivatives transactions to terminate derivatives contracts prior to maturity in the event the Fund’s net asset value declines by a stated percentage over a specified time period or if the Fund fails to meet certain terms of the ISDA Master Agreement, which would cause the Fund to accelerate payment of any net liability owed to the counterparty. The Fund also has termination rights if the counterparty fails to meet certain terms of the ISDA Master Agreement. In determining whether to exercise such termination rights, the Fund would consider, in addition to counterparty credit risk, whether termination would result in a net liability owed from the counterparty.
For financial reporting purposes, the Fund does not offset derivative assets and derivative liabilities that are subject to netting arrangements in the Statement of Assets and Liabilities.
Futures contracts
Futures contracts are exchange-traded and represent commitments for the future purchase or sale of an asset at a specified price on a specified date. The Fund bought and sold futures contracts to manage the duration and yield curve exposure of the Fund versus the benchmark. These instruments may be used for other purposes in future periods. Upon entering into futures contracts, the Fund bears risks that it may not achieve the anticipated benefits of the futures contracts and may realize a loss. Additional risks include counterparty credit risk, the possibility of an illiquid market, and that a change in the value of the contract or option may not correlate with changes in the value of the underlying asset.
Upon entering into a futures contract, the Fund deposits cash or securities with the broker, known as a futures commission merchant (FCM), in an amount sufficient to meet the initial margin requirement. The initial margin deposit must be maintained at an established level over the life of the contract. Cash deposited as initial margin is recorded in the Statement of Assets and Liabilities as margin deposits. Securities deposited as initial margin are designated in the Portfolio of Investments. Subsequent payments (variation margin) are made or received by the Fund each day. The variation margin payments are equal to the daily change in the contract value and are recorded as variation margin receivable or payable and are offset in unrealized gains or losses. The Fund generally expects to earn interest income on its margin deposits. The Fund recognizes a realized gain or loss when the contract is closed or expires. Futures contracts involve, to varying degrees, risk of loss in excess of the variation margin disclosed in the Statement of Assets and Liabilities.
Effects of derivative transactions in the financial statements
The following tables are intended to provide additional information about the effect of derivatives on the financial statements of the Fund, including: the fair value of derivatives by risk category and the location of those fair values in the Statement of Assets and Liabilities; and the impact of derivative transactions over the period in the Statement of Operations, including realized and unrealized gains (losses). The derivative instrument schedules following the Portfolio of Investments present additional information regarding derivative instruments outstanding at the end of the period, if any.
| 34 | Columbia Short Duration Municipal Bond Fund | Annual Report 2023 |
Notes to Financial Statements (continued)
April 30, 2023
The following table indicates the effect of derivative instruments (not considered to be hedging instruments for accounting disclosure purposes) in the Statement of Operations for the year ended April 30, 2023:
| Amount of realized gain (loss) on derivatives recognized in income |
| Risk exposure category | Futures
contracts
($) |
| Interest rate risk | 1,383,534 |
| |
| Change in unrealized appreciation (depreciation) on derivatives recognized in income |
| Risk exposure category | Futures
contracts
($) |
| Interest rate risk | (539,694) |
The following table is a summary of the average outstanding volume by derivative instrument for the year ended April 30, 2023:
| Derivative instrument | Average notional
amounts ($)* |
| Futures contracts — short | 13,103,809 |
| * | Based on the ending quarterly outstanding amounts for the year ended April 30, 2023. |
Delayed delivery securities
The Fund may trade securities on other than normal settlement terms, including securities purchased or sold on a “when-issued” or "forward commitment" basis. This may increase risk to the Fund since the other party to the transaction may fail to deliver, which could cause the Fund to subsequently invest at less advantageous prices. The Fund designates cash or liquid securities in an amount equal to the delayed delivery commitment.
Security transactions
Security transactions are accounted for on the trade date. Cost is determined and gains (losses) are based upon the specific identification method for both financial statement and federal income tax purposes.
Income recognition
Interest income is recorded on an accrual basis. Market premiums and discounts, including original issue discounts, are amortized and accreted, respectively, over the expected life of the security on all debt securities, unless otherwise noted.
The Fund may place a debt security on non-accrual status and reduce related interest income when it becomes probable that the interest will not be collected and the amount of uncollectible interest can be reasonably estimated. The Fund may also adjust accrual rates when it becomes probable the full interest will not be collected and a partial payment will be received. A defaulted debt security is removed from non-accrual status when the issuer resumes interest payments or when collectability of interest is reasonably assured.
Dividend income is recorded on the ex-dividend date.
Expenses
General expenses of the Trust are allocated to the Fund and other funds of the Trust based upon relative net assets or other expense allocation methodologies determined by the nature of the expense. Expenses directly attributable to the Fund are charged to the Fund. Expenses directly attributable to a specific class of shares are charged to that share class.
Determination of class net asset value
All income, expenses (other than class-specific expenses, which are charged to that share class, as shown in the Statement of Operations) and realized and unrealized gains (losses) are allocated to each class of the Fund on a daily basis, based on the relative net assets of each class, for purposes of determining the net asset value of each class.
Columbia Short Duration Municipal Bond Fund | Annual Report 2023
| 35 |
Notes to Financial Statements (continued)
April 30, 2023
Federal income tax status
The Fund intends to qualify each year as a regulated investment company under Subchapter M of the Internal Revenue Code, as amended, and will distribute substantially all of its net tax-exempt and investment company taxable income and net capital gain, if any, for its tax year, and as such will not be subject to federal income taxes. In addition, the Fund intends to distribute in each calendar year substantially all of its ordinary income, capital gain net income and certain other amounts, if any, such that the Fund should not be subject to federal excise tax. Therefore, no federal income or excise tax provision is recorded.
Distributions to shareholders
Distributions from net investment income, if any, are declared daily and paid monthly. Net realized capital gains, if any, are distributed at least annually. Income distributions and capital gain distributions are determined in accordance with federal income tax regulations, which may differ from GAAP.
Guarantees and indemnifications
Under the Trust’s organizational documents and, in some cases, by contract, its officers and trustees are indemnified against certain liabilities arising out of the performance of their duties to the Trust or its funds. In addition, certain of the Fund’s contracts with its service providers contain general indemnification clauses. The Fund’s maximum exposure under these arrangements is unknown since the amount of any future claims that may be made against the Fund cannot be determined, and the Fund has no historical basis for predicting the likelihood of any such claims.
Recent accounting pronouncement
Tailored Shareholder Reports
In October 2022, the Securities and Exchange Commission (SEC) adopted a final rule relating to Tailored Shareholder Reports for Mutual Funds and Exchange-Traded Funds; Fee Information in Investment Company Advertisements. The rule and form amendments will, among other things, require the Fund to transmit concise and visually engaging shareholder reports that highlight key information. The amendments will require that funds tag information in a structured data format and that certain more in-depth information be made available online and available for delivery free of charge to investors on request. The amendments became effective January 24, 2023. There is an 18-month transition period after the effective date of the amendment.
Note 3. Fees and other transactions with affiliates
Management services fees
The Fund has entered into a Management Agreement with Columbia Management Investment Advisers, LLC (the Investment Manager), a wholly-owned subsidiary of Ameriprise Financial, Inc. (Ameriprise Financial). Under the Management Agreement, the Investment Manager provides the Fund with investment research and advice, as well as administrative and accounting services. The management services fee is an annual fee that is equal to a percentage of the Fund’s daily net assets that declines from 0.43% to 0.28% as the Fund’s net assets increase. The effective management services fee rate for the year ended April 30, 2023 was 0.43% of the Fund’s average daily net assets.
Compensation of board members
Members of the Board of Trustees who are not officers or employees of the Investment Manager or Ameriprise Financial are compensated for their services to the Fund as disclosed in the Statement of Operations. Under a Deferred Compensation Plan (the Deferred Plan), these members of the Board of Trustees may elect to defer payment of up to 100% of their compensation. Deferred amounts are treated as though equivalent dollar amounts had been invested in shares of certain funds managed by the Investment Manager. The Fund’s liability for these amounts is adjusted for market value changes and remains in the Fund until distributed in accordance with the Deferred Plan. All amounts payable under the Deferred Plan constitute a general unsecured obligation of the Fund. The expense for the Deferred Plan, which includes Trustees’ fees deferred during the current period as well as any gains or losses on the Trustees’ deferred compensation balances as a result of market fluctuations, is included in "Compensation of board members" in the Statement of Operations.
| 36 | Columbia Short Duration Municipal Bond Fund | Annual Report 2023 |
Notes to Financial Statements (continued)
April 30, 2023
Compensation of Chief Compliance Officer
The Board of Trustees has appointed a Chief Compliance Officer for the Fund in accordance with federal securities regulations. As disclosed in the Statement of Operations, a portion of the Chief Compliance Officer’s total compensation is allocated to the Fund, along with other allocations to affiliated registered investment companies managed by the Investment Manager and its affiliates, based on relative net assets.
Transfer agency fees
Under a Transfer and Dividend Disbursing Agent Agreement, Columbia Management Investment Services Corp. (the Transfer Agent), an affiliate of the Investment Manager and a wholly-owned subsidiary of Ameriprise Financial, is responsible for providing transfer agency services to the Fund. The Transfer Agent has contracted with SS&C GIDS, Inc. (SS&C GIDS) to serve as sub-transfer agent. Prior to January 1, 2023, SS&C GIDS was known as DST Asset Manager Solutions, Inc. The Transfer Agent pays the fees of SS&C GIDS for services as sub-transfer agent and SS&C GIDS is not entitled to reimbursement for such fees from the Fund (with the exception of out-of-pocket fees).
The Fund pays the Transfer Agent a monthly transfer agency fee based on the number or the average value of accounts, depending on the type of account. In addition, the Fund pays the Transfer Agent a fee for shareholder services based on the number of accounts or on a percentage of the average aggregate value of the Fund’s shares maintained in omnibus accounts up to the lesser of the amount charged by the financial intermediary or a cap established by the Board of Trustees from time to time.
The Transfer Agent also receives compensation from the Fund for various shareholder services and reimbursements for certain out-of-pocket fees. Total transfer agency fees for Institutional 2 Class and Institutional 3 Class shares are subject to an annual limitation of not more than 0.07% and 0.02%, respectively, of the average daily net assets attributable to each share class. In addition, effective through August 31, 2024, Institutional 2 Class shares are subject to a contractual transfer agency fee annual limitation of not more than 0.05% and Institutional 3 Class shares are subject to a contractual transfer agency fee annual limitation of not more than 0.00% of the average daily net assets attributable to each share class.
For the year ended April 30, 2023, the Fund’s effective transfer agency fee rates as a percentage of average daily net assets of each class were as follows:
| | Effective rate (%) |
| Class A | 0.11 |
| Advisor Class | 0.11 |
| Class C | 0.11 |
| Institutional Class | 0.11 |
| Institutional 2 Class | 0.05 |
| Institutional 3 Class | 0.00 |
An annual minimum account balance fee of $20 may apply to certain accounts with a value below the applicable share class’s initial minimum investment requirements to reduce the impact of small accounts on transfer agency fees. These minimum account balance fees are remitted to the Fund and recorded as part of expense reductions in the Statement of Operations. For the year ended April 30, 2023, these minimum account balance fees reduced total expenses of the Fund by $40.
Distribution and service fees
The Fund has entered into an agreement with Columbia Management Investment Distributors, Inc. (the Distributor), an affiliate of the Investment Manager and a wholly-owned subsidiary of Ameriprise Financial, for distribution and shareholder services. The Board of Trustees has approved, and the Fund has adopted, distribution and shareholder service plans (the Plans) applicable to certain share classes, which set the distribution and service fees for the Fund. These fees are calculated daily and are intended to compensate the Distributor and/or eligible selling and/or servicing agents for selling shares of the Fund and providing services to investors.
Columbia Short Duration Municipal Bond Fund | Annual Report 2023
| 37 |
Notes to Financial Statements (continued)
April 30, 2023
Under the Plans, the Fund pays a monthly combined distribution and service fee to the Distributor at the maximum annual rate of 0.25% of the average daily net assets attributable to Class A shares of the Fund. Also under the Plans, the Fund pays a monthly service fee to the Distributor at the maximum annual rate of 0.25% of the average daily net assets attributable to Class C shares of the Fund and a monthly distribution fee to the Distributor at the maximum annual rate of 0.75% of the average daily net assets attributable to Class C shares of the Fund.
Sales charges (unaudited)
Sales charges, including front-end charges and contingent deferred sales charges (CDSCs), received by the Distributor for distributing Fund shares for the year ended April 30, 2023, if any, are listed below:
| | Front End (%) | CDSC (%) | Amount ($) |
| Class A | 1.00 | 0.50(a) | 45,620 |
| Class C | — | 1.00(b) | — |
| (a) | This charge is imposed on certain investments of $500,000 or more if redeemed within 12 months after purchase. |
| (b) | This charge applies to redemptions within 12 months after purchase, with certain limited exceptions. |
The Fund’s other share classes are not subject to sales charges.
Expenses waived/reimbursed by the Investment Manager and its affiliates
The Investment Manager and certain of its affiliates have contractually agreed to waive fees and/or reimburse expenses (excluding certain fees and expenses described below) for the period(s) disclosed below, unless sooner terminated at the sole discretion of the Board of Trustees, so that the Fund’s net operating expenses, after giving effect to fees waived/expenses reimbursed and any balance credits and/or overdraft charges from the Fund’s custodian, do not exceed the following annual rate(s) as a percentage of the classes’ average daily net assets:
| | September 1, 2022
through
August 31, 2023 | Prior to
September 1, 2022 |
| Class A | 0.65% | 0.66% |
| Advisor Class | 0.40 | 0.41 |
| Class C | 1.40 | 1.41 |
| Institutional Class | 0.40 | 0.41 |
| Institutional 2 Class | 0.34 | 0.37 |
| Institutional 3 Class | 0.29 | 0.32 |
In addition, the Investment Manager and certain of its affiliates have contractually agreed to waive fees and/or reimburse expenses (excluding certain fees and expenses described below) through August 31, 2024, unless sooner terminated at the sole discretion of the Board of Trustees, so that the Fund’s net operating expenses, after giving effect to fees waived/expenses reimbursed and any balance credits and/or overdraft charges from the Fund’s custodian, will not exceed the annual rates of 0.66% for Class A, 0.41% for Advisor Class, 1.41% for Class C, 0.41% for Institutional Class, 0.37% for Institutional 2 Class and 0.32% for Institutional 3 Class as a percentage of the classes’ average daily net assets.
Under the agreement governing these fee waivers and/or expense reimbursement arrangements, the following fees and expenses are excluded from the waiver/reimbursement commitment, and therefore will be paid by the Fund, if applicable: taxes (including foreign transaction taxes), expenses associated with investments in affiliated and non-affiliated pooled investment vehicles (including mutual funds and exchange-traded funds), transaction costs and brokerage commissions, costs related to any securities lending program, dividend expenses associated with securities sold short, inverse floater program fees and expenses, transaction charges and interest on borrowed money, interest, costs associated with shareholder meetings, infrequent and/or unusual expenses and any other expenses the exclusion of which is specifically approved by the Board of Trustees. This agreement may be modified or amended only with approval from the Investment Manager, certain of its affiliates and the Fund. Reflected in the contractual cap commitment, effective through August 31, 2024, is the Transfer Agent’s contractual agreement to limit total transfer agency fees to an annual rate of not more than 0.05% for Institutional 2 Class and 0.00% for Institutional 3 Class of the average daily net assets attributable to
| 38 | Columbia Short Duration Municipal Bond Fund | Annual Report 2023 |
Notes to Financial Statements (continued)
April 30, 2023
each share class, unless sooner terminated at the sole discretion of the Board of Trustees. Any fees waived and/or expenses reimbursed under the expense reimbursement arrangements described above are not recoverable by the Investment Manager or its affiliates in future periods.
Note 4. Federal tax information
The timing and character of income and capital gain distributions are determined in accordance with income tax regulations, which may differ from GAAP because of temporary or permanent book to tax differences.
At April 30, 2023, these differences were primarily due to differing treatment for tax straddles, capital loss carryforwards, trustees’ deferred compensation, distributions and re-characterization of distributions for investments. To the extent these differences were permanent, reclassifications were made among the components of the Fund’s net assets. Temporary differences do not require reclassifications.
The following reclassifications were made:
Excess of distributions
over net investment
income ($) | Accumulated
net realized
(loss) ($) | Paid in
capital ($) |
| (1) | 1 | — |
Net investment income (loss) and net realized gains (losses), as disclosed in the Statement of Operations, and net assets were not affected by this reclassification.
The tax character of distributions paid during the years indicated was as follows:
| Year Ended April 30, 2023 | Year Ended April 30, 2022 |
Ordinary
income ($) | Tax-exempt
income ($) | Long-term
capital gains ($) | Total ($) | Ordinary
income ($) | Tax-exempt
income ($) | Long-term
capital gains ($) | Total ($) |
| 36,898 | 11,076,553 | — | 11,113,451 | 96,825 | 7,081,649 | — | 7,178,474 |
Short-term capital gain distributions, if any, are considered ordinary income distributions for tax purposes.
At April 30, 2023, the components of distributable earnings on a tax basis were as follows:
Undistributed
ordinary income ($) | Undistributed tax-
exempt income ($) | Undistributed
long-term
capital gains ($) | Capital loss
carryforwards ($) | Net unrealized
(depreciation) ($) |
| — | 932,690 | — | (15,642,999) | (13,197,101) |
At April 30, 2023, the cost of all investments for federal income tax purposes along with the aggregate gross unrealized appreciation and depreciation based on that cost was:
Federal
tax cost ($) | Gross unrealized
appreciation ($) | Gross unrealized
(depreciation) ($) | Net unrealized
(depreciation) ($) |
| 511,538,443 | 495,503 | (13,692,604) | (13,197,101) |
Tax cost of investments and unrealized appreciation/(depreciation) may also include timing differences that do not constitute adjustments to tax basis.
The following capital loss carryforwards, determined at April 30, 2023, may be available to reduce future net realized gains on investments, if any, to the extent permitted by the Internal Revenue Code. In addition, for the year ended April 30, 2023, capital loss carryforwards utilized, if any, were as follows:
No expiration
short-term ($) | No expiration
long-term ($) | Total ($) | Utilized ($) |
| (8,542,874) | (7,100,125) | (15,642,999) | — |
Columbia Short Duration Municipal Bond Fund | Annual Report 2023
| 39 |
Notes to Financial Statements (continued)
April 30, 2023
Management of the Fund has concluded that there are no significant uncertain tax positions in the Fund that would require recognition in the financial statements. However, management’s conclusion may be subject to review and adjustment at a later date based on factors including, but not limited to, new tax laws, regulations, and administrative interpretations (including relevant court decisions). Generally, the Fund’s federal tax returns for the prior three fiscal years remain subject to examination by the Internal Revenue Service.
Note 5. Portfolio information
The cost of purchases and proceeds from sales of securities, excluding short-term investments and derivatives, if any, aggregated to $283,822,720 and $483,199,805, respectively, for the year ended April 30, 2023. The amount of purchase and sale activity impacts the portfolio turnover rate reported in the Financial Highlights.
Note 6. Interfund lending
Pursuant to an exemptive order granted by the Securities and Exchange Commission, the Fund participates in a program (the Interfund Program) allowing each participating Columbia Fund (each, a Participating Fund) to lend money directly to and, except for closed-end funds and money market funds, borrow money directly from other Participating Funds for temporary purposes. The amounts eligible for borrowing and lending under the Interfund Program are subject to certain restrictions.
Interfund loans are subject to the risk that the borrowing fund could be unable to repay the loan when due, and a delay in repayment to the lending fund could result in lost opportunities and/or additional lending costs. The exemptive order is subject to conditions intended to mitigate conflicts of interest arising from the Investment Manager’s relationship with each Participating Fund.
The Fund’s activity in the Interfund Program during the year ended April 30, 2023 was as follows:
| Borrower or lender | Average loan
balance ($) | Weighted average
interest rate (%) | Number of days
with outstanding loans |
| Borrower | 4,800,000 | 4.35 | 19 |
Interest expense incurred by the Fund is recorded as Interfund lending in the Statement of Operations. The Fund had no outstanding interfund loans at April 30, 2023.
Note 7. Line of credit
The Fund has access to a revolving credit facility with a syndicate of banks led by JPMorgan Chase Bank, N.A., Citibank, N.A. and Wells Fargo Bank, N.A. whereby the Fund may borrow for the temporary funding of shareholder redemptions or for other temporary or emergency purposes. Pursuant to an October 27, 2022 amendment and restatement, the credit facility, which is an agreement between the Fund and certain other funds managed by the Investment Manager or an affiliated investment manager, severally and not jointly, permits aggregate borrowings up to $950 million. Interest is currently charged to each participating fund based on its borrowings at a rate equal to the higher of (i) the federal funds effective rate, (ii) the secured overnight financing rate plus 0.10% and (iii) the overnight bank funding rate, plus in each case, 1.00%. Each borrowing under the credit facility matures no later than 60 days after the date of borrowing. The Fund also pays a commitment fee equal to its pro rata share of the unused amount of the credit facility at a rate of 0.15% per annum. The commitment fee is included in other expenses in the Statement of Operations. This agreement expires annually in October unless extended or renewed. Prior to the October 27, 2022 amendment and restatement, the Fund had access to a revolving credit facility with a syndicate of banks led by JPMorgan Chase Bank, N.A., Citibank, N.A. and Wells Fargo Bank, N.A. which permitted collective borrowings up to $950 million. Interest was charged to each participating fund based on its borrowings at a rate equal to the higher of (i) the federal funds effective rate, (ii) the secured overnight financing rate plus 0.11448% and (iii) the overnight bank funding rate, plus in each case, 1.00%.
The Fund had no borrowings during the year ended April 30, 2023.
| 40 | Columbia Short Duration Municipal Bond Fund | Annual Report 2023 |
Notes to Financial Statements (continued)
April 30, 2023
Note 8. Fund reorganization
At the close of business on December 10, 2021, the Fund acquired the assets and assumed the identified liabilities of BMO Short Tax-Free Fund (the Acquired Fund), a series of BMO Funds, Inc. The reorganization was completed after shareholders of the Acquired Fund approved a plan of reorganization at a shareholder meeting held on November 23, 2021. The purpose of the reorganization was to combine two funds with comparable investment objectives and strategies.
The aggregate net assets of the Fund immediately before the reorganization were $775,720,860 and the combined net assets immediately after the reorganization were $873,471,299.
The reorganization was accomplished by a tax-free exchange of 9,525,261 shares of the Acquired Fund valued at $97,750,439 (including $1,544,020 of unrealized appreciation/(depreciation)).
In exchange for the Acquired Fund’s shares, the Fund issued the following number of shares:
| | Shares |
| Class A | 329,765 |
| Advisor Class | 9,031,436 |
For financial reporting purposes, net assets received and shares issued by the Fund were recorded at fair value; however, the Acquired Fund’s cost of investments was carried forward.
The Fund’s financial statements reflect both the operations of the Fund for the period prior to the reorganization and the combined Fund for the period subsequent to the reorganization. Because the combined investment portfolios have been managed as a single integrated portfolio since the reorganization was completed, it is not practicable to separate the amounts of revenue and earnings of the Acquired Fund that have been included in the combined Fund’s Statement of Operations since the reorganization was completed.
Assuming the reorganization had been completed on May 1, 2021, the Fund’s pro-forma results of operations for the year ended April 30, 2022 would have been approximately:
| | ($) |
| Net investment income | 7,995,000 |
| Net realized loss | (310,000) |
| Net change in unrealized appreciation/(depreciation) | (36,561,000) |
| Net decrease in net assets from operations | (28,876,000) |
Note 9. Significant risks
Credit risk
Credit risk is the risk that the value of debt instruments in the Fund’s portfolio may decline because the issuer defaults or otherwise becomes unable or unwilling, or is perceived to be unable or unwilling, to honor its financial obligations, such as making payments to the Fund when due. Credit rating agencies assign credit ratings to certain debt instruments to indicate their credit risk. Lower-rated or unrated debt instruments held by the Fund may present increased credit risk as compared to higher-rated debt instruments.
Derivatives risk
Losses involving derivative instruments may be substantial, because a relatively small movement in the underlying reference (which is generally the price, rate or other economic indicator associated with a security(ies), commodity, currency, index or other instrument or asset) may result in a substantial loss for the Fund. In addition to the potential for increased losses, the use of derivative instruments may lead to increased volatility within the Fund. Derivatives will typically increase the Fund’s exposure to principal risks to which it is otherwise exposed, and may expose the Fund to additional risks, including correlation risk, counterparty risk, hedging risk, leverage risk, liquidity risk and pricing risk.
Columbia Short Duration Municipal Bond Fund | Annual Report 2023
| 41 |
Notes to Financial Statements (continued)
April 30, 2023
Interest rate risk
Interest rate risk is the risk of losses attributable to changes in interest rates. In general, if interest rates rise, the values of debt instruments tend to fall, and if interest rates fall, the values of debt instruments tend to rise. Actions by governments and central banking authorities can result in increases or decreases in interest rates. Higher periods of inflation could lead such authorities to raise interest rates. Increasing interest rates may negatively affect the value of debt securities held by the Fund, resulting in a negative impact on the Fund’s performance and net asset value per share. In general, the longer the maturity or duration of a debt security, the greater its sensitivity to changes in interest rates. The Fund is subject to the risk that the income generated by its investments may not keep pace with inflation.
Liquidity risk
Liquidity risk is the risk associated with a lack of marketability of investments which may make it difficult to sell the investment at a desirable time or price. Changing regulatory, market or other conditions or environments (for example, the interest rate or credit environments) may adversely affect the liquidity of the Fund’s investments. The Fund may have to accept a lower selling price for the holding, sell other investments, or forego another, more appealing investment opportunity. Generally, the less liquid the market at the time the Fund sells a portfolio investment, the greater the risk of loss or decline of value to the Fund. A less liquid market can lead to an increase in Fund redemptions, which may negatively impact Fund performance and net asset value per share, including, for example, if the Fund is forced to sell securities in a down market.
Market risk
The Fund may incur losses due to declines in the value of one or more securities in which it invests. These declines may be due to factors affecting a particular issuer, or the result of, among other things, political, regulatory, market, economic or social developments affecting the relevant market(s) more generally. In addition, turbulence in financial markets and reduced liquidity in equity, credit and/or fixed income markets may negatively affect many issuers, which could adversely affect the Fund’s ability to price or value hard-to-value assets in thinly traded and closed markets and could cause significant redemptions and operational challenges. Global economies and financial markets are increasingly interconnected, and conditions and events in one country, region or financial market may adversely impact issuers in a different country, region or financial market. These risks may be magnified if certain events or developments adversely interrupt the global supply chain; in these and other circumstances, such risks might affect companies worldwide. As a result, local, regional or global events such as terrorism, war, natural disasters, disease/virus outbreaks and epidemics or other public health issues, recessions, depressions or other events – or the potential for such events – could have a significant negative impact on global economic and market conditions.
Municipal securities risk
Municipal securities are debt obligations generally issued to obtain funds for various public purposes, including general financing for state and local governments, or financing for a specific project or public facility, and include obligations of the governments of the U.S. territories, commonwealths and possessions such as Guam, Puerto Rico and the U.S. Virgin Islands to the extent such obligations are exempt from state and U.S. federal income taxes. The value of municipal securities can be significantly affected by actual or expected political and legislative changes at the federal or state level. Municipal securities may be fully or partially backed by the taxing authority of the local government, by the credit of a private issuer, by the current or anticipated revenues from a specific project or specific assets or by domestic or foreign entities providing credit support, such as letters of credit, guarantees or insurance, and are generally classified into general obligation bonds and special revenue obligations. Because many municipal securities are issued to finance projects in sectors such as education, health care, transportation and utilities, conditions in those sectors can affect the overall municipal market.
Issuers in a state, territory, commonwealth or possession in which the Fund invests may experience significant financial difficulties for various reasons, including as the result of events that cannot be reasonably anticipated or controlled such as economic downturns or similar periods of economic stress, social conflict or unrest, labor disruption and natural disasters. Such financial difficulties may lead to credit rating downgrades or defaults of such issuers which in turn, could affect the market values and marketability of many or all municipal obligations of issuers in such state, territory, commonwealth or possession. The value of the Fund’s shares will be negatively impacted to the extent it invests in such securities. The Fund’s annual and semiannual reports show the Fund’s investment exposures at a point in time. The risk of investing in the Fund is directly correlated to the Fund’s investment exposures.
| 42 | Columbia Short Duration Municipal Bond Fund | Annual Report 2023 |
Notes to Financial Statements (continued)
April 30, 2023
Securities issued by a particular state and its instrumentalities are subject to the risk of unfavorable developments in such state. A municipal security can be significantly affected by adverse tax, legislative, regulatory, demographic or political changes as well as changes in a particular state’s (state and its instrumentalities’) financial, economic or other condition and prospects.
Shareholder concentration risk
At April 30, 2023, two unaffiliated shareholders of record owned 54.5% of the outstanding shares of the Fund in one or more accounts. The Fund has no knowledge about whether any portion of those shares was owned beneficially. Affiliated shareholders of record owned 10.5% of the outstanding shares of the Fund in one or more accounts. Subscription and redemption activity by concentrated accounts may have a significant effect on the operations of the Fund. In the case of a large redemption, the Fund may be forced to sell investments at inopportune times, including its liquid positions, which may result in Fund losses and the Fund holding a higher percentage of less liquid positions. Large redemptions could result in decreased economies of scale and increased operating expenses for non-redeeming Fund shareholders.
Note 10. Subsequent events
Management has evaluated the events and transactions that have occurred through the date the financial statements were issued and noted no items requiring adjustment of the financial statements or additional disclosure.
Note 11. Information regarding pending and settled legal proceedings
Ameriprise Financial and certain of its affiliates are involved in the normal course of business in legal proceedings which include regulatory inquiries, arbitration and litigation, including class actions concerning matters arising in connection with the conduct of their activities as part of a diversified financial services firm. Ameriprise Financial believes that the Fund is not currently the subject of, and that neither Ameriprise Financial nor any of its affiliates are the subject of, any pending legal, arbitration or regulatory proceedings that are likely to have a material adverse effect on the Fund or the ability of Ameriprise Financial or its affiliates to perform under their contracts with the Fund. Ameriprise Financial is required to make quarterly (10-Q), annual (10-K) and, as necessary, 8-K filings with the Securities and Exchange Commission (SEC) on legal and regulatory matters that relate to Ameriprise Financial and its affiliates. Copies of these filings may be obtained by accessing the SEC website at www.sec.gov.
There can be no assurance that these matters, or the adverse publicity associated with them, will not result in increased Fund redemptions, reduced sale of Fund shares or other adverse consequences to the Fund. Further, although we believe proceedings are not likely to have a material adverse effect on the Fund or the ability of Ameriprise Financial or its affiliates to perform under their contracts with the Fund, these proceedings are subject to uncertainties and, as such, we are unable to estimate the possible loss or range of loss that may result. An adverse outcome in one or more of these proceedings could result in adverse judgments, settlements, fines, penalties or other relief that could have a material adverse effect on the consolidated financial condition or results of operations of Ameriprise Financial or one or more of its affiliates that provides services to the Fund.
Columbia Short Duration Municipal Bond Fund | Annual Report 2023
| 43 |
Report of Independent Registered Public Accounting Firm
To the Board of Trustees of Columbia Funds Series Trust and Shareholders of Columbia Short Duration Municipal Bond Fund
Opinion on the Financial Statements
We have audited the accompanying statement of assets and liabilities, including the portfolio of investments, of Columbia Short Duration Municipal Bond Fund (one of the funds constituting Columbia Funds Series Trust, referred to hereafter as the "Fund") as of April 30, 2023, the related statement of operations for the year ended April 30, 2023, the statement of changes in net assets for each of the two years in the period ended April 30, 2023, including the related notes, and the financial highlights for each of the five years in the period ended April 30, 2023 (collectively referred to as the "financial statements"). In our opinion, the financial statements present fairly, in all material respects, the financial position of the Fund as of April 30, 2023, the results of its operations for the year then ended, the changes in its net assets for each of the two years in the period ended April 30, 2023 and the financial highlights for each of the five years in the period ended April 30, 2023 in conformity with accounting principles generally accepted in the United States of America.
Basis for Opinion
These financial statements are the responsibility of the Fund’s management. Our responsibility is to express an opinion on the Fund’s financial statements based on our audits. We are a public accounting firm registered with the Public Company Accounting Oversight Board (United States) (PCAOB) and are required to be independent with respect to the Fund in accordance with the U.S. federal securities laws and the applicable rules and regulations of the Securities and Exchange Commission and the PCAOB.
We conducted our audits of these financial statements in accordance with the standards of the PCAOB. Those standards require that we plan and perform the audit to obtain reasonable assurance about whether the financial statements are free of material misstatement, whether due to error or fraud.
Our audits included performing procedures to assess the risks of material misstatement of the financial statements, whether due to error or fraud, and performing procedures that respond to those risks. Such procedures included examining, on a test basis, evidence regarding the amounts and disclosures in the financial statements. Our audits also included evaluating the accounting principles used and significant estimates made by management, as well as evaluating the overall presentation of the financial statements. Our procedures included confirmation of securities owned as of April 30, 2023 by correspondence with the custodian, transfer agents and brokers. We believe that our audits provide a reasonable basis for our opinion.
/s/PricewaterhouseCoopers LLP
Minneapolis, Minnesota
June 22, 2023
We have served as the auditor of one or more investment companies within the Columbia Funds Complex since 1977.
| 44 | Columbia Short Duration Municipal Bond Fund | Annual Report 2023 |
Federal Income Tax Information
(Unaudited)
The Fund hereby designates the following tax attributes for the fiscal year ended April 30, 2023. Shareholders will be notified in early 2024 of the amounts for use in preparing 2023 income tax returns.
Exempt-
interest
dividends | |
| 99.67% | |
Exempt-interest dividends. The percentage of net investment income distributed during the fiscal year that qualifies as exempt-interest dividends for federal income tax purposes. A portion of the income may be subject to federal alternative minimum tax.
TRUSTEES AND OFFICERS
(Unaudited)
The Board oversees the Fund’s operations and appoints officers who are responsible for day-to-day business decisions based on policies set by the Board. The following table provides basic biographical information about the Fund’s Trustees as of the printing of this report, including their principal occupations during the past five years, although specific titles for individuals may have varied over the period. The year set forth beneath Length of Service in the table below is the year in which the Trustee was first appointed or elected as Trustee to any Fund currently in the Columbia Funds Complex or a predecessor thereof. Under current Board policy, each Trustee generally serves until December 31 of the year such Trustee turns seventy-five (75).
Independent trustees
Name,
address,
year of birth | Position held
with the Columbia Funds and
length of service | Principal occupation(s)
during past five years
and other relevant
professional experience | Number of
Funds in the
Columbia Funds
Complex*
overseen | Other directorships
held by Trustee
during the past five years
and other relevant Board experience |
George S. Batejan
c/o Columbia Management
Investment Advisers, LLC
290 Congress Street
Boston, MA 02210
1954 | Trustee since 2017 | Executive Vice President, Global Head of Technology and Operations, Janus Capital Group, Inc., 2010-2016 | 174 | Former Chairman of the Board, NICSA (National Investment Company Services Association) (Executive Committee, Nominating Committee and Governance Committee), 2014-2016; former Director, Intech Investment Management, 2011-2016; former Board Member, Metro Denver Chamber of Commerce, 2015-2016; former Advisory Board Member, University of Colorado Business School, 2015-2018; former Board Member, Chase Bank International, 1993-1994 |
Columbia Short Duration Municipal Bond Fund | Annual Report 2023
| 45 |
TRUSTEES AND OFFICERS (continued)
(Unaudited)
Independent trustees (continued)
Name,
address,
year of birth | Position held
with the Columbia Funds and
length of service | Principal occupation(s)
during past five years
and other relevant
professional experience | Number of
Funds in the
Columbia Funds
Complex*
overseen | Other directorships
held by Trustee
during the past five years
and other relevant Board experience |
Kathleen Blatz
c/o Columbia Management
Investment Advisers, LLC
290 Congress Street
Boston, MA 02210
1954 | Trustee since 2006 | Attorney, specializing in arbitration and mediation; Chief Justice, Minnesota Supreme Court, 1998-2006; Associate Justice, Minnesota Supreme Court, 1996-1998; Fourth Judicial District Court Judge, Hennepin County, 1994-1996; Attorney in private practice and public service, 1984-1993; State Representative, Minnesota House of Representatives, 1979-1993, which included service on the Tax and Financial Institutions and Insurance Committees; Member and Interim Chair, Minnesota Sports Facilities Authority, January-July 2017; Interim President and Chief Executive Officer, Blue Cross and Blue Shield of Minnesota (health care insurance), February-July 2018, April-October 2021 | 174 | Former Trustee, Blue Cross and Blue Shield of Minnesota, 2009-2021 (Chair of the Business Development Committee, 2014-2017; Chair of the Governance Committee, 2017-2019); former Member and Chair of the Board, Minnesota Sports Facilities Authority, January 2017-July 2017; former Director, Robina Foundation, 2009-2020 (Chair, 2014-2020); Director, Richard M. Schulze Family Foundation, since 2021 |
Pamela G. Carlton
c/o Columbia Management
Investment Advisers, LLC
290 Congress Street
Boston, MA 02210
1954 | Chair since 2023; Trustee since 2007 | President, Springboard — Partners in Cross Cultural Leadership (consulting company), since 2003; Managing Director of US Equity Research, JP Morgan Chase, 1999-2003; Director of US Equity Research, Chase Asset Management, 1996-1999; Co-Director Latin America Research, 1993-1996, COO Global Research, 1992-1996, Co-Director of US Research, 1991-1992, Investment Banker, 1982-1991, Morgan Stanley; Attorney, Cleary Gottlieb Steen & Hamilton LLP, 1980-1982 | 174 | Trustee, New York Presbyterian Hospital Board, since 1996; Director, DR Bank (Audit Committee) since 2017; Director, Evercore Inc. (Audit Committee, Nominating and Governance Committee), since 2019; Director, Apollo Commercial Real Estate Finance, Inc. (Chair, Nominating and Governance Committee) (financial services), since 2021; the Governing Council of the Independent Directors Council (IDC), since 2021 |
Janet Langford Carrig
c/o Columbia Management
Investment Advisers, LLC
290 Congress Street
Boston, MA 02210
1957 | Trustee since 1996 | Senior Vice President, General Counsel and Corporate Secretary, ConocoPhillips (independent energy company), September 2007-October 2018 | 174 | Director, EQT Corporation (natural gas producer), since 2019; former Director, Whiting Petroleum Corporation (independent oil and gas company), 2020-2022 |
J. Kevin Connaughton
c/o Columbia Management
Investment Advisers, LLC
290 Congress Street
Boston, MA 02210
1964 | Trustee since 2020 | CEO and President, RhodeWay Financial (non-profit financial planning firm), since December 2022; Member, FINRA National Adjudicatory Council, since January 2020; Adjunct Professor of Finance, Bentley University since January 2018; Consultant to Independent Trustees of CFVIT and CFST I from March 2016 to June 2020 with respect to CFVIT and to December 2020 with respect to CFST I; Managing Director and General Manager of Mutual Fund Products, Columbia Management Investment Advisers, LLC, May 2010-February 2015; President, Columbia Funds, 2008-2015; and senior officer of Columbia Funds and affiliated funds, 2003-2015 | 172 | Former Director, The Autism Project, March 2015-December 2021; former Member of the Investment Committee, St. Michael’s College, November 2015-February 2020; former Trustee, St. Michael’s College, June 2017-September 2019; former Trustee, New Century Portfolios (former mutual fund complex), January 2015-December 2017 |
| 46 | Columbia Short Duration Municipal Bond Fund | Annual Report 2023 |
TRUSTEES AND OFFICERS (continued)
(Unaudited)
Independent trustees (continued)
Name,
address,
year of birth | Position held
with the Columbia Funds and
length of service | Principal occupation(s)
during past five years
and other relevant
professional experience | Number of
Funds in the
Columbia Funds
Complex*
overseen | Other directorships
held by Trustee
during the past five years
and other relevant Board experience |
Olive M. Darragh
c/o Columbia Management
Investment Advisers, LLC
290 Congress Street
Boston, MA 02210
1962 | Trustee since 2020 | Managing Director of Darragh Inc. (strategy and talent management consulting firm), since 2010; Founder and CEO, Zolio, Inc. (investment management talent identification platform), since 2004; Consultant to Independent Trustees of CFVIT and CFST I from June 2019 to June 2020 with respect to CFVIT and to December 2020 with respect to CFST I; Partner, Tudor Investments, 2004-2010; Senior Partner, McKinsey & Company (consulting), 1990-2004; Touche Ross CPA, 1985-1988 | 172 | Treasurer, Edinburgh University US Trust Board, since January 2023; Member, HBS Community Action Partners Board, since September 2022; former Director, University of Edinburgh Business School (Member of US Board), 2004-2019; former Director, Boston Public Library Foundation, 2008-2017 |
Patricia M. Flynn
c/o Columbia Management
Investment Advisers, LLC
290 Congress Street
Boston, MA 02210
1950 | Trustee since 2004 | Professor of Economics and Management, Bentley University, since 2002; Dean, McCallum Graduate School of Business, Bentley University, 1992-2002 | 174 | Former Trustee, MA Taxpayers Foundation, 1997-2022; former Director, The MA Business Roundtable, 2003-2019; former Chairperson, Innovation Index Advisory Committee, MA Technology Collaborative, 1997-2020 |
Brian J. Gallagher
c/o Columbia Management
Investment Advisers, LLC
290 Congress Street
Boston, MA 02210
1954 | Trustee since 2017 | Retired; Partner with Deloitte & Touche LLP and its predecessors, 1977-2016 | 174 | Trustee, Catholic Schools Foundation, since 2004 |
Douglas A. Hacker
c/o Columbia Management
Investment Advisers, LLC
290 Congress Street
Boston, MA 02210
1955 | Trustee since 1996 | Independent business executive, since May 2006; Executive Vice President – Strategy of United Airlines, December 2002 - May 2006; President of UAL Loyalty Services (airline marketing company), September 2001-December 2002; Executive Vice President and Chief Financial Officer of United Airlines, July 1999-September 2001 | 174 | Director, SpartanNash Company since November 2013 (Chair of the Board, since May 2021) (food distributor); Director, Aircastle Limited (Chair of Audit Committee) (aircraft leasing), since August 2006; former Director, Nash Finch Company (food distributor), 2005-2013; former Director, SeaCube Container Leasing Ltd. (container leasing), 2010-2013; and former Director, Travelport Worldwide Limited (travel information technology), 2014-2019 |
Nancy T. Lukitsh
c/o Columbia Management
Investment Advisers, LLC
290 Congress Street
Boston, MA 02210
1956 | Trustee since 2011 | Senior Vice President, Partner and Director of Marketing, Wellington Management Company, LLP (investment adviser), 1997-2010; Chair, Wellington Management Portfolios (commingled non-U.S. investment pools), 2007-2010; Director, Wellington Trust Company, NA and other Wellington affiliates, 1997-2010 | 172 | None |
Columbia Short Duration Municipal Bond Fund | Annual Report 2023
| 47 |
TRUSTEES AND OFFICERS (continued)
(Unaudited)
Independent trustees (continued)
Name,
address,
year of birth | Position held
with the Columbia Funds and
length of service | Principal occupation(s)
during past five years
and other relevant
professional experience | Number of
Funds in the
Columbia Funds
Complex*
overseen | Other directorships
held by Trustee
during the past five years
and other relevant Board experience |
David M. Moffett
c/o Columbia Management
Investment Advisers, LLC
290 Congress Street
Boston, MA 02210
1952 | Trustee since 2011 | Retired; former Chief Executive Officer of Freddie Mac and Chief Financial Officer of U.S. Bank | 172 | Director, CSX Corporation (transportation suppliers); Director, PayPal Holdings Inc. (payment and data processing services); Trustee, University of Oklahoma Foundation; former Director, eBay Inc. (online trading community), 2007-2015; and former Director, CIT Bank, CIT Group Inc. (commercial and consumer finance), 2010-2016; former Senior Adviser to The Carlyle Group (financial services), March 2008-September 2008; former Governance Consultant to Bridgewater Associates, January 2013-December 2015 |
Catherine James Paglia
c/o Columbia Management
Investment Advisers, LLC
290 Congress Street
Boston, MA 02210
1952 | Trustee since 2004 | Director, Enterprise Asset Management, Inc. (private real estate and asset management company), since September 1998; Managing Director and Partner, Interlaken Capital, Inc., 1989-1997; Vice President, 1982-1985, Principal, 1985-1987, Managing Director, 1987-1989, Morgan Stanley; Vice President, Investment Banking, 1980-1982, Associate, Investment Banking, 1976-1980, Dean Witter Reynolds, Inc. | 174 | Director, Valmont Industries, Inc. (irrigation systems manufacturer), since 2012; Trustee, Carleton College (on the Investment Committee), since 1987; Trustee, Carnegie Endowment for International Peace (on the Investment Committee), since 2009 |
Natalie A. Trunow
c/o Columbia Management
Investment Advisers, LLC
290 Congress Street
Boston, MA 02210
1967 | Trustee since 2020 | Chief Executive Officer, Millennial Portfolio Solutions LLC (asset management and consulting services), January 2016-January 2021; Non-executive Member of the Investment Committee and Valuation Committee, Sarona Asset Management Inc. (private equity firm) since September 2019; Advisor, Horizon Investments (asset management and consulting services), August 2018-January 2022; Advisor, Paradigm Asset Management, November 2016-January 2022; Consultant to Independent Trustees of CFVIT and CFST I from September 2016 to June 2020 with respect to CFVIT and to December 2020 with respect to CFST I; Director of Investments/Consultant, Casey Family Programs, April 2016-November 2016; Senior Vice President and Chief Investment Officer, Calvert Investments, August 2008-January 2016; Section Head and Portfolio Manager, General Motors Asset Management, June 1997-August 2008 | 172 | Independent Director, Investment Committee, Health Services for Children with Special Needs, Inc., 2010-2021; Independent Director, (Executive Committee and Chair, Audit Committee), Consumer Credit Counseling Services (formerly Guidewell Financial Solutions), since 2016; Independent Director, (Investment Committee), Sarona Asset Management, since 2019 |
| 48 | Columbia Short Duration Municipal Bond Fund | Annual Report 2023 |
TRUSTEES AND OFFICERS (continued)
(Unaudited)
Independent trustees (continued)
Name,
address,
year of birth | Position held
with the Columbia Funds and
length of service | Principal occupation(s)
during past five years
and other relevant
professional experience | Number of
Funds in the
Columbia Funds
Complex*
overseen | Other directorships
held by Trustee
during the past five years
and other relevant Board experience |
Sandra L. Yeager
c/o Columbia Management
Investment Advisers, LLC
290 Congress Street
Boston, MA 02210
1964 | Trustee since 2017 | Retired; President and founder, Hanoverian Capital, LLC (SEC registered investment advisor firm), 2008-2016; Managing Director, DuPont Capital, 2006-2008; Managing Director, Morgan Stanley Investment Management, 2004-2006; Senior Vice President, Alliance Bernstein, 1990-2004 | 174 | Former Director, NAPE (National Alliance for Partnerships in Equity) Education Foundation, October 2016-October 2020; Advisory Board, Jennersville YMCA, since 2022 |
Interested trustee affiliated with Investment Manager**
Name,
address,
year of birth | Position held with the Columbia Funds and length of service | Principal occupation(s) during the
past five years and other relevant
professional experience | Number of
Funds in the
Columbia Funds
Complex overseen | Other directorships
held by Trustee
during the past
five years and
other relevant Board experience |
Daniel J. Beckman
c/o Columbia Management
Investment Advisers, LLC
290 Congress Street
Boston, MA 02210
1962 | Trustee since November 2021 and President since June 2021 | Vice President – Head of North America Product, Columbia Management Investment Advisers, LLC, since April 2015; President and Principal Executive Officer of the Columbia Funds, since June 2021; officer of Columbia Funds and affiliated funds, 2020-2021 | 174 | Director, Ameriprise Trust Company, since October 2016; Director, Columbia Management Investment Distributors, Inc. since November 2018; Board of Governors, Columbia Wanger Asset Management, LLC since, January 2022; Director, Columbia Threadneedle Canada, Inc., since December 2022 |
| * | The term “Columbia Funds Complex” as used herein includes Columbia Seligman Premium Technology Growth Fund, Tri-Continental Corporation and each series of Columbia Funds Series Trust (CFST), Columbia Funds Series Trust I (CFST I), Columbia Funds Series Trust II (CFST II), Columbia ETF Trust I (CET I), Columbia ETF Trust II (CET II), Columbia Funds Variable Insurance Trust (CFVIT) and Columbia Funds Variable Series Trust II (CFVST II). Messrs. Batejan, Beckman, Gallagher and Hacker and Mses. Blatz, Carlton, Carrig, Flynn, Paglia, and Yeager serve as directors of Columbia Seligman Premium Technology Growth Fund and Tri-Continental Corporation. |
| ** | Interested person (as defined under the 1940 Act) by reason of being an officer, director, security holder and/or employee of the Investment Manager or Ameriprise Financial. |
The Statement of Additional Information has additional information about the Fund’s Board members and is available, without charge, upon request by calling 800.345.6611, visiting columbiathreadneedleus.com/investor/ or contacting your financial intermediary.
Columbia Short Duration Municipal Bond Fund | Annual Report 2023
| 49 |
TRUSTEES AND OFFICERS (continued)
(Unaudited)
The Board has appointed officers who are responsible for day-to-day business decisions based on policies it has established. The officers serve at the pleasure of the Board. The following table provides basic information about the Officers of the Fund as of the printing of this report, including principal occupations during the past five years, although their specific titles may have varied over the period. In addition to Mr. Beckman, who is President and Principal Executive Officer, the Fund’s other officers are:
Fund officers
Name,
address and
year of birth | Position and year
first appointed to
position for any Fund
in the Columbia
Funds Complex or a
predecessor thereof | Principal occupation(s) during past five years |
Michael G. Clarke
290 Congress Street
Boston, MA 02210
1969 | Chief Financial Officer and Principal Financial Officer (2009) and Senior Vice President (2019) | Senior Vice President and Head of North America Operations & Investor Services, Columbia Management Investment Advisers, LLC, since June 2023 (previously Senior Vice President and Head of Global Operations, March 2022 – June 2023, Vice President, Head of North America Operations, and Co-Head of Global Operations, June 2019 - February 2022 and Vice President – Accounting and Tax, May 2010 - May 2019); senior officer of Columbia Funds and affiliated funds, since 2002. |
Joseph Beranek
5890 Ameriprise Financial Center
Minneapolis, MN 55474
1965 | Treasurer and Chief Accounting Officer (Principal Accounting Officer) (2019) and Principal Financial Officer (2020), CFST, CFST I, CFST II, CFVIT and CFVST II; Assistant Treasurer, CET I and CET II | Vice President – Mutual Fund Accounting and Financial Reporting, Columbia Management Investment Advisers, LLC, since December 2018 and March 2017, respectively. |
Marybeth Pilat
290 Congress Street
Boston, MA 02210
1968 | Treasurer and Chief Accounting Officer (Principal Accounting Officer) and Principal Financial Officer (2020) for CET I and CET II; Assistant Treasurer, CFST, CFST I, CFST II, CFVIT and CFVST II | Vice President – Product Pricing and Administration, Columbia Management Investment Advisers, LLC, since May 2017. |
William F. Truscott
290 Congress Street
Boston, MA 02210
1960 | Senior Vice President (2001) | Formerly, Trustee/Director of Columbia Funds Complex or legacy funds, November 2001-January 1, 2021; Chief Executive Officer, Global Asset Management, Ameriprise Financial, Inc., since September 2012; Chairman of the Board and President, Columbia Management Investment Advisers, LLC, since July 2004 and February 2012, respectively; Chairman of the Board and Chief Executive Officer, Columbia Management Investment Distributors, Inc., since November 2008 and February 2012, respectively; Chairman of the Board and Director, Threadneedle Asset Management Holdings, Sàrl, since March 2013 and December 2008, respectively; senior executive of various entities affiliated with Columbia Threadneedle. |
Christopher O. Petersen
5228 Ameriprise Financial Center
Minneapolis, MN 55474
1970 | Senior Vice President and Assistant Secretary (2021) | Formerly, Trustee/Director of funds within the Columbia Funds Complex, July 1, 2020 - November 22, 2021; Senior Vice President and Assistant General Counsel, Ameriprise Financial, Inc., since September 2021 (previously Vice President and Lead Chief Counsel, January 2015 - September 2021); formerly, President and Principal Executive Officer of the Columbia Funds, 2015 - 2021; officer of Columbia Funds and affiliated funds, since 2007. |
Thomas P. McGuire
290 Congress Street
Boston, MA 02210
1972 | Senior Vice President and Chief Compliance Officer (2012) | Vice President – Asset Management Compliance, Ameriprise Financial, Inc., since May 2010; Chief Compliance Officer, Columbia Acorn/Wanger Funds, since December 2015; formerly, Chief Compliance Officer, Ameriprise Certificate Company, September 2010 – September 2020. |
Ryan C. Larrenaga
290 Congress Street
Boston, MA 02210
1970 | Senior Vice President (2017), Chief Legal Officer (2017), and Secretary (2015) | Vice President and Chief Counsel, Ameriprise Financial, Inc., since August 2018 (previously Vice President and Group Counsel, August 2011 - August 2018); Chief Legal Officer, Columbia Acorn/Wanger Funds, since September 2020; officer of Columbia Funds and affiliated funds, since 2005. |
| 50 | Columbia Short Duration Municipal Bond Fund | Annual Report 2023 |
TRUSTEES AND OFFICERS (continued)
(Unaudited)
Fund officers (continued)
Name,
address and
year of birth | Position and year
first appointed to
position for any Fund
in the Columbia
Funds Complex or a
predecessor thereof | Principal occupation(s) during past five years |
Michael E. DeFao
290 Congress Street
Boston, MA 02210
1968 | Vice President (2011) and Assistant Secretary (2010) | Vice President and Chief Counsel, Ameriprise Financial, Inc., since May 2010; Vice President, Chief Legal Officer and Assistant Secretary, Columbia Management Investment Advisers, LLC, since October 2021 (previously Vice President and Assistant Secretary, May 2010 – September 2021). |
Lyn Kephart-Strong
5228 Ameriprise Financial Center
Minneapolis, MN 55474
1960 | Vice President (2015) | Vice President, Global Investment Operations Services, Columbia Management Investment Advisers, LLC, since 2010; President, Columbia Management Investment Services Corp., since October 2014; President, Ameriprise Trust Company, since January 2017. |
Liquidity Risk Management Program
(Unaudited)
Pursuant to Rule 22e-4 under the 1940 Act, the Fund has adopted a liquidity risk management program (Program). The Program’s principal objectives include assessing, managing and periodically reviewing the Fund’s liquidity risk. Liquidity risk is defined as the risk that the Fund could not meet redemption requests without significant dilution of remaining investors’ interests in the Fund.
The Board has appointed the Investment Manager as the program administrator for the Fund’s Program. The Investment Manager has delegated oversight of the Program to its Liquidity Risk Management Committee (the Committee). At a board meeting during the fiscal period, the Committee provided the Board with a report addressing the operations of the program and assessing its adequacy and effectiveness of implementation for the period January 1, 2022, through December 31, 2022, including:
| • | the Fund had sufficient liquidity to both meet redemptions and operate effectively on behalf of shareholders; |
| • | there were no material changes to the Program during the period; |
| • | the implementation of the Program was effective to manage the Fund’s liquidity risk; and |
| • | the Program operated adequately during the period. |
There can be no assurance that the Program will achieve its objectives in the future. Please refer to the Fund’s prospectus for more information regarding the Fund’s exposure to liquidity risk and other principal risks to which an investment in the Fund may be subject.
Columbia Short Duration Municipal Bond Fund | Annual Report 2023
| 51 |
Columbia Short Duration Municipal Bond Fund
P.O. Box 219104
Kansas City, MO 64121-9104
Please read and consider the investment objectives, risks, charges and expenses for any fund carefully before investing. For a prospectus and summary prospectus, which contains this and other important information about the Fund, go to
columbiathreadneedleus.com/investor/. The Fund is distributed by Columbia Management Investment Distributors, Inc., member FINRA, and managed by Columbia Management Investment Advisers, LLC.
Columbia Threadneedle Investments (Columbia Threadneedle) is the global brand name of the Columbia and Threadneedle group of companies. All rights reserved.
© 2023 Columbia Management Investment Advisers, LLC.
columbiathreadneedleus.com/investor/
Item 2. Code of Ethics.
(a) | The registrant has adopted a code of ethics that applies to the registrant’s principal executive officer, principal financial officer, principal accounting officer or controller, or persons performing similar functions, regardless of whether these individuals are employed by the registrant or a third party. |
(b) | During the period covered by this report, there were not any amendments to a provision of the code of ethics that applies to the registrant’s principal executive officer, principal financial officer, principal accounting officer or controller, or persons performing similar functions, regardless of whether these individuals are employed by the registrant or a third party, and that relates to any element of the code of ethics definition enumerated in paragraph (b) of this Item. |
(c) | During the period covered by this report, there were no waivers, including any implicit waivers, from a provision of the code of ethics to the registrant’s principal executive officer, principal financial officer, principal accounting officer or controller, or persons performing similar functions, regardless of whether these individuals are employed by the registrant or a third party that relates to one or more of the items set forth in paragraph (b) of this Item. |
Item 3. Audit Committee Financial Expert.
The registrant’s Board of Trustees has determined that David M. Moffett, Brian J. Gallagher, J. Kevin Connaughton, Sandra L. Yeager, and Douglas A. Hacker, each of whom are members of the registrant’s Board of Trustees and Audit Committee, each qualify as an audit committee financial expert. Mr. Moffett, Mr. Gallagher, Mr. Connaughton, Ms. Yeager, and Mr. Hacker are each independent trustees, as defined in paragraph (a)(2) of this item’s instructions.
Item 4. Principal Accountant Fees and Services.
Fee information below is disclosed for the five series of the registrant whose reports to stockholders are included in this annual filing.
(a) Audit Fees. Aggregate Audit Fees billed by the principal accountant for professional services rendered during the fiscal years ended April 30, 2023 and April 30, 2022 are approximately as follows:
| |
2023 | 2022 |
$160,700 | $161,500 |
Audit Fees include amounts related to the audit of the registrant’s annual financial statements or services that are normally provided by the accountant in connection with statutory and regulatory filings or engagements for those fiscal years.
(b) Audit-Related Fees. Aggregate Audit-Related Fees billed to the registrant by the principal accountant for professional services rendered during the fiscal years ended April 30, 2023 and April 30, 2022 are approximately as follows:
Audit-Related Fees, if any, include amounts for assurance and related services by the principal accountant that are reasonably related to the performance of the audit of the registrant’s financial statements and are not reported in Audit Fees above.
During the fiscal years ended April 30, 2023 and April 30, 2022, there were no Audit-Related Fees billed by the registrant’s principal accountant to the registrant’s investment adviser (not including any sub-adviser whose role is primarily portfolio management and is subcontracted with or overseen by another investment adviser) and any entity controlling, controlled by, or under common control with the adviser that provides ongoing services to the registrant for an engagement that related directly to the operations and financial reporting of the registrant.
(c) Tax Fees. Aggregate Tax Fees billed by the principal accountant to the registrant for professional services rendered during the fiscal years ended April 30, 2023 and April 30, 2022 are approximately as follows:
| |
2023 | 2022 |
$62,500 | $19,000 |
Tax Fees include amounts for the review of annual tax returns, the review of required shareholder distribution calculations and typically include amounts for professional services by the principal accountant for tax compliance, tax advice and tax planning.
During the fiscal years ended April 30, 2023 and April 30, 2022, there were no Tax Fees billed by the registrant’s principal accountant to the registrant’s investment adviser (not including any sub-adviser whose role is primarily portfolio management and is subcontracted with or overseen by another investment adviser) and any entity controlling, controlled by, or under common control with the adviser that provides ongoing services to the registrant for an engagement that related directly to the operations and financial reporting of the registrant.
(d) All Other Fees. Aggregate All Other Fees billed by the principal accountant to the registrant for professional services rendered during the fiscal years ended April 30, 2023 and April 30, 2022 are approximately as follows:
All Other Fees, if any, include amounts for products and services provided by the principal accountant, other than the services reported in paragraphs (a) through (c) above.
Aggregate All Other Fees billed by the registrant’s principal accountant to the registrant’s investment adviser (not including any sub-adviser whose role is primarily portfolio management and is subcontracted with or overseen by another investment adviser) and any entity controlling, controlled by, or under common control with the adviser that provides ongoing services to the registrant for an engagement that related directly to the operations and financial reporting of the registrant during the fiscal years ended April 30, 2023 and April 30, 2022 are approximately as follows:
| |
2023 | 2022 |
$541,000 | $535,000 |
In fiscal years 2023 and 2022, All Other Fees primarily consists of fees billed for internal control examinations of the registrant’s transfer agent and investment adviser.
(e)(1) Audit Committee Pre-Approval Policies and Procedures
The registrant’s Audit Committee is required to pre-approve the engagement of the registrant’s independent auditors to provide audit and non-audit services to the registrant and non-audit services to its investment adviser (excluding any sub-adviser whose role is primarily portfolio management and is sub-contracted or overseen by another investment adviser (the “Adviser”) or any entity controlling, controlled by or under common control with the Adviser that provides ongoing services to the Fund (a “Control Affiliate”) if the engagement relates directly to the operations and financial reporting of the registrant.
The Audit Committee has adopted a Policy for Engagement of Independent Auditors for Audit and Non-Audit Services (the “Policy”). The Policy sets forth the understanding of the Audit Committee regarding the engagement of the registrant’s independent accountants to provide (i) audit and permissible audit-related, tax and other services to the registrant (“Fund Services”); (ii) non-audit services to the registrant’s Adviser and any Control Affiliates, that relates directly to the operations and financial reporting of a Fund (“Fund-related Adviser Services”); and (iii) certain other audit and non-audit services to the registrant’s Adviser and its Control Affiliates. A service will require specific pre-approval by the Audit Committee if it is to be provided by the Fund’s independent auditor; provided, however, that pre-approval of non-audit services to the Fund, the Adviser or Control Affiliates may be waived if certain de minimis requirements set forth in the SEC’s rules are met.
Under the Policy, the Audit Committee may delegate pre-approval authority to any pre-designated member or members who are independent board members. The member(s) to whom such authority is delegated must report, for informational purposes only, any pre-approval decisions to the Audit Committee at its next regular meeting. The Audit Committee's responsibilities with respect to the pre-approval of services performed by the independent auditor may not be delegated to management.
On an annual basis, at a regularly scheduled Audit Committee meeting, the Fund’s Treasurer or other Fund officer shall submit to the Audit Committee a schedule of the types of Fund Services and Fund-related Adviser Services that are subject to specific pre-approval. This schedule will provide a description of each type of service that is subject to specific pre-approval, along with total projected fees for each service. The pre-approval will generally cover a one-year period. The Audit Committee will review and approve the types of services and the projected fees for the next one-year period and may add to, or subtract from, the list of pre-approved services from time to time, based on subsequent determinations. This specific approval acknowledges that the Audit Committee is in agreement with the specific types of services that the independent auditor will be permitted to perform and the projected fees for each service.
The Fund’s Treasurer or other Fund officer shall report to the Audit Committee at each of its regular meetings regarding all Fund Services or Fund-related Adviser Services provided since the last such report was rendered, including a description of the services, by category, with forecasted fees for the annual reporting period, proposed changes requiring specific pre-approval and a description of services provided by the independent auditor, by category, with actual fees during the current reporting period.
*****
(e)(2) None, or 0%, of the Audit-Related Fees, Tax Fees and All Other Fees paid by the Fund or affiliated entities relating directly to the operations and financial reporting of the Registrant disclosed above were approved by the audit committee pursuant to paragraphs (c)(7)(i)(C) of Rule 2-01 of Regulation S-X (which permits audit committee approval after the start of the engagement with respect to services other than audit, review or attest services, if certain conditions are satisfied).
(f) Not applicable.
(g) The aggregate non-audit fees billed by the registrant’s accountant for services rendered to the registrant, and rendered to the registrant’s investment adviser (not including any sub-adviser whose role is primarily portfolio management and is subcontracted with or overseen by another investment adviser), and any entity controlling, controlled by, or under common control with the adviser that provides ongoing services to the registrant for the fiscal years ended April 30, 2023 and April 30, 2022 are approximately as follows:
| |
2023 | 2022 |
$603,500 | $554,000 |
(h) The registrant’s Audit Committee of the Board of Directors has considered whether the provision of non-audit services that were rendered to the registrant’s adviser (not including any sub-adviser whose role is primarily portfolio management and is subcontracted with or overseen by another investment adviser), and any entity controlling, controlled by, or under common control with the investment adviser that provides ongoing services to the registrant that were not pre-approved pursuant to paragraph (c)(7)(ii) of Rule 2-01 of Regulation S-X, is compatible with maintaining the principal accountant’s independence.
Item 5. Audit Committee of Listed Registrants.
Not applicable.
Item 6. Investments
(a) | The registrant’s “Schedule I – Investments in securities of unaffiliated issuers” (as set forth in 17 CFR 210.12-12) is included in Item 1 of this Form N-CSR. |
Item 7. Disclosure of Proxy Voting Policies and Procedures for Closed-End Management Investment Companies.
Not applicable.
Item 8. Portfolio Managers of Closed-End Management Investment Companies.
Not applicable.
Item 9. Purchases of Equity Securities by Closed-End Management Investment Company and Affiliated Purchasers.
Not applicable.
Item 10. Submission of Matters to a Vote of Security Holders.
There were no material changes to the procedures by which shareholders may recommend nominees to the registrant's board of directors.
Item 11. Controls and Procedures.
(a) | The registrant’s principal executive officer and principal financial officer, based on their evaluation of the registrant’s disclosure controls and procedures as of a date within 90 days of the filing of this report, have concluded that such controls and procedures are adequately designed to ensure that information required to be disclosed by the registrant in Form N-CSR is accumulated and communicated to the registrant’s management, including the principal executive officer and principal financial officer, or persons performing similar functions, as appropriate to allow timely decisions regarding required disclosure. |
(b) | There was no change in the registrant's internal control over financial reporting that occurred during the period covered by this report that has materially affected, or is reasonably likely to materially affect, the registrant's internal control over financial reporting. |
Item 12. Disclosure of Securities Lending Activities for Closed-End Management Investment Companies
Not applicable.
Item 13. Exhibits.
(a)(1) Code of ethics required to be disclosed under Item 2 of Form N-CSR attached hereto as Exhibit 99.CODE ETH.
(a)(2) Certifications pursuant to Rule 30a-2(a) under the Investment Company Act of 1940 (17 CFR 270.30a-2(a)) attached hereto as Exhibit 99.CERT.
(b) Certification pursuant to Rule 30a-2(b) under the Investment Company Act of 1940 (17 CFR 270.30a-2(b)) attached hereto as Exhibit 99.906CERT.
SIGNATURES
Pursuant to the requirements of the Securities Exchange Act of 1934 and the Investment Company Act of 1940, the registrant has duly caused this report to be signed on its behalf by the undersigned, thereunto duly authorized.
(registrant) | Columbia Funds Series Trust |
| |
By (Signature and Title) | /s/ Daniel J. Beckman |
| Daniel J. Beckman, President and Principal Executive Officer |
| |
Date | June 22, 2023 |
| |
| |
Pursuant to the requirements of the Securities Exchange Act of 1934 and the Investment Company Act of 1940, this report has been signed below by the following persons on behalf of the registrant and in the capacities and on the dates indicated.
By (Signature and Title) | /s/ Daniel J. Beckman |
| Daniel J. Beckman, President and Principal Executive Officer |
| |
Date | June 22, 2023 |
By (Signature and Title) | /s/ Michael G. Clarke |
| Michael G. Clarke, Chief Financial Officer, |
| Principal Financial Officer and Senior Vice President |
| |
Date | June 22, 2023 |
By (Signature and Title) | /s/ Joseph Beranek |
| Joseph Beranek, Treasurer, Chief Accounting |
| Officer and Principal Financial Officer |
| |
Date | June 22, 2023 |