FORM 6-K
SECURITIES AND EXCHANGE COMMISSION
Washington, D.C. 20549
Report of Foreign Private Issuer
Pursuant to Rule 13a-16 or 15d-16
of the Securities Exchange Act of 1934
For the month of November 5th, 2003
Commission File Number: 000-28011
Terra Networks, S.A.
(Translation of registrant’s name into English)
Paseo de la Castellana, 92
28.046 Madrid
Spain
(34) 91-452-3900
(Address of principal executive offices)
Indicate by check mark whether the registrant files or will file annual reports under cover of Form 20-F or Form 40-F:
| Form 20-F X | Form 40-F |
Indicate by check mark if the registrant is submitting the Form 6-K in paper as permitted by Regulation S-T Rule 101(b)(1):
| Yes | No X |
Indicate by check mark if the registrant is submitting the Form 6-K in paper as permitted by Regulation S-T Rule 101(b)(7):
| Yes | No X |
Indicate by check mark whether by furnishing the information contained in this Form, the registrant is also thereby furnishing the information to the Commission pursuant to Rule 12g3-2(b) under the Securities Exchange Act of 1934:
| Yes | No X |
If “Yes” is marked, indicate below the file number assigned to the registrant in connection with Rule 12g3-2(b): N/A
Terra Networks, S.A.
TABLE OF CONTENTS
Item | Sequential Page Number | |||
1 | 9 month-03 Terra Lycos Financial Results SLIDES | 26 |

TERRA LYCOS
January - September
2003 Results

Safe Harbor Statement
This document contains statements that constitute forward-looking statements within the meaning of
the Private Securities Litigation Reform Act of 1995. These statements appear in a number of places
in this document and include statements regarding the intent, belief or current expectations of the
customer base, estimates regarding future growth in the different business lines and the global
business, market share, financial results and other aspects of the activities and situation relating to the
Company. The forward-looking statements in this document can be identified, in some instances, by
the use of words such as "expects", "anticipates", "intends", "believes" and similar language or the
negative thereof or by the forward-looking nature of discussions of strategy, plans or intentions.
Such forward looking statements are not guarantees of future performance and involve risks and
uncertainties, and actual results may differ materially from those in the forward looking statements as
a result of various factors.
Analysts and investors are cautioned not to place undue reliance on those forward looking statements,
which speak only as of the date of this presentation. Terra Lycos undertakes no obligation to release
publicly the results of any revisions to these forward looking statements which may be made to reflect
events and circumstances after the date of this document, including, without limitation, changes in
Terra Lycos business or acquisition strategy or to reflect the occurrence of unanticipated events.
Analysts and investors are encouraged to consult the Company's Annual Report on Form 20-F as well
as periodic filings made on Form 6-K, which are on file with the United States Securities and
Exchange Commission.

Joaquim Agut
Chief Executive Officer
January - September 2003 Results
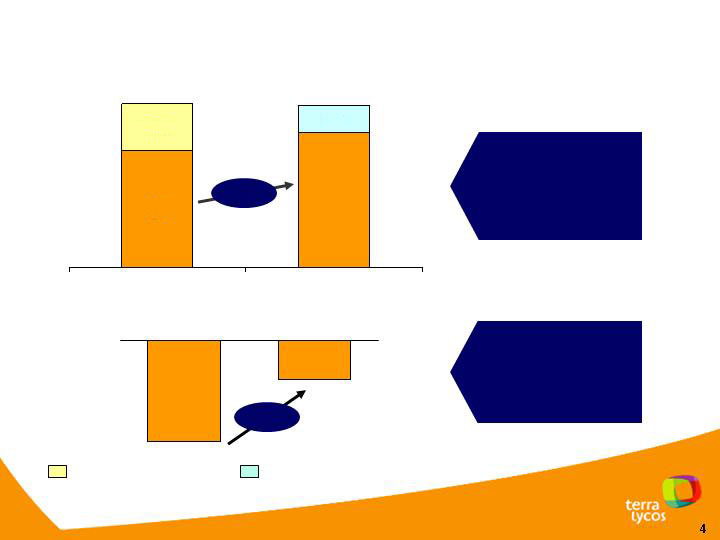
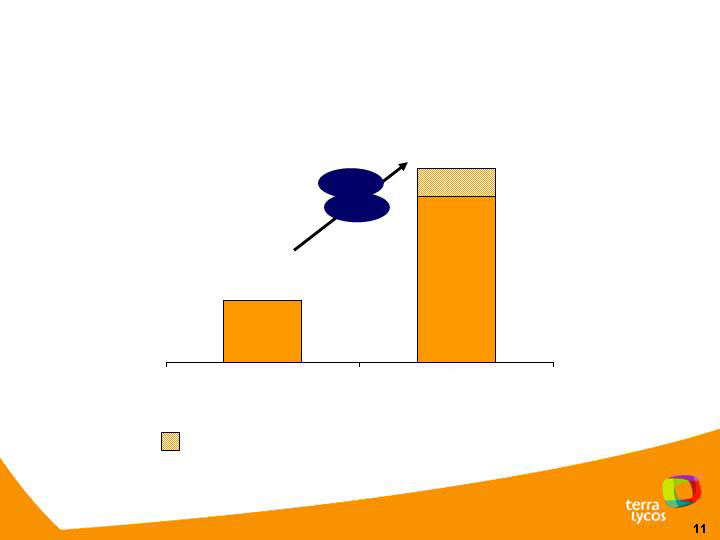
Highlights YTD 2003 vs YTD 2002
Total Revenues
increased by 15%,
excluding BAG/Tef
and fx (€72MM)
+ 62 %
EBITDA margin
improved by 62%
YTD Sept 02
YTD Sept 03 e/fx
- 21%
- 8 %
(Million EUR)
468
463
TEF Alliance revenues
BAG Alliance revenues
BAG
TEF
+15 %
335
133
77
386
YTD Sept 02
YTD Sept 03 e/fx
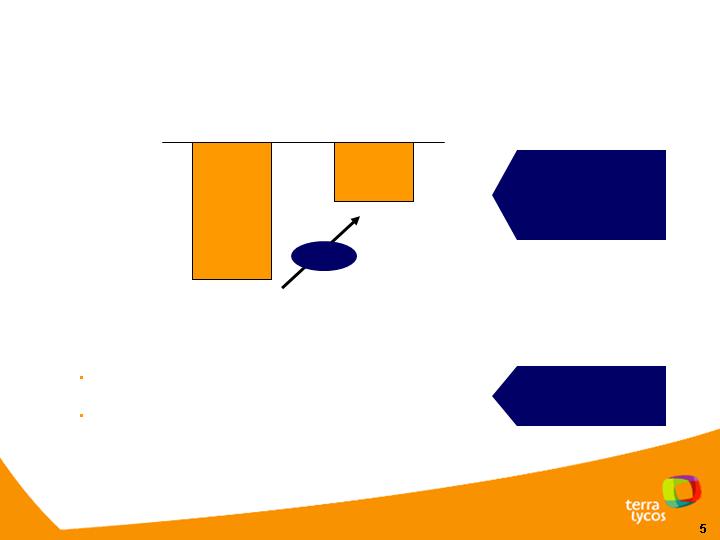
Highlights January - September 2003
Total Paid subscribers: 4.600K, 82% growth;
Broadband subscribers: 543K, 34% of total paid Access subscribers
+ 59 %
Net Results
improved 195MM
Euro
YTD Sept 02
YTD Sept 03
-332
-137
Number of clients
(thousands)

Total Revenues
January - September 2003
(Million EUR)
15% growth net of
BAG/Tef and Fx
impacts
468
463
TEF Alliance revenues
BAG Alliance revenues
+ 51
BAG
TEF
BAG/Tef net impact
of - 56 ME
Fx impact of – 72
million Euro
+15 %
133
335
386
YTD Sept 03 e/fx
YTD Sept 02
77

Total Revenue Mix
YTD Sept 02
YTD Sept 03 e/fx
36%
I. Access Subscriptions II. Advertising and E-Commerce Revenues
III. Communication, Portal and Content Services IV. Other Revenues
38
33
228
169
54
103
121
185
468
463
49%
7%
8%
40%
26%
22%
12%
(Million EUR)
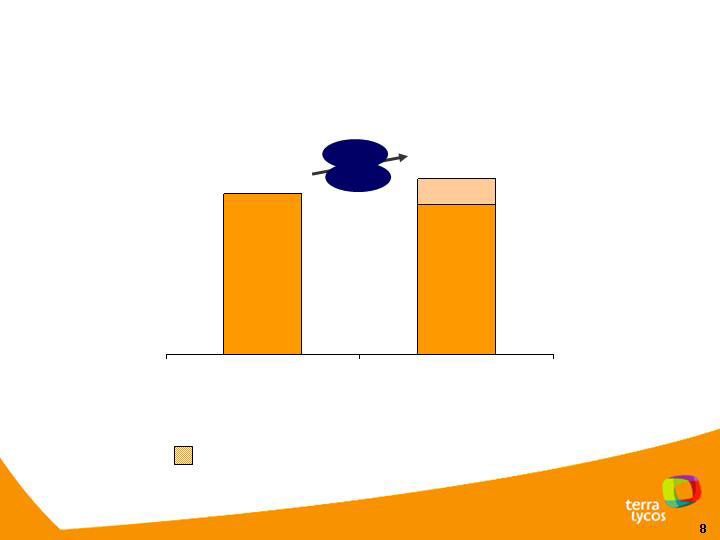
Access Subscription Revenues
(Million EUR)
169
185
Fx Impact
YTD Sept 03 e/fx
YTD Sept 02
+ 16
27
158
+ 10 %

Paying Access Subscribers
(Thousand subscribers)
1,393
1,051
342
1,035
543
YTD Sept 02
YTD Sept 03
1,578
Broadband
Narrowband
+201
25%
75%
34%
66%
+13 %
+186
+59%
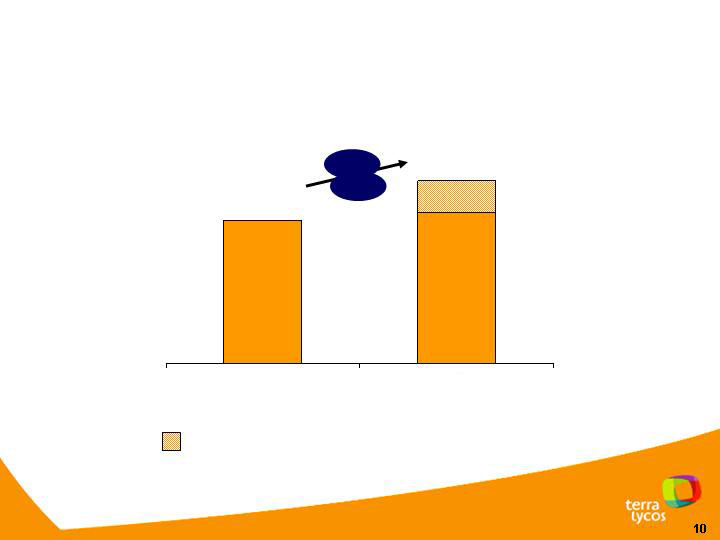
Advertising and E-Commerce Revenues
(Million EUR)
121
Fx Impact
+26
95
YTD Sept 02 Net of BAG
YTD Sept 03 e/fx
21
100
+27%
Communication, Portal and Content
Services Revenues
(Million EUR)
33
103
Fx Impact
+70
+212%
88
YTD Sept 02
YTD Sept 03 e/fx
15

Corporate Services and Other Revenues
(Million EUR)
38
54
Fx Impact
+16
+43%
9
45
YTD Sept 02
YTD Sept 03 e/fx

CSP/OBP Subscribers
(Thousand subs)
1,137
3,024
+166%
TL
TEF
+1,887
643
1,244
YTD Sept 02
YTD Sept 03

Revenue Breakdown by Country
23%
20%
15%
42%
YTD Sept 02
YTD Sept 03
30%
32%
14%
24%
Wide geographical coverage, consistent
with the Telefonica agreement
Revenues
Clients
EBITDA
N. Results

EBITDA Evolution
YTD 02
+13 BP
- 21%
YTD 03
YTD 03 e/fx
+11BP
Operational improvements on track to beat our 2003 EBITDA guidance
+ 62
+ 63
January - September
(Million EUR)
-100
- 10%
- 8%
-37
-38

Alliance with Telefónica
Achieved 68% of 78.5 million Euro guaranteed value
YTD execution on track to achieve guaranteed value
by year end
REVENUE
YTD Sept 03
I.
Internet Communication and portal
services and infrastructures
II.
Corporate Services: Terra Biz
III.
Online Advertising and IMS
IV.
Consulting
TOTAL
49
3
9
5
66
(Million EUR)

Global Operations
Successful migration into 2 Datacenters in US, covering both
the US and part of Latam countries: delivering savings of 4
million Euro in H2’03
Improved New Product Introduction cycle times with a total of
10 products being launched in the last quarter
Examples of Products/Services launched in the quarter:
Conecta Disney in Spain and Brazil
WorldCybergames in Spain
Side Search in the US
Common Search Platform across most geographies
Web EDI in Brazil
New Matchmaker design in the US

Elías Rodríguez-Viña
Chief Financial Officer
January - September 2003 Results
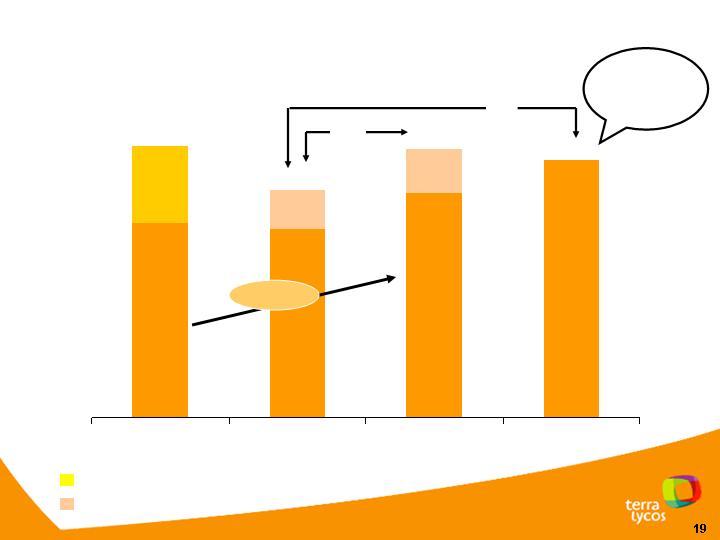
Total YTD Revenues (30.09)
+ 15%
YTD 02
YTD 03
YTD 03
FxYTD 02
YTD 03
at 2002 average
exchange rate
GUIDANCE
445
463
72
Fx
impact
54
Fx
impact
468
133
335
386
77
325
391
66
(Million EUR)
BAG Alliance revenues
Tef Alliance revenues
In line with
guidance of
€570 – 620M
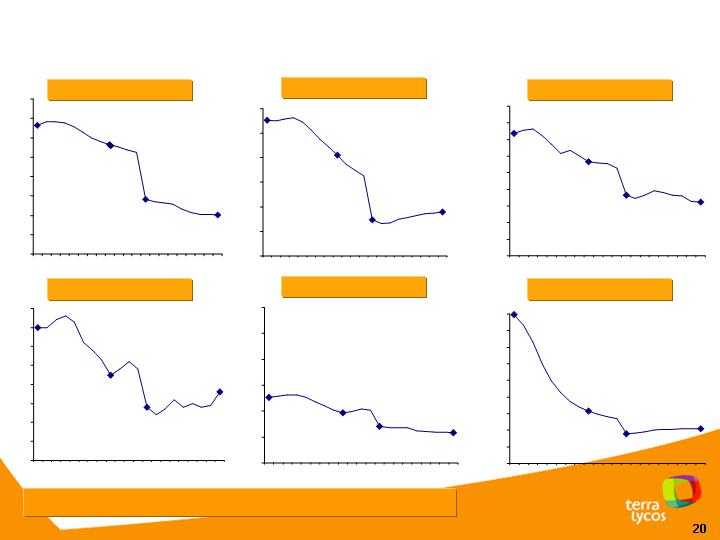
Total YTD Revenues – Significant Fx impact
65% of Revenues are not denominated in Euros
US Dollar
Mexican Peso
Brazilian Real
Chilean Peso
Argentine Peso
Peruvian Nuevo Sol
Jan 02
Sep 02
Jan 03
Sep 03
Jan 02
Sep 02
Jan 03
Sep 03
Jan 02
Sep 02
Jan 03
Sep 03
Jan 02
Sep 02
Jan 03
Sep 03
Jan 02
Sep 02
Jan 03
Sep 03
Jan 02
Sep 02
Jan 03
Sep 03
1.1321
0.9415
1.0822
0.9008
0.8000
0.8500
0.9000
0.9500
1.0000
1.0500
1.1000
1.1500
1.2000
-17%
0.2892
0.4760
0.2738
0.4050
0.2000
0.2500
0.3000
0.3500
0.4000
0.4500
0.5000
-29%
0.0824
0.0865
0.1064
0.0500
0.0600
0.0700
0.0800
0.0900
0.1000
0.1100
0.1200
0.1300
0.1400
-23%
0.0014
0.0015
0.0013
0.0017
0.0010
0.0011
0.0012
0.0013
0.0014
0.0015
0.0016
0.0017
0.0018
-6%
0.2586
0.3260
0.2702
0.2970
0.2000
0.2500
0.3000
0.3500
0.4000
0.4500
0.5000
-13%
0.3042
0.6490
0.2892
0.3573
0.2000
0.2500
0.3000
0.3500
0.4000
0.4500
0.5000
0.5500
0.6000
0.6500
-15%

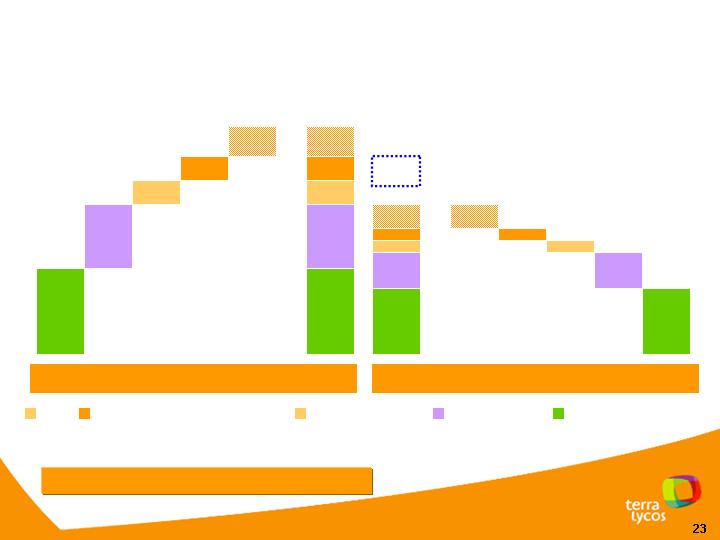
Total YTD Revenues (30.09)
BAG/TEF & Fx impacts
YTD 02
BAG
YTD 03 FxYTD 02
net of TEF
TEF
Fx
YTD 03
reported
YTD 02
net of
BAG
€ 468M
€ 335M
€ 386M
€ -72M
€ +77M
€ 391M
€ -133M
+15%
Excluding BAG/TEF
(Million EUR)
Change of contract –56 million Euro

Total revenue breakdown
By Business line
€ 468M
€ 391M
€ 463M
YTD 02
YTD 03
YTD 03
FxYTD 02
38
33
228
169
54
103
121
185
45
88
100
158
(8%)
(36%)
(49%)
(7%)
(11%)
(41%)
(25%)
(23%)
Other revenues
Communication,
Portal and Content
Services
Advertising and
e-Commerce
Access Subscription
Var %
+ 43 %
+ 212%
- 47%
+ 10%
Revenue diversification with more stable revenue sources
(40%)
(26%)
(22%)
(12%)
Base cost breakdown and evolution
229M
274M
341M
YTD 02
48
YTD 03
Fx impact
31
29
96
137
45
37
21
54
93
Other
Maintenance, supplies and leases
(excluding Lycos equipment leases)
Professional services
Marketing
and Commissions
Personnel expenses
Base cost reduction across the board
24
Progress on our Path to Profitability
YTD 02
-100
-37
+13 BP
-21%
-10%
YTD 03
-8%
-38
YTD 03 FxYTD 02
+11 BP
+63M
+62 M
(Million EUR)
Continuing improvement on our path to profitability
YTD 03

Q & A
Session
January - September 2003 Results

Thank You
SIGNATURES
Pursuant to the requirements of the Securities Exchange Act of 1934, the registrant has duly caused this report to be signed on its behalf by the undersigned, thereunto duly authorized.
TERRA NETWORKS, S.A. | ||||||||
| Date: | November 5, 2003 | By: | /s/ ELÍAS RODRÍGUEZ-VIÑA CANCIO | |||||
Name: Elías Rodríguez-Viña Cancio Title: Chief Financial Officer Terra Networks, S.A. | ||||||||