FORM 6-K
SECURITIES AND EXCHANGE COMMISSION
Washington, D.C. 20549
Report of Foreign Private Issuer
Pursuant to Rule 13a-16 or 15d-16
of the Securities Exchange Act of 1934
For the month of July 23rd, 2003
Commission File Number: 000-28011
Terra Networks, S.A.
(Translation of registrant’s name into English)
Paseo de la Castellana, 92
28.046 Madrid
Spain
(34) 91-452-3900
(Address of principal executive offices)
Indicate by check mark whether the registrant files or will file annual reports under cover of Form 20-F or Form 40-F:
Form 20-F X Form 40-F
Indicate by check mark if the registrant is submitting the Form 6-K in paper as permitted by Regulation S-T Rule 101(b)(1):
Yes No X
Indicate by check mark if the registrant is submitting the Form 6-K in paper as permitted by Regulation S-T Rule 101(b)(7):
Yes No X
Indicate by check mark whether by furnishing the information contained in this Form, the registrant is also thereby furnishing the information to the Commission pursuant to Rule 12g3-2(b) under the Securities Exchange Act of 1934:
Yes No X
If “Yes” is marked, indicate below the file number assigned to the registrant in connection with Rule 12g3-2(b): N/A
Terra Networks, S.A.
TABLE OF CONTENTS
Item | Sequential Page Number | |||
1 | 1H-04 Earnings Release Financial Report | 33 |
 |
 |
 |
 |
1. Terra Lycos Group Financial Results Analysis
| • | Revenue |
| • | Costs and Expenses |
| • | Cash and Capex |
2. Financial Statements
| • | Consolidated Statement of Operations |
| • | Notes to Consolidated Statement of Operations |
| • | Consolidated Balance Sheet |
| • | Cash Flow and Change in Net Debt Position |
| • | Operating Data |
3. Historic Data
| • | Consolidated Statements of Operations |
| • | Notes to Consolidated Statements of Operations |
| • | Consolidated Balance Sheet |
| • | Operating Data |
4. Other Information
| • | Description of main Consolidated Statement of Operations accounts and EBITDA |
| • | Main Fully and Equity Consolidated companies |
| • | Relevant Facts filed with the CNMV/SEC |
| • | Press releases |
| • | Contact information |
2

Terra Lycos Group Results
| Note: | The rounding-off of figures has produced small differences in the partial totals shown and in the percentage changes stated |
3

Terra Lycos Group Results
Key highlights:
| • | 5.7 million paid subscribers: 3.9 million (CSP/Portal) clients and 1.8 million access subscribers. |
| • | Y-o-y growth of 76% in broadband subscribers in Spain and Latin America to over 840,000. At June 30, 2004, these customers represented 46 % of the total paid access subscriber base (vs. 31 % in 1H03). |
| • | Terra Lycos is still the largest internet access service company in Latin America, with a total of 1.5 million paid subs, of which 650,000 are broadband subscribers. |
| • | Revenues amounted to 275 million euros, an improvement of over 21 million euros since the same period last year. Stripping out the forex effect, revenues in constant euros were 287 million euros, +13%. |
| • | EBITDA was 2.4 million euros, with a margin of 1% and an advance of 30.6 million euros or 12 basis points compared to the same period last year. |
| • | Net income was -69 million euros, an improvement of 29 million euros compared to the 98 million euro loss reported last year. |
| • | The cash balance at the end of June 2004 was 1.6 billion euros. Operating cash flow was positive, totaling 20 million euros. |
| • | The Ordinary General Shareholders’ Meeting held on June 22nd, 2004 approved payment of a gross dividend of 2 euros for each of the Company’s shares in issue, for a total of 1.1 billion euros. |
| • | The Ordinary General Shareholders’ Meeting of June 22nd 2004 approved a share capital reduction by the sum of 53 million euros via the amortization of 26.5 million own shares. |
4
Revenue
Terra Lycos reported revenues of 275 million euros in the first half of 2004, 21 million euros more than in the same period last year. In constant euros, this amounted to 287 million euros, an increase of 13% y-o-y. Approximately 59% of consolidated revenues derived from countries with currencies other than the euro.
Revenues in the first six months of 2004, excluding OneTravel (included in the consolidation perimeter since April 2003) would have included 16 million euros.
The alliance with Telefónica yielded revenues of 59 million euros, 16 million euros more than in the first half of 2003.
Revenue by Business Line
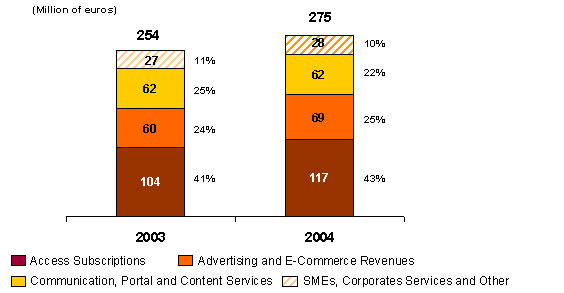
Revenues from the accessbusiness in the first six months of the year stood at 117 million euros, up 12% on the same period a year earlier. This business line represents 43% of total revenues vs. 41 % in the first half of 2003 and growth is based largely on the sustained increase in the number of subscribers to broadband services, especially in Brazil and, to a lesser extent, in Chile.
5
Paid Access Subs
(Thousand of subscribers)
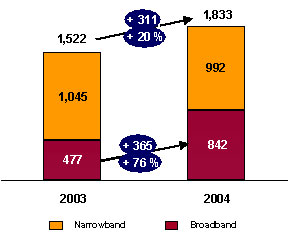
Paid access subscribers now exceed 1.8 million, an increase of 20%. Narrowband customers account for 54% of the total while broadband customers account for the remaining 46%.
In one year, broadband subscribers have increased by 364,000 or 76% to 842,000. This represents 46% total paid access subscribers compared with 31% at the end of June 2003. In Brazil, the number of subscribers increased 244,000, or 83%, in Spain the number rose 57,000, or 42 %, and in Chile by 59,000 or 125 %, exceeding the 100,000 customer mark. Growth in subscriber numbers in Spain slowed compared with March 2004 as the effects of the Christmas campaign were still being felt in the first quarter of 2004.
Narrowband subscribers fell by 5% compared with the previous year due largely to migration to free and broadband products.
In line with the rest of the market, monthly ARPU1 from paid access subscribers continued to decline: from 10.9 euros in the first half of 2003 to 9.9 euros in the first half of 2004 (or 10.1 in constant euros). This was mostly due to the change in the structure of ADSL tariffs in Brazil following Telesp’s launch of its new portfolio of Speedy products in September 2003. At the same time, the decline in ARPU reflects the group’s penetration of market segments with lower prices both in narrow and broad band.
| 1 | Monthly ARPU = {(access revenues – induced traffic revenues) / [(customers at the start of the period + customers at the end of the period) / 2 ]} / months elapsed |
6
Advertising and E-commerce revenues were 69 million euros, an increase of 15% versus the same period last year. These businesses account for 25% of total revenues vs. 24% in 2003. Around 6% of advertising and e-commerce revenues are generated from the alliance with Telefónica. Revenue growth in this activity in this half was mainly due to the increase in revenues from One Travel after its full consolidation in April 2003. In local currency, advertising and e-commerce revenues in Spain and Brazil recorded y-o-y growth of 21% and 29% respectively.
The US business, including One Travel, made the largest contribution to advertising and e-commerce revenues with 45 million euros or 66% of Advertising and E-commerce revenues.
Communication, Portal and Content Servicesrevenues amounted to 62 million euros in line with the same period last year (22% of total revenues vs. 25% in 2003). 54% of revenues from this activity derive from the alliance with Telefónica.
We would point out that in 1H03 revenues of 19 million euros were booked from the sale of software licences in Brazil within the framework of the Telefónica alliance. Organic growth, in constant euros and stripping out one-off revenues, was 253%, driven by steady growth in OBP/CSP subscribers.
OBP (CSP/Portal) Subs
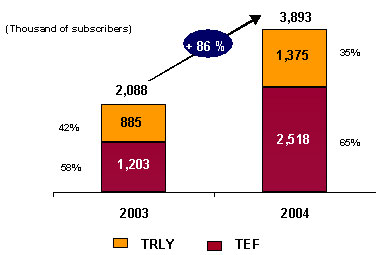
Paid communication and content subscribers, including corporate and SME customers, increased by 1.8 million or 86% to close to 3.9 million. A third of these are Terra Lycos subscribers while the remainder derives from the Telefónica alliance.
7
Revenues fromSMEs, Corporate Services and Othersstood at 28 million euros, in line with the same period last year, and accounted for 10% of total group revenues compared with 11% in 1H03. 25% derived from the Telefónica alliance and correspond to auditing,e-learningand consultancy services.
Revenue by Country
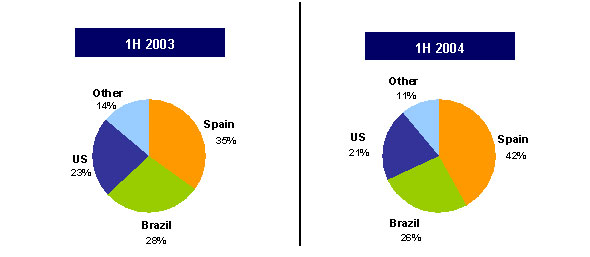
The breakdown of Terra Lycos revenues by country remains unchanged, with Spain, Brazil and the US still the most significant markets.
Spain, with y-o-y growth of 29%, generated revenues of 116 million euros, or 42% of total group revenues (35 % in 1H03). This growth was due mainly to the increase in the number of subscribers both for paid access services and OBP and the rendering of consultancy services within the framework of the Telefónica Alliance. All business lines in this geographical area posted double-digit year-on-year rises, with the SME, Corporate Services and Other line showing growth of 54%.
The main highlights of Terra Lycos’ operations in Spain in January-June 2004 were: the positive impact of the Christmas advertising campaign, which continued to generate subscribers adds in the first months of 2004, and the launch in the second quarter of the “Terra Disney Pack” a new product which includes high-speed internet access (ADSL) plus a package of exclusive Disney content in a total secure environment.
Brazil generated revenues of 256 million reals, in line with the same period last year, or 70 million euros at the average exchange rate prevailing in the first half of 2004. This represents 26% of the total group revenues in 1H04, compared with 28% in 1H03. Stripping out the 19 million euros in revenues from the sale of software licences to Telefónica in the first half of 2003, growth in constant euros stood at 36%. More specifically, the following business lines: access; advertising and ecommerce; communications, portal and content services (stripping out one-off revenues) and SMEs, corporate services and other business lines reported growth in local currency of 20%, 29%, 361% and 14%, respectively.
8
Terra Brazil remains the leading paid access provider in Brazil with over 1,186,000 subscribers. The company is the undisputed leader of the broadband market with around 540,000 customers. The strong performance of the e-commerce activity merits a special mention this half, showing growth of 60% vs. 2003, thanks, among other things, to the increase in Terra Ofertas sales, for example the virtual state lottery and the sale of electronic products and mobile phones.
Costs and Expenses
Gross profit was 143 million euros or 52% of total revenues, an improvement of 3 percentage points on the figure of 49% recorded in 1H03. Operating expenses declined in absolute terms and as a percentage of revenues from 161 million euros or 63% of sales in the first half of 2003 to 141 million or 51 % at the end of 1H04.
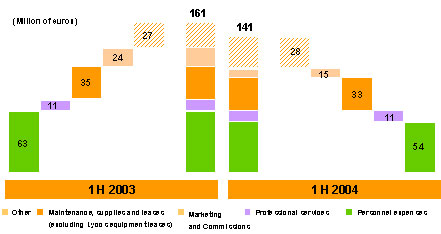
The largest savings were made inPersonnel Costsand Maintenance, Supplies and Leases,which fell by 8.7 million and 8.8 million euros respectively due mainly to the headcount restructuring in the US in the first quarter of the year for the former and the capitalisation of leases for equipment and reduction of rentals for Lycos Inc. for the latter.
Marketing expenses and Commissions from Salesand Professional Servicestotalled 33.3 million and 10.9 million euros respectively, and in absolute terms were in line with figures recorded in 1H03, an investment policy that has not prevented the group from meeting its customer sign-up objectives.
Other Expenseswhich includes working capital provisions, taxes (other than income tax), and travel and insurance expenses, among others, totalled 27.6 million euros in 1H04, in line with the figure of 27.4 million euros recorded last year.
9
EBITDA
CumulativeEBITDA was 2.4 million euros or 1 % of total revenues, an improvement of 30.6 million euros or 12 basis points compared to the same period last year and confirms the positive trend initiated in the last quarter of 2003.
EBITDA Margin
(thousand of euros) | 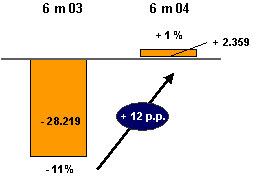 |
Below the EBITDA line, we would highlightEquity Accounted Results which amounted to 8.1 million euros, similar to the figure for the previous year andExtraordinary Results which reflected a 24.4 million euro loss due mainly to severance payments and provisions for the cancellation of operating contracts and leases associated with the restructuring of US operations in the first half of this year, to expenses (10 million euros) associated with the redundancy program for the Corporate activity and Latam and incentive retirements plan for Spain and the cancellation of leasing contracts in Spain in the second quarter. It is worth mentioning extraordinary revenues of 10.8 million euros in June 2004, from the sale of Tecnología SVA in Mexico.
Depreciation and Amortizationand Goodwill Amortizationamounted to 38.7 million and 39.4 million euros respectively, in line with the figures recorded in 1H03.
NetFinancial Income was 17.4 million euros, reflecting interest received on cash balances and mark-to-market financial investments. This item should be smaller in the second half due to the lower cash volumes resulting from the dividend payment of 2 euros per share.
TaxesAfter the acquisition made by Terra Networks, S.A. in year 2003 of the Citibank N.A. shares that covered the Stock Options Plans of the employees assumed by the company as a consequence of the integration of Lycos, Inc., Telefónica, S.A. reached a 75,29% effective ownership of Terra Networks, S.A. General Shareholders Meeting of Terra Networks, S.A, held on June 22, 2004 approved the inclusion of the company within the Tax Consolidated Group of Telefónica S.A. Therefore, the Tax accrual amounting to EUR 19 MM is related to the recognition of the tax credit in connection with 2004 losses and it is registered based upon the assumption that Terra will finally be included in the aforementioned Telefónica Consolidated Tax Group from January 1, 2004.
10
Minority interests amounted to 2.5 million euros and correspond to One Travel.
Net Incomereflects a loss of 69 million euros, an improvement of 29 million euros or 29% on 1H03.
Cash and Capex
The cash balance at the end of the first half of 2004 was 1,615 million of euros, 20 million euros more than in December 2003, representing approximately 2.88 euros per share, excluding treasury stock.
This increase on the previous year was due to cash generation of 8.4 million euros and the 11.9 million euro positive impact of the dollar’s appreciation. At 30 June 2004 the group had a cash position of $130 million.
Operating Cash-flow was 8 million euros, mirroring the improvement in EBITDA. During the fist half there was a positive effect from the working capital of 15 million euros.
Investment Cash-flowstood at 14 million euros, lower than the figure reported in the first quarter of the year, thanks to the sale of financial assets worth 19 million euros.
Financing Cash-flowwas 15 million euros, corresponding to the interest received on cash balances.
Capital reduction
The Ordinary General Shareholder’s Meeting held on June 22nd, 2004 voted to reduce the group’s share capital by amortizing its own shares, with the exclusion of creditors rights of opposition and delegation of powers upon the Board of Directors with regard to the coverage of the stock option schemes (Fourth Agreement).
The share capital will be reduced by the sum of 53,052,804 euros, in order to amortize 26,526,402 of the company’s own shares of with a face value of two euros each. The capital reduction will be charged against the issue premium reserve, and the group will set aside a reserve amounting to a sum equal to the face value of the shares to be amortized. The 26,526,402 shares to be amortized were acquired from Citibank and were being held as treasury stock in order to provide coverage for Lycos’ Inc’s stock option schemes.
As a consequence of this capital reduction, the company’s share capital will be 1.15 billion euros (574.9 million shares with a face value of two euros each) and is fully subscribed and paid up.
11
Dividend Payment
The Ordinary General Shareholders’ Meeting held on June 22nd, 2004 voted to pay a cash dividend against the “Share Issue Premium Reserve” (Resolution Six).
The dividend will be paid in cash against the “Share Issue Premium Reserve” at a fixed sum of 2 euros gross for each of the Company’s shares currently in issue and give the right to collect dividends on the date of payment, for a total amount of 1,136 million euros.
The payment will be made on 30th July 2004 through the entities participating in the “Sociedad de Gestión de los sistemas de Registro, Compensación y Liquidación de Valores S.A.” (IBERCLEAR), in the manner that will be duly announced.
The appropriate tax withholdings will be affected, where required, on the gross amount paid.
12
Financial Statements
| Note: | The rounding-off of figures has produced small differences in the partial totals shown and in the percentage changes stated |
13
Consolidated Statement of Operations
(in thousand of Euros - Spanish GAAP)
unaudited
Six Months Jun-30 | ||||||
| 2004 | 2003 (1) | |||||
Revenues: | ||||||
Access | 116,833 | 104,409 | ||||
Advertising and e-commerce | 68,667 | 59,933 | ||||
Communication, portal and content services | 61,692 | 62,333 | ||||
Corporate & SMEs Services and Other | 27,709 | 27,061 | ||||
Total revenues | 274,901 | 253,736 | ||||
Goods purchased | (131,600 | ) | (129,529 | ) | ||
Gross profit | 143,301 | 124,207 | ||||
Personnel expenses | (54,003 | ) | (62,712 | ) | ||
Professional services | (10,858 | ) | (11,430 | ) | ||
Depreciation and amortization | (38,714 | ) | (37,492 | ) | ||
Marketing and Commissions | (33,347 | ) | (35,398 | ) | ||
Maintenance, supplies and leases | (15,128 | ) | (23,905 | ) | ||
Other expenses | (27,606 | ) | (27,385 | ) | ||
Total other operating expenses | (179,656 | ) | (198,322 | ) | ||
Operating loss | (36,355 | ) | (74,115 | ) | ||
Financial income (expense) | 17,410 | 21,416 | ||||
Amortization of goodwill | (39,388 | ) | (42,173 | ) | ||
Equity share in affiliate losses, net | (8,050 | ) | (8,608 | ) | ||
Extraordinary income (expense) and other | (24,400 | ) | 5,773 | |||
Income (loss) before taxes | (90,783 | ) | (97,707 | ) | ||
Corporate income tax | 19,008 | (168 | ) | |||
Minority interest | 2,498 | 24 | ||||
Net Loss (Spanish GAAP) | (69,277 | ) | (97,851 | ) | ||
Shares excluding Stock Options Plan (‘000) | 561,070 | 560,835 | ||||
| (1) | Revenue by business line and some operating expenses show slight variations from previously reported |
figures due to reclassifications
14
Notes to Consolidated Statement of Operations
(in thousands - Spanish GAAP)
unaudited
Revenues by Country(1)
| Jun-30 | Jun-30 | ||||||||||||
| 2004 | 2003 | 2004 | 2003 | D% | |||||||||
| Current Euros | Local Currency | ||||||||||||
Spain | 115,530 | 89,635 | 115,530 | 89,635 | 29 | % | |||||||
Brazil | 70,228 | 71,934 | 255,686 | 255,259 | 0 | % | |||||||
US | 58,113 | 57,262 | 71,265 | 63,155 | 13 | % | |||||||
Other | 31,030 | 34,905 | 35,193 | (2) | 34,905 | (3) | 1 | % | |||||
Total revenues | 274,901 | 253,736 | |||||||||||
| (1) | Not by legal entity |
| (2) | In Euros at 6m’03 average exchange rates |
| (3) | In Euros |
EBITDA Reconciliation - Current Euros
| Jun-30 | D% | ||||||||
| 2004 | 2003 | ||||||||
Operating loss | (36,355 | ) | (74,115 | ) | 51 | % | |||
Depreciation and amortization | 38,714 | 37,492 | -3 | % | |||||
Leases (1) | 0 | 8,404 | 100 | % | |||||
EBITDA (2) | 2,359 | (28,219 | ) | 108 | % | ||||
EBITDA Margin | 1 | % | -11 | % | 12 b | .p. | |||
| (1) | In all prior periods reported and for EBITDA guidance calculation purposes, expenses related to equipment leases recorded in Lycos are deemed to be depreciation costs |
| (2) | See EBITDA description in the Other Information section |
15
Figures at Constant Euros
| Jun-30 | D% | ||||||||
2004 constant E (1) | 2003 | ||||||||
Revenue by business: | |||||||||
Access | 119,440 | 104,409 | 14 | % | |||||
Advertising and e-commerce | 74,794 | 59,933 | 25 | % | |||||
Communication, portal and content services | 63,831 | 62,333 | 2 | % | |||||
Corporate & SMEs Services and Other | 29,328 | 27,061 | 8 | % | |||||
Total revenues | 287,392 | 253,736 | 13 | % | |||||
Revenue by country: | |||||||||
Spain | 115,530 | 89,635 | 29 | % | |||||
Brazil | 72,054 | 71,934 | 0 | % | |||||
US | 64,615 | 57,262 | 13 | % | |||||
Other | 35,193 | 34,905 | 1 | % | |||||
Total revenues | 287,392 | 253,736 | 13 | % | |||||
EBITDA (2) | 830 | (28,219 | ) | 103 | % | ||||
EBITDA Margin | 0 | % | -11 | % | 11 b.p. | ||||
| (1) | 6m’03 average exchange rates |
| (2) | See EBITDA description in the Other Information section |
16
Consolidated Balance Sheet
(in million of Euros - Spanish GAAP)
unaudited
| Jun-30 | ||||
| 2004 | 2003 | |||
ASSETS | ||||
Due from Shareholders for Uncalled Capital | 0 | 229 | ||
Fixed and Other Noncurrent Assets: | ||||
Intangible assets | 69 | 69 | ||
Property and equipment | 29 | 43 | ||
Long-term investments | 553 | 615 | ||
Treasury Stock | 0 | 2 | ||
Other fixed and noncurrent assets | 1 | 1 | ||
Total fixed an other noncurrent assets | 652 | 730 | ||
Goodwill in consolidation | 383 | 471 | ||
Long-Term deferred expenses | 6 | 7 | ||
Current Assets: | ||||
Cash and Short-term investments | 1,616 | 1,650 | ||
Other current assets | 138 | 169 | ||
Total current Assets | 1,754 | 1,819 | ||
TOTAL ASSETS | 2,795 | 3,256 | ||
SHAREHOLDERS’ EQUITY AND LIABILITIES | ||||
Shareholders’ equity | 2,533 | 2,987 | ||
Minority interests | 1 | 4 | ||
Long-term liabilities | 70 | 62 | ||
Current liabilities | 191 | 203 | ||
TOTAL SHAREHOLDERS’ EQUITY AND LIABILITIES | 2,795 | 3,256 | ||
17
Cash Flow Statement
(in million of Euros - Spanish GAAP)
unaudited
jun-30 2004 | ||
Initial Balance (1) | 1,595 | |
Cash flows from operating activities | 8 | |
Cash flows from investing activities | -14 | |
Cash flows from financing activities | 15 | |
Cash burn | -4 | |
Conversion rates changes | 12 | |
Cash variation | -17 | |
Ending Balance (2) | 1,615 |
| (1) | ’03 initial balance expressed in Euros at Dec’03 closing exchange rates. There is a €2 million difference with the 12m03 reported final balance due to a change in the consolidation perimeter |
| (2) | ’03 ending balance expressed in Euros at June 04 closing exchange rates |
Change in Net Debt Position
(in million of Euros - Spanish GAAP)
unaudited
Jun-30 2004 | ||||
I | Cash flow from operations | 7.9 | ||
II | Other payment related to operating activities | -0.2 | ||
III | Net interest payment | 15.1 | ||
IV | Payment for income tax | 0.0 | ||
A=I+II+III+IV | Net cash provided by operating activities | 22.8 | ||
V | Net payment for investment in fixed and intangible assets Net | -32.3 | ||
VI | payment for financial investment | 17.9 | ||
B=V+VI | Net cash used in investing activities | -14.5 | ||
C | Dividends paid | 0.0 | ||
D=A+B+C | Free cash flow after dividends | 8.4 | ||
E | Capital increases | 0.1 | ||
F | Financing increases | 0.0 | ||
G | Effects of conversion rate changes on net debt | 11.9 | ||
H=I+J | Net debt at beginning of period | -1,600.2 | ||
I | Cash and cash equivalent | -1,595.2 | ||
J | Other short term financial investment | -5.0 | ||
K=L+M | Net debt at end of period | -1,616.3 | ||
L=I-G-F-E-D | Cash and cash equivalent | -1,615.5 | ||
M | Other short term financial investment | -0.8 | ||
18
Operating Data
(in thousands)
| jun-30 | |||||||
| 2004 | 2003 | D% | |||||
Total Paid Subscribers(1) | 5,726 | 3,610 | 59 | % | |||
Access: | |||||||
Narrowband | 992 | 1,045 | -5 | % | |||
Broadband | 842 | 477 | 76 | % | |||
Total | 1,833 | 1,522 | 20 | % | |||
OBP (CSP/Portal): | 3,893 | 2,088 | 86 | % | |||
Broadband Access Subscribers: | |||||||
Spain | 192 | 135 | 42 | % | |||
Latam | 650 | 342 | 90 | % | |||
Total | 842 | 477 | 76 | % | |||
| (1) | Based on number of services delivered. Some subscribers may be contracting access and OBP product/services at the same time |
19

Historic Data
| Note: | The rounding-off of figures has produced small differences in the partial totals shown and in the percentage changes stated |
20
Consolidated Statement of Operations
(in thousand of Euros - Spanish GAAP)
| 2003 (1) | 2004 | |||||||||||||||||
| 3m | 6m | 9m | 12m | 3m | 6m | |||||||||||||
Revenues: | ||||||||||||||||||
Access | 50,566 | 104,409 | 161,392 | 221,034 | 56,959 | 116,833 | ||||||||||||
Advertising and e-commerce | 20,285 | 59,933 | 99,558 | 143,021 | 34,214 | 68,667 | ||||||||||||
Communication, portal and content services | 31,452 | 62,333 | 88,766 | 119,023 | 29,135 | 61,692 | ||||||||||||
Corporate & SMEs Services and Other | 12,523 | 27,061 | 41,523 | 63,550 | 13,928 | 27,709 | ||||||||||||
Total revenues | 114,827 | 253,736 | 391,239 | 546,627 | 134,236 | 274,901 | ||||||||||||
Goods purchased | (57,857 | ) | (129,529 | ) | (199,561 | ) | (265,836 | ) | (63,881 | ) | (131,600 | ) | ||||||
Gross profit | 56,970 | 124,207 | 191,678 | 280,791 | 70,355 | 143,301 | ||||||||||||
Personnel expenses | (31,831 | ) | (62,712 | ) | (93,126 | ) | (119,653 | ) | (27,187 | ) | (54,003 | ) | ||||||
Professional services | (5,118 | ) | (11,430 | ) | (16,374 | ) | (23,191 | ) | (5,048 | ) | (10,858 | ) | ||||||
Depreciation and amortization | (19,461 | ) | (37,492 | ) | (57,158 | ) | (78,742 | ) | (21,848 | ) | (38,714 | ) | ||||||
Marketing and Commissions | (15,592 | ) | (35,398 | ) | (54,395 | ) | (79,104 | ) | (15,204 | ) | (33,347 | ) | ||||||
Maintenance, supplies and leases | (12,176 | ) | (23,905 | ) | (33,333 | ) | (41,306 | ) | (7,726 | ) | (15,128 | ) | ||||||
Other expenses | (11,814 | ) | (27,385 | ) | (41,553 | ) | (57,021 | ) | (14,526 | ) | (27,606 | ) | ||||||
Total other operating expenses | (95,992 | ) | (198,322 | ) | (295,939 | ) | (399,017 | ) | (91,539 | ) | (179,656 | ) | ||||||
Operating loss | (39,022 | ) | (74,115 | ) | (104,261 | ) | (118,226 | ) | (21,184 | ) | (36,355 | ) | ||||||
Financial income (expense) | 12,270 | 21,416 | 27,059 | 57,743 | 11,988 | 17,410 | ||||||||||||
Amortization of goodwill | (20,129 | ) | (42,173 | ) | (62,385 | ) | (82,297 | ) | (19,675 | ) | (39,388 | ) | ||||||
Equity share in affiliate losses, net | (11,187 | ) | (8,608 | ) | (15,014 | ) | (34,734 | ) | (4,609 | ) | (8,050 | ) | ||||||
Extraordinary income (expense) and other | 2,518 | 5,773 | 17,401 | 4,534 | (19,607 | ) | (24,400 | ) | ||||||||||
Income (loss) before taxes | (55,550 | ) | (97,707 | ) | (137,200 | ) | (172,980 | ) | (53,087 | ) | (90,783 | ) | ||||||
Corporate income tax | (164 | ) | (168 | ) | (226 | ) | (266 | ) | 10,573 | 19,008 | ||||||||
Minority interest | 26 | 24 | 447 | 536 | 2,121 | 2,498 | ||||||||||||
Net Loss (Spanish GAAP) | (55,688 | ) | (97,851 | ) | (136,979 | ) | (172,710 | ) | (40,393 | ) | (69,277 | ) | ||||||
Shares excluding Stock Options Plan (’000) | 559,848 | 560,835 | 560,973 | 560,997 | 561,012 | 561,070 | ||||||||||||
| (1) | Revenue by business line and some operating expenses show slight variations from previously reported figures due to reclassifications |
21
Notes to Consolidated Statement of Operations
(in thousand of Euros - Spanish GAAP)
unaudited
| 2003 | 2004 | |||||||||||||||||
| 3m | 6m | 9m | 12m | 3m | 6m | |||||||||||||
Revenues by Country:(1) | ||||||||||||||||||
Spain | 42,051 | 89,635 | 139,949 | 203,257 | 55,427 | 115,530 | ||||||||||||
Brazil | 33,270 | 71,934 | 105,990 | 142,599 | 33,651 | 70,228 | ||||||||||||
US | 21,317 | 57,262 | 93,812 | 126,026 | 30,041 | 58,113 | ||||||||||||
Other | 18,189 | 34,905 | 51,488 | 74,746 | 15,116 | 31,030 | ||||||||||||
Total revenues | 114,827 | 253,736 | 391,239 | 546,627 | 134,236 | 274,901 | ||||||||||||
EBITDA reconciliation: | ||||||||||||||||||
Operating loss | (39,022 | ) | (74,115 | ) | (104,261 | ) | (118,226 | ) | (21,184 | ) | (36,355 | ) | ||||||
Depreciation and amortization | 19,461 | 37,492 | 57,158 | 78,742 | 21,848 | 38,714 | ||||||||||||
Lease expense on fixed assets (2) | 4,359 | 8,404 | 9,875 | 10,133 | 0 | 0 | ||||||||||||
EBITDA(3) | (15,202 | ) | (28,219 | ) | (37,228 | ) | (29,352 | ) | 664 | 2,359 | ||||||||
EBITDA Margin | -13 | % | -11 | % | -10 | % | -5 | % | 0.5 | % | 0.9 | % | ||||||
| (1) | Not by legal entity |
| (2) | In all prior periods reported and for EBITDA guidance calculation purposes, expenses related to equipment leases recorded in Lycos are deemed to be depreciation costs |
| (3) | See EBITDA description in the Other Information section |
22
Consolidated Balance Sheet
(in million of Euros - Spanish GAAP)
| 2003 | 2004 | |||||||||||
| Mar-31 | Jun-30 | Sep-30 | Dec-31 | Mar-31 | Jun-30 | |||||||
ASSETS | ||||||||||||
Due from Shareholders for Uncalled Capital | 254 | 229 | 224 | 0 | 0 | 0 | ||||||
Fixed and Other Noncurrent Assets: | ||||||||||||
Intangible assets | 72 | 69 | 78 | 80 | 75 | 69 | ||||||
Property and equipment | 46 | 43 | 39 | 39 | 34 | 29 | ||||||
Long-term investments | 559 | 615 | 619 | 546 | 561 | 553 | ||||||
Treasury Stock | 2 | 2 | 0 | 126 | 125 | 0 | ||||||
Other fixed and noncurrent assets | 1 | 1 | 1 | 1 | 1 | 1 | ||||||
Total fixed an other noncurrent assets | 679 | 730 | 737 | 792 | 796 | 652 | ||||||
Goodwill in consolidation | 606 | 471 | 451 | 422 | 403 | 383 | ||||||
Long-Term deferred expenses | 7 | 7 | 7 | 6 | 6 | 6 | ||||||
Current Assets: | ||||||||||||
Cash and Short-term investments | 1,744 | 1,650 | 1,622 | 1,599 | 1,608 | 1,616 | ||||||
Other current assets | 147 | 169 | 176 | 168 | 139 | 138 | ||||||
Total current Assets | 1,891 | 1,819 | 1,798 | 1,767 | 1,747 | 1,754 | ||||||
TOTAL ASSETS | 3,437 | 3,256 | 3,217 | 2,987 | 2,952 | 2,795 | ||||||
SHAREHOLDERS’ EQUITY AND LIABILITIES | ||||||||||||
Shareholders’ equity | 3,112 | 2,987 | 2,939 | 2,721 | 2,685 | 2,533 | ||||||
Minority interests | 0 | 4 | 3 | 3 | 1 | 1 | ||||||
Long-term liabilities | 60 | 62 | 73 | 60 | 69 | 70 | ||||||
Current liabilities | 266 | 203 | 202 | 203 | 197 | 191 | ||||||
TOTAL SHAREHOLDERS’ EQUITY AND LIABILITIES | 3,437 | 3,256 | 3,217 | 2,987 | 2,952 | 2,795 | ||||||
23
Operating Data
(in thousands)
| 2003 | 2004 | |||||||||||
| 3m | 6m | 9m | 12m | 3m | 6m | |||||||
Total Paid Subscribers(1) | 3,260 | 3,610 | 4,602 | 5,033 | 5,273 | 5,726 | ||||||
Access: | ||||||||||||
Narrowband | 1,031 | 1,045 | 1,035 | 1,028 | 1,020 | 992 | ||||||
Broadband | 419 | 477 | 543 | 644 | 726 | 842 | ||||||
Total | 1,450 | 1,522 | 1,578 | 1,672 | 1,746 | 1,833 | ||||||
OBP (CSP/Portal): | 1,810 | 2,088 | 3,024 | 3,361 | 3,528 | 3,893 | ||||||
Broadband Access Subscribers: | ||||||||||||
Spain | 122 | 135 | 143 | 166 | 184 | 192 | ||||||
Latam | 297 | 342 | 400 | 478 | 542 | 650 | ||||||
Total | 419 | 477 | 543 | 644 | 726 | 842 | ||||||
| (1) | Based on number of services delivered. Some subscribers may be contracting access and OBP product/services at the same time |
24
Other Information
25
Description of main Consolidated Statement of Operations accounts and EBITDA
Revenues
Access: subscriptions, traffic-inducement fees and call center revenues from residential clients.
Advertising and e-commerce: advertising, slotting fees and transaction commissions.
Communication, Portal and Content Services: value-added service fees related to communication, portal and content services and software package licenses paid to us by the final user or the companies through which we distribute them to the final user.
Corporate & SMEs Services and Other: primarily services to corporations and SMEs both access and media related. It excludes fees paid to us by the companies that distribute our value-added services, which are included under the Communication, Portal and Content Services line.
Goods Purchased
Include telecommunication expenses, technical help desk expenses, purchase of customer connection kits and modems, cost of e-commerce products sold, ad-serving costs, purchase of content, operating outsourcing and any other purchase.
Personnel Expenses
Include salaries, associated expenses and other employee benefits, regardless of the job classification of the employee.
Professional Services
Include consulting, legal advisors’ and auditors’ fees, among others.
Depreciation and Amortization Expenses
Include depreciation charges relating to tangible assets and amortization charges relating to intangible assets (not including goodwill), intangible rights and start-up costs.
Marketing and Commissions
Include expenses related to advertising and marketing.
Maintenance, Supplies and Leases
Include rental expenses, equipment leases, repairs and maintenance expenses, as well as expenses related to internal communications and other office expenses.
Other Expenses
These expenses include bad debt, tax (other than income tax), travel and insurance expenses and other operating expenses.
26
EBITDA
EBITDA is defined as operating income (loss) before depreciation on fixed assets, lease expense on fixed assets and amortization on intangible assets.
Other below the line items that are not included in EBITDA represent costs that are either not directly related to our core business or are non-recurring in nature including our share of gains and losses on equity method investments, goodwill amortization and other one time charges we believe to be outside the normal course of business and which may change from period to period, as well as income taxes.
27
Main Fully and Equity Consolidated Companies
MAIN FULLY CONSOLIDATED COMPANIES | ||
ARGENTINA | TERRA NETWORKS ARGENTINA, S.A. | |
BRAZIL | TELEFONICA INTERACTIVA BRASIL, LTDA. (GROUP) | |
CHILE | TERRA NETWORKS CHILE HOLDING LIMITADA, S.A. (GROUP) | |
COLOMBIA | TERRA NETWORKS COLOMBIA HOLDING, S.A. (GROUP) | |
| DOMINICAN REPUBLIC | TERRA NETWORKS CARIBE, S.A. | |
GUATEMALA | TERRA NETWORKS GUATEMALA, S.A. (GROUP) | |
MEXICO | TERRA NETWORKS MEXICO HOLDING, S.A. DE C.V. (GROUP) | |
PERU | TERRA NETWORKS PERU, S.A. | |
SPAIN | EDUCATERRA, S.L. | |
SPAIN | IFIGENIA PLUS, S.L. | |
SPAIN | MAPTEL NETWORKS, S.A.U. | |
SPAIN | TERRA NETWORKS ESPAÑA, S.A.U. | |
USA | LYCOS, INC. (GRUPO) | |
USA | ONE TRAVEL.COM, INC. | |
VENEZUELA | TERRA NETWORKS VENEZUELA S.A. | |
MAIN EQUITY CONSOLIDATED COMPANIES
| |||||
HOLLAND | LYCOS EUROPE | 32,1 | % | ||
SINGAPUR | LYCOS ASIA | 100 | % | ||
SPAIN | AZELER AUTOMOCIÓN, S.A. | 50 | % | ||
SPAIN | ATREA, S.A. | 50 | % | ||
SPAIN | RED UNIVERSAL DE MARKETING Y BOOKINGS ON-LINE, S.A. | 50 | % | ||
28
Relevant Facts filed with the CNMV/SEC
| • | July 15, 2004: Terra Networks, S.A. announces that on July 15, 2004 Barclays Bank sold 7,000,000 Terra Network shares off the market at a price of 2.16 euros per share. |
| • | June 15, 2004: Terra Networks, S.A. announces that the Ordinary General Shareholders’ Meeting held on the evening of June 22, 2004 in Barcelona approved by a sufficient majority of votes all the resolutions proposed, including the reduction of share capital through the amortization of the group’s own shares and the payment of a dividend against the “Share issue premium reserve”. |
| • | 28 May 2004: Terra Networks, S.A. announces that the Board of Directors, at its meeting held on 27th May 2004, unanimously resolved to amend the Regulations governing the Company’s Board of Directors to adapt them to the terms of the said Act 26/2003. These regulations can be consulted on the websitewww.terralycos.com |
| • | 28 May 2004: Terra Networks, S.A. sends the Board of Directors Report in relation with the proposal to submit for the approval of the General Shareholders’ Meeting the share capital reduction to amortize own shares acquired by the Company and the consequent modification of articles 5 and 6 of the Company Bylaws. |
| • | 27 May 2004Terra Networks, S.A. announces the Agenda of the Ordinary General Shareholders’ Meeting to be held on June 22, 2004. |
| • | 20 May 2004:Terra Networks, S.A. describes the Stock Option Plans of the Terra Lycos Group in May 2004. There are 17.1 million live Stock Options, with 40.4 million shares to provide coverage. |
| • | April 29th. 2004:Terra Networks, S.A. is currently involved in a reviewing and analyzing process on some of its operating units. As part of this global process, different alternatives are being analyzed for Lycos US. No definitive decision has been adopted so far. |
| • | March 30th. 2004: To complete the restructuring process at Terra Lycos group, the Company believes it needs, amongst other things, to reduce personnel costs. Accordingly, it has submitted an application to make redundancies. For the time being, it does not know the precise scope of this action or the number of employees that will be affected. |
| • | March 24th. 2004: As part of the technical reorganization of its central operating units, Terra Networks, S.A. has created two new areas called, respectively, the Content and Innovation Unit, and the Technology and Development Unit. Luis Velo has been appointed to head the former and Alfonso Vicente the latter. |
29
| • | March 10th. 2004: Terra Lycos files the Corporate Governance Annual Report related to year 2003 once it has been approved by the Board of Directors of Terra Networks, S.A. with the favourable report from the Audit and Control Committee. The mentioned Report of Corporate Governance may be consult throughout Terra Networks, S.A. web page. (http://www.terralycos.com). |
| • | February 25th. 2004: The Board of Directors of Terra Lycos accepted the resignation submitted by Mr. Luis Ramón Arrieta Durana, as Member of the Board of Directors as well as Member of the Audit and Control Committee and Appointment and Remuneration Committee, after thanking Mr. Arrieta for his work and dedication during the term of his functions. |
| • | February 25th. 2004: The Board of Directors of Terra Lycos accepted the resignation submitted by Mr. Joaquim Agut Bonsfills, as Member of the Board of Directors, after thanking Mr. Agut for his work and dedication during the term of his functions, for both, Executive Chairman and Member of the Board of Directors. |
| • | January 27th. 2004:The Board of Directors of Terra Lycos accepted the resignation submitted by Mr. Edward M. Philip, as Member of the Board of Directors, after thanking Mr. Philip for his work and dedication during the term of his functions. |
30
Press Releases of the Quarter
| • | 1 June 2004:Terra España has just launched “Terra Disney Pack Disney”, a new product that includes high speed internet access plus an exclusive package of content for broadband. The pack is for small children to learn and have fun with Disney characters in a totally secure environment, while at the same time the whole family can enjoy the benefits of having an ADSL internet connection in the home. In addition to including ADSL internet access, the “Terra Disney Pack” is comprised of two products: Disney Connect and Paternal Control. |
| • | 7 May 2004:The Virtual Forum developed by Terra Lycos is progressing at a good rate and delivering on expectations. In April, the official website received 9,000,000 page views and almost 800,000 visits, this is a spectacular performance compared with figures obtained in the same month of 2003 (400,000 page views and 60,000 hits). It is also worth highlighting the new services and functions which have been developed to mark the inauguration of the event. |
31
Contact Information
Terra Lycos
Investor Relations
| Miguel von Bernard | Investor Relations Director | |
Phone: | 34.91. 452.3922 | |
e-mail: | miguel.vonbernard@corp.terra.com |
| Concha López | Investor Relations | |
Phone: | 34.91. 452.3926 | |
e-mail: | concha.lopez@corp.terra.com |
32
SIGNATURES
Pursuant to the requirements of the Securities Exchange Act of 1934, the registrant has duly caused this report to be signed on its behalf by the undersigned, thereunto duly authorized.
| Terra Networks, S.A. | ||||
Date: July, 23rd. | By: | /s/ Elías J. Rodríguez-Viña | ||
Name: | Elías J. Rodríguez-Viña | |||
Title: | Chief Financial Officer | |||
Terra Networks, S.A. | ||||