| | | |
|
| | | OMB APPROVAL |
| | | |
| | | OMB Number: 3235-0570 |
| | | Expires: August 31, 2011 |
| | | Estimated average burden hours |
| | | per response. . . . . . . . . . . . . . . . . 18.9 |
| | | |
UNITED STATES
SECURITIES AND EXCHANGE COMMISSION
Washington, D.C. 20549
FORM N-CSR
CERTIFIED SHAREHOLDER REPORT OF REGISTERED
MANAGEMENT INVESTMENT COMPANIES
Investment Company Act file number 811-09721
Allianz Global Investors Managed Accounts Trust
(Exact name of registrant as specified in charter)
| | | |
|
| 1345 Avenue of the Americas, New York, New York | | 10105 |
| |
| (Address of principal executive offices) | | (Zip code) |
Lawrence G. Altadonna — 1345 Avenue of the Americas, New York, New York 10105
(Name and address of agent for service)
Registrant’s telephone number, including area code: 212-739-3371
Date of fiscal year end: October 31, 2010
Date of reporting period: October 31, 2010
Form N-CSR is to be used by management investment companies to file reports with the Commission not later than 10 days after the transmission to stockholders of any report that is required to be transmitted to stockholders under Rule 30e-1 under the Investment Company Act of 1940 (17 CFR 270.30e-1). The Commission may use the information provided on Form N-CSR in its regulatory, disclosure review, inspection, and policymaking roles.
A registrant is required to disclose the information specified by Form N-CSR, and the Commission will make this information public. A registrant is not required to respond to the collection of information contained in Form N-CSR unless the Form displays a currently valid Office of Management and Budget (“OMB”) control number. Please direct comments concerning the accuracy of the information collection burden estimate and any suggestions for reducing the burden to Secretary, Securities and Exchange Commission, 100 F Street, NE, Washington, DC 20549-2001. The OMB has reviewed this collection of information under the clearance requirements of 44 U.S.C. § 3507.
| |
| Item 1. | Report to Shareholders |
October 31, 2010
Allianz Global Investors Managed Accounts Trust
Equity Shares: Series I
Fixed Income SHares: Series C, H, M, R
| | | |
| Contents | | |
| |
| Letter to Shareholders | | 2 – 3 |
| Important Information | | 4 |
| Portfolio Insights/Performance & Statistics | | 5 – 14 |
| Benchmark Descriptions | | 15 |
| Schedules of Investments | | 16 – 73 |
| Statements of Assets and Liabilities | | 74 – 75 |
| Statements of Operations | | 76 |
| Statements of Changes in Net Assets | | 77 – 79 |
| Financial Highlights | | 80 – 84 |
| Notes to Financial Statements | | 85 – 128 |
| Report of Independent Registered Public Accounting Firm | | 129 |
| Shareholder Meeting Results/Changes to Board of Trustees/Tax Information | | 130 |
| Matters Relating to the Trustees’ Consideration of the Investment Management & Portfolio Management Agreements | | 131 – 133 |
| Privacy Policy | | 134 |
| Board of Trustees | | 135 |
| Fund Officers | | 136 |
10.31.10 ï Allianz Global Investors Managed Accounts Trust Annual Report 1
Dear Shareholder:
| | | |
The U.S. economy continued to improve in 2010, extending a recovery that began in the summer of 2009. However, the recovery has been tepid at best, with a variety of data indicating underlying weakness. This in turn has resulted in continued caution by both consumers and businesses, big and small. As investors evaluated this continuous stream of information, their tolerance for risk rose and fell, prompting many to move out of U.S. Treasury bonds – only to return when new worries arose. Corporate bonds and municipal bonds provided solid returns. As is often the case, the stock market displayed volatility, but ended the fiscal year with the major indices perched at their highest levels in two years.
Twelve Months in Review
For the fiscal year ended October 31, 2010, prior to the deduction of fees, the individual series underlying the Allianz Global Investors Managed Accounts Trust registered the following returns:
•� 0;Equity Shares: Series I: 18.10%.
• Fixed Income SHares: Series C: 22.40%.
• Fixed Income SHares: Series H: 9.62%.
• Fixed Income SHares: Series M: 18.22%.
• Fixed Income SHares: Series R: 17.94%. | |  Hans W. Kertess Chairman

Brian S. Shlissel
President & CEO |
When the fiscal period began, it appeared as if the U.S. economy was poised for a solid rebound from the recession. But after expanding at an annual rate of 5.0% between October and December of 2009, gross domestic product (“GDP”) slowed to 3.7% between January and March 2010 and to 1.7% between April and June. GDP perked up to 2.0% between July and September 2010.
Corporate bonds displayed strength during the fiscal year. Higher yielding securities did particularly well, as income-seeking investors assumed more risk, especially during the first half of the fiscal year. Municipal bonds also performed well, driven by continued demand in anticipation of higher federal, state and local taxes. However, as the fiscal year drew to a close, investors appeared increasingly skittish over the strained fiscal situation in many states and cities, putting downward pressure on the price of certain municipal securities.
2 Allianz Global Investors Managed Accounts Trust Annual Report ï 10.31.10
The Road Ahead
In our report to shareholders six months ago, we mentioned that the strength and resilience of the U.S. economy was likely to be tested. This is now occurring. Unemployment still hovers near double-digit levels, the housing market remains troubled, and consumers – traditionally the backbone of the economy – continue to retrench. These factors, combined with the winding down of the federal government’s stimulus program, historically low interest rates and a growing inclination for belt-tightening at all levels of government, hardly suggest a robust recovery is imminent. At the same time, a second recession – the so-called “double-dip” scenario – does not appear imminent either. Another often-discussed scenario for the economy, deflation, seems increasingly unlikely as well. What is likely, in our view, is that the U.S. economy will continue to trudge ahead.
Together with Allianz Global Investors Fund Management LLC, the Portfolios’ investment manager, Pacific Investment Management Company LLC, sub-adviser of Fixed Income SHares: Series C, H, M and R, and RCM Capital Management LLC and Allianz Global Investors Advisory GmbH, sub-advisers of Equity Shares: Series I, we thank you for investing with us.
We remain dedicated to serving your investment needs.
Sincerely,
| | | |
 | |  |
| Hans W. Kertess | | Brian S. Shlissel |
| Chairman | | President & CEO |
Receive this report
electronically and
eliminate paper mailings.
To enroll, go to
www.allianzinvestors.com/
edelivery.
10.31.10 ï Allianz Global Investors Managed Accounts Trust Annual Report 3
Allianz Global Investors Managed Accounts Trust
Equity Shares: Series I
Fixed Income SHares: Series C, H, M, R
Important Information
October 31, 2010 (unaudited)
In an economic environment where interest rates may trend upward, rising rates will negatively impact the performance of most bond funds and fixed income securities held by a fund and are likely to cause these instruments to decrease in value. Bond funds and individual bonds with a longer duration (a measure of the expected life of a security) tend to be more sensitive to changes in interest rates, usually making them more volatile than securities with shorter durations.
Equity Shares: Series I and Fixed Income SHares: Series C, H, M and R (the “Portfolios”) may be subject to various risks as described in their prospectuses. Some of these risks may include, but are not limited to, the following: derivatives risk, foreign (non-U.S.) investment risk, high-yield security risk, counterparty risk and issuer non-diversification risk. The Portfolios may use derivative instruments for hedging purposes or as part of an investment strategy. Use of these instruments may involve certain costs and risks, such as liquidity risk, interest rate risk, market risk, credit risk, management risk and the risk that a Portfolio could not close out a position when it would be most advantageous to do so. Portfolios investing in derivatives could lose more than the principal amount invested in these instruments. Investing in non-U.S. securities may entail risk due to non-U.S. economic, political and other developments. This risk may be enhanced when a Portfolio invests in emerging markets. High-yield bonds typically have a lower credit rating than other bonds. Lower rated bonds generally involve a greater risk to principal than higher rated bonds. Concentrating investments in individual sectors may add additional risk and volatility compared to a diversified Portfolio. The credit quality of a particular security or group of securities does not ensure the stability or safety of the overall Portfolio.
The Portfolios’ Investment Manager and each Sub-Adviser have adopted written proxy voting policies and procedures (the “Proxy Policy”) as required by Rule 206(4)-6 under the Investment Advisers Act of 1940, as amended. The Proxy Policy has been adopted by the Portfolios as the policies and procedures that the Sub-Advisers will use when voting proxies on behalf of the Portfolios. Copies of the written Proxy Policy and the factors that the Sub-Advisers may consider in determining how to vote proxies for each Portfolio, and information about how each Portfolio voted proxies relating to portfolio securities held during the most recent twelve-month period ended June 30, are available without charge, upon request, by calling the Portfolios’ shareholder servicing agent at (800) 628-1237, on the Allianz Global Investors Distributors’ website at www.allianzinvestors.com and on the Securities and Exchange Commission’s (the “SEC”) website at http://www.sec.gov.
Past performance is no guarantee of future results. Total return is calculated by subtracting the value of an investment in each Portfolio at the beginning of each specified period from its value at the end of the period and dividing the remainder by the value of the investment at the beginning of the period and expressing the result as a percentage. The calculation assumes that all income dividends and capital gain distributions, if any, have been reinvested. Total return does not reflect broker commissions or “wrap fee” charges. Total return for a period of more than one year represents the average annual total return during the period.
An investment in the Portfolios involves risk, including the loss of principal. Total return, distribution yield, net asset value and duration will fluctuate with changes in market conditions. The following data is provided for information only and is not intended for trading purposes. Net asset value is equal to total assets less total liabilities divided by the number of shares outstanding.
This report, including the financial information herein is transmitted to the shareholders of Allianz Global Investors Managed Accounts Trust for their information. It is not a prospectus, circular or representation intended for use in the purchase of shares of the Portfolios or any other securities mentioned in this report.
4 Allianz Global Investors Managed Accounts Trust Annual Report ï 10.31.10
Allianz Global Investors Managed Accounts Trust
Equity Shares: Series I Portfolio Insights/Performance & Statistics
October 31, 2010 (unaudited)
| | | | | |
| Symbol: | | Primary Investments: | | Inception Date: |
| | | | | |
| ALIIX | | Equity securities of non-U.S. companies. | | 8/3/09 |
| | | | | |
| | | | | Net Assets: |
| | | | | $2.5 million |
| | | | | |
| | | | | Portfolio Managers: |
| | | | | Lucy MacDonald
Matthew Bowyer |
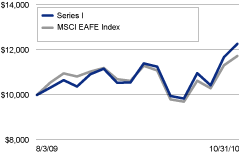
For the fiscal year ended October 31, 2010, Series I returned 18.10%, prior to the deduction of fees, outperforming the Morgan Stanley Capital International Europe Australasia Far East (MSCI EAFE) Index (the “benchmark index”), which returned 8.36% during the reporting period.
International equity markets were roiled in the first half of 2010 by a combination of concerns over the potential for a double-dip recession globally as well as ongoing fiscal concerns of heavily-indebted governments on the periphery of Europe. The markets found more solid footing in September 2010, when expectations for further stimulus by the U.S. Federal Reserve grew. Markets were also reassured by the aggressive response of Europe’s core economies to the challenges of its smaller economies.
Performance Drivers
Series I’s outperformance of its benchmark resulted in large part from positioning in the financials and technology sectors. An underweight position in the struggling financials sector supported its relative returns given the ongoing uncertainty about the strength of the global financial system. Stock selection in this sector also contributed strongly, with holdings such as Standard Chartered PLC & Australia and New Zealand Banking Group among the strongest performers. Stock selection in technology also contributed significantly to returns, with Chinese internet provider Baidu dominating its sector. The Portfolio has benefited significantly from Google’s partial withdrawal from the Chinese market, reporting third quarter results that exceeded already optimistic expectations. The stock was the largest contributor to returns both within its sector and on an absolute basis.
Results were weaker in industrials, where the benefit of a sector overweighting relative to the benchmark was more than offset by the impact of stock selection. This sector contained two of the weakest stocks in the portfolio, Alstom and Gamesa. Both European firms have built leading global positions in power generation, with an emphasis on clean technologies, while Alstom’s business mix also includes transportation. Gamesa, in particular, detracted as order intake for wind turbine manufacturers remained weak in the aftermath of the financial crisis. Not all of the Portfolio’s industrial holdings were poor performers. Swedish equipment and systems manufacturer Atlas Copco provided the third-best performance of all stocks in the Portfolio, while not holding Vestas contributed positively.
10.31.10 ï Allianz Global Investors Managed Accounts Trust Annual Report 5
Allianz Global Investors Managed Accounts Trust
Equity Shares: Series I Portfolio Insights/Performance & Statistics
October 31, 2010 (unaudited) (continued)
| | | | | | | | | |
| | | | | | Since Inception
| |
| Total Returns (Period ended 10/31/10) | | 1 Year | | | (8/3/09) | |
| | |
| |
| Series I | | | 18.10 | % | | | 17.70 | % |
| |
| |
| MSCI EAFE Index | | | 8.36 | % | | | 11.41 | % |
| |
| |
Change in Value of $10,000 Investments
in Series I and MSCI EAFE Index
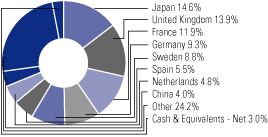
Country Allocation
(as a % of net assets)
Past performance is no guarantee of future results. Returns presented do not reflect the deduction of taxes that a shareholder would pay on fund distribution or the redemption of fund shares.
| | | | | | | | | |
| Shareholder Expense Example | | | Actual | | | Hypothetical |
| | | | | | | (5 % return before expenses) |
| Beginning Account Value (5/1/10) | | | $ | 1,000.00 | | | $ | 1,000.00 |
| Ending Account Value (10/31/10) | | | $ | 1,089.30 | | | $ | 1,025.21 |
| Expenses Paid During Period | | | $ | — | | | $ | — |
| |
Expenses are equal to the expense ratio of 0.00%, multiplied by the average account value over the period, multiplied by 184/365 (to reflect the one-half year period).
6 Allianz Global Investors Managed Accounts Trust Annual Report ï 10.31.10
Allianz Global Investors Managed Accounts Trust
Fixed Income SHares: Series C Portfolio Insights/Performance & Statistics
October 31, 2010 (unaudited)
| | | | | |
| Symbol: | | Primary Investments: | | Inception Date: |
| | | | | |
| FXICX | | Intermediate maturity fixed income securities. | | 3/17/00 |
| | | | | |
| | | | | Net Assets: |
| | | | | $3.3 billion |
| | | | | |
| | | | | Portfolio Managers: |
| | | | | Mark R. Kiesel
Curtis Mewbourne |
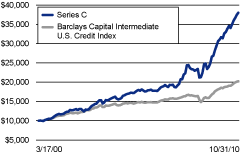
For the fiscal year ended October 31, 2010, Series C returned 22.40%, prior to the deduction of fees, outperforming the unmanaged Barclays Capital Intermediate U.S. Credit Index (the “benchmark index”), which returned 10.70% during the reporting period.
Initiatives such as the Federal Reserve’s (the “Fed”) purchase of mortgage and Treasury securities, the Fed’s commitment to hold short-term rates near zero and government support for consumer finance markets were major factors behind enhanced stability through the first half of the review period. Beginning in early 2010, investor confidence was shaken by a range of macroeconomic events, including signs that the U.S. and global economies might be slowing and the ongoing debt crisis in Europe. Concerns in the U.S. centered on the waning effects of policy stimulus as unemployment remained stubbornly high and consumer confidence weakened. The uncertain impact of new regulations for the health care and financial services industries also added to the anxiety.
Against this backdrop, corporate bond performance was generally muted for the first two-thirds of the review period as economic concerns were balanced against reassurances by the Fed of ongoing support for credit markets and the economy. The creation of the Greek bailout package late in the second quarter served to reassure markets, as did the growing expectation of further quantitative easing by the Fed, leading to a sharp and sustained rally for risk assets from July through the end of the period. Investors’ renewed risk appetite resulted in particularly strong performance by high yield and emerging markets debt, which returned 19.35% and 17.70%, respectively, for the period, (as measured by the Barclays Capital U.S. High Yield and J.P. Morgan Emerging Markets Bond Indices).
Performance Drivers
Series C’s interest rate positioning was largely favorable for returns over the course of the review period. Although Series C’s duration was reduced during the period from 9.57 years to 6.11 years, it remained higher than that of the Portfolio’s benchmark index. This positioning contributed positively to returns as 10-year U.S. Treasury yields fell to record lows during the reporting period. The Portfolio was also positioned to benefit from a steepening of the yield curve, which delivered further gains as the anticipated steepening came to pass, with 2-year Treasury yields falling 55 basis points while 30-year Treasury yields fell 24 basis points over the course of the fiscal year.
Sector positioning produced mix results for the Portfolio. The Portfolio’s underweight exposure to investment grade corporate debt detracted from relative performance given the sector’s strong outperformance relative to Treasuries. That said, positioning within the corporate debt market was positive for performance, particularly an overweighting in the bonds of financial companies, which outpaced their corporate peers as credit premiums continued to tighten. Series C’s exposure to agency mortgage-backed securities (“MBS”) also benefited performance as agency MBS outperformed U.S. Treasury securities with similar durations. Tactical coupon selection among MBS further enhanced performance.
10.31.10 ï Allianz Global Investors Managed Accounts Trust Annual Report 7
Allianz Global Investors Managed Accounts Trust
Fixed Income SHares: Series C Portfolio Insights/Performance & Statistics
October 31, 2010 (unaudited) (continued)
| | | | | | | | | | | | | |
| | | | | | | | | Since Inception
| |
| Total Returns (Period ended 10/31/10) | | 1 Year | | | 5 Years | | | (3/17/00) | |
| | |
| |
| Series C | | | 22.40 | % | | | 16.68 | % | | | 13.40 | % |
| |
| |
| Barclays Capital Intermediate U.S. Credit Index | | | 10.70 | % | | | 6.69 | % | | | 6.86 | % |
| |
| |
Change in Value of $10,000 Investments
in Series C and the Barclays Capital Intermediate U.S. Credit Index
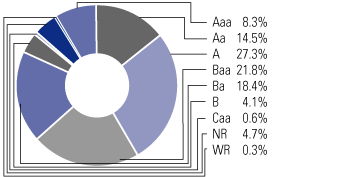
Moody’s Ratings
(as a % of total investments)
Past performance is no guarantee of future results. Returns presented do not reflect the deduction of taxes that a shareholder would pay on fund distribution or the redemption of fund shares.
| | | | | | | | | |
| Shareholder Expense Example | | | Actual | | | Hypothetical |
| | | | | | | (5 % return before expenses) |
| Beginning Account Value (5/1/10) | | | $ | 1,000.00 | | | $ | 1,000.00 |
| Ending Account Value (10/31/10) | | | $ | 1,099.80 | | | $ | 1,025.20 |
| Expenses Paid During Period | | | $ | 0.01 | | | $ | 0.01 |
| |
Expenses are equal to the expense ratio of 0.002%, multiplied by the average account value over the period, multiplied by 184/365 (to reflect the one-half year period).
8 Allianz Global Investors Managed Accounts Trust Annual Report ï 10.31.10
Allianz Global Investors Managed Accounts Trust
Fixed Income SHares: Series H Portfolio Insights/Performance & Statistics
October 31, 2010 (unaudited)
| | | | | |
| Symbol: | | Primary Investments: | | Inception Date: |
| | | | | |
| FXIHX | | High yield municipal securities. | | 4/2/07 |
| | | | | |
| | | | | Net Assets: |
| | | | | $7.8 million |
| | | | | |
| | | | | Portfolio Manager: |
| | | | | John Cummings |
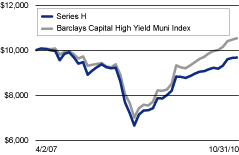
For the fiscal year ended October 31, 2010, Series H returned 9.62%, prior to the deduction of fees, underperforming the unmanaged Barclays Capital High Yield Muni Index (the “benchmark index”), which returned 13.86% during the reporting period.
The high-quality segment of the municipal bond market produced positive returns for the period, as yields moved lower across the curve. On longer maturities, municipal bonds underperformed the stronger taxable bond market, with the Barclays Capital Long Municipal Bond Index returning 4.70% while the Barclays Capital Long Government/Credit Index returned 9.05%, and the Barclays Capital Long U.S. Treasury Index returned 11%. The Barclays Capital Zero Coupon Municipal Bond Index returned 5.27% for the reporting period. Municipal to Treasury yield ratios (a measure of the relative attractiveness of municipal and Treasury bonds) ended higher as Treasuries outperformed municipals. The 10-year ratio (a measure of the relative attractiveness of Treasuries and municipal bonds) increased to 97% and the 30-year ratio decreased to 97%.
Performance Drivers
Series H’s interest rate positioning produced mixed results during the fiscal year. The Portfolio’s duration was below that of its benchmark index for most of the period, which hindered returns as municipal yields moved lower across the curve. By contrast, positioning in longer maturities was positive for returns, as longer-maturity bonds outperformed the general municipal market over the fiscal year.
Consistent with the PIMCO view, Series H was positioned more conservatively from a credit perspective relative to the benchmark index during the reporting period. This positioning hampered relative returns given the general outperformance of lower-quality, higher-yielding credit as investors became more comfortable with credit risk.
Sector positioning generally hurt performance during the period, particularly exposure to the transportation and tobacco securitized sectors. Series H’s holdings of hospital bonds were more beneficial, however.
10.31.10 ï Allianz Global Investors Managed Accounts Trust Annual Report 9
Allianz Global Investors Managed Accounts Trust
Fixed Income SHares: Series H Portfolio Insights/Performance & Statistics
October 31, 2010 (unaudited) (continued)
| | | | | | | | | |
| | | | | | Since Inception
| |
| Total Returns (Period ended 10/31/10) | | 1 Year | | | (4/2/07) | |
| | |
| |
| Series H | | | 9.62 | % | | | (0.94 | )% |
| |
| |
| Barclays Capital High Yield Muni Index | | | 13.86 | % | | | 1.41 | % |
| |
| |
Change in Value of $10,000 Investments in Series H and the Barclays Capital High Yield Muni Index
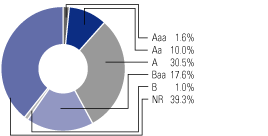
Moody’s Ratings
(as a % of total investments)
Past performance is no guarantee of future results. Returns presented do not reflect the deduction of taxes that a shareholder would pay on fund distribution or the redemption of fund shares.
| | | | | | | | | |
| Shareholder Expense Example | | | Actual | | | Hypothetical |
| | | | | | | (5 % return before expenses) |
| Beginning Account Value (5/1/10) | | | $ | 1,000.00 | | | $ | 1,000.00 |
| Ending Account Value (10/31/10) | | | $ | 1,056.10 | | | $ | 1,025.21 |
| Expenses Paid During Period | | | $ | — | | | $ | — |
| |
Expenses are equal to the expense ratio of 0.00%, multiplied by the average account value over the period, multiplied by 184/365 (to reflect the one-half year period).
10 Allianz Global Investors Managed Accounts Trust Annual Report ï 10.31.10
Allianz Global Investors Managed Accounts Trust
Fixed Income SHares: Series M Portfolio Insights/Performance & Statistics
October 31, 2010 (unaudited)
| | | | | |
Symbol: | | Primary Investments: | | Inception Date: |
| FXIMX | | Intermediate maturity mortgage-backed securities. | | 3/17/00 |
| | | | | |
| | | | | |
| | | | | Net Assets: |
| | | | | $3.4 billion |
| | | | | |
| | | | | |
| | | | | Portfolio Managers: |
| | | | | Scott Simon |
| | | | | Curtis Mewbourne |
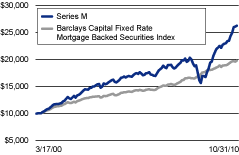
For the fiscal year ended October 31, 2010, Series M returned 18.22%, prior to the deduction of fees, outperforming the unmanaged Barclays Capital Fixed Rate Mortgage Backed Securities Index (the “benchmark index”), which returned 6.12% during the reporting period.
Initiatives such as the Federal Reserve’s (the “Fed”) purchase of mortgage and Treasury securities, the Fed’s commitment to hold short-term rates near zero and government support for consumer finance markets were major factors behind enhanced stability through the first half of the review period. Beginning in early 2010, investor confidence was shaken by a range of macroeconomic events, including signs that the U.S. and global economies might be slowing and the ongoing debt crisis in Europe. Concerns in the U.S. centered on the waning effects of policy stimulus as unemployment remained stubbornly high and consumer confidence weakened. The uncertain impact of new regulations for the health care and financial services industries also added to the anxiety.
The mortgage-backed securities (“MBS”) sector produced positive returns for the 12-month period as a whole, though option-adjusted spreads for the sector widened slightly as investors remained focused on higher-yielding assets. The generally low interest rate environment was marked by unusually low levels of refinancing activity given the ongoing troubles in the housing and lending markets, leading higher coupon securities to outperform. Commercial mortgage-backed securities (CMBS) benefited from investors search for yield, as did non-agency MBS.
Performance Drivers
Series M’s interest rate positioning was largely favorable for returns over the course of the review period. The Portfolio’s duration at the end of the period was 8.44 years, compared to 8.17 years on October 31, 2009. The duration was above that of the Portfolio’s benchmark index, which contributed positively to returns as 10-year U.S. Treasury yields fell to record lows during the period. The Portfolio was also positioned to benefit from a steepening of the yield curve, which delivered further gains as the anticipated steepening came to pass, with 2-year Treasury yields falling 55 basis points while 30-year Treasury yields fell 24 basis points over the course of the year.
Sector positioning produced mixed results for the Portfolio. Series M’s underweighting in agency MBS detracted from performance as agency MBS outperformed like-duration U.S. Treasury securities, though this negative effect was partially offset by gains from tactical coupon selection. Series M’s exposure to non-agency MBS benefited from strong investor demand for high quality bonds offering extra yield. Exposure to investment-grade corporate debt also boosted performance during the reporting period, as investment-grade credits outpaced U.S. Treasuries in performance.
10.31.10 ï Allianz Global Investors Managed Accounts Trust Annual Report 11
Allianz Global Investors Managed Accounts Trust
Fixed Income SHares: Series M Portfolio Insights/Performance & Statistics
October 31, 2010 (unaudited) (continued)
| | | | | | | | | | | | | |
| | | | | | | | | Since Inception
| |
| Total Returns (Period ended 10/31/10) | | 1 Year | | | 5 Years | | | (3/17/00) | |
| | |
| |
| Series M | | | 18.22 | % | | | 8.93 | % | | | 9.46 | % |
| |
| |
| Barclays Capital Fixed Rate Mortgage Backed Securities Index | | | 6.12 | % | | | 6.82 | % | | | 6.58 | % |
| |
| |
Change in Value of $10,000 Investments
in Series M and the Barclays Capital Fixed Rate Mortgage Backed Securities Index
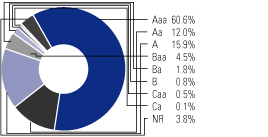
Moody’s Ratings
(as a % of total investments)
Past performance is no guarantee of future results. Returns presented do not reflect the deduction of taxes that a shareholder would pay on fund distribution or the redemption of fund shares.
| | | | | | | | | |
| Shareholder Expense Example | | | Actual | | | Hypothetical |
| | | | | | | (5 % return before expenses) |
| Beginning Account Value (5/1/10) | | | $ | 1,000.00 | | | $ | 1,000.00 |
| Ending Account Value (10/31/10) | | | $ | 1,121.10 | | | $ | 1,025.16 |
| Expenses Paid During Period | | | $ | 0.05 | | | $ | 0.05 |
| |
Expenses are equal to the expense ratio of 0.009%, multiplied by the average account value over the period, multiplied by 184/365 (to reflect the one-half year period).
12 Allianz Global Investors Managed Accounts Trust Annual Report ï 10.31.10
Allianz Global Investors Managed Accounts Trust
Fixed Income SHares: Series R Portfolio Insights/Performance & Statistics
October 31, 2010 (unaudited)
| | | | | |
| Symbol: | | Primary Investments: | | Inception Date: |
| | | | | |
| FXIRX | | Intermediate maturity
inflation-indexed fixed income
securities. | | 4/15/04 |
| | | | | |
| | | | | Net Assets: |
| | | | | $403.4 million |
| | | | | |
| | | | | Portfolio Manager: |
| | | | | Mihir Worah |
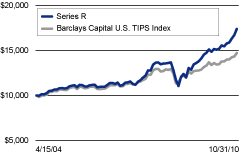
For the fiscal year ended October 31, 2010, Series R returned 17.94%, prior to the deduction of fees, outperforming the unmanaged Barclays Capital U.S. TIPS Index (the “benchmark index”), which returned 10.42% during the reporting period.
U.S. interest rates, both real and nominal, continued to fall during the fiscal year as the tepid economic recovery showed few signs of gathering steam and inflation remained low. Treasury Inflation Protected Securities (“TIPS”) advanced during the fiscal year, supported by declining real yields across the maturity spectrum. These declines were largely the result of slower growth and the widely expected announcement by the Fed late in the period of a second round of quantitative easing. The changes in breakeven inflation levels (i.e., the difference between nominal and real yields) for various segments of the market were mixed during the fiscal year, with 10-year breakevens widening to 2.15% from 2.01% while 5-year breakevens narrowed marginally, down 7 basis points to 1.49%.
Performance Drivers
Series R’s underweight position in TIPS detracted from performance, as TIPS outperformed other sectors of the bond market during the period. That said, many of the Portfolio’s positions were positive for returns, particularly exposure to nominal bonds in Europe, Canada, and Australia, which gained as interest rates fell in these markets. Series R’s holdings of mortgage-backed securities (“MBS”) were bolstered by that sector’s outperformance relative to like-duration Treasuries, and also benefited from tactical coupon selection. Exposure to investment-grade corporate debt added to performance during the reporting period, as investment-grade credits outpaced U.S. Treasury Securities in performance.
The Portfolio’s performance was also supported by favorable interest rate positioning. Series R’s duration was 6.93 years at the end of the review period, compared to 7.02 years on October 31, 2009. This above-benchmark duration posture contributed positively as 10-year U.S. Treasury yields fell to record lows. The Portfolio was also positioned to benefit from a steepening of the yield curve in the U.S., which delivered further gains as the anticipated steepening came to pass, with 2-year Treasury yields falling 55 basis points while 30-year Treasury yields fell 24 basis points over the course of the year.
10.31.10 ï Allianz Global Investors Managed Accounts Trust Annual Report 13
Allianz Global Investors Managed Accounts Trust
Fixed Income SHares: Series R Portfolio Insights/Performance & Statistics
October 31, 2010 (unaudited) (continued)
| | | | | | | | | | | | | |
| | | | | | | | | Since Inception
| |
| Total Returns (Period ended 10/31/10) | | 1 Year | | | 5 Years | | | (4/15/04) | |
| | |
| |
| Series R | | | 17.94 | % | | | 9.52 | % | | | 8.76 | % |
| |
| |
| Barclays Capital U.S. TIPS Index | | | 10.42 | % | | | 6.32 | % | | | 6.07 | % |
| |
| |
Change in Value of $10,000 Investments in Series R and the Barclays Capital U.S. TIPS Index
Moody’s Ratings
(as a % of total investments)
Past performance is no guarantee of future results. Returns presented do not reflect the deduction of taxes that a shareholder would pay on fund distribution or the redemption of fund shares.
| | | | | | | | | |
| Shareholder Expense Example | | | Actual | | | Hypothetical |
| | | | | | | (5 % return before expenses) |
| Beginning Account Value (5/1/10) | | | $ | 1,000.00 | | | $ | 1,000.00 |
| Ending Account Value (10/31/10) | | | $ | 1,117.50 | | | $ | 1,025.20 |
| Expenses Paid During Period | | | $ | 0.01 | | | $ | 0.01 |
| |
Expenses are equal to the expense ratio of 0.001%, multiplied by the average account value over the period, multiplied by 184/365 (to reflect the one-half year period).
14 Allianz Global Investors Managed Accounts Trust Annual Report ï 10.31.10
Allianz Global Investors Managed Accounts Trust
Benchmark Descriptions
October 31, 2010 (unaudited)
Unless otherwise noted, index returns reflect the reinvestment of income dividends and capital gains, if any, but do not reflect fees, brokerage commissions or other expenses of investing. It is not possible to invest directly in an index.
Index/Description
| |
| • | Barclays Capital Fixed Rate Mortgage Backed Securities Index |
The Barclays Capital Fixed Rate Mortgage Backed Securities Index is an unmanaged index comprised of fixed rate mortgage pass through securities issued by Ginnie Mae (GNMA), Fannie Mae (FNMA), and Freddie Mac (FHLMC), with a Weighted Average Maturity (WAM) of at least one year and at least $250 million par outstanding.
| |
| • | Barclays Capital Intermediate U.S. Credit Index |
The Barclays Capital Intermediate U.S. Credit Index is an unmanaged index of publicly issued U.S. corporate and specified foreign debentures and secured notes with intermediate maturities ranging from 1 to 10 years. Securities must also meet specific liquidity and quality requirements.
| |
| • | Barclays Capital High Yield Muni Index |
The Barclays Capital High Yield Municipal Bond Index is an unmanaged index made up of bonds that are non-investment grade, unrated, or rated below Ba1 by Moodys Investors Service with a remaining maturity of at least one year.
| |
| • | Barclays Capital U.S. TIPS Index |
The Barclays Capital U.S. TIPS Index is an unmanaged market index comprised of all U.S. Treasury Inflation Protected Securities rated investment grade (Baa3 or better), having at least one year to final maturity, and at least $250 million par amount outstanding. Performance data for this index prior to October 1997 represents returns of the Barclays Capital Inflation Notes Index.
| |
| • | Morgan Stanley Capital International Europe Australasia Far East (MSCI EAFE) Index |
The MSCI EAFE Index is a widely recognized, unmanaged index of issuers located in the countries of Europe, Australia, and the Far East. Prior to November 1, 2006, performance data for the MSCI Index was calculated gross of dividend tax withholding. Performance data presently shown for the Index is net of dividend tax withholding. This recalculation results in lower performance for the Index.
10.31.10 ï Allianz Global Investors Managed Accounts Trust Annual Report 15
Equity Shares: Series I Schedule of Investments
October 31, 2010
| | | | | | | | | | | |
| | | | | | | | |
| Shares | | | | | | | Value | |
COMMON STOCK–90.3% |
| | | | | Australia–3.2% | | | | | | |
| | 3,206 | | | Australia & New Zealand Banking Group Ltd. | | | | $ | 78,216 | |
| | | | | | | | | | | |
| | | | | Belgium–3.9% | | | | | | |
| | 1,548 | | | Anheuser-Busch InBev NV | | | | | 97,220 | |
| | | | | | | | | | | |
| | | | | China–4.0% | | | | | | |
| | 700 | | | Baidu, Inc. ADR (l) | | | | | 77,007 | |
| | 10,000 | | | Dongfeng Motor Group Co., Ltd. | | | | | 21,725 | |
| | | | | | | | | | | |
| | | | | | | | | | 98,732 | |
| | | | | | | | | | | |
| | | | | France–11.9% | | | | | | |
| | 599 | | | Air Liquide S.A. | | | | | 77,556 | |
| | 881 | | | Eutelsat Communications | | | | | 33,158 | |
| | 801 | | | Gemalto NV | | | | | 36,505 | |
| | 2,691 | | | Vinci S.A. | | | | | 144,295 | |
| | | | | | | | | | | |
| | | | | | | | | | 291,514 | |
| | | | | | | | | | | |
| | | | | Germany–2.6% | | | | | | |
| | 897 | | | BASF SE | | | | | 65,222 | |
| | | | | | | | | | | |
| | | | | Hong Kong–2.8% | | | | | | |
| | 2,076 | | | AIA Group Ltd. (l) | | | | | 6,187 | |
| | 7,000 | | | BOC Hong Kong Holdings Ltd. | | | | | 21,971 | |
| | 19,000 | | | CNOOC Ltd. | | | | | 39,568 | |
| | | | | | | | | | | |
| | | | | | | | | | 67,726 | |
| | | | | | | | | | | |
| | | | | Israel–1.9% | | | | | | |
| | 1,100 | | | Check Point Software Technologies Ltd.(l) | | | | | 47,025 | |
| | | | | | | | | | | |
| | | | | Italy–3.9% | | | | | | |
| | 2,176 | | | Saipem SpA | | | | | 96,676 | |
| | | | | | | | | | | |
| | | | | Japan–14.6% | | | | | | |
| | 1,400 | | | Canon, Inc. | | | | | 64,447 | |
| | 1,600 | | | Hitachi Construction Machinery Co., Ltd. | | | | | 34,020 | |
| | 1,200 | | | Ibiden Co., Ltd. | | | | | 29,524 | |
| | 2 | | | Inpex Corp. | | | | | 10,415 | |
| | 6 | | | KDDI Corp. | | | | | 32,345 | |
| | 400 | | | Nidec Corp. | | | | | 39,501 | |
| | 900 | | | Shin-Etsu Chemical Co., Ltd. | | | | | 45,509 | |
| | 200 | | | SMC Corp. | | | | | 30,532 | |
| | 1,100 | | | Sony Corp. | | | | | 37,166 | |
| | 98 | | | Yahoo! Japan Corp. | | | | | 34,208 | |
| | | | | | | | | | | |
| | | | | | | | | | 357,667 | |
| | | | | | | | | | | |
16 Allianz Global Investors Managed Accounts Trust Annual Report ï 10.31.10
Equity Shares: Series I Schedule of Investments
October 31, 2010 (continued)
| | | | | | | | | | | |
| | | | | | | | |
| Shares | | | | | | | Value | |
| | | | | Korea (Republic of)–2.7% | | | | | | |
| | 200 | | | Samsung Electronics Co., Ltd. GDR (d) | | | | $ | 66,760 | |
| | | | | | | | | | | |
| | | | | Netherlands–4.8% | | | | | | |
| | 948 | | | Koninklijke DSM NV | | | | | 50,735 | |
| | 1,523 | | | Koninklijke Philips Electronics NV | | | | | 46,455 | |
| | 744 | | | TNT NV | | | | | 19,786 | |
| | | | | | | | | | | |
| | | | | | | | | | 116,976 | |
| | | | | | | | | | | |
| | | | | Portugal–2.6% | | | | | | |
| | 9,771 | | | Energias de Portugal S.A. | | | | | 37,380 | |
| | 1,340 | | | Galp Energia SGPS S.A., Class B | | | | | 25,855 | |
| | | | | | | | | | | |
| | | | | | | | | | 63,235 | |
| | | | | | | | | | | |
| | | | | Spain–5.5% | | | | | | |
| | 4,677 | | | Banco Santander S.A. | | | | | 60,032 | |
| | 905 | | | Inditex S.A. | | | | | 75,586 | |
| | | | | | | | | | | |
| | | | | | | | | | 135,618 | |
| | | | | | | | | | | |
| | | | | Sweden–8.8% | | | | | | |
| | 5,757 | | | Atlas Copco AB, Class A | | | | | 120,311 | |
| | 2,038 | | | Hennes & Mauritz AB, Class B | | | | | 71,780 | |
| | 3,035 | | | Skandinaviska Enskilda Banken AB, Class A | | | | | 23,528 | |
| | | | | | | | | | | |
| | | | | | | | | | 215,619 | |
| | | | | | | | | | | |
| | | | | Switzerland–3.2% | | | | | | |
| | 942 | | | Novartis AG | | | | | 54,582 | |
| | 214 | | | Sonova Holding AG | | | | | 24,786 | |
| | | | | | | | | | | |
| | | | | | | | | | 79,368 | |
| | | | | | | | | | | |
| | | | | United Kingdom–13.9% | | | | | | |
| | 23,011 | | | Centrica PLC | | | | | 122,443 | |
| | 4,764 | | | Standard Chartered PLC | | | | | 137,798 | |
| | 4,189 | | | Xstrata PLC | | | | | 81,155 | |
| | | | | | | | | | | |
| | | | | | | | | | 341,396 | |
| | | | | | | | | | | |
| | | | | Total Common Stock (cost–$1,836,474) | | | | | 2,218,970 | |
| | | | | | | | | | | |
| | | | | | | | | | | |
| | | | | | | | | | | |
PREFERRED STOCK–6.7% |
| | | | | Germany–6.7% | | | | | | |
| | 1,408 | | | Fresenius SE | | | | | 126,197 | |
| | 644 | | | Henkel AG & Co. KGaA | | | | | 37,986 | |
| | | | | | | | | | | |
| | | | | | | | | | | |
| | | | | Total Preferred Stock (cost–$112,467) | | | | | 164,183 | |
| | | | | | | | | | | |
| | | | | Total Investments (cost–$1,948,941) (p) | | 97.0% | | | 2,383,153 | |
| | | | | Other assets less liabilities | | 3.0 | | | 74,001 | |
| | | | | | | | | | | |
| | | | | Net Assets | | 100.0% | | $ | 2,457,154 | |
| | | | | | | | | | | |
10.31.10 ï Allianz Global Investors Managed Accounts Trust Annual Report 17
Fixed Income SHares: Series C Schedule of Investments
October 31, 2010
| | | | | | | | | | | |
Principal
| | | | | | | | |
Amount
| | | | | Credit Rating
| | | |
| (000s) | | | | | (Moody’s/S&P)* | | Value | |
CORPORATE BONDS & NOTES–70.7% |
| | | | | Airlines–1.7% | | | | | | |
| $ | 98 | | | American Airlines Pass Through Trust, 10.375%, 7/2/19 | | Baa3/A− | | $ | 117,857 | |
| | 2,100 | | | Continental Airlines, Inc., 6.503%, 12/15/12 | | Baa2/BBB | | | 2,152,500 | |
| | | | | Delta Air Lines, Inc., | | | | | | |
| | 4,200 | | | 7.111%, 3/18/13 | | WR/BBB− | | | 4,399,500 | |
| | 300 | | | 7.57%, 5/18/12 | | WR/BBB− | | | 301,500 | |
| | | | | Northwest Airlines, Inc., | | | | | | |
| | 1,404 | | | 7.041%, 10/1/23 | | WR/BBB− | | | 1,474,661 | |
| | 47,460 | | | 7.15%, 4/1/21 (MBIA) | | Ba3/BB+ | | | 47,934,394 | |
| | 65 | | | United Air Lines Pass Trough Trust, 10.125%, 3/22/15 (b)(f) | | WR/NR | | | 25,856 | |
| | | | | | | | | | | |
| | | | | | | | | | 56,406,268 | |
| | | | | | | | | | | |
| | | | | Automotive–0.3% | | | | | | |
| | 9,100 | | | Volkswagen International Finance NV, 4.00%, 8/12/20 (a)(d) | | A3/A− | | | 9,331,586 | |
| | | | | | | | | | | |
| | | | | Banking–10.0% | | | | | | |
| € | 2,600 | | | ABN Amro Bank NV, 3.75%, 1/12/12 | | Aaa/AAA | | | 3,706,538 | |
| $ | 5,000 | | | American Express Bank FSB, 5.50%, 4/16/13 | | A2/BBB+ | | | 5,456,040 | |
| | 2,000 | | | ANZ National International Ltd., 6.20%, 7/19/13 (a)(d) | | Aa2/AA | | | 2,237,866 | |
| | 32,200 | | | Australia & New Zealand Banking Group Ltd., 3.70%, 1/13/15 (a)(d) | | Aa1/AA | | | 34,224,156 | |
| | 5,100 | | | Banco Santander Chile, 1.539%, 4/20/12, FRN (a)(d) | | Aa3/A+ | | | 5,100,388 | |
| € | 2,200 | | | Bank of Scotland PLC, 3.375%, 12/5/11 | | Aaa/AAA | | | 3,134,314 | |
| | | | | Barclays Bank PLC, | | | | | | |
| $ | 10,025 | | | 2.50%, 1/23/13 | | Aa3/AA− | | | 10,319,304 | |
| € | 5,180 | | | 4.875%, 12/15/14 (i) | | Baa3/A− | | | 6,422,046 | |
| $ | 400 | | | 5.00%, 9/22/16 | | Aa3/AA− | | | 445,438 | |
| | 25,300 | | | 5.20%, 7/10/14 | | Aa3/AA− | | | 28,221,062 | |
| | 24,000 | | | 6.05%, 12/4/17 (a)(d) | | Baa1/A | | | 26,304,480 | |
| | 5,000 | | | 6.86%, 6/15/32 (a)(d)(i) | | Baa2/A− | | | 4,925,000 | |
| | 5,900 | | | 7.434%, 12/15/17 (a)(d)(i) | | Baa2/A− | | | 6,047,500 | |
| | 4,000 | | | 8.55%, 6/15/11 (a)(d)(i) | | Baa2/A− | | | 4,085,000 | |
| £ | 3,300 | | | 14.00%, 6/15/19 (i) | | Baa2/A− | | | 6,806,093 | |
| $ | 6,600 | | | CBA Capital Trust II, 6.024%, 3/15/16 (a)(d)(i) | | A3/A+ | | | 6,554,348 | |
| € | 3,000 | | | Cie de Financement Foncier, 4.00%, 10/25/12 | | Aaa/AAA | | | 4,344,570 | |
| AUD | 2,600 | | | Commonwealth Bank of Australia, 4.50%, 2/20/14 | | Aaa/AAA | | | 2,477,516 | |
| $ | 5,000 | | | HBOS Capital Funding L.P., 6.071%, 6/30/14 (a)(d)(i) | | Ba2/BB− | | | 4,550,000 | |
| | 30,600 | | | HBOS PLC, 6.75%, 5/21/18 (a)(d) | | Baa3/BBB− | | | 31,421,426 | |
| | 10,400 | | | HSBC Bank USA N.A., 6.00%, 8/9/17 | | A1/AA− | | | 11,675,654 | |
18 Allianz Global Investors Managed Accounts Trust Annual Report ï 10.31.10
Fixed Income SHares: Series C Schedule of Investments
October 31, 2010 (continued)
| | | | | | | | | | | |
Principal
| | | | | | | | |
Amount
| | | | | Credit Rating
| | | |
| (000s) | | | | | (Moody’s/S&P)* | | Value | |
| | | | | Banking (continued) | | | | | | |
| | | | | | | | | | | |
| | | | | HSBC Capital Funding L.P. (a)(d)(i), | | | | | | |
| $ | 13,900 | | | 4.61%, 6/27/13 | | A3/A− | | $ | 13,682,840 | |
| | 1,350 | | | 10.176%, 6/30/30 | | A3/A− | | | 1,788,750 | |
| | 29,300 | | | Lloyds TSB Bank PLC, 12.00%, 12/16/24 (a)(d)(i) | | Ba1/BB | | | 35,213,131 | |
| | 25,000 | | | Rabobank Nederland NV, 11.00%, 6/30/19 (a)(d)(i) | | A2/AA− | | | 33,476,450 | |
| | 2,400 | | | RBS Capital Trust I, 4.709%, 7/1/13 (i) | | B3/C | | | 1,854,000 | |
| | 3,600 | | | Resona Bank Ltd., 5.85%, 4/15/16 (a)(d)(i) | | A3/BBB | | | 3,580,420 | |
| € | 1,000 | | | Royal Bank of Scotland PLC, 4.625%, 9/22/21, (converts to FRN on 9/22/16) | | Ba2/BBB | | | 1,309,814 | |
| | 2,100 | | | SNS Bank NV, 2.875%, 1/30/12 | | Aaa/AAA | | | 2,976,227 | |
| ¥ | 200,000 | | | Sumitomo Mitsui Banking Corp., 0.996%, 6/2/49 | | NR/NR | | | 2,399,193 | |
| $ | 1,700 | | | Wachovia Bank N.A., 0.622%, 3/15/16, FRN | | Aa3/AA− | | | 1,569,736 | |
| € | 5,000 | | | Wells Fargo Bank N.A., 6.00%, 5/23/13 | | Aa2/AA | | | 7,560,648 | |
| AUD | 20,000 | | | Westpac Banking Corp., 4.75%, 3/5/14 | | Aaa/AAA | | | 19,195,060 | |
| | | | | | | | | | | |
| | | | | | | | | | 333,065,008 | |
| | | | | | | | | | | |
| | | | | Computers–0.2% | | | | | | |
| $ | 5,000 | | | Lexmark International, Inc., 5.90%, 6/1/13 | | Baa3/BBB− | | | 5,438,465 | |
| | | | | | | | | | | |
| | | | | Diversified Manufacturing–0.5% | | | | | | |
| | 15,000 | | | Tyco Electronics Group S.A., 6.55%, 10/1/17 | | Baa2/BBB | | | 17,538,570 | |
| | | | | | | | | | | |
| | | | | Drugs & Medical Products–0.3% | | | | | | |
| | 100 | | | Biomet, Inc., 10.00%, 10/15/17 | | B3/B− | | | 111,500 | |
| | 1,700 | | | Hospira, Inc., 6.05%, 3/30/17 | | Baa3/BBB+ | | | 1,970,614 | |
| | 7,000 | | | Pfizer, Inc., 6.20%, 3/15/19 | | A1/AA | | | 8,596,826 | |
| | | | | | | | | | | |
| | | | | | | | | | 10,678,940 | |
| | | | | | | | | | | |
| | | | | Electronics–0.0% | | | | | | |
| | 400 | | | Sanmina-SCI Corp., 8.125%, 3/1/16 | | B2/CCC+ | | | 413,000 | |
| | | | | | | | | | | |
| | | | | Financial Services–33.0% | | | | | | |
| | | | | Ally Financial, Inc., | | | | | | |
| | 13,894 | | | 2.497%, 12/1/14, FRN | | B3/B | | | 12,435,825 | |
| | 12,430 | | | 6.00%, 12/15/11 | | B3/B | | | 12,684,865 | |
| | 1,000 | | | 6.75%, 12/1/14 | | B3/B | | | 1,046,825 | |
| | 10,500 | | | 7.50%, 12/31/13 | | B3/B | | | 11,340,000 | |
| | 17,300 | | | 8.00%, 3/15/20 (a)(d) | | B3/B | | | 19,159,750 | |
| | 14,820 | | | 8.00%, 11/1/31 | | B3/B | | | 16,187,130 | |
| | 19,100 | | | 8.30%, 2/12/15 (a)(d) | | B3/B | | | 20,866,750 | |
| | | | | American Express Co., | | | | | | |
| | 100 | | | 6.15%, 8/28/17 | | A3/BBB+ | | | 115,458 | |
| | 11,000 | | | 7.25%, 5/20/14 | | A3/BBB+ | | | 12,887,138 | |
10.31.10 ï Allianz Global Investors Managed Accounts Trust Annual Report 19
Fixed Income SHares: Series C Schedule of Investments
October 31, 2010 (continued)
| | | | | | | | | | | |
Principal
| | | | | | | | |
Amount
| | | | | Credit Rating
| | | |
| (000s) | | | | | (Moody’s/S&P)* | | Value | |
| | | | | Financial Services (continued) | | | | | | |
| | | | | | | | | | | |
| $ | 1,592 | | | American Express Travel Related Services Co., Inc., 5.25%, 11/21/11 (a)(d) | | A2/BBB+ | | $ | 1,653,246 | |
| £ | 3,500 | | | BAC Capital Trust VII, 5.25%, 8/10/35 | | Baa3/BB | | | 4,159,527 | |
| | | | | Bank of America Corp., | | | | | | |
| $ | 3,800 | | | 5.65%, 5/1/18 | | A2/A | | | 4,005,546 | |
| | 4,300 | | | 5.75%, 12/1/17 | | A2/A | | | 4,564,029 | |
| | 9,400 | | | 8.00%, 1/30/18 (i) | | Ba3/BB | | | 9,499,095 | |
| | 500 | | | Bank of America N.A., 5.30%, 3/15/17 | | A1/A | | | 513,358 | |
| | | | | Bear Stearns Cos. LLC, | | | | | | |
| | 1,500 | | | 5.30%, 10/30/15 | | Aa3/A+ | | | 1,689,514 | |
| | 4,800 | | | 5.70%, 11/15/14 | | Aa3/A+ | | | 5,473,766 | |
| | 16,865 | | | 7.25%, 2/1/18 | | Aa3/A+ | | | 20,608,490 | |
| | 9,400 | | | BNP Paribas, 5.186%, 6/29/15 (a)(d)(i) | | Baa1/A | | | 9,071,000 | |
| | | | | CIT Group, Inc., | | | | | | |
| | 6,684 | | | 7.00%, 5/1/13 | | B3/B+ | | | 6,800,975 | |
| | 126 | | | 7.00%, 5/1/14 | | B3/B+ | | | 127,267 | |
| | 126 | | | 7.00%, 5/1/15 | | B3/B+ | | | 126,480 | |
| | 210 | | | 7.00%, 5/1/16 | | B3/B+ | | | 210,276 | |
| | 294 | | | 7.00%, 5/1/17 | | B3/B+ | | | 294,018 | |
| | | | | Citigroup, Inc., | | | | | | |
| | 12,350 | | | 4.75%, 5/19/15 | | A3/A | | | 13,178,660 | |
| | 11,525 | | | 5.30%, 10/17/12 | | A3/A | | | 12,291,147 | |
| | 13,308 | | | 5.50%, 8/27/12 | | A3/A | | | 14,232,480 | |
| | 700 | | | 5.50%, 4/11/13 | | A3/A | | | 758,304 | |
| | 700 | | | 5.50%, 10/15/14 | | A3/A | | | 766,153 | |
| | 24,830 | | | 5.85%, 7/2/13 | | A3/A | | | 26,998,379 | |
| | 11,718 | | | 6.00%, 8/15/17 | | A3/A | | | 12,938,582 | |
| | 4,500 | | | 6.125%, 11/21/17 | | A3/A | | | 5,015,907 | |
| | 42,000 | | | 6.50%, 8/19/13 | | A3/A | | | 46,893,546 | |
| | 5,000 | | | 6.625%, 6/15/32 | | Baa1/A− | | | 5,136,110 | |
| | 7,260 | | | Citigroup Capital XXI, 8.30%, 12/21/57, (converts to FRN on 12/21/37) | | Ba1/BB− | | | 7,632,075 | |
| | | | | Credit Agricole S.A. (i), | | | | | | |
| | 16,300 | | | 6.637%, 5/31/17 (a)(d) | | A3/A− | | | 15,627,625 | |
| | 17,500 | | | 6.637%, 5/31/17 (b) | | A3/A− | | | 16,712,500 | |
| | | | | Ford Motor Credit Co. LLC, | | | | | | |
| | 5,700 | | | 3.039%, 1/13/12, FRN | | Ba2/B+ | | | 5,757,285 | |
| | 49,300 | | | 5.625%, 9/15/15 | | Ba2/B+ | | | 52,355,318 | |
| | 16,900 | | | 7.00%, 10/1/13 | | Ba2/B+ | | | 18,446,249 | |
20 Allianz Global Investors Managed Accounts Trust Annual Report ï 10.31.10
Fixed Income SHares: Series C Schedule of Investments
October 31, 2010 (continued)
| | | | | | | | | | | |
Principal
| | | | | | | | |
Amount
| | | | | Credit Rating
| | | |
| (000s) | | | | | (Moody’s/S&P)* | | Value | |
| | | | | Financial Services (continued) | | | | | | |
| | | | | | | | | | | |
| $ | 20,750 | | | 8.00%, 6/1/14 | | Ba2/B+ | | $ | 23,255,749 | |
| | 6,700 | | | 8.00%, 12/15/16 | | Ba2/B+ | | | 7,855,582 | |
| | 6,100 | | | 8.70%, 10/1/14 | | Ba2/B+ | | | 7,024,931 | |
| | | | | General Electric Capital Corp., | | | | | | |
| € | 10,000 | | | 4.625%, 9/15/66, (converts to FRN on 9/15/16) (a)(d) | | Aa3/A+ | | | 11,640,416 | |
| € | 25,700 | | | 5.50%, 9/15/67, (converts to FRN on 9/15/17) | | Aa3/A+ | | | 32,148,397 | |
| $ | 20,000 | | | 5.625%, 5/1/18 | | Aa2/AA+ | | | 22,384,720 | |
| | 5,000 | | | 6.375%, 11/15/67, (converts to FRN on 11/15/17) | | Aa3/A+ | | | 4,981,250 | |
| | £1,400 | | | 6.50%, 9/15/67, (converts to FRN on 9/15/17) | | Aa3/A+ | | | 2,092,830 | |
| | | | | Goldman Sachs Group, Inc., | | | | | | |
| € | 10,000 | | | 1.241%, 5/23/16, FRN | | A1/A | | | 12,530,411 | |
| $ | 5,855 | | | 5.25%, 10/15/13 | | A1/A | | | 6,407,566 | |
| | 19,559 | | | 5.35%, 1/15/16 | | A1/A | | | 21,575,455 | |
| € | 5,645 | | | 5.375%, 2/15/13 | | A1/A | | | 8,268,895 | |
| $ | 700 | | | 5.75%, 10/1/16 | | A1/A | | | 784,468 | |
| | 19,800 | | | 5.95%, 1/18/18 | | A1/A | | | 22,036,153 | |
| | 15,200 | | | 6.15%, 4/1/18 | | A1/A | | | 17,045,873 | |
| | 14,900 | | | 6.25%, 9/1/17 | | A1/A | | | 16,862,613 | |
| | 2,000 | | | HSBC Finance Corp., 6.375%, 11/27/12 | | A3/A | | | 2,186,828 | |
| | 400 | | | HSBC Holdings PLC, 7.625%, 5/17/32 | | A1/A | | | 452,513 | |
| | | | | International Lease Finance Corp. (a)(d), | | | | | | |
| | 4,000 | | | 6.75%, 9/1/16 | | Ba3/BBB− | | | 4,380,000 | |
| | 3,000 | | | 7.125%, 9/1/18 | | Ba3/BBB− | | | 3,315,000 | |
| | | | | JPMorgan Chase & Co., | | | | | | |
| | 6,000 | | | 4.25%, 10/15/20 | | Aa3/A+ | | | 6,055,962 | |
| | 32,200 | | | 6.00%, 1/15/18 | | Aa3/A+ | | | 36,810,460 | |
| | | | | JPMorgan Chase Bank N.A., | | | | | | |
| | 4,400 | | | 0.623%, 6/13/16, FRN | | Aa2/A+ | | | 4,145,086 | |
| | 9,200 | | | 6.00%, 10/1/17 | | Aa2/A+ | | | 10,485,645 | |
| | 2,700 | | | JPMorgan Chase Capital XX, 6.55%, 9/15/66, (converts to FRN on 9/15/36) | | A2/BBB+ | | | 2,628,269 | |
| | | | | LBG Capital No. 1 PLC, | | | | | | |
| € | 2,825 | | | 7.375%, 3/12/20 | | Ba3/BB− | | | 3,746,087 | |
| £ | 9,402 | | | 7.588%, 5/12/20 | | Ba3/BB− | | | 14,280,324 | |
| £ | 1,000 | | | 7.869%, 8/25/20 | | Ba3/BB− | | | 1,526,854 | |
| $ | 3,400 | | | 7.875%, 11/1/20 | | Ba3/BB− | | | 3,383,000 | |
| | 22,200 | | | 8.50%, 12/17/21 (a)(d)(g)(i) | | NR/B+ | | | 20,748,870 | |
| | | | | LBG Capital No. 2 PLC, | | | | | | |
| £ | 2,331 | | | 9.00%, 12/15/19 | | Ba2/BB | | | 3,726,803 | |
| | 4,500 | | | 9.334%, 2/7/20 | | Ba2/BB | | | 7,374,466 | |
| € | 2,180 | | | 15.00%, 12/21/19 | | Ba2/BB | | | 4,196,526 | |
10.31.10 ï Allianz Global Investors Managed Accounts Trust Annual Report 21
Fixed Income SHares: Series C Schedule of Investments
October 31, 2010 (continued)
| | | | | | | | | | | |
Principal
| | | | | | | | |
Amount
| | | | | Credit Rating
| | | |
| (000s) | | | | | (Moody’s/S&P)* | | Value | |
| | | | | Financial Services (continued) | | | | | | |
| | | | | | | | | | | |
| | | | | Merrill Lynch & Co., Inc., | | | | | | |
| € | 2,000 | | | 1.428%, 9/14/18, FRN | | A3/A− | | $ | 2,272,287 | |
| € | 2,150 | | | 1.628%, 9/27/12, FRN | | A2/A | | | 2,889,000 | |
| $ | 500 | | | 5.00%, 1/15/15 | | A2/A | | | 525,650 | |
| | 7,470 | | | 6.05%, 8/15/12 | | A2/A | | | 7,968,025 | |
| | 200 | | | 6.15%, 4/25/13 | | A2/A | | | 216,901 | |
| | 22,700 | | | 6.40%, 8/28/17 | | A2/A | | | 24,768,901 | |
| | 40,100 | | | 6.875%, 4/25/18 | | A2/A | | | 45,073,122 | |
| | | | | Morgan Stanley, | | | | | | |
| € | 10,000 | | | 1.407%, 1/16/17, FRN | | A2/A | | | 12,293,377 | |
| $ | 400 | | | 5.30%, 3/1/13 | | A2/A | | | 431,948 | |
| | 2,800 | | | 5.375%, 10/15/15 | | A2/A | | | 3,058,051 | |
| | 5,000 | | | 5.625%, 9/23/19 | | A2/A | | | 5,259,485 | |
| | 900 | | | 5.95%, 12/28/17 | | A2/A | | | 975,607 | |
| | 25,000 | | | 6.00%, 5/13/14 | | A2/A | | | 27,534,125 | |
| | 23,400 | | | 6.00%, 4/28/15 | | A2/A | | | 26,035,706 | |
| | 3,700 | | | 6.625%, 4/1/18 | | A2/A | | | 4,162,123 | |
| £ | 550 | | | MUFG Capital Finance 5 Ltd., 6.299%, 1/25/17 (i) | | Ba1/BBB+ | | | 841,265 | |
| $ | 633 | | | Preferred Term Securities XIII Ltd., 0.842%, 3/24/34, FRN (a)(b)(d)(n) (acquisition cost–$632,726; purchased 3/9/04) | | A1/CCC+ | | | 385,963 | |
| | | | | Royal Bank of Scotland Group PLC, | | | | | | |
| | 273 | | | 5.00%, 11/12/13 | | Ba2/NR | | | 278,425 | |
| | 22,200 | | | 6.99%, 10/5/17 (a)(d)(i) | | Ba3/C | | | 18,342,750 | |
| | 10,000 | | | 7.64%, 9/29/17 (i) | | B3/C | | | 7,812,500 | |
| | 5,000 | | | 7.648%, 9/30/31 (i) | | Ba2/BB− | | | 4,875,000 | |
| | | | | RSHB Capital S.A. for OJSC Russian Agricultural Bank, | | | | | | |
| | 500 | | | 7.125%, 1/14/14 | | Baa1/NR | | | 541,875 | |
| | 1,500 | | | 9.00%, 6/11/14 (a)(d) | | Baa1/NR | | | 1,725,000 | |
| | | | | SLM Corp., | | | | | | |
| € | 1,600 | | | 3.125%, 9/17/12 | | Ba1/BBB− | | | 2,147,054 | |
| € | 1,600 | | | 4.75%, 3/17/14 | | Ba1/BBB− | | | 2,078,268 | |
| £ | 500 | | | 4.875%, 12/17/12 | | Ba1/BBB− | | | 751,682 | |
| $ | 9,255 | | | 8.45%, 6/15/18 | | Ba1/BBB− | | | 9,709,402 | |
| | | | | Teco Finance, Inc., | | | | | | |
| | 983 | | | 6.572%, 11/1/17 | | Baa3/BBB− | | | 1,143,286 | |
| | 2,000 | | | 6.75%, 5/1/15 | | Baa3/BBB− | | | 2,342,976 | |
| | | | | Temasek Financial I Ltd., | | | | | | |
| | 6,450 | | | 4.30%, 10/25/19 (a)(d) | | Aaa/AAA | | | 7,004,003 | |
| | 10,000 | | | 4.30%, 10/25/19 | | Aaa/AAA | | | 10,658,080 | |
| | 7,700 | | | TNK-BP Finance S.A., 7.50%, 3/13/13 | | Baa2/BBB− | | | 8,373,750 | |
22 Allianz Global Investors Managed Accounts Trust Annual Report ï 10.31.10
Fixed Income SHares: Series C Schedule of Investments
October 31, 2010 (continued)
| | | | | | | | | | | |
Principal
| | | | | | | | |
Amount
| | | | | Credit Rating
| | | |
| (000s) | | | | | (Moody’s/S&P)* | | Value | |
| | | | | Financial Services (continued) | | | | | | |
| | | | | | | | | | | |
| $ | 6,800 | | | TransCapitalInvest Ltd. for OJSC AK Transneft,
5.67%, 3/5/14 | | Baa1/BBB | | $ | 7,250,500 | |
| | 1,000 | | | UBS AG, 5.875%, 12/20/17 | | Aa3/A+ | | | 1,147,940 | |
| | 5,900 | | | UBS Preferred Funding Trust V, 6.243%, 5/15/16 (i) | | Baa3/BBB− | | | 5,892,920 | |
| | 6,700 | | | USB Capital IX, 6.189%, 4/15/11 (i) | | A3/BBB+ | | | 5,326,500 | |
| | | | | Wachovia Corp., | | | | | | |
| | 2,000 | | | 5.625%, 10/15/16 | | A2/A+ | | | 2,233,174 | |
| | 10,000 | | | 5.75%, 2/1/18 | | A1/AA− | | | 11,364,320 | |
| | 35,917 | | | Wells Fargo & Co., 7.98%, 3/15/18 (i) | | Ba1/A− | | | 37,892,435 | |
| | 4,300 | | | White Nights Finance BV for Gazprom,
10.50%, 3/25/14 | | Baa1/NR | | | 5,178,920 | |
| | 7,400 | | | Xstrata Finance Canada Ltd., 5.80%, 11/15/16 (a)(d) | | Baa2/BBB | | | 8,329,092 | |
| | | | | | | | | | | |
| | | | | | | | | | 1,103,690,038 | |
| | | | | | | | | | | |
| | | | | Food & Beverage–0.3% | | | | | | |
| | 400 | | | H.J. Heinz Co., 15.59%, 12/1/20 (a)(b)(d)(n) (acquisition cost–$489,132; purchased 3/26/10) | | Baa2/BBB | | | 466,138 | |
| | 6,700 | | | Kraft Foods, Inc., 6.50%, 8/11/17 | | Baa2/BBB− | | | 8,064,556 | |
| | 400 | | | Kroger Co., 6.20%, 6/15/12 | | Baa2/BBB | | | 433,518 | |
| | 1,100 | | | Tate & Lyle International Finance PLC,
6.625%, 6/15/16 (a)(d) | | Baa3/BBB− | | | 1,254,291 | |
| | | | | | | | | | | |
| | | | | | | | | | 10,218,503 | |
| | | | | | | | | | | |
| | | | | Healthcare & Hospitals–0.3% | | | | | | |
| | 8,050 | | | HCA, Inc., 9.125%, 11/15/14 | | B2/BB− | | | 8,457,531 | |
| | | | | | | | | | | |
| | | | | Holding Companies–0.0% | | | | | | |
| | 1,000 | | | Hutchinson Whampoa International 09 Ltd.,
7.625%, 4/9/19 | | A3/A− | | | 1,248,178 | |
| | | | | | | | | | | |
| | | | | Insurance–5.9% | | | | | | |
| | | | | American International Group, Inc., | | | | | | |
| € | 7,800 | | | 4.875%, 3/15/67, (converts to FRN on 3/15/17) | | Ba2/BBB | | | 8,754,288 | |
| $ | 7,600 | | | 5.05%, 10/1/15 | | A3/A− | | | 7,991,400 | |
| | 1,000 | | | 5.45%, 5/18/17 | | A3/A− | | | 1,043,750 | |
| | 600 | | | 5.60%, 10/18/16 | | A3/A− | | | 630,750 | |
| | 30,200 | | | 5.85%, 1/16/18 | | A3/A− | | | 32,087,500 | |
| | 16,800 | | | 6.25%, 5/1/36 | | A3/A− | | | 16,821,000 | |
| € | 24,050 | | | 8.00%, 5/22/68, (converts to FRN on 5/22/18) | | Ba2/BBB | | | 33,844,944 | |
| $ | 7,700 | | | 8.175%, 5/15/68, (converts to FRN on 5/15/38) | | Ba2/BBB | | | 8,258,250 | |
| | 67,700 | | | 8.25%, 8/15/18 | | A3/A− | | | 81,155,375 | |
| £ | 3,000 | | | 8.625%, 5/22/68, (converts to FRN on 5/22/18) | | Ba2/BBB | | | 4,964,275 | |
| | | | | | | | | | | |
| | | | | | | | | | 195,551,532 | |
| | | | | | | | | | | |
10.31.10 ï Allianz Global Investors Managed Accounts Trust Annual Report 23
Fixed Income SHares: Series C Schedule of Investments
October 31, 2010 (continued)
| | | | | | | | | | | |
Principal
| | | | | | | | |
Amount
| | | | | Credit Rating
| | | |
| (000s) | | | | | (Moody’s/S&P)* | | Value | |
| | | | | Metals & Mining–0.4% | | | | | | |
| $ | 5,000 | | | Alcoa, Inc., 6.00%, 7/15/13 | | Baa3/BBB− | | $ | 5,465,315 | |
| | 5,000 | | | Gold Fields Orogen Holding BVI Ltd., 4.875%, 10/7/20 (a)(d) | | Baa3/BBB− | | | 4,917,985 | |
| | 1,600 | | | Newmont Mining Corp., 5.125%, 10/1/19 | | Baa1/BBB+ | | | 1,817,848 | |
| | 2,000 | | | Rio Tinto Finance USA Ltd., 8.95%, 5/1/14 | | A3/BBB+ | | | 2,499,588 | |
| | | | | | | | | | | |
| | | | | | | | | | 14,700,736 | |
| | | | | | | | | | | |
| | | | | Multi-Media–2.1% | | | | | | |
| | 1,000 | | | Comcast Cable Communications LLC, 7.125%, 6/15/13 | | Baa1/BBB+ | | | 1,144,563 | |
| | | | | Comcast Corp., | | | | | | |
| | 10,600 | | | 5.875%, 2/15/18 | | Baa1/BBB+ | | | 12,266,797 | |
| | 1,700 | | | 5.90%, 3/15/16 | | Baa1/BBB+ | | | 1,986,215 | |
| | 810 | | | CSC Holdings LLC, 7.875%, 2/15/18 | | Ba3/BB | | | 909,225 | |
| | | | | DISH DBS Corp., | | | | | | |
| | 3,700 | | | 7.00%, 10/1/13 | | Ba3/BB− | | | 3,977,500 | |
| | 4,200 | | | 7.125%, 2/1/16 | | Ba3/BB− | | | 4,473,000 | |
| | 19,200 | | | 7.75%, 5/31/15 | | Ba3/BB− | | | 21,000,000 | |
| | | | | Time Warner Cable, Inc., | | | | | | |
| | 6,940 | | | 5.85%, 5/1/17 | | Baa2/BBB | | | 7,929,013 | |
| | 1,500 | | | 8.25%, 4/1/19 | | Baa2/BBB | | | 1,955,579 | |
| | 12,200 | | | Time Warner Entertainment Co. L.P., 8.875%, 10/1/12 | | Baa2/BBB | | | 13,866,166 | |
| | | | | | | | | | | |
| | | | | | | | | | 69,508,058 | |
| | | | | | | | | | | |
| | | | | Oil & Gas–6.1% | | | | | | |
| | 300 | | | Anadarko Petroleum Corp., 5.95%, 9/15/16 | | Ba1/BBB− | | | 328,648 | |
| | 800 | | | BP Capital Markets PLC, 2.75%, 2/27/12 | | A2/A | | | 810,172 | |
| | 2,400 | | | Canadian Natural Resources Ltd., 6.00%, 8/15/16 | | Baa1/BBB | | | 2,853,154 | |
| | 10,400 | | | Canadian Oil Sands Ltd., 7.75%, 5/15/19 (a)(d) | | Baa2/BBB | | | 12,825,311 | |
| | 2,900 | | | DCP Midstream LLC, 5.375%, 10/15/15 (a)(d) | | Baa2/BBB | | | 3,282,278 | |
| | 846 | | | Devon Energy Corp., 7.95%, 4/15/32 | | Baa1/BBB+ | | | 1,143,933 | |
| | 1,300 | | | Devon Financing Corp. ULC, 7.875%, 9/30/31 | | Baa1/BBB+ | | | 1,734,975 | |
| | | | | El Paso Corp., | | | | | | |
| | 2,450 | | | 7.00%, 6/15/17 | | Ba3/BB− | | | 2,683,127 | |
| | 19,700 | | | 7.25%, 6/1/18 | | Ba3/BB− | | | 21,959,216 | |
| | 4,800 | | | Enbridge Energy Partners L.P., 5.875%, 12/15/16 | | Baa2/BBB | | | 5,558,510 | |
| | | | | EnCana Corp., | | | | | | |
| | 2,000 | | | 5.90%, 12/1/17 | | Baa2/BBB+ | | | 2,364,954 | |
| | 4,700 | | | 6.50%, 8/15/34 | | Baa2/BBB+ | | | 5,327,046 | |
| | | | | Energy Transfer Partners L.P., | | | | | | |
| | 3,000 | | | 6.00%, 7/1/13 | | Baa3/BBB− | | | 3,312,126 | |
| | 2,100 | | | 6.125%, 2/15/17 | | Baa3/BBB− | | | 2,340,326 | |
| | 2,600 | | | 6.625%, 10/15/36 | | Baa3/BBB− | | | 2,722,574 | |
24 Allianz Global Investors Managed Accounts Trust Annual Report ï 10.31.10
Fixed Income SHares: Series C Schedule of Investments
October 31, 2010 (continued)
| | | | | | | | | | | |
Principal
| | | | | | | | |
Amount
| | | | | Credit Rating
| | | |
| (000s) | | | | | (Moody’s/S&P)* | | Value | |
| | | | | Oil & Gas (continued) | | | | | | |
| | | | | | | | | | | |
| | | | | Enterprise Products Operating LLC, | | | | | | |
| $ | 600 | | | 4.60%, 8/1/12 | | Baa3/BBB− | | $ | 631,670 | |
| | 756 | | | 7.625%, 2/15/12 | | Baa3/BBB− | | | 809,748 | |
| | | | | Gaz Capital S.A. for Gazprom (a)(d), | | | | | | |
| | 5,700 | | | 7.343%, 4/11/13 | | Baa1/BBB | | | 6,205,875 | |
| | 14,000 | | | 8.146%, 4/11/18 | | Baa1/BBB | | | 16,257,500 | |
| | 2,319 | | | Gazprom International S.A. for Gazprom,
7.201%, 2/1/20 | | NR/BBB+ | | | 2,501,418 | |
| | 1,089 | | | Kern River Funding Corp., 4.893%, 4/30/18 (a)(d) | | A3/A− | | | 1,152,823 | |
| | | | | Kinder Morgan Energy Partners L.P., | | | | | | |
| | 5,800 | | | 6.00%, 2/1/17 | | Baa2/BBB | | | 6,641,945 | |
| | 3,800 | | | 6.95%, 1/15/38 | | Baa2/BBB | | | 4,244,851 | |
| | 5,500 | | | 7.30%, 8/15/33 | | Baa2/BBB | | | 6,294,871 | |
| | 11,900 | | | Midcontinent Express Pipeline LLC,
5.45%, 9/15/14 (a)(d) | | Ba1/BBB− | | | 12,999,893 | |
| | 4,500 | | | Morgan Stanley Bank AG for OAO Gazprom,
9.625%, 3/1/13 (a)(d) | | Baa1/BBB | | | 5,130,000 | |
| | 3,400 | | | NGPL PipeCo LLC, 7.119%, 12/15/17 (a)(d) | | Ba1/BBB− | | | 3,838,933 | |
| | | | | Northwest Pipeline GP, | | | | | | |
| | 3,900 | | | 5.95%, 4/15/17 | | Baa2/BBB− | | | 4,519,515 | |
| | 1,700 | | | 7.00%, 6/15/16 | | Baa2/BBB− | | | 2,081,013 | |
| | 500 | | | Pemex Project Funding Master Trust, 5.75%, 12/15/15 | | Baa1/BBB | | | 569,028 | |
| | 14,800 | | | Petrobras International Finance Co., 7.875%, 3/15/19 | | Baa1/BBB− | | | 18,781,866 | |
| | | | | Petroleos Mexicanos, | | | | | | |
| | 13,900 | | | 5.50%, 1/21/21 | | Baa1/BBB | | | 15,181,580 | |
| | 1,000 | | | 8.00%, 5/3/19 | | Baa1/BBB | | | 1,290,100 | |
| | 2,600 | | | Plains All American Pipeline L.P., 6.65%, 1/15/37 | | Baa3/BBB− | | | 2,783,773 | |
| | 1,200 | | | Plains Exploration & Production Co., 7.00%, 3/15/17 | | B1/BB− | | | 1,248,000 | |
| | 3,365 | | | Ras Laffan Liquefied Natural Gas Co., Ltd. II,
5.298%, 9/30/20 (b) | | Aa2/A | | | 3,667,360 | |
| | | | | Ras Laffan Liquefied Natural Gas Co., Ltd. III (b), | | | | | | |
| | 1,400 | | | 5.50%, 9/30/14 | | Aa2/A | | | 1,547,895 | |
| | 2,230 | | | 5.832%, 9/30/16 | | Aa2/A | | | 2,442,398 | |
| | 3,000 | | | 6.75%, 9/30/19 | | Aa2/A | | | 3,599,481 | |
| | 4,400 | | | Southern Natural Gas Co., 5.90%, 4/1/17 (a)(d) | | Baa3/BB | | | 4,848,259 | |
| | 1,950 | | | Tennessee Gas Pipeline Co., 7.50%, 4/1/17 | | Baa3/BB | | | 2,304,627 | |
| | 3,000 | | | XTO Energy, Inc., 7.50%, 4/15/12 | | Aaa/AAA | | | 3,292,752 | |
| | | | | | | | | | | |
| | | | | | | | | | 204,113,524 | |
| | | | | | | | | | | |
10.31.10 ï Allianz Global Investors Managed Accounts Trust Annual Report 25
Fixed Income SHares: Series C Schedule of Investments
October 31, 2010 (continued)
| | | | | | | | | | | |
Principal
| | | | | | | | |
Amount
| | | | | Credit Rating
| | | |
| (000s) | | | | | (Moody’s/S&P)* | | Value | |
| | | | | Paper & Forest Products–1.8% | | | | | | |
| | | | | Weyerhaeuser Co., | | | | | | |
| $ | 51,406 | | | 6.75%, 3/15/12 | | Ba1/BBB− | | $ | 54,780,547 | |
| | 5,000 | | | 7.375%, 10/1/19 | | Ba1/BBB− | | | 5,543,750 | |
| | | | | | | | | | | |
| | | | | | | | | | 60,324,297 | |
| | | | | | | | | | | |
| | | | | Paper/Paper Products–0.5% | | | | | | |
| | | | | Georgia-Pacific LLC (a)(d), | | | | | | |
| | 6,300 | | | 5.40%, 11/1/20 (e) | | Ba2/BBB | | | 6,394,500 | |
| | 6,400 | | | 7.00%, 1/15/15 | | Ba2/BBB | | | 6,712,000 | |
| | 2,900 | | | 7.125%, 1/15/17 | | Ba2/BBB | | | 3,132,000 | |
| | | | | | | | | | | |
| | | | | | | | | | 16,238,500 | |
| | | | | | | | | | | |
| | | | | Retail–0.8% | | | | | | |
| | 23,601 | | | CVS Pass Through Trust, 7.507%, 1/10/32 (a)(d) | | Baa2/BBB+ | | | 27,665,492 | |
| | | | | | | | | | | |
| | | | | Telecommunications–3.3% | | | | | | |
| | | | | America Movil SAB De C.V., | | | | | | |
| | 34,100 | | | 5.00%, 3/30/20 | | A2/A− | | | 37,446,983 | |
| | 30,900 | | | 6.125%, 3/30/40 | | A2/A− | | | 34,315,995 | |
| | | | | AT&T Corp., | | | | | | |
| | 2,252 | | | 7.30%, 11/15/11 | | A2/A | | | 2,404,393 | |
| | 51 | | | 8.00%, 11/15/31 | | A2/A | | | 66,637 | |
| | | | | AT&T, Inc., | | | | | | |
| | 1,718 | | | 5.35%, 9/1/40 (a)(d) | | A2/A | | | 1,693,177 | |
| | 5,000 | | | 5.50%, 2/1/18 | | A2/A | | | 5,830,545 | |
| | | | | Deutsche Telekom International Finance BV, | | | | | | |
| | 4,500 | | | 6.75%, 8/20/18 | | Baa1/BBB+ | | | 5,598,958 | |
| € | 1,280 | | | 8.125%, 5/29/12 | | Baa1/BBB+ | | | 1,955,500 | |
| $ | 3,000 | | | Qtel International Finance Ltd., 3.375%, 10/14/16 (a)(d) | | A2/A | | | 2,997,555 | |
| | 9,503 | | | Qwest Communications International, Inc.,
7.50%, 2/15/14 | | Ba2/B+ | | | 9,740,575 | |
| | | | | Qwest Corp., | | | | | | |
| | 2,000 | | | 3.542%, 6/15/13, FRN | | Baa3/BBB− | | | 2,105,000 | |
| | 1,250 | | | 6.50%, 6/1/17 | | Baa3/BBB− | | | 1,403,125 | |
| | 4,800 | | | Sprint Capital Corp., 8.75%, 3/15/32 | | Ba3/BB− | | | 5,292,000 | |
| | | | | | | | | | | |
| | | | | | | | | | 110,850,443 | |
| | | | | | | | | | | |
| | | | | Tobacco–0.7% | | | | | | |
| | 10,000 | | | Altria Group, Inc., 10.20%, 2/6/39 | | Baa1/BBB | | | 14,765,260 | |
| | 8,130 | | | Reynolds American, Inc., 7.75%, 6/1/18 | | Baa3/BBB | | | 9,663,294 | |
| | | | | | | | | | | |
| | | | | | | | | | 24,428,554 | |
| | | | | | | | | | | |
26 Allianz Global Investors Managed Accounts Trust Annual Report ï 10.31.10
Fixed Income SHares: Series C Schedule of Investments
October 31, 2010 (continued)
| | | | | | | | | | | |
Principal
| | | | | | | | |
Amount
| | | | | Credit Rating
| | | |
| (000s) | | | | | (Moody’s/S&P)* | | Value | |
| | | | | Utilities–2.5% | | | | | | |
| $ | 2,649 | | | Bruce Mansfield Unit, 6.85%, 6/1/34 | | Baa2/BBB− | | $ | 2,932,444 | |
| | 400 | | | Columbus Southern Power Co., 5.50%, 3/1/13 | | A3/BBB | | | 439,632 | |
| | 655 | | | Constellation Energy Group, Inc., 7.00%, 4/1/12 | | Baa3/BBB− | | | 702,089 | |
| | | | | Consumers Energy Co., | | | | | | |
| | 2,050 | | | 5.00%, 2/15/12 | | A3/BBB+ | | | 2,156,569 | |
| | 850 | | | 5.00%, 3/15/15 | | A3/BBB+ | | | 951,374 | |
| | 2,000 | | | 5.15%, 2/15/17 | | A3/BBB+ | | | 2,258,300 | |
| | 1,100 | | | 5.375%, 4/15/13 | | A3/BBB+ | | | 1,208,523 | |
| | 1,400 | | | Dayton Power & Light Co., 5.125%, 10/1/13 | | Aa3/A | | | 1,564,331 | |
| | 5,000 | | | DTE Energy Co., 6.35%, 6/1/16 | | Baa2/BBB− | | | 5,875,315 | |
| | 14,200 | | | EDF S.A., 6.50%, 1/26/19 (a)(d) | | Aa3/A+ | | | 17,604,649 | |
| | 27,500 | | | Entergy Corp., 3.625%, 9/15/15 | | Baa3/BBB− | | | 28,115,560 | |
| | 1,600 | | | FirstEnergy Corp., 6.45%, 11/15/11 | | Baa3/BB+ | | | 1,672,192 | |
| | 277 | | | GG1C Funding Corp., 5.129%, 1/15/14 (a)(d) | | Baa3/BBB+ | | | 288,489 | |
| | 200 | | | Midamerican Energy Holdings Co., 5.875%, 10/1/12 | | Baa1/BBB+ | | | 217,949 | |
| | | | | Nevada Power Co., | | | | | | |
| | 100 | | | 5.875%, 1/15/15 | | Baa3/BBB | | | 114,988 | |
| | 1,600 | | | 5.95%, 3/15/16 | | Baa3/BBB | | | 1,864,634 | |
| | 3,000 | | | 6.50%, 5/15/18 | | Baa3/BBB | | | 3,616,332 | |
| | 1,700 | | | Ohio Edison Co., 5.45%, 5/1/15 | | Baa2/BBB− | | | 1,910,020 | |
| | 2,900 | | | Public Service Co. of Oklahoma, 6.15%, 8/1/16 | | Baa1/BBB | | | 3,399,452 | |
| | 1,900 | | | Sierra Pacific Power Co., 6.00%, 5/15/16 | | Baa3/BBB | | | 2,228,238 | |
| | 4,500 | | | Toledo Edison Co., 6.15%, 5/15/37 | | Baa1/BBB | | | 4,776,453 | |
| | 76 | | | W3A Funding Corp., 8.09%, 1/2/17 | | Baa2/BBB | | | 77,379 | |
| | | | | | | | | | | |
| | | | | | | | | | 83,974,912 | |
| | | | | | | | | | | |
| | | | | Total Corporate Bonds & Notes (cost–$2,100,668,756) | | | | | 2,363,842,135 | |
| | | | | | | | | | | |
| | | | | | | | | | | |
| | | | | | | | | | | |
SOVEREIGN DEBT OBLIGATIONS–8.6% |
| | | | | Australia–0.2% | | | | | | |
| AUD | 5,400 | | | Queensland Treasury Corp., 6.00%, 9/14/17, Ser. 17 | | Aaa/AAA | | | 5,449,130 | |
| | | | | | | | | | | |
| | | | | Brazil–5.3% | | | | | | |
| | | | | Brazil Notas do Tesouro Nacional, Ser. F, | | | | | | |
| BRL | 2,798 | | | 10.00%, 1/1/12 | | Baa3/NR | | | 1,621,547 | |
| BRL | 147,046 | | | 10.00%, 1/1/17 | | Baa3/NR | | | 79,387,713 | |
| BRL | 147,171 | | | 10.00%, 1/1/21 | | Baa3/NR | | | 76,413,907 | |
| $ | 3,300 | | | Brazilian Development Bank, 6.369%, 6/16/18 | | Ba3/BBB− | | | 3,803,250 | |
| | 12,176 | | | Brazilian Government International Bond,
8.875%, 10/14/19 | | Baa3/BBB− | | | 17,350,800 | |
| | | | | | | | | | | |
| | | | | | | | | | 178,577,217 | |
| | | | | | | | | | | |
10.31.10 ï Allianz Global Investors Managed Accounts Trust Annual Report 27
Fixed Income SHares: Series C Schedule of Investments
October 31, 2010 (continued)
| | | | | | | | | | | |
Principal
| | | | | | | | |
Amount
| | | | | Credit Rating
| | | |
| (000s) | | | | | (Moody’s/S&P)* | | Value | |
| | | | | Canada–0.9% | | | | | | |
| CAD | 2,400 | | | Province of Ontario Canada, 6.50%, 3/8/29 | | Aa1/AA− | | $ | 3,080,651 | |
| $ | 27,800 | | | Province of Quebec Canada, 3.50%, 7/29/20 | | Aa2/A+ | | | 28,428,975 | |
| | | | | | | | | | | |
| | | | | | | | | | 31,509,626 | |
| | | | | | | | | | | |
| | | | | Colombia–0.1% | | | | | | |
| | 2,000 | | | Colombia Government International Bond,
7.375%, 1/27/17 | | Ba1/BBB− | | | 2,503,000 | |
| | | | | | | | | | | |
| | | | | Germany–1.3% | | | | | | |
| € | 25,200 | | | Bundesrepublik Deutschland, 4.25%, 7/4/39, Ser. 07 | | Aaa/AAA | | | 43,095,399 | |
| | | | | | | | | | | |
| | | | | Indonesia–0.1% | | | | | | |
| $ | 3,100 | | | Indonesia Government International Bond,
6.875%, 1/17/18 | | Ba2/BB | | | 3,755,030 | |
| | | | | | | | | | | |
| | | | | Korea (Republic of)–0.3% | | | | | | |
| | 10,300 | | | Export-Import Bank of Korea, 4.00%, 1/29/21 | | A1/A | | | 10,127,784 | |
| | 300 | | | Korea Development Bank, 8.00%, 1/23/14 | | A1/A | | | 353,465 | |
| | | | | | | | | | | |
| | | | | | | | | | 10,481,249 | |
| | | | | | | | | | | |
| | | | | Qatar–0.3% | | | | | | |
| | | | | Qatar Government International Bond (a)(d), | | | | | | |
| | 3,300 | | | 4.00%, 1/20/15 | | Aa2/AA | | | 3,493,875 | |
| | 6,100 | | | 5.25%, 1/20/20 | | Aa2/AA | | | 6,755,750 | |
| | | | | | | | | | | |
| | | | | | | | | | 10,249,625 | |
| | | | | | | | | | | |
| | | | | Russia–0.1% | | | | | | |
| | 1,790 | | | Russian Federation, 7.50%, 3/31/30 | | Baa1/BBB | | | 2,152,296 | |
| | | | | | | | | | | |
| | | | | Total Sovereign Debt Obligations (cost–$269,387,416) | | | | | 287,772,572 | |
| | | | | | | | | | | |
| | | | | | | | | | | |
| | | | | | | | | | | |
MUNICIPAL BONDS–6.5% |
| | | | | Arizona–0.1% | | | | | | |
| | 2,000 | | | Univ. of Arizona Rev., 6.423%, 8/1/35 | | Aa3/AA− | | | 2,017,460 | |
| | | | | | | | | | | |
| | | | | California–2.8% | | | | | | |
| | 2,400 | | | Golden State Tobacco Securitization Corp. Rev.,
5.75%, 6/1/47, Ser. A-1 | | Baa3/BBB | | | 1,914,672 | |
| | 15,000 | | | Infrastructure & Economic Dev. Bank Rev.,
6.486%, 5/15/49 | | Aa2/AA− | | | 15,846,000 | |
| | 25,000 | | | Los Angeles Community College Dist., GO,
6.75%, 8/1/49 | | Aa1/AA | | | 26,777,000 | |
| | 3,000 | | | Los Angeles Department of Water & Power Rev., 5.516%, 7/1/27, Ser. C | | Aa3/AA− | | | 2,985,540 | |
| | 13,600 | | | Northern California Power Agcy. Rev., 7.311%, 6/1/40 | | A3/A− | | | 14,574,576 | |
28 Allianz Global Investors Managed Accounts Trust Annual Report ï 10.31.10
Fixed Income SHares: Series C Schedule of Investments
October 31, 2010 (continued)
| | | | | | | | | | | |
Principal
| | | | | | | | |
Amount
| | | | | Credit Rating
| | | |
| (000s) | | | | | (Moody’s/S&P)* | | Value | |
| | | | | California (continued) | | | | | | |
| | | | | | | | | | | |
| | | | | State, GO, | | | | | | |
| $ | 4,350 | | | 7.55%, 4/1/39 | | A1/A− | | $ | 4,548,969 | |
| | 22,400 | | | 7.95%, 3/1/36 | | A1/A− | | | 23,508,128 | |
| | 2,500 | | | Univ. of California Rev., 4.75%, 5/15/33, Ser. L | | Aa1/AA | | | 2,543,500 | |
| | | | | | | | | | | |
| | | | | | | | | | 92,698,385 | |
| | | | | | | | | | | |
| | | | | Illinois–0.5% | | | | | | |
| | 1,500 | | | Chicago Board of Education, GO, 5.25%, 12/1/26, Ser. C | | Aa2/AA− | | | 1,615,410 | |
| | 2,500 | | | Chicago Metropolitan Water Reclamation Dist., GO, 5.72%, 12/1/38 | | Aaa/AAA | | | 2,736,850 | |
| | 10,500 | | | Chicago Transit Auth. Rev., 6.20%, 12/1/40, Ser. B | | Aa3/AA | | | 10,116,855 | |
| | | | | Finance Auth. Rev., Univ. of Chicago, | | | | | | |
| | 1,240 | | | 5.00%, 7/1/27, Ser. A | | Aa1/AA | | | 1,326,217 | |
| | 1,600 | | | 5.50%, 7/1/37, Ser. B | | Aa1/AA | | | 1,782,608 | |
| | | | | | | | | | | |
| | | | | | | | | | 17,577,940 | |
| | | | | | | | | | | |
| | | | | Iowa–0.0% | | | | | | |
| | 765 | | | Tobacco Settlement Auth. Rev., 6.50%, 6/1/23, Ser. A | | Baa3/BBB | | | 710,387 | |
| | | | | | | | | | | |
| | | | | Massachusetts–0.4% | | | | | | |
| | 12,000 | | | School Building Auth. Rev., 5.468%, 6/15/27 | | Aa2/AA | | | 12,628,080 | |
| | | | | | | | | | | |
| | | | | Michigan–0.3% | | | | | | |
| | 8,355 | | | Detroit City School Dist., School Building & Site Improvements, GO, 5.00%, 5/1/33, Ser. B (FGIC) (Q-SBLF) | | Aa2/AA− | | | 8,299,189 | |
| | | | | | | | | | | |
| | | | | Minnesota–0.0% | | | | | | |
| | 900 | | | St. Louis Park Rev., Nicollett Health Services,
5.75%, 7/1/39 | | NR/A | | | 933,462 | |
| | | | | | | | | | | |
| | | | | Nevada–0.1% | | | | | | |
| | 4,005 | | | Clark Cnty. School Dist., GO, 5.00%, 6/15/19, Ser. A | | Aa1/AA | | | 4,561,294 | |
| | | | | | | | | | | |
| | | | | New Jersey–0.0% | | | | | | |
| | 250 | | | Tobacco Settlement Financing Corp. Rev.,
5.00%, 6/1/41, Ser. 1-A | | Baa3/BBB | | | 180,718 | |
| | | | | | | | | | | |
| | | | | New York–0.3% | | | | | | |
| | 1,300 | | | New York City Transitional Finance Auth. Rev.,
5.00%, 1/15/25, Ser. S-1 | | Aa3/AA− | | | 1,416,181 | |
| | 5,000 | | | Port Auth. of New York & New Jersey Rev.,
5.125%, 5/1/34, Ser. 136 (NPFGC) (m) | | Aa2/AA− | | | 5,136,250 | |
| | 2,500 | | | State Urban Dev. Corp. Rev., 5.77%, 3/15/39 | | NR/AAA | | | 2,556,650 | |
| | | | | | | | | | | |
| | | | | | | | | | 9,109,081 | |
| | | | | | | | | | | |
10.31.10 ï Allianz Global Investors Managed Accounts Trust Annual Report 29
Fixed Income SHares: Series C Schedule of Investments
October 31, 2010 (continued)
| | | | | | | | | | | |
Principal
| | | | | | | | |
Amount
| | | | | Credit Rating
| | | |
| (000s) | | | | | (Moody’s/S&P)* | | Value | |
| | | | | Ohio–0.4% | | | | | | |
| $ | 3,600 | | | American Municipal Power Rev., 5.939%, 2/15/47 | | A1/A | | $ | 3,511,836 | |
| | | | | Buckeye Tobacco Settlement Financing Auth. Rev., Ser. A-2, | | | | | | |
| | 11,700 | | | 5.75%, 6/1/34 | | Baa3/BBB | | | 9,341,748 | |
| | 900 | | | 5.875%, 6/1/47 | | Baa3/BBB | | | 687,042 | |
| | | | | | | | | | | |
| | | | | | | | | | 13,540,626 | |
| | | | | | | | | | | |
| | | | | Texas–1.5% | | | | | | |
| | 43,800 | | | Dallas Area Rapid Transit Rev., 5.022%, 12/1/48 | | Aa2/AA+ | | | 41,998,068 | |
| | 4,400 | | | Dallas Cnty. Hospital Dist., GO, 5.621%, 8/15/44, Ser. C | | NR/AAA | | | 4,648,600 | |
| | 4,100 | | | North Texas Tollway Auth. Rev., 6.718%, 1/1/49, Ser. B | | A2/A− | | | 4,268,059 | |
| | | | | | | | | | | |
| | | | | | | | | | 50,914,727 | |
| | | | | | | | | | | |
| | | | | Washington–0.0% | | | | | | |
| | 600 | | | State, GO, zero coupon, 12/1/20, Ser. F (NPFGC) | | Aa1/AA+ | | | 422,532 | |
| | | | | | | | | | | |
| | | | | Wisconsin–0.1% | | | | | | |
| | 2,300 | | | State Rev., 6.00%, 5/1/36, Ser. A | | Aa3/AA− | | | 2,589,708 | |
| | | | | | | | | | | |
| | | | | Total Municipal Bonds (cost–$211,220,262) | | | | | 216,183,589 | |
| | | | | | | | | | | |
| | | | | | | | | | | |
| | | | | | | | | | | |
MORTGAGE-BACKED SECURITIES–5.4% |
| € | 5,400 | | | Arena BV, 0.988%, 2/17/63, CMO, FRN | | Aaa/NR | | | 7,474,790 | |
| $ | 4,400 | | | Banc of America Commercial Mortgage, Inc.,
5.889%, 7/10/44, CMO, VRN | | NR/A+ | | | 4,827,856 | |
| | 262 | | | Banc of America Funding Corp., 5.924%, 1/20/47, CMO, VRN | | NR/CCC | | | 194,719 | |
| | 1,616 | | | Banc of America Large Loan, Inc., 0.766%, 8/15/29, CMO, FRN (b) | | Aaa/AAA | | | 1,451,542 | |
| | | | | Bear Stearns Adjustable Rate Mortgage Trust, CMO, | | | | | | |
| | 1,903 | | | 2.40%, 8/25/35, FRN | | Baa2/AAA | | | 1,804,643 | |
| | 2,195 | | | 2.76%, 3/25/35, FRN | | Ba2/AAA | | | 2,096,009 | |
| | 9,440 | | | 2.876%, 10/25/35, FRN | | NR/BBB+ | | | 9,470,735 | |
| | 492 | | | 2.934%, 3/25/35, FRN | | A1/AAA | | | 472,334 | |
| | 170 | | | 2.979%, 10/25/33, VRN | | Aaa/AAA | | | 175,713 | |
| | 107 | | | 4.578%, 5/25/34, FRN | | Aaa/AAA | | | 107,279 | |
| | | | | Bear Stearns Alt-A Trust, CMO, VRN, | | | | | | |
| | 1,596 | | | 5.144%, 2/25/36 | | Ca/CCC | | | 821,867 | |
| | 5,005 | | | 5.153%, 11/25/36 | | Caa3/CCC | | | 3,114,192 | |
| | 6,316 | | | 5.354%, 11/25/36 | | Caa3/CCC | | | 3,956,324 | |
| | | | | Bear Stearns Commercial Mortgage Securities, CMO, | | | | | | |
| | 739 | | | 0.366%, 3/15/19, FRN (a)(d) | | Aaa/AA | | | 711,058 | |
| | 1,600 | | | 5.54%, 9/11/41 | | NR/AAA | | | 1,752,112 | |
| | 7,500 | | | 5.694%, 6/11/50, VRN | | NR/A+ | | | 8,090,839 | |
30 Allianz Global Investors Managed Accounts Trust Annual Report ï 10.31.10
Fixed Income SHares: Series C Schedule of Investments
October 31, 2010 (continued)
| | | | | | | | | | | |
Principal
| | | | | | | | |
Amount
| | | | | Credit Rating
| | | |
| (000s) | | | | | (Moody’s/S&P)* | | Value | |
| | | | | Citigroup Mortgage Loan Trust, Inc., CMO, FRN, | | | | | | |
| $ | 671 | | | 2.51%, 8/25/35 | | B1/AA | | $ | 632,208 | |
| | 727 | | | 2.56%, 8/25/35 | | B3/AA | | | 653,714 | |
| | | | | Citigroup/Deutsche Bank Commercial Mortgage Trust, CMO, | | | | | | |
| | 4,400 | | | 5.322%, 12/11/49 | | Aaa/A− | | | 4,600,774 | |
| | 8,000 | | | 5.348%, 1/15/46, VRN | | Aaa/AAA | | | 8,665,974 | |
| € | 359 | | | Cordusio RMBS SRL, 1.02%, 6/30/35, CMO, FRN | | Aaa/AAA | | | 484,561 | |
| | | | | Countrywide Alternative Loan Trust, CMO, | | | | | | |
| $ | 2,571 | | | 0.446%, 11/25/46, FRN | | B3/B− | | | 1,460,373 | |
| | 717 | | | 0.456%, 5/25/36, FRN | | B1/B− | | | 385,037 | |
| | 12,448 | | | 6.25%, 8/25/37 | | Caa3/CC | | | 8,969,641 | |
| | | | | Countrywide Home Loan Mortgage Pass Through Trust, CMO, | | | | | | |
| | 346 | | | 0.576%, 3/25/35, FRN | | B1/A | | | 205,578 | |
| | 80 | | | 2.985%, 8/25/34, VRN | | Ba1/B+ | | | 58,884 | |
| | 24 | | | Credit Suisse First Boston Mortgage Securities Corp., 2.493%, 7/25/33, CMO, VRN | | Aaa/AAA | | | 23,102 | |
| | | | | Credit Suisse Mortgage Capital Certificates, CMO, | | | | | | |
| | 2,600 | | | 5.311%, 12/15/39 | | Aaa/A+ | | | 2,743,496 | |
| | 7,300 | | | 5.721%, 6/15/39, VRN | | Aaa/BBB+ | | | 7,594,625 | |
| | | | | Downey Savings & Loan Assoc. Mortgage Loan Trust, CMO, FRN, | | | | | | |
| | 2,546 | | | 0.516%, 8/19/45 | | Baa3/BBB− | | | 1,694,685 | |
| | 1,627 | | | 2.470%, 7/19/44 | | Aa3/AAA | | | 1,273,899 | |
| | 159 | | | First Horizon Asset Securities, Inc., 2.744%, 12/25/33, CMO, FRN | | Aaa/NR | | | 156,801 | |
| | 4,058 | | | Greenpoint Mortgage Funding Trust, 0.486%, 6/25/45, CMO, FRN | | Baa2/BB− | | | 2,529,343 | |
| | 18 | | | Greenpoint Mortgage Pass Through Certificates, | | | | | | |
| | | | | 3.122%, 10/25/33, CMO, FRN | | NR/B | | | 15,459 | |
| | | | | GSR Mortgage Loan Trust, CMO, FRN, | | | | | | |
| | 132 | | | 2.14%, 3/25/33 | | Aaa/NR | | | 129,916 | |
| | 1,113 | | | 2.895%, 9/25/35 | | NR/AAA | | | 1,073,022 | |
| | 643 | | | 2.897%, 9/25/35 | | NR/AAA | | | 634,325 | |
| | 1,968 | | | 2.897%, 9/25/35 | | NR/AA | | | 1,960,650 | |
| | | | | Harborview Mortgage Loan Trust, CMO, | | | | | | |
| | 677 | | | 0.596%, 6/20/35, FRN | | Aaa/AAA | | | 566,146 | |
| | 274 | | | 3.079%, 5/19/33, VRN | | NR/AAA | | | 279,043 | |
| | 403 | | | Homebanc Mortgage Trust, 5.802%, 4/25/37, CMO, VRN | | Caa1/BBB− | | | 351,247 | |
| € | 205 | | | IntesaBci Sec 2 SRL, 1.169%, 8/28/23, CMO, FRN | | Aaa/AAA | | | 283,973 | |
10.31.10 ï Allianz Global Investors Managed Accounts Trust Annual Report 31
Fixed Income SHares: Series C Schedule of Investments
October 31, 2010 (continued)
| | | | | | | | | | | |
Principal
| | | | | | | | |
Amount
| | | | | Credit Rating
| | | |
| (000s) | | | | | (Moody’s/S&P)* | | Value | |
| | | | | JPMorgan Chase Commercial Mortgage Securities Corp., CMO, | | | | | | |
| $ | 1,000 | | | 5.336%, 5/15/47 | | Aa3/A | | $ | 1,054,648 | |
| | 6,600 | | | 5.42%, 1/15/49 | | Aaa/NR | | | 6,926,770 | |
| | 2,200 | | | 5.44%, 6/12/47 | | Aaa/A+ | | | 2,326,192 | |
| | | | | JPMorgan Mortgage Trust, CMO, | | | | | | |
| | 2,107 | | | 3.238%, 7/25/35, FRN | | Baa2/AAA | | | 2,075,783 | |
| | 170 | | | 3.290%, 11/25/33, FRN | | NR/AAA | | | 171,954 | |
| | 339 | | | 5.017%, 2/25/35, FRN | | A2/AAA | | | 346,361 | |
| | 6,123 | | | 5.430%, 2/25/36, VRN | | NR/BB− | | | 5,702,107 | |
| | | | | Merrill Lynch/Countrywide Commercial Mortgage Trust, CMO, VRN, | | | | | | |
| | 1,200 | | | 5.172%, 12/12/49 | | Aaa/AA− | | | 1,270,374 | |
| | 1,600 | | | 5.965%, 8/12/49 | | NR/AAA | | | 1,747,754 | |
| | | | | Morgan Stanley Dean Witter Capital I, CMO, | | | | | | |
| | 600 | | | 4.74%, 11/13/36 | | NR/AAA | | | 635,192 | |
| | 92 | | | 6.66%, 2/15/33 | | NR/AAA | | | 92,535 | |
| | 1,074 | | | Ocwen Residential MBS Corp., 7.00%, 10/25/40, CMO, VRN (a)(d)(g) | | C/NR | | | 123,362 | |
| | | | | RBSSP Resecuritization Trust, CMO, FRN (a)(d), | | | | | | |
| | 2,212 | | | 0.536%, 5/26/37 | | NR/NR | | | 2,128,817 | |
| | 20,024 | | | 0.576%, 3/26/37 | | NR/NR | | | 18,435,102 | |
| | 9,931 | | | 0.756%, 9/26/34 | | NR/NR | | | 9,372,263 | |
| | 13,748 | | | 0.756%, 3/26/36 | | NR/NR | | | 13,141,169 | |
| | 8,672 | | | 0.756%, 4/26/37 | | NR/NR | | | 8,247,277 | |
| | 1,780 | | | Residential Accredit Loans, Inc., 0.466%, 4/25/46, CMO, FRN | | Baa2/CCC | | | 730,458 | |
| | 167 | | | Structured Adjustable Rate Mortgage Loan Trust, 2.879%, 2/25/34, CMO, VRN | | Aa2/AAA | | | 161,390 | |
| | 4,677 | | | Structured Asset Mortgage Investments, Inc.,
0.476%, 5/25/36, CMO, FRN | | B3/CCC | | | 2,632,064 | |
| | 1,553 | | | Thornburg Mortgage Securities Trust,
0.366%, 11/25/46, CMO, FRN | | B2/AAA | | | 1,513,434 | |
| | | | | Wachovia Bank Commercial Mortgage Trust, CMO, | | | | | | |
| | 448 | | | 0.336%, 6/15/20, FRN (a)(d) | | Aaa/A+ | | | 395,322 | |
| | 700 | | | 5.416%, 1/15/45, VRN | | Aaa/AA− | | | 760,673 | |
| | 1,300 | | | 5.678%, 5/15/46 | | Aaa/A | | | 1,372,502 | |
| | | | | WaMu Mortgage Pass Through Certificates, CMO, FRN, | | | | | | |
| | 265 | | | 0.566%, 1/25/45 | | Aa2/AAA | | | 220,510 | |
| | 2,915 | | | 0.62%, 11/25/34 | | Aa2/AAA | | | 2,179,596 | |
| | 1,505 | | | 1.353%, 2/25/46 | | A2/AA | | | 1,116,655 | |
32 Allianz Global Investors Managed Accounts Trust Annual Report ï 10.31.10
Fixed Income SHares: Series C Schedule of Investments
October 31, 2010 (continued)
| | | | | | | | | | | |
Principal
| | | | | | | | |
Amount
| | | | | Credit Rating
| | | |
| (000s) | | | | | (Moody’s/S&P)* | | Value | |
| $ | 853 | | | Wells Fargo Mortgage-Backed Securities Trust,
2.910%, 3/25/36, CMO, VRN | | Caa2/NR | | $ | 635,677 | |
| | | | | | | | | | | |
| | | | | Total Mortgage-Backed Securities (cost–$164,537,124) | | | | | 179,464,429 | |
| | | | | | | | | | | |
| | | | | | | | | | | |
| | | | | | | | | | | |
U.S. GOVERNMENT AGENCY SECURITIES–3.4% |
| | | | | Fannie Mae–0.5% | | | | | | |
| | 1,846 | | | 2.228%, 5/1/35, FRN, MBS | | Aaa/AAA | | | 1,915,132 | |
| | 4,196 | | | 2.872%, 11/1/35, FRN, MBS | | Aaa/AAA | | | 4,403,657 | |
| | 4 | | | 2.963%, 8/25/18, CMO, FRN | | Aaa/AAA | | | 3,902 | |
| | 7 | | | 3.751%, 2/1/18, FRN, MBS | | Aaa/AAA | | | 7,521 | |
| | 269 | | | 4.50%, 4/25/16, CMO | | Aaa/AAA | | | 269,751 | |
| | 2,348 | | | 4.50%, 1/25/17, CMO | | Aaa/AAA | | | 2,390,088 | |
| | 4 | | | 4.812%, 4/1/17, FRN, MBS | | Aaa/AAA | | | 4,534 | |
| | 341 | | | 5.00%, 1/25/17, CMO | | Aaa/AAA | | | 344,199 | |
| | 64 | | | 5.00%, 4/1/22, MBS | | Aaa/AAA | | | 68,444 | |
| | 4,443 | | | 5.29%, 11/25/33, CMO | | Aaa/AAA | | | 4,815,617 | |
| | 1,789 | | | 6.00%, 11/1/27, MBS | | Aaa/AAA | | | 1,951,634 | |
| | | | | | | | | | | |
| | | | | | | | | | 16,174,479 | |
| | | | | | | | | | | |
| | | | | Freddie Mac–1.0% | | | | | | |
| | 9 | | | 3.00%, 12/1/18, FRN, MBS | | Aaa/AAA | | | 9,422 | |
| | 5 | | | 3.575%, 6/1/30, FRN, MBS | | Aaa/AAA | | | 4,653 | |
| | 34 | | | 4.50%, 10/15/19, CMO | | Aaa/AAA | | | 34,650 | |
| | 1,329 | | | 4.50%, 2/15/20, CMO | | Aaa/AAA | | | 1,342,283 | |
| | 504 | | | 5.00%, 1/15/18, CMO | | Aaa/AAA | | | 513,248 | |
| | 19,960 | | | 5.00%, 7/15/33, CMO | | Aaa/AAA | | | 21,567,043 | |
| | 7,164 | | | 6.00%, 5/15/36, CMO | | Aaa/AAA | | | 8,239,740 | |
| | 95 | | | 6.50%, 1/1/38, MBS | | Aaa/AAA | | | 105,060 | |
| | 487 | | | 6.50%, 10/1/38, MBS | | Aaa/AAA | | | 536,939 | |
| | | | | | | | | | | |
| | | | | | | | | | 32,353,038 | |
| | | | | | | | | | | |
| | | | | Ginnie Mae–0.1% | | | | | | |
| | 16 | | | 3.375%, 1/20/22, FRN, MBS | | Aaa/AAA | | | 16,384 | |
| | 95 | | | 6.00%, 6/15/36, MBS | | Aaa/AAA | | | 104,398 | |
| | 76 | | | 6.00%, 9/15/36, MBS | | Aaa/AAA | | | 84,152 | |
| | 11 | | | 6.00%, 10/15/36, MBS | | Aaa/AAA | | | 11,918 | |
| | 4,470 | | | 6.00%, 11/15/36, MBS | | Aaa/AAA | | | 4,924,623 | |
| | | | | | | | | | | |
| | | | | | | | | | 5,141,475 | |
| | | | | | | | | | | |
| | | | | Small Business Administration Participation Certificates–1.8% | | | | | | |
| | 399 | | | 4.504%, 2/1/14 | | Aaa/AAA | | | 421,656 | |
| | 4,657 | | | 4.77%, 4/1/24, ABS | | Aaa/AAA | | | 5,049,014 | |
| | 27,257 | | | 5.32%, 1/1/27, ABS | | Aaa/AAA | | | 30,405,877 | |
10.31.10 ï Allianz Global Investors Managed Accounts Trust Annual Report 33
Fixed Income SHares: Series C Schedule of Investments
October 31, 2010 (continued)
| | | | | | | | | | | |
Principal
| | | | | | | | |
Amount
| | | | | Credit Rating
| | | |
| (000s) | | | | | (Moody��s/S&P)* | | Value | |
| | | | | Small Business Administration Participation Certificates (continued) | | | | | | |
| | | | | | | | | | | |
| $ | 20,338 | | | 5.70%, 8/1/26, ABS | | Aaa/AAA | | $ | 23,016,472 | |
| | | | | | | | | | | |
| | | | | | | | | | 58,893,019 | |
| | | | | | | | | | | |
| | | | | Total U.S. Government Agency Securities (cost–$101,750,183) | | | | | 112,562,011 | |
| | | | | | | | | | | |
| | | | | | | | | | | |
| | | | | | | | | | | |
SENIOR LOANS (a)(c)–0.3% |
| | | | | Automotive–0.2% | | | | | | |
| | | | | Ford Motor Corp., Term B1, | | | | | | |
| | 2,007 | | | 3.01%, 12/15/13 | | | | | 1,990,501 | |
| | 1,894 | | | 3.04%, 12/15/13 | | | | | 1,877,596 | |
| | 4,049 | | | 3.05%, 12/15/13 | | | | | 4,014,550 | |
| | | | | | | | | | | |
| | | | | | | | | | 7,882,647 | |
| | | | | | | | | | | |
| | | | | Healthcare & Hospitals–0.0% | | | | | | |
| | | | | HCA, Inc. | | | | | | |
| | 369 | | | 2.539%, 11/17/13, Term B1 | | | | | 362,038 | |
| | 886 | | | 3.539%, 3/31/17, Term B2 | | | | | 870,892 | |
| | | | | | | | | | | |
| | | | | | | | | | 1,232,930 | |
| | | | | | | | | | | |
| | | | | Paper/Paper Products–0.1% | | | | | | |
| | | | | Georgia-Pacific Corp., Term B2, | | | | | | |
| | 1,937 | | | 2.286%, 12/23/12 | | | | | 1,936,976 | |
| | 238 | | | 2.289%, 12/20/12 | | | | | 238,446 | |
| | | | | | | | | | | |
| | | | | | | | | | 2,175,422 | |
| | | | | | | | | | | |
| | | | | Total Senior Loans (cost–$11,380,179) | | | | | 11,290,999 | |
| | | | | | | | | | | |
| | | | | | | | | | | |
| | | | | | | | | | | |
ASSET-BACKED SECURITIES–0.3% |
| | 308 | | | ACE Securities Corp., 0.306%, 12/25/36, FRN | | B3/B | | | 294,536 | |
| | 78 | | | Asset-Backed Funding Certificates, 0.316%, 1/25/37, FRN | | Ba1/A− | | | 76,972 | |
| | 682 | | | Bear Stearns Asset-Backed Securities Trust,
1.256%, 10/25/37, FRN | | Caa2/BBB | | | 549,981 | |
| | 456 | | | BNC Mortgage Loan Trust, 0.356%, 5/25/37, FRN | | Ba2/B+ | | | 422,920 | |
| | | | | Conseco Financial Corp., | | | | | | |
| | 347 | | | 6.22%, 3/1/30 | | NR/BBB− | | | 365,733 | |
| | 4,827 | | | 6.53%, 2/1/31, VRN | | NR/CCC− | | | 4,708,674 | |
| | 75 | | | Indymac Residential Asset-Backed Trust,
0.336%, 7/25/37, FRN | | A2/BBB− | | | 74,768 | |
| | 374 | | | JPMorgan Mortgage Acquisition Corp.,
0.336%, 3/25/37, FRN | | Caa1/BB− | | | 353,551 | |
| | 4 | | | Keystone Owner Trust, 9.00%, 1/25/29 (a)(d) | | Caa1/NR | | | 3,891 | |
34 Allianz Global Investors Managed Accounts Trust Annual Report ï 10.31.10
Fixed Income SHares: Series C Schedule of Investments
October 31, 2010 (continued)
| | | | | | | | | | | |
Principal
| | | | | | | | |
Amount
| | | | | Credit Rating
| | | |
| (000s) | | | | | (Moody’s/S&P)* | | Value | |
| $ | 1,035 | | | MASTR Asset-Backed Securities Trust,
0.336%, 5/25/37, FRN | | Ba1/AAA | | $ | 1,001,798 | |
| | 389 | | | Merrill Lynch Mortgage Investors, Inc.,
0.376%, 2/25/37, FRN | | Ca/CCC | | | 280,928 | |
| | 245 | | | Morgan Stanley Mortgage Loan Trust,
0.616%, 4/25/37, FRN | | Ca/CCC | | | 122,226 | |
| | 230 | | | Nationstar Home Equity Loan Trust, 0.316%, 6/25/37, FRN | | Aa2/AAA | | | 226,214 | |
| | 388 | | | Popular ABS Mortgage Pass Through Trust,
0.346%, 6/25/47, FRN | | Caa2/B− | | | 351,046 | |
| | 120 | | | Wells Fargo Home Equity Trust, 0.486%, 10/25/35, FRN | | Aaa/AAA | | | 120,097 | |
| | | | | | | | | | | |
| | | | | Total Asset-Backed Securities (cost–$8,164,279) | | | | | 8,953,335 | |
| | | | | | | | | | | |
| Shares | | | | | | | | |
PREFERRED STOCK–0.0% |
| | | | | Capital Markets–0.0% | | | | | | |
| | 56,000 | | | Goldman Sachs Group, Inc., 3.75%, Ser. A (o) (cost–$1,400,000) | | Baa2/BBB | | | 1,228,080 | |
| | | | | | | | | | | |
| | | | | | | | | | | |
| | | | | | | | | | | |
CONVERTIBLE PREFERRED STOCK–0.0% |
| | | | | Financial Services–0.0% | | | | | | |
| | 700 | | | Wells Fargo & Co., 7.50%, 3/15/13, Ser. L (i) | | Ba1/A− | | | 700,000 | |
| | | | | | | | | | | |
| | | | | Insurance–0.0% | | | | | | |
| | 9,050 | | | American International Group, Inc., 8.50%, 8/1/11 | | Ba2/NR | | | 66,518 | |
| | | | | | | | | | | |
| | | | | Total Convertible Preferred Stock (cost–$1,016,500) | | | | | 766,518 | |
| | | | | | | | | | | |
Principal
| | | | | | | | |
Amount
| | | | | | | | |
| (000s) | | | | | | | | |
SHORT-TERM INVESTMENTS–4.3% |
| | | | | Corporate Notes–1.4% | | | | | | |
| | | | | Banking–0.0% | | | | | | |
| € | 500 | | | VTB Capital S.A., 8.25%, 6/30/11 | | Baa1/BBB | | | 722,748 | |
| | | | | | | | | | | |
| | | | | Biotechnology–0.1% | | | | | | |
| $ | 4,200 | | | Amgen, Inc., 0.125%, 2/1/11 | | A3/A+ | | | 4,205,250 | |
| | | | | | | | | | | |
| | | | | Financial Services–1.1% | | | | | | |
| | 10,000 | | | Caelus Re Ltd., 6.549%, 6/7/11, FRN (a)(b)(d)(n) (acquisition cost–$9,963,680; purchased 6/20/08-2/9/09) | | NR/BB | | | 10,146,480 | |
| £ | 4,000 | | | FCE Bank PLC, 7.875%, 2/15/11 | | Ba2/BB− | | | 6,499,443 | |
| | | | | Ford Motor Credit Co. LLC, | | | | | | |
| $ | 2,700 | | | 7.25%, 10/25/11 | | Ba2/B+ | | | 2,834,916 | |
| | 1,700 | | | 9.875%, 8/10/11 | | Ba2/B+ | | | 1,802,313 | |
| | 1,399 | | | HSBC Finance Corp., 6.375%, 10/15/11 | | A3/A | | | 1,469,872 | |
| | 2,900 | | | International Lease Finance Corp., 4.95%, 2/1/11 | | B1/BB+ | | | 2,929,000 | |
10.31.10 ï Allianz Global Investors Managed Accounts Trust Annual Report 35
Fixed Income SHares: Series C Schedule of Investments
October 31, 2010 (continued)
| | | | | | | | | | | |
Principal
| | | | | | | | |
Amount
| | | | | Credit Rating
| | | |
| (000s) | | | | | (Moody’s/S&P)* | | Value | |
| | | | | Financial Services (continued) | | | | | | |
| | | | | | | | | | | |
| $ | 700 | | | Mystic Re Ltd., 10.299%, 6/7/11, FRN (a)(b)(d)(n) (acquisition cost–$700,000; purchased 5/23/07) | | NR/BB− | | $ | 736,890 | |
| | 2,372 | | | Petroleum Export Ltd., 5.265%, 6/15/11 (b) | | Ba1/BBB | | | 2,368,158 | |
| | | | | Petroleum Export II Ltd., | | | | | | |
| | 343 | | | 6.34%, 6/20/11 (b) | | NR/NR | | | 342,475 | |
| | 2,158 | | | 6.34%, 6/20/11 (a)(d) | | NR/NR | | | 2,152,496 | |
| | 5,000 | | | SLM Corp., 5.40%, 10/25/11 | | Ba1/BBB− | | | 5,136,950 | |
| | | | | | | | | | | |
| | | | | | | | | | 36,418,993 | |
| | | | | | | | | | | |
| | | | | Insurance–0.1% | | | | | | |
| € | 1,500 | | | American International Group, Inc., 4.00%, 9/20/11 | | A3/A− | | | 2,100,518 | |
| | | | | | | | | | | |
| | | | | Oil & Gas–0.0% | | | | | | |
| $ | 25 | | | Sonat, Inc., 7.625%, 7/15/11 | | Ba3/BB− | | | 26,043 | |
| | | | | | | | | | | |
| | | | | Telecommunications–0.1% | | | | | | |
| | 100 | | | British Telecommunications PLC, 9.375%, 12/15/10 | | Baa2/BBB− | | | 101,037 | |
| | 3,500 | | | Telefonica Emisiones s.A.u., 5.984%, 6/20/11 | | Baa1/A− | | | 3,614,646 | |
| | | | | | | | | | | |
| | | | | | | | | | 3,715,683 | |
| | | | | | | | | | | |
| | | | | Utilities–0.0% | | | | | | |
| | 200 | | | Idaho Power Co., 6.60%, 3/2/11 | | A2/A− | | | 203,975 | |
| | 500 | | | PSEG Power LLC, 7.75%, 4/15/11 | | Baa1/BBB | | | 515,906 | |
| | | | | | | | | | | |
| | | | | | | | | | 719,881 | |
| | | | | | | | | | | |
| | | | | Total Corporate Notes (cost–$46,196,303) | | | | | 47,909,116 | |
| | | | | | | | | | | |
| | | | | U.S. Treasury Bills (k)(q)–0.5% | | | | | | |
| | 16,503 | | | 0.117%-0.154%, 11/4/10-1/27/11 (cost–$16,500,101) | | | | | 16,500,502 | |
| | | | | | | | | | | |
| | | | | Sovereign Debt Obligations–0.0% | | | | | | |
| | | | | Philippines–0.0% | | | | | | |
| | 900 | | | Philippine Government International Bond,
8.375%, 2/15/11 (cost–$919,996) | | Ba3/BB− | | | 925,875 | |
| | | | | | | | | | | |
| | | | | Repurchase Agreements–2.4% | | | | | | |
| | 14,000 | | | Barclays Capital Inc., dated 10/29/10, 0.22%, due 11/1/10, proceeds $14,000,257; collateralized by U.S. Treasury Notes, 2.75%, due 2/15/19, valued at $14,293,560 including accrued interest | | | | | 14,000,000 | |
| | 62,200 | | | Barclays Capital Inc., dated 10/29/10, 0.23%, due 11/1/10, proceeds $62,201,192; collateralized by U.S. Treasury Notes, 0.625%, due 6/30/12, valued at $63,467,819 including accrued interest | | | | | 62,200,000 | |
36 Allianz Global Investors Managed Accounts Trust Annual Report ï 10.31.10
Fixed Income SHares: Series C Schedule of Investments
October 31, 2010 (continued)
| | | | | | | | | | | |
Principal
| | | | | | | | |
Amount
| | | | | | | | |
| (000s) | | | | | | | Value | |
| | | | | Repurchase Agreements (continued) | | | | | | |
| | | | | | | | | | | |
| $ | 4,092 | | | State Street Bank & Trust Co., dated 10/29/10, 0.01%, due 11/1/10, proceeds $4,092,003; collateralized by U.S. Treasury Notes, 2.125%, due 5/31/15, valued at $4,178,317 including accrued interest | | | | $ | 4,092,000 | |
| | | | | | | | | | | |
| | | | | | | | | | | |
| | | | | Total Repurchase Agreements (cost–$80,292,000) | | | | | 80,292,000 | |
| | | | | | | | | | | |
| | | | | Total Short-Term Investments (cost–$143,908,400) | | | | | 145,627,493 | |
| | | | | | | | | | | |
| | | | | Total Investments before options written (cost–$3,013,433,099)–99.5% | | | | | 3,327,691,161 | |
| | | | | | | | | | | |
| | | | | | | | | | | |
| | | | | | | | | | | |
Contracts/
| | | | | | | | |
Notional
| | | | | | | | |
| Amount | | | | | | | | |
OPTIONS WRITTEN (l)–(0.6)% |
| | | | | Call Options–(0.2)% | | | | | | |
| | | | | 5-Year Interest Rate Swap (OTC), | | | | | | |
| | | | | Pay 3-Month USD-LIBOR Floating Rate Index, | | | | | | |
| $ | 743,400,000 | | | strike rate 1.35%, expires 12/13/10 | | | | | (1,952,466 | ) |
| $ | 500,300,000 | | | strike rate 1.50%, expires 12/13/10 | | | | | (2,844,656 | ) |
| | | | | 10-Year Interest Rate Swap (OTC), | | | | | | |
| | | | | Pay 3-Month USD-LIBOR Floating Rate Index, | | | | | | |
| $ | 59,800,000 | | | strike rate 2.25%, expires 12/13/10 | | | | | (84,025 | ) |
| | | | | Dow Jones CDX IG-14 5-Year Index, | | | | | | |
| $ | 164,700,000 | | | strike price $0.90, expires 11/17/10 | | | | | (310,219 | ) |
| $ | 148,200,000 | | | strike price $0.90, expires 12/15/10 | | | | | (426,997 | ) |
| | | | | Financial Futures Euro–90 day (CME), | | | | | | |
| | 304 | | | strike price $99.50, expires 12/13/10 | | | | | (142,500 | ) |
| | | | | iTraxx Europe 13 5-Year Index (OTC), | | | | | | |
| € | 56,100,000 | | | strike price €0.90, expires 11/17/10 | | | | | (105,760 | ) |
| € | 275,800,000 | | | strike price €0.90, expires 12/15/10 | | | | | (916,978 | ) |
| | | | | iTraxx Europe 14 5-Year Index (OTC), | | | | | | |
| € | 800,000 | | | strike price €0.90, expires 3/16/11 | | | | | (3,749 | ) |
| € | 34,600,000 | | | strike price €1, expires 11/17/10 | | | | | (120,843 | ) |
| | | | | U.S. Treasury Notes 10 yr. Futures (CBOT), | | | | | | |
| | 423 | | | strike price $129, expires 11/26/10 | | | | | (71,444 | ) |
| | | | | | | | | | | |
| | | | | | | | | | (6,979,637 | ) |
| | | | | | | | | | | |
| | | | | Put Options–(0.4)% | | | | | | |
| $ | 1,291,700,000 | | | 2-Year Interest Rate Swap (OTC), | | | | | | |
| | | | | Pay 3-Month USD-LIBOR Floating Rate Index, | | | | | | |
| | | | | strike rate 2.25%, expires 9/24/12 | | | | | (5,582,469 | ) |
| | | | | 3-Year Interest Rate Swap (OTC), | | | | | | |
| | | | | Pay 3-Month USD-LIBOR Floating Rate Index, | | | | | | |
10.31.10 ï Allianz Global Investors Managed Accounts Trust Annual Report 37
Fixed Income SHares: Series C Schedule of Investments
October 31, 2010 (continued)
| | | | | | | | | | | |
Contracts/
| | | | | | | | |
Notional
| | | | | | | | |
| Amount | | | | | | | Value | |
| | | | | Put Options (continued) | | | | | | |
| | | | | | | | | | | |
| $ | 306,900,000 | | | strike rate 2.75%, expires 6/18/12 | | | | $ | (1,301,256 | ) |
| $ | 1,376,100,000 | | | strike rate 3.00%, expires 6/18/12 | | | | | (4,548,011 | ) |
| | | | | 5-Year Interest Rate Swap (OTC), | | | | | | |
| | | | | Pay 3-Month USD-LIBOR Floating Rate Index, | | | | | | |
| $ | 355,000,000 | | | strike rate 1.70%, expires 12/13/10 | | | | | (864,390 | ) |
| $ | 388,400,000 | | | strike rate 1.95%, expires 12/13/10 | | | | | (274,016 | ) |
| $ | 500,300,000 | | | strike rate 2.10%, expires 12/13/10 | | | | | (158,495 | ) |
| $ | 314,100,000 | | | strike rate 4.00%, expires 12/1/10 | | | | | (31 | ) |
| $ | 59,800,000 | | | 10-Year Interest Rate Swap (OTC), | | | | | | |
| | | | | Pay 3-Month USD-LIBOR Floating Rate Index, | | | | | | |
| | | | | strike rate 2.75%, expires 12/13/10 | | | | | (820,767 | ) |
| | | | | Dow Jones CDX IG-14 5-Year Index, | | | | | | |
| $ | 164,700,000 | | | strike price $1.50, expires 11/17/10 | | | | | (48 | ) |
| $ | 148,200,000 | | | strike price $1.50, expires 12/15/10 | | | | | (3,944 | ) |
| | 304 | | | Financial Futures Euro–90 day (CME),
strike price $99.50, expires 12/13/10 | | | | | (13,300 | ) |
| | | | | iTraxx Europe 13 5-Year Index (OTC), | | | | | | |
| € | 99,000,000 | | | strike price €1.50, expires 12/15/10 | | | | | (22,028 | ) |
| € | 56,100,000 | | | strike price €1.60, expires 11/17/10 | | | | | (17 | ) |
| € | 176,800,000 | | | strike price €1.60, expires 12/15/10 | | | | | (20,268 | ) |
| | | | | iTraxx Europe 14 5-Year Index (OTC), | | | | | | |
| € | 34,600,000 | | | strike price €1.40, expires 11/17/10 | | | | | (2,157 | ) |
| € | 18,800,000 | | | strike price €1.60, expires 3/16/11 | | | | | (51,898 | ) |
| | 423 | | | U.S. Treasury Notes 10 yr. Futures (CBOT),
strike price $125, expires 11/26/10 | | | | | (199,811 | ) |
| | | | | | | | | | | |
| | | | | | | | | | (13,862,906 | ) |
| | | | | | | | | | | |
| | | | | Total Options Written (premiums received–$42,510,383) | | | | | (20,842,543 | ) |
| | | | | | | | | | | |
| | | | | Total Investments net of options written (cost–$2,970,922,716) | | 98.9% | | | 3,306,848,618 | |
| | | | | Other assets less other liabilities | | 1.1 | | | 38,354,279 | |
| | | | | | | | | | | |
| | | | | Net Assets | | 100.0% | | $ | 3,345,202,897 | |
| | | | | | | | | | | |
38 Allianz Global Investors Managed Accounts Trust Annual Report ï 10.31.10
Fixed Income SHares: Series H Schedule of Investments
October 31, 2010
| | | | | | | | | | | |
Principal
| | | | | | | | |
Amount
| | | | | Credit Rating
| | | |
| (000s) | | | | | (Moody’s/S&P)* | | Value | |
MUNICIPAL BONDS–96.3% |
| | | | | Arizona–2.4% | | | | | | |
| $ | 100 | | | Apache Cnty. Industrial Dev. Auth. Rev.,
Tucson Electric Power Co. Project, 5.875%, 3/1/33, Ser. B | | Baa3/BBB− | | $ | 100,389 | |
| | 100 | | | Pima Cnty. Industrial Dev. Auth. Rev., Choice Education and Dev. Corp. Project, 6.375%, 6/1/36 | | NR/NR | | | 81,581 | |
| | | | | | | | | | | |
| | | | | | | | | | 181,970 | |
| | | | | | | | | | | |
| | | | | California–10.4% | | | | | | |
| | 100 | | | Assoc. of Bay Area Gov’t Finance Auth. for Nonprofit Corps. Rev., Sharp Healthcare, 6.25%, 8/1/39 | | A3/A− | | | 111,837 | |
| | 250 | | | City & Cnty. of San Francisco Airports Commission Rev.,
4.90%, 5/1/29, Ser. A | | A1/A | | | 257,330 | |
| | 100 | | | Health Facs. Financing Auth. Rev., Children’s Hospital of Los Angeles, 5.25%, 7/1/38, (AGM) | | Aa3/AA+ | | | 101,202 | |
| | 100 | | | Los Angeles Department of Water & Power Rev., 5.00%, 7/1/39, Ser. A-1 (AMBAC) | | Aa3/AA− | | | 104,011 | |
| | 200 | | | State Department of Water Res. Rev., 5.00%, 5/1/16, Ser. L | | Aa3/AA− | | | 232,430 | |
| | | | | | | | | | | |
| | | | | | | | | | 806,810 | |
| | | | | | | | | | | |
| | | | | Colorado–6.0% | | | | | | |
| | 200 | | | Aurora Rev., Children’s Hospital Assoc., 5.00%, 12/1/40 | | A1/A+ | | | 201,202 | |
| | 250 | | | Regional Transportation Dist. Rev., Denver Transportation Partners, 6.00%, 1/15/34 | | Baa3/NR | | | 265,845 | |
| | | | | | | | | | | |
| | | | | | | | | | 467,047 | |
| | | | | | | | | | | |
| | | | | Delaware–1.4% | | | | | | |
| | 100 | | | State Economic Dev. Auth. Rev., Delmarva Power & Light Co., 5.40%, 2/1/31 | | Baa2/BBB+ | | | 105,255 | |
| | | | | | | | | | | |
| | | | | Florida–1.1% | | | | | | |
| | 100 | | | Sarasota Cnty. Health Facs. Auth. Rev., 5.75%, 7/1/37 | | NR/NR | | | 86,488 | |
| | | | | | | | | | | |
| | | | | Georgia–1.3% | | | | | | |
| | 100 | | | DeKalb Cnty. Hospital Auth. Rev., DeKalb Medical Center, Inc. Project, 6.125%, 9/1/40 | | NR/NR | | | 103,612 | |
| | | | | | | | | | | |
| | | | | Hawaii–1.3% | | | | | | |
| | 100 | | | State Airport Rev., 5.00%, 7/1/34, Ser. A | | A2/A− | | | 103,007 | |
| | | | | | | | | | | |
| | | | | Illinois–11.7% | | | | | | |
| | 250 | | | Finance Auth. Rev. OSF Healthcare Systems, 6.00%, 5/15/39, Ser. A | | A3/A | | | 264,110 | |
| | 100 | | | Finance Auth. Rev., DeKalb Supportive Living, 6.10%, 12/1/41 (m) | | NR/NR | | | 78,879 | |
| | 500 | | | State Rev., 5.00%, 6/15/16 | | NR/AAA | | | 568,195 | |
| | | | | | | | | | | |
| | | | | | | | | | 911,184 | |
| | | | | | | | | | | |
| | | | | Indiana–4.3% | | | | | | |
| | 250 | | | Finance Auth. Rev., 5.00%, 7/1/40 | | A3/NR | | | 239,913 | |
| | 100 | | | Vigo Cnty. Hospital Auth. Rev., Union Hospital, Inc.,
5.70%, 9/1/37 (a)(d) | | NR/NR | | | 95,374 | |
| | | | | | | | | | | |
| | | | | | | | | | 335,287 | |
| | | | | | | | | | | |
10.31.10 ï Allianz Global Investors Managed Accounts Trust Annual Report 39
Fixed Income SHares: Series H Schedule of Investments
October 31, 2010 (continued)
| | | | | | | | | | | |
Principal
| | | | | | | | |
Amount
| | | | | Credit Rating
| | | |
| (000s) | | | | | (Moody’s/S&P)* | | Value | |
| | | | | Iowa–0.9% | | | | | | |
| $ | 100 | | | Finance Auth. Rev., Deerfield Retirement Community, Inc.,
5.50%, 11/15/37, Ser. A | | NR/NR | | $ | 68,780 | |
| | | | | | | | | | | |
| | | | | Kansas–1.6% | | | | | | |
| | 150 | | | Manhattan Rev., Meadowlark Hills Retirement, 5.00%, 5/15/36, Ser. A | | NR/NR | | | 123,103 | |
| | | | | | | | | | | |
| | | | | Maine–1.3% | | | | | | |
| | 100 | | | Portland Airport Rev., 5.00%, 1/1/40, (AGM) | | Aa3/AA+ | | | 102,656 | |
| | | | | | | | | | | |
| | | | | Maryland–5.7% | | | | | | |
| | 250 | | | Economic Dev. Corp. Rev., CNX Marine Terminal, Inc., 5.75%, 9/1/25 | | NR/BB | | | 258,510 | |
| | 100 | | | Health & Higher Educational Facs. Auth. Rev.,
King Farm Presbyterian Community, 5.30%, 1/1/37, Ser. A | | NR/NR | | | 77,296 | |
| | 100 | | | Washington Cnty. Hospital, 6.00%, 1/1/43 | | NR/BBB− | | | 103,576 | |
| | | | | | | | | | | |
| | | | | | | | | | 439,382 | |
| | | | | | | | | | | |
| | | | | Massachusetts–3.1% | | | | | | |
| | 250 | | | Health & Educational Facs. Auth. Rev., Lowell General Hospital, 5.125%, 7/1/35, Ser. C | | Baa1/BBB+ | | | 242,995 | |
| | | | | | | | | | | |
| | | | | Michigan–2.5% | | | | | | |
| | 100 | | | Detroit, GO, 5.25%, 11/1/35 | | Aa3/AA | | | 101,319 | |
| | 100 | | | Tobacco Settlement Finance Auth. Rev., 5.125%, 6/1/22, Ser. A | | NR/BBB | | | 93,162 | |
| | | | | | | | | | | |
| | | | | | | | | | 194,481 | |
| | | | | | | | | | | |
| | | | | Minnesota–2.7% | | | | | | |
| | 200 | | | Higher Education Facs. Auth. Rev., Gustavus Adolphus College, 4.00%, 10/1/19, Ser. B | | A3/NR | | | 210,254 | |
| | | | | | | | | | | |
| | | | | Missouri–0.7% | | | | | | |
| | 100 | | | Branson Regional Airport Transportation Dev. Dist. Rev.,
6.00%, 7/1/25, Ser. B (m) | | NR/NR | | | 55,000 | |
| | | | | | | | | | | |
| | | | | New Mexico–1.1% | | | | | | |
| | 100 | | | Otero Cnty. Rev., 6.00%, 4/1/28 | | NR/NR | | | 83,420 | |
| | | | | | | | | | | |
| | | | | New York–6.5% | | | | | | |
| | 250 | | | Liberty Dev. Corp. Rev., 5.125%, 1/15/44 | | NR/AA | | | 252,080 | |
| | 250 | | | State Dormitory Auth. Rev., St. Francis College, 5.00%, 10/1/40 | | NR/A− | | | 251,738 | |
| | | | | | | | | | | |
| | | | | | | | | | 503,818 | |
| | | | | | | | | | | |
| | | | | North Carolina–3.3% | | | | | | |
| | 100 | | | Medical Care Commission Rev., Galloway Ridge Project,
6.00%, 1/1/39, Ser. A | | NR/NR | | | 100,480 | |
| | 150 | | | Ports Auth. Rev., 5.25%, 2/1/40, Ser. A | | A3/NR | | | 157,725 | |
| | | | | | | | | | | |
| | | | | | | | | | 258,205 | |
| | | | | | | | | | | |
| | | | | Ohio–5.8% | | | | | | |
| | | | | Buckeye Tobacco Settlement Financing Auth. Rev., | | | | | | |
| | 100 | | | 5.875%, 6/1/30, Ser. A-2 | | Baa3/BBB | | | 83,991 | |
| | 475 | | | 5.875%, 6/1/47, Ser. A-2 | | Baa3/BBB | | | 362,606 | |
| | | | | | | | | | | |
| | | | | | | | | | 446,597 | |
| | | | | | | | | | | |
40 Allianz Global Investors Managed Accounts Trust Annual Report ï 10.31.10
Fixed Income SHares: Series H Schedule of Investments
October 31, 2010 (continued)
| | | | | | | | | | | |
Principal
| | | | | | | | |
Amount
| | | | | Credit Rating
| | | |
| (000s) | | | | | (Moody’s/S&P)* | | Value | |
| | | | | Oregon–2.0% | | | | | | |
| $ | 150 | | | State Facs. Auth. Rev., Concordia Univ., 6.375%, 9/1/40, Ser. A | | NR/BB+ | | $ | 154,564 | |
| | | | | | | | | | | |
| | | | | Pennsylvania–5.7% | | | | | | |
| | 100 | | | Allegheny Cnty. Hospital Dev. Auth. Rev., West Penn Allegheny Health System, 5.375%, 11/15/40, Ser. A | | B1/BB− | | | 77,181 | |
| | 100 | | | Dauphin Cnty. General Auth. Rev., Pinnacle Health System Project, 6.00%, 6/1/36, Ser. A | | A2/A | | | 106,257 | |
| | 250 | | | Delaware River Port Auth. Rev., 5.00%, 1/1/40, Ser. D | | A3/A− | | | 258,338 | |
| | | | | | | | | | | |
| | | | | | | | | | 441,776 | |
| | | | | | | | | | | |
| | | | | Puerto Rico–3.4% | | | | | | |
| | 250 | | | Sales Tax Financing Corp. Rev., 5.375%, 8/1/38, Ser. C | | A1/A+ | | | 263,652 | |
| | | | | | | | | | | |
| | | | | Tennessee–3.3% | | | | | | |
| | 100 | | | Rutherford Cnty. Health & Educational Facs. Board Rev., Ascension Health Group, 5.00%, 11/15/40 | | Aa1/AA | | | 104,811 | |
| | 150 | | | Tennessee Energy Acquisition Corp. Rev., 5.00%, 2/1/25, Ser. C | | Baa1/A | | | 153,526 | |
| | | | | | | | | | | |
| | | | | | | | | | 258,337 | |
| | | | | | | | | | | |
| | | | | Texas–2.9% | | | | | | |
| | 100 | | | North Texas Tollway Auth. Rev., 5.75%, 1/1/33, Ser. F | | A3/BBB+ | | | 105,817 | |
| | 100 | | | Texas A&M Univ. Rev., 5.00%, 5/15/16, Ser. B | | Aaa/AA+ | | | 118,168 | |
| | | | | | | | | | | |
| | | | | | | | | | 223,985 | |
| | | | | | | | | | | |
| | | | | Utah–2.3% | | | | | | |
| | 100 | | | Spanish Fork City Rev., American Leadership Academy,
5.55%, 11/15/21 (a)(d) | | NR/NR | | | 94,401 | |
| | 100 | | | Utah Cnty., Lincoln Academy Charter School, GO, 5.875%, 6/15/37, Ser. A (a)(d) | | NR/NR | | | 85,960 | |
| | | | | | | | | | | |
| | | | | | | | | | 180,361 | |
| | | | | | | | | | | |
| | | | | Virginia–0.5% | | | | | | |
| | 100 | | | Lewistown Commerce Center Community Dev. Auth. Rev.,
6.05%, 3/1/27 | | NR/NR | | | 35,072 | |
| | | | | | | | | | | |
| | | | | Wisconsin–1.1% | | | | | | |
| | 100 | | | Milwaukee Redev. Auth. Rev., Academy of Learning, 5.65%, 8/1/37, Ser. A | | NR/NR | | | 81,706 | |
| | | | | | | | | | | |
| | | | | Total Municipal Bonds (cost–$7,556,179) | | | | | 7,468,804 | |
| | | | | | | | | | | |
| Shares | | | | | | | | |
MONEY MARKET FUND–2.5% |
| | 195,000 | | | SSgA Tax Free Money Market Fund (cost–$195,000) | | | | | 195,000 | |
| | | | | | | | | | | |
| | | | | Total Investments (cost–$7,751,179) | | 98.8% | | | 7,663,804 | |
| | | | | | | | | | | |
| | | | | Other assets less liabilities | | 1.2 | | | 91,429 | |
| | | | | | | | | | | |
| | | | | Net Assets | | 100.0% | | $ | 7,755,233 | |
| | | | | | | | | | | |
10.31.10 ï Allianz Global Investors Managed Accounts Trust Annual Report 41
Fixed Income SHares: Series M Schedule of Investments
October 31, 2010
| | | | | | | | | | | |
Principal
| | | | | | | | |
Amount
| | | | | Credit Rating
| | | |
| (000s) | | | | | (Moody’s/S&P)* | | Value | |
U.S. GOVERNMENT AGENCY SECURITIES–62.9% |
| | | | | Fannie Mae–55.3% | | | | | | |
| $ | 6,100 | | | 0.456%, 10/27/37, CMO, FRN | | Aaa/AAA | | $ | 6,090,872 | |
| | 61 | | | 0.731%, 8/25/21, CMO, FRN | | Aaa/AAA | | | 61,782 | |
| | 646 | | | 2.014%, 1/1/22, FRN, MBS | | Aaa/AAA | | | 650,535 | |
| | 1,232 | | | 2.03%, 1/1/20, FRN, MBS | | Aaa/AAA | | | 1,274,272 | |
| | 238 | | | 2.047%, 5/1/34, FRN, MBS | | Aaa/AAA | | | 246,606 | |
| | 2,325 | | | 2.08%, 1/1/34, FRN, MBS | | Aaa/AAA | | | 2,402,119 | |
| | 526 | | | 2.273%, 5/1/28, FRN, MBS | | Aaa/AAA | | | 543,569 | |
| | 96 | | | 2.345%, 9/1/27, FRN, MBS | | Aaa/AAA | | | 99,731 | |
| | 417 | | | 2.417%, 9/1/32, FRN, MBS | | Aaa/AAA | | | 431,636 | |
| | 35 | | | 2.48%, 10/1/32, FRN, MBS | | Aaa/AAA | | | 36,207 | |
| | 283 | | | 2.501%, 5/1/33, FRN, MBS | | Aaa/AAA | | | 295,924 | |
| | 151 | | | 2.523%, 1/1/33, FRN, MBS | | Aaa/AAA | | | 157,870 | |
| | 355 | | | 2.547%, 9/1/35, FRN, MBS | | Aaa/AAA | | | 368,997 | |
| | 400 | | | 2.58%, 2/1/33, FRN, MBS | | Aaa/AAA | | | 415,684 | |
| | 17 | | | 2.725%, 11/1/32, FRN, MBS | | Aaa/AAA | | | 16,970 | |
| | 607 | | | 2.735%, 4/1/35, FRN, MBS | | Aaa/AAA | | | 636,669 | |
| | 486 | | | 2.773%, 1/1/33, FRN, MBS | | Aaa/AAA | | | 502,500 | |
| | 21 | | | 2.783%, 9/1/32, FRN, MBS | | Aaa/AAA | | | 20,933 | |
| | 240 | | | 2.79%, 12/1/32, FRN, MBS | | Aaa/AAA | | | 250,344 | |
| | 197 | | | 2.87%, 12/1/34, FRN, MBS | | Aaa/AAA | | | 205,835 | |
| | 2,420 | | | 2.982%, 11/1/35, FRN, MBS | | Aaa/AAA | | | 2,529,138 | |
| | 34 | | | 3.003%, 5/1/17, FRN, MBS | | Aaa/AAA | | | 34,451 | |
| | 44 | | | 3.028%, 6/1/20, FRN, MBS | | Aaa/AAA | | | 45,165 | |
| | 64 | | | 3.041%, 5/1/18, FRN, MBS | | Aaa/AAA | | | 66,115 | |
| | 48 | | | 3.045%, 1/1/18, FRN, MBS | | Aaa/AAA | | | 48,927 | |
| | 199 | | | 3.098%, 10/1/34, FRN, MBS | | Aaa/AAA | | | 208,758 | |
| | 2,859 | | | 4.00%, 11/25/19, CMO | | Aaa/AAA | | | 3,014,879 | |
| | 962 | | | 4.00%, 9/1/39, MBS | | Aaa/AAA | | | 993,076 | |
| | 1,946 | | | 4.00%, 11/1/39, MBS | | Aaa/AAA | | | 2,008,761 | |
| | 1,092,000 | | | 4.00%, MBS, TBA (e) | | Aaa/AAA | | | 1,126,125,000 | |
| | 9,200 | | | 4.10%, 12/17/18 | | Aaa/AAA | | | 9,241,455 | |
| | 30 | | | 4.271%, 3/25/41, CMO, FRN | | Aaa/AAA | | | 30,999 | |
| | 27 | | | 4.462%, 5/25/42, CMO, FRN | | Aaa/AAA | | | 27,632 | |
| | 8,500 | | | 4.50%, 11/25/26, CMO | | Aaa/AAA | | | 9,279,629 | |
| | 3,023 | | | 4.50%, 10/25/34, CMO | | Aaa/AAA | | | 3,231,011 | |
| | 20 | | | 4.50%, 2/1/38, MBS | | Aaa/AAA | | | 21,630 | |
| | 749 | | | 4.50%, 3/1/38, MBS | | Aaa/AAA | | | 786,794 | |
| | 930 | | | 4.50%, 11/1/39, MBS | | Aaa/AAA | | | 978,055 | |
| | 597,000 | | | 4.50%, MBS, TBA (e) | | Aaa/AAA | | | 626,850,000 | |
| | 11,600 | | | 4.875%, 12/15/16 | | Aaa/AAA | | | 13,650,091 | |
42 Allianz Global Investors Managed Accounts Trust Annual Report ï 10.31.10
Fixed Income SHares: Series M Schedule of Investments
October 31, 2010 (continued)
| | | | | | | | | | | |
Principal
| | | | | | | | |
Amount
| | | | | Credit Rating
| | | |
| (000s) | | | | | (Moody’s/S&P)* | | Value | |
| | | | | Fannie Mae (continued) | | | | | | |
| | | | | | | | | | | |
| $ | 1,222 | | | 5.00%, 9/25/14, CMO | | Aaa/AAA | | $ | 1,329,998 | |
| | 153 | | | 5.00%, 9/1/17, MBS | | Aaa/AAA | | | 161,471 | |
| | 146 | | | 5.00%, 6/1/18, MBS | | Aaa/AAA | | | 155,357 | |
| | 13 | | | 5.00%, 9/1/18, MBS | | Aaa/AAA | | | 14,236 | |
| | 1,264 | | | 5.00%, 7/25/20, CMO | | Aaa/AAA | | | 1,288,571 | |
| | 559 | | | 5.00%, 4/1/23, MBS | | Aaa/AAA | | | 596,760 | |
| | -- (h | ) | | 5.00%, 11/1/33, MBS | | Aaa/AAA | | | 34 | |
| | 789 | | | 5.50%, 2/25/24, CMO | | Aaa/AAA | | | 883,485 | |
| | 11,000 | | | 5.50%, MBS, TBA (e) | | Aaa/AAA | | | 11,814,693 | |
| | 12 | | | 6.00%, 8/1/22, MBS | | Aaa/AAA | | | 12,897 | |
| | 16 | | | 6.00%, 9/1/22, MBS | | Aaa/AAA | | | 17,063 | |
| | 221 | | | 6.00%, 8/1/23, MBS | | Aaa/AAA | | | 239,911 | |
| | 385 | | | 6.00%, 12/1/23, MBS | | Aaa/AAA | | | 417,366 | |
| | 47 | | | 6.50%, 1/1/25, MBS | | Aaa/AAA | | | 52,079 | |
| | 163 | | | 6.50%, 7/18/27, CMO | | Aaa/AAA | | | 184,084 | |
| | 37 | | | 6.50%, 12/1/28, MBS | | Aaa/AAA | | | 40,674 | |
| | 226 | | | 7.00%, 11/1/38, MBS | | Aaa/AAA | | | 254,701 | |
| | 113 | | | 7.01%, 8/1/22, MBS | | Aaa/AAA | | | 128,010 | |
| | 53 | | | 7.01%, 11/1/22, MBS | | Aaa/AAA | | | 59,771 | |
| | 8 | | | 7.925%, 2/1/25, FRN, MBS | | Aaa/AAA | | | 8,033 | |
| | 14,652 | | | 8.10%, 8/12/19 | | Aaa/AAA | | | 20,700,009 | |
| | 165 | | | 11.00%, 7/15/20, MBS | | Aaa/AAA | | | 191,642 | |
| | | | | | | | | | | |
| | | | | | | | | | 1,852,431,466 | |
| | | | | | | | | | | |
| | | | | Freddie Mac–4.8% | | | | | | |
| | 5,002 | | | 0.656%, 8/15/32, CMO, FRN | | Aaa/AAA | | | 5,018,871 | |
| | 465 | | | 0.706%, 9/15/16, CMO, FRN | | Aaa/AAA | | | 465,792 | |
| | 97 | | | 0.706%, 8/15/29, CMO, FRN | | Aaa/AAA | | | 97,078 | |
| | 58 | | | 0.706%, 12/15/31, CMO, FRN | | Aaa/AAA | | | 58,484 | |
| | 16 | | | 0.756%, 9/15/30, CMO, FRN | | Aaa/AAA | | | 16,330 | |
| | 24 | | | 0.806%, 3/15/32, CMO, FRN | | Aaa/AAA | | | 24,186 | |
| | 63 | | | 0.963%, 3/15/20, CMO, FRN | | Aaa/AAA | | | 62,836 | |
| | 223 | | | 0.963%, 2/15/24, CMO, FRN | | Aaa/AAA | | | 224,158 | |
| | 11 | | | 1.013%, 10/15/19, CMO, FRN | | Aaa/AAA | | | 11,136 | |
| | 112 | | | 1.263%, 12/15/13, CMO, FRN | | Aaa/AAA | | | 112,036 | |
| | 96 | | | 1.463%, 9/15/22, CMO, FRN | | Aaa/AAA | | | 96,481 | |
| | 27 | | | 1.663%, 8/15/23, CMO, FRN | | Aaa/AAA | | | 26,867 | |
| | 5,887 | | | 2.233%, 6/1/35, FRN, MBS | | Aaa/AAA | | | 6,135,002 | |
| | 239 | | | 2.509%, 10/1/32, FRN, MBS | | Aaa/AAA | | | 247,065 | |
| | 41 | | | 2.541%, 8/1/29, FRN, MBS | | Aaa/AAA | | | 43,200 | |
| | 163 | | | 2.584%, 4/1/32, FRN, MBS | | Aaa/AAA | | | 170,480 | |
10.31.10 ï Allianz Global Investors Managed Accounts Trust Annual Report 43
Fixed Income SHares: Series M Schedule of Investments
October 31, 2010 (continued)
| | | | | | | | | | | |
Principal
| | | | | | | | |
Amount
| | | | | Credit Rating
| | | |
| (000s) | | | | | (Moody’s/S&P)* | | Value | |
| | | | | Freddie Mac (continued) | | | | | | |
| | | | | | | | | | | |
| $ | 11 | | | 2.598%, 1/1/33, FRN, MBS | | Aaa/AAA | | $ | 11,455 | |
| | 308 | | | 2.60%, 3/1/32, FRN, MBS | | Aaa/AAA | | | 319,641 | |
| | 660 | | | 2.604%, 5/1/34, FRN, MBS | | Aaa/AAA | | | 689,984 | |
| | 279 | | | 2.607%, 2/1/29, FRN, MBS | | Aaa/AAA | | | 291,903 | |
| | 180 | | | 2.611%, 2/1/33, FRN, MBS | | Aaa/AAA | | | 187,958 | |
| | 20 | | | 2.723%, 7/1/29, FRN, MBS | | Aaa/AAA | | | 20,896 | |
| | 103 | | | 2.75%, 10/1/32, FRN, MBS | | Aaa/AAA | | | 103,691 | |
| | 1,711 | | | 2.798%, 10/1/35, FRN, MBS | | Aaa/AAA | | | 1,797,163 | |
| | 107 | | | 2.892%, 1/1/32, FRN, MBS | | Aaa/AAA | | | 110,690 | |
| | 16 | | | 2.946%, 7/1/32, FRN, MBS | | Aaa/AAA | | | 16,726 | |
| | 23 | | | 3.10%, 8/1/32, FRN, MBS | | Aaa/AAA | | | 24,417 | |
| | 143 | | | 3.49%, 8/1/32, FRN, MBS | | Aaa/AAA | | | 143,380 | |
| | 7,300 | | | 3.75%, 3/27/19 | | Aaa/AAA | | | 7,998,778 | |
| | 45 | | | 4.50%, 5/15/18, CMO | | Aaa/AAA | | | 48,625 | |
| | 59,800 | | | 4.875%, 6/13/18 | | Aaa/AAA | | | 70,824,668 | |
| | 37,000 | | | 5.00%, 1/15/25, CMO | | Aaa/AAA | | | 40,795,848 | |
| | 12,000 | | | 5.00%, 2/15/25, CMO | | Aaa/AAA | | | 13,197,926 | |
| | 2,440 | | | 5.50%, 3/15/34, CMO | | Aaa/AAA | | | 2,735,318 | |
| | 2,800 | | | 5.50%, 4/15/35, CMO | | Aaa/AAA | | | 3,173,682 | |
| | 3,441 | | | 5.50%, 5/15/36, CMO | | Aaa/AAA | | | 3,851,211 | |
| | 62 | | | 6.00%, 8/15/16, CMO | | Aaa/AAA | | | 66,585 | |
| | 1,702 | | | 6.00%, 12/15/28, CMO | | Aaa/AAA | | | 1,847,030 | |
| | 103 | | | 6.50%, 8/15/16, CMO | | Aaa/AAA | | | 109,850 | |
| | 28 | | | 6.50%, 12/15/23, CMO | | Aaa/AAA | | | 31,834 | |
| | 621 | | | 6.50%, 7/15/31, CMO | | Aaa/AAA | | | 709,748 | |
| | 22 | | | 7.00%, 4/1/29, MBS | | Aaa/AAA | | | 25,284 | |
| | 1 | | | 7.00%, 12/1/29, MBS | | Aaa/AAA | | | 1,294 | |
| | — | (h) | | 7.00%, 1/1/30, MBS | | Aaa/AAA | | | 85 | |
| | 14 | | | 7.00%, 2/1/30, MBS | | Aaa/AAA | | | 16,038 | |
| | 20 | | | 7.00%, 3/1/30, MBS | | Aaa/AAA | | | 22,507 | |
| | 2 | | | 7.00%, 6/1/30, MBS | | Aaa/AAA | | | 2,468 | |
| | 152 | | | 7.50%, 8/15/30, CMO | | Aaa/AAA | | | 174,148 | |
| | | | | | | | | | | |
| | | | | | | | | | 162,160,833 | |
| | | | | | | | | | | |
| | | | | Ginnie Mae–1.3% | | | | | | |
| | 33 | | | 0.606%, 6/20/32, CMO, FRN | | Aaa/AAA | | | 32,944 | |
| | 1,036 | | | 0.813%, 10/20/27, CMO, FRN | | Aaa/AAA | | | 1,035,950 | |
| | 17 | | | 2.75%, 3/20/30, FRN, MBS | | Aaa/AAA | | | 17,687 | |
| | 101 | | | 3.125%, 11/20/23, FRN, MBS | | Aaa/AAA | | | 104,664 | |
| | 10 | | | 3.125%, 10/20/25, FRN, MBS | | Aaa/AAA | | | 10,661 | |
| | 7 | | | 3.125%, 11/20/25, FRN, MBS | | Aaa/AAA | | | 7,408 | |
44 Allianz Global Investors Managed Accounts Trust Annual Report ï 10.31.10
Fixed Income SHares: Series M Schedule of Investments
October 31, 2010 (continued)
| | | | | | | | | | | |
Principal
| | | | | | | | |
Amount
| | | | | Credit Rating
| | | |
| (000s) | | | | | (Moody’s/S&P)* | | Value | |
| | | | | Ginnie Mae (continued) | | | | | | |
| | | | | | | | | | | |
| $ | 7 | | | 3.125%, 10/20/26, FRN, MBS | | Aaa/AAA | | $ | 7,379 | |
| | 19 | | | 3.125%, 10/20/27, FRN, MBS | | Aaa/AAA | | | 19,637 | |
| | 357 | | | 3.25%, 1/20/28, FRN, MBS | | Aaa/AAA | | | 368,993 | |
| | 38 | | | 3.25%, 2/20/28, FRN, MBS | | Aaa/AAA | | | 38,793 | |
| | 103 | | | 3.25%, 1/20/30, FRN, MBS | | Aaa/AAA | | | 106,755 | |
| | 181 | | | 3.375%, 3/20/17, FRN, MBS | | Aaa/AAA | | | 186,965 | |
| | 9 | | | 3.375%, 1/20/18, FRN, MBS | | Aaa/AAA | | | 8,840 | |
| | 56 | | | 3.375%, 5/20/18, FRN, MBS | | Aaa/AAA | | | 57,830 | |
| | 40 | | | 3.375%, 4/20/19, FRN, MBS | | Aaa/AAA | | | 41,228 | |
| | 9 | | | 3.375%, 5/20/19, FRN, MBS | | Aaa/AAA | | | 9,800 | |
| | 11 | | | 3.375%, 6/20/21, FRN, MBS | | Aaa/AAA | | | 11,615 | |
| | 25 | | | 3.375%, 1/20/22, FRN, MBS | | Aaa/AAA | | | 26,140 | |
| | 602 | | | 3.375%, 2/20/22, FRN, MBS | | Aaa/AAA | | | 622,774 | |
| | 28 | | | 3.375%, 4/20/22, FRN, MBS | | Aaa/AAA | | | 28,419 | |
| | 15 | | | 3.375%, 5/20/22, FRN, MBS | | Aaa/AAA | | | 15,364 | |
| | 17 | | | 3.375%, 2/20/23, FRN, MBS | | Aaa/AAA | | | 17,509 | |
| | 23 | | | 3.375%, 3/20/23, FRN, MBS | | Aaa/AAA | | | 23,918 | |
| | 24 | | | 3.375%, 4/20/23, FRN, MBS | | Aaa/AAA | | | 24,398 | |
| | 137 | | | 3.375%, 4/20/24, FRN, MBS | | Aaa/AAA | | | 141,874 | |
| | 8 | | | 3.375%, 5/20/24, FRN, MBS | | Aaa/AAA | | | 8,281 | |
| | 2 | | | 3.375%, 4/20/25, FRN, MBS | | Aaa/AAA | | | 2,535 | |
| | 12 | | | 3.375%, 5/20/25, FRN, MBS | | Aaa/AAA | | | 11,924 | |
| | 19 | | | 3.375%, 6/20/25, FRN, MBS | | Aaa/AAA | | | 19,772 | |
| | 10 | | | 3.375%, 1/20/26, FRN, MBS | | Aaa/AAA | | | 10,396 | |
| | 12 | | | 3.375%, 6/20/26, FRN, MBS | | Aaa/AAA | | | 12,336 | |
| | 6 | | | 3.375%, 1/20/27, FRN, MBS | | Aaa/AAA | | | 5,872 | |
| | 59 | | | 3.375%, 2/20/27, FRN, MBS | | Aaa/AAA | | | 60,633 | |
| | 15 | | | 3.375%, 4/20/27, FRN, MBS | | Aaa/AAA | | | 15,488 | |
| | 37 | | | 3.375%, 6/20/27, FRN, MBS | | Aaa/AAA | | | 37,906 | |
| | 25 | | | 3.375%, 2/20/28, FRN, MBS | | Aaa/AAA | | | 26,239 | |
| | 68 | | | 3.375%, 3/20/28, FRN, MBS | | Aaa/AAA | | | 70,600 | |
| | 27 | | | 3.375%, 4/20/28, FRN, MBS | | Aaa/AAA | | | 28,240 | |
| | 16 | | | 3.375%, 4/20/29, FRN, MBS | | Aaa/AAA | | | 16,537 | |
| | 28 | | | 3.375%, 6/20/29, FRN, MBS | | Aaa/AAA | | | 28,414 | |
| | 23 | | | 3.375%, 5/20/30, FRN, MBS | | Aaa/AAA | | | 23,192 | |
| | 18 | | | 3.375%, 5/20/32, FRN, MBS | | Aaa/AAA | | | 18,876 | |
| | 27 | | | 3.375%, 6/20/32, FRN, MBS | | Aaa/AAA | | | 27,984 | |
| | 58 | | | 3.50%, 3/20/31, FRN, MBS | | Aaa/AAA | | | 60,512 | |
| | 34 | | | 3.50%, 3/20/32, FRN, MBS | | Aaa/AAA | | | 35,117 | |
| | 7 | | | 3.625%, 8/20/17, FRN, MBS | | Aaa/AAA | | | 7,130 | |
10.31.10 ï Allianz Global Investors Managed Accounts Trust Annual Report 45
Fixed Income SHares: Series M Schedule of Investments
October 31, 2010 (continued)
| | | | | | | | | | | |
Principal
| | | | | | | | |
Amount
| | | | | Credit Rating
| | | |
| (000s) | | | | | (Moody’s/S&P)* | | Value | |
| | | | | Ginnie Mae (continued) | | | | | | |
| | | | | | | | | | | |
| $ | 4 | | | 3.625%, 7/20/20, FRN, MBS | | Aaa/AAA | | $ | 3,842 | |
| | 4 | | | 3.625%, 7/20/21, FRN, MBS | | Aaa/AAA | | | 4,555 | |
| | 9 | | | 3.625%, 8/20/21, FRN, MBS | | Aaa/AAA | | | 9,460 | |
| | 16 | | | 3.625%, 9/20/21, FRN, MBS | | Aaa/AAA | | | 16,170 | |
| | 1,162 | | | 3.625%, 8/20/23, FRN, MBS | | Aaa/AAA | | | 1,202,163 | |
| | 72 | | | 3.625%, 8/20/25, FRN, MBS | | Aaa/AAA | | | 74,633 | |
| | 12 | | | 3.625%, 9/20/25, FRN, MBS | | Aaa/AAA | | | 12,644 | |
| | 8 | | | 3.625%, 8/20/26, FRN, MBS | | Aaa/AAA | | | 8,287 | |
| | 7 | | | 3.625%, 7/20/27, FRN, MBS | | Aaa/AAA | | | 6,749 | |
| | 9 | | | 3.625%, 9/20/27, FRN, MBS | | Aaa/AAA | | | 9,623 | |
| | 60 | | | 3.625%, 8/20/28, FRN, MBS | | Aaa/AAA | | | 62,442 | |
| | 25 | | | 3.625%, 7/20/29, FRN, MBS | | Aaa/AAA | | | 25,393 | |
| | 54 | | | 3.875%, 6/20/22, FRN, MBS | | Aaa/AAA | | | 55,401 | |
| | 5 | | | 4.50%, 8/20/18, FRN, MBS | | Aaa/AAA | | | 5,391 | |
| | 20 | | | 5.00%, 2/20/29, CMO | | Aaa/AAA | | | 19,990 | |
| | 35,427 | | | 6.00%, 7/20/32, CMO | | Aaa/AAA | | | 38,896,342 | |
| | 3 | | | 6.50%, 5/15/23, MBS | | Aaa/AAA | | | 2,918 | |
| | — | (h) | | 6.50%, 12/15/23, MBS | | Aaa/AAA | | | 289 | |
| | | | | | | | | | | |
| | | | | | | | | | 43,911,821 | |
| | | | | | | | | | | |
| | | | | Other Government Agencies–1.5% | | | | | | |
| | 18,561 | | | SLM Student Loan Trust, 1.788%, 4/25/23, ABS, FRN | | Aaa/AAA | | | 19,231,110 | |
| | 26,091 | | | Small Business Administration Participation Certificates, 5.23%, 3/1/27, ABS | | Aaa/AAA | | | 28,950,359 | |
| | 1,325 | | | Vendee Mortgage Trust, 6.50%, 9/15/24, CMO | | Aaa/AAA | | | 1,415,159 | |
| | | | | | | | | | | |
| | | | | | | | | | 49,596,628 | |
| | | | | | | | | | | |
| | | | | Total U.S. Government Agency Securities (cost–$2,086,014,602) | | | | | 2,108,100,748 | |
| | | | | | | | | | | |
| | | | | | | | | | | |
| | | | | | | | | | | |
CORPORATE BONDS & NOTES–43.3% |
| | | | | Banking–11.3% | | | | | | |
| | 7,000 | | | Achmea Hypotheekbank NV, 3.20%, 11/3/14 (a)(d) | | Aaa/AAA | | | 7,509,691 | |
| | | | | American Express Bank FSB, | | | | | | |
| | 10,000 | | | 0.385%, 5/29/12, FRN | | A2/BBB+ | | | 9,907,980 | |
| | 1,700 | | | 5.50%, 4/16/13 | | A2/BBB+ | | | 1,855,054 | |
| | 22,550 | | | 5.55%, 10/17/12 | | A2/BBB+ | | | 24,267,927 | |
| | 17,300 | | | 6.00%, 9/13/17 | | A2/BBB+ | | | 19,833,274 | |
| | 24,600 | | | American Express Centurion Bank,
6.00%, 9/13/17 | | A2/BBB+ | | | 28,202,227 | |
| | 2,600 | | | ANZ National International Ltd.,
6.20%, 7/19/13 (a)(d) | | Aa2/AA | | | 2,909,226 | |
46 Allianz Global Investors Managed Accounts Trust Annual Report ï 10.31.10
Fixed Income SHares: Series M Schedule of Investments
October 31, 2010 (continued)
| | | | | | | | | | | |
Principal
| | | | | | | | |
Amount
| | | | | Credit Rating
| | | |
| (000s) | | | | | (Moody’s/S&P)* | | Value | |
| | | | | Banking (continued) | | | | | | |
| | | | | | | | | | | |
| $ | 1,100 | | | Banco Santander Chile,
1.539%, 4/20/12, FRN (a)(d) | | Aa3/A+ | | $ | 1,100,084 | |
| | 15,680 | | | Bank of Nova Scotia, 1.65%, 10/29/15 (a)(d) | | Aaa/NR | | | 15,707,435 | |
| | | | | Barclays Bank PLC, | | | | | | |
| | 6,400 | | | 5.00%, 9/22/16 | | Aa3/AA− | | | 7,127,014 | |
| | 45,800 | | | 5.45%, 9/12/12 | | Aa3/AA− | | | 49,656,223 | |
| | 5,000 | | | 5.926%, 12/15/16 (a)(d)(i) | | Baa2/A− | | | 4,750,000 | |
| | 1,900 | | | Commonwealth Bank of Australia,
2.90%, 9/17/14 (a)(d) | | Aaa/AAA | | | 2,014,053 | |
| | 5,000 | | | Credit Suisse, 5.50%, 5/1/14 | | Aa1/A+ | | | 5,633,005 | |
| | 11,000 | | | HSBC Capital Funding L.P., 4.61%, 6/27/13 (a)(d)(i) | | A3/A− | | | 10,828,147 | |
| | 35,300 | | | ING Bank NV, 0.919%, 1/13/12, FRN (a)(d) | | Aa3/A+ | | | 35,284,997 | |
| | | | | Rabobank Nederland NV (a)(d), | | | | | | |
| | 1,600 | | | 3.20%, 3/11/15 | | Aaa/AAA | | | 1,686,186 | |
| | 36,900 | | | 4.75%, 1/15/20 | | Aaa/AAA | | | 40,235,760 | |
| | | | | Royal Bank of Scotland PLC, | | | | | | |
| | 16,400 | | | 3.00%, 12/9/11 (a)(d) | | Aaa/AAA | | | 16,826,252 | |
| | 79,000 | | | 3.95%, 9/21/15 | | Aa3/A+ | | | 81,494,346 | |
| | | | | Wachovia Bank N.A., | | | | | | |
| | 13,750 | | | 0.622%, 3/15/16, FRN | | Aa3/AA− | | | 12,696,392 | |
| | 500 | | | 4.875%, 2/1/15 | | Aa3/AA− | | | 544,145 | |
| | | | | | | | | | | |
| | | | | | | | | | 380,069,418 | |
| | | | | | | | | | | |
| | | | | Biotechnology–0.0% | | | | | | |
| | 700 | | | Amgen, Inc., 6.40%, 2/1/39 | | A3/A+ | | | 822,991 | |
| | | | | | | | | | | |
| | | | | Commercial Services–0.2% | | | | | | |
| | 4,700 | | | Board of Trustees of The Leland Stanford Junior Univ., 4.75%, 5/1/19 | | Aaa/AAA | | | 5,243,640 | |
| | | | | | | | | | | |
| | | | | Diversified Manufacturing–2.3% | | | | | | |
| | 70,000 | | | General Electric Co., 5.25%, 12/6/17 | | Aa2/AA+ | | | 78,928,850 | |
| | | | | | | | | | | |
| | | | | Drugs & Medical Products–0.8% | | | | | | |
| | 5,000 | | | AstraZeneca PLC, 5.40%, 9/15/12 | | A1/AA− | | | 5,447,250 | |
| | 8,000 | | | Novartis Securities Investment Ltd., 5.125%, 2/10/19 | | Aa2/AA− | | | 9,200,432 | |
| | 10,000 | | | Pfizer, Inc., 6.20%, 3/15/19 | | A1/AA | | | 12,281,180 | |
| | | | | | | | | | | |
| | | | | | | | | | 26,928,862 | |
| | | | | | | | | | | |
| | | | | Financial Services–21.8% | | | | | | |
| | | | | American Express Co., | | | | | | |
| | 600 | | | 6.15%, 8/28/17 | | A3/BBB+ | | | 692,749 | |
| | 600 | | | 7.00%, 3/19/18 | | A3/BBB+ | | | 721,759 | |
10.31.10 ï Allianz Global Investors Managed Accounts Trust Annual Report 47
Fixed Income SHares: Series M Schedule of Investments
October 31, 2010 (continued)
| | | | | | | | | | | |
Principal
| | | | | | | | |
Amount
| | | | | Credit Rating
| | | |
| (000s) | | | | | (Moody’s/S&P)* | | Value | |
| | | | | Financial Services (continued) | | | | | | |
| | | | | | | | | | | |
| $ | 25,000 | | | American Express Credit Corp., 5.875%, 5/2/13 | | A2/BBB+ | | $ | 27,533,225 | |
| | | | | Bank of America Corp., | | | | | | |
| | 8,295 | | | 0.706%, 8/15/16, FRN | | A3/A− | | | 7,285,499 | |
| | 21,700 | | | 5.75%, 12/1/17 | | A2/A | | | 23,032,423 | |
| | 50,300 | | | 7.375%, 5/15/14 | | A2/A | | | 57,083,911 | |
| | | | | Bank of America N.A., | | | | | | |
| | 15,000 | | | 5.30%, 3/15/17 | | A1/A | | | 15,400,755 | |
| | 2,600 | | | 6.10%, 6/15/17 | | A1/A | | | 2,776,623 | |
| | | | | Bear Stearns Cos. LLC, | | | | | | |
| | 1,700 | | | 5.70%, 11/15/14 | | Aa3/A+ | | | 1,938,626 | |
| | 30,600 | | | 6.40%, 10/2/17 | | Aa3/A+ | | | 35,737,954 | |
| | 800 | | | 6.95%, 8/10/12 | | Aa3/A+ | | | 882,941 | |
| | 21,000 | | | 7.25%, 2/1/18 | | Aa3/A+ | | | 25,661,328 | |
| | | | | CIT Group, Inc., | | | | | | |
| | 230 | | | 7.00%, 5/1/13 | | B3/B+ | | | 234,095 | |
| | 345 | | | 7.00%, 5/1/14 | | B3/B+ | | | 348,555 | |
| | 345 | | | 7.00%, 5/1/15 | | B3/B+ | | | 346,398 | |
| | 575 | | | 7.00%, 5/1/16 | | B3/B+ | | | 575,892 | |
| | 806 | | | 7.00%, 5/1/17 | | B3/B+ | | | 805,243 | |
| | | | | Citigroup, Inc., | | | | | | |
| | 13,100 | | | 2.076%, 5/15/18, FRN | | A3/A | | | 12,477,134 | |
| | 10,000 | | | 5.30%, 10/17/12 | | A3/A | | | 10,664,770 | |
| | 40,500 | | | 5.50%, 4/11/13 | | A3/A | | | 43,873,326 | |
| | 52,260 | | | 6.125%, 5/15/18 | | A3/A | | | 58,365,118 | |
| | 25,000 | | | 6.375%, 8/12/14 | | A3/A | | | 28,087,925 | |
| | 6,900 | | | Citigroup Capital XXI, 8.30%, 12/21/77, (converts to FRN on 12/21/37) | | Ba1/BB− | | | 7,253,625 | |
| | 7,689 | | | Countrywide Financial Corp., 5.80%, 6/7/12 | | A2/A | | | 8,120,276 | |
| | 600 | | | Credit Agricole S.A., 6.637%, 5/31/17 (a)(d)(i) | | A3/A− | | | 575,250 | |
| | | | | General Electric Capital Corp., | | | | | | |
| € | 1,200 | | | 5.50%, 9/15/67, (converts to FRN on 9/15/17)(a)(d) | | Aa3/A+ | | | 1,501,093 | |
| $ | 31,100 | | | 6.375%, 11/15/67, (converts to FRN on 11/15/17) | | Aa3/A+ | | | 30,983,375 | |
| | | | | Goldman Sachs Group, Inc., | | | | | | |
| € | 800 | | | 1.198%, 2/4/13, FRN | | A1/A | | | 1,079,219 | |
| $ | 11,550 | | | 3.70%, 8/1/15 | | A1/A | | | 11,973,088 | |
| | 450 | | | 5.125%, 1/15/15 | | A1/A | | | 492,850 | |
| € | 3,000 | | | 5.375%, 2/15/13 | | A1/A | | | 4,394,452 | |
| $ | 2,900 | | | 5.95%, 1/18/18 | | A1/A | | | 3,227,517 | |
| | 27,575 | | | 6.75%, 10/1/37 | | A2/A− | | | 29,042,073 | |
| | | | | HSBC Finance Corp., FRN, | | | | | | |
| | 5,900 | | | 0.558%, 4/24/12 | | A3/A | | | 5,851,148 | |
48 Allianz Global Investors Managed Accounts Trust Annual Report ï 10.31.10
Fixed Income SHares: Series M Schedule of Investments
October 31, 2010 (continued)
| | | | | | | | | | | |
Principal
| | | | | | | | |
Amount
| | | | | Credit Rating
| | | |
| (000s) | | | | | (Moody’s/S&P)* | | Value | |
| | | | | Financial Services (continued) | | | | | | |
| | | | | | | | | | | |
| $ | 670 | | | 0.642%, 9/14/12 | | A3/A | | $ | 660,471 | |
| | | | | JPMorgan Chase & Co., | | | | | | |
| | 4,500 | | | 4.65%, 6/1/14 | | Aa3/A+ | | | 4,914,932 | |
| | 1,000 | | | 7.90%, 4/30/18 (i) | | Baa1/BBB+ | | | 1,069,613 | |
| | 49,200 | | | Lehman Brothers Holdings, Inc., 6.75%, 12/28/17 (f) | | WR/NR | | | 66,420 | |
| | 8,200 | | | MassMutual Global Funding II, 2.875%, 4/21/14 (a)(d) | | Aa2/AA+ | | | 8,690,458 | |
| | | | | Merrill Lynch & Co., Inc., | | | | | | |
| | 3,000 | | | 0.523%, 6/5/12, FRN | | A2/A | | | 2,948,409 | |
| | 200 | | | 5.00%, 1/15/15 | | A2/A | | | 210,260 | |
| | 400 | | | 5.45%, 7/15/14 | | A2/A | | | 427,906 | |
| | 400 | | | 6.05%, 8/15/12 | | A2/A | | | 426,668 | |
| | 59,200 | | | 6.875%, 4/25/18 | | A2/A | | | 66,541,866 | |
| | | | | Morgan Stanley, | | | | | | |
| € | 5,850 | | | 1.218%, 3/1/13, FRN | | A2/A | | | 7,755,424 | |
| $ | 33,300 | | | 2.876%, 5/14/13, FRN | | A2/NR | | | 34,122,976 | |
| | 24,000 | | | 6.00%, 4/28/15 | | A2/A | | | 26,703,288 | |
| | 21,200 | | | 6.25%, 8/28/17 | | A2/A | | | 23,420,318 | |
| | 10,000 | | | OMX Timber Finance Investments I LLC,
5.42%, 1/29/20 (a)(b)(d)(n) (acquisition cost–$10,780,800; purchased 10/6/10) | | A1/AA− | | | 10,551,300 | |
| € | 1,300 | | | SLM Corp., 1.149%, 11/15/11, FRN | | Ba1/BBB− | | | 1,727,858 | |
| $ | 1,100 | | | TNK-BP Finance S.A., 6.25%, 2/2/15 | | Baa2/BBB− | | | 1,172,875 | |
| | | | | UBS AG, | | | | | | |
| | 39,800 | | | 4.875%, 8/4/20 | | Aa3/A+ | | | 42,754,593 | |
| | 3,000 | | | 5.75%, 4/25/18 | | Aa3/A+ | | | 3,408,072 | |
| | 5,100 | | | 5.875%, 12/20/17 | | Aa3/A+ | | | 5,854,494 | |
| | | | | Wachovia Corp., FRN, | | | | | | |
| | 7,600 | | | 0.562%, 6/15/17 | | A1/AA− | | | 6,945,708 | |
| | 12,600 | | | 2.236%, 5/1/13 | | A1/AA− | | | 12,969,608 | |
| | 6,400 | | | Wells Fargo & Co., 7.98%, 3/15/18 (i) | | Ba1/A− | | | 6,752,000 | |
| | | | | | | | | | | |
| | | | | | | | | | 729,115,732 | |
| | | | | | | | | | | |
| | | | | Food & Beverage–0.1% | | | | | | |
| | 1,700 | | | Kraft Foods, Inc., 6.125%, 2/1/18 | | Baa2/BBB− | | | 2,005,628 | |
| | | | | | | | | | | |
| | | | | Healthcare & Hospitals–0.5% | | | | | | |
| | 15,000 | | | Roche Holdings, Inc., 6.00%, 3/1/19 (a)(d) | | A2/AA− | | | 18,127,635 | |
| | | | | | | | | | | |
| | | | | Insurance–1.3% | | | | | | |
| | | | | American International Group, Inc., | | | | | | |
| | 16,500 | | | 8.175%, 5/15/68, (converts to FRN on 5/15/38) | | Ba2/BBB | | | 17,696,250 | |
| | 21,700 | | | 8.25%, 8/15/18 | | A3/A− | | | 26,012,875 | |
10.31.10 ï Allianz Global Investors Managed Accounts Trust Annual Report 49
Fixed Income SHares: Series M Schedule of Investments
October 31, 2010 (continued)
| | | | | | | | | | | |
Principal
| | | | | | | | |
Amount
| | | | | Credit Rating
| | | |
| (000s) | | | | | (Moody’s/S&P)* | | Value | |
| | | | | Insurance (continued) | | | | | | |
| | | | | | | | | | | |
| £ | 1,000 | | | 8.625%, 5/22/68, (converts to FRN on 5/22/18) | | Ba2/BBB | | $ | 1,654,758 | |
| $ | | | | | | | | | | |
| | | | | | | | | | | |
| | | | | | | | | | 45,363,883 | |
| | | | | | | | | | | |
| | | | | Metals & Mining–0.3% | | | | | | |
| $ | 3,900 | | | Alcoa, Inc., 6.15%, 8/15/20 | | Baa3/BBB− | | | 4,124,098 | |
| | 5,100 | | | Freeport-McMoRan Copper & Gold, Inc.,
8.375%, 4/1/17 | | Baa3/BBB− | | | 5,776,642 | |
| | | | | | | | | | | |
| | | | | | | | | | 9,900,740 | |
| | | | | | | | | | | |
| | | | | Oil & Gas–2.2% | | | | | | |
| | 2,000 | | | Gaz Capital S.A. for Gazprom, 8.125%, 7/31/14 | | Baa1/BBB | | | 2,271,200 | |
| | 2,899 | | | Gazprom International S.A. for Gazprom,
7.201%, 2/1/20 (a)(d) | | NR/BBB+ | | | 3,123,151 | |
| | 15,500 | | | Kinder Morgan Energy Partners L.P., 6.95%, 1/15/38 | | Baa2/BBB | | | 17,314,523 | |
| | 39,900 | | | Morgan Stanley Bank AG for OAO Gazprom,
9.625%, 3/1/13 | | Baa1/BBB | | | 45,685,500 | |
| | 4,600 | | | Valero Energy Corp., 6.625%, 6/15/37 | | Baa2/BBB | | | 4,668,977 | |
| | | | | | | | | | | |
| | | | | | | | | | 73,063,351 | |
| | | | | | | | | | | |
| | | | | Retail–0.2% | | | | | | |
| | 5,000 | | | Macy’s Retail Holdings, Inc., 8.375%, 7/15/15 | | Ba1/BB+ | | | 5,862,500 | |
| | | | | | | | | | | |
| | | | | Telecommunications–1.6% | | | | | | |
| | 44,600 | | | AT&T, Inc., 5.50%, 2/1/18 | | A2/A | | | 52,008,461 | |
| | 400 | | | Embarq Corp., 6.738%, 6/1/13 | | Baa3/BBB− | | | 439,718 | |
| | | | | | | | | | | |
| | | | | | | | | | 52,448,179 | |
| | | | | | | | | | | |
| | | | | Tobacco–0.6% | | | | | | |
| | | | | Altria Group, Inc., | | | | | | |
| | 5,300 | | | 9.25%, 8/6/19 | | Baa1/BBB | | | 7,288,549 | |
| | 1,500 | | | 9.70%, 11/10/18 | | Baa1/BBB | | | 2,072,261 | |
| | 9,700 | | | Reynolds American, Inc., 7.25%, 6/15/37 | | Baa3/BBB | | | 10,140,496 | |
| | | | | | | | | | | |
| | | | | | | | | | 19,501,306 | |
| | | | | | | | | | | |
| | | | | Utilities–0.1% | | | | | | |
| | 2,600 | | | EDF S.A., 6.50%, 1/26/19 (a)(d) | | Aa3/A+ | | | 3,223,386 | |
| | | | | | | | | | | |
| | | | | Total Corporate Bonds & Notes (cost–$1,388,835,699) | | | | | 1,450,606,101 | |
| | | | | | | | | | | |
| | | | | | | | | | | |
| | | | | | | | | | | |
U.S. TREASURY OBLIGATIONS–21.7% |
| | 1,667 | | | U.S. Treasury Bonds, 11.25%, 2/15/15 (k) | | | | | 2,388,889 | |
| | | | | U.S. Treasury Notes, | | | | | | |
| | 4,900 | | | 0.375%, 10/31/12 (e) | | | | | 4,903,827 | |
| | 235,300 | | | 1.25%, 9/30/15 (e)(k) | | | | | 236,458,146 | |
| | 336,000 | | | 1.875%, 9/30/17 (e) | | | | | 335,973,792 | |
50 Allianz Global Investors Managed Accounts Trust Annual Report ï 10.31.10
Fixed Income SHares: Series M Schedule of Investments
October 31, 2010 (continued)
| | | | | | | | | | | |
Principal
| | | | | | | | |
Amount
| | | | | Credit Rating
| | | |
| (000s) | | | | | (Moody’s/S&P)* | | Value | |
| $ | 24,800 | | | 2.375%, 7/31/17 (e) | | | | $ | 25,671,869 | |
| | 114,200 | | | 3.125%, 5/15/19 (k) | | | | | 121,132,283 | |
| | | | | | | | | | | |
| | | | | Total U.S. Treasury Obligations (cost–$722,620,456) | | | | | 726,528,806 | |
| | | | | | | | | | | |
| | | | | | | | | | | |
| | | | | | | | | | | |
MORTGAGE-BACKED SECURITIES–14.2% |
| | | | | Adjustable Rate Mortgage Trust, CMO, VRN, | | | | | | |
| | 1,047 | | | 3.108%, 5/25/35 | | Ba2/A− | | | 1,041,464 | |
| | 613 | | | 5.317%, 11/25/35 | | Caa2/B | | | 497,917 | |
| | 496 | | | 5.330%, 1/25/36 | | Caa1/BBB− | | | 441,759 | |
| | 11,993 | | | American General Mortgage Loan Trust,
5.15%, 3/25/58, CMO, VRN (a)(d) | | Aaa/NR | | | 12,634,651 | |
| | | | | American Home Mortgage Assets, CMO, FRN, | | | | | | |
| | 1,699 | | | 0.446%, 9/25/46 | | B2/BBB+ | | | 902,515 | |
| | 1,450 | | | 0.466%, 10/25/46 | | Caa3/BBB | | | 753,567 | |
| | 2,315 | | | Banc of America Funding Corp.,
3.182%, 2/20/36, CMO, FRN | | NR/AAA | | | 2,187,290 | |
| | 1,389 | | | Banc of America Mortgage Securities, Inc.,
5.50%, 9/25/35, CMO | | B3/CCC | | | 1,145,890 | |
| | 4,700 | | | BCRR Trust, 5.808%, 8/17/45, CMO, VRN (a)(d) | | Aaa/NR | | | 5,092,060 | |
| | | | | Bear Stearns Adjustable Rate Mortgage Trust, CMO, | | | | | | |
| | 12,213 | | | 2.40%, 8/25/35, FRN | | Baa2/AAA | | | 11,580,032 | |
| | 3,294 | | | 2.56%, 10/25/35, FRN | | Caa1/BBB | | | 2,912,916 | |
| | 23,959 | | | 2.76%, 3/25/35, FRN | | Ba2/AAA | | | 22,884,168 | |
| | 7,418 | | | 2.934%, 3/25/35, FRN | | A1/AAA | | | 7,123,841 | |
| | 78 | | | 3.237%, 1/25/35, VRN | | A2/AA+ | | | 66,082 | |
| | 241 | | | 3.575%, 1/25/34, VRN | | Aa2/AAA | | | 233,241 | |
| | 304 | | | 4.598%, 2/25/34, VRN | | Aa3/AA | | | 297,596 | |
| | 1,121 | | | 5.347%, 5/25/47, VRN | | NR/CCC | | | 861,535 | |
| | 445 | | | 5.690%, 2/25/36, FRN | | Caa3/CCC | | | 321,970 | |
| | | | | Bear Stearns Alt-A Trust, CMO, VRN, | | | | | | |
| | 200 | | | 2.879%, 5/25/35 | | Caa2/AA | | | 156,272 | |
| | 5,265 | | | 3.013%, 6/25/34 | | A1/AA+ | | | 2,272,192 | |
| | 1,140 | | | 5.144%, 2/25/36 | | Ca/CCC | | | 587,048 | |
| | 56 | | | Bear Stearns Mortgage Funding Trust,
0.326%, 2/25/37, CMO, FRN | | A1/AAA | | | 55,625 | |
| | 28 | | | Bear Stearns Mortgage Securities, Inc.,
6.753%, 3/25/31, CMO, VRN | | Aaa/NR | | | 29,137 | |
| | 2,470 | | | Bear Stearns Structured Products, Inc.,
4.017%, 1/26/36, CMO, VRN | | B2/A+ | | | 1,710,246 | |
| | 4,258 | | | Carey Commercial Mortgage Trust,
5.97%, 9/20/19, CMO (a)(d) | | Aaa/NR | | | 4,331,576 | |
| | 1,119 | | | CC Mortgage Funding Corp.,
0.386%, 5/25/48, CMO, FRN (a)(d) | | Caa3/CC | | | 481,902 | |
10.31.10 ï Allianz Global Investors Managed Accounts Trust Annual Report 51
Fixed Income SHares: Series M Schedule of Investments
October 31, 2010 (continued)
| | | | | | | | | | | |
Principal
| | | | | | | | |
Amount
| | | | | Credit Rating
| | | |
| (000s) | | | | | (Moody’s/S&P)* | | Value | |
| $ | 3,823 | | | Chase Mortgage Finance Corp.,
6.010%, 9/25/36, CMO, FRN | | B3/NR | | $ | 3,537,502 | |
| | | | | Citigroup Commercial Mortgage Trust, CMO, VRN (a)(d), | | | | | | |
| | 9,862 | | | 5.32%, 12/17/49 | | Aaa/NR | | | 10,592,470 | |
| | 15,178 | | | 5.86%, 7/17/40 | | Aaa/NR | | | 16,630,846 | |
| | | | | Citigroup Mortgage Loan Trust, Inc., CMO, | | | | | | |
| | 25,077 | | | 2.66%, 10/25/35, FRN | | NR/BB+ | | | 21,871,349 | |
| | 994 | | | 2.67%, 12/25/35, FRN | | NR/AA− | | | 959,814 | |
| | 332 | | | 2.896%, 12/25/35, VRN | | Caa1/CC | | | 205,965 | |
| | 182 | | | 2.918%, 8/25/35, VRN | | Aa3/NR | | | 174,563 | |
| | 2,600 | | | 5.851%, 9/25/37, VRN | | NR/CCC | | | 1,943,473 | |
| | 3,505 | | | Commercial Capital Access One, Inc.,
7.698%, 11/15/28, CMO, VRN (a)(d) | | NR/NR | | | 1,343,717 | |
| | | | | Commercial Mortgage Pass Through Certificates, CMO (a)(d), | | | | | | |
| | 17,000 | | | 3.156%, 11/1/15 (e)(g) | | Aaa/NR | | | 17,504,496 | |
| | 7,000 | | | 5.362%, 2/5/19 | | NR/AAA | | | 7,044,323 | |
| | 2,000 | | | 5.479%, 2/5/19, VRN | | NR/BB− | | | 1,930,836 | |
| | 800 | | | Community Program Loan Trust,
4.50%, 4/1/29, CMO | | NR/AAA | | | 775,506 | |
| | | | | Countrywide Alternative Loan Trust, CMO, | | | | | | |
| | 1,074 | | | 0.426%, 1/25/37, FRN | | Caa3/CCC | | | 630,071 | |
| | 3,575 | | | 0.436%, 2/20/47, FRN | | Ba2/CCC | | | 1,973,893 | |
| | 3,767 | | | 0.436%, 5/25/47, FRN | | B2/CCC | | | 2,060,695 | |
| | 182 | | | 0.466%, 7/20/46, FRN | | Caa3/CCC | | | 83,251 | |
| | 6,194 | | | 0.476%, 5/25/35, FRN | | Baa1/A− | | | 3,546,923 | |
| | 3,439 | | | 0.516%, 12/25/35, FRN | | A1/B− | | | 2,204,580 | |
| | 398 | | | 0.526%, 5/25/36, FRN | | Ca/CCC | | | 83,799 | |
| | 1,420 | | | 1.353%, 2/25/36, FRN | | B2/CCC | | | 943,381 | |
| | 412 | | | 5.720%, 11/25/35, VRN | | Ca/CCC | | | 260,834 | |
| | | | | Countrywide Home Loan Mortgage Pass Through Trust, CMO, | | | | | | |
| | 272 | | | 0.486%, 5/25/35, FRN | | A1/AAA | | | 176,204 | |
| | 509 | | | 0.556%, 4/25/46, FRN | | Ca/CCC | | | 129,362 | |
| | 1,422 | | | 0.566%, 3/25/35, FRN | | A1/CCC | | | 864,440 | |
| | 1,974 | | | 0.576%, 3/25/35, FRN | | A1/AAA | | | 1,195,501 | |
| | 1,350 | | | 0.596%, 3/25/36, FRN | | B2/CCC | | | 445,398 | |
| | 1,035 | | | 0.646%, 2/25/35, FRN | | Ba1/BBB | | | 352,416 | |
| | 51 | | | 0.796%, 2/25/35, FRN | | Aaa/AAA | | | 42,542 | |
| | 197 | | | 2.608%, 2/20/36, FRN | | Caa2/BBB+ | | | 156,197 | |
| | 679 | | | 3.512%, 4/25/35, FRN | | Caa1/CCC | | | 158,205 | |
| | 435 | | | 5.103%, 10/20/35, VRN | | Caa2/CCC | | | 330,014 | |
| | 632 | | | 5.615%, 5/20/36, VRN | | Ca/CCC | | | 468,096 | |
52 Allianz Global Investors Managed Accounts Trust Annual Report ï 10.31.10
Fixed Income SHares: Series M Schedule of Investments
October 31, 2010 (continued)
| | | | | | | | | | | |
Principal
| | | | | | | | |
Amount
| | | | | Credit Rating
| | | |
| (000s) | | | | | (Moody’s/S&P)* | | Value | |
| $ | 19 | | | Credit Suisse First Boston Mortgage Securities Corp., | | | | | | |
| | | | | 0.931%, 3/25/32, CMO, FRN (a)(d) | | Aaa/NR | | $ | 15,758 | |
| | 359 | | | Downey Savings & Loan Assoc. Mortgage Loan Trust, | | | | | | |
| | | | | 0.576%, 7/19/45, CMO, FRN | | Caa3/CCC | | | 89,202 | |
| | 1,500 | | | First Horizon Asset Securities, Inc.,
6.25%,
11/25/36, CMO | | B2/AA | | | 1,406,206 | |
| | 851 | | | GMAC Commercial Mortgage Securities, Inc.,
6.50%, 5/15/35, CMO (a)(d) | | NR/BBB | | | 892,153 | |
| | 451 | | | GMAC Mortgage Corp. Loan Trust, 3.960%, 11/19/35, CMO, FRN | | Caa3/CCC | | | 389,539 | |
| | 8,927 | | | Granite Master Issuer PLC, 0.346%, 12/20/54, CMO, FRN | | Aaa/AAA | | | 8,321,341 | |
| | 162 | | | Greenpoint Mortgage Funding Trust,
0.336%, 10/25/46, CMO, FRN | | B2/CC | | | 147,564 | |
| | 1,500 | | | GS Mortgage Securities Corp. II, 6.615%, 2/14/16, CMO (a)(d) | | NR/AAA | | | 1,509,360 | |
| | | | | GSR Mortgage Loan Trust, CMO, | | | | | | |
| | 1,780 | | | 2.895%, 9/25/35, FRN | | NR/AAA | | | 1,716,835 | |
| | 356 | | | 3.082%, 9/25/34, VRN | | A2/A+ | | | 303,470 | |
| | 213 | | | 3.527%, 4/25/35, VRN | | Caa2/BB− | | | 165,922 | |
| | | | | Harborview Mortgage Loan Trust, CMO, FRN, | | | | | | |
| | 5,441 | | | 0.446%, 2/19/46 | | Baa3/AAA | | | 3,154,604 | |
| | 4,165 | | | 0.476%, 5/19/35 | | Baa1/AAA | | | 2,590,023 | |
| | 374 | | | 0.506%, 1/19/38 | | Ca/CCC | | | 102,286 | |
| | 440 | | | 0.506%, 9/19/46 | | Ca/CCC | | | 85,817 | |
| | | | | Homebanc Mortgage Trust, CMO, | | | | | | |
| | 413 | | | 0.436%, 12/25/36, FRN | | Caa2/A+ | | | 304,177 | |
| | 7,800 | | | 5.770%, 4/25/37, VRN | | Ca/CCC | | | 4,811,890 | |
| | 7,900 | | | Indymac INDA Mortgage Loan Trust, 5.686%, 8/25/36, CMO, VRN | | B2/AAA | | | 5,850,361 | |
| | 540 | | | Indymac INDB Mortgage Loan Trust,
0.556%, 11/25/35, CMO, FRN | | Ca/CCC | | | 259,976 | |
| | | | | Indymac Index Mortgage Loan Trust, CMO, | | | | | | |
| | 183 | | | 0.446%, 9/25/46, FRN | | B3/B− | | | 104,300 | |
| | 919 | | | 0.536%, 3/25/35, FRN | | Ba1/BB− | | | 629,468 | |
| | 3,362 | | | 5.00%, 8/25/35, FRN | | Caa2/B+ | | | 2,585,007 | |
| | 6,082 | | | 5.076%, 9/25/35, VRN | | C/CCC | | | 1,433,342 | |
| | 364 | | | 5.076%, 9/25/35, VRN | | Caa2/B | | | 293,113 | |
| | 3,056 | | | 5.173%, 10/25/35, VRN | | Caa2/CCC | | | 2,396,226 | |
| | 345 | | | 5.275%, 6/25/35, VRN | | Caa2/CCC | | | 266,042 | |
| | 5,411 | | | 5.376%, 6/25/36, VRN | | B3/AAA | | | 4,247,116 | |
10.31.10 ï Allianz Global Investors Managed Accounts Trust Annual Report 53
Fixed Income SHares: Series M Schedule of Investments
October 31, 2010 (continued)
| | | | | | | | | | | |
Principal
| | | | | | | | |
Amount
| | | | | Credit Rating
| | | |
| (000s) | | | | | (Moody’s/S&P)* | | Value | |
| $ | 12,572 | | | JPMorgan Alternative Loan Trust, 0.756%, 6/27/37, CMO, FRN (a)(d) | | NR/AAA | | $ | 10,941,097 | |
| | | | | JPMorgan Chase Commercial Mortgage Securities Corp., CMO, | | | | | | |
| | 25,767 | | | 0.631%, 7/15/19, FRN (a)(d) | | Aaa/NR | | | 23,179,423 | |
| | 29,200 | | | 2.749%, 11/15/43 (a)(d) | | NR/AAA | | | 29,673,428 | |
| | 600 | | | 5.336%, 5/15/47 | | Aa3/A | | | 632,789 | |
| | 2,000 | | | 6.465%, 11/15/35 | | NR/AAA | | | 2,066,993 | |
| | | | | JPMorgan Mortgage Trust, CMO, | | | | | | |
| | 1,525 | | | 2.976%, 9/25/34, FRN | | NR/AAA | | | 1,592,691 | |
| | 2,611 | | | 3.238%, 7/25/35, FRN | | Baa2/AAA | | | 2,572,166 | |
| | 340 | | | 4.861%, 4/25/35, VRN | | Ba2/AAA | | | 326,898 | |
| | 525 | | | 5.410%, 11/25/35, VRN | | B2/BBB | | | 508,370 | |
| | | | | Luminent Mortgage Trust, CMO, FRN, | | | | | | |
| | 2,043 | | | 0.426%, 12/25/36 | | B2/B+ | | | 1,277,240 | |
| | 737 | | | 0.456%, 10/25/46 | | Ba1/A− | | | 470,053 | |
| | | | | MASTR Adjustable Rate Mortgage Trust, CMO, FRN, | | | | | | |
| | 384 | | | 0.496%, 5/25/37 | | Caa3/CCC | | | 198,450 | |
| | 74 | | | 2.899%, 11/21/34 | | Aa2/AAA | | | 74,293 | |
| | | | | MASTR Reperforming Loan Trust, CMO (a)(d), | | | | | | |
| | 2,615 | | | 7.00%, 5/25/35 | | Ba3/BBB− | | | 2,633,668 | |
| | 3,939 | | | 7.50%, 7/25/35 | | Ba3/AAA | | | 3,608,943 | |
| | 2,343 | | | 8.00%, 7/25/35 | | Ba3/AAA | | | 2,144,076 | |
| | 251 | | | Mellon Residential Funding Corp., 2.61%, 10/20/29, CMO, FRN | | NR/AAA | | | 236,084 | |
| | 1,150 | | | Merrill Lynch Alternative Note Asset,
0.556%, 3/25/37, CMO, FRN | | Ca/CCC | | | 541,753 | |
| | 2,000 | | | Merrill Lynch/Countrywide Commercial Mortgage Trust, | | | | | | |
| | | | | 5.965%, 8/12/49, CMO, VRN | | NR/AAA | | | 2,184,693 | |
| | | | | MLCC Mortgage Investors, Inc., CMO, FRN, | | | | | | |
| | 334 | | | 1.749%, 7/25/29 | | Aaa/AAA | | | 313,071 | |
| | 1,433 | | | 2.009%, 10/25/35 | | Baa1/AAA | | | 1,306,125 | |
| | | | | Morgan Stanley Capital I, CMO, | | | | | | |
| | 38,250 | | | 5.332%, 12/15/43 | | NR/AAA | | | 41,807,858 | |
| | 1,100 | | | 5.692%, 4/15/49, VRN | | Aa2/A− | | | 1,148,812 | |
| | 28,450 | | | 5.731%, 7/12/44, VRN | | NR/AAA | | | 31,645,279 | |
| | 315 | | | Morgan Stanley Dean Witter Capital I,
1.90%, 3/25/33, CMO, FRN | | Aaa/AAA | | | 302,944 | |
| | | | | Nomura Asset Acceptance Corp., CMO, | | | | | | |
| | 2,602 | | | 5.376%, 2/25/36, VRN | | Caa3/D | | | 1,599,619 | |
| | 1,174 | | | 7.50%, 3/25/34 (a)(d) | | Aa3/AAA | | | 1,223,905 | |
54 Allianz Global Investors Managed Accounts Trust Annual Report ï 10.31.10
Fixed Income SHares: Series M Schedule of Investments
October 31, 2010 (continued)
| | | | | | | | | | | |
Principal
| | | | | | | | |
Amount
| | | | | Credit Rating
| | | |
| (000s) | | | | | (Moody’s/S&P)* | | Value | |
| $ | 246 | | | Opteum Mortgage Acceptance Corp.,
0.516%, 7/25/35, CMO, FRN | | Ba1/AAA | | $ | 220,538 | |
| | | | | Residential Accredit Loans, Inc., CMO, | | | | | | |
| | 145 | | | 0.356%, 9/25/46, FRN | | B3/CC | | | 138,632 | |
| | 1,143 | | | 0.506%, 8/25/37, FRN | | B3/CCC | | | 633,461 | |
| | 441 | | | 0.556%, 8/25/35, FRN | | Baa3/BBB+ | | | 281,844 | |
| | 354 | | | 0.656%, 10/25/45, FRN | | B1/B− | | | 189,613 | |
| | 372 | | | 5.714%, 2/25/36, VRN | | Caa3/D | | | 197,035 | |
| | 14 | | | Residential Asset Securitization Trust,
0.756%, 3/25/33, CMO, FRN | | NR/AAA | | | 13,202 | |
| | | | | Residential Funding Mortgage Securities I, CMO, | | | | | | |
| | 2,410 | | | 4.051%, 3/25/35, VRN | | Caa3/B | | | 2,044,023 | |
| | 1,659 | | | 6.00%, 9/25/36 | | Caa1/CCC | | | 1,474,965 | |
| | 580 | | | Sovereign Commercial Mortgage Securities Trust, | | | | | | |
| | | | | 5.790%, 7/22/30, CMO, VRN (a)(d) | | Aaa/NR | | | 603,364 | |
| | | | | Structured Adjustable Rate Mortgage Loan Trust, CMO, | | | | | | |
| | 1,073 | | | 0.746%, 6/25/34, FRN | | A1/AAA | | | 848,723 | |
| | 1,290 | | | 1.742%, 5/25/35, FRN | | B3/CCC | | | 671,315 | |
| | 169 | | | 2.870%, 10/25/34, VRN | | A2/AA− | | | 142,858 | |
| | 31 | | | 4.939%, 1/25/36, VRN | | NR/CC | | | 26,838 | |
| | 7,900 | | | 5.184%, 9/25/36, VRN | | NR/CCC | | | 4,506,741 | |
| | 7,900 | | | 5.210%, 5/25/36, FRN | | NR/BBB− | | | 5,783,159 | |
| | | | | Structured Asset Mortgage Investments, Inc., CMO, FRN, | | | | | | |
| | 107 | | | 0.356%, 9/25/47 | | Aa1/AAA | | | 107,098 | |
| | 464 | | | 0.386%, 3/25/37 | | A1/BBB | | | 269,383 | |
| | 13,758 | | | 0.436%, 6/25/36 | | B3/B− | | | 6,984,515 | |
| | 184 | | | 0.446%, 6/25/36 | | B3/BB | | | 106,695 | |
| | 1,423 | | | 0.446%, 7/25/46 | | B3/CCC | | | 854,855 | |
| | 9,611 | | | 0.476%, 5/25/36 | | B3/CCC | | | 5,408,350 | |
| | 1,611 | | | 0.476%, 5/25/46 | | B3/A+ | | | 854,869 | |
| | 444 | | | 0.516%, 5/25/46 | | Caa3/CCC | | | 77,513 | |
| | 725 | | | 0.606%, 3/19/34 | | Aa1/AAA | | | 354,767 | |
| | 376 | | | 0.606%, 3/19/34 | | Aaa/AAA | | | 338,009 | |
| | 1,362 | | | 0.626%, 12/19/33 | | Aa3/AAA | | | 1,172,882 | |
| | | | | Structured Asset Securities Corp., CMO, FRN, | | | | | | |
| | 5 | | | 2.163%, 5/25/32 | | WR/AAA | | | 4,720 | |
| | 270 | | | 2.585%, 2/25/34 | | Aa3/AAA | | | 250,435 | |
| | 381 | | | Wachovia Mortgage Loan Trust LLC,
5.426%, 10/20/35, CMO, FRN | | NR/A− | | | 370,748 | |
| | | | | WaMu Mortgage Pass Through Certificates, CMO, FRN, | | | | | | |
| | 27 | | | 0.526%, 12/25/45 | | Aa1/AAA | | | 22,183 | |
| | 853 | | | 0.576%, 1/25/45 | | Aaa/AAA | | | 696,427 | |
10.31.10 ï Allianz Global Investors Managed Accounts Trust Annual Report 55
Fixed Income SHares: Series M Schedule of Investments
October 31, 2010 (continued)
| | | | | | | | | | | |
Principal
| | | | | | | | |
Amount
| | | | | Credit Rating
| | | |
| (000s) | | | | | (Moody’s/S&P)* | | Value | |
| $ | 729 | | | 0.62%, 11/25/34 | | Aa2/AAA | | $ | 544,899 | |
| | 3,917 | | | 0.64%, 10/25/44 | | Aa2/AAA | | | 3,145,482 | |
| | 600 | | | 0.666%, 11/25/45 | | Baa3/AAA | | | 355,297 | |
| | 2,007 | | | 0.74%, 11/25/34 | | A1/AAA | | | 1,338,255 | |
| | 1,906 | | | 0.796%, 12/25/27 | | Aaa/AAA | | | 1,682,563 | |
| | 247 | | | 0.896%, 12/25/27 | | Aaa/AAA | | | 219,659 | |
| | 540 | | | 1.103%, 6/25/47 | | Ca/CCC | | | 150,088 | |
| | 83 | | | 1.553%, 11/25/42 | | Baa2/A | | | 72,853 | |
| | 741 | | | 1.853%, 11/25/46 | | A1/A+ | | | 514,873 | |
| | 19,069 | | | 2.711%, 9/25/33 | | A1/AAA | | | 18,492,528 | |
| | 1,668 | | | 2.719%, 8/25/33 | | Aaa/AAA | | | 1,692,552 | |
| | | | | Wells Fargo Mortgage-Backed Securities Trust, CMO, | | | | | | |
| | 850 | | | 0.756%, 7/25/37, FRN | | B3/NR | | | 556,332 | |
| | 1,047 | | | 2.876%, 7/25/35, FRN | | Aa3/AAA | | | 1,047,076 | |
| | 489 | | | 2.88%, 1/25/35, FRN | | Aa1/NR | | | 484,661 | |
| | 2,099 | | | 2.88%, 1/25/35, FRN | | A3/NR | | | 2,017,750 | |
| | 14,741 | | | 3.321%, 6/25/35, FRN | | Baa2/AAA | | | 14,756,704 | |
| | 3,907 | | | 4.339%, 3/25/36, VRN | | NR/A | | | 3,476,645 | |
| | 750 | | | 4.652%, 8/25/34, FRN | | Aaa/AAA | | | 704,638 | |
| | 1,157 | | | 6.00%, 6/25/37 | | Caa1/NR | | | 1,092,698 | |
| | | | | | | | | | | |
| | | | | Total Mortgage-Backed Securities (cost–$483,925,114) | | | | | 477,500,286 | |
| | | | | | | | | | | |
| | | | | | | | | | | |
| | | | | | | | | | | |
MUNICIPAL BONDS–11.9% |
| | | | | Alaska–0.0% | | | | | | |
| | 100 | | | Northern Tobacco Securitization Corp. Rev.,
5.00%, 6/1/46, Ser. A | | Baa3/NR | | | 68,637 | |
| | | | | | | | | | | |
| | | | | California–2.9% | | | | | | |
| | 11,000 | | | Alameda Cnty. JT Powers Auth. Rev.,
7.046%, 12/1/44 (e) | | A1/AA | | | 10,994,500 | |
| | | | | Bay Area Toll Auth. Rev., | | | | | | |
| | 11,000 | | | 6.907%, 10/1/50 (e) | | NR/A+ | | | 11,069,080 | |
| | 800 | | | 6.918%, 4/1/40, Ser. S-1 | | A1/A+ | | | 838,288 | |
| | 15,000 | | | 7.043%, 4/1/50, Ser. S-1 | | A1/A+ | | | 15,740,550 | |
| | 100 | | | Chino Valley Unified School Dist., GO, zero coupon, 8/1/23, Ser. D (FGIC-NPFGC) | | Aa2/A+ | | | 49,094 | |
| | 100 | | | Clovis Unified School Dist., GO, zero coupon, 8/1/20, Ser. B (FGIC-NPFGC) | | WR/AA | | | 64,384 | |
| | | | | Golden State Tobacco Securitization Corp. Rev., Ser. A (FGIC), | | | | | | |
| | 5,000 | | | 5.00%, 6/1/35 | | A2/BBB+ | | | 4,841,700 | |
| | 3,500 | | | 5.00%, 6/1/38 | | A2/BBB+ | | | 3,358,355 | |
56 Allianz Global Investors Managed Accounts Trust Annual Report ï 10.31.10
Fixed Income SHares: Series M Schedule of Investments
October 31, 2010 (continued)
| | | | | | | | | | | |
Principal
| | | | | | | | |
Amount
| | | | | Credit Rating
| | | |
| (000s) | | | | | (Moody’s/S&P)* | | Value | |
| | | | | California (continued) | | | | | | |
| | | | | | | | | | | |
| $ | 4,500 | | | Los Angeles Community College Dist., GO,
6.75%, 8/1/49 | | Aa1/AA | | $ | 4,819,860 | |
| | | | | Los Angeles Department of Water & Power Rev., | | | | | | |
| | 6,100 | | | 5.716%, 7/1/39 | | Aa3/AA− | | | 6,030,033 | |
| | 6,400 | | | 6.166%, 7/1/40 | | Aa3/AA− | | | 6,387,200 | |
| | 6,500 | | | Los Angeles Unified School Dist., GO, 5.981%, 5/1/27 | | Aa2/AA− | | | 6,821,685 | |
| | 4,800 | | | Palomar Community College Dist., GO,
7.194%, 8/1/45 (e) | | Aa2/AA− | | | 4,800,000 | |
| | | | | Riverside Community College Dist., GO (e), | | | | | | |
| | 2,750 | | | 6.971%, 8/1/35 | | Aa2/AA | | | 2,755,555 | |
| | 3,250 | | | 7.021%, 8/1/40 | | Aa2/AA | | | 3,256,532 | |
| | 1,000 | | | San Diego Redev. Agcy., Tax Allocation,
7.75%, 9/1/40, Ser. A | | A3/BBB+ | | | 974,910 | |
| | | | | State, GO, | | | | | | |
| | 3,600 | | | 5.65%, 4/1/39, VRN | | A1/A− | | | 3,880,332 | |
| | 600 | | | 7.50%, 4/1/34 | | A1/A− | | | 626,442 | |
| | 3,300 | | | 7.55%, 4/1/39 | | A1/A− | | | 3,450,942 | |
| | 985 | | | Tobacco Securitization Auth. of Northern California Rev., 5.40%, 6/1/27, Ser. A-2 | | Baa3/BBB | | | 935,307 | |
| | | | | Univ. of California Rev., | | | | | | |
| | 3,500 | | | 5.946%, 5/15/45 | | Aa2/AA− | | | 3,414,880 | |
| | 2,750 | | | 6.296%, 5/15/50 | | Aa2/AA− | | | 2,651,605 | |
| | | | | | | | | | | |
| | | | | | | | | | 97,761,234 | |
| | | | | | | | | | | |
| | | | | Illinois–0.2% | | | | | | |
| | 700 | | | Regional Transportation Auth. Rev., 5.00%, 7/1/25, Ser. A (NPFGC) | | Aa2/AA | | | 746,431 | |
| | 2,200 | | | State Toll Highway Auth. Rev., 6.184%, 1/1/34, Ser. A | | Aa3/AA− | | | 2,277,308 | |
| | 7,505 | | | Will Cnty. Community High School Dist. No. 210, Lincoln-Way Central High School, GO, zero coupon, 1/1/21 (AGM) | | Aa2/NR | | | 4,727,775 | |
| | | | | | | | | | | |
| | | | | | | | | | 7,751,514 | |
| | | | | | | | | | | |
| | | | | Iowa–0.1% | | | | | | |
| | 3,800 | | | Tobacco Settlement Auth. Rev., 5.60%, 6/1/34, Ser. B | | Baa3/BBB | | | 3,402,672 | |
| | | | | | | | | | | |
| | | | | Louisiana–0.1% | | | | | | |
| | 4,400 | | | East Baton Rouge Sewerage Commission Rev., 6.087%, 2/1/45 | | Aa2/AA− | | | 4,473,172 | |
| | | | | | | | | | | |
| | | | | Michigan–0.1% | | | | | | |
| | 1,250 | | | Michigan State Univ. Rev., 6.173%, 2/15/50, Ser. A | | Aa1/AA | | | 1,291,775 | |
| | | | | | | | | | | |
10.31.10 ï Allianz Global Investors Managed Accounts Trust Annual Report 57
Fixed Income SHares: Series M Schedule of Investments
October 31, 2010 (continued)
| | | | | | | | | | | |
Principal
| | | | | | | | |
Amount
| | | | | Credit Rating
| | | |
| (000s) | | | | | (Moody’s/S&P)* | | Value | |
| | | | | New Jersey–0.5% | | | | | | |
| $ | 1,335 | | | Economic Dev. Auth. Rev., 6.425%, 12/15/35, Ser. CC-1 | | Aa3/AA− | | $ | 1,373,928 | |
| | 21,440 | | | Tobacco Settlement Financing Corp. Rev.,
5.00%, 6/1/41, Ser. 1-A | | Baa3/BBB | | | 15,498,333 | |
| | | | | | | | | | | |
| | | | | | | | | | 16,872,261 | |
| | | | | | | | | | | |
| | | | | New York–3.1% | | | | | | |
| | | | | New York City Municipal Water Finance Auth. Rev., | | | | | | |
| | 4,450 | | | 5.44%, 6/15/43 | | Aa2/AA+ | | | 4,449,689 | |
| | 3,000 | | | 6.124%, 6/15/42 | | Aa2/AA+ | | | 3,026,640 | |
| | | | | New York City Transitional Finance Auth. Rev., | | | | | | |
| | 7,330 | | | 4.325%, 11/1/21 (e) | | Aa1/AAA | | | 7,314,094 | |
| | 16,700 | | | 4.525%, 11/1/22 (e) | | Aa1/AAA | | | 16,646,393 | |
| | 5,000 | | | 5.267%, 5/1/27 | | Aa1/AAA | | | 5,031,250 | |
| | 12,400 | | | 5.572%, 11/1/38 (e) | | Aa1/AAA | | | 12,418,104 | |
| | 7,500 | | | 5.767%, 8/1/36 | | Aa1/AAA | | | 7,683,900 | |
| | 14,700 | | | 5.932%, 11/1/36 (e) | | Aa1/AAA | | | 14,633,262 | |
| | | | | Port Auth. of New York & New Jersey Rev., | | | | | | |
| | 16,700 | | | 5.647%, 11/1/40 (e) | | Aa2/AA− | | | 16,484,570 | |
| | 2,500 | | | 5.859%, 12/1/24, Ser. 158 | | Aa2/AA− | | | 2,760,475 | |
| | 4,000 | | | State Dormitory Auth. Rev., 5.051%, 9/15/27 | | NR/AAA | | | 3,946,600 | |
| | 8,800 | | | State Urban Dev. Corp. Rev., 5.77%, 3/15/39 | | NR/AAA | | | 8,999,408 | |
| | | | | | | | | | | |
| | | | | | | | | | 103,394,385 | |
| | | | | | | | | | | |
| | | | | Ohio–0.5% | | | | | | |
| | | | | Buckeye Tobacco Settlement Financing Auth. Rev., Ser. A-2, | | | | | | |
| | 5,800 | | | 5.875%, 6/1/30 | | Baa3/BBB | | | 4,871,478 | |
| | 9,500 | | | 5.875%, 6/1/47 | | Baa3/BBB | | | 7,252,110 | |
| | 7,020 | | | 6.00%, 6/1/42 | | Baa3/BBB | | | 5,544,045 | |
| | | | | | | | | | | |
| | | | | | | | | | 17,667,633 | |
| | | | | | | | | | | |
| | | | | Puerto Rico–0.0% | | | | | | |
| | 1,000 | | | Sales Tax Financing Corp. Rev., zero coupon, 8/1/54, Ser. A (AMBAC) | | Aa2/AA− | | | 63,020 | |
| | | | | | | | | | | |
| | | | | Tennessee–0.3% | | | | | | |
| | 8,900 | | | State School Bond Auth., GO, 4.848%, 9/15/27 | | Aa2/AA | | | 8,806,550 | |
| | | | | | | | | | | |
| | | | | Texas–4.1% | | | | | | |
| | 45,400 | | | North Texas Tollway Auth. Rev., 8.91%, 2/1/30 | | Baa3/NR | | | 45,986,568 | |
| | | | | San Antonio Electric Rev., | | | | | | |
| | 7,000 | | | 5.808%, 2/1/41 (e) | | Aa2/AA− | | | 7,000,000 | |
58 Allianz Global Investors Managed Accounts Trust Annual Report ï 10.31.10
Fixed Income SHares: Series M Schedule of Investments
October 31, 2010 (continued)
| | | | | | | | | | | |
Principal
| | | | | | | | |
Amount
| | | | | Credit Rating
| | | |
| (000s) | | | | | (Moody’s/S&P)* | | Value | |
| | | | | Texas (continued) | | | | | | |
| | | | | | | | | | | |
| $ | 4,600 | | | 6.308%, 2/1/37 | | Aa2/AA− | | $ | 4,600,000 | |
| | | | | State, GO, Ser. A, | | | | | | |
| | 8,600 | | | 4.631%, 4/1/33 | | Aaa/AA+ | | | 8,406,328 | |
| | 17,500 | | | 4.681%, 4/1/40 | | Aaa/AA+ | | | 16,610,475 | |
| | 700 | | | State, Mobility Fund, GO, 4.75%, 4/1/37 | | Aaa/AA+ | | | 721,126 | |
| | 52,100 | | | State Transportation Commission Rev.,
5.178%, 4/1/30, Ser. B | | Aaa/AAA | | | 53,822,426 | |
| | | | | | | | | | | |
| | | | | | | | | | 137,146,923 | |
| | | | | | | | | | | |
| | | | | Total Municipal Bonds (cost–$402,717,024) | | | | | 398,699,776 | |
| | | | | | | | | | | |
| | | | | | | | | | | |
| | | | | | | | | | | |
SOVEREIGN DEBT OBLIGATIONS–9.6% |
| | | | | Canada–7.3% | | | | | | |
| CAD | 44,600 | | | Canada Housing Trust No. 1, 2.45%, 12/15/15 (a)(d) | | Aaa/AAA | | | 44,350,627 | |
| CAD | 198,000 | | | Canadian Government Bond, 2.50%, 6/1/15 | | Aaa/AAA | | | 199,982,841 | |
| | | | | | | | | | | |
| | | | | | | | | | 244,333,468 | |
| | | | | | | | | | | |
| | | | | China–0.3% | | | | | | |
| | | | | Export-Import Bank of China, | | | | | | |
| $ | 3,350 | | | 4.875%, 7/21/15 | | A1/A+ | | | 3,725,170 | |
| | 4,050 | | | 4.875%, 7/21/15 (a)(d) | | A1/A+ | | | 4,521,173 | |
| | | | | | | | | | | |
| | | | | | | | | | 8,246,343 | |
| | | | | | | | | | | |
| | | | | Korea (Republic of)–0.7% | | | | | | |
| | 21,900 | | | Export-Import Bank of Korea, 5.125%, 6/29/20 | | A1/A | | | 23,779,370 | |
| | | | | | | | | | | |
| | | | | Mexico–0.4% | | | | | | |
| | 12,600 | | | Mexico Government International Bond,
6.05%, 1/11/40 | | Baa1/BBB | | | 14,553,000 | |
| | | | | | | | | | | |
| | | | | Qatar–0.9% | | | | | | |
| | | | | Qatar Government International Bond, | | | | | | |
| | 3,900 | | | 4.00%, 1/20/15 (a)(d) | | Aa2/AA | | | 4,129,125 | |
| | 7,900 | | | 5.25%, 1/20/20 (a)(d) | | Aa2/AA | | | 8,749,250 | |
| | 4,600 | | | 6.40%, 1/20/40 (a)(d) | | Aa2/AA | | | 5,336,000 | |
| | 9,500 | | | 6.55%, 4/9/19 | | Aa2/AA | | | 11,411,875 | |
| | | | | | | | | | | |
| | | | | | | | | | 29,626,250 | |
| | | | | | | | | | | |
| | | | | Total Sovereign Debt Obligations (cost–$306,202,889) | | | | | 320,538,431 | |
| | | | | | | | | | | |
| | | | | | | | | | | |
| | | | | | | | | | | |
ASSET-BACKED SECURITIES–1.5% |
| | 856 | | | Aames Mortgage Investment Trust, 0.656%, 10/25/35, FRN | | NR/AAA | | | 828,825 | |
| | 336 | | | Access Group, Inc., 1.588%, 10/27/25, FRN | | Aaa/NR | | | 344,935 | |
| | 102 | | | Accredited Mortgage Loan Trust, 0.306%, 2/25/37, FRN | | Aa3/AAA | | | 101,456 | |
10.31.10 ï Allianz Global Investors Managed Accounts Trust Annual Report 59
Fixed Income SHares: Series M Schedule of Investments
October 31, 2010 (continued)
| | | | | | | | | | | |
Principal
| | | | | | | | |
Amount
| | | | | Credit Rating
| | | |
| (000s) | | | | | (Moody’s/S&P)* | | Value | |
| $ | 61 | | | Amortizing Residential Collateral Trust,
0.526%, 6/25/32, FRN | | NR/AAA | | $ | 52,669 | |
| | 1,041 | | | Bayview Financial Asset Trust, 0.656%, 12/25/39, FRN (a)(d)(g) | | Ba1/NR | | | 748,527 | |
| | | | | Bear Stearns Asset-Backed Securities Trust, FRN, | | | | | | |
| | 590 | | | 0.336%, 10/25/36 | | B3/NR | | | 552,012 | |
| | 3,519 | | | 0.846%, 6/25/43 | | Aaa/AAA | | | 3,192,304 | |
| | 66 | | | Cendant Mortgage Corp., 5.985%, 7/25/43, VRN (a)(d) | | NR/NR | | | 60,516 | |
| | 2,241 | | | Chase Issuance Trust, 0.296%, 4/15/13, FRN | | Aaa/AAA | | | 2,240,699 | |
| | | | | Conseco Financial Corp., | | | | | | |
| | 4,082 | | | 6.18%, 4/1/30 | | Ba3/NR | | | 4,273,764 | |
| | 3,115 | | | 6.81%, 12/1/28, VRN | | Ba1/BBB | | | 3,313,515 | |
| | 994 | | | 6.87%, 4/1/30, VRN | | Ba3/NR | | | 1,046,736 | |
| | 1,000 | | | 7.06%, 2/1/31, VRN | | NR/CCC− | | | 1,000,298 | |
| | 474 | | | 7.40%, 6/15/27 | | A2/AA | | | 494,271 | |
| | 311 | | | 7.55%, 1/15/29, VRN | | NR/A+ | | | 334,309 | |
| | | | | Countrywide Asset-Backed Certificates, FRN, | | | | | | |
| | 4,015 | | | 0.346%, 1/25/46 | | A3/A+ | | | 3,790,490 | |
| | 605 | | | 0.356%, 9/25/47 | | Ba1/AAA | | | 587,279 | |
| | 343 | | | 0.726%, 11/25/33 (a)(d) | | Aaa/AAA | | | 301,313 | |
| | 1,019 | | | 0.736%, 12/25/31 | | A2/B− | | | 515,085 | |
| | 862 | | | Credit-Based Asset Servicing and Securitization LLC, | | | | | | |
| | | | | 1.156%, 11/25/33, FRN | | Aaa/AAA | | | 786,677 | |
| | 100 | | | Delta Funding Home Equity Loan Trust,
0.576%, 8/15/30, FRN | | NR/AAA | | | 68,097 | |
| | 1,646 | | | Denver Arena Trust, 6.94%, 11/15/19 (a)(d) | | NR/NR | | | 1,512,323 | |
| | 41 | | | EMC Mortgage Loan Trust, 0.626%, 5/25/40, FRN (a)(d) | | Aaa/NR | | | 32,540 | |
| | 5,730 | | | First Franklin Mortgage Loan Asset-Backed Certificates, 0.656%, 4/25/35, FRN | | Aa1/AA+ | | | 5,465,214 | |
| | 6 | | | First Plus Home Loan Trust, 7.32%, 11/10/23 (g) | | NR/D | | | 5,944 | |
| | 35 | | | Fremont Home Loan Owner Trust, 1.046%, 12/25/29, FRN | | A2/BB | | | 21,909 | |
| | 528 | | | Fremont Home Loan Trust, 0.316%, 1/25/37, FRN | | Caa2/CCC | | | 477,092 | |
| | 55 | | | HSI Asset Securitization Corp. Trust,
0.306%, 12/25/36, FRN | | Caa2/CCC | | | 54,108 | |
| | | | | Lehman XS Trust, FRN, | | | | | | |
| | 2,862 | | | 0.406%, 4/25/37 | | Caa1/CCC | | | 2,012,072 | |
| | 321 | | | 0.486%, 8/25/46 | | C/D | | | 28,811 | |
| | 583 | | | 0.496%, 11/25/46 | | C/CCC | | | 131,267 | |
| | 1,324 | | | Long Beach Mortgage Loan Trust, 1.681%, 3/25/32, FRN | | Baa2/NR | | | 863,791 | |
| | 500 | | | Madison Avenue Manufactured Housing Contract, 1.706%, 3/25/32, FRN | | Baa1/A+ | | | 484,065 | |
| | 1,594 | | | Mesa Trust Asset-Backed Certificates,
1.056%, 12/25/31, FRN (a)(d) | | Aaa/A | | | 1,272,812 | |
60 Allianz Global Investors Managed Accounts Trust Annual Report ï 10.31.10
Fixed Income SHares: Series M Schedule of Investments
October 31, 2010 (continued)
| | | | | | | | | | | |
Principal
| | | | | | | | |
Amount
| | | | | Credit Rating
| | | |
| (000s) | | | | | (Moody’s/S&P)* | | Value | |
| $ | 1,352 | | | Mid-State Trust, 6.005%, 8/15/37 | | Aa2/AAA | | $ | 1,398,633 | |
| | | | | Morgan Stanley Mortgage Loan Trust, FRN, | | | | | | |
| | 338 | | | 0.486%, 2/25/37 | | Caa3/CCC | | | 156,989 | |
| | 572 | | | 0.616%, 4/25/37 | | Ca/CCC | | | 285,193 | |
| | 200 | | | RAAC Series, 0.656%, 6/25/47, FRN | | Ca/CCC | | | 92,750 | |
| | | | | Residential Asset Mortgage Products, Inc., | | | | | | |
| | 3,096 | | | 5.634%, 1/25/34 | | Aa3/AAA | | | 2,906,029 | |
| | 2,000 | | | 5.741%, 7/25/34 | | B3/CC | | | 726,751 | |
| | | | | Residential Asset Securities Corp., | | | | | | |
| | 2,716 | | | 0.686%, 3/25/35, FRN | | Caa3/A | | | 1,784,594 | |
| | 317 | | | 7.14%, 4/25/32, VRN | | Ca/D | | | 17,478 | |
| | 893 | | | SACO I, Inc., 1.016%, 11/25/35, FRN | | B2/AA | | | 450,497 | |
| | 6 | | | Saxon Asset Securities Trust, 0.776%, 8/25/32, FRN | | Aaa/AAA | | | 5,700 | |
| | | | | South Carolina Student Loan Corp., FRN, | | | | | | |
| | 2,746 | | | 0.847%, 3/1/18 | | Aaa/AAA | | | 2,697,692 | |
| | 3,600 | | | 1.047%, 3/2/20 | | Aaa/AAA | | | 3,574,296 | |
| | 600 | | | 1.297%, 9/3/24 | | Aaa/AAA | | | 594,486 | |
| | | | | | | | | | | |
| | | | | Total Asset-Backed Securities (cost–$57,344,883) | | | | | 51,686,813 | |
| | | | | | | | | | | |
| Shares | | | | | | | | |
CONVERTIBLE PREFERRED STOCK–0.4% |
| | | | | Financial Services–0.4% | | | | | | |
| | 11,800 | | | Wells Fargo & Co., 7.50%, 3/15/13, Ser. L (i) | | Ba1/A− | | | 11,800,000 | |
| | | | | | | | | | | |
| | | | | Insurance–0.0% | | | | | | |
| | 228,667 | | | American International Group, Inc., 8.50%, 8/1/11 | | Ba2/NR | | | 1,680,703 | |
| | | | | | | | | | | |
| | | | | Total Convertible Preferred Stock (cost–$27,918,940) | | | | | 13,480,703 | |
| | | | | | | | | | | |
Principal
| | | | | | | | |
Amount
| | | | | | | | |
| (000s) | | | | | | | | |
SHORT-TERM INVESTMENTS–1.0% |
| | | | | U.S. Treasury Bills (k)(q)–0.5% | | | | | | |
| $ | 15,899 | | | 0.118%-0.187%, 12/2/10-1/27/11 (cost–$15,894,666) | | | | | 15,895,644 | |
| | | | | | | | | | | |
| | | | | Corporate Notes–0.1% | | | | | | |
| | | | | Financial Services–0.1% | | | | | | |
| | 1,900 | | | JPMorgan Chase & Co., 1.043%, 6/13/11, FRN | | Aa3/A+ | | | 1,909,075 | |
| | | | | | | | | | | |
| | | | | Insurance–0.0% | | | | | | |
| € | 1,300 | | | American International Group, Inc., 4.00%, 9/20/11 | | A3/A− | | | 1,820,449 | |
| | | | | | | | | | | |
| | | | | Total Corporate Notes (cost–$3,342,052) | | | | | 3,729,524 | |
| | | | | | | | | | | |
| | | | | U.S. Government Agency Securities–0.0% | | | | | | |
| $ | 254 | | | Freddie Mac, 0.362%, 3/9/11, FRN (cost–$254,190) | | Aaa/AAA | | | 254,151 | |
| | | | | | | | | | | |
10.31.10 ï Allianz Global Investors Managed Accounts Trust Annual Report 61
Fixed Income SHares: Series M Schedule of Investments
October 31, 2010 (continued)
| | | | | | | | | | | |
Principal
| | | | | | | | |
Amount
| | | | | | | | |
| (000s) | | | | | | | Value | |
| | | | | Repurchase Agreement–0.4% | | | | | | |
| $ | 11,958 | | | State Street Bank & Trust Co., dated 10/29/10, 0.01%, due 11/1/10, proceeds $11,958,010; collateralized by U.S. Treasury Notes, 2.125%, due 5/31/15, valued at $12,197,735 including accrued interest (cost–$11,958,000) | | | | $ | 11,958,000 | |
| | | | | | | | | | | |
| | | | | Total Short-Term Investments (cost–$31,448,908) | | | | | 31,837,319 | |
| | | | | | | | | | | |
| | | | | Total Investments before options written and securities sold short (cost–$5,507,028,515)–166.5% | | | | | 5,578,978,983 | |
| | | | | | | | | | | |
| | | | | | | | |
Notional
| | | | | | | | |
| Amount | | | | | | | | |
OPTIONS WRITTEN (l)–(0.3)% |
| | | | | Straddle Options–(0.3)% | | | | | | |
| | | | | Call & Put 1-Year vs. 1-Year Forward Volatility Agreement (OTC), | | | | | | |
| $ | 220,800,000 | | | exercise price $0.010, expires 10/11/11 | | | | | (1,252,751 | ) |
| | | | | Call & Put 1-Year vs. 2-Year Forward Volatility Agreement (OTC), | | | | | | |
| $ | 384,900,000 | | | exercise price $0.001, expires 10/11/11 | | | | | (4,102,726 | ) |
| $ | 254,100,000 | | | exercise price $0.001, expires 11/14/11 | | | | | (2,664,752 | ) |
| | | | | | | | | | | |
| | | | | Total Options Written (premiums received–$8,209,618) | | | | | (8,020,229 | ) |
| | | | | | | | | | | |
Principal
| | | | | | | | |
Amount
| | | | | | | | |
| (000s) | | | | | | | | |
SECURITIES SOLD SHORT–(0.5)% |
| | | | | U.S. Treasury Obligations–(0.5)% | | | | | | |
| $ | 16,300 | | | U.S. Treasury Notes, 1.25%, 9/30/15 (e) (proceeds received–$16,330,562) | | | | | (16,380,229 | ) |
| | | | | | | | | | | |
| | | | | Total Investments net of options written and securities sold short (cost–$5,482,488,335) | | 165.7% | | | 5,554,578,525 | |
| | | | | | | | | | | |
| | | | | Other liabilities in excess of other assets | | (65.7) | | | (2,203,174,033 | ) |
| | | | | | | | | | | |
| | | | | Net Assets | | 100.0% | | $ | 3,351,404,492 | |
| | | | | | | | | | | |
62 Allianz Global Investors Managed Accounts Trust Annual Report ï 10.31.10
Fixed Income SHares: Series R Schedule of Investments
October 31, 2010
| | | | | | | | | | | |
Principal
| | | | | | | | |
Amount
| | | | | Credit Rating
| | | |
| (000s) | | | | | (Moody’s/S&P)* | | Value | |
U.S. TREASURY OBLIGATIONS–134.2% |
| | | | | U.S. Treasury Inflation Indexed Bonds (j)–43.4% | | | | | | |
| $ | 22,716 | | | 1.75%, 1/15/28 (k) | | | | $ | 25,190,317 | |
| | 25,740 | | | 2.00%, 1/15/26 (e)(k) | | | | | 29,483,881 | |
| | 10,706 | | | 2.125%, 2/15/40 | | | | | 12,581,345 | |
| | 50,138 | | | 2.375%, 1/15/25 (e)(k) | | | | | 59,899,394 | |
| | 5,521 | | | 2.375%, 1/15/27 | | | | | 6,641,722 | |
| | 10,676 | | | 2.50%, 1/15/29 | | | | | 13,172,582 | |
| | 13,632 | | | 3.625%, 4/15/28 | | | | | 18,993,306 | |
| | 6,374 | | | 3.875%, 4/15/29 | | | | | 9,246,874 | |
| | | | | | | | | | | |
| | | | | | | | | | 175,209,421 | |
| | | | | | | | | | | |
| | | | | U.S. Treasury Inflation Indexed Notes (j)–90.6% | | | | | | |
| | 1,032 | | | 1.25%, 4/15/14 | | | | | 1,095,778 | |
| | 114,546 | | | 1.25%, 7/15/20 (e)(k) | | | | | 123,127,620 | |
| | 707 | | | 1.375%, 1/15/20 | | | | | 768,158 | |
| | 12,690 | | | 1.625%, 1/15/15 | | | | | 13,757,081 | |
| | 1,459 | | | 1.625%, 1/15/18 | | | | | 1,613,389 | |
| | 22,466 | | | 1.875%, 7/15/13 (e)(k) | | | | | 24,036,451 | |
| | 33,458 | | | 1.875%, 7/15/15 (e) | | | | | 36,952,404 | |
| | 29,547 | | | 2.00%, 1/15/14 (e) | | | | | 31,984,357 | |
| | 53,880 | | | 2.00%, 7/15/14 (e)(k) | | | | | 58,939,420 | |
| | 1,980 | | | 2.00%, 1/15/16 | | | | | 2,206,685 | |
| | 14,722 | | | 2.375%, 1/15/17 | | | | | 16,885,442 | |
| | 24,754 | | | 2.50%, 7/15/16 (e) | | | | | 28,525,566 | |
| | 20,646 | | | 2.625%, 7/15/17 (e)(k) | | | | | 24,241,031 | |
| | 1,229 | | | 3.375%, 1/15/12 | | | | | 1,287,444 | |
| | | | | | | | | | | |
| | | | | | | | | | 365,420,826 | |
| | | | | | | | | | | |
| | | | | U.S. Treasury Notes–0.2% | | | | | | |
| | 320 | | | 0.375%, 8/31/12 (k) | | | | | 320,250 | |
| | 300 | | | 0.625%, 6/30/12 | | | | | 301,547 | |
| | | | | | | | | | | |
| | | | | | | | | | 621,797 | |
| | | | | | | | | | | |
| | | | | Total U.S. Treasury Obligations (cost–$527,609,053) | | | | | 541,252,044 | |
| | | | | | | | | | | |
| | | | | | | | | | | |
| | | | | | | | | | | |
CORPORATE BONDS & NOTES–23.8% |
| | | | | Airlines–1.3% | | | | | | |
| | 5,000 | | | Continental Airlines, Inc., 6.75%, 9/15/15 (a)(d) | | Ba2/BB− | | | 5,231,250 | |
| | | | | | | | | | | |
| | | | | Banking–2.8% | | | | | | |
| | 1,500 | | | American Express Bank FSB, 0.385%, 5/29/12, FRN | | A2/BBB+ | | | 1,486,197 | |
10.31.10 ï Allianz Global Investors Managed Accounts Trust Annual Report 63
Fixed Income SHares: Series R Schedule of Investments
October 31, 2010 (continued)
| | | | | | | | | | | |
Principal
| | | | | | | | |
Amount
| | | | | Credit Rating
| | | |
| (000s) | | | | | (Moody’s/S&P)* | | Value | |
| | | | | Banking (continued) | | | | | | |
| | | | | | | | | | | |
| $ | 1,300 | | | Banco Santander Chile, 1.539%, 4/20/12, FRN (a)(d) | | Aa3/A+ | | $ | 1,300,099 | |
| | | | | Barclays Bank PLC (a)(d), | | | | | | |
| | 100 | | | 7.434%, 12/15/17 (i) | | Baa2/A− | | | 102,500 | |
| | 720 | | | 10.179%, 6/12/21 | | Baa1/A | | | 961,313 | |
| | 1,500 | | | ING Bank NV, 1.089%, 3/30/12, FRN (a)(d) | | Aa3/A+ | | | 1,495,632 | |
| | 700 | | | National Australia Bank Ltd., 5.35%, 6/12/13 (a)(d) | | Aa1/AA | | | 769,203 | |
| | | | | Royal Bank of Scotland PLC, | | | | | | |
| | 4,200 | | | 2.759%, 8/23/13, FRN | | Aa3/A+ | | | 4,304,475 | |
| | 800 | | | 3.00%, 12/9/11 (a)(d) | | Aaa/AAA | | | 820,793 | |
| | | | | | | | | | | |
| | | | | | | | | | 11,240,212 | |
| | | | | | | | | | | |
| | | | | Chemicals–0.3% | | | | | | |
| | 1,000 | | | RPM International, Inc., 6.50%, 2/15/18 | | Baa3/BBB− | | | 1,109,949 | |
| | | | | | | | | | | |
| | | | | Financial Services–11.4% | | | | | | |
| | | | | Ally Financial, Inc., | | | | | | |
| | 500 | | | 6.00%, 12/15/11 | | B3/B | | | 517,500 | |
| | 2,400 | | | 6.625%, 5/15/12 | | B3/B | | | 2,517,000 | |
| | | | | American Express Credit Corp., | | | | | | |
| | 200 | | | 5.875%, 5/2/13 | | A2/BBB+ | | | 220,266 | |
| | 580 | | | 7.30%, 8/20/13 | | A2/BBB+ | | | 663,680 | |
| | | | | Bank of America Corp., | | | | | | |
| £ | 4,800 | | | 0.826%, 6/11/12, FRN | | A2/A | | | 7,463,676 | |
| $ | 1,400 | | | 5.375%, 6/15/14 | | A2/A | | | 1,520,261 | |
| | | | | Citigroup, Inc., | | | | | | |
| | 4,700 | | | 2.384%, 8/13/13, FRN | | A3/A | | | 4,741,980 | |
| | 2,300 | | | 6.125%, 5/15/18 | | A3/A | | | 2,568,691 | |
| | 4,400 | | | Ford Motor Credit Co. LLC, 7.50%, 8/1/12 | | Ba2/B+ | | | 4,726,726 | |
| € | 700 | | | Goldman Sachs Group, Inc., 5.375%, 2/15/13 | | A1/A | | | 1,025,372 | |
| | | | | International Lease Finance Corp., | | | | | | |
| $ | 1,000 | | | 5.625%, 9/20/13 | | B1/BB+ | | | 1,011,250 | |
| | 500 | | | 6.50%, 9/1/14 (a)(d) | | Ba3/BBB− | | | 542,500 | |
| | 500 | | | 6.75%, 9/1/16 (a)(d) | | Ba3/BBB− | | | 547,500 | |
| | 900 | | | 7.125%, 9/1/18 (a)(d) | | Ba3/BBB− | | | 994,500 | |
| | 100 | | | Lehman Brothers Holdings, Inc., 6.20%, 9/26/14 (f) | | WR/NR | | | 22,250 | |
| | | | | Merrill Lynch & Co., Inc., | | | | | | |
| € | 5,000 | | | 1.18%, 6/29/12, FRN | | A2/A | | | 6,743,012 | |
| $ | 400 | | | 5.45%, 7/15/14 | | A2/A | | | 427,906 | |
| | | | | Morgan Stanley, FRN, | | | | | | |
| | 500 | | | 0.739%, 10/18/16 | | A2/A | | | 445,545 | |
| € | 1,500 | | | 1.377%, 4/13/16 | | A2/A | | | 1,868,775 | |
64 Allianz Global Investors Managed Accounts Trust Annual Report ï 10.31.10
Fixed Income SHares: Series R Schedule of Investments
October 31, 2010 (continued)
| | | | | | | | | | | |
Principal
| | | | | | | | |
Amount
| | | | | Credit Rating
| | | |
| (000s) | | | | | (Moody’s/S&P)* | | Value | |
| | | | | Financial Services (continued) | | | | | | |
| | | | | | | | | | | |
| | | | | SLM Corp., | | | | | | |
| $ | 590 | | | 3.235%, 3/17/14, FRN | | Ba1/BBB− | | $ | 511,884 | |
| | 500 | | | 5.05%, 11/14/14 | | Ba1/BBB− | | | 494,170 | |
| | 4,500 | | | UBS AG, 1.439%, 2/23/12, FRN | | Aa3/A+ | | | 4,537,242 | |
| | 1,500 | | | Wachovia Corp., 2.236%, 5/1/13, FRN | | A1/AA− | | | 1,544,001 | |
| | 400 | | | Wells Fargo Capital XIII, 7.70%, 3/26/13 (i) | | Ba1/A− | | | 417,000 | |
| | | | | | | | | | | |
| | | | | | | | | | 46,072,687 | |
| | | | | | | | | | | |
| | | | | Food & Beverage–0.4% | | | | | | |
| | 1,500 | | | FBG Finance Ltd., 5.125%, 6/15/15 (a)(d) | | Baa2/BBB | | | 1,662,691 | |
| | | | | | | | | | | |
| | | | | Hotels/Gaming–0.8% | | | | | | |
| | 2,900 | | | Starwood Hotels & Resorts Worldwide, Inc.,
6.25%, 2/15/13 | | Ba1/BB+ | | | 3,103,000 | |
| | | | | | | | | | | |
| | | | | Insurance–3.4% | | | | | | |
| | 2,445 | | | American International Group, Inc., | | | | | | |
| | | | | 8.175%, 5/15/68, (converts to FRN on 5/15/38) | | Ba2/BBB | | | 2,622,262 | |
| | 3,000 | | | Marsh & McLennan Cos., Inc., 9.25%, 4/15/19 | | Baa2/BBB− | | | 3,909,753 | |
| | | | | New York Life Global Funding, | | | | | | |
| € | 5,000 | | | 0.999%, 12/20/13, FRN | | Aaa/AAA | | | 6,771,227 | |
| $ | 300 | | | 4.65%, 5/9/13 (a)(d) | | Aaa/AAA | | | 325,566 | |
| | 200 | | | Pacific Life Global Funding, 5.15%, 4/15/13 (a)(d) | | A1/A+ | | | 216,312 | |
| | | | | | | | | | | |
| | | | | | | | | | 13,845,120 | |
| | | | | | | | | | | |
| | | | | Metals & Mining–1.0% | | | | | | |
| | 4,000 | | | Gerdau Trade, Inc., 5.75%, 1/30/21 (a)(d) | | NR/BBB− | | | 4,165,000 | |
| | | | | | | | | | | |
| | | | | Multi-Media–1.3% | | | | | | |
| | 5,000 | | | DISH DBS Corp., 6.625%, 10/1/14 | | Ba3/BB− | | | 5,306,250 | |
| | | | | | | | | | | |
| | | | | Oil & Gas–1.1% | | | | | | |
| | 1,200 | | | DCP Midstream Operating L.P., 3.25%, 10/1/15 | | NR/BBB− | | | 1,212,214 | |
| | 200 | | | Gaz Capital S.A. for Gazprom, 8.146%, 4/11/18 (a)(d) | | Baa1/BBB | | | 232,250 | |
| | 600 | | | Petroleos Mexicanos, 5.50%, 1/21/21 | | Baa1/BBB | | | 655,320 | |
| | 2,100 | | | Transocean, Inc., 4.95%, 11/15/15 | | Baa3/BBB | | | 2,227,936 | |
| | | | | | | | | | | |
| | | | | | | | | | 4,327,720 | |
| | | | | | | | | | | |
| | | | | Total Corporate Bonds & Notes (cost–$90,033,497) | | | | | 96,063,879 | |
| | | | | | | | | | | |
| | | | | | | | | | | |
| | | | | | | | | | | |
MORTGAGE-BACKED SECURITIES–5.8% |
| | 2,000 | | | Arkle Master Issuer PLC, 1.519%, 5/17/60, CMO, FRN (a)(d) | | Aaa/AAA | | | 1,992,656 | |
| € | 400 | | | Arran Residential Mortgages Funding PLC,
2.203%, 5/16/47, CMO, FRN (a)(d) | | Aaa/NR | | | 556,045 | |
10.31.10 ï Allianz Global Investors Managed Accounts Trust Annual Report 65
Fixed Income SHares: Series R Schedule of Investments
October 31, 2010 (continued)
| | | | | | | | | | | |
Principal
| | | | | | | | |
Amount
| | | | | Credit Rating
| | | |
| (000s) | | | | | (Moody’s/S&P)* | | Value | |
| | | | | Bear Stearns Adjustable Rate Mortgage Trust, CMO, FRN, | | | | | | |
| $ | 46 | | | 2.34%, 8/25/35 | | A1/AAA | | $ | 44,378 | |
| | 79 | | | 2.40%, 8/25/35 | | Baa2/AAA | | | 75,073 | |
| | 137 | | | 2.76%, 3/25/35 | | Ba2/AAA | | | 130,859 | |
| | 43 | | | 2.934%, 3/25/35 | | A1/AAA | | | 41,635 | |
| | | | | Citigroup Mortgage Loan Trust, Inc., CMO, | | | | | | |
| | 54 | | | 2.51%, 8/25/35, FRN | | B1/AA | | | 50,577 | |
| | 91 | | | 2.56%, 8/25/35, FRN | | B3/AA | | | 81,714 | |
| | 1,156 | | | 5.851%, 9/25/37, VRN | | NR/CCC | | | 863,766 | |
| | 1,000 | | | Citigroup/Deutsche Bank Commercial Mortgage Trust, | | | | | | |
| | | | | 5.205%, 12/11/49, CMO | | Aaa/AAA | | | 1,042,948 | |
| | 5,500 | | | Commercial Mortgage Pass Through Certificates,
3.156%, 11/1/15, CMO (a)(d)(e)(g) | | Aaa/NR | | | 5,663,219 | |
| | | | | Countrywide Alternative Loan Trust, CMO, FRN, | | | | | | |
| | 2,757 | | | 0.451%, 12/20/46 | | Caa1/CCC | | | 1,355,390 | |
| | 728 | | | 1.353%, 2/25/36 | | B2/CCC | | | 483,785 | |
| | | | | Countrywide Home Loan Mortgage Pass Through Trust, CMO, | | | | | | |
| | 36 | | | 0.596%, 6/25/35, FRN (a)(d) | | Aa3/AAA | | | 31,321 | |
| | 1,359 | | | 3.068%, 4/20/35, VRN | | Aa1/AAA | | | 1,313,628 | |
| | 244 | | | Granite Master Issuer PLC, 0.296%, 12/20/54, CMO, FRN | | Aaa/AAA | | | 227,572 | |
| | 178 | | | GSR Mortgage Loan Trust, 2.895%, 9/25/35, CMO, FRN | | NR/AAA | | | 171,684 | |
| | 1,228 | | | MLCC Mortgage Investors, Inc., 2.009%, 10/25/35, CMO, FRN | | Baa1/AAA | | | 1,119,536 | |
| | 5,800 | | | Permanent Master Issuer PLC, 0.399%, 7/15/33, CMO, FRN | | Aaa/AAA | | | 5,647,245 | |
| | 471 | | | Residential Accredit Loans, Inc., 0.436%, 6/25/46, CMO, FRN | | Caa1/CCC | | | 194,421 | |
| AUD | 1,687 | | | Swan, 5.93%, 4/25/41, CMO, FRN | | NR/AAA | | | 1,662,000 | |
| $ | 500 | | | Wachovia Bank Commercial Mortgage Trust,
5.088%, 8/15/41, CMO, VRN | | Aaa/AAA | | | 542,663 | |
| | | | | | | | | | | |
| | | | | | | | | | | |
| | | | | Total Mortgage-Backed Securities (cost–$23,444,502) | | | | | 23,292,115 | |
| | | | | | | | | | | |
| | | | | | | | | | | |
| | | | | | | | | | | |
ASSET-BACKED SECURITIES–5.1% |
| | 1,100 | | | AMMC CDO, 0.526%, 8/8/17, FRN (a)(d)(g) | | Aaa/AAA | | | 1,055,618 | |
| | 791 | | | ARES CLO Funds, 0.52%, 3/12/18, FRN (a)(d)(g) | | Aaa/AAA | | | 750,677 | |
| | 409 | | | Bear Stearns Asset-Backed Securities Trust,
1.256%, 10/25/37, FRN | | Caa2/BBB | | | 329,988 | |
| | 789 | | | Citigroup Mortgage Loan Trust, Inc., 0.336%, 1/25/37, FRN | | Caa2/B− | | | 637,513 | |
| | 509 | | | Clearwater Funding CBO, 1.133%, 7/15/13, FRN (a)(d)(g) | | Aaa/AA− | | | 490,649 | |
| CAD | 6,827 | | | Ford Auto Securitization Trust, 1.926%, 6/15/13 (a)(d)(g) | | NR/AAA | | | 6,700,325 | |
| € | 2,863 | | | Globaldrive BV, 3.00%, 7/20/15 (g) | | NR/AAA | | | 3,977,771 | |
| $ | 531 | | | JPMorgan Mortgage Acquisition Corp., 0.746%, 7/25/35, FRN | | Baa3/AA | | | 506,186 | |
66 Allianz Global Investors Managed Accounts Trust Annual Report ï 10.31.10
Fixed Income SHares: Series R Schedule of Investments
October 31, 2010 (continued)
| | | | | | | | | | | |
Principal
| | | | | | | | |
Amount
| | | | | Credit Rating
| | | |
| (000s) | | | | | (Moody’s/S&P)* | | Value | |
| € | 404 | | | Magnolia Funding Ltd., 3.00%, 4/20/17 (a)(d) | | NR/NR | | $ | 563,094 | |
| $ | 309 | | | Massachusetts Educational Financing Auth.,
1.238%, 4/25/38, FRN | | Aaa/AAA | | | 310,240 | |
| | 4,800 | | | Navigare Funding CLO Ltd., 0.605%, 5/20/19, FRN (a)(d)(g) | | Aaa/AA+ | | | 4,459,984 | |
| | 431 | | | Park Place Securities, Inc., 0.676%, 6/25/35, FRN | | Aa1/AAA | | | 399,253 | |
| € | 298 | | | Wood Street CLO BV, 1.388%, 3/29/21, FRN (a)(b)(d)(g)(n) (acquisition cost-$341,367; purchased 8/24/10) | | Aa1/AA | | | 383,451 | |
| | | | | | | | | | | |
| | | | | | | | | | | |
| | | | | Total Asset-Backed Securities (cost–$20,424,109) | | | | | 20,564,749 | |
| | | | | | | | | | | |
| | | | | | | | | | | |
| | | | | | | | | | | |
SOVEREIGN DEBT OBLIGATIONS (j)–4.1% |
| | | | | Australia–3.1% | | | | | | |
| | | | | Australia Government Bond, | | | | | | |
| AUD | 4,000 | | | 3.00%, 9/20/25, Ser. 25-CI | | Aaa/NR | | | 4,279,847 | |
| AUD | 1,500 | | | 4.00%, 8/20/15, Ser. 15-CI | | Aaa/NR | | | 2,473,283 | |
| AUD | 1,500 | | | 4.00%, 8/20/20, Ser. 20-CI | | Aaa/NR | | | 2,415,197 | |
| AUD | 3,400 | | | New South Wales Treasury Corp., 2.75%, 11/20/25 | | Aaa/AAA | | | 3,420,582 | |
| | | | | | | | | | | |
| | | | | | | | | | 12,588,909 | |
| | | | | | | | | | | |
| | | | | Canada–1.0% | | | | | | |
| | | | | Canadian Government Bond, | | | | | | |
| CAD | 1,586 | | | 3.00%, 12/1/36 | | Aaa/AAA | | | 2,223,499 | |
| CAD | 1,264 | | | 4.25%, 12/1/21, Ser. L-256 | | Aaa/AAA | | | 1,701,218 | |
| | | | | | | | | | | |
| | | | | | | | | | 3,924,717 | |
| | | | | | | | | | | |
| | | | | Total Sovereign Debt Obligations (cost–$14,840,968) | | | | | 16,513,626 | |
| | | | | | | | | | | |
| | | | | | | | | | | |
| | | | | | | | | | | |
U.S. GOVERNMENT AGENCY SECURITIES–0.7% |
| | | | | Fannie Mae–0.3% | | | | | | |
| $ | 953 | | | 0.701%, 2/25/37, CMO, FRN | | Aaa/AAA | | | 953,602 | |
| | 16 | | | 1.57%, 10/1/44, FRN, MBS | | Aaa/AAA | | | 15,835 | |
| | | | | | | | | | | |
| | | | | | | | | | 969,437 | |
| | | | | | | | | | | |
| | | | | Freddie Mac–0.1% | | | | | | |
| | 212 | | | 6.32%, 9/1/36, FRN, MBS | | Aaa/AAA | | | 224,344 | |
| | 253 | | | 6.621%, 7/1/36, FRN, MBS | | Aaa/AAA | | | 267,482 | |
| | | | | | | | | | | |
| | | | | | | | | | 491,826 | |
| | | | | | | | | | | |
| | | | | SLM Student Loan Trust–0.3% | | | | | | |
| | 1,314 | | | 2.176%, 8/15/16, ABS, FRN (a)(d) | | Aaa/AAA | | | 1,313,981 | |
| | | | | | | | | | | |
| | | | | Total U.S. Government Agency Securities (cost–$2,738,393) | | | | | 2,775,244 | |
| | | | | | | | | | | |
| | | | | | | | | | | |
| | | | | | | | | | | |
10.31.10 ï Allianz Global Investors Managed Accounts Trust Annual Report 67
Fixed Income SHares: Series R Schedule of Investments
October 31, 2010 (continued)
| | | | | | | | | | | |
Principal
| | | | | | | | |
Amount
| | | | | Credit Rating
| | | |
| (000s) | | | | | (Moody’s/S&P)* | | Value | |
SENIOR LOANS (a)(b)(c)(n)–0.1% |
| | | | | Telecommunications–0.1% | | | | | | |
| $ | 400 | | | Vodafone, 6.875%, 8/11/15 (acquisition cost–$397,340; purchased 8/11/10) (cost–$397,397) | | | | $ | 395,000 | |
| | | | | | | | | | | |
| Shares | | | | | | | | |
CONVERTIBLE PREFERRED STOCK–0.0% |
| | | | | Financial Services–0.0% | | | | | | |
| | 200 | | | Wells Fargo & Co., 7.50%, 3/15/13, Ser. L (i) (cost–$200,000) | | Ba1/A− | | | 200,000 | |
| | | | | | | | | | | |
Principal
| | | | | | | | |
Amount
| | | | | | | | |
| (000s) | | | | | | | | |
MUNICIPAL BONDS–0.0% |
| | | | | West Virginia–0.0% | | | | | | |
| $ | 100 | | | Tobacco Settlement Finance Auth. Rev., 7.467%, 6/1/47, Ser. A (cost–$94,080) | | Baa3/BBB | | | 77,847 | |
| | | | | | | | | | | |
| | | | | | | | | | | |
| | | | | | | | | | | |
SHORT-TERM INVESTMENTS–3.3% |
| | | | | Corporate Notes–2.0% | | | | | | |
| | | | | Building & Construction–0.4% | | | | | | |
| | 1,400 | | | Pulte Homes, Inc., 7.875%, 8/1/11 | | B1/BB− | | | 1,459,500 | |
| | | | | | | | | | | |
| | | | | Financial Services–0.5% | | | | | | |
| | | | | Ally Financial, Inc., | | | | | | |
| | 500 | | | 5.375%, 6/6/11 | | B3/B | | | 508,750 | |
| | 700 | | | 6.875%, 9/15/11 | | B3/B | | | 720,078 | |
| | 800 | | | Ford Motor Credit Co. LLC, 7.25%, 10/25/11 | | Ba2/B+ | | | 839,976 | |
| | | | | | | | | | | |
| | | | | | | | | | 2,068,804 | |
| | | | | | | | | | | |
| | | | | Oil & Gas–0.0% | | | | | | |
| | 200 | | | BP Capital Markets PLC, 0.423%, 4/11/11, FRN | | A2/NR | | | 199,830 | |
| | | | | | | | | | | |
| | | | | Retail–0.7% | | | | | | |
| | 2,800 | | | New Albertsons, Inc., 7.50%, 2/15/11 | | Ba3/B+ | | | 2,856,000 | |
| | | | | | | | | | | |
| | | | | Telecommunications–0.4% | | | | | | |
| | 1,500 | | | British Telecommunications PLC, 9.375%, 12/15/10 | | Baa2/BBB− | | | 1,515,549 | |
| | | | | | | | | | | |
| | | | | Total Corporate Notes (cost–$7,952,147) | | | | | 8,099,683 | |
| | | | | | | | | | | |
| | | | | U.S. Treasury Bills (k)(q)–0.6% | | | | | | |
| | 2,340 | | | 0.128%-0.155%, 12/9/10-1/27/11 (cost–$2,339,339) | | | | | 2,339,475 | |
| | | | | | | | | | | |
| | | | | U.S. Government Agency Securities–0.3% | | | | | | |
| | 37 | | | Freddie Mac, 0.326%, 2/1/11, FRN | | Aaa/AAA | | | 36,996 | |
| | 1,254 | | | U.S. Treasury Inflation Indexed Notes, 3.50%, 1/15/11 (j) | | NR/NR | | | 1,263,404 | |
| | | | | | | | | | | |
| | | | | Total U.S. Government Agency Securities (cost–$1,300,896) | | | | | 1,300,400 | |
| | | | | | | | | | | |
68 Allianz Global Investors Managed Accounts Trust Annual Report ï 10.31.10
Fixed Income SHares: Series R Schedule of Investments
October 31, 2010 (continued)
| | | | | | | | | | | |
Principal
| | | | | | | | |
Amount
| | | | | | | | |
| (000s) | | | | | | | Value | |
| | | | | Repurchase Agreement–0.4% | | | | | | |
| $ | 1,548 | | | State Street Bank & Trust Co., dated 10/29/10, 0.01%, due 11/1/10, proceeds $1,548,001; collateralized by U.S. Treasury Notes, 2.125%, due 5/31/15, valued at $1,580,700 including accrued interest (cost–$1,548,000) | | | | $ | 1,548,000 | |
| | | | | | | | | | | |
| | | | | Total Short-Term Investments (cost–$13,140,382) | | | | | 13,287,558 | |
| | | | | | | | | | | |
Contracts/
| | | | | | | | |
Notional
| | | | | | | | |
| Amount | | | | | | | | |
OPTIONS PURCHASED (l)–0.0% |
| | | | | Put Options–0.0% | | | | | | |
| | | | | 1-Year Interest Rate Swap (OTC),
Pay 3-Month USD-LIBOR Floating Rate Index, | | | | | | |
| $ | 12,900,000 | | | strike rate 2.00%, expires 11/19/12 | | | | | 29,015 | |
| | | | | Treasury Inflation Protected Securities (OTC), | | | | | | |
| $ | 35,000,000 | | | strike price $75, expires 11/15/10 | | | | | 35 | |
| $ | 9,000,000 | | | strike price $75, expires 11/30/10 | | | | | 703 | |
| | | | | U.S. Treasury Notes 10 yr. Futures (CBOT), | | | | | | |
| | 51 | | | strike price $100, expires 11/26/10 | | | | | 776 | |
| | | | | | | | | | | |
| | | | | Total Options Purchased (cost–$35,205) | | | | | 30,529 | |
| | | | | | | | | | | |
| | | | | Total Investments before options written (cost–$692,957,586)–177.1% | | | | | 714,452,591 | |
| | | | | | | | | | | |
| | | | | | | | | | | |
| | | | | | | | | | | |
OPTIONS WRITTEN (l)–(0.4)% |
| | | | | Call Options–(0.1)% | | | | | | |
| | | | | 5-Year Interest Rate Swap (OTC),
Pay 3-Month USD-LIBOR Floating Rate Index, | | | | | | |
| $ | 14,100,000 | | | strike rate 1.25%, expires 2/22/11 | | | | | (32,309 | ) |
| $ | 58,400,000 | | | strike rate 1.35%, expires 12/13/10 | | | | | (153,382 | ) |
| $ | 8,300,000 | | | strike rate 1.50%, expires 12/13/10 | | | | | (47,193 | ) |
| | | | | 10-Year Interest Rate Swap (OTC),
Pay 3-Month USD-LIBOR Floating Rate Index, | | | | | | |
| $ | 3,200,000 | | | strike rate 2.25%, expires 12/13/10 | | | | | (4,496 | ) |
| | | | | CPURNSA Index (OTC) Exercise Index=Maximum of
((Index Final/Index Initial-1)-2.50%) or $0, | | | | | | |
| $ | 5,800,000 | | | strike price $2.50, expires 12/7/10 | | | | | (580 | ) |
| | | | | Dow Jones CDX IG-14 5-Year Index, | | | | | | |
| $ | 4,000,000 | | | strike price $0.90, expires 12/15/10 | | | | | (11,525 | ) |
| | | | | iTraxx Europe 13 5-Year Index (OTC), | | | | | | |
| € | 1,100,000 | | | strike price €0.90, expires 11/17/10 | | | | | (2,074 | ) |
| € | 5,700,000 | | | strike price €0.90, expires 12/15/10 | | | | | (18,951 | ) |
| | | | | U.S. Treasury Notes 10 yr. Futures (CBOT), | | | | | | |
| | 6 | | | strike price $128, expires 11/26/10 | | | | | (2,203 | ) |
10.31.10 ï Allianz Global Investors Managed Accounts Trust Annual Report 69
Fixed Income SHares: Series R Schedule of Investments
October 31, 2010 (continued)
| | | | | | | | | | | |
Contracts/
| | | | | | | | |
Notional
| | | | | | | | |
| Amount | | | | | | | Value | |
| | | | | Call Options (continued) | | | | | | |
| | | | | | | | | | | |
| | 13 | | | strike price $129, expires 11/26/10 | | | | $ | (2,196 | ) |
| | | | | | | | | | | |
| | | | | | | | | | (274,909 | ) |
| | | | | | | | | | | |
| | | | | Put Options–(0.2)% | | | | | | |
| | | | | 1-Year Interest Rate Swap (OTC),
Pay 3-Month USD-LIBOR Floating Rate Index, | | | | | | |
| $ | 12,900,000 | | | strike rate 1.00%, expires 11/19/12 | | | | | (66,547 | ) |
| | | | | 2-Year Interest Rate Swap (OTC),
Pay 3-Month USD-LIBOR Floating Rate Index, | | | | | | |
| $ | 64,700,000 | | | strike rate 2.25%, expires 9/24/12 | | | | | (279,620 | ) |
| | | | | 3-Year Interest Rate Swap (OTC),
Pay 3-Month USD-LIBOR Floating Rate Index, | | | | | | |
| $ | 44,600,000 | | | strike rate 3.00%, expires 6/18/12 | | | | | (147,403 | ) |
| | | | | 5-Year Interest Rate Swap (OTC),
Pay 3-Month USD-LIBOR Floating Rate Index, | | | | | | |
| $ | 38,600,000 | | | strike rate 1.70%, expires 12/13/10 | | | | | (93,987 | ) |
| $ | 14,100,000 | | | strike rate 1.80%, expires 2/22/11 | | | | | (79,514 | ) |
| $ | 19,800,000 | | | strike rate 1.95%, expires 12/13/10 | | | | | (13,969 | ) |
| $ | 8,300,000 | | | strike rate 2.10%, expires 12/13/10 | | | | | (2,629 | ) |
| $ | 4,300,000 | | | strike rate 4.00%, expires 12/1/10 | | | | | (1 | ) |
| | | | | 10-Year Interest Rate Swap (OTC),
Pay 3-Month USD-LIBOR Floating Rate Index, | | | | | | |
| $ | 3,200,000 | | | strike rate 2.75%, expires 12/13/10 | | | | | (43,921 | ) |
| $ | 3,300,000 | | | strike rate 10.00%, expires 7/10/12 | | | | | (732 | ) |
| | | | | Inflation Floor CPURNSA Index (OTC) Exercise Index=Maximum of ((1+0.00%)^10−(Index Final/Index Initial)) or $0, | | | | | | |
| $ | 5,600,000 | | | strike price $0.001, expires 3/12/20 | | | | | (49,792 | ) |
| $ | 32,200,000 | | | strike price $0.001, expires 4/7/20 | | | | | (290,652 | ) |
| $ | 1,500,000 | | | strike price $0.001, expires 9/29/20 | | | | | (13,489 | ) |
| | | | | Inflation Floor CPURNSA Index (OTC) Exercise Index=Maximum of (0.00%−(Index Final/Index Initial−1)) or $0, | | | | | | |
| $ | 1,500,000 | | | strike price $0.001, expires 3/10/20 | | | | | (12,494 | ) |
| | | | | Inflation Floor CPURNSA Index (OTC) Exercise Index=Maximum of (–1.00%−(Index Final/Index Initial−1)) or $0, | | | | | | |
| $ | 5,800,000 | | | strike price $1, expires 12/14/10 | | | | | — | |
| | | | | Dow Jones CDX IG-14 5-Year Index, | | | | | | |
| $ | 4,000,000 | | | strike price $1.50, expires 12/15/10 | | | | | (106 | ) |
| | | | | Dow Jones CDX IG-15 5-Year Index, | | | | | | |
| $ | 700,000 | | | strike price $1.70, expires 3/16/11 | | | | | (1,089 | ) |
70 Allianz Global Investors Managed Accounts Trust Annual Report ï 10.31.10
Fixed Income SHares: Series R Schedule of Investments
October 31, 2010 (continued)
| | | | | | | | | | | |
Contracts/
| | | | | | | | |
Notional
| | | | | | | | |
| Amount | | | | | | | Value | |
| | | | | Put Options (continued) | | | | | | |
| | | | | | | | | | | |
| | | | | iTraxx Europe 13 5-Year Index (OTC), | | | | | | |
| € | 1,100,000 | | | strike price €1.60, expires 11/17/10 | | | | $ | — | |
| € | 5,700,000 | | | strike price €1.60, expires 12/15/10 | | | | | (653 | ) |
| | | | | iTraxx Europe 14 5-Year Index (OTC), | | | | | | |
| € | 1,100,000 | | | strike price €1.60, expires 3/16/11 | | | | | (3,037 | ) |
| € | 700,000 | | | strike price €1.80, expires 3/16/11 | | | | | (1,157 | ) |
| | | | | U.S. Treasury Notes 10 yr. Futures (CBOT), | | | | | | |
| | 6 | | | strike price $124, expires 11/26/10 | | | | | (1,583 | ) |
| | 13 | | | strike price $125, expires 11/26/10 | | | | | (6,141 | ) |
| | | | | | | | | | | |
| | | | | | | | | | (1,108,516 | ) |
| | | | | | | | | | | |
| | | | | Straddle Options–(0.1)% | | | | | | |
| | | | | Call & Put 1-Year vs. 1-Year Forward Volatility Agreement (OTC), | | | | | | |
| $ | 9,600,000 | | | exercise price $0.001, expires 10/11/11 | | | | | (53,107 | ) |
| $ | 4,900,000 | | | exercise price $0.010, expires 10/11/11 | | | | | (28,478 | ) |
| | | | | Call & Put 1-Year vs. 2-Year Forward Volatility Agreement (OTC), | | | | | | |
| $ | 8,900,000 | | | exercise price $0.001, expires 10/11/11 | | | | | (94,867 | ) |
| $ | 13,900,000 | | | exercise price $0.001, expires 11/14/11 | | | | | (145,769 | ) |
| | | | | | | | | | | |
| | | | | | | | | | (322,221 | ) |
| | | | | | | | | | | |
| | | | | Total Options Written (premiums received–$2,423,993) | | | | | (1,705,646 | ) |
| | | | | | | | | | | |
| | | | | Total Investments net of options written (cost–$690,533,593) | | 176.7% | | | 712,746,945 | |
| | | | | Other liabilities in excess of other assets | | (76.7) | | | (309,370,878 | ) |
| | | | | | | | | | | |
| | | | | Net Assets | | 100.0% | | $ | 403,376,067 | |
| | | | | | | | | | | |
10.31.10 ï Allianz Global Investors Managed Accounts Trust Annual Report 71
Allianz Global Investors Managed Accounts Trust Notes to Schedules of Investments
October 31, 2010
| | | |
| * | | Unaudited. |
| (a) | | Private Placement – Restricted as to resale and may not have a readily available market. Securities with an aggregate value of $591,574,705, representing 17.7% of net assets in Series C; securities with an aggregate value of $275,735, representing 3.6% of net assets in Series H; securities with an aggregate value of $409,670,362, representing 12.2% of net assets in Series M; securities with an aggregate value of $43,723,129, representing 10.8% of net assets in Series R. |
| (b) | | Illiquid. |
| (c) | | These securities generally pay interest at rates which are periodically pre-determined by reference to a base lending rate plus a premium. These base lending rates are generally either the lending rate offered by one or more major European banks, such as the “LIBOR” or the prime rate offered by one or more major United States banks, or the certificate of deposit rate. These securities are generally considered to be restricted as the Portfolios are ordinarily contractually obligated to receive approval from the Agent bank and/or borrower prior to disposition. Remaining maturities of senior loans may be less than the stated maturities shown as a result of contractual or optional payments by the borrower. |
| | | Such prepayments cannot be predicted with certainty. The interest rate disclosed reflects the rate in effect on October 31, 2010. |
| (d) | | 144A – Exempt from registration under Rule 144A of the Securities Act of 1933. These securities may be resold in transactions exempt from registration, typically only to qualified institutional buyers. Unless otherwise indicated, these securities are not considered to be illiquid. |
| (e) | | When-issued or delayed-delivery. To be settled/delivered after October 31, 2010. |
| (f) | | In default. |
| (g) | | Fair-Valued – Securities with an aggregate value of $20,872,232, representing 0.6% of net assets in Series C; securities with an aggregate value of $18,258,967, representing 0.5% of net assets in Series M; securities with an aggregate value of $23,481,694, representing 5.8% of net assets in Series R. |
| (h) | | Principal amount less than $500. |
| (i) | | Perpetual maturity. Maturity date shown is the first call date. For Corporate Bonds & Notes, the interest rate is fixed until the first call date and variable thereafter. |
| (j) | | Inflationary Bonds – Principal amount of security is adjusted for inflation/deflation. |
| (k) | | All or partial amount segregated for the benefit of the counterparty as collateral for derivatives and delayed-delivery securities. |
| (l) | | Non-income producing. |
| (m) | | Subject to Alternative Minimum Tax. |
| (n) | | Restricted. The aggregate acquisition cost of such securities is $11,785,538, $10,780,800 and $738,707 in Series C, Series M and Series R, respectively. The aggregate market value of $11,735,471, $10,551,300 and $778,451, representing 0.4%, 0.3% and 0.2% of net assets in Series C, Series M and Series R, respectively. |
| (o) | | Floating Rate. The rate disclosed reflects the rate in effect on October 31, 2010. |
| (p) | | Securities with an aggregate value of $2,148,188, representing 87.4% of net assets in Series I, were valued utilizing modeling tools provided by a third-party vendor as described in Note 1(a) and 1(b) in the Notes to Financial Statements. |
| (q) | | Rates shown are the effective yields at purchase date. |
Glossary:
ABS – Asset-Backed Securities
ADR – American Depositary Receipt
AGM – insured by Assured Guaranty Municipal Corp.
AMBAC – insured by American Municipal Bond Assurance Corp.
AUD – Australian Dollar
BRL – Brazilian Real
£ – British Pound
CAD – Canadian Dollar
CBO – Collateralized Bond Obligation
72 Allianz Global Investors Managed Accounts Trust Annual Report ï 10.31.10 ï See accompanying Notes to Financial Statements
Allianz Global Investors Managed Accounts Trust Notes to Schedules of Investments
October 31, 2010 (continued)
CBOT – Chicago Board of Trade
CDO – Collateralized Debt Obligation
CLO – Collateralized Loan Obligation
CME – Chicago Mercantile Exchange
CMO – Collateralized Mortgage Obligation
CPURNSA – Consumer Price All Urban Non-Seasonally Adjusted Index
€ – Euro
FGIC – insured by Financial Guaranty Insurance Co.
FRN – Floating Rate Note. The interest rate disclosed reflects the rate in effect on October 31, 2010.
GDR – Global Depositary Receipt
GO – General Obligation Bond
¥ – Japanese Yen
LIBOR – London Inter-Bank Offered Rate
MBIA – insured by Municipal Bond Investors Assurance
MBS – Mortgage-Backed Securities
NPFGC – insured by National Public Finance Guarantee Corp.
NR – Not Rated
OTC – Over the Counter
Q-SBLF – Qualified School Bond Loan Fund
TBA – To Be Announced
VRN – Variable Rate Note. Instruments whose interest rates change on specified date (such as a coupon date or interest payment date) and/or whose interest rates vary with changes in a designated base rate (such as the prime interest rate). The interest rate disclosed reflects the rate in effect on October 31, 2010.
WR – Withdrawn Rating
See accompanying Notes to Financial Statements ï 10.31.10 ï Allianz Global Investors Managed Accounts Trust Annual Report 73
Allianz Global Investors Managed Accounts Trust Statements of Assets and Liabilities
October 31, 2010
| | | | | | | | | |
| | | | | | Fixed
| |
| | | Equity
| | | Income
| |
| | | Shares:
| | | SHares:
| |
| | | Series I | | | Series C | |
Assets: | | | | | | | | |
| Investments, at value (cost-$1,948,941, $3,013,433,099, $7,751,179, $5,507,028,515 and $692,957,586, respectively) | | | $2,383,153 | | | | $3,327,691,161 | |
| | | | | | | | | |
| Cash (including foreign currency for Series C, Series M and Series R with a value and cost of $1,285,125 and $1,277,579, $647,091 and $640,315, $865,554 and $857,483, respectively) | | | 67,047 | | | | 1,293,095 | |
| | | | | | | | | |
| Interest and dividend receivable | | | 3,308 | | | | 48,571,868 | |
| | | | | | | | | |
| Receivable for investments sold | | | 2,435 | | | | 4,972,013 | |
| | | | | | | | | |
| Tax reclaims receivable | | | 1,211 | | | | 241,934 | |
| | | | | | | | | |
| Unrealized appreciation of swaps | | | — | | | | 34,117,908 | |
| | | | | | | | | |
| Swap premiums paid | | | — | | | | 21,575,365 | |
| | | | | | | | | |
| Unrealized appreciation of forward foreign currency contracts | | | — | | | | 19,092,334 | |
| | | | | | | | | |
| Receivable for shares of beneficial interest sold | | | — | | | | 4,538,908 | |
| | | | | | | | | |
| Receivable for variation margin on futures contracts | | | — | | | | 333,404 | |
| | | | | | | | | |
| Deposits with brokers for futures contracts collateral | | | — | | | | 272,000 | |
| | | | | | | | | |
| Receivable for paydown principal | | | — | | | | 164 | |
| | | | | | | | | |
| Receivable from broker | | | — | | | | — | |
| | | | | | | | | |
| Other assets | | | — | | | | 17,040 | |
| | | | | | | | | |
| Total Assets | | | 2,457,154 | | | | 3,462,717,194 | |
| | | | | | | | | |
| | | | | | | | | |
Liabilities: | | | | | | | | |
| Payable to brokers for cash collateral received | | | — | | | | 35,510,000 | |
| | | | | | | | | |
| Options written, at value (premiums received–$0, $42,510,383, $0, $8,209,618, and $2,423,993, respectively) | | | — | | | | 20,842,543 | |
| | | | | | | | | |
| Securities sold short, at value (proceeds received–$0, $0, $0 $16,330,562 and $0, respectively) | | | — | | | | — | |
| | | | | | | | | |
| Dividends payable | | | — | | | | 17,074,079 | |
| | | | | | | | | |
| Unrealized depreciation of swaps | | | — | | | | 15,445,101 | |
| | | | | | | | | |
| Unrealized depreciation of forward foreign currency contracts | | | — | | | | 9,489,899 | |
| | | | | | | | | |
| Payable for investments purchased | | | — | | | | 7,232,791 | |
| | | | | | | | | |
| Swap premiums received | | | — | | | | 6,855,688 | |
| | | | | | | | | |
| Payable for shares of beneficial interest redeemed | | | — | | | | 4,840,388 | |
| | | | | | | | | |
| Payable to broker | | | — | | | | 221,016 | |
| | | | | | | | | |
| Interest payable for cash collateral received | | | — | | | | 2,792 | |
| | | | | | | | | |
| Payable to custodian for cash overdraft | | | — | | | | — | |
| | | | | | | | | |
| Payable for terminated swaps | | | — | | | | — | |
| | | | | | | | | |
| Total Liabilities | | | — | | | | 117,514,297 | |
| | | | | | | | | |
| | | | | | | | | |
Net Assets | | | $2,457,154 | | | | $3,345,202,897 | |
| | | | | | | | | |
| | | | | | | | | |
Net Assets Consist of: | | | | | | | | |
| Shares of beneficial interest of $0.001 par value (unlimited number authorized) | | | $205 | | | | $238,150 | |
| | | | | | | | | |
Paid-in-capital in excess of par | | | 2,059,148 | | | | 2,812,942,470 | |
| | | | | | | | | |
| Undistributed (dividends in excess of) net investment income | | | 38,491 | | | | 68,504,913 | |
| | | | | | | | | |
| Accumulated net realized gain (loss) | | | (75,109 | ) | | | 79,646,508 | |
| | | | | | | | | |
| Net unrealized appreciation (depreciation) of investments, futures contracts, options written, securities sold short, swaps and foreign currency transactions | | | 434,419 | | | | 383,870,856 | |
| | | | | | | | | |
Net Assets | | | $2,457,154 | | | | $3,345,202,897 | |
| | | | | | | | | |
| Shares Outstanding | | | 205,520 | | | | 238,149,524 | |
| | | | | | | | | |
Net Asset Value, Offering Price and Redemption Price Per Share | | | $11.96 | | | | $14.05 | |
| | | | | | | | | |
74 Allianz Global Investors Managed Accounts Trust Annual Report ï 10.31.10 ï See accompanying Notes to Financial Statements
| | | | | | | | | | | |
Fixed
| | Fixed
| | Fixed
|
Income
| | Income
| | Income
|
SHares:
| | SHares:
| | SHares:
|
| Series H | | Series M | | Series R |
| |
$7,663,804 | | | | $5,578,978,983 | | | | $714,452,591 | |
| | | | | | | | | | | |
| |
782 | | | | — | | | | 866,059 | |
| | | | | | | | | | | |
| | 122,587 | | | | 32,770,004 | | | | 4,014,661 | |
| | | | | | | | | | | |
| | — | | | | 601,424,823 | | | | 1,990,557 | |
| | | | | | | | | | | |
| | — | | | | 164,113 | | | | 4,548 | |
| | | | | | | | | | | |
| | — | | | | 35,185,137 | | | | 2,112,911 | |
| | | | | | | | | | | |
| | — | | | | 8,226,267 | | | | 941,417 | |
| | | | | | | | | | | |
| | — | | | | 371,502 | | | | 834,372 | |
| | | | | | | | | | | |
| | — | | | | 4,601,500 | | | | 797,066 | |
| | | | | | | | | | | |
| | — | | | | 86,644 | | | | 14,175 | |
| | | | | | | | | | | |
| | — | | | | 13,000 | | | | 10,000 | |
| | | | | | | | | | | |
| | — | | | | 51,343 | | | | — | |
| | | | | | | | | | | |
| | — | | | | 46,963 | | | | 1,794 | |
| | | | | | | | | | | |
| | — | | | | 17,040 | | | | — | |
| | | | | | | | | | | |
| | 7,787,173 | | | | 6,261,937,319 | | | | 726,040,151 | |
| | | | | | | | | | | |
| | | | | | | | | | | |
| | | | | | | | | | | |
| | — | | | | 29,630,000 | | | | 3,030,000 | |
| | | | | | | | | | | |
| |
— | | | | 8,020,229 | | | | 1,705,646 | |
| | | | | | | | | | | |
| | — | | | | 16,380,229 | | | | — | |
| | | | | | | | | | | |
| | 31,940 | | | | 12,698,734 | | | | 1,012,178 | |
| | | | | | | | | | | |
| | — | | | | 3,458,211 | | | | 727,030 | |
| | | | | | | | | | | |
| | — | | | | 6,998,340 | | | | 2,162,768 | |
| | | | | | | | | | | |
| | — | | | | 2,744,357,595 | | | | 312,696,043 | |
| | | | | | | | | | | |
| | — | | | | 7,654,958 | | | | 1,132,049 | |
| | | | | | | | | | | |
| | — | | | | 3,762,577 | | | | 197,792 | |
| | | | | | | | | | | |
| | — | | | | — | | | | — | |
| | | | | | | | | | | |
| | — | | | | 21,728 | | | | 199 | |
| | | | | | | | | | | |
| | — | | | | 77,550,226 | | | | — | |
| | | | | | | | | | | |
| | — | | | | — | | | | 379 | |
| | | | | | | | | | | |
| | 31,940 | | | | 2,910,532,827 | | | | 322,664,084 | |
| | | | | | | | | | | |
| | | | | | | | | | | |
| | $7,755,233 | | | | $3,351,404,492 | | | | $403,376,067 | |
| | | | | | | | | | | |
| | | | | | | | | | | |
| | | | | | | | | | | |
| | $995 | | | | $306,382 | | | | $33,247 | |
| | | | | | | | | | | |
| | 8,308,982 | | | | 3,211,564,491 | | | | 351,451,051 | |
| | | | | | | | | | | |
| | (6 | ) | | | 13,268,518 | | | | 864,477 | |
| | | | | | | | | | | |
| | (467,363 | ) | | | 24,726,456 | | | | 28,610,225 | |
| | | | | | | | | | | |
| |
(87,375 | ) | | | 101,538,645 | | | | 22,417,067 | |
| | | | | | | | | | | |
| | $7,755,233 | | | | $3,351,404,492 | | | | $403,376,067 | |
| | | | | | | | | | | |
| | 994,689 | | | | 306,382,007 | | | | 33,247,277 | |
| | | | | | | | | | | |
| | $7.80 | | | | $10.94 | | | | $12.13 | |
| | | | | | | | | | | |
See accompanying Notes to Financial Statements ï 10.31.10 ï Allianz Global Investors Managed Accounts Trust Annual Report 75
Allianz Global Investors Managed Accounts Trust Statements of Operations
Year ended October 31, 2010
| | | | | | | | | | | | | | | | | | | | | |
| | | | | Fixed
| | Fixed
| | Fixed
| | Fixed
|
| | | Equity
| | Income
| | Income
| | Income
| | Income
|
| | | Shares:
| | SHares:
| | SHares:
| | SHares:
| | SHares:
|
| | | Series I | | Series C | | Series H | | Series M | | Series R |
Investment Income: | | | | | | | | | | | | | | | | | | | | |
| Dividends (net of foreign withholding tax of $5,041 for Series I) | | | $46,396 | | | | $163,422 | | | | — | | | | $2,342,758 | | | | $15,000 | |
| | | | | | | | | | | | | | | | | | | | | |
| Interest (net of foreign withholding tax of $9,646 for Series C) | | | 3 | | | | 171,850,280 | | | | $213,435 | | | | 139,359,793 | | | | 9,976,550 | |
| | | | | | | | | | | | | | | | | | | | | |
| Facility and other fee income | | | — | | | | 809,783 | | | | — | | | | 10,003 | | | | 4,012 | |
| | | | | | | | | | | | | | | | | | | | | |
| Total Investment Income | | | 46,399 | | | | 172,823,485 | | | | 213,435 | | | | 141,712,554 | | | | 9,995,562 | |
| | | | | | | | | | | | | | | | | | | | | |
| | | | | | | | | | | | | | | | | | | | | |
Expenses: | | | | | | | | | | | | | | | | | | | | |
| Interest expense | | | 60 | | | | 58,551 | | | | — | | | | 208,047 | | | | 2,620 | |
| | | | | | | | | | | | | | | | | | | | | |
Net Investment Income | | | 46,339 | | | | 172,764,934 | | | | 213,435 | | | | 141,504,507 | | | | 9,992,942 | |
| | | | | | | | | | | | | | | | | | | | | |
| | | | | | | | | | | | | | | | | | | | | |
Realized and Change In Unrealized Gain (Loss): | | | | | | | | | | | | | | | | | | | | |
| Net realized gain (loss) on: | | | | | | | | | | | | | | | | | | | | |
| Investments | | | (75,109 | ) | | | 63,576,328 | | | | (147,811 | ) | | | 95,639,792 | | | | 33,637,233 | |
| | | | | | | | | | | | | | | | | | | | | |
| Futures contracts | | | — | | | | 111,652,177 | | | | — | | | | 53,753,342 | | | | 5,814,224 | |
| | | | | | | | | | | | | | | | | | | | | |
| Options written | | | — | | | | 35,003,199 | | | | — | | | | 15,888,087 | | | | 2,264,501 | |
| | | | | | | | | | | | | | | | | | | | | |
| Swaps | | | — | | | | (27,932,926 | ) | | | — | | | | 104,114,022 | | | | (1,049,757 | ) |
| | | | | | | | | | | | | | | | | | | | | |
| Foreign currency transactions | | | (3,490 | ) | | | 9,354,580 | | | | — | | | | (6,973,800 | ) | | | (960,449 | ) |
| | | | | | | | | | | | | | | | | | | | | |
Net change in unrealized
appreciation/depreciation of: | | | | | | | | | | | | | | | | | | | | |
| Investments | | | 411,515 | | | | 207,568,014 | | | | 355,234 | | | | 124,521,667 | | | | 13,347,922 | |
| | | | | | | | | | | | | | | | | | | | | |
| Futures contracts | | | — | | | | (3,649,666 | ) | | | — | | | | 3,228,754 | | | | (3,376,314 | ) |
| | | | | | | | | | | | | | | | | | | | | |
| Options written | | | — | | | | 16,407,741 | | | | — | | | | (3,693,622 | ) | | | 575,256 | |
| | | | | | | | | | | | | | | | | | | | | |
| Securities sold short | | | — | | | | 866,716 | | | | — | | | | (44,074 | ) | | | 5,449 | |
| | | | | | | | | | | | | | | | | | | | | |
| Swaps | | | — | | | | 20,486,551 | | | | — | | | | (3,160,068 | ) | | | 1,018,758 | |
| | | | | | | | | | | | | | | | | | | | | |
| Foreign currency transactions | | | 213 | | | | 8,826,099 | | | | — | | | | (6,472,570 | ) | | | (1,434,438 | ) |
| | | | | | | | | | | | | | | | | | | | | |
| Net realized and change in unrealized gain on investments, futures contracts, options written, securities sold short, swaps and foreign currency transactions | | | 333,129 | | | | 442,158,813 | | | | 207,423 | | | | 376,801,530 | | | | 49,842,385 | |
| | | | | | | | | | | | | | | | | | | | | |
Net Increase in Net Assets Resulting from Investment Operations | | | $379,468 | | | | $614,923,747 | | | | $420,858 | | | | $518,306,037 | | | | $59,835,327 | |
| | | | | | | | | | | | | | | | | | | | | |
76 Allianz Global Investors Managed Accounts Trust Annual Report ï 10.31.10 ï See accompanying Notes to Financial Statements
Equity SHares: Series I Statement of Changes in Net Assets
| | | | | | | | | |
| | | | | For the period
|
| | | | | August 3, 2009*
|
| | | Year ended
| | through
|
| | | October 31, 2010 | | October 31, 2009 |
Investment Operations: | | | | | | | | |
| Net investment income | | | $46,339 | | | | $11,101 | |
| | | | | | | | | |
| Net realized gain (loss) on investments and foreign currency transactions | | | (78,599 | ) | | | 38,190 | |
| | | | | | | | | |
| Net change in unrealized appreciation/depreciation of investments and foreign currency transactions | | | 411,728 | | | | 22,691 | |
| | | | | | | | | |
| Net increase in net assets resulting from investment operations | | | 379,468 | | | | 71,982 | |
| | | | | | | | | |
Dividends and Distributions to Shareholders from: | | | | | | | | |
| Net investment income | | | (45,138 | ) | | | — | |
| | | | | | | | | |
| Net realized gains | | | (8,511 | ) | | | — | |
| | | | | | | | | |
| Total dividends and distributions to shareholders | | | (53,649 | ) | | | — | |
| | | | | | | | | |
Common Share Transactions: | | | | | | | | |
| Net proceeds from the sale of shares | | | 3,503 | | | | 55,850 | |
| | | | | | | | | |
| Total increase in net assets | | | 329,322 | | | | 127,832 | |
| | | | | | | | | |
Net Assets: | | | | | | | | |
| Beginning of period | | | 2,127,832 | | | | 2,000,000 | |
| | | | | | | | | |
| End of period (including undistributed net investment income of $38,491 and $40,779, respectively) | | | $2,457,154 | | | | $2,127,832 | |
| | | | | | | | | |
Shares Issued | | | 315 | | | | 5,205 | |
| | | | | | | | | |
| | | |
| * | | Commencement of operations. |
Fixed Income SHares: Series C Statement of Changes in Net Assets
| | | | | | | | | |
| | | Year ended October 31, |
| | | 2010 | | 2009 |
Investment Operations: | | | | | | | | |
| Net investment income | | | $172,764,934 | | | | $155,138,980 | |
| | | | | | | | | |
| Net realized gain on investments, futures contracts, options written, swaps and foreign currency transactions | | | 191,653,358 | | | | 337,890,240 | |
| | | | | | | | | |
| Net change in unrealized appreciation/depreciation of investments, futures contracts, options written, securities sold short, swaps and foreign currency transactions | | | 250,505,455 | | | | 400,879,928 | |
| | | | | | | | | |
| Net increase in net assets resulting from investment operations | | | 614,923,747 | | | | 893,909,148 | |
| | | | | | | | | |
Dividends and Distributions to Shareholders from: | | | | | | | | |
| Net investment income | | | (367,578,793 | ) | | | (249,633,509 | ) |
| | | | | | | | | |
| Net realized gains | | | (165,337,424 | ) | | | (170,954,511 | ) |
| | | | | | | | | |
| Total dividends and distributions to shareholders | | | (532,916,217 | ) | | | (420,588,020 | ) |
| | | | | | | | | |
Common Share Transactions: | | | | | | | | |
| Net proceeds from the sale of shares | | | 1,118,550,608 | | | | 1,226,521,545 | |
| | | | | | | | | |
| Cost of shares redeemed | | | (748,582,092 | ) | | | (813,110,233 | ) |
| | | | | | | | | |
| Net increase in net assets from common share transactions | | | 369,968,516 | | | | 413,411,312 | |
| | | | | | | | | |
| Total increase in net assets | | | 451,976,046 | | | | 886,732,440 | |
| | | | | | | | | |
Net Assets: | | | | | | | | |
| Beginning of year | | | 2,893,226,851 | | | | 2,006,494,411 | |
| | | | | | | | | |
| End of year (including undistributed net investment income of $68,504,913 and $175,633,709, respectively) | | | $3,345,202,897 | | | | $2,893,226,851 | |
| | | | | | | | | |
Common Shares Issued and Redeemed: | | | | | | | | |
| Issued | | | 85,203,531 | | | | 102,008,354 | |
| | | | | | | | | |
| Redeemed | | | (56,294,305 | ) | | | (67,253,145 | ) |
| | | | | | | | | |
| Net Increase | | | 28,909,226 | | | | 34,755,209 | |
| | | | | | | | | |
See accompanying Notes to Financial Statements ï 10.31.10 ï Allianz Global Investors Managed Accounts Trust Annual Report 77
Fixed Income SHares: Series H Statement of Changes in Net Assets
| | | | | | | | | |
| | | Year ended October 31, |
| | | 2010 | | 2009 |
Investment Operations: | | | | | | | | |
| Net investment income | | | $213,435 | | | | $164,637 | |
| | | | | | | | | |
| Net realized loss on investments | | | (147,811 | ) | | | (223,665 | ) |
| | | | | | | | | |
| Net change in unrealized appreciation/depreciation of investments | | | 355,234 | | | | 393,462 | |
| | | | | | | | | |
| Net increase in net assets resulting from investment operations | | | 420,858 | | | | 334,434 | |
| | | | | | | | | |
| | | | | | | | | |
Dividends to Shareholders from Net Investment Income | | | (213,436 | ) | | | (164,230 | ) |
| | | | | | | | | |
| | | | | | | | | |
Common Share Transactions: | | | | | | | | |
| Net proceeds from the sale of shares | | | 6,392,803 | | | | 222,316 | |
| | | | | | | | | |
| Cost of shares redeemed | | | (1,518,951 | ) | | | — | |
| | | | | | | | | |
| Net increase in net assets from common share transactions | | | 4,873,852 | | | | 222,316 | |
| | | | | | | | | |
| Total increase in net assets | | | 5,081,274 | | | | 392,520 | |
| | | | | | | | | |
| | | | | | | | | |
Net Assets: | | | | | | | | |
| Beginning of year | | | 2,673,959 | | | | 2,281,439 | |
| | | | | | | | | |
| End of year (including dividends in excess of net investment income of $(6) and $(5), respectively) | | | $7,755,233 | | | | $2,673,959 | |
| | | | | | | | | |
| | | | | | | | | |
Common Shares Issued and Redeemed: | | | | | | | | |
| Issued | | | 837,811 | | | | 32,203 | |
| | | | | | | | | |
| Redeemed | | | (199,929 | ) | | | — | |
| | | | | | | | | |
| Net Increase | | | 637,882 | | | | 32,203 | |
| | | | | | | | | |
Fixed Income SHares: Series M Statement of Changes in Net Assets
| | | | | | | | | |
| | | Year ended October 31, |
| | | 2010 | | 2009 |
Investment Operations: | | | | | | | | |
| Net investment income | | | $141,504,507 | | | | $289,589,578 | |
| | | | | | | | | |
| Net realized gain (loss) on investments, futures contracts, options written, swaps and foreign currency transactions | | | 262,421,443 | | | | (80,112,227 | ) |
| | | | | | | | | |
| Net change in unrealized appreciation/depreciation of investments, futures contracts, options written, securities sold short, swaps and foreign currency transactions | | | 114,380,087 | | | | 498,645,005 | |
| | | | | | | | | |
| Net increase in net assets resulting from investment operations | | | 518,306,037 | | | | 708,122,356 | |
| | | | | | | | | |
| | | | | | | | | |
Dividends to Shareholders from Net Investment Income | | | (201,758,229 | ) | | | (313,991,564 | ) |
| | | | | | | | | |
| | | | | | | | | |
Common Share Transactions: | | | | | | | | |
| Net proceeds from the sale of shares | | | 991,047,690 | | | | 1,417,781,851 | |
| | | | | | | | | |
| Cost of shares redeemed | | | (736,122,976 | ) | | | (742,240,702 | ) |
| | | | | | | | | |
| Net increase in net assets from common share transactions | | | 254,924,714 | | | | 675,541,149 | |
| | | | | | | | | |
| Total increase in net assets | | | 571,472,522 | | | | 1,069,671,941 | |
| | | | | | | | | |
| | | | | | | | | |
Net Assets: | | | | | | | | |
| Beginning of year | | | 2,779,931,970 | | | | 1,710,260,029 | |
| | | | | | | | | |
| End of year (including undistributed net investment income of $13,268,518 and $38,310,879, respectively) | | | $3,351,404,492 | | | | $2,779,931,970 | |
| | | | | | | | | |
| | | | | | | | | |
Common Shares Issued and Redeemed: | | | | | | | | |
| Issued | | | 97,748,465 | | | | 161,066,051 | |
| | | | | | | | | |
| Redeemed | | | (72,129,934 | ) | | | (84,942,297 | ) |
| | | | | | | | | |
| Net Increase | | | 25,618,531 | | | | 76,123,754 | |
| | | | | | | | | |
78 Allianz Global Investors Managed Accounts Trust Annual Report ï 10.31.10 ï See accompanying Notes to Financial Statements
Fixed Income SHares: Series R Statement of Changes in Net Assets
| | | | | | | | | |
| | | Year ended October 31, |
| | | 2010 | | 2009 |
Investment Operations: | | | | | | | | |
| Net investment income | | | $9,992,942 | | | | $5,641,303 | |
| | | | | | | | | |
| Net realized gain on investments, futures contracts, options written, swaps and foreign currency transactions | | | 39,705,752 | | | | 12,899,114 | |
| | | | | | | | | |
| Net change in unrealized appreciation/depreciation of investments, futures contracts, options written, securities sold short, swaps and foreign currency transactions | | | 10,136,633 | | | | 28,147,013 | |
| | | | | | | | | |
| Net increase in net assets resulting from investment operations | | | 59,835,327 | | | | 46,687,430 | |
| | | | | | | | | |
| | | | | | | | | |
Dividends and Distributions to Shareholders from: | | | | | | | | |
| Net investment income | | | (15,634,695 | ) | | | (6,425,824 | ) |
| | | | | | | | | |
| Net realized gains | | | (1,313,661 | ) | | | (6,964,780 | ) |
| | | | | | | | | |
| Total dividends and distributions to shareholders | | | (16,948,356 | ) | | | (13,390,604 | ) |
| | | | | | | | | |
| | | | | | | | | |
Common Share Transactions: | | | | | | | | |
| Net proceeds from the sale of shares | | | 170,185,580 | | | | 162,771,513 | |
| | | | | | | | | |
| Cost of shares redeemed | | | (97,662,595 | ) | | | (78,193,796 | ) |
| | | | | | | | | |
| Net increase in net assets from common share transactions | | | 72,522,985 | | | | 84,577,717 | |
| | | | | | | | | |
| Total increase in net assets | | | 115,409,956 | | | | 117,874,543 | |
| | | | | | | | | |
| | | | | | | | | |
Net Assets: | | | | | | | | |
| Beginning of year | | | 287,966,111 | | | | 170,091,568 | |
| | | | | | | | | |
| End of year (including undistributed net investment income of $864,477 and $2,053,485, respectively) | | | $403,376,067 | | | | $287,966,111 | |
| | | | | | | | | |
| | | | | | | | | |
Common Shares Issued and Redeemed: | | | | | | | | |
| Issued | | | 15,489,601 | | | | 16,327,477 | |
| | | | | | | | | |
| Redeemed | | | (8,835,579 | ) | | | (8,086,228 | ) |
| | | | | | | | | |
| Net Increase | | | 6,654,022 | | | | 8,241,249 | |
| | | | | | | | | |
See accompanying Notes to Financial Statements ï 10.31.10 ï Allianz Global Investors Managed Accounts Trust Annual Report 79
Equity Shares: Series I Financial Highlights
For a share outstanding throughout each period:
| | | | | | | | | |
| | | | | For the period
|
| | | | | August 3, 2009*
|
| | | Year ended
| | through
|
| | | October 31, 2010 | | October 31, 2009 |
| Net asset value, beginning of period | | | $10.37 | | | | $10.00 | |
| | | | | | | | | |
| | | | | | | | | |
Investment Operations: | | | | | | | | |
| Net investment income | | | 0.23 | | | | 0.05 | |
| | | | | | | | | |
| Net realized and change in unrealized gain on investments and foreign currency transactions | | | 1.62 | | | | 0.32 | |
| | | | | | | | | |
| Total from investment operations | | | 1.85 | | | | 0.37 | |
| | | | | | | | | |
| | | | | | | | | |
Dividends and Distributions to Shareholders from: | | | | | | | | |
| Net investment income | | | (0.22 | ) | | | — | |
| | | | | | | | | |
| Net realized gains | | | (0.04 | ) | | | — | |
| | | | | | | | | |
| Total dividends and distributions to shareholders | | | (0.26 | ) | | | — | |
| | | | | | | | | |
| Net asset value, end of period | | | $11.96 | | | | $10.37 | |
| | | | | | | | | |
Total Investment Return (1) | | | 18.10 | % | | | 3.70 | % |
| | | | | | | | | |
| | | | | | | | | |
RATIOS/SUPPLEMENTAL DATA: | | | | | | | | |
| Net assets, end of period (000s) | | | $2,457 | | | | $2,128 | |
| | | | | | | | | |
| Ratio of operating expenses to average net assets (2) | | | 0.00 | %(3) | | | 0.00 | %† |
| | | | | | | | | |
| Ratio of net investment income to average net assets (2) | | | 2.10 | % | | | 2.14 | %† |
| | | | | | | | | |
| Portfolio turnover | | | 29 | % | | | 15 | % |
| | | | | | | | | |
| | | |
| * | | Commencement of operations. |
| † | | Annualized. |
| (1) | | Assumes reinvestment of all dividends and distributions. Total return for a period of less than one year is not annualized. |
| (2) | | Reflects the fact that no fees or expenses are incurred. The Portfolios are an integral part of “wrap-fee” programs sponsored by investment advisers and/or broker-dealers unaffiliated with Series I, the Investment Manager or the Sub-Advisers. Participants in these programs pay a “wrap” fee to the sponsor of the program. |
| (3) | | If interest expense were included, the ratio of operating expenses to average net assets for the year ended October 31, 2010 would be less than 0.005%. |
80 Allianz Global Investors Managed Accounts Trust Annual Report ï 10.31.10 ï See accompanying Notes to Financial Statements
Fixed Income SHares: Series C Financial Highlights
For a share outstanding throughout each year:
| | | | | | | | | | | | | | | | | | | | | |
| | | Year ended October 31, |
| | | 2010 | | 2009 | | 2008 | | 2007 | | 2006 |
| Net asset value, beginning of year | | | $13.83 | | | | $11.50 | | | | $12.05 | | | | $11.78 | | | | $11.64 | |
| | | | | | | | | | | | | | | | | | | | | |
| | | | | | | | | | | | | | | | | | | | | |
Investment Operations: | | | | | | | | | | | | | | | | | | | | |
| Net investment income | | | 0.75 | | | | 0.83 | | | | 0.76 | | | | 0.63 | | | | 0.55 | |
| | | | | | | | | | | | | | | | | | | | | |
| Net realized and change in unrealized gain (loss) on investments, futures contracts, options written, securities sold short, swaps, unfunded loan commitments and foreign currency transactions | | | 1.93 | | | | 3.86 | | | | (0.37 | ) | | | 0.44 | | | | 0.31 | |
| | | | | | | | | | | | | | | | | | | | | |
| Total from investment operations | | | 2.68 | | | | 4.69 | | | | 0.39 | | | | 1.07 | | | | 0.86 | |
| | | | | | | | | | | | | | | | | | | | | |
| | | | | | | | | | | | | | | | | | | | | |
Dividends and Distributions | | | | | | | | | | | | | | | | | | | | |
to Shareholders from: | | | | | | | | | | | | | | | | | | | | |
| Net investment income | | | (1.67 | ) | | | (1.36 | ) | | | (0.74 | ) | | | (0.56 | ) | | | (0.72 | ) |
| | | | | | | | | | | | | | | | | | | | | |
| Net realized gains | | | (0.79 | ) | | | (1.00 | ) | | | (0.20 | ) | | | (0.24 | ) | | | — | |
| | | | | | | | | | | | | | | | | | | | | |
| Total dividends and distributions to shareholders | | | (2.46 | ) | | | (2.36 | ) | | | (0.94 | ) | | | (0.80 | ) | | | (0.72 | ) |
| | | | | | | | | | | | | | | | | | | | | |
| Net asset value, end of year | | | $14.05 | | | | $13.83 | | | | $11.50 | | | | $12.05 | | | | $11.78 | |
| | | | | | | | | | | | | | | | | | | | | |
Total Investment Return (1) | | | 22.40 | % | | | 45.84 | % | | | 2.56 | % | | | 9.67 | % | | | 7.69 | % |
| | | | | | | | | | | | | | | | | | | | | |
| | | | | | | | | | | | | | | | | | | | | |
RATIOS/SUPPLEMENTAL DATA: | | | | | | | | | | | | | | | | | | | | |
| Net assets, end of year (000s) | | | $3,345,203 | | | | $2,893,227 | | | | $2,006,494 | | | | $1,886,225 | | | | $1,449,575 | |
| | | | | | | | | | | | | | | | | | | | | |
| Ratio of operating expenses to average net assets (3) | | | 0.00 | %(2) | | | 0.00 | %(2) | | | 0.00 | % | | | 0.00 | % | | | 0.00 | % |
| | | | | | | | | | | | | | | | | | | | | |
| Ratio of net investment income to average net assets (3) | | | 5.70 | % | | | 6.71 | % | | | 6.01 | % | | | 5.60 | % | | | 4.89 | % |
| | | | | | | | | | | | | | | | | | | | | |
| Portfolio turnover | | | 164 | % | | | 683 | % | | | 873 | % | | | 750 | % | | | 560 | % |
| | | | | | | | | | | | | | | | | | | | | |
| | | |
| (1) | | Assumes reinvestment of all dividends and distributions. |
| (2) | | If interest expense were included, the ratio of operating expenses to average net assets for the years ended October 31, 2010 and October 31, 2009 would be less than 0.005% and 0.01%, respectively. |
| (3) | | Reflects the fact that no fees or expenses are incurred. The Portfolios are an integral part of “wrap-fee” programs sponsored by investment advisers and/or broker-dealers unaffiliated with Series C, the Investment Manager or the Sub-Advisers. Participants in these programs pay a “wrap” fee to the sponsor of the program. |
See accompanying Notes to Financial Statements ï 10.31.10 ï Allianz Global Investors Managed Accounts Trust Annual Report 81
Fixed Income SHares: Series H Financial Highlights
For a share outstanding throughout each period:
| | | | | | | | | | | | | | | | | |
| | | | | | | | | For the period
|
| | | Year ended October 31, | | April 2, 2007*
|
| | | | | through
|
| | | 2010 | | 2009 | | 2008 | | October 31, 2007 |
| Net asset value, beginning of period | | | $7.49 | | | | $7.03 | | | | $9.61 | | | | $10.00 | |
| | | | | | | | | | | | | | | | | |
| | | | | | | | | | | | | | | | | |
Investment Operations: | | | | | | | | | | | | | | | | |
| Net investment income | | | 0.39 | | | | 0.49 | | | | 0.52 | | | | 0.29 | |
| | | | | | | | | | | | | | | | | |
| Net realized and change in unrealized gain (loss) on investments, futures contracts and swaps | | | 0.31 | | | | 0.46 | | | | (2.58 | ) | | | (0.40 | ) |
| | | | | | | | | | | | | | | | | |
| Total from investment operations | | | 0.70 | | | | 0.95 | | | | (2.06 | ) | | | (0.11 | ) |
| | | | | | | | | | | | | | | | | |
| | | | | | | | | | | | | | | | | |
Dividends to Shareholders from Net Investment Income | | | (0.39 | ) | | | (0.49 | ) | | | (0.52 | ) | | | (0.28 | ) |
| | | | | | | | | | | | | | | | | |
| Net asset value, end of period | | | $7.80 | | | | $7.49 | | | | $7.03 | | | | $9.61 | |
| | | | | | | | | | | | | | | | | |
Total Investment Return (1) | | | 9.62 | % | | | 14.54 | % | | | (22.21 | )% | | | (1.04 | )% |
| | | | | | | | | | | | | | | | | |
| | | | | | | | | | | | | | | | | |
RATIOS/SUPPLEMENTAL DATA: | | | | | | | | | | | | | | | | |
| Net assets, end of period (000s) | | | $7,755 | | | | $2,674 | | | | $2,281 | | | | $2,884 | |
| | | | | | | | | | | | | | | | | |
| Ratio of operating expenses to average net assets (2) | | | 0.00 | % | | | 0.00 | % | | | 0.00 | % | | | 0.00 | %† |
| | | | | | | | | | | | | | | | | |
| Ratio of net investment income to average net assets (2) | | | 4.90 | % | | | 7.22 | % | | | 6.05 | % | | | 5.04 | %† |
| | | | | | | | | | | | | | | | | |
| Portfolio turnover | | | 26 | % | | | 23 | % | | | 15 | % | | | 87 | % |
| | | | | | | | | | | | | | | | | |
| | | |
| * | | Commencement of operations. |
| † | | Annualized. |
| (1) | | Assumes reinvestment of all dividends and distributions. Total return for a period of less than one year is not annualized. |
| (2) | | Reflects the fact that no fees or expenses are incurred. The Portfolios are an integral part of “wrap-fee” programs sponsored by investment advisers and/or broker-dealers unaffiliated with Series H, the Investment Manager or the Sub-Advisers. Participants in these programs pay a “wrap” fee to the sponsor of the program. |
82 Allianz Global Investors Managed Accounts Trust Annual Report ï 10.31.10 ï See accompanying Notes to Financial Statements
Fixed Income SHares: Series M Financial Highlights
For a share outstanding throughout each year:
| | | | | | | | | | | | | | | | | | | | | |
| | | Year ended October 31, |
| | | 2010 | | 2009 | | 2008 | | 2007 | | 2006 |
| Net asset value, beginning of year | | | $9.90 | | | | $8.36 | | | | $11.31 | | | | $11.38 | | | | $11.12 | |
| | | | | | | | | | | | | | | | | | | | | |
| | | | | | | | | | | | | | | | | | | | | |
Investment Operations: | | | | | | | | | | | | | | | | | | | | |
| Net investment income | | | 0.47 | | | | 1.19 | | | | 1.35 | | | | 0.66 | | | | 0.57 | |
| | | | | | | | | | | | | | | | | | | | | |
| Net realized and change in unrealized gain (loss) on investments, futures contracts, options written, securities sold short, swaps and foreign currency transactions | | | 1.25 | | | | 1.62 | | | | (2.90 | ) | | | (0.08 | ) | | | 0.27 | |
| | | | | | | | | | | | | | | | | | | | | |
| Total from investment operations | | | 1.72 | | | | 2.81 | | | | (1.55 | ) | | | 0.58 | | | | 0.84 | |
| | | | | | | | | | | | | | | | | | | | | |
| | | | | | | | | | | | | | | | | | | | | |
Dividends to Shareholders from Net Investment Income | | | (0.68 | ) | | | (1.27 | ) | | | (1.40 | ) | | | (0.65 | ) | | | (0.58 | ) |
| | | | | | | | | | | | | | | | | | | | | |
| Net asset value, end of year | | | $10.94 | | | | $9.90 | | | | $8.36 | | | | $11.31 | | | | $11.38 | |
| | | | | | | | | | | | | | | | | | | | | |
Total Investment Return (1) | | | 18.22 | % | | | 36.99 | % | | | (16.53 | )% | | | 5.26 | % | | | 7.80 | % |
| | | | | | | | | | | | | | | | | | | | | |
| | | | | | | | | | | | | | | | | | �� | | | |
RATIOS/SUPPLEMENTAL DATA: | | | | | | | | | | | | | | | | | | | | |
| Net assets, end of year (000s) | | | $3,351,404 | | | | $2,779,932 | | | | $1,710,260 | | | | $1,819,024 | | | | $1,454,145 | |
| | | | | | | | | | | | | | | | | | | | | |
| Ratio of operating expenses to average net assets (2)(3) | | | 0.00 | % | | | 0.00 | % | | | 0.00 | % | | | 0.00 | % | | | 0.00 | % |
| | | | | | | | | | | | | | | | | | | | | |
| Ratio of net investment income to average net assets (3) | | | 4.67 | % | | | 13.01 | % | | | 11.82 | % | | | 5.91 | % | | | 5.11 | % |
| | | | | | | | | | | | | | | | | | | | | |
| Portfolio turnover | | | 482 | % | | | 916 | % | | | 923 | % | | | 837 | % | | | 928 | % |
| | | | | | | | | | | | | | | | | | | | | |
| | | |
| (1) | | Assumes reinvestment of all dividends and distributions. |
| (2) | | If interest expense were included, the ratio of operating expenses to average net assets for the years ended October 31, 2010, 2009, 2008, 2007 and 2006 would be 0.01%, 1.78%, 7.63%, 1.26% and 0.07%, respectively. |
| (3) | | Reflects the fact that no fees or expenses are incurred. The Portfolios are an integral part of “wrap-fee” programs sponsored by investment advisers and/or broker-dealers unaffiliated with Series M, the Investment Manager or the Sub-Advisers. Participants in these programs pay a “wrap” fee to the sponsor of the program. |
See accompanying Notes to Financial Statements ï 10.31.10 ï Allianz Global Investors Managed Accounts Trust Annual Report 83
Fixed Income SHares: Series R Financial Highlights
For a share outstanding throughout each year:
| | | | | | | | | | | | | | | | | | | | | |
| | | Year ended October 31, |
| | | 2010 | | 2009 | | 2008 | | 2007 | | 2006 |
| Net asset value, beginning of year | | | $10.83 | | | | $9.27 | | | | $10.21 | | | | $9.90 | | | | $10.20 | |
| | | | | | | | | | | | | | | | | | | | | |
| | | | | | | | | | | | | | | | | | | | | |
Investment Operations: | | | | | | | | | | | | | | | | | | | | |
| Net investment income | | | 0.33 | | | | 0.25 | | | | 0.57 | | | | 0.43 | | | | 0.54 | |
| | | | | | | | | | | | | | | | | | | | | |
| Net realized and unrealized gain (loss) on investments, futures contracts, options written, securities sold short, swaps and foreign currency transactions | | | 1.54 | | | | 2.00 | | | | (0.91 | ) | | | 0.34 | | | | (0.29 | ) |
| | | | | | | | | | | | | | | | | | | | | |
| Total from investment operations | | | 1.87 | | | | 2.25 | | | | (0.34 | ) | | | 0.77 | | | | 0.25 | |
| | | | | | | | | | | | | | | | | | | | | |
| | | | | | | | | | | | | | | | | | | | | |
Dividends and Distributions to Shareholders from: | | | | | | | | | | | | | | | | | | | | |
| Net investment income | | | (0.52 | ) | | | (0.29 | ) | | | (0.60 | ) | | | (0.46 | ) | | | (0.55 | ) |
| | | | | | | | | | | | | | | | | | | | | |
| Net realized gains | | | (0.05 | ) | | | (0.40 | ) | | | — | | | | — | | | | — | |
| | | | | | | | | | | | | | | | | | | | | |
| Total dividends and distributions to shareholders | | | (0.57 | ) | | | (0.69 | ) | | | (0.60 | ) | | | (0.46 | ) | | | (0.55 | ) |
| | | | | | | | | | | | | | | | | | | | | |
| Net asset value, end of year | | | $12.13 | | | | $10.83 | | | | $9.27 | | | | $10.21 | | | | $9.90 | |
| | | | | | | | | | | | | | | | | | | | | |
Total Investment Return (1) | | | 17.94 | % | | | 25.50 | % | | | (3.87 | )% | | | 8.05 | % | | | 2.49 | % |
| | | | | | | | | | | | | | | | | | | | | |
| | | | | | | | | | | | | | | | | | | | | |
RATIOS/SUPPLEMENTAL DATA: | | | | | | | | | | | | | | | | | | | | |
| Net assets, end of year (000s) | | | $403,376 | | | | $287,966 | | | | $170,092 | | | | $123,018 | | | | $154,793 | |
| | | | | | | | | | | | | | | | | | | | | |
| Ratio of operating expenses to average net assets (3) | | | 0.00 | %(2) | | | 0.00 | %(2) | | | 0.00 | % | | | 0.00 | % | | | 0.00 | % |
| | | | | | | | | | | | | | | | | | | | | |
| Ratio of net investment income to average net assets (3) | | | 2.90 | % | | | 2.77 | % | | | 5.39 | % | | | 4.36 | % | | | 5.33 | % |
| | | | | | | | | | | | | | | | | | | | | |
| Portfolio turnover | | | 495 | % | | | 1216 | % | | | 1003 | % | | | 825 | % | | | 593 | % |
| | | | | | | | | | | | | | | | | | | | | |
| | | |
| (1) | | Assumes reinvestment of all dividends and distributions. |
| (2) | | If interest expense were included, the ratio of operating expenses to average net assets for the years ended October 31, 2010 and October 31, 2009 would be less than 0.005% and less than 0.005%, respectively. |
| (3) | | Reflects the fact that no fees or expenses are incurred. The Portfolios are an integral part of “wrap-fee” programs sponsored by investment advisers and/or broker-dealers unaffiliated with Series R, the Investment Manager or the Sub-Advisers. Participants in these programs pay a “wrap” fee to the sponsor of the program. |
84 Allianz Global Investors Managed Accounts Trust Annual Report ï 10.31.10 ï See accompanying Notes to Financial Statements
Allianz Global Investors Managed Accounts Trust Notes to Financial Statements
October 31, 2010
1. Organization and Significant Accounting Policies
Allianz Global Investors Managed Accounts Trust (the “Trust”), was organized as a Massachusetts business trust on November 3, 1999. The Trust is comprised of Equity Shares: Series I, Fixed Income SHares: Series C, Series H, Series M and Series R (the “Portfolios”). Allianz Global Investors Fund Management LLC (the “Investment Manager”) serves as the Portfolios’ Investment Manager and is an indirect, wholly-owned subsidiary of Allianz Global Investors of America L.P. (“Allianz Global”). Allianz Global is an indirect, wholly-owned subsidiary of Allianz SE, a publicly-traded European insurance and financial services company. The Portfolios are authorized to issue an unlimited amount of shares of beneficial interest at $0.001 par value.
Equity Shares: Series I sold and issued 200,000 shares of beneficial interest in the amount of $2,000,000 to Allianz Global on August 3, 2009.
The preparation of the Portfolios’ financial statements in accordance with accounting principles generally accepted in the United States of America requires the Portfolios’ management to make estimates and assumptions that affect the reported amounts and disclosures in the Portfolios’ financial statements. Actual results could differ from those estimates.
In the normal course of business, the Portfolios enter into contracts that contain a variety of representations that provide general indemnifications. The Portfolios’ maximum exposure under these arrangements is unknown as this would involve future claims that may be made against the Portfolios that have not yet occurred.
The following is a summary of significant accounting policies consistently followed by the Portfolios:
(a) Valuation of Investments
Portfolio securities and other financial instruments for which market quotations are readily available are stated at market value. Market value is generally determined on the basis of last reported sales prices, or if no sales are reported, on the basis of quotes obtained from a quotation reporting system, established market makers, or independent pricing services.
Portfolio securities and other financial instruments for which market quotations are not readily available or for which a development/event occurs that may significantly impact the value of a security, are fair-valued, in good faith, pursuant to procedures established by the Board of Trustees, or persons acting at their discretion pursuant to procedures established by the Board of Trustees, including certain fixed income securities which may be valued with reference to securities whose prices are more readily available. The Portfolios’ investments are valued daily using prices supplied by an independent pricing service or dealer quotations, or by using the last sale price on the exchange that is the primary market for such securities, or the mean between the last quoted bid and ask price. Independent pricing services use information provided by market makers or estimates of market values obtained from yield data relating to investments or securities with similar characteristics. Exchange-traded futures and options on futures are valued at the settlement price determined by the relevant exchange. Securities purchased on a when-issued or delayed-delivery basis are marked to market daily until settlement at the forward settlement date. Short-term securities maturing in 60 days or less are valued at amortized cost, if their original term to maturity was 60 days or less, or by amortizing their value on the 61st day prior to maturity, if the original term to maturity exceeded 60 days. Investments initially valued in currencies other than U.S. dollar are converted to the U.S. dollar using exchange rates obtained from pricing services. As a result, the net asset value (“NAV”) of each Portfolio’s shares may be affected by changes in the value of currencies in relation to the U.S. dollar. The value of securities traded in markets outside the United States or denominated in currencies other than the U.S. dollar may be affected significantly on a day that the New York Stock Exchange (“NYSE”) is closed.
The prices used by the Portfolios to value securities may differ from the value that would be realized if the securities were sold and these differences could be material to the Portfolios’ financial statements. Each Portfolio’s NAV is normally determined as of the close of regular trading (normally, 4:00 p.m. Eastern time) on the NYSE on each day the NYSE is open for business.
The prices of certain portfolio securities or financial instruments may be determined at a time prior to the close of regular trading on the NYSE. When fair valuing securities, the Equity Shares: Series I Portfolio may, among other things, consider significant events (which may be considered to include changes in the value of U.S. securities or securities indices) that occur after the close of the relevant market and before the time the Portfolio’s NAV is calculated. With respect to certain foreign securities, the Portfolio may fair-value securities using modeling tools provided by third-party vendors. The Portfolio has retained a statistical research service to assist in determining the fair value of foreign securities. This service utilizes statistics and programs based on historical performance of markets and other economic data to assist in making fair value estimates. Fair value estimates used by Equity Shares: Series I for foreign securities may differ from the value realized from the sale of those securities and the difference could be material to the financial statements. Fair value pricing may require subjective determinations about the value of a security or other assets, and fair values used to
10.31.10 ï Allianz Global Investors Managed Accounts Trust Annual Report 85
Allianz Global Investors Managed Accounts Trust Notes to Financial Statements
October 31, 2010
1. Organization and Significant Accounting Policies (continued)
determine the Portfolio’s NAV may differ from quoted or published prices, or from prices that are used by others, for the same investments. In addition, the use of fair value pricing may not always result in adjustments to the prices of securities or other assets held by Equity Shares: Series I.
(b) Fair Value Measurements
Fair value is defined as the price that would be received to sell an asset or paid to transfer a liability (i.e. the “exit price”) in an orderly transaction between market participants. The three levels of the fair value hierarchy are described below:
| |
| • | Level 1 – quoted prices in active markets for identical investments that the Portfolios have the ability to access |
| |
| • | Level 2 – valuations based on other significant observable inputs (including quoted prices for similar investments, interest rates, prepayment speeds, credit risk, etc.) or quotes from inactive exchanges |
| |
| • | Level 3 – valuations based on significant unobservable inputs (including the Portfolios’ own assumptions in determining the fair value of investments) |
An investment asset’s or liability’s level within the fair value hierarchy is based on the lowest level input, individually or in aggregate, that is significant to fair value measurement. The objective of fair value measurement remains the same even when there is a significant decrease in the volume and level of activity for an asset or liability and regardless of the valuation techniques used.
The valuation techniques used by the Portfolios to measure fair value during the year ended October 31, 2010 maximized the use of observable inputs and minimized the use of unobservable inputs. When fair-valuing securities, the Portfolios utilized the estimation of the price that would have prevailed in a liquid market for an international equity given information available at the time of evaluation and option adjusted spread pricing techniques.
The inputs or methodology used for valuing securities are not necessarily an indication of the risk associated with investing in those securities. The following are certain inputs and techniques that the Portfolios generally use to evaluate how to classify each major category of assets and liabilities in accordance with Generally Accepted Accounting Principles (“GAAP”).
Equity Securities (Common and Preferred Stock) – Equity securities traded in inactive markets and certain foreign equity securities are valued using inputs which include broker-dealer quotes, recently executed transactions adjusted for changes in the benchmark index, or evaluated price quotes received from independent pricing services that take into account the integrity of the market sector and issuer, the individual characteristics of the security, and information received from broker-dealers and other market sources pertaining to the issuer or security. To the extent that these inputs are observable, the values of equity securities are categorized as Level 2. To the extent that these inputs are unobservable the values are categorized as Level 3.
U.S. Treasury Obligations – U.S. Treasuries are valued by independent pricing services based on pricing models that evaluate the mean between the most recently quoted bid and ask price. The models also take into consideration data received from active market makers and broker-dealers, yield curves, and the spread over comparable U.S. Treasury issues. The spreads change daily in response to market conditions and are generally obtained from the new issue market and broker-dealer sources. To the extent that these inputs are observable, the values of U.S. Treasury obligations are categorized as Level 2. To the extent that these inputs are unobservable the values are categorized as Level 3.
Government Sponsored Enterprise and Mortgage-Backed Securities – Government sponsored enterprise and mortgage-backed securities are valued by independent pricing services using pricing models based on inputs that include issuer type, coupon, cash flows, mortgage prepayment projection tables and Adjustable Rate Mortgage evaluations that incorporate index data, periodic and life caps, the next coupon reset date, and the convertibility of the bond. To the extent that these inputs are observable, the values of Government sponsored enterprise and mortgage-backed securities are categorized as Level 2. To the extent that these inputs are unobservable the values are categorized as Level 3.
Municipal Bonds – Municipal bonds are valued by independent pricing services based on pricing models that take into account, among other factors, information received from market makers and broker-dealers, current trades, bid-want lists, offerings, market movements, the callability of the bond, state of issuance, benchmark yield curves, and bond insurance. To the extent that these inputs are observable, the values of municipal bonds are categorized as Level 2. To the extent that these inputs are unobservable the values are categorized as Level 3.
86 Allianz Global Investors Managed Accounts Trust Annual Report ï 10.31.10
Allianz Global Investors Managed Accounts Trust Notes to Financial Statements
October 31, 2010
1. Organization and Significant Accounting Policies (continued)
Sovereign Debt Obligations – Sovereign Debt Obligations are valued by independent pricing services based on discounted cash flow models that incorporate option adjusted spreads along with benchmark curves and credit spreads. In addition, international bond markets are monitored regularly for information pertaining to the issuer and/or the specific issue. To the extent that these inputs are observable, the values of Sovereign Debt Obligations are categorized as Level 2. To the extent that these inputs are unobservable the values are categorized as Level 3.
Corporate Bonds & Notes – Corporate bonds and notes are generally comprised of two main categories: investment grade bonds and high yield bonds. Investment grade bonds are valued by independent pricing services using various inputs and techniques, which include broker-dealer quotations, live trading levels, recently executed transactions in securities of the issuer or comparable issuers, and option adjusted spread models that include base curve and spread curve inputs. Adjustments to individual bonds can be applied to recognize trading differences compared to other bonds issued by the same issuer. High yield bonds are valued by independent pricing services based primarily on broker-dealer quotations from relevant market makers and recently executed transactions in securities of the issuer or comparable issuers. The broker-dealer quotations received are supported by credit analysis of the issuer that takes into consideration credit quality assessments, daily trading activity, and the activity of the underlying equities, listed bonds and sector-specific trends. To the extent that these inputs are observable, the values of corporate bonds are categorized as Level 2. To the extent that these inputs are unobservable the values are categorized as Level 3.
Asset-Backed Securities and Collateralized Mortgage Obligations – Asset-backed securities and collateralized mortgage obligations are valued by independent pricing services using pricing models based on a security’s average life volatility. The models also take into account tranche characteristics such as coupon average life, collateral types, ratings, the issuer and tranche type, underlying collateral and performance of the collateral, and discount margin for certain floating rate issues. To the extent that these inputs are observable, the values of asset-backed securities and collateralized mortgage obligations are categorized as Level 2. To the extent that these inputs are unobservable the values are categorized as Level 3.
Option Contracts – Option contracts traded over the counter (“OTC”) are valued by independent pricing services based on pricing models that incorporate various inputs such as interest rates, credit spreads, currency exchange rates and volatility measurements for in-the-money, at-the-money, and out-of-the-money contracts based on a given strike price. To the extent that these inputs are observable, the values of OTC option contracts are categorized as Level 2. To the extent that these inputs are unobservable the values are categorized as Level 3.
Forward Foreign Currency Contracts – Forward foreign currency contracts are valued by independent pricing services using various inputs and techniques, which include broker-dealer quotations, actual trading information and foreign currency exchange rates gathered from leading market makers and foreign currency exchange trading centers throughout the world. To the extent that these inputs are observable, the values of forward foreign currency contracts are categorized as Level 2. To the extent that these inputs are unobservable the values are categorized as Level 3.
Interest Rate Swaps – Interest rate swaps are valued by independent pricing services using pricing models that are based on real-time intraday snapshots of relevant interest rate curves that are built using the most actively traded securities for a given maturity. The pricing models also incorporate cash and money market rates. In addition, market data pertaining to interest rate swaps are monitored regularly to ensure that interest rates are properly depicting the current market rate. To the extent that these inputs are observable, the values of interest rate swaps are categorized as Level 2. To the extent that these inputs are unobservable the values are categorized as Level 3.
Credit Default Swaps – Credit default swaps are valued by independent pricing services using pricing models that take into account, among other factors, information received from market makers and broker-dealers, default probabilities from index specific credit spread curves, recovery rates, and cash flows. To the extent that these inputs are observable, the values of credit default swaps are categorized as Level 2. To the extent that these inputs are unobservable the values are categorized as Level 3.
Senior Loans – Senior Loans are valued by independent pricing services based on the average of quoted prices received from multiple dealers or valued relative to other benchmark securities when broker-dealer quotes are unavailable. To the extent that these inputs are observable, the values of Senior Loans are categorized as Level 2. To the extent that these inputs are unobservable the values are categorized as Level 3.
The Portfolios’ policy is to recognize transfers between levels at the end of the reporting period.
10.31.10 ï Allianz Global Investors Managed Accounts Trust Annual Report 87
Allianz Global Investors Managed Accounts Trust Notes to Financial Statements
October 31, 2010
1. Organization and Significant Accounting Policies (continued)
A summary of the inputs used at October 31, 2010 in valuing each Portfolio’s assets and liabilities is listed below:
| | | | | | | | | | | | | | | | | |
Equity Shares: Series I:
| |
| | | | | | Level 2 –
| | | Level 3 –
| | | | |
| | | | | | Other Significant
| | | Significant
| | | | |
| | | Level 1 –
| | | Observable
| | | Unobservable
| | | Value at
| |
| | | Quoted Prices | | | Inputs | | | Inputs | | | 10/31/10 | |
| | |
| |
Investments in Securities – Assets | | | | | | | | | | | | | | | | |
| Common Stock: | | | | | | | | | | | | | | | | |
| China | | | $77,007 | | | | $21,725 | | | | — | | | | $98,732 | |
| Hong Kong | | | 6,187 | | | | 61,539 | | | | — | | | | 67,726 | |
| Israel | | | 47,025 | | | | — | | | | — | | | | 47,025 | |
| Korea (Republic of) | | | 66,760 | | | | — | | | | — | | | | 66,760 | |
| All Other | | | — | | | | 1,938,727 | | | | — | | | | 1,938,727 | |
| Preferred Stock | | | 37,986 | | | | 126,197 | | | | — | | | | 164,183 | |
| | | | | | | | | | | | | | | | | |
Total Investments | | | $234,965 | | | | $2,148,188 | | | | — | | | | $2,383,153 | |
| | | | | | | | | | | | | | | | | |
| | | | | | | | | | | | | | | | | |
Fixed Income SHares: Series C:
| |
| | | | | | Level 2 –
| | | Level 3 –
| | | | |
| | | | | | Other Significant
| | | Significant
| | | | |
| | | Level 1 –
| | | Observable
| | | Unobservable
| | | Value at
| |
| | | Quoted Prices | | | Inputs | | | Inputs | | | 10/31/10 | |
| | |
| |
Investments in Securities – Assets | | | | | | | | | | | | | | | | |
| Corporate Bonds & Notes: | | | | | | | | | | | | | | | | |
| Airlines | | | — | | | | $47,960,250 | | | | $8,446,018 | | | | $56,406,268 | |
| Financial Services | | | — | | | | 1,082,555,205 | | | | 21,134,833 | | | | 1,103,690,038 | |
| All Other | | | — | | | | 1,203,745,829 | | | | — | | | | 1,203,745,829 | |
| Sovereign Debt Obligations | | | — | | | | 287,772,572 | | | | — | | | | 287,772,572 | |
| Municipal Bonds | | | — | | | | 216,183,589 | | | | — | | | | 216,183,589 | |
| Mortgage-Backed Securities | | | — | | | | 179,341,067 | | | | 123,362 | | | | 179,464,429 | |
| U.S. Government Agency Securities | | | — | | | | 112,562,011 | | | | — | | | | 112,562,011 | |
| Senior Loans | | | — | | | | 11,290,999 | | | | — | | | | 11,290,999 | |
| Asset-Backed Securities | | | — | | | | 8,953,335 | | | | — | | | | 8,953,335 | |
| Preferred Stock | | | $1,228,080 | | | | — | | | | — | | | | 1,228,080 | |
| Convertible Preferred Stock | | | 766,518 | | | | — | | | | — | | | | 766,518 | |
| Short-Term Investments: | | | | | | | | | | | | | | | | |
| Corporate Notes: | | | | | | | | | | | | | | | | |
| Financial Services | | | — | | | | 35,682,103 | | | | 736,890 | | | | 36,418,993 | |
| All Other | | | — | | | | 11,490,123 | | | | — | | | | 11,490,123 | |
| Other Short-Term Investments | | | — | | | | 97,718,377 | | | | — | | | | 97,718,377 | |
| | | | | | | | | | | | | | | | | |
Total Investments in Securities – Assets | | | $1,994,598 | | | | $3,295,255,460 | | | | $30,441,103 | | | | $3,327,691,161 | |
| | | | | | | | | | | | | | | | | |
88 Allianz Global Investors Managed Accounts Trust Annual Report ï 10.31.10
Allianz Global Investors Managed Accounts Trust Notes to Financial Statements
October 31, 2010
1. Organization and Significant Accounting Policies (continued)
| | | | | | | | | | | | | | | | | |
| | | | | | Level 2 –
| | | Level 3 –
| | | | |
| | | | | | Other Significant
| | | Significant
| | | | |
| | | Level 1 –
| | | Observable
| | | Unobservable
| | | Value at
| |
| | | Quoted Prices | | | Inputs | | | Inputs | | | 10/31/10 | |
| | |
| |
Investments in Securities – Liabilities | | | | | | | | | | | | | | | | |
| Options Written, at value: | | | | | | | | | | | | | | | | |
| Credit Contracts | | | — | | | | $(1,984,906 | ) | | | — | | | | $(1,984,906 | ) |
| Interest Rate Contracts | | | — | | | | (18,857,637 | ) | | | — | | | | (18,857,637 | ) |
| | | | | | | | | | | | | | | | | |
Total Investments in Securities – Liabilities | | | — | | | | $(20,842,543 | ) | | | — | | | | $(20,842,543 | ) |
| | | | | | | | | | | | | | | | | |
Other Financial Instruments* – Assets | | | | | | | | | | | | | | | | |
| Credit Contracts | | | — | | | | $11,109,738 | | | | — | | | | $11,109,738 | |
| Interest Rate Contracts | | | $20,693,312 | | | | 23,008,170 | | | | — | | | | 43,701,482 | |
| Foreign Exchange Contracts | | | — | | | | 19,092,334 | | | | — | | | | 19,092,334 | |
| | | | | | | | | | | | | | | | | |
Total Other Financial Instruments * – Assets | | | $20,693,312 | | | | $53,210,242 | | | | — | | | | $73,903,554 | |
| | | | | | | | | | | | | | | | | |
Other Financial Instruments* – Liabilities | | | | | | | | | | | | | | | | |
| Credit Contracts | | | — | | | | $(1,429,370 | ) | | | — | | | | $(1,429,370 | ) |
| Interest Rate Contracts | | | $(12,217,183 | ) | | | (3,198,903 | ) | | | | | | | (15,416,086 | ) |
| Foreign Exchange Contracts | | | — | | | | (9,489,899 | ) | | | — | | | | (9,489,899 | ) |
| | | | | | | | | | | | | | | | | |
Total Other Financial Instruments * – Liabilities | | | $(12,217,183 | ) | | | $(14,118,172 | ) | | | — | | | | $(26,335,355 | ) |
| | | | | | | | | | | | | | | | | |
Total Investments | | | $10,470,727 | | | | $3,313,504,987 | | | | $30,441,103 | | | | $3,354,416,817 | |
| | | | | | | | | | | | | | | | | |
| | | | | | | | | | | | | | | | | |
Fixed Income SHares: Series H:
| |
| | | | | | Level 2 –
| | | Level 3 –
| | | | |
| | | | | | Other Significant
| | | Significant
| | | | |
| | | Level 1 –
| | | Observable
| | | Unobservable
| | | Value at
| |
| | | Quoted Prices | | | Inputs | | | Inputs | | | 10/31/10 | |
| | |
| |
Investments in Securities – Assets | | | | | | | | | | | | | | | | |
| Municipal Bonds | | | — | | | | $7,468,804 | | | | — | | | | $7,468,804 | |
| Money Market Fund | | | — | | | | 195,000 | | | | — | | | | 195,000 | |
| | | | | | | | | | | | | | | | | |
Total Investments | | | — | | | | $7,663,804 | | | | — | | | | $7,663,804 | |
| | | | | | | | | | | | | | | | | |
10.31.10 ï Allianz Global Investors Managed Accounts Trust Annual Report 89
Allianz Global Investors Managed Accounts Trust Notes to Financial Statements
October 31, 2010
1. Organization and Significant Accounting Policies (continued)
| | | | | | | | | | | | | | | | | |
Fixed Income SHares: Series M:
| |
| | | | | | Level 2 –
| | | Level 3 –
| | | | |
| | | | | | Other Significant
| | | Significant
| | | | |
| | | Level 1 –
| | | Observable
| | | Unobservable
| | | Value at
| |
| | | Quoted Prices | | | Inputs | | | Inputs | | | 10/31/10 | |
| | |
| |
Investments in Securities – Assets | | | | | | | | | | | | | | | | |
| U.S. Government Agency Securities | | | — | | | | $2,108,100,748 | | | | — | | | | $2,108,100,748 | |
| Corporate Bonds & Notes: | | | | | | | | | | | | | | | | |
| Financial Services | | | — | | | | 718,564,432 | | | | $10,551,300 | | | | 729,115,732 | |
| All Other | | | — | | | | 721,490,369 | | | | — | | | | 721,490,369 | |
| U.S. Treasury Obligations | | | — | | | | 726,528,806 | | | | — | | | | 726,528,806 | |
| Mortgage-Backed Securities | | | — | | | | 459,995,790 | | | | 17,504,496 | | | | 477,500,286 | |
| Municipal Bonds | | | $16,400,000 | | | | 382,299,776 | | | | — | | | | 398,699,776 | |
| Sovereign Debt Obligations | | | — | | | | 320,538,431 | | | | — | | | | 320,538,431 | |
| Asset-Backed Securities | | | — | | | | 50,932,342 | | | | 754,471 | | | | 51,686,813 | |
| Convertible Preferred Stock | | | 13,480,703 | | | | — | | | | — | | | | 13,480,703 | |
| Short-Term Investments | | | — | | | | 31,837,319 | | | | — | | | | 31,837,319 | |
| | | | | | | | | | | | | | | | | |
Total Investments in Securities – Assets | | | $29,880,703 | | | | $5,520,288,013 | | | | $28,810,267 | | | | $5,578,978,983 | |
| | | | | | | | | | | | | | | | | |
Investments in Securities – Liabilities | | | | | | | | | | | | | | | | |
| Options Written, at value: | | | | | | | | | | | | | | | | |
| Interest Rate Contracts | | | — | | | | — | | | | $(8,020,229 | ) | | | $(8,020,229 | ) |
| Securities Sold Short, at value | | | — | | | | $(16,380,229 | ) | | | — | | | | (16,380,229 | ) |
| | | | | | | | | | | | | | | | | |
Total Investments in Securities – Liabilities | | | — | | | | $(16,380,229 | ) | | | $(8,020,229 | ) | | | $(24,400,458 | ) |
| | | | | | | | | | | | | | | | | |
Other Financial Instruments* – Assets | | | | | | | | | | | | | | | | |
| Credit Contracts | | | — | | | | $15,411,662 | | | | — | | | | $15,411,662 | |
| Interest Rate Contracts | | | $4,316,850 | | | | 19,773,475 | | | | — | | | | 24,090,325 | |
| Foreign Exchange Contracts | | | — | | | | 371,502 | | | | — | | | | 371,502 | |
| | | | | | | | | | | | | | | | | |
Total Other Financial Instruments* – Assets | | | $4,316,850 | | | | $35,556,639 | | | | — | | | | $39,873,489 | |
| | | | | | | | | | | | | | | | | |
Other Financial Instruments* – Liabilities | | | | | | | | | | | | | | | | |
| Credit Contracts | | | — | | | | $(3,458,211 | ) | | | — | | | | $(3,458,211 | ) |
| Interest Rate Contracts | | | $(23,123 | ) | | | — | | | | — | | | | (23,123 | ) |
| Foreign Exchange Contracts | | | — | | | | (6,998,340 | ) | | | — | | | | (6,998,340 | ) |
| | | | | | | | | | | | | | | | | |
Total Other Financial Instruments* – Liabilities | | | $(23,123 | ) | | | $(10,456,551 | ) | | | — | | | | $(10,479,674 | ) |
| | | | | | | | | | | | | | | | | |
Total Investments | | | $34,174,430 | | | | $5,529,007,872 | | | | $20,790,038 | | | | $5,583,972,340 | |
| | | | | | | | | | | | | | | | | |
90 Allianz Global Investors Managed Accounts Trust Annual Report ï 10.31.10
Allianz Global Investors Managed Accounts Trust Notes to Financial Statements
October 31, 2010
1. Organization and Significant Accounting Policies (continued)
| | | | | | | | | | | | | | | | | |
Fixed Income SHares: Series R:
| |
| | | | | | Level 2 –
| | | Level 3 –
| | | | |
| | | | | | Other Significant
| | | Significant
| | | | |
| | | Level 1 –
| | | Observable
| | | Unobservable
| | | Value at
| |
| | | Quoted Prices | | | Inputs | | | Inputs | | | 10/31/10 | |
| | |
| |
Investments in Securities – Assets | | | | | | | | | | | | | | | | |
| U.S. Treasury Obligations | | | — | | | | $541,252,044 | | | | — | | | | $541,252,044 | |
| Corporate Bonds & Notes | | | — | | | | 96,063,879 | | | | — | | | | 96,063,879 | |
| Mortgage-Backed Securities | | | — | | | | 17,628,896 | | | | $5,663,219 | | | | 23,292,115 | |
| Asset-Backed Securities | | | — | | | | 2,746,274 | | | | 17,818,475 | | | | 20,564,749 | |
| Sovereign Debt Obligations | | | — | | | | 16,513,626 | | | | — | | | | 16,513,626 | |
| U.S. Government Agency Securities | | | — | | | | 2,775,244 | | | | — | | | | 2,775,244 | |
| Senior Loans | | | — | | | | 395,000 | | | | — | | | | 395,000 | |
| Convertible Preferred Stock | | | $200,000 | | | | — | | | | — | | | | 200,000 | |
| Municipal Bonds | | | — | | | | 77,847 | | | | — | | | | 77,847 | |
| Short-Term Investments | | | — | | | | 13,287,558 | | | | — | | | | 13,287,558 | |
| Options Purchased: | | | | | | | | | | | | | | | | |
| Interest Rate Contracts | | | — | | | | 30,529 | | | | — | | | | 30,529 | |
| | | | | | | | | | | | | | | | | |
Total Investments in Securities – Assets | | | $200,000 | | | | $690,770,897 | | | | $23,481,694 | | | | $714,452,591 | |
| | | | | | | | | | | | | | | | | |
Investments in Securities – Liabilities | | | | | | | | | | | | | | | | |
| Options Written, at value: | | | | | | | | | | | | | | | | |
| Credit Contracts | | | — | | | | $(38,592 | ) | | | — | | | | $(38,592 | ) |
| Interest Rate Contracts | | | — | | | | (977,826 | ) | | | $(689,228 | ) | | | (1,667,054 | ) |
| | | | | | | | | | | | | | | | | |
Total Investments in Securities – Liabilities | | | — | | | | $(1,016,418 | ) | | | $(689,228 | ) | | | $(1,705,646 | ) |
| | | | | | | | | | | | | | | | | |
Other Financial Instruments* – Assets | | | | | | | | | | | | | | | | |
| Credit Contracts | | | — | | | | $1,337,633 | | | | — | | | | $1,337,633 | |
| Interest Rate Contracts | | | $133,338 | | | | 775,278 | | | | — | | | | 908,616 | |
| Foreign Exchange Contracts | | | — | | | | 834,372 | | | | — | | | | 834,372 | |
| | | | | | | | | | | | | | | | | |
Total Other Financial Instruments* – Assets | | | $133,338 | | | | $2,947,283 | | | | — | | | | $3,080,621 | |
| | | | | | | | | | | | | | | | | |
Other Financial Instruments* – Liabilities | | | | | | | | | | | | | | | | |
| Credit Contracts | | | — | | | | $(190,874 | ) | | | — | | | | $(190,874 | ) |
| Interest Rate Contracts | | | $(531,330 | ) | | | (4,826 | ) | | | — | | | | (536,156 | ) |
| Foreign Exchange Contracts | | | — | | | | (2,162,768 | ) | | | — | | | | (2,162,768 | ) |
| | | | | | | | | | | | | | | | | |
Total Other Financial Instruments* – Liabilities | | | $(531,330 | ) | | | $(2,358,468 | ) | | | — | | | | $(2,889,798 | ) |
| | | | | | | | | | | | | | | | | |
Total Investments | | | $(197,992 | ) | | | $690,343,294 | | | | $22,792,466 | | | | $712,937,768 | |
| | | | | | | | | | | | | | | | | |
There were no significant transfers between Levels 1 and 2 during the year ended October 31, 2010.
10.31.10 ï Allianz Global Investors Managed Accounts Trust Annual Report 91
Allianz Global Investors Managed Accounts Trust Notes to Financial Statements
October 31, 2010
1. Organization and Significant Accounting Policies (continued)
A roll forward of fair value measurements using significant unobservable inputs (Level 3) for the year ended October 31, 2010, was as follows:
| | | | | | | | | | | | | | | | | | | | | | | | | | | | | | | | | |
Fixed Income SHares: Series C:
| |
| | | | | | Net
| | | | | | Net
| | | Net Change
| | | | | | | | | | |
| | | Beginning
| | | Purchases
| | | Accrued
| | | Realized
| | | in Unrealized
| | | Transfers
| | | Transfers
| | | Ending
| |
| | | Balance
| | | (Sales) and
| | | Discounts
| | | Gain
| | | Appreciation/
| | | into
| | | out of
| | | Balance
| |
| | | 10/31/09 | | | Settlements | | | (Premiums) | | | (Loss) | | | Depreciation | | | Level 3** | | | Level 3 | | | 10/31/10 | |
| | |
| |
Investments in Securities – Assets |
| Corporate Bonds & Notes: |
| Airlines | | | $4,341,632 | | | | $3,792,777 | | | | $(35,561 | ) | | | $(5,610 | ) | | | $352,780 | | | | — | | | | — | | | | $8,446,018 | |
| Financial Services | | | 311,000 | | | | 22,177,989 | | | | — | | | | — | | | | (1,354,156 | ) | | | — | | | | — | | | | 21,134,833 | |
| Mortgage-Backed Securities | | | 158,059 | | | | (311,682 | ) | | | 1,606 | | | | 68,369 | | | | 207,010 | | | | — | | | | — | | | | 123,362 | |
| Short-Term Investments: |
| Airlines | | | 3,225,000 | | | | (2,500,000 | ) | | | — | | | | — | | | | (725,000 | ) | | | — | | | | — | | | | — | |
| Financial Services | | | 4,150,876 | | | | (4,241,282 | ) | | | (15,711 | ) | | | 3,538 | | | | 102,579 | | | | $736,890 | | | | | | | | 736,890 | |
| | | | | | �� | | | | | | | | | | | | | | | | | | | | | | | | | | | |
Total Investments | | | $12,186,567 | | | | $18,917,802 | | | | $(49,666 | ) | | | $66,297 | | | | $(1,416,787 | ) | | | $736,890 | | | | — | | | | $30,441,103 | |
| | | | | | | | | | | | | | | | | | | | | | | | | | | | | | | | | |
| | | | | | | | | | | | | | | | | | | | | | | | | | | | | | | | | |
Fixed Income SHares: Series M:
| |
| | | | | | Net
| | | | | | Net
| | | Net Change
| | | | | | | | | | |
| | | Beginning
| | | Purchases
| | | Accrued
| | | Realized
| | | in Unrealized
| | | Transfers
| | | Transfers
| | | Ending
| |
| | | Balance
| | | (Sales) and
| | | Discounts
| | | Gain
| | | Appreciation/
| | | into
| | | out of
| | | Balance
| |
| | | 10/31/09 | | | Settlements | | | (Premiums) | | | (Loss) | | | Depreciation | | | Level 3** | | | Level 3*** | | | 10/31/10 | |
| | |
| |
Investments in Securities – Assets |
| U.S. Government Agency Securities | | | $5,930,401 | | | | — | | | | $28,455 | | | | — | | | | $132,016 | | | | — | | | | $(6,090,872 | ) | | | — | |
| Corporate Bonds & Notes: |
| Financial Services | | | — | | | | $10,780,800 | | | | (3,876 | ) | | | — | | | | (225,624 | ) | | | — | | | | — | | | | $10,551,300 | |
| Mortgage-Backed Securities | | | 26,289,690 | | | | 17,509,960 | | | | 444,702 | | | | — | | | | 5,575,520 | | | | — | | | | (32,315,376 | ) | | | 17,504,496 | |
| Asset-Backed Securities | | | 794,015 | | | | (175,816 | ) | | | — | | | | — | | | | 130,328 | | | | $5,944 | | | | — | | | | 754,471 | |
| | | | | | | | | | | | | | | | | | | | | | | | | | | | | | | | | |
Total Investments in Securities – Assets | | | $33,014,106 | | | | $28,114,944 | | | | $469,281 | | | | — | | | | $5,612,240 | | | | $5,944 | | | | $(38,406,248 | ) | | | $28,810,267 | |
| | | | | | | | | | | | | | | | | | | | | | | | | | | | | | | | | |
Investments in Securities – Liabilities |
| Options Written, at value: |
| Interest Rate Contracts | | | — | | | | $(8,209,618 | ) | | | — | | | | — | | | | $189,389 | | | | — | | | | — | | | | $(8,020,229 | ) |
| | | | | | | | | | | | | | | | | | | | | | | | | | | | | | | | | |
Total Investments | | | $33,014,106 | | | | $19,905,326 | | | | $469,281 | | | | — | | | | $5,801,629 | | | | $5,944 | | | | $(38,406,248 | ) | | | $20,790,038 | |
| | | | | | | | | | | | | | | | | | | | | | | | | | | | | | | | | |
92 Allianz Global Investors Managed Accounts Trust Annual Report ï 10.31.10
Allianz Global Investors Managed Accounts Trust Notes to Financial Statements
October 31, 2010
1. Organization and Significant Accounting Policies (continued)
| | | | | | | | | | | | | | | | | | | | | | | | | | | | | | | | | |
Fixed Income SHares: Series R:
| |
| | | | | | Net
| | | | | | Net
| | | Net Change
| | | | | | | | | | |
| | | Beginning
| | | Purchases
| | | Accrued
| | | Realized
| | | in Unrealized
| | | Transfers
| | | Transfers
| | | Ending
| |
| | | Balance
| | | (Sales) and
| | | Discounts
| | | Gain
| | | Appreciation/
| | | into
| | | out of
| | | Balance
| |
| | | 10/31/09 | | | Settlements | | | (Premiums) | | | (Loss) | | | Depreciation | | | Level 3 | | | Level 3 | | | 10/31/10 | |
| | |
| |
Investments in Securities – Assets |
| Corporate Bonds & Notes: |
| Financial Services | | | $392,280 | | | | $(400,000 | ) | | | $1,044 | | | | — | | | | $6,676 | | | | — | | | | — | | | | — | |
| Mortgage-Backed Securities | | | — | | | | 5,664,987 | | | | — | | | | — | | | | (1,768 | ) | | | — | | | | — | | | | $5,663,219 | |
| Asset-Backed Securities | | | — | | | | 17,718,093 | | | | 19,983 | | | | $19,474 | | | | 60,925 | | | | — | | | | — | | | | 17,818,475 | |
| | | | | | | | | | | | | | | | | | | | | | | | | | | | | | | | | |
Total Investments in Securities – Assets | | | $392,280 | | | | $22,983,080 | | | | $21,027 | | | | $19,474 | | | | $65,833 | | | | — | | | | — | | | | $23,481,694 | |
| | | | | | | | | | | | | | | | | | | | | | | | | | | | | | | | | |
Investments in Securities – Liabilities |
| Options Written, at value: |
| Interest Rate Contracts | | | — | | | | $(737,440 | ) | | | — | | | | — | | | | 48,212 | | | | — | | | | — | | | | $(689,228 | ) |
| | | | | | | | | | | | | | | | | | | | | | | | | | | | | | | | | |
Total Investments | | | $392,280 | | | | $22,245,640 | | | | $21,027 | | | | $19,474 | | | | $114,045 | | | | — | | | | — | | | | $22,792,466 | |
| | | | | | | | | | | | | | | | | | | | | | | | | | | | | | | | | |
| |
| * | Other Financial Instruments are derivative instruments not reflected in the Schedules of Investments, such as futures contracts, swap agreements and forward foreign currency contracts, which are valued at the unrealized appreciation (depreciation) of the instrument. |
| |
| ** | Transferred out of Level 2 into Level 3 because sufficient observable inputs were not available. |
| |
| *** | Transferred out of Level 3 into Level 2 because sufficient observable inputs are available. |
The net change in unrealized appreciation/depreciation of Level 3 investments and other financial instruments, which Fixed Income SHares: Series C, Series M and Series R held at October 31, 2010, was $(1,034,552), $27,507 and $96,186, respectively. Net realized gain (loss) and net change in unrealized appreciation/depreciation are reflected on the Statements of Operations.
(c) Investment Transactions and Investment Income
Investment transactions are accounted for on the trade date. Securities purchased and sold on a when-issued or delayed-delivery basis may be settled a month or more after the trade date. Realized gains and losses on investments are determined on an identified cost basis. Interest income adjusted for the accretion of discounts and amortization of premiums is recorded on an accrual basis. Discounts or premiums on debt securities purchased are accreted or amortized to interest income over the lives of the respective securities. Dividend income is recorded on the ex-dividend date. Facility fees and other fees (such as origination fees) received by the Portfolios are amortized as income over the expected term of the loan. Commitment fees received by the Portfolios relating to unfunded purchase commitments are recorded as other fee income upon receipt. Paydown gains and losses are netted and recorded as interest income on the Statements of Operations.
(d) Federal Income Taxes
The Portfolios intend to distribute all of their taxable income and to comply with the requirements of Subchapter M of the U.S. Internal Revenue Code of 1986, as amended, applicable to regulated investment companies. Accordingly, no provision for U.S. federal income taxes is required.
Accounting for uncertainty in income taxes establishes for all entities, including pass-through entities such as the Portfolios, a minimum threshold for financial statement recognition of the benefit of positions taken in filing tax returns (including whether an entity is taxable in a particular jurisdiction), and requires certain expanded tax disclosures. The Portfolios’ management has determined that its evaluation has resulted in no material impact to the Portfolios’ financial statements at October 31, 2010. The Portfolios’ federal income tax returns for the prior three fiscal years (since inception for Equity Shares: Series I) remain subject to examination by the Internal Revenue Service.
10.31.10 ï Allianz Global Investors Managed Accounts Trust Annual Report 93
Allianz Global Investors Managed Accounts Trust Notes to Financial Statements
October 31, 2010
1. Organization and Significant Accounting Policies (continued)
(e) Dividends and Distributions
The Portfolios, with the exception of Equity Shares: Series I, declare dividends from net investment income monthly to shareholders. Equity Shares: Series I will declare dividends from net investment income, if any, at least annually. Distributions of net realized capital gains for all Series, if any, are paid at least annually. The Portfolios record dividends and distributions to their respective shareholders on the ex-dividend date. The amount of dividends and distributions from net investment income and net realized capital gains are determined in accordance with federal income tax regulations, which may differ from GAAP. These ‘‘book-tax” differences are considered either temporary or permanent in nature. To the extent these differences are permanent in nature, such amounts are reclassified within the capital accounts based on their federal income tax treatment. Temporary differences do not require reclassification. To the extent dividends and/or distributions exceed current and accumulated earnings and profits for federal income tax purposes, they are reported as dividends and/or distributions to shareholders from return of capital.
(f) Foreign Currency Translation
The Portfolios’ accounting records are maintained in U.S. dollars as follows: (1) the foreign currency market value of investments and other assets and liabilities denominated in foreign currencies are translated at the prevailing exchange rate at the end of the period; and (2) purchases and sales, income and expenses are translated at the prevailing exchange rate on the respective dates of such transactions. The resulting net foreign currency gain (loss) is included in the Portfolios’ Statements of Operations.
The Portfolios do not generally isolate that portion of the results of operations arising as a result of changes in the foreign currency exchange rates from the fluctuations arising from changes in the market prices of securities. Accordingly, such foreign currency gain (loss) is included in net realized and unrealized gain (loss) on investments. However, the Portfolios do isolate the effect of fluctuations in foreign currency exchange rates when determining the gain (loss) upon the sale or maturity of foreign currency denominated debt obligations pursuant to U.S. federal income tax regulations; such amount is categorized as foreign currency gain (loss) for both financial reporting and income tax reporting purposes.
(g) Senior Loans
The Portfolios purchase assignments of, and participations in, Senior Loans originated, negotiated and structured by a U.S. or foreign commercial bank, insurance company, finance company or other financial institution (the “Agent”) for a lending syndicate of financial institutions (the “Lender”). When purchasing an assignment, the Portfolios succeed to all the rights and obligations under the loan agreement with the same rights and obligations as the assigning Lender. Assignments may, however, be arranged through private negotiations between potential assignees and potential assignors, and the rights and obligations acquired by the purchaser of an assignment may differ from, and be more limited than, those held by the assigning Lender.
(h) Repurchase Agreements
The Portfolios enter into transactions with their custodian bank or securities brokerage firms whereby they purchase securities under agreements to resell such securities at an agreed upon price and date (“repurchase agreements”). The Portfolios, through their custodian, take possession of securities collateralizing the repurchase agreement. Such agreements are carried at the contract amount in the financial statements, which is considered to represent fair-value. Collateral pledged (the securities received), which consists primarily of U.S. government obligations and asset-backed securities, is held by the custodian bank for the benefit of the Portfolios until maturity of the repurchase agreement. Provisions of the repurchase agreements and the procedures adopted by the Portfolios require that the market value of the collateral, including accrued interest thereon, be sufficient in the event of default by the counterparty. If the counterparty defaults and the value of the collateral declines or if the counterparty enters an insolvency proceeding, realization of the collateral by the Portfolios may be delayed or limited.
(i) Reverse Repurchase Agreements
In a reverse repurchase agreement, the Portfolios sell securities to a bank or broker-dealer and agree to repurchase the securities at a mutually agreed upon date and price. Generally, the effect of such a transaction is that the Portfolios can recover and reinvest all or most of the cash invested in portfolio securities involved during the term of the reverse repurchase agreement and still be entitled to the returns associated with those portfolio securities. Such transactions are advantageous if the interest cost to the Portfolios of the reverse repurchase transaction is less than the returns it obtains on investments purchased with the cash. To the extent a Portfolio does not cover its positions in reverse repurchase agreements (by segregating liquid assets at least equal in amount to the forward purchase commitment), the Portfolio’s uncovered obligations under the agreements will be subject to each Portfolio’s limitations on borrowings. Reverse repurchase agreements involve leverage risk and also the risk that the market value of the securities that the Portfolios
94 Allianz Global Investors Managed Accounts Trust Annual Report ï 10.31.10
Allianz Global Investors Managed Accounts Trust Notes to Financial Statements
October 31, 2010
1. Organization and Significant Accounting Policies (continued)
are obligated to repurchase under the agreements may decline below the repurchase price. In the event the buyer of securities under a reverse repurchase agreement files for bankruptcy or becomes insolvent, the Portfolios’ use of the proceeds of the agreement may be restricted pending determination by the other party, or their trustee or receiver, whether to enforce the Portfolios’ obligation to repurchase the securities.
(j) When-Issued/Delayed-Delivery Transactions
When-issued or delayed-delivery transactions involve a commitment to purchase or sell securities for a predetermined price or yield, with payment and delivery taking place beyond the customary settlement period. When delayed-delivery purchases are outstanding, the Portfolios will set aside and maintain until the settlement date in a designated account, liquid assets in an amount sufficient to meet the purchase price. When purchasing a security on a delayed-delivery basis, the Portfolios assume the rights and risks of ownership of the security, including the risk of price and yield fluctuations; consequently, such fluctuations are taken into account when determining the net asset value. The Portfolios may dispose of or renegotiate a delayed-delivery transaction after it is entered into, and may sell when-issued securities before they are delivered, which may result in a realized gain or loss. When a security is sold on a delayed-delivery basis, the Portfolios do not participate in future gains and losses with respect to the security.
(k) Inflation-Indexed Bonds
Inflation-indexed bonds are fixed income securities whose principal value is periodically adjusted to the rate of inflation. The interest rate on these bonds is generally fixed at issuance at a rate lower than typical bonds. Over the life of an inflation-indexed bond, however, interest will be paid based on a principal value, which is adjusted for inflation. Any increase in the principal amount of an inflation-indexed bond will be considered interest income in the Statements of Operations, even though investors do not receive principal until maturity.
(l) Mortgage-Related and Other Asset-Backed Securities
Investments in mortgage-related or other asset-backed securities include mortgage pass-through securities, collateralized mortgage obligations (“CMOs”), commercial mortgage-backed securities, mortgage dollar rolls, CMO residuals, stripped mortgage-backed securities (“SMBSs”) and other securities that directly or indirectly represent a participation in, or are secured by and payable from, mortgage loans on real property. The value of some mortgage-related or asset-backed securities may be particularly sensitive to changes in prevailing interest rates. Early repayment of principal on some mortgage-related securities may expose the Portfolios to a lower rate of return upon reinvestment of principal. The value of these securities may fluctuate in response to the market’s perception of the creditworthiness of the issuers. The decline in liquidity and prices of these types of securities may have made it more difficult to determine fair market value. Additionally, although mortgages and mortgage-related securities are generally supported by some form of government or private guarantee and/or insurance, there is no assurance that private guarantors or insurers will meet their obligations.
One type of SMBS involves one class receiving all or a portion of the interest from the mortgage assets (the interest-only, or “IO” and/or the high coupon rate with relatively low principal amount, or “IOette” class), while the other class will receive all of the principal (the principal-only, or “PO” class). Payments received for IOs and IOettes are included in interest income on the Statements of Operations. Because little to no principal will be received at the maturity of an IO or IOette, adjustments are made to the book value of the security on a daily basis until maturity. SMBSs represent a participation in, or are secured by and payable from, mortgage loans on real property, and may be structured in classes with rights to receive varying proportions of principal and interest. If the underlying mortgage assets experience greater than anticipated payments of principal, the Portfolios may fail to recoup some or all of their initial investment in these securities. The market value of these securities is highly sensitive to changes in interest rates. These adjustments are included in interest income on the Statements of Operations. Payments received for POs are treated as reductions to the cost and par value of the securities.
(m) U.S. Government Agencies or Government-Sponsored Enterprises
Securities issued by U.S. Government agencies or government-sponsored enterprises may not be guaranteed by the U.S. Treasury. The Government National Mortgage Association (“GNMA” or “Ginnie Mae”), a wholly-owned U.S. Government corporation, is authorized to guarantee, with the full faith and credit of the U.S. Government, the timely payment of principal and interest on securities issued by institutions approved by GNMA and backed by pools of mortgages insured by the Federal Housing Administration or guaranteed by the Department of Veterans Affairs. Government-related guarantors not backed by the full faith and credit of the U.S. Government include the Federal National Mortgage Association (“FNMA” or “Fannie Mae”) and the Federal Home Loan Mortgage Corporation (“FHLMC” or “Freddie Mac”). Pass-through securities issued by FNMA are guaranteed as to timely payment of principal and interest by FNMA, but are
10.31.10 ï Allianz Global Investors Managed Accounts Trust Annual Report 95
Allianz Global Investors Managed Accounts Trust Notes to Financial Statements
October 31, 2010
1. Organization and Significant Accounting Policies (continued)
not backed by the full faith and credit of the U.S. Government. FHLMC guarantees the timely payment of interest and ultimate collection of principal, but its participation certificates are not backed by the full faith and credit of the U.S. Government.
(n) Restricted Securities
The Portfolios are permitted to invest in securities that are subject to legal or contractual restrictions on resale. These securities generally may be resold in transactions exempt from registration or to the public if the securities are registered. Disposal of these securities may involve time-consuming negotiations and expenses, and prompt sale at an acceptable price may be difficult.
(o) Short Sales
Short sale transactions involve the Portfolios selling securities they do not own in anticipation of a decline in the market price of the securities. The Portfolios are obligated to deliver securities at the market price at the time the short position is closed. Possible losses from short sales may be unlimited, whereas losses from purchases cannot exceed the total amount invested.
(p) Interest Expense
Interest expense primarily relates to the Portfolios’ participation in reverse repurchase agreements. Interest expense is recorded as it is incurred.
2. Principal Risks
In the normal course of business, the Portfolios trade financial instruments and enter into financial transactions where risk of potential loss exists due to, among other things, changes in the market (market risk) or failure of the other party to a transaction to perform (counterparty risk). The Portfolios also are exposed to various risks such as, but not limited to, interest rate, foreign currency, market price and credit risks.
Interest rate risk is the risk that fixed income securities will decline in value because of changes in interest rates. As nominal interest rates rise, the value of certain fixed income securities held by the Portfolios are likely to decrease. A nominal interest rate can be described as the sum of a real interest rate and an expected inflation rate. Fixed income securities with longer durations tend to be more sensitive to changes in interest rates, usually making them more volatile than securities with shorter durations. Duration is used primarily as a measure of the sensitivity of a fixed income security’s market price to interest rate (i.e. yield) movements.
Variable and floating rate securities generally are less sensitive to interest rate changes but may decline in value if their interest rates do not rise as much, or as quickly, as interest rates in general. Conversely, floating rate securities will not generally increase in value if interest rates decline. Inverse floating rate securities may decrease in value if interest rates increase. Inverse floating rate securities may also exhibit greater price volatility than a fixed rate obligation with similar credit quality. When the Portfolios hold variable or floating rate securities, a decrease (or, in the case of inverse floating rate securities, an increase) in market interest rates will adversely affect the income received from such securities and the net asset value of the Portfolios’ shares.
Mortgage-related and other asset-backed securities often involve risks that are different from or more acute than risks associated with other types of debt instruments. Generally, rising interest rates tend to extend the duration of fixed rate mortgage-related securities, making them more sensitive to changes in interest rates. As a result, in a period of rising interest rates, if the Portfolios hold mortgage-related securities, they may exhibit additional volatility. This is known as extension risk. In addition, adjustable and fixed rate mortgage-related securities are subject to prepayment risk. When interest rates decline, borrowers may pay off their mortgages sooner than expected. This can reduce the returns the Portfolios because the Portfolios may have to reinvest that money at the lower prevailing interest rates. The Portfolios’ investments in other asset-backed securities are subject to risks similar to those associated with mortgage-related securities, as well as additional risks associated with the nature of the assets and the servicing of those assets.
The Portfolios are exposed to credit risk, which is the risk of losing money if the issuer or guarantor of a fixed income security is unable or unwilling, or is perceived (whether by market participants, rating agencies, pricing services or otherwise) as unable or unwilling, to make timely principal and/or interest payments, or to otherwise honor its obligations. Securities are subject to varying degrees of credit risk, which are often reflected in credit ratings.
To the extent the Portfolios directly invest in foreign currencies or in securities that trade in, and receive revenues in, foreign currencies, or in derivatives that provide exposure to foreign currencies, they will be subject to the risk that those currencies will decline in value relative to the U.S. dollar, or, in the case of hedging positions, that the U.S. dollar will
96 Allianz Global Investors Managed Accounts Trust Annual Report ï 10.31.10
Allianz Global Investors Managed Accounts Trust Notes to Financial Statements
October 31, 2010
2. Principal Risks (continued)
decline in value relative to the currency being hedged. Currency rates in foreign countries may fluctuate significantly over short periods of time for a number of reasons, including economic growth, inflation, changes in interest rates, intervention (or the failure to intervene) by U.S. or foreign governments, central banks or supranational entities such as the International Monetary Fund, or the imposition of currency controls or other political developments in the United States or abroad. As a result, the Portfolios’ investments in foreign currency-denominated securities may reduce the returns of the Portfolios.
The Portfolios are subjected to elements of risk not typically associated with investments in the U.S., due to concentrated investments in specific industries or investments in foreign issuers located in a specific country or region. Such concentrations will subject the Portfolios to additional risks resulting from future political or economic conditions in such country or region and the possible imposition of adverse governmental laws of currency exchange restrictions affecting such country or region, which could cause the securities and their markets to be less liquid and prices more volatile than those of comparable U.S. companies.
The market values of equity securities, such as common and preferred stock, or equity-related investments, such as futures and options, may decline due to general market conditions which are not specifically related to a particular company, such as real or perceived adverse economic conditions, changes in the general outlook for corporate earnings, changes in interest or currency rates or adverse investor sentiment. They may also decline due to factors which affect a particular industry or industries, such as labor shortages or increased production costs and competitive conditions within an industry. Equity securities and equity-related investments generally have greater market price volatility than fixed income securities.
The Portfolios are exposed to counterparty risk, or the risk that an institution or other entity with which the Portfolios have unsettled or open transactions will default. The potential loss to the Portfolios could exceed the value of the financial assets recorded in the Portfolios’ financial statements. Financial assets, which potentially expose the Portfolios to counterparty risk, consist principally of cash due from counterparties and investments. The Sub-Adviser for the Fixed Income SHares Portfolios, Pacific Investment Management Company LLC (“PIMCO”), as well as the Sub-Adviser for the Equity Shares: Series I, RCM Capital Management LLC (“RCM” and together with PIMCO, the “Sub-Advisers”), both affiliates of the Investment Manager, seek to minimize the Portfolios’ counterparty risk by performing reviews of each counterparty and by minimizing concentration of counterparty risk by undertaking transactions with multiple customers and counterparties on recognized and reputable exchanges. Delivery of securities sold is only made once the Portfolios have received payment. Payment is made on a purchase once the securities have been delivered by the counterparty. The trade will fail if either party fails to meet its obligation.
The Portfolios are party to International Swaps and Derivatives Association, Inc. Master Agreements (“ISDA Master Agreements”) with select counterparties that govern transactions, over-the-counter derivative and foreign exchange contracts entered into by the Portfolios and those counterparties. The ISDA Master Agreements contain provisions for general obligations, representations, agreements, collateral and events of default or termination. Events of termination include conditions that may entitle counterparties to elect to terminate early and cause settlement of all outstanding transactions under the applicable ISDA Master Agreement. Any election to terminate early could be material to the financial statements of the Portfolios.
The considerations and factors surrounding the settlement of certain purchases and sales made on a delayed-delivery basis are governed by Master Securities Forward Transaction Agreements (“Master Forward Agreements”) between the Portfolios and select counterparties. The Master Forward Agreements maintain provisions for, among other things, initiation and confirmation, payment and transfer, events of default, termination, and maintenance of collateral.
The Portfolios are also party to Master Repurchase Agreements (“Master Repo Agreements”) with select counterparties. The Master Repo Agreements maintain provisions for initiation, income payments, events of default, and maintenance of collateral.
The counterparty risk associated with certain contracts may be reduced by master netting arrangements to the extent that if an event of default occurs, all amounts with the counterparty are terminated and settled on a net basis. The Portfolios’ overall exposure to counterparty risk with respect to transactions subject to master netting arrangements can change substantially within a short period, as it is affected by each transaction subject to the arrangement.
Certain of the Portfolios had credit default swap agreements, foreign currency transactions, security and derivative transactions outstanding with Lehman Brothers entities as issuer, referenced entity, counterparty or guarantor at the time
10.31.10 ï Allianz Global Investors Managed Accounts Trust Annual Report 97
Allianz Global Investors Managed Accounts Trust Notes to Financial Statements
October 31, 2010
2. Principal Risks (continued)
the relevant Lehman Brothers entity filed for protection or was placed in administration. The credit default swap agreements, foreign currency transactions, security and derivative transactions associated with LBSF as counterparty were written down to their estimated recoverable values. Anticipated losses for securities and derivatives transactions associated with Lehman Brothers have been incorporated as net realized gain (loss) on the Statements of Operations of the applicable Portfolios. The remaining balances associated with Lehman Brothers are included in receivable from/ payable to broker on the Statements of Assets and Liabilities of the applicable Portfolios. The estimated recoverable value of receivables is determined by independent broker quotes.
3. Financial Derivative Instruments
Disclosure about derivative instruments and hedging activities requires qualitative disclosure regarding objectives and strategies for using derivatives, quantitative disclosure about fair value amounts of gains and losses on derivative instruments, and disclosure about credit-risk-related contingent features in derivative agreements. The disclosure requirements distinguish between derivatives which are accounted for as “hedges” and those that do not qualify for such accounting. Although the Portfolios sometimes use derivatives for hedging purposes, the Portfolios reflect derivatives at fair value and recognize changes in fair value through the Portfolios’ Statements of Operations, and such derivatives do not qualify for hedge accounting treatment.
(a) Futures Contracts
The Portfolios use futures contracts to manage their exposure to the securities markets or the movements in interest rates and currency values. A futures contract is an agreement between two parties to buy and sell a financial instrument at a set price on a future date. Upon entering into such a contract, the Portfolios are required to pledge to the broker an amount of cash or securities equal to the minimum “initial margin” requirements of the exchange. Pursuant to the contracts, the Portfolios agree to receive from or pay to the broker an amount of cash or securities equal to the daily fluctuation in the value of the contracts. Such receipts or payments are known as “variation margin” and are recorded by the Portfolios as unrealized appreciation or depreciation. When the contracts are closed, the Portfolios record a realized gain or loss equal to the difference between the value of the contracts at the time they were opened and the value at the time they were closed. Any unrealized appreciation or depreciation recorded is simultaneously reversed. The use of futures transactions involves various risks, including the risk of an imperfect correlation in the movements in the price of futures contracts, interest rates and underlying hedging assets, and possible inability or unwillingness of counterparties to meet the terms of their contracts.
(b) Option Transactions
The Portfolios purchase and write (sell) put and call options on securities and indices to earn premiums, for hedging purposes, risk management purposes or otherwise as part of their investment strategies. The risk associated with purchasing an option is that the Portfolios pay a premium whether or not the option is exercised. Additionally, the Portfolios bear the risk of loss of premiums and changes in market value should the counterparty not perform under the contract. Put and call options purchased are accounted for in the same manner as portfolio securities. The cost of securities acquired through the exercise of call options is increased by the premiums paid. The proceeds from securities sold through the exercise of put options are decreased by the premiums paid.
When an option is written, the premium received is recorded as an asset with an equal liability which is subsequently marked to market to reflect the market value of the option written. These liabilities are reflected as options written in the Portfolios’ Statements of Assets and Liabilities. Premiums received from writing options which expire unexercised are recorded on the expiration date as a realized gain. The difference between the premium received and the amount paid on effecting a closing purchase transaction, including brokerage commissions, is also treated as a realized gain, or if the premium is less than the amount paid for the closing purchased transactions, as a realized loss. If a call option written is exercised, the premium is added to the proceeds from the sale of the underlying security in determining whether there has been a realized gain or loss. If a put option written is exercised, the premium reduces the cost basis of the security. In writing an option, the Portfolios bear the market risk of an unfavorable change in the price of the security underlying the written option. Exercise of a written option could result in the Portfolios purchasing a security at a price different from its current market value.
(c) Swap Agreements
Swap agreements are privately negotiated agreements between the Portfolios and a counterparty to exchange or swap investment cash flows, assets, foreign currencies or market-linked returns at specified, future intervals. The Portfolios enter into credit default, cross-currency, interest rate, total return, variance and other forms of swap agreements in order to manage their exposure to credit, currency and interest rate risk. In connection with these agreements, securities may
98 Allianz Global Investors Managed Accounts Trust Annual Report ï 10.31.10
Allianz Global Investors Managed Accounts Trust Notes to Financial Statements
October 31, 2010
3. Financial Derivative Instruments (continued)
be identified as collateral in accordance with the terms of the respective swap agreements to provide assets of value and recourse in the event of default or bankruptcy/insolvency.
Payments received or made at the beginning of the measurement period are reflected as such on the Portfolios’ Statements of Assets and Liabilities and represent payments made or received upon entering into the swap agreement to compensate for differences between the stated terms of the swap agreement and prevailing market conditions (credit spreads, currency exchange rates, interest rates, and other relevant factors). These upfront payments are recorded as realized gains or losses on the Portfolios’ Statements of Operations upon termination or maturity of the swap. A liquidation payment received or made at the termination of the swap is recorded as realized gain or loss on the Portfolios’ Statements of Operations. Net periodic payments received or paid by the Portfolios are included as part of realized gains or losses on the Portfolios’ Statements of Operations.
Entering into these agreements involves, to varying degrees, elements of credit, legal, market and documentation risk in excess of the amounts recognized on the Portfolios’ Statements of Assets and Liabilities. Such risks include the possibility that there will be no liquid market for these agreements, that the counterparties to the agreements may default on their obligation to perform or disagree as to the meaning of contractual terms in the agreements and that there may be unfavorable changes in interest rates.
Credit Default Swap Agreements – Credit default swap agreements involve one party (referred to as the buyer of protection) making a stream of payments to another party (the seller of protection) in exchange for the right to receive a specified return in the event of a default or other credit event for the referenced entity, obligation or index. As sellers of protection on credit default swap agreements, the Portfolios will generally receive from the buyer of protection a fixed rate of income throughout the term of the swap provided that there is no credit event. As sellers, the Portfolios would effectively add leverage to their investment portfolios because, in addition to their total net assets, the Portfolios would be subject to investment exposure on the notional amount of the swap.
If the Portfolios are sellers of protection and a credit event occurs, as defined under the terms of that particular swap agreement, the Portfolio will either (i) pay to the buyer of protection an amount equal to the notional amount of the swap and take delivery of the referenced obligation, other deliverable obligations or underlying securities comprising the referenced index or (ii) pay a net settlement amount in the form of cash or securities equal to the notional amount of the swap less the recovery value of the referenced obligation or underlying securities comprising the referenced index. If the Portfolios are buyers of protection and a credit event occurs, as defined under the terms of that particular swap agreement, the Portfolios will either (i) receive from the seller of protection an amount equal to the notional amount of the swap and deliver the referenced obligation, other deliverable obligations or underlying securities comprising the referenced index or (ii) receive a net settlement amount in the form of cash or securities equal to the notional amount of the swap less the recovery value of the referenced obligation or underlying securities comprising the referenced index. Recovery values are assumed by market makers considering either industry standard recovery rates or entity specific factors and considerations until a credit event occurs. If a credit event has occurred, the recovery value is determined by a facilitated auction whereby a minimum number of allowable broker bids, together with a specified valuation method, are used to calculate the settlement value.
Credit default swap agreements on corporate issues or sovereign issues of an emerging market country involve one party making a stream of payments to another party in exchange for the right to receive a specified return in the event of a default or other credit event. If a credit event occurs and cash settlement is not elected, a variety of other deliverable obligations may be delivered in lieu of the specific referenced obligation. The ability to deliver other obligations may result in a cheapest-to-deliver option (the buyer of protection’s right to choose the deliverable obligation with the lowest value following a credit event). The Portfolios use credit default swaps on corporate issues or sovereign issues of an emerging country to provide a measure of protection against defaults of the issuers (i.e., to reduce risk where the Portfolios own or have exposure to the referenced obligation) or to take an active long or short position with respect to the likelihood of a particular issuer’s default.
Credit default swap agreements on asset-backed securities involve one party making a stream of payments to another party in exchange for the right to receive a specified return in the event of a default or other credit events. Unlike credit default swaps on corporate issues or sovereign issues of an emerging country, deliverable obligations in most instances would be limited to the specific referenced obligation as performance for asset-backed securities can vary across deals. Prepayments, principal paydowns, and other writedown or loss events on the underlying mortgage loans will reduce the outstanding principal balance of the referenced obligation. These reductions may be temporary or permanent as defined under the terms of the swap agreement and the notional amount for the swap agreement will be adjusted by
10.31.10 ï Allianz Global Investors Managed Accounts Trust Annual Report 99
Allianz Global Investors Managed Accounts Trust Notes to Financial Statements
October 31, 2010
3. Financial Derivative Instruments (continued)
corresponding amounts. The Portfolios use credit default swaps on asset-backed securities to provide a measure of protection against defaults of the referenced obligation or to take an active long or short position with respect to the likelihood of a particular referenced obligation’s default.
Credit default swap agreements on credit indices involve one party making a stream of payments to another party in exchange for the right to receive a specified return in the event of a write-down, principal shortfall, interest shortfall or default of all or part of the referenced entities comprising the credit index. A credit index is a basket of credit instruments or exposures designed to be representative of some part of the credit market as a whole. These indices are made up of reference credits that are judged by a poll of dealers to be the most liquid entities in the credit default swap market based on the sector of the index. Components of the indices may include, but are not limited to, investment grade securities, high yield securities, asset backed securities, emerging markets, and/or various credit ratings within each sector. Credit indices are traded using credit default swaps with standardized terms including a fixed spread and standard maturity dates. An index credit default swap references all the names in the index, and if there is a default, the credit event is settled based on that name’s weight in the index, or in the case of a tranched index credit default swap, the credit event is settled based on the name’s weight in the index that falls within the tranche for which the Portfolios bear exposure. The composition of the indices changes periodically, usually every six months, and for most indices, each name has an equal weight in the index. The Portfolios use credit default swaps on credit indices to hedge a portfolio of credit default swaps or bonds with a credit default swap on indices which is less expensive than it would be to buy many credit default swaps to achieve a similar effect. Credit-default swaps on indices are benchmarks for protecting investors owning bonds against default, and traders use them to speculate on changes in credit quality.
Implied credit spreads, represented in absolute terms, utilized in determining the market value of credit default swap agreements on corporate issues or sovereign issues of an emerging market country as of period end are disclosed later in the Notes to Financial Statements (see 5(c)) and serve as an indicator of the current status of the payment/performance risk and represent the likelihood or risk of default for the credit derivative. The implied credit spread of a particular referenced entity reflects the cost of buying/selling protection and may include upfront payments required to be made to enter into the agreement. For credit default swap agreements on asset-backed securities and credit indices, the quoted market prices and resulting values serve as the indicator of the current status of the payment/performance risk. Wider credit spreads and increasing market values, in absolute terms when compared to the notional amount of the swap, represent a deterioration of the referenced entity’s credit soundness and a greater likelihood or risk of default or other credit event occurring as defined under the terms of the agreement.
The maximum potential amount of future payments (undiscounted) that the Portfolios as sellers of protection could be required to make under a credit default swap agreement would be an amount equal to the notional amount of the agreement. Notional amounts of all credit default swap agreements outstanding as of October 31, 2010 for which the Portfolios are sellers of protection are disclosed later in the Notes to Financial Statements (see 5(c)). These potential amounts would be partially offset by any recovery values of the respective referenced obligations, upfront payments received upon entering into the agreement, or net amounts received from the settlement of buy protection credit default swap agreements entered into by the Portfolios for the same referenced entity or entities.
Interest Rate Swap Agreements – Interest rate swap agreements involve the exchange by the Portfolios with a counterparty of their respective commitments to pay or receive interest, e.g., an exchange of floating rate payments for fixed rate payments, with respect to the notional amount of principal. Certain forms of interest rate swap agreements may include: (i) interest rate caps, under which, in return for a premium, one party agrees to make payments to the other to the extent that interest rates exceed a specified rate, or “cap”, (ii) interest rate floors, under which, in return for a premium, one party agrees to make payments to the other to the extent that interest rates fall below a specified rate, or “floor”, (iii) interest rate collars, under which a party sells a cap and purchases a floor or vice versa in an attempt to protect itself against interest rate movements exceeding given minimum or maximum levels, (iv) callable interest rate swaps, under which the counterparty may terminate the swap transaction in whole at zero cost by a predetermined date and time prior to the maturity date, (v) spreadlocks, which allow the interest rate swap users to lock in the forward differential (or spread) between the interest rate swap rate and a specified benchmark, or (vi) basis swaps, under which two parties can exchange variable interest rates based on different money markets.
(d) Forward Foreign Currency Contracts
A forward foreign currency contract is an agreement between two parties to buy and sell a currency at a set exchange rate on a future date. Equity Shares: Series I and Fixed Income SHares: Series C, Series M and Series R enter into forward foreign currency contracts for the purpose of hedging against foreign currency risk arising from the investment or
100 Allianz Global Investors Managed Accounts Trust Annual Report ï 10.31.10
Allianz Global Investors Managed Accounts Trust Notes to Financial Statements
October 31, 2010
3. Financial Derivative Instruments (continued)
anticipated investment in securities denominated in foreign currencies. The Portfolios also enter these contracts for purposes of increasing exposure to a foreign currency or shifting exposure to foreign currency fluctuations from one country to another. The market value of a forward foreign currency contract fluctuates with changes in foreign currency exchange rates. All commitments are marked to market daily at the applicable exchange rates and any resulting unrealized appreciation or depreciation is recorded. Realized gains or losses are recorded at the time the forward contract matures or by delivery of the currency. Risks may arise upon entering these contracts from the potential inability of counterparties to meet the terms of their contracts and from unanticipated movements in the value of a foreign currency relative to the U.S. dollar. In addition, these contracts may involve market risk in excess of unrealized gain (loss) reflected in the Portfolios’ Statements of Assets and Liabilities.
Fair Value of Derivative Instruments at October 31, 2010
The following is a summary of the fair valuation of the Portfolios’ derivative instruments categorized by risk exposure.
The effect of derivative instruments on the Portfolios’ Statements of Assets and Liabilities at October 31, 2010:
Fixed Income SHares: Series C:
| | | | | | | | | | | | | | | | | |
| | | | | | | | | Foreign
| | | | |
| | | Interest Rate
| | | Credit
| | | Exchange
| | | | |
| Location | | Contracts | | | Contracts | | | Contracts | | | Total | |
| | |
| |
Asset derivatives: | | | | | | | | | | | | | | | | |
| Unrealized appreciation of swaps | | | $23,008,170 | | | | $11,109,738 | | | | — | | | | $34,117,908 | |
| Receivable for variation margin on futures contracts* | | | 333,404 | | | | — | | | | — | | | | 333,404 | |
| Unrealized appreciation of forward foreign currency contracts | | | — | | | | — | | | | $19,092,334 | | | | 19,092,334 | |
| | | | | | | | | | | | | | | | | |
Total asset derivatives | | | $23,341,574 | | | | $11,109,738 | | | | $19,092,334 | | | | $53,543,646 | |
| | | | | | | | | | | | | | | | | |
Liability derivatives: | | | | | | | | | | | | | | | | |
| Unrealized depreciation of swaps | | | $(14,015,731 | ) | | | $(1,429,370 | ) | | | — | | | | $(15,445,101 | ) |
| Options written, at value | | | (18,857,637 | ) | | | (1,984,906 | ) | | | — | | | | (20,842,543 | ) |
| Unrealized depreciation of forward foreign currency contracts | | | — | | | | — | | | | $(9,489,899 | ) | | | (9,489,899 | ) |
| | | | | | | | | | | | | | | | | |
Total liability derivatives | | | $(32,873,368 | ) | | | $(3,414,276 | ) | | | $(9,489,899 | ) | | | $(45,777,543 | ) |
| | | | | | | | | | | | | | | | | |
| | | |
| * | | Includes in the net appreciation of $19,292,957 on futures contracts as reported in section 5(a) of the Notes to Financial Statements. |
10.31.10 ï Allianz Global Investors Managed Accounts Trust Annual Report 101
Allianz Global Investors Managed Accounts Trust Notes to Financial Statements
October 31, 2010
3. Financial Derivative Instruments (continued)
Fixed Income SHares: Series M:
| | | | | | | | | | | | | | | | | |
| | | | | | | | | Foreign
| | | | |
| | | Interest Rate
| | | Credit
| | | Exchange
| | | | |
| Location | | Contracts | | | Contracts | | | Contracts | | | Total | |
| | |
| |
Asset derivatives: | | | | | | | | | | | | | | | | |
| Unrealized appreciation of swaps | | | $19,773,475 | | | | $15,411,662 | | | | — | | | | $35,185,137 | |
| Receivable for variation margin on futures contracts* | | | 86,644 | | | | — | | | | — | | | | 86,644 | |
| Unrealized appreciation of forward foreign currency contracts | | | — | | | | — | | | | $371,502 | | | | 371,502 | |
| | | | | | | | | | | | | | | | | |
Total asset derivatives | | | $19,860,119 | | | | $15,411,662 | | | | $371,502 | | | | $35,643,283 | |
| | | | | | | | | | | | | | | | | |
Liability derivatives: | | | | | | | | | | | | | | | | |
| Unrealized depreciation of swaps | | | — | | | | $(3,458,211 | ) | | | — | | | | $(3,458,211 | ) |
| Options written, at value | | | $(8,020,229 | ) | | | — | | | | — | | | | (8,020,229 | ) |
| Unrealized depreciation of forward foreign currency contracts | | | — | | | | — | | | | $(6,998,340 | ) | | | (6,998,340 | ) |
| | | | | | | | | | | | | | | | | |
Total liability derivatives | | | $(8,020,229 | ) | | | $(3,458,211 | ) | | | $(6,998,340 | ) | | | $(18,476,780 | ) |
| | | | | | | | | | | | | | | | | |
| | | |
| * | | Includes in the net appreciation of $4,293,727 on futures contracts as reported in section 5(a) of the Notes to Financial Statements. |
Fixed Income SHares: Series R:
| | | | | | | | | | | | | | | | | |
| | | | | | | | | Foreign
| | | | |
| | | Interest Rate
| | | Credit
| | | Exchange
| | | | |
| Location | | Contracts | | | Contracts | | | Contracts | | | Total | |
| | |
| |
Asset derivatives: | | | | | | | | | | | | | | | | |
| Investments, at value (options purchased) | | | $30,529 | | | | — | | | | — | | | | $30,529 | |
| Unrealized appreciation of swaps | | | 775,278 | | | | $1,337,633 | | | | — | | | | 2,112,911 | |
| Receivable for variation margin on futures contracts* | | | 14,175 | | | | — | | | | — | | | | 14,175 | |
| Unrealized appreciation of forward foreign currency contracts | | | — | | | | — | | | | $834,372 | | | | 834,372 | |
| | | | | | | | | | | | | | | | | |
Total asset derivatives | | | $819,982 | | | | $1,337,633 | | | | $834,372 | | | | $2,991,987 | |
| | | | | | | | | | | | | | | | | |
Liability derivatives: | | | | | | | | | | | | | | | | |
| Unrealized depreciation of swaps | | | $(536,156 | ) | | | $(190,874 | ) | | | — | | | | $(727,030 | ) |
| Options written, at value | | | (1,667,054 | ) | | | (38,592 | ) | | | — | | | | (1,705,646 | ) |
| Unrealized depreciation of forward foreign currency contracts | | | — | | | | — | | | | $(2,162,768 | ) | | | (2,162,768 | ) |
| | | | | | | | | | | | | | | | | |
Total liability derivatives | | | $(2,203,210 | ) | | | $(229,466 | ) | | | $(2,162,768 | ) | | | $(4,595,444 | ) |
| | | | | | | | | | | | | | | | | |
| | | |
| * | | Includes in the net appreciation of $133,338 on futures contracts as reported in section 5(a) of the Notes to Financial Statements. |
102 Allianz Global Investors Managed Accounts Trust Annual Report ï 10.31.10
Allianz Global Investors Managed Accounts Trust Notes to Financial Statements
October 31, 2010
3. Financial Derivative Instruments (continued)
The effect of derivative instruments on the Portfolios’ Statements of Operations for the year ended October 31, 2010:
Fixed Income SHares: Series C:
| | | | | | | | | | | | | | | | | |
| | | | | | | | | Foreign
| | | | |
| | | Interest Rate
| | | Credit
| | | Exchange
| | | | |
| Location | | Contracts | | | Contracts | | | Contracts | | | Total | |
| | |
| |
Net realized gain (loss) on: | | | | | | | | | | | | | | | | |
| Investments (options purchased) | | | $(7,301,279 | ) | | | — | | | | — | | | | $(7,301,279 | ) |
| Futures contracts | | | 111,652,177 | | | | — | | | | — | | | | 111,652,177 | |
| Options written | | | 28,021,673 | | | | $5,460,076 | | | | $1,521,450 | | | | 35,003,199 | |
| Swaps | | | (38,367,766 | ) | | | 10,434,840 | | | | — | | | | (27,932,926 | ) |
| Foreign currency transactions (forward foreign currency contracts) | | | — | | | | — | | | | 5,404,051 | | | | 5,404,051 | |
| | | | | | | | | | | | | | | | | |
Total net realized gain | | | $94,004,805 | | | | $15,894,916 | | | | $6,925,501 | | | | $116,825,222 | |
| | | | | | | | | | | | | | | | | |
Net change in unrealized appreciation/depreciation of: | | | | | | | | | | | | | | | | |
| Investments (options purchased) | | | $(1,645,499 | ) | | | — | | | | — | | | | $(1,645,499 | ) |
| Futures contracts | | | (3,649,666 | ) | | | — | | | | — | | | | (3,649,666 | ) |
| Options written | | | 14,024,178 | | | | $2,383,563 | | | | — | | | | 16,407,741 | |
| Swaps | | | 11,089,710 | | | | 9,396,841 | | | | — | | | | 20,486,551 | |
| Foreign currency transactions (forward foreign currency contracts) | | | — | | | | — | | | | $8,596,469 | | | | 8,596,469 | |
| | | | | | | | | | | | | | | | | |
Total net change in unrealized appreciation/depreciation | | | $19,818,723 | | | | $11,780,404 | | | | $8,596,469 | | | | $40,195,596 | |
| | | | | | | | | | | | | | | | | |
Fixed Income SHares: Series M:
| | | | | | | | | | | | | | | | | |
| | | | | | | | | Foreign
| | | | |
| | | Interest Rate
| | | Credit
| | | Exchange
| | | | |
| Location | | Contracts | | | Contracts | | | Contracts | | | Total | |
| | |
| |
Net realized gain on: | | | | | | | | | | | | | | | | |
| Futures contracts | | | $53,753,342 | | | | — | | | | — | | | | $53,753,342 | |
| Options written | | | 15,888,087 | | | | — | | | | — | | | | 15,888,087 | |
| Swaps | | | 97,431,893 | | | | $6,682,129 | | | | — | | | | 104,114,022 | |
| Foreign currency transactions (forward foreign currency contracts) | | | — | | | | — | | | | $7,606,484 | | | | 7,606,484 | |
| | | | | | | | | | | | | | | | | |
Total net realized gain | | | $167,073,322 | | | | $6,682,129 | | | | $7,606,484 | | | | $181,361,935 | |
| | | | | | | | | | | | | | | | | |
Net change in unrealized appreciation/depreciation of: | | | | | | | | | | | | | | | | |
| Futures contracts | | | $3,228,754 | | | | — | | | | — | | | | $3,228,754 | |
| Options written | | | (3,693,622 | ) | | | — | | | | — | | | | (3,693,622 | ) |
| Swaps | | | (8,845,428 | ) | | | $5,685,360 | | | | — | | | | (3,160,068 | ) |
| Foreign currency transactions (forward foreign currency contracts) | | | — | | | | — | | | | $(6,511,733 | ) | | | (6,511,733 | ) |
| | | | | | | | | | | | | | | | | |
Total net change in unrealized appreciation/depreciation | | | $(9,310,296 | ) | | | $5,685,360 | | | | $(6,511,733 | ) | | | $(10,136,669 | ) |
| | | | | | | | | | | | | | | | | |
10.31.10 ï Allianz Global Investors Managed Accounts Trust Annual Report 103
Allianz Global Investors Managed Accounts Trust Notes to Financial Statements
October 31, 2010
3. Financial Derivative Instruments (continued)
Fixed Income SHares: Series R:
| | | | | | | | | | | | | | | | | |
| | | | | | | | | Foreign
| | | | |
| | | Interest Rate
| | | Credit
| | | Exchange
| | | | |
| Location | | Contracts | | | Contracts | | | Contracts | | | Total | |
| | |
| |
Net realized gain (loss) on: | | | | | | | | | | | | | | | | |
| Investments (options purchased) | | | $(781 | ) | | | — | | | | — | | | | $(781 | ) |
| Futures contracts | | | 5,814,224 | | | | — | | | | — | | | | 5,814,224 | |
| Options written | | | 2,264,501 | | | | — | | | | — | | | | 2,264,501 | |
| Swaps | | | (239,392 | ) | | | $(810,365 | ) | | | — | | | | (1,049,757 | ) |
| Foreign currency transactions (forward foreign currency contracts) | | | — | | | | — | | | | $(756,209 | ) | | | (756,209 | ) |
| | | | | | | | | | | | | | | | | |
Total net realized gain (loss) | | | $7,838,552 | | | | $(810,365 | ) | | | $(756,209 | ) | | | $6,271,978 | |
| | | | | | | | | | | | | | | | | |
Net change in unrealized appreciation/depreciation of: | | | | | | | | | | | | | | | | |
| Investments (options purchased) | | | $(4,676 | ) | | | — | | | | — | | | | $(4,676 | ) |
| Futures contracts | | | (3,376,314 | ) | | | — | | | | — | | | | (3,376,314 | ) |
| Options written | | | 538,925 | | | | $36,331 | | | | — | | | | 575,256 | |
| Swaps | | | (315,055 | ) | | | 1,333,813 | | | | — | | | | 1,018,758 | |
| Foreign currency transactions (forward foreign currency contracts) | | | — | | | | — | | | | $(1,446,609 | ) | | | (1,446,609 | ) |
| | | | | | | | | | | | | | | | | |
Total net change in unrealized appreciation/depreciation | | | $(3,157,120 | ) | | | $1,370,144 | | | | $(1,446,609 | ) | | | $(3,233,585 | ) |
| | | | | | | | | | | | | | | | | |
The average volumes of derivative instrument activities during the year ended October 31, 2010 were:
| | | | | | | | | | | | | | | | | | | | | | | | | | | | | |
| | | Options
| | | Options
| | | | | | | |
| | | Purchased | | | Written | | | Futures Contracts(1) | | | | |
| | | Contracts | | | Notional | | | Contracts | | | Notional | | | Long | | | Short | | | | |
| | |
| |
| | | | | | | | | | | | | | | | | | | | | | | | | | | | | |
| Fixed Income SHares: Series C | | | — | | | | 111,880,000 | | | | 1,060 | | | | 4,071,360,000 | | | | 20,429 | | | | — | | | | | |
| | | | | | | | | | | | | | | | | | | | | | | | | | | | | |
| Fixed Income SHares: Series M | | | — | | | | — | | | | — | | | | 848,680,000 | | | | 7,798 | | | | — | | | | | |
| | | | | | | | | | | | | | | | | | | | | | | | | | | | | |
| Fixed Income SHares: Series R | | | 10 | | | | 11,380,000 | | | | 116 | | | | 197,080,000 | | | | 708 | | | | | | | | | |
| | | | | | | | | | | | | | | | | | | | | | | | | |
| | | Forward Foreign
| | | Credit Default
| | | Interest Rate
| | | | |
| | | Currency Contracts(2) | | | Swap Agreements(3) | | | Swap
| | | | |
| | | Purchased | | | Sold | | | Buy | | | Sell | | | Agreements(3) | | | | |
| | |
| |
| | | | | | | | | | | | | | | | | | | | | | | | | |
| Fixed Income SHares: Series C | | | 767,950,283 | | | | 669,364,271 | | | | 29,920 | | | | 345,519 | | | | 3,349,380 | | | | | |
| | | | | | | | | | | | | | | | | | | | | | | | | |
| Fixed Income SHares: Series M | | | 23,981,830 | | | | 353,605,066 | | | | 18,400 | | | | 254,240 | | | | 1,651,160 | | | | | |
| | | | | | | | | | | | | | | | | | | | | | | | | |
| Fixed Income SHares: Series R | | | 27,792,408 | | | | 44,096,826 | | | | 16,621 | | | | 25,580 | | | | 68,860 | | | | | |
| | | |
| (1) | | Number of contracts |
| (2) | | U.S. $ value on origination date |
| (3) | | Notional amount (in thousands) |
4. Investment Manager/Sub-Advisers/Administrator/Distributor
(a) Investment Manager/Sub-Advisers
The Investment Manager serves as manager of the Portfolios pursuant to an Investment Management Agreement with the Trust. Pursuant to Portfolio Management Agreements between the Investment Manager and PIMCO with regard to Fixed Income SHares: Series C, Series H, Series M and Series R and the Investment Manager and RCM with regard to
104 Allianz Global Investors Managed Accounts Trust Annual Report ï 10.31.10
Allianz Global Investors Managed Accounts Trust Notes to Financial Statements
October 31, 2010
4. Investment Manager/Sub-Advisers/Administrator/Distributor (continued)
Equity Shares: Series I, the Investment Manager employs PIMCO and RCM, to serve as Sub-Advisers and provide investment advisory services to the Fixed Income SHares: Series C, Series H, Series M and Series R Portfolios and Equity Shares: Series I Portfolio, respectively. RCM employs Allianz Global Investors Advisory GmbH (“AGIA”, together with RCM, the Sub-Adviser) to serve as portfolio manager and provide day-to-day investment advisory services to Equity Shares: Series I.
Neither the Investment Manager nor PIMCO, RCM or AGIA receive investment management or other fees from the Portfolios or the Trust. The financial statements reflect the fact that no fees or expenses are incurred by the Portfolios. It should be understood, however, that the Portfolios are an integral part of “wrap-fee” programs sponsored by investment advisers unaffiliated with the Portfolios, the Investment Manager or the Sub-Advisers. Typically, participants in these programs pay a “wrap fee” to their investment adviser. Although the Portfolios do not compensate the Investment Manager or Sub-Advisers directly for their services under the Investment Management Agreements or Portfolio Management Agreements, respectively, the Investment Manager and Sub-Advisers may benefit from their relationship with the sponsors of wrap fee programs for which the Trust is an investment option.
(b) Administrator
The Investment Manager also serves as administrator to the Portfolios pursuant to an administration agreement (“Administration Agreement”) with the Trust. The administrator’s responsibilities include providing or procuring certain administrative services to the Portfolios as well as arranging at its own expense for the provision of legal, audit, custody, transfer agency and other services required for the ordinary operation of the Portfolios, and is responsible for printing, trustees’ fees, and other costs of the Portfolios. Under the Administration Agreement, the Investment Manager has agreed to provide or procure these services, and to bear these expenses at no charge to the Portfolios.
(c) Distributor
Allianz Global Investors Distributors LLC (the “Distributor”), an affiliate of the Investment Manager, serves as the distributor of the Portfolios’ shares. Pursuant to a distribution agreement with the Trust, the Investment Manager, on behalf of the Portfolios, pays the Distributor.
At October 31, 2010, Allianz Global Investors owned 97% and 30% of the outstanding shares of Equity Shares: Series I and Fixed Income SHares: Series H, respectively. Investment activity by this shareholder could have a material impact on Equity Shares: Series I and Fixed Income SHares: Series H.
5. Investments in Securities
Purchases and sales of investments, other than short-term securities and U.S. Government obligations for the year ended October 31, 2010, were:
| | | | | | | | | | | | | | | | | |
| | | U.S. Government Obligations | | | All Other | |
| | | Purchases | | | Sales | | | Purchases | | | Sales | |
| | |
| |
| Equity Shares: Series I | | | — | | | | — | | | | $674,494 | | | | $607,995 | |
| Fixed Income SHares: Series C | | | $3,233,216,254 | | | | $3,563,268,967 | | | | 1,951,874,256 | | | | 1,298,348,899 | |
| Fixed Income SHares: Series H | | | — | | | | — | | | | 5,759,368 | | | | 1,014,331 | |
| Fixed Income SHares: Series M | | | 15,829,842,728 | | | | 14,744,951,446 | | | | 2,544,097,768 | | | | 1,327,301,308 | |
| Fixed Income SHares: Series R | | | 2,312,892,935 | | | | 2,016,802,803 | | | | 170,984,928 | | | | 72,912,938 | |
10.31.10 ï Allianz Global Investors Managed Accounts Trust Annual Report 105
Allianz Global Investors Managed Accounts Trust Notes to Financial Statements
October 31, 2010
5. Investments in Securities (continued)
(a) Futures contracts outstanding at October 31, 2010:
| | | | | | | | | | | | | | | | | |
Fixed Income SHares: Series C:
| |
| | | | | | | Market
| | | | | | Unrealized
| |
| | | | | | | Value
| | | Expiration
| | | Appreciation
| |
| | | Type | | Contracts | | (000s) | | | Date | | | (Depreciation) | |
| | |
| |
| | | | | | | | | | | | | | | | | |
| Long: | | Euro Bobl 5 yr. Futures | | 744 | | | $123,718 | | | | 12/1/10 | | | | $(1,400,355 | ) |
| | | | | | | | | | | | | | | | | |
| | | Financial Futures Euro–90 day | | 2,346 | | | 584,594 | | | | 12/13/10 | | | | 2,815,200 | |
| | | | | | | | | | | | | | | | | |
| | | Financial Futures Euro–90 day | | 2,084 | | | 518,916 | | | | 6/13/11 | | | | 5,945,162 | |
| | | | | | | | | | | | | | | | | |
| | | Financial Futures Euro–90 day | | 4,503 | | | 1,120,571 | | | | 9/19/11 | | | | 11,932,950 | |
| | | | | | | | | | | | | | | | | |
| | | | | | | | | | | | | | | | | |
| | | | | | | | | | | | | | | | $19,292,957 | |
| | | | | | | | | | | | | | | | | |
| | | | | | | | | | | | | | | | | |
Fixed Income SHares: Series M:
| |
| | | | | | | Market
| | | | | | Unrealized
| |
| | | | | | | Value
| | | Expiration
| | | Appreciation
| |
| | | Type | | Contracts | | (000s) | | | Date | | | (Depreciation) | |
| | |
| |
| | | | | | | | | | | | | | | | | |
| Long: | | Euro Bobl 5 yr. Futures | | 12 | | | $1,995 | | | | 12/1/10 | | | | $(23,123 | ) |
| | | | | | | | | | | | | | | | | |
| | | Financial Futures Euro–90 day | | 3,498 | | | 871,658 | | | | 12/13/10 | | | | 4,153,875 | |
| | | | | | | | | | | | | | | | | |
| | | Financial Futures Euro–90 day | | 644 | | | 160,002 | | | | 3/19/12 | | | | 162,975 | |
| | | | | | | | | | | | | | | | | |
| | | | | | | | | | | | | | | | | |
| | | | | | | | | | | | | | | | $4,293,727 | |
| | | | | | | | | | | | | | | | | |
| | | | | | | | | | | | | | | | | |
Fixed Income SHares: Series R:
| |
| | | | | | | Market
| | | | | | | |
| | | | | | | Value
| | | Expiration
| | | Unrealized
| |
| | | Type | | Contracts | | (000s) | | | Date | | | Appreciation | |
| | |
| |
| | | | | | | | | | | | | | | | | |
| Long: | | Financial Futures Euro–90 day | | 113 | | | $28,147 | | | | 3/14/11 | | | | $4,150 | |
| | | | | | | | | | | | | | | | | |
| | | Financial Futures Euro–90 day | | 234 | | | 58,266 | | | | 6/13/11 | | | | 23,688 | |
| | | | | | | | | | | | | | | | | |
| | | Financial Futures Euro–90 day | | 180 | | | 44,721 | | | | 3/19/12 | | | | 105,500 | |
| | | | | | | | | | | | | | | | | |
| | | | | | | | | | | | | | | | | |
| | | | | | | | | | | | | | | | $133,338 | |
| | | | | | | | | | | | | | | | | |
At October 31, 2010, Fixed Income SHares: Series C, Series M and Series R pledged cash collateral of $272,000, $13,000 and $10,000 for futures contracts.
106 Allianz Global Investors Managed Accounts Trust Annual Report ï 10.31.10
Allianz Global Investors Managed Accounts Trust Notes to Financial Statements
October 31, 2010
5. Investments in Securities (continued)
(b) Transactions in options written for the year ended October 31, 2010:
| | | | | | | | | | | | | |
Fixed Income SHares: Series C:
| |
| | | | | | Notional
| | | | |
| | | Contracts | | | Amount | | | Premiums | |
| | |
| |
| Options outstanding, October 31, 2009 | | | 792 | | | | 1,181,700,000 | | | | $11,798,952 | |
| Options written | | | 7,313 | | | | 15,264,800,000 | | | | 80,097,063 | |
| Options terminated in closing transactions | | | (6,651 | ) | | | (8,832,400,000 | ) | | | (45,636,551 | ) |
| Options expired | | | — | | | | (339,900,000 | ) | | | (3,749,081 | ) |
| | | | | | | | | | | | | |
| Options outstanding, October 31, 2010 | | | 1,454 | | | | 7,274,200,000 | | | | $42,510,383 | |
| | | | | | | | | | | | | |
| | | | | | | | | | | | | |
Fixed Income SHares: Series M:
| |
| | | | | | Notional
| | | | |
| | | Contracts | | | Amount | | | Premiums | |
| | |
| |
| Options outstanding, October 31, 2009 | | | — | | | | 805,100,000 | | | | $8,189,138 | |
| Options written | | | 2,966 | | | | 2,444,800,000 | | | | 16,223,567 | |
| Options terminated in closing transactions | | | (2,966 | ) | | | (2,390,100,000 | ) | | | (16,203,087 | ) |
| | | | | | | | | | | | | |
| Options outstanding, October 31, 2010 | | | — | | | | 859,800,000 | | | | $8,209,618 | |
| | | | | | | | | | | | | |
| | | | | | | | | | | | | |
| Fixed Income SHares: Series R: | |
| | | | | | Notional
| | | | |
| | | Contracts | | | Amount | | | Premiums | |
| | |
| |
| Options outstanding, October 31, 2009 | | | — | | | | 28,300,000 | | | | $243,705 | |
| Options written | | | 712 | | | | 768,700,000 | | | | 4,868,982 | |
| Options terminated in closing transactions | | | (674 | ) | | | (372,000,000 | ) | | | (2,625,043 | ) |
| Options expired | | | — | | | | (13,400,000 | ) | | | (63,650 | ) |
| | | | | | | | | | | | | |
| Options outstanding, October 31, 2010 | | | 38 | | | | 411,600,000 | | | | $2,423,993 | |
| | | | | | | | | | | | | |
(c) Credit default swap agreements:
Buy protection swap agreements outstanding at October 31, 2010(1):
| | | | | | | | | | | | | | | | | | | | | | | | | | | | | |
Fixed Income SHares: Series C:
| |
| | | Notional Amount
| | | | | | | | | | | | | | | Upfront
| | | Unrealized
| |
Swap Counterparty/
| | Payable on Default
| | | Credit
| | | Termination
| | | Payments
| | | Market
| | | Premiums
| | | Appreciation
| |
| Referenced Debt Issuer | | (000s)(4) | | | Spread(3)* | | | Date | | | Made | | | Value(5) | | | Paid | | | (Depreciation) | |
| | |
| |
| Bank of America: | | | | | | | | | | | | | | | | | | | | | | | | | | | | |
| DTE Energy | | $ | 5,000 | | | | 0.92 | % | | | 6/20/16 | | | | (0.97 | )% | | $ | (18,622 | ) | | | — | | | $ | (18,622 | ) |
| Credit Suisse First Boston: | | | | | | | | | | | | | | | | | | | | | | | | | | | | |
| Deutsche Telekom International Finance | | | 5,000 | | | | 0.92 | % | | | 9/20/18 | | | | (1.08 | )% | | | (63,825 | ) | | | — | | | | (63,825 | ) |
| JPMorgan Chase: | | | | | | | | | | | | | | | | | | | | | | | | | | | | |
| Lexmark International | | | 5,000 | | | | 1.38 | % | | | 6/20/13 | | | | (1.19 | )% | | | 18,139 | | | | — | | | | 18,139 | |
| | | | | | | | | | | | | | | | | | | | | | | | | | | | | |
| | | | | | | | | | | | | | | | | | | $ | (64,308 | ) | | | — | | | $ | (64,308 | ) |
| | | | | | | | | | | | | | | | | | | | | | | | | | | | | |
10.31.10 ï Allianz Global Investors Managed Accounts Trust Annual Report 107
Allianz Global Investors Managed Accounts Trust Notes to Financial Statements
October 31, 2010
5. Investments in Securities (continued)
| | | | | | | | | | | | | | | | | | | | | | | | | | | | | |
Fixed Income SHares: Series M:
| |
| | | Notional Amount
| | | | | | | | | | | | | | | Upfront
| | | Unrealized
| |
Swap Counterparty/
| | Payable on Default
| | | Credit
| | | Termination
| | | Payments
| | | Market
| | | Premiums
| | | Appreciation
| |
| Referenced Debt Issuer | | (000s)(4) | | | Spread(3)* | | | Date | | | Made | | | Value(5) | | | Received | | | (Depreciation) | |
| | |
| |
| Bank of America: | | | | | | | | | | | | | | | | | | | | | | | | | | | | |
| Macy’s | | $ | 5,000 | | | | 1.86 | % | | | 9/20/15 | | | | (7.06 | )% | | $ | (1,232,959 | ) | | | — | | | $ | (1,232,959 | ) |
| Barclays Bank: | | | | | | | | | | | | | | | | | | | | | | | | | | | | |
| Embarq | | | 400 | | | | 0.73 | % | | | 6/20/13 | | | | (1.00 | )% | | | (3,357 | ) | | $ | (7,215 | ) | | | 3,858 | |
| Citigroup: | | | | | | | | | | | | | | | | | | | | | | | | | | | | |
| Valero Energy | | | 4,600 | | | | 1.13 | % | | | 12/20/13 | | | | (3.40 | )% | | | (340,448 | ) | | | — | | | | (340,448 | ) |
| Deutsche Bank: | | | | | | | | | | | | | | | | | | | | | | | | | | | | |
| Altria Group | | | 4,500 | | | | 1.18 | % | | | 3/20/19 | | | | (1.46 | )% | | | (101,266 | ) | | | — | | | | (101,266 | ) |
| Morgan Stanley: | | | | | | | | | | | | | | | | | | | | | | | | | | | | |
| Altria Group | | | 1,500 | | | | 1.16 | % | | | 12/20/18 | | | | (1.55 | )% | | | (45,368 | ) | | | — | | | | (45,368 | ) |
| | | | | | | | | | | | | | | | | | | | | | | | | | | | | |
| | | | | | | | | | | | | | | | | | | $ | (1,723,398 | ) | | $ | (7,215 | ) | | $ | (1,716,183 | ) |
| | | | | | | | | | | | | | | | | | | | | | | | | | | | | |
| | | | | | | | | | | | | | | | | | | | | | | | | | | | | |
Fixed Income SHares: Series R:
| |
| | | Notional Amount
| | | | | | | | | | | | | | | Upfront
| | | Unrealized
| |
Swap Counterparty/
| | Payable on Default
| | | Credit
| | | Termination
| | | Payments
| | | Market
| | | Premiums
| | | Appreciation
| |
| Referenced Debt Issuer | | (000s)(4) | | | Spread(3)* | | | Date | | | Made | | | Value(5) | | | Paid(Received) | | | (Depreciation) | |
| | |
| |
| Bank of America: | | | | | | | | | | | | | | | | | | | | | | | | | | | | |
| International Lease Finance | | | $1,000 | | | | 2.60 | % | | | 9/20/13 | | | | (5.00 | )% | | | $(71,978 | ) | | | $(32,287 | ) | | | $(39,691 | ) |
| Marsh & McLennan | | | 3,000 | | | | 1.24 | % | | | 6/20/19 | | | | (0.90 | )% | | | 73,877 | | | | — | | | | 73,877 | |
| Barclays Bank: | | | | | | | | | | | | | | | | | | | | | | | | | | | | |
| FBG Finance | | | 1,500 | | | | 0.75 | % | | | 6/20/15 | | | | (1.60 | )% | | | (60,057 | ) | | | — | | | | (60,057 | ) |
| Deutsche Bank: | | | | | | | | | | | | | | | | | | | | | | | | | | | | |
| Albertsons | | | 3,000 | | | | 2.87 | % | | | 3/20/11 | | | | (1.00 | )% | | | 18,450 | | | | 30,211 | | | | (11,761 | ) |
| Pulte Homes | | | 1,500 | | | | 2.09 | % | | | 9/20/11 | | | | (1.00 | )% | | | 12,789 | | | | 5,573 | | | | 7,216 | |
| Starwood Hotels & Resorts Worldwide | | | 3,100 | | | | 0.75 | % | | | 3/20/13 | | | | (1.00 | )% | | | (22,166 | ) | | | 52,342 | | | | (74,508 | ) |
| Goldman Sachs: | | | | | | | | | | | | | | | | | | | | | | | | | | | | |
| RPM International | | | 1,000 | | | | 1.80 | % | | | 3/20/18 | | | | (1.50 | )% | | | $17,750 | | | | — | | | | $17,750 | |
| | | | | | | | | | | | | | | | | | | | | | | | | | | | | |
| | | | | | | | | | | | | | | | | | | | $(31,335 | ) | | | $55,839 | | | | $(87,174 | ) |
| | | | | | | | | | | | | | | | | | | | | | | | | | | | | |
Sell protection swap agreements outstanding at October 31, 2010 (2):
| | | | | | | | | | | | | | | | | | | | | | | | | | | | | |
Fixed Income SHares: Series C:
| |
| | | Notional Amount
| | | | | | | | | | | | | | | Upfront
| | | Unrealized
| |
Swap Counterparty/
| | Payable on Default
| | | Credit
| | | Termination
| | | Payments
| | | Market
| | | Premiums
| | | Appreciation
| |
| Referenced Debt Issuer | | (000s)(4) | | | Spread(3)* | | | Date | | | Received | | | Value(5) | | | Paid(Received) | | | (Depreciation) | |
| | |
| |
| Bank of America: | | | | | | | | | | | | | | | | | | | | | | | | | | | | |
| Dow Jones CDX EM-14 Index | | | $15,500 | | | | 2.04 | % | | | 12/20/15 | | | | 5.00 | % | | | $2,264,543 | | | | $1,922,000 | | | | $342,543 | |
| General Electric | | | 4,000 | | | | 1.05 | % | | | 6/20/12 | | | | 5.00 | % | | | 282,153 | | | | 75,672 | | | | 206,481 | |
| Morgan Stanley | | | 1,000 | | | | 0.92 | % | | | 3/20/11 | | | | 1.00 | % | | | 1,490 | | | | (1,068 | ) | | | 2,558 | |
108 Allianz Global Investors Managed Accounts Trust Annual Report ï 10.31.10
Allianz Global Investors Managed Accounts Trust Notes to Financial Statements
October 31, 2010
5. Investments in Securities (continued)
| | | | | | | | | | | | | | | | | | | | | | | | | | | | | |
| | | Notional Amount
| | | | | | | | | | | | | | | Upfront
| | | Unrealized
| |
Swap Counterparty/
| | Payable on Default
| | | Credit
| | | Termination
| | | Payments
| | | Market
| | | Premiums
| | | Appreciation
| |
| Referenced Debt Issuer | | (000s)(4) | | | Spread(3)* | | | Date | | | Received | | | Value(5) | | | Paid(Received) | | | (Depreciation) | |
| | |
| |
| Barclays Bank: | | | | | | | | | | | | | | | | | | | | | | | | | | | | |
| Brazilian Government International Bond | | | $44,000 | | | | 0.64 | % | | | 3/20/12 | | | | 1.00 | % | | | $274,613 | | | | $90,126 | | | | $184,487 | |
| China Government International Bond | | | 28,800 | | | | 0.58 | % | | | 9/20/15 | | | | 1.00 | % | | | 618,382 | | | | 271,505 | | | | 346,877 | |
| Dow Jones CDX EM-14 Index | | | 31,400 | | | | 2.04 | % | | | 12/20/15 | | | | 5.00 | % | | | 4,587,525 | | | | 3,998,200 | | | | 589,325 | |
| BNP Paribas: | | | | | | | | | | | | | | | | | | | | | | | | | | | | |
| China Government International Bond | | | 17,500 | | | | 0.58 | % | | | 9/20/15 | | | | 1.00 | % | | | 375,753 | | | | 161,042 | | | | 214,711 | |
Dow Jones CDX IG-15 5-Year Index | | | 39,400 | | | | 0.94 | % | | | 12/20/15 | | | | 1.00 | % | | | 153,190 | | | | 43,591 | | | | 109,599 | |
| General Electric | | | 15,200 | | | | 1.30 | % | | | 12/20/13 | | | | 4.90 | % | | | 1,764,104 | | | | — | | | | 1,764,104 | |
| Citigroup: | | | | | | | | | | | | | | | | | | | | | | | | | | | | |
| China Government International Bond | | | 6,300 | | | | 0.58 | % | | | 9/20/15 | | | | 1.00 | % | | | 135,271 | | | | 58,011 | | | | 77,260 | |
| Dow Jones CDX EM-14 Index | | | 16,900 | | | | 2.04 | % | | | 12/20/15 | | | | 5.00 | % | | | 2,469,082 | | | | 2,095,600 | | | | 373,482 | |
| El Paso | | | 2,700 | | | | 1.84 | % | | | 3/20/14 | | | | 5.00 | % | | | 295,316 | | | | (133,380 | ) | | | 428,696 | |
| United Kingdom Gilt | | | 49,700 | | | | 0.50 | % | | | 6/20/15 | | | | 1.00 | % | | | 1,195,163 | | | | 411,397 | | | | 783,766 | |
| Credit Suisse First Boston: | | | | | | | | | | | | | | | | | | | | | | | | | | | | |
| China Government International Bond | | | 4,700 | | | | 0.52 | % | | | 3/20/15 | | | | 1.00 | % | | | 102,104 | | | | 51,098 | | | | 51,006 | |
| United Kingdom Gilt | | | 13,000 | | | | 0.52 | % | | | 9/20/15 | | | | 1.00 | % | | | 313,454 | | | | 133,971 | | | | 179,483 | |
| Deutsche Bank: | | | | | | | | | | | | | | | | | | | | | | | | | | | | |
| Berkshire Hathaway | | | 11,900 | | | | 0.92 | % | | | 9/20/13 | | | | 1.10 | % | | | 78,141 | | | | — | | | | 78,141 | |
| Dow Jones CDX EM-14 Index | | | 24,200 | | | | 2.04 | % | | | 12/20/15 | | | | 5.00 | % | | | 3,535,609 | | | | 3,363,950 | | | | 171,659 | |
| France (Gov’t of) | | | 13,500 | | | | 0.68 | % | | | 9/20/15 | | | | 0.25 | % | | | (271,216 | ) | | | (492,309 | ) | | | 221,093 | |
| General Electric | | | 7,700 | | | | 1.30 | % | | | 12/20/13 | | | | 3.80 | % | | | 624,120 | | | | — | | | | 624,120 | |
| ING Bank | | | €28,600 | | | | 1.37 | % | | | 6/20/11 | | | | 1.40 | % | | | 72,931 | | | | — | | | | 72,931 | |
| Procter & Gamble | | | $3,000 | | | | 0.32 | % | | | 3/20/14 | | | | 1.27 | % | | | 100,793 | | | | — | | | | 100,793 | |
| SLM | | | 10,000 | | | | 3.09 | % | | | 12/20/12 | | | | 5.00 | % | | | 453,606 | | | | 271,347 | | | | 182,259 | |
10.31.10 ï Allianz Global Investors Managed Accounts Trust Annual Report 109
Allianz Global Investors Managed Accounts Trust Notes to Financial Statements
October 31, 2010
5. Investments in Securities (continued)
| | | | | | | | | | | | | | | | | | | | | | | | | | | | | |
| | | Notional Amount
| | | | | | | | | | | | | | | Upfront
| | | Unrealized
| |
Swap Counterparty/
| | Payable on Default
| | | Credit
| | | Termination
| | | Payments
| | | Market
| | | Premiums
| | | Appreciation
| |
| Referenced Debt Issuer | | (000s)(4) | | | Spread(3)* | | | Date | | | Received | | | Value(5) | | | Paid(Received) | | | (Depreciation) | |
| | |
| |
| Goldman Sachs: | | | | | | | | | | | | | | | | | | | | | | | | | | | | |
| BP Capital Markets | | | $3,400 | | | | 1.43 | % | | | 6/20/15 | | | | 5.00 | % | | | $554,390 | | | | $89,913 | | | | $464,477 | |
| California State Municipal Bond | | | 3,300 | | | | 2.62 | % | | | 12/20/18 | | | | 1.63 | % | | | (155,920 | ) | | | — | | | | (155,920 | ) |
| California State Municipal Bond | | | 25,000 | | | | 2.62 | % | | | 12/20/18 | | | | 1.65 | % | | | (1,155,690 | ) | | | — | | | | (1,155,690 | ) |
Dow Jones CDX HY-9 5-Year Index 35-100% | | | 3,369 | | | | 0.41 | % | | | 12/20/12 | | | | 2.05 | % | | | 126,397 | | | | — | | | | 126,397 | |
| El Paso | | | 350 | | | | 2.07 | % | | | 9/20/14 | | | | 5.00 | % | | | 40,122 | | | | (27,125 | ) | | | 67,247 | |
| SLM | | | 4,100 | | | | 3.32 | % | | | 3/20/13 | | | | 2.95 | % | | | (20,581 | ) | | | — | | | | (20,581 | ) |
| HSBC Bank: | | | | | | | | | | | | | | | | | | | | | | | | | | | | |
| Brazilian Government International Bond | | | 18,100 | | | | 0.64 | % | | | 3/20/12 | | | | 1.00 | % | | | 112,965 | | | | 40,787 | | | | 72,178 | |
| China Government International Bond | | | 6,200 | | | | 0.58 | % | | | 9/20/15 | | | | 1.00 | % | | | 133,124 | | | | 57,090 | | | | 76,034 | |
| JPMorgan Chase: | | | | | | | | | | | | | | | | | | | | | | | | | | | | |
| American Express | | | 2,800 | | | | 0.65 | % | | | 3/20/14 | | | | 2.75 | % | | | 206,634 | | | | — | | | | 206,634 | |
| BP Capital Markets | | | 600 | | | | 1.43 | % | | | 6/20/15 | | | | 5.00 | % | | | 97,833 | | | | 6,025 | | | | 91,808 | |
| China Government International Bond | | | 22,000 | | | | 0.52 | % | | | 3/20/15 | | | | 1.00 | % | | | 477,933 | | | | 254,939 | | | | 222,994 | |
| France (Gov’t of) | | | 17,500 | | | | 0.68 | % | | | 9/20/15 | | | | 0.25 | % | | | (351,577 | ) | | | (613,195 | ) | | | 261,618 | |
| General Electric | | | 2,500 | | | | 0.82 | % | | | 6/20/11 | | | | 1.00 | % | | | 5,856 | | | | 6,012 | | | | (156 | ) |
| Petrobras International | | | 37,000 | | | | 0.95 | % | | | 9/20/11 | | | | 1.00 | % | | | 60,165 | | | | (133,578 | ) | | | 193,743 | |
| Merrill Lynch: | | | | | | | | | | | | | | | | | | | | | | | | | | | | |
| American International Group | | | 4,000 | | | | 1.01 | % | | | 12/20/12 | | | | 0.90 | % | | | (5,523 | ) | | | — | | | | (5,523 | ) |
| JPMorgan Chase | | | 3,000 | | | | 0.50 | % | | | 9/20/12 | | | | 0.39 | % | | | (4,832 | ) | | | — | | | | (4,832 | ) |
| SLM | | | 3,000 | | | | 3.13 | % | | | 12/20/12 | | | | 2.90 | % | | | (4,221 | ) | | | — | | | | (4,221 | ) |
| Morgan Stanley: | | | | | | | | | | | | | | | | | | | | | | | | | | | | |
| Altria Group | | | 2,500 | | | | 0.27 | % | | | 12/20/10 | | | | 0.95 | % | | | 5,214 | | | | — | | | | 5,214 | |
| China Government International Bond | | | 17,200 | | | | 0.58 | % | | | 9/20/15 | | | | 1.00 | % | | | 369,312 | | | | 137,396 | | | | 231,916 | |
| ConocoPhillips | | | 4,700 | | | | 0.07 | % | | | 3/20/11 | | | | 0.23 | % | | | 4,285 | | | | — | | | | 4,285 | |
Dow Jones CDX IG-15 5-Year Index | | | 218,400 | | | | 0.94 | % | | | 12/20/15 | | | | 1.00 | % | | | 849,151 | | | | (509,472 | ) | | | 1,358,623 | |
110 Allianz Global Investors Managed Accounts Trust Annual Report ï 10.31.10
Allianz Global Investors Managed Accounts Trust Notes to Financial Statements
October 31, 2010
5. Investments in Securities (continued)
| | | | | | | | | | | | | | | | | | | | | | | | | | | | | |
| | | Notional Amount
| | | | | | | | | | | | | | | Upfront
| | | Unrealized
| |
Swap Counterparty/
| | Payable on Default
| | | Credit
| | | Termination
| | | Payments
| | | Market
| | | Premiums
| | | Appreciation
| |
| Referenced Debt Issuer | | (000s)(4) | | | Spread(3)* | | | Date | | | Received | | | Value(5) | | | Paid(Received) | | | (Depreciation) | |
| | |
| |
| Royal Bank of Scotland: | | | | | | | | | | | | | | | | | | | | | | | | | | | | |
| China Government International Bond | | | $41,500 | | | | 0.58 | % | | | 9/20/15 | | | | 1.00 | % | | | $891,072 | | | | $379,144 | | | | $511,928 | |
| UBS: | | | | | | | | | | | | | | | | | | | | | | | | | | | | |
| SLM | | | 5,000 | | | | 3.09 | % | | | 12/20/12 | | | | 5.00 | % | | | 226,803 | | | | 135,674 | | | | 91,129 | |
| | | | | | | | | | | | | | | | | | | | | | | | | | | | | |
| | | | | | | | | | | | | | | | | | | | $21,889,039 | | | | $12,144,363 | | | | $9,744,676 | |
| | | | | | | | | | | | | | | | | | | | | | | | | | | | | |
| | | | | | | | | | | | | | | | | | | | | | | | | | | | | |
Fixed Income SHares: Series M:
| |
| | | Notional Amount
| | | | | | | | | | | | | | | Upfront
| | | Unrealized
| |
Swap Counterparty/
| | Payable on Default
| | | Credit
| | | Termination
| | | Payments
| | | Market
| | | Premiums
| | | Appreciation
| |
| Referenced Debt Issuer | | (000s)(4) | | | Spread(3)* | | | Date | | | Received | | | Value(5) | | | Paid(Received) | | | (Depreciation) | |
| | |
| |
| Bank of America: | | | | | | | | | | | | | | | | | | | | | | | | | | | | |
Dow Jones CDX IG-15 5-Year Index | | | $218,400 | | | | 0.94 | % | | | 12/20/15 | | | | 1.00 | % | | | $849,151 | | | | $720,529 | | | | $128,622 | |
| Barclays Bank: | | | | | | | | | | | | | | | | | | | | | | | | | | | | |
| SLM | | | 15,000 | | | | 3.71 | % | | | 12/20/13 | | | | 5.00 | % | | | 650,223 | | | | (2,025,000 | ) | | | 2,675,223 | |
| BNP Paribas: | | | | | | | | | | | | | | | | | | | | | | | | | | | | |
| General Electric | | | 10,000 | | | | 1.30 | % | | | 12/20/13 | | | | 3.80 | % | | | 810,545 | | | | — | | | | 810,545 | |
| General Electric | | | 75,000 | | | | 1.30 | % | | | 12/20/13 | | | | 4.50 | % | | | 7,749,781 | | | | — | | | | 7,749,781 | |
| Citigroup: | | | | | | | | | | | | | | | | | | | | | | | | | | | | |
Dow Jones MCDX 5-Year Index | | | 34,000 | | | | 1.86 | % | | | 12/20/15 | | | | 1.00 | % | | | (1,067,159 | ) | | | (1,418,290 | ) | | | 351,131 | |
| Credit Suisse First Boston: | | | | | | | | | | | | | | | | | | | | | | | | | | | | |
| BP Capital Markets | | | 6,000 | | | | 1.43 | % | | | 6/20/15 | | | | 5.00 | % | | | 978,334 | | | | 92,045 | | | | 886,289 | |
| Deutsche Bank: | | | | | | | | | | | | | | | | | | | | | | | | | | | | |
| SLM | | | 10,000 | | | | 3.71 | % | | | 12/20/13 | | | | 5.00 | % | | | 433,482 | | | | (1,350,000 | ) | | | 1,783,482 | |
| Goldman Sachs: | | | | | | | | | | | | | | | | | | | | | | | | | | | | |
| Berkshire Hathaway | | | 2,200 | | | | 0.92 | % | | | 9/20/13 | | | | 0.97 | % | | | 5,940 | | | | — | | | | 5,940 | |
| Berkshire Hathaway | | | 14,600 | | | | 0.92 | % | | | 9/20/13 | | | | 0.98 | % | | | 43,761 | | | | — | | | | 43,761 | |
| BP Capital Markets | | | 1,100 | | | | 1.43 | % | | | 6/20/15 | | | | 5.00 | % | | | 179,361 | | | | 17,777 | | | | 161,584 | |
| California State Municipal Bond | | | 25,000 | | | | 2.62 | % | | | 12/20/18 | | | | 1.60 | % | | | (1,219,492 | ) | | | — | | | | (1,219,492 | ) |
| California State Municipal Bond | | | 11,000 | | | | 2.62 | % | | | 12/20/18 | | | | 1.75 | % | | | (452,358 | ) | | | — | | | | (452,358 | ) |
Dow Jones MCDX 5-Year Index | | | 40,000 | | | | 1.86 | % | | | 12/20/15 | | | | 1.00 | % | | | (1,255,482 | ) | | | (1,648,193 | ) | | | 392,711 | |
| SLM | | | 5,600 | | | | 3.32 | % | | | 3/20/13 | | | | 2.95 | % | | | (28,110 | ) | | | — | | | | (28,110 | ) |
| SLM | | | 10,000 | | | | 3.32 | % | | | 3/20/13 | | | | 3.00 | % | | | (38,210 | ) | | | — | | | | (38,210 | ) |
10.31.10 ï Allianz Global Investors Managed Accounts Trust Annual Report 111
Allianz Global Investors Managed Accounts Trust Notes to Financial Statements
October 31, 2010
5. Investments in Securities (continued)
| | | | | | | | | | | | | | | | | | | | | | | | | | | | | |
Fixed Income SHares: Series M:
| |
| | | Notional Amount
| | | | | | | | | | | | | | | Upfront
| | | Unrealized
| |
Swap Counterparty/
| | Payable on Default
| | | Credit
| | | Termination
| | | Payments
| | | Market
| | | Premiums
| | | Appreciation
| |
| Referenced Debt Issuer | | (000s)(4) | | | Spread(3)* | | | Date | | | Received | | | Value(5) | | | Paid(Received) | | | (Depreciation) | |
| | |
| |
| JPMorgan Chase: | | | | | | | | | | | | | | | | | | | | | | | | | | | | |
| BP Capital Markets | | | $1,100 | | | | 1.43 | % | | | 6/20/15 | | | | 5.00 | % | | | $179,361 | | | | $4,393 | | | | $174,968 | |
| Morgan Stanley: | | | | | | | | | | | | | | | | | | | | | | | | | | | | |
Dow Jones MCDX 5-Year Index | | | 22,000 | | | | 1.86 | % | | | 12/20/15 | | | | 1.00 | % | | | (690,515 | ) | | | (934,282 | ) | | | 243,767 | |
| | | | | | | | | | | | | | | | | | | | | | | | | | | | | |
| | | | | | | | | | | | | | | | | | | | $7,128,613 | | | | $(6,541,021 | ) | | | $13,669,634 | |
| | | | | | | | | | | | | | | | | | | | | | | | | | | | | |
| | | | | | | | | | | | | | | | | | | | | | | | | | | | | |
Fixed Income SHares: Series R:
| |
| | | Notional Amount
| | | | | | | | | | | | | | | Upfront
| | | Unrealized
| |
Swap Counterparty/
| | Payable on Default
| | | Credit
| | | Termination
| | | Payments
| | | Market
| | | Premiums
| | | Appreciation
| |
| Referenced Debt Issuer | | (000s)(4) | | | Spread(3)* | | | Date | | | Received | | | Value(5) | | | Paid(Received) | | | (Depreciation) | |
| | |
| |
| Bank of America: | | | | | | | | | | | | | | | | | | | | | | | | | | | | |
| France Government Bond | | | $100 | | | | 0.70 | % | | | 12/20/15 | | | | 0.25 | % | | | $(2,201 | ) | | | $(2,034 | ) | | | $(167 | ) |
| Japan Government Bond | | | 4,000 | | | | 0.55 | % | | | 12/20/15 | | | | 1.00 | % | | | 93,828 | | | | 90,933 | | | | 2,895 | |
| MetLife | | | 300 | | | | 1.40 | % | | | 9/20/13 | | | | 1.00 | % | | | (3,089 | ) | | | (14,605 | ) | | | 11,516 | |
| Barclays Bank: | | | | | | | | | | | | | | | | | | | | | | | | | | | | |
| Dow Jones CDX EM-14 Index | | | 800 | | | | 2.04 | % | | | 12/20/15 | | | | 5.00 | % | | | 116,880 | | | | 114,000 | | | | 2,880 | |
| Citigroup: | | | | | | | | | | | | | | | | | | | | | | | | | | | | |
| France Government Bond | | | 7,000 | | | | 0.66 | % | | | 6/20/15 | | | | 0.25 | % | | | (126,847 | ) | | | (147,851 | ) | | | 21,004 | |
| United Kingdom Gilt | | | 1,300 | | | | 0.50 | % | | | 6/20/15 | | | | 1.00 | % | | | 31,262 | | | | 10,564 | | | | 20,698 | |
| Credit Suisse First Boston: | | | | | | | | | | | | | | | | | | | | | | | | | | | | |
| United Kingdom Gilt | | | 300 | | | | 0.54 | % | | | 12/20/15 | | | | 1.00 | % | | | 7,252 | | | | 7,037 | | | | 215 | |
112 Allianz Global Investors Managed Accounts Trust Annual Report ï 10.31.10
Allianz Global Investors Managed Accounts Trust Notes to Financial Statements
October 31, 2010
5. Investments in Securities (continued)
| | | | | | | | | | | | | | | | | | | | | | | | | | | | | |
| | | Notional Amount
| | | | | | | | | | | | | | | Upfront
| | | Unrealized
| |
Swap Counterparty/
| | Payable on Default
| | | Credit
| | | Termination
| | | Payments
| | | Market
| | | Premiums
| | | Appreciation
| |
| Referenced Debt Issuer | | (000s)(4) | | | Spread(3)* | | | Date | | | Received | | | Value(5) | | | Paid(Received) | | | (Depreciation) | |
| | |
| |
| Deutsche Bank: | | | | | | | | | | | | | | | | | | | | | | | | | | | | |
| American International Group | | | $3,800 | | | | 1.42 | % | | | 12/20/13 | | | | 5.00 | % | | | $439,440 | | | | $(389,500 | ) | | | $828,940 | |
| Brazilian Government International Bond | | | 2,100 | | | | 1.27 | % | | | 6/20/20 | | | | 1.00 | % | | | (45,008 | ) | | | (69,609 | ) | | | 24,601 | |
| Dow Jones CDX EM-14 Index | | | 1,100 | | | | 2.04 | % | | | 12/20/15 | | | | 5.00 | % | | | 160,710 | | | | 162,900 | | | | (2,190 | ) |
Dow Jones CDX IG-15 5-Year Index | | | 21,300 | | | | 0.94 | % | | | 12/20/15 | | | | 1.00 | % | | | 82,816 | | | | (75,826 | ) | | | 158,642 | |
| France Government Bond | | | 1,900 | | | | 0.66 | % | | | 6/20/15 | | | | 0.25 | % | | | (34,430 | ) | | | (62,247 | ) | | | 27,817 | |
| Italy Government Bond | | | 600 | | | | 1.67 | % | | | 6/20/15 | | | | 1.00 | % | | | (16,904 | ) | | | (14,404 | ) | | | (2,500 | ) |
| Petrobras International | | | 200 | | | | 1.13 | % | | | 9/20/12 | | | | 1.00 | % | | | (249 | ) | | | (2,481 | ) | | | 2,232 | |
| United Kingdom Gilt | | | 2,100 | | | | 0.50 | % | | | 6/20/15 | | | | 1.00 | % | | | 50,500 | | | | 16,094 | | | | 34,406 | |
| United Kingdom Gilt | | | 800 | | | | 0.54 | % | | | 12/20/15 | | | | 1.00 | % | | | 19,339 | | | | 18,567 | | | | 772 | |
| HSBC Bank: | | | | | | | | | | | | | | | | | | | | | | | | | | | | |
| Brazilian Government International Bond | | | 3,100 | | | | 0.95 | % | | | 6/20/15 | | | | 1.00 | % | | | 10,585 | | | | (31,107 | ) | | | 41,692 | |
| Petrobras International | | | 2,000 | | | | 1.45 | % | | | 9/20/15 | | | | 1.00 | % | | | (39,128 | ) | | | (63,728 | ) | | | 24,600 | |
| JPMorgan Chase: | | | | | | | | | | | | | | | | | | | | | | | | | | | | |
Dow Jones CDX IG-15 5-Year Index | | | 23,000 | | | | 0.94 | % | | | 12/20/15 | | | | 1.00 | % | | | 89,425 | | | | 61,597 | | | | 27,828 | |
| Royal Bank of Scotland: | | | | | | | | | | | | | | | | | | | | | | | | | | | | |
| Japan Government Bond | | | 800 | | | | 0.55 | % | | | 12/20/15 | | | | 1.00 | % | | | 18,766 | | | | 17,978 | | | | 788 | |
| UBS: | | | | | | | | | | | | | | | | | | | | | | | | | | | | |
| Dow Jones CDX EM-14 Index | | | 1,400 | | | | 2.04 | % | | | 12/20/15 | | | | 5.00 | % | | | 204,539 | | | | 197,400 | | | | 7,139 | |
Dow Jones CDX IG-15 5-Year Index | | | 100 | | | | 0.95 | % | | | 12/20/15 | | | | 1.00 | % | | | 393 | | | | 268 | | | | 125 | |
| | | | | | | | | | | | | | | | | | | | | | | | | | | | | |
| | | | | | | | | | | | | | | | | | | | $1,057,879 | | | | $(176,054 | ) | | | $1,233,933 | |
| | | | | | | | | | | | | | | | | | | | | | | | | | | | | |
10.31.10 ï Allianz Global Investors Managed Accounts Trust Annual Report 113
Allianz Global Investors Managed Accounts Trust Notes to Financial Statements
October 31, 2010
5. Investments in Securities (continued)
| | | |
| * | | Unaudited. |
| (1) | | If the Portfolios are buyers of protection and a credit event occurs, as defined under the terms of that particular swap agreement, the Portfolios will either (i) receive from the seller of protection an amount equal to the notional amount of the swap and deliver the referenced obligation or underlying securities comprising the referenced index or (ii) receive a net settlement amount in the form of cash or securities equal to the notional amount of the swap less the recovery value of the referenced obligation or underlying securities comprising the referenced index. |
| (2) | | If the Portfolios are sellers of protection and a credit event occurs, as defined under the terms of that particular swap agreement, the Portfolios will either (i) pay to the buyer of protection an amount equal to the notional amount of the swap and take delivery of the referenced obligation or underlying securities comprising the referenced index or (ii) pay a net settlement amount in the form of cash or securities equal to the notional amount of the swap less the recovery value of the referenced obligation or underlying securities comprising the referenced index. |
| (3) | | Implied credit spreads, represented in absolute terms, utilized in determining the market value of credit default swap agreements as of year end serve as an indicator of the current status of the payment/performance risk and represent the likelihood or risk of default for the credit derivative. The implied credit spread of a particular referenced entity reflects the cost of buying/selling protection and may include upfront payments required to be made to enter into the agreement. Wider credit spreads represent a deterioration of the referenced entity’s credit soundness and a greater likelihood or risk of default or other credit event occurring as defined under the terms of the agreement. |
| (4) | | The maximum potential amount the Portfolios could be required to make available as sellers of credit protection or receive as buyers of credit protection if a credit event occurs as defined under the terms of that particular swap agreement. |
| (5) | | The quoted market prices and resulting values for credit default swap agreements serve as an indicator of the status at October 31, 2010 of the payment/performance risk and represent the likelihood of an expected liability (or profit) for the credit derivative should the notional amount of the swap agreement been closed/sold as of the period end. Increasing market values, in absolute terms when compared to the notional amount of the swap, represent a deterioration of the referenced entity’s credit soundness and a greater likelihood or risk of default or other credit event occurring as defined under the terms of the agreement. |
(d) Interest rate swap agreements outstanding at October 31, 2010:
| | | | | | | | | | | | | | | | | | | | | | | | | |
Fixed Income SHares: Series C:
| |
| | | Notional
| | | | | | Rate Type | | | | | Upfront
| | | Unrealized
| |
| | | Amount
| | | Termination
| | | Payments
| | Payments
| | Market
| | | Premiums
| | | Appreciation
| |
| Swap Counterparty | | (000s) | | | Date | | | Made | | Received | | Value | | | Paid(Received) | | | (Depreciation) | |
| | |
| |
| Bank of America | | | €27,000 | | | | 3/16/21 | | | 6-Month EUR-LIBOR | | 3.00% | | | $316,060 | | | | $891,810 | | | | $(575,750 | ) |
| Barclays Bank | | | BRL 472,500 | | | | 1/2/12 | | | BRL-CDI-Compounded | | 11.65% | | | 8,358,709 | | | | (387,938 | ) | | | 8,746,647 | |
| Barclays Bank | | | BRL 169,900 | | | | 1/2/12 | | | BRL-CDI-Compounded | | 11.67% | | | 3,104,769 | | | | 1,379,581 | | | | 1,725,188 | |
| Barclays Bank | | | MXN 91,800 | | | | 4/9/19 | | | 28-Day Mexico Interbank
TIIE Banxico | | 7.78% | | | 767,667 | | | | 3,208 | | | | 764,459 | |
| BNP Paribas | | | $58,000 | | | | 1/2/12 | | | 3.25% | | 3-Month USD-LIBOR | | | (2,813,765 | ) | | | (289,360 | ) | | | (2,524,405 | ) |
| Citigroup | | | 264,100 | | | | 11/2/15 | | | 1.60% | | 3-Month USD-LIBOR | | | (2,277,826 | ) | | | (686,660 | ) | | | (1,591,166 | ) |
| Citigroup | | | 29,500 | | | | 1/2/12 | | | 3.25% | | 3-Month USD-LIBOR | | | (1,514,372 | ) | | | (134,225 | ) | | | (1,380,147 | ) |
| Deutsche Bank | | | 98,500 | | | | 12/16/11 | | | 3-Month USD-LIBOR | | 3.00% | | | 3,842,883 | | | | 2,128,585 | | | | 1,714,298 | |
| Deutsche Bank | | | AUD 188,640 | | | | 12/15/15 | | | 6-Month Australian Bank Bill | | 5.00% | | | (4,384,074 | ) | | | (2,459,890 | ) | | | (1,924,184 | ) |
| Deutsche Bank | | | €31,000 | | | | 3/16/21 | | | 6-Month EUR-LIBOR | | 3.00% | | | 362,884 | | | | 1,061,853 | | | | (698,969 | ) |
| Goldman Sachs | | | $47,500 | | | | 1/2/12 | | | 3.25% | | 3-Month USD-LIBOR | | | (2,380,738 | ) | | | (223,820 | ) | | | (2,156,918 | ) |
| Goldman Sachs | | | BRL 281,400 | | | | 1/2/12 | | | BRL-CDI-Compounded | | 10.72% | | | 1,820,692 | | | | 20,342 | | | | 1,800,350 | |
| Goldman Sachs | | | BRL 53,500 | | | | 1/2/12 | | | BRL-CDI-Compounded | | 11.67% | | | 977,664 | | | | 264,164 | | | | 713,500 | |
| HSBC Bank | | | BRL 100,000 | | | | 1/2/12 | | | BRL-CDI-Compounded | | 10.61% | | | 486,562 | | | | (135,865 | ) | | | 622,427 | |
| HSBC Bank | | | BRL 171,900 | | | | 1/2/12 | | | BRL-CDI-Compounded | | 11.67% | | | 3,141,318 | | | | 1,337,006 | | | | 1,804,312 | |
| HSBC Bank | | | BRL 195,300 | | | | 1/2/14 | | | BRL-CDI-Compounded | | 12.12% | | | 2,129,153 | | | | 360,273 | | | | 1,768,880 | |
114 Allianz Global Investors Managed Accounts Trust Annual Report ï 10.31.10
Allianz Global Investors Managed Accounts Trust Notes to Financial Statements
October 31, 2010
5. Investments in Securities (continued)
| | | | | | | | | | | | | | | | | | | | | | | | | |
Fixed Income SHares: Series C:
| |
| | | Notional
| | | | | | Rate Type | | | | | Upfront
| | | Unrealized
| |
| | | Amount
| | | Termination
| | | Payments
| | Payments
| | Market
| | | Premiums
| | | Appreciation
| |
| Swap Counterparty | | (000s) | | | Date | | | Made | | Received | | Value | | | Paid(Received) | | | (Depreciation) | |
| | |
| |
| JPMorgan Chase | | | BRL 46,900 | | | | 1/2/12 | | | BRL-CDI-Compounded | | 11.65% | | | $829,679 | | | | $(31,400 | ) | | | $861,079 | |
| JPMorgan Chase | | | €4,000 | | | | 9/16/19 | | | 6-Month EUR-LIBOR | | 4.00% | | | 596,605 | | | | 74,053 | | | | 522,552 | |
| Merrill Lynch | | | BRL 200,000 | | | | 1/2/14 | | | BRL-CDI-Compounded | | 12.31% | | | 1,964,478 | | | | — | | | | 1,964,478 | |
| Morgan Stanley | | | $56,500 | | | | 1/2/12 | | | 3.25% | | 3-Month USD-LIBOR | | | (2,900,407 | ) | | | (378,550 | ) | | | (2,521,857 | ) |
| Royal Bank of Scotland | | | 104,800 | | | | 1/2/12 | | | 1.60% | | 3-Month USD-LIBOR | | | (860,188 | ) | | | (217,853 | ) | | | (642,335 | ) |
| | | | | | | | | | | | | | | | | | | | | | | | | |
| | | | | | | | | | | | | | | | $11,567,753 | | | | $2,575,314 | | | | $8,992,439 | |
| | | | | | | | | | | | | | | | | | | | | | | | | |
| | | | | | | | | | | | | | | | | | | | | | | | | |
Fixed Income SHares: Series M:
| |
| | | Notional
| | | | | | Rate Type | | | | | | | | | |
| | | Amount
| | | Termination
| | | Payments
| | Payments
| | Market
| | | Premiums
| | | Unrealized
| |
| Swap Counterparty | | (000s) | | | Date | | | Made | | Received | | Value | | | Paid(Received) | | | Appreciation | |
| | |
| |
| Barclays Bank | | | BRL 150,000 | | | | 1/2/12 | | | BRL-CDI-Compounded | | 11.65% | | | $2,653,558 | | | | $(124,590 | ) | | | $2,778,148 | |
| Barclays Bank | | | BRL 145,300 | | | | 1/2/13 | | | BRL-CDI-Compounded | | 12.29% | | | 1,888,925 | | | | 438,901 | | | | 1,450,024 | |
| Barclays Bank | | | MXN 189,600 | | | | 1/28/15 | | | 28-Day Mexico Interbank
TIIE Banxico | | 7.34% | | | 1,106,107 | | | | (35 | ) | | | 1,106,142 | |
| HSBC Bank | | | BRL 150,000 | | | | 1/2/12 | | | BRL-CDI-Compounded | | 11.65% | | | 2,653,558 | | | | (140,499 | ) | | | 2,794,057 | |
| HSBC Bank | | | MXN 99,400 | | | | 1/28/15 | | | 28-Day Mexico Interbank
TIIE Banxico | | 7.33% | | | 576,747 | | | | (6,854 | ) | | | 583,601 | |
| Merrill Lynch | | | MXN 40,400 | | | | 2/7/19 | | | 28-Day Mexico Interbank
TIIE Banxico | | 8.30% | | | 444,076 | | | | — | | | | 444,076 | |
| Morgan Stanley | | | $189,600 | | | | 12/16/16 | | | 3-Month USD-LIBOR | | 4.00% | | | 16,667,632 | | | | 6,825,600 | | | | 9,842,032 | |
| Royal Bank of Scotland | | | 6,900 | | | | 12/16/14 | | | 3-Month USD-LIBOR | | 4.00% | | | 902,417 | | | | 127,022 | | | | 775,395 | |
| | | | | | | | | | | | | | | | | | | | | | | | | |
| | | | | | | | | | | | | | | | $26,893,020 | | | | $7,119,545 | | | | $19,773,475 | |
| | | | | | | | | | | | | | | | | | | | | | | | | |
| | | | | | | | | | | | | | | | | | | | | | | | | |
Fixed Income SHares: Series R:
| |
| | | Notional
| | | | | | Rate Type | | | | | Upfront
| | | Unrealized
| |
| | | Amount
| | | Termination
| | | Payments
| | Payments
| | Market
| | | Premiums
| | | Appreciation
| |
| Swap Counterparty | | (000s) | | | Date | | | Made | | Received | | Value | | | Paid(Received) | | | (Depreciation) | |
| | |
| |
| Barclays Bank | | | BRL 6,100 | | | | 1/2/13 | | | BRL-CDI-Compounded | | 12.28% | | | $79,301 | | | | $23,354 | | | | $55,947 | |
| BNP Paribas | | | $5,600 | | | | 11/2/20 | | | 3-Month USD-LIBOR | | 3.25% | | | (271,674 | ) | | | (18,480 | ) | | | (253,194 | ) |
| BNP Paribas | | | BRL 3,200 | | | | 1/2/13 | | | BRL-CDI-Compounded | | 11.88% | | | 23,928 | | | | (15,091 | ) | | | 39,019 | |
| Citibank NA | | | $1,400 | | | | 11/2/20 | | | 3-Month USD-LIBOR | | 3.25% | | | (71,869 | ) | | | (6,370 | ) | | | (65,499 | ) |
| Deutsche Bank | | | £500 | | | | 9/15/12 | | | United Kingdom RPI Index | | 3.45% | | | 397 | | | | — | | | | 397 | |
| Goldman Sachs | | | $1,800 | | | | 1/2/13 | | | 3-Month USD-LIBOR | | 3.25% | | | (90,217 | ) | | | (7,020 | ) | | | (83,197 | ) |
| Goldman Sachs | | | BRL 12,900 | | | | 1/2/13 | | | BRL-CDI-Compounded | | 11.89% | | | 102,114 | | | | 6,711 | | | | 95,403 | |
| HSBC Bank | | | BRL 3,600 | | | | 1/2/12 | | | BRL-CDI-Compounded | | 11.14% | | | 41,988 | | | | 13,812 | | | | 28,176 | |
| HSBC Bank | | | BRL 27,700 | | | | 1/2/12 | | | BRL-CDI-Compounded | | 11.36% | | | 289,041 | | | | 19,350 | | | | 269,691 | |
| HSBC Bank | | | BRL 5,400 | | | | 1/2/12 | | | BRL-CDI-Compounded | | 11.67% | | | 98,680 | | | | 43,235 | | | | 55,445 | |
| HSBC Bank | | | BRL 2,600 | | | | 1/2/13 | | | BRL-CDI-Compounded | | 11.89% | | | 20,581 | | | | 3,940 | | | | 16,641 | |
| JPMorgan Chase | | | BRL 3,000 | | | | 1/2/12 | | | BRL-CDI-Compounded | | 11.25% | | | (217 | ) | | | (76 | ) | | | (141 | ) |
| JPMorgan Chase | | | BRL 1,100 | | | | 1/2/13 | | | BRL-CDI-Compounded | | 12.17% | | | 12,690 | | | | 4,671 | | | | 8,019 | |
10.31.10 ï Allianz Global Investors Managed Accounts Trust Annual Report 115
Allianz Global Investors Managed Accounts Trust Notes to Financial Statements
October 31, 2010
5. Investments in Securities (continued)
| | | | | | | | | | | | | | | | | | | | | | | | | |
Fixed Income SHares: Series R:
| |
| | | Notional
| | | | | | Rate Type | | | | | Upfront
| | | Unrealized
| |
| | | Amount
| | | Termination
| | | Payments
| | Payments
| | Market
| | | Premiums
| | | Appreciation
| |
| Swap Counterparty | | (000s) | | | Date | | | Made | | Received | | Value | | | Paid(Received) | | | (Depreciation) | |
| | |
| |
| Morgan Stanley | | | $2,900 | | | | 11/2/20 | | | 3-Month USD-LIBOR | | 3.25% | | | $(148,870 | ) | | | $(19,430 | ) | | | $(129,440 | ) |
| Morgan Stanley | | | BRL 7,700 | | | | 1/2/12 | | | BRL-CDI-Compounded | | 10.12% | | | (141,740 | ) | | | (137,055 | ) | | | (4,685 | ) |
| Morgan Stanley | | | BRL 11,000 | | | | 1/2/12 | | | BRL-CDI-Compounded | | 11.29% | | | 2,837 | | | | (8,056 | ) | | | 10,893 | |
| Morgan Stanley | | | BRL 6,900 | | | | 1/2/12 | | | BRL-CDI-Compounded | | 11.60% | | | 119,921 | | | | 39,777 | | | | 80,144 | |
| Morgan Stanley | | | BRL 1,100 | | | | 1/2/12 | | | BRL-CDI-Compounded | | 12.54% | | | 33,617 | | | | (3,176 | ) | | | 36,793 | |
| Morgan Stanley | | | BRL 3,200 | | | | 1/2/13 | | | BRL-CDI-Compounded | | 11.98% | | | 28,182 | | | | — | | | | 28,182 | |
| Royal Bank of Scotland | | | £1,600 | | | | 9/14/12 | | | United Kingdom RPI Index | | 3.44% | | | 263 | | | | — | | | | 263 | |
| UBS | | | BRL 600 | | | | 1/2/13 | | | BRL-CDI-Compounded | | 12.07% | | | 6,115 | | | | 1,103 | | | | 5,012 | |
| UBS | | | BRL 3,300 | | | | 1/2/13 | | | BRL-CDI-Compounded | | 12.07% | | | 33,637 | | | | (11,616 | ) | | | 45,253 | |
| | | | | | | | | | | | | | | | | | | | | | | | | |
| | | | | | | | | | | | | | | | $168,705 | | | | $(70,417 | ) | | | $239,122 | |
| | | | | | | | | | | | | | | | | | | | | | | | | |
AUD – Australian Dollar
BRL – Brazilian Real
£ – British Pound
CDI – Inter-Bank Deposit Certificate
EUR/€ – Euro
LIBOR – London Inter-Bank Offered Rate
MXN – Mexican Peso
RPI – Retail Price Index
TIIE – Inter-Bank Equilibrium Interest Rate
(e) Forward foreign currency contracts outstanding at October 31, 2010:
| | | | | | | | | | | | | | | |
Fixed Income SHares: Series C:
| |
| | | | | | | | | | | Unrealized
| |
| | | | | U.S.$ Value on
| | | U.S.$ Value
| | | Appreciation
| |
| | | Counterparty | | Origination Date | | | October 31, 2010 | | | (Depreciation) | |
| | |
| |
Purchased: | | | | | | | | | | | | | | |
| 32,785,000 Australian Dollar settling 12/3/10 | | Bank of America | | | $32,191,591 | | | | $32,017,526 | | | | $(174,065 | ) |
| 147,316,500 Brazilian Real settling 12/2/10 | | Citigroup | | | 86,691,345 | | | | 86,250,457 | | | | (440,888 | ) |
| 37,998,290 Brazilian Real settling 12/2/10 | | HSBC Bank | | | 22,066,370 | | | | 22,247,134 | | | | 180,764 | |
| 3,855,500 Brazilian Real settling 12/2/10 | | Morgan Stanley | | | 2,200,000 | | | | 2,257,307 | | | | 57,307 | |
| 130,932,758 Brazilian Real settling 12/2/10 | | Royal Bank of Scotland | | | 76,236,574 | | | | 76,658,149 | | | | 421,575 | |
| 10,900,000 Canadian Dollar settling 11/18/10 | | Credit Suisse First Boston | | | 10,352,911 | | | | 10,707,424 | | | | 354,513 | |
| 70,154,000 Canadian Dollar settling 11/18/10 | | Morgan Stanley | | | 65,923,058 | | | | 68,914,549 | | | | 2,991,491 | |
| 511,455,000 Chilean Peso settling 1/12/11 | | JPMorgan Chase | | | 1,039,966 | | | | 1,040,516 | | | | 550 | |
| 103,629,070 Chinese Yuan Renminbi settling 11/23/10 | | Barclays Bank | | | 15,623,000 | | | | 15,576,292 | | | | (46,708 | ) |
116 Allianz Global Investors Managed Accounts Trust Annual Report ï 10.31.10
Allianz Global Investors Managed Accounts Trust Notes to Financial Statements
October 31, 2010
5. Investments in Securities (continued)
| | | | | | | | | | | | | | | |
| | | | | | | | | | | Unrealized
| |
| | | | | U.S.$ Value on
| | | U.S.$ Value
| | | Appreciation
| |
| | | Counterparty | | Origination Date | | | October 31, 2010 | | | (Depreciation) | |
| | |
| |
| 779,016,565 Chinese Yuan Renminbi settling 1/10/11 | | Barclays Bank | | | $117,023,000 | | | | $117,749,144 | | | | $726,144 | |
| 365,537,400 Chinese Yuan Renminbi settling 9/14/11 | | Barclays Bank | | | 55,600,000 | | | | 56,451,037 | | | | 851,037 | |
| 97,545,000 Chinese Yuan Renminbi settling 11/15/11 | | Barclays Bank | | | 15,143,317 | | | | 15,134,284 | | | | (9,033 | ) |
| 156,384,762 Chinese Yuan Renminbi settling 11/17/10 | | Citigroup | | | 23,575,000 | | | | 23,488,249 | | | | (86,751 | ) |
| 411,336,000 Chinese Yuan Renminbi settling 11/15/11 | | Citigroup | | | 63,535,981 | | | | 63,819,527 | | | | 283,546 | |
| 399,943,500 Chinese Yuan Renminbi settling 11/17/10 | | Deutsche Bank | | | 60,362,878 | | | | 60,069,616 | | | | (293,262 | ) |
| 151,939,200 Chinese Yuan Renminbi settling 1/10/11 | | HSBC Bank | | | 22,800,000 | | | | 22,965,764 | | | | 165,764 | |
| 832,936,500 Chinese Yuan Renminbi settling 6/15/11 | | HSBC Bank | | | 127,800,000 | | | | 127,705,947 | | | | (94,053 | ) |
| 162,565,000 Chinese Yuan Renminbi settling 1/10/11 | | JPMorgan Chase | | | 24,400,000 | | | | 24,571,865 | | | | 171,865 | |
| 185,147,000 Chinese Yuan Renminbi settling 11/15/11 | | JPMorgan Chase | | | 28,825,627 | | | | 28,725,893 | | | | (99,734 | ) |
| 157,491,218 Chinese Yuan Renminbi settling 11/17/10 | | Morgan Stanley | | | 23,801,000 | | | | 23,654,433 | | | | (146,567 | ) |
| 602,176,800 Chinese Yuan Renminbi settling 1/10/11 | | Morgan Stanley | | | 90,400,000 | | | | 91,019,635 | | | | 619,635 | |
| 19,791,480 Chinese Yuan Renminbi settling 11/15/11 | | Royal Bank of Scotland | | | 3,058,489 | | | | 3,070,684 | | | | 12,195 | |
| 610,000 Euro settling 11/23/10 | | Barclays Bank | | | 807,771 | | | | 847,621 | | | | 39,850 | |
| 1,446,000 Euro settling 11/23/10 | | Citigroup | | | 1,846,522 | | | | 2,009,280 | | | | 162,758 | |
| 1,900,000 Euro settling 11/23/10 | | Credit Suisse First Boston | | | 2,472,436 | | | | 2,640,133 | | | | 167,697 | |
| 5,860,000 Euro settling 11/23/10 | | Royal Bank of Scotland | | | 7,535,376 | | | | 8,142,724 | | | | 607,348 | |
| 225,700,000 Indian Rupee settling 3/9/11 | | BNP Paribas | | | 5,000,000 | | | | 4,964,746 | | | | (35,254 | ) |
| 901,600,000 Indian Rupee settling 3/9/11 | | Citigroup | | | 20,000,000 | | | | 19,832,587 | | | | (167,413 | ) |
| 1,865,200,000 Japanese Yen settling 11/1/10 | | Morgan Stanley | | | 22,162,547 | | | | 23,155,804 | | | | 993,257 | |
| 1,865,200,000 Japanese Yen settling 12/6/10 | | Royal Bank of Scotland | | | 22,875,364 | | | | 23,162,221 | | | | 286,857 | |
| 210,698,000 Malaysian Ringgit settling 2/7/11 | | JPMorgan Chase | | | 68,000,000 | | | | 67,280,486 | | | | (719,514 | ) |
| 330,111,098 Mexican Peso settling 2/22/11 | | Barclays Bank | | | 25,577,660 | | | | 26,539,808 | | | | 962,148 | |
10.31.10 ï Allianz Global Investors Managed Accounts Trust Annual Report 117
Allianz Global Investors Managed Accounts Trust Notes to Financial Statements
October 31, 2010
5. Investments in Securities (continued)
| | | | | | | | | | | | | | | |
| | | | | | | | | | | Unrealized
| |
| | | | | U.S.$ Value on
| | | U.S.$ Value
| | | Appreciation
| |
| | | Counterparty | | Origination Date | | | October 31, 2010 | | | (Depreciation) | |
| | |
| |
| 569,880,194 Mexican Peso settling 2/22/11 | | Citigroup | | | $43,873,662 | | | | $45,816,428 | | | | $1,942,766 | |
| 15,427,581 Mexican Peso settling 2/22/11 | | Deutsche Bank | | | 1,196,650 | | | | 1,240,325 | | | | 43,675 | |
| 2,023,232,200 Mexican Peso settling 2/22/11 | | Morgan Stanley | | | 159,200,000 | | | | 162,660,981 | | | | 3,460,981 | |
| 542,395,500 Mexican Peso settling 2/22/11 | | Royal Bank of Scotland | | | 41,900,000 | | | | 43,606,752 | | | | 1,706,752 | |
| 25,061,000 Norwegian Krone settling 11/4/10 | | Citigroup | | | 4,100,506 | | | | 4,255,050 | | | | 154,544 | |
| 603,553,000 Norwegian Krone settling 11/4/10 | | Morgan Stanley | | | 103,261,476 | | | | 102,475,890 | | | | (785,586 | ) |
| 1,478,469,800 Philippines Peso settling 2/7/11 | | Citigroup | | | 33,980,000 | | | | 34,130,120 | | | | 150,120 | |
| 422,579,200 Philippines Peso settling 2/7/11 | | Deutsche Bank | | | 9,710,000 | | | | 9,755,139 | | | | 45,139 | |
| 274,800,500 Philippines Peso settling 2/7/11 | | UBS | | | 6,310,000 | | | | 6,343,703 | | | | 33,703 | |
| 22,368,000,000 South Korean Won settling 1/19/11 | | Citigroup | | | 20,000,000 | | | | 19,817,514 | | | | (182,486 | ) |
| 5,592,500,000 South Korean Won settling 1/19/11 | | Goldman Sachs | | | 5,000,000 | | | | 4,954,822 | | | | (45,178 | ) |
| 55,900,000,000 South Korean Won settling 1/19/11 | | HSBC Bank | | | 50,000,000 | | | | 49,526,066 | | | | (473,934 | ) |
| 53,342,910,000 South Korean Won settling 1/19/11 | | Morgan Stanley | | | 47,700,000 | | | | 47,260,545 | | | | (439,455 | ) |
| 367,000 Taiwan Dollar settling 4/6/11 | | Bank of America | | | 12,064 | | | | 12,022 | | | | (42 | ) |
| 1,661,423 Taiwan Dollar settling 1/14/11 | | Deutsche Bank | | | 53,490 | | | | 54,322 | | | | 832 | |
| 200,000 Taiwan Dollar settling 4/6/11 | | Deutsche Bank | | | 6,520 | | | | 6,551 | | | | 31 | |
| 1,018,000 Taiwan Dollar settling 1/14/11 | | JPMorgan Chase | | | 32,236 | | | | 33,285 | | | | 1,049 | |
| 377,424 Taiwan Dollar settling 4/6/11 | | JPMorgan Chase | | | 12,473 | | | | 12,364 | | | | (109 | ) |
| 1,566,000 Taiwan Dollar settling 1/14/11 | | Morgan Stanley | | | 49,833 | | | | 51,202 | | | | 1,369 | |
| 849,000 Taiwan Dollar settling 1/14/11 | | UBS | | | 26,786 | | | | 27,759 | | | | 973 | |
| | | | | | | | | | | | | | | |
Sold: | | | | | | | | | | | | | | |
| 104,873,800 Brazilian Real settling 2/2/11 | | Citigroup | | | 60,589,173 | | | | 60,653,209 | | | | (64,036 | ) |
| 42,442,700 Brazilian Real settling 3/2/11 | | Citigroup | | | 24,887,241 | | | | 24,409,916 | | | | 477,325 | |
| 102,446,860 Brazilian Real settling 12/2/10 | | HSBC Bank | | | 58,478,959 | | | | 59,980,304 | | | | (1,501,345 | ) |
118 Allianz Global Investors Managed Accounts Trust Annual Report ï 10.31.10
Allianz Global Investors Managed Accounts Trust Notes to Financial Statements
October 31, 2010
5. Investments in Securities (continued)
| | | | | | | | | | | | | | | |
| | | | | | | | | | | Unrealized
| |
| | | | | U.S.$ Value on
| | | U.S.$ Value
| | | Appreciation
| |
| | | Counterparty | | Origination Date | | | October 31, 2010 | | | (Depreciation) | |
| | |
| |
| 37,998,290 Brazilian Real settling 2/2/11 | | HSBC Bank | | | $21,806,766 | | | | $21,976,110 | | | | $(169,344 | ) |
| 123,870,900 Brazilian Real settling 12/2/10 | | Morgan Stanley | | | 72,000,000 | | | | 72,523,592 | | | | (523,592 | ) |
| 102,635,730 Brazilian Real settling 12/2/10 | | Royal Bank of Scotland | | | 59,700,000 | | | | 60,090,884 | | | | (390,884 | ) |
| 129,352,898 Brazilian Real settling 2/2/11 | | Royal Bank of Scotland | | | 74,464,854 | | | | 74,810,566 | | | | (345,712 | ) |
| 15,411,000 British Pound settling 12/20/10 | | Citigroup | | | 24,110,423 | | | | 24,629,934 | | | | (519,511 | ) |
| 2,244,000 British Pound settling 12/20/10 | | Goldman Sachs | | | 3,493,488 | | | | 3,586,371 | | | | (92,883 | ) |
| 2,393,000 British Pound settling 12/20/10 | | Morgan Stanley | | | 3,794,341 | | | | 3,824,504 | | | | (30,163 | ) |
| 10,180,000 British Pound settling 12/20/10 | | Royal Bank of Scotland | | | 16,178,973 | | | | 16,269,725 | | | | (90,752 | ) |
| 5,068,000 British Pound settling 12/20/10 | | UBS | | | 7,881,767 | | | | 8,099,702 | | | | (217,935 | ) |
| 20,000 Canadian Dollar settling 11/18/10 | | Bank of America | | | 19,439 | | | | 19,646 | | | | (207 | ) |
| 5,415,000 Canadian Dollar settling 11/18/10 | | Deutsche Bank | | | 5,289,378 | | | | 5,319,330 | | | | (29,952 | ) |
| 18,183,000 Canadian Dollar settling 11/18/10 | | Royal Bank of Canada | | | 17,384,861 | | | | 17,861,750 | | | | (476,889 | ) |
| 2,548,000 Canadian Dollar settling 11/18/10 | | Royal Bank of Scotland | | | 2,488,938 | | | | 2,502,983 | | | | (14,045 | ) |
| 97,545,000 Chinese Yuan Renminbi settling 11/17/10 | | Barclays Bank | | | 14,670,509 | | | | 14,650,796 | | | | 19,713 | |
| 411,336,000 Chinese Yuan Renminbi settling 11/17/10 | | Citigroup | | | 61,747,195 | | | | 61,780,715 | | | | (33,520 | ) |
| 185,147,000 Chinese Yuan Renminbi settling 11/17/10 | | JPMorgan Chase | | | 27,883,584 | | | | 27,808,201 | | | | 75,383 | |
| 19,791,480 Chinese Yuan Renminbi settling 11/17/10 | | Royal Bank of Scotland | | | 2,965,460 | | | | 2,972,586 | | | | (7,126 | ) |
| 360,000 Euro settling 11/23/10 | | Bank of America | | | 501,275 | | | | 500,236 | | | | 1,039 | |
| 92,851,000 Euro settling 11/23/10 | | Citigroup | | | 129,242,185 | | | | 129,020,494 | | | | 221,691 | |
| 3,973,000 Euro settling 11/23/10 | | Deutsche Bank | | | 5,087,943 | | | | 5,520,656 | | | | (432,713 | ) |
| 278,842,000 Euro settling 11/23/10 | | Goldman Sachs | | | 388,162,006 | | | | 387,463,058 | | | | 698,948 | |
| 8,119,000 Euro settling 11/23/10 | | Royal Bank of Scotland | | | 11,272,415 | | | | 11,281,703 | | | | (9,288 | ) |
| 3,625,830 Indian Rupee settling 3/9/11 | | Barclays Bank | | | 78,000 | | | | 79,758 | | | | (1,758 | ) |
10.31.10 ï Allianz Global Investors Managed Accounts Trust Annual Report 119
Allianz Global Investors Managed Accounts Trust Notes to Financial Statements
October 31, 2010
5. Investments in Securities (continued)
| | | | | | | | | | | | | | | |
| | | | | | | | | | | Unrealized
| |
| | | | | U.S.$ Value on
| | | U.S.$ Value
| | | Appreciation
| |
| | | Counterparty | | Origination Date | | | October 31, 2010 | | | (Depreciation) | |
| | |
| |
| 1,760,620 Indian Rupee settling 3/9/11 | | HSBC Bank | | | $37,936 | | | | $38,728 | | | | $(792 | ) |
| 1,823,419 Indian Rupee settling 3/9/11 | | JPMorgan Chase | | | 39,391 | | | | 40,110 | | | | (719 | ) |
| 2,076,672 Indian Rupee settling 3/9/11 | | UBS | | | 44,806 | | | | 45,681 | | | | (875 | ) |
| 1,865,200,000 Japanese Yen settling 11/1/10 | | Royal Bank of Scotland | | | 22,869,053 | | | | 23,155,804 | | | | (286,751 | ) |
| 334,010 Singapore Dollar settling 3/9/11 | | Citigroup | | | 249,016 | | | | 258,091 | | | | (9,075 | ) |
| | | | | | | | | | | | | | | |
| | | | | | | | | | | | | | $9,602,435 | |
| | | | | | | | | | | | | | | |
| | | | | | | | | | | | | | | |
Fixed Income SHares: Series M:
| |
| | | | | | | | | | | Unrealized
| |
| | | | | U.S.$ Value on
| | | U.S.$ Value
| | | Appreciation
| |
| | | Counterparty | | Origination Date | | | October 31, 2010 | | | (Depreciation) | |
| | |
| |
Purchased: | | | | | | | | | | | | | | |
| 53,500,000 Australian Dollar settling 12/3/10 | | Citigroup | | | $52,559,952 | | | | $52,247,603 | | | | $(312,349 | ) |
| 1,155,000 Canadian Dollar settling 11/18/10 | | Bank of America | | | 1,122,634 | | | | 1,134,594 | | | | 11,960 | |
| 225,700,000 Indian Rupee settling 3/9/11 | | BNP Paribas | | | 5,000,000 | | | | 4,964,746 | | | | (35,254 | ) |
| 901,600,000 Indian Rupee settling 3/9/11 | | Citigroup | | | 20,000,000 | | | | 19,832,587 | | | | (167,413 | ) |
| 35,698,561 Mexican Peso settling 2/22/11 | | Bank of America | | | 2,780,067 | | | | 2,870,043 | | | | 89,976 | |
| 14,879,146 Mexican Peso settling 2/22/11 | | Barclays Bank | | | 1,124,652 | | | | 1,196,233 | | | | 71,581 | |
| 36,543,239 Mexican Peso settling 2/22/11 | | Citigroup | | | 2,755,900 | | | | 2,937,952 | | | | 182,052 | |
| 1,513,044 Mexican Peso settling 2/22/11 | | Deutsche Bank | | | 114,093 | | | | 121,644 | | | | 7,551 | |
| 22,368,000,000 South Korean Won settling 1/19/11 | | Citigroup | | | 20,000,000 | | | | 19,817,514 | | | | (182,486 | ) |
| 5,592,500,000 South Korean Won settling 1/19/11 | | Goldman Sachs | | | 5,000,000 | | | | 4,954,821 | | | | (45,179 | ) |
| | | | | | | | | | | | | | | |
Sold: | | | | | | | | | | | | | | |
| 61,736,000 British Pound settling 12/20/10 | | Citigroup | | | 95,850,388 | | | | 98,666,770 | | | | (2,816,382 | ) |
| 13,207,000 British Pound settling 12/20/10 | | Goldman Sachs | | | 20,560,829 | | | | 21,107,490 | | | | (546,661 | ) |
| 29,835,000 British Pound settling 12/20/10 | | UBS | | | 46,399,474 | | | | 47,682,439 | | | | (1,282,965 | ) |
| 158,148,000 Canadian Dollar settling 11/18/10 | | Deutsche Bank | | | 154,475,826 | | | | 155,353,908 | | | | (878,082 | ) |
120 Allianz Global Investors Managed Accounts Trust Annual Report ï 10.31.10
Allianz Global Investors Managed Accounts Trust Notes to Financial Statements
October 31, 2010
5. Investments in Securities (continued)
| | | | | | | | | | | | | | | |
Fixed Income SHares: Series M:
| |
| | | | | | | | | | | Unrealized
| |
| | | | | U.S.$ Value on
| | | U.S.$ Value
| | | Appreciation
| |
| | | Counterparty | | Origination Date | | | October 31, 2010 | | | (Depreciation) | |
| | |
| |
| 78,834,000 Canadian Dollar settling 11/18/10 | | Royal Bank of Scotland | | | $77,006,633 | | | | $77,441,195 | | | | $(434,562 | ) |
| 4,101,000 Euro settling 1/25/11 | | Citigroup | | | 5,701,846 | | | | 5,693,464 | | | | 8,382 | |
| 2,727,000 Euro settling 11/23/10 | | Deutsche Bank | | | 3,492,278 | | | | 3,789,285 | | | | (297,007 | ) |
| | | | | | | | | | | | | | | |
| | | | | | | | | | | | | | $(6,626,838 | ) |
| | | | | | | | | | | | | | | |
| | | | | | | | | | | | | | | |
Fixed Income SHares: Series R:
| |
| | | | | | | | | | | Unrealized
| |
| | | | | U.S.$ Value on
| | | U.S.$ Value
| | | Appreciation
| |
| | | Counterparty | | Origination Date | | | October 31, 2010 | | | (Depreciation) | |
| | |
| |
Purchased: | | | | | | | | | | | | | | |
| 7,791,071 Brazilian Real settling 3/2/11 | | Citigroup | | | $4,568,472 | | | | $4,480,851 | | | | $(87,621 | ) |
| 1,575,450 Brazilian Real settling 12/2/10 | | Deutsche Bank | | | 900,000 | | | | 922,390 | | | | 22,390 | |
| 5,862,221 Brazilian Real settling 12/2/10 | | HSBC Bank | | | 3,266,589 | | | | 3,432,197 | | | | 165,608 | |
| 353,400 Brazilian Real settling 12/2/10 | | Royal Bank of Scotland | | | 200,000 | | | | 206,908 | | | | 6,908 | |
| 207,000 Canadian Dollar settling 12/1/10 | | Citigroup | | | 202,944 | | | | 202,822 | | | | (122 | ) |
| 572,000 Canadian Dollar settling 11/18/10 | | Credit Suisse First Boston | | | 560,268 | | | | 561,894 | | | | 1,626 | |
| 2,656,200 Chinese Yuan Renminbi settling 1/10/11 | | Bank of America | | | 400,000 | | | | 401,487 | | | | 1,487 | |
| 351,572 Chinese Yuan Renminbi settling 11/23/10 | | Barclays Bank | | | 53,000 | | | | 52,844 | | | | (156 | ) |
| 274,000 Chinese Yuan Renminbi settling 11/15/11 | | Barclays Bank | | | 42,646 | | | | 42,512 | | | | (134 | ) |
| 563,848 Chinese Yuan Renminbi settling 11/17/10 | | Citigroup | | | 85,000 | | | | 84,687 | | | | (313 | ) |
| 1,649,062 Chinese Yuan Renminbi settling 11/15/11 | | Citigroup | | | 253,839 | | | | 255,855 | | | | 2,016 | |
| 1,457,535 Chinese Yuan Renminbi settling 11/17/10 | | Deutsche Bank | | | 219,984 | | | | 218,915 | | | | (1,069 | ) |
| 4,516,000 Chinese Yuan Renminbi settling 1/10/11 | | Deutsche Bank | | | 674,231 | | | | 682,598 | | | | 8,367 | |
| 6,530,000 Chinese Yuan Renminbi settling 1/10/11 | | JPMorgan Chase | | | 978,497 | | | | 987,016 | | | | 8,519 | |
| 674,000 Chinese Yuan Renminbi settling 11/15/11 | | JPMorgan Chase | | | 104,935 | | | | 104,572 | | | | (363 | ) |
| 575,680 Chinese Yuan Renminbi settling 11/17/10 | | Morgan Stanley | | | 87,000 | | | | 86,465 | | | | (535 | ) |
10.31.10 ï Allianz Global Investors Managed Accounts Trust Annual Report 121
Allianz Global Investors Managed Accounts Trust Notes to Financial Statements
October 31, 2010
5. Investments in Securities (continued)
| | | | | | | | | | | | | | | |
| | | | | | | | | | | Unrealized
| |
| | | | | U.S.$ Value on
| | | U.S.$ Value
| | | Appreciation
| |
| | | Counterparty | | Origination Date | | | October 31, 2010 | | | (Depreciation) | |
| | |
| |
| 4,647,860 Chinese Yuan Renminbi settling 1/10/11 | | Morgan Stanley | | | $700,000 | | | | $702,529 | | | | $2,529 | |
| 4,513,000 Euro settling 11/23/10 | | Barclays Bank | | | 6,256,869 | | | | 6,271,009 | | | | 14,140 | |
| 275,000 Euro settling 1/25/11 | | Deutsche Bank | | | 377,855 | | | | 381,785 | | | | 3,930 | |
| 4,759,120 Indian Rupee settling 3/9/11 | | Bank of America | | | 101,000 | | | | 104,687 | | | | 3,687 | |
| 36,019,500 Indian Rupee settling 3/9/11 | | Barclays Bank | | | 800,000 | | | | 792,325 | | | | (7,675 | ) |
| 120,712,900 Indian Rupee settling 3/9/11 | | Citigroup | | | 2,652,265 | | | | 2,655,334 | | | | 3,069 | |
| 86,165,400 Indian Rupee settling 3/9/11 | | Deutsche Bank | | | 1,885,000 | | | | 1,895,389 | | | | 10,389 | |
| 55,497,850 Indian Rupee settling 3/9/11 | | JPMorgan Chase | | | 1,199,000 | | | | 1,220,792 | | | | 21,792 | |
| 23,260,000 Indian Rupee settling 11/12/10 | | Morgan Stanley | | | 500,000 | | | | 522,423 | | | | 22,423 | |
| 14,560,000 Indian Rupee settling 3/9/11 | | Royal Bank of Scotland | | | 322,991 | | | | 320,278 | | | | (2,713 | ) |
| 5,665,000 Indian Rupee settling 3/9/11 | | UBS | | | 125,000 | | | | 124,614 | | | | (386 | ) |
| 9,187,200,000 Indonesian Rupiah settling 10/31/11 | | Citigroup | | | 990,000 | | | | 968,414 | | | | (21,586 | ) |
| 452,000 Philippines Peso settling 11/15/10 | | Barclays Bank | | | 9,727 | | | | 10,500 | | | | 773 | |
| 45,481,327 Philippines Peso settling 11/15/10 | | Citigroup | | | 1,031,600 | | | | 1,056,472 | | | | 24,872 | |
| 90,848,150 Philippines Peso settling 2/7/11 | | Citigroup | | | 2,085,000 | | | | 2,097,208 | | | | 12,208 | |
| 85,475,400 Philippines Peso settling 6/15/11 | | Citigroup | | | 1,947,719 | | | | 1,955,963 | | | | 8,244 | |
| 26,866,000 Philippines Peso settling 11/15/10 | | Deutsche Bank | | | 609,243 | | | | 624,062 | | | | 14,819 | |
| 18,583,040 Philippines Peso settling 2/7/11 | | Deutsche Bank | | | 427,000 | | | | 428,985 | | | | 1,985 | |
| 14,009,600 Philippines Peso settling 6/15/11 | | Deutsche Bank | | | 318,541 | | | | 320,587 | | | | 2,046 | |
| 6,542,000 Philippines Peso settling 6/15/11 | | HSBC Bank | | | 149,463 | | | | 149,703 | | | | 240 | |
| 8,945,000 Philippines Peso settling 6/15/11 | | JPMorgan Chase | | | 203,991 | | | | 204,692 | | | | 701 | |
| 12,106,900 Philippines Peso settling 2/7/11 | | UBS | | | 278,000 | | | | 279,485 | | | | 1,485 | |
| 345,062,000 South Korean Won settling 11/12/10 | | Bank of America | | | 292,641 | | | | 306,517 | | | | 13,876 | |
122 Allianz Global Investors Managed Accounts Trust Annual Report ï 10.31.10
Allianz Global Investors Managed Accounts Trust Notes to Financial Statements
October 31, 2010
5. Investments in Securities (continued)
| | | | | | | | | | | | | | | |
| | | | | | | | | | | Unrealized
| |
| | | | | U.S.$ Value on
| | | U.S.$ Value
| | | Appreciation
| |
| | | Counterparty | | Origination Date | | | October 31, 2010 | | | (Depreciation) | |
| | |
| |
| 1,521,444,677 South Korean Won settling 11/12/10 | | Barclays Bank | | | $1,268,626 | | | | $1,351,494 | | | | $82,868 | |
| 272,200,000 South Korean Won settling 5/9/11 | | Barclays Bank | | | 242,322 | | | | 240,710 | | | | (1,612 | ) |
| 2,184,458,323 South Korean Won settling 11/12/10 | | Citigroup | | | 1,848,036 | | | | 1,940,447 | | | | 92,411 | |
| 687,780,000 South Korean Won settling 1/19/11 | | Citigroup | | | 600,000 | | | | 609,357 | | | | 9,357 | |
| 2,881,500,000 South Korean Won settling 5/9/11 | | Citigroup | | | 2,560,367 | | | | 2,548,149 | | | | (12,218 | ) |
| 197,642,000 South Korean Won settling 11/12/10 | | Deutsche Bank | | | 170,000 | | | | 175,565 | | | | 5,565 | |
| 3,707,460,000 South Korean Won settling 1/19/11 | | Deutsche Bank | | | 3,300,000 | | | | 3,284,721 | | | | (15,279 | ) |
| 227,300,000 South Korean Won settling 5/9/11 | | Deutsche Bank | | | 200,000 | | | | 201,004 | | | | 1,004 | |
| 105,570,000 South Korean Won settling 11/12/10 | | Goldman Sachs | | | 90,000 | | | | 93,777 | | | | 3,777 | |
| 386,648,000 South Korean Won settling 1/19/11 | | Goldman Sachs | | | 340,000 | | | | 342,561 | | | | 2,561 | |
| 219,351,500 South Korean Won settling 5/9/11 | | Goldman Sachs | | �� | 193,295 | | | | 193,975 | | | | 680 | |
| 514,000,000 South Korean Won settling 5/9/11 | | HSBC Bank | | | 457,866 | | | | 454,537 | | | | (3,329 | ) |
| 815,370,500 South Korean Won settling 11/12/10 | | JPMorgan Chase | | | 710,000 | | | | 724,291 | | | | 14,291 | |
| 1,184,300,000 South Korean Won settling 5/9/11 | | JPMorgan Chase | | | 1,044,327 | | | | 1,047,292 | | | | 2,965 | |
| 804,774,000 South Korean Won settling 11/12/10 | | Morgan Stanley | | | 688,294 | | | | 714,878 | | | | 26,584 | |
| 468,280,000 South Korean Won settling 11/12/10 | | Royal Bank of Scotland | | | 384,577 | | | | 415,972 | | | | 31,395 | |
| 1,029,000,000 South Korean Won settling 5/9/11 | | Royal Bank of Scotland | | | 909,533 | | | | 909,958 | | | | 425 | |
| 808,406,000 South Korean Won settling 1/19/11 | | UBS | | | 710,000 | | | | 716,228 | | | | 6,228 | |
| 113,820,000 South Korean Won settling 5/9/11 | | UBS | | | 100,000 | | | | 100,652 | | | | 652 | |
| | | | | | | | | | | | | | | |
Sold: | | | | | | | | | | | | | | |
| 14,202,000 Australian Dollar settling 12/3/10 | | Deutsche Bank | | | 13,925,743 | | | | 13,869,541 | | | | 56,202 | |
| 7,791,071 Brazilian Real settling 12/2/10 | | Citigroup | | | 4,655,555 | | | | 4,561,495 | | | | 94,060 | |
| 3,445,000 British Pound settling 12/20/10 | | Citigroup | | | 5,348,655 | | | | 5,505,815 | | | | (157,160 | ) |
| 755,000 British Pound settling 12/20/10 | | Goldman Sachs | | | 1,175,394 | | | | 1,206,645 | | | | (31,251 | ) |
10.31.10 ï Allianz Global Investors Managed Accounts Trust Annual Report 123
Allianz Global Investors Managed Accounts Trust Notes to Financial Statements
October 31, 2010
5. Investments in Securities (continued)
| | | | | | | | | | | | | | | |
| | | | | | | | | | | Unrealized
| |
| | | | | U.S.$ Value on
| | | U.S.$ Value
| | | Appreciation
| |
| | | Counterparty | | Origination Date | | | October 31, 2010 | | | (Depreciation) | |
| | |
| |
| 1,705,000 British Pound settling 12/20/10 | | UBS | | | $2,651,619 | | | | $2,724,939 | | | | $(73,320 | ) |
| 7,600,000 Canadian Dollar settling 11/18/10 | | BNP Paribas | | | 7,391,163 | | | | 7,465,727 | | | | (74,564 | ) |
| 207,000 Canadian Dollar settling 11/2/10 | | Citigroup | | | 203,077 | | | | 202,957 | | | | 120 | |
| 571,946 Canadian Dollar settling 11/1/10 | | Credit Suisse First Boston | | | 560,419 | | | | 562,054 | | | | (1,635 | ) |
| 772,000 Canadian Dollar settling 11/18/10 | | Deutsche Bank | | | 754,090 | | | | 758,360 | | | | (4,270 | ) |
| 2,202,000 Canadian Dollar settling 11/18/10 | | Royal Bank of Canada | | | 2,105,344 | | | | 2,163,096 | | | | (57,752 | ) |
| 363,000 Canadian Dollar settling 11/18/10 | | Royal Bank of Scotland | | | 354,586 | | | | 356,587 | | | | (2,001 | ) |
| 274,000 Chinese Yuan Renminbi settling 11/17/10 | | Barclays Bank | | | 41,265 | | | | 41,153 | | | | 112 | |
| 1,649,062 Chinese Yuan Renminbi settling 11/17/10 | | Citigroup | | | 246,865 | | | | 247,681 | | | | (816 | ) |
| 674,000 Chinese Yuan Renminbi settling 11/17/10 | | JPMorgan Chase | | | 101,506 | | | | 101,232 | | | | 274 | |
| 234,000 Euro settling 11/23/10 | | Barclays Bank | | | 309,866 | | | | 325,153 | | | | (15,287 | ) |
| 3,206,909 Euro settling 1/25/11 | | Citigroup | | | 4,458,742 | | | | 4,452,187 | | | | 6,555 | |
| 13,634,000 Euro settling 11/23/10 | | Deutsche Bank | | | 17,460,109 | | | | 18,945,034 | | | | (1,484,925 | ) |
| 3,503,000 Euro settling 11/23/10 | | UBS | | | 4,787,604 | | | | 4,867,571 | | | | (79,967 | ) |
| 8,700,000 Indian Rupee settling 11/12/10 | | Citigroup | | | 194,936 | | | | 195,403 | | | | (467 | ) |
| 14,560,000 Indian Rupee settling 11/12/10 | | Royal Bank of Scotland | | | 327,691 | | | | 327,020 | | | | 671 | |
| 24,870,000 Philippines Peso settling 11/15/10 | | Citigroup | | | 573,807 | | | | 577,698 | | | | (3,891 | ) |
| 8,708,000 Philippines Peso settling 11/15/10 | | Deutsche Bank | | | 201,016 | | | | 202,276 | | | | (1,260 | ) |
| 6,542,000 Philippines Peso settling 11/15/10 | | HSBC Bank | | | 151,435 | | | | 151,962 | | | | (527 | ) |
| 8,945,000 Philippines Peso settling 11/15/10 | | JPMorgan Chase | | | 206,201 | | | | 207,781 | | | | (1,580 | ) |
| 2,345,327 Philippines Peso settling 11/15/10 | | UBS | | | 51,421 | | | | 54,478 | | | | (3,057 | ) |
| 272,200,000 South Korean Won settling 11/12/10 | | Barclays Bank | | | 243,101 | | | | 241,794 | | | | 1,307 | |
| 2,654,000,000 South Korean Won settling 11/12/10 | | Citigroup | | | 2,368,347 | | | | 2,357,539 | | | | 10,808 | |
124 Allianz Global Investors Managed Accounts Trust Annual Report ï 10.31.10
Allianz Global Investors Managed Accounts Trust Notes to Financial Statements
October 31, 2010
5. Investments in Securities (continued)
| | | | | | | | | | | | | | | |
| | | | | | | | | | | Unrealized
| |
| | | | | U.S.$ Value on
| | | U.S.$ Value
| | | Appreciation
| |
| | | Counterparty | | Origination Date | | | October 31, 2010 | | | (Depreciation) | |
| | |
| |
| 219,351,500 South Korean Won settling 11/12/10 | | Goldman Sachs | | | $194,013 | | | | $194,849 | | | | $(836 | ) |
| 514,000,000 South Korean Won settling 11/12/10 | | HSBC Bank | | | 459,955 | | | | 456,584 | | | | 3,371 | |
| 1,184,300,000 South Korean Won settling 11/12/10 | | JPMorgan Chase | | | 1,046,202 | | | | 1,052,010 | | | | (5,808 | ) |
| 1,598,750,000 South Korean Won settling 11/12/10 | | Royal Bank of Scotland | | | 1,412,881 | | | | 1,420,164 | | | | (7,283 | ) |
| | | | | | | | | | | | | | | |
| | | | | | | | | | | | | | $(1,328,396 | ) |
| | | | | | | | | | | | | | | |
At October 31, 2010, Fixed Income SHares: Series C held $410,000 in principal value of U.S. Treasury Bills; Fixed Income SHares: Series C, Series M and Series R held $35,510,000, $29,630,000 and $3,030,000, respectively, in cash as collateral for derivatives and delayed-delivery securities. Cash collateral held may be invested in accordance with the Portfolios’ investment strategies. Securities held as collateral will not be pledged and are not reflected in the Portfolios’ Schedules of Investments.
(f) Reverse repurchase agreements:
The weighted average daily balance of reverse repurchase agreements outstanding for Fixed Income SHares: Series M during the year ended October 31, 2010 was $121,444,120 at a weighted average interest rate of 0.16%. There were no open reverse repurchase agreements at October 31, 2010.
6. Income Tax Information
Equity Shares: Series I:
The tax character of dividends paid was:
| | | | | | | | | |
| | | | | | For the period
| |
| | | | | | August 3, 2009*
| |
| | | Year ended
| | | through
| |
| | | October 31, 2010 | | | October 31, 2009 | |
| |
| Ordinary Income | | | $53,649 | | | | — | |
| | | |
| * | | Commencement of operations |
At October 31, 2010, the tax character of distributable earnings of $38,491 was comprised entirely of ordinary income.
For the year ended October 31, 2010, permanent “book-tax” differences were primarily attributable to the differing treatment of foreign currency transactions. These adjustments were to decrease undistributed net investment income by $3,489 and decrease accumulated net realized loss by $3,489.
At October 31, 2010, Equity Shares: Series I had capital loss carryforward of $75,109 (which will expire in 2018), available as a reduction, to the extent provided in the regulations, of any future net realized capital gains. To the extent that these losses are used to offset future realized capital gains, such gains will not be distributed.
10.31.10 ï Allianz Global Investors Managed Accounts Trust Annual Report 125
Allianz Global Investors Managed Accounts Trust Notes to Financial Statements
October 31, 2010
6. Income Tax Information (continued)
Fixed Income SHares: Series C:
The tax character of dividends and distributions paid was:
| | | | | | | | | |
| | | Year ended
| | | Year ended
| |
| | | October 31, 2010 | | | October 31, 2009 | |
| |
| Ordinary Income | | | $498,140,712 | | | | $384,158,365 | |
| Long-Term Capital Gains | | | 34,775,505 | | | | 36,429,655 | |
At October 31, 2010, the tax character of distributable earnings of $200,163,218 was comprised of $128,423,061 of ordinary income and $71,740,157 of long-term capital gains.
For the year ended October 31, 2010, permanent “book-tax” differences were primarily attributable to the differing treatment of foreign currency transactions, swap payments, paydowns, and gains from the sale of securities classified as Passive Foreign Investment Companies (“PFICs”) for tax purposes. These adjustments were to increase undistributed net investment income by $87,685,063 and decrease accumulated net realized gain by $87,685,063.
Fixed Income SHares: Series H:
The tax character of dividends and distributions paid was:
| | | | | | | | | |
| | | Year ended
| | | Year ended
| |
| | | October 31, 2010 | | | October 31, 2009 | |
| |
| Ordinary Income | | | — | | | | $7,885 | |
| Tax-Exempt Income | | | $213,436 | | | | 156,345 | |
At October 31, 2010, there were no distributable earnings.
For the year ended October 31, 2010, there were no permanent “book-tax” differences.
At October 31, 2010, Fixed Income SHares: Series H had capital loss carryforward of $467,363 ($41,357 of which will expire in 2015, $54,942 of which will expire in 2016, $223,253 of which will expire in 2017 and $147,811 of which will expire in 2018), available as a reduction, to the extent provided in the regulations, of any future net realized capital gains. To the extent that these losses are used to offset future realized capital gains, such gains will not be distributed.
Fixed Income SHares: Series M:
The tax character of dividends and distributions paid was:
| | | | | | | | | |
| | | Year ended
| | | Year ended
| |
| | | October 31, 2010 | | | October 31, 2009 | |
| |
| Ordinary Income | | | $201,758,229 | | | | $313,991,564 | |
At October 31, 2010, the tax character of distributable earnings of $48,299,431 was comprised of $9,326,378 of ordinary income and $38,973,053 of long-term capital gains.
For the year ended October 31, 2010, permanent “book-tax” differences were primarily attributable to the differing treatment of foreign currency transactions, swap payments, and paydowns. These adjustments were to increase undistributed net investment income by $35,211,361 and decrease accumulated net realized gain by $35,211,361.
For the year ended October 31, 2010, Fixed Income SHares: Series M utilized capital loss carryovers of $195,626,800.
126 Allianz Global Investors Managed Accounts Trust Annual Report ï 10.31.10
Allianz Global Investors Managed Accounts Trust Notes to Financial Statements
October 31, 2010
6. Income Tax Information (continued)
Fixed Income SHares: Series R:
The tax character of dividends and distributions paid was:
| | | | | | | | | |
| | | Year ended
| | | Year ended
| |
| | | October 31, 2010 | | | October 31, 2009 | |
| |
| Ordinary Income | | | $16,127,915 | | | | $13,390,604 | |
| Long-Term Capital Gains | | | 820,441 | | | | — | |
At October 31, 2010, the tax character of distributable earnings of $33,792,813 was comprised of $33,333,179 of ordinary income and $459,634 of long-term capital gains.
For the year ended October 31, 2010, permanent “book-tax” differences were primarily attributable to the differing treatment of foreign currency transactions, swap payments, paydowns and contingent debt instruments. These adjustments were to increase undistributed net investment income by $4,452,745 and decrease accumulated net realized gain by $4,452,745.
The cost of investments for federal income tax purposes and gross unrealized appreciation and gross unrealized depreciation of investments at October 31, 2010 was:
| | | | | | | | | | | | | | | | | |
| | | | | | | | | | | | Net Unrealized
| |
| | | Cost of
| | | Gross Unrealized
| | | Gross Unrealized
| | | Appreciation
| |
| | | Investments | | | Appreciation | | | Depreciation | | | (Depreciation) | |
| | |
| |
| Equity Shares: Series I | | | $1,948,941 | | | | $490,149 | | | | $55,937 | | | | $434,212 | |
| Fixed Income SHares: Series C | | | 3,013,737,187 | | | | 345,113,627 | | | | 31,159,653 | | | | 313,953,974 | |
| Fixed Income SHares: Series H | | | 7,751,179 | | | | 236,662 | | | | 324,037 | | | | (87,375 | ) |
| Fixed Income SHares: Series M | | | 5,508,569,353 | | | | 191,513,064 | | | | 121,103,434 | | | | 70,409,630 | |
| Fixed Income SHares: Series R | | | 693,990,465 | | | | 21,526,405 | | | | 1,064,279 | | | | 20,462,126 | |
The primary differences between book and tax appreciation (depreciation) on investments, were attributable to wash sales, the recognition of unrealized gain on PFICs and recognized gain for tax purposes on a corporate action.
7. Legal Proceedings
In June and September 2004, the Investment Manager and certain of its affiliates (including PEA Capital LLC (“PEA”), Allianz Global Investors Distributors LLC and Allianz Global Investors of America, L.P.) agreed to settle, without admitting or denying the allegations, claims brought by the Securities and Exchange Commission (“SEC”) and the New Jersey Attorney General alleging violations of federal and state securities laws with respect to certain open-end funds for which the Investment Manager serves as investment adviser. The settlements related to an alleged “market timing” arrangement in certain open-end funds formerly sub-advised by PEA. The Investment Manager and its affiliates agreed to pay a total of $68 million to settle the claims. In addition to monetary payments, the settling parties agreed to undertake certain corporate governance, compliance and disclosure reforms related to market timing, and consented to cease and desist orders and censures. Subsequent to these events, PEA deregistered as an investment adviser and dissolved. None of the settlements alleged that any inappropriate activity took place with respect to the Portfolios.
Since February 2004, the Investment Manager and certain of its affiliates and their employees have been named as defendants in a number of pending lawsuits concerning “market timing,” which allege the same or similar conduct underlying the regulatory settlements discussed above. The market timing lawsuits have been consolidated in a multi-district litigation proceeding in the U.S. District Court for the District of Maryland (the “MDL Court”). After a number of claims in the lawsuits were dismissed by the MDL Court, the parties entered into a stipulation of settlement, which was publicly filed with the MDL Court in April 2010, resolving all remaining claims, but the settlement remains subject to the approval of the MDL Court.
In addition, PIMCO is the subject of a lawsuit in the Northern District of Illinois Eastern Division in which the complaint alleges that plaintiffs each purchased and sold a 10-year Treasury note futures contract and suffered damages from an alleged shortage when PIMCO held both physical and futures positions in 10-year Treasury notes for its client accounts. In July 2007, the court granted class certification of a class consisting of those persons who purchased futures contracts to
10.31.10 ï Allianz Global Investors Managed Accounts Trust Annual Report 127
Allianz Global Investors Managed Accounts Trust Notes to Financial Statements
October 31, 2010
7. Legal Proceedings (continued)
offset short positions between May 9, 2005 and June 30, 2005. PIMCO currently believes that the complaint is without merit and PIMCO intends to vigorously defend against this action.
The Investment Manager and PIMCO believe that these matters are not likely to have a material adverse effect on the Portfolios or on their ability to perform their respective investment advisory activities relating to the Portfolios.
8. Subsequent Events
On December 17, 2010, the following Portfolios paid capital gain and special year-end distributions to shareholders of record on December 16, 2010:
| | | | | | | | | | | | | |
| | | | | | Short-Term
| | | Long-Term
| |
| | | Income | | | Capital Gains | | | Capital Gains | |
| | |
| |
| Equity Shares: Series I | | | $0.22124 | | | | NA | | | | NA | |
| Fixed Income SHares: Series C | | | $0.43511 | | | | $0.10614 | | | | $0.30321 | |
| Fixed Income SHares: Series M | | | $0.03285 | | | | NA | | | | $0.12791 | |
| Fixed Income SHares: Series R | | | $0.02666 | | | | $0.96213 | | | | $0.01363 | |
128 Allianz Global Investors Managed Accounts Trust Annual Report ï 10.31.10
Allianz Global Investors Managed Accounts Trust
Report of Independent Registered Public Accounting Firm
To the Board of Trustees and Shareholders of Allianz Global Investors Managed Accounts Trust:
In our opinion, the accompanying statements of assets and liabilities, including the schedules of investments, and the related statements of operations, of changes in net assets and the financial highlights present fairly, in all material respects, the financial position of Equity Shares: Series I, Fixed Income SHares: Series C, Fixed Income SHares: Series H, Fixed Income SHares: Series M and Fixed Income SHares: Series R (constituting Allianz Global Investors Managed Accounts Trust, hereafter referred to as the “Portfolios”) at October 31, 2010, the results of each of their operations for the year then ended and the changes in each of their net assets and the financial highlights for each of the periods indicated, in conformity with accounting principles generally accepted in the United States of America. These financial statements and financial highlights (hereafter referred to as “financial statements”) are the responsibility of the Portfolios’ management; our responsibility is to express an opinion on these financial statements based on our audits. We conducted our audits of these financial statements in accordance with the standards of the Public Company Accounting Oversight Board (United States). Those standards require that we plan and perform the audit to obtain reasonable assurance about whether the financial statements are free of material misstatement. An audit includes examining, on a test basis, evidence supporting the amounts and disclosures in the financial statements, assessing the accounting principles used and significant estimates made by management, and evaluating the overall financial statement presentation. We believe that our audits, which included confirmation of securities at October 31, 2010 by correspondence with the custodian and brokers, provide a reasonable basis for our opinion.
PricewaterhouseCoopers LLP
Kansas City, Missouri
December 23, 2010
10.31.10 ï Allianz Global Investors Managed Accounts Trust Annual Report 129
Allianz Global Investors Managed Accounts Trust
Shareholder Meeting Results/Changes to Board of Trustees/
Tax Information
(unaudited)
Shareholder Meeting Results:
The Trust held a meeting of shareholders on September 14, 2010. Common shareholders voted as indicated below:
| | | | | | | | | |
| | | | | | Withheld
| |
| | | Affirmative | | | Authority | |
| | |
| |
| Re-election of Paul Belica | | | 532,746,827 | | | | 140,471 | |
| Election of Bradford K. Gallagher | | | 532,746,828 | | | | 140,471 | |
| Election of James A. Jacobson | | | 532,746,827 | | | | 140,471 | |
| Re-election of Hans W. Kertess | | | 532,746,827 | | | | 140,471 | |
| Election of John C. Maney† | | | 532,746,827 | | | | 140,471 | |
| Election of William B. Ogden, IV | | | 532,746,827 | | | | 140,471 | |
| Election of Alan Rappaport | | | 532,629,826 | | | | 257,472 | |
Changes to Board of Trustees:
Robert E. Connor served as a Trustee of the Trust until his death on April 8, 2010.
On September 14, 2010, the shareholders of the Trust elected Bradford K. Gallagher, James A. Jacobson and Alan Rappaport to serve as Trustees of the Trust.
R. Peter Sullivan, III retired from the Trust’s Board of Trustees effective July 31, 2010.
Tax Information:
Subchapter M of the Internal Revenue Code of 1986, as amended, requires the Portfolios to advise shareholders within 60 days of the Portfolios’ tax year ended October 31, 2010 as to the federal tax status of dividends and distributions received by shareholders during such tax year.
Dividends for the tax year ended October 31, 2010 were as follows:
| | | |
| Fixed Income SHares: Series C: | | Distributions from long-term capital gains–$34,775,505 |
| Fixed Income SHares: Series H: | | Exempt interest dividends–$213,436 |
| Fixed Income SHares: Series R: | | Distributions from long-term capital gains–$820,441 |
Pursuant to the Jobs and Growth Tax Relief Reconciliation Act of 2003, Equity Shares: Series I and Fixed Income SHares: Series C, Series M and Series R designate 99.18%, 0.03%, 1.16% and 0.09%, respectively, of ordinary dividends paid (or the maximum amount allowable) as qualified dividend income.
Fixed Income SHares: Series C, Series H, and Series M designate 0.03%, 1.16%, and 0.09%, respectively, of ordinary dividends paid (or the maximum amount allowable) as qualifying for the Dividends Received Deduction.
Since the Portfolios’ tax year is not the calendar year, another notification will be sent with respect to calendar year 2010. In January 2011, shareholders will be advised on IRS Form 1099 DIV as to the federal tax status of the dividends and distributions received during calendar 2010. The amount that will be reported will be the amount to use on your 2010 federal income tax return and may differ from the amount which must be reported in connection with the Portfolios’ tax year ended October 31, 2010. Shareholders are advised to consult their tax advisers as to the federal, state and local tax status of the dividend income received from the Portfolios. For Fixed Income SHares: Series H, in January 2011, an allocation of interest income by state will be provided which may be of value in reducing a shareholder’s state and local tax liability, if any.
130 Allianz Global Investors Managed Accounts Trust Annual Report ï 10.31.10
Allianz Global Investors Managed Accounts Trust
Fixed Income SHares: Series C, H, M, R
Matters Relating to the Trustees’ Consideration of the Investment Management & Portfolio Management Agreements
(unaudited)
The Investment Company Act of 1940, as amended, requires that both the full Board of Trustees (the “Trustees”) and a majority of the non-interested (“Independent”) Trustees, voting separately, approve the Trust’s Investment Advisory Agreement (the “Advisory Agreement”) with the Investment Manager and the Portfolio Management Agreements (the “Sub-Advisory Agreements” and, together with the Advisory Agreement, the “Agreements”) between the Investment Manager and the Sub-Adviser, with respect to Fixed Income SHares: Series C, Fixed Income SHares: Series H, Fixed Income SHares: Series M and Fixed Income SHares: Series R (collectively, the “Portfolios”) of the Trust. The Trustees met on June 22 – 23, 2010 (the “contract review meeting”) for the specific purpose of considering whether to approve the continuation of the Advisory Agreement and the Sub-Advisory Agreements. The Independent Trustees were assisted in their evaluation of the Agreements by independent legal counsel, from whom they received separate legal advice and with whom they met separately from management during the contract review meeting.
Based on their evaluation of factors that they deemed to be material, including those factors described below, the Board of Trustees, including a majority of the Independent Trustees, concluded that the continuation of the Advisory Agreement and the Sub-Advisory Agreements should be approved with respect to the Portfolios for a one-year period commencing July 1, 2010.
In connection with their deliberations regarding the continuation of the Agreements, the Trustees, including the Independent Trustees, considered such information and factors as they believed, in light of the legal advice furnished to them and their own business judgment, to be relevant. As described below, the Trustees considered the nature, quality, and extent of the various investment management, administrative and other services performed by the Investment Manager and the Sub-Adviser under the applicable Agreements.
In connection with the contract review meeting, the Trustees received and relied upon materials provided by the Investment Manager, which included, among other items: (i) information regarding the investment performance and management fees of comparable portfolios of other clients of the Sub-Adviser, including institutional separate account and other clients, (ii) the profitability to the Investment Manager and its affiliates from their relationships with the Portfolios for the one-year period ended March 31, 2010, (iii) descriptions of various functions performed by the Investment Manager, its affiliates and the Sub-Adviser for the Portfolios, such as compliance monitoring and portfolio trading practices, and (iv) information regarding the overall organization of the Investment Manager and the Sub-Adviser, including information regarding senior management, portfolio managers and other personnel providing investment management, administrative and other services to the Portfolios.
The Trustees’ conclusions as to the continuation of the Agreements were based on a comprehensive consideration of all information provided to the Trustees and were not the result of any single factor. Some of the factors that figured particularly in the Trustees’ deliberations are described below, although individual Trustees may have evaluated the information presented differently from one another, attributing different weights to various factors.
In determining to approve the continuation of the Advisory Agreement and the Sub-Advisory Agreements, the Trustees met periodically with relevant investment advisory personnel from the Investment Manager and the Sub-Adviser and considered information relating to personnel providing services under the applicable Agreements. The information considered included the education and experience of the personnel providing services, including the education and experience of the investment professionals on the team of investment professionals managing the Portfolios. The Trustees also took into account the time and attention that had been devoted by senior management to the Portfolios and the other funds in the complex. The Trustees evaluated the level of skill required to manage the Portfolios and concluded that the human resources devoted by the Investment Manager and the Sub-Adviser to the Portfolios were appropriate to fulfill effectively the duties of the Investment Manager and Sub-Adviser under the applicable Agreements. The Trustees also considered the business reputation of the Investment Manager and Sub-Adviser since their inception, their significant financial resources, the Investment Manager’s and Sub-Adviser’s experience in managing the Portfolios, including their professional liability insurance coverage and the Investment Manager’s and Sub-Adviser’s assets under management and concluded that they would be able to meet any reasonably foreseeable obligations under the applicable Agreements.
The Trustees received information concerning the investment philosophy and investment process applied by the Investment Manager and the Sub-Adviser in managing the Portfolios, as described in the Prospectus. The Trustees considered the Investment Manager’s and Sub-Adviser’s in-house research capabilities, including their ongoing
10.31.10 ï Allianz Global Investors Managed Accounts Trust Annual Report 131
Allianz Global Investors Managed Accounts Trust
Fixed Income SHares: Series C, H, M, R
Matters Relating to the Trustees’ Consideration of the Investment Management & Portfolio Management Agreements
(unaudited) (continued)
forecasting of industry, sector and overall market movements, interest rates and the development of their ongoing outlook on the global economy, as well as other resources available to the Investment Manager’s and Sub-Adviser’s personnel, including research services available to the Investment Manager and the Sub-Adviser as a result of securities transactions effected for the Portfolios and other investment advisory clients. The Trustees concluded that the Investment Manager’s and Sub-Adviser’s investment process, research capabilities and philosophy were well suited to the Portfolios, given each Portfolio’s investment objectives and policies.
The Trustees considered the scope of the services provided by the Investment Manager and Sub-Adviser to the Portfolios under the Advisory Agreement and Sub-Advisory Agreements, respectively, relative to services provided by third parties to other mutual funds and relative to services provided by the Investment Manager and Sub-Adviser to their other advisory clients. The Trustees noted that the Investment Manager’s and Sub-Adviser’s required standard of care was comparable to that found in most mutual fund investment advisory agreements. The Trustees also considered the tools and procedures used to assure the Portfolios’ compliance with applicable regulations and policies including the functions of its Chief Compliance Officer and the implementation of compliance policies and procedures. The Trustees apprised themselves and took account of past claims made by regulators and others against affiliates of the Investment Manager and the steps taken to address those claims. The Trustees concluded that the scope of the Investment Manager’s and Sub-Adviser’s services to the Portfolios, as described above, was consistent with the Portfolios’ operational requirements, including, in addition to the applicable investment objectives, compliance with the Portfolios’ investment restrictions, tax and reporting requirements and related shareholder services.
The Trustees also evaluated the procedures of the Investment Manager and Sub-Adviser designed to fulfill their fiduciary duty to the Portfolios with respect to possible conflicts of interest, including their codes of ethics, the procedures by which the Investment Manager and Sub-Adviser allocate trades among their various investment advisory clients, the integrity of the systems in place to ensure compliance with the foregoing and the record of the Investment Manager and Sub-Adviser. The Trustees also confirmed information concerning standards of the Investment Manager and Sub-Adviser with respect to the execution of the Portfolios’ transactions. The information considered by the Trustees included information regarding the Investment Manager and the Sub-Adviser, their personnel, policies and practices included in each of their respective Forms ADV.
The Trustees also considered the performance of the Portfolios compared with similar accounts managed by the Sub-Adviser. The Trustees noted that the Portfolios do not align closely with any particular account or fund managed by the Sub-Adviser, and that the Investment Manager had provided information for various funds/accounts managed by the Sub-Adviser that are similar to various investment components represented in the Portfolios. In the course of their deliberations, the Trustees took into account information provided by the Investment Manager at the contract review meeting, as well as during investment review meetings conducted with portfolio management personnel during the course of the year regarding each Portfolio’s performance. After reviewing these and related factors, the Trustees concluded, within the context of their overall conclusions regarding the Agreements, that they were satisfied with the Investment Manager’s and Sub-Adviser’s responses and efforts relating to the investment performance of the Portfolios.
In re-approving the Agreements, the Trustees also gave substantial consideration to the fact that, with respect to the Portfolios, no fees are payable under either the Advisory Agreement with the Investment Manager or the Sub-Advisory Agreements between the Investment Manager and the Sub-Adviser. The Trustees did consider, however, the amounts paid by the sponsors of the “wrap” programs to the Investment Manager’s affiliate, Allianz Global Investors Managed Accounts LLC, with respect to the Trust, as well as the fees “imputed” to the Investment Manager and the Sub-Adviser for purposes of arriving at an estimate of profitability arising from the Investment Manager’s and its affiliates’ relationships with the Trust. The Trustees determined that such profitability did not appear to be excessive. Because the Portfolios do not pay fees directly, the Trustees did not consider the extent to which economies of scale would be realized due to the Portfolios’ anticipated growth of assets, whether fee levels reflect economies of scale for the Portfolios’ shareholders or comparisons of fees paid by the Portfolios with fees paid to other investment advisers or by other clients of the Investment Manager or the Sub-Adviser.
The Trustees considered the fact that the Investment Manager and the Sub-Adviser may benefit from their relationship with the sponsors of wrap programs for which the Portfolios are an investment option. Such benefits include the receipt by their affiliates of fees paid by the sponsor of the wrap program based on assets under management of the wrap program. The Trustees also took into account so-called “fallout benefits” to the Investment Manager and the Sub-Adviser,
132 Allianz Global Investors Managed Accounts Trust Annual Report ï 10.31.10
Allianz Global Investors Managed Accounts Trust
Fixed Income SHares: Series C, H, M, R
Matters Relating to the Trustees’ Consideration of the Investment Management & Portfolio Management Agreements
(unaudited) (continued)
such as reputational value derived from serving as investment adviser and the fact that the Investment Manager and the Sub-Adviser receive services from brokers who execute portfolio transactions for the Portfolios.
Based on the foregoing, the Trustees concluded, within the context of their overall conclusions regarding the Agreements, to continue to engage the Investment Manager and Sub-Adviser to serve as investment advisers for the Portfolios under each applicable Agreement.
10.31.10 ï Allianz Global Investors Managed Accounts Trust Annual Report 133
Allianz Global Investors Managed Accounts Trust
Privacy Policy (unaudited)
Privacy Policy:
Our Commitment to You
We consider customer privacy to be a fundamental aspect of our relationship with shareholders and are committed to maintaining the confidentiality, integrity and security of our current, prospective and former shareholders’ personal information. To ensure our shareholders’ privacy, we have developed policies that are designed to protect this confidentiality, while allowing shareholders’ needs to be served.
Obtaining Personal Information
In the course of providing shareholders with products and services, we may obtain non-public personal information about shareholders, which may come from sources such as account applications and other forms, from other written, electronic or verbal correspondence, from shareholder transactions, from a shareholder’s brokerage or financial advisory firm, financial adviser or consultant, and/or from information captured on our internet web sites.
Respecting Your Privacy
As a matter of policy, we do not disclose any personal or account information provided by shareholders or gathered by us to non-affiliated third parties, except as required for our everyday business purposes, such as to process transactions or service a shareholder’s account, or as otherwise permitted by law. As is common in the industry, non-affiliated companies may from time to time be used to provide certain services, such as preparing and mailing prospectuses, reports, account statements and other information, and gathering shareholder proxies. We may also retain non-affiliated financial services providers, such as broker-dealers, to market our shares or products and we may enter into joint-marketing arrangements with them and other financial companies. We may also retain marketing and research service firms to conduct research on shareholder satisfaction. These companies may have access to a shareholder’s personal and account information, but are permitted to use this information solely to provide the specific service or as otherwise permitted by law. We may also provide a shareholder’s personal and account information to their respective brokerage or financial advisory firm, Custodian, and/or to their financial advisor or consultant.
Sharing Information with Third Parties
We reserve the right to disclose or report personal information to non-affiliated third parties, in limited circumstances, where we believe in good faith that disclosure is required under law to cooperate with regulators or law enforcement authorities, to protect our rights or property or upon reasonable request by any Fund in which a shareholder has chosen to invest. In addition, we may disclose information about a shareholder or shareholder’s accounts to a non-affiliated third party only if we receive a shareholder’s written request or consent.
Sharing Information with Affiliates
We may share shareholder information with our affiliates in connection with our affiliates’ everyday business purposes, such as servicing a shareholder’s account, but our affiliates may not use this information to market products and services to you except in conformance with applicable laws or regulations. The information we share includes information about our experiences and transactions with a shareholder and may include, for example, a shareholder’s participation in one of the Funds or in other investment programs, a shareholder’s ownership of certain types of accounts (such as IRAs), or other data about a shareholder’s transactions or accounts. Our affiliates, in turn, are not permitted to share shareholder information with non-affiliated entities, except as required or permitted by law.
Procedures to Safeguard Private Information
We take seriously the obligation to safeguard shareholder non-public personal information. In addition to this policy, we have also implemented procedures that are designed to restrict access to a shareholder’s non-public personal information only to internal personnel who need to know that information in order to provide products or services to such shareholders. In addition, we have physical, electronic and procedural safeguards in place to guard a shareholder’s non-public personal information.
Disposal of Confidential Records
We will dispose of records, if any, that are knowingly derived from data received from a consumer reporting agency regarding a shareholder that is an individual in a manner that ensures the confidentiality of the data is maintained. Such records include, among other things, copies of consumer reports and notes of conversations with individuals at consumer reporting agencies.
134 Allianz Global Investors Managed Accounts Trust Annual Report ï 10.31.10
Allianz Global Investors Managed Accounts Trust Board of Trustees (unaudited)
| | | |
Name, Date of Birth, Position(s) Held with
| | |
Fund, Length of Service, Other Trusteeships/
| | |
Directorships Held by Trustee; Number of
| | |
Portfolios in Fund Complex/Outside Fund
| | |
| Complexes Currently Overseen by Trustee | | Principal Occupation(s) During Past 5 Years: |
| |
| |
| The address of each trustee is 1345 Avenue of the Americas, New York, NY 10105. |
Hans W. Kertess
Date of Birth: 7/12/39
Chairman of the Board of Trustees since: 2007
Trustee since: 2005
Trustee/Director of 52 funds in Fund Complex;
Trustee/Director of no funds outside of Fund Complex | | President, H. Kertess & Co., a financial advisory company. Formerly, Managing Director, Royal Bank of Canada Capital Markets. |
Paul Belica
Date of Birth: 9/27/21
Trustee since: 2000
Trustee/Director of 52 funds in Fund Complex
Trustee/Director of no funds outside of Fund Complex | | Retired. Formerly Director, Student Loan Finance Corp., Education Loans, Inc., Goal Funding, Inc., Goal Funding II, Inc. and Surety Loan Fund, Inc. Formerly, Manager of Stratigos Fund LLC, Whistler Fund LLC, Xanthus Fund LLC & Wynstone Fund LLC. |
Bradford K. Gallagher
Date of Birth: 2/28/44
Trustee since: 2010
Trustee/Director of 52 funds in Fund Complex
Trustee/Director of no funds outside of Fund complex | | Founder, Spyglass Investments LLC, a private investment vehicle (since 2001); Founder, President and CEO of Cypress Holding Company and Cypress Tree Investment Management Company (since 1995); Trustee, The Common Fund (since 2005); Director, Anchor Point Inc. (since 1995); Chairman and Trustee, Atlantic Maritime Heritage Foundation (since 2007); Director, Shielding Technology Inc. (since 2006); Formerly Chairman and Trustee of Grail Advisors ETF Trust (2009-2010) and Trustee Nicholas-Applegate Institutional Funds (2007-2010). |
James A. Jacobson
Date of Birth: 2/3/45
Trustee since: 2010
Trustee/Director of 52 funds in Fund Complex
Trustee/Director of 16 Alpine Mutual Funds | | Retired. Formerly, Vice Chairman and Managing Director of Spear, Leeds & Kellogg Specialists, LLC, specialist firm on the New York Stock Exchange. |
John C. Maney†
Date of Birth: 8/3/59
Trustee since: 2006
Trustee/Director of 77 funds in Fund Complex
Trustee/Director of no funds outside of Fund Complex | | Management Board of Allianz Global Investors Fund Management LLC; Management Board and Managing Director of Allianz Global Investors of America L.P. since January 2005 and also Chief Operating Officer of Allianz Global Investors of America L.P. since November 2006. |
William B. Ogden, IV
Date of Birth: 1/11/45
Trustee since: 2006
Trustee/Director of 52 Funds in Fund Complex;
Trustee/Director of no funds outside of Fund Complex | | Asset Management Industry Consultant. Formerly, Managing Director, Investment Banking Division of Citigroup Global Markets Inc. |
Alan Rappaport
Date of Birth: 3/13/53
Trustee since: 2010
Trustee/Director of 52 funds in Fund Complex
Trustee/Director of no funds outside of Fund Complex | | Vice Chairman, Roundtable Investment partners since 2009; Chairman (formerly President), Private Bank of Bank of America; Vice Chairman, US Trust (2001-2008). |
| | |
| † | | Mr. Maney is an “interested person” of the Trust, as defined in Section 2(a)(19) of the 1940 Act, due to his affiliation with Allianz Global Investors of America L.P. In addition to Mr. Maney’s positions set forth in the table above, he holds the following positions with affiliated persons: Management Board, Managing Director and Chief Operating Officer of Allianz Global Investors of America LLC; Member – Board of Directors and Chief Operating Officer of Allianz Global Investors of America Holdings Inc. and Oppenheimer Group, Inc.; Managing Director and Chief Operating Officer of Allianz Global Investors NY Holdings LLC; Management Board and Managing Director of Allianz Global Investors U.S. Holding LLC; Managing Director and Chief Operating Officer of Allianz Hedge Fund Partners Holding L.P. and Allianz Global Investors U.S. Retail LLC; Compensation Committee of NFJ Investment Group LLC; Management Board of Nicholas-Applegate Holdings LLC; Member – Board of Directors and Chief Operating Officer of PIMCO Global Advisors (Resources) Limited; Executive Vice President of PIMCO Japan Ltd.; Chief Operating Officer of Allianz Global Investors U.S. Holding II LLC; and Member and Chairman – Board of Directors, President and Chief Operating Officer of PFP Holdings, Inc. and Managing Director of Allianz Global Investors Capital LLC. |
| |
| | Further information about certain of the Portfolios’ Trustees is available in the Portfolios’ Statements of Additional Information, dated March 1, 2010 for Fixed Income SHares: Series C, H, M and R and for Equity Shares: Series I, which can be obtained upon request, without charge, by calling the Portfolios’ shareholder servicing agent at (800) 628-1237. |
10.31.10 ï Allianz Global Investors Managed Accounts Trust Annual Report 135
Allianz Global Investors Managed Accounts Trust Fund Officers (unaudited)
| | | |
Name, Date of Birth, Position(s) Held
| | |
| with Portfolios. | | Principal Occupation(s) During Past 5 Years: |
| |
| |
Brian S. Shlissel
Date of Birth: 11/14/64
President & Chief Executive Officer since: 2004 | | Managing Director, Head of Mutual Fund Services, Allianz Global Investors Fund Management LLC; President and Chief Executive Officer of 29 funds in the Fund Complex; Treasurer, Principal Financial and Accounting Officer of 48 funds in the Fund Complex and of The Korea Fund, Inc. |
Lawrence G. Altadonna
Date of Birth: 3/10/66
Treasurer, Principal Financial and Accounting Officer since: 2004 | | Senior Vice President, Director of Fund Administration, Allianz Global Investors Fund Management LLC; Treasurer, Principal Financial and Accounting Officer of 29 funds in the Fund Complex; Assistant Treasurer of 48 funds in the Fund Complex and of The Korea Fund, Inc. |
Thomas J. Fuccillo
Date of Birth: 3/22/68
Vice President since: 2007
Secretary & Chief Legal Officer since: 2004 | | Executive Vice President, Chief Legal Officer and Secretary of Allianz Global Investors Fund Management LLC; Executive Vice President of Allianz Global Investors of America L.P; Vice President, Secretary and Chief Legal Officer of 77 funds in the Fund Complex; Secretary and Chief Legal Officer of The Korea Fund, Inc. |
Scott Whisten
Date of Birth: 3/13/71
Assistant Treasurer since: 2007 | | Senior Vice President, Allianz Global Investors Fund Management LLC; Assistant Treasurer of 77 funds in the Fund Complex. |
Richard J. Cochran
Date of Birth: 1/23/61
Assistant Treasurer since: 2008 | | Vice President, Allianz Global Investors Fund Management LLC, Assistant Treasurer of 77 funds in the Funds Complex. Formerly, Tax Manager, Teacher Insurance Annuity Association/College Retirement Equity Fund (TIAA-CREF), 2002-2008. |
Youse E. Guia
Date of Birth: 9/3/72
Chief Compliance Officer since: 2004 | | Senior Vice President, Chief Compliance Officer, Allianz Global Investors of America L.P.; Chief Compliance Officer of 77 funds in the Fund Complex and of The Korea Fund, Inc. |
Kathleen A. Chapman
Date of Birth: 11/11/54
Assistant Secretary since: 2006 | | Senior Paralegal, Allianz Global Investors of America, L.P. (since March 2005); Assistant Secretary of 77 funds in the Fund Complex. |
Lagan Srivastava
Date of Birth: 9/20/77
Assistant Secretary since: 2006 | | Assistant Secretary of 77 funds in the Fund Complex and of The Korea Fund, Inc. |
Officers hold office at the pleasure of the Board and until their successors are appointed and qualified or until their earlier resignation or removal.
136 Allianz Global Investors Managed Accounts Trust Annual Report ï 10.31.10
(This page intentionally left blank)
10.31.10 ï Allianz Global Investors Managed Accounts Trust Annual Report 137
(This page intentionally left blank)
138 Allianz Global Investors Managed Accounts Trust Annual Report ï 10.31.10
Trustees and Fund Officers
| | | |
Hans W. Kertess
Chairman of the Board of Trustees
Paul Belica
Bradford K. Gallagher
James A. Jacobson
John C. Maney
William B. Ogden, IV
Alan Rappaport | | Brian S. Shlissel
President & Chief Executive Officer
Lawrence G. Altadonna
Treasurer, Principal Financial & Accounting Officer
Thomas J. Fuccillo
Vice President, Secretary & Chief Legal Officer
Scott Whisten
Assistant Treasurer
Richard J. Cochran
Assistant Treasurer
Youse E. Guia
Chief Compliance Officer
Kathleen A. Chapman
Assistant Secretary
Lagan Srivastava
Assistant Secretary |
Investment Manager/Administrator
Allianz Global Investors Fund Management LLC
1345 Avenue of the Americas
New York, NY 10105
Sub-Advisers
Fixed Income SHares: Series C, H, M and R:
Pacific Investment Management Company LLC
840 Newport Center Drive
Newport Beach, CA 92660
Equity Shares: Series I:
RCM Capital Management LLC
555 Mission Street, Suite 1700
San Francisco, CA 94105
Allianz Global Investors Advisory GmbH
Mainzer Landstrasse 11-13
Frankfurt-am-Main, Germany
Distributor
Allianz Global Investors Distributors LLC
1345 Avenue of the Americas
New York, NY 10105
Custodian & Accounting Agent
State Street Bank & Trust Co.
801 Pennsylvania Avenue
Kansas City, MO 64105-1307
Transfer Agent, Dividend Paying Agent and Registrar
Boston Financial Data Services-Midwest
330 West 9th Street
Kansas City, MO 64105
Independent Registered Public Accounting Firm
PricewaterhouseCoopers LLP
1100 Walnut, Suite 1300
Kansas City, MO 64106
Legal Counsel
Ropes & Gray LLP
Prudential Tower
800 Boylston Street
Boston, MA 02199
This report, including the financial information herein, is transmitted to the shareholders of Allianz Global Investors Managed Accounts Trust for their information. It is not a prospectus, circular or representation intended for use in the purchase of shares of the Portfolios or any securities mentioned in this report.
The Portfolios file their complete schedules of portfolio holdings with the Securities and Exchange Commission (“SEC”) for the first and third quarters of their fiscal year on Form N-Q. The Portfolios’ Form N-Q is available on the SEC’s website at www.sec.gov and may be reviewed and copied at the SEC’s Public Reference Room in Washington, D.C. Information on the operation of the Public Reference Room may be obtained by calling (800) SEC-0330.
Receive this report electronically and eliminate paper mailings.
To enroll, go www.allianzinvestors.com/edelivery.
AZ080AR_103110
ITEM 2. CODE OF ETHICS
| (a) | | As of the end of the period covered by this report, the registrant has adopted a code of ethics (the “Section 406 Standards for Investment Companies — Ethical Standards for Principal Executive and Financial Officers”) that applies to the registrant’s Principal Executive Officer and Principal Financial Officer; the registrant’s Principal Financial Officer also serves as the Principal Accounting Officer. The registrant undertakes to provide a copy of such code of ethics to any person upon request, without charge, by calling 1-800-254-5197. The Investment Manager’s code of ethics are included as an exhibit Exhibit 99.CODEETH hereto. |
| |
| (b) | | The CODE OF ETHICS PURSUANT TO SECTION 406 OF THE SARBANES-OXLEY ACT OF 2002 FOR PRINCIPAL EXECUTIVE AND SENIOR FINANCIAL OFFICERS (the “Code”) was updated to remove interested trustees from being subject to the Code, which is not required under Section 406 of the Sarbanes-Oxley Act of 2002. The Code also was updated to remove examples of specific conflict of interest situations and to add an annual certification requirement for Covered Officers. In addition, the approval or ratification process for material amendments to the Code was clarified to include approval by a majority of the independent trustees. |
| |
| (c) | | During the period covered by this report, there were not any waivers or implicit waivers to a provision of the code of ethics adopted in 2(a) above. |
ITEM 3. AUDIT COMMITTEE FINANCIAL EXPERT
The registrant’s Board has determined that Paul Belica and James A. Jacobson, members of the Board’s Audit Oversight Committee are “audit committee financial experts,” and that they are “independent,” for purposes of this Item.
ITEM 4. PRINCIPAL ACCOUNTANT FEES AND SERVICES
| a) | | Audit fees. The aggregate fees billed for each of the last two fiscal years (the “Reporting Periods”) for professional services rendered by the Registrant’s principal accountant (the “Auditor”) for the audit of the Registrant’s annual financial statements, or services that are normally provided by the Auditor in connection with the statutory and regulatory filings or engagements for the Reporting Periods, were $195,000 in 2009 and $195,000 in 2010. |
| |
| b) | | Audit-Related Fees. The aggregate fees billed in the Reporting Periods for assurance and related services by the principal accountant that are reasonably related to the performance of the audit registrant’s financial statements and are not reported under paragraph (e) of this Item were $0 in 2009 and $0 in 2010. |
| |
| c) | | Tax Fees. The aggregate fees billed in the Reporting Periods for professional services rendered by the Auditor for tax compliance, tax service and tax planning (“Tax Services”) were $46,000 in 2009 and $57,500 in 2010. These services consisted of review or preparation of U.S. federal, state, local, excise tax returns, and calculation of excise tax distributions. |
| |
| d) | | All Other Fees. There were no other fees billed in the Reporting Periods for products and services provided by the Auditor to the Registrant. |
| |
| e) | | 1. Audit Committee Pre-Approval Policies and Procedures. The Registrant’s Audit Committee has established policies and procedures for pre-approval of all audit and permissible non-audit services by the Auditor for the Registrant, as well as the Auditor’s engagements related directly to the operations and financial reporting of the Registrant. The Registrant’s policy is stated below. |
Allianz Global Investors Managed Accounts Trust (The “Trust”)
AUDIT OVERSIGHT COMMITTEE POLICY FOR PRE-APPROVAL OF SERVICES PROVIDED BY THE INDEPENDENT ACCOUNTANTS
The Trust’s Audit Oversight Committee (“Committee”) is charged with the oversight of the Trust’s financial reporting policies and practices and their internal controls. As part of this responsibility, the Committee must pre-approve any independent accounting firm’s engagement to render audit and/or permissible non-audit services, as required by law. In evaluating a proposed engagement by the independent accountants, the Committee will assess the effect that the engagement might reasonably be expected to have on the accountant’s independence. The Committee’s evaluation will be based on:
a review of the nature of the professional services expected to provided,
the fees to be charged in connection with the services expected to be provided,
a review of the safeguards put into place by the accounting firm to safeguard independence, and periodic meetings with the accounting firm.
POLICY FOR AUDIT AND NON-AUDIT SERVICES TO BE PROVIDED TO THE TRUST
On an annual basis, the Trust’s Committee will review and pre-approve the scope of the audits of the Funds and proposed audit fees and permitted non-audit (including audit-related) services that may be performed by the Trust’s independent accountants. At least annually, the Committee will receive a report of all audit and non-audit services that were rendered in the previous calendar year pursuant to this Policy. In addition to the Committee’s pre-approval of services pursuant to this Policy, the engagement of the independent accounting firm for any permitted non-audit service provided to the Trust will also require the separate written pre-approval of the President of the Trust, who will confirm, independently, that the accounting firm’s engagement will not adversely affect the firm’s independence. All non-audit services performed by the independent accounting firm will be disclosed, as required, in filings with the Securities and Exchange Commission.
AUDIT SERVICES
The categories of audit services and related fees to be reviewed and pre-approved annually by the Committee are:
Annual Trust financial statement audits
Seed audits (related to new product filings, as required)
SEC and regulatory filings and consents
AUDIT-RELATED SERVICES
The following categories of audit-related services are considered to be consistent with the role of the Trust’s independent accountants and services falling under one of these categories will be pre-approved by the Committee on an annual basis if the Committee deems those services to be consistent with the accounting firm’s independence:
Accounting consultations
Trust merger support services
Other attestation reports
Comfort letters
Other internal control reports
Individual audit-related services that fall within one of these categories and are not presented to the Committee as part of the annual pre-approval process described above, may be pre-approved, if deemed consistent with the accounting firm’s independence, by the Committee Chair (or any other Committee member who is a disinterested trustee under the Investment Company Act to whom this responsibility has been delegated) so long as the estimated fee for those services does not exceed $250,000. Any such pre-approval shall be reported to the full Committee at its next regularly scheduled meeting.
TAX SERVICES
The following categories of tax services are considered to be consistent with the role of the Trust’s independent accountants and services falling under one of these categories will be pre-approved by the Committee on an annual basis if the Committee deems those services to be consistent with the accounting firm’s independence:
Tax compliance services related to the filing or amendment of the following:
Federal, state and local income tax compliance; and, sales and use tax compliance
Timely RIC qualification reviews
Tax distribution analysis and planning
Tax authority examination services
Tax appeals support services
Accounting methods studies
Trust merger support service
Other tax consulting services and related projects
Individual tax services that fall within one of these categories and are not presented to the Committee as part of the annual pre-approval process described above, may be pre-approved, if deemed consistent with the accounting firm’s independence, by the Committee Chairman (or any other Committee member who is a disinterested trustee under the Investment Company Act to whom this responsibility has been delegated) so long as the estimated fee for those services does not exceed $250,000. Any such pre-approval shall be reported to the full Committee at its next regularly scheduled meeting.
PROSCRIBED SERVICES
The Trust’s independent accountants will not render services in the following categories of non-audit services:
Bookkeeping or other services related to the accounting records or financial statements of the Trust
Financial information systems design and implementation
Appraisal or valuation services, fairness opinions, or contribution-in-kind reports
Actuarial services
Internal audit outsourcing services
Management functions or human resources
Broker or dealer, investment adviser or investment banking services
Legal services and expert services unrelated to the audit
Any other service that the Public Company Accounting Oversight Board determines, by regulation, is impermissible.
PRE-APPROVAL OF NON-AUDIT SERVICES PROVIDED TO OTHER ENTITIES WITHIN THE FUND COMPLEX
The Committee will pre-approve annually any permitted non-audit services to be provided to Allianz Global Investors Fund Management LLC or any other investment manager to the Trust (but not including any sub-adviser whose role is primarily portfolio management and is sub-contracted by the investment manager) (the “Investment Manager”) and any entity controlling, controlled by, or under common control with the Investment Manager that provides ongoing services to the Trust (including affiliated sub-advisers to the Trust), provided, in each case, that the engagement relates directly to the operations and financial reporting of the Trust (such entities, including the Investment Manager, shall be referred to herein as the “Accounting Affiliates”). Individual projects that are not presented to the Committee as part of the annual pre-approval process, may be pre-approved, if deemed consistent with the accounting firm’s independence, by the Committee Chairman (or any other Committee member who is a disinterested trustee under the Investment Company Act to whom this responsibility has been delegated) so long as the estimated fee for those services does not exceed $250,000. Any such pre-approval shall be reported to the full Committee at its next regularly scheduled meeting. Although the Committee will not pre-approve all services provided to the Investment Manager and its affiliates, the Committee will receive an annual report from the Trust’s independent accounting firm showing the aggregate fees for all services provided to the Investment Manager and its affiliates.
DE MINIMUS EXCEPTION TO REQUIREMENT OF PRE-APPROVAL OF NON-AUDIT SERVICES
With respect to the provision of permitted non-audit services to a Trust or Accounting Affiliates, the pre-approval requirement is waived if:
| | (1) | | The aggregate amount of all such permitted non-audit services provided constitutes no more than (i) with respect to such services provided to the Trust, five percent (5%) of the total amount of revenues paid by the Trust to its independent accountant during the fiscal year in which the services are provided, and (ii) with respect to such services provided to Accounting Affiliates, five percent (5%) of the total amount of revenues paid to the Trust’s independent accountant by the Trust and the Accounting Affiliates during the fiscal year in which the services are provided; |
| |
| | (2) | | Such services were not recognized by the Trust at the time of the engagement for such services to be non-audit services; and |
| |
| | (3) | | Such services are promptly brought to the attention of the Committee and approved prior to the completion of the audit by the Committee or by the Committee Chairman (or any other Committee member who is a disinterested trustee under the Investment Company Act to whom this Committee Chairman or other delegate shall be reported to the full Committee at its next regularly scheduled meeting. |
| | e) | | 2. No services were approved pursuant to the procedures contained in paragraph (C) (7) (i) (C) of Rule 2-01 of Registration S-X. |
| |
| | f) | | Not applicable |
| |
| | g) | | Non-audit fees. The aggregate non-audit fees billed by the Auditor for services rendered to the Registrant, and rendered to the Adviser, for the 2009 Reporting Period was $3,675,717 and the 2010 Reporting Period was $3,243,021. |
| |
| | h) | | Auditor Independence. The Registrant’s Audit Oversight Committee has considered whether the provision of non-audit services that were rendered to the Adviser which were not pre-approved is compatible with maintaining the Auditor’s independence. |
ITEM 5. AUDIT COMMITTEE OF LISTED REGISTRANT
Disclosure not required for open-end investment management companies.
ITEM 6. SCHEDULE OF INVESTMENTS
(a) The registrant’s Schedule of Investments is included as part of the report to shareholders filed under Item 1 of this form.
(b) Not applicable due to no such divestments during the semi-annual period covered since the previous Form N-CSR filing.
ITEM 7. DISCLOSURE OF PROXY VOTING POLICIES AND PROCEDURES FOR CLOSED-END MANAGEMENT INVESTMENT COMPANIES
Disclosure not required for open-end investment management companies.
ITEM 8. PORTFOLIO MANAGERS OF CLOSED-END MANAGEMENT INVESTMENT COMPANIES
Disclosure not required for open-end investment management companies.
ITEM 9. PURCHASES OF EQUITY SECURITIES BY CLOSED-END MANAGEMENT INVESTMENT COMPANY AND AFFILIATED COMPANIES
Disclosure not required for open-end investment management companies.
ITEM 10. SUBMISSION OF MATTERS TO A VOTE OF SECURITY HOLDERS
There have been no material changes to the procedures by which shareholders may recommend nominees to the Trust’s Board of Trustees since the Fund last provided disclosure in response to this item.
ITEM 11. CONTROLS AND PROCEDURES
(a) The registrant’s President and Chief Executive Officer and Treasurer, Principal Financial & Accounting Officer have concluded that the registrant’s disclosure controls and procedures (as defined in Rule 30a-2(c) under the Act (17 CFR 270.30a-3(c))), as amended are effective based on their evaluation of these controls and procedures as of a date within 90 days of the filing date of this document.
(b) There were no significant changes in the registrant’s internal controls over financial reporting (as defined in Rule 30a-3(d) under the Act (17 CFR 270.30a-3(d))) that occurred during the second fiscal quarter of the period covered by this report that has materially affected, or is reasonably likely to materially affect, the registrants control over financial reporting.
ITEM 12. EXHIBITS
(a) (1) Exhibit 99.CODE ETH — Code of Ethics
(a) (2) Exhibit 99 Cert. — Certification pursuant to Section 302 of the Sarbanes-Oxley Act of 2002
(a) (3) Not applicable
(b) Exhibit 99.906 Cert. — Certification pursuant to Section 906 of the Sarbanes-Oxley Act of 2002
Signatures
Pursuant to the requirements of the Securities Exchange Act of 1934 and the Investment Company Act of 1940, the registrant has duly caused this report to be signed on its behalf by the undersigned, thereunto duly authorized.
| | | | | |
|
| (Registrant) Allianz Global Investors Managed Accounts Trust |
| | | | | |
| By | | /s/ Brian S. Shlissel | | |
| | | | | |
| | | President and Chief Executive Officer | | |
| | | | | |
| Date: January 6, 2011 | | |
| | | | | |
| By | | /s/ Lawrence G. Altadonna | | |
| | | | | |
| | | Treasurer, Principal Financial & | | |
| | | Accounting Officer | | |
| | | | | |
| Date: January 6, 2011 | | |
Pursuant to the requirements of the Securities Exchange Act of 1934 and the Investment Company Act of 1940, this report has been signed below by the following persons on behalf of the registrant and in the capacities and on the dates indicated.
| | | | | |
|
| By | | /s/ Brian S. Shlissel | | |
| | | | | |
| | | President and Chief Executive Officer | | |
| | | | | |
| Date: January 6, 2011 | | |
| | | | | |
| By | | /s/ Lawrence G. Altadonna | | |
| | | | | |
| | | Treasurer, Principal Financial & | | |
| | | Accounting Officer | | |
| | | | | |
| Date: January 6, 2011 | | |