UNITED STATES
SECURITIES AND EXCHANGE COMMISSION
Washington, D.C. 20549
FORM N-CSR
CERTIFIED SHAREHOLDER REPORT OF REGISTERED MANAGEMENT
INVESTMENT COMPANIES
Investment Company Act file number: 811-09721
PIMCO Managed Accounts Trust
(Exact name of registrant as specified in charter)
1633 Broadway, New York, NY 10019
(Address of principal executive offices)
William G. Galipeau
Treasurer, Principal Financial & Accounting Officer
650 Newport Center Drive
Newport Beach, CA 92660
(Name and address of agent for service)
Copies to:
David C. Sullivan
Ropes & Gray LLP
Prudential Tower
800 Boylston Street
Boston, MA 02199
Registrant’s telephone number, including area code: (844) 337-4626
Date of fiscal year end: October 31, 2014
Date of reporting period: October 31, 2014
Form N-CSR is to be used by management investment companies to file reports with the Commission not later than 10 days after the transmission to stockholders of any report that is required to be transmitted to stockholders under Rule 30e-1 under the Investment Company Act of 1940 (17 CFR 270.30e-1). The Commission may use the information provided on Form N-CSR in its regulatory, disclosure review, inspection, and policymaking roles.
A registrant is required to disclose the information specified by Form N-CSR, and the Commission will make this information public. A registrant is not required to respond to the collection of information contained in Form N-CSR unless the Form displays a currently valid Office of Management and Budget (“OMB”) control number. Please direct comments concerning the accuracy of the information collection burden estimate and any suggestions for reducing the burden to Secretary, Securities and Exchange Commission, 450 Fifth Street, NW, Washington, DC 20549-0609. The OMB has reviewed this collection of information under the clearance requirements of 44 U.S.C. § 3507.
| Item 1. | Reports to Shareholders. |
The following is a copy of the report transmitted to shareholders pursuant to Rule 30e-1 under the Investment Company Act of 1940, as amended (the “1940 Act”) (17 CFR 270.30e-1).

Your Global Investment Authority
PIMCO Managed Accounts Trust
Annual Report
October 31, 2014
Fixed Income SHares: Series C (“FISH: Series C”)
Fixed Income SHares: Series LD (“FISH: Series LD”)
Fixed Income SHares: Series M (“FISH: Series M”)
Fixed Income SHares: Series R (“FISH: Series R”)
Fixed Income SHares: Series TE (“FISH: Series TE”)

Table of Contents
Letter from the Chairman of the Board & President
Dear Shareholder:
As previously announced, on September 26, 2014, prior to the close of the reporting period, William “Bill” Gross, PIMCO’s former chief investment officer (“CIO”) and co-founder, resigned from the firm. PIMCO’s managing directors elected Daniel Ivascyn to serve as group chief investment officer (“Group CIO”). In addition, PIMCO appointed Andrew Balls, CIO Global; Mark Kiesel, CIO Global Credit; Virginie Maisonneuve, CIO Global Equities; Scott Mather, CIO U.S. Core Strategies; and Mihir Worah, CIO Real Return and Asset Allocation. As announced by PIMCO on November 3, 2014, Marc Seidner returned to the firm effective November 12, 2014, in a new role as CIO Non-Traditional Strategies and head of portfolio management in PIMCO’s New York office. Under this leadership structure, Andrew and Mihir have additional managerial responsibility for PIMCO’s Portfolio Management group and trade floor activities globally. Andrew oversees portfolio management and trade floor activities in Europe and Asia-Pacific, and Mihir oversees portfolio management and trade floor activities in the U.S. There have not been any changes to the portfolio management of the series of PIMCO Managed Accounts Trust (formerly, AllianzGI Managed Accounts Trust).
Douglas Hodge, PIMCO’s chief executive officer, and Jay Jacobs, PIMCO’s president, continue to serve as the firm’s senior executive leadership team, spearheading PIMCO’s business strategy, client service and the firm’s operations.
These appointments are a further evolution of the structure that PIMCO established earlier in 2014, reflecting our belief that the best approach for PIMCO’s clients and our firm is an investment leadership team of seasoned, highly skilled investors overseeing all areas of PIMCO’s investment activities.
During his 43 years at PIMCO, Mr. Gross made great contributions to building the firm and delivering value to PIMCO’s clients. Over this period, PIMCO developed into a global asset manager, expanding beyond core fixed income, now encompassing over 2,400 employees across 13 offices, including more than 250 portfolio managers. Mr. Gross was also responsible for starting PIMCO’s robust investment process, with a focus on long-term macroeconomic views and bottom-up security selection—a process that is well institutionalized and will continue into PIMCO’s future.
For the 12-month reporting period ended October 31, 2014:
After several years of positive growth, severe winter weather in parts of the country appeared to be a headwind for the U.S. economy in early 2014. Looking back, gross domestic product (“GDP”), the value of goods and services produced in the country, the broadest measure of economic activity and the principal indicator of economic performance, expanded at a 3.5% annual pace during the fourth quarter of 2013. According to the U.S. Commerce Department, GDP then contracted at an annual pace
| | | | | | |
| 2 | | PIMCO MANAGED ACCOUNTS TRUST | | | | |
of 2.1% during the first quarter of 2014. However, this was a temporary setback, as GDP expanded at a 4.6% annual pace during the second quarter of 2014. This represented the strongest growth rate since the fourth quarter of 2011. According to the Commerce Department’s estimate released on November 25, 2014, GDP expanded at an annual pace of 3.9% during the third quarter of 2014.
The Federal Reserve (the “Fed”) began tapering its monthly asset purchase program in January 2014. At each of its next seven meetings, the Fed announced that it would further taper its asset purchases. Following its meeting in October 2014, the Fed announced that it had concluded its asset purchases. However, the Fed again indicated that it would not raise interest rates in the near future, saying in October that “… it likely will be appropriate to maintain the 0 to 1/4 percent target range for the federal funds rate for a considerable time following the end of its asset purchase program this month, especially if projected inflation continues to run below the Committee’s 2 percent longer-run goal, and provided that longer-term inflation expectations remain well anchored.”
Outlook
PIMCO’s 2015 forecast in the U.S. is for a continuation of the economic recovery. With the ongoing assistance of easy monetary policy, combined with healthy private financial sector balance sheets, we believe the U.S. economy is poised to grow between 2.5% and 3.0% in the coming calendar year. We expect to see corporate capital expenditures accelerate on the back of rising pricing power and expected returns on newly invested capital. We expect very gradually rising wages and product prices, which will allow the Fed to maintain its accommodative monetary policy for 2015. Potential wildcards for the economy in both the U.S. and abroad are geopolitical issues in Ukraine, the Middle East and elsewhere.
On the following pages of this PIMCO Managed Accounts Trust Annual Report, please find specific details regarding investment performance and a discussion of factors that most affected performance of the series of PIMCO Managed Accounts Trust over the 12-month reporting period ended October 31, 2014.
Thank you for investing with us. We value your trust and will continue to work diligently to meet your investment needs. We also invite you to visit our website at pimco.com/FISH to learn more about our views and global thought leadership.
| | | | | | |
| | ANNUAL REPORT | | OCTOBER 31, 2014 | | 3 |
Letter from the Chairman of the Board & President (Cont.)
We remain dedicated to serving your investment needs.
Sincerely,
| | |
 | |  |
| |
 | |  |
| Hans W. Kertess | | Peter G. Strelow |
| Chairman of the Board of Trustees | | President; Principal Executive Officer |
| | | | | | |
| 4 | | PIMCO MANAGED ACCOUNTS TRUST | | | | |
Important Information About the Portfolios
We believe that bond funds have an important role to play in a well-diversified investment portfolio. It is important to note, however, that in an environment where interest rates trend upward, rising rates would negatively impact the performance of most bond funds, and fixed-income securities held by a Portfolio are likely to decrease in value. A number of factors can cause interest rates to rise (e.g., central bank monetary policies, inflation rates, general economic conditions, etc.). Accordingly, changes in interest rates can be sudden, and there is no guarantee that Portfolio Management will anticipate such movement.
As of the date of this report, interest rates in the U.S. are at or near historically low levels. As such, bond funds may currently face an increased exposure to the risks associated with rising interest rates. This is especially true since the Federal Reserve Board has concluded its quantitative easing program. Further, while the U.S. bond market has steadily grown over the past three decades, dealer inventories of corporate bonds have remained relatively stagnant. As a result, there has been a significant reduction in the ability of dealers to “make markets” in corporate bonds. All of the factors mentioned above, individually or collectively, could lead to increased volatility and/or lower liquidity in the fixed income markets, which could result in increased losses to a Portfolio. Bond funds and individual bonds with a longer duration (a measure of the sensitivity of a security’s price to changes in interest rates) tend to be more sensitive to changes in interest rates, usually making them more volatile than securities or funds with shorter durations.
The use of derivatives may subject the Portfolios to greater volatility than investments in traditional securities. The Portfolios may use derivative instruments for hedging purposes or as part of an investment strategy. Use of these instruments may involve certain costs and risks such as liquidity risk, interest rate risk, market risk, call risk, credit risk, management risk and the risk that a Portfolio could not close out a position when it would be most advantageous to do so. Certain derivative transactions may have a leveraging effect on a Portfolio. For example, a small investment in a derivative instrument may have a significant impact on a Portfolio’s exposure to interest rates, currency exchange rates or other investments. As a result, a relatively small price movement in a derivative instrument may cause an immediate and substantial loss or gain, which translates into heightened volatility in a Portfolio’s net asset value. A Portfolio may engage in such transactions regardless of whether the Portfolio owns the asset, instrument or components of the index underlying a derivative instrument. A Portfolio may invest a significant portion of its assets in these types of instruments. If it does, a Portfolio’s investment exposure could far exceed the value of its portfolio securities and its investment performance could be primarily dependent upon securities it does not directly own.
A Portfolio’s investments in and exposure to foreign securities involve special risks. For example, the value of these investments may decline in response to unfavorable political and legal developments, unreliable or untimely information or economic and financial instability. Foreign securities may experience more rapid and extreme changes in value than investments in securities of U.S. issuers. The securities markets of certain foreign countries are relatively small, with a limited number of companies representing a small number of industries. Issuers of foreign securities are usually not subject to the same degree of regulation as U.S. issuers. Reporting, accounting, auditing and custody standards of foreign countries differ, in some cases significantly, from U.S. standards. Also, nationalization, expropriation or other confiscation, currency blockage, political changes or diplomatic developments could adversely affect a Portfolio’s investments in foreign securities. In the event of nationalization, expropriation or other confiscation, a Portfolio could lose its entire investment in foreign securities. Risks associated with investing in foreign securities may be increased
| | | | | | |
| | ANNUAL REPORT | | OCTOBER 31, 2014 | | 5 |
Important Information About the Portfolios (Cont.)
when invests in emerging markets. For example, if a Portfolio invests in emerging market debt, it may face increased exposure to interest rate, liquidity, volatility, and redemption risk due to the specific economic, political, geographical, or legal background of the emerging market issuer.
Investments in loans are generally subject to risks similar to those of investments in other types of debt obligations, including, among others, credit risk, interest rate risk, variable and floating rate securities risk, and, as applicable, risks associated with mortgage-related securities. In addition, in many cases loans are subject to the risks associated with below-investment grade securities. In the case of a loan participation or assignment, a Portfolio generally has no right to enforce compliance with the terms of the loan agreement with the borrower. As a result, a Portfolio may be subject to the credit risk of both the borrower and the lender that is selling the loan agreement. In the event of the insolvency of the lender selling a loan participation, a Portfolio may be treated as a general creditor of the lender and may not benefit from any set-off between the lender and the borrower. The Portfolios may be subject to heightened or additional risks and potential liabilities and costs by investing in mezzanine and other subordinated loans or acting as an originator of loans, including those arising under bankruptcy, fraudulent conveyance, equitable subordination, lender liability, environmental and other laws and regulations, and risks and costs associated with debt servicing and taking foreclosure actions associated with the loans.
Mortgage-related and other asset-backed securities often involve risks that are different from or more acute than risks associated with other types of debt instruments. Generally, rising interest rates tend to extend the duration of fixed rate mortgage-related securities, making them more sensitive to changes in interest rates. As a result, in a period of rising interest rates, if a Portfolio holds mortgage-related securities, it may experience additional volatility since individual mortgage holders are less likely to exercise prepayment options, thereby putting additional downward pressure on the value of these securities and potentially causing the fund to lose money. This is known as extension risk. Mortgage-backed securities can be highly sensitive to rising interest rates, such that even small movements can cause an investing Portfolio to lose value. Mortgage-backed securities, and in particular those not backed by a government guarantee, are subject to credit risk. In addition, adjustable and fixed rate mortgage-related securities are subject to prepayment risk. When interest rates decline, borrowers may pay off their mortgages sooner than expected. This can reduce the returns of the Portfolios because the Portfolios may have to reinvest that money at the lower prevailing interest rates. A Portfolio’s investments in other asset-backed securities are subject to risks similar to those associated with mortgage-related securities, as well as additional risks associated with the nature of the assets and the servicing of those assets. Payment of principal and interest on asset-backed securities may be largely dependent upon the cash flows generated by the assets backing the securities, and asset-backed securities may not have the benefit of any security interest in the related assets.
High-yield bonds (commonly referred to as “junk bonds”) typically have a lower credit rating than other bonds. Lower-rated bonds generally involve a greater risk to principal than higher-rated bonds. Further, markets for lower-rated bonds are typically less liquid than for higher-rated bonds, and public information is usually less abundant in such markets. Thus, high yield investments increase the chance that a Portfolio will lose money. The Portfolios may hold defaulted securities that may involve special considerations including bankruptcy proceedings, other regulatory and legal restrictions affecting the Portfolio’s ability to trade, and the availability of prices from independent pricing services or dealer
| | | | | | |
| 6 | | PIMCO MANAGED ACCOUNTS TRUST | | | | |
quotations. Defaulted securities are often illiquid and may not be actively traded. Sale of securities in bankrupt companies at an acceptable price may be difficult and differences compared to the value of the securities used by the Portfolios could be material.
Certain Portfolios may invest in securities and instruments that are economically tied to Russia. Investments in Russia are subject to political, economic, legal, market and currency risks, as well as the risk that economic sanctions may be imposed by the United States and/or other countries. Such sanctions — which may impact companies in many sectors, including energy, financial services and defense, among others — may negatively impact a Portfolio’s performance and/or ability to achieve its investment objective. For example, certain transactions may be prohibited and/or existing investments may become illiquid (e.g., in the event that transacting in certain existing investments is prohibited).
The Portfolios may be subject to various risks in addition to those described above. Some of these risks may include, but are not limited to, the following: California state-specific risk, credit risk, currency risk, focused-investment risk, foreign (non-U.S.) investment risk, interest rate risk, issuer-non-diversification risk, issuer risk, leveraging risk, liquidity risk, management risk, market risk, municipal project-specific risk, municipal securities risk, New York state-specific risk, and turnover risk. A description of certain of these risks is available in the Notes to Financial Statements of this Report.
Foreign securities in this report are classified by the country of incorporation of a holding. In certain instances, a security’s country of incorporation may be different from its country of economic exposure.
On each individual Portfolio Summary page in this Shareholder Report the Average Annual Total Return table and Cumulative Returns chart measure performance assuming that all dividend and capital gain distributions were reinvested. Total return is calculated by determining the percentage change in NAV in the specified period. Returns do not reflect the deduction of taxes that a shareholder would pay on (i) Portfolio distributions or (ii) the redemption of Portfolio shares. Total return for a period of more than one year represents the average annual total return. Performance shown is net of fees and expenses. A Portfolio’s total annual operating expense ratios on each individual Portfolio Summary page are as of the currently effective prospectus, as supplemented to date. The figures in the line graph are calculated at NAV and assume the investment of $1,000,000 at the end of the month that a Portfolio commenced operations. Each Portfolio measures its performance against a broad-based securities market index (“benchmark index”). Each benchmark index does not take into account fees, expenses or taxes.
The following table discloses the commencement of operations of each Portfolio:
| | | | | | |
| Portfolio Name | | | | Commencement
of Operations | |
| Fixed Income SHares: Series C | | | | | 03/17/00 | |
| Fixed Income SHares: Series M | | | | | 03/17/00 | |
| Fixed Income SHares: Series R | | | | | 04/15/04 | |
| Fixed Income SHares: Series TE | | | | | 06/26/12 | |
| Fixed Income SHares: Series LD | | | | | 12/23/13 | |
An investment in a Portfolio is not a deposit of a bank and is not guaranteed or insured by the Federal Deposit Insurance Corporation or any other government agency. It is possible to lose money on investments in the Portfolios.
| | | | | | |
| | ANNUAL REPORT | | OCTOBER 31, 2014 | | 7 |
Important Information About the Portfolios (Cont.)
PIMCO has adopted written proxy voting policies and procedures (“Proxy Policy”) as required by Rule 206(4)-6 under the Investment Advisers Act of 1940. The Proxy Policy has been adopted by the Portfolios as the policies and procedures that PIMCO will use when voting proxies on behalf of the Portfolios. A description of the policies and procedures that PIMCO uses to vote proxies relating to portfolio securities of each Portfolio, and information about how each Portfolio voted proxies relating to portfolio securities held during the most recent twelve-month period ended June 30, are available without charge, upon request, by calling the Portfolios at (844) 33-PIMCO (844-337-4626), and on the Securities and Exchange Commission’s (“SEC”) website at http://www.sec.gov.
Each Portfolio files a complete schedule of its portfolio holdings with the SEC for the first and third quarters of its fiscal year on Form N-Q. A copy of each Portfolio’s Form N-Q is available on the SEC’s website at http://www.sec.gov and may be reviewed and copied at the SEC’s Public Reference Room in Washington, D.C., and is available without charge, upon request by calling the Portfolios at (844) 33-PIMCO (844-337-4626). Information on the operation of the Public Reference Room may be obtained by calling 1-800-SEC-0330.
| | | | | | |
| 8 | | PIMCO MANAGED ACCOUNTS TRUST | | | | |
(THIS PAGE INTENTIONALLY LEFT BLANK)
| | | | | | |
| | ANNUAL REPORT | | OCTOBER 31, 2014 | | 9 |
| | |
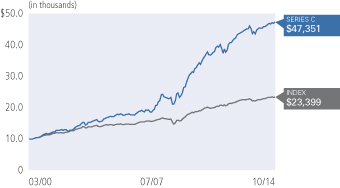
| Fixed Income SHares - Series C | | FXICX |
Cumulative Returns Through October 31, 2014
| | | | |
| Allocation Breakdown† | | | |
| |
| Corporate Bonds & Notes | | | 63.0% | |
| Sovereign Issues | | | 22.9% | |
| Short-Term Instruments | | | 10.4% | |
| Mortgage-Backed Securities | | | 1.4% | |
| Municipal Bonds & Notes | | | 1.2% | |
| Other | | | 1.1% | |
| | † | % of Investments, at value as of 10/31/14 |
| | | | | | | | | | | | | | | | | | |
| Average Annual Total Return for the period ended October 31, 2014 | |
| | | | | 1 Year | | | 5 Year | | | 10 Year | | | Commencement
of Operations
(03/17/00) | |
 | | Fixed Income SHares - Series C | | | 4.72% | | | | 8.95% | | | | 10.94% | | | | 11.26% | |
 | | Barclays U.S. Credit Intermediate Index | | | 3.69% | | | | 5.14% | | | | 4.87% | | | | 6.01% | |
All Portfolio returns are net of fees and expenses.
Performance quoted represents past performance. Past performance is not a guarantee or a reliable indicator of future results. Current performance may be lower or higher than performance shown. Investment return and the principal value of an investment will fluctuate. Returns presented do not reflect the deduction of taxes that a shareholder would pay on fund distribution or the redemption of fund shares or the deduction of any fees charged to investors at the “wrap account” level. The Portfolio’s total annual operating expense ratio as stated in the Portfolio’s current prospectus, as supplemented to date, is 0.053%.
| | | | | | |
| 10 | | PIMCO MANAGED ACCOUNTS TRUST | | | | |
Portfolio Insights
| » | | An underweight to U.S. duration was negative for performance as the 10-year Treasury yield declined 22 basis points during the reporting period. |
| » | | U.S. yield curve positioning was also a negative for returns. Specifically, a focus on the one- to-seven-year portion of the yield curve detracted from results as their rates rose. In addition, a short position in the long end of the curve was not rewarded as 30-year Treasury rates moved 57 basis points lower during the reporting period. |
| » | | An overall underweight to investment grade corporate bonds detracted from performance as the sector outperformed like-duration Treasuries during the reporting period, as measured by the Barclays Capital U.S. Corporate Investment Grade Index. |
| » | | An allocation to Brazilian local debt was negative for performance. |
| » | | An exposure to high yield corporate bonds contributed to performance as the sector outperformed like-duration Treasuries, as measured by the Barclays U.S. Corporate High Yield Index. |
| » | | Within taxable municipals, an overweight to Build America Bonds (BABs) contributed to returns. BABs, as measured by the Barclays Taxable Municipal-Build America Bonds Index, returned 13.86% over the reporting period and outperformed both like-duration Treasuries and the general taxable municipal market. |
| » | | In addition, currency positioning was positive for performance. In particular, short exposures to the euro and yen were beneficial as those currencies weakened against the U.S. dollar. |
| | | | | | |
| | ANNUAL REPORT | | OCTOBER 31, 2014 | | 11 |
| | |
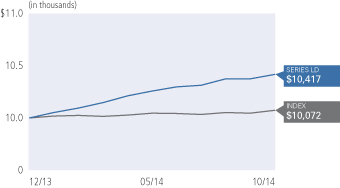
| Fixed Income SHares - Series LD | | FXIDX |
Cumulative Returns Through October 31, 2014
| | | | |
| Allocation Breakdown† | | | |
| |
| Corporate Bonds & Notes | | | 68.1% | |
| Mortgage-Backed Securities | | | 14.6% | |
| Asset-Backed Securities | | | 7.8% | |
| Short-Term Instruments | | | 4.9% | |
| Sovereign Issues | | | 2.4% | |
| Other | | | 2.2% | |
| | † | % of Investments, at value as of 10/31/14 |
| | | | | | |
| Average Annual Total Return for the period ended October 31, 2014 | | | |
| | | | | Commencement
of Operations
(12/23/13) | |
| | Fixed Income SHares - Series LD | | | 4.08% | |
| | BofA Merrill Lynch 1-3 Year U.S. Treasury Index | | | 0.72% | |
All Portfolio returns are net of fees and expenses.
Performance quoted represents past performance. Past performance is not a guarantee or a reliable indicator of future results. Current performance may be lower or higher than performance shown. Investment return and the principal value of an investment will fluctuate. Returns presented do not reflect the deduction of taxes that a shareholder would pay on fund distribution or the redemption of fund shares or the deduction of any fees charged to investors at the “wrap account” level. The Portfolio’s total annual operating expense ratio as stated in the Portfolio’s current prospectus, as supplemented to date, is 0.072%.
| | | | | | |
| 12 | | PIMCO MANAGED ACCOUNTS TRUST | | | | |
Portfolio Insights
| » | | An overweight to U.S. duration contributed to performance as yields fell over much of the yield curve during the period since the Portfolio’s inception. |
| » | | An allocation to non-agency mortgage-backed securities was positive for performance. These securities continued to rise in price given strong investor demand amid the improving housing market. |
| » | | Currency positioning benefited performance, specifically shorts to the euro and yen, as both currencies depreciated against the U.S. dollar. |
| » | | In addition, an allocation to U.S. corporate bonds was rewarded given their solid performance during the reporting period. |
| » | | There were no notable detractors from relative performance during the reporting period. |
| | | | | | |
| | ANNUAL REPORT | | OCTOBER 31, 2014 | | 13 |
| | |
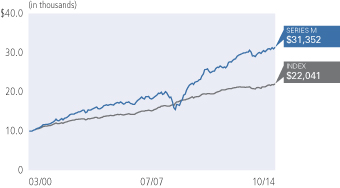
| Fixed Income SHares - Series M | | FXIMX |
Cumulative Returns Through October 31, 2014
| | | | |
| Allocation Breakdown† | | | |
| |
| Corporate Bonds & Notes | | | 36.2% | |
| U.S. Government Agencies | | | 20.9% | |
| Mortgage-Backed Securities | | | 12.5% | |
| Municipal Bonds & Notes | | | 12.5% | |
| Short-Term Instruments | | | 9.3% | |
| Asset-Backed Securities | | | 6.5% | |
| Other | | | 2.1% | |
| | † | % of Investments, at value as of 10/31/14 |
| | | | | | | | | | | | | | | | | | |
| Average Annual Total Return for the period ended October 31, 2014 | |
| | | | | 1 Year | | | 5 Year | | | 10 Year | | | Commencement
of Operations
(03/17/00) | |
| | Fixed Income SHares - Series M | | | 4.78% | | | | 7.42% | | | | 6.50% | | | | 8.18% | |
| | Barclays U.S. MBS Fixed-Rate Index | | | 4.11% | | | | 3.58% | | | | 4.75% | | | | 5.57% | |
All Portfolio returns are net of fees and expenses.
Performance quoted represents past performance. Past performance is not a guarantee or a reliable indicator of future results. Current performance may be lower or higher than performance shown. Investment return and the principal value of an investment will fluctuate. Returns presented do not reflect the deduction of taxes that a shareholder would pay on fund distribution or the redemption of fund shares or the deduction of any fees charged to investors at the “wrap account” level. The Portfolio’s total annual operating expense ratio as stated in the Portfolio’s current prospectus, as supplemented to date, is 0.053%.
| | | | | | |
| 14 | | PIMCO MANAGED ACCOUNTS TRUST | | | | |
Portfolio Insights
| » | | An overweight to U.S. duration was positive for performance as the 10-year Treasury yield declined 22 basis points during the reporting period. |
| » | | Non-U.S. interest rate exposure, overall, was positive for performance. In particular, the Portfolio’s Canadian exposure contributed to returns as Canadian rates declined during the reporting period. |
| » | | Exposures to both high yield and investment grade corporate bonds were beneficial for results as the U.S. corporate sector posted strong returns. |
| » | | An allocation to non-agency mortgage-backed securities was positive for performance. These securities continued to rise in price given strong investor demand amid the improving housing market. |
| » | | A focus on the three- to five-year portion of the yield curve detracted from performance. Rates for that portion of the yield curve rose modestly during the reporting period and underperformed the long end of the yield curve as 30-year Treasury rates moved 57 basis points lower during the reporting period. |
| » | | A small short to Japanese interest rates modestly detracted from performance as Japanese rates fell. |
| » | | Currency positioning was negative for performance, driven by a long position in the euro, as it weakened against the U.S. dollar. |
| | | | | | |
| | ANNUAL REPORT | | OCTOBER 31, 2014 | | 15 |
| | |
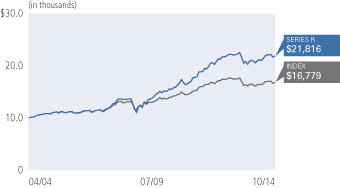
| Fixed Income SHares - Series R | | FXIRX |
Cumulative Returns Through October 31, 2014
| | | | |
| Allocation Breakdown† | | | |
| |
| U.S. Treasury Obligations | | | 64.2% | |
| Sovereign Issues | | | 15.7% | |
| Short-Term Instruments | | | 7.0% | |
| Corporate Bonds & Notes | | | 5.3% | |
| U.S. Government Agencies | | | 3.0% | |
| Other | | | 4.8% | |
| | † | % of Investments, at value as of 10/31/14 |
| | | | | | | | | | | | | | | | | | |
| Average Annual Total Return for the period ended October 31, 2014 | |
| | | | | 1 Year | | | 5 Year | | | 10 Year | | | Commencement
of Operations
(04/15/04) | |
| | Fixed Income SHares - Series R | | | 3.82% | | | | 8.17% | | | | 7.41% | | | | 7.65% | |
| | Barclays U.S. TIPS Index | | | 1.90% | | | | 4.40% | | | | 4.62% | | | | 4.87% | |
All Portfolio returns are net of fees and expenses.
Performance quoted represents past performance. Past performance is not a guarantee or a reliable indicator of future results. Current performance may be lower or higher than performance shown. Investment return and the principal value of an investment will fluctuate. Returns presented do not reflect the deduction of taxes that a shareholder would pay on fund distribution or the redemption of fund shares or the deduction of any fees charged to investors at the “wrap account” level. The Portfolio’s total annual operating expense ratio as stated in the Portfolio’s current prospectus, as supplemented to date, is 0.097%.
| | | | | | |
| 16 | | PIMCO MANAGED ACCOUNTS TRUST | | | | |
Portfolio Insights
| » | | An average overweight to the 12- to 15-year portion of the real yield curve was positive for performance. Yields in that portion of the curve fell, and it outperformed shorter-term maturities during the reporting period. |
| » | | Exposure to nominal and real duration in Australia was positive for performance as Australian rates declined. |
| » | | An allocation to U.S. corporate bonds contributed to results as they performed well during the reporting period. |
| » | | Exposures to commercial mortgage-backed securities and non-agency mortgage-backed securities were beneficial given their solid returns. |
| » | | In addition, currency positioning was positive for performance. In particular, short exposures to the euro and yen were beneficial as those currencies weakened against the U.S. dollar. |
| » | | An allocation to U.S. nominal rates was negative for performance. In particular, the Portfolio’s exposure to the short-to-intermediate portion of the curve detracted from results as rates in that portion of the curve rose. In contrast, 30-year Treasury rates moved 57 basis points lower during the reporting period. |
| » | | An allocation to nominal rates in Brazil was negative for performance as rates rose in the short-to-intermediate portion of Brazil’s yield curve. |
| | | | | | |
| | ANNUAL REPORT | | OCTOBER 31, 2014 | | 17 |
| | |
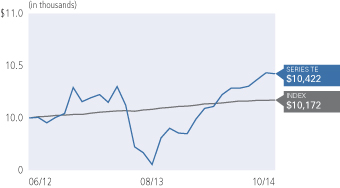
| Fixed Income SHares - Series TE | | FXIEX |
Cumulative Returns Through October 31, 2014
| | | | |
| Allocation Breakdown† | | | |
| |
| Municipal Bonds & Notes | | | 92.3% | |
| Short-Term Instruments | | | 7.7% | |
| | † | % of Investments, at value as of 10/31/14 |
| | | | | | | | | | |
| Average Annual Total Return for the period ended October 31, 2014 | |
| | | | | 1 Year | | | Commencement
of Operations
(06/26/12) | |
| | Fixed Income SHares - Series TE | | | 5.27% | | | | 1.78% | |
| | Barclays 1-Year Municipal Bond Index | | | 0.72% | | | | 0.72% | |
All Portfolio returns are net of fees and expenses.
Performance quoted represents past performance. Past performance is not a guarantee or a reliable indicator of future results. Current performance may be lower or higher than performance shown. Investment return and the principal value of an investment will fluctuate. Returns presented do not reflect the deduction of taxes that a shareholder would pay on fund distribution or the redemption of fund shares or the deduction of any fees charged to investors at the “wrap account” level. The Portfolio’s total annual operating expense ratio as stated in the Portfolio’s current prospectus, as supplemented to date, is 0.052%.
| | | | | | |
| 18 | | PIMCO MANAGED ACCOUNTS TRUST | | | | |
Portfolio Insights
| » | | An overweight to duration contributed to performance as municipal yields moved lower across the curve during the reporting period. |
| » | | An overweight to revenue-backed bonds contributed to results as they outperformed the broader municipal market. |
| » | | An overweight to the industrial revenue sector was beneficial for returns as that sector outperformed the general municipal market and credit spreads compressed during the reporting period. |
| » | | Elsewhere, an overweight to the hospital sector contributed to performance as the sector, as measured by the Barclays Municipal Bond: Hospital Index, gained 11% over the 12 months ended October 31, 2014. |
| » | | A short exposure to 30-year nominal Treasuries was negative for performance, as 30-year Treasury rates moved 57 basis points lower during the reporting period. |
| » | | An underweight to the housing revenue sector detracted from performance as that sector outperformed the general municipal market. |
| | | | | | |
| | ANNUAL REPORT | | OCTOBER 31, 2014 | | 19 |
Expense Examples
Example
As a shareholder of a Portfolio, you incur two types of costs: (1) transaction costs and (2) ongoing costs, including management fees, distribution and/or service (12b-1) fees (if applicable), and other Portfolio expenses. The Example is intended to help you understand your ongoing costs (in dollars) of investing in the Portfolio and to compare these costs with the ongoing costs of investing in other mutual funds.
The Example is based on an investment of $1,000 invested at the beginning of the period and held for the entire period indicated, which for all Portfolios is from April 1, 2014 to September 30, 2014 unless noted otherwise in the table and footnotes below.
Actual Expenses
The information in the table under the heading “Actual” provides information about actual account values and actual expenses. You may use the information in these columns, together with the amount you invested, to estimate the expenses that you paid over the period. Simply divide your account value by $1,000 (for example, an $8,600 account value divided by $1,000 = $8.60), then multiply the result by the number in the appropriate column for your share class, in the column titled “Expenses Paid During Period” to estimate the expenses you paid on your account during this period.
Hypothetical Example for Comparison Purposes
The information in the table under the heading “Hypothetical (5% return before expenses)” provides information about hypothetical account values and hypothetical expenses based on a Portfolio’s actual expense ratio and an assumed rate of return of 5% per year before expenses, which is not the Portfolio’s actual return. The hypothetical account values and expenses may not be used to estimate the actual ending account balance or expenses you paid for the period. You may use this information to compare the ongoing costs of investing in a Portfolio and other funds. To do so, compare this 5% hypothetical example with the 5% hypothetical examples that appear in the shareholder reports of the other funds.
Please note that the expenses shown in the table are meant to highlight your ongoing costs only and do not reflect any transactional costs. Therefore, the information under the heading “Hypothetical (5% return before expenses)” is useful in comparing ongoing costs only, and will not help you determine the relative total costs of owning different funds. In addition, if these transactional costs were included, your costs would have been higher.
Expense ratios may vary period to period because of various factors, such as an increase in expenses that are not covered by the management fees such as fees and expenses of the independent trustees and their counsel, extraordinary expenses and interest expense.
| | | | | | | | | | | | | | | | | | | | | | | | | | | | | | | | | | |
| | | | | Actual | | | | | Hypothetical
(5% return before expenses) | | | | | | |
| | | | | Beginning
Account Value
(05/01/14) | | | Ending
Account Value
(10/31/14) | | | Expenses Paid
During Period * | | | | | Beginning
Account Value
(05/01/14) | | | Ending
Account Value
(10/31/14) | | | Expenses Paid
During Period * | | | | | Net Annualized
Expense Ratio | |
Series C | | | | $ | 1,000.00 | | | $ | 1,026.00 | | | $ | 0.03 | | | | | $ | 1,000.00 | | | $ | 1,025.45 | | | $ | 0.03 | | | | | | 0.006 | % |
Series LD | | | | | 1,000.00 | | | | 1,020.10 | | | | 0.72 | | | | | | 1,000.00 | | | | 1,024.77 | | | | 0.72 | | | | | | 0.140 | |
Series M | | | | | 1,000.00 | | | | 1,026.80 | | | | 0.32 | | | | | | 1,000.00 | | | | 1,025.16 | | | | 0.32 | | | | | | 0.062 | |
Series R | | | | | 1,000.00 | | | | 1,020.70 | | | | 0.36 | | | | | | 1,000.00 | | | | 1,025.12 | | | | 0.36 | | | | | | 0.070 | |
Series TE | | | | | 1,000.00 | | | | 1,019.60 | | | | 0.00 | | | | | | 1,000.00 | | | | 1,025.48 | | | | 0.00 | | | | | | 0.000 | |
* Expenses Paid During Period are equal to the net annualized expense ratio for the Portfolio, multiplied by the average account value over the period, multiplied by 186/365 (to reflect the one-half year period).
| | | | | | |
| 20 | | PIMCO MANAGED ACCOUNTS TRUST | | | | |
Benchmark Descriptions
| | |
| Index | | Description |
| |
| Barclays U.S. Credit Intermediate Index | | The Barclays U.S. Credit Intermediate Index is an unmanaged index of publicly issued U.S. corporate and specified non-U.S. debentures and secured notes with intermediate maturities ranging from 1 to 10 years. Securities must also meet specific liquidity and quality requirements. To qualify, bonds must be SEC-registered. It is not possible to invest directly in an unmanaged index. |
| |
| Barclays U.S. MBS Fixed-Rate Index | | Barclays U.S. MBS Fixed-Rate Index is an unmanaged index of mortgage-backed pass-through securities of Ginnie Mae (GNMA), Fannie Mae (FNMA), and Freddie Mac (FHLMC). The MBS Index is formed by grouping the universe of over 600,000 individual fixed rate MBS pools into approximately 3,500 generic aggregates. It is not possible to invest directly in an unmanaged index. |
| |
| BofA Merrill Lynch 1-3 Year U.S. Treasury Index | | The BofA Merrill Lynch 1-3 Year U.S. Treasury Index is an unmanaged index that tracks the performance of the direct sovereign debt of the U.S. Government having a maturity of at least one year and less than three years. It is not possible to invest directly in an unmanaged index. |
| |
| Barclays U.S. TIPS Index | | Barclays U.S. TIPS Index is an unmanaged market index comprised of all U.S. Treasury Inflation-Protected Securities rated investment grade (Baa3 or better), have at least one year to final maturity, and at least $250 million par amount outstanding. It is not possible to invest directly in an unmanaged index. |
| |
| Barclays 1 Year Municipal Bond Index | | Barclays 1-Year Municipal Bond Index is the 1 Year (1-2) component of the Municipal Bond Index. The Barclays Municipal Bond Index is a rules-based, market-value-weighted index engineered for the long term tax-exempt bond market. To be included in the Index, bonds must be rated investment-grade (Baa3/BBB- or higher) by at least two of the following ratings agencies: Moody’s, S&P and Fitch. If only two of the three agencies rate the security, the lower rating is used to determine index eligibility. If only one of the three agencies rates a security, the rating must be investment-grade. They must have an outstanding par value of at least $7 million and be issued as part of a transaction of at least $75 million. The bonds must be fixed rate, have a dated-date after December 31, 1990, and must be at least one year from their maturity date. Remarketed issues, taxable municipal bonds, bonds with floating rates, and derivatives, are excluded from the benchmark. It is not possible to invest directly in an index. |
| | | | | | |
| | ANNUAL REPORT | | OCTOBER 31, 2014 | | 21 |
Financial Highlights PIMCO Fixed Income SHares
| | | | | | | | | | | | | | | | | | | | | | | | |
Selected Per Share Data for
the Year or Period Ended: | | Net Asset
Value
Beginning
of Year
or Period | | | Net
Investment
Income (a) | | | Net Realized/
Unrealized
Gain (Loss) | | | Total Income
(Loss) from
Investment
Operations | | | Dividends
from Net
Investment
Income | | | Distributions
from Net
Realized
Capital Gains | |
Series C | | | | | | | | | | | | | | | | | | | | | | | | |
10/31/2014 | | $ | 13.11 | | | $ | 0.51 | | | $ | 0.05 | | | $ | 0.56 | | | $ | (0.55 | ) | | $ | (0.83 | ) |
10/31/2013 | | | 13.75 | | | | 0.60 | | | | (0.24 | ) | | | 0.36 | | | | (0.90 | ) | | | (0.10 | ) |
10/31/2012 | | | 12.71 | | | | 0.65 | | | | 1.06 | | | | 1.71 | | | | (0.67 | ) | | | 0.00 | |
10/31/2011 | | | 14.05 | | | | 0.78 | | | | (0.46 | ) | | | 0.32 | | | | (1.25 | ) | | | (0.41 | ) |
10/31/2010 | | | 13.83 | | | | 0.75 | | | | 1.93 | | | | 2.68 | | | | (1.67 | ) | | | (0.79 | ) |
| | | | | | |
Series LD | | | | | | | | | | | | | | | | | | | | | | | | |
12/23/2013 - 10/31/2014 | | $ | 10.00 | | | $ | 0.19 | | | $ | 0.22 | | | $ | 0.41 | | | $ | (0.21 | ) | | $ | 0.00 | |
| | | | | | |
Series M | | | | | | | | | | | | | | | | | | | | | | | | |
10/31/2014 | | $ | 10.86 | | | $ | 0.43 | | | $ | 0.07 | | | $ | 0.50 | | | $ | (0.40 | ) | | $ | (0.18 | ) |
10/31/2013 | | | 11.22 | | | | 0.34 | | | | (0.23 | ) | | | 0.11 | | | | (0.47 | ) | | | 0.00 | |
10/31/2012 | | | 10.51 | | | | 0.41 | | | | 0.84 | | | | 1.25 | | | | (0.54 | ) | | | 0.00 | |
10/31/2011 | | | 10.94 | | | | 0.48 | | | | (0.29 | ) | | | 0.19 | | | | (0.49 | ) | | | (0.13 | ) |
10/31/2010 | | | 9.90 | | | | 0.47 | | | | 1.25 | | | | 1.72 | | | | (0.68 | ) | | | 0.00 | |
| | | | | | |
Series R | | | | | | | | | | | | | | | | | | | | | | | | |
10/31/2014 | | $ | 10.52 | | | $ | 0.37 | | | $ | 0.01 | | | $ | 0.38 | | | $ | (0.18 | ) | | $ | (0.25 | ) |
10/31/2013 | | | 11.93 | | | | 0.19 | | | | (0.69 | ) | | | (0.50 | ) | | | (0.23 | ) | | | (0.68 | ) |
10/31/2012 | | | 11.97 | | | | 0.31 | | | | 1.10 | | | | 1.41 | | | | (0.40 | ) | | | (1.05 | ) |
10/31/2011 | | | 12.13 | | | | 0.40 | | | | 0.85 | | | | 1.25 | | | | (0.43 | ) | | | (0.98 | ) |
10/31/2010 | | | 10.83 | | | | 0.33 | | | | 1.54 | | | | 1.87 | | | | (0.52 | ) | | | (0.05 | ) |
| | | | | | |
Series TE | | | | | | | | | | | | | | | | | | | | | | | | |
10/31/2014 | | $ | 9.64 | | | $ | 0.26 | | | $ | 0.24 | | | $ | 0.50 | | | $ | (0.24 | ) | | $ | 0.00 | |
10/31/2013 | | | 9.99 | | | | 0.22 | | | | (0.35 | ) | | | (0.13 | ) | | | (0.22 | ) | | | 0.00 | |
06/26/2012 - 10/31/2012 | | | 10.00 | | | | 0.05 | | | | (0.01 | ) | | | 0.04 | | | | (0.05 | ) | | | 0.00 | |
| (a) | Per share amounts based on average number of shares outstanding during the year or period. |
| (b) | The calculation assumes that all income dividends and capital gain distributions, if any, have been reinvested. Total return does not reflect broker commissions or “wrap fee” charges. |
| (c) | Reflects the fact that no fees or expenses are incurred. The Portfolios are an integral part of “wrap-fee” programs sponsored by investment advisers and/or broker-dealers unaffiliated with the Series and the Investment Manager. Participants in these programs pay a “wrap” fee to the sponsor of the program. |
| | | | | | |
| 22 | | PIMCO MANAGED ACCOUNTS TRUST | | | | See Accompanying Notes |
| | | | | | | | | | | | | | | | | | | | | | | | | | | | | | |
Total
Distributions | | | Net Asset
Value End
of Year
or Period | | | Total
Return (b) | | | Net Assets
End of Year
or Period (000s) | | | Ratio of
Expenses to
Average
Net Assets (c) | | | Ratio of
Expenses to
Average
Net Assets
Excluding
Interest
Expense (c) | | | Ratio of
Expenses Net
Investment
Income to
Average
Net Assets (c) | | | Portfolio
Turnover
Rate | |
| | | | | | | | | | | | | | | | | | | | | | | | | | | | | | |
| $ | (1.38 | ) | | $ | 12.29 | | | | 4.72 | % | | $ | 2,353,773 | | | | 0.01 | % | | | 0.00 | % | | | 4.11 | % | | | 82 | % |
| | (1.00 | ) | | | 13.11 | | | | 2.72 | | | | 3,261,050 | | | | 0.00 | † | | | 0.00 | † | | | 4.65 | | | | 149 | |
| | (0.67 | ) | | | 13.75 | | | | 13.79 | | | | 4,018,843 | | | | 0.00 | † | | | 0.00 | | | | 4.87 | | | | 83 | |
| | (1.66 | ) | | | 12.71 | | | | 2.75 | | | | 3,680,966 | | | | 0.00 | † | | | 0.00 | | | | 5.72 | | | | 178 | |
| | (2.46 | ) | | | 14.05 | | | | 22.40 | | | | 3,345,203 | | | | 0.00 | † | | | 0.00 | | | | 5.70 | | | | 164 | |
| | | | | | | | | | | | | | | | | | | | | | | | | | | | | | |
| $ | (0.21 | ) | | $ | 10.20 | | | | 4.08 | % | | $ | 9,070 | | | | 0.10 | %* | | | 0.00 | % | | | 2.15 | %* | | | 8,278 | % |
| | | | | | | | | | | | | | | | | | | | | | | | | | | | | | |
| $ | (0.58 | ) | | $ | 10.78 | | | | 4.78 | % | | $ | 2,332,201 | | | | 0.04 | % | | | 0.00 | % | | | 4.01 | % | | | 587 | % |
| | (0.47 | ) | | | 10.86 | | | | 0.97 | | | | 2,996,930 | | | | 0.00 | † | | | 0.00 | † | | | 3.25 | | | | 448 | |
| | (0.54 | ) | | | 11.22 | | | | 12.23 | | | | 3,988,009 | | | | 0.00 | † | | | 0.00 | | | | 3.78 | | | | 516 | |
| | (0.62 | ) | | | 10.51 | | | | 1.95 | | | | 3,643,832 | | | | 0.00 | † | | | 0.00 | | | | 4.57 | | | | 514 | |
| | (0.68 | ) | | | 10.94 | | | | 18.22 | | | | 3,351,404 | | | | 0.01 | | | | 0.00 | | | | 4.67 | | | | 482 | |
| | | | | | | | | | | | | | | | | | | | | | | | | | | | | | |
| $ | (0.43 | ) | | $ | 10.47 | | | | 3.82 | % | | $ | 215,671 | | | | 0.07 | % | | | 0.00 | % | | | 3.55 | % | | | 88 | % |
| | (0.91 | ) | | | 10.52 | | | | (4.78 | ) | | | 350,159 | | | | 0.04 | | | | 0.00 | † | | | 2.06 | | | | 69 | |
| | (1.45 | ) | | | 11.93 | | | | 13.26 | | | | 602,719 | | | | 0.02 | | | | 0.00 | | | | 2.67 | | | | 264 | |
| | (1.41 | ) | | | 11.97 | | | | 12.23 | | | | 492,949 | | | | 0.00 | † | | | 0.00 | | | | 3.62 | | | | 805 | |
| | (0.57 | ) | | | 12.13 | | | | 17.94 | | | | 403,376 | | | | 0.00 | † | | | 0.00 | | | | 2.90 | | | | 495 | |
| | | | | | | | | | | | | | | | | | | | | | | | | | | | | | |
| $ | (0.24 | ) | | $ | 9.90 | | | | 5.27 | % | | $ | 95,841 | | | | 0.00 | % | | | 0.00 | % | | | 2.67 | % | | | 8 | % |
| | (0.22 | ) | | | 9.64 | | | | (1.40 | ) | | | 65,594 | | | | 0.00 | † | | | 0.00 | | | | 2.19 | | | | 18 | |
| | (0.05 | ) | | | 9.99 | | | | 0.43 | | | | 9,450 | | | | 0.00 | * | | | 0.00 | | | | 1.71 | * | | | 30 | |
| | | | | | |
| | ANNUAL REPORT | | OCTOBER 31, 2014 | | 23 |
Statements of Assets and Liabilities PIMCO Fixed Income SHares
| | | | | | | | |
| (Amounts in thousands, except per share amounts) | | Series C | | | Series LD | |
Assets: | | | | | | | | |
Investments, at value | | | | | | | | |
Investments in securities* | | $ | 2,654,142 | | | $ | 13,186 | |
Financial Derivative Instruments | | | | | | | | |
Exchange-traded or centrally cleared | | | 1,259 | | | | 15 | |
Over the counter | | | 57,956 | | | | 41 | |
Cash | | | 0 | | | | 262 | |
Deposits with counterparty | | | 1,941 | | | | 45 | |
Foreign currency, at value | | | 2,703 | | | | 14 | |
Receivable for investments sold | | | 54,800 | | | | 152 | |
Receivable for Portfolio shares sold | | | 303 | | | | 0 | |
Interest receivable | | | 34,291 | | | | 99 | |
Other assets | | | 57 | | | | 0 | |
| | | | 2,807,452 | | | | 13,814 | |
| | |
Liabilities: | | | | | | | | |
Borrowings & Other Financing Transactions | | | | | | | | |
Payable for reverse repurchase agreements | | $ | 223,775 | | | $ | 4,401 | |
Payable for sale-buyback transactions | | | 162,347 | | | | 0 | |
Payable for short sales | | | 0 | | | | 152 | |
Financial Derivative Instruments | | | | | | | | |
Exchange-traded or centrally cleared | | | 1,532 | | | | 11 | |
Over the counter | | | 23,495 | | | | 37 | |
Payable for investments purchased | | | 222 | | | | 115 | |
Deposits from counterparty | | | 18,145 | | | | 0 | |
Payable for Portfolio shares redeemed | | | 13,699 | | | | 0 | |
Dividends payable | | | 10,451 | | | | 28 | |
Overdraft due to custodian | | | 13 | | | | 0 | |
| | | | 453,679 | | | | 4,744 | |
| | |
Net Assets | | $ | 2,353,773 | | | $ | 9,070 | |
| | |
Net Assets Consist of: | | | | | | | | |
Shares of beneficial interest of $0.001 par value (unlimited number authorized) | | $ | 192 | | | $ | 1 | |
Paid in capital | | | 2,242,555 | | | | 8,922 | |
Undistributed (overdistributed) net investment income | | | (28,707 | ) | | | 7 | |
Accumulated undistributed net realized gain (loss) | | | 108,815 | | | | 94 | |
Net unrealized appreciation (depreciation) | | | 30,918 | | | | 46 | |
| | | $ | 2,353,773 | | | $ | 9,070 | |
| | |
Shares Issued and Outstanding | | | 191,507 | | | | 889 | |
| | |
Net Asset Value, Offering Price and Redemption Price Per Share | | $ | 12.29 | | | $ | 10.20 | |
| | |
Cost of Investments in Securities | | $ | 2,609,187 | | | $ | 13,141 | |
| | |
Cost of Foreign Currency Held | | $ | 2,706 | | | $ | 15 | |
| | |
Proceeds Received on Short Sales | | $ | 0 | | | $ | 152 | |
| | |
Cost or Premiums of Financial Derivative Instruments, net | | $ | 547 | | | $ | (9 | ) |
| | |
* Includes repurchase agreements of: | | $ | 40,894 | | | $ | 0 | |
| | | | | | |
| 24 | | PIMCO MANAGED ACCOUNTS TRUST | | | | See Accompanying Notes |
| | | | | | | | | | |
| Series M | | | Series R | | | Series TE | |
| | | | | | | | | | |
| | | | | | | | | | | |
| $ | 3,327,262 | | | $ | 344,456 | | | $ | 95,385 | |
| | | | | | | | | | | |
| | 0 | | | | 194 | | | | 112 | |
| | 8,766 | | | | 4,434 | | | | 0 | |
| | 368 | | | | 1 | | | | 717 | |
| | 1,079 | | | | 1,609 | | | | 126 | |
| | 1,326 | | | | 1,019 | | | | 0 | |
| | 1,336,802 | | | | 12,096 | | | | 0 | |
| | 311 | | | | 66 | | | | 0 | |
| | 28,276 | | | | 1,662 | | | | 1,246 | |
| | 105 | | | | 11 | | | | 0 | |
| | 4,704,295 | | | | 365,548 | | | | 97,586 | |
| | |
| | | | | | | | | | |
| | | | | | | | | | | |
| $ | 380,038 | | | $ | 11,349 | | | $ | 0 | |
| | 0 | | | | 131,382 | | | | 0 | |
| | 55,425 | | | | 0 | | | | 0 | |
| | | | | | | | | | | |
| | 50 | | | | 248 | | | | 0 | |
| | 11,134 | | | | 6,041 | | | | 0 | |
| | 1,896,212 | | | | 0 | | | | 1,537 | |
| | 6,365 | | | | 628 | | | | 0 | |
| | 13,633 | | | | 149 | | | | 0 | |
| | 9,237 | | | | 80 | | | | 208 | |
| | 0 | | | | 0 | | | | 0 | |
| | 2,372,094 | | | | 149,877 | | | | 1,745 | |
| | |
| $ | 2,332,201 | | | $ | 215,671 | | | $ | 95,841 | |
| | |
| | | | | | | | | | |
$ |
216 |
| | $ | 21 | | | $ | 10 | |
| | 2,203,307 | | | | 236,316 | | | | 95,240 | |
| | 5,074 | | | | 6,379 | | | | 66 | |
| | 54,483 | | | | (19,913 | ) | | | (957 | ) |
| | 69,121 | | | | (7,132 | ) | | | 1,482 | |
| $ | 2,332,201 | | | $ | 215,671 | | | $ | 95,841 | |
| | |
| | 216,276 | | | | 20,598 | | | | 9,677 | |
| | |
| $ | 10.78 | | | $ | 10.47 | | | $ | 9.90 | |
| | |
| $ | 3,253,128 | | | $ | 350,830 | | | $ | 92,375 | |
| | |
| $ | 1,342 | | | $ | 1,026 | | | $ | 0 | |
| | |
| $ | 55,425 | | | $ | 0 | | | $ | 0 | |
| | |
| $ | (1,114 | ) | | $ | (1,039 | ) | | $ | 0 | |
| | |
| $ | 110,775 | | | $ | 153 | | | $ | 1,300 | |
| | | | | | |
| | ANNUAL REPORT | | OCTOBER 31, 2014 | | 25 |
Statements of Operations PIMCO Fixed Income SHares
| | | | | | | | |
| Year Ended October 31, 2014 | | | | | | |
| (Amounts in thousands) | | Series C | | | Series LD (1) | |
| | |
Investment Income: | | | | | | | | |
Interest | | $ | 123,361 | | | $ | 148 | |
Miscellaneous income | | | 1 | | | | 0 | |
Total Income | | | 123,362 | | | | 148 | |
| | |
Expenses: | | | | | | | | |
Interest expense | | | 338 | | | | 6 | |
Total Expenses | | | 338 | | | | 6 | |
| | |
Net Investment Income | | | 123,024 | | | | 142 | |
| | |
Net Realized Gain (Loss): | | | | | | | | |
Investments in securities | | | 43,667 | | | | 57 | |
Exchange-traded or centrally cleared financial derivative instruments | | | 4,159 | | | | (2 | ) |
Over the counter financial derivative instruments | | | 63,502 | | | | 63 | |
Foreign currency | | | (1,272 | ) | | | 6 | |
Net Realized Gain (Loss) | | | 110,056 | | | | 124 | |
| | |
Net Change in Unrealized Appreciation (Depreciation): | | | | | | | | |
Investments in securities | | | (104,774 | ) | | | 45 | |
Exchange-traded or centrally cleared financial derivative instruments | | | (34,936 | ) | | | (12 | ) |
Over the counter financial derivative instruments | | | 38,617 | | | | 13 | |
Foreign currency assets and liabilities | | | 1,308 | | | | 0 | |
Net Change in Unrealized Appreciation (Depreciation) | | | (99,785 | ) | | | 46 | |
Net Gain (Loss) | | | 10,271 | | | | 170 | |
| | |
Net Increase in Net Assets Resulting from Operations | | $ | 133,295 | | | $ | 312 | |
| (1) | Period from December 23, 2013 to October 31, 2014. |
| | | | | | |
| 26 | | PIMCO MANAGED ACCOUNTS TRUST | | | | See Accompanying Notes |
| | | | | | | | | | |
| | | | | | | | |
| Series M | | | Series R | | | Series TE | |
| | |
| | | | | | | | | | |
| $ | 117,346 | | | $ | 9,450 | | | $ | 2,301 | |
| | 0 | | | | 0 | | | | 0 | |
| | 117,346 | | | | 9,450 | | | | 2,301 | |
| | |
| | | | | | | | | | |
| | 1,146 | | | | 177 | | | | 0 | |
| | 1,146 | | | | 177 | | | | 0 | |
| | |
| | 116,200 | | | | 9,273 | | | | 2,301 | |
| | |
| | | | | | | | | | |
| | 99,840 | | | | (1,618 | ) | | | 38 | |
| | (76,151 | ) | | | (858 | ) | | | (1,029 | ) |
| | 36,055 | | | | 8,106 | | | | 0 | |
| | (414 | ) | | | (339 | ) | | | 0 | |
| | 59,330 | | | | 5,291 | | | | (991 | ) |
| | |
| | | | | | | | | | |
| | (44,986 | ) | | | (2,127 | ) | | | 4,702 | |
| | 15,078 | | | | (5,595 | ) | | | (1,528 | ) |
| | (9,893 | ) | | | 1,816 | | | | 0 | |
| | (420 | ) | | | (63 | ) | | | 0 | |
| | (40,221 | ) | | | (5,969 | ) | | | 3,174 | |
| | 19,109 | | | | (678 | ) | | | 2,183 | |
| | |
| $ | 135,309 | | | $ | 8,595 | | | $ | 4,484 | |
| | | | | | |
| | ANNUAL REPORT | | OCTOBER 31, 2014 | | 27 |
Statements of Changes in Net Assets PIMCO Fixed Income SHares
| | | | | | | | | | | | |
| | | Series C | | | Series LD | |
| (Amounts in thousands) | | Year Ended
October 31, 2014 | | | Year Ended
October 31, 2013 | | | Period from
December 23, 2013 to
October 31, 2014 | |
Increase (Decrease) in Net Assets from: | | | | | | | | | | | | |
| | | |
Operations: | | | | | | | | | | | | |
Net investment income | | $ | 123,024 | | | $ | 171,735 | | | $ | 142 | |
Net realized gain (loss) | | | 110,056 | | | | 247,852 | | | | 124 | |
Net change in unrealized appreciation (depreciation) | | | (99,785 | ) | | | (318,537 | ) | | | 46 | |
Net increase (decrease) resulting from operations | | | 133,295 | | | | 101,050 | | | | 312 | |
| | | |
Distributions to Shareholders: | | | | | | | | | | | | |
From net investment income | | | (132,768 | ) | | | (252,692 | ) | | | (166 | ) |
From net realized capital gains | | | (205,508 | ) | | | (28,713 | ) | | | 0 | |
| | | |
Total Distributions | | | (338,276 | ) | | | (281,405 | ) | | | (166 | ) |
| | | |
Portfolio Share Transactions: | | | | | | | | | | | | |
Receipts for shares sold | | | 829,579 | | | | 1,005,090 | | | | 11,062 | |
Cost of shares redeemed | | | (1,531,875 | ) | | | (1,582,527 | ) | | | (2,138 | ) |
Net increase (decrease) resulting from Portfolio share transactions | | | (702,296 | ) | | | (577,437 | ) | | | 8,924 | |
| | | |
Total Increase (Decrease) in Net Assets | | | (907,277 | ) | | | (757,792 | ) | | | 9,070 | |
| | | |
Net Assets: | | | | | | | | | | | | |
Beginning of year | | | 3,261,050 | | | | 4,018,842 | | | | 0 | |
End of year* | | $ | 2,353,773 | | | $ | 3,261,050 | | | $ | 9,070 | |
| | | |
* Including undistributed (overdistributed) net investment income of: | | $ | (28,707 | ) | | $ | 10,569 | | | $ | 7 | |
| | | |
Shares of Beneficial Interest: | | | | | | | | | | | | |
Shares Sold | | | 66,880 | | | | 75,595 | | | | 1,099 | |
Shares Redeemed | | | (124,067 | ) | | | (119,237 | ) | | | (210 | ) |
Net increase (decrease) in shares outstanding | | | (57,187 | ) | | | (43,642 | ) | | | 889 | |
| | | | | | |
| 28 | | PIMCO MANAGED ACCOUNTS TRUST | | | | See Accompanying Notes |
| | | | | | | | | | | | | | | | | | | | | | |
| Series M | | | Series R | | | Series TE | |
Year Ended
October 31, 2014 | | | Year Ended
October 31, 2013 | | | Year Ended
October 31, 2014 | | | Year Ended
October 31, 2013 | | | Year Ended
October 31, 2014 | | | Year Ended
October 31, 2013 | |
| | | | | | | | | | | | | | | | | | | | | | |
| | | | | |
| | | | | | | | | | | | | | | | | | | | | | |
| $ | 116,200 | | | $ | 116,509 | | | $ | 9,273 | | | $ | 10,726 | | | $ | 2,301 | | | $ | 903 | |
| | 59,330 | | | | 129,622 | | | | 5,291 | | | | 2,649 | | | | (991 | ) | | | (91 | ) |
| | (40,221 | ) | | | (209,795 | ) | | | (5,969 | ) | | | (42,389 | ) | | | 3,174 | | | | (1,734 | ) |
| | 135,309 | | | | 36,336 | | | | 8,595 | | | | (29,014 | ) | | | 4,484 | | | | (922 | ) |
| | | | | |
| | | | | | | | | | | | | | | | | | | | | | |
| | (105,630 | ) | | | (153,920 | ) | | | (4,386 | ) | | | (10,835 | ) | | | (2,105 | ) | | | (903 | ) |
| | (50,578 | ) | | | 0 | | | | (7,339 | ) | | | (34,897 | ) | | | 0 | | | | 0 | |
| | | | | |
| | (156,208 | ) | | | (153,920 | ) | | | (11,725 | ) | | | (45,732 | ) | | | (2,105 | ) | | | (903 | ) |
| | | | | |
| | | | | | | | | | | | | | | | | | | | | | |
| | 781,102 | | | | 954,104 | | | | 40,368 | | | | 183,493 | | | | 44,664 | | | | 70,209 | |
| | (1,424,932 | ) | | | (1,827,599 | ) | | | (171,726 | ) | | | (361,307 | ) | | | (16,796 | ) | | | (12,240 | ) |
| | | | | |
| | (643,830 | ) | | | (873,495 | ) | | | (131,358 | ) | | | (177,814 | ) | | | 27,868 | | | | 57,969 | |
| | | | | |
| | (664,729 | ) | | | (991,079 | ) | | | (134,488 | ) | | | (252,560 | ) | | | 30,247 | | | | 56,144 | |
| | | | | |
| | | | | | | | | | | | | | | | | | | | | | |
| | 2,996,930 | | | | 3,988,009 | | | | 350,159 | | | | 602,719 | | | | 65,594 | | | | 9,450 | |
| $ | 2,332,201 | | | $ | 2,996,930 | | | $ | 215,671 | | | $ | 350,159 | | | $ | 95,841 | | | $ | 65,594 | |
| | | | | |
| $ | 5,074 | | | $ | (1,252 | ) | | $ | 6,379 | | | $ | (1,154 | ) | | $ | 66 | | | $ | 0 | |
| | | | | |
| | | | | | | | | | | | | | | | | | | | | | |
| | 72,731 | | | | 86,882 | | | | 3,921 | | | | 16,265 | | | | 4,601 | | | | 7,126 | |
| | (132,447 | ) | | | (166,387 | ) | | | (16,606 | ) | | | (33,505 | ) | | | (1,729 | ) | | | (1,268 | ) |
| | (59,716 | ) | | | (79,505 | ) | | | (12,685 | ) | | | (17,240 | ) | | | 2,872 | | | | 5,858 | |
| | | | | | |
| | ANNUAL REPORT | | OCTOBER 31, 2014 | | 29 |
Statement of Cash Flows PIMCO Fixed Income SHares
| | | | | | | | | | | | |
Year Ended October 31, 2014 (Amounts in thousands) | | Series LD (1) | | | Series M | | | Series R | |
Cash flows provided by (used for) operating activities: | | | | | | | | | | | | |
| | | |
Net increase in net assets resulting from operations | | $ | 312 | | | $ | 135,309 | | | $ | 8,595 | |
| | | |
Adjustments to reconcile net increase in net assets from operations to net cash provided by (used for) operating activities: | | | | | | | | | | | | |
Purchases of long-term securities | | | (799,308 | ) | | | (26,661,906 | ) | | | (342,970 | ) |
Proceeds from sales of long-term securities | | | 755,478 | | | | 27,563,569 | | | | 528,429 | |
(Purchases) Proceeds from sales of short-term portfolio investments, net | | | 30,650 | | | | (278,050 | ) | | | (24,599 | ) |
(Increase) decrease in deposits with counterparty | | | (45 | ) | | | 41,342 | | | | 457 | |
(Increase) decrease in receivable for investments sold | | | (152 | ) | | | (1,101,452 | ) | | | 1,489 | |
(Increase) decrease in interest receivable | | | (99 | ) | | | (6,217 | ) | | | 413 | |
(Increase) in exchange-traded or centrally cleared derivatives | | | (18 | ) | | | (57,849 | ) | | | (6,244 | ) |
Decrease in over the counter derivatives | | | 72 | | | | 10,311 | | | | 7,876 | |
Increase (decrease) in payable for investments purchased | | | 115 | | | | 722,000 | | | | (9,814 | ) |
Increase in deposits from counterparty | | | 0 | | | | 20 | | | | 534 | |
Proceeds from short sales transactions, net | | | 152 | | | | 55,425 | | | | 0 | |
Proceeds from (Payments on) currency transactions | | | 6 | | | | (834 | ) | | | (402 | ) |
Net Realized (Gain) Loss | | | | | | | | | | | | |
Investments in securities | | | (57 | ) | | | (97,702 | ) | | | (1,623 | ) |
Exchange-traded or centrally cleared financial derivative instruments | | | 2 | | | | 76,151 | | | | 858 | |
Over the counter financial derivative instruments | | | (63 | ) | | | (36,055 | ) | | | (8,106 | ) |
Foreign currency | | | (6 | ) | | | 414 | | | | 339 | |
Net Change in Unrealized (Appreciation) Depreciation | | | | | | | | | | | | |
Investments in securities | | | (45 | ) | | | 42,848 | | | | 5,368 | |
Exchange-traded or centrally cleared financial derivative instruments | | | 12 | | | | (15,078 | ) | | | 5,595 | |
Over the counter financial derivative instruments | | | (13 | ) | | | 9,893 | | | | (1,816 | ) |
Foreign currency assets and liabilities | | | 0 | | | | 420 | | | | 63 | |
Net amortization (accretion) on investments | | | 96 | | | | 9,862 | | | | 1,653 | |
Net cash provided by (used for) operating activities | | | (12,911 | ) | | | 412,421 | | | | 166,095 | |
| | | |
Cash flows received from (used for) financing activities: | | | | | | | | | | | | |
Proceeds from shares sold | | | 11,062 | | | | 785,775 | | | | 40,850 | |
Payments on shares redeemed | | | (2,138 | ) | | | (1,414,410 | ) | | | (171,733 | ) |
(Decrease) in overdraft due to custodian | | | 0 | | | | (39 | ) | | | 0 | |
Cash dividend paid | | | (138 | ) | | | (156,086 | ) | | | (12,160 | ) |
Proceeds from reverse repurchase agreements | | | 35,585 | | | | 18,872,751 | | | | 39,826 | |
Payments on reverse repurchase agreements | | | (31,184 | ) | | | (18,492,713 | ) | | | (123,377 | ) |
Proceeds from sale-buyback transactions | | | 2,590 | | | | 6,457,930 | | | | 2,545,286 | |
Payments on sale-buyback transactions | | | (2,590 | ) | | | (6,457,930 | ) | | | (2,482,815 | ) |
Proceeds from deposits from counterparty | | | 0 | | | | 145,661 | | | | 5,370 | |
Payments on deposits from counterparty | | | 0 | | | | (153,400 | ) | | | (6,720 | ) |
Net cash received from (used for) financing activities | | | 13,187 | | | | (412,461 | ) | | | (165,473 | ) |
Net Increase (Decrease) in Cash and Foreign Currency | | | 276 | | | | (40 | ) | | | 622 | |
| | | |
Cash and Foreign Currency: | | | | | | | | | | | | |
Beginning of year | | | 0 | | | | 1,734 | | | | 398 | |
End of year | | $ | 276 | | | $ | 1,694 | | | $ | 1,020 | |
| | | |
Supplemental disclosure of cash flow information: | | | | | | | | | | | | |
Interest expense paid during the year | | $ | 5 | | | $ | 1,045 | | | $ | 130 | |
| (1) | Period from December 23, 2013 to October 31, 2014. |
| | | | | | |
| 30 | | PIMCO MANAGED ACCOUNTS TRUST | | | | See Accompanying Notes |
Schedule of Investments PIMCO Fixed Income SHares: Series C
October 31, 2014
| | | | | | | | | | | | |
| | | | | PRINCIPAL
AMOUNT
(000S) | | | | | MARKET
VALUE
(000S) | |
| INVESTMENTS IN SECURITIES 112.8% | |
| | | | | | | | | | | | |
| CORPORATE BONDS & NOTES 71.0% | |
| | | | | | | | | | | | |
| BANKING & FINANCE 36.3% | |
Ally Financial, Inc. | |
4.625% due 06/26/2015 | | $ | | | 800 | | | $ | | | 818 | |
6.250% due 12/01/2017 | | | | | 300 | | | | | | 328 | |
7.500% due 09/15/2020 | | | | | 11,566 | | | | | | 13,792 | |
8.000% due 03/15/2020 | | | | | 2,136 | | | | | | 2,574 | |
8.300% due 02/12/2015 | | | | | 200 | | | | | | 204 | |
American International Group, Inc. | |
4.875% due 06/01/2022 | | | | | 3,000 | | | | | | 3,350 | |
5.850% due 01/16/2018 | | | | | 30,300 | | | | | | 34,172 | |
6.765% due 11/15/2017 | | GBP | | | 1,456 | | | | | | 2,649 | |
Banco do Brasil S.A. | |
4.500% due 01/22/2015 (e) | | $ | | | 25,200 | | | | | | 25,389 | |
4.500% due 01/20/2016 | | EUR | | | 8,700 | | | | | | 11,311 | |
Banco Santander Brasil S.A. | |
4.250% due 01/14/2016 | | $ | | | 4,250 | | | | | | 4,388 | |
4.500% due 04/06/2015 | | | | | 4,500 | | | | | | 4,566 | |
4.625% due 02/13/2017 | | | | | 11,375 | | | | | | 11,901 | |
Bank of America Corp. | |
4.000% due 04/01/2024 | | | | | 500 | | | | | | 517 | |
4.100% due 07/24/2023 | | | | | 5,600 | | | | | | 5,850 | |
6.400% due 08/28/2017 | | | | | 14,750 | | | | | | 16,628 | |
6.875% due 04/25/2018 | | | | | 66,155 | | | | | | 76,586 | |
Banque PSA Finance S.A. | |
3.875% due 01/14/2015 | | EUR | | | 700 | | | | | | 883 | |
Barclays Bank PLC | |
7.625% due 11/21/2022 | | $ | | | 1,200 | | | | | | 1,309 | |
7.750% due 04/10/2023 | | | | | 2,400 | | | | | | 2,634 | |
BBVA Banco Continental S.A. | |
3.250% due 04/08/2018 | | | | | 3,000 | | | | | | 3,067 | |
Bear Stearns Cos. LLC | |
7.250% due 02/01/2018 | | | | | 17,265 | | | | | | 20,085 | |
Blackstone CQP Holdco LP | |
9.296% due 03/18/2019 | | | | | 10,109 | | | | | | 10,151 | |
BPCE S.A. | |
4.500% due 03/15/2025 | | | | | 27,400 | | | | | | 26,657 | |
BPE Financiaciones S.A. | |
2.875% due 05/19/2016 | | EUR | | | 1,000 | | | | | | 1,279 | |
CIT Group, Inc. | |
3.875% due 02/19/2019 | | $ | | | 900 | | | | | | 908 | |
4.250% due 08/15/2017 | | | | | 1,000 | | | | | | 1,030 | |
Citigroup, Inc. | |
6.000% due 08/15/2017 | | | | | 6,718 | | | | | | 7,501 | |
6.125% due 11/21/2017 | | | | | 13,500 | | | | | | 15,193 | |
Cooperatieve Centrale Raiffeisen-Boerenleenbank BA | |
8.375% due 07/26/2016 (c) | | | | | 25,653 | | | | | | 27,577 | |
8.400% due 06/29/2017 (c) | | | | | 4,240 | | | | | | 4,675 | |
| | | | | | | | | | | | |
| | | | | PRINCIPAL
AMOUNT
(000S) | | | | | MARKET
VALUE
(000S) | |
Credit Agricole S.A. | |
8.125% due 09/19/2033 | | $ | | | 200 | | | $ | | | 227 | |
Doric Nimrod Air Finance Alpha Ltd. Pass-Through Trust | |
5.125% due 11/30/2024 | | | | | 10,155 | | | | | | 10,704 | |
Ford Motor Credit Co. LLC | |
5.875% due 08/02/2021 | | | | | 600 | | | | | | 694 | |
8.000% due 12/15/2016 | | | | | 7,900 | | | | | | 8,963 | |
8.125% due 01/15/2020 | | | | | 22,700 | | | | | | 28,400 | |
General Motors Financial Co., Inc. | |
3.000% due 09/25/2017 | | | | | 17,000 | | | | | | 17,361 | |
4.250% due 05/15/2023 | | | | | 21,570 | | | | | | 22,271 | |
GMAC International Finance BV | |
7.500% due 04/21/2015 | | EUR | | | 8,700 | | | | | | 11,198 | |
Goldman Sachs Group, Inc. | |
4.000% due 03/03/2024 | | $ | | | 16,700 | | | | | | 17,078 | |
6.150% due 04/01/2018 | | | | | 15,200 | | | | | | 17,184 | |
HBOS PLC | |
6.750% due 05/21/2018 | | | | | 25,300 | | | | | | 28,459 | |
HSBC Holdings PLC | |
6.375% due 09/17/2024 (c) | | | | | 1,200 | | | | | | 1,225 | |
Hypo Alpe-Adria-Bank International AG | |
2.750% due 08/12/2015 | | CHF | | | 200 | | | | | | 193 | |
4.250% due 10/31/2016 | | EUR | | | 600 | | | | | | 635 | |
4.375% due 01/24/2017 | | | | | 600 | | | | | | 631 | |
ICICI Bank Ltd. | |
4.750% due 11/25/2016 | | $ | | | 5,900 | | | | | | 6,204 | |
5.000% due 01/15/2016 | | | | | 2,500 | | | | | | 2,595 | |
5.500% due 03/25/2015 | | | | | 700 | | | | | | 712 | |
International Lease Finance Corp. | |
5.875% due 04/01/2019 | | | | | 1,400 | | | | | | 1,514 | |
6.750% due 09/01/2016 | | | | | 4,000 | | | | | | 4,260 | |
7.125% due 09/01/2018 | | | | | 3,000 | | | | | | 3,405 | |
JPMorgan Chase & Co. | |
6.000% due 01/15/2018 | | | | | 14,800 | | | | | | 16,690 | |
6.125% due 04/30/2024 (c) | | | | | 4,200 | | | | | | 4,210 | |
Korea Development Bank | |
3.875% due 05/04/2017 | | | | | 7,500 | | | | | | 7,921 | |
4.000% due 09/09/2016 | | | | | 3,950 | | | | | | 4,148 | |
Korea Exchange Bank | |
4.875% due 01/14/2016 | | | | | 900 | | | | | | 938 | |
LBG Capital PLC | |
7.375% due 03/12/2020 | | EUR | | | 2,825 | | | | | | 3,816 | |
9.000% due 12/15/2019 | | GBP | | | 2,331 | | | | | | 3,962 | |
15.000% due 12/21/2019 | | EUR | | | 4,380 | | | | | | 8,115 | |
15.000% due 12/21/2019 | | GBP | | | 1,100 | | | | | | 2,464 | |
Lloyds Bank PLC | |
9.875% due 12/16/2021 | | $ | | | 177 | | | | | | 204 | |
11.875% due 12/16/2021 | | EUR | | | 1,448 | | | | | | 2,212 | |
12.000% due 12/16/2024 (c) | | $ | | | 29,300 | | | | | | 42,705 | |
13.000% due 12/19/2021 | | AUD | | | 200 | | | | | | 206 | |
| | | | | | |
| See Accompanying Notes | | ANNUAL REPORT | | OCTOBER 31, 2014 | | 31 |
Schedule of Investments PIMCO Fixed Income SHares: Series C (Cont.)
| | | | | | | | | | | | |
| | | | | PRINCIPAL
AMOUNT
(000S) | | | | | MARKET
VALUE
(000S) | |
Lloyds Banking Group PLC | |
7.500% due 06/27/2024 (c) | | $ | | | 3,604 | | | $ | | | 3,757 | |
MetLife Capital Trust | |
7.875% due 12/15/2067 | | | | | 600 | | | | | | 769 | |
Morgan Stanley | |
5.375% due 10/15/2015 | | | | | 2,800 | | | | | | 2,924 | |
5.500% due 07/28/2021 | | | | | 9,500 | | | | | | 10,844 | |
5.750% due 01/25/2021 | | | | | 100 | | | | | | 115 | |
5.950% due 12/28/2017 | | | | | 900 | | | | | | 1,012 | |
6.625% due 04/01/2018 | | | | | 3,700 | | | | | | 4,240 | |
Navient Corp. | |
5.500% due 01/15/2019 | | | | | 1,500 | | | | | | 1,559 | |
6.250% due 01/25/2016 (e) | | | | | 36,000 | | | | | | 37,530 | |
7.250% due 01/25/2022 (e) | | | | | 17,700 | | | | | | 19,824 | |
8.000% due 03/25/2020 | | | | | 1,100 | | | | | | 1,265 | |
8.450% due 06/15/2018 (e) | | | | | 20,455 | | | | | | 23,452 | |
Preferred Term Securities Ltd. | |
0.785% due 03/24/2034 | | | | | 366 | | | | | | 296 | |
Qatari Diar Finance Co. | |
5.000% due 07/21/2020 | | | | | 1,500 | | | | | | 1,695 | |
QNB Finance Ltd. | |
3.125% due 11/16/2015 | | | | | 500 | | | | | | 512 | |
Royal Bank of Scotland Group PLC | |
7.648% due 09/30/2031 (c) | | | | | 5,000 | | | | | | 5,906 | |
Russian Agricultural Bank OJSC Via RSHB Capital S.A. | |
5.100% due 07/25/2018 | | | | | 9,700 | | | | | | 9,385 | |
6.299% due 05/15/2017 | | | | | 6,080 | | | | | | 6,126 | |
Sberbank of Russia Via SB Capital S.A. | |
4.950% due 02/07/2017 | | | | | 14,000 | | | | | | 14,105 | |
5.400% due 03/24/2017 | | | | | 11,000 | | | | | | 11,188 | |
Springleaf Finance Corp. | |
5.400% due 12/01/2015 | | | | | 100 | | | | | | 104 | |
6.900% due 12/15/2017 | | | | | 14,000 | | | | | | 15,295 | |
State Bank of India | |
4.500% due 07/27/2015 | | | | | 1,000 | | | | | | 1,024 | |
Temasek Financial Ltd. | |
2.375% due 01/23/2023 | | | | | 3,000 | | | | | | 2,913 | |
UBS AG | |
4.750% due 02/12/2026 | | EUR | | | 400 | | | | | | 530 | |
7.250% due 02/22/2022 | | $ | | | 200 | | | | | | 217 | |
Virgin Media Secured Finance PLC | |
6.000% due 04/15/2021 | | GBP | | | 10,400 | | | | | | 17,470 | |
Vnesheconombank Via VEB Finance PLC | |
5.375% due 02/13/2017 | | $ | | | 6,400 | | | | | | 6,440 | |
5.450% due 11/22/2017 | | | | | 2,700 | | | | | | 2,710 | |
Wells Fargo & Co. | |
3.450% due 02/13/2023 | | | | | 4,700 | | | | | | 4,690 | |
7.980% due 03/15/2018 (c) | | | | | 19,217 | | | | | | 21,118 | |
Weyerhaeuser Co. | |
7.375% due 10/01/2019 | | | | | 5,000 | | | | | | 6,061 | |
| | | | | | | | | | | | |
| | | | | | | | | | | 854,552 | |
| | | | | | | | | | | | |
| | | | | | | | | | | | |
| | | | | PRINCIPAL
AMOUNT
(000S) | | | | | MARKET
VALUE
(000S) | |
| INDUSTRIALS 21.5% | |
Alliance Data Systems Corp. | |
5.250% due 12/01/2017 | | $ | | | 12,750 | | | $ | | | 13,196 | |
America Movil S.A.B. de C.V. | |
5.000% due 03/30/2020 (e) | | | | | 42,800 | | | | | | 47,395 | |
6.125% due 03/30/2040 | | | | | 5,530 | | | | | | 6,669 | |
Amgen, Inc. | |
5.700% due 02/01/2019 | | | | | 1,700 | | | | | | 1,926 | |
Anglo American Capital PLC | |
4.125% due 09/27/2022 | | | | | 12,800 | | | | | | 12,769 | |
Axiata SPV Labuan Ltd. | |
5.375% due 04/28/2020 | | | | | 1,000 | | | | | | 1,106 | |
Brunswick Rail Finance Ltd. | |
6.500% due 11/01/2017 | | | | | 2,800 | | | | | | 2,513 | |
Canadian Oil Sands Ltd. | |
7.750% due 05/15/2019 | | | | | 10,400 | | | | | | 12,529 | |
CSC Holdings LLC | |
7.625% due 07/15/2018 | | | | | 7,850 | | | | | | 8,920 | |
7.875% due 02/15/2018 | | | | | 810 | | | | | | 918 | |
8.625% due 02/15/2019 | | | | | 7,500 | | | | | | 8,831 | |
CSN Islands Corp. | |
6.875% due 09/21/2019 | | | | | 100 | | | | | | 106 | |
Delta Air Lines Pass-Through Trust | |
4.950% due 11/23/2020 | | | | | 363 | | | | | | 386 | |
6.200% due 01/02/2020 | | | | | 332 | | | | | | 369 | |
Deutsche Telekom International Finance BV | |
6.750% due 08/20/2018 | | | | | 3,400 | | | | | | 3,983 | |
DISH DBS Corp. | |
5.000% due 03/15/2023 | | | | | 14,842 | | | | | | 14,823 | |
5.875% due 07/15/2022 | | | | | 300 | | | | | | 319 | |
7.125% due 02/01/2016 | | | | | 4,200 | | | | | | 4,478 | |
Ecopetrol S.A. | |
5.875% due 09/18/2023 (e) | | | | | 14,650 | | | | | | 16,371 | |
7.625% due 07/23/2019 (e) | | | | | 32,270 | | | | | | 38,643 | |
Encana Corp. | |
5.900% due 12/01/2017 | | | | | 2,000 | | | | | | 2,246 | |
Energy Transfer Partners LP | |
6.125% due 02/15/2017 | | | | | 2,100 | | | | | | 2,308 | |
9.700% due 03/15/2019 | | | | | 300 | | | | | | 385 | |
Georgia-Pacific LLC | |
5.400% due 11/01/2020 | | | | | 9,300 | | | | | | 10,639 | |
Gerdau Trade, Inc. | |
5.750% due 01/30/2021 | | | | | 800 | | | | | | 854 | |
Glencore Finance Canada Ltd. | |
5.800% due 11/15/2016 | | | | | 7,400 | | | | | | 8,009 | |
Gold Fields Orogen Holding BVI Ltd. | |
4.875% due 10/07/2020 | | | | | 5,000 | | | | | | 4,475 | |
GTL Trade Finance, Inc. | |
5.893% due 04/29/2024 | | | | | 13,189 | | | | | | 13,717 | |
HCA, Inc. | |
7.250% due 09/15/2020 | | | | | 3,200 | | | | | | 3,400 | |
| | | | | | |
| 32 | | PIMCO MANAGED ACCOUNTS TRUST | | | | See Accompanying Notes |
October 31, 2014
| | | | | | | | | | | | |
| | | | | PRINCIPAL
AMOUNT
(000S) | | | | | MARKET
VALUE
(000S) | |
Hospira, Inc. | |
6.050% due 03/30/2017 | | $ | | | 1,700 | | | $ | | | 1,857 | |
Hutchison Whampoa International Ltd. | |
5.750% due 09/11/2019 | | | | | 100 | | | | | | 115 | |
7.625% due 04/09/2019 | | | | | 1,000 | | | | | | 1,219 | |
Kern River Funding Corp. | |
4.893% due 04/30/2018 | | | | | 645 | | | | | | 700 | |
Kinder Morgan Energy Partners LP | |
3.950% due 09/01/2022 | | | | | 1,000 | | | | | | 999 | |
6.000% due 02/01/2017 | | | | | 5,800 | | | | | | 6,354 | |
Kinder Morgan, Inc. | |
7.000% due 06/15/2017 | | | | | 1,789 | | | | | | 1,999 | |
7.250% due 06/01/2018 | | | | | 13,900 | | | | | | 15,916 | |
NBCUniversal Media LLC | |
4.375% due 04/01/2021 | | | | | 15,600 | | | | | | 17,156 | |
Northwest Airlines Pass-Through Trust | |
7.041% due 10/01/2023 | | | | | 1,152 | | | | | | 1,348 | |
7.150% due 04/01/2021 | | | | | 26,691 | | | | | | 29,960 | |
Northwest Pipeline LLC | |
7.000% due 06/15/2016 | | | | | 1,700 | | | | | | 1,866 | |
Numericable Group S.A. | |
5.375% due 05/15/2022 | | EUR | | | 700 | | | | | | 913 | |
Petrobras International Finance Co. S.A. | |
5.375% due 01/27/2021 | | $ | | | 28,200 | | | | | | 29,014 | |
5.875% due 03/01/2018 | | | | | 300 | | | | | | 323 | |
7.875% due 03/15/2019 | | | | | 17,500 | | | | | | 20,155 | |
Petrofac Ltd. | |
3.400% due 10/10/2018 | | | | | 1,200 | | | | | | 1,237 | |
Petroleos de Venezuela S.A. | |
5.250% due 04/12/2017 | | | | | 31,290 | | | | | | 20,902 | |
5.500% due 04/12/2037 | | | | | 12,300 | | | | | | 5,781 | |
8.500% due 11/02/2017 | | | | | 18,600 | | | | | | 14,134 | |
Phosagro OAO Via Phosagro Bond Funding Ltd. | |
4.204% due 02/13/2018 | | | | | 4,300 | | | | | | 4,160 | |
Reliance Holdings USA, Inc. | |
4.500% due 10/19/2020 | | | | | 1,800 | | | | | | 1,894 | |
Reynolds American, Inc. | |
7.750% due 06/01/2018 | | | | | 6,030 | | | | | | 7,152 | |
Rockies Express Pipeline LLC | |
5.625% due 04/15/2020 | | | | | 100 | | | | | | 105 | |
Russian Railways Via RZD Capital PLC | |
5.739% due 04/03/2017 | | | | | 11,300 | | | | | | 11,696 | |
SCF Capital Ltd. | |
5.375% due 10/27/2017 | | | | | 1,100 | | | | | | 1,051 | |
Severstal OAO Via Steel Capital S.A. | |
4.450% due 03/19/2018 | | | | | 12,000 | | | | | | 11,671 | |
6.700% due 10/25/2017 | | | | | 500 | | | | | | 519 | |
Sibur Securities Ltd. | |
3.914% due 01/31/2018 | | | | | 4,400 | | | | | | 4,109 | |
Tate & Lyle International Finance PLC | |
6.625% due 06/15/2016 | | | | | 1,100 | | | | | | 1,197 | |
| | | | | | | | | | | | |
| | | | | PRINCIPAL
AMOUNT
(000S) | | | | | MARKET
VALUE
(000S) | |
Tennessee Gas Pipeline Co. LLC | |
7.500% due 04/01/2017 | | $ | | | 1,950 | | | $ | | | 2,217 | |
TransCanada PipeLines Ltd. | |
3.800% due 10/01/2020 | | | | | 1,100 | | | | | | 1,155 | |
Tullow Oil PLC | |
6.000% due 11/01/2020 | | | | | 3,900 | | | | | | 3,666 | |
Tyco Electronics Group S.A. | |
6.550% due 10/01/2017 | | | | | 5,000 | | | | | | 5,697 | |
UAL Pass-Through Trust | |
9.750% due 07/15/2018 | | | | | 1,403 | | | | | | 1,557 | |
10.400% due 05/01/2018 | | | | | 1,594 | | | | | | 1,761 | |
UAL Pass-Through Trust AB | |
10.125% due 03/22/2015 ^ | | | | | 35 | | | | | | 20 | |
USG Corp. | |
9.750% due 01/15/2018 | | | | | 2,407 | | | | | | 2,786 | |
Vale Overseas Ltd. | |
4.375% due 01/11/2022 | | | | | 2,590 | | | | | | 2,644 | |
8.250% due 01/17/2034 | | | | | 1,000 | | | | | | 1,273 | |
Vimpel Communications Via VIP Finance Ireland Ltd. OJSC | |
9.125% due 04/30/2018 | | | | | 3,000 | | | | | | 3,266 | |
Volkswagen International Finance NV | |
4.000% due 08/12/2020 | | | | | 9,100 | | | | | | 9,822 | |
Wal-Mart Stores, Inc. | |
3.300% due 04/22/2024 | | | | | 12,500 | | | | | | 12,790 | |
| | | | | | | | | | | | |
| | | | | | | | | | | 506,439 | |
| | | | | | | | | | | | |
| | | | | | | | | | | | |
| UTILITIES 13.2% | |
AK Transneft OJSC Via TransCapitalInvest Ltd. | |
8.700% due 08/07/2018 | | | | | 22,500 | | | | | | 25,115 | |
Electricite de France S.A. | |
6.500% due 01/26/2019 | | | | | 14,200 | | | | | | 16,629 | |
FirstEnergy Corp. | |
2.750% due 03/15/2018 | | | | | 2,000 | | | | | | 2,022 | |
Gazprom OAO Via Gaz Capital S.A. | |
6.212% due 11/22/2016 | | | | | 6,500 | | | | | | 6,784 | |
6.510% due 03/07/2022 | | | | | 1,300 | | | | | | 1,363 | |
8.146% due 04/11/2018 | | | | | 15,300 | | | | | | 16,978 | |
9.250% due 04/23/2019 | | | | | 23,650 | | | | | | 27,439 | |
Intergas Finance BV | |
6.375% due 05/14/2017 | | | | | 3,700 | | | | | | 3,954 | |
Kinder Morgan Finance Co. LLC | |
5.700% due 01/05/2016 | | | | | 9,200 | | | | | | 9,631 | |
Korea Hydro & Nuclear Power Co. Ltd. | |
3.125% due 09/16/2015 | | | | | 300 | | | | | | 306 | |
Majapahit Holding BV | |
7.250% due 06/28/2017 | | | | | 1,000 | | | | | | 1,115 | |
Nevada Power Co. | |
6.500% due 05/15/2018 | | | | | 3,000 | | | | | | 3,491 | |
| | | | | | |
| See Accompanying Notes | | ANNUAL REPORT | | OCTOBER 31, 2014 | | 33 |
Schedule of Investments PIMCO Fixed Income SHares: Series C (Cont.)
| | | | | | | | | | | | |
| | | | | PRINCIPAL
AMOUNT
(000S) | | | | | MARKET
VALUE
(000S) | |
NGPL PipeCo LLC | |
7.119% due 12/15/2017 | | $ | | | 20,600 | | | $ | | | 20,754 | |
NiSource Finance Corp. | |
6.400% due 03/15/2018 | | | | | 900 | | | | | | 1,030 | |
Novatek OAO Via Novatek Finance Ltd. | |
5.326% due 02/03/2016 | | | | | 1,000 | | | | | | 1,018 | |
NRG Energy, Inc. | |
7.625% due 01/15/2018 | | | | | 6,100 | | | | | | 6,862 | |
Petrobras Global Finance BV | |
6.250% due 03/17/2024 | | | | | 1,000 | | | | | | 1,062 | |
Petroleos Mexicanos | |
5.500% due 01/21/2021 | | | | | 18,700 | | | | | | 20,767 | |
5.750% due 12/15/2015 | | | | | 500 | | | | | | 521 | |
8.000% due 05/03/2019 | | | | | 7,500 | | | | | | 9,149 | |
Public Service Co. of Oklahoma | |
6.150% due 08/01/2016 | | | | | 2,900 | | | | | | 3,153 | |
Qtel International Finance Ltd. | |
3.375% due 10/14/2016 | | | | | 3,000 | | | | | | 3,113 | |
5.000% due 10/19/2025 | | | | | 11,800 | | | | | | 12,877 | |
Qwest Corp. | |
6.500% due 06/01/2017 | | | | | 1,250 | | | | | | 1,387 | |
Ras Laffan Liquefied Natural Gas Co. Ltd. | |
5.298% due 09/30/2020 | | | | | 2,168 | | | | | | 2,352 | |
5.832% due 09/30/2016 | | | | | 948 | | | | | | 1,000 | |
6.750% due 09/30/2019 | | | | | 3,000 | | | | | | 3,574 | |
Rosneft Finance S.A. | |
6.625% due 03/20/2017 | | | | | 10,100 | | | | | | 10,436 | |
7.500% due 07/18/2016 | | | | | 21,650 | | | | | | 22,597 | |
7.875% due 03/13/2018 | | | | | 3,700 | | | | | | 3,973 | |
Rosneft Oil Co. Via Rosneft International Finance Ltd. | |
3.149% due 03/06/2017 | | | | | 4,500 | | | | | | 4,331 | |
Sprint Communications, Inc. | |
7.000% due 08/15/2020 | | | | | 1,000 | | | | | | 1,065 | |
TECO Finance, Inc. | |
6.572% due 11/01/2017 | | | | | 983 | | | | | | 1,123 | |
Telefonos de Mexico S.A.B. de C.V. | |
8.750% due 01/31/2016 | | MXN | | | 128,300 | | | | | | 10,102 | |
Verizon Communications, Inc. | |
2.625% due 02/21/2020 | | $ | | | 31,307 | | | | | | 31,178 | |
4.500% due 09/15/2020 | | | | | 19,700 | | | | | | 21,405 | |
8.750% due 11/01/2018 | | | | | 715 | | | | | | 893 | |
W3A Funding Corp. | |
8.090% due 01/02/2017 | | | | | 41 | | | | | | 41 | |
| | | | | | | | | | | | |
| | | | | | | | | | | 310,590 | |
| | | | | | | | | | | | |
Total Corporate Bonds & Notes
(Cost $1,599,015) | | | 1,671,581 | |
| | | | | | | | | | | | |
| | | | | | | | | | | | |
| | | | | PRINCIPAL
AMOUNT
(000S) | | | | | MARKET
VALUE
(000S) | |
| MUNICIPAL BONDS & NOTES 1.3% | |
| | | | | | | | | | | | |
| ARIZONA 0.1% | |
University of Arizona Revenue Bonds, (BABs), Series 2010 | |
6.423% due 08/01/2035 | | $ | | | 2,000 | | | $ | | | 2,295 | |
| | | | | | | | | | | | |
| | | | | | | | | | | | |
| CALIFORNIA 0.9% | |
Bay Area Toll Authority, California Revenue Bonds, (BABs), Series 2009 | |
6.263% due 04/01/2049 | | | | | 600 | | | | | | 826 | |
California State General Obligation Bonds, (BABs), Series 2009 | |
7.550% due 04/01/2039 | | | | | 3,150 | | | | | | 4,734 | |
California State General Obligation Bonds, (BABs), Series 2010 | |
6.650% due 03/01/2022 | | | | | 1,500 | | | | | | 1,857 | |
California State General Obligation Notes, Series 2009 | |
6.200% due 10/01/2019 | | | | | 400 | | | | | | 473 | |
Los Angeles County, California Public Works Financing Authority Revenue Bonds, (BABs), Series 2010 | |
7.488% due 08/01/2033 | | | | | 6,900 | | | | | | 9,013 | |
Los Angeles Department of Water & Power, California Revenue Bonds, Series 2010 | |
5.516% due 07/01/2027 | | | | | 3,000 | | | | | | 3,610 | |
Palomar Community College District, California General Obligation Bonds, (BABs), Series 2010 | |
7.194% due 08/01/2045 | | | | | 300 | | | | | | 344 | |
| | | | | | | | | | | | |
| | | | | | | | | | | 20,857 | |
| | | | | | | | | | | | |
| | | | | | | | | | | | |
| NEW YORK 0.1% | |
New York City, New York Transitional Finance Authority Future Tax Secured Revenue Bonds, (BABs), Series 2010 | |
4.325% due 11/01/2021 | | | | | 400 | | | | | | 443 | |
4.525% due 11/01/2022 | | | | | 800 | | | | | | 892 | |
5.932% due 11/01/2036 | | | | | 200 | | | | | | 226 | |
New York State Dormitory Authority Revenue Bonds, (BABs), Series 2010 | |
5.289% due 03/15/2033 | | | | | 1,600 | | | | | | 1,867 | |
| | | | | | | | | | | | |
| | | | | | | | | | | 3,428 | |
| | | | | | | | | | | | |
| | | | | | | | | | | | |
| OHIO 0.2% | |
American Municipal Power, Inc., Ohio Revenue Bonds, (BABs), Series 2010 | |
5.939% due 02/15/2047 | | | | | 3,600 | | | | | | 4,448 | |
7.834% due 02/15/2041 | | | | | 200 | | | | | | 292 | |
| | | | | | | | | | | | |
| | | | | | | | | | | 4,740 | |
| | | | | | | | | | | | |
Total Municipal Bonds & Notes
(Cost $25,019) | | | 31,320 | |
| | | | | | | | | | | | |
| | | | | | |
| 34 | | PIMCO MANAGED ACCOUNTS TRUST | | | | See Accompanying Notes |
October 31, 2014
| | | | | | | | | | | | |
| | | | | PRINCIPAL
AMOUNT
(000S) | | | | | MARKET
VALUE
(000S) | |
| U.S. GOVERNMENT AGENCIES 0.1% | |
Fannie Mae | |
1.917% due 08/25/2018 | | $ | | | 1 | | | $ | | | 2 | |
2.575% due 02/01/2018 | | | | | 2 | | | | | | 3 | |
4.095% due 04/01/2017 | | | | | 2 | | | | | | 2 | |
4.500% due 08/01/2039 - 11/01/2041 | | | | | 598 | | | | | | 650 | |
Freddie Mac | |
1.875% due 12/01/2018 | | | | | 5 | | | | | | 5 | |
6.500% due 01/01/2038 - 10/01/2038 | | | | | 151 | | | | | | 171 | |
Ginnie Mae | |
1.625% due 01/20/2022 | | | | | 8 | | | | | | 8 | |
| | | | | | | | | | | | |
Total U.S. Government Agencies
(Cost $803) | | | 841 | |
| | | | | | | | | | | | |
| | | | | | | | | | | | |
| U.S. TREASURY OBLIGATIONS 0.5% | |
U.S. Treasury Notes | |
1.500% due 02/28/2019 (g) | | | | | 12,030 | | | | | | 12,044 | |
| | | | | | | | | | | | |
Total U.S. Treasury Obligations
(Cost $12,056) | | | 12,044 | |
| | | | | | | | | | | | |
| | | | | | | | | | | | |
| MORTGAGE-BACKED SECURITIES 1.6% | |
Banc of America Commercial Mortgage Trust | |
5.889% due 07/10/2044 | | | | | 4,259 | | | | | | 4,521 | |
Banc of America Funding Trust | |
2.829% due 01/20/2047 ^ | | | | | 125 | | | | | | 97 | |
BCAP LLC Trust | |
0.322% due 09/26/2035 | | | | | 708 | | | | | | 699 | |
Bear Stearns Adjustable Rate Mortgage Trust | |
2.483% due 05/25/2034 | | | | | 60 | | | | | | 56 | |
2.488% due 10/25/2033 | | | | | 75 | | | | | | 76 | |
2.528% due 03/25/2035 | | | | | 170 | | | | | | 172 | |
Bear Stearns ALT-A Trust | |
2.538% due 02/25/2036 ^ | | | | | 1,034 | | | | | | 711 | |
Bear Stearns Commercial Mortgage Securities Trust | |
5.540% due 09/11/2041 | | | | | 1,526 | | | | | | 1,619 | |
Citigroup Mortgage Loan Trust, Inc. | |
2.200% due 09/25/2035 | | | | | 354 | | | | | | 353 | |
2.280% due 09/25/2035 | | | | | 322 | | | | | | 322 | |
Cordusio RMBS SRL | |
0.222% due 06/30/2035 | | EUR | | | 154 | | | | | | 191 | |
Countrywide Alternative Loan Trust | |
0.352% due 05/25/2036 | | $ | | | 204 | | | | | | 167 | |
Countrywide Home Loan Mortgage Pass-Through Trust | |
0.472% due 03/25/2035 | | | | | 231 | | | | | | 178 | |
2.624% due 08/25/2034 | | | | | 47 | | | | | | 42 | |
Credit Suisse First Boston Mortgage Securities Corp. | |
2.248% due 07/25/2033 | | | | | 12 | | | | | | 12 | |
| | | | | | | | | | | | |
| | | | | PRINCIPAL
AMOUNT
(000S) | | | | | MARKET
VALUE
(000S) | |
Downey Savings & Loan Association Mortgage Loan Trust | |
0.417% due 08/19/2045 | | $ | | | 1,669 | | | $ | | | 1,507 | |
2.527% due 07/19/2044 | | | | | 974 | | | | | | 974 | |
Greenpoint Mortgage Funding Trust | |
0.382% due 06/25/2045 | | | | | 2,922 | | | | | | 2,517 | |
Greenpoint Mortgage Pass-Through Certificates | |
2.795% due 10/25/2033 | | | | | 10 | | | | | | 10 | |
GSR Mortgage Loan Trust | |
1.871% due 03/25/2033 | | | | | 56 | | | | | | 55 | |
2.655% due 09/25/2035 | | | | | 1,242 | | | | | | 1,255 | |
2.660% due 09/25/2035 | | | | | 539 | | | | | | 542 | |
HarborView Mortgage Loan Trust | |
0.347% due 01/19/2038 | | | | | 238 | | | | | | 203 | |
0.497% due 06/20/2035 | | | | | 397 | | | | | | 382 | |
2.483% due 05/19/2033 | | | | | 134 | | | | | | 135 | |
HomeBanc Mortgage Trust | |
0.412% due 01/25/2036 | | | | | 2,396 | | | | | | 2,076 | |
5.279% due 04/25/2037 ^ | | | | | 269 | | | | | | 218 | |
JPMorgan Mortgage Trust | |
1.990% due 11/25/2033 | | | | | 74 | | | | | | 74 | |
2.594% due 07/25/2035 | | | | | 966 | | | | | | 984 | |
2.640% due 02/25/2035 | | | | | 69 | | | | | | 68 | |
5.296% due 07/25/2035 | | | | | 683 | | | | | | 687 | |
Ocwen Residential MBS Corp. | |
7.000% due 10/25/2040 ^ | | | | | 125 | | | | | | 0 | |
RBSSP Resecuritization Trust | |
0.432% due 05/26/2037 | | | | | 504 | | | | | | 497 | |
0.652% due 09/26/2034 | | | | | 4,713 | | | | | | 4,365 | |
0.652% due 03/26/2036 | | | | | 3,454 | | | | | | 3,377 | |
0.652% due 04/26/2037 | | | | | 3,868 | | | | | | 3,617 | |
Residential Accredit Loans, Inc. Trust | |
0.362% due 04/25/2046 | | | | | 1,282 | | | | | | 664 | |
Structured Adjustable Rate Mortgage Loan Trust | |
2.490% due 02/25/2034 | | | | | 106 | | | | | | 107 | |
Structured Asset Securities Corp. Mortgage Pass-Through Certificates | |
5.250% due 09/25/2034 | | | | | 556 | | | | | | 563 | |
WaMu Mortgage Pass-Through Certificates Trust | |
0.462% due 01/25/2045 | | | | | 166 | | | | | | 156 | |
0.522% due 11/25/2034 | | | | | 1,758 | | | | | | 1,683 | |
1.114% due 02/25/2046 | | | | | 998 | | | | | | 947 | |
Wells Fargo Mortgage-Backed Securities Trust | |
2.615% due 03/25/2036 | | | | | 534 | | | | | | 514 | |
| | | | | | | | | | | | |
Total Mortgage-Backed Securities
(Cost $35,924) | | | 37,393 | |
| | | | | | | | | | | | |
| | | | | | | | | | | | |
| ASSET-BACKED SECURITIES 0.8% | |
Ameriquest Mortgage Securities Trust | |
0.542% due 03/25/2036 | | | | | 100 | | | | | | 85 | |
| | | | | | |
| See Accompanying Notes | | ANNUAL REPORT | | OCTOBER 31, 2014 | | 35 |
Schedule of Investments PIMCO Fixed Income SHares: Series C (Cont.)
| | | | | | | | | | | | |
| | | | | PRINCIPAL
AMOUNT
(000S) | | | | | MARKET
VALUE
(000S) | |
Bear Stearns Asset-Backed Securities Trust | |
0.352% due 12/25/2036 | | $ | | | 1,681 | | | $ | | | 1,576 | |
0.565% due 12/25/2035 | | | | | 1,000 | | | | | | 958 | |
1.152% due 10/25/2037 | | | | | 465 | | | | | | 436 | |
BNC Mortgage Loan Trust | |
0.252% due 05/25/2037 | | | | | 1,082 | | | | | | 1,036 | |
Conseco Financial Corp. | |
6.220% due 03/01/2030 | | | | | 188 | | | | | | 201 | |
6.530% due 02/01/2031 | | | | | 3,268 | | | | | | 3,283 | |
First Franklin Mortgage Loan Trust | |
0.642% due 09/25/2035 | | | | | 1,500 | | | | | | 1,433 | |
First NLC Trust | |
0.857% due 12/25/2035 | | | | | 1,161 | | | | | | 1,102 | |
Home Equity Asset Trust | |
1.352% due 10/25/2033 | | | | | 814 | | | | | | 781 | |
Keystone Owner Trust | |
9.000% due 01/25/2029 | | | | | 3 | | | | | | 1 | |
Merrill Lynch Mortgage Investors Trust | |
0.272% due 02/25/2037 | | | | | 224 | | | | | | 105 | |
Morgan Stanley ABS Capital, Inc. Trust | |
0.582% due 09/25/2035 | | | | | 500 | | | | | | 434 | |
Morgan Stanley Mortgage Loan Trust | |
0.512% due 04/25/2037 | | | | | 168 | | | | | | 95 | |
Nomura Home Equity Loan, Inc. Home Equity Loan Trust | |
0.742% due 09/25/2035 | | | | | 1,000 | | | | | | 862 | |
Popular ABS Mortgage Pass-Through Trust | |
0.242% due 06/25/2047 ^ | | | | | 123 | | | | | | 120 | |
Residential Asset Mortgage Products Trust | |
1.802% due 11/25/2034 | | | | | 214 | | | | | | 203 | |
Structured Asset Investment Loan Trust | |
0.842% due 06/25/2035 | | | | | 1,000 | | | | | | 966 | |
Structured Asset Securities Corp. Mortgage Loan Trust | |
0.492% due 02/25/2036 | | | | | 1,000 | | | | | | 845 | |
0.602% due 11/25/2035 | | | | | 1,200 | | | | | | 1,042 | |
Wells Fargo Home Equity Asset-Backed Securities Trust | |
0.742% due 11/25/2035 | | | | | 1,500 | | | | | | 1,306 | |
0.852% due 10/25/2034 | | | | | 486 | | | | | | 463 | |
| | | | | | | | | | | | |
Total Asset-Backed Securities
(Cost $15,879) | | | 17,333 | |
| | | | | | | | | | | | |
| | | | | | | | | | | | |
| SOVEREIGN ISSUES 25.8% | |
Banco Nacional de Desenvolvimento Economico e Social | |
3.375% due 09/26/2016 | | | | | 11,700 | | | | | | 11,978 | |
6.369% due 06/16/2018 | | | | | 3,300 | | | | | | 3,630 | |
Brazil Notas do Tesouro Nacional | |
10.000% due 01/01/2021 | | BRL | | | 179,600 | | | | | | 66,330 | |
| | | | | | | | | | | | |
| | | | | PRINCIPAL
AMOUNT
(000S) | | | | | MARKET
VALUE
(000S) | |
Colombia Government International Bond | |
7.375% due 01/27/2017 | | $ | | | 2,000 | | | $ | | | 2,273 | |
Export-Import Bank of Korea | |
4.000% due 01/29/2021 | | | | | 10,900 | | | | | | 11,610 | |
5.125% due 06/29/2020 | | | | | 250 | | | | | | 282 | |
Indonesia Government International Bond | |
6.875% due 01/17/2018 | | | | | 3,100 | | | | | | 3,515 | |
Italy Buoni Poliennali Del Tesoro | |
4.750% due 06/01/2017 (e) | | EUR | | | 155,300 | | | | | | 214,265 | |
Mexico Government International Bond | |
4.500% due 11/22/2035 (b) | | MXN | | | 546,371 | | | | | | 47,815 | |
Province of Quebec | |
3.500% due 07/29/2020 | | $ | | | 7,800 | | | | | | 8,380 | |
Qatar Government International Bond | |
4.000% due 01/20/2015 | | | | | 3,500 | | | | | | 3,528 | |
5.250% due 01/20/2020 | | | | | 6,400 | | | | | | 7,296 | |
Republic of Greece Government Bond | |
3.800% due 08/08/2017 | | JPY | | | 955,000 | | | | | | 8,083 | |
4.500% due 07/03/2017 | | | | | 820,000 | | | | | | 6,775 | |
Russia Government International Bond | |
7.500% due 03/31/2030 | | $ | | | 1,310 | | | | | | 1,489 | |
South Africa Government International Bond | |
6.875% due 05/27/2019 | | | | | 300 | | | | | | 346 | |
Spain Government International Bond | |
2.100% due 04/30/2017 | | EUR | | | 161,500 | | | | | | 209,595 | |
| | | | | | | | | | | | |
Total Sovereign Issues (Cost $644,319) | | | 607,190 | |
| | | | | | | | | | | | |
| | | | | | | | | | | | |
| SHORT-TERM INSTRUMENTS 11.7% | |
| | | | | | | | | | | | |
| CERTIFICATES OF DEPOSIT 1.5% | | | | |
Intesa Sanpaolo SpA | |
1.610% due 04/11/2016 | | $ | | | 35,400 | | | | | | 35,654 | |
| | | | | | | | | | | | |
| | | | | | | | | | | | |
| REPURCHASE AGREEMENTS (d) 1.7% | |
| | | | | | | | | | | 40,894 | |
| | | | | | | | | | | | |
| | | | | | | | | | | | |
| SHORT-TERM NOTES 6.2% | |
Fannie Mae | |
0.071% due 04/27/2015 | | | | | 20,000 | | | | | | 19,995 | |
0.081% due 04/22/2015 - 05/01/2015 | | | | | 4,500 | | | | | | 4,499 | |
Federal Home Loan Bank | |
0.081% due 04/17/2015 | | | | | 4,300 | | | | | | 4,299 | |
Freddie Mac | |
0.071% due 04/01/2015 - 04/10/2015 | | | | | 110,000 | | | | | | 109,976 | |
0.081% due 04/27/2015 | | | | | 7,300 | | | | | | 7,298 | |
| | | | | | | | | | | | |
| | | | | | | | | | | 146,067 | |
| | | | | | | | | | | | |
| | | | | | |
| 36 | | PIMCO MANAGED ACCOUNTS TRUST | | | | See Accompanying Notes |
October 31, 2014
| | | | | | | | | | | | |
| | | | | PRINCIPAL
AMOUNT
(000S) | | | | | MARKET
VALUE
(000S) | |
| U.S. TREASURY BILLS 2.3% | |
0.026% due 11/06/2014 - 04/16/2015 (a)(e)(g)(i) | | $ | | | 53,827 | | | $ | | | 53,825 | |
| | | | | | | | | | | | |
Total Short-Term Instruments
(Cost $276,172) | | | | | | 276,440 | |
| | | | | | | | | | | | |
| |
Total Investments in Securities
(Cost $2,609,187) | | | | | | 2,654,142 | |
| | | | | | | | | | | | |
| |
Total Investments 112.8%
(Cost $2,609,187) | | | $ | | | 2,654,142 | |
| |
Financial Derivative
Instruments (f)(h) 1.5% (Cost or Premiums, net $547) | | | 34,188 | |
| |
Other Assets and Liabilities,
net (14.3%) | | | (334,557 | ) |
| | | | | | | | | | | | |
| Net Assets 100.0% | | | $ | | | 2,353,773 | |
| | | | | | | | | | | | |
NOTES TO SCHEDULE OF INVESTMENTS (AMOUNTS IN THOUSANDS*, EXCEPT NUMBER OF CONTRACTS):
| * | A zero balance may reflect actual amounts rounding to less than one thousand. |
| (a) | Weighted average yield to maturity. |
| (b) | Principal amount of security is adjusted for inflation. |
| (c) | Perpetual maturity; date shown, if applicable, represents next contractual call date. |
BORROWINGS AND OTHER FINANCING TRANSACTIONS
(d) REPURCHASE AGREEMENTS:
| | | | | | | | | | | | | | | | | | | | | | | | | | | | |
| Counterparty | | Lending
Rate | | Settlement
Date | | | Maturity
Date | | | Principal
Amount | | | Collateralized By | | Collateral
Received,
at Value | | | Repurchase
Agreements,
at Value | | | Repurchase
Agreement
Proceeds
to be
Received (1) | |
BOS | | 0.160% | | | 10/31/2014 | | | | 11/03/2014 | | | $ | 10,900 | | | U.S. Treasury Bonds
3.750% due 11/15/2043 | | $ | (11,270 | ) | | $ | 10,900 | | | $ | 10,900 | |
SAL | | 0.160% | | | 10/31/2014 | | | | 11/03/2014 | | | | 27,000 | | | U.S. Treasury Notes
2.500% due 05/15/2024 | | | (27,554 | ) | | | 27,000 | | | | 27,000 | |
SSB | | 0.000% | | | 10/31/2014 | | | | 11/03/2014 | | | | 2,994 | | | Freddie Mac
2.000% due 11/02/2022 | | | (3,058 | ) | | | 2,994 | | | | 2,994 | |
| | | | | | | | | | | | | | | | | | | | | | | | | | | | |
Total Repurchase Agreements | | | | | $ | (41,882 | ) | | $ | 40,894 | | | $ | 40,894 | |
| | | | | | | | | | | | | | | | | | | | | | | | | | | | |
| (1) | Includes accrued interest. |
| | | | | | |
| See Accompanying Notes | | ANNUAL REPORT | | OCTOBER 31, 2014 | | 37 |
Schedule of Investments PIMCO Fixed Income SHares: Series C (Cont.)
REVERSE REPURCHASE AGREEMENTS:
| | | | | | | | | | | | | | | | | | | | | | | | |
| Counterparty | | Borrowing
Rate | | | Borrowing
Date | | | Maturity
Date | | | Amount
Borrowed (2) | | | Payable for
Reverse
Repurchase
Agreements | |
BCY | | | 0.650 | % | | | 10/29/2014 | | | | 11/04/2014 | | | $ | | | | | (51,328 | ) | | $ | (51,333 | ) |
| | | 0.650 | % | | | 11/04/2014 | | | | 01/05/2015 | | | | | | | | (51,083 | ) | | | (51,083 | ) |
BPG | | | 0.390 | % | | | 10/06/2014 | | | | 11/07/2014 | | | | | | | | (85,014 | ) | | | (85,040 | ) |
| | | 0.390 | % | | | 10/14/2014 | | | | 11/17/2014 | | | | | | | | (15,095 | ) | | | (15,098 | ) |
DEU | | | 0.700 | % | | | 10/28/2014 | | | | 11/18/2014 | | | | | | | | (21,219 | ) | | | (21,221 | ) |
| | | | | | | | | | | | | | | | | | | | | | | | |
Total Reverse Repurchase Agreements | | | | | | | | | | | | | | | $ | (223,775 | ) |
| | | | | | | | | | | | | | | | | | | | | | | | |
SALE-BUYBACK TRANSACTIONS:
| | | | | | | | | | | | | | | | | | | | | | | | |
| Counterparty | | Borrowing
Rate | | | Borrowing
Date | | | Maturity
Date | | | Amount
Borrowed (2) | | | Payable for
Sale-Buyback
Transactions (3) | |
BPS | | | 0.120 | % | | | 10/01/2014 | | | | 11/10/2014 | | | $ | | | | | (129,402 | ) | | $ | (162,347 | ) |
| | | | | | | | | | | | | | | | | | | | | | | | |
Total Sale-Buyback Transactions | | | | | | | | | | | | | | | $ | (162,347 | ) |
| | | | | | | | | | | | | | | | | | | | | | | | |
| (2) | The average amount of borrowings while outstanding during the period ended October 31, 2014 was $547,030 at a weighted average interest rate of 0.117%. |
| (3) | Payable for sale-buyback transactions includes $166 of deferred price drop on sale-buyback transactions. |
BORROWINGS AND OTHER FINANCING TRANSACTIONS SUMMARY
The following is a summary by counterparty of the market value of Borrowings and Other Financing Transactions and collateral (received)/pledged as of October 31, 2014:
| (e) | Securities with an aggregate market value of $405,740 have been pledged as collateral under the terms of the following master agreements as of October 31, 2014. |
| | | | | | | | | | | | | | | | | | | | | | | | | | | | |
| Counterparty | | Repurchase
Agreement
Proceeds
to be
Received | | | Payable for
Reverse
Repurchase
Agreements | | | Payable for
Sale-Buyback
Transactions | | | Payable for
Short Sales | | | Total
Borrowings and
Other Financing
Transactions | | | Collateral
(Received)/
Pledged | | | Net
Exposure (3) | |
Global/Master Repurchase Agreement | | | | | | | | | | | | | | | | | | | | | | | | | | | | |
BCY | | $ | 0 | | | $ | (102,416 | ) | | $ | 0 | | | $ | 0 | | | $ | (102,416 | ) | | $ | 114,708 | | | $ | 12,292 | |
BOS | | | 10,900 | | | | 0 | | | | 0 | | | | 0 | | | | 10,900 | | | | (11,270 | ) | | | (370 | ) |
BPG | | | 0 | | | | (100,138 | ) | | | 0 | | | | 0 | | | | (100,138 | ) | | | 106,892 | | | | 6,754 | |
DEU | | | 0 | | | | (21,221 | ) | | | 0 | | | | 0 | | | | (21,221 | ) | | | 23,099 | | | | 1,878 | |
SAL | | | 27,000 | | | | 0 | | | | 0 | | | | 0 | | | | 27,000 | | | | (27,554 | ) | | | (554 | ) |
SSB | | | 2,994 | | | | 0 | | | | 0 | | | | 0 | | | | 2,994 | | | | (3,058 | ) | | | (64 | ) |
| | | | | | | |
Master Securities Forward Transaction Agreement | | | | | | | | | | | | | | | | | | | | | | | | | | | | |
BPS | | | 0 | | | | 0 | | | | (162,347 | ) | | | 0 | | | | 0 | | | | 159,493 | | | | (2,854 | ) |
| | | | | | | | | | | | | | | | | | | | | | | | | | | | |
Total Borrowings and Other Financing Transactions | | $ | 40,894 | | | $ | (223,775 | ) | | $ | (162,347 | ) | | $ | 0 | | | | | | | | | | | | | |
| | | | | | | | | | | | | | | | | | | | | | | | | | | | |
| (3) | Net Exposure represents the net receivable/(payable) that would be due from/to the counterparty in the event of default. Exposure from borrowings and other financing transactions can only be netted across transactions governed under the same master agreement with the same legal entity. See Note 7, Principal Risks, in the Notes to Financial Statements for more information regarding master netting arrangements. |
| | | | | | |
| 38 | | PIMCO MANAGED ACCOUNTS TRUST | | | | See Accompanying Notes |
October 31, 2014
(f) FINANCIAL DERIVATIVE INSTRUMENTS: EXCHANGE-TRADED OR CENTRALLY CLEARED
FUTURES CONTRACTS:
| | | | | | | | | | | | | | | | | | | | | | |
| Description | | Type | | Expiration
Month | | | # of
Contracts | | | Unrealized
Appreciation/
(Depreciation) | | | Variation Margin | |
| | | | | | Asset | | | Liability | |
Call Options Strike @ EUR 99.500 on 3-Month Euribor December Futures | | Short | | | 12/2014 | | | | 345 | | | $ | (217 | ) | | $ | 0 | | | $ | (11 | ) |
Put Options Strike @ EUR 99.500 on 3-Month Euribor December Futures | | Short | | | 12/2014 | | | | 345 | | | | 290 | | | | 0 | | | | 0 | |
U.S. Treasury 10-Year Note December Futures | | Long | | | 12/2014 | | | | 2,147 | | | | 1,812 | | | | 0 | | | | (570 | ) |
| | | | | | | | | | | | | | | | | | | | | | |
Total Futures Contracts | | | | | | | $ | 1,885 | | | $ | 0 | | | $ | (581 | ) |
| | | | | | | | | | | | | | | | | | | | | | |
SWAP AGREEMENTS:
CREDIT DEFAULT SWAPS ON CREDIT INDICES - SELL PROTECTION (1)
| | | | | | | | | | | | | | | | | | | | | | | | | | | | |
| Index/Tranches | | Fixed Deal
Receive Rate | | | Maturity
Date | | | Notional
Amount (2) | | | Market
Value (3) | | | Unrealized
Appreciation | | | Variation Margin | |
| | | | | | | Asset | | | Liability | |
CDX.HY-23 5-Year Index | | | 5.000% | | | | 12/20/2019 | | | $ | 5,500 | | | $ | 416 | | | $ | 98 | | | $ | 24 | | | $ | 0 | |
| | | | | | | | | | | | | | | | | | | | | | | | | | | | |
| (1) | If the Portfolio is a seller of protection and a credit event occurs, as defined under the terms of that particular swap agreement, the Portfolio will either (i) pay to the buyer of protection an amount equal to the notional amount of the swap and take delivery of the referenced obligation or underlying securities comprising the referenced index or (ii) pay a net settlement amount in the form of cash or securities equal to the notional amount of the swap less the recovery value of the referenced obligation or underlying securities comprising the referenced index. |
| (2) | The maximum potential amount the Portfolio could be required to pay as a seller of credit protection or receive as a buyer of credit protection if a credit event occurs as defined under the terms of that particular swap agreement. |
| (3) | The prices and resulting values for credit default swap agreements on credit indices serve as an indicator of the current status of the payment/performance risk and represent the likelihood of an expected liability (or profit) for the credit derivative should the notional amount of the swap agreement be closed/sold as of the period end. Increasing market values, in absolute terms when compared to the notional amount of the swap, represent a deterioration of the referenced indices’ credit soundness and a greater likelihood or risk of default or other credit event occurring as defined under the terms of the agreement. |
INTEREST RATE SWAPS
| | | | | | | | | | | | | | | | | | | | | | | | | | | | | | | | | | |
Pay/Receive
Floating Rate | | Floating Rate Index | | Fixed
Rate | | | Maturity
Date | | | Notional
Amount | | | Market
Value | | | Unrealized
Appreciation/
(Depreciation) | | | Variation Margin | |
| | | | | | | | Asset | | | Liability | |
Receive | | 3-Month USD-LIBOR | | | 3.500% | | | | 12/18/2043 | | | | $ | | | | 211,700 | | | $ | (22,301 | ) | | $ | (35,931 | ) | | $ | 1,224 | | | $ | 0 | |
Pay | | 6-Month EUR-EURIBOR | | | 4.000% | | | | 09/16/2019 | | | | EUR | | | | 4,000 | | | | 895 | | | | 292 | | | | 11 | | | | 0 | |
Receive | | 6-Month JPY-LIBOR | | | 1.000% | | | | 09/18/2023 | | | | JPY | | | | 7,920,000 | | | | (3,144 | ) | | | (1,462 | ) | | | 0 | | | | (30 | ) |
Pay | | 28-Day MXN-TIIE | | | 5.500% | | | | 09/13/2017 | | | | MXN | | | | 1,008,000 | | | | 2,495 | | | | 255 | | | | 0 | | | | (204 | ) |
Pay | | 28-Day MXN-TIIE | | | 6.300% | | | | 04/26/2024 | | | | | | | | 1,300,000 | | | | 1,788 | | | | 260 | | | | 0 | | | | (426 | ) |
Pay | | 28-Day MXN-TIIE | | | 6.150% | | | | 06/07/2024 | | | | | | | | 887,000 | | | | 432 | | | | 1,107 | | | | 0 | | | | (291 | ) |
| | | | | | | | | | | | | | | | | | | | | | | | | | | | | | | | | | |
| | | | | | | | | | | | | | | | | | | | $ | (19,835 | ) | | $ | (35,479 | ) | | $ | 1,235 | | | $ | (951 | ) |
| | | | | | | | | | | | | | | | | | | | | | | | | | | | | | | | | | |
Total Swap Agreements | | | | | | | | | | | | | | | $ | (19,419 | ) | | $ | (35,381 | ) | | $ | 1,259 | | | $ | (951 | ) |
| | | | | | | | | | | | | | | | | | | | | | | | | | | | | | | | | | |
| | | | | | |
| See Accompanying Notes | | ANNUAL REPORT | | OCTOBER 31, 2014 | | 39 |
Schedule of Investments PIMCO Fixed Income SHares: Series C (Cont.)
FINANCIAL DERIVATIVE INSTRUMENTS: EXCHANGE-TRADED OR CENTRALLY CLEARED SUMMARY
The following is a summary of the market value and variation margin of Exchange-Traded or Centrally Cleared Financial Derivative Instruments as of October 31, 2014:
| (g) | Securities with an aggregate market value of $23,814 and cash of $1,531 have been pledged as collateral for exchange-traded and centrally cleared financial derivative instruments as of October 31, 2014. See Note 7, Principal Risks, in the Notes to Financial Statements for more information regarding master netting arrangements. |
| | | | | | | | | | | | | | | | | | | | | | | | | | | | | | | | |
| | | Financial Derivative Assets | | | | | Financial Derivative Liabilities | |
| | | Market Value | | Variation Margin
Asset | | | Total | | | | | Market Value | | | Variation Margin
Liability | | | Total | |
| | | Purchased
Options | | Futures | | | Swap
Agreements | | | | | | Written
Options | | | Futures | | | Swap
Agreements | | |
Total Exchange-Traded or Centrally Cleared | | $ 0 | | $ | 0 | | | $ | 1,259 | | | $ | 1,259 | | | | | $ | 0 | | | $ | (581 | ) | | $ | (951 | ) | | $ | (1,532 | ) |
| | | | | | | | | |
(h) FINANCIAL DERIVATIVE INSTRUMENTS: OVER THE COUNTER
FORWARD FOREIGN CURRENCY CONTRACTS:
| | | | | | | | | | | | | | | | | | | | | | | | | | | | |
| Counterparty | | Settlement
Month | | | Currency to
be Delivered | | | Currency to
be Received | | | Unrealized Appreciation/
(Depreciation) | |
| | | | | Asset | | | Liability | |
BOA | | | 11/2014 | | | | AUD | | | | 48,437 | | | | $ | | | | 42,906 | | | $ | 281 | | | $ | 0 | |
| | | 11/2014 | | | | EUR | | | | 571,723 | | | | | | | | 728,529 | | | | 12,075 | | | | 0 | |
| | | 11/2014 | | | | $ | | | | 5,288 | | | | AUD | | | | 6,077 | | | | 59 | | | | 0 | |
| | | 11/2014 | | | | | | | | 164,385 | | | | EUR | | | | 129,400 | | | | 0 | | | | (2,227 | ) |
| | | 11/2014 | | | | | | | | 191,836 | | | | JPY | | | | 20,683,920 | | | | 0 | | | | (7,692 | ) |
| | | 12/2014 | | | | GBP | | | | 13,295 | | | | $ | | | | 21,471 | | | | 210 | | | | 0 | |
| | | 12/2014 | | | | JPY | | | | 20,683,920 | | | | | | | | 191,873 | | | | 7,692 | | | | 0 | |
| | | 02/2015 | | | | $ | | | | 144 | | | | MXN | | | | 1,951 | | | | 0 | | | | 0 | |
| | | | | | | | | | | | | | | | | | | | | | | | | | | | |
BPS | | | 11/2014 | | | | JPY | | | | 44,420 | | | | $ | | | | 410 | | | | 15 | | | | 0 | |
| | | 11/2014 | | | | $ | | | | 25,779 | | | | EUR | | | | 20,073 | | | | 0 | | | | (625 | ) |
| | | 12/2014 | | | | MXN | | | | 25,604 | | | | $ | | | | 1,913 | | | | 16 | | | | 0 | |
| | | 12/2014 | | | | $ | | | | 52,092 | | | | MXN | | | | 685,573 | | | | 2 | | | | (1,318 | ) |
| | | 02/2015 | | | | | | | | 450 | | | | | | | | 6,092 | | | | 0 | | | | 0 | |
| | | | | | | | | | | | | | | | | | | | | | | | | | | | |
BRC | | | 12/2014 | | | | | | | | 1,872 | | | | | | | | 24,679 | | | | 0 | | | | (44 | ) |
| | | 02/2015 | | | | | | | | 3,507 | | | | | | | | 47,549 | | | | 9 | | | | (4 | ) |
| | | | | | | | | | | | | | | | | | | | | | | | | | | | |
CBK | | | 12/2014 | | | | | | | | 7,500 | | | | | | | | 99,508 | | | | 0 | | | | (131 | ) |
| | | 01/2015 | | | | BRL | | | | 169,592 | | | | $ | | | | 69,874 | | | | 2,605 | | | | 0 | |
| | | | | | | | | | | | | | | | | | | | | | | | | | | | |
DUB | | | 12/2014 | | | $ | | | | | 4,066 | | | | MXN | | | | 53,346 | | | | 0 | | | | (115 | ) |
| | | | | | | | | | | | | | | | | | | | | | | | | | | | |
FBF | | | 01/2015 | | | | | | | | 6 | | | | BRL | | | | 15 | | | | 0 | | | | 0 | |
| | | | | | | | | | | | | | | | | | | | | | | | | | | | |
GLM | | | 11/2014 | | | | | | | | 37,394 | | | | AUD | | | | 42,360 | | | | 0 | | | | (118 | ) |
| | | 12/2014 | | | | AUD | | | | 42,360 | | | | $ | | | | 37,319 | | | | 115 | | | | 0 | |
| | | | | | | | | | | | | | | | | | | | | | | | | | | | |
HUS | | | 11/2014 | | | | $ | | | | 3,100 | | | | CAD | | | | 3,476 | | | | 0 | | | | (17 | ) |
| | | | | | | | | | | | | | | | | | | | | | | | | | | | |
JPM | | | 12/2014 | | | | | | | | 1,475 | | | | MXN | | | | 19,651 | | | | 2 | | | | (21 | ) |
| | | 02/2015 | | | | | | | | 986 | | | | | | | | 13,500 | | | | 11 | | | | 0 | |
| | | | | | | | | | | | | | | | | | | | | | | | | | | | |
MSB | | | 11/2014 | | | | EUR | | | | 94,417 | | | | $ | | | | 120,009 | | | | 1,690 | | | | 0 | |
| | | 12/2014 | | | | MXN | | | | 127,768 | | | | | | | | 9,699 | | | | 236 | | | | 0 | |
| | | | | | | | | | | | | | | | | | | | | | | | | | | | |
UAG | | | 11/2014 | | | | BRL | | | | 22,873 | | | | | | | | 9,647 | | | | 416 | | | | 0 | �� |
| | | 11/2014 | | | | JPY | | | | 20,639,500 | | | | | | | | 189,572 | | | | 5,824 | | | | 0 | |
| | | | | | |
| 40 | | PIMCO MANAGED ACCOUNTS TRUST | | | | See Accompanying Notes |
October 31, 2014
| | | | | | | | | | | | | | | | | | | | | | | | | | | | |
| Counterparty | | Settlement
Month | | | Currency to
be Delivered | | | Currency to
be Received | | | Unrealized Appreciation/
(Depreciation) | |
| | | | | Asset | | | Liability | |
| | | 11/2014 | | | $ | | | | | 9,260 | | | | BRL | | | | 22,873 | | | $ | 0 | | | $ | (30 | ) |
| | | 11/2014 | | | | | | | | 656,580 | | | | EUR | | | | 516,667 | | | | 0 | | | | (9,119 | ) |
| | | 12/2014 | | | | BRL | | | | 22,873 | | | $ | | | | | 9,189 | | | | 38 | | | | 0 | |
| | | 12/2014 | | | | EUR | | | | 516,667 | | | | | | | | 656,683 | | | | 9,106 | | | | 0 | |
| | | 01/2015 | | | $ | | | | | 477 | | | | PLN | | | | 1,602 | | | | 0 | | | | (3 | ) |
| | | | | | | | | | | | | | | | | | | | | | | | | | | | |
Total Forward Foreign Currency Contracts | | | $ | 40,402 | | | $ | (21,464 | ) |
| | | | | | | | | | | | | | | | | | | | | | | | | | | | |
WRITTEN OPTIONS:
CREDIT DEFAULT SWAPTIONS ON CREDIT INDICES
| | | | | | | | | | | | | | | | | | | | | | | | | | | | |
| Counterparty | | Description | | Buy/Sell
Protection | | Exercise
Rate | | | Expiration
Date | | | Notional
Amount | | | Premiums
(Received) | | | Market
Value | |
| BOA | | Put - OTC CDX.IG-22 5-Year Index | | Sell | | | 0.850% | | | | 12/17/2014 | | | | $ | | | | 13,100 | | | $ | (15 | ) | | $ | (3 | ) |
| | Put - OTC CDX.IG-22 5-Year Index | | Sell | | | 1.200% | | | | 12/17/2014 | | | | | | | | 54,300 | | | | (54 | ) | | | (4 | ) |
| | | | | | | | | | | | | | | | | | | | | | | | | | | | |
| BPS | | Call - OTC iTraxx Europe 22 5-Year Index | | Buy | | | 0.600% | | | | 01/21/2015 | | | | EUR | | | | 20,700 | | | | (40 | ) | | | (40 | ) |
| | Put - OTC iTraxx Europe 22 5-Year Index | | Sell | | | 0.900% | | | | 01/21/2015 | | | | | | | | 20,700 | | | | (35 | ) | | | (35 | ) |
| | | | | | | | | | | | | | | | | | | | | | | | | | | | |
| CBK | | Put - OTC CDX.IG-22 5-Year Index | | Sell | | | 0.850% | | | | 12/17/2014 | | | | $ | | | | 13,100 | | | | (15 | ) | | | (3 | ) |
| | Call - OTC iTraxx Europe 22 5-Year Index | | Buy | | | 0.600% | | | | 01/21/2015 | | | | EUR | | | | 23,400 | | | | (43 | ) | | | (50 | ) |
| | Put - OTC iTraxx Europe 22 5-Year Index | | Sell | | | 0.900% | | | | 01/21/2015 | | | | | | | | 23,400 | | | | (46 | ) | | | (38 | ) |
| | | | | | | | | | | | | | | | | | | | | | | | | | | | |
| GST | | Put - OTC CDX.IG-22 5-Year Index | | Sell | | | 1.200% | | | | 12/17/2014 | | | | $ | | | | 134,500 | | | | (101 | ) | | | (10 | ) |
| | Put - OTC CDX.IG-22 5-Year Index | | Sell | | | 0.900% | | | | 01/21/2015 | | | | | | | | 14,200 | | | | (21 | ) | | | (7 | ) |
| | Call - OTC iTraxx Europe 22 5-Year Index | | Buy | | | 0.600% | | | | 01/21/2015 | | | | EUR | | | | 20,600 | | | | (25 | ) | | | (44 | ) |
| | Put - OTC iTraxx Europe 22 5-Year Index | | Sell | | | 1.000% | | | | 01/21/2015 | | | | | | | | 20,600 | | | | (57 | ) | | | (21 | ) |
| | | | | | | | | | | | | | | | | | | | | | | | | | | | |
| | | | | | | | | | | | | | | | | | | | | | $ | (452 | ) | | $ | (255 | ) |
| | | | | | | | | | | | | | | | | | | | | | | | | | | | |
FOREIGN CURRENCY OPTIONS
| | | | | | | | | | | | | | | | | | | | | | | | | | |
| Counterparty | | Description | | Strike
Price | | | Expiration
Date | | | Notional
Amount | | | Premiums
(Received) | | | Market
Value | |
| JPM | | Call - OTC USD versus INR | | | INR | | | | 65.900 | | | | 03/19/2015 | | | | $ 91,500 | | | $ | (891 | ) | | $ | (478 | ) |
| UAG | | Call - OTC USD versus INR | | | | | | | 66.150 | | | | 03/19/2015 | | | | 91,500 | | | | (874 | ) | | | (439 | ) |
| | | | | | | | | | | | | | | | | | | | | | | | | | |
| | | | | | | | | | | | | | | | | | | | $ | (1,765 | ) | | $ | (917 | ) |
| | | | | | | | | | | | | | | | | | | | | | | | | | |
Total Written Options | | | | | | | $ | (2,217 | ) | | $ | (1,172 | ) |
| | | | | | | | | | | | | | | | | | | | | | | | | | |
TRANSACTIONS IN WRITTEN CALL AND PUT OPTIONS FOR THE PERIOD ENDED OCTOBER 31, 2014:
| | | | | | | | | | | | | | | | | | | | |
| | | # of
Contracts | | | Notional
Amount in $ | | | Notional
Amount in EUR | | | Premiums | |
Balance at Beginning of Period | | | 268 | | | $ | 1,408,800 | | | | EUR | | | | 912,000 | | | $ | (5,861 | ) |
Sales | | | 563 | | | | 2,936,000 | | | | | | | | 129,400 | | | | (11,752 | ) |
Closing Buys | | | 0 | | | | (2,185,300 | ) | | | | | | | 0 | | | | 2,697 | |
Expirations | | | (831 | ) | | | (1,747,300 | ) | | | | | | | (456,000 | ) | | | 11,831 | |
Exercised | | | 0 | | | | 0 | | | | | | | | (456,000 | ) | | | 868 | |
| | | | | | | | | | | | | | | | | | | | |
Balance at End of Period | | | 0 | | | $ | 412,200 | | | | EUR | | | | 129,400 | | | $ | (2,217 | ) |
| | | | | | | | | | | | | | | | | | | | |
| | | | | | |
| See Accompanying Notes | | ANNUAL REPORT | | OCTOBER 31, 2014 | | 41 |
Schedule of Investments PIMCO Fixed Income SHares: Series C (Cont.)
SWAP AGREEMENTS:
CREDIT DEFAULT SWAPS ON CORPORATE, SOVEREIGN AND U.S. MUNICIPAL ISSUES - SELL PROTECTION (1)
| | | | | | | | | | | | | | | | | | | | | | | | | | | | | | | | | | | | | | |
| Counterparty | | Reference Entity | | Fixed Deal
Receive Rate | | | Maturity
Date | | | Implied
Credit
Spread at
October 31,
2014 (2) | | | Notional
Amount (3) | | | Premiums
Paid/(Received) | | | Unrealized
Appreciation/
(Depreciation) | | | Swap Agreements,
at Value | |
| | | | | | | | | Asset | | | Liability | |
BOA | | China Government International Bond | | | 1.000% | | | | 09/20/2016 | | | | 0.277% | | | | $ | | | | 2,000 | | | $ | 10 | | | $ | 19 | | | $ | 29 | | | $ | 0 | |
| | | | | | | | | | | | | | | | | | | | | | | | | | | | | | | | | | | | | | |
BPS | | China Government International Bond | | | 1.000% | | | | 09/20/2015 | | | | 0.160% | | | | | | | | 17,500 | | | | 161 | | | | (9 | ) | | | 152 | | | | 0 | |
| | General Electric Capital Corp. | | | 1.000% | | | | 09/20/2015 | | | | 0.230% | | | | | | | | 900 | | | | (46 | ) | | | 53 | | | | 7 | | | | 0 | |
| | Teck Resources Ltd. | | | 1.000% | | | | 03/20/2019 | | | | 1.615% | | | | | | | | 800 | | | | (23 | ) | | | 3 | | | | 0 | | | | (20 | ) |
| | | | | | | | | | | | | | | | | | | | | | | | | | | | | | | | | | | | | | |
BRC | | Ally Financial, Inc. | | | 5.000% | | | | 03/20/2020 | | | | 1.600% | | | | | | | | 20,500 | | | | 3,478 | | | | 87 | | | | 3,565 | | | | 0 | |
| | China Government International Bond | | | 1.000% | | | | 09/20/2015 | | | | 0.160% | | | | | | | | 28,800 | | | | 272 | | | | (21 | ) | | | 251 | | | | 0 | |
| | China Government International Bond | | | 1.000% | | | | 09/20/2016 | | | | 0.277% | | | | | | | | 6,000 | | | | 31 | | | | 58 | | | | 89 | | | | 0 | |
| | | | | | | | | | | | | | | | | | | | | | | | | | | | | | | | | | | | | | |
CBK | | China Government International Bond | | | 1.000% | | | | 09/20/2015 | | | | 0.160% | | | | | | | | 6,300 | | | | 58 | | | | (3 | ) | | | 55 | | | | 0 | |
| | United Kingdom Gilt | | | 1.000% | | | | 06/20/2015 | | | | 0.019% | | | | | | | | 16,200 | | | | 132 | | | | (11 | ) | | | 121 | | | | 0 | |
| | United Kingdom Gilt | | | 1.000% | | | | 06/20/2016 | | | | 0.037% | | | | | | | | 33,500 | | | | 416 | | | | 156 | | | | 572 | | | | 0 | |
| | | | | | | | | | | | | | | | | | | | | | | | | | | | | | | | | | | | | | |
DUB | | Ally Financial, Inc. | | | 5.000% | | | | 03/20/2020 | | | | 1.600% | | | | | | | | 10,000 | | | | 1,810 | | | | (71 | ) | | | 1,739 | | | | 0 | |
| | BP Capital Markets America, Inc. | | | 1.000% | | | | 12/20/2018 | | | | 0.555% | | | | EUR | | | | 4,000 | | | | 106 | | | | (8 | ) | | | 98 | | | | 0 | |
| | France Government Bond | | | 0.250% | | | | 09/20/2015 | | | | 0.125% | | | | $ | | | | 3,800 | | | | (139 | ) | | | 144 | | | | 5 | | | | 0 | |
| | France Government Bond | | | 0.250% | | | | 03/20/2016 | | | | 0.162% | | | | | | | | 31,100 | | | | (1,104 | ) | | | 1,151 | | | | 47 | | | | 0 | |
| | | | | | | | | | | | | | | | | | | | | | | | | | | | | | | | | | | | | | |
FBF | | China Government International Bond | | | 1.000% | | | | 03/20/2015 | | | | 0.145% | | | | | | | | 4,700 | | | | 51 | | | | (30 | ) | | | 21 | | | | 0 | |
| | United Kingdom Gilt | | | 1.000% | | | | 09/20/2015 | | | | 0.021% | | | | | | | | 13,000 | | | | 134 | | | | (5 | ) | | | 129 | | | | 0 | |
| | | | | | | | | | | | | | | | | | | | | | | | | | | | | | | | | | | | | | |
GST | | Brazil Government International Bond | | | 1.000% | | | | 03/20/2018 | | | | 1.080% | | | | | | | | 1,200 | | | | (15 | ) | | | 13 | | | | 0 | | | | (2 | ) |
| | California State General Obligation Bonds, Series 2003 | | | 1.630% | | | | 12/20/2018 | | | | 0.415% | | | | | | | | 3,300 | | | | 0 | | | | 167 | | | | 167 | | | | 0 | |
| | California State General Obligation Bonds, Series 2003 | | | 1.650% | | | | 12/20/2018 | | | | 0.415% | | | | | | | | 25,000 | | | | 0 | | | | 1,288 | | | | 1,288 | | | | 0 | |
| | China Government International Bond | | | 1.000% | | | | 06/20/2019 | | | | 0.715% | | | | | | | | 25,000 | | | | 370 | | | | (21 | ) | | | 349 | | | | 0 | |
| | France Government Bond | | | 0.250% | | | | 03/20/2016 | | | | 0.162% | | | | | | | | 25,900 | | | | (866 | ) | | | 906 | | | | 40 | | | | 0 | |
| | | | | | | | | | | | | | | | | | | | | | | | | | | | | | | | | | | | | | |
HUS | | China Government International Bond | | | 1.000% | | | | 09/20/2015 | | | | 0.160% | | | | | | | | 9,200 | | | | 16 | | | | 65 | | | | 81 | | | | 0 | |
| | | | | | | | | | | | | | | | | | | | | | | | | | | | | | | | | | | | | | |
JPM | | Brazil Government International Bond | | | 1.000% | | | | 12/20/2017 | | | | 1.013% | | | | | | | | 12,000 | | | | 0 | | | | 9 | | | | 9 | | | | 0 | |
| | China Government International Bond | | | 1.000% | | | | 03/20/2015 | | | | 0.145% | | | | | | | | 22,000 | | | | 255 | | | | (156 | ) | | | 99 | | | | 0 | |
| | China Government International Bond | | | 1.000% | | | | 06/20/2019 | | | | 0.715% | | | | | | | | 50,000 | | | | 740 | | | | (43 | ) | | | 697 | | | | 0 | |
| | France Government Bond | | | 0.250% | | | | 09/20/2015 | | | | 0.125% | | | | | | | | 4,900 | | | | (172 | ) | | | 179 | | | | 7 | | | | 0 | |
| | | | | | |
| 42 | | PIMCO MANAGED ACCOUNTS TRUST | | | | See Accompanying Notes |
October 31, 2014
| | | | | | | | | | | | | | | | | | | | | | | | | | | | | | | | | | | | | | |
| Counterparty | | Reference Entity | | Fixed Deal
Receive Rate | | | Maturity
Date | | | Implied
Credit
Spread at
October 31,
2014 (2) | | | Notional
Amount (3) | | | Premiums
Paid/(Received) | | | Unrealized
Appreciation/
(Depreciation) | | | Swap Agreements,
at Value | |
| | | | | | | | | Asset | | | Liability | |
| | Newmont Mining Corp. | | | 1.000% | | | | 12/20/2018 | | | | 1.255% | | | | $ | | | | 1,600 | | | $ | (111 | ) | | $ | 97 | | | $ | 0 | | | $ | (14 | ) |
| | | | | | | | | | | | | | | | | | | | | | | | | | | | | | | | | | | | | | |
MYC | | China Government International Bond | | | 1.000% | | | | 09/20/2015 | | | | 0.160% | | | | | | | | 17,200 | | | | 137 | | | | 13 | | | | 150 | | | | 0 | |
| | China Government International Bond | | | 1.000% | | | | 06/20/2019 | | | | 0.715% | | | | | | | | 25,000 | | | | 371 | | | | (22 | ) | | | 349 | | | | 0 | |
| | France Government Bond | | | 0.250% | | | | 09/20/2016 | | | | 0.197% | | | | | | | | 22,300 | | | | (1,053 | ) | | | 1,082 | | | | 29 | | | | 0 | |
| | | | | | | | | | | | | | | | | | | | | | | | | | | | | | | | | | | | | | |
RYL | | China Government International Bond | | | 1.000% | | | | 09/20/2015 | | | | 0.160% | | | | | | | | 41,500 | | | | 379 | | | | (18 | ) | | | 361 | | | | 0 | |
| | | | | | | | | | | | | | | | | | | | | | | | | | | | | | | | | | | | | | |
| | | | | | | | | | | | | | | | | | | | | | | | $ | 5,398 | | | $ | 5,072 | | | $ | 10,506 | | | $ | (36 | ) |
| | | | | | | | | | | | | | | | | | | | | | | | | | | | | | | | | | | | | | |
CREDIT DEFAULT SWAPS ON CREDIT INDICES - SELL PROTECTION (1)
| | | | | | | | | | | | | | | | | | | | | | | | | | | | | | |
| Counterparty | | Index/Tranches | | Fixed Deal
Receive Rate | | | Maturity
Date | | | Notional
Amount (3) | | | Premiums
Paid/(Received) | | | Unrealized
Appreciation/
(Depreciation) | | | Swap Agreements,
at Value (4) | |
| | | | | | | | Asset | | | Liability | |
BRC | | CDX.EM-15 5-Year Index | | | 5.000% | | | | 06/20/2016 | | | $ | 5,358 | | | $ | 723 | | | $ | (497 | ) | | $ | 226 | | | $ | 0 | |
| | | | | | | | | | | | | | | | | | | | | | | | | | | | | | |
CBK | | MCDX-23 10-Year Index | | | 1.000% | | | | 12/20/2024 | | | | 21,400 | | | | (584 | ) | | | 173 | | | | 0 | | | | (411 | ) |
| | | | | | | | | | | | | | | | | | | | | | | | | | | | | | |
GST | | MCDX-23 5-Year Index | | | 1.000% | | | | 12/20/2019 | | | | 23,700 | | | | 144 | | | | 119 | | | | 263 | | | | 0 | |
| | | | | | | | | | | | | | | | | | | | | | | | | | | | | | |
MYC | | MCDX-23 5-Year Index | | | 1.000% | | | | 12/20/2019 | | | | 19,100 | | | | 116 | | | | 96 | | | | 212 | | | | 0 | |
| | MCDX-23 10-Year Index | | | 1.000% | | | | 12/20/2024 | | | | 21,400 | | | | (576 | ) | | | 165 | | | | 0 | | | | (411 | ) |
| | | | | | | | | | | | | | | | | | | | | | | | | | | | | | |
| | | | | | | | | | | | | | | | $ | (177 | ) | | $ | 56 | | | $ | 701 | | | $ | (822 | ) |
| | | | | | | | | | | | | | | | | | | | | | | | | | | | | | |
| (1) | If the Portfolio is a seller of protection and a credit event occurs, as defined under the terms of that particular swap agreement, the Portfolio will either (i) pay to the buyer of protection an amount equal to the notional amount of the swap and take delivery of the referenced obligation or underlying securities comprising the referenced index or (ii) pay a net settlement amount in the form of cash or securities equal to the notional amount of the swap less the recovery value of the referenced obligation or underlying securities comprising the referenced index. |
| (2) | Implied credit spreads, represented in absolute terms, utilized in determining the market value of credit default swap agreements on corporate, sovereign or U.S. municipal issues as of period end serve as an indicator of the current status of the payment/performance risk and represent the likelihood or risk of default for the credit derivative. The implied credit spread of a particular referenced entity reflects the cost of buying/selling protection and may include upfront payments required to be made to enter into the agreement. Wider credit spreads represent a deterioration of the referenced entity’s credit soundness and a greater likelihood or risk of default or other credit event occurring as defined under the terms of the agreement. |
| (3) | The maximum potential amount the Portfolio could be required to pay as a seller of credit protection or receive as a buyer of credit protection if a credit event occurs as defined under the terms of that particular swap agreement. |
| (4) | The prices and resulting values for credit default swap agreements on credit indices serve as an indicator of the current status of the payment/performance risk and represent the likelihood of an expected liability (or profit) for the credit derivative should the notional amount of the swap agreement be closed/sold as of the period end. Increasing market values, in absolute terms when compared to the notional amount of the swap, represent a deterioration of the referenced indices’ credit soundness and a greater likelihood or risk of default or other credit event occurring as defined under the terms of the agreement. |
| | | | | | |
| See Accompanying Notes | | ANNUAL REPORT | | OCTOBER 31, 2014 | | 43 |
Schedule of Investments PIMCO Fixed Income SHares: Series C (Cont.)
INTEREST RATE SWAPS
| | | | | | | | | | | | | | | | | | | | | | | | | | | | | | | | | | | | |
| Counterparty | | Pay/
Receive
Floating
Rate | | Floating Rate
Index | | Fixed
Rate | | | Maturity
Date | | | Notional
Amount | | | Premiums
Paid/
(Received) | | | Unrealized
Appreciation/
(Depreciation) | | | Swap Agreements,
at Value | |
| | | | | | | | | Asset | | | Liability | |
BRC | | Pay | | 28-Day MXN-TIIE | | | 7.780% | | | | 04/09/2019 | | | | MXN | | | | 91,800 | | | $ | 3 | | | $ | 776 | | | $ | 779 | | | $ | 0 | |
| | | | | | | | | | | | | | | | | | | | | | | | | | | | | | | | | | | | |
DUB | | Pay | | 1-Year BRL-CDI | | | 7.620% | | | | 01/02/2015 | | | | BRL | | | | 100 | | | | 0 | | | | (1 | ) | | | 0 | | | | (1 | ) |
| | Pay | | 6-Month
AUD-BBR-BBSW | | | 5.000% | | | | 12/15/2015 | | | | AUD | | | | 188,640 | | | | (2,460 | ) | | | 8,028 | | | | 5,568 | | | | 0 | |
| | | | | | | | | | | | | | | | | | | | | | | | | | | | | | | | | | | | |
| | | | | | | | | | | | | | | | | | | | | | $ | (2,457 | ) | | $ | 8,803 | | | $ | 6,347 | | | $ | (1 | ) |
| | | | | | | | | | | | | | | | | | | | | | | | | | | | | | | | | | | | |
Total Swap Agreements | | | | | | | | | | | $ | 2,764 | | | $ | 13,931 | | | $ | 17,554 | | | $ | (859 | ) |
| | | | | | | | | | | | | | | | | | | | | | | | | | | | | | | | | | | | |
FINANCIAL DERIVATIVE INSTRUMENTS: OVER THE COUNTER SUMMARY
The following is a summary by counterparty of the market value of OTC financial derivative instruments and collateral (received)/pledged as of October 31, 2014:
| (i) | Securities with an aggregate market value of $1,632 have been pledged as collateral for financial derivative instruments as governed by International Swaps and Derivatives Association, Inc. master agreements as of October 31, 2014. |
| | | | | | | | | | | | | | | | | | | | | | | | | | | | | | | | | | | | | | | | | | | | | | |
| | | Financial Derivative Assets | | | | | Financial Derivative Liabilities | | | | | | | | | | |
| Counterparty | | Forward
Foreign
Currency
Contracts | | | Purchased
Options | | | Swap
Agreements | | | Total
Over
the
Counter | | | | | Forward
Foreign
Currency
Contracts | | | Written
Options | | | Swap
Agreements | | | Total
Over
the
Counter | | | Net
Market
Value
of
OTC
Derivatives | | | Collateral
(Received)/
Pledged | | | Net
Exposure (5) | |
BOA | | $ | 20,317 | | | $ | 0 | | | $ | 29 | | | $ | 20,346 | | | | | $ | (9,919 | ) | | $ | (7 | ) | | $ | 0 | | | $ | (9,926 | ) | | $ | 10,420 | | | $ | (6,310 | ) | | $ | 4,110 | |
BPS | | | 33 | | | | 0 | | | | 159 | | | | 192 | | | | | | (1,943 | ) | | | (75 | ) | | | (20 | ) | | | (2,038 | ) | | | (1,846 | ) | | | 1,453 | | | | (393 | ) |
BRC | | | 9 | | | | 0 | | | | 4,910 | | | | 4,919 | | | | | | (48 | ) | | | 0 | | | | 0 | | | | (48 | ) | | | 4,871 | | | | (4,720 | ) | | | 151 | |
CBK | | | 2,605 | | | | 0 | | | | 748 | | | | 3,353 | | | | | | (131 | ) | | | (91 | ) | | | (411 | ) | | | (633 | ) | | | 2,720 | | | | (820 | ) | | | 1,900 | |
DUB | | | 0 | | | | 0 | | | | 7,457 | | | | 7,457 | | | | | | (115 | ) | | | 0 | | | | (1 | ) | | | (116 | ) | | | 7,341 | | | | (7,070 | ) | | | 271 | |
FBF | | | 0 | | | | 0 | | | | 150 | | | | 150 | | | | | | 0 | | | | 0 | | | | 0 | | | | 0 | | | | 150 | | | | (176 | ) | | | (26 | ) |
GLM | | | 115 | | | | 0 | | | | 0 | | | | 115 | | | | | | (118 | ) | | | 0 | | | | 0 | | | | (118 | ) | | | (3 | ) | | | 0 | | | | (3 | ) |
GST | | | 0 | | | | 0 | | | | 2,107 | | | | 2,107 | | | | | | 0 | | | | (82 | ) | | | (2 | ) | | | (84 | ) | | | 2,023 | | | | (1,950 | ) | | | 73 | |
HUS | | | 0 | | | | 0 | | | | 81 | | | | 81 | | | | | | (17 | ) | | | 0 | | | | 0 | | | | (17 | ) | | | 64 | | | | (80 | ) | | | (16 | ) |
JPM | | | 13 | | | | 0 | | | | 812 | | | | 825 | | | | | | (21 | ) | | | (478 | ) | | | (14 | ) | | | (513 | ) | | | 312 | | | | (280 | ) | | | 32 | |
MSB | | | 1,926 | | | | 0 | | | | 0 | | | | 1,926 | | | | | | 0 | | | | 0 | | | | 0 | | | | 0 | | | | 1,926 | | | | (1,050 | ) | | | 876 | |
MYC | | | 0 | | | | 0 | | | | 740 | | | | 740 | | | | | | 0 | | | | 0 | | | | (411 | ) | | | (411 | ) | | | 329 | | | | (489 | ) | | | (160 | ) |
RYL | | | 0 | | | | 0 | | | | 361 | | | | 361 | | | | | | 0 | | | | 0 | | | | 0 | | | | 0 | | | | 361 | | | | (660 | ) | | | (299 | ) |
UAG | | | 15,384 | | | | 0 | | | | 0 | | | | 15,384 | | | | | | (9,152 | ) | | | (439 | ) | | | 0 | | | | (9,591 | ) | | | 5,793 | | | | 179 | | | | 5,972 | |
| | | | | | | | | | | | | | | | | | | | | | | | | | | | | | | | | | | | | | | | | | | | | | |
Total Over the
Counter | | $ | 40,402 | | | $ | 0 | | | $ | 17,554 | | | $ | 57,956 | | | | | $ | (21,464) | | | $ | (1,172 | ) | | $ | (859 | ) | | $ | (23,495 | ) | | | | | | | | | | | | |
| | | | | | | | | | | | | | | | | | | | | | | | | | | | | | | | | | | | | | | | | | | | | | |
| (5) | Net Exposure represents the net receivable/(payable) that would be due from/to the counterparty in the event of default. Exposure from OTC financial derivative instruments can only be netted across transactions governed under the same master agreement with the same legal entity. See Note 7, Principal Risks, in the Notes to Financial Statements for more information regarding master netting arrangements. |
| | | | | | |
| 44 | | PIMCO MANAGED ACCOUNTS TRUST | | | | See Accompanying Notes |
October 31, 2014
FAIR VALUE OF FINANCIAL DERIVATIVE INSTRUMENTS
The following is a summary of the fair valuation of the Portfolio’s derivative instruments categorized by risk exposure. See Note 7, Principal Risks, in the Notes to Financial Statements on risks of the Portfolio.
Fair Values of Financial Derivative Instruments on the Statements of Assets and Liabilities as of October 31, 2014:
| | | | | | | | | | | | | | | | | | | | | | | | |
| | | Derivatives not accounted for as hedging instruments | |
| | | Commodity
Contracts | | | Credit
Contracts | | | Equity
Contracts | | | Foreign
Exchange
Contracts | | | Interest
Rate Contracts | | | Total | |
Financial Derivative Instruments - Assets | |
Exchange-traded or centrally cleared | | | | | | | | | | | | | | | | | | | | | | | | |
Swap Agreements | | $ | 0 | | | $ | 24 | | | $ | 0 | | | $ | 0 | | | $ | 1,235 | | | $ | 1,259 | |
| | | | | | | | | | | | | | | | | | | | | | | | |
Over the counter | | | | | | | | | | | | | | | | | | | | | | | | |
Forward Foreign Currency Contracts | | $ | 0 | | | $ | 0 | | | $ | 0 | | | $ | 40,402 | | | $ | 0 | | | $ | 40,402 | |
Swap Agreements | | | 0 | | | | 11,206 | | | | 0 | | | | 0 | | | | 6,348 | | | | 17,554 | |
| | | | | | | | | | | | | | | | | | | | | | | | |
| | $ | 0 | | | $ | 11,206 | | | $ | 0 | | | $ | 40,402 | | | $ | 6,348 | | | $ | 57,956 | |
| | | | | | | | | | | | | | | | | | | | | | | | |
| | $ | 0 | | | $ | 11,230 | | | $ | 0 | | | $ | 40,402 | | | $ | 7,583 | | | $ | 59,215 | |
| | | | | | | | | | | | | | | | | | | | | | | | |
|
Financial Derivative Instruments - Liabilities | |
Exchange-traded or centrally cleared | | | | | | | | | | | | | | | | | | | | | | | | |
Futures | | $ | 0 | | | $ | 0 | | | $ | 0 | | | $ | 0 | | | $ | 581 | | | $ | 581 | |
Swap Agreements | | | 0 | | | | 0 | | | | 0 | | | | 0 | | | | 951 | | | | 951 | |
| | | | | | | | | | | | | | | | | | | | | | | | |
| | $ | 0 | | | $ | 0 | | | $ | 0 | | | $ | 0 | | | $ | 1,532 | | | $ | 1,532 | |
| | | | | | | | | | | | | | | | | | | | | | | | |
Over the counter | | | | | | | | | | | | | | | | | | | | | | | | |
Forward Foreign Currency Contracts | | $ | 0 | | | $ | 0 | | | $ | 0 | | | $ | 21,464 | | | $ | 0 | | | $ | 21,464 | |
Written Options | | | 0 | | | | 255 | | | | 0 | | | | 917 | | | | 0 | | | | 1,172 | |
Swap Agreements | | | 0 | | | | 859 | | | | 0 | | | | 0 | | | | 0 | | | | 859 | |
| | | | | | | | | | | | | | | | | | | | | | | | |
| | $ | 0 | | | $ | 1,114 | | | $ | 0 | | | $ | 22,381 | | | $ | 0 | | | $ | 23,495 | |
| | | | | | | | | | | | | | | | | | | | | | | | |
| | $ | 0 | | | $ | 1,114 | | | $ | 0 | | | $ | 22,381 | | | $ | 1,532 | | | $ | 25,027 | |
| | | | | | | | | | | | | | | | | | | | | | | | |
The Effect of Financial Derivative Instruments on the Statements of Operations for the Period Ended October 31, 2014:
| | | | | | | | | | | | | | | | | | | | | | | | |
| | | Derivatives not accounted for as hedging instruments | |
| | | Commodity
Contracts | | | Credit
Contracts | | | Equity
Contracts | | | Foreign
Exchange
Contracts | | | Interest
Rate Contracts | | | Total | |
Net Realized Gain (Loss) on Financial
Derivative Instruments | |
Exchange-traded or centrally cleared | | | | | | | | | | | | | | | | | | | | | | | | |
Written Options | | $ | 0 | | | $ | 0 | | | $ | 0 | | | $ | 0 | | | $ | 299 | | | $ | 299 | |
Futures | | | 0 | | | | 0 | | | | 0 | | | | 0 | | | | 14,120 | | | | 14,120 | |
Swap Agreements | | | 0 | | | | (8 | ) | | | 0 | | | | 0 | | | | (10,252 | ) | | | (10,260 | ) |
| | | | | | | | | | | | | | | | | | | | | | | | |
| | $ | 0 | | | $ | (8 | ) | | $ | 0 | | | $ | 0 | | | $ | 4,167 | | | $ | 4,159 | |
| | | | | | | | | | | | | | | | | | | | | | | | |
Over the counter | | | | | | | | | | | | | | | | | | | | | | | | |
Forward Foreign Currency Contracts | | $ | 0 | | | $ | 0 | | | $ | 0 | | | $ | 53,909 | | | $ | 0 | | | $ | 53,909 | |
Written Options | | | 0 | | | | 0 | | | | 0 | | | | 5,507 | | | | 7,490 | | | | 12,997 | |
Swap Agreements | | | 0 | | | | 3,655 | | | | 0 | | | | 0 | | | | (7,059 | ) | | | (3,404 | ) |
| | | | | | | | | | | | | | | | | | | | | | | | |
| | $ | 0 | | | $ | 3,655 | | | $ | 0 | | | $ | 59,416 | | | $ | 431 | | | $ | 63,502 | |
| | | | | | | | | | | | | | | | | | | | | | | | |
| | $ | 0 | | | $ | 3,647 | | | $ | 0 | | | $ | 59,416 | | | $ | 4,598 | | | $ | 67,661 | |
| | | | | | | | | | | | | | | | | | | | | | | | |
| | | | | | |
| See Accompanying Notes | | ANNUAL REPORT | | OCTOBER 31, 2014 | | 45 |
Schedule of Investments PIMCO Fixed Income SHares: Series C (Cont.)
| | | | | | | | | | | | | | | | | | | | | | | | |
| | | Derivatives not accounted for as hedging instruments | |
| | | Commodity
Contracts | | | Credit
Contracts | | | Equity
Contracts | | | Foreign
Exchange
Contracts | | | Interest
Rate Contracts | | | Total | |
Net Change in Unrealized Appreciation
(Depreciation) on Financial
Derivative Instruments | |
Exchange-traded or centrally cleared | | | | | | | | | | | | | | | | | | | | | | | | |
Futures | | $ | 0 | | | $ | 0 | | | $ | 0 | | | $ | 0 | | | $ | (9,322 | ) | | $ | (9,322 | ) |
Swap Agreements | | | 0 | | | | 98 | | | | 0 | | | | 0 | | | | (25,712 | ) | | | (25,614 | ) |
| | | | | | | | | | | | | | | | | | | | | | | | |
| | $ | 0 | | | $ | 98 | | | $ | 0 | | | $ | 0 | | | $ | (35,034 | ) | | $ | (34,936 | ) |
| | | | | | | | | | | | | | | | | | | | | | | | |
Over the counter | | | | | | | | | | | | | | | | | | | | | | | | |
Forward Foreign Currency Contracts | | $ | 0 | | | $ | 0 | | | $ | 0 | | | $ | 27,602 | | | $ | 0 | | | $ | 27,602 | |
Written Options | | | 0 | | | | 197 | | | | 0 | | | | 848 | | | | (2,009 | ) | | | (964 | ) |
Swap Agreements | | | 0 | | | | 976 | | | | 0 | | | | 0 | | | | 11,003 | | | | 11,979 | |
| | | | | | | | | | | | | | | | | | | | | | | | |
| | $ | 0 | | | $ | 1,173 | | | $ | 0 | | | $ | 28,450 | | | $ | 8,994 | | | $ | 38,617 | |
| | | | | | | | | | | | | | | | | | | | | | | | |
| | $ | 0 | | | $ | 1,271 | | | $ | 0 | | | $ | 28,450 | | | $ | (26,040 | ) | | $ | 3,681 | |
| | | | | | | | | | | | | | | | | | | | | | | | |
FAIR VALUE MEASUREMENTS
The following is a summary of the fair valuations according to the inputs used as of October 31, 2014 in valuing the Portfolio’s assets and liabilities:
| | | | | | | | | | | | | | | | |
| Category and Subcategory | | Level 1 | | | Level 2 | | | Level 3 | | | Fair
Value at
10/31/2014 | |
Investments in Securities, at Value | | | | | | | | | | | | | | | | |
Corporate Bonds & Notes | | | | | | | | | | | | | | | | |
Banking & Finance | | $ | 0 | | | $ | 854,552 | | | $ | 0 | | | $ | 854,552 | |
Industrials | | | 0 | | | | 471,058 | | | | 35,381 | | | | 506,439 | |
Utilities | | | 0 | | | | 310,590 | | | | 0 | | | | 310,590 | |
Municipal Bonds & Notes | | | | | | | | | | | | | | | | |
Arizona | | | 0 | | | | 2,295 | | | | 0 | | | | 2,295 | |
California | | | 0 | | | | 20,857 | | | | 0 | | | | 20,857 | |
New York | | | 0 | | | | 3,428 | | | | 0 | | | | 3,428 | |
Ohio | | | 0 | | | | 4,740 | | | | 0 | | | | 4,740 | |
U.S. Government Agencies | | | 0 | | | | 841 | | | | 0 | | | | 841 | |
U.S. Treasury Obligations | | | 0 | | | | 12,044 | | | | 0 | | | | 12,044 | |
Mortgage-Backed Securities | | | 0 | | | | 37,393 | | | | 0 | | | | 37,393 | |
Asset-Backed Securities | | | 0 | | | | 17,332 | | | | 1 | | | | 17,333 | |
Sovereign Issues | | | 0 | | | | 607,190 | | | | 0 | | | | 607,190 | |
Short-Term Instruments | | | | | | | | | | | | | | | | |
Certificates of Deposit | | | 0 | | | | 35,654 | | | | 0 | | | | 35,654 | |
Repurchase Agreements | | | 0 | | | | 40,894 | | | | 0 | | | | 40,894 | |
Short-Term Notes | | | 0 | | | | 146,067 | | | | 0 | | | | 146,067 | |
U.S. Treasury Bills | | | 0 | | | | 53,825 | | | | 0 | | | | 53,825 | |
| | | | |
Total Investments | | $ | 0 | | | $ | 2,618,760 | | | $ | 35,382 | | | $ | 2,654,142 | |
| | | | |
Financial Derivative Instruments - Assets | | | | | | | | | | | | | | | | |
Exchange-traded or centrally cleared | | | 0 | | | | 1,259 | | | | 0 | | | | 1,259 | |
Over the counter | | | 0 | | | | 57,956 | | | | 0 | | | | 57,956 | |
| | $ | 0 | | | $ | 59,215 | | | $ | 0 | | | $ | 59,215 | |
| | | | |
Financial Derivative Instruments - Liabilities | | | | | | | | | | | | | | | | |
Exchange-traded or centrally cleared | | | (581 | ) | | | (951 | ) | | | 0 | | | | (1,532 | ) |
Over the counter | | | (75 | ) | | | (23,420 | ) | | | 0 | | | | (23,495 | ) |
| | $ | (656 | ) | | $ | (24,371 | ) | | $ | 0 | | | $ | (25,027 | ) |
| | | | |
Totals | | $ | (656 | ) | | $ | 2,653,604 | | | $ | 35,382 | | | $ | 2,688,330 | |
| | | | | | |
| 46 | | PIMCO MANAGED ACCOUNTS TRUST | | | | See Accompanying Notes |
October 31, 2014
There were no significant transfers between Level 1 and 2 during the period ended October 31, 2014.
The following is a reconciliation of the fair valuations using significant unobservable inputs (Level 3) for the Portfolio during the period ended October 31, 2014:
| | | | | | | | | | | | | | | | | | | | | | | | | | | | | | | | | | | | | | | | |
| Category and Subcategory | | Beginning
Balance
at
10/31/2013 | | | Net Purchases | | | Net
Sales | | | Accrued
Discounts/
(Premiums) | | | Realized
Gain/
(Loss) | | | Net Change
in Unrealized
Appreciation/
(Depreciation) (1) | | | Transfers
into
Level 3 | | | Transfers
out of
Level 3 | | | Ending
Balance
at
10/31/2014 | | | Net Change
in Unrealized
Appreciation/
(Depreciation)
on
Investments
Held at
10/31/2014 (1) | |
Investments in Securities, at Value | | | | | | | | | | | | | | | | | | | | | | | | | |
Corporate Bonds & Notes | | | | | | | | | | | | | | | | | | | | | | | | | | | | | | | | | | | | | | | | |
Banking &
Finance | | $ | 349 | | | $ | 0 | | | $ | (84 | ) | | $ | 0 | | | $ | 0 | | | $ | 31 | | | $ | 0 | | | $ | (296 | ) | | $ | 0 | | | $ | 0 | |
Industrials | | | 1,428 | | | | 4,747 | | | | (583 | ) | | | (61 | ) | | | (68 | ) | | | (21 | ) | | | 29,960 | | | | (21 | ) | | | 35,381 | | | | (63 | ) |
Mortgage-Backed
Securities | | | 1 | | | | 0 | | | | (89 | ) | | | 0 | | | | 19 | | | | 69 | | | | 0 | | | | 0 | | | | 0 | | | | 0 | |
Asset-Backed Securities | | | 1 | | | | 0 | | | | 0 | | | | 0 | | | | 0 | | | | 0 | | | | 0 | | | | 0 | | | | 1 | | | | 1 | |
| | | | | | | | | | | | | | | | | | | | | | | | | | | | | | | | | | | | | | | | |
Totals | | $ | 1,779 | | | $ | 4,747 | | | $ | (756 | ) | | $ | (61 | ) | | $ | (49 | ) | | $ | 79 | | | $ | 29,960 | | | $ | (317 | ) | | $ | 35,382 | | | $ | (62 | ) |
| | | | | | | | | | | | | | | | | | | | | | | | | | | | | | | | | | | | | | | | |
The following is a summary of significant unobservable inputs used in the fair valuations of assets and liabilities categorized within Level 3 of the fair value hierarchy:
| | | | | | | | | | | | |
| Category and Subcategory | | Ending
Balance
at 10/31/2014 | | | Valuation
Technique | | Unobservable
Inputs | | Input Value(s)
(% Unless
Noted
Otherwise) | |
Investments in Securities, at Value | | | | | | |
Corporate Bonds & Notes | | | | | | | | | | | | |
Industrials | | $ | 35,381 | | | Third Party Vendor | | Broker Quote | | | 106.50-117.00 | |
Mortgage-Backed Securities | | | 0 | | | Benchmark Pricing | | Base Price | | | 0.20 | |
Asset-Backed Securities | | | 1 | | | Benchmark Pricing | | Base Price | | | 48.49 | |
| | | | | | | | | | | | |
Total | | $ | 35,382 | | | | | | | | | |
| | | | | | | | | | | | |
| (1) | Any difference between Net Change in Unrealized Appreciation/(Depreciation) and Net Change in Unrealized Appreciation/(Depreciation) on Investments Held at October 31, 2014 may be due to an investment no longer held or categorized as level 3 at period end. |
| | | | | | |
| See Accompanying Notes | | ANNUAL REPORT | | OCTOBER 31, 2014 | | 47 |
Schedule of Investments PIMCO Fixed Income SHares: Series LD
| | | | | | | | | | | | |
| | | | | PRINCIPAL
AMOUNT
(000S) | | | | | MARKET
VALUE
(000S) | |
| INVESTMENTS IN SECURITIES 145.4% | |
| | | | | | | | | | | | |
| CORPORATE BONDS & NOTES 98.9% | |
| | | | | | | | | | | | |
| BANKING & FINANCE 41.0% | |
Abbey National Treasury Services PLC | |
2.350% due 09/10/2019 (a) | | $ | | | 100 | | | $ | | | 99 | |
Ally Financial, Inc. | |
2.750% due 01/30/2017 | | | | | 100 | | | | | | 100 | |
American Express Credit Corp. | |
2.800% due 09/19/2016 (a) | | | | | 95 | | | | | | 98 | |
American International Group, Inc. | |
2.375% due 08/24/2015 | | | | | 22 | | | | | | 22 | |
Banco Bradesco S.A. | |
4.500% due 01/12/2017 | | | | | 200 | | | | | | 210 | |
Banco Santander Chile | |
3.750% due 09/22/2015 (a) | | | | | 150 | | | | | | 153 | |
Bank of America Corp. | |
6.500% due 08/01/2016 (a) | | | | | 75 | | | | | | 82 | |
Bear Stearns Cos. LLC | |
0.624% due 11/21/2016 | | | | | 75 | | | | | | 75 | |
CIT Group, Inc. | |
4.250% due 08/15/2017 | | | | | 95 | | | | | | 98 | |
DBS Bank Ltd. | |
0.840% due 07/15/2021 | | | | | 100 | | | | | | 98 | |
5.000% due 11/15/2019 | | | | | 50 | | | | | | 50 | |
Eksportfinans ASA | |
2.375% due 05/25/2016 | | | | | 50 | | | | | | 50 | |
5.500% due 05/25/2016 | | | | | 100 | | | | | | 105 | |
Erste Europaische Pfandbrief und Kommunalkreditbank AG S.A. | |
0.102% due 03/20/2017 | | | | | 100 | | | | | | 97 | |
5.125% due 01/21/2016 | | | | | 100 | | | | | | 104 | |
General Electric Capital Corp. | |
0.553% due 12/20/2016 | | | | | 78 | | | | | | 78 | |
General Motors Financial Co., Inc. | |
2.750% due 05/15/2016 | | | | | 75 | | | | | | 76 | |
Hana Bank | |
1.375% due 02/05/2016 | | | | | 200 | | | | | | 201 | |
HSBC Finance Corp. | |
5.500% due 01/19/2016 (a) | | | | | 145 | | | | | | 153 | |
Hypothekenbank Frankfurt AG | |
0.102% due 09/20/2017 | | | | | 100 | | | | | | 99 | |
International Lease Finance Corp. | |
5.750% due 05/15/2016 | | | | | 125 | | | | | | 131 | |
8.625% due 09/15/2015 | | | | | 50 | | | | | | 53 | |
Kookmin Bank | |
1.109% due 01/27/2017 | | | | | 200 | | | | | | 202 | |
Korea Development Bank | |
3.250% due 03/09/2016 (a) | | | | | 100 | | | | | | 103 | |
Korea Finance Corp. | |
3.250% due 09/20/2016 (a) | | | | | 100 | | | | | | 104 | |
| | | | | | | | | | | | |
| | | | | PRINCIPAL
AMOUNT
(000S) | | | | | MARKET
VALUE
(000S) | |
LeasePlan Corp. NV | |
2.500% due 05/16/2018 | | $ | | | 180 | | | $ | | | 181 | |
Macquarie Bank Ltd. | |
2.000% due 08/15/2016 | | | | | 75 | | | | | | 76 | |
Macquarie Group Ltd. | |
3.000% due 12/03/2018 | | | | | 100 | | | | | | 103 | |
Navient Corp. | |
6.250% due 01/25/2016 | | | | | 150 | | | | | | 156 | |
Royal Bank of Scotland PLC | |
5.000% due 05/17/2015 | | | | | 100 | | | | | | 102 | |
Synchrony Financial | |
1.875% due 08/15/2017 (a) | | | | | 100 | | | | | | 101 | |
Vesey Street Investment Trust | |
4.404% due 09/01/2016 (a) | | | | | 75 | | | | | | 79 | |
Weyerhaeuser Co. | |
6.950% due 08/01/2017 (a) | | | | | 150 | | | | | | 171 | |
Woori Bank Co. Ltd. | |
4.750% due 01/20/2016 (a) | | | | | 100 | | | | | | 104 | |
| | | | | | | | | | | | |
| | | | | | | | | | | 3,714 | |
| | | | | | | | | | | | |
| | | | | | | | | | | | |
| INDUSTRIALS 45.7% | |
Amgen, Inc. | |
2.125% due 05/15/2017 (a) | | | | | 95 | | | | | | 97 | |
Anadarko Petroleum Corp. | |
5.950% due 09/15/2016 (a) | | | | | 90 | | | | | | 98 | |
Comcast Corp. | |
5.900% due 03/15/2016 | | | | | 25 | | | | | | 27 | |
Devon Energy Corp. | |
1.875% due 05/15/2017 (a) | | | | | 100 | | | | | | 102 | |
DISH DBS Corp. | |
7.125% due 02/01/2016 | | | | | 50 | | | | | | 53 | |
7.750% due 05/31/2015 | | | | | 80 | | | | | | 83 | |
Enbridge, Inc. | |
0.684% due 06/02/2017 (a) | | | | | 150 | | | | | | 150 | |
Express Scripts Holding Co. | |
2.250% due 06/15/2019 (a) | | | | | 100 | | | | | | 99 | |
3.125% due 05/15/2016 | | | | | 95 | | | | | | 98 | |
Forest Laboratories, Inc. | |
4.375% due 02/01/2019 (a) | | | | | 100 | | | | | | 105 | |
Glencore Funding LLC | |
1.700% due 05/27/2016 | | | | | 100 | | | | | | 101 | |
HCA, Inc. | |
6.500% due 02/15/2016 | | | | | 80 | | | | | | 85 | |
7.190% due 11/15/2015 | | | | | 75 | | | | | | 79 | |
Hyundai Capital America | |
1.450% due 02/06/2017 | | | | | 50 | | | | | | 50 | |
1.625% due 10/02/2015 | | | | | 40 | | | | | | 40 | |
2.125% due 10/02/2017 (a) | | | | | 100 | | | | | | 101 | |
Kansas City Southern de Mexico S.A. de C.V. | |
0.933% due 10/28/2016 | | | | | 100 | | | | | | 100 | |
| | | | | | |
| 48 | | PIMCO MANAGED ACCOUNTS TRUST | | | | See Accompanying Notes |
October 31, 2014
| | | | | | | | | | | | |
| | | | | PRINCIPAL
AMOUNT
(000S) | | | | | MARKET
VALUE
(000S) | |
KazMunayGas National Co. JSC | |
11.750% due 01/23/2015 | | $ | | | 150 | | | $ | | | 153 | |
Kinder Morgan Energy Partners LP | |
6.000% due 02/01/2017 | | | | | 30 | | | | | | 33 | |
Korea National Oil Corp. | |
4.000% due 10/27/2016 (a) | | | | | 200 | | | | | | 210 | |
Lowe’s Cos., Inc. | |
0.654% due 09/10/2019 (a) | | | | | 100 | | | | | | 100 | |
Masco Corp. | |
6.125% due 10/03/2016 | | | | | 100 | | | | | | 107 | |
McKesson Corp. | |
0.634% due 09/10/2015 (a) | | | | | 100 | | | | | | 100 | |
MGM Resorts International | |
6.625% due 07/15/2015 | | | | | 115 | | | | | | 118 | |
Mylan, Inc. | |
2.600% due 06/24/2018 (a) | | | | | 100 | | | | | | 102 | |
Oracle Corp. | |
0.743% due 10/08/2019 (a) | | | | | 150 | | | | | | 151 | |
Pioneer Natural Resources Co. | |
6.875% due 05/01/2018 | | | | | 100 | | | | | | 115 | |
Reynolds American, Inc. | |
7.750% due 06/01/2018 (a) | | | | | 150 | | | | | | 178 | |
Rockies Express Pipeline LLC | |
3.900% due 04/15/2015 | | | | | 150 | | | | | | 150 | |
Sinopec Group Overseas Development Ltd. | |
2.750% due 05/17/2017 (a) | | | | | 200 | | | | | | 205 | |
SK Telecom Co. Ltd. | |
2.125% due 05/01/2018 | | | | | 200 | | | | | | 200 | |
Telefonica Emisiones S.A.U. | |
3.729% due 04/27/2015 (a) | | | | | 125 | | | | | | 127 | |
Thermo Fisher Scientific, Inc. | |
3.200% due 03/01/2016 (a) | | | | | 95 | | | | | | 98 | |
Tyson Foods, Inc. | |
2.650% due 08/15/2019 | | | | | 50 | | | | | | 51 | |
Universal Health Services, Inc. | |
3.750% due 08/01/2019 | | | | | 100 | | | | | | 101 | |
USG Corp. | |
6.300% due 11/15/2016 | | | | | 95 | | | | | | 101 | |
8.375% due 10/15/2018 | | | | | 75 | | | | | | 79 | |
Wynn Macau Ltd. | |
5.250% due 10/15/2021 | | | | | 200 | | | | | | 201 | |
| | | | | | | | | | | | |
| | | | | | | | | | | 4,148 | |
| | | | | | | | | | | | |
| | | | | | | | | | | | |
| UTILITIES 12.2% | |
Electricite de France S.A. | |
0.691% due 01/20/2017 | | | | | 30 | | | | | | 30 | |
FirstEnergy Corp. | |
2.750% due 03/15/2018 | | | | | 200 | | | | | | 202 | |
Freeport-McMoran Oil & Gas LLC | |
6.125% due 06/15/2019 (a) | | | | | 98 | | | | | | 108 | |
| | | | | | | | | | | | |
| | | | | PRINCIPAL
AMOUNT
(000S) | | | | | MARKET
VALUE
(000S) | |
Korea Western Power Co. Ltd. | |
3.125% due 05/10/2017 (a) | | $ | | | 200 | | | $ | | | 207 | |
KT Corp. | |
2.625% due 04/22/2019 (a) | | | | | 200 | | | | | | 202 | |
Orange S.A. | |
2.750% due 02/06/2019 (a) | | | | | 50 | | | | | | 51 | |
Petrobras Global Finance BV | |
1.852% due 05/20/2016 (a) | | | | | 100 | | | | | | 100 | |
Sprint Communications, Inc. | |
6.000% due 12/01/2016 | | | | | 100 | | | | | | 106 | |
Verizon Communications, Inc. | |
2.500% due 09/15/2016 (a) | | | | | 100 | | | | | | 103 | |
| | | | | | | | | | | | |
| | | | | | | | | | | 1,109 | |
| | | | | | | | | | | | |
Total Corporate Bonds & Notes
(Cost $8,950) | | | 8,971 | |
| | | | | | | | | | | | |
| | | | | | | | | | | | |
| U.S. GOVERNMENT AGENCIES 3.2% | |
Fannie Mae | |
3.000% due 03/01/2042 (a) | | | | | 291 | | | | | | 292 | |
| | | | | | | | | | | | |
Total U.S. Government Agencies
(Cost $288) | | | 292 | |
| | | | | | | | | | | | |
| | | | | | | | | | | | |
| MORTGAGE-BACKED SECURITIES 21.3% | |
BAMLL Commercial Mortgage Securities Trust | |
0.954% due 06/15/2028 | | | | | 100 | | | | | | 100 | |
Banc of America Funding Trust | |
0.457% due 02/20/2035 | | | | | 38 | | | | | | 36 | |
Banc of America/Merrill Lynch Commercial Mortgage, Inc. | |
4.933% due 07/10/2045 | | | | | 30 | | | | | | 31 | |
BCAP LLC Trust | |
0.312% due 03/26/2037 | | | | | 89 | | | | | | 87 | |
2.546% due 07/26/2036 | | | | | 49 | | | | | | 50 | |
Citigroup Mortgage Loan Trust, Inc. | |
6.000% due 02/25/2037 | | | | | 8 | | | | | | 8 | |
Credit Suisse Commercial Mortgage Trust | |
5.311% due 12/15/2039 | | | | | 30 | | | | | | 32 | |
Credit Suisse First Boston Mortgage Securities Corp. | |
2.186% due 06/25/2033 | | | | | 48 | | | | | | 47 | |
Credit Suisse Mortgage Capital Certificates | |
2.517% due 09/27/2036 | | | | | 135 | | | | | | 136 | |
JPMorgan Mortgage Trust | |
2.368% due 09/25/2034 | | | | | 22 | | | | | | 22 | |
2.490% due 02/25/2034 | | | | | 120 | | | | | | 123 | |
2.546% due 04/25/2035 | | | | | 687 | | | | | | 690 | |
JPMorgan Resecuritization Trust | |
2.120% due 07/27/2037 | | | | | 26 | | | | | | 27 | |
MASTR Asset Securitization Trust | |
5.500% due 09/25/2033 | | | | | 41 | | | | | | 42 | |
| | | | | | |
| See Accompanying Notes | | ANNUAL REPORT | | OCTOBER 31, 2014 | | 49 |
Schedule of Investments PIMCO Fixed Income SHares: Series LD (Cont.)
| | | | | | | | | | | | |
| | | | | PRINCIPAL
AMOUNT
(000S) | | | | | MARKET
VALUE
(000S) | |
Merrill Lynch Mortgage Investors Trust | |
0.612% due 04/25/2029 | | $ | | | 20 | | | $ | | | 19 | |
Morgan Stanley Mortgage Loan Trust | |
2.464% due 11/25/2034 | | | | | 32 | | | | | | 32 | |
Residential Accredit Loans, Inc. Trust | |
0.592% due 06/25/2034 | | | | | 109 | | | | | | 108 | |
Selkirk Ltd. | |
1.860% due 12/20/2041 | | | | | 99 | | | | | | 100 | |
Structured Asset Securities Corp. Mortgage Loan Trust | |
0.752% due 10/25/2027 | | | | | 28 | | | | | | 27 | |
Thornburg Mortgage Securities Trust | |
2.234% due 04/25/2045 | | | | | 87 | | | | | | 88 | |
Vulcan European Loan Conduit Ltd. | |
0.478% due 05/15/2017 | | EUR | | | 24 | | | | | | 30 | |
Wachovia Bank Commercial Mortgage Trust | |
5.558% due 03/15/2045 | | $ | | | 20 | | | | | | 21 | |
WaMu Mortgage Pass-Through Certificates Trust | |
0.552% due 06/25/2044 | | | | | 55 | | | | | | 51 | |
2.363% due 08/25/2035 | | | | | 13 | | | | | | 13 | |
Wells Fargo Mortgage-Backed Securities Trust | |
2.500% due 12/25/2034 | | | | | 7 | | | | | | 8 | |
| | | | | | | | | | | | |
Total Mortgage-Backed Securities
(Cost $1,917) | | | 1,928 | |
| | | | | | | | | | | | |
| | | | | | | | | | | | |
| ASSET-BACKED SECURITIES 11.4% | |
Aegis Asset-Backed Securities Trust | |
0.422% due 12/25/2035 | | | | | 26 | | | | | | 26 | |
Argent Securities, Inc. Asset-Backed Pass-Through Certificates | |
0.412% due 10/25/2035 | | | | | 37 | | | | | | 37 | |
1.195% due 04/25/2034 | | | | | 101 | | | | | | 96 | |
Exeter Automobile Receivables Trust | |
1.060% due 08/15/2018 | | | | | 122 | | | | | | 121 | |
Golden Knight CDO Ltd. | |
0.471% due 04/15/2019 | | | | | 74 | | | | | | 74 | |
Highbridge Loan Management Ltd. | |
1.485% due 09/20/2022 | | | | | 250 | | | | | | 250 | |
National Collegiate Student Loan Trust | |
0.392% due 11/27/2028 | | | | | 119 | | | | | | 117 | |
Race Point CLO Ltd. | |
1.534% due 12/15/2022 | | | | | 50 | | | | | | 50 | |
Saturn CLO Ltd. | |
0.459% due 05/13/2022 | | | | | 211 | | | | | | 210 | |
| | | | | | | | | | | | |
| | | | | PRINCIPAL
AMOUNT
(000S) | | | | | MARKET
VALUE
(000S) | |
Structured Asset Securities Corp. Mortgage Pass-Through Certificates | |
0.732% due 01/25/2033 | | $ | | | 55 | | | $ | | | 52 | |
| | | | | | | | | | | | |
Total Asset-Backed Securities
(Cost $1,023) | | | 1,033 | |
| | | | | | | | | | | | |
| | | | | | | | | | | | |
| SOVEREIGN ISSUES 3.5% | |
Export-Import Bank of Korea | |
4.125% due 09/09/2015 (a) | | | | | 100 | | | | | | 103 | |
5.375% due 10/04/2016 (a) | | | | | 150 | | | | | | 163 | |
Junta Comunidades de Castilla-La Mancha | |
4.707% due 11/15/2014 | | | | | 50 | | | | | | 49 | |
| | | | | | | | | | | | |
Total Sovereign Issues (Cost $315) | | | 315 | |
| | | | | | | | | | | | |
| | | | | | | | | | | | |
| SHORT-TERM INSTRUMENTS 7.1% | |
| | | | | | | | | | | | |
| CERTIFICATES OF DEPOSIT 2.2% | |
Intesa Sanpaolo SpA | |
1.650% due 04/07/2015 | | | | | 200 | | | | | | 201 | |
| | | | | | | | | | | | |
| | | | | | | | | | | | |
| COMMERCIAL PAPER 4.9% | |
Ford Motor Credit Co. | |
0.720% due 03/02/2015 | | | | | 200 | | | | | | 199 | |
Tesco Treasury Services PLC | |
1.024% due 08/17/2015 | | | | | 250 | | | | | | 247 | |
| | | | | | | | | | | | |
| | | | | | | | | | | 446 | |
| | | | | | | | | | | | |
Total Short-Term Instruments
(Cost $648) | | | 647 | |
| | | | | | | | | | | | |
| |
Total Investments in Securities
(Cost $13,141) | | | 13,186 | |
| | | | | | | | | | | | |
| |
Total Investments 145.4%
(Cost $13,141) | | | $ | | | 13,186 | |
| | | | | | | | | | | | |
Financial Derivative Instruments (b)(c) 0.1% (Cost or Premiums, net $(9)) | | | 8 | |
| |
| Other Assets and Liabilities, net (45.5%) | | | | | | | | | (4,124 | ) |
| | | | | | | | | | | | |
| Net Assets 100.0% | | | $ | | | 9,070 | |
| | | | | | | | | | | | |
| | | | | | |
| 50 | | PIMCO MANAGED ACCOUNTS TRUST | | | | See Accompanying Notes |
October 31, 2014
NOTES TO SCHEDULE OF INVESTMENTS (AMOUNTS IN THOUSANDS*, EXCEPT NUMBER OF CONTRACTS):
| * | A zero balance may reflect actual amounts rounding to less than one thousand. |
BORROWINGS AND OTHER FINANCING TRANSACTIONS
REVERSE REPURCHASE AGREEMENTS:
| | | | | | | | | | | | | | | | | | | | | | | | |
| Counterparty | | Borrowing
Rate | | | Borrowing
Date | | | Maturity
Date | | | Amount
Borrowed (1) | | | Payable for
Reverse
Repurchase
Agreements | |
BPG | | | 0.350 | % | | | 10/02/2014 | | | | 11/03/2014 | | | $ | | | | | (199 | ) | | $ | (199 | ) |
| | | 0.350 | % | | | 10/03/2014 | | | | 11/07/2014 | | | | | | | | (380 | ) | | | (380 | ) |
| | | 0.350 | % | | | 10/08/2014 | | | | 11/06/2014 | | | | | | | | (649 | ) | | | (650 | ) |
| | | 0.350 | % | | | 10/08/2014 | | | | 11/07/2014 | | | | | | | | (97 | ) | | | (97 | ) |
| | | 0.350 | % | | | 10/08/2014 | | | | 11/17/2014 | | | | | | | | (49 | ) | | | (49 | ) |
| | | 0.350 | % | | | 10/10/2014 | | | | 11/03/2014 | | | | | | | | (95 | ) | | | (95 | ) |
| | | 0.350 | % | | | 10/17/2014 | | | | 11/03/2014 | | | | | | | | (95 | ) | | | (95 | ) |
| | | 0.350 | % | | | 10/17/2014 | | | | 11/07/2014 | | | | | | | | (97 | ) | | | (97 | ) |
| | | 0.350 | % | | | 10/17/2014 | | | | 12/01/2014 | | | | | | | | (224 | ) | | | (224 | ) |
| | | 0.350 | % | | | 10/20/2014 | | | | 11/06/2014 | | | | | | | | (196 | ) | | | (196 | ) |
| | | 0.350 | % | | | 10/20/2014 | | | | 11/07/2014 | | | | | | | | (93 | ) | | | (93 | ) |
| | | 0.350 | % | | | 10/20/2014 | | | | 11/20/2014 | | | | | | | | (140 | ) | | | (140 | ) |
| | | 0.360 | % | | | 10/08/2014 | | | | 11/19/2014 | | | | | | | | (94 | ) | | | (94 | ) |
| | | 0.360 | % | | | 10/17/2014 | | | | 11/19/2014 | | | | | | | | (94 | ) | | | (94 | ) |
| | | 0.360 | % | | | 10/20/2014 | | | | 11/19/2014 | | | | | | | | (94 | ) | | | (94 | ) |
| | | 0.360 | % | | | 10/20/2014 | | | | 11/20/2014 | | | | | | | | (475 | ) | | | (475 | ) |
CFR | | | (0.500 | %) | | | 07/30/2014 | | | | 07/29/2016 | | | | | | | | (191 | ) | | | (191 | ) |
DEU | | | 0.230 | % | | | 10/07/2014 | | | | 11/07/2014 | | | | | | | | (283 | ) | | | (283 | ) |
FOB | | | 0.280 | % | | | 10/16/2014 | | | | 11/24/2014 | | | | | | | | (155 | ) | | | (155 | ) |
UBS | | | 0.300 | % | | | 10/02/2014 | | | | 11/06/2014 | | | | | | | | (197 | ) | | | (197 | ) |
| | | 0.340 | % | | | 10/23/2014 | | | | 11/25/2014 | | | | | | | | (404 | ) | | | (404 | ) |
| | | 0.400 | % | | | 10/07/2014 | | | | 11/06/2014 | | | | | | | | (99 | ) | | | (99 | ) |
| | | | | | | | | | | | | | | | | | | | | | | | |
Total Reverse Repurchase Agreements | | | | | | | | | | | | | | | $ | (4,401 | ) |
| | | | | | | | | | | | | | | | | | | | | | | | |
| (1) | The average amount of borrowings while outstanding during the period ended October 31, 2014 was $3,027 at a weighted average interest rate of 0.340%. |
SHORT SALES:
| | | | | | | | | | | | | | | | | | | | | | |
| Counterparty | | Description | | Coupon | | | Maturity
Date | | | Principal
Amount | | | Proceeds | | | Payable for
Short Sales | |
TDM | | U.S. Treasury Bonds | | | 3.125 | % | | | 08/15/2044 | | | $ | 150 | | | $ | (152 | ) | | $ | (152 | ) |
| | | | | | | | | | | | | | | | | | | | | | |
Total Short Sales | | | | | | | | | | | $ | (152 | ) | | $ | (152 | ) |
| | | | | | | | | | | | | | | | | | | | | | |
| | | | | | |
| See Accompanying Notes | | ANNUAL REPORT | | OCTOBER 31, 2014 | | 51 |
Schedule of Investments PIMCO Fixed Income SHares: Series LD (Cont.)
BORROWINGS AND OTHER FINANCING TRANSACTIONS SUMMARY
The following is a summary by counterparty of the market value of Borrowings and Other Financing Transactions and collateral (received)/pledged as of October 31, 2014:
| (a) | Securities with an aggregate market value of $4,598 have been pledged as collateral under the terms of the following master agreements as of October 31, 2014. |
| | | | | | | | | | | | | | | | | | | | | | | | | | | | |
| Counterparty | | Repurchase
Agreement
Proceeds
to be
Received | | | Payable for
Reverse
Repurchase
Agreements | | | Payable for
Sale-Buyback
Transactions | | | Payable for
Short Sales | | | Total
Borrowings and
Other Financing
Transactions | | | Collateral
(Received)/
Pledged | | | Net
Exposure (2) | |
Global/Master Repurchase Agreement | | | | | | | | | | | | | | | | | | | | | | | | | | | | |
BPG | | $ | 0 | | | $ | (3,072 | ) | | $ | 0 | | | $ | 0 | | | $ | (3,072 | ) | | $ | 3,062 | | | $ | (10 | ) |
CFR | | | 0 | | | | (191 | ) | | | 0 | | | | 0 | | | | (191 | ) | | | 201 | | | | 10 | |
DEU | | | 0 | | | | (283 | ) | | | 0 | | | | 0 | | | | (283 | ) | | | 292 | | | | 9 | |
FOB | | | 0 | | | | (155 | ) | | | 0 | | | | 0 | | | | (155 | ) | | | 162 | | | | 7 | |
UBS | | | 0 | | | | (700 | ) | | | 0 | | | | 0 | | | | (700 | ) | | | 880 | | | | 180 | |
| | | | | | | |
Master Securities Forward Transaction Agreement | | | | | | | | | | | | | | | | | | | | | | | | | | | | |
TDM | | | 0 | | | | 0 | | | | 0 | | | | (152 | ) | | | (152 | ) | | | 0 | | | | (152 | ) |
| | | | | | | | | | | | | | | | | | | | | | | | | | | | |
Total Borrowings and Other Financing Transactions | | $ | 0 | | | $ | (4,401 | ) | | $ | 0 | | | $ | (152 | ) | | | | | | | | | | | | |
| | | | | | | | | | | | | | | | | | | | | | | | | | | | |
| (2) | Net Exposure represents the net receivable/(payable) that would be due from/to the counterparty in the event of default. Exposure from borrowings and other financing transactions can only be netted across transactions governed under the same master agreement with the same legal entity. |
(b) FINANCIAL DERIVATIVE INSTRUMENTS: EXCHANGE-TRADED OR CENTRALLY CLEARED
FUTURES CONTRACTS:
| | | | | | | | | | | | | | | | | | | | | | |
| Description | | Type | | Expiration
Month | | | # of
Contracts | | | Unrealized
Appreciation/
(Depreciation) | | | Variation Margin | |
| | | | | | Asset | | | Liability | |
90-Day Eurodollar December Futures | | Long | | | 12/2015 | | | | 18 | | | $ | 5 | | | $ | 0 | | | $ | (1 | ) |
90-Day Eurodollar March Futures | | Long | | | 03/2016 | | | | 16 | | | | 7 | | | | 0 | | | | (1 | ) |
90-Day Eurodollar March Futures | | Short | | | 03/2018 | | | | 17 | | | | (6 | ) | | | 2 | | | | 0 | |
U.S. Treasury 5-Year Note December Futures | | Short | | | 12/2014 | | | | 7 | | | | (6 | ) | | | 1 | | | | 0 | |
United Kingdom 90-Day LIBOR Sterling Interest Rate December Futures | | Short | | | 12/2015 | | | | 22 | | | | (4 | ) | | | 1 | | | | 0 | |
| | | | | | | | | | | | | | | | | | | | | | |
Total Futures Contracts | | | | | | | $ | (4 | ) | | $ | 4 | | | $ | (2 | ) |
| | | | | | | | | | | | | | | | | | | | | | |
SWAP AGREEMENTS:
INTEREST RATE SWAPS
| | | | | | | | | | | | | | | | | | | | | | | | | | | | | | | | | | |
Pay/Receive
Floating Rate | | Floating Rate Index | | Fixed
Rate | | | Maturity
Date | | | Notional
Amount | | | Market
Value | | | Unrealized
Appreciation/
(Depreciation) | | | Variation Margin | |
| | | | | | | | Asset | | | Liability | |
Pay | | 3-Month USD-LIBOR | | | 2.675% | | | | 07/11/2024 | | | $ | | | | | 3,600 | | | $ | 102 | | | $ | 102 | | | $ | 0 | | | $ | (9 | ) |
Receive | | 3-Month USD-LIBOR | | | 3.000% | | | | 07/13/2025 | | | | | | | | 3,600 | | | | (93 | ) | | | (111 | ) | | | 11 | | | | 0 | |
| | | | | | | | | | | | | | | | | | | | | | | | | | | | | | | | | | |
| | | | | | | | | | | | | | | | | | | | $ | 9 | | | $ | (9 | ) | | $ | 11 | | | $ | (9 | ) |
| | | | | | | | | | | | | | | | | | | | | | | | | | | | | | | | | | |
Total Swap Agreements | | | $ | 9 | | | $ | (9 | ) | | $ | 11 | | | $ | (9 | ) |
| | | | | | | | | | | | | | | | | | | | | | | | | | | | | | | | | | |
| | | | | | |
| 52 | | PIMCO MANAGED ACCOUNTS TRUST | | | | See Accompanying Notes |
October 31, 2014
FINANCIAL DERIVATIVE INSTRUMENTS: EXCHANGE-TRADED OR CENTRALLY CLEARED SUMMARY
The following is a summary of the market value and variation margin of Exchange-Traded or Centrally Cleared Financial Derivative Instruments as of October 31, 2014:
Cash of $43 has been pledged as collateral for exchange-traded and centrally cleared financial derivative instruments as of October 31, 2014.
| | | | | | | | | | | | | | | | | | | | | | | | | | | | | | | | |
| | | Financial Derivative Assets | | | | | Financial Derivative Liabilities | |
| | | Market Value | | Variation Margin
Asset | | | Total | | | | | Market Value | | | Variation Margin
Liability | | | Total | |
| | Purchased
Options | | Futures | | | Swap
Agreements | | | | | | Written
Options | | | Futures | | | Swap
Agreements | | |
Total Exchange-Traded or Centrally Cleared | | $ 0 | | $ | 4 | | | $ | 11 | | | $ | 15 | | | | | $ | 0 | | | $ | (2 | ) | | $ | (9 | ) | | $ | (11 | ) |
| | | | | | | | | | | | | | | | | | | | | | | | | | | | | | | | |
(c) FINANCIAL DERIVATIVE INSTRUMENTS: OVER THE COUNTER
FORWARD FOREIGN CURRENCY CONTRACTS:
| | | | | | | | | | | | | | | | | | | | | | | | | | | | |
| Counterparty | | Settlement
Month | | | Currency to
be Delivered | | | Currency to
be Received | | | Unrealized Appreciation/
(Depreciation) | |
| | | | | Asset | | | Liability | |
BOA | | | 11/2014 | | | | EUR | | | | 257 | | | $ | | | | | 344 | | | | $ 22 | | | $ | 0 | |
| | | 12/2014 | | | | GBP | | | | 7 | | | | | | | | 11 | | | | 0 | | | | 0 | |
| | | | | | | | | | | | | | | | | | | | | | | | | | | | |
BPS | | | 11/2014 | | | $ | | | | | 310 | | | | JPY | | | | 33,900 | | | | 0 | | | | (8 | ) |
| | | 12/2014 | | | | GBP | | | | 3 | | | $ | | | | | 5 | | | | 0 | | | | 0 | |
| | | 12/2014 | | | $ | | | | | 193 | | | | GBP | | | | 121 | | | | 0 | | | | 0 | |
| | | | | | | | | | | | | | | | | | | | | | | | | | | | |
BRC | | | 11/2014 | | | | | | | | 129 | | | | EUR | | | | 98 | | | | 0 | | | | (6 | ) |
| | | 11/2014 | | | | | | | | 130 | | | | JPY | | | | 14,300 | | | | 0 | | | | (3 | ) |
| | | | | | | | | | | | | | | | | | | | | | | | | | | | |
FBF | | | 12/2014 | | | | | | | | 46 | | | | GBP | | | | 28 | | | | 0 | | | | (1 | ) |
| | | | | | | | | | | | | | | | | | | | | | | | | | | | |
GLM | | | 11/2014 | | | | | | | | 7 | | | | EUR | | | | 5 | | | | 0 | | | | 0 | |
| | | | | | | | | | | | | | | | | | | | | | | | | | | | |
JPM | | | 11/2014 | | | | JPY | | | | 47,867 | | | $ | | | | | 440 | | | | 14 | | | | 0 | |
| | | 11/2014 | | | $ | | | | | 159 | | | | EUR | | | | 123 | | | | 0 | | | | (5 | ) |
| | | | | | | | | | | | | | | | | | | | | | | | | | | | |
Total Forward Foreign Currency Contracts | | | | | | | | $ 36 | | | $ | (23 | ) |
| | | | | | | | | | | | | | | | | | | | | | | | | | | | |
PURCHASED OPTIONS:
INTEREST RATE SWAPTIONS
| | | | | | | | | | | | | | | | | | | | | | | | | | | | |
| Counterparty | | Description | | Floating Rate Index | | Pay/Receive
Floating Rate | | | Exercise
Rate | | | Expiration
Date | | | Notional
Amount | | | Cost | | | Market
Value | |
BRC | | Put - OTC 1-Year Interest Rate Swap | | 3-Month USD-LIBOR | | | Receive | | | | 1.050% | | | | 07/21/2015 | | | $ | 5,300 | | | $ | 13 | | | $ | 5 | |
| | | | | | | | | | | | | | | | | | | | | | | | | | | | |
Total Purchased Options | | | | | | | | | | | | | | | $ | 13 | | | $ | 5 | |
| | | | | | | | | | | | | | | | | | | | | | | | | | | | |
| | | | | | |
| See Accompanying Notes | | ANNUAL REPORT | | OCTOBER 31, 2014 | | 53 |
Schedule of Investments PIMCO Fixed Income SHares: Series LD (Cont.)
WRITTEN OPTIONS:
INTEREST RATE SWAPTIONS
| | | | | | | | | | | | | | | | | | | | | | | | | | |
| Counterparty | | Description | | Floating Rate Index | | Pay/
Receive
Floating
Rate | | Exercise
Rate | | | Expiration
Date | | | Notional
Amount | | | Premiums
(Received) | | | Market
Value | |
BRC | | Put - OTC 1-Year Interest Rate Swap | | 3-Month USD-LIBOR | | Pay | | | 1.340% | | | | 07/21/2015 | | | $ | 5,300 | | | $ | (8 | ) | | $ | (2 | ) |
| | Put - OTC 1-Year Interest Rate Swap | | 3-Month USD-LIBOR | | Pay | | | 1.545% | | | | 07/21/2015 | | | | 5,300 | | | | (5 | ) | | | (2 | ) |
| | | | | | | | | | | | | | | | | | | | | | | | | | |
JPM | | Call - OTC 1-Year Interest Rate Swap (Effective 07/23/2018) | | 3-Month USD-LIBOR | | Receive | | | 3.000% | | | | 07/21/2015 | | | | 1,365 | | | | (5 | ) | | | (6 | ) |
| | | | | | | | | | | | | | | | | | | | | | | | | | |
| | | | | | | | | | | | | | | | | | | | $ | (18 | ) | | $ | (10 | ) |
| | | | | | | | | | | | | | | | | | | | | | | | | | |
Total Written Options | | | | | | | | | | | | | | | | $ | (18 | ) | | $ | (10 | ) |
| | | | | | | | | | | | | | | | | | | | | | | | | | |
TRANSACTIONS IN WRITTEN CALL AND PUT OPTIONS FOR THE PERIOD ENDED OCTOBER 31, 2014:
| | | | | | | | |
| | | Notional
Amount | | | Premiums | |
Balance at Beginning of Period | | $ | 0 | | | $ | 0 | |
Sales | | | 12,365 | | | | (22 | ) |
Closing Buys | | | (400 | ) | | | 4 | |
Expirations | | | 0 | | | | 0 | |
Exercised | | | 0 | | | | 0 | |
| | | | | | | | |
Balance at End of Period | | $ | 11,965 | | | $ | (18 | ) |
| | | | | | | | |
SWAP AGREEMENTS:
CREDIT DEFAULT SWAPS ON CORPORATE ISSUES - SELL PROTECTION (1)
| | | | | | | | | | | | | | | | | | | | | | | | | | | | | | | | | | |
| Counterparty | | Reference Entity | | Fixed Deal
Receive Rate | | | Maturity
Date | | | Implied
Credit
Spread at
October 31,
2014 (2) | | | Notional
Amount (3) | | | Premiums
(Received) | | | Unrealized
Appreciation/
(Depreciation) | | | Swap Agreements,
at Value | |
| | | | | | | | | Asset | | | Liability | |
| MYC | | Domtar Corp. | | | 1.000% | | | | 09/20/2019 | | | | 1.681% | | | $ | 100 | | | $ | (3 | ) | | $ | 0 | | | $ | 0 | | | $ | (3 | ) |
| | | | | | | | | | | | | | | | | | | | | | | | | | | | | | | | | | |
CREDIT DEFAULT SWAPS ON CREDIT INDICES - SELL PROTECTION (1)
| | | | | | | | | | | | | | | | | | | | | | | | | | | | | | |
| Counterparty | | Index/Tranches | | Fixed Deal
Receive Rate | | | Maturity
Date | | | Notional
Amount (3) | | | Premiums
Paid/(Received) | | | Unrealized
Appreciation/
(Depreciation) | | | Swap Agreements,
at Value (4) | |
| | | | | | | | Asset | | | Liability | |
FBF | | CMBX.NA.AAA.1 Index | | | 0.100% | | | | 10/12/2052 | | | $ | 90 | | | $ | (1 | ) | | $ | 0 | | | $ | 0 | | | $ | (1 | ) |
| | | | | | | | | | | | | | | | | | | | | | | | | | | | | | |
GST | | CMBX.NA.AAA.1 Index | | | 0.100% | | | | 10/12/2052 | | | | 90 | | | | 0 | | | | 0 | | | | 0 | | | | 0 | |
| | | | | | | | | | | | | | | | | | | | | | | | | | | | | | |
| | | | | | | | | | | | | | | | $ | (1 | ) | | $ | 0 | | | $ | 0 | | | $ | (1 | ) |
| | | | | | | | | | | | | | | | | | | | | | | | | | | | | | |
Total Swap Agreements | | | | | | | | | | | $ | (4 | ) | | $ | 0 | | | $ | 0 | | | $ | (4 | ) |
| | | | | | | | | | | | | | | | | | | | | | | | | | | | | | |
| (1) | If the Portfolio is a seller of protection and a credit event occurs, as defined under the terms of that particular swap agreement, the Portfolio will either (i) pay to the buyer of protection an amount equal to the notional amount of the swap and take delivery of the referenced obligation or underlying securities comprising the referenced index or (ii) pay a net settlement amount in the form of cash or securities equal to the notional amount of the swap less the recovery value of the referenced obligation or underlying securities comprising the referenced index. |
| | | | | | |
| 54 | | PIMCO MANAGED ACCOUNTS TRUST | | | | See Accompanying Notes |
October 31, 2014
| (2) | Implied credit spreads, represented in absolute terms, utilized in determining the market value of credit default swap agreements on corporate issues as of period end serve as an indicator of the current status of the payment/performance risk and represent the likelihood or risk of default for the credit derivative. The implied credit spread of a particular referenced entity reflects the cost of buying/selling protection and may include upfront payments required to be made to enter into the agreement. Wider credit spreads represent a deterioration of the referenced entity’s credit soundness and a greater likelihood or risk of default or other credit event occurring as defined under the terms of the agreement. |
| (3) | The maximum potential amount the Portfolio could be required to pay as a seller of credit protection or receive as a buyer of credit protection if a credit event occurs as defined under the terms of that particular swap agreement. |
| (4) | The prices and resulting values for credit default swap agreements on credit indices serve as an indicator of the current status of the payment/performance risk and represent the likelihood of an expected liability (or profit) for the credit derivative should the notional amount of the swap agreement be closed/sold as of the period end. Increasing market values, in absolute terms when compared to the notional amount of the swap, represent a deterioration of the referenced indices’ credit soundness and a greater likelihood or risk of default or other credit event occurring as defined under the terms of the agreement. |
FINANCIAL DERIVATIVE INSTRUMENTS: OVER THE COUNTER SUMMARY
The following is a summary by counterparty of the market value of OTC financial derivative instruments and collateral (received)/pledged as of October 31, 2014:
| | | | | | | | | | | | | | | | | | | | | | | | | | | | | | | | | | | | | | | | | | | | | | |
| | | Financial Derivative Assets | | | | | Financial Derivative Liabilities | | | | | | | | | | |
| Counterparty | | Forward
Foreign
Currency
Contracts | | | Purchased
Options | | | Swap
Agreements | | | Total
Over
the
Counter | | | | | Forward
Foreign
Currency
Contracts | | | Written
Options | | | Swap
Agreements | | | Total
Over
the
Counter | | | Net Market
Value of
OTC
Derivatives | | | Collateral
(Received)/
Pledged | | | Net
Exposure (5) | |
BOA | | $ | 22 | | | $ | 0 | | | $ | 0 | | | $ | 22 | | | | | $ | 0 | | | $ | 0 | | | $ | 0 | | | $ | 0 | | | $ | 22 | | | $ | 0 | | | $ | 22 | |
BPS | | | 0 | | | | 0 | | | | 0 | | | | 0 | | | | | | (8 | ) | | | 0 | | | | 0 | | | | (8 | ) | | | (8 | ) | | | 0 | | | | (8 | ) |
BRC | | | 0 | | | | 5 | | | | 0 | | | | 5 | | | | | | (9 | ) | | | (4 | ) | | | 0 | | | | (13 | ) | | | (8 | ) | | | 0 | | | | (8 | ) |
FBF | | | 0 | | | | 0 | | | | 0 | | | | 0 | | | | | | (1 | ) | | | 0 | | | | (1 | ) | | | (2 | ) | | | (2 | ) | | | 0 | | | | (2 | ) |
JPM | | | 14 | | | | 0 | | | | 0 | | | | 14 | | | | | | (5 | ) | | | (6 | ) | | | 0 | | | | (11 | ) | | | 3 | | | | 0 | | | | 3 | |
MYC | | | 0 | | | | 0 | | | | 0 | | | | 0 | | | | | | 0 | | | | 0 | | | | (3 | ) | | | (3 | ) | | | (3 | ) | | | 0 | | | | (3 | ) |
| | | | | | | | | | | | | | | | | | | | | | | | | | | | | | | | | | | | | | | | | | | | | | |
Total Over
the Counter | | $ | 36 | | | $ | 5 | | | $ | 0 | | | $ | 41 | | | | | $ | (23 | ) | | $ | (10 | ) | | $ | (4 | ) | | $ | (37 | ) | | | | | | | | | | | | |
| | | | | | | | | | | | | | | | | | | | | | | | | | | | | | | | | | | | | | | | | | | | | | |
| (5) | Net Exposure represents the net receivable/(payable) that would be due from/to the counterparty in the event of default. Exposure from OTC financial derivative instruments can only be netted across transactions governed under the same master agreement with the same legal entity. |
| | | | | | |
| See Accompanying Notes | | ANNUAL REPORT | | OCTOBER 31, 2014 | | 55 |
Schedule of Investments PIMCO Fixed Income SHares: Series LD (Cont.)
FAIR VALUE OF FINANCIAL DERIVATIVE INSTRUMENTS
The following is a summary of the fair valuation of the Portfolio’s derivative instruments categorized by risk exposure. See Note 7, Principal Risks, in the Notes to Financial Statements on risks of the Portfolio.
Fair Values of Financial Derivative Instruments on the Statements of Assets and Liabilities as of October 31, 2014:
| | | | | | | | | | | | | | | | | | | | | | | | |
| | | Derivatives not accounted for as hedging instruments | |
| | | Commodity
Contracts | | | Credit
Contracts | | | Equity
Contracts | | | Foreign
Exchange
Contracts | | | Interest
Rate Contracts | | | Total | |
Financial Derivative Instruments - Assets | | | | | | | | | | | | | | | | | | | | | | | | |
Exchange-traded or centrally cleared | | | | | | | | | | | | | | | | | | | | | | | | |
Futures | | $ | 0 | | | $ | 0 | | | $ | 0 | | | $ | 0 | | | $ | 4 | | | $ | 4 | |
Swap Agreements | | | 0 | | | | 0 | | | | 0 | | | | 0 | | | | 11 | | | | 11 | |
| | | | | | | | | | | | | | | | | | | | | | | | |
| | $ | 0 | | | $ | 0 | | | $ | 0 | | | $ | 0 | | | $ | 15 | | | $ | 15 | |
| | | | | | | | | | | | | | | | | | | | | | | | |
Over the counter | | | | | | | | | | | | | | | | | | | | | | | | |
Forward Foreign Currency Contracts | | $ | 0 | | | $ | 0 | | | $ | 0 | | | $ | 36 | | | $ | 0 | | | $ | 36 | |
Purchased Options | | | 0 | | | | 0 | | | | 0 | | | | 0 | | | | 5 | | | | 5 | |
| | | | | | | | | | | | | | | | | | | | | | | | |
| | $ | 0 | | | $ | 0 | | | $ | 0 | | | $ | 36 | | | $ | 5 | | | $ | 41 | |
| | | | | | | | | | | | | | | | | | | | | | | | |
| | $ | 0 | | | $ | 0 | | | $ | 0 | | | $ | 36 | | | $ | 20 | | | $ | 56 | |
| | | | | | | | | | | | | | | | | | | | | | | | |
| | | | | | |
Financial Derivative Instruments - Liabilities | | | | | | | | | | | | | | | | | | | | | | | | |
Exchange-traded or centrally cleared | | | | | | | | | | | | | | | | | | | | | | | | |
Futures | | $ | 0 | | | $ | 0 | | | $ | 0 | | | $ | 0 | | | $ | 2 | | | $ | 2 | |
Swap Agreements | | | 0 | | | | 0 | | | | 0 | | | | 0 | | | | 9 | | | | 9 | |
| | | | | | | | | | | | | | | | | | | | | | | | |
| | $ | 0 | | | $ | 0 | | | $ | 0 | | | $ | 0 | | | $ | 11 | | | $ | 11 | |
| | | | | | | | | | | | | | | | | | | | | | | | |
Over the counter | | | | | | | | | | | | | | | | | | | | | | | | |
Forward Foreign Currency Contracts | | $ | 0 | | | $ | 0 | | | $ | 0 | | | $ | 23 | | | $ | 0 | | | $ | 23 | |
Written Options | | | 0 | | | | 0 | | | | 0 | | | | 0 | | | | 10 | | | | 10 | |
Swap Agreements | | | 0 | | | | 4 | | | | 0 | | | | 0 | | | | 0 | | | | 4 | |
| | | | | | | | | | | | | | | | | | | | | | | | |
| | $ | 0 | | | $ | 4 | | | $ | 0 | | | $ | 23 | | | $ | 10 | | | $ | 37 | |
| | | | | | | | | | | | | | | | | | | | | | | | |
| | $ | 0 | | | $ | 4 | | | $ | 0 | | | $ | 23 | | | $ | 21 | | | $ | 48 | |
| | | | | | | | | | | | | | | | | | | | | | | | |
The Effect of Financial Derivative Instruments on the Statements of Operations for the Period Ended October 31, 2014:
| | | | | | | | | | | | | | | | | | | | | | | | |
| | | Derivatives not accounted for as hedging instruments | |
| | | Commodity
Contracts | | | Credit
Contracts | | | Equity
Contracts | | | Foreign
Exchange
Contracts | | | Interest
Rate Contracts | | | Total | |
Net Realized Gain (Loss) on Financial Derivative Instruments | | | | | | | | | | | | | | | | | | | | | | | | |
Exchange-traded or centrally cleared | | | | | | | | | | | | | | | | | | | | | | | | |
Swap Agreements | | $ | 0 | | | $ | 0 | | | $ | 0 | | | $ | 0 | | | $ | (2 | ) | | $ | (2 | ) |
| | | | | | | | | | | | | | | | | | | | | | | | |
Over the counter | | | | | | | | | | | | | | | | | | | | | | | | |
Forward Foreign Currency Contracts | | $ | 0 | | | $ | 0 | | | $ | 0 | | | $ | 57 | | | $ | 0 | | | $ | 57 | |
Purchased Options | | | 0 | | | | 0 | | | | 0 | | | | 0 | | | | 5 | | | | 5 | |
Swap Agreements | | | 0 | | | | 1 | | | | 0 | | | | 0 | | | | 0 | | | | 1 | |
| | | | | | | | | | | | | | | | | | | | | | | | |
| | $ | 0 | | | $ | 1 | | | $ | 0 | | | $ | 57 | | | $ | 5 | | | $ | 63 | |
| | | | | | | | | | | | | | | | | | | | | | | | |
| | $ | 0 | | | $ | 1 | | | $ | 0 | | | $ | 57 | | | $ | 3 | | | $ | 61 | |
| | | | | | | | | | | | | | | | | | | | | | | | |
| | | | | | |
| 56 | | PIMCO MANAGED ACCOUNTS TRUST | | | | See Accompanying Notes |
October 31, 2014
| | | | | | | | | | | | | | | | | | | | | | | | |
| | | Derivatives not accounted for as hedging instruments | |
| | | Commodity
Contracts | | | Credit
Contracts | | | Equity
Contracts | | | Foreign
Exchange
Contracts | | | Interest
Rate Contracts | | | Total | |
Net Change in Unrealized Appreciation (Depreciation) on Financial Derivative Instruments | | | | | | | | | | | | | | | | | | | | | | | | |
Exchange-traded or centrally cleared | | | | | | | | | | | | | | | | | | | | | | | | |
Futures | | $ | 0 | | | $ | 0 | | | $ | 0 | | | $ | 0 | | | $ | (3 | ) | | $ | (3 | ) |
Swap Agreements | | | 0 | | | | 0 | | | | 0 | | | | 0 | | | | (9 | ) | | | (9 | ) |
| | | | | | | | | | | | | | | | | | | | | | | | |
| | $ | 0 | | | $ | 0 | | | $ | 0 | | | $ | 0 | | | $ | (12 | ) | | $ | (12 | ) |
| | | | | | | | | | | | | | | | | | | | | | | | |
Over the counter | | | | | | | | | | | | | | | | | | | | | | | | |
Forward Foreign Currency Contracts | | $ | 0 | | | $ | 0 | | | $ | 0 | | | $ | 12 | | | $ | 0 | | | $ | 12 | |
Purchased Options | | | 0 | | | | 0 | | | | 0 | | | | 0 | | | | (9 | ) | | | (9 | ) |
Written Options | | | 0 | | | | 0 | | | | 0 | | | | 0 | | | | 9 | | | | 9 | |
Swap Agreements | | | 0 | | | | 1 | | | | 0 | | | | 0 | | | | 0 | | | | 1 | |
| | | | | | | | | | | | | | | | | | | | | | | | |
| | $ | 0 | | | $ | 1 | | | $ | 0 | | | $ | 12 | | | $ | 0 | | | $ | 13 | |
| | | | | | | | | | | | | | | | | | | | | | | | |
| | $ | 0 | | | $ | 1 | | | $ | 0 | | | $ | 12 | | | $ | (12 | ) | | $ | 1 | |
| | | | | | | | | | | | | | | | | | | | | | | | |
FAIR VALUE MEASUREMENTS
The following is a summary of the fair valuations according to the inputs used as of October 31, 2014 in valuing the Portfolio’s assets and liabilities:
| | | | | | | | | | | | | | | | |
| Category and Subcategory | | Level 1 | | | Level 2 | | | Level 3 | | | Fair
Value at
10/31/2014 | |
Investments in Securities, at Value | | | | | | | | | | | | | | | | |
Corporate Bonds & Notes | | | | | | | | | | | | | | | | |
Banking & Finance | | $ | 0 | | | $ | 3,714 | | | $ | 0 | | | $ | 3,714 | |
Industrials | | | 0 | | | | 4,148 | | | | 0 | | | | 4,148 | |
Utilities | | | 0 | | | | 1,109 | | | | 0 | | | | 1,109 | |
U.S. Government Agencies | | | 0 | | | | 292 | | | | 0 | | | | 292 | |
Mortgage-Backed Securities | | | 0 | | | | 1,928 | | | | 0 | | | | 1,928 | |
Asset-Backed Securities | | | 0 | | | | 1,033 | | | | 0 | | | | 1,033 | |
Sovereign Issues | | | 0 | | | | 315 | | | | 0 | | | | 315 | |
Short-Term Instruments | | | | | | | | | | | | | | | | |
Certificates of Deposit | | | 0 | | | | 201 | | | | 0 | | | | 201 | |
Commercial Paper | | | 0 | | | | 446 | | | | 0 | | | | 446 | |
| | | | |
Total Investments | | $ | 0 | | | $ | 13,186 | | | $ | 0 | | | $ | 13,186 | |
| | | | |
Short Sales, at Value - Liabilities | | | | | | | | | | | | | | | | |
U.S. Treasury Obligations | | $ | 0 | | | $ | (152 | ) | | $ | 0 | | | $ | (152 | ) |
| | | | |
Financial Derivative Instruments - Assets | | | | | | | | | | | | | | | | |
Exchange-traded or centrally cleared | | | 4 | | | | 11 | | | | 0 | | | | 15 | |
Over the counter | | | 0 | | | | 41 | | | | 0 | | | | 41 | |
| | $ | 4 | | | $ | 52 | | | $ | 0 | | | $ | 56 | |
| | | | |
Financial Derivative Instruments - Liabilities | | | | | | | | | | | | | | | | |
Exchange-traded or centrally cleared | | | (2 | ) | | | (9 | ) | | | 0 | | | | (11 | ) |
Over the counter | | | 0 | | | | (37 | ) | | | 0 | | | | (37 | ) |
| | $ | (2 | ) | | $ | (46 | ) | | $ | 0 | | | $ | (48 | ) |
| | | | |
Totals | | $ | 2 | | | $ | 13,040 | | | $ | 0 | | | $ | 13,042 | |
There were no significant transfers between Level 1, 2, and 3 during the period ended October 31, 2014.
| | | | | | |
| See Accompanying Notes | | ANNUAL REPORT | | OCTOBER 31, 2014 | | 57 |
Schedule of Investments PIMCO Fixed Income SHares: Series M
| | | | | | | | | | | | |
| | | | | PRINCIPAL
AMOUNT
(000S) | | | | | MARKET
VALUE (000S) | |
| INVESTMENTS IN SECURITIES 142.7% | |
| |
| CORPORATE BONDS & NOTES 51.6% | |
| |
| BANKING & FINANCE 26.1% | |
AerCap Ireland Capital Ltd. | |
5.000% due 10/01/2021 | | $ | | | 17,800 | | | $ | | | 18,556 | |
Ally Financial, Inc. | |
2.750% due 01/30/2017 | | | | | 100 | | | | | | 100 | |
8.300% due 02/12/2015 | | | | | 100 | | | | | | 102 | |
American International Group, Inc. | |
6.250% due 05/01/2036 | | | | | 6,000 | | | | | | 7,610 | |
Banco Santander Brasil S.A. | |
4.250% due 01/14/2016 | | | | | 6,800 | | | | | | 7,021 | |
Banco Santander Chile | |
3.875% due 09/20/2022 | | | | | 5,000 | | | | | | 5,016 | |
Banco Santander Mexico S.A. Institucion de Banca Multiple Grupo Financiero Santander | |
4.125% due 11/09/2022 (e) | | | | | 41,700 | | | | | | 42,325 | |
4.125% due 11/09/2022 | | | | | 5,900 | | | | | | 5,988 | |
Bank of America Corp. | |
5.000% due 05/13/2021 | | | | | 300 | | | | | | 332 | |
5.625% due 07/01/2020 (e) | | | | | 14,600 | | | | | | 16,601 | |
5.700% due 01/24/2022 (e) | | | | | 20,000 | | | | | | 23,053 | |
Bank of Nova Scotia | |
1.650% due 10/29/2015 | | | | | 15,680 | | | | | | 15,856 | |
Bankia S.A. | |
3.500% due 12/14/2015 | | EUR | | | 1,400 | | | | | | 1,818 | |
3.625% due 10/05/2016 | | | | | 700 | | | | | | 933 | |
4.250% due 07/05/2016 | | | | | 100 | | | | | | 134 | |
Banque PSA Finance S.A. | |
5.750% due 04/04/2021 | | $ | | | 17,700 | | | | | | 18,806 | |
Barclays Bank PLC | |
7.625% due 11/21/2022 | | | | | 6,700 | | | | | | 7,311 | |
7.750% due 04/10/2023 | | | | | 2,600 | | | | | | 2,853 | |
10.000% due 05/21/2021 | | GBP | | | 17,200 | | | | | | 35,914 | |
10.179% due 06/12/2021 | | $ | | | 12,280 | | | | | | 16,530 | |
14.000% due 06/15/2019 (b) | | GBP | | | 3,500 | | | | | | 7,307 | |
Blackstone CQP Holdco LP | |
9.296% due 03/18/2019 | | $ | | | 73,055 | | | | | | 73,356 | |
BPCE S.A. | |
4.625% due 07/11/2024 | | | | | 13,600 | | | | | | 13,437 | |
CIT Group, Inc. | |
4.250% due 08/15/2017 | | | | | 7,000 | | | | | | 7,210 | |
5.000% due 05/15/2017 | | | | | 100 | | | | | | 105 | |
Cooperatieve Centrale Raiffeisen-Boerenleenbank BA | |
4.750% due 01/15/2020 (e) | | | | | 36,900 | | | | | | 41,008 | |
Corp. Financiera de Desarrollo S.A. | |
4.750% due 02/08/2022 | | | | | 7,000 | | | | | | 7,350 | |
Credit Suisse AG | |
6.500% due 08/08/2023 | | | | | 19,000 | | | | | | 20,995 | |
| | | | | | | | | | | | |
| | | | | PRINCIPAL
AMOUNT
(000S) | | | | | MARKET
VALUE (000S) | |
Ford Motor Credit Co. LLC | |
5.750% due 02/01/2021 | | $ | | | 15,000 | | | $ | | | 17,183 | |
8.125% due 01/15/2020 | | | | | 4,605 | | | | | | 5,761 | |
General Electric Capital Corp. | |
6.150% due 08/07/2037 | | | | | 1,000 | | | | | | 1,268 | |
General Motors Financial Co., Inc. | |
4.250% due 05/15/2023 (e) | | | | | 10,930 | | | | | | 11,285 | |
Goldman Sachs Group, Inc. | |
4.000% due 03/03/2024 (e) | | | | | 13,400 | | | | | | 13,703 | |
Hospitality Properties Trust | |
5.000% due 08/15/2022 | | | | | 8,500 | | | | | | 8,971 | |
HSBC Finance Corp. | |
6.676% due 01/15/2021 | | | | | 19,600 | | | | | | 23,146 | |
HSBC Holdings PLC | |
4.250% due 03/14/2024 (e) | | | | | 30,700 | | | | | | 31,607 | |
6.500% due 05/02/2036 | | | | | 6,100 | | | | | | 7,657 | |
ICICI Bank Ltd. | |
4.750% due 11/25/2016 | | | | | 6,700 | | | | | | 7,045 | |
International Lease Finance Corp. | |
5.875% due 04/01/2019 | | | | | 285 | | | | | | 308 | |
Intesa Sanpaolo SpA | |
6.500% due 02/24/2021 | | | | | 4,000 | | | | | | 4,646 | |
KGH Intermediate Holdco LLC | |
8.500% due 08/07/2019 (c) | | | | | 13,275 | | | | | | 13,275 | |
8.500% due 08/08/2019 (c) | | | | | 4,425 | | | | | | 4,425 | |
Navient Corp. | |
5.050% due 11/14/2014 | | | | | 3,400 | | | | | | 3,402 | |
6.250% due 01/25/2016 | | | | | 300 | | | | | | 313 | |
Ohio National Financial Services, Inc. | |
6.375% due 04/30/2020 | | | | | 1,500 | | | | | | 1,732 | |
OMX Timber Finance Investments LLC | |
5.420% due 01/29/2020 | | | | | 10,000 | | | | | | 11,152 | |
Qatari Diar Finance Co. | |
5.000% due 07/21/2020 | | | | | 2,000 | | | | | | 2,260 | |
Sberbank of Russia Via SB Capital S.A. | |
5.400% due 03/24/2017 | | | | | 4,950 | | | | | | 5,035 | |
5.717% due 06/16/2021 | | | | | 350 | | | | | | 343 | |
6.125% due 02/07/2022 | | | | | 600 | | | | | | 603 | |
Springleaf Finance Corp. | |
5.400% due 12/01/2015 | | | | | 100 | | | | | | 104 | |
Temasek Financial Ltd. | |
4.300% due 10/25/2019 | | | | | 10,000 | | | | | | 11,062 | |
UBS AG | |
2.375% due 08/14/2019 | | | | | 10,200 | | | | | | 10,219 | |
4.875% due 08/04/2020 | | | | | 9,663 | | | | | | 10,844 | |
Wells Fargo Bank N.A. | |
6.600% due 01/15/2038 | | | | | 3,000 | | | | | | 4,096 | |
| | | | | | | | | | | | |
| | | | | | | | | | | 609,072 | |
| | | | | | | | | | | | |
| | | | | | | | | | | | |
| | | | | | |
| 58 | | PIMCO MANAGED ACCOUNTS TRUST | | | | See Accompanying Notes |
October 31, 2014
| | | | | | | | | | | | |
| | | | | PRINCIPAL
AMOUNT
(000S) | | | | | MARKET
VALUE (000S) | |
| INDUSTRIALS 13.7% | |
Activision Blizzard, Inc. | |
5.625% due 09/15/2021 | | $ | | | 4,000 | | | $ | | | 4,265 | |
Aviation Capital Group Corp. | |
6.750% due 04/06/2021 | | | | | 9,800 | | | | | | 11,221 | |
Clear Channel Worldwide Holdings, Inc. | |
6.500% due 11/15/2022 | | | | | 11,250 | | | | | | 11,684 | |
CNH Industrial Finance Europe S.A. | |
6.250% due 03/09/2018 | | EUR | | | 1,000 | | | | | | 1,405 | |
CSC Holdings LLC | |
7.625% due 07/15/2018 | | $ | | | 2,200 | | | | | | 2,500 | |
7.875% due 02/15/2018 | | | | | 7,340 | | | | | | 8,322 | |
CSN Islands Corp. | |
10.000% due 01/15/2015 | | | | | 5,600 | | | | | | 5,722 | |
CVS Pass-Through Trust | |
7.507% due 01/10/2032 | | | | | 13,461 | | | | | | 17,171 | |
Domtar Corp. | |
6.750% due 02/15/2044 | | | | | 700 | | | | | | 768 | |
Ecopetrol S.A. | |
5.875% due 09/18/2023 | | | | | 15,100 | | | | | | 16,874 | |
7.625% due 07/23/2019 | | | | | 7,245 | | | | | | 8,676 | |
Europcar Groupe S.A. | |
11.500% due 05/15/2017 | | EUR | | | 2,100 | | | | | | 2,967 | |
Fiat Chrysler Finance Europe | |
7.000% due 03/23/2017 | | | | | 4,300 | | | | | | 5,923 | |
Financiere Quick S.A.S. | |
4.832% due 04/15/2019 | | | | | 4,600 | | | | | | 5,217 | |
Florida Gas Transmission Co. LLC | |
7.900% due 05/15/2019 | | $ | | | 5,000 | | | | | | 6,085 | |
Georgia-Pacific LLC | |
5.400% due 11/01/2020 | | | | | 4,900 | | | | | | 5,606 | |
7.750% due 11/15/2029 | | | | | 5,100 | | | | | | 7,159 | |
8.000% due 01/15/2024 | | | | | 4,200 | | | | | | 5,678 | |
Gerdau Trade, Inc. | |
5.750% due 01/30/2021 | | | | | 12,500 | | | | | | 13,346 | |
GTL Trade Finance, Inc. | |
5.893% due 04/29/2024 | | | | | 9,000 | | | | | | 9,360 | |
HCA, Inc. | |
5.875% due 03/15/2022 | | | | | 5,000 | | | | | | 5,500 | |
6.500% due 02/15/2020 | | | | | 10,300 | | | | | | 11,536 | |
Kinder Morgan Energy Partners LP | |
5.300% due 09/15/2020 | | | | | 10,500 | | | | | | 11,558 | |
6.850% due 02/15/2020 | | | | | 5,000 | | | | | | 5,892 | |
Lafarge S.A. | |
6.250% due 04/13/2018 | | EUR | | | 1,200 | | | | | | 1,718 | |
NBCUniversal Media LLC | |
4.375% due 04/01/2021 (e) | | $ | | | 10,000 | | | | | | 10,997 | |
Petrobras International Finance Co. S.A. | |
6.875% due 01/20/2040 (e) | | | | | 22,150 | | | | | | 23,454 | |
Petroleum Co. of Trinidad & Tobago Ltd. | |
9.750% due 08/14/2019 | | | | | 14,565 | | | | | | 18,315 | |
| | | | | | | | | | | | |
| | | | | PRINCIPAL
AMOUNT
(000S) | | | | | MARKET
VALUE (000S) | |
Reynolds Group Issuer, Inc. | |
7.125% due 04/15/2019 | | $ | | | 5,300 | | | $ | | | 5,519 | |
7.875% due 08/15/2019 | | | | | 1,900 | | | | | | 2,040 | |
Sabine Pass Liquefaction LLC | |
5.625% due 02/01/2021 | | | | | 3,800 | | | | | | 4,000 | |
Southwestern Energy Co. | |
4.100% due 03/15/2022 | | | | | 12,300 | | | | | | 12,518 | |
Telenet Finance Luxembourg S.C.A. | |
6.250% due 08/15/2022 | | EUR | | | 3,500 | | | | | | 4,770 | |
6.625% due 02/15/2021 | | | | | 1,500 | | | | | | 2,016 | |
6.750% due 08/15/2024 | | | | | 6,000 | | | | | | 8,426 | |
UPC Holding BV | |
8.375% due 08/15/2020 | | | | | 4,000 | | | | | | 5,407 | |
Wind Acquisition Finance S.A. | |
4.000% due 07/15/2020 | | | | | 28,200 | | | | | | 34,941 | |
| | | | | | | | | | | | |
| | | | | | | | | | | 318,556 | |
| | | | | | | | | | | | |
| | | | | | | | | | | | |
| UTILITIES 11.8% | |
BG Energy Capital PLC | |
6.500% due 11/30/2072 | | GBP | | | 2,000 | | | | | | 3,461 | |
6.500% due 11/30/2072 | | $ | | | 4,000 | | | | | | 4,376 | |
Centrais Eletricas Brasileiras S.A. | |
6.875% due 07/30/2019 | | | | | 12,810 | | | | | | 14,059 | |
Dynegy Finance, Inc. | |
6.750% due 11/01/2019 | | | | | 8,000 | | | | | | 8,290 | |
7.375% due 11/01/2022 | | | | | 5,900 | | | | | | 6,247 | |
7.625% due 11/01/2024 | | | | | 2,100 | | | | | | 2,229 | |
Gazprom OAO Via Gaz Capital S.A. | |
5.999% due 01/23/2021 | | | | | 200 | | | | | | 205 | |
6.212% due 11/22/2016 | | | | | 4,750 | | | | | | 4,958 | |
6.510% due 03/07/2022 | | | | | 400 | | | | | | 420 | |
8.146% due 04/11/2018 | | | | | 16,700 | | | | | | 18,531 | |
8.625% due 04/28/2034 | | | | | 2,500 | | | | | | 2,952 | |
9.250% due 04/23/2019 | | | | | 20,250 | | | | | | 23,494 | |
Novatek OAO Via Novatek Finance Ltd. | |
4.422% due 12/13/2022 | | | | | 4,300 | | | | | | 3,816 | |
6.604% due 02/03/2021 | | | | | 29,800 | | | | | | 30,544 | |
Odebrecht Drilling Norbe Ltd. | |
6.350% due 06/30/2021 | | | | | 175 | | | | | | 186 | |
Petrobras Global Finance BV | |
5.625% due 05/20/2043 | | | | | 3,100 | | | | | | 2,844 | |
6.250% due 03/17/2024 (e) | | | | | 48,400 | | | | | | 51,390 | |
7.250% due 03/17/2044 | | | | | 3,300 | | | | | | 3,633 | |
Petroleos Mexicanos | |
5.500% due 01/21/2021 | | | | | 12,300 | | | | | | 13,660 | |
5.500% due 02/24/2025 | | EUR | | | 13,000 | | | | | | 20,407 | |
6.500% due 06/02/2041 (e) | | $ | | | 31,450 | | | | | | 36,954 | |
6.625% due 06/15/2035 | | | | | 500 | | | | | | 593 | |
6.625% due 06/15/2038 | | | | | 1,300 | | | | | | 1,516 | |
Rosneft Finance S.A. | |
6.250% due 02/02/2015 | | | | | 1,100 | | | | | | 1,106 | |
| | | | | | |
| See Accompanying Notes | | ANNUAL REPORT | | OCTOBER 31, 2014 | | 59 |
Schedule of Investments PIMCO Fixed Income SHares: Series M (Cont.)
| | | | | | | | | | | | |
| | | | | PRINCIPAL
AMOUNT
(000S) | | | | | MARKET
VALUE (000S) | |
Verizon Communications, Inc. | |
4.500% due 09/15/2020 | | $ | | | 5,400 | | | $ | | | 5,867 | |
5.150% due 09/15/2023 (e) | | | | | 12,200 | | | | | | 13,667 | |
| | | | | | | | | | | | |
| | | | | | | | | | | 275,405 | |
| | | | | | | | | | | | |
Total Corporate Bonds & Notes
(Cost $1,192,485) | | | 1,203,033 | |
| | | | | | | | | | | | |
| | | | | | | | | | | | |
| MUNICIPAL BONDS & NOTES 17.8% | |
| | | | | | | | | | | | |
| CALIFORNIA 8.6% | |
Alameda County, California Joint Powers Authority Revenue Bonds, (BABs), Series 2010 | |
7.046% due 12/01/2044 | | | | | 11,000 | | | | | | 14,567 | |
Bay Area Toll Authority, California Revenue Bonds, (BABs), Series 2010 | |
6.918% due 04/01/2040 | | | | | 1,300 | | | | | | 1,784 | |
7.043% due 04/01/2050 | | | | | 14,000 | | | | | | 20,299 | |
California Infrastructure & Economic Development Bank Revenue Bonds, (BABs), Series 2010 | |
6.486% due 05/15/2049 | | | | | 15,000 | | | | | | 17,973 | |
California State General Obligation Bonds, (BABs), Series 2010 | |
7.700% due 11/01/2030 | | | | | 12,000 | | | | | | 14,971 | |
7.950% due 03/01/2036 | | | | | 27,250 | | | | | | 33,721 | |
Irvine Ranch Water District, California Special Assessment Bonds, (BABs), Series 2010 | |
6.622% due 05/01/2040 | | | | | 7,200 | | | | | | 9,278 | |
Los Angeles County, California Metropolitan Transportation Authority Revenue Bonds, (BABs), Series 2010 | |
4.530% due 06/01/2022 | | | | | 1,850 | | | | | | 2,064 | |
Los Angeles County, California Public Works Financing Authority Revenue Bonds, (BABs), Series 2010 | |
7.488% due 08/01/2033 | | | | | 2,800 | | | | | | 3,657 | |
7.618% due 08/01/2040 | | | | | 12,300 | | | | | | 17,457 | |
Los Angeles Department of Water & Power, California Revenue Bonds, (BABs), Series 2010 | |
6.166% due 07/01/2040 | | | | | 6,400 | | | | | | 7,116 | |
Los Angeles Unified School District, California General Obligation Bonds, Series 2010 | |
5.981% due 05/01/2027 | | | | | 6,500 | | | | | | 7,930 | |
M-S-R Energy Authority, California Revenue Bonds, Series 2009 | |
6.500% due 11/01/2039 | | | | | 1,000 | | | | | | 1,375 | |
Napa Valley Unified School District, California General Obligation Bonds, (BABs), Series 2010 | |
6.507% due 08/01/2043 | | | | | 204 | | | | | | 278 | |
Newport Beach, California Certificates of Participation Bonds, (BABs), Series 2010 | |
7.168% due 07/01/2040 | | | | | 3,500 | | | | | | 4,347 | |
| | | | | | | | | | | | |
| | | | | PRINCIPAL
AMOUNT
(000S) | | | | | MARKET
VALUE (000S) | |
Palomar Community College District, California General Obligation Bonds, (BABs), Series 2010 | |
7.194% due 08/01/2045 | | $ | | | 4,200 | | | $ | | | 4,812 | |
Pasadena Public Financing Authority, California Revenue Bonds, (BABs), Series 2010 | |
7.148% due 03/01/2043 | | | | | 6,500 | | | | | | 8,626 | |
Regents of the University of California Medical Center Pooled Revenue Bonds, (BABs), Series 2010 | |
6.398% due 05/15/2031 | | | | | 5,100 | | | | | | 6,164 | |
Riverside Community College District Foundation, California General Obligation Bonds, (BABs), Series 2010 | |
6.971% due 08/01/2035 | | | | | 1,550 | | | | | | 1,763 | |
7.021% due 08/01/2040 | | | | | 3,250 | | | | | | 3,715 | |
San Diego County, California Regional Airport Authority Revenue Bonds, (BABs), Series 2010 | |
6.628% due 07/01/2040 | | | | | 2,300 | | | | | | 2,601 | |
San Diego Redevelopment Agency, California Tax Allocation Bonds, Series 2010 | |
7.750% due 09/01/2040 | | | | | 2,400 | | | | | | 2,673 | |
San Francisco, California Public Utilities Commission Water Revenue Bonds, (BABs), Series 2010 | |
5.500% due 11/01/2025 | | | | | 6,400 | | | | | | 7,500 | |
Tobacco Securitization Authority of Northern California Revenue Bonds, Series 2005 | |
5.400% due 06/01/2027 | | | | | 985 | | | | | | 920 | |
Tobacco Securitization Authority of Southern California Revenue Bonds, Series 2006 | |
5.000% due 06/01/2037 | | | | | 1,050 | | | | | | 849 | |
University of California Revenue Bonds, (BABs), Series 2010 | |
6.296% due 05/15/2050 | | | | | 3,350 | | | | | | 3,939 | |
| | | | | | | | | | | | |
| | | | | | | | | | | 200,379 | |
| | | | | | | | | | | | |
| | | | | | | | | | | | |
| ILLINOIS 0.7% | |
Chicago Transit Authority, Illinois Revenue Bonds, (BABs), Series 2010 | |
6.200% due 12/01/2040 | | | | | 10,100 | | | | | | 11,796 | |
Chicago, Illinois Waterworks Revenue Bonds, Series 2010 | |
6.642% due 11/01/2029 | | | | | 900 | | | | | | 1,091 | |
Illinois State Toll Highway Authority Revenue Bonds, (BABs), Series 2009 | |
6.184% due 01/01/2034 | | | | | 2,200 | | | | | | 2,778 | |
| | | | | | | | | | | | |
| | | | | | | | | | | 15,665 | |
| | | | | | | | | | | | |
| | | | | | | | | | | | |
| MASSACHUSETTS 0.0% | |
University of Massachusetts Building Authority Revenue Bonds, (BABs), Series 2009 | |
6.423% due 05/01/2029 | | | | | 750 | | | | | | 851 | |
| | | | | | | | | | | | |
| | | | | | |
| 60 | | PIMCO MANAGED ACCOUNTS TRUST | | | | See Accompanying Notes |
October 31, 2014
| | | | | | | | | | | | |
| | | | | PRINCIPAL
AMOUNT
(000S) | | | | | MARKET
VALUE (000S) | |
| MICHIGAN 0.1% | |
Michigan State University Revenue Bonds, (BABs), Series 2010 | |
6.173% due 02/15/2050 | | $ | | | 1,250 | | | $ | | | 1,469 | |
| | | | | | | | | | | | |
| | | | | | | | | | | | |
| NEW JERSEY 0.8% | |
New Jersey Economic Development Authority Revenue Bonds, (BABs), Series 2010 | |
6.425% due 12/15/2035 | | | | | 1,335 | | | | | | 1,488 | |
Tobacco Settlement Financing Corp., New Jersey Revenue Bonds, Series 2007 | |
5.000% due 06/01/2029 | | | | | 200 | | | | | | 171 | |
5.000% due 06/01/2041 | | | | | 21,960 | | | | | | 16,418 | |
| | | | | | | | | | | | |
| | | | | | | | | | | 18,077 | |
| | | | | | | | | | | | |
| | | | | | | | | | | | |
| NEW YORK 3.8% | |
Metropolitan Transportation Authority, New York Revenue Bonds, (BABs), Series 2009 | |
5.871% due 11/15/2039 | | | | | 3,500 | | | | | | 4,314 | |
Metropolitan Transportation Authority, New York Revenue Bonds, (BABs), Series 2010 | |
6.814% due 11/15/2040 | | | | | 12,000 | | | | | | 16,423 | |
New York City, New York Transitional Finance Authority Future Tax Secured Revenue Bonds, (BABs), Series 2010 | |
4.325% due 11/01/2021 | | | | | 7,330 | | | | | | 8,118 | |
4.525% due 11/01/2022 | | | | | 16,700 | | | | | | 18,610 | |
5.932% due 11/01/2036 | | | | | 14,700 | | | | | | 16,638 | |
New York City, New York Transitional Finance Authority Future Tax Secured Revenue Bonds, Series 2010 | |
5.267% due 05/01/2027 | | | | | 5,000 | | | | | | 5,804 | |
New York City, New York Water & Sewer System Revenue Bonds, (BABs), Series 2010 | |
6.124% due 06/15/2042 | | | | | 3,000 | | | | | | 3,427 | |
New York State Dormitory Authority Revenue Bonds, (BABs), Series 2010 | |
5.500% due 03/15/2030 | | | | | 400 | | | | | | 473 | |
New York State Dormitory Authority Revenue Bonds, Series 2010 | |
5.051% due 09/15/2027 | | | | | 4,000 | | | | | | 4,581 | |
Port Authority of New York & New Jersey Revenue Bonds, Series 2009 | |
5.859% due 12/01/2024 | | | | | 2,500 | | | | | | 3,110 | |
Triborough Bridge & Tunnel Authority, New York Revenue Bonds, (BABs), Series 2010 | |
5.550% due 11/15/2040 | | | | | 5,200 | | | | | | 6,197 | |
| | | | | | | | | | | | |
| | | | | | | | | | | 87,695 | |
| | | | | | | | | | | | |
| | | | | | | | | | | | |
| | | | | | | | | | | | |
| | | | | PRINCIPAL
AMOUNT
(000S) | | | | | MARKET
VALUE (000S) | |
| OHIO 1.9% | |
American Municipal Power, Inc., Ohio Revenue Bonds, (BABs), Series 2010 | |
8.084% due 02/15/2050 | | $ | | | 10,500 | | | $ | | | 16,420 | |
American Municipal Power, Inc., Ohio Revenue Bonds, Series 2010 | |
7.734% due 02/15/2033 | | | | | 900 | | | | | | 1,272 | |
Buckeye Tobacco Settlement Financing Authority, Ohio Revenue Bonds, Series 2007 | |
5.875% due 06/01/2047 | | | | | 21,800 | | | | | | 17,287 | |
6.000% due 06/01/2042 | | | | | 11,825 | | | | | | 9,404 | |
6.500% due 06/01/2047 | | | | | 500 | | | | | | 430 | |
| | | | | | | | | | | | |
| | | | | | | | | | | 44,813 | |
| | | | | | | | | | | | |
| | | | | | | | | | | | |
| PENNSYLVANIA 0.4% | |
Pennsylvania Economic Development Financing Authority Revenue Bonds, (BABs), Series 2010 | |
6.532% due 06/15/2039 | | | | | 600 | | | | | | 680 | |
State Public School Building Authority, Pennsylvania Revenue Bonds, Series 2011 | |
5.426% due 09/15/2026 | | | | | 8,500 | | | | | | 9,710 | |
| | | | | | | | | | | | |
| | | | | | | | | | | 10,390 | |
| | | | | | | | | | | | |
| | | | | | | | | | | | |
| TENNESSEE 0.0% | | | | | | | | | | | | |
Metropolitan Government of Nashville & Davidson County, Tennessee Water & Sewer Revenue Bonds, (BABs), Series 2010 | |
6.568% due 07/01/2037 | | | | | 100 | | | | | | 127 | |
| | | | | | | | | | | | |
| | | | | | | | | | | | |
| WASHINGTON 0.4% | | | | | | | | | | | | |
Washington State Convention Center Public Facilities District Revenue Bonds, (BABs), Series 2010 | |
6.790% due 07/01/2040 | | | | | 6,800 | | | | | | 8,380 | |
| | | | | | | | | | | | |
| | | | | | | | | | | | |
| WEST VIRGINIA 1.1% | | | | | | | | | | | | |
Tobacco Settlement Finance Authority, West Virginia Revenue Bonds, Series 2007 | |
7.467% due 06/01/2047 | | | | | 31,095 | | | | | | 26,493 | |
| | | | | | | | | | | | |
Total Municipal Bonds & Notes
(Cost $371,034) | | | | | | 414,339 | |
| | | | | | | | | | | | |
| | | | | | | | | | | | |
| U.S. GOVERNMENT AGENCIES 29.8% | | | | |
Fannie Mae | | | | | | | | | | | | |
0.352% due 10/27/2037 | | | | | 6,800 | | | | | | 6,788 | |
0.602% due 08/25/2021 | | | | | 17 | | | | | | 17 | |
2.035% due 05/01/2028 | | | | | 138 | | | | | | 146 | |
2.040% due 05/01/2034 | | | | | 123 | | | | | | 123 | |
2.100% due 11/01/2032 | | | | | 14 | | | | | | 14 | |
2.123% due 10/01/2032 | | | | | 23 | | | | | | 23 | |
| | | | | | |
| See Accompanying Notes | | ANNUAL REPORT | | OCTOBER 31, 2014 | | 61 |
Schedule of Investments PIMCO Fixed Income SHares: Series M (Cont.)
| | | | | | | | | | | | |
| | | | | PRINCIPAL
AMOUNT
(000S) | | | | | MARKET
VALUE (000S) | |
2.215% due 09/01/2032 | | $ | | | 13 | | | $ | | | 13 | |
2.216% due 12/01/2034 | | | | | 102 | | | | | | 109 | |
2.220% due 09/01/2027 | | | | | 55 | | | | | | 55 | |
2.251% due 05/01/2033 | | | | | 146 | | | | | | 156 | |
2.264% due 01/01/2033 | | | | | 66 | | | | | | 70 | |
2.425% due 10/01/2034 | | | | | 141 | | | | | | 141 | |
2.500% due 05/01/2017 | | | | | 10 | | | | | | 10 | |
2.519% due 06/01/2020 | | | | | 17 | | | | | | 17 | |
2.756% due 05/01/2018 | | | | | 23 | | | | | | 24 | |
2.758% due 01/01/2018 | | | | | 17 | | | | | | 17 | |
3.000% due 11/01/2044 - 12/01/2044 | | | | | 216,000 | | | | | | 215,584 | |
3.193% due 03/25/2041 | | | | | 20 | | | | | | 20 | |
3.500% due 11/01/2044 | | | | | 125,000 | | | | | | 129,207 | |
3.596% due 05/25/2042 | | | | | 18 | | | | | | 19 | |
4.000% due 11/25/2019 - 11/01/2044 | | | | | 125,374 | | | | | | 133,105 | |
4.500% due 11/25/2026 - 12/01/2044 | | | | | 128,203 | | | | | | 138,772 | |
5.000% due 11/01/2033 - 12/01/2044 | | | | | 55,000 | | | | | | 60,742 | |
6.000% due 08/01/2022 - 12/01/2023 | | | | | 187 | | | | | | 204 | |
6.500% due 01/01/2025 - 12/01/2028 | | | | | 66 | | | | | | 74 | |
7.000% due 11/01/2038 | | | | | 86 | | | | | | 93 | |
7.010% due 08/01/2022 | | | | | 45 | | | | | | 47 | |
7.925% due 02/01/2025 | | | | | 1 | | | | | | 1 | |
11.000% due 07/15/2020 | | | | | 30 | | | | | | 31 | |
Freddie Mac | |
0.603% due 08/15/2029 - 12/15/2031 | | | | | 68 | | | | | | 68 | |
0.653% due 09/15/2030 | | | | | 7 | | | | | | 7 | |
0.703% due 03/15/2032 | | | | | 10 | | | | | | 10 | |
0.803% due 03/15/2020 - 02/15/2024 | | | | | 239 | | | | | | 247 | |
0.853% due 10/15/2019 | | | | | 2 | | | | | | 2 | |
1.303% due 09/15/2022 | | | | | 39 | | | | | | 40 | |
1.503% due 08/15/2023 | | | | | 11 | | | | | | 12 | |
1.955% due 08/01/2032 | | | | | 75 | | | | | | 75 | |
2.250% due 08/01/2029 | | | | | 20 | | | | | | 21 | |
2.314% due 02/01/2033 | | | | | 71 | | | | | | 75 | |
2.334% due 04/01/2032 | | | | | 62 | | | | | | 63 | |
2.348% due 01/01/2033 | | | | | 9 | | | | | | 9 | |
2.364% due 02/01/2029 | | | | | 117 | | | | | | 123 | |
2.375% due 01/01/2032 - 10/01/2032 | | | | | 202 | | | | | | 210 | |
2.393% due 07/01/2032 | | | | | 9 | | | | | | 9 | |
2.437% due 07/01/2029 | | | | | 10 | | | | | | 10 | |
2.475% due 08/01/2032 | | | | | 13 | | | | | | 13 | |
2.625% due 10/01/2032 | | | | | 62 | | | | | | 63 | |
4.500% due 05/15/2018 | | | | | 11 | | | | | | 12 | |
5.500% due 04/15/2035 | | | | | 2,800 | | | | | | 3,149 | |
6.000% due 08/15/2016 - 12/15/2028 | | | | | 542 | | | | | | 589 | |
| | | | | | | | | | | | |
| | | | | PRINCIPAL
AMOUNT
(000S) | | | | | MARKET
VALUE (000S) | |
6.500% due 08/15/2016 - 12/15/2023 | | $ | | | 23 | | | $ | | | 24 | |
7.000% due 04/01/2029 - 06/01/2030 | | | | | 20 | | | | | | 23 | |
7.500% due 08/15/2030 | | | | | 69 | | | | | | 79 | |
Ginnie Mae | |
0.507% due 06/20/2032 | | | | | 18 | | | | | | 18 | |
1.625% due 03/20/2017 - 06/20/2032 | | | | | 706 | | | | | | 732 | |
2.000% due 05/20/2018 - 09/20/2027 | | | | | 145 | | | | | | 150 | |
2.125% due 06/20/2022 | | | | | 32 | | | | | | 33 | |
2.500% due 01/20/2018 - 09/20/2021 | | | | | 21 | | | | | | 23 | |
3.000% due 04/20/2019 - 08/20/2025 | | | | | 70 | | | | | | 70 | |
6.500% due 05/15/2023 - 12/15/2023 | | | | | 2 | | | | | | 2 | |
NCUA Guaranteed Notes | |
0.603% due 10/07/2020 | | | | | 2,916 | | | | | | 2,935 | |
Vendee Mortgage Trust | |
6.500% due 09/15/2024 | | | | | 750 | | | | | | 845 | |
| | | | | | | | | | | | |
Total U.S. Government Agencies
(Cost $694,313) | | | | | | 695,363 | |
| | | | | | | | | | | | |
| | | | | | | | | | | | |
| U.S. TREASURY OBLIGATIONS 0.1% | |
U.S. Treasury Notes | |
0.250% due 01/31/2015 (h) | | | | | 522 | | | | | | 522 | |
2.000% due 02/15/2022 (h) | | | | | 1,300 | | | | | | 1,294 | |
| | | | | | | | | | | | |
Total U.S. Treasury Obligations
(Cost $1,797) | | | | | | 1,816 | |
| | | | | | | | | | | | |
| | | | | | | | | | | | |
| MORTGAGE-BACKED SECURITIES 17.9% | |
Adjustable Rate Mortgage Trust | |
2.671% due 11/25/2035 ^ | | | | | 383 | | | | | | 330 | |
2.756% due 02/25/2036 | | | | | 257 | | | | | | 209 | |
4.843% due 11/25/2035 | | | | | 737 | | | | | | 675 | |
4.896% due 01/25/2036 | | | | | 186 | | | | | | 171 | |
American Home Mortgage Assets Trust | |
0.342% due 09/25/2046 | | | | | 1,199 | | | | | | 892 | |
0.362% due 10/25/2046 | | | | | 976 | | | | | | 683 | |
1.034% due 11/25/2046 | | | | | 814 | | | | | | 448 | |
American Home Mortgage Investment Trust | |
0.442% due 02/25/2045 | | | | | 203 | | | | | | 202 | |
Banc of America Alternative Loan Trust | |
6.000% due 07/25/2046 ^ | | | | | 362 | | | | | | 301 | |
16.606% due 09/25/2035 | | | | | 361 | | | | | | 449 | |
Banc of America Funding Ltd | |
0.417% due 10/03/2039 | | | | | 5,639 | | | | | | 5,567 | |
Banc of America Funding Trust | |
0.347% due 10/20/2036 | | | | | 324 | | | | | | 233 | |
0.362% due 04/25/2037 | | | | | 275 | | | | | | 188 | |
| | | | | | |
| 62 | | PIMCO MANAGED ACCOUNTS TRUST | | | | See Accompanying Notes |
October 31, 2014
| | | | | | | | | | | | |
| | | | | PRINCIPAL
AMOUNT
(000S) | | | | | MARKET
VALUE (000S) | |
0.457% due 05/20/2047 | | $ | | | 166 | | | $ | | | 137 | |
0.552% due 05/25/2037 | | | | | 231 | | | | | | 163 | |
2.640% due 02/20/2036 | | | | | 1,148 | | | | | | 1,141 | |
2.790% due 04/20/2035 | | | | | 374 | | | | | | 283 | |
2.796% due 09/20/2047 | | | | | 447 | | | | | | 332 | |
5.453% due 09/20/2046 | | | | | 301 | | | | | | 254 | |
5.500% due 03/25/2036 ^ | | | | | 65 | | | | | | 62 | |
Banc of America Mortgage Trust | |
2.622% due 02/25/2033 | | | | | 2 | | | | | | 2 | |
2.644% due 07/25/2035 | | | | | 91 | | | | | | 85 | |
5.500% due 09/25/2035 | | | | | 1,389 | | | | | | 1,340 | |
5.500% due 05/25/2037 | | | | | 348 | | | | | | 273 | |
BCAP LLC Trust | |
0.302% due 05/25/2047 | | | | | 180 | | | | | | 136 | |
0.312% due 03/26/2037 | | | | | 177 | | | | | | 173 | |
0.354% due 07/26/2036 | | | | | 496 | | | | | | 474 | |
0.362% due 05/26/2047 | | | | | 385 | | | | | | 371 | |
0.372% due 05/25/2047 ^ | | | | | 1,162 | | | | | | 883 | |
0.405% due 07/26/2035 | | | | | 221 | | | | | | 218 | |
0.652% due 05/26/2035 | | | | | 167 | | | | | | 154 | |
0.672% due 11/26/2035 | | | | | 309 | | | | | | 303 | |
0.802% due 09/25/2047 | | | | | 257 | | | | | | 220 | |
0.814% due 11/26/2046 | | | | | 404 | | | | | | 390 | |
0.895% due 01/26/2036 | | | | | 214 | | | | | | 212 | |
1.581% due 10/26/2035 | | | | | 323 | | | | | | 323 | |
2.246% due 07/26/2036 | | | | | 963 | | | | | | 965 | |
2.382% due 01/26/2034 | | | | | 127 | | | | | | 126 | |
2.589% due 07/26/2036 | | | | | 620 | | | | | | 527 | |
2.610% due 02/26/2035 | | | | | 263 | | | | | | 261 | |
2.619% due 06/26/2035 | | | | | 517 | | | | | | 523 | |
2.809% due 07/26/2036 | | | | | 346 | | | | | | 349 | |
2.809% due 03/26/2037 | | | | | 327 | | | | | | 260 | |
4.000% due 02/26/2037 | | | | | 412 | | | | | | 409 | |
4.824% due 03/27/2037 | | | | | 439 | | | | | | 291 | |
5.007% due 07/26/2036 | | | | | 86 | | | | | | 69 | |
12.801% due 10/26/2036 | | | | | 435 | | | | | | 404 | |
BCRR Trust | |
5.797% due 08/17/2045 | | | | | 4,066 | | | | | | 4,445 | |
Bear Stearns Adjustable Rate Mortgage Trust | |
2.271% due 08/25/2035 | | | | | 6,213 | | | | | | 6,254 | |
2.430% due 10/25/2035 | | | | | 1,843 | | | | | | 1,820 | |
2.455% due 12/25/2046 ^ | | | | | 2,396 | | | | | | 2,065 | |
2.474% due 06/25/2035 | | | | | 82 | | | | | | 75 | |
2.528% due 03/25/2035 | | | | | 2,565 | | | | | | 2,595 | |
2.530% due 02/25/2036 ^ | | | | | 299 | | | | | | 244 | |
2.607% due 11/25/2034 | | | | | 207 | | | | | | 202 | |
2.652% due 02/25/2034 | | | | | 167 | | | | | | 167 | |
2.653% due 05/25/2034 | | | | | 84 | | | | | | 82 | |
2.665% due 10/25/2035 | | | | | 320 | | | | | | 318 | |
2.679% due 03/25/2035 | | | | | 157 | | | | | | 153 | |
2.712% due 01/25/2035 | | | | | 42 | | | | | | 42 | |
2.772% due 01/25/2034 | | | | | 156 | | | | | | 157 | |
2.933% due 05/25/2047 ^ | | | | | 618 | | | | | | 532 | |
5.174% due 08/25/2035 | | | | | 167 | | | | | | 150 | |
| | | | | | | | | | | | |
| | | | | PRINCIPAL
AMOUNT
(000S) | | | | | MARKET
VALUE (000S) | |
Bear Stearns ALT-A Trust | |
0.592% due 04/25/2036 | | $ | | | 343 | | | $ | | | 254 | |
2.447% due 02/25/2036 ^ | | | | | 73 | | | | | | 59 | |
2.455% due 06/25/2034 | | | | | 4,779 | | | | | | 3,734 | |
2.538% due 02/25/2036 ^ | | | | | 738 | | | | | | 508 | |
2.551% due 05/25/2035 | | | | | 146 | | | | | | 140 | |
2.670% due 08/25/2036 ^ | | | | | 430 | | | | | | 261 | |
4.334% due 11/25/2036 ^ | | | | | 249 | | | | | | 194 | |
4.865% due 07/25/2035 | | | | | 1,205 | | | | | | 1,004 | |
5.243% due 05/25/2036 | | | | | 1,211 | | | | | | 925 | |
Bear Stearns Mortgage Funding Trust | |
0.342% due 01/25/2037 | | | | | 187 | | | | | | 154 | |
Bear Stearns Mortgage Securities, Inc. | |
6.374% due 03/25/2031 | | | | | 12 | | | | | | 13 | |
Bear Stearns Structured Products, Inc. Trust | |
2.506% due 01/26/2036 | | | | | 1,844 | | | | | | 1,476 | |
Chase Mortgage Finance Trust | |
2.475% due 03/25/2037 | | | | | 215 | | | | | | 197 | |
5.164% due 03/25/2037 | | | | | 118 | | | | | | 114 | |
5.641% due 09/25/2036 | | | | | 3,956 | | | | | | 3,604 | |
6.000% due 05/25/2037 | | | | | 242 | | | | | | 216 | |
ChaseFlex Trust | |
0.452% due 07/25/2037 | | | | | 414 | | | | | | 358 | |
4.805% due 08/25/2037 ^ | | | | | 76 | | | | | | 61 | |
5.000% due 07/25/2037 | | | | | 252 | | | | | | 222 | |
Citigroup Commercial Mortgage Trust | |
5.322% due 12/17/2049 | | | | | 9,862 | | | | | | 10,595 | |
5.858% due 07/17/2040 | | | | | 13,898 | | | | | | 14,789 | |
Citigroup Mortgage Loan Trust, Inc. | |
0.321% due 10/25/2046 | | | | | 300 | | | | | | 286 | |
2.299% due 10/25/2046 | | | | | 495 | | | | | | 397 | |
2.438% due 09/25/2037 | | | | | 200 | | | | | | 190 | |
2.521% due 10/25/2035 | | | | | 516 | | | | | | 512 | |
2.521% due 11/25/2035 | | | | | 338 | | | | | | 336 | |
2.550% due 12/25/2035 ^ | | | | | 239 | | | | | | 182 | |
2.559% due 08/25/2035 | | | | | 99 | | | | | | 99 | |
2.809% due 03/25/2037 | | | | | 233 | | | | | | 185 | |
3.667% due 09/25/2037 ^ | | | | | 1,396 | | | | | | 1,225 | |
5.208% due 08/25/2035 | | | | | 4,051 | | | | | | 3,983 | |
5.500% due 12/25/2035 | | | | | 257 | | | | | | 182 | |
6.489% due 11/25/2037 | | | | | 185 | | | | | | 155 | |
CitiMortgage Alternative Loan Trust | |
6.500% due 06/25/2037 | | | | | 340 | | | | | | 292 | |
Commercial Mortgage Trust | |
3.156% due 07/10/2046 | | | | | 14,742 | | | | | | 14,950 | |
Community Program Loan Trust | |
4.500% due 04/01/2029 | | | | | 419 | | | | | | 424 | |
Countrywide Alternative Loan Resecuritization Trust | |
0.422% due 03/25/2047 | | | | | 338 | | | | | | 312 | |
6.000% due 08/25/2037 | | | | | 144 | | | | | | 112 | |
6.000% due 08/25/2037 ^ | | | | | 125 | | | | | | 100 | |
Countrywide Alternative Loan Trust | |
0.292% due 08/25/2037 | | | | | 1,642 | | | | | | 1,369 | |
| | | | | | |
| See Accompanying Notes | | ANNUAL REPORT | | OCTOBER 31, 2014 | | 63 |
Schedule of Investments PIMCO Fixed Income SHares: Series M (Cont.)
| | | | | | | | | | | | |
| | | | | PRINCIPAL
AMOUNT
(000S) | | | | | MARKET
VALUE (000S) | |
0.312% due 12/25/2046 ^ | | $ | | | 310 | | | $ | | | 303 | |
0.322% due 11/25/2036 | | | | | 2,365 | | | | | | 2,118 | |
0.322% due 01/25/2037 ^ | | | | | 466 | | | | | | 432 | |
0.332% due 11/25/2036 | | | | | 293 | | | | | | 267 | |
0.332% due 05/25/2047 | | | | | 2,629 | | | | | | 2,210 | |
0.337% due 02/20/2047 | | | | | 2,914 | | | | | | 2,203 | |
0.342% due 07/25/2046 | | | | | 250 | | | | | | 231 | |
0.342% due 09/25/2046 ^ | | | | | 1,056 | | | | | | 891 | |
0.342% due 10/25/2046 | | | | | 497 | | | | | | 483 | |
0.367% due 07/20/2046 ^ | | | | | 98 | | | | | | 68 | |
0.372% due 05/25/2035 | | | | | 4,233 | | | | | | 3,642 | |
0.402% due 06/25/2035 | | | | | 298 | | | | | | 262 | |
0.412% due 07/25/2035 | | | | | 289 | | | | | | 250 | |
0.412% due 12/25/2035 | | | | | 2,037 | | | | | | 1,810 | |
0.422% due 05/25/2036 ^ | | | | | 76 | | | | | | 56 | |
0.462% due 08/25/2035 | | | | | 429 | | | | | | 333 | |
0.462% due 10/25/2035 | | | | | 285 | | | | | | 234 | |
0.652% due 05/25/2035 | | | | | 7,498 | | | | | | 6,297 | |
0.935% due 09/25/2034 | | | | | 149 | | | | | | 147 | |
1.114% due 02/25/2036 | | | | | 901 | | | | | | 818 | |
2.434% due 05/25/2036 | | | | | 134 | | | | | | 105 | |
2.459% due 08/25/2035 | | | | | 543 | | | | | | 478 | |
4.588% due 06/25/2047 | | | | | 418 | | | | | | 352 | |
5.307% due 11/25/2035 ^ | | | | | 227 | | | | | | 184 | |
5.500% due 11/25/2035 | | | | | 220 | | | | | | 183 | |
5.500% due 02/25/2036 | | | | | 184 | | | | | | 165 | |
5.750% due 03/25/2037 ^ | | | | | 306 | | | | | | 263 | |
5.750% due 04/25/2047 | | | | | 268 | | | | | | 222 | |
6.000% due 12/25/2034 | | | | | 186 | | | | | | 187 | |
6.000% due 03/25/2036 | | | | | 451 | | | | | | 376 | |
6.000% due 08/25/2036 | | | | | 721 | | | | | | 655 | |
6.000% due 02/25/2037 | | | | | 932 | | | | | | 744 | |
6.000% due 04/25/2037 | | | | | 185 | | | | | | 163 | |
6.000% due 05/25/2037 ^ | | | | | 334 | | | | | | 281 | |
6.000% due 05/25/2037 | | | | | 480 | | | | | | 396 | |
6.000% due 08/25/2037 | | | | | 854 | | | | | | 730 | |
6.250% due 11/25/2036 ^ | | | | | 191 | | | | | | 181 | |
6.500% due 12/25/2036 | | | | | 132 | | | | | | 109 | |
6.500% due 08/25/2037 | | | | | 595 | | | | | | 435 | |
19.382% due 07/25/2035 | | | | | 117 | | | | | | 162 | |
Countrywide Home Loan Mortgage Pass-Through Trust | |
0.382% due 05/25/2035 | | | | | 170 | | | | | | 145 | |
0.452% due 04/25/2046 ^ | | | | | 155 | | | | | | 101 | |
0.472% due 03/25/2035 | | | | | 1,225 | | | | | | 1,178 | |
0.492% due 03/25/2036 | | | | | 848 | | | | | | 500 | |
0.522% due 02/25/2035 | | | | | 804 | | | | | | 707 | |
0.542% due 02/25/2035 | | | | | 682 | | | | | | 527 | |
0.692% due 02/25/2035 | | | | | 37 | | | | | | 36 | |
0.772% due 03/25/2035 | | | | | 827 | | | | | | 766 | |
2.313% due 02/20/2036 | | | | | 109 | | | | | | 99 | |
2.431% due 11/25/2034 | | | | | 228 | | | | | | 217 | |
2.442% due 08/25/2034 | | | | | 159 | | | | | | 147 | |
2.458% due 05/20/2036 | | | | | 149 | | | | | | 137 | |
2.486% due 02/20/2036 | | | | | 802 | | | | | | 676 | |
2.494% due 04/25/2035 ^ | | | | | 295 | | | | | | 88 | |
2.519% due 05/20/2036 | | | | | 350 | | | | | | 284 | |
| | | | | | | | | | | | |
| | | | | PRINCIPAL
AMOUNT
(000S) | | | | | MARKET
VALUE (000S) | |
2.644% due 11/25/2037 | | $ | | | 546 | | | $ | | | 485 | |
5.030% due 10/20/2035 | | | | | 209 | | | | | | 176 | |
5.104% due 01/25/2036 ^ | | | | | 338 | | | | | | 319 | |
5.500% due 07/25/2037 | | | | | 875 | | | | | | 813 | |
5.750% due 12/25/2035 ^ | | | | | 336 | | | | | | 319 | |
6.000% due 02/25/2037 | | | | | 993 | | | | | | 956 | |
6.000% due 03/25/2037 | | | | | 328 | | | | | | 298 | |
6.000% due 07/25/2037 | | | | | 582 | | | | | | 502 | |
6.500% due 11/25/2036 | | | | | 2,090 | | | | | | 1,893 | |
Countrywide Home Loan Reperforming REMIC Trust | |
6.000% due 03/25/2035 | | | | | 228 | | | | | | 230 | |
Credit Suisse Commercial Mortgage Trust | |
5.900% due 09/15/2039 (e) | | | | | 23,274 | | | | | | 25,338 | |
Credit Suisse First Boston Mortgage Securities Corp. | |
0.798% due 03/25/2032 | | | | | 9 | | | | | | 9 | |
1.302% due 09/25/2034 | | | | | 205 | | | | | | 171 | |
Credit Suisse Mortgage Capital Certificates | |
0.305% due 03/27/2036 | | | | | 222 | | | | | | 218 | |
0.395% due 05/27/2037 | | | | | 100 | | | | | | 84 | |
0.554% due 12/27/2035 | | | | | 300 | | | | | | 287 | |
1.958% due 04/28/2037 | | | | | 579 | | | | | | 388 | |
2.467% due 04/26/2038 | | | | | 1,900 | | | | | | 1,856 | |
2.517% due 09/27/2036 | | | | | 297 | | | | | | 299 | |
2.831% due 08/28/2036 | | | | | 179 | | | | | | 174 | |
Deutsche ALT-A Securities, Inc. | |
0.452% due 04/25/2037 | | | | | 727 | | | | | | 411 | |
Deutsche ALT-A Securities, Inc. Mortgage Loan Trust | |
0.312% due 01/25/2047 | | | | | 210 | | | | | | 154 | |
0.342% due 08/25/2047 | | | | | 920 | | | | | | 765 | |
Deutsche Mortgage & Asset Receiving Corp. | |
0.408% due 11/27/2036 | | | | | 500 | | | | | | 421 | |
Downey Savings & Loan Association Mortgage Loan Trust | |
0.477% due 07/19/2045 ^ | | | | | 120 | | | | | | 27 | |
First Horizon Alternative Mortgage Securities Trust | |
2.219% due 04/25/2036 | | | | | 392 | | | | | | 330 | |
2.386% due 01/25/2036 | | | | | 755 | | | | | | 613 | |
First Horizon Mortgage Pass-Through Trust | |
2.618% due 11/25/2037 | | | | | 167 | | | | | | 149 | |
6.250% due 11/25/2036 | | | | | 1,055 | | | | | | 1,064 | |
GMAC Mortgage Corp. Loan Trust | |
2.940% due 11/19/2035 | | | | | 305 | | | | | | 288 | |
Granite Master Issuer PLC | |
0.337% due 12/20/2054 | | | | | 2,959 | | | | | | 2,941 | |
Greenpoint Mortgage Funding Trust | |
0.352% due 12/25/2046 ^ | | | | | 384 | | | | | | 217 | |
GSC Capital Corp. Mortgage Trust | |
0.332% due 05/25/2036 | | | | | 325 | | | | | | 251 | |
GSR Mortgage Loan Trust | |
2.539% due 09/25/2034 | | | | | 209 | | | | | | 199 | |
2.660% due 09/25/2035 | | | | | 862 | | | | | | 867 | |
2.667% due 04/25/2035 | | | | | 120 | | | | | | 119 | |
| | | | | | |
| 64 | | PIMCO MANAGED ACCOUNTS TRUST | | | | See Accompanying Notes |
October 31, 2014
| | | | | | | | | | | | |
| | | | | PRINCIPAL
AMOUNT
(000S) | | | | | MARKET
VALUE (000S) | |
2.675% due 11/25/2035 | | $ | | | 272 | | | $ | | | 248 | |
2.783% due 04/25/2035 | | | | | 135 | | | | | | 132 | |
HarborView Mortgage Loan Trust | |
0.347% due 01/19/2038 | | | | | 79 | | | | | | 67 | |
0.377% due 05/19/2035 | | | | | 3,557 | | | | | | 2,986 | |
0.407% due 01/19/2036 | | | | | 237 | | | | | | 165 | |
0.407% due 01/19/2038 ^ | | | | | 181 | | | | | | 60 | |
0.407% due 09/19/2046 ^ | | | | | 48 | | | | | | 4 | |
0.497% due 01/19/2035 | | | | | 99 | | | | | | 84 | |
0.885% due 07/19/2045 | | | | | 106 | | | | | | 102 | |
2.513% due 12/19/2035 ^ | | | | | 290 | | | | | | 223 | |
2.661% due 12/19/2035 ^ | | | | | 262 | | | | | | 234 | |
HomeBanc Mortgage Trust | |
0.332% due 12/25/2036 | | | | | 242 | | | | | | 211 | |
Impac Secured Assets Trust | |
0.302% due 11/25/2036 | | | | | 2,198 | | | | | | 1,575 | |
0.322% due 01/25/2037 | | | | | 541 | | | | | | 451 | |
IndyMac Mortgage Loan Trust | |
0.332% due 07/25/2047 | | | | | 646 | | | | | | 503 | |
0.342% due 09/25/2046 | | | | | 239 | | | | | | 206 | |
0.432% due 03/25/2035 | | | | | 599 | | | | | | 534 | |
0.452% due 11/25/2035 ^ | | | | | 358 | | | | | | 217 | |
2.059% due 06/25/2037 ^ | | | | | 195 | | | | | | 150 | |
2.625% due 06/25/2035 ^ | | | | | 181 | | | | | | 153 | |
4.307% due 06/25/2036 | | | | | 3,102 | | | | | | 2,984 | |
4.409% due 11/25/2035 ^ | | | | | 336 | | | | | | 278 | |
4.535% due 09/25/2035 | | | | | 220 | | | | | | 193 | |
4.535% due 09/25/2035 ^ | | | | | 539 | | | | | | 39 | |
4.547% due 08/25/2035 | | | | | 2,055 | | | | | | 1,706 | |
4.692% due 10/25/2035 | | | | | 1,804 | | | | | | 1,549 | |
4.994% due 08/25/2036 | | | | | 5,379 | | | | | | 5,348 | |
JPMorgan Alternative Loan Trust | |
0.652% due 06/27/2037 | | | | | 8,356 | | | | | | 6,981 | |
3.205% due 12/25/2036 | | | | | 113 | | | | | | 103 | |
JPMorgan Chase Commercial Mortgage Securities Trust | |
2.749% due 11/15/2043 | | | | | 18,609 | | | | | | 18,894 | |
3.341% due 07/15/2046 | | | | | 19,749 | | | | | | 20,389 | |
4.106% due 07/15/2046 | | | | | 22,900 | | | | | | 24,609 | |
5.336% due 05/15/2047 | | | | | 591 | | | | | | 633 | |
JPMorgan Mortgage Trust | |
2.356% due 11/25/2035 | | | | | 202 | | | | | | 191 | |
2.522% due 01/25/2037 | | | | | 55 | | | | | | 49 | |
2.546% due 04/25/2035 | | | | | 98 | | | | | | 99 | |
2.548% due 07/25/2035 | | | | | 938 | | | | | | 953 | |
2.594% due 07/25/2035 | | | | | 1,197 | | | | | | 1,220 | |
2.596% due 09/25/2034 | | | | | 740 | | | | | | 743 | |
2.778% due 04/25/2035 | | | | | 103 | | | | | | 104 | |
5.040% due 11/25/2035 | | | | | 198 | | | | | | 189 | |
5.583% due 06/25/2037 ^ | | | | | 416 | | | | | | 382 | |
6.000% due 01/25/2036 | | | | | 252 | | | | | | 229 | |
JPMorgan Resecuritization Trust | |
2.564% due 08/27/2037 | | | | | 271 | | | | | | 275 | |
| | | | | | | | | | | | |
| | | | | PRINCIPAL
AMOUNT
(000S) | | | | | MARKET
VALUE (000S) | |
Lavender Trust | |
6.250% due 10/26/2036 | | $ | | | 321 | | | $ | | | 230 | |
Lehman Mortgage Trust | |
5.490% due 01/25/2036 | | | | | 428 | | | | | | 403 | |
5.696% due 12/25/2035 | | | | | 529 | | | | | | 457 | |
6.000% due 07/25/2036 ^ | | | | | 160 | | | | | | 125 | |
Lehman XS Trust | |
0.302% due 07/25/2047 | | | | | 237 | | | | | | 229 | |
0.352% due 08/25/2046 | | | | | 154 | | | | | | 119 | |
0.382% due 04/25/2046 | | | | | 136 | | | | | | 103 | |
0.382% due 08/25/2046 ^ | | | | | 8 | | | | | | 1 | |
0.392% due 11/25/2046 | | | | | 141 | | | | | | 27 | |
Luminent Mortgage Trust | |
0.322% due 12/25/2036 | | | | | 1,338 | | | | | | 1,082 | |
0.352% due 10/25/2046 | | | | | 449 | | | | | | 386 | |
MASTR Adjustable Rate Mortgages Trust | |
0.392% due 05/25/2037 | | | | | 221 | | | | | | 151 | |
MASTR Reperforming Loan Trust | |
7.000% due 05/25/2035 | | | | | 1,714 | | | | | | 1,741 | |
8.000% due 07/25/2035 | | | | | 1,560 | | | | | | 1,615 | |
Mellon Residential Funding Corp. Mortgage Pass-Through Trust | |
2.610% due 10/20/2029 | | | | | 93 | | | | | | 95 | |
Merrill Lynch Alternative Note Asset Trust | |
0.332% due 04/25/2037 | | | | | 1,248 | | | | | | 1,193 | |
0.452% due 03/25/2037 | | | | | 830 | | | | | | 426 | |
6.000% due 05/25/2037 | | | | | 336 | | | | | | 269 | |
Merrill Lynch Mortgage Investors Trust | |
0.612% due 04/25/2029 | | | | | 135 | | | | | | 128 | |
0.812% due 09/25/2029 | | | | | 120 | | | | | | 120 | |
0.815% due 11/25/2029 | | | | | 174 | | | | | | 168 | |
1.325% due 07/25/2029 | | | | | 146 | | | | | | 141 | |
1.572% due 10/25/2035 | | | | | 639 | | | | | | 629 | |
2.124% due 02/25/2036 | | | | | 111 | | | | | | 111 | |
2.692% due 11/25/2035 | | | | | 253 | | | | | | 253 | |
Merrill Lynch/Countrywide Commercial Mortgage Trust | |
5.882% due 08/12/2049 | | | | | 2,000 | | | | | | 2,196 | |
Morgan Stanley Capital Trust | |
5.332% due 12/15/2043 (e) | | | | | 36,215 | | | | | | 38,661 | |
5.692% due 04/15/2049 | | | | | 1,100 | | | | | | 1,196 | |
Morgan Stanley Dean Witter Capital, Inc. Trust | |
1.699% due 03/25/2033 | | | | | 177 | | | | | | 166 | |
Morgan Stanley Mortgage Loan Trust | |
0.432% due 11/25/2035 | | | | | 236 | | | | | | 233 | |
0.472% due 01/25/2035 | | | | | 113 | | | | | | 109 | |
2.133% due 06/25/2036 | | | | | 281 | | | | | | 274 | |
6.000% due 10/25/2037 ^ | | | | | 139 | | | | | | 115 | |
Morgan Stanley Re-REMIC Trust | |
0.459% due 02/26/2037 | | | | | 412 | | | | | | 268 | |
0.462% due 01/26/2051 | | | | | 575 | | | | | | 549 | |
0.464% due 03/26/2037 | | | | | 231 | | | | | | 170 | |
5.500% due 08/26/2047 | | | | | 140 | | | | | | 147 | |
| | | | | | |
| See Accompanying Notes | | ANNUAL REPORT | | OCTOBER 31, 2014 | | 65 |
Schedule of Investments PIMCO Fixed Income SHares: Series M (Cont.)
| | | | | | | | | | | | |
| | | | | PRINCIPAL
AMOUNT
(000S) | | | | | MARKET
VALUE (000S) | |
NAAC Reperforming Loan REMIC Trust | |
7.500% due 03/25/2034 | | $ | | | 827 | | | $ | | | 892 | |
Nomura Asset Acceptance Corp. Alternative Loan Trust | |
5.190% due 02/25/2036 ^ | | | | | 1,183 | | | | | | 990 | |
RBSSP Resecuritization Trust | |
0.472% due 03/26/2037 | | | | | 9,810 | | | | | | 9,603 | |
Residential Accredit Loans, Inc. Trust | |
0.322% due 12/25/2036 | | | | | 726 | | | | | | 564 | |
0.352% due 05/25/2047 | | | | | 282 | | | | | | 234 | |
0.362% due 06/25/2037 | | | | | 227 | | | | | | 173 | |
0.402% due 08/25/2037 | | | | | 736 | | | | | | 589 | |
0.452% due 01/25/2035 | | | | | 218 | | | | | | 211 | |
0.452% due 08/25/2035 | | | | | 312 | | | | | | 246 | |
0.552% due 10/25/2045 | | | | | 243 | | | | | | 189 | |
3.195% due 02/25/2035 | | | | | 667 | | | | | | 535 | |
3.568% due 02/25/2036 ^ | | | | | 223 | | | | | | 162 | |
8.000% due 04/25/2036 ^ | | | | | 316 | | | | | | 303 | |
Residential Asset Securitization Trust | |
6.000% due 06/25/2036 | | | | | 301 | | | | | | 219 | |
6.000% due 11/25/2036 | | | | | 191 | | | | | | 141 | |
6.000% due 03/25/2037 ^ | | | | | 185 | | | | | | 142 | |
6.250% due 11/25/2036 | | | | | 130 | | | | | | 99 | |
6.500% due 04/25/2037 | | | | | 1,547 | | | | | | 953 | |
Residential Funding Mortgage Securities, Inc. Trust | |
3.398% due 03/25/2035 | | | | | 2,048 | | | | | | 1,690 | |
5.500% due 02/25/2035 | | | | | 135 | | | | | | 135 | |
6.000% due 09/25/2036 ^ | | | | | 545 | | | | | | 504 | |
Structured Adjustable Rate Mortgage Loan Trust | |
0.472% due 10/25/2035 | | | | | 3,010 | | | | | | 2,563 | |
0.887% due 06/25/2034 | | | | | 845 | | | | | | 796 | |
1.516% due 05/25/2035 | | | | | 962 | | | | | | 688 | |
2.431% due 12/25/2035 | | | | | 237 | | | | | | 228 | |
2.477% due 10/25/2034 | | | | | 124 | | | | | | 124 | |
2.479% due 02/25/2036 | | | | | 608 | | | | | | 490 | |
2.522% due 10/25/2036 | | | | | 331 | | | | | | 251 | |
2.550% due 01/25/2036 ^ | | | | | 7 | | | | | | 7 | |
2.620% due 09/25/2036 ^ | | | | | 6,214 | | | | | | 3,891 | |
2.626% due 06/25/2036 | | | | | 129 | | | | | | 108 | |
4.577% due 07/25/2037 ^ | | | | | 12 | | | | | | 9 | |
Structured Asset Mortgage Investments Trust | |
0.282% due 03/25/2037 | | | | | 335 | | | | | | 259 | |
0.332% due 09/25/2047 | | | | | 147 | | | | | | 124 | |
0.342% due 06/25/2036 | | | | | 12,487 | | | | | | 10,336 | |
0.342% due 07/25/2046 | | | | | 1,040 | | | | | | 846 | |
0.342% due 09/25/2047 | | | | | 1,514 | | | | | | 1,130 | |
0.352% due 05/25/2036 | | | | | 1,621 | | | | | | 1,244 | |
0.362% due 09/25/2047 | | | | | 3,235 | | | | | | 2,279 | |
0.372% due 05/25/2046 | | | | | 1,312 | | | | | | 736 | |
0.412% due 05/25/2046 ^ | | | | | 140 | | | | | | 33 | |
0.857% due 03/19/2034 | | | | | 809 | | | | | | 754 | |
0.857% due 02/19/2035 | | | | | 371 | | | | | | 360 | |
0.893% due 12/19/2033 | | | | | 803 | | | | | | 777 | |
1.614% due 02/25/2036 | | | | | 1,160 | | | | | | 1,022 | |
| | | | | | | | | | | | |
| | | | | PRINCIPAL
AMOUNT
(000S) | | | | | MARKET
VALUE (000S) | |
Structured Asset Securities Corp. Mortgage Pass-Through Certificates | |
1.839% due 05/25/2032 | | $ | | | 1 | | | $ | | | 1 | |
2.217% due 01/25/2032 | | | | | 5 | | | | | | 5 | |
2.390% due 02/25/2034 | | | | | 188 | | | | | | 184 | |
2.516% due 02/25/2032 | | | | | 2 | | | | | | 2 | |
2.708% due 08/25/2032 | | | | | 105 | | | | | | 104 | |
Structured Asset Securities Corp. Trust | |
0.502% due 02/25/2035 | | | | | 101 | | | | | | 95 | |
Suntrust Adjustable Rate Mortgage Loan Trust | |
6.002% due 02/25/2037 | | | | | 717 | | | | | | 551 | |
Thornburg Mortgage Securities Trust | |
0.792% due 09/25/2043 | | | | | 115 | | | | | | 111 | |
0.892% due 09/25/2044 | | | | | 110 | | | | | | 107 | |
2.438% due 09/25/2037 | | | | | 216 | | | | | | 214 | |
Wachovia Mortgage Loan Trust LLC | |
5.442% due 10/20/2035 | | | | | 192 | | | | | | 191 | |
WaMu Mortgage Pass-Through Certificates Trust | |
0.422% due 12/25/2045 | | | | | 17 | | | | | | 17 | |
0.472% due 01/25/2045 | | | | | 530 | | | | | | 500 | |
0.522% due 11/25/2034 | | | | | 439 | | | | | | 421 | |
0.562% due 11/25/2045 | | | | | 429 | | | | | | 391 | |
0.578% due 10/25/2044 | | | | | 2,337 | | | | | | 2,264 | |
0.642% due 11/25/2034 | | | | | 1,210 | | | | | | 1,128 | |
0.865% due 06/25/2047 ^ | | | | | 312 | | | | | | 132 | |
0.925% due 07/25/2047 | | | | | 1,256 | | | | | | 1,074 | |
1.314% due 11/25/2042 | | | | | 49 | | | | | | 48 | |
2.167% due 11/25/2046 | | | | | 426 | | | | | | 390 | |
2.198% due 12/25/2036 ^ | | | | | 2,936 | | | | | | 2,654 | |
2.217% due 08/25/2036 | | | | | 284 | | | | | | 249 | |
2.392% due 08/25/2033 | | | | | 821 | | | | | | 847 | |
4.064% due 12/25/2036 ^ | | | | | 335 | | | | | | 307 | |
Washington Mutual Mortgage Pass-Through Certificates Trust | |
0.602% due 05/25/2035 | | | | | 903 | | | | | | 732 | |
0.815% due 04/25/2047 | | | | | 702 | | | | | | 564 | |
0.885% due 04/25/2047 | | | | | 1,026 | | | | | | 830 | |
4.765% due 09/25/2036 | | | | | 221 | | | | | | 130 | |
Wells Fargo Alternative Loan Trust | |
2.590% due 07/25/2037 | | | | | 164 | | | | | | 139 | |
Wells Fargo Mortgage-Backed Securities Trust | |
0.652% due 07/25/2037 | | | | | 335 | | | | | | 285 | |
2.609% due 07/25/2036 | | | | | 3,602 | | | | | | 3,503 | |
2.611% due 10/25/2036 ^ | | | | | 179 | | | | | | 174 | |
2.615% due 08/25/2034 | | | | | 369 | | | | | | 375 | |
2.615% due 01/25/2035 | | | | | 1,061 | | | | | | 1,054 | |
2.615% due 03/25/2035 | | | | | 3,214 | | | | | | 3,269 | |
2.615% due 06/25/2035 | | | | | 6,268 | | | | | | 6,230 | |
2.615% due 03/25/2036 | | | | | 2,122 | | | | | | 2,118 | |
2.620% due 10/25/2036 | | | | | 1,685 | | | | | | 1,595 | |
2.629% due 03/25/2036 | | | | | 285 | | | | | | 274 | |
5.254% due 05/25/2035 | | | | | 165 | | | | | | 166 | |
6.000% due 06/25/2037 | | | | | 415 | | | | | | 422 | |
| | | | | | | | | | | | |
Total Mortgage-Backed Securities
(Cost $405,078) | | | 416,803 | |
| | | | | | | | | | | | |
| | | | | | |
| 66 | | PIMCO MANAGED ACCOUNTS TRUST | | | | See Accompanying Notes |
October 31, 2014
| | | | | | | | | | | | |
| | | | | PRINCIPAL
AMOUNT
(000S) | | | | | MARKET
VALUE (000S) | |
| ASSET-BACKED SECURITIES 9.3% | |
Aames Mortgage Investment Trust | |
0.935% due 10/25/2035 | | $ | | | 200 | | | $ | | | 159 | |
1.355% due 06/25/2035 | | | | | 700 | | | | | | 549 | |
Accredited Mortgage Loan Trust | |
0.282% due 02/25/2037 | | | | | 4,109 | | | | | | 3,921 | |
0.412% due 09/25/2036 | | | | | 1,100 | | | | | | 924 | |
0.630% due 09/25/2035 | | | | | 200 | | | | | | 151 | |
ACE Securities Corp. Home Equity Loan Trust | |
0.262% due 12/25/2036 | | | | | 413 | | | | | | 188 | |
0.292% due 07/25/2036 | | | | | 601 | | | | | | 420 | |
0.307% due 08/25/2036 | | | | | 1,038 | | | | | | 891 | |
0.312% due 05/25/2036 | | | | | 163 | | | | | | 143 | |
0.452% due 02/25/2036 | | | | | 200 | | | | | | 176 | |
0.595% due 11/25/2035 | | | | | 200 | | | | | | 160 | |
0.622% due 10/25/2035 | | | | | 1,800 | | | | | | 1,522 | |
0.772% due 02/25/2036 ^ | | | | | 200 | | | | | | 162 | |
0.802% due 07/25/2035 | | | | | 100 | | | | | | 86 | |
1.052% due 12/25/2034 | | | | | 190 | | | | | | 173 | |
1.127% due 06/25/2034 | | | | | 228 | | | | | | 216 | |
Aegis Asset-Backed Securities Trust | |
0.582% due 12/25/2035 | | | | | 200 | | | | | | 136 | |
0.632% due 06/25/2035 | | | | | 200 | | | | | | 136 | |
0.855% due 03/25/2035 | | | | | 300 | | | | | | 234 | |
1.152% due 03/25/2035 ^ | | | | | 200 | | | | | | 178 | |
Ameriquest Mortgage Securities Trust | |
0.542% due 03/25/2036 | | | | | 400 | | | | | | 340 | |
Ameriquest Mortgage Securities, Inc. Asset-Backed Pass-Through Certificates | |
0.602% due 07/25/2035 | | | | | 800 | | | | | | 712 | |
0.602% due 01/25/2036 | | | | | 300 | | | | | | 274 | |
0.622% due 11/25/2035 | | | | | 200 | | | | | | 159 | |
0.672% due 09/25/2035 | | | | | 10,000 | | | | | | 8,028 | |
0.752% due 08/25/2035 | | | | | 1,000 | | | | | | 988 | |
0.760% due 11/25/2034 | | | | | 77 | | | | | | 77 | |
0.892% due 03/25/2035 | | | | | 200 | | | | | | 158 | |
Amortizing Residential Collateral Trust | |
0.692% due 06/25/2032 | | | | | 41 | | | | | | 38 | |
0.732% due 07/25/2032 | | | | | 73 | | | | | | 67 | |
1.152% due 10/25/2034 | | | | | 372 | | | | | | 367 | |
Argent Securities Trust | |
0.302% due 09/25/2036 | | | | | 1,082 | | | | | | 442 | |
0.342% due 03/25/2036 | | | | | 425 | | | | | | 226 | |
Argent Securities, Inc. Asset-Backed Pass-Through Certificates | |
0.382% due 01/25/2036 | | | | | 145 | | | | | | 98 | |
Asset-Backed Funding Certificates Trust | |
0.262% due 01/25/2037 | | | | | 679 | | | | | | 424 | |
0.312% due 01/25/2037 | | | | | 428 | | | | | | 269 | |
0.372% due 01/25/2037 | | | | | 257 | | | | | | 163 | |
0.772% due 04/25/2034 | | | | | 877 | | | | | | 869 | |
0.827% due 06/25/2035 | | | | | 425 | | | | | | 385 | |
1.152% due 06/25/2037 | | | | | 346 | | | | | | 246 | |
| | | | | | | | | | | | |
| | | | | PRINCIPAL
AMOUNT
(000S) | | | | | MARKET
VALUE (000S) | |
Asset-Backed Securities Corp. Home Equity Loan Trust | |
0.602% due 11/25/2035 | | $ | | | 300 | | | $ | | | 264 | |
1.052% due 06/25/2035 | | | | | 200 | | | | | | 166 | |
1.355% due 06/25/2034 | | | | | 200 | | | | | | 166 | |
3.154% due 08/15/2033 | | | | | 56 | | | | | | 52 | |
Basic Asset-Backed Securities Trust | |
0.462% due 04/25/2036 | | | | | 200 | | | | | | 174 | |
Bayview Financial Asset Trust | |
0.552% due 12/25/2039 | | | | | 502 | | | | | | 472 | |
Bear Stearns Asset-Backed Securities Trust | |
0.265% due 11/25/2036 | | | | | 223 | | | | | | 214 | |
0.302% due 06/25/2036 | | | | | 425 | | | | | | 405 | |
0.322% due 05/25/2036 ^ | | | | | 421 | | | | | | 362 | |
0.332% due 06/25/2047 | | | | | 170 | | | | | | 164 | |
0.342% due 05/25/2037 | | | | | 387 | | | | | | 349 | |
0.352% due 12/25/2036 | | | | | 572 | | | | | | 536 | |
0.422% due 06/25/2036 | | | | | 200 | | | | | | 166 | |
0.552% due 09/25/2046 | | | | | 357 | | | | | | 307 | |
0.585% due 12/25/2035 | | | | | 500 | | | | | | 452 | |
0.602% due 08/25/2036 | | | | | 400 | | | | | | 336 | |
0.655% due 12/25/2035 | | | | | 300 | | | | | | 272 | |
0.702% due 06/25/2036 | | | | | 300 | | | | | | 257 | |
0.742% due 06/25/2043 | | | | | 2,189 | | | | | | 2,161 | |
0.855% due 11/25/2035 | | | | | 273 | | | | | | 230 | |
1.115% due 04/25/2035 | | | | | 180 | | | | | | 168 | |
1.402% due 08/25/2037 | | | | | 218 | | | | | | 201 | |
2.510% due 10/25/2036 | | | | | 85 | | | | | | 64 | |
22.993% due 03/25/2036 | | | | | 265 | | | | | | 293 | |
Carrington Mortgage Loan Trust | |
0.372% due 01/25/2037 | | | | | 1,200 | | | | | | 740 | |
0.412% due 02/25/2037 | | | | | 1,400 | | | | | | 999 | |
1.202% due 05/25/2035 | | | | | 300 | | | | | | 217 | |
Cendant Mortgage Corp. | |
5.973% due 07/25/2043 | | | | | 35 | | | | | | 35 | |
Citigroup Mortgage Loan Trust, Inc. | |
0.292% due 12/25/2036 | | | | | 1,463 | | | | | | 1,304 | |
0.292% due 05/25/2037 | | | | | 122 | | | | | | 117 | |
0.322% due 05/25/2037 | | | | | 800 | | | | | | 709 | |
0.412% due 01/25/2037 | | | | | 300 | | | | | | 247 | |
0.462% due 12/25/2035 | | | | | 911 | | | | | | 849 | |
0.552% due 11/25/2046 | | | | | 478 | | | | | | 407 | |
0.562% due 10/25/2035 | | | | | 1,700 | | | | | | 1,466 | |
0.602% due 11/25/2045 | | | | | 300 | | | | | | 268 | |
0.612% due 09/25/2035 | | | | | 492 | | | | | | 491 | |
0.632% due 09/25/2035 ^ | | | | | 300 | | | | | | 283 | |
0.642% due 09/25/2035 | | | | | 500 | | | | | | 372 | |
0.772% due 05/25/2035 | | | | | 200 | | | | | | 157 | |
5.695% due 05/25/2036 ^ | | | | | 250 | | | | | | 169 | |
Conseco Financial Corp. | |
6.180% due 04/01/2030 | | | | | 2,300 | | | | | | 2,370 | |
6.810% due 12/01/2028 | | | | | 1,507 | | | | | | 1,587 | |
6.870% due 04/01/2030 | | | | | 560 | | | | | | 596 | |
7.060% due 02/01/2031 | | | | | 1,000 | | | | | | 1,024 | |
| | | | | | |
| See Accompanying Notes | | ANNUAL REPORT | | OCTOBER 31, 2014 | | 67 |
Schedule of Investments PIMCO Fixed Income SHares: Series M (Cont.)
| | | | | | | | | | | | |
| | | | | PRINCIPAL
AMOUNT
(000S) | | | | | MARKET
VALUE (000S) | |
7.400% due 06/15/2027 | | $ | | | 11 | | | $ | | | 11 | |
7.550% due 01/15/2029 | | | | | 126 | | | | | | 133 | |
Countrywide Asset-Backed Certificates | |
0.252% due 08/25/2037 | | | | | 188 | | | | | | 186 | |
0.272% due 06/25/2047 | | | | | 142 | | | | | | 142 | |
0.292% due 02/25/2037 | | | | | 197 | | | | | | 190 | |
0.292% due 07/25/2037 | | | | | 8,600 | | | | | | 6,714 | |
0.302% due 12/25/2036 | | | | | 704 | | | | | | 659 | |
0.302% due 05/25/2037 | | | | | 1,595 | | | | | | 1,387 | |
0.305% due 01/25/2037 | | | | | 278 | | | | | | 263 | |
0.312% due 01/25/2034 | | | | | 254 | | | | | | 220 | |
0.312% due 05/25/2036 | | | | | 1,439 | | | | | | 1,323 | |
0.312% due 03/25/2037 | | | | | 543 | | | | | | 490 | |
0.322% due 03/25/2037 | | | | | 902 | | | | | | 794 | |
0.322% due 05/25/2037 | | | | | 743 | | | | | | 662 | |
0.322% due 06/25/2047 | | | | | 891 | | | | | | 796 | |
0.332% due 06/25/2047 | | | | | 1,200 | | | | | | 1,050 | |
0.342% due 06/25/2047 | | | | | 600 | | | | | | 509 | |
0.372% due 09/25/2037 | | | | | 400 | | | | | | 308 | |
0.372% due 09/25/2047 | | | | | 3,200 | | | | | | 2,404 | |
0.382% due 10/25/2047 | | | | | 900 | | | | | | 734 | |
0.402% due 01/25/2046 | | | | | 200 | | | | | | 128 | |
0.402% due 06/25/2047 | | | | | 243 | | | | | | 125 | |
0.455% due 07/25/2036 | | | | | 500 | | | | | | 445 | |
0.502% due 04/25/2036 | | | | | 100 | | | | | | 87 | |
0.537% due 11/25/2035 | | | | | 300 | | | | | | 286 | |
0.552% due 06/25/2036 | | | | | 300 | | | | | | 205 | |
0.602% due 03/25/2047 ^ | | | | | 203 | | | | | | 136 | |
0.605% due 04/25/2036 | | | | | 100 | | | | | | 71 | |
0.622% due 11/25/2033 | | | | | 3 | | | | | | 3 | |
0.632% due 12/25/2031 | | | | | 814 | | | | | | 628 | |
0.642% due 02/25/2036 | | | | | 200 | | | | | | 159 | |
0.672% due 12/25/2035 | | | | | 700 | | | | | | 689 | |
0.812% due 12/25/2035 | | | | | 300 | | | | | | 250 | |
0.852% due 08/25/2035 | | | | | 100 | | | | | | 88 | |
1.155% due 02/25/2035 | | | | | 300 | | | | | | 261 | |
5.530% due 04/25/2047 | | | | | 418 | | | | | | 409 | |
Countrywide Asset-Backed Certificates Trust | |
0.302% due 03/25/2047 | | | | | 469 | | | | | | 402 | |
0.615% due 05/25/2036 | | | | | 600 | | | | | | 489 | |
0.652% due 08/25/2047 | | | | | 70 | | | | | | 69 | |
0.685% due 02/25/2036 | | | | | 200 | | | | | | 165 | |
0.775% due 08/25/2035 | | | | | 200 | | | | | | 186 | |
0.872% due 07/25/2034 | | | | | 300 | | | | | | 284 | |
0.885% due 07/25/2035 | | | | | 400 | | | | | | 337 | |
0.952% due 08/25/2047 | | | | | 1,300 | | | | | | 1,115 | |
1.052% due 10/25/2034 | | | | | 412 | | | | | | 401 | |
1.055% due 04/25/2035 | | | | | 200 | | | | | | 157 | |
1.127% due 02/25/2034 | | | | | 125 | | | | | | 118 | |
Credit-Based Asset Servicing and Securitization LLC | |
0.272% due 07/25/2037 | | | | | 20 | | | | | | 13 | |
0.372% due 07/25/2037 | | | | | 436 | | | | | | 290 | |
0.722% due 07/25/2036 | | | | | 300 | | | | | | 269 | |
1.097% due 04/25/2036 | | | | | 80 | | | | | | 69 | |
4.153% due 07/25/2035 ^ | | | | | 80 | | | | | | 80 | |
| | | | | | | | | | | | |
| | | | | PRINCIPAL
AMOUNT
(000S) | | | | | MARKET
VALUE (000S) | |
Delta Funding Home Equity Loan Trust | |
0.794% due 08/15/2030 | | $ | | | 87 | | | $ | | | 74 | |
Denver Arena Trust | |
6.940% due 11/15/2019 | | | | | 279 | | | | | | 281 | |
EMC Mortgage Loan Trust | |
0.892% due 05/25/2040 | | | | | 20 | | | | | | 18 | |
First Franklin Mortgage Loan Trust | |
0.292% due 12/25/2036 | | | | | 440 | | | | | | 273 | |
0.302% due 07/25/2036 | | | | | 192 | | | | | | 183 | |
0.312% due 04/25/2036 | | | | | 434 | | | | | | 357 | |
0.392% due 04/25/2036 | | | | | 400 | | | | | | 262 | |
0.392% due 08/25/2036 | | | | | 400 | | | | | | 278 | |
0.512% due 10/25/2035 | | | | | 269 | | | | | | 251 | |
0.512% due 11/25/2035 | | | | | 200 | | | | | | 127 | |
0.602% due 06/25/2036 | | | | | 414 | | | | | | 377 | |
0.642% due 09/25/2035 | | | | | 300 | | | | | | 286 | |
0.662% due 09/25/2035 | | | | | 509 | | | | | | 503 | |
0.812% due 04/25/2035 | | | | | 451 | | | | | | 451 | |
0.962% due 04/25/2035 | | | | | 1,000 | | | | | | 941 | |
1.022% due 09/25/2034 | | | | | 501 | | | | | | 443 | |
1.097% due 03/25/2035 | | | | | 100 | | | | | | 85 | |
1.352% due 01/25/2035 | | | | | 122 | | | | | | 99 | |
1.577% due 10/25/2034 | | | | | 948 | | | | | | 783 | |
First NLC Trust | |
0.222% due 08/25/2037 | | | | | 79 | | | | | | 44 | |
0.615% due 05/25/2035 | | | | | 1,337 | | | | | | 1,139 | |
First Plus Home Loan Owners Trust | |
7.320% due 11/10/2023 | | | | | 6 | | | | | | 0 | |
Fremont Home Loan Trust | |
0.302% due 10/25/2036 | | | | | 461 | | | | | | 242 | |
0.302% due 01/25/2037 | | | | | 352 | | | | | | 175 | |
0.312% due 08/25/2036 | | | | | 264 | | | | | | 115 | |
0.322% due 02/25/2036 | | | | | 91 | | | | | | 79 | |
0.322% due 02/25/2037 | | | | | 1,240 | | | | | | 726 | |
0.422% due 02/25/2036 | | | | | 300 | | | | | | 185 | |
0.422% due 04/25/2036 | | | | | 3,000 | | | | | | 1,865 | |
0.642% due 07/25/2035 | | | | | 100 | | | | | | 89 | |
0.942% due 12/25/2029 | | | | | 17 | | | | | | 15 | |
GE-WMC Asset-Backed Pass-Through Certificates | |
0.402% due 12/25/2035 | | | | | 4,484 | | | | | | 4,060 | |
GSAA Home Equity Trust | |
0.272% due 04/25/2047 | | | | | 453 | | | | | | 350 | |
GSAMP Trust | |
0.242% due 01/25/2037 | | | | | 4,183 | | | | | | 2,533 | |
0.272% due 12/25/2036 | | | | | 1,329 | | | | | | 693 | |
0.302% due 06/25/2036 | | | | | 565 | | | | | | 505 | |
0.302% due 09/25/2036 | | | | | 447 | | | | | | 209 | |
0.302% due 12/25/2046 | | | | | 867 | | | | | | 501 | |
0.312% due 05/25/2046 | | | | | 73 | | | | | | 62 | |
0.352% due 11/25/2036 | | | | | 257 | | | | | | 151 | |
0.382% due 12/25/2046 | | | | | 260 | | | | | | 152 | |
0.392% due 12/25/2035 | | | | | 254 | | | | | | 233 | |
0.392% due 06/25/2036 | | | | | 414 | | | | | | 258 | |
| | | | | | |
| 68 | | PIMCO MANAGED ACCOUNTS TRUST | | | | See Accompanying Notes |
October 31, 2014
| | | | | | | | | | | | |
| | | | | PRINCIPAL
AMOUNT
(000S) | | | | | MARKET
VALUE (000S) | |
0.422% due 04/25/2036 | | $ | | | 400 | | | $ | | | 251 | |
1.802% due 10/25/2034 | | | | | 154 | | | | | | 135 | |
Home Equity Asset Trust | |
1.247% due 05/25/2035 | | | | | 200 | | | | | | 163 | |
Home Equity Loan Trust | |
0.382% due 04/25/2037 | | | | | 800 | | | | | | 473 | |
0.492% due 04/25/2037 | | | | | 500 | | | | | | 302 | |
HSI Asset Securitization Corp. Trust | |
0.262% due 12/25/2036 | | | | | 318 | | | | | | 154 | |
0.322% due 12/25/2036 | | | | | 1,448 | | | | | | 701 | |
0.372% due 12/25/2036 | | | | | 965 | | | | | | 472 | |
0.542% due 11/25/2035 | | | | | 300 | | | | | | 214 | |
IndyMac Home Equity Mortgage Loan Asset-Backed Trust | |
0.292% due 11/25/2036 | | | | | 684 | | | | | | 551 | |
0.312% due 11/25/2036 | | | | | 500 | | | | | | 319 | |
0.472% due 04/25/2047 | | | | | 500 | | | | | | 353 | |
IXIS Real Estate Capital Trust | |
0.572% due 02/25/2036 | | | | | 500 | | | | | | 417 | |
JPMorgan Mortgage Acquisition Corp. | |
0.332% due 02/25/2036 | | | | | 503 | | | | | | 483 | |
0.382% due 05/25/2035 | | | | | 522 | | | | | | 509 | |
JPMorgan Mortgage Acquisition Trust | |
0.312% due 01/25/2036 | | | | | 200 | | | | | | 176 | |
0.312% due 01/25/2037 | | | | | 1,022 | | | | | | 997 | |
0.312% due 05/25/2037 | | | | | 200 | | | | | | 180 | |
0.315% due 05/25/2036 | | | | | 563 | | | | | | 545 | |
0.325% due 04/25/2036 | | | | | 1,063 | | | | | | 1,024 | |
0.412% due 03/25/2037 | | | | | 300 | | | | | | 230 | |
0.412% due 05/25/2037 | | | | | 300 | | | | | | 233 | |
0.425% due 04/25/2036 | | | | | 300 | | | | | | 258 | |
0.425% due 05/25/2036 | | | | | 700 | | | | | | 581 | |
0.425% due 07/25/2036 | | | | | 200 | | | | | | 145 | |
0.432% due 01/25/2037 | | | | | 200 | | | | | | 146 | |
6.337% due 08/25/2036 ^ | | | | | 189 | | | | | | 134 | |
Lehman ABS Mortgage Loan Trust | |
0.242% due 06/25/2037 | | | | | 352 | | | | | | 227 | |
0.352% due 06/25/2037 | | | | | 283 | | | | | | 185 | |
Lehman XS Trust | |
0.305% due 04/25/2037 ^ | | | | | 1,378 | | | | | | 1,015 | |
0.322% due 02/25/2037 | | | | | 2,139 | | | | | | 1,164 | |
Long Beach Mortgage Loan Trust | |
0.532% due 08/25/2045 | | | | | 299 | | | | | | 280 | |
0.582% due 11/25/2035 | | | | | 600 | | | | | | 520 | |
0.992% due 07/25/2031 | | | | | 390 | | | | | | 371 | |
1.202% due 06/25/2035 | | | | | 500 | | | | | | 395 | |
1.427% due 02/25/2035 | | | | | 200 | | | | | | 154 | |
1.577% due 03/25/2032 | | | | | 632 | | | | | | 600 | |
MASTR Asset-Backed Securities Trust | |
0.262% due 08/25/2036 | | | | | 248 | | | | | | 132 | |
0.302% due 08/25/2036 | | | | | 409 | | | | | | 219 | |
0.332% due 02/25/2036 | | | | | 559 | | | | | | 328 | |
0.392% due 06/25/2036 | | | | | 240 | | | | | | 135 | |
0.392% due 08/25/2036 | | | | | 246 | | | | | | 133 | |
| | | | | | | | | | | | |
| | | | | PRINCIPAL
AMOUNT
(000S) | | | | | MARKET
VALUE (000S) | |
0.452% due 01/25/2036 | | $ | | | 300 | | | $ | | | 289 | |
0.532% due 01/25/2036 | | | | | 300 | | | | | | 214 | |
0.652% due 10/25/2035 | | | | | 396 | | | | | | 273 | |
0.902% due 12/25/2034 ^ | | | | | 141 | | | | | | 132 | |
Meritage Mortgage Loan Trust | |
0.902% due 11/25/2035 | | | | | 414 | | | | | | 396 | |
Merrill Lynch Mortgage Investors Trust | |
0.352% due 01/25/2037 | | | | | 170 | | | | | | 163 | |
0.392% due 08/25/2037 | | | | | 1,384 | | | | | | 804 | |
0.462% due 08/25/2036 | | | | | 300 | | | | | | 270 | |
0.602% due 02/25/2047 | | | | | 1,675 | | | | | | 1,256 | |
0.632% due 05/25/2036 | | | | | 500 | | | | | | 447 | |
MESA Trust | |
0.952% due 12/25/2031 | | | | | 1,067 | | | | | | 974 | |
Mid-State Capital Corp. Trust | |
6.005% due 08/15/2037 | | | | | 1,031 | | | | | | 1,087 | |
Morgan Stanley ABS Capital, Inc. Trust | |
0.222% due 10/25/2036 | | | | | 125 | | | | | | 76 | |
0.292% due 10/25/2036 | | | | | 185 | | | | | | 114 | |
0.292% due 11/25/2036 | | | | | 349 | | | | | | 248 | |
0.302% due 06/25/2036 | | | | | 776 | | | | | | 664 | |
0.302% due 09/25/2036 | | | | | 481 | | | | | | 273 | |
0.302% due 10/25/2036 | | | | | 300 | | | | | | 205 | |
0.302% due 11/25/2036 | | | | | 1,834 | | | | | | 1,171 | |
0.332% due 03/25/2037 | | | | | 541 | | | | | | 309 | |
0.352% due 02/25/2037 | | | | | 186 | | | | | | 120 | |
0.372% due 11/25/2036 | | | �� | | 436 | | | | | | 314 | |
0.402% due 03/25/2037 | | | | | 541 | | | | | | 311 | |
0.442% due 01/25/2036 | | | | | 2,000 | | | | | | 1,788 | |
0.462% due 12/25/2035 | | | | | 547 | | | | | | 494 | |
1.052% due 05/25/2034 | | | | | 186 | | | | | | 170 | |
1.082% due 03/25/2035 | | | | | 300 | | | | | | 286 | |
1.142% due 06/25/2035 | | | | | 400 | | | | | | 361 | |
1.202% due 04/25/2035 | | | | | 200 | | | | | | 149 | |
1.402% due 07/25/2037 | | | | | 400 | | | | | | 294 | |
1.802% due 03/25/2034 | | | | | 1,598 | | | | | | 1,445 | |
Morgan Stanley Dean Witter Capital, Inc. Trust | |
1.502% due 02/25/2033 | | | | | 1,266 | | | | | | 1,209 | |
Morgan Stanley Home Equity Loan Trust | |
0.312% due 04/25/2036 | | | | | 198 | | | | | | 155 | |
0.322% due 04/25/2037 | | | | | 843 | | | | | | 541 | |
0.382% due 04/25/2037 | | | | | 281 | | | | | | 182 | |
Morgan Stanley Mortgage Loan Trust | |
0.382% due 02/25/2037 | | | | | 231 | | | | | | 136 | |
0.512% due 04/25/2037 | | | | | 391 | | | | | | 223 | |
5.750% due 11/25/2036 ^ | | | | | 337 | | | | | | 182 | |
5.965% due 09/25/2046 | | | | | 601 | | | | | | 437 | |
New Century Home Equity Loan Trust | |
0.382% due 02/25/2036 | | | | | 83 | | | | | | 83 | |
0.402% due 12/25/2035 | | | | | 294 | | | | | | 288 | |
0.432% due 10/25/2035 | | | | | 434 | | | | | | 429 | |
0.602% due 06/25/2035 | | | | | 1,000 | | | | | | 929 | |
| | | | | | |
| See Accompanying Notes | | ANNUAL REPORT | | OCTOBER 31, 2014 | | 69 |
Schedule of Investments PIMCO Fixed Income SHares: Series M (Cont.)
| | | | | | | | | | | | |
| | | | | PRINCIPAL
AMOUNT
(000S) | | | | | MARKET
VALUE (000S) | |
Nomura Home Equity Loan, Inc. Home Equity Loan Trust | |
0.562% due 02/25/2036 | | $ | | | 200 | | | $ | | | 180 | |
6.032% due 10/25/2036 | | | | | 205 | | | | | | 114 | |
NovaStar Mortgage Funding Trust | |
0.302% due 06/25/2036 | | | | | 204 | | | | | | 139 | |
0.522% due 01/25/2036 | | | | | 81 | | | | | | 80 | |
0.622% due 01/25/2036 | | | | | 7,500 | | | | | | 5,877 | |
Option One Mortgage Loan Trust | |
0.292% due 01/25/2037 | | | | | 96 | | | | | | 56 | |
0.322% due 05/25/2037 | | | | | 244 | | | | | | 148 | |
0.372% due 01/25/2037 | | | | | 382 | | | | | | 227 | |
0.482% due 04/25/2037 | | | | | 178 | | | | | | 108 | |
0.512% due 01/25/2036 | | | | | 300 | | | | | | 201 | |
0.662% due 08/25/2035 | | | | | 400 | | | | | | 308 | |
Option One Mortgage Loan Trust Asset-Backed Certificates | |
0.592% due 11/25/2035 | | | | | 400 | | | | | | 379 | |
0.612% due 11/25/2035 | | | | | 1,100 | | | | | | 816 | |
Ownit Mortgage Loan Trust | |
0.752% due 10/25/2036 | | | | | 297 | | | | | | 222 | |
Park Place Securities, Inc. | |
0.642% due 09/25/2035 | | | | | 200 | | | | | | 161 | |
Park Place Securities, Inc. Asset-Backed Pass-Through Certificates | |
0.642% due 08/25/2035 | | | | | 200 | | | | | | 155 | |
0.642% due 09/25/2035 | | | | | 500 | | | | | | 406 | |
0.682% due 07/25/2035 | | | | | 400 | | | | | | 346 | |
0.702% due 07/25/2035 | | | | | 950 | | | | | | 732 | |
0.712% due 01/25/2036 | | | | | 100 | | | | | | 94 | |
0.782% due 06/25/2035 | | | | | 200 | | | | | | 172 | |
0.902% due 03/25/2035 | | | | | 400 | | | | | | 321 | |
0.982% due 01/25/2036 | | | | | 300 | | | | | | 268 | |
1.097% due 02/25/2035 | | | | | 118 | | | | | | 119 | |
1.202% due 10/25/2034 | | | | | 500 | | | | | | 429 | |
1.952% due 12/25/2034 | | | | | 676 | | | | | | 556 | |
People’s Choice Home Loan Securities Trust | |
0.875% due 05/25/2035 ^ | | | | | 200 | | | | | | 183 | |
People’s Financial Realty Mortgage Securities Trust | |
0.292% due 09/25/2036 | | | | | 486 | | | | | | 194 | |
Popular ABS Mortgage Pass-Through Trust | |
0.412% due 11/25/2046 | | | | | 200 | | | | | | 175 | |
0.542% due 02/25/2036 | | | | | 400 | | | | | | 332 | |
RAAC Trust | |
0.452% due 06/25/2044 | | | | | 126 | | | | | | 110 | |
0.502% due 11/25/2046 | | | | | 820 | | | | | | 726 | |
0.552% due 09/25/2045 | | | | | 4,100 | | | | | | 3,329 | |
0.552% due 06/25/2047 | | | | | 195 | | | | | | 182 | |
1.352% due 10/25/2045 | | | | | 250 | | | | | | 226 | |
1.652% due 09/25/2047 | | | | | 600 | | | | | | 489 | |
Renaissance Home Equity Loan Trust | |
5.812% due 11/25/2036 | | | | | 583 | | | | | | 381 | |
7.238% due 09/25/2037 | | | | | 291 | | | | | | 191 | |
| | | | | | | | | | | | |
| | | | | PRINCIPAL
AMOUNT
(000S) | | | | | MARKET
VALUE (000S) | |
Residential Asset Mortgage Products Trust | |
0.312% due 12/25/2036 | | $ | | | 256 | | | $ | | | 250 | |
0.312% due 02/25/2037 | | | | | 604 | | | | | | 550 | |
0.372% due 10/25/2034 | | | | | 146 | | | | | | 133 | |
0.432% due 09/25/2036 | | | | | 300 | | | | | | 232 | |
0.452% due 05/25/2036 | | | | | 1,987 | | | | | | 1,517 | |
0.472% due 01/25/2036 | | | | | 1,000 | | | | | | 727 | |
0.582% due 11/25/2035 | | | | | 250 | | | | | | 212 | |
0.592% due 10/25/2035 | | | | | 200 | | | | | | 181 | |
0.612% due 10/25/2035 | | | | | 100 | | | | | | 80 | |
0.632% due 09/25/2035 | | | | | 300 | | | | | | 259 | |
1.055% due 08/25/2034 | | | | | 303 | | | | | | 284 | |
5.634% due 01/25/2034 | | | | | 2,260 | | | | | | 2,416 | |
5.649% due 07/25/2034 ^ | | | | | 1,906 | | | | | | 1,588 | |
Residential Asset Securities Corp. Trust | |
0.282% due 11/25/2036 | | | | | 984 | | | | | | 817 | |
0.312% due 11/25/2036 | | | | | 1,038 | | | | | | 886 | |
0.322% due 11/25/2036 | | | | | 1,223 | | | | | | 1,079 | |
0.392% due 09/25/2036 | | | | | 900 | | | | | | 787 | |
0.402% due 04/25/2037 | | | | | 400 | | | | | | 351 | |
0.422% due 05/25/2037 | | | | | 300 | | | | | | 271 | |
0.432% due 06/25/2036 | | | | | 1,000 | | | | | | 789 | |
0.482% due 12/25/2035 | | | | | 280 | | | | | | 192 | |
0.492% due 04/25/2037 | | | | | 1,600 | | | | | | 1,114 | |
0.532% due 02/25/2036 | | | | | 400 | | | | | | 350 | |
0.562% due 01/25/2036 | | | | | 200 | | | | | | 174 | |
0.572% due 10/25/2035 | | | | | 300 | | | | | | 252 | |
0.572% due 12/25/2035 | | | | | 400 | | | | | | 329 | |
0.592% due 11/25/2035 | | | | | 300 | | | | | | 259 | |
0.612% due 11/25/2035 | | | | | 300 | | | | | | 234 | |
0.797% due 03/25/2035 | | | | | 2,004 | | | | | | 1,836 | |
0.920% due 03/25/2034 | | | | | 116 | | | | | | 108 | |
0.992% due 12/25/2034 | | | | | 65 | | | | | | 62 | |
7.140% due 04/25/2032 ^ | | | | | 46 | | | | | | 1 | |
SACO Trust | |
0.912% due 11/25/2035 | | | | | 4 | | | | | | 4 | |
Salomon Mortgage Loan Trust | |
1.052% due 11/25/2033 | | | | | 411 | | | | | | 391 | |
Saxon Asset Securities Trust | |
1.322% due 07/25/2031 | | | | | 108 | | | | | | 101 | |
Securitized Asset-Backed Receivables LLC Trust | |
0.242% due 07/25/2036 | | | | | 312 | | | | | | 153 | |
0.292% due 05/25/2036 | | | | | 679 | | | | | | 395 | |
0.312% due 07/25/2036 | | | | | 305 | | | | | | 151 | |
0.392% due 07/25/2036 | | | | | 262 | | | | | | 131 | |
0.402% due 05/25/2036 | | | | | 1,507 | | | | | | 898 | |
0.422% due 03/25/2036 | | | | | 356 | | | | | | 285 | |
0.432% due 08/25/2035 | | | | | 372 | | | | | | 367 | |
0.592% due 08/25/2035 | | | | | 400 | | | | | | 252 | |
0.827% due 01/25/2035 | | | | | 219 | | | | | | 199 | |
1.112% due 01/25/2036 ^ | | | | | 186 | | | | | | 163 | |
3.502% due 01/25/2036 ^ | | | | | 86 | | | | | | 64 | |
SG Mortgage Securities Trust | |
0.312% due 07/25/2036 | | | | | 35,834 | | | | | | 14,789 | |
0.602% due 10/25/2035 | | | | | 1,000 | | | | | | 802 | |
| | | | | | |
| 70 | | PIMCO MANAGED ACCOUNTS TRUST | | | | See Accompanying Notes |
October 31, 2014
| | | | | | | | | | | | |
| | | | | PRINCIPAL
AMOUNT
(000S) | | | | | MARKET
VALUE (000S) | |
SLM Student Loan Trust | |
1.734% due 04/25/2023 | | $ | | | 11,134 | | | $ | | | 11,481 | |
Soundview Home Loan Trust | |
0.232% due 06/25/2037 | | | | | 81 | | | | | | 48 | |
0.262% due 02/25/2037 | | | | | 381 | | | | | | 186 | |
0.302% due 01/25/2037 | | | | | 117 | | | | | | 114 | |
0.312% due 11/25/2036 | | | | | 850 | | | | | | 712 | |
0.332% due 02/25/2037 | | | | | 534 | | | | | | 263 | |
0.332% due 07/25/2037 | | | | | 2,825 | | | | | | 1,790 | |
0.502% due 03/25/2036 | | | | | 400 | | | | | | 327 | |
0.977% due 06/25/2035 | | | | | 300 | | | | | | 268 | |
1.102% due 10/25/2037 | | | | | 593 | | | | | | 401 | |
South Carolina Student Loan Corp. | |
1.234% due 09/03/2024 | | | | | 600 | | | | | | 608 | |
Specialty Underwriting & Residential Finance Trust | |
0.302% due 09/25/2037 | | | | | 183 | | | | | | 107 | |
0.302% due 11/25/2037 | | | | | 1,100 | | | | | | 621 | |
0.422% due 04/25/2037 | | | | | 300 | | | | | | 161 | |
0.802% due 12/25/2035 | | | | | 600 | | | | | | 554 | |
Structured Asset Investment Loan Trust | |
0.302% due 09/25/2036 | | | | | 487 | | | | | | 389 | |
0.342% due 03/25/2036 | | | | | 1,002 | | | | | | 905 | |
0.452% due 01/25/2036 | | | | | 313 | | | | | | 241 | |
1.052% due 05/25/2035 | | | | | 600 | | | | | | 490 | |
1.277% due 07/25/2033 | | | | | 136 | | | | | | 130 | |
Structured Asset Securities Corp. Mortgage Loan Trust | |
0.292% due 09/25/2036 | | | | | 781 | | | | | | 764 | |
0.302% due 09/25/2036 | | | | | 259 | | | | | | 211 | |
0.312% due 03/25/2036 | | | | | 252 | | | | | | 243 | |
0.322% due 12/25/2036 | | | | | 377 | | | | | | 303 | |
0.362% due 02/25/2037 | | | | | 1,277 | | | | | | 1,131 | |
0.382% due 01/25/2037 | | | | | 3,456 | | | | | | 2,275 | |
0.402% due 09/25/2036 | | | | | 200 | | | | | | 159 | |
0.522% due 04/25/2036 | | | | | 600 | | | | | | 513 | |
1.052% due 08/25/2037 | | | | | 521 | | | | | | 486 | |
1.152% due 08/25/2037 | | | | | 1,443 | | | | | | 1,354 | |
Structured Asset Securities Corp. Trust | |
0.612% due 09/25/2035 | | | | | 700 | | | | | | 483 | |
Wells Fargo Home Equity Asset-Backed Securities Trust | |
0.482% due 05/25/2036 | | | | | 300 | | | | | | 239 | |
0.782% due 08/25/2035 | | | | | 1,000 | | | | | | 883 | |
0.782% due 11/25/2035 | | | | | 200 | | | | | | 177 | |
1.202% due 08/25/2035 | | | | | 200 | | | | | | 181 | |
| | | | | | | | | | | | |
Total Asset-Backed Securities
(Cost $213,458) | | | 217,025 | |
| | | | | | | | | | | | |
| |
| SOVEREIGN ISSUES 3.0% | |
Banco Nacional de Desenvolvimento Economico e Social | |
3.375% due 09/26/2016 | | | | | 1,400 | | | | | | 1,433 | |
| | | | | | | | | | | | |
| | | | | PRINCIPAL
AMOUNT
(000S) | | | | | MARKET
VALUE (000S) | |
Export-Import Bank of China | |
4.875% due 07/21/2015 | | $ | | | 7,400 | | | $ | | | 7,610 | |
Export-Import Bank of Korea | |
5.125% due 06/29/2020 | | | | | 21,900 | | | | | | 24,699 | |
Qatar Government International Bond | |
4.000% due 01/20/2015 | | | | | 3,900 | | | | | | 3,931 | |
5.250% due 01/20/2020 | | | | | 10,200 | | | | | | 11,628 | |
6.400% due 01/20/2040 | | | | | 2,300 | | | | | | 2,961 | |
6.550% due 04/09/2019 | | | | | 9,500 | | | | | | 11,329 | |
Venezuela Government International Bond | |
9.250% due 05/07/2028 | | | | | 10,000 | | | | | | 6,400 | |
| | | | | | | | | | | | |
Total Sovereign Issues
(Cost $66,086) | | | 69,991 | |
| | | | | | | | | | | | |
| | | | | | | | | | | | |
| SHORT-TERM INSTRUMENTS 13.2% | |
| | | | | | | | | | | | |
REPURCHASE AGREEMENTS (d) 4.7% | |
| | | | | | | | | | | 110,775 | |
| | | | | | | | | | | | |
| | | | | | | | | | | | |
| SHORT-TERM NOTES 6.8% | |
Fannie Mae | |
0.071% due 04/27/2015 | | | | | 28,700 | | | | | | 28,693 | |
0.076% due 05/01/2015 | | | | | 6,700 | | | | | | 6,698 | |
0.081% due 05/01/2015 | | | | | 3,900 | | | | | | 3,899 | |
Freddie Mac | |
0.020% due 02/06/2015 | | | | | 1,200 | | | | | | 1,200 | |
0.071% due 04/01/2015 - 04/10/2015 | | | | | 109,600 | | | | | | 109,577 | |
0.081% due 04/27/2015 | | | | | 7,300 | | | | | | 7,298 | |
| | | | | | | | | | | | |
| | | | | | | | | | | 157,365 | |
| | | | | | | | | | | | |
| |
| U.S. TREASURY BILLS 1.7% | |
0.024% due 11/06/2014 - 04/16/2015 (a)(e)(h) | | | | | 40,753 | | | | | | 40,752 | |
| | | | | | | | | | | | |
Total Short-Term Instruments
(Cost $308,877) | | | | | | 308,892 | |
| | | | | | | | | | | | |
| |
Total Investments in Securities
(Cost $3,253,128) | | | | | | 3,327,262 | |
| | | | | | | | | | | | |
| |
Total Investments 142.7%
(Cost $3,253,128) | | | $ | | | 3,327,262 | |
| |
Financial Derivative
Instruments (f)(g) (0.1%) (Cost or Premiums, net $(1,114)) | | | (2,418 | ) |
| |
Other Assets and Liabilities,
net (42.6%) | | | | | | (992,643 | ) |
| | | | | | | | | | | | |
| Net Assets 100.0% | | | $ | | | 2,332,201 | |
| | | | | | | | | | | | |
| | | | | | |
| See Accompanying Notes | | ANNUAL REPORT | | OCTOBER 31, 2014 | | 71 |
Schedule of Investments PIMCO Fixed Income SHares: Series M (Cont.)
NOTES TO SCHEDULE OF INVESTMENTS (AMOUNTS IN THOUSANDS*):
| * | A zero balance may reflect actual amounts rounding to less than one thousand. |
| (a) | Coupon represents a weighted average yield to maturity. |
| (b) | Perpetual maturity; date shown, if applicable, represents next contractual call date. |
(c) RESTRICTED SECURITIES:
| | | | | | | | | | | | | | | | | | | | | | | | |
| Issuer Description | | Coupon | | | Maturity
Date | | | Acquisition
Date | | | Cost | | | Market
Value | | | Market Value
as Percentage
of Net Assets | |
KGH Intermediate Holdco LLC | | | 8.500% | | | | 08/07/2019 - 08/08/2019 | | | | 08/07/2014 | | | $ | 17,360 | | | $ | 17,700 | | | | 0.76% | |
| | | | | | | | | | | | | | | | | | | | | | | | |
BORROWINGS AND OTHER FINANCING TRANSACTIONS
(d) REPURCHASE AGREEMENTS:
| | | | | | | | | | | | | | | | | | | | | | | | | | | | |
| Counterparty | | Lending
Rate | | Settlement
Date | | | Maturity
Date | | | Principal
Amount | | | Collateralized By | | Collateral
Received,
at Value | | | Repurchase
Agreements,
at Value | | | Repurchase
Agreement
Proceeds
to be
Received (1) | |
BCY | | 0.060% | | | 10/22/2014 | | | | 11/05/2014 | | | $ | 26,800 | | | U.S. Treasury Notes 1.250% due 01/31/2019 | | $ | (27,224 | ) | | $ | 26,800 | | | $ | 26,801 | |
BOS | | 0.160% | | | 10/31/2014 | | | | 11/03/2014 | | | | 11,200 | | | U.S. Treasury Bonds 3.750% due 11/15/2043 | | | (11,580 | ) | | | 11,200 | | | | 11,200 | |
RDR | | 0.160% | | | 10/31/2014 | | | | 11/03/2014 | | | | 69,500 | | | U.S. Treasury Notes 2.625% due 08/15/2020 | | | (70,965 | ) | | | 69,500 | | | | 69,501 | |
SSB | | 0.000% | | | 10/31/2014 | | | | 11/03/2014 | | | | 3,275 | | | Freddie Mac 2.000% due 11/02/2022 | | | (3,342 | ) | | | 3,275 | | | | 3,275 | |
| | | | | | | | | | | | | | | | | | | | | | | | | | | | |
Total Repurchase Agreements | | | | | | | | | $ | (113,111 | ) | | $ | 110,775 | | | $ | 110,777 | |
| | | | | | | | | | | | | | | | | | | | | | | | | | | | |
| (1) | Includes accrued interest. |
REVERSE REPURCHASE AGREEMENTS:
| | | | | | | | | | | | | | | | | | | | |
| Counterparty | | Borrowing
Rate | | | Borrowing
Date | | | Maturity
Date | | | Amount
Borrowed (2) | | | Payable for
Reverse
Repurchase
Agreements | |
BCY | | | 0.500 | % | | | 10/01/2014 | | | | 11/03/2014 | | | $ | (65,322 | ) | | $ | (65,352 | ) |
| | | 0.500 | % | | | 11/03/2014 | | | | 12/05/2014 | | | | (40,853 | ) | | | (40,853 | ) |
BPG | | | 0.390 | % | | | 10/06/2014 | | | | 11/19/2014 | | | | (21,280 | ) | | | (21,287 | ) |
| | | 0.390 | % | | | 10/14/2014 | | | | 11/17/2014 | | | | (34,323 | ) | | | (34,331 | ) |
| | | 0.410 | % | | | 10/27/2014 | | | | 01/27/2015 | | | | (39,133 | ) | | | (39,136 | ) |
| | | 0.410 | % | | | 10/28/2014 | | | | 01/27/2015 | | | | (17,088 | ) | | | (17,089 | ) |
DEU | | | 0.700 | % | | | 10/24/2014 | | | | 11/17/2014 | | | | (10,082 | ) | | | (10,084 | ) |
RDR | | | 0.370 | % | | | 09/29/2014 | | | | 11/07/2014 | | | | (1,930 | ) | | | (1,931 | ) |
| | | 0.370 | % | | | 10/01/2014 | | | | 11/07/2014 | | | | (27,699 | ) | | | (27,708 | ) |
| | | 0.850 | % | | | 10/06/2014 | | | | 11/07/2014 | | | | (58,074 | ) | | | (58,112 | ) |
UBS | | | 0.300 | % | | | 10/30/2014 | | | | 12/01/2014 | | | | (39,985 | ) | | | (39,986 | ) |
| | | 0.400 | % | | | 10/30/2014 | | | | 12/01/2014 | | | | (24,168 | ) | | | (24,169 | ) |
| | | | | | | | | | | | | | | | | | | | |
Total Reverse Repurchase Agreements | | | | | | | | | | | $ | (380,038 | ) |
| | | | | | | | | | | | | | | | | | | | |
| (2) | The average amount of borrowings while outstanding during the period ended October 31, 2014 was $1,205,894 at a weighted average interest rate of 0.106%. |
| | | | | | |
| 72 | | PIMCO MANAGED ACCOUNTS TRUST | | | | See Accompanying Notes |
October 31, 2014
SHORT SALES:
| | | | | | | | | | | | | | | | | | | | | | |
| Counterparty | | Description | | Coupon | | | Maturity
Date | | | Principal
Amount | | | Proceeds | | | Payable for
Short Sales | |
DEU | | Fannie Mae | | | 5.000% | | | | 11/01/2041 | | | $ | 22,000 | | | $ | (24,350 | ) | | $ | (24,350 | ) |
WFS | | Fannie Mae | | | 3.000% | | | | 11/01/2042 | | | | 31,000 | | | | (31,075 | ) | | | (31,075 | ) |
| | | | | | | | | | | | | | | | | | | | | | |
| | | | | | | | | | | | | | | | $ | (55,425 | ) | | $ | (55,425 | ) |
| | | | | | | | | | | | | | | | | | | | | | |
Total Short Sales | | | | | | | | | | | | | | $ | (55,425 | ) | | $ | (55,425 | ) |
| | | | | | | | | | | | | | | | | | | | | | |
BORROWINGS AND OTHER FINANCING TRANSACTIONS SUMMARY
The following is a summary by counterparty of the market value of Borrowings and Other Financing Transactions and collateral (received)/pledged as of October 31, 2014:
| (e) | Securities with an aggregate market value of $402,533 have been pledged as collateral under the terms of the following master agreements as of October 31, 2014. |
| | | | | | | | | | | | | | | | | | | | | | | | | | | | |
| Counterparty | | Repurchase
Agreement
Proceeds
to be
Received | | | Payable for
Reverse
Repurchase
Agreements | | | Payable for
Sale-Buyback
Transactions | | | Payable for
Short Sales | | | Total
Borrowings and
Other Financing
Transactions | | | Collateral
(Received)/
Pledged | | | Net
Exposure (3) | |
Global/Master Repurchase Agreement | | | | | | | | | | | | | | | | | | | | | | | | | | | | |
BCY | | $ | 26,801 | | | $ | (106,205 | ) | | $ | 0 | | | $ | 0 | | | $ | (79,404 | ) | | $ | 83,050 | | | $ | 3,646 | |
BOS | | | 11,200 | | | | 0 | | | | 0 | | | | 0 | | | | 11,200 | | | | (11,580 | ) | | | (380 | ) |
BPG | | | 0 | | | | (111,843 | ) | | | 0 | | | | 0 | | | | (111,843 | ) | | | 117,925 | | | | 6,082 | |
DEU | | | 0 | | | | (10,084 | ) | | | 0 | | | | 0 | | | | (10,084 | ) | | | 10,999 | | | | 915 | |
RDR | | | 69,501 | | | | (87,751 | ) | | | 0 | | | | 0 | | | | (18,250 | ) | | | 24,279 | | | | 6,029 | |
SSB | | | 3,275 | | | | 0 | | | | 0 | | | | 0 | | | | 3,275 | | | | (3,342 | ) | | | (67 | ) |
UBS | | | 0 | | | | (64,155 | ) | | | 0 | | | | 0 | | | | (64,155 | ) | | | 66,161 | | | | 2,006 | |
| | | | | | | |
Master Securities Forward Transaction Agreement | | | | | | | | | | | | | | | | | | | | | | | | | | | | |
BOA | | | 0 | | | | 0 | | | | 0 | | | | 0 | | | | 0 | | | | (640 | ) | | | (640 | ) |
DEU | | | 0 | | | | 0 | | | | 0 | | | | (24,350 | ) | | | (24,350 | ) | | | 0 | | | | (24,350 | ) |
FOB | | | 0 | | | | 0 | | | | 0 | | | | 0 | | | | 0 | | | | (850 | ) | | | (850 | ) |
GSC | | | 0 | | | | 0 | | | | 0 | | | | 0 | | | | 0 | | | | 282 | | | | 282 | |
JPS | | | 0 | | | | 0 | | | | 0 | | | | 0 | | | | 0 | | | | (140 | ) | | | (140 | ) |
MSC | | | 0 | | | | 0 | | | | 0 | | | | 0 | | | | 0 | | | | (460 | ) | | | (460 | ) |
SAL | | | 0 | | | | 0 | | | | 0 | | | | 0 | | | | 0 | | | | (1,155 | ) | | | (1,155 | ) |
WFS | | | 0 | | | | 0 | | | | 0 | | | | (31,075 | ) | | | (31,075 | ) | | | 0 | | | | (31,075 | ) |
| | | | | | | | | | | | | | | | | | | | | | | | | | | | |
Total Borrowings and Other Financing Transactions | | $ | 110,777 | | | $ | (380,038 | ) | | $ | 0 | | | $ | (55,425 | ) | | | | | | | | | | | | |
| | | | | | | | | | | | | | | | | | | | | | | | | | | | |
| (3) | Net Exposure represents the net receivable/(payable) that would be due from/to the counterparty in the event of default. Exposure from borrowings and other financing transactions can only be netted across transactions governed under the same master agreement with the same legal entity. See Note 7, Principal Risks, in the Notes to Financial Statements for more information regarding master netting arrangements. |
| | | | | | |
| See Accompanying Notes | | ANNUAL REPORT | | OCTOBER 31, 2014 | | 73 |
Schedule of Investments PIMCO Fixed Income SHares: Series M (Cont.)
(f) FINANCIAL DERIVATIVE INSTRUMENTS: EXCHANGE-TRADED OR CENTRALLY CLEARED
SWAP AGREEMENTS:
INTEREST RATE SWAPS
| | | | | | | | | | | | | | | | | | | | | | | | | | | | | | | | | | |
Pay/Receive
Floating Rate | | Floating Rate Index | | Fixed
Rate | | | Maturity
Date | | | Notional
Amount | | | Market
Value | | | Unrealized
Appreciation/
(Depreciation) | | | Variation Margin | |
| | | | | | | | Asset | | | Liability | |
Receive | | 6-Month JPY-LIBOR | | | 1.000 | % | | | 09/18/2023 | | | | JPY | | | | 7,290,000 | | | | $ (2,894 | ) | | | $ (1,346 | ) | | $ | 0 | | | | $ (28) | |
Pay | | 28-Day MXN-TIIE | | | 6.150 | % | | | 06/07/2024 | | | | MXN | | | | 68,000 | | | | 33 | | | | 85 | | | | 0 | | | | (22) | |
| | | | | | | | | | | | | | | | | | | | | | | | | | | | | | | | | | |
| | | | | | | | | | | | | | | | | | | | | $ (2,861 | ) | | | $ (1,261 | ) | | $ | 0 | | | | $ (50) | |
| | | | | | | | | | | | | | | | | | | | | | | | | | | | | | | | | | |
Total Swap Agreements | | | | | | | | | | | | | | | | $ (2,861 | ) | | | $ (1,261 | ) | | $ | 0 | | | | $ (50) | |
| | | | | | | | | | | | | | | | | | | | | | | | | | | | | | | | | | |
FINANCIAL DERIVATIVE INSTRUMENTS: EXCHANGE-TRADED OR CENTRALLY CLEARED SUMMARY
The following is a summary of the market value and variation margin of Exchange-Traded or Centrally Cleared Financial Derivative Instruments as of October 31, 2014:
Cash of $972 has been pledged as collateral for exchange-traded and centrally cleared financial derivative instruments as of October 31, 2014. See Note 7, Principal Risks, in the Notes to Financial Statements for more information regarding master netting arrangements.
| | | | | | | | | | | | | | | | | | | | | | | | | | | | | | |
| | | Financial Derivative Assets | | | | | Financial Derivative Liabilities | |
| | | Market Value | | Variation Margin
Asset | | | Total | | | | | Market Value | | | Variation Margin
Liability | | | Total | |
| | | Purchased
Options | | Futures | | Swap
Agreements | | | | | Written
Options | | | Futures | | | Swap
Agreements | | |
Total Exchange-Traded or Centrally Cleared | | $ 0 | | $ 0 | | $ | 0 | | | $ | 0 | | | | | $ | 0 | | | $ | 0 | | | $ | (50) | | | $ | (50) | |
| | | | | | | | | | | | | | | | | | | | | | | | | | | | | | |
(g) FINANCIAL DERIVATIVE INSTRUMENTS: OVER THE COUNTER
FORWARD FOREIGN CURRENCY CONTRACTS:
| | | | | | | | | | | | | | | | | | | | | | | | | | | | |
| Counterparty | | Settlement
Month | | | Currency to
be Delivered | | | Currency to
be Received | | | Unrealized Appreciation/
(Depreciation) | |
| | | | | Asset | | | Liability | |
BOA | | | 11/2014 | | | | CAD | | | | 50,303 | | | $ | | | | | 44,782 | | | $ | 165 | | | $ | 0 | |
| | | 11/2014 | | | $ | | | | | 37,788 | | | | AUD | | | | 42,661 | | | | 0 | | | | (247 | ) |
| | | 12/2014 | | | | | | | | 807 | | | | MXN | | | | 10,573 | | | | 0 | | | | (24 | ) |
| | | | | | | | | | | | | | | | | | | | | | | | | | | | |
BPS | | | 12/2014 | | | | | | | | 5,651 | | | | | | | | 75,524 | | | | 0 | | | | (57 | ) |
| | | 02/2015 | | | | | | | | 113 | | | | | | | | 1,531 | | | | 0 | | | | 0 | |
| | | | | | | | | | | | | | | | | | | | | | | | | | | | |
BRC | | | 11/2014 | | | | | | | | 65,654 | | | | JPY | | | | 7,072,200 | | | | 0 | | | | (2,692 | ) |
| | | 12/2014 | | | | GBP | | | | 30,068 | | | $ | | | | | 48,363 | | | | 277 | | | | 0 | |
| | | 12/2014 | | | | JPY | | | | 7,072,200 | | | | | | | | 65,667 | | | | 2,692 | | | | 0 | |
| | | 12/2014 | | | $ | | | | | 474 | | | | MXN | | | | 6,423 | | | | 2 | | | | 0 | |
| | | | | | | | | | | | | | | | | | | | | | | | | | | | |
CBK | | | 11/2014 | | | | | | | | 44,671 | | | | CAD | | | | 50,303 | | | | 0 | | | | (54 | ) |
| | | | | | | | | | | | | | | | | | | | | | | | | | | | |
DUB | | | 12/2014 | | | | | | | | 15,696 | | | | EUR | | | | 12,465 | | | | 0 | | | | (73 | ) |
| | | | | | | | | | | | | | | | | | | | | | | | | | | | |
GLM | | | 11/2014 | | | | AUD | | | | 42,661 | | | $ | | | | | 37,660 | | | | 118 | | | | 0 | |
| | | 12/2014 | | | $ | | | | | 37,584 | | | | AUD | | | | 42,661 | | | | 0 | | | | (116 | ) |
| | | 12/2014 | | | | | | | | 1,281 | | | | EUR | | | | 1,018 | | | | 0 | | | | (5 | ) |
| | | | | | | | | | | | | | | | | | | | | | | | | | | | |
HUS | | | 11/2014 | | | | | | | | 3,522 | | | | CAD | | | | 3,949 | | | | 0 | | | | (19 | ) |
| | | | | | | | | | | | | | | | | | | | | | | | | | | | |
| | | | | | |
| 74 | | PIMCO MANAGED ACCOUNTS TRUST | | | | See Accompanying Notes |
October 31, 2014
| | | | | | | | | | | | | | | | | | | | | | | | | | | | |
| Counterparty | | Settlement
Month | | | Currency to
be Delivered | | | Currency to
be Received | | | Unrealized Appreciation/
(Depreciation) | |
| | | | | Asset | | | Liability | |
JPM | | | 11/2014 | | | | JPY | | | | 7,072,200 | | | $ | | | | | 64,988 | | | $ | 2,026 | | | $ | 0 | |
| | | | | | | | | | | | | | | | | | | | | | | | | | | | |
UAG | | | 11/2014 | | | | BRL | | | | 4,944 | | | | | | | | 2,002 | | | | 6 | | | | 0 | |
| | | 11/2014 | | | | EUR | | | | 2,875 | | | | | | | | 3,678 | | | | 75 | | | | 0 | |
| | | 11/2014 | | | $ | | | | | 2,086 | | | | BRL | | | | 4,945 | | | | 0 | | | | (90 | ) |
| | | 11/2014 | | | | | | | | 3,654 | | | | EUR | | | | 2,875 | | | | 0 | | | | (51 | ) |
| | | 12/2014 | | | | EUR | | | | 2,875 | | | $ | | | | | 3,654 | | | | 51 | | | | 0 | |
| | | 12/2014 | | | $ | | | | | 1,987 | | | | BRL | | | | 4,945 | | | | 0 | | | | (8 | ) |
| | | | | | | | | | | | | | | | | | | | | | | | | | | | |
Total Forward Foreign Currency Contracts | | | | | | | | | | | $ | 5,412 | | | $ | (3,436 | ) |
| | | | | | | | | | | | | | | | | | | | | | | | | | | | |
PURCHASED OPTIONS:
OPTIONS ON SECURITIES
| | | | | | | | | | | | | | | | | | | | | | |
| Counterparty | | Description | | Strike
Price | | | Expiration
Date | | | Notional
Amount | | | Cost | | | Market
Value | |
JPM | | Put - OTC Fannie Mae 4.000% due 11/01/2044 | | $ | 73.000 | | | | 11/06/2014 | | | $ | 100,000 | | | $ | 4 | | | $ | 0 | |
| | Put - OTC Fannie Mae 4.000% due 11/01/2044 | | | 75.000 | | | | 11/06/2014 | | | | 110,000 | | | | 4 | | | | 0 | |
| | Put - OTC Fannie Mae 4.000% due 11/01/2044 | | | 77.000 | | | | 11/06/2014 | | | | 100,000 | | | | 4 | | | | 0 | |
| | Put - OTC Fannie Mae 4.000% due 11/01/2044 | | | 78.000 | | | | 11/06/2014 | | | | 200,000 | | | | 8 | | | | 0 | |
| | | | | | | | | | | | | | | | | | | | | | |
| | | | | | | | | | | | | | | | $ | 20 | | | $ | 0 | |
| | | | | | | | | | | | | | | | | | | | | | |
Total Purchased Options | | | $ | 20 | | | $ | 0 | |
| | | | | | | | | | | | | | | | | | | | | | |
WRITTEN OPTIONS:
FOREIGN CURRENCY OPTIONS
| | | | | | | | | | | | | | | | | | | | | | | | | | |
| Counterparty | | Description | | Strike
Price | | | Expiration
Date | | | Notional
Amount | | | Premiums
(Received) | | | Market
Value | |
JPM | | Call - OTC USD versus INR | | | INR | | | | 65.900 | | | | 03/19/2015 | | | $ | 46,500 | | | $ | (453 | ) | | $ | (243 | ) |
| | | | | | | | | | | | | | | | | | | | | | | | | | |
UAG | | Call - OTC USD versus INR | | | | | | | 66.150 | | | | 03/19/2015 | | | | 46,500 | | | | (444 | ) | | | (223 | ) |
| | | | | | | | | | | | | | | | | | | | | | | | | | |
| | | | | | | | | | | | | | | | | | | | $ | (897 | ) | | $ | (466 | ) |
| | | | | | | | | | | | | | | | | | | | | | | | | | |
Total Written Options | | | $ | (897 | ) | | $ | (466 | ) |
| | | | | | | | | | | | | | | | | | | | | | | | | | |
TRANSACTIONS IN WRITTEN CALL AND PUT OPTIONS FOR THE PERIOD ENDED OCTOBER 31, 2014:
| | | | | | | | | | | | |
| | | # of
Contracts | | | Notional
Amount | | | Premiums | |
Balance at Beginning of Period | | | 536 | | | $ | 12,874,000 | | | $ | (26,746 | ) |
Sales | | | 0 | | | | 1,879,100 | | | | (9,617 | ) |
Closing Buys | | | 0 | | | | (12,790,800 | ) | | | 27,688 | |
Expirations | | | (536 | ) | | | (1,869,300 | ) | | | 7,778 | |
Exercised | | | 0 | | | | 0 | | | | 0 | |
| | | | | | | | | | | | |
Balance at End of Period | | | 0 | | | $ | 93,000 | | | $ | (897 | ) |
| | | | | | | | | | | | |
| | | | | | |
| See Accompanying Notes | | ANNUAL REPORT | | OCTOBER 31, 2014 | | 75 |
Schedule of Investments PIMCO Fixed Income SHares: Series M (Cont.)
SWAP AGREEMENTS:
CREDIT DEFAULT SWAPS ON CORPORATE ISSUES - BUY PROTECTION (1)
| | | | | | | | | | | | | | | | | | | | | | | | | | | | | | | | | | | | |
| Counterparty | | Reference Entity | | Fixed Deal
(Pay) Rate | | | Maturity
Date | | | Implied
Credit
Spread at
October 31,
2014 (3) | | | | | Notional
Amount (4) | | | Premiums
Paid/
(Received) | | | Unrealized
(Depreciation) | | | Swap Agreements,
at Value | |
| | | | | | | | | | Asset | | | Liability | |
| BOA | | Macy’s Retail Holdings, Inc. | | | (7.060% | ) | | | 09/20/2015 | | | | 0.081% | | | | | $ | 5,000 | | | $ | 0 | | | $ | (354 | ) | | $ | 0 | | | $ | (354 | ) |
| | | | | | | | | | | | | | | | | | | | | | | | | | | | | | | | | | | | |
CREDIT DEFAULT SWAPS ON CORPORATE AND U.S. MUNICIPAL ISSUES - SELL PROTECTION (2)
| | | | | | | | | | | | | | | | | | | | | | | | | | | | | | | | | | | | | | |
| Counterparty | | Reference Entity | | Fixed Deal
Receive Rate | | | Maturity
Date | | | Implied
Credit
Spread at
October 31,
2014 (3) | | | Notional
Amount (4) | | | Premiums
Paid/
(Received) | | | Unrealized
Appreciation/
(Depreciation) | | | Swap Agreements,
at Value | |
| | | | | | | | | Asset | | | Liability | |
| DUB | | BP Capital Markets America, Inc. | | | 1.000% | | | | 12/20/2018 | | | | 0.555% | | | | EUR | | | | 8,200 | | | $ | 218 | | | $ | (18 | ) | | $ | 200 | | | $ | 0 | |
| | | | | | | | | | | | | | | | | | | | | | | | | | | | | | | | | | | | | | |
| GST | | Bank of America Corp. | | | 1.000% | | | | 03/20/2018 | | | | 0.465% | | | | $ | | | | 30,000 | | | | (316 | ) | | | 887 | | | | 571 | | | | 0 | |
| | California State General Obligation Bonds, Series 2003 | | | 1.600% | | | | 12/20/2018 | | | | 0.415% | | | | | | | | 25,000 | | | | 0 | | | | 1,237 | | | | 1,237 | | | | 0 | |
| | California State General Obligation Bonds, Series 2003 | | | 1.750% | | | | 12/20/2018 | | | | 0.415% | | | | | | | | 11,000 | | | | 0 | | | | 612 | | | | 612 | | | | 0 | |
| | Connecticut State General Obligation Notes, Series 2007 | | | 1.600% | | | | 03/20/2021 | | | | 0.990% | | | | | | | | 9,000 | | | | 0 | | | | 330 | | | | 330 | | | | 0 | |
| | | | | | | | | | | | | | | | | | | | | | | | | | | | | | | | | | | | | | |
| | | | | | | | | | | | | | | | | | | | | | | | $ | (98 | ) | | $ | 3,048 | | | $ | 2,950 | | | $ | 0 | |
| | | | | | | | | | | | | | | | | | | | | | | | | | | | | | | | | | | | | | |
| (1) | If the Portfolio is a buyer of protection and a credit event occurs, as defined under the terms of that particular swap agreement, the Portfolio will either (i) receive from the seller of protection an amount equal to the notional amount of the swap and deliver the referenced obligation or underlying securities comprising the referenced index or (ii) receive a net settlement amount in the form of cash or securities equal to the notional amount of the swap less the recovery value of the referenced obligation or underlying securities comprising the referenced index. |
| (2) | If the Portfolio is a seller of protection and a credit event occurs, as defined under the terms of that particular swap agreement, the Portfolio will either (i) pay to the buyer of protection an amount equal to the notional amount of the swap and take delivery of the referenced obligation or underlying securities comprising the referenced index or (ii) pay a net settlement amount in the form of cash or securities equal to the notional amount of the swap less the recovery value of the referenced obligation or underlying securities comprising the referenced index. |
| (3) | Implied credit spreads, represented in absolute terms, utilized in determining the market value of credit default swap agreements on corporate or U.S. municipal issues as of period end serve as an indicator of the current status of the payment/performance risk and represent the likelihood or risk of default for the credit derivative. The implied credit spread of a particular referenced entity reflects the cost of buying/selling protection and may include upfront payments required to be made to enter into the agreement. Wider credit spreads represent a deterioration of the referenced entity’s credit soundness and a greater likelihood or risk of default or other credit event occurring as defined under the terms of the agreement. |
| (4) | The maximum potential amount the Portfolio could be required to pay as a seller of credit protection or receive as a buyer of credit protection if a credit event occurs as defined under the terms of that particular swap agreement. |
| | | | | | |
| 76 | | PIMCO MANAGED ACCOUNTS TRUST | | | | See Accompanying Notes |
October 31, 2014
INTEREST RATE SWAPS
| | | | | | | | | | | | | | | | | | | | | | | | | | | | | | | | | | | | |
| Counterparty | | Pay/
Receive
Floating
Rate | | Floating Rate Index | | Fixed
Rate | | | Maturity
Date | | | Notional
Amount | | | Premiums
Paid/
(Received) | | | Unrealized
Appreciation/
(Depreciation) | | | Swap Agreements,
at Value | |
| | | | | | | | | Asset | | | Liability | |
BOA | | Pay | | 28-Day MXN-TIIE | | | 8.300% | | | | 02/07/2019 | | | | MXN | | | | 40,400 | | | $ | 0 | | | $ | 404 | | | $ | 404 | | | $ | 0 | |
| | | | | | | | | | | | | | | | | | | | | | | | | | | | | | | | | | | | |
BRC | | Pay | | 1-Year BRL-CDI | | | 8.180% | | | | 01/02/2017 | | | | BRL | | | | 34,400 | | | | (46 | ) | | | (1,065 | ) | | | 0 | | | | (1,111 | ) |
| | | | | | | | | | | | | | | | | | | | | | | | | | | | | | | | | | | | |
DUB | | Pay | | 1-Year BRL-CDI | | | 8.285% | | | | 01/02/2017 | | | | | | | | 61,000 | | | | (72 | ) | | | (1,827 | ) | | | 0 | | | | (1,899 | ) |
| | | | | | | | | | | | | | | | | | | | | | | | | | | | | | | | | | | | |
MYC | | Pay | | 1-Year BRL-CDI | | | 8.220% | | | | 01/02/2017 | | | | | | | | 13,600 | | | | (21 | ) | | | (411 | ) | | | 0 | | | | (432 | ) |
| | | | | | | | | | | | | | | | | | | | | | | | | | | | | | | | | | | | |
UAG | | Pay | | 1-Year BRL-CDI | | | 8.900% | | | | 01/02/2017 | | | | | | | | 143,900 | | | | 0 | | | | (3,436 | ) | | | 0 | | | | (3,436 | ) |
| | | | | | | | | | | | | | | | | | | | | | | | | | | | | | | | | | | | |
| | | | | | | | | | | | | | | | | | | | | | $ | (139 | ) | | $ | (6,335 | ) | | $ | 404 | | | $ | (6,878 | ) |
| | | | | | | | | | | | | | | | | | | | | | | | | | | | | | | | | | | | |
Total Swap Agreements | | | | | | | | | | | | | | | | | | $ | (237 | ) | | $ | (3,641 | ) | | $ | 3,354 | | | $ | (7,232 | ) |
| | | | | | | | | | | | | | | | | | | | | | | | | | | | | | | | | | | | |
FINANCIAL DERIVATIVE INSTRUMENTS: OVER THE COUNTER SUMMARY
The following is a summary by counterparty of the market value of OTC financial derivative instruments and collateral (received)/pledged as of October 31, 2014:
| (h) | Securities with an aggregate market value of $7,605 have been pledged as collateral for financial derivative instruments as governed by International Swaps and Derivatives Association, Inc. master agreements as of October 31, 2014. |
| | | | | | | | | | | | | | | | | | | | | | | | | | | | | | | | | | | | | | | | | | | | | | |
| | | Financial Derivative Assets | | | | | Financial Derivative Liabilities | | | | | | | | | | |
| Counterparty | | Forward
Foreign
Currency
Contracts | | | Purchased
Options | | | Swap
Agreements | | | Total
Over
the
Counter | | | | | Forward
Foreign
Currency
Contracts | | | Written
Options | | | Swap
Agreements | | | Total
Over
the
Counter | | | Net
Market
Value of
OTC
Derivatives | | | Collateral
(Received)/
Pledged | | | Net
Exposure (5) | |
BOA | | $ | 165 | | | $ | 0 | | | $ | 404 | | | $ | 569 | | | | | $ | (271 | ) | | $ | 0 | | | $ | (354 | ) | | $ | (625 | ) | | $ | (56 | ) | | $ | 281 | | | $ | 225 | |
BPS | | | 0 | | | | 0 | | | | 0 | | | | 0 | | | | | | (57 | ) | | | 0 | | | | 0 | | | | (57 | ) | | | (57 | ) | | | 262 | | | | 205 | |
BRC | | | 2,971 | | | | 0 | | | | 0 | | | | 2,971 | | | | | | (2,692 | ) | | | 0 | | | | (1,111 | ) | | | (3,803 | ) | | | (832 | ) | | | 979 | | | | 147 | |
CBK | | | 0 | | | | 0 | | | | 0 | | | | 0 | | | | | | (54 | ) | | | 0 | | | | 0 | | | | (54 | ) | | | (54 | ) | | | (320 | ) | | | (374 | ) |
DUB | | | 0 | | | | 0 | | | | 200 | | | | 200 | | | | | | (73 | ) | | | 0 | | | | (1,899 | ) | | | (1,972 | ) | | | (1,772 | ) | | | 1,731 | | | | (41 | ) |
GLM | | | 118 | | | | 0 | | | | 0 | | | | 118 | | | | | | (121 | ) | | | 0 | | | | 0 | | | | (121 | ) | | | (3 | ) | | | 0 | | | | (3 | ) |
GST | | | 0 | | | | 0 | | | | 2,750 | | | | 2,750 | | | | | | 0 | | | | 0 | | | | 0 | | | | 0 | | | | 2,750 | | | | (2,730 | ) | | | 20 | |
HUS | | | 0 | | | | 0 | | | | 0 | | | | 0 | | | | | | (19 | ) | | | 0 | | | | 0 | | | | (19 | ) | | | (19 | ) | | | 0 | | | | (19 | ) |
JPM | | | 2,026 | | | | 0 | | | | 0 | | | | 2,026 | | | | | | 0 | | | | (243 | ) | | | 0 | | | | (243 | ) | | | 1,783 | | | | 179 | | | | 1,962 | |
MYC | | | 0 | | | | 0 | | | | 0 | | | | 0 | | | | | | 0 | | | | 0 | | | | (432 | ) | | | (432 | ) | | | (432 | ) | | | 586 | | | | 154 | |
UAG | | | 132 | | | | 0 | | | | 0 | | | | 132 | | | | | | (149 | ) | | | (223 | ) | | | (3,436 | ) | | | (3,808 | ) | | | (3,676 | ) | | | 3,558 | | | | (118 | ) |
| | | | | | | | | | | | | | | | | | | | | | | | | | | | | | | | | | | | | | | | | | | | | | |
Total Over the
Counter | | $ | 5,412 | | | $ | 0 | | | $ | 3,354 | | | $ | 8,766 | | | | | $ | (3,436 | ) | | $ | (466 | ) | | $ | (7,232 | ) | | $ | (11,134 | ) | | | | | | | | | | | | |
| | | | | | | | | | | | | | | | | | | | | | | | | | | | | | | | | | | | | | | | | | | | | | |
| (5) | Net Exposure represents the net receivable/(payable) that would be due from/to the counterparty in the event of default. Exposure from OTC financial derivative instruments can only be netted across transactions governed under the same master agreement with the same legal entity. See Note 7, Principal Risks, in the Notes to Financial Statements for more information regarding master netting arrangements. |
| | | | | | |
| See Accompanying Notes | | ANNUAL REPORT | | OCTOBER 31, 2014 | | 77 |
Schedule of Investments PIMCO Fixed Income SHares: Series M (Cont.)
FAIR VALUE OF FINANCIAL DERIVATIVE INSTRUMENTS
The following is a summary of the fair valuation of the Portfolio’s derivative instruments categorized by risk exposure. See Note 7, Principal Risks, in the Notes to Financial Statements on risks of the Portfolio.
Fair Values of Financial Derivative Instruments on the Statements of Assets and Liabilities as of October 31, 2014:
| | | | | | | | | | | | | | | | | | | | | | | | |
| | | Derivatives not accounted for as hedging instruments | |
| | | Commodity
Contracts | | | Credit
Contracts | | | Equity
Contracts | | | Foreign
Exchange
Contracts | | | Interest
Rate Contracts | | | Total | |
Financial Derivative Instruments - Assets | | | | | | | | | | | | | | | | | | | | | | | | |
Over the counter | | | | | | | | | | | | | | | | | | | | | | | | |
Forward Foreign Currency Contracts | | $ | 0 | | | $ | 0 | | | $ | 0 | | | $ | 5,412 | | | $ | 0 | | | $ | 5,412 | |
Swap Agreements | | | 0 | | | | 2,950 | | | | 0 | | | | 0 | | | | 404 | | | | 3,354 | |
| | | | | | | | | | | | | | | | | | | | | | | | |
| | $ | 0 | | | $ | 2,950 | | | $ | 0 | | | $ | 5,412 | | | $ | 404 | | | $ | 8,766 | |
| | | | | | | | | | | | | | | | | | | | | | | | |
| | | | | |
Financial Derivative Instruments - Liabilities | | | | | | | | | | | | | | | | | | | | | |
Exchange-traded or centrally cleared | | | | | | | | | | | | | | | | | | | | | | | | |
Swap Agreements | | $ | 0 | | | $ | 0 | | | $ | 0 | | | $ | 0 | | | $ | 50 | | | $ | 50 | |
| | | | | | | | | | | | | | | | | | | | | | | | |
Over the counter | | | | | | | | | | | | | | | | | | | | | | | | |
Forward Foreign Currency Contracts | | $ | 0 | | | $ | 0 | | | $ | 0 | | | $ | 3,436 | | | $ | 0 | | | $ | 3,436 | |
Written Options | | | 0 | | | | 0 | | | | 0 | | | | 466 | | | | 0 | | | | 466 | |
Swap Agreements | | | 0 | | | | 354 | | | | 0 | | | | 0 | | | | 6,878 | | | | 7,232 | |
| | | | | | | | | | | | | | | | | | | | | | | | |
| | $ | 0 | | | $ | 354 | | | $ | 0 | | | $ | 3,902 | | | $ | 6,878 | | | $ | 11,134 | |
| | | | | | | | | | | | | | | | | | | | | | | | |
| | $ | 0 | | | $ | 354 | | | $ | 0 | | | $ | 3,902 | | | $ | 6,928 | | | $ | 11,184 | |
| | | | | | | | | | | | | | | | | | | | | | | | |
The Effect of Financial Derivative Instruments on the Statements of Operations for the Period Ended October 31, 2014:
| | | | | | | | | | | | | | | | | | | | | | | | |
| | | Derivatives not accounted for as hedging instruments | |
| | | Commodity
Contracts | | | Credit
Contracts | | | Equity
Contracts | | | Foreign
Exchange
Contracts | | | Interest
Rate Contracts | | | Total | |
Net Realized Gain (Loss) on Financial Derivative Instruments | | | | | | | | | | | | | | | | | | | | | | | | |
Exchange-traded or centrally cleared | | | | | | | | | | | | | | | | | | | | | | | | |
Purchased Options | | $ | 0 | | | $ | 0 | | | $ | 0 | | | $ | 0 | | | $ | (99 | ) | | $ | (99 | ) |
Written Options | | | 0 | | | | 0 | | | | 0 | | | | 0 | | | | 217 | | | | 217 | |
Futures | | | 0 | | | | 0 | | | | 0 | | | | 0 | | | | (19,497 | ) | | | (19,497 | ) |
Swap Agreements | | | 0 | | | | 0 | | | | 0 | | | | 0 | | | | (56,772 | ) | | | (56,772 | ) |
| | | | | | | | | | | | | | | | | | | | | | | | |
| | $ | 0 | | | $ | 0 | | | $ | 0 | | | $ | 0 | | | $ | (76,151 | ) | | $ | (76,151 | ) |
| | | | | | | | | | | | | | | | | | | | | | | | |
Over the counter | | | | | | | | | | | | | | | | | | | | | | | | |
Forward Foreign Currency Contracts | | $ | 0 | | | $ | 0 | | | $ | 0 | | | $ | 6,939 | | | $ | 0 | | | $ | 6,939 | |
Purchased Options | | | 0 | | | | 0 | | | | 0 | | | | 0 | | | | (63 | ) | | | (63 | ) |
Written Options | | | 0 | | | | 1,541 | | | | 0 | | | | 4,043 | | | | 23,146 | | | | 28,730 | |
Swap Agreements | | | 0 | | | | 1,339 | | | | 0 | | | | 0 | | | | (890 | ) | | | 449 | |
| | | | | | | | | | | | | | | | | | | | | | | | |
| | $ | 0 | | | $ | 2,880 | | | $ | 0 | | | $ | 10,982 | | | $ | 22,193 | | | $ | 36,055 | |
| | | | | | | | | | | | | | | | | | | | | | | | |
| | $ | 0 | | | $ | 2,880 | | | $ | 0 | | | $ | 10,982 | | | $ | (53,958 | ) | | $ | (40,096 | ) |
| | | | | | | | | | | | | | | | | | | | | | | | |
| | | | | | |
| 78 | | PIMCO MANAGED ACCOUNTS TRUST | | | | See Accompanying Notes |
October 31, 2014
| | | | | | | | | | | | | | | | | | | | | | | | |
| | | Derivatives not accounted for as hedging instruments | |
| | | Commodity
Contracts | | | Credit
Contracts | | | Equity
Contracts | | | Foreign
Exchange
Contracts | | | Interest
Rate Contracts | | | Total | |
Net Change in Unrealized Appreciation (Depreciation) on Financial Derivative Instruments | | | | | | | | | | | | | | | | | | | | | | | | |
Exchange-traded or centrally cleared | | | | | | | | | | | | | | | | | | | | | | | | |
Written Options | | $ | 0 | | | $ | 0 | | | $ | 0 | | | $ | 0 | | | $ | (130 | ) | | $ | (130 | ) |
Futures | | | 0 | | | | 0 | | | | 0 | | | | 0 | | | | (4,843 | ) | | | (4,843 | ) |
Swap Agreements | | | 0 | | | | 0 | | | | 0 | | | | 0 | | | | 20,051 | | | | 20,051 | |
| | | | | | | | | | | | | | | | | | | | | | | | |
| | $ | 0 | | | $ | 0 | | | $ | 0 | | | $ | 0 | | | $ | 15,078 | | | $ | 15,078 | |
| | | | | | | | | | | | | | | | | | | | | | | | |
Over the counter | | | | | | | | | | | | | | | | | | | | | | | | |
Forward Foreign Currency Contracts | | $ | 0 | | | $ | 0 | | | $ | 0 | | | $ | 99 | | | $ | 0 | | | $ | 99 | |
Purchased Options | | | 0 | | | | 0 | | | | 0 | | | | 0 | | | | (20 | ) | | | (20 | ) |
Written Options | | | 0 | | | | (791 | ) | | | 0 | | | | 431 | | | | (10,286 | ) | | | (10,646 | ) |
Swap Agreements | | | 0 | | | | 620 | | | | 0 | | | | 0 | | | | 54 | | | | 674 | |
| | | | | | | | | | | | | | | | | | | | | | | | |
| | $ | 0 | | | $ | (171 | ) | | $ | 0 | | | $ | 530 | | | $ | (10,252 | ) | | $ | (9,893 | ) |
| | | | | | | | | | | | | | | | | | | | | | | | |
| | $ | 0 | | | $ | (171 | ) | | $ | 0 | | | $ | 530 | | | $ | 4,826 | | | $ | 5,185 | |
| | | | | | | | | | | | | | | | | | | | | | | | |
FAIR VALUE MEASUREMENTS
The following is a summary of the fair valuations according to the inputs used as of October 31, 2014 in valuing the Portfolio’s assets and liabilities:
| | | | | | | | | | | | | | | | |
| Category and Subcategory | | Level 1 | | | Level 2 | | | Level 3 | | | Fair
Value at
10/31/2014 | |
Investments in Securities, at Value | | | | | | | | | |
Corporate Bonds & Notes | | | | | | | | | | | | | | | | |
Banking & Finance | | $ | 0 | | | $ | 580,220 | | | $ | 28,852 | | | $ | 609,072 | |
Industrials | | | 0 | | | | 318,556 | | | | 0 | | | | 318,556 | |
Utilities | | | 0 | | | | 275,405 | | | | 0 | | | | 275,405 | |
Municipal Bonds & Notes | | | | | | | | | | | | | | | | |
California | | | 0 | | | | 200,379 | | | | 0 | | | | 200,379 | |
Illinois | | | 0 | | | | 15,665 | | | | 0 | | | | 15,665 | |
Massachusetts | | | 0 | | | | 851 | | | | 0 | | | | 851 | |
Michigan | | | 0 | | | | 1,469 | | | | 0 | | | | 1,469 | |
New Jersey | | | 0 | | | | 18,077 | | | | 0 | | | | 18,077 | |
New York | | | 0 | | | | 87,695 | | | | 0 | | | | 87,695 | |
Ohio | | | 0 | | | | 44,813 | | | | 0 | | | | 44,813 | |
Pennsylvania | | | 0 | | | | 10,390 | | | | 0 | | | | 10,390 | |
Tennessee | | | 0 | | | | 127 | | | | 0 | | | | 127 | |
Washington | | | 0 | | | | 8,380 | | | | 0 | | | | 8,380 | |
West Virginia | | | 0 | | | | 26,493 | | | | 0 | | | | 26,493 | |
U.S. Government Agencies | | | 0 | | | | 695,363 | | | | 0 | | | | 695,363 | |
U.S. Treasury Obligations | | | 0 | | | | 1,816 | | | | 0 | | | | 1,816 | |
Mortgage-Backed Securities | | | 0 | | | | 410,815 | | | | 5,988 | | | | 416,803 | |
Asset-Backed Securities | | | 0 | | | | 216,553 | | | | 472 | | | | 217,025 | |
Sovereign Issues | | | 0 | | | | 69,991 | | | | 0 | | | | 69,991 | |
Short-Term Instruments | | | | | | | | | | | | | | | | |
Repurchase Agreements | | | 0 | | | | 110,775 | | | | 0 | | | | 110,775 | |
Short-Term Notes | | | 0 | | | | 157,365 | | | | 0 | | | | 157,365 | |
U.S. Treasury Bills | | | 0 | | | | 40,752 | | | | 0 | | | | 40,752 | |
| | | | |
Total Investments | | $ | 0 | | | $ | 3,291,950 | | | $ | 35,312 | | | $ | 3,327,262 | |
| | | | | | |
| See Accompanying Notes | | ANNUAL REPORT | | OCTOBER 31, 2014 | | 79 |
Schedule of Investments PIMCO Fixed Income SHares: Series M (Cont.)
October 31, 2014
| | | | | | | | | | | | | | | | |
| Category and Subcategory | | Level 1 | | | Level 2 | | | Level 3 | | | Fair
Value at
10/31/2014 | |
Short Sales, at Value - Liabilities | | | | | | | | | | | | | | | | |
U.S. Government Agencies | | $ | 0 | | | $ | (55,425 | ) | | $ | 0 | | | $ | (55,425 | ) |
| | | | |
Financial Derivative Instruments - Assets | | | | | | | | | | | | | | | | |
Over the counter | | $ | 0 | | | $ | 8,766 | | | $ | 0 | | | $ | 8,766 | |
| | | | |
Financial Derivative Instruments - Liabilities | | | | | | | | | | | | | | | | |
Exchange-traded or centrally cleared | | | 0 | | | | (50 | ) | | | 0 | | | | (50 | ) |
Over the counter | | | 0 | | | | (11,134 | ) | | | 0 | | | | (11,134 | ) |
| | $ | 0 | | | $ | (11,184 | ) | | $ | 0 | | | $ | (11,184 | ) |
| | | | |
Totals | | $ | 0 | | | $ | 3,234,107 | | | $ | 35,312 | | | $ | 3,269,419 | |
There were no significant transfers between Level 1 and 2 during the period ended October 31, 2014.
The following is a reconciliation of the fair valuations using significant unobservable inputs (Level 3) for the Portfolio during the period ended October 31, 2014:
| | | | | | | | | | | | | | | | | | | | | | | | | | | | | | | | | | | | | | | | |
| Category and Subcategory | | Beginning
Balance
at
10/31/2013 | | | Net
Purchases | | | Net
Sales | | | Accrued
Discounts/
(Premiums) | | | Realized
Gain/
(Loss) | | | Net Change
in Unrealized
Appreciation/
(Depreciation) (1) | | | Transfers
into
Level 3 | | | Transfers
out of
Level 3 | | | Ending
Balance
at
10/31/2014 | | | Net Change
in Unrealized
Appreciation/
(Depreciation)
on Investments
Held at
10/31/2014 (1) | |
Investments in Securities, at Value | | | | | | | | | | | | | | | | | | | | | | | | | |
Corporate Bonds & Notes | | | | | | | | | | | | | | | | | | | | | | | | | | | | | | | | | | | | | | | | |
Banking & Finance | | $ | 11,000 | | | $ | 17,346 | | | $ | 0 | | | $ | (69 | ) | | $ | 0 | | | $ | 575 | | | $ | 0 | | | $ | 0 | | | $ | 28,852 | | | $ | 575 | |
U.S. Government Agencies | | | 3,429 | | | | 0 | | | | (496 | ) | | | 0 | | | | (1 | ) | | | 3 | | | | 0 | | | | (2,935 | ) | | | 0 | | | | 0 | |
Mortgage-Backed Securities | | | 0 | | | | 7,300 | | | | (1,309 | ) | | | 2 | | | | 14 | | | | (19 | ) | | | 0 | | | | 0 | | | | 5,988 | | | | (19 | ) |
Asset-Backed Securities | | | 510 | | | | 0 | | | | (100 | ) | | | 0 | | | | 0 | | | | 62 | | | | 0 | | | | 0 | | | | 472 | | | | 0 | |
| | | | | | | | | | | | | | | | | | | | | | | | | | | | | | | | | | | | | | | | |
Totals | | $ | 14,939 | | | $ | 24,646 | | | $ | (1,905 | ) | | $ | (67 | ) | | $ | 13 | | | $ | 621 | | | $ | 0 | | | $ | (2,935 | ) | | $ | 35,312 | | | $ | 556 | |
| | | | | | | | | | | | | | | | | | | | | | | | | | | | | | | | | | | | | | | | |
The following is a summary of significant unobservable inputs used in the fair valuations of assets and liabilities categorized within Level 3 of the fair value hierarchy:
| | | | | | | | | | | | |
| Category and Subcategory | | Ending
Balance
at 10/31/2014 | | | Valuation
Technique | | Unobservable
Inputs | | Input Value(s)
(% Unless
Noted
Otherwise) | |
Investments in Securities, at Value | | | | | | |
Corporate Bonds & Notes | | | | | | | | | | | | |
Banking & Finance | | $ | 17,700 | | | Other Valuation Techniques (2) | | — | | | — | |
| | | 11,152 | | | Third Party Vendor | | Broker Quote | | | 111.52 | |
Mortgage-Backed Securities | | | 5,988 | | | Benchmark Pricing | | Base Price | | | 84.48-98.72 | |
Asset-Backed Securities | | | 472 | | | Benchmark Pricing | | Base Price | | | 5.99-94.38 | |
| | | | | | | | | | | | |
Total | | $ | 35,312 | | | | | | | | | |
| | | | | | | | | | | | |
| (1) | Any difference between Net Change in Unrealized Appreciation/(Depreciation) and Net Change in Unrealized Appreciation/(Depreciation) on Investments Held at October 31, 2014 may be due to an investment no longer held or categorized as level 3 at period end. |
| (2) | Includes valuation techniques not defined in the Notes to Financial Statements as securities valued using such techniques are not considered significant to the Portfolio. |
| | | | | | |
| 80 | | PIMCO MANAGED ACCOUNTS TRUST | | | | See Accompanying Notes |
Schedule of Investments PIMCO Fixed Income SHares: Series R
October 31, 2014
| | | | | | | | | | | | |
| | | | | PRINCIPAL
AMOUNT
(000S) | | | | | MARKET
VALUE
(000S) | |
| INVESTMENTS IN SECURITIES 159.7% | |
| |
| CORPORATE BONDS & NOTES 8.4% | |
| |
| BANKING & FINANCE 7.2% | |
Ally Financial, Inc. | |
2.434% due 12/01/2014 | | $ | | | 700 | | | $ | | | 700 | |
Banco Popular Espanol S.A. | |
11.500% due 10/10/2018 (c) | | EUR | | | 600 | | | | | | 862 | |
Barclays PLC | |
6.500% due 09/15/2019 (c) | | | | | 200 | | | | | | 245 | |
BNP Paribas S.A. | |
0.697% due 05/07/2017 | | $ | | | 4,400 | | | | | | 4,401 | |
CIT Group, Inc. | |
4.750% due 02/15/2015 | | | | | 300 | | | | | | 303 | |
IM Cedulas Fondo de Titulazion de Activos | |
3.750% due 03/11/2015 | | EUR | | | 100 | | | | | | 127 | |
LBG Capital PLC | |
15.000% due 12/21/2019 | | GBP | | | 770 | | | | | | 1,724 | |
Stone Street Trust | |
5.902% due 12/15/2015 | | $ | | | 6,100 | | | | | | 6,380 | |
Vnesheconombank Via VEB Finance PLC | |
5.450% due 11/22/2017 | | | | | 900 | | | | | | 903 | |
| | | | | | | | | | | | |
| | | | | | | | | | | 15,645 | |
| | | | | | | | | | | | |
| |
| INDUSTRIALS 0.6% | |
California Resources Corp. | |
5.000% due 01/15/2020 | | | | | 1,300 | | | | | | 1,323 | |
| | | | | | | | | | | | |
| |
| UTILITIES 0.6% | |
Dynegy Finance, Inc. | |
6.750% due 11/01/2019 | | | | | 900 | | | | | | 933 | |
7.625% due 11/01/2024 | | | | | 300 | | | | | | 318 | |
| | | | | | | | | | | | |
| | | | | | | | | | | 1,251 | |
| | | | | | | | | | | | |
Total Corporate Bonds & Notes
(Cost $17,956) | | | 18,219 | |
| | | | | | | | | | | | |
| | | | | | | | | | | | |
| U.S. GOVERNMENT AGENCIES 4.8% | |
Fannie Mae | |
0.597% due 02/25/2037 | | | | | 168 | | | | | | 169 | |
1.318% due 10/01/2044 | | | | | 8 | | | | | | 8 | |
Freddie Mac | |
1.987% due 09/01/2036 | | | | | 125 | | | | | | 132 | |
2.089% due 07/01/2036 | | | | | 118 | | | | | | 125 | |
NCUA Guaranteed Notes | |
0.523% due 11/06/2017 | | | | | 3,157 | | | | | | 3,166 | |
2.650% due 10/29/2020 | | | | | 6,513 | | | | | | 6,695 | |
| | | | | | | | | | | | |
Total U.S. Government Agencies
(Cost $10,115) | | | 10,295 | |
| | | | | | | | | | | | |
| | | | | | | | | | | | |
| | | | | PRINCIPAL
AMOUNT
(000S) | | | | | MARKET
VALUE
(000S) | |
| U.S. TREASURY OBLIGATIONS 102.5% | |
U.S. Treasury Inflation Protected Securities (b) | |
0.125% due 04/15/2017 (h) | | $ | | | 3,979 | | | $ | | | 4,042 | |
0.125% due 04/15/2018 (f)(h) | | | 18,834 | | | | | | 19,065 | |
0.125% due 04/15/2019 (f) | | | | | 16,050 | | | | | | 16,176 | |
0.125% due 07/15/2022 | | | | | 7,137 | | | | | | 7,040 | |
0.125% due 01/15/2023 | | | | | 5,462 | | | | | | 5,347 | |
0.375% due 07/15/2023 (h)(j) | | | 1,227 | | | | | | 1,227 | |
0.500% due 04/15/2015 (f)(h)(j) | | | 11,526 | | | | | | 11,506 | |
0.625% due 07/15/2021 | | | | | 3,166 | | | | | | 3,254 | |
1.125% due 01/15/2021 | | | | | 1,577 | | | | | | 1,666 | |
1.250% due 07/15/2020 (f)(h)(j) | | | 39,162 | | | | | | 41,836 | |
1.375% due 01/15/2020 (h) | | | 330 | | | | | | 353 | |
1.375% due 02/15/2044 | | | | | 8,165 | | | | | | 9,004 | |
1.750% due 01/15/2028 (f) | | | 44,411 | | | | | | 50,441 | |
1.875% due 07/15/2015 (h)(j) | | | 3,179 | | | | | | 3,239 | |
1.875% due 07/15/2019 (h) | | | 8,466 | | | | | | 9,278 | |
2.000% due 01/15/2026 | | | | | 599 | | | | | | 693 | |
2.125% due 02/15/2041 | | | | | 652 | | | | | | 833 | |
2.375% due 01/15/2025 | | | | | 2,145 | | | | | | 2,546 | |
2.375% due 01/15/2027 | | | | | 1,062 | | | | | | 1,278 | |
2.500% due 01/15/2029 | | | | | 4,985 | | | | | | 6,209 | |
2.625% due 07/15/2017 (f)(h)(j) | | | 22,498 | | | | | | 24,544 | |
3.875% due 04/15/2029 (j) | | | | | 463 | | | | | | 666 | |
U.S. Treasury Notes | |
0.250% due 01/15/2015 (j) | | | | | 538 | | | | | | 538 | |
0.250% due 01/31/2015 | | | | | 242 | | | | | | 242 | |
| | | | | | | | | | | | |
Total U.S. Treasury Obligations
(Cost $225,469) | | | 221,023 | |
| | | | | | | | | | | | |
| | | | | | | | | | | | |
| MORTGAGE-BACKED SECURITIES 4.7% | |
Bear Stearns Adjustable Rate Mortgage Trust | |
2.171% due 08/25/2035 | | | | | 20 | | | | | | 20 | |
2.528% due 03/25/2035 | | | | | 15 | | | | | | 15 | |
2.580% due 03/25/2035 | | | | | 61 | | | | | | 61 | |
Citigroup Mortgage Loan Trust, Inc. | |
2.200% due 09/25/2035 | | | | | 24 | | | | | | 24 | |
2.280% due 09/25/2035 | | | | | 40 | | | | | | 40 | |
3.667% due 09/25/2037 ^ | | | | | 621 | | | | | | 545 | |
Commercial Mortgage Trust | |
3.156% due 07/10/2046 | | | | | 4,769 | | | | | | 4,837 | |
Countrywide Alternative Loan Trust | |
0.352% due 12/20/2046 | | | | | 2,058 | | | | | | 1,580 | |
1.114% due 02/25/2036 | | | | | 462 | | | | | | 419 | |
Countrywide Home Loan Mortgage Pass-Through Trust | |
2.341% due 04/20/2035 | | | | | 567 | | | | | | 573 | |
Countrywide Home Loan Reperforming REMIC Trust | |
0.492% due 06/25/2035 | | | | | 17 | | | | | | 15 | |
Granite Mortgages PLC | |
0.886% due 03/20/2044 | | GBP | | | 476 | | | | | | 762 | |
| | | | | | |
| See Accompanying Notes | | ANNUAL REPORT | | OCTOBER 31, 2014 | | 81 |
Schedule of Investments PIMCO Fixed Income SHares: Series R (Cont.)
| | | | | | | | | | | | |
| | | | | PRINCIPAL
AMOUNT
(000S) | | | | | MARKET
VALUE
(000S) | |
GSR Mortgage Loan Trust | |
2.660% due 09/25/2035 | | $ | | | 86 | | | $ | | | 87 | |
Merrill Lynch Mortgage Investors Trust | |
1.572% due 10/25/2035 | | | | | 548 | | | | | | 539 | |
Residential Accredit Loans, Inc. Trust | |
0.332% due 06/25/2046 | | | | | 331 | | | | | | 151 | |
Swan Trust | |
3.930% due 04/25/2041 | | AUD | | | 546 | | | | | | 485 | |
| | | | | | | | | | | | |
Total Mortgage-Backed Securities
(Cost $9,649) | | | 10,153 | |
| | | | | | | | | | | | |
| | | | | | | | | | | | |
| ASSET-BACKED SECURITIES 3.0% | |
Bear Stearns Asset-Backed Securities Trust | |
1.152% due 10/25/2037 | | $ | | | 279 | | | | | | 262 | |
2.252% due 03/25/2035 | | | | | 1,300 | | | | | | 1,206 | |
Citigroup Mortgage Loan Trust, Inc. | |
0.232% due 01/25/2037 | | | | | 339 | | | | | | 215 | |
0.442% due 10/25/2036 | | | | | 2,600 | | | | | | 2,271 | |
JPMorgan Mortgage Acquisition Corp. | |
0.887% due 07/25/2035 | | | | | 154 | | | | | | 153 | |
Magi Funding PLC | |
0.429% due 04/11/2021 | | EUR | | | 141 | | | | | | 176 | |
Massachusetts Educational Financing Authority | |
1.184% due 04/25/2038 | | $ | | | 144 | | | | | | 146 | |
Park Place Securities, Inc. Asset-Backed Pass-Through Certificates | |
0.572% due 06/25/2035 | | | | | 8 | | | | | | 8 | |
0.872% due 03/25/2035 | | | | | 300 | | | | | | 273 | |
Residential Asset Securities Corp. Trust | |
0.572% due 12/25/2035 | | | | | 400 | | | | | | 329 | |
Saxon Asset Securities Trust | |
4.034% due 06/25/2033 | | | | | 350 | | | | | | 356 | |
Soundview Home Loan Trust | |
0.672% due 12/25/2035 | | | | | 852 | | | | | | 839 | |
Structured Asset Securities Corp. Mortgage Loan Trust | |
1.152% due 08/25/2037 | | | | | 108 | | | | | | 102 | |
Wood Street CLO BV | |
0.433% due 03/29/2021 | | EUR | | | 89 | | | | | | 110 | |
| | | | | | | | | | | | |
Total Asset-Backed Securities
(Cost $6,459) | | | 6,446 | |
| | | | | | | | | | | | |
| | | | | | | | | | | | |
| SOVEREIGN ISSUES 25.1% | |
Denmark Government Bond | |
0.100% due 11/15/2023 (b) | | DKK | | | 40,338 | | | | | | 7,038 | |
France Government Bond | |
0.250% due 07/25/2018 (b) | | EUR | | | 2,178 | | | | | | 2,829 | |
0.700% due 07/25/2030 (b) | | | | | 200 | | | | | | 266 | |
| | | | | | | | | | | | |
| | | | | PRINCIPAL
AMOUNT
(000S) | | | | | MARKET
VALUE
(000S) | |
Italy Buoni Poliennali Del Tesoro | |
1.700% due 09/15/2018 (b) | | EUR | | | 3,025 | | | $ | | | 3,984 | |
2.100% due 09/15/2016 (b) | | | | | 107 | | | | | | 139 | |
2.100% due 09/15/2017 (b) | | | | | 811 | | | | | | 1,071 | |
2.100% due 09/15/2021 (b) | | | | | 1,513 | | | | | | 2,054 | |
2.350% due 09/15/2024 (b) | | | | | 4,610 | | | | | | 6,341 | |
2.450% due 03/26/2016 (b) | | | | | 200 | | | | | | 257 | |
2.550% due 10/22/2016 (b) | | | | | 300 | | | | | | 389 | |
3.100% due 09/15/2026 (b) | | | | | 212 | | | | | | 310 | |
5.000% due 09/01/2040 | | | | | 500 | | | | | | 767 | |
5.500% due 11/01/2022 | | | | | 200 | | | | | | 314 | |
Mexico Government International Bond | |
4.000% due 11/15/2040 (b) | | MXN | | | 12,488 | | | | | | 1,019 | |
4.000% due 11/08/2046 (b) | | | | | 9,366 | | | | | | 770 | |
4.500% due 11/22/2035 (b) | | | | | 23,468 | | | | | | 2,054 | |
Mexico Government International Inflation Linked Bond | |
3.010% due 06/29/2017 | | | | | 1,200 | | | | | | 89 | |
New South Wales Treasury Corp. | |
2.500% due 11/20/2035 | | AUD | | | 800 | | | | | | 947 | |
2.750% due 11/20/2025 | | | | | 800 | | | | | | 968 | |
New Zealand Government Bond | |
2.000% due 09/20/2025 | | NZD | | | 500 | | | | | | 389 | |
3.000% due 09/20/2030 | | | | | 1,200 | | | | | | 1,007 | |
Republic of Germany | |
0.750% due 04/15/2018 (b) | | EUR | | | 5,723 | | | | | | 7,490 | |
Spain Government International Bond | |
5.400% due 01/31/2023 | | | | | 8,500 | | | | | | 13,629 | |
| | | | | | | | | | | | |
Total Sovereign Issues (Cost $56,184) | | | 54,121 | |
| | | | | | | | | | | | |
| | | | | | | | | | | | |
| SHORT-TERM INSTRUMENTS 11.2% | |
| | | | | | | | | | | | |
| COMMERCIAL PAPER 0.6% | |
Greensill Capital SCF S.A. | |
5.830% due 03/04/2015 (d) | | $ | | | 1,300 | | | | | | 1,276 | |
| | | | | | | | | | | | |
| | | | | | | | | | | | |
| REPURCHASE AGREEMENTS (e) 0.1% | |
| | | | | | | | | | | 153 | |
| | | | | | | | | | | | |
| | | | | | | | | | | | |
| GREECE TREASURY BILLS 10.4% | |
1.726% due 11/14/2014 - 03/06/2015 (a) | | EUR | | | 18,000 | | | | | | 22,510 | |
| | | | | | | | | | | | |
| | | | | | | | | | | | |
| | | | | | |
| 82 | | PIMCO MANAGED ACCOUNTS TRUST | | | | See Accompanying Notes |
October 31, 2014
| | | | | | | | | | | | |
| | | | | PRINCIPAL
AMOUNT
(000S) | | | | | MARKET
VALUE
(000S) | |
| U.S. TREASURY BILLS 0.1% | |
0.035% due 03/05/2015 - 03/26/2015 (a)(j) | | $ | | | 260 | | | $ | | | 260 | |
| | | | | | | | | | | | |
Total Short-Term Instruments
(Cost $24,998) | | | 24,199 | |
| | | | | | | | | | | | |
| |
Total Investments in Securities
(Cost $350,830) | | | 344,456 | |
| | | | | | | | | | | | |
| |
Total Investments 159.7%
(Cost $350,830) | | | $ | | | 344,456 | |
| |
Financial Derivative
Instruments (g)(i) (0.8%) (Cost or Premiums, net $(1,039)) | | | (1,661 | ) |
| |
| Other Assets and Liabilities, net (58.9%) | | | (127,124 | ) |
| | | | | | | | | | | | |
| Net Assets 100.0% | | | $ | | | 215,671 | |
| | | | | | | | | | | | |
NOTES TO SCHEDULE OF INVESTMENTS (AMOUNTS IN THOUSANDS*, EXCEPT NUMBER OF CONTRACTS):
| * | A zero balance may reflect actual amounts rounding to less than one thousand. |
| (a) | Coupon represents a weighted average yield to maturity. |
| (b) | Principal amount of security is adjusted for inflation. |
| (c) | Perpetual maturity; date shown, if applicable, represents next contractual call date. |
(d) RESTRICTED SECURITIES:
| | | | | | | | | | | | | | | | | | | | | | | | |
| Issuer Description | | Coupon | | | Maturity
Date | | | Acquisition
Date | | | Cost | | | Market
Value | | | Market Value
as Percentage
of Net Assets | |
Greensill Capital SCF S.A. | | | 5.830% | | | | 03/04/2015 | | | | 09/03/2014 | | | $ | 1,276 | | | $ | 1,276 | | | | 0.59% | |
| | | | | | | | | | | | | | | | | | | | | | | | |
BORROWINGS AND OTHER FINANCING TRANSACTIONS
(e) REPURCHASE AGREEMENTS:
| | | | | | | | | | | | | | | | | | | | | | | | | | | | |
| Counterparty | | Lending
Rate | | Settlement
Date | | | Maturity
Date | | | Principal
Amount | | | Collateralized By | | Collateral
Received,
at Value | | | Repurchase
Agreements,
at Value | | | Repurchase
Agreement
Proceeds
to be
Received (1) | |
SSB | | 0.000% | | | 10/31/2014 | | | | 11/03/2014 | | | $ | 153 | | | Freddie Mac
2.000% due 11/02/2022 | | $ | (156 | ) | | $ | 153 | | | $ | 153 | |
| | | | | | | | | | | | | | | | | | | | | | | | | | | | |
Total Repurchase Agreements | | | | | $ | (156 | ) | | $ | 153 | | | $ | 153 | |
| | | | | | | | | | | | | | | | | | | | | | | | | | | | |
| (1) | Includes accrued interest. |
| | | | | | |
| See Accompanying Notes | | ANNUAL REPORT | | OCTOBER 31, 2014 | | 83 |
Schedule of Investments PIMCO Fixed Income SHares: Series R (Cont.)
REVERSE REPURCHASE AGREEMENTS:
| | | | | | | | | | | | | | | | | | | | | | | | |
| Counterparty | | Borrowing
Rate | | | Borrowing
Date | | | Maturity
Date | | | Amount
Borrowed (2) | | | Payable for
Reverse
Repurchase
Agreements | |
RYL | | | 0.120 | % | | | 10/01/2014 | | | | 11/03/2014 | | | | $ | | | | (11,348 | ) | | $ | (11,349 | ) |
| | | | | | | | | | | | | | | | | | | | | | | | |
Total Reverse Repurchase Agreements | | | | | | | | | | | | | | | $ | (11,349 | ) |
| | | | | | | | | | | | | | | | | | | | | | | | |
SALE-BUYBACK TRANSACTIONS:
| | | | | | | | | | | | | | | | | | | | | | | | |
| Counterparty | | Borrowing
Rate | | | Borrowing
Date | | | Maturity
Date | | | Amount
Borrowed (2) | | | Payable for
Sale-Buyback
Transactions (3) | |
BCY | | | 0.150 | % | | | 10/17/2014 | | | | 11/17/2014 | | | | $ | | | | (6,701 | ) | | $ | (6,707 | ) |
| | | 0.170 | % | | | 10/27/2014 | | | | 12/01/2014 | | | | | | | | (17,236 | ) | | | (17,248 | ) |
| | | 0.180 | % | | | 10/29/2014 | | | | 12/02/2014 | | | | | | | | (877 | ) | | | (878 | ) |
| | | 0.180 | % | | | 11/03/2014 | | | | 11/10/2014 | | | | | | | | (12,070 | ) | | | (12,076 | ) |
BPG | | | 0.140 | % | | | 10/09/2014 | | | | 11/25/2014 | | | | | | | | (26,025 | ) | | | (26,046 | ) |
| | | 0.150 | % | | | 10/14/2014 | | | | 11/14/2014 | | | | | | | | (14,326 | ) | | | (14,315 | ) |
MSC | | | 0.150 | % | | | 10/10/2014 | | | | 11/13/2014 | | | | | | | | (7,976 | ) | | | (7,980 | ) |
| | | 0.170 | % | | | 10/30/2014 | | | | 11/13/2014 | | | | | | | | (4,278 | ) | | | (4,279 | ) |
| | | 0.190 | % | | | 10/27/2014 | | | | 11/10/2014 | | | | | | | | (38,977 | ) | | | (38,988 | ) |
| | | 0.190 | % | | | 10/31/2014 | | | | 11/14/2014 | | | | | | | | (2,863 | ) | | | (2,865 | ) |
| | | | | | | | | | | | | | | | | | | | | | | | |
Total Sale-Buyback Transactions | | | | | | | | | | | | | | | $ | (131,382 | ) |
| | | | | | | | | | | | | | | | | | | | | | | | |
| (2) | The average amount of borrowings while outstanding during the period ended October 31, 2014 was $140,924 at a weighted average interest rate of 0.123%. |
| (3) | Payable for sale-buyback transactions includes $47 of deferred price drop on sale-buyback transactions. |
BORROWINGS AND OTHER FINANCING TRANSACTIONS SUMMARY
The following is a summary by counterparty of the market value of Borrowings and Other Financing Transactions and collateral (received)/pledged as of October 31, 2014:
| (f) | Securities with an aggregate market value of $142,146 have been pledged as collateral under the terms of the following master agreements as of October 31, 2014. |
| | | | | | | | | | | | | | | | | | | | | | | | | | | | |
| Counterparty | | Repurchase
Agreement
Proceeds
to be
Received | | | Payable for
Reverse
Repurchase
Agreements | | | Payable for
Sale-Buyback
Transactions | | | Payable for
Short Sales | | | Total
Borrowings and
Other Financing
Transactions | | | Collateral
(Received)/
Pledged | | | Net
Exposure (4) | |
Global/Master Repurchase Agreement | | | | | | | | | | | | | | | | | | | | | | | | | | | | |
RYL | | $ | 0 | | | $ | (11,349 | ) | | $ | 0 | | | $ | 0 | | | $ | (11,349 | ) | | $ | 11,143 | | | $ | (206 | ) |
SSB | | | 153 | | | | 0 | | | | 0 | | | | 0 | | | | 153 | | | | (156 | ) | | | (3 | ) |
| | | | | | | |
Master Securities Forward Transaction Agreement | | | | | | | | | | | | | | | | | | | | | | | | | | | | |
BCY | | | 0 | | | | 0 | | | | (36,909 | ) | | | 0 | | | | (36,909 | ) | | | 36,695 | | | | (214 | ) |
BPG | | | 0 | | | | 0 | | | | (40,361 | ) | | | 0 | | | | (40,361 | ) | | | 40,061 | | | | (300 | ) |
MSC | | | 0 | | | | 0 | | | | (54,112 | ) | | | 0 | | | | (54,112 | ) | | | 53,724 | | | | (388 | ) |
| | | | | | | | | | | | | | | | | | | | | | | | | | | | |
Total Borrowings and Other Financing Transactions | | $ | 153 | | | $ | (11,349) | | | $ | (131,382 | ) | | $ | 0 | | | | | | | | | | | | | |
| | | | | | | | | | | | | | | | | | | | | | | | | | | | |
| | | | | | |
| 84 | | PIMCO MANAGED ACCOUNTS TRUST | | | | See Accompanying Notes |
October 31, 2014
| (4) | Net Exposure represents the net receivable/(payable) that would be due from/to the counterparty in the event of default. Exposure from borrowings and other financing transactions can only be netted across transactions governed under the same master agreement with the same legal entity. See Note 7, Principal Risks, in the Notes to Financial Statements for more information regarding master netting arrangements. |
(g) FINANCIAL DERIVATIVE INSTRUMENTS: EXCHANGE-TRADED OR CENTRALLY CLEARED
PURCHASED OPTIONS:
OPTIONS ON EXCHANGE-TRADED FUTURES CONTRACTS
| | | | | | | | | | | | | | | | | | | | |
| Description | | Strike
Price | | | Expiration
Date | | | # of
Contracts | | | Cost | | | Market
Value | |
Put - CBOT U.S. Treasury 5-Year Note December Futures | | $ | 112.500 | | | | 11/21/2014 | | | | 601 | | | $ | 5 | | | $ | 5 | |
Call - CBOT U.S. Treasury 10-Year Note December Futures | | | 142.000 | | | | 11/21/2014 | | | | 88 | | | | 1 | | | | 1 | |
| | | | | | | | | | | | | | | | | | | | |
| | | | | | | | | | | | | | $ | 6 | | | $ | 6 | |
| | | | | | | | | | | | | | | | | | | | |
Total Purchased Options | | | | | | | | | | | | | | $ | 6 | | | $ | 6 | |
| | | | | | | | | | | | | | | | | | | | |
FUTURES CONTRACTS:
| | | | | | | | | | | | | | | | | | | | | | |
| Description | | Type | | Expiration
Month | | | # of
Contracts | | | Unrealized
Appreciation/
(Depreciation) | | | Variation Margin | |
| | | | | | Asset | | | Liability | |
Call Options Strike @ EUR 156.000 on Euro-Bund 10-Year Bond December Futures | | Long | | | 11/2014 | | | | 145 | | | $ | 0 | | | $ | 0 | | | $ | 0 | |
Call Options Strike @ EUR 160.000 on Euro-Bund 10-Year Bond December Futures | | Long | | | 11/2014 | | | | 93 | | | | 0 | | | | 0 | | | | 0 | |
Euro-Bund 10-Year Bond December Futures | | Short | | | 12/2014 | | | | 102 | | | | (179 | ) | | | 0 | | | | (74 | ) |
Put Options Strike @ EUR 142.000 on Euro-Bund 10-Year Bond December Futures | | Long | | | 11/2014 | | | | 22 | | | | 0 | | | | 0 | | | | 0 | |
U.S. Treasury 5-Year Note December Futures | | Long | | | 12/2014 | | | | 601 | | | | 567 | | | | 0 | | | | (99 | ) |
U.S. Treasury 10-Year Note December Futures | | Short | | | 12/2014 | | | | 88 | | | | 237 | | | | 23 | | | | 0 | |
| | | | | | | | | | | | | | | | | | | | | | |
Total Futures Contracts | | | | | | | $ | 625 | | | $ | 23 | | | $ | (173 | ) |
| | | | | | | | | | | | | | | | | | | | | | |
SWAP AGREEMENTS:
CREDIT DEFAULT SWAPS ON CREDIT INDICES - SELL PROTECTION (1)
| | | | | | | | | | | | | | | | | | | | | | | | | | | | | | | | |
| Index/Tranches | | Fixed Deal
Receive Rate | | | Maturity
Date | | | Notional
Amount (2) | | | Market
Value (3) | | | Unrealized
Appreciation | | | Variation Margin | |
| | | | | | | Asset | | | Liability | |
iTraxx Europe 21 10-Year Index | | | 1.000% | | | | 06/20/2024 | | | | EUR | | | | 1,300 | | | $ | (1 | ) | | $ | 29 | | | $ | 2 | | �� | $ | 0 | |
iTraxx Europe 22 5-Year Index | | | 1.000% | | | | 12/20/2019 | | | | | | | | 16,450 | | | | 383 | | | | 28 | | | | 27 | | | | 0 | |
| | | | | | | | | | | | | | | | | | | | | | | | | | | | | | | | |
| | | | | | | | | | | | | | | | | | $ | 382 | | | $ | 57 | | | $ | 29 | | | $ | 0 | |
| | | | | | | | | | | | | | | | | | | | | | | | | | | | | | | | |
| (1) | If the Portfolio is a seller of protection and a credit event occurs, as defined under the terms of that particular swap agreement, the Portfolio will either (i) pay to the buyer of protection an amount equal to the notional amount of the swap and take delivery of the referenced obligation or underlying securities comprising the referenced index or (ii) pay a net settlement amount in the form of cash or securities equal to the notional amount of the swap less the recovery value of the referenced obligation or underlying securities comprising the referenced index. |
| (2) | The maximum potential amount the Portfolio could be required to pay as a seller of credit protection or receive as a buyer of credit protection if a credit event occurs as defined under the terms of that particular swap agreement. |
| (3) | The prices and resulting values for credit default swap agreements on credit indices serve as an indicator of the current status of the payment/performance risk and represent the likelihood of an expected liability (or profit) for the credit derivative should the notional amount of the swap agreement be closed/sold as of the period end. Increasing market values, in absolute terms when compared to the notional amount of the swap, represent a deterioration of the referenced indices’ credit soundness and a greater likelihood or risk of default or other credit event occurring as defined under the terms of the agreement. |
| | | | | | |
| See Accompanying Notes | | ANNUAL REPORT | | OCTOBER 31, 2014 | | 85 |
Schedule of Investments PIMCO Fixed Income SHares: Series R (Cont.)
INTEREST RATE SWAPS
| | | | | | | | | | | | | | | | | | | | | | | | | | | | | | | | | | |
Pay/Receive
Floating Rate | | Floating Rate Index | | Fixed
Rate | | | Maturity
Date | | | Notional
Amount | | | Market
Value | | | Unrealized
Appreciation/
(Depreciation) | | | Variation Margin | |
| | | | | | | | Asset | | | Liability | |
Receive | | 3-Month USD-LIBOR | | | 3.000% | | | | 12/17/2024 | | | | $ | | | | 5,500 | | | $ | (240 | ) | | $ | (73 | ) | | $ | 16 | | | $ | 0 | |
Receive | | 3-Month USD-LIBOR | | | 2.750% | | | | 06/19/2043 | | | | | | | | 4,700 | | | | 230 | | | | (52 | ) | | | 24 | | | | 0 | |
Receive | | 3-Month USD-LIBOR | | | 3.500% | | | | 12/18/2043 | | | | | | | | 16,600 | | | | (1,748 | ) | | | (2,415 | ) | | | 96 | | | | 0 | |
Receive | | 6-Month EUR-EURIBOR | | | 0.550% | | | | 01/17/2016 | | | | EUR | | | | 24,600 | | | | (168 | ) | | | (138 | ) | | | 0 | | | | (3 | ) |
Receive | | 6-Month EUR-EURIBOR | | | 2.000% | | | | 01/29/2024 | | | | | | | | 3,400 | | | | (444 | ) | | | (416 | ) | | | 0 | | | | (17 | ) |
Receive | | 6-Month EUR-EURIBOR | | | 2.000% | | | | 03/18/2045 | | | | | | | | 7,200 | | | | (324 | ) | | | (418 | ) | | | 0 | | | | (43 | ) |
Receive | | 6-Month JPY-LIBOR | | | 1.000% | | | | 09/18/2023 | | | | JPY | | | | 1,740,000 | | | | (691 | ) | | | (562 | ) | | | 0 | | | | (7 | ) |
Pay | | 28-Day MXN-TIIE | | | 4.310% | | | | 09/06/2016 | | | | MXN | | | | 70,000 | | | | 3 | | | | 15 | | | | 0 | | | | (5 | ) |
| | | | | | | | | | | | | | | | | | | | | | | | | | | | | | | | | | |
| | | | | | | | | | | | | | | | | | | | $ | (3,382 | ) | | $ | (4,059 | ) | | $ | 136 | | | $ | (75 | ) |
| | | | | | | | | | | | | | | | | | | | | | | | | | | | | | | | | | |
Total Swap Agreements | | | $ | (3,000 | ) | | $ | (4,002 | ) | | $ | 165 | | | $ | (75 | ) |
| | | | | | | | | | | | | | | | | | | | | | | | | | | | | | | | | | |
FINANCIAL DERIVATIVE INSTRUMENTS: EXCHANGE-TRADED OR CENTRALLY CLEARED SUMMARY
The following is a summary of the market value and variation margin of Exchange-Traded or Centrally Cleared Financial Derivative Instruments as of October 31, 2014:
| (h) | Securities with an aggregate market value of $2,799 and cash of $1,507 have been pledged as collateral for exchange-traded and centrally cleared financial derivative instruments as of October 31, 2014. See Note 7, Principal Risks, in the Notes to Financial Statements for more information regarding master netting arrangements. |
| | | | | | | | | | | | | | | | | | | | | | | | | | | | | | | | |
| | | Financial Derivative Assets | | | | | Financial Derivative Liabilities | |
| | | Market Value | | Variation Margin
Asset | | | Total | | | | | Market Value | | | Variation Margin
Liability | | | Total | |
| | | Purchased
Options | | Futures | | | Swap
Agreements | | | | | | Written
Options | | | Futures | | | Swap
Agreements | | |
Total Exchange-Traded or Centrally Cleared | | $ 6 | | $ | 23 | | | $ | 165 | | | $ | 194 | | | | | $ | 0 | | | $ | (173 | ) | | $ | (75 | ) | | $ | (248 | ) |
| | | | | | | | | | | | | | | | | | | | | | | | | | | | | | | | |
(i) FINANCIAL DERIVATIVE INSTRUMENTS: OVER THE COUNTER
FORWARD FOREIGN CURRENCY CONTRACTS:
| | | | | | | | | | | | | | | | | | | | | | | | | | | | |
| Counterparty | | Settlement
Month | | | Currency to
be Delivered | | | Currency to
be Received | | | Unrealized Appreciation/
(Depreciation) | |
| | | | | Asset | | | Liability | |
BOA | | | 11/2014 | | | | AUD | | | | 4,631 | | | $ | | | | | 4,102 | | | $ | 27 | | | $ | 0 | |
| | | 11/2014 | | | | EUR | | | | 11,189 | | | | | | | | 14,258 | | | | 236 | | | | 0 | |
| | | 12/2014 | | | | GBP | | | | 2,004 | | | | | | | | 3,236 | | | | 32 | | | | 0 | |
| | | | | | | | | | | | | | | | | | | | | | | | | | | | |
BPS | | | 11/2014 | | | | BRL | | | | 251 | | | | | | | | 102 | | | | 0 | | | | 0 | |
| | | 11/2014 | | | | EUR | | | | 718 | | | | | | | | 911 | | | | 12 | | | | 0 | |
| | | 11/2014 | | | $ | | | | | 100 | | | | BRL | | | | 251 | | | | 1 | | | | 0 | |
| | | 12/2014 | | | | EUR | | | | 1,175 | | | $ | | | | | 1,496 | | | | 24 | | | | 0 | |
| | | 12/2014 | | | | MXN | | | | 68,565 | | | | | | | | 5,134 | | | | 56 | | | | 0 | |
| | | 02/2015 | | | $ | | | | | 5,439 | | | | MXN | | | | 73,158 | | | | 4 | | | | (39 | ) |
| | | | | | | | | | | | | | | | | | | | | | | | | | | | |
| | | | | | |
| 86 | | PIMCO MANAGED ACCOUNTS TRUST | | | | See Accompanying Notes |
October 31, 2014
| | | | | | | | | | | | | | | | | | | | | | | | | | | | |
| Counterparty | | Settlement
Month | | | Currency to
be Delivered | | | Currency to
be Received | | | Unrealized Appreciation/
(Depreciation) | |
| | | | | Asset | | | Liability | |
BRC | | | 11/2014 | | | | CAD | | | | 681 | | | $ | | | | | 608 | | | $ | 4 | | | $ | 0 | |
| | | 11/2014 | | | $ | | | | | 357 | | | | AUD | | | | 407 | | | | 1 | | | | 0 | |
| | | 11/2014 | | | | | | | | 10,921 | | | | JPY | | | | 1,176,454 | | | | 0 | | | | (448 | ) |
| | | 12/2014 | | | | JPY | | | | 1,176,454 | | | $ | | | | | 10,924 | | | | 448 | | | | 0 | |
| | | 12/2014 | | | | MXN | | | | 25,177 | | | | | | | | 1,906 | | | | 42 | | | | 0 | |
| | | | | | | | | | | | | | | | | | | | | | | | | | | | |
CBK | | | 11/2014 | | | | DKK | | | | 39,735 | | | | | | | | 7,153 | | | | 463 | | | | 0 | |
| | | 11/2014 | | | $ | | | | | 208 | | | | EUR | | | | 164 | | | | 0 | | | | (2 | ) |
| | | 12/2014 | | | | MXN | | | | 14,950 | | | $ | | | | | 1,132 | | | | 25 | | | | 0 | |
| | | 12/2014 | | | $ | | | | | 831 | | | | GBP | | | | 507 | | | | 0 | | | | (20 | ) |
| | | 01/2015 | | | | | | | | 5,648 | | | | INR | | | | 352,335 | | | | 0 | | | | (2 | ) |
| | | | | | | | | | | | | | | | | | | | | | | | | | | | |
DUB | | | 11/2014 | | | | BRL | | | | 275 | | | $ | | | | | 110 | | | | 0 | | | | (1 | ) |
| | | 11/2014 | | | | EUR | | | | 995 | | | | | | | | 1,260 | | | | 13 | | | | 0 | |
| | | 11/2014 | | | $ | | | | | 113 | | | | BRL | | | | 275 | | | | 0 | | | | (1 | ) |
| | | 12/2014 | | | | MXN | | | | 8,833 | | | $ | | | | | 670 | | | | 16 | | | | 0 | |
| | | | | | | | | | | | | | | | | | | | | | | | | | | | |
FBF | | | 11/2014 | | | $ | | | | | 9,380 | | | | EUR | | | | 7,358 | | | | 0 | | | | (159 | ) |
| | | 12/2014 | | | | EUR | | | | 6,380 | | | $ | | | | | 8,136 | | | | 139 | | | | 0 | |
| | | 01/2015 | | | | HUF | | | | 816,918 | | | | | | | | 3,358 | | | | 42 | | | | 0 | |
| | | | | | | | | | | | | | | | | | | | | | | | | | | | |
GLM | | | 11/2014 | | | $ | | | | | 3,079 | | | | AUD | | | | 3,488 | | | | 0 | | | | (10 | ) |
| | | 12/2014 | | | | AUD | | | | 3,488 | | | $ | | | | | 3,073 | | | | 9 | | | | 0 | |
| | | 12/2014 | | | | GBP | | | | 96 | | | | | | | | 154 | | | | 0 | | | | 0 | |
| | | | | | | | | | | | | | | | | | | | | | | | | | | | |
HUS | | | 11/2014 | | | | NZD | | | | 1,656 | | | | | | | | 1,286 | | | | 0 | | | | (5 | ) |
| | | 11/2014 | | | $ | | | | | 639 | | | | AUD | | | | 736 | | | | 9 | | | | 0 | |
| | | | | | | | | | | | | | | | | | | | | | | | | | | | |
JPM | | | 11/2014 | | | | BRL | | | | 275 | | | $ | | | | | 113 | | | | 2 | | | | 0 | |
| | | 11/2014 | | | | JPY | | | | 1,176,454 | | | | | | | | 10,811 | | | | 337 | | | | 0 | |
| | | 11/2014 | | | $ | | | | | 112 | | | | BRL | | | | 275 | | | | 0 | | | | (1 | ) |
| | | 12/2014 | | | | BRL | | | | 275 | | | $ | | | | | 111 | | | | 1 | | | | 0 | |
| | | | | | | | | | | | | | | | | | | | | | | | | | | | |
MSB | | | 11/2014 | | | | | | | | 151 | | | | | | | | 60 | | | | 0 | | | | (1 | ) |
| | | 11/2014 | | | $ | | | | | 62 | | | | BRL | | | | 151 | | | | 0 | | | | (1 | ) |
| | | 12/2014 | | | | MXN | | | | 10,066 | | | $ | | | | | 760 | | | | 15 | | | | 0 | |
| | | | | | | | | | | | | | | | | | | | | | | | | | | | |
UAG | | | 11/2014 | | | | BRL | | | | 4,616 | | | | | | | | 1,869 | | | | 6 | | | | 0 | |
| | | 11/2014 | | | | EUR | | | | 45,992 | | | | | | | | 58,836 | | | | 1,201 | | | | 0 | |
| | | 11/2014 | | | $ | | | | | 1,947 | | | | BRL | | | | 4,616 | | | | 0 | | | | (84 | ) |
| | | 11/2014 | | | | | | | | 65,284 | | | | EUR | | | | 51,372 | | | | 0 | | | | (907 | ) |
| | | 11/2014 | | | | | | | | 1,314 | | | | NZD | | | | 1,656 | | | | 0 | | | | (23 | ) |
| | | 12/2014 | | | | EUR | | | | 51,372 | | | $ | | | | | 65,294 | | | | 905 | | | | 0 | |
| | | 12/2014 | | | | NZD | | | | 1,656 | | | | | | | | 1,311 | | | | 23 | | | | 0 | |
| | | 12/2014 | | | $ | | | | | 1,854 | | | | BRL | | | | 4,616 | | | | 0 | | | | (7 | ) |
| | | 01/2015 | | | | | | | | 635 | | | | MYR | | | | 2,077 | | | | 0 | | | | (7 | ) |
| | | 01/2015 | | | | | | | | 2,165 | | | | PLN | | | | 7,269 | | | | 0 | | | | (15 | ) |
| | | 02/2015 | | | | MYR | | | | 2,034 | | | $ | | | | | 618 | | | | 4 | | | | 0 | |
| | | | | | | | | | | | | | | | | | | | | | | | | | | | |
Total Forward Foreign Currency Contracts | | | | | | | $ | 4,097 | | | $ | (1,733 | ) |
| | | | | | | | | | | | | | | | | | | | | | | | | | | | |
PURCHASED OPTIONS:
FOREIGN CURRENCY OPTIONS
| | | | | | | | | | | | | | | | | | | | | | | | | | | | | | |
| Counterparty | | Description | | Strike
Price | | | Expiration
Date | | | Notional
Amount | | | Cost | | | Market
Value | |
DUB | | Call - OTC EUR versus USD | | | $ | | | | 1.450 | | | | 12/10/2014 | | | | EUR | | | | 7,000 | | | $ | 1 | | | $ | 0 | |
| | Put - OTC USD versus JPY | | | JPY | | | | 90.000 | | | | 11/24/2014 | | | | $ | | | | 7,000 | | | | 1 | | | | 0 | |
| | | | | | | | | | | | | | | | | | | | | | | | | | | | | | |
MSB | | Put - OTC USD versus JPY | | | | | | | 90.000 | | | | 12/29/2014 | | | | | | | | 5,100 | | | | 0 | | | | 0 | |
| | | | | | | | | | | | | | | | | | | | | | | | | | | | | | |
| | | | | | | | | | | | | | | $ | 2 | | | $ | 0 | |
| | | | | | | | | | | | | | | | | | | | | |
Total Purchased Options | | | $ | 2 | | | $ | 0 | |
| | | | | | | | | |
| | | | | | |
| See Accompanying Notes | | ANNUAL REPORT | | OCTOBER 31, 2014 | | 87 |
Schedule of Investments PIMCO Fixed Income SHares: Series R (Cont.)
WRITTEN OPTIONS:
CREDIT DEFAULT SWAPTIONS ON CREDIT INDICES
| | | | | | | | | | | | | | | | | | | | | | | | | | | | |
| Counterparty | | Description | | Buy/Sell
Protection | | Exercise
Rate | | | Expiration
Date | | | Notional
Amount | | | Premiums
(Received) | | | Market
Value | |
| BOA | | Put - OTC CDX.IG-22 5-Year Index | | Sell | | | 0.950% | | | | 12/17/2014 | | | | $ | | | | 300 | | | $ | (1 | ) | | $ | 0 | |
| | Put - OTC CDX.IG-22 5-Year Index | | Sell | | | 1.200% | | | | 12/17/2014 | | | | | | | | 700 | | | | (1 | ) | | | 0 | |
| | | | | | | | | | | | | | | | | | | | | | | | | | | | |
| BPS | | Call - OTC iTraxx Europe 22 5-Year Index | | Buy | | | 0.600% | | | | 01/21/2015 | | | | EUR | | | | 1,600 | | | | (3 | ) | | | (3 | ) |
| | Put - OTC iTraxx Europe 22 5-Year Index | | Sell | | | 0.900% | | | | 01/21/2015 | | | | | | | | 1,600 | | | | (3 | ) | | | (3 | ) |
| | | | | | | | | | | | | | | | | | | | | | | | | | | | |
| CBK | | Put - OTC CDX.IG-22 5-Year Index | | Sell | | | 0.850% | | | | 12/17/2014 | | | | $ | | | | 2,300 | | | | (3 | ) | | | (1 | ) |
| | Put - OTC CDX.IG-22 5-Year Index | | Sell | | | 0.900% | | | | 12/17/2014 | | | | | | | | 600 | | | | (1 | ) | | | 0 | |
| | Put - OTC CDX.IG-22 5-Year Index | | Sell | | | 0.950% | | | | 12/17/2014 | | | | | | | | 600 | | | | (1 | ) | | | 0 | |
| | Put - OTC CDX.IG-22 5-Year Index | | Sell | | | 1.000% | | | | 12/17/2014 | | | | | | | | 300 | | | | (1 | ) | | | 0 | |
| | | | | | | | | | | | | | | | | | | | | | | | | | | | |
| GST | | Put - OTC CDX.IG-22 5-Year Index | | Sell | | | 1.200% | | | | 12/17/2014 | | | | | | | | 1,500 | | | | (1 | ) | | | 0 | |
| | Put - OTC CDX.IG-22 5-Year Index | | Sell | | | 0.900% | | | | 01/21/2015 | | | | | | | | 700 | | | | (1 | ) | | | 0 | |
| | Put - OTC iTraxx Europe 21 5-Year Index | | Sell | | | 0.850% | | | | 12/17/2014 | | | | EUR | | | | 4,000 | | | | (11 | ) | | | (2 | ) |
| | Put - OTC iTraxx Europe 21 5-Year Index | | Sell | | | 0.950% | | | | 12/17/2014 | | | | | | | | 4,700 | | | | (11 | ) | | | (1 | ) |
| | Put - OTC iTraxx Europe 22 5-Year Index | | Sell | | | 1.100% | | | | 01/21/2015 | | | | | | | | 500 | | | | (1 | ) | | | 0 | |
| | Put - OTC iTraxx Europe 22 5-Year Index | | Sell | | | 1.200% | | | | 01/21/2015 | | | | | | | | 1,000 | | | | (2 | ) | | | 0 | |
| | | | | | | | | | | | | | | | | | | | | | | | | | | | |
| JPM | | Put - OTC CDX.IG-22 5-Year Index | | Sell | | | 0.850% | | | | 12/17/2014 | | | | $ | | | | 2,700 | | | | (3 | ) | | | (1 | ) |
| | Put - OTC CDX.IG-22 5-Year Index | | Sell | | | 0.900% | | | | 12/17/2014 | | | | | | | | 2,600 | | | | (4 | ) | | | 0 | |
| | Put - OTC CDX.IG-22 5-Year Index | | Sell | | | 0.950% | | | | 12/17/2014 | | | | | | | | 1,200 | | | | (2 | ) | | | 0 | |
| | Put - OTC iTraxx Europe 21 5-Year Index | | Sell | | | 0.950% | | | | 12/17/2014 | | | | EUR | | | | 700 | | | | (1 | ) | | | 0 | |
| | Call - OTC iTraxx Europe 22 5-Year Index | | Buy | | | 0.600% | | | | 01/21/2015 | | | | | | | | 1,500 | | | | (2 | ) | | | (3 | ) |
| | Put - OTC iTraxx Europe 22 5-Year Index | | Sell | | | 1.000% | | | | 01/21/2015 | | | | | | | | 1,500 | | | | (4 | ) | | | (2 | ) |
| | | | | | | | | | | | | | | | | | | | | | | | | | | | |
| | | | | | | | | | | | | | | | | | | | | | $ | (57 | ) | | $ | (16 | ) |
| | | | | | | | | | | | | | | | | | | | | | | | | | | | |
FOREIGN CURRENCY OPTIONS
| | | | | | | | | | | | | | | | | | | | | | | | | | |
| Counterparty | | Description | | Strike
Price | | | Expiration
Date | | | Notional
Amount | | | Premiums
(Received) | | | Market
Value | |
| DUB | | Call - OTC USD versus BRL | | | BRL | | | | 2.680 | | | | 07/01/2015 | | | | $ 370 | | | $ | (9 | ) | | $ | (16 | ) |
| GLM | | Put - OTC USD versus INR | | | INR | | | | 58.500 | | | | 03/09/2015 | | | | 300 | | | | (1 | ) | | | 0 | |
| | Call - OTC USD versus INR | | | | | | | 64.500 | | | | 03/09/2015 | | | | 300 | | | | (3 | ) | | | (2 | ) |
| JPM | | Call - OTC USD versus INR | | | | | | | 65.000 | | | | 03/10/2015 | | | | 1,700 | | | | (20 | ) | | | (11 | ) |
| | | | | | | | | | | | | | | | | | | | | | | | | | |
| | | | | | | | | | | | | | | | | | | | $ | (33 | ) | | $ | (29 | ) |
| | | | | | | | | | | | | | | | | | | | | | | | | | |
INFLATION-CAPPED OPTIONS
| | | | | | | | | | | | | | | | | | | | | | |
| Counterparty | | Description | | Initial
Index | | Floating Rate | | Expiration
Date (1) | | | Notional
Amount | | | Premiums
(Received) | | | Market
Value | |
| CBK | | Floor - OTC CPURNSA Index | | TBD | | Maximum of [(1 + 0.000%)10 - (Final Index/Initial Index)] or 0 | | | 04/07/2020 | | | $ | 32,200 | | | $ | (287 | ) | | $ | (11 | ) |
| | Floor - OTC CPURNSA Index | | TBD | | Maximum of [(1 + 0.000%)10 - (Final Index/Initial Index)] or 0 | | | 09/29/2020 | | | | 1,500 | | | | (19 | ) | | | (1 | ) |
| DUB | | Floor - OTC YOY CPURNSA Index | | TBD | | Maximum of [(1 + 0.000%) - (Final Index/Initial Index)] or 0 | | | 01/22/2018 | | | | 1,800 | | | | (18 | ) | | | (5 | ) |
| JPM | | Cap - OTC CPURNSA Index | | 4.000 | | Maximum of [(Final Index/Initial Index - 1) - 4.000%] or 0 | | | 04/22/2024 | | | | 6,500 | | | | (47 | ) | | | (20 | ) |
| | Cap - OTC CPURNSA Index | | 4.000 | | Maximum of [(Final Index/Initial Index - 1) - 4.000%] or 0 | | | 05/16/2024 | | | | 500 | | | | (4 | ) | | | (2 | ) |
| | | | | | | | | | | | | | | | | | | | | | |
| | | | | | | | | | | | $ | (375 | ) | | $ | (39 | ) |
| | | | | | | | | | | | | | | | | | | | | | |
| (1) | YOY options may have a series of expirations. |
| | | | | | |
| 88 | | PIMCO MANAGED ACCOUNTS TRUST | | | | See Accompanying Notes |
October 31, 2014
INTEREST RATE SWAPTIONS
| | | | | | | | | | | | | | | | | | | | | | | | | | | | | | |
| Counterparty | | Description | | Floating Rate Index | | Pay/Receive
Floating Rate | | Exercise
Rate | | | Expiration
Date | | | Notional
Amount | | | Premiums
(Received) | | | Market
Value | |
| GLM | | Call - OTC 10-Year Interest Rate Swap | | 6-Month EUR-EURIBOR | | Receive | | | 1.000% | | | | 12/15/2014 | | | | EUR | | | | 4,300 | | | $ | (8 | ) | | $ | (15 | ) |
| | Put - OTC 10-Year Interest Rate Swap | | 6-Month EUR-EURIBOR | | Pay | | | 1.500% | | | | 12/15/2014 | | | | | | | | 4,300 | | | | (18 | ) | | | (1 | ) |
| JPM | | Call - OTC 5-Year Interest Rate Swap (Effective 11/20/2019) | | 3-Month USD-LIBOR | | Receive | | | 3.200% | | | | 11/18/2014 | | | | $ | | | | 5,900 | | | | (16 | ) | | | (8 | ) |
| MYC | | Call - OTC 10-Year Interest Rate Swap | | 3-Month USD-LIBOR | | Receive | | | 2.250% | | | | 11/17/2014 | | | | | | | | 6,500 | | | | (36 | ) | | | (1 | ) |
| | Put - OTC 10-Year Interest Rate Swap | | 3-Month USD-LIBOR | | Pay | | | 2.450% | | | | 11/17/2014 | | | | | | | | 6,500 | | | | (43 | ) | | | (47 | ) |
| | | | | | | | | | | | | | | | | | | | | | | | | | | | | | |
| | | | | | | | | | | | | | | | | | | | | | | | $ | (121 | ) | | $ | (72 | ) |
| | | | | | | | | | | | | | | | | | | | | | | | | | | | | | |
Total Written Options | | | | | | | | | | | | | | | | | | | | $ | (586 | ) | | $ | (156 | ) |
| | | | | | | | | | | | | | | | | | | | | | | | | | | | | | |
TRANSACTIONS IN WRITTEN CALL AND PUT OPTIONS FOR THE PERIOD ENDED OCTOBER 31, 2014:
| | | | | | | | | | | | | | | | |
| | | # of
Contracts | | | Notional
Amount in $ | | | Notional
Amount in EUR | | | Premiums | |
Balance at Beginning of Period | | | 93 | | | $ | 262,500 | | | EUR | 56,000 | | | $ | (1,638 | ) |
Sales | | | 90 | | | | 129,766 | | | | 71,700 | | | | (954 | ) |
Closing Buys | | | 0 | | | | (53,900 | ) | | | (15,600 | ) | | | 234 | |
Expirations | | | (93 | ) | | | (260,796 | ) | | | (55,700 | ) | | | 1,657 | |
Exercised | | | (90 | ) | | | 0 | | | | (30,700 | ) | | | 115 | |
| | | | | | | | | | | | | | | | |
Balance at End of Period | | | 0 | | | $ | 77,570 | | | EUR | 25,700 | | | $ | (586 | ) |
| | | | | | | | | | | | | | | | |
SWAP AGREEMENTS:
CREDIT DEFAULT SWAPS ON CORPORATE ISSUES - BUY PROTECTION (2)
| | | | | | | | | | | | | | | | | | | | | | | | | | | | | | | | | | |
Counterparty | | Reference Entity | | Fixed Deal
(Pay) Rate | | | Maturity
Date | | | Implied
Credit
Spread at
October 31,
2014 (4) | | | Notional
Amount (5) | | | Premiums
Paid/(Received) | | | Unrealized
(Depreciation) | | | Swap Agreements,
at Value | |
| | | | | | | | | Asset | | | Liability | |
BOA | | Marsh & McLennan Cos., Inc. | | | (0.900% | ) | | | 06/20/2019 | | | | 0.223% | | | $ | 3,000 | | | $ | 0 | | | $ | (95 | ) | | $ | 0 | | | $ | (95 | ) |
| | | | | | | | | | | | | | | | | | | | | | | | | | | | | | | | | | |
GST | | RPM International, Inc. | | | (1.500% | ) | | | 03/20/2018 | | | | 0.458% | | | | 1,000 | | | | 0 | | | | (37 | ) | | | 0 | | | | (37 | ) |
| | | | | | | | | | | | | | | | | | | | | | | | | | | | | | | | | | |
| | | | | | | | | | | | | | | | | | | | $ | 0 | | | $ | (132 | ) | | $ | 0 | | | $ | (132 | ) |
| | | | | | | | | | | | | | | | | | | | | | | | | | | | | | | | | | |
CREDIT DEFAULT SWAPS ON CORPORATE AND SOVEREIGN ISSUES - SELL PROTECTION (3)
| | | | | | | | | | | | | | | | | | | | | | | | | | | | | | | | | | |
Counterparty | | Reference Entity | | Fixed Deal
Receive Rate | | | Maturity
Date | | | Implied
Credit
Spread at
October 31,
2014 (4) | | | Notional
Amount (5) | | | Premiums
Paid/
(Received) | | | Unrealized
Appreciation/
(Depreciation) | | | Swap Agreements,
at Value | |
| | | | | | | | | Asset | | | Liability | |
BOA | | Brazil Government International Bond | | | 1.000% | | | | 03/20/2019 | | | | 1.317% | | | $ | 100 | | | $ | (5 | ) | | $ | 4 | | | $ | 0 | | | $ | (1 | ) |
| | | | | | | | | | | | | | | | | | | | | | | | | | | | | | | | | | |
BPS | | Italy Government International Bond | | | 1.000% | | | | 03/20/2019 | | | | 1.028% | | | | 6,800 | | | | (118 | ) | | | 117 | | | | 0 | | | | (1 | ) |
| | | | | | | | | | | | | | | | | | | | | | | | | | | | | | | | | | |
| | | | | | |
| See Accompanying Notes | | ANNUAL REPORT | | OCTOBER 31, 2014 | | 89 |
Schedule of Investments PIMCO Fixed Income SHares: Series R (Cont.)
| | | | | | | | | | | | | | | | | | | | | | | | | | | | | | | | | | |
Counterparty | | Reference Entity | | Fixed Deal
Receive Rate | | | Maturity
Date | | | Implied
Credit
Spread at
October 31,
2014 (4) | | | Notional
Amount (5) | | | Premiums
Paid/
(Received) | | | Unrealized
Appreciation/
(Depreciation) | | | Swap Agreements,
at Value | |
| | | | | | | | | Asset | | | Liability | |
CBK | | Russia Government International Bond | | | 1.000% | | | | 03/20/2019 | | | | 2.337% | | | $ | 400 | | | $ | (33 | ) | | $ | 12 | | | $ | 0 | | | $ | (21 | ) |
| | | | | | | | | | | | | | | | | | | | | | | | | | | | | | | | | | |
DUB | | Brazil Government International Bond | | | 1.000% | | | | 03/20/2019 | | | | 1.317% | | | | 2,400 | | | | (121 | ) | | | 92 | | | | 0 | | | | (29 | ) |
| | | | | | | | | | | | | | | | | | | | | | | | | | | | | | | | | | |
GST | | Russia Government International Bond | | | 1.000% | | | | 09/20/2019 | | | | 2.398% | | | | 200 | | | | (11 | ) | | | (1 | ) | | | 0 | | | | (12 | ) |
| | | | | | | | | | | | | | | | | | | | | | | | | | | | | | | | | | |
HUS | | Petrobras International Finance Co. | | | 1.000% | | | | 09/20/2015 | | | | 0.886% | | | | 2,000 | | | | (64 | ) | | | 68 | | | | 4 | | | | 0 | |
| | Spain Government International Bond | | | 1.000% | | | | 03/20/2019 | | | | 0.829% | | | | 1,600 | | | | (12 | ) | | | 25 | | | | 13 | | | | 0 | |
| | | | | | | | | | | | | | | | | | | | | | | | | | | | | | | | | | |
JPM | | Brazil Government International Bond | | | 1.000% | | | | 03/20/2019 | | | | 1.317% | | | | 900 | | | | (46 | ) | | | 35 | | | | 0 | | | | (11 | ) |
| | HSBC Bank PLC | | | 1.000% | | | | 06/20/2019 | | | | 0.406% | | | | 4,500 | | | | 56 | | | | 70 | | | | 126 | | | | 0 | |
| | Russia Government International Bond | | | 1.000% | | | | 09/20/2019 | | | | 2.398% | | | | 100 | | | | (6 | ) | | | (1 | ) | | | 0 | | | | (7 | ) |
| | | | | | | | | | | | | | | | | | | | | | | | | | | | | | | | | | |
MYC | | Brazil Government International Bond | | | 1.000% | | | | 03/20/2019 | | | | 1.317% | | | | 2,500 | | | | (127 | ) | | | 97 | | | | 0 | | | | (30 | ) |
| | Spain Government International Bond | | | 1.000% | | | | 03/20/2019 | | | | 0.829% | | | | 3,000 | | | | (18 | ) | | | 44 | | | | 26 | | | | 0 | |
| | | | | | | | | | | | | | | | | | | | | | | | | | | | | | | | | | |
| | | | | | | | | | | | | | | | | | | | $ | (505 | ) | | $ | 562 | | | $ | 169 | | | $ | (112 | ) |
| | | | | | | | | | | | | | | | | | | | | | | | | | | | | | | | | | |
| (2) | If the Portfolio is a buyer of protection and a credit event occurs, as defined under the terms of that particular swap agreement, the Portfolio will either (i) receive from the seller of protection an amount equal to the notional amount of the swap and deliver the referenced obligation or underlying securities comprising the referenced index or (ii) receive a net settlement amount in the form of cash or securities equal to the notional amount of the swap less the recovery value of the referenced obligation or underlying securities comprising the referenced index. |
| (3) | If the Portfolio is a seller of protection and a credit event occurs, as defined under the terms of that particular swap agreement, the Portfolio will either (i) pay to the buyer of protection an amount equal to the notional amount of the swap and take delivery of the referenced obligation or underlying securities comprising the referenced index or (ii) pay a net settlement amount in the form of cash or securities equal to the notional amount of the swap less the recovery value of the referenced obligation or underlying securities comprising the referenced index. |
| (4) | Implied credit spreads, represented in absolute terms, utilized in determining the market value of credit default swap agreements on corporate or sovereign issues as of period end serve as an indicator of the current status of the payment/performance risk and represent the likelihood or risk of default for the credit derivative. The implied credit spread of a particular referenced entity reflects the cost of buying/selling protection and may include upfront payments required to be made to enter into the agreement. Wider credit spreads represent a deterioration of the referenced entity’s credit soundness and a greater likelihood or risk of default or other credit event occurring as defined under the terms of the agreement. |
| (5) | The maximum potential amount the Portfolio could be required to pay as a seller of credit protection or receive as a buyer of credit protection if a credit event occurs as defined under the terms of that particular swap agreement. |
INTEREST RATE SWAPS
| | | | | | | | | | | | | | | | | | | | | | | | | | | | | | | | | | | | |
| Counterparty | | Pay/
Receive
Floating
Rate | | Floating Rate Index | | Fixed
Rate | | | Maturity
Date | | | Notional
Amount | | | Premiums
Paid/
(Received) | | | Unrealized
Appreciation/
(Depreciation) | | | Swap Agreements,
at Value | |
| | | | | | | | | Asset | | | Liability | |
BOA | | Pay | | 1-Month GBP-UKRPI | | | 3.500% | | | | 10/15/2044 | | | | GBP | | | | 1,200 | | | $ | 2 | | | $ | (41 | ) | | $ | 0 | | | $ | (39 | ) |
| | | | | | | | | | | | | | | | | | | | | | | | | | | | | | | | | | | | |
CBK | | Pay | | 1-Month GBP-UKRPI | | | 3.500% | | | | 10/15/2044 | | | | | | | | 400 | | | | (13 | ) | | | (1 | ) | | | 0 | | | | (14 | ) |
| | Receive | | 3-Month USD-
CPURNSA Index | | | 2.250% | | | | 07/15/2017 | | | | $ | | | | 15,000 | | | | 4 | | | | (517 | ) | | | 0 | | | | (513 | ) |
| | | | | | | | | | | | | | | | | | | | | | | | | | | | | | | | | | | | |
| | | | | | |
| 90 | | PIMCO MANAGED ACCOUNTS TRUST | | | | See Accompanying Notes |
October 31, 2014
| | | | | | | | | | | | | | | | | | | | | | | | | | | | | | | | | | | | |
| Counterparty | | Pay/
Receive
Floating
Rate | | Floating Rate Index | | Fixed
Rate | | | Maturity
Date | | | Notional
Amount | | | Premiums
Paid/
(Received) | | | Unrealized
Appreciation/
(Depreciation) | | | Swap Agreements,
at Value | |
| | | | | | | | | Asset | | | Liability | |
DUB | | Pay | | 1-Year BRL-CDI | | | 11.160% | | | | 01/04/2021 | | | | BRL | | | | 1,300 | | | $ | 0 | | | $ | (10 | ) | | $ | 0 | | | $ | (10 | ) |
| | Receive | | 3-Month USD-
CPURNSA Index | | | 1.860% | | | | 11/05/2016 | | | | $ | | | | 11,800 | | | | 0 | | | | (101 | ) | | | 0 | | | | (101 | ) |
| | Receive | | 3-Month USD-
CPURNSA Index | | | 2.360% | | | | 01/28/2017 | | | | | | | | 8,200 | | | | 0 | | | | (270 | ) | | | 0 | | | | (270 | ) |
| | Receive | | 3-Month USD-
CPURNSA Index | | | 2.500% | | | | 07/15/2022 | | | | | | | | 5,000 | | | | 103 | | | | (370 | ) | | | 0 | | | | (267 | ) |
| | Pay | | 6-Month AUD-
BBR-BBSW | | | 4.000% | | | | 06/18/2019 | | | | AUD | | | | 4,400 | | | | 10 | | | | 158 | | | | 168 | | | | 0 | |
| | | | | | | | | | | | | | | | | | | | | | | | | | | | | | | | | | | | |
FBF | | Pay | | 1-Month GBP-UKRPI | | | 3.528% | | | | 09/23/2044 | | | | GBP | | | | 600 | | | | (4 | ) | | | (6 | ) | | | 0 | | | | (10 | ) |
| | Pay | | 1-Month GBP-UKRPI | | | 3.500% | | | | 10/15/2044 | | | | | | | | 200 | | | | (6 | ) | | | 0 | | | | 0 | | | | (6 | ) |
| | | | | | | | | | | | | | | | | | | | | | | | | | | | | | | | | | | | |
GLM | | Pay | | 1-Year BRL-CDI | | | 8.300% | | | | 01/02/2017 | | | | BRL | | | | 28,800 | | | | 13 | | | | (886 | ) | | | 0 | | | | (873 | ) |
| | Pay | | 1-Year BRL-CDI | | | 10.910% | | | | 01/02/2017 | | | | | | | | 100 | | | | 0 | | | | (1 | ) | | | 0 | | | | (1 | ) |
| | Receive | | 3-Month USD-
CPURNSA Index | | | 1.730% | | | | 04/15/2016 | | | | $ | | | | 24,100 | | | | (49 | ) | | | (154 | ) | | | 0 | | | | (203 | ) |
| | Receive | | 3-Month USD-
CPURNSA Index | | | 2.033% | | | | 04/15/2018 | | | | | | | | 5,300 | | | | 0 | | | | (94 | ) | | | 0 | | | | (94 | ) |
| | | | | | | | | | | | | | | | | | | | | | | | | | | | | | | | | | | | |
JPM | | Pay | | 1-Month GBP-UKRPI | | | 3.528% | | | | 09/23/2044 | | | | GBP | | | | 600 | | | | 1 | | | | (11 | ) | | | 0 | | | | (10 | ) |
| | | | | | | | | | | | | | | | | | | | | | | | | | | | | | | | | | | | |
MYC | | Pay | | 1-Year BRL-CDI | | | 8.220% | | | | 01/02/2017 | | | | BRL | | | | 1,700 | | | | 0 | | | | (54 | ) | | | 0 | | | | (54 | ) |
| | Pay | | 1-Year BRL-CDI | | | 11.500% | | | | 01/04/2021 | | | | | | | | 800 | | | | 4 | | | | (6 | ) | | | 0 | | | | (2 | ) |
| | | | | | | | | | | | | | | | | | | | | | | | | | | | | | | | | | | | |
RYL | | Receive | | 3-Month USD-
CPURNSA Index | | | 1.930% | | | | 10/31/2016 | | | | $ | | | | 7,800 | | | | 0 | | | | (84 | ) | | | 0 | | | | (84 | ) |
| | Receive | | 3-Month USD-
CPURNSA Index | | | 2.250% | | | | 07/15/2017 | | | | | | | | 4,100 | | | | 14 | | | | (155 | ) | | | 0 | | | | (141 | ) |
| | | | | | | | | | | | | | | | | | | | | | | | | | | | | | | | | | | | |
UAG | | Pay | | 1-Year BRL-CDI | | | 8.150% | | | | 01/02/2017 | | | | BRL | | | | 37,200 | | | | (37 | ) | | | (1,179 | ) | | | 0 | | | | (1,216 | ) |
| | Pay | | 1-Year BRL-CDI | | | 11.500% | | | | 01/04/2021 | | | | | | | | 300 | | | | 2 | | | | (2 | ) | | | 0 | | | | 0 | |
| | | | | | | | | | | | | | | | | | | | | | | | | | | | | | | | | | | | |
| | | | | | | | | | | | | | | | | | | | | | $ | 44 | | | $ | (3,784 | ) | | $ | 168 | | | $ | (3,908 | ) |
| | | | | | | | | | | | | | | | | | | | | | | | | | | | | | | | | | | | |
Total Swap Agreements | | | $ | (461 | ) | | $ | (3,354 | ) | | $ | 337 | | | $ | (4,152 | ) |
| | | | | | | | | | | | | | | | | | | | | | | | | | | | | | | | | | | | |
FINANCIAL DERIVATIVE INSTRUMENTS: OVER THE COUNTER SUMMARY
The following is a summary by counterparty of the market value of OTC financial derivative instruments and collateral (received)/pledged as of October 31, 2014:
| (j) | Securities with an aggregate market value of $2,671 have been pledged as collateral for financial derivative instruments as governed by International Swaps and Derivatives Association, Inc. master agreements as of October 31, 2014. |
| | | | | | | | | | | | | | | | | | | | | | | | | | | | | | | | | | | | | | | | | | | | | | |
| | | Financial Derivative Assets | | | | | Financial Derivative Liabilities | | | | | | | | | | |
| Counterparty | | Forward
Foreign
Currency
Contracts | | | Purchased
Options | | | Swap
Agreements | | | Total
Over the
Counter | | | | | Forward
Foreign
Currency
Contracts | | | Written
Options | | | Swap
Agreements | | | Total
Over the
Counter | | | Net Market
Value of OTC
Derivatives | | | Collateral
(Received)/
Pledged | | | Net
Exposure (6) | |
BOA | | $ | 295 | | | $ | 0 | | | $ | 0 | | | $ | 295 | | | | | $ | 0 | | | $ | 0 | | | $ | (135 | ) | | $ | (135 | ) | | $ | 160 | | | $ | 0 | | | $ | 160 | |
BPS | | | 97 | | | | 0 | | | | 0 | | | | 97 | | | | | | (39 | ) | | | (6 | ) | | | (1 | ) | | | (46 | ) | | | 51 | | | | 0 | | | | 51 | |
BRC | | | 495 | | | | 0 | | | | 0 | | | | 495 | | | | | | (448 | ) | | | 0 | | | | 0 | | | | (448 | ) | | | 47 | | | | 0 | | | | 47 | |
CBK | | | 488 | | | | 0 | | | | 0 | | | | 488 | | | | | | (24 | ) | | | (13 | ) | | | (548 | ) | | | (585 | ) | | | (97 | ) | | | 318 | | | | 221 | |
DUB | | | 29 | | | | 0 | | | | 168 | | | | 197 | | | | | | (2 | ) | | | (21 | ) | | | (677 | ) | | | (700 | ) | | | (503 | ) | | | 619 | | | | 116 | |
FBF | | | 181 | | | | 0 | | | | 0 | | | | 181 | | | | | | (159 | ) | | | 0 | | | | (16 | ) | | | (175 | ) | | | 6 | | | | 0 | | | | 6 | |
GLM | | | 9 | | | | 0 | | | | 0 | | | | 9 | | | | | | (10 | ) | | | (18 | ) | | | (1,171 | ) | | | (1,199 | ) | | | (1,190 | ) | | | 1,175 | | | | (15 | ) |
GST | | | 0 | | | | 0 | | | | 0 | | | | 0 | | | | | | 0 | | | | (3 | ) | | | (49 | ) | | | (52 | ) | | | (52 | ) | | | 0 | | | | (52 | ) |
HUS | | | 9 | | | | 0 | | | | 17 | | | | 26 | | | | | | (5 | ) | | | 0 | | | | 0 | | | | (5 | ) | | | 21 | | | | 0 | | | | 21 | |
JPM | | | 340 | | | | 0 | | | | 126 | | | | 466 | | | | | | (1 | ) | | | (47 | ) | | | (28 | ) | | | (76 | ) | | | 390 | | | | 0 | | | | 390 | |
MSB | | | 15 | | | | 0 | | | | 0 | | | | 15 | | | | | | (2 | ) | | | 0 | | | | 0 | | | | (2 | ) | | | 13 | | | | (10 | ) | | | 3 | |
| | | | | | |
| See Accompanying Notes | | ANNUAL REPORT | | OCTOBER 31, 2014 | | 91 |
Schedule of Investments PIMCO Fixed Income SHares: Series R (Cont.)
| | | | | | | | | | | | | | | | | | | | | | | | | | | | | | | | | | | | | | | | | | | | | | |
| | | Financial Derivative Assets | | | | | Financial Derivative Liabilities | | | | | | | | | | |
| Counterparty | | Forward
Foreign
Currency
Contracts | | | Purchased
Options | | | Swap
Agreements | | | Total
Over the
Counter | | | | | Forward
Foreign
Currency
Contracts | | | Written
Options | | | Swap
Agreements | | | Total
Over the
Counter | | | Net Market
Value of OTC
Derivatives | | | Collateral
(Received)/
Pledged | | | Net
Exposure (6) | |
MYC | | $ | 0 | | | $ | 0 | | | $ | 26 | | | $ | 26 | | | | | $ | 0 | | | $ | (48 | ) | | $ | (86 | ) | | $ | (134 | ) | | $ | (108 | ) | | $ | 33 | | | $ | (75 | ) |
RYL | | | 0 | | | | 0 | | | | 0 | | | | 0 | | | | | | 0 | | | | 0 | | | | (225 | ) | | | (225 | ) | | | (225 | ) | | | (50 | ) | | | (275 | ) |
UAG | | | 2,139 | | | | 0 | | | | 0 | | | | 2,139 | | | | | | (1,043 | ) | | | 0 | | | | (1,216 | ) | | | (2,259 | ) | | | (120 | ) | | | 482 | | | | 362 | |
| | | | | | | | | | | | | | | | | | | | | | | | | | | | | | | | | | | | | | | | | | | | | | |
Total Over the
Counter | | $ | 4,097 | | | $ | 0 | | | $ | 337 | | | $ | 4,434 | | | | | $ | (1,733 | ) | | $ | (156 | ) | | $ | (4,152 | ) | | $ | (6,041 | ) | | | | | | | | | | | | |
| | | | | | | | | | | | | | | | | | | | | | | | | | | | | | | | | | | | | | | | | | | | | | |
| (6) | Net Exposure represents the net receivable/(payable) that would be due from/to the counterparty in the event of default. Exposure from OTC financial derivative instruments can only be netted across transactions governed under the same master agreement with the same legal entity. See Note 7, Principal Risks, in the Notes to Financial Statements for more information regarding master netting arrangements. |
FAIR VALUE OF FINANCIAL DERIVATIVE INSTRUMENTS
The following is a summary of the fair valuation of the Portfolio’s derivative instruments categorized by risk exposure. See Note 7, Principal Risks, in the Notes to Financial Statements on risks of the Portfolio.
Fair Values of Financial Derivative Instruments on the Statements of Assets and Liabilities as of October 31, 2014:
| | | | | | | | | | | | | | | | | | | | | | | | |
| | | Derivatives not accounted for as hedging instruments | |
| | | Commodity
Contracts | | | Credit
Contracts | | | Equity
Contracts | | | Foreign
Exchange
Contracts | | | Interest
Rate Contracts | | | Total | |
Financial Derivative Instruments - Assets | |
Exchange-traded or centrally cleared | | | | | | | | | | | | | | | | | | | | | | | | |
Purchased Options | | $ | 0 | | | $ | 0 | | | $ | 0 | | | $ | 0 | | | $ | 6 | | | $ | 6 | |
Futures | | | 0 | | | | 0 | | | | 0 | | | | 0 | | | | 23 | | | | 23 | |
Swap Agreements | | | 0 | | | | 29 | | | | 0 | | | | 0 | | | | 136 | | | | 165 | |
| | | | | | | | | | | | | | | | | | | | | | | | |
| | $ | 0 | | | $ | 29 | | | $ | 0 | | | $ | 0 | | | $ | 165 | | | $ | 194 | |
| | | | | | | | | | | | | | | | | | | | | | | | |
Over the counter | | | | | | | | | | | | | | | | | | | | | | | | |
Forward Foreign Currency Contracts | | $ | 0 | | | $ | 0 | | | $ | 0 | | | $ | 4,097 | | | $ | 0 | | | $ | 4,097 | |
Swap Agreements | | | 0 | | | | 169 | | | | 0 | | | | 0 | | | | 168 | | | | 337 | |
| | | | | | | | | | | | | | | | | | | | | | | | |
| | $ | 0 | | | $ | 169 | | | $ | 0 | | | $ | 4,097 | | | $ | 168 | | | $ | 4,434 | |
| | | | | | | | | | | | | | | | | | | | | | | | |
| | $ | 0 | | | $ | 198 | | | $ | 0 | | | $ | 4,097 | | | $ | 333 | | | $ | 4,628 | |
| | | | | | | | | | | | | | | | | | | | | | | | |
|
Financial Derivative Instruments - Liabilities | |
Exchange-traded or centrally cleared | | | | | | | | | | | | | | | | | | | | | | | | |
Futures | | $ | 0 | | | $ | 0 | | | $ | 0 | | | $ | 0 | | | $ | 173 | | | $ | 173 | |
Swap Agreements | | | 0 | | | | 0 | | | | 0 | | | | 0 | | | | 75 | | | | 75 | |
| | | | | | | | | | | | | | | | | | | | | | | | |
| | $ | 0 | | | $ | 0 | | | $ | 0 | | | $ | 0 | | | $ | 248 | | | $ | 248 | |
| | | | | | | | | | | | | | | | | | | | | | | | |
Over the counter | | | | | | | | | | | | | | | | | | | | | | | | |
Forward Foreign Currency Contracts | | $ | 0 | | | $ | 0 | | | $ | 0 | | | $ | 1,733 | | | $ | 0 | | | $ | 1,733 | |
Written Options | | | 0 | | | | 16 | | | | 0 | | | | 29 | | | | 111 | | | | 156 | |
Swap Agreements | | | 0 | | | | 244 | | | | 0 | | | | 0 | | | | 3,908 | | | | 4,152 | |
| | | | | | | | | | | | | | | | | | | | | | | | |
| | $ | 0 | | | $ | 260 | | | $ | 0 | | | $ | 1,762 | | | $ | 4,019 | | | $ | 6,041 | |
| | | | | | | | | | | | | | | | | | | | | | | | |
| | $ | 0 | | | $ | 260 | | | $ | 0 | | | $ | 1,762 | | | $ | 4,267 | | | $ | 6,289 | |
| | | | | | | | | | | | | | | | | | | | | | | | |
| | | | | | |
| 92 | | PIMCO MANAGED ACCOUNTS TRUST | | | | See Accompanying Notes |
October 31, 2014
The Effect of Financial Derivative Instruments on the Statements of Operations for the Period Ended October 31, 2014:
| | | | | | | | | | | | | | | | | | | | | | | | |
| | | Derivatives not accounted for as hedging instruments | |
| | | Commodity
Contracts | | | Credit
Contracts | | | Equity
Contracts | | | Foreign
Exchange
Contracts | | | Interest
Rate Contracts | | | Total | |
Net Realized Gain (Loss) on Financial Derivative Instruments | | | | | | | | | | | | | | | | | | | | | | | | |
Exchange-traded or centrally cleared | | | | | | | | | | | | | | | | | | | | | | | | |
Purchased Options | | $ | 0 | | | $ | 0 | | | $ | 0 | | | $ | 0 | | | $ | (17 | ) | | $ | (17 | ) |
Written Options | | | 0 | | | | 0 | | | | 0 | | | | 0 | | | | 32 | | | | 32 | |
Futures | | | 0 | | | | 0 | | | | 0 | | | | 0 | | | | 974 | | | | 974 | |
Swap Agreements | | | 0 | | | | 248 | | | | 0 | | | | 0 | | | | (2,095 | ) | | | (1,847 | ) |
| | | | | | | | | | | | | | | | | | | | | | | | |
| | $ | 0 | | | $ | 248 | | | $ | 0 | | | $ | 0 | | | $ | (1,106 | ) | | $ | (858 | ) |
| | | | | | | | | | | | | | | | | | | | | | | | |
Over the counter | | | | | | | | | | | | | | | | | | | | | | | | |
Forward Foreign Currency Contracts | | $ | 0 | | | $ | 0 | | | $ | 0 | | | $ | 5,299 | | | $ | 0 | | | $ | 5,299 | |
Purchased Options | | | 0 | | | | 0 | | | | 0 | | | | (1 | ) | | | (413 | ) | | | (414 | ) |
Written Options | | | 0 | | | | 77 | | | | 0 | | | | 335 | | | | 1,327 | | | | 1,739 | |
Swap Agreements | | | 0 | | | | 97 | | | | 0 | | | | 0 | | | | 1,385 | | | | 1,482 | |
| | | | | | | | | | | | | | | | | | | | | | | | |
| | $ | 0 | | | $ | 174 | | | $ | 0 | | | $ | 5,633 | | | $ | 2,299 | | | $ | 8,106 | |
| | | | | | | | | | | | | | | | | | | | | | | | |
| | $ | 0 | | | $ | 422 | | | $ | 0 | | | $ | 5,633 | | | $ | 1,193 | | | $ | 7,248 | |
| | | | | | | | | | | | | | | | | | | | | | | | |
| | | | | | |
Net Change in Unrealized Appreciation (Depreciation) on Financial Derivative Instruments | | | | | | | | | | | | | | | | | | | | | | | | |
Exchange-traded or centrally cleared | | | | | | | | | | | | | | | | | | | | | | | | |
Futures | | $ | 0 | | | $ | 0 | | | $ | 0 | | | $ | 0 | | | $ | (613 | ) | | $ | (613 | ) |
Swap Agreements | | | 0 | | | | 57 | | | | 0 | | | | 0 | | | | (5,039 | ) | | | (4,982 | ) |
| | | | | | | | | | | | | | | | | | | | | | | | |
| | $ | 0 | | | $ | 57 | | | $ | 0 | | | $ | 0 | | | $ | (5,652 | ) | | $ | (5,595 | ) |
| | | | | | | | | | | | | | | | | | | | | | | | |
Over the counter | | | | | | | | | | | | | | | | | | | | | | | | |
Forward Foreign Currency Contracts | | $ | 0 | | | $ | 0 | | | $ | 0 | | | $ | 2,461 | | | $ | 0 | | | $ | 2,461 | |
Purchased Options | | | 0 | | | | 0 | | | | 0 | | | | (2 | ) | | | 190 | | | | 188 | |
Written Options | | | 0 | | | | 41 | | | | 0 | | | | 4 | | | | (606 | ) | | | (561 | ) |
Swap Agreements | | | 0 | | | | 490 | | | | 0 | | | | 0 | | | | (762 | ) | | | (272 | ) |
| | | | | | | | | | | | | | | | | | | | | | | | |
| | $ | 0 | | | $ | 531 | | | $ | 0 | | | $ | 2,463 | | | $ | (1,178 | ) | | $ | 1,816 | |
| | | | | | | | | | | | | | | | | | | | | | | | |
| | $ | 0 | | | $ | 588 | | | $ | 0 | | | $ | 2,463 | | | $ | (6,830 | ) | | $ | (3,779 | ) |
| | | | | | | | | | | | | | | | | | | | | | | | |
FAIR VALUE MEASUREMENTS (4)
The following is a summary of the fair valuations according to the inputs used as of October 31, 2014 in valuing the Portfolio’s assets and liabilities:
| | | | | | | | | | | | | | | | |
| Category and Subcategory | | Level 1 | | | Level 2 | | | Level 3 | | | Fair
Value at
10/31/2014 | |
Investments in Securities, at Value | | | | | | | | | |
Corporate Bonds & Notes | | | | | | | | | | | | | | | | |
Banking & Finance | | $ | 0 | | | $ | 15,645 | | | $ | 0 | | | $ | 15,645 | |
Industrials | | | 0 | | | | 1,323 | | | | 0 | | | | 1,323 | |
Utilities | | | 0 | | | | 1,251 | | | | 0 | | | | 1,251 | |
U.S. Government Agencies | | | 0 | | | | 10,295 | | | | 0 | | | | 10,295 | |
U.S. Treasury Obligations | | | 0 | | | | 221,023 | | | | 0 | | | | 221,023 | |
Mortgage-Backed Securities | | | 0 | | | | 10,153 | | | | 0 | | | | 10,153 | �� |
Asset-Backed Securities | | | 0 | | | | 6,446 | | | | 0 | | | | 6,446 | |
Sovereign Issues | | | 0 | | | | 54,121 | | | | 0 | | | | 54,121 | |
| | | | | | |
| See Accompanying Notes | | ANNUAL REPORT | | OCTOBER 31, 2014 | | 93 |
Schedule of Investments PIMCO Fixed Income SHares: Series R (Cont.)
October 31, 2014
| | | | | | | | | | | | | | | | |
| Category and Subcategory | | Level 1 | | | Level 2 | | | Level 3 | | | Fair
Value at
10/31/2014 | |
Short-Term Instruments | | | | | | | | | | | | | | | | |
Commercial Paper | | $ | 0 | | | $ | 1,276 | | | $ | 0 | | | $ | 1,276 | |
Repurchase Agreements | | | 0 | | | | 153 | | | | 0 | | | | 153 | |
Greece Treasury Bills | | | 0 | | | | 22,510 | | | | 0 | | | | 22,510 | |
U.S. Treasury Bills | | | 0 | | | | 260 | | | | 0 | | | | 260 | |
| | | | |
Total Investments | | $ | 0 | | | $ | 344,456 | | | $ | 0 | | | $ | 344,456 | |
| | | | |
Financial Derivative Instruments - Assets | | | | | | | | | | | | | | | | |
Exchange-traded or centrally cleared | | | 23 | | | | 171 | | | | 0 | | | | 194 | |
Over the counter | | | 0 | | | | 4,434 | | | | 0 | | | | 4,434 | |
| | $ | 23 | | | $ | 4,605 | | | $ | 0 | | | $ | 4,628 | |
| | | | |
Financial Derivative Instruments - Liabilities | | | | | | | | | | | | | | | | |
Exchange-traded or centrally cleared | | | (173 | ) | | | (75 | ) | | | 0 | | | | (248 | ) |
Over the counter | | | (6 | ) | | | (6,035 | ) | | | 0 | | | | (6,041 | ) |
| | $ | (179 | ) | | $ | (6,110 | ) | | $ | 0 | | | $ | (6,289 | ) |
| | | | |
Totals | | $ | (156 | ) | | $ | 342,951 | | | $ | 0 | | | $ | 342,795 | |
There were no significant transfers between Level 1, 2, and 3 during the period ended October 31, 2014.
| | | | | | |
| 94 | | PIMCO MANAGED ACCOUNTS TRUST | | | | See Accompanying Notes |
Schedule of Investments PIMCO Fixed Income SHares: Series TE
October 31, 2014
| | | | | | | | | | | | |
| | | | | PRINCIPAL
AMOUNT
(000S) | | | | | MARKET
VALUE
(000S) | |
| INVESTMENTS IN SECURITIES 99.5% | |
| | | | | | | | | | | | |
| MUNICIPAL BONDS & NOTES 91.9% | |
| | | | | | | | | | | | |
| ARIZONA 5.4% | |
Arizona State University Revenue Bonds, Series 2012 | |
5.000% due 07/01/2025 | | $ | | | 175 | | | $ | | | 205 | |
Arizona Water Infrastructure Finance Authority Revenue Bonds, Series 2009 | |
4.250% due 10/01/2019 | | | | | 1,000 | | | | | | 1,147 | |
Arizona Water Infrastructure Finance Authority Revenue Bonds, Series 2014 | |
5.000% due 10/01/2026 | | | | | 1,250 | | | | | | 1,536 | |
Phoenix Civic Improvement Corp., Arizona Revenue Bonds, Series 2010 | |
5.000% due 07/01/2028 | | | | | 1,000 | | | | | | 1,133 | |
Salt River Project Agricultural Improvement & Power District, Arizona Revenue Bonds, Series 2012 | |
5.000% due 12/01/2030 | | | | | 1,000 | | | | | | 1,174 | |
| | | | | | | | | | | | |
| | | | | | | | | | | 5,195 | |
| | | | | | | | | | | | |
| | | | | | | | | | | | |
| ARKANSAS 0.3% | |
University of Arkansas Revenue Bonds, Series 2012 | |
5.000% due 05/01/2026 | | | | | 260 | | | | | | 305 | |
| | | | | | | | | | | | |
| |
| CALIFORNIA 8.8% | |
Bay Area Toll Authority, California Revenue Bonds, Series 2013 | |
5.000% due 04/01/2038 | | | | | 2,000 | | | | | | 2,252 | |
Bay Area Water Supply & Conservation Agency, California Revenue Bonds, Series 2013 | |
5.000% due 10/01/2026 | | | | | 1,000 | | | | | | 1,199 | |
California Health Facilities Financing Authority Revenue Bonds, Series 2008 | |
5.250% due 08/15/2022 | | | | | 500 | | | | | | 578 | |
California Health Facilities Financing Authority Revenue Bonds, Series 2013 | |
5.000% due 07/01/2043 | | | | | 1,000 | | | | | | 1,191 | |
California Statewide Communities Development Authority Revenue Bonds, Series 2012 | |
5.000% due 08/15/2023 | | | | | 100 | | | | | | 122 | |
Contra Costa Transportation Authority, California Revenue Bonds, Series 2012 | |
5.000% due 03/01/2025 | | | | | 500 | | | | | | 589 | |
East Bay Municipal Utility District Water System, California Revenue Notes, Series 2012 | |
5.000% due 06/01/2022 | | | | | 400 | | | | | | 492 | |
Los Angeles County, California Public Works Financing Authority Revenue Bonds, Series 2012 | |
5.000% due 08/01/2042 | | | | | 250 | | | | | | 277 | |
Los Angeles Department of Airports, California Revenue Bonds, Series 2012 | |
5.000% due 05/15/2029 | | | | | 500 | | | | | | 577 | |
| | | | | | | | | | | | |
| | | | | PRINCIPAL
AMOUNT
(000S) | | | | | MARKET
VALUE
(000S) | |
Los Angeles, California General Obligation Bonds, Series 2011 | |
5.000% due 09/01/2022 | | $ | | | 730 | | | $ | | | 876 | |
San Francisco Bay Area Rapid Transit District, California Revenue Bonds, Series 2010 | |
5.000% due 07/01/2024 | | | | | 200 | | | | | | 237 | |
| | | | | | | | | | | | |
| | | | | | | | | | | 8,390 | |
| | | | | | | | | | | | |
| | | | | | | | | | | | |
| COLORADO 3.4% | |
Colorado Health Facilities Authority Revenue Bonds, Series 2013 | |
5.000% due 12/01/2033 | | | | | 2,125 | | | | | | 2,362 | |
Colorado State University System Board of Governors Revenue Notes, Series 2010 | |
5.000% due 03/01/2018 | | | | | 250 | | | | | | 284 | |
Denver, Colorado City & County School District No. 1 General Obligation Bonds, Series 2012 | |
5.000% due 12/01/2026 | | | | | 500 | | | | | | 598 | |
| | | | | | | | | | | | |
| | | | | | | | | | | 3,244 | |
| | | | | | | | | | | | |
| | | | | | | | | | | | |
| CONNECTICUT 1.2% | |
Connecticut State Health & Educational Facility Authority Revenue Bonds, Series 2014 | |
5.000% due 07/01/2026 | | | | | 1,000 | | | | | | 1,174 | |
| | | | | | | | | | | | |
| |
| FLORIDA 4.7% | |
Broward County, Florida Airport System Revenue Bonds, Series 2012 | |
5.000% due 10/01/2037 | | | | | 1,300 | | | | | | 1,440 | |
Florida Municipal Power Agency Revenue Bonds, Series 2012 | |
5.000% due 10/01/2026 | | | | | 1,800 | | | | | | 2,086 | |
Florida State General Obligation Bonds, Series 2012 | |
5.000% due 07/01/2025 | | | | | 250 | | | | | | 298 | |
Miami-Dade County, Florida Water & Sewer System Revenue Bonds, Series 2013 | |
5.000% due 10/01/2028 | | | | | 555 | | | | | | 648 | |
| | | | | | | | | | | | |
| | | | | | | | | | | 4,472 | |
| | | | | | | | | | | | |
| | | | | | | | | | | | |
| GEORGIA 1.2% | |
Atlanta, Georgia Department of Aviation Revenue Bonds, Series 2012 | |
5.000% due 01/01/2042 | | | | | 1,000 | | | | | | 1,111 | |
| | | | | | | | | | | | |
| |
| GUAM 0.9% | |
Guam Government Waterworks Authority Revenue Bonds, Series 2014 | |
5.000% due 07/01/2025 | | | | | 770 | | | | | | 877 | |
| | | | | | | | | | | | |
| |
| | | | | | |
| See Accompanying Notes | | ANNUAL REPORT | | OCTOBER 31, 2014 | | 95 |
Schedule of Investments PIMCO Fixed Income SHares: Series TE (Cont.)
| | | | | | | | | | | | |
| | | | | PRINCIPAL
AMOUNT
(000S) | | | | | MARKET
VALUE
(000S) | |
| KANSAS 2.3% | |
Kansas Development Finance Authority Revenue Bonds, Series 2012 | |
5.000% due 11/15/2034 | | $ | | | 2,000 | | | $ | | | 2,239 | |
| | | | | | | | | | | | |
| |
| MASSACHUSETTS 4.8% | |
Massachusetts Bay Transportation Authority Revenue Bonds, Series 2004 | |
5.500% due 07/01/2018 | | | | | 1,150 | | | | | | 1,346 | |
Massachusetts School Building Authority Revenue Bonds, Series 2012 | |
5.000% due 08/15/2027 | | | | | 100 | | | | | | 119 | |
5.000% due 08/15/2030 | | | | | 615 | | | | | | 720 | |
Massachusetts State College Building Authority Revenue Bonds, Series 2014 | |
5.000% due 05/01/2028 | | | | | 2,000 | | | | | | 2,368 | |
| | | | | | | | | | | | |
| | | | | | | | | | | 4,553 | |
| | | | | | | | | | | | |
| | | | | | | | | | | | |
| MINNESOTA 1.2% | |
Anoka-Hennepin Independent School District No. 11, Minnesota General Obligation Bonds, Series 2008 | |
5.000% due 02/01/2019 | | | | | 1,000 | | | | | | 1,149 | |
| | | | | | | | | | | | |
| |
| MISSOURI 0.9% | |
Metropolitan St. Louis Sewer District, Missouri Revenue Bonds, Series 2012 | |
5.000% due 05/01/2023 | | | | | 750 | | | | | | 905 | |
| | | | | | | | | | | | |
| |
| NEBRASKA 0.2% | |
Omaha Public Power District, Nebraska Revenue Bonds, Series 2012 | |
5.000% due 02/01/2025 | | | | | 200 | | | | | | 236 | |
| | | | | | | | | | | | |
| |
| NEW JERSEY 4.4% | |
New Jersey Economic Development Authority Revenue Bonds, Series 2013 | |
5.000% due 03/01/2024 | | | | | 1,000 | | | | | | 1,130 | |
New Jersey Health Care Facilities Financing Authority Revenue Bonds, Series 2013 | |
5.250% due 07/01/2035 | | | | | 1,000 | | | | | | 1,149 | |
New Jersey State Turnpike Authority Revenue Bonds, Series 2013 | |
5.000% due 01/01/2031 | | | | | 1,300 | | | | | | 1,488 | |
New Jersey State Turnpike Authority Revenue Notes, Series 2012 | |
5.000% due 01/01/2021 | | | | | 175 | | | | | | 207 | |
New Jersey Transportation Trust Fund Authority Revenue Bonds, Series 2011 | |
5.500% due 06/15/2041 | | | | | 210 | | | | | | 234 | |
| | | | | | | | | | | | |
| | | | | | | | | | | 4,208 | |
| | | | | | | | | | | | |
| | | | | | | | | | | | |
| | | | | PRINCIPAL
AMOUNT
(000S) | | | | | MARKET
VALUE
(000S) | |
| NEW YORK 10.5% | |
Metropolitan Transportation Authority, New York Revenue Bonds, Series 2012 | |
5.000% due 11/15/2027 | | $ | | | 165 | | | $ | | | 190 | |
5.000% due 11/15/2028 | | | | | 1,340 | | | | | | 1,590 | |
New York City, New York General Obligation Bonds, Series 2012 | |
5.000% due 08/01/2023 | | | | | 125 | | | | | | 150 | |
New York City, New York Trust for Cultural Resources Revenue Bonds, Series 2013 | |
5.000% due 08/01/2024 | | | | | 200 | | | | | | 240 | |
5.000% due 08/01/2025 | | | | | 365 | | | | | | 434 | |
New York State Dormitory Authority Revenue Bonds, Series 2011 | |
5.000% due 03/15/2027 | | | | | 170 | | | | | | 197 | |
New York State Dormitory Authority Revenue Bonds, Series 2012 | |
5.000% due 12/15/2026 | | | | | 1,725 | | | | | | 2,054 | |
Tompkins County, New York Development Corp. Revenue Notes, Series 2013 | |
5.000% due 07/01/2020 | | | | | 1,130 | | | | | | 1,258 | |
Triborough Bridge & Tunnel Authority, New York Revenue Bonds, Series 2012 | |
5.000% due 11/15/2025 | | | | | 300 | | | | | | 358 | |
Triborough Bridge & Tunnel Authority, New York Revenue Bonds, Series 2013 | |
5.000% due 11/15/2027 | | | | | 2,000 | | | | | | 2,398 | |
5.000% due 11/15/2029 | | | | | 1,000 | | | | | | 1,172 | |
| | | | | | | | | | | | |
| | | | | | | | | | | 10,041 | |
| | | | | | | | | | | | |
| | | | | | | | | | | | |
| NORTH CAROLINA 6.4% | | | | | | | | | | | | |
Charlotte-Mecklenburg Hospital Authority, North Carolina Revenue Bonds, Series 2012 | |
5.000% due 01/15/2028 | | | | | 100 | | | | | | 114 | |
North Carolina State Revenue Bonds, Series 2011 | |
5.000% due 05/01/2026 | | | | | 100 | | | | | | 118 | |
North Carolina Turnpike Authority Revenue Bonds, Series 2011 | |
5.000% due 07/01/2024 | | | | | 1,000 | | | | | | 1,179 | |
Raleigh, North Carolina Combined Enterprise System Revenue Bonds, Series 2013 | |
5.000% due 03/01/2024 | | | | | 1,250 | | | | | | 1,527 | |
Town of Cary, North Carolina Combined Utility Systems Revenue Bonds, Series 2013 | |
5.000% due 12/01/2024 | | | | | 1,000 | | | | | | 1,219 | |
University of North Carolina at Greensboro Revenue Notes, Series 2014 | |
5.000% due 04/01/2024 | | | | | 1,660 | | | | | | 2,021 | |
| | | | | | | | | | | | |
| | | | | | | | | | | 6,178 | |
| | | | | | | | | | | | |
| | | | | | | | | | | | |
| | | | | | |
| 96 | | PIMCO MANAGED ACCOUNTS TRUST | | | | See Accompanying Notes |
October 31, 2014
| | | | | | | | | | | | |
| | | | | PRINCIPAL
AMOUNT
(000S) | | | | | MARKET
VALUE
(000S) | |
| OHIO 11.3% | | | | | | | | | | | | |
Cleveland Department of Public Utilities Division of Water, Ohio Revenue Bonds, Series 2012 | |
5.000% due 01/01/2024 | | $ | | | 900 | | | $ | | | 1,063 | |
Cuyahoga County, Ohio Certificates of Participation Bonds, Series 2014 | |
5.000% due 12/01/2026 | | | | | 4,000 | | | | | | 4,668 | |
Ohio Air Quality Development Authority Revenue Bonds, Series 2006 | |
3.750% due 12/01/2023 | | | | | 4,000 | | | | | | 4,258 | |
Ohio Higher Educational Facility Commission Revenue Notes, Series 2012 | |
5.000% due 12/01/2021 | | | | | 450 | | | | | | 541 | |
Ohio State Revenue Bonds, Series 2012 | |
5.000% due 12/15/2024 | | | | | 250 | | | | | | 295 | |
| | | | | | | | | | | | |
| | | | | | | | | | | 10,825 | |
| | | | | | | | | | | | |
| | | | | | | | | | | | |
| OKLAHOMA 0.4% | | | | | | | | | | | | |
Oklahoma Water Resources Board Revenue Bonds, Series 2011 | |
5.000% due 04/01/2022 | | | | | 300 | | | | | | 356 | |
| | | | | | | | | | | | |
| | | | | | | | | | | | |
| PENNSYLVANIA 2.5% | | | | | | | | | | | | |
Delaware River Port Authority, Pennsylvania Revenue Bonds, Series 2012 | |
5.000% due 01/01/2023 | | | | | 1,000 | | | | | | 1,151 | |
Monroeville Finance Authority, Pennsylvania Revenue Notes, Series 2012 | |
5.000% due 02/15/2022 | | | | | 100 | | | | | | 119 | |
Pennsylvania Turnpike Commission Revenue Bonds, Series 2009 | |
5.000% due 12/01/2020 | | | | | 1,000 | | | | | | 1,167 | |
| | | | | | | | | | | | |
| | | | | | | | | | | 2,437 | |
| | | | | | | | | | | | |
| | | | | | | | | | | | |
| TENNESSEE 0.4% | | | | | | | | | | | | |
Metropolitan Government of Nashville & Davidson County, Tennessee General Obligation Bonds, Series 2012 | |
5.000% due 07/01/2023 | | | | | 100 | | | | | | 121 | |
Tennessee Energy Acquisition Corp. Revenue Bonds, Series 2006 | |
5.250% due 09/01/2024 | | | | | 200 | | | | | | 235 | |
| | | | | | | | | | | | |
| | | | | | | | | | | 356 | |
| | | | | | | | | | | | |
| | | | | | | | | | | | |
| TEXAS 10.2% | | | | | | | | | | | | |
Dallas, Texas General Obligation Bonds, Series 2012 | |
5.000% due 02/15/2023 | | | | | 300 | | | | | | 360 | |
Dallas/Fort Worth International Airport, Texas Revenue Bonds, Series 2013 | |
5.000% due 11/01/2027 | | | | | 500 | | | | | | 580 | |
| | | | | | | | | | | | |
| | | | | PRINCIPAL
AMOUNT
(000S) | | | | | MARKET
VALUE
(000S) | |
Harris County, Texas General Obligation Bonds, Series 1997 | |
5.125% due 08/15/2024 | | $ | | | 1,580 | | | $ | | | 1,950 | |
Harris County, Texas General Obligation Bonds, Series 2012 | |
5.000% due 08/15/2026 | | | | | 250 | | | | | | 297 | |
La Joya Independent School District, Texas General Obligation Bonds, (PSF Insured), Series 2012 | |
5.000% due 02/15/2027 | | | | | 200 | | | | | | 236 | |
Lower Colorado River Authority, Texas Revenue Bonds, Series 2012 | |
5.000% due 05/15/2033 | | | | | 750 | | | | | | 842 | |
North Texas Tollway Authority Revenue Bonds, Series 2012 | |
5.000% due 01/01/2028 | | | | | 175 | | | | | | 196 | |
San Antonio Public Facilities Corp., Texas Revenue Bonds, Series 2012 | |
5.000% due 09/15/2025 | | | | | 250 | | | | | | 292 | |
Texas Municipal Gas Acquisition & Supply Corp. Revenue Bonds, Series 2006 | |
5.250% due 12/15/2023 | | | | | 1,000 | | | | | | 1,160 | |
Texas Municipal Gas Acquisition & Supply Corp. Revenue Bonds, Series 2008 | |
6.250% due 12/15/2026 | | | | | 3,000 | | | | | | 3,711 | |
Texas Municipal Gas Acquisition & Supply Corp. Revenue Bonds, Series 2012 | |
5.000% due 12/15/2026 | | | | | 100 | | | | | | 112 | |
| | | | | | | | | | | | |
| | | | | | | | | | | 9,736 | |
| | | | | | | | | | | | |
| | | | | | | | | | | | |
| UTAH 1.2% | | | | | | | | | | | | |
Intermountain Power Agency, Utah Revenue Bonds, Series 2013 | |
5.000% due 07/01/2023 | | | | | 1,000 | | | | | | 1,131 | |
| | | | | | | | | | | | |
| | | | | | | | | | | | |
| VIRGINIA 6.3% | | | | | | | | | | | | |
Loudoun County, Virginia General Obligation Bonds, Series 2013 | |
5.000% due 12/01/2027 | | | | | 2,315 | | | | | | 2,765 | |
Virginia College Building Authority Revenue Bonds, Series 2012 | |
5.000% due 02/01/2025 | | | | | 560 | | | | | | 664 | |
Virginia Public Building Authority Revenue Bonds, Series 2013 | |
5.000% due 08/01/2025 | | | | | 1,000 | | | | | | 1,211 | |
Virginia Public School Authority Revenue Notes, Series 2013 | |
5.000% due 08/01/2021 | | | | | 1,000 | | | | | | 1,206 | |
Virginia Resources Authority Revenue Bonds, Series 2012 | |
5.000% due 11/01/2026 | | | | | 175 | | | | | | 210 | |
| | | | | | | | | | | | |
| | | | | | | | | | | 6,056 | |
| | | | | | | | | | | | |
| | | | | | |
| See Accompanying Notes | | ANNUAL REPORT | | OCTOBER 31, 2014 | | 97 |
Schedule of Investments PIMCO Fixed Income SHares: Series TE (Cont.)
| | | | | | | | | | | | |
| | | | | PRINCIPAL
AMOUNT
(000S) | | | | | MARKET
VALUE
(000S) | |
| WASHINGTON 1.8% | | | | | | | | | | | | |
Central Puget Sound Regional Transit Authority, Washington Revenue Bonds, Series 2012 | |
5.000% due 02/01/2024 | | $ | | | 1,250 | | | $ | | | 1,499 | |
Washington State General Obligation Bonds, Series 2008 | |
5.000% due 01/01/2028 | | | | | 200 | | | | | | 227 | |
| | | | | | | | | | | | |
| | | | | | | | | | | 1,726 | |
| | | | | | | | | | | | |
| | | | | | | | | | | | |
| WISCONSIN 1.2% | | | | | | | | | | | | |
WPPI Energy, Wisconsin Revenue Bonds, Series 2013 | |
5.000% due 07/01/2025 | | | | | 1,000 | | | | | | 1,181 | |
| | | | | | | | | | | | |
Total Municipal Bonds & Notes (Cost $85,071) | | | | | | 88,081 | |
| | | | | | | | | | | | |
| | | | | | | | | | | | |
| SHORT-TERM INSTRUMENTS 7.6% | |
| | | | | | | | | | | | |
REPURCHASE AGREEMENTS (b) 1.4% | |
| | | | | | | | | | | 1,300 | |
| | | | | | | | | | | | |
| | | | | | | | | | | | |
| SHORT-TERM NOTES 4.1% | | | | | | | | | | | | |
Fannie Mae | |
0.107% due 03/16/2015 | | | | | 1,200 | | | | | | 1,200 | |
| | | | | | | | | | | | |
| | | | | PRINCIPAL
AMOUNT
(000S) | | | | | MARKET
VALUE
(000S) | |
Federal Home Loan Bank | |
0.091% due 03/13/2015 | | $ | | | 2,800 | | | $ | | | 2,799 | |
| | | | | | | | | | | | |
| | | | | | | | | | | 3,999 | |
| | | | | | | | | | | | |
| | | | | | | | | | | | |
| U.S. TREASURY BILLS 2.1% | | | | | | | | | | | | |
0.028% due 11/06/2014 - 04/23/2015 (a) | | | | | 2,005 | | | | | | 2,005 | |
| | | | | | | | | | | | |
Total Short-Term Instruments
(Cost $7,304) | | | 7,304 | |
| | | | | | | | | | | | |
| |
Total Investments in Securities
(Cost $92,375) | | | 95,385 | |
| | | | | | | | | | | | |
| |
Total Investments 99.5%
(Cost $92,375) | | | $ | | | 95,385 | |
| |
Financial Derivative
Instruments (c)(d) 0.1% (Cost or Premiums, net $0) | | | 112 | |
| |
| Other Assets and Liabilities, net 0.4% | | | 344 | |
| | | | | | | | | | | | |
| Net Assets 100.0% | | | | | | | | $ | | | 95,841 | |
| | | | | | | | | | | | |
NOTES TO SCHEDULE OF INVESTMENTS (AMOUNTS IN THOUSANDS*, EXCEPT NUMBER OF CONTRACTS):
| * | A zero balance may reflect actual amounts rounding to less than one thousand. |
| (a) | Coupon represents a weighted average yield to maturity. |
BORROWINGS AND OTHER FINANCING TRANSACTIONS
(b) REPURCHASE AGREEMENTS:
| | | | | | | | | | | | | | | | | | | | | | | | | | | | |
| Counterparty | | Lending
Rate | | Settlement
Date | | | Maturity
Date | | | Principal
Amount | | | Collateralized By | | Collateral
Received,
at Value | | | Repurchase
Agreements,
at Value | | | Repurchase
Agreement
Proceeds
to be
Received (1) | |
GSC | | 0.150% | | | 10/31/2014 | | | | 11/03/2014 | | | $ | 1,300 | | | Freddie Mac 3.500% due 09/01/2042 | | $ | (1,338 | ) | | $ | 1,300 | | | $ | 1,300 | |
| | | | | | | | | | | | | | | | | | | | | | | | | | | | |
Total Repurchase Agreements | | | | | $ | (1,338 | ) | | $ | 1,300 | | | $ | 1,300 | |
| | | | | | | | | | | | | | | | | | | | | | | | | | | | |
| (1) | Includes accrued interest. |
| | | | | | |
| 98 | | PIMCO MANAGED ACCOUNTS TRUST | | | | See Accompanying Notes |
October 31, 2014
BORROWINGS AND OTHER FINANCING TRANSACTIONS SUMMARY
The following is a summary by counterparty of the market value of Borrowings and Other Financing Transactions and collateral (received) as of October 31, 2014:
| | | | | | | | | | | | | | | | | | | | | | | | | | | | |
| Counterparty | | Repurchase
Agreement
Proceeds
to be
Received | | | Payable for
Reverse
Repurchase
Agreements | | | Payable for
Sale-Buyback
Transactions | | | Payable for
Short Sales | | | Total
Borrowings and
Other Financing
Transactions | | | Collateral
(Received) | | | Net
Exposure (2) | |
Global/Master Repurchase Agreement | | | | | | | | | | | | | | | | | | | | | | | | | | | | |
GSC | | $ | 1,300 | | | $ | 0 | | | $ | 0 | | | $ | 0 | | | $ | 1,300 | | | $ | (1,338 | ) | | $ | | (38) |
| | | | | | | | | | | | | | | | | | | | | | | | | | | | |
Total Borrowings and Other Financing Transactions | | $ | 1,300 | | | $ | 0 | | | $ | 0 | | | $ | 0 | | | | | | | | | | | | | |
| | | | | | | | | | | | | | | | | | | | | | | | | | | | |
| (2) | Net Exposure represents the net receivable/(payable) that would be due from/to the counterparty in the event of default. Exposure from borrowings and other financing transactions can only be netted across transactions governed under the same master agreement with the same legal entity. See Note 7, Principal Risks, in the Notes to Financial Statements for more information regarding master netting arrangements. |
(c) FINANCIAL DERIVATIVE INSTRUMENTS: EXCHANGE-TRADED OR CENTRALLY CLEARED
FUTURES CONTRACTS:
| | | | | | | | | | | | | | | | | | | | | | |
| Description | | Type | | Expiration
Month | | | # of
Contracts | | | Unrealized
(Depreciation) | | | Variation Margin | |
| | | | | | Asset | | | Liability | |
U.S. Treasury 30-Year Bond December Futures | | Short | | | 12/2014 | | | | 140 | | | $ | (293 | ) | | $ | 66 | | | $ | 0 | |
| | | | | | | | | | | | | | | | | | | | | | |
Total Futures Contracts | | | | | | | $ | (293 | ) | | $ | 66 | | | $ | 0 | |
| | | | | | | | | | | | | | | | | | | | | | |
SWAP AGREEMENTS:
INTEREST RATE SWAPS
| | | | | | | | | | | | | | | | | | | | | | | | | | | | | | |
Pay/Receive
Floating Rate | | Floating Rate Index | | Fixed Rate | | | Maturity
Date | | | Notional
Amount | | | Market
Value | | | Unrealized
(Depreciation) | | | Variation Margin | |
| | | | | | | | Asset | | | Liability | |
Receive | | 3-Month USD-LIBOR | | | 3.500% | | | | 12/18/2043 | | | $ | 8,000 | | | $ | (843 | ) | | $ | (1,235 | ) | | $ | 46 | | | $ | 0 | |
| | | | | | | | | | | | | | | | | | | | | | | | | | | | | | |
Total Swap Agreements | | | $ | (843 | ) | | $ | (1,235 | ) | | $ | 46 | | | $ | 0 | |
| | | | | | | | | | | | | | | | | | | | | | | | | | | | | | |
FINANCIAL DERIVATIVE INSTRUMENTS: EXCHANGE-TRADED OR CENTRALLY CLEARED SUMMARY
The following is a summary of the market value and variation margin of Exchange-Traded or Centrally Cleared Financial Derivative Instruments as of October 31, 2014:
| (d) | Securities with an aggregate market value of $905 and cash of $76 have been pledged as collateral for exchange-traded and centrally cleared financial derivative instruments as of October 31, 2014. See Note 7, Principal Risks, in the Notes to Financial Statements for more information regarding master netting arrangements. |
| | | | | | | | | | | | | | | | | | |
| | | Financial Derivative Assets | | | | Financial Derivative Liabilities |
| | | Market Value | | Variation Margin
Asset | | Total | | | | Market Value | | Variation Margin
Liability | | Total |
| | | Purchased
Options | | Futures | | Swap
Agreements | | | | | Written
Options | | Futures | | Swap
Agreements | |
Total Exchange-Traded or Centrally Cleared | | $ 0 | | $ 66 | | $ 46 | | $ 112 | | | | $ 0 | | $ 0 | | $ 0 | | $ 0 |
| | | | | | | | | | | | | | | | | | |
| | | | | | |
| See Accompanying Notes | | ANNUAL REPORT | | OCTOBER 31, 2014 | | 99 |
Schedule of Investments PIMCO Fixed Income SHares: Series TE (Cont.)
FAIR VALUE OF FINANCIAL DERIVATIVE INSTRUMENTS
The following is a summary of the fair valuation of the Portfolio’s derivative instruments categorized by risk exposure. See Note 7, Principal Risks, in the Notes to Financial Statements on risks of the Portfolio.
Fair Values of Financial Derivative Instruments on the Statements of Assets and Liabilities as of October 31, 2014:
| | | | | | | | | | | | | | | | | | | | | | | | |
| | | Derivatives not accounted for as hedging instruments | |
| | | Commodity
Contracts | | | Credit
Contracts | | | Equity
Contracts | | | Foreign
Exchange
Contracts | | | Interest
Rate Contracts | | | Total | |
Financial Derivative Instruments - Assets | | | | | | | | | | | | | | | | | | | | | | | | |
Exchange-traded or centrally cleared | | | | | | | | | | | | | | | | | | | | | | | | |
Futures | | $ | 0 | | | $ | 0 | | | $ | 0 | | | $ | 0 | | | $ | 66 | | | $ | 66 | |
Swap Agreements | | | 0 | | | | 0 | | | | 0 | | | | 0 | | | | 46 | | | | 46 | |
| | | | | | | | | | | | | | | | | | | | | | | | |
| | $ | 0 | | | $ | 0 | | | $ | 0 | | | $ | 0 | | | $ | 112 | | | $ | 112 | |
| | | | | | | | | | | | | | | | | | | | | | | | |
The Effect of Financial Derivative Instruments on the Statements of Operations for the Period Ended October 31, 2014:
| | | | | | | | | | | | | | | | | | | | | | | | |
| | | Derivatives not accounted for as hedging instruments | |
| | | Commodity
Contracts | | | Credit
Contracts | | | Equity
Contracts | | | Foreign
Exchange
Contracts | | | Interest
Rate Contracts | | | Total | |
Net Realized (Loss) on Financial Derivative Instruments | | | | | | | | | | | | | | | | | | | | | | | | |
Exchange-traded or centrally cleared | | | | | | | | | | | | | | | | | | | | | | | | |
Futures | | $ | 0 | | | $ | 0 | | | $ | 0 | | | $ | 0 | | | $ | (899 | ) | | $ | (899 | ) |
Swap Agreements | | | 0 | | | | 0 | | | | 0 | | | | 0 | | | | (130 | ) | | | (130 | ) |
| | | | | | | | | | | | | | | | | | | | | | | | |
| | $ | 0 | | | $ | 0 | | | $ | 0 | | | $ | 0 | | | $ | (1,029 | ) | | $ | (1,029 | ) |
| | | | | | | | | | | | | | | | | | | | | | | | |
| | | | | | |
Net Change in Unrealized (Depreciation) on Financial Derivative Instruments | | | | | | | | | | | | | | | | | | | | | | | | |
Exchange-traded or centrally cleared | | | | | | | | | | | | | | | | | | | | | | | | |
Futures | | $ | 0 | | | $ | 0 | | | $ | 0 | | | $ | 0 | | | $ | (293 | ) | | $ | (293 | ) |
Swap Agreements | | | 0 | | | | 0 | | | | 0 | | | | 0 | | | | (1,235 | ) | | | (1,235 | ) |
| | | | | | | | | | | | | | | | | | | | | | | | |
| | $ | 0 | | | $ | 0 | | | $ | 0 | | | $ | 0 | | | $ | (1,528 | ) | | $ | (1,528 | ) |
| | | | | | | | | | | | | | | | | | | | | | | | |
FAIR VALUE MEASUREMENTS
The following is a summary of the fair valuations according to the inputs used as of October 31, 2014 in valuing the Portfolio’s assets and liabilities:
| | | | | | | | | | | | | | | | |
| Category and Subcategory | | Level 1 | | | Level 2 | | | Level 3 | | | Fair
Value at
10/31/2014 | |
Investments in Securities, at Value | | | | | | | | | |
Municipal Bonds & Notes | | | | | | | | | | | | | | | | |
Arizona | | $ | 0 | | | $ | 5,195 | | | $ | 0 | | | $ | 5,195 | |
Arkansas | | | 0 | | | | 305 | | | | 0 | | | | 305 | |
California | | | 0 | | | | 8,390 | | | | 0 | | | | 8,390 | |
Colorado | | | 0 | | | | 3,244 | | | | 0 | | | | 3,244 | |
Connecticut | | | 0 | | | | 1,174 | | | | 0 | | | | 1,174 | |
Florida | | | 0 | | | | 4,472 | | | | 0 | | | | 4,472 | |
Georgia | | | 0 | | | | 1,111 | | | | 0 | | | | 1,111 | |
Guam | | | 0 | | | | 877 | | | | 0 | | | | 877 | |
Kansas | | | 0 | | | | 2,239 | | | | 0 | | | | 2,239 | |
Massachusetts | | | 0 | | | | 4,553 | | | | 0 | | | | 4,553 | |
| | | | | | |
| 100 | | PIMCO MANAGED ACCOUNTS TRUST | | | | See Accompanying Notes |
October 31, 2014
| | | | | | | | | | | | | | | | |
| Category and Subcategory | | Level 1 | | | Level 2 | | | Level 3 | | | Fair
Value at
10/31/2014 | |
Minnesota | | $ | 0 | | | $ | 1,149 | | | $ | 0 | | | $ | 1,149 | |
Missouri | | | 0 | | | | 905 | | | | 0 | | | | 905 | |
Nebraska | | | 0 | | | | 236 | | | | 0 | | | | 236 | |
New Jersey | | | 0 | | | | 4,208 | | | | 0 | | | | 4,208 | |
New York | | | 0 | | | | 10,041 | | | | 0 | | | | 10,041 | |
North Carolina | | | 0 | | | | 6,178 | | | | 0 | | | | 6,178 | |
Ohio | | | 0 | | | | 10,825 | | | | 0 | | | | 10,825 | |
Oklahoma | | | 0 | | | | 356 | | | | 0 | | | | 356 | |
Pennsylvania | | | 0 | | | | 2,437 | | | | 0 | | | | 2,437 | |
Tennessee | | | 0 | | | | 356 | | | | 0 | | | | 356 | |
Texas | | | 0 | | | | 9,736 | | | | 0 | | | | 9,736 | |
Utah | | | 0 | | | | 1,131 | | | | 0 | | | | 1,131 | |
Virginia | | | 0 | | | | 6,056 | | | | 0 | | | | 6,056 | |
Washington | | | 0 | | | | 1,726 | | | | 0 | | | | 1,726 | |
Wisconsin | | | 0 | | | | 1,181 | | | | 0 | | | | 1,181 | |
Short-Term Instruments | | | | | | | | | | | | | | | | |
Repurchase Agreements | | | 0 | | | | 1,300 | | | | 0 | | | | 1,300 | |
Short-Term Notes | | | 0 | | | | 3,999 | | | | 0 | | | | 3,999 | |
U.S. Treasury Bills | | | 0 | | | | 2,005 | | | | 0 | | | | 2,005 | |
| | | | |
Total Investments | | $ | 0 | | | $ | 95,385 | | | $ | 0 | | | $ | 95,385 | |
| | | | |
Financial Derivative Instruments - Assets | | | | | | | | | | | | | | | | |
Exchange-traded or centrally cleared | | $ | 66 | | | $ | 46 | | | $ | 0 | | | $ | 112 | |
| | | | |
Totals | | $ | 66 | | | $ | 95,431 | | | $ | 0 | | | $ | 95,497 | |
There were no significant transfers between Level 1, 2, and 3 during the period ended October 31, 2014.
| | | | | | |
| See Accompanying Notes | | ANNUAL REPORT | | OCTOBER 31, 2014 | | 101 |
Notes to Financial Statements
1. ORGANIZATION
PIMCO Managed Accounts Trust (the “Trust”), formerly known as AllianzGI Managed Accounts Trust, was organized as a Massachusetts business trust on November 3, 1999. The Trust is comprised of Fixed Income SHares: Series C, Series LD, Series M, Series R and Series TE (each a “Portfolio” or “Series” and collectively the “Portfolios”). Each Portfolio has authorized an unlimited amount of shares of beneficial interest with $0.001 par value. Pacific Investment Management Company LLC (“PIMCO” or the “Manager”) serves as the Portfolios’ investment manager.
Prior to the close of business on September 5, 2014, Allianz Global Investors Fund Management LLC (“AGIFM”) and PIMCO served as the Trust’s investment manager and sub-adviser, respectively. Effective at the close of business on September 5, 2014, each Portfolio entered into a new investment management agreement (the “Agreement”) with PIMCO, pursuant to which PIMCO replaced AGIFM as the investment manager to the Portfolios. Under the Agreement, PIMCO continues to provide the day-to-day portfolio management services it provided to each Portfolio as its sub-adviser and also assumed responsibility for providing the supervisory and administrative services previously provided by AGIFM to each Portfolio as its investment manager. PIMCO personnel have replaced AGIFM personnel as Porfolio officers and in other roles to provide and oversee the administrative, accounting/financial reporting, compliance, legal, marketing, transfer agency, shareholder servicing and other services required for the daily operations of each Portfolio. Please see “Fees and Expenses” below for additional information.
2. SIGNIFICANT ACCOUNTING POLICIES
The following is a summary of significant accounting policies consistently followed by the Trust in the preparation of its financial statements in conformity with accounting principles generally accepted in the United States of America (“U.S. GAAP”). The preparation of financial statements in accordance with U.S. GAAP requires management to make estimates and assumptions that affect the reported amounts of assets and liabilities and disclosure of contingent assets and liabilities at the date of the financial statements and the reported amounts of increases and decreases in net assets from operations during the reporting period. Actual results could differ from those estimates.
(a) Securities Transactions and Investment Income Securities transactions are recorded as of the trade date for financial reporting purposes. Securities purchased or sold on a when-issued or delayed-delivery basis may be settled 15 days or more after the trade date. Realized gains and losses from securities sold are recorded on the identified cost basis. Dividend income is recorded on the ex-dividend date, except certain dividends from foreign securities where the ex-dividend date may have passed, which are recorded as soon as a Portfolio is informed of the ex-dividend date. Interest income, adjusted for the accretion of discounts and amortization of premiums, is recorded on the accrual basis from settlement date. For convertible securities, premiums attributable to the conversion feature are not amortized. Estimated tax liabilities on certain foreign securities are recorded on an accrual basis and are reflected as components of interest income or net change in unrealized gain/loss on investments on the Statements of Operations, as appropriate. Tax liabilities realized as a result of such security sales are reflected as a component of net realized gain/loss on investments on the Statements of Operations. Paydown gains and losses on mortgage-related and other asset-backed securities are recorded as components of interest income on the Statements of Operations.
| | | | | | |
| 102 | | PIMCO MANAGED ACCOUNTS TRUST | | | | |
October 31, 2014
Debt obligations may be placed on non-accrual status and related interest income may be reduced by ceasing current accruals and writing off interest receivable when the collection of all or a portion of interest has become doubtful based on consistently applied procedures. A debt obligation is removed from non-accrual status when the issuer resumes interest payments or when collectability of interest is probable.
(b) Cash and Foreign Currency The functional and reporting currency for the Portfolios is the U.S. dollar. The market values of foreign securities, currency holdings and other assets and liabilities are translated into U.S. dollars based on the current exchange rates each business day. Purchases and sales of securities and income and expense items denominated in foreign currencies are translated into U.S. dollars at the exchange rate in effect on the transaction date. The Portfolios do not separately report the effects of changes in foreign exchange rates from changes in market prices on securities held. Such changes are included in net realized and net changes in unrealized gain or loss from investments on the Statements of Operations. Certain Portfolios may invest in foreign currency-denominated securities and may engage in foreign currency transactions either on a spot (cash) basis at the rate prevailing in the currency exchange market at the time or through a forward foreign currency contract (see financial derivative instruments). Realized foreign exchange gains or losses arising from sales of spot foreign currencies, currency gains or losses realized between the trade and settlement dates on securities transactions and the difference between the recorded amounts of dividends, interest, and foreign withholding taxes and the U.S. dollar equivalent of the amounts actually received or paid are included in net realized gain or loss on foreign currency transactions on the Statements of Operations. Net unrealized foreign exchange gains and losses arising from changes in foreign exchange rates on foreign denominated assets and liabilities other than investments in securities held at the end of the reporting period are included in net change in unrealized appreciation or depreciation on foreign currency assets and liabilities on the Statements of Operations.
(c) Dividends and Distributions to Shareholders Each Portfolio distributes substantially all of its net investment income to shareholders in the form of dividends. Dividends are declared daily and paid monthly on the last business day of the month. Net realized capital gains earned by each Portfolio, if any, will be distributed no less frequently than once each year. A Portfolio may engage in investment strategies, including the use of derivatives, to, among other things, generate current, distributable income without regard to possible declines in the Portfolio’s net asset value. A Portfolio’s income and gain-generating strategies, including certain derivatives strategies, may generate current income for monthly distributions even in situations when the Portfolio has experienced a decline in net assets, including losses due to adverse changes in securities markets or the Portfolio’s portfolio of investments, including derivatives. Consequently, shareholders may receive distributions and owe tax at a time when their investment in a Portfolio has declined in value, which tax may be at ordinary income rates. Also, the tax treatment of certain derivatives may be open to different interpretations. Any recharacterization of payments made or received by a Portfolio pursuant to derivatives potentially could affect the amount, timing or character of Portfolio distributions. In addition, the tax treatment of such investment strategies may be changed by regulation or otherwise.
Income distributions and capital gain distributions are determined in accordance with income tax regulations which may differ from U.S. GAAP. Differences between tax regulations and U.S. GAAP may cause timing differences between income and capital gain recognition. Examples of events that give rise to timing differences include wash sales, straddles and capital loss carryforwards. Further,
| | | | | | |
| | ANNUAL REPORT | | OCTOBER 31, 2014 | | 103 |
Notes to Financial Statements (Cont.)
the character of investment income and capital gains may be different for certain transactions under the two methods of accounting. Examples of characterization differences include the treatment of paydowns on mortgage-backed securities, swaps, foreign currency transactions and contingent debt instruments. As a result, income distribution and capital gain distributions declared during a fiscal period may differ significantly from the net investment income (loss) and realized gains (losses) reported on each Portfolio’s annual financial statements presented under U.S. GAAP.
Distributions classified as a tax basis return of capital, if any, are reflected on the accompanying Statements of Changes in Net Assets and have been recorded to paid in capital. In addition, other amounts have been reclassified between undistributed net investment income, accumulated undistributed net realized gains or losses and/or paid in capital to more appropriately conform financial accounting to tax characterizations of dividend distributions.
(d) Statements of Cash Flows U.S. GAAP requires entities providing financial statements that report both financial position and results of operations to also provide a statement of cash flows for each period for which results of operations are provided, but exempts investment companies meeting certain conditions. One of the conditions is that substantially all of the enterprise’s investments were carried at fair value during the period and classified as Level 1 or Level 2 in the fair value hierarchy in accordance with the requirements of U.S. GAAP. Another condition is that the enterprise had little or no debt, based on the average debt outstanding during the period, in relation to average total assets. Portfolios with certain degrees of borrowing activity, typically through the use of reverse repurchase agreements, sale-buyback transactions or short sale transactions, have been determined to be at a level requiring a Statement of Cash Flows. Statements of Cash Flows, as applicable, have been prepared using the indirect method which requires net change in net assets resulting from operations to be adjusted to reconcile to net cash flows from operating activities.
(e) New Accounting Pronouncements In June 2013, the Financial Accounting Standards Board (“FASB”) issued an Accounting Standards Update (“ASU”) providing updated guidance for assessing whether an entity is an investment company and for the measurement of noncontrolling ownership interests in other investment companies. This update became effective for interim or annual periods beginning on or after December 15, 2013. In accordance with investment company reporting requirements under U.S. GAAP, the Trust adopted the ASU for the fiscal year ended October 31, 2014. The ASU did not have an impact on the Portfolios’ financial statements.
In June 2014, the FASB issued an ASU that expands secured borrowing accounting for certain repurchase agreements. The ASU also sets forth additional disclosure requirements for certain transactions accounted for as sales in order to provide financial statement users with information to compare to similar transactions accounted for as secured borrowings. The ASU is effective prospectively during interim or annual periods beginning after December 15, 2014. At this time, management is evaluating the implications of these changes on the financial statements.
3. INVESTMENT VALUATION AND FAIR VALUE MEASUREMENTS
(a) Investment Valuation Policies The Net Asset Value (“NAV”) of a Portfolio’s shares is valued as of the close of regular trading (normally 4:00 p.m., Eastern time) (the “NYSE Close”) on each day that the New York Stock Exchange (“NYSE”) is open (each a “Business Day”). Information that becomes
| | | | | | |
| 104 | | PIMCO MANAGED ACCOUNTS TRUST | | | | |
October 31, 2014
known to a Portfolio or its agents after the NAV has been calculated on a particular day will not generally be used to retroactively adjust the price of a security or the NAV determined earlier that day.
For purposes of calculating the NAV, portfolio securities and other financial derivative instruments are valued on each Business Day using valuation methods as adopted by the Board of Trustees (the “Board”) of the Trust. The Board has formed a Valuation Committee whose function is to monitor the valuation of portfolio securities and other financial derivative instruments and, as required by the Trust’s valuation policies, determine in good faith the fair value of portfolio holdings after consideration of all relevant factors, including recommendations provided by the Manager. The Board has delegated responsibility for applying the valuation methods to the Manager. The Manager monitors the continual appropriateness of methods applied and determines if adjustments should be made in light of market factor changes and events affecting issuers.
Where market quotes are readily available, fair market value is generally determined on the basis of official closing prices or the last reported sales prices, or if no sales are reported, based on quotes obtained from a quotation reporting system, established market makers, or pricing services. Where market quotes are not readily available, portfolio securities and other financial derivative instruments are valued at fair value, as determined in good faith by the Board, its Valuation Committee, or the Manager pursuant to instructions from the Board or its Valuation Committee. Market quotes are considered not readily available in circumstances where there is an absence of current or reliable market-based data (e.g., trade information, bid/ask information, or broker quotes), including where events occur after the close of the relevant market, but prior to the NYSE Close, that materially affect the values of a Portfolio’s securities or financial derivative instruments. In addition, market quotes are considered not readily available when, due to extraordinary circumstances, the exchanges or markets on which securities trade do not open for trading for the entire day and no other market prices are available. The Board has delegated to the Manager, PIMCO, the responsibility for monitoring significant events that may materially affect the values of a Portfolio’s securities or financial derivative instruments and for determining whether the value of the applicable securities or financial derivative instruments should be re-evaluated in light of such significant events.
The Board has adopted methods for valuing securities and other financial derivative instruments that may require fair valuation under particular circumstances. PIMCO monitors the continual appropriateness of fair valuation methods applied and determines if adjustments should be made in light of market changes, events affecting the issuer, or other factors. If the Manager determines that a fair valuation method may no longer be appropriate, another valuation method may be selected, or the Valuation Committee will take any appropriate action in accordance with procedures set forth by the Board. The Board reviews the appropriateness of the valuation methods from time to time and these methods may be amended or supplemented from time to time by the Valuation Committee.
In circumstances in which daily market quotes are not readily available, investments may be valued pursuant to guidelines established by the Board. In the event that the security or asset cannot be valued pursuant to the established guidelines, the value of the security or other financial derivative instrument will be determined in good faith by the Valuation Committee of the Board, generally based upon recommendations provided by PIMCO. These methods may require subjective determinations about the value of a security. While the Trust’s policy is intended to result in a calculation of a Portfolio’s NAV that fairly reflects security values as of the time of pricing, the Trust
| | | | | | |
| | ANNUAL REPORT | | OCTOBER 31, 2014 | | 105 |
Notes to Financial Statements (Cont.)
cannot guarantee that values determined by the Board or persons acting at their direction would accurately reflect the price that a Portfolio could obtain for a security if it were to dispose of that security as of the time of pricing (for instance, in a forced or distressed sale). The prices used by a Portfolio may differ from the value that would be realized if the securities were sold.
(b) Fair Value Hierarchy U.S. GAAP describes fair market value as the price that a Portfolio would receive to sell an asset or pay to transfer a liability in an orderly transaction between market participants at the measurement date. It establishes a fair value hierarchy that prioritizes inputs to valuation methods and requires disclosure of the fair value hierarchy, separately for each major category of assets and liabilities, that segregates fair value measurements into levels (Level 1, 2, and 3). The inputs or methodology used for valuing securities are not necessarily an indication of the risk associated with investing in those securities. Levels 1, 2, and 3 of the fair value hierarchy are defined as follows:
| n | | Level 1 — Inputs using (unadjusted) quoted prices in active markets or exchanges for identical assets and liabilities. |
| n | | Level 2 — Significant other observable inputs, which may include, but are not limited to, quoted prices for similar assets or liabilities in markets that are active, quoted prices for identical or similar assets or liabilities in markets that are not active, inputs other than quoted prices that are observable for the assets or liabilities (such as interest rates, yield curves, volatilities, prepayment speeds, loss severities, credit risks and default rates) or other market corroborated inputs. |
| n | | Level 3 — Significant unobservable inputs based on the best information available in the circumstances, to the extent observable inputs are not available, which may include assumptions made by the Board or persons acting at their direction that are used in determining the fair value of investments. |
Assets or liabilities categorized as Level 2 or 3 as of period end have been transferred between Levels 2 and 3 since the prior period due to changes in the valuation method utilized in valuing the investments. Transfers from Level 2 to Level 3 are a result of a change, in the normal course of business, from the use of valuation methods used by third-party pricing services (Level 2) to the use of a broker quote or valuation technique which utilizes significant unobservable inputs due to an absence of current or reliable market-based data (Level 3). Transfers from Level 3 to Level 2 are a result of the availability of current and reliable market-based data provided by third-party pricing services or other valuation techniques which utilize significant observable inputs. In accordance with the requirements of U.S. GAAP, the amounts of transfers between Levels 1 and 2 and transfers in and out of Level 3, if material, are disclosed in the Notes to Schedule of Investments for each respective Portfolio.
For fair valuations using significant unobservable inputs, U.S. GAAP requires a reconciliation of the beginning to ending balances for reported fair values that presents changes attributable to total realized and unrealized gains or losses, purchases and sales, and transfers in or out of the Level 3 category during the period. The end of period timing recognition is used for the transfers between Levels of the Portfolio’s assets and liabilities. Additionally, U.S. GAAP requires quantitative information regarding the significant unobservable inputs used in the determination of fair value of assets or liabilities categorized as Level 3 in the fair value hierarchy. In accordance with the requirements of U.S. GAAP, a fair value hierarchy, and if material, a Level 3 reconciliation and details of significant unobservable inputs, have been included in the Notes to Schedule of Investments for each Series.
| | | | | | |
| 106 | | PIMCO MANAGED ACCOUNTS TRUST | | | | |
October 31, 2014
(c) Valuation Techniques and the Fair Value Hierarchy
Level 1 and Level 2 trading assets and trading liabilities, at fair market value The valuation methods (or “techniques”) and significant inputs used in determining the fair market values of portfolio securities or financial derivative instruments categorized as Level 1 and Level 2 of the fair value hierarchy are as follows:
Fixed income securities including corporate, convertible and municipal bonds and notes, U.S. government agencies, U.S. treasury obligations, sovereign issues, bank loans, convertible preferred securities and non-U.S. bonds are normally valued by pricing service providers that use broker-dealer quotations, reported trades or valuation estimates from their internal pricing models. The service providers’ internal models use inputs that are observable such as issuer details, interest rates, yield curves, prepayment speeds, credit risks/spreads, default rates and quoted prices for similar assets. Securities that use similar valuation techniques and inputs as described above are categorized as Level 2 of the fair value hierarchy.
Fixed income securities purchased on a delayed-delivery basis or as a repurchase commitment in a sale-buyback transaction are marked to market daily until settlement at the forward settlement date and are categorized as Level 2 of the fair value hierarchy.
Mortgage-related and asset-backed securities are usually issued as separate tranches, or classes, of securities within each deal. These securities are also normally valued by pricing service providers that use broker-dealer quotations or valuation estimates from their internal pricing models. The pricing models for these securities usually consider tranche-level attributes, current market data, estimated cash flows and market-based yield spreads for each tranche, and incorporate deal collateral performance, as available. Mortgage-related and asset-backed securities that use similar valuation techniques and inputs as described above are categorized as Level 2 of the fair value hierarchy.
Common stocks, exchange-traded funds, exchange-traded notes and financial derivative instruments, such as futures contracts, commodity options and options on futures that are traded on a national securities exchange, are stated at the last reported sale or settlement price on the day of valuation. To the extent these securities are actively traded and valuation adjustments are not applied, they are categorized as Level 1 of the fair value hierarchy.
Investments initially valued in currencies other than the U.S. dollar are converted to the U.S. dollar using exchange rates obtained from pricing service providers. As a result, the NAV of a Portfolio’s shares may be affected by changes in the value of currencies in relation to the U.S. dollar. The value of securities traded in markets outside the United States or denominated in currencies other than the U.S. dollar may be affected significantly on a day that the NYSE is closed. Valuation adjustments may be applied to certain securities that are solely traded on a foreign exchange to account for the market movement between the close of the foreign market and the NYSE Close. These securities are valued using pricing service providers that consider the correlation of the trading patterns of the foreign security to the intraday trading in the U.S. markets for investments. Securities using these valuation adjustments are categorized as Level 2 of the fair value hierarchy. Preferred securities and other equities traded on inactive markets or valued by reference to similar instruments are also categorized as Level 2 of the fair value hierarchy.
| | | | | | |
| | ANNUAL REPORT | | OCTOBER 31, 2014 | | 107 |
Notes to Financial Statements (Cont.)
Equity-linked securities are valued by referencing the last reported sale or settlement price of the linked referenced equity on the day of valuation. Foreign exchange adjustments are applied to the last reported price to convert the linked equity’s trading currency to the contract’s settling currency. These investments are categorized as Level 2 of the fair value hierarchy.
Short-term investments having a maturity of 60 days or less and repurchase agreements are generally valued at amortized cost which approximates fair market value. These investments are categorized as Level 2 of the fair value hierarchy.
Equity exchange-traded options and over the counter financial derivative instruments, such as foreign currency contracts, options contracts, or swap agreements, derive their value from underlying asset prices, indices, reference rates, and other inputs or a combination of these factors. These contracts are normally valued by independent pricing service providers. Depending on the product and the terms of the transaction, financial derivative instruments can be valued by a pricing service provider using a series of techniques, including simulation pricing models. The pricing models use inputs that are observed from actively quoted markets such as quoted prices, issuer details, indices, bid/ask spreads, interest rates, implied volatilities, yield curves, dividends and exchange rates. Financial derivative instruments that use similar valuation techniques and inputs as described above are categorized as Level 2 of the fair value hierarchy.
Centrally cleared swaps listed or traded on a multilateral or trade facility platform, such as a registered exchange, are valued at the daily settlement price determined by the respective exchange. For centrally cleared credit default swaps the clearing facility requires its members to provide actionable price levels across complete term structures. These levels along with external third-party prices are used to produce daily settlement prices. These securities are categorized as Level 2 of the fair value hierarchy. Centrally cleared interest rate swaps are valued using a pricing model that references the underlying rates including the overnight index swap rate and London Interbank Offered Rate (“LIBOR”) forward rate to produce the daily settlement price. These securities are categorized as Level 2 of the fair value hierarchy.
Level 3 trading assets and trading liabilities, at fair value When a fair valuation method is applied by PIMCO that uses significant unobservable inputs, securities will be priced by a method that the Board or persons acting at their direction believe reflects fair value and are categorized as Level 3 of the fair value hierarchy. The valuation techniques and significant inputs used in determining the fair values of portfolio assets and liabilities categorized as Level 3 of the fair value hierarchy are as follows:
Benchmark pricing procedures set the base price of a fixed income security and subsequently adjust the price proportionally to market value changes of a pre-determined security deemed to be comparable in duration, generally a U.S. Treasury or sovereign note based on country of issuance. The base price may be a broker-dealer quote, transaction price, or an internal value as derived by analysis of market data. The base price of the security may be reset on a periodic basis based on the availability of market data and procedures approved by the Valuation Committee. Significant changes in the unobservable inputs of the benchmark pricing process (the base price) would result in direct and proportional changes in the fair value of the security. These securities are categorized as Level 3 of the fair value hierarchy. The validity of the fair value is reviewed by PIMCO on a periodic basis and may be amended as the availability of market data indicates a material change.
| | | | | | |
| 108 | | PIMCO MANAGED ACCOUNTS TRUST | | | | |
October 31, 2014
If third-party evaluated vendor pricing is not available or not deemed to be indicative of fair value, PIMCO may elect to obtain indicative market quotations (“broker quotes”) directly from the broker-dealer or passed through from a third-party vendor. In the event that fair value is based upon a single sourced broker quote, these securities are categorized as Level 3 of the fair value hierarchy. Broker quotes are typically received from established market participants. Although independently received, the investment advisor does not have the transparency to view the underlying inputs which support the market quotation. Significant changes in the broker quote would have direct and proportional changes in the fair value of the security.
4. SECURITIES AND OTHER INVESTMENTS
(a) Investments in Securities
Inflation-Indexed Bonds Certain Portfolios may invest in inflation-indexed bonds. Inflation-indexed bonds are fixed income securities whose principal value is periodically adjusted to the rate of inflation. The interest rate on these bonds is generally fixed at issuance at a rate lower than typical bonds. Over the life of an inflation-indexed bond, however, interest will be paid based on a principal value which is adjusted for inflation. Any increase or decrease in the principal amount of an inflation-indexed bond will be included as interest income on the Statements of Operations, even though investors do not receive their principal until maturity.
Mortgage-Related and Other Asset-Backed Securities Certain Portfolios may invest in mortgage-related and other asset-backed securities that directly or indirectly represent a participation in, or are secured by and payable from, loans on real property. Mortgage-related securities are created from pools of residential or commercial mortgage loans, including mortgage loans made by savings and loan institutions, mortgage bankers, commercial banks and others. These securities provide a monthly payment which consists of both interest and principal. Interest may be determined by fixed or adjustable rates. The rate of prepayments on underlying mortgages will affect the price and volatility of a mortgage-related security, and may have the effect of shortening or extending the effective duration of the security relative to what was anticipated at the time of purchase. The timely payment of principal and interest of certain mortgage-related securities is guaranteed with the full faith and credit of the U.S. Government. Pools created and guaranteed by non-governmental issuers, including government-sponsored corporations, may be supported by various forms of insurance or guarantees, but there can be no assurance that private insurers or guarantors can meet their obligations under the insurance policies or guarantee arrangements. Many of the risks of investing in mortgage-related securities secured by commercial mortgage loans reflect the effects of local and other economic conditions on real estate markets, the ability of tenants to make lease payments, and the ability of a property to attract and retain tenants. These securities may be less liquid and may exhibit greater price volatility than other types of mortgage-related or other asset-backed securities. Other asset-backed securities are created from many types of assets, including auto loans, credit card receivables, home equity loans, and student loans.
Collateralized Mortgage Obligations (“CMOs”) are debt obligations of a legal entity that are collateralized by whole mortgage loans or private mortgage bonds and divided into classes. CMOs are structured into multiple classes, often referred to as “tranches,” with each class bearing a different stated maturity and entitled to a different schedule for payments of principal and interest, including prepayments. CMOs may be less liquid and may exhibit greater price volatility than other types of mortgage-related or asset-backed securities.
| | | | | | |
| | ANNUAL REPORT | | OCTOBER 31, 2014 | | 109 |
Notes to Financial Statements (Cont.)
Collateralized Debt Obligations (“CDOs”) include Collateralized Bond Obligations (“CBOs”), Collateralized Loan Obligations (“CLOs”) and other similarly structured securities. CBOs and CLOs are types of asset-backed securities. A CBO is a trust which is backed by a diversified pool of high risk, below investment grade fixed income securities. A CLO is a trust typically collateralized by a pool of loans, which may include, among others, domestic and foreign senior secured loans, senior unsecured loans, and subordinate corporate loans, including loans that may be rated below investment grade or equivalent unrated loans. The risks of an investment in a CDO depend largely on the type of the collateral securities and the class of the CDO in which a Portfolio invests. CDOs carry additional risks including, but not limited to, (i) the possibility that distributions from collateral securities will not be adequate to make interest or other payments, (ii) the collateral may decline in value or default, (iii) a Portfolio may invest in CDOs that are subordinate to other classes, and (iv) the complex structure of the security may not be fully understood at the time of investment and may produce disputes with the issuer or unexpected investment results.
Restricted Securities Certain Portfolios may invest in securities that are subject to legal or contractual restrictions on resale. These securities may be sold privately, but are required to be registered or exempted from such registration before being sold to the public. Private placement securities are generally considered to be restricted except for those securities traded between qualified institutional investors under the provisions of Rule 144A of the Securities Act of 1933. Disposal of restricted securities may involve time-consuming negotiations and expenses, and prompt sale at an acceptable price may be difficult to achieve. Restricted securities outstanding at October 31, 2014 are disclosed in the Notes to Schedules of Investments.
U.S. Government Agencies or Government-Sponsored Enterprises Certain Portfolios may invest in securities of U.S. Government agencies or government-sponsored enterprises. U.S. Government securities are obligations of and, in certain cases, guaranteed by, the U.S. Government, its agencies or instrumentalities. Some U.S. Government securities, such as Treasury bills, notes and bonds, and securities guaranteed by the Government National Mortgage Association (“GNMA” or “Ginnie Mae”), are supported by the full faith and credit of the U.S. Government; others, such as those of the Federal Home Loan Banks, are supported by the right of the issuer to borrow from the U.S. Department of the Treasury (the “U.S. Treasury”); and others, such as those of the Federal National Mortgage Association (“FNMA” or “Fannie Mae”), are supported by the discretionary authority of the U.S. Government to purchase the agency’s obligations. U.S. Government securities may include zero coupon securities. Zero coupon securities do not distribute interest on a current basis and tend to be subject to a greater risk than interest paying securities.
Government-related guarantors (i.e., not backed by the full faith and credit of the U.S. Government) include FNMA and the Federal Home Loan Mortgage Corporation (“FHLMC” or “Freddie Mac”). FNMA is a government-sponsored corporation. FNMA purchases conventional (i.e., not insured or guaranteed by any government agency) residential mortgages from a list of approved seller/servicers which include state and federally chartered savings and loan associations, mutual savings banks, commercial banks and credit unions and mortgage bankers. Pass-through securities issued by FNMA are guaranteed as to timely payment of principal and interest by FNMA, but are not backed by the full faith and credit of the U.S. Government. FHLMC issues Participation Certificates (“PCs”), which are pass-through securities, each representing an undivided interest in a pool of residential
| | | | | | |
| 110 | | PIMCO MANAGED ACCOUNTS TRUST | | | | |
October 31, 2014
mortgages. FHLMC guarantees the timely payment of interest and ultimate collection of principal, but PCs are not backed by the full faith and credit of the U.S. Government.
5. BORROWINGS AND OTHER FINANCING TRANSACTIONS
The following disclosures contain information on a Portfolio’s ability to lend or borrow cash or securities to the extent permitted under the Act, which may be viewed as borrowing or financing transactions by a Portfolio. The location and fair value amounts of these instruments are described below. For a detailed description of credit and counterparty risks that can be associated with borrowings and other financing transactions, please see Note 7, Principal Risks.
(a) Repurchase Agreements Certain Portfolios may engage in repurchase agreements. Under the terms of a typical repurchase agreement, a Portfolio takes possession of an underlying debt obligation (collateral) subject to an obligation of the seller to repurchase, and a Portfolio to resell, the obligation at an agreed-upon price and time. The underlying securities for all repurchase agreements are held in safekeeping at the Portfolio’s custodian or designated subcustodians under tri-party repurchase agreements. The market value of the collateral must be equal to or exceed the total amount of the repurchase obligations, including interest. Repurchase agreements, including accrued interest, are included on the Statements of Assets and Liabilities. Interest earned is recorded as a component of interest income on the Statements of Operations. In periods of increased demand for collateral, a Portfolio may pay a fee for receipt of collateral, which may result in interest expense to the Portfolio.
(b) Reverse Repurchase Agreements Certain Portfolios may enter into reverse repurchase agreements. In a reverse repurchase agreement, a Portfolio delivers a security in exchange for cash to a financial institution, the counterparty, with a simultaneous agreement to repurchase the same or substantially the same security at an agreed upon price and date. A Portfolio is entitled to receive principal and interest payments, if any, made on the security delivered to the counterparty during the term of the agreement. Cash received in exchange for securities delivered plus accrued interest payments to be made by a Portfolio to counterparties are reflected as a liability on the Statements of Assets and Liabilities. Interest payments made by a Portfolio to counterparties are recorded as a component of interest expense on the Statements of Operations. In periods of increased demand for the security, a Portfolio may receive a fee for use of the security by the counterparty, which may result in interest income to the Portfolio. A Portfolio will segregate assets determined to be liquid by PIMCO or will otherwise cover its obligations under reverse repurchase agreements.
(c) Sale-Buybacks Certain Portfolios may enter into financing transactions referred to as ‘sale-buybacks’. A sale-buyback transaction consists of a sale of a security by a Portfolio to a financial institution, the counterparty, with a simultaneous agreement to repurchase the same or substantially the same security at an agreed-upon price and date. A Portfolio is not entitled to receive principal and interest payments, if any, made on the security sold to the counterparty during the term of the agreement. The agreed-upon proceeds for securities to be repurchased by a Portfolio are reflected as a liability on the Statements of Assets and Liabilities. A Portfolio will recognize net income represented by the price differential between the price received for the transferred security and the agreed-upon repurchase price. This is commonly referred to as the ‘price drop’. A price drop consists of (i) the foregone interest and inflationary income adjustments, if any, a Portfolio would have otherwise received had the security not been sold and (ii) the negotiated financing terms between a
| | | | | | |
| | ANNUAL REPORT | | OCTOBER 31, 2014 | | 111 |
Notes to Financial Statements (Cont.)
Portfolio and counterparty. Foregone interest and inflationary income adjustments, if any, are recorded as components of interest income on the Statements of Operations. Interest payments based upon negotiated financing terms made by a Portfolio to counterparties are recorded as a component of interest expense on the Statements of Operations. In periods of increased demand for the security, a Portfolio may receive a fee for use of the security by the counterparty, which may result in interest income to the Portfolio. A Portfolio will segregate assets determined to be liquid by PIMCO or will otherwise cover its obligations under sale-buyback transactions.
(d) Short Sales Certain Portfolios may enter into short sales transactions. A short sale is a transaction in which a Portfolio sells securities it may not own in anticipation of a decline in the fair market value of the securities. Securities sold in short sale transactions and the interest payable on such securities, if any, are reflected as a liability on the Statements of Assets and Liabilities. A Portfolio is obligated to deliver securities at the trade price at the time the short position is covered. Possible losses from short sales may be unlimited, whereas losses from purchases cannot exceed the total amount invested.
6. FINANCIAL DERIVATIVE INSTRUMENTS
The following disclosures contain information on how and why the Portfolios may use financial derivative instruments, the credit-risk-related contingent features in certain financial derivative instruments, and how financial derivative instruments affect the Portfolios’ financial position, results of operations and cash flows. The location and fair value amounts of these instruments on the Statements of Assets and Liabilities and the realized and changes in unrealized gains and losses on the Statements of Operations, each categorized by type of financial derivative contract and related risk exposure, are included in a table in the Notes to Schedules of Investments. The financial derivative instruments outstanding as of period end and the amounts of realized and changes in unrealized gains and losses on financial derivative instruments during the period, as disclosed in the Notes to Schedules of Investments, serve as indicators of the volume of financial derivative activity for the Portfolios.
(a) Forward Foreign Currency Contracts Certain Portfolios may enter into forward foreign currency contracts in connection with settling planned purchases or sales of securities, to hedge the currency exposure associated with some or all of a Portfolio’s securities or as a part of an investment strategy. A forward foreign currency contract is an agreement between two parties to buy and sell a currency at a set price on a future date. The market value of a forward foreign currency contract fluctuates with changes in foreign currency exchange rates. Forward foreign currency contracts are marked to market daily and the change in value is recorded by a Portfolio as an unrealized gain or loss. Realized gains or losses equal to the difference between the value of the contract at the time it was opened and the value at the time it was closed are recorded upon delivery or receipt of the currency. These contracts may involve market risk in excess of the unrealized gain or loss reflected on the Statements of Assets and Liabilities. In addition, a Portfolio could be exposed to risk if the counterparties are unable to meet the terms of the contracts or if the value of the currency changes unfavorably to the U.S. dollar. In connection with these contracts, cash or securities may be identified as collateral in accordance with the terms of the respective contracts.
(b) Futures Contracts Certain Portfolios may enter into futures contracts. A Portfolio may use futures contracts to manage its exposure to the securities markets or to movements in interest rates and currency values. The primary risks associated with the use of futures contracts are the imperfect
| | | | | | |
| 112 | | PIMCO MANAGED ACCOUNTS TRUST | | | | |
October 31, 2014
correlation between the change in market value of the securities held by a Portfolio and the prices of futures contracts and the possibility of an illiquid market. Futures contracts are valued based upon their quoted daily settlement prices. Upon entering into a futures contract, a Portfolio is required to deposit with its futures broker an amount of cash, U.S. Government and Agency Obligations, or select sovereign debt, in accordance with the initial margin requirements of the broker or exchange. Futures contracts are marked to market daily and an appropriate payable or receivable for the change in value (“variation margin”) is recorded by the Portfolio. Gains or losses are recognized but not considered realized until the contracts expire or are closed. Futures contracts involve, to varying degrees, risk of loss in excess of variation margin disclosed within exchange traded or centrally cleared on the Statements of Assets and Liabilities.
(c) Options Contracts Certain Portfolios may write call and put options on securities and financial derivative instruments they own or in which they may invest. Writing put options tends to increase a Portfolio’s exposure to the underlying instrument. Writing call options tends to decrease a Portfolio’s exposure to the underlying instrument. When a Portfolio writes a call or put, an amount equal to the premium received is recorded as a liability and subsequently marked to market to reflect the current value of the option written. These liabilities are included on the Statements of Assets and Liabilities. Premiums received from writing options which expire are treated as realized gains. Premiums received from writing options which are exercised or closed are added to the proceeds or offset against amounts paid on the underlying futures, swap, security or currency transaction to determine the realized gain or loss. Certain options may be written with premiums to be determined on a future date. The premiums for these options are based upon implied volatility parameters at specified terms. A Portfolio as a writer of an option has no control over whether the underlying instrument may be sold (“call”) or purchased (“put”) and as a result bears the market risk of an unfavorable change in the price of the instrument underlying the written option. There is the risk a Portfolio may not be able to enter into a closing transaction because of an illiquid market.
Certain Portfolios may also purchase put and call options. Purchasing call options tends to increase a Portfolio’s exposure to the underlying instrument. Purchasing put options tends to decrease a Portfolio’s exposure to the underlying instrument. A Portfolio pays a premium which is included as an asset on the Statement of Assets and Liabilities and subsequently marked to market to reflect the current value of the option. Premiums paid for purchasing options which expire are treated as realized losses. Certain options may be purchased with premiums to be determined on a future date. The premiums for these options are based upon implied volatility parameters at specified terms. The risk associated with purchasing put and call options is limited to the premium paid. Premiums paid for purchasing options which are exercised or closed are added to the amounts paid or offset against the proceeds on the underlying investment transaction to determine the realized gain or loss when the underlying transaction is executed.
Inflation-Capped Options Certain Portfolios may write or purchase inflation-capped options to enhance returns or for hedging opportunities. When a Portfolio writes an inflation-capped option, an amount equal to the premium received is recorded as a liability and subsequently marked to market to reflect the current value of the option written. When a Portfolio purchases an inflation-capped option, the Portfolio pays a premium which is recorded as an asset and subsequently marked to market to reflect the current value of the option. The purpose of purchasing inflation-capped options is to protect a Portfolio from inflation erosion above a certain rate on a given notional exposure. A floor can be used to give downside protection to investments in inflation-linked products.
| | | | | | |
| | ANNUAL REPORT | | OCTOBER 31, 2014 | | 113 |
Notes to Financial Statements (Cont.)
��
Options on Exchange-Traded Futures Contracts Certain Portfolios may write or purchase options on exchange-traded futures contracts (“Futures Option”) to hedge an existing position or future investment, for speculative purposes or to manage exposure to market movements. A Futures Option is an option contract in which the underlying instrument is a single futures contract.
Credit Default Swaptions Certain Portfolios may write or purchase credit default swaption agreements to hedge exposure to the credit risk of an investment without making a commitment to the underlying instrument. A credit default swaption is an option to sell or buy credit protection to a specific reference by entering into a pre-defined swap agreement by some specified date in the future.
Interest Rate Swaptions Certain Portfolios may write or purchase interest rate swaption agreements which are options to enter into a pre-defined swap agreement by some specified date in the future. The writer of the swaption becomes the counterparty to the swap if the buyer exercises. The interest rate swaption agreement will specify whether the buyer of the swaption will be a fixed-rate receiver or a fixed-rate payer upon exercise.
Foreign Currency Options Certain Portfolios may write or purchase foreign currency options. Purchasing foreign currency options gives a Portfolio the right, but not the obligation to buy or sell the currency and will specify the amount of currency and a rate of exchange that may be exercised by a specified date. These options may be used as a short or long hedge against possible variations in foreign exchange rates or to gain exposure to foreign currencies.
Options on Securities Certain Portfolios may write or purchase options on securities. An option uses a specified security as the underlying instrument for the option contract. A Portfolio may write or purchase options to enhance returns or to hedge an existing position or future investment.
(d) Swap Agreements Certain Portfolios may invest in swap agreements. Swap agreements are bilaterally negotiated agreements between a Portfolio and a counterparty to exchange or swap investment cash flows, assets, foreign currencies or market-linked returns at specified, future intervals. Swap agreements are privately negotiated in the over the counter market (“OTC swaps”) or may be executed in a multilateral or other trade facility platform, such as a registered exchange (“centrally cleared swaps”). A Portfolio may enter into asset, credit default, cross-currency, interest rate, total return, variance and other forms of swap agreements to manage its exposure to credit, currency, interest rate, commodity, equity and inflation risk. In connection with these agreements, securities or cash may be identified as collateral or margin in accordance with the terms of the respective swap agreements to provide assets of value and recourse in the event of default or bankruptcy/insolvency.
Swaps are marked to market daily based upon values from third-party vendors, which may include a registered exchange, or quotations from market makers to the extent available. In the event that market quotes are not readily available and the swap cannot be valued pursuant to one of the valuation methods, the value of the swap will be determined in good faith by the Valuation Committee of the Board, generally based upon recommendations provided by PIMCO. Changes in market value, if any, are reflected as a component of net change in unrealized appreciation/(depreciation) on the Statements of Operations. Daily changes in valuation of centrally cleared swaps, if any, are recorded as a receivable or payable for the change in value as appropriate
| | | | | | |
| 114 | | PIMCO MANAGED ACCOUNTS TRUST | | | | |
October 31, 2014
(“variation margin”) on the Statements of Assets and Liabilities. OTC swap payments received or paid at the beginning of the measurement period are included on the Statements of Assets and Liabilities and represent premiums paid or received upon entering into the swap agreement to compensate for differences between the stated terms of the swap agreement and prevailing market conditions (credit spreads, currency exchange rates, interest rates, and other relevant factors). Upfront premiums received (paid) are initially recorded as liabilities (assets) and subsequently marked to market to reflect the current value of the swap. These upfront premiums are recorded as realized gains or losses on the Statements of Operations upon termination or maturity of the swap. A liquidation payment received or made at the termination of the swap is recorded as realized gain or loss on the Statements of Operations. Net periodic payments received or paid by a Portfolio are included as part of realized gains or losses on the Statements of Operations.
Entering into these agreements involves, to varying degrees, elements of interest, credit, market and documentation risk in excess of the amounts recognized on the Statements of Assets and Liabilities. Such risks involve the possibility that there will be no liquid market for these agreements, that the counterparty to the agreements may default on its obligation to perform or disagree as to the meaning of contractual terms in the agreements and that there may be unfavorable changes in interest rates.
A Portfolio’s maximum risk of loss from counterparty credit risk is the discounted net value of the cash flows to be received from the counterparty over the contract’s remaining life, to the extent that amount is positive. The risk is mitigated by having a master netting arrangement between a Portfolio and the counterparty and by the posting of collateral to a Portfolio to cover a Portfolio’s exposure to the counterparty.
Credit Default Swap Agreements Credit default swap agreements involve one party making a stream of payments (referred to as the buyer of protection) to another party (the seller of protection) in exchange for the right to receive a specified return in the event of a default or other credit event for the referenced entity, obligation or index. As a seller of protection on credit default swap agreements, a Portfolio will generally receive from the buyer of protection a fixed rate of income throughout the term of the swap provided that there is no credit event. As the seller, a Portfolio would effectively add leverage to its portfolio because, in addition to its total net assets, a Portfolio would be subject to investment exposure on the notional amount of the swap.
If a Portfolio is a seller of protection and a credit event occurs, as defined under the terms of that particular swap agreement, a Portfolio will either (i) pay to the buyer of protection an amount equal to the notional amount of the swap and take delivery of the referenced obligation, other deliverable obligations or underlying securities comprising the referenced index or (ii) pay a net settlement amount in the form of cash or securities equal to the notional amount of the swap less the recovery value of the referenced obligation or underlying securities comprising the referenced index. If a Portfolio is a buyer of protection and a credit event occurs, as defined under the terms of that particular swap agreement, a Portfolio will either (i) receive from the seller of protection an amount equal to the notional amount of the swap and deliver the referenced obligation, other deliverable obligations or underlying securities comprising the referenced index or (ii) receive a net settlement amount in the form of cash or securities equal to the notional amount of the swap less the recovery value of the referenced obligation or underlying securities comprising the referenced index. Recovery
| | | | | | |
| | ANNUAL REPORT | | OCTOBER 31, 2014 | | 115 |
Notes to Financial Statements (Cont.)
values are estimated by market makers considering either industry standard recovery rates or entity specific factors and considerations until a credit event occurs. If a credit event has occurred, the recovery value is determined by a facilitated auction whereby a minimum number of allowable broker bids, together with a specified valuation method, are used to calculate the settlement value.
Credit default swap agreements on corporate, sovereign or U.S. municipal issues involve one party making a stream of payments to another party in exchange for the right to receive a specified return in the event of a default or other credit event. If a credit event occurs and cash settlement is not elected, a variety of other deliverable obligations may be delivered in lieu of the specific referenced obligation. The ability to deliver other obligations may result in a cheapest-to-deliver option (the buyer of protection’s right to choose the deliverable obligation with the lowest value following a credit event). A Portfolio may use credit default swaps on corporate, sovereign or U.S. municipal issues to provide a measure of protection against defaults of the issuers (i.e., to reduce risk where a Portfolio owns or has exposure to the referenced obligation) or to take an active long or short position with respect to the likelihood of a particular issuer’s default.
Credit default swap agreements on credit indices involve one party making a stream of payments to another party in exchange for the right to receive a specified return in the event of a write-down, principal shortfall, interest shortfall or default of all or part of the referenced entities comprising the credit index. A credit index is a basket of credit instruments or exposures designed to be representative of some part of the credit market as a whole. These indices are made up of reference credits that are judged by a poll of dealers to be the most liquid entities in the credit default swap market based on the sector of the index. Components of the indices may include, but are not limited to, investment grade securities, high yield securities, asset-backed securities, emerging markets, and/or various credit ratings within each sector. Credit indices are traded using credit default swaps with standardized terms including a fixed spread and standard maturity dates. An index credit default swap references all the names in the index, and if there is a default, the credit event is settled based on that name’s weight in the index. The composition of the indices changes periodically, usually every six months, and for most indices, each name has an equal weight in the index. A Portfolio may use credit default swaps on credit indices to hedge a portfolio of credit default swaps or bonds, which is less expensive than it would be to buy many credit default swaps to achieve a similar effect. Credit default swaps on indices are instruments for protecting investors owning bonds against default, and traders use them to speculate on changes in credit quality.
Implied credit spreads, represented in absolute terms, utilized in determining the market value of credit default swap agreements on corporate, sovereign or U.S. municipal issues as of period end are disclosed in the Notes to Schedules of Investments. They serve as an indicator of the current status of payment/performance risk and represent the likelihood or risk of default for the reference entity. The implied credit spread of a particular referenced entity reflects the cost of buying/selling protection and may include upfront payments required to be made to enter into the agreement. Wider credit spreads represent a deterioration of the referenced entity’s credit soundness and a greater likelihood or risk of default or other credit event occurring as defined under the terms of the agreement. For credit default swap agreements on asset-backed securities and credit indices, the quoted market prices and resulting values serve as the indicator of the current status of the payment/performance risk. Increasing market values, in absolute terms when compared to the notional amount of the swap, represent a deterioration of the referenced entity’s credit soundness and a greater likelihood or risk of default or other credit event occurring as defined under the terms of the agreement.
| | | | | | |
| 116 | | PIMCO MANAGED ACCOUNTS TRUST | | | | |
October 31, 2014
The maximum potential amount of future payments (undiscounted) that a Portfolio as a seller of protection could be required to make under a credit default swap agreement equals the notional amount of the agreement. Notional amounts of each individual credit default swap agreement outstanding as of period end for which a Portfolio is the seller of protection are disclosed in the Notes to Schedules of Investments. These potential amounts would be partially offset by any recovery values of the respective referenced obligations, upfront payments received upon entering into the agreement, or net amounts received from the settlement of buy protection credit default swap agreements entered into by a Portfolio for the same referenced entity or entities.
Interest Rate Swap Agreements Certain Portfolios are subject to interest rate risk exposure in the normal course of pursuing their investment objectives. Because a Portfolio holds fixed rate bonds, the value of these bonds may decrease if interest rates rise. To help hedge against this risk and to maintain its ability to generate income at prevailing market rates, a Portfolio may enter into interest rate swap agreements. Interest rate swap agreements involve the exchange by a Portfolio with another party for their respective commitment to pay or receive interest on the notional amount of principal. Certain forms of interest rate swap agreements may include: (i) interest rate caps, under which, in return for a premium, one party agrees to make payments to the other to the extent that interest rates exceed a specified rate, or “cap”, (ii) interest rate floors, under which, in return for a premium, one party agrees to make payments to the other to the extent that interest rates fall below a specified rate, or “floor”, (iii) interest rate collars, under which a party sells a cap and purchases a floor or vice versa in an attempt to protect itself against interest rate movements exceeding given minimum or maximum levels, (iv) callable interest rate swaps, under which the buyer pays an upfront fee in consideration for the right to early terminate the swap transaction in whole, at zero cost and at a predetermined date and time prior to the maturity date, (v) spreadlocks, which allow the interest rate swap users to lock in the forward differential (or spread) between the interest rate swap rate and a specified benchmark, or (vi) basis swaps, under which two parties can exchange variable interest rates based on different segments of money markets.
7. PRINCIPAL RISKS
In the normal course of business the Portfolios trade financial instruments and enter into financial transactions where risk of potential loss exists due to such things as changes in the market (market risk) or failure or inability of the other party to a transaction to perform (credit and counterparty risk). See below for a detailed description of select principal risks. For a more comprehensive list of potential risks the Portfolios may be subject to, please see the Important Information About the Portfolios.
Market Risks A Portfolio’s investments in financial derivatives and other financial instruments expose the Portfolio to various risks such as, but not limited to, interest rate, foreign currency, equity and commodity risks.
Interest rate risk is the risk that fixed income securities will decline in value because of an increase in interest rates. As nominal interest rates rise, the value of certain fixed income securities held by a Portfolio is likely to decrease. A nominal interest rate can be described as the sum of a real interest rate and an expected inflation rate. Interest rate changes can be sudden and unpredictable, and the Portfolio may lose money if these changes are not anticipated by Portfolio management.
| | | | | | |
| | ANNUAL REPORT | | OCTOBER 31, 2014 | | 117 |
Notes to Financial Statements (Cont.)
A Portfolio may not be able to hedge against changes in interest rates or may choose not to do so for cost or other reasons. In addition, any hedges may not work as intended. Fixed income securities with longer durations tend to be more sensitive to changes in interest rates, usually making them more volatile than securities with shorter durations. Duration is useful primarily as a measure of the sensitivity of a fixed income security’s market price to interest rate (i.e., yield) movements. A wide variety of factors can cause interest rates to rise (e.g., central bank monetary policies, inflation rates, general economic conditions). At present, the U.S. is experiencing historically low interest rates. This, combined with recent economic recovery and the Federal Reserve Board’s conclusion of its quantitative easing program, could potentially increase the probability of an upward interest rate environment in the near future. Further, while U.S. bond markets have steadily grown over the past three decades, dealer “market making” ability has remained relatively stagnant. Given the importance of intermediary “market making” in creating a robust and active market, fixed income securities may face increased volatility and liquidity risks. All of these factors, collectively and/or individually, could cause a Portfolio to lose value. If a Portfolio lost enough value, the Portfolio could face increased redemptions by shareholders, which could further impair its performance.
If a Portfolio invests directly in foreign currencies or in securities that trade in, and receive revenues in, foreign currencies, or in financial derivatives that provide exposure to foreign currencies, it will be subject to the risk that those currencies will decline in value relative to the base currency of the Portfolio, or, in the case of hedging positions, that the Portfolio’s base currency will decline in value relative to the currency being hedged. Currency rates in foreign countries may fluctuate significantly over short periods of time for a number of reasons, including changes in interest rates, intervention (or the failure to intervene) by U.S. or foreign governments, central banks or supranational entities such as the International Monetary Fund, or by the imposition of currency controls or other political developments in the United States or abroad. As a result, a Portfolio’s investments in foreign currency denominated securities may reduce the Portfolio’s returns.
The market values of securities may decline due to general market conditions which are not specifically related to a particular company or issuer, such as real or perceived adverse economic conditions, changes in the general outlook for corporate earnings, changes in interest or currency rates or adverse investor sentiment generally. They may also decline due to factors which affect a particular industry or industries, such as labor shortages or increased production costs and competitive conditions within an industry. Different types of equity securities may react differently to these developments. Equity securities and equity related investments generally have greater market price volatility than fixed income securities.
Credit and Counterparty Risks A Portfolio will be exposed to credit risk to parties with whom it trades and will also bear the risk of settlement default. A Portfolio minimizes concentrations of credit risk by undertaking transactions with a large number of customers and counterparties on recognized and reputable exchanges. A Portfolio could lose money if the issuer or guarantor of a fixed income security, or the counterparty to a financial derivatives contract, repurchase agreement or a loan of portfolio securities, is unable or unwilling to make timely principal and/or interest payments, or to otherwise honor its obligations. Securities are subject to varying degrees of credit risk, which are often reflected in credit ratings.
| | | | | | |
| 118 | | PIMCO MANAGED ACCOUNTS TRUST | | | | |
October 31, 2014
Similar to credit risk, a Portfolio may be exposed to counterparty risk, or the risk that an institution or other entity with which a Portfolio has unsettled or open transactions will default. Financial assets, which potentially expose a Portfolio to counterparty risk, consist principally of cash due from counterparties and investments. PIMCO, as the Adviser, minimizes counterparty risks to the Portfolios by performing extensive reviews of each counterparty and obtaining approval from the PIMCO Counterparty Risk Committee prior to entering into transactions with a third-party. Furthermore, to the extent that unpaid amounts owed to a Portfolio exceed a predetermined threshold agreed to with the counterparty, such counterparty shall advance collateral to the Portfolio in the form of cash or cash equivalents equal in value to the unpaid amount owed to the Portfolio. A Portfolio may invest such collateral in securities or other instruments and will typically pay interest to the counterparty on the collateral received. If the unpaid amount owed to a Portfolio subsequently decreases, the Portfolio would be required to return to the counterparty all or a portion of the collateral previously advanced.
All transactions in listed securities are settled/paid for upon delivery using approved counterparties. The risk of default is considered minimal, as delivery of securities sold is only made once a Portfolio has received payment. Payment is made on a purchase once the securities have been delivered by the counterparty. The trade will fail if either party fails to meet its obligation.
Master Netting Arrangements The Portfolios are subject to various netting arrangements with select counterparties (“Master Agreements”). Master Agreements govern the terms of certain transactions, and reduce the counterparty risk associated with relevant transactions by specifying credit protection mechanisms and providing standardization that improves legal certainty. Since different types of transactions have different mechanics and are sometimes traded out of different legal entities of a particular organization, each type of transaction may be covered by a different Master Agreement, resulting in the need for multiple agreements with a single counterparty. As the Master Agreements are specific to unique operations of different asset types, they allow the Portfolios to close out and net their total exposure to a counterparty in the event of a default with respect to all the transactions governed under a single agreement with a counterparty.
Master Agreements can also help limit counterparty risk by specifying collateral posting arrangements at pre-arranged exposure levels. Under the Master Agreements, collateral is routinely transferred if the total net exposure to certain transactions (net of existing collateral already in place) governed under the relevant Master Agreement with a counterparty in a given account exceeds a specified threshold, which typically ranges from zero to $250,000 depending on the counterparty and the type of Master Agreement. United States Treasury Bills and U.S. dollar cash are generally the preferred forms of collateral, although other forms of AAA rated paper or sovereign securities may be used. Securities and cash pledged as collateral are reflected as assets in the Statement of Assets and Liabilities as either a component of Investments at value (securities) or Deposits due from Counterparties (cash). Cash collateral received is not typically held in a segregated account and as such is reflected as a liability in the Statement of Assets and Liabilities as Deposits due to Counterparties. The market value of any securities received as collateral is not reflected as a component of net asset value. The Portfolio’s overall exposure to counterparty risk can change substantially within a short period, as it is affected by each transaction subject to the relevant Master Agreement.
| | | | | | |
| | ANNUAL REPORT | | OCTOBER 31, 2014 | | 119 |
Notes to Financial Statements (Cont.)
Master Repurchase Agreements and Global Master Repurchase Agreements (individually and collectively “Master Repo Agreements”) govern repurchase, reverse repurchase, and sale-buyback transactions between the Portfolios and select counterparties. Master Repo Agreements maintain provisions for, among other things, initiation, income payments, events of default, and maintenance of collateral. The market value of transactions under the Master Repo Agreement, collateral pledged or received, and the net exposure by counterparty as of period end are disclosed in the Notes to Schedule of Investments.
Master Securities Forward Transaction Agreements (“Master Forward Agreements”) govern the considerations and factors surrounding the settlement of certain forward settling transactions, such as To-Be-Announced securities, delayed-delivery or sale-buyback transactions by and between the Portfolios and select counterparties. The Master Forward Agreements maintain provisions for, among other things, initiation and confirmation, payment and transfer, events of default, termination, and maintenance of collateral. The market value of forward settling transactions, collateral pledged or received, and the net exposure by counterparty as of period end is disclosed in the Notes to Schedule of Investments.
Customer Account Agreements and related addendums govern cleared derivatives transactions such as futures, options on futures, and cleared OTC derivatives. Cleared derivative transactions require posting of initial margin as determined by each relevant clearing agency which is segregated at a broker account registered with the Commodity Futures Trading Commission (CFTC), or the applicable regulator. In the U.S., counterparty risk is significantly reduced as creditors of the futures broker do not have claim to Portfolio assets in the segregated account. Additionally, portability of exposure in the event of default further reduces risk to a Portfolio. Variation margin, or changes in market value, are exchanged daily, but may not be netted between futures and cleared OTC derivatives. The market value or accumulated unrealized appreciation or depreciation, initial margin posted, and any unsettled variation margin as of period end is disclosed in the Notes to Schedule of Investments.
International Swaps and Derivatives Association, Inc. Master Agreements and Credit Support Annexes (“ISDA Master Agreements”) govern OTC financial derivative transactions entered into by the Portfolios and select counterparties. ISDA Master Agreements maintain provisions for general obligations, representations, agreements, collateral and events of default or termination. Events of termination include conditions that may entitle counterparties to elect to terminate early and cause settlement of all outstanding transactions under the applicable ISDA Master Agreement. Any election to terminate early could be material to the financial statements. In limited circumstances, the ISDA Master Agreement may contain additional provisions that add counterparty protection beyond coverage of existing daily exposure if the counterparty has a decline in credit quality below a predefined level. These amounts, if any, may be segregated with a third-party custodian. The market value of OTC financial derivative instruments, collateral received or pledged, and net exposure by counterparty as of period end are disclosed in the Notes to Schedule of Investments.
8. FEES AND EXPENSES
(a) Investment Advisory Fee Effective at the close of business on September 5, 2014, the Trust entered into an Investment Advisory Agreement with the Manager (previously defined as the “Advisory Contract”) pursuant to which the Manager serves as the investment adviser to each
| | | | | | |
| 120 | | PIMCO MANAGED ACCOUNTS TRUST | | | | |
October 31, 2014
Portfolio. The Manager does not receive investment advisory or other fees from the Portfolios or the Trust (although PIMCO may receive compensation under the Advisory Contract with respect to future series of the Trust). The financial statements reflect the fact that no investment management fees or expenses are incurred by the Portfolios. Prior to the close of business on September 5, 2014, AGIFM served as the investment adviser to each Portfolio. AGIFM did not receive investment advisory or other fees from the Portfolios or the Trust.
Each Portfolio is an integral part of one or more “wrap-fee” programs, including those sponsored by investment advisers and broker-dealers unaffiliated with the Portfolios, and unaffiliated with PIMCO or AGIFM. Participants in these programs pay a “wrap” fee to the sponsor of the program. PIMCO may receive, and prior to the close of business on September 5, 2014, AGIFM may have received, fees or other benefits from or through its relationships with the sponsors of such wrap-fee programs for which the Portfolios are an investment option.
(b) Supervisory and Administration Fee Effective at the close of business on September 5, 2014, the Trust also entered into a Supervision and Administration Agreement with PIMCO (previously defined as the “Administration Agreement”), pursuant to which PIMCO also serves as administrator to the Portfolios (in this capacity, PIMCO is referred to as the “Administrator”). Under the Administration Agreement, the Administrator, at its expense, is required to procure most supervisory and administrative services required by the Portfolios including, but not limited to, expenses of most third-party service providers (e.g., audit, custodial, legal, transfer agency, printing) and other expenses, such as those associated with insurance, proxy solicitations and mailings for shareholder meetings, tax services, valuation services and other services required for the Portfolios’ daily operations. Under the Administration Agreement, the Administrator has agreed to provide or procure these services, and to bear the expenses associated with these services at no charge to the Portfolios. In addition, PIMCO has entered into an expense limitation agreement with the Trust pursuant to which it has agreed to pay or reimburse certain other expenses of the Portfolios, as discussed in more detail below. The Administrator does not receive any administration or other fees from the Portfolios or the Trust for serving as administrator to the Portfolios (although the Administrator may receive compensation under the Administrator Agreement with respect to future series of the Trust).
Prior to the close of business on September 5, 2014, AGIFM served as the administrator to the Portfolios. AGIFM did not receive any administration or other fees from the Portfolios or the Trust for serving as administrator to the Portfolios.
(c) Distribution Fee Effective at the close of business on September 5, 2014, the Trust entered into a Distribution Contract with Pacific Investments LLC (the “Distributor”), a wholly-owned subsidiary of PIMCO, pursuant to which the Distributor serves as the distributor and principal underwriter of the Portfolios’ shares. The Distributor does not receive any distribution or other fees from the Portfolios or the Trust for serving as the distributor and principal underwriter of the Portfolios’ shares (although the Distributor may receive compensation under the Distribution Contract with respect to future series of the Trust).
Prior to the close of business on September 5, 2014, Allianz Global Investors Distributors LLC (“AGID”) served as the distributor and principal underwriter of the Portfolios’ shares. AGID did not
| | | | | | |
| | ANNUAL REPORT | | OCTOBER 31, 2014 | | 121 |
Notes to Financial Statements (Cont.)
receive any distribution or other fees from the Portfolios or the Trust for serving as the distributor and principal underwriter of the Portfolios’ shares.
(d) Expense Limitation Agreement Effective beginning at the close of business on September 5, 2014, the Manager has contractually agreed pursuant to an expense limitation agreement to bear the expenses of or make payments to each Portfolio to the extent that, for any calendar month, “Specified Expenses” of such Portfolio would exceed 0.00%. “Specified Expenses” of a Portfolio means expenses incurred by the Portfolio, including organizational and offering expenses and fees and expenses of the Trust’s Independent Trustees, but excluding any brokerage fees and commissions and other portfolio transaction expenses, costs, including interest expenses, of borrowing money or engaging in other types of leverage financing, including, without limitation, through reverse repurchase agreements, tender option bonds, bank borrowings and credit facilities, fees and expenses of any underlying Portfolios or other pooled vehicles in which the Portfolio invests, taxes, governmental fees, dividends and interest on short positions, and extraordinary expenses, including extraordinary legal expenses. This expense limitation agreement shall continue in effect, unless sooner terminated by the Trust’s Board of Trustees, for so long as the Manager serves as the investment adviser to the Portfolios pursuant to the Advisory Contract.
Prior to the close of business on September 5, 2014, AGIFM and/or its affiliates had agreed to waive all fees and pay or reimburse all expenses of the Portfolios, except extraordinary expenses and expenses incurred as a result of Portfolio investments, including any interest expense.
9. RELATED PARTY TRANSACTIONS
The Manager, Administrator, and Distributor are related parties. Fees payable, if any, to these parties are disclosed in Note 8 and the accrued related party fee amounts are disclosed on the Statements of Assets and Liabilities.
Certain Portfolios are permitted to purchase or sell securities from or to certain related affiliated funds or portfolios under specified conditions outlined in procedures adopted by the Board. The procedures have been designed to ensure that any purchase or sale of securities by a Portfolio from or to another fund or portfolio that are, or could be, considered an affiliate by virtue of having a common investment adviser (or affiliated investment advisers), common Trustees and/or common officers complies with Rule 17a-7 of the Act. Further, as defined under the procedures, each transaction is effected at the current market price. During the period ended October 31, 2014, the Portfolios below engaged in purchases and sales of securities pursuant to Rule 17a-7 of the Act (amounts in thousands):
| | | | | | | | | | |
| Portfolio Name | | | | Purchases | | | Sales | |
| Fixed Income SHares - Series C | | | | $ | 454,952 | | | $ | 1,813,463 | |
| Fixed Income SHares - Series M | | | | | 3,009,770 | | | | 321,214 | |
| Fixed Income SHares - Series TE | | | | | 4,609 | | | | 110 | |
10. GUARANTEES AND INDEMNIFICATIONS
Under each Portfolio’s organizational documents, each Trustee and officer is indemnified, to the extent permitted by the Act, against certain liabilities that may arise out of performance of their
| | | | | | |
| 122 | | PIMCO MANAGED ACCOUNTS TRUST | | | | |
October 31, 2014
duties to the Portfolios. Additionally, in the normal course of business, the Portfolios enter into contracts that contain a variety of indemnification clauses. The Portfolios’ maximum exposure under these arrangements is unknown as this would involve future claims that may be made against the Portfolios that have not yet occurred. However, the Portfolios have not had prior claims or losses pursuant to these contracts.
11. PURCHASES AND SALES OF SECURITIES
The length of time a Portfolio has held a particular security is not generally a consideration in investment decisions. A change in the securities held by a Portfolio is known as “portfolio turnover.” Each Portfolio may engage in frequent and active trading of portfolio securities to achieve its investment objective, particularly during periods of volatile market movements. High portfolio turnover involves correspondingly greater expenses to a Portfolio, including brokerage commissions or dealer mark-ups and other transaction costs on the sale of securities and reinvestments in other securities. Such sales may also result in realization of taxable capital gains, including short-term capital gains (which are generally taxed at ordinary income tax rates). The trading costs and tax effects associated with portfolio turnover may adversely affect a Portfolio’s performance. The portfolio turnover rates are reported in the Financial Highlights.
Purchases and sales of securities (excluding short-term investments) for the period ended October 31, 2014, were as follows (amounts in thousands):
| | | | | | | | | | | | | | | | | | |
| | | | | U.S. Government/Agency | | | All Other | |
| Portfolio Name | | | | Purchases | | | Sales | | | Purchases | | | Sales | |
| Fixed Income SHares - Series C | | | | $ | 1,176,955 | | | $ | 2,664,414 | | | $ | 1,331,878 | | | $ | 1,404,590 | |
| Fixed Income SHares - Series LD | | | | | 774,731 | | | | 743,495 | | | | 24,589 | | | | 11,437 | |
| Fixed Income SHares - Series M | | | | | 24,825,417 | | | | 26,278,092 | | | | 1,798,379 | | | | 1,142,262 | |
| Fixed Income SHares - Series R | | | | | 223,562 | | | | 258,136 | | | | 98,477 | | | | 81,888 | |
| Fixed Income SHares - Series TE | | | | | 5,204 | | | | 5,205 | | | | 24,236 | | | | 1,268 | |
12. SHARES OF BENEFICIAL INTEREST
The Trust may issue an unlimited number of shares of beneficial interest with a $0.0001 par value. Fixed Income SHares: Series LD sold and issued 300,000 shares of beneficial interest in the amount of $3,000,000 to the Manager on December 20, 2013. Changes in shares of beneficial interest are disclosed in the Statements of Changes in Net Assets. As of October 31, 2014, two shareholders each owned 10% or more of the Fixed Income SHares: Series LD’s outstanding shares comprising 44% of the Portfolio, and each of the two shareholders are related parties of the Portfolio. Related parties may include, but are not limited to, the investment manager and its affiliates, affiliated broker dealers, fund of funds and directors or employees of the Trust or Manager.
13. REGULATORY AND LITIGATION MATTERS
The Trust is not engaged in any material litigation or arbitration proceedings and is not aware of any material litigation or claim pending or threatened by or against it.
| | | | | | |
| | ANNUAL REPORT | | OCTOBER 31, 2014 | | 123 |
Notes to Financial Statements (Cont.)
14. FEDERAL INCOME TAX MATTERS
Each Portfolio intends to qualify as a regulated investment company under Subchapter M of the Internal Revenue Code (the “Code”) and distribute all of its taxable income and net realized gains, if applicable, to shareholders. Accordingly, no provision for Federal income taxes has been made.
In accordance with U.S. GAAP, the Manager has reviewed the Portfolios’ tax positions for all open tax years. As of October 31, 2014, the Portfolios have recorded no liability for net unrecognized tax benefits relating to uncertain income tax positions they have taken or expect to take in future tax returns.
The Portfolios file U.S. tax returns. While the statute of limitations remains open to examine the Portfolios’ U.S. tax returns filed for the fiscal years from 2011-2013, no examinations are in progress or anticipated at this time. The Portfolios are not aware of any tax positions for which it is reasonably possible that the total amounts of unrecognized tax benefits will significantly change in the next twelve months.
As of October 31, 2014, the components of distributable taxable earnings are as follows (amounts in thousands):
| | | | | | | | | | | | | | | | | | | | | | | | | | | | | | |
| | | | | Undistributed
Ordinary
Income | | | Undistributed
Long-Term
Capital Gains | | | Net Tax Basis
Unrealized
Appreciation/
(Depreciation) (1) | | | Other Book-
to-Tax
Accounting
Differences (2) | | | Accumulated
Capital
Losses (3) | | | Qualified
Post-
October
Loss
Deferral
Capital (4) | | | Qualified
Late-Year
Loss
Deferral
Ordinary (5) | |
| Series C | | | | $ | 30,493 | | | $ | 77,776 | | | $ | (22,402 | ) | | $ | (282 | ) | | $ | — | | | $ | — | | | $ | — | |
| Series LD | | | | | 138 | | | | — | | | | 8 | | | | — | | | | — | | | | — | | | | — | |
| Series M | | | | | 32,339 | | | | 29,806 | | | | 64,414 | | | | (19 | ) | | | — | | | | — | | | | — | |
| Series R | | | | | 8,408 | | | | — | | | | (22,471 | ) | | | (1,227 | ) | | | (6,372 | ) | | | — | | | | — | |
| Series TE | | | | | — | | | | — | | | | 1,880 | | | | — | | | | (1,250 | ) | | | — | | | | — | |
| (1) | Adjusted for open wash sale loss deferrals and accelerated recognition of unrealized gain on certain futures, options and forward contracts for federal income tax purposes. Also adjusted for differences between book and tax realized and unrealized gain/loss on swap contracts. |
| (2) | Represents differences in income tax regulations and financial accounting principles generally accepted in the United States of America, mainly for straddle loss deferrals. |
| (3) | Capital losses available to offset future net capital gains expire in varying amounts in the years shown below. |
| (4) | Capital losses realized during the period November 1, 2013 through October 31, 2014, which the Portfolio elected to defer to the following taxable year pursuant to income tax regulations. |
| (5) | Specified losses realized during the period November 1, 2013 through October 31, 2014 and Ordinary losses realized during the period January 1, 2014 through October 31, 2014, which the Portfolio elected to defer to the following taxable year pursuant to income tax regulations. |
| | | | | | |
| 124 | | PIMCO MANAGED ACCOUNTS TRUST | | | | |
October 31, 2014
Under the Regulated Investment Company Modernization Act of 2010, a fund is permitted to carry forward any capital losses for an unlimited period. Additionally, such capital losses that are carried forward will retain their character as either short-term or long-term capital losses rather than being considered all short-term under previous law. As of October 31, 2014, the Fund had the following post-effective capital losses with no expiration:
| | | | | | | | | | |
| | | | | Short-Term | | | Long-Term | |
| Series C | | | | $ | — | | | $ | — | |
| Series LD | | | | | — | | | | — | |
| Series M | | | | | — | | | | — | |
| Series R | | | | | — | | | | 6,372 | |
| Series TE | | | | | 516 | | | | 735 | |
As of October 31, 2014, the aggregate cost and the net unrealized appreciation/(depreciation) of investments for federal income tax purposes (in thousands):
| | | | | | | | | | | | | | | | | | |
| | | | | Federal Tax
Cost | | | Unrealized
Appreciation | | | Unrealized
(Depreciation) | | | Net Unrealized
Appreciation/
(Depreciation) (6) | |
| Series C | | | | $ | 2,641,299 | | | $ | 98,384 | | | $ | (85,541 | ) | | $ | 12,843 | |
| Series LD | | | | | 13,141 | | | | 72 | | | | (27 | ) | | | 45 | |
| Series M | | | | | 3,255,636 | | | | 101,325 | | | | (29,700 | ) | | | 71,625 | |
| Series R | | | | | 363,824 | | | | 1,904 | | | | (21,272 | ) | | | (19,367 | ) |
| Series TE | | | | | 92,375 | | | | 3,169 | | | | (159 | ) | | | 3,010 | |
| (6) | Primary differences, if any, between book and tax net unrealized appreciation/(depreciation) on investments are attributable to open wash sale loss deferrals. |
For the fiscal years ended October 31, 2014 and October 31, 2013, respectively, the Funds made the following tax basis distributions (amounts in thousands):
| | | | | | | | | | | | | | | | | | | | | | | | | | | | | | | | | | |
| | | | | October 31, 2014 | | | October 31, 2013 | |
| | | | | Tax-Exempt
Income
Distributions | | | Ordinary
Income
Distributions (7) | | | Long-Term
Capital Gain
Distributions | | | Return
of
Capital (8) | | | Tax-Exempt
Income
Distributions | | | Ordinary
Income
Distributions (7) | | | Long-Term
Capital Gain
Distributions | | | Return
of
Capital (8) | |
| Series C | | | | $ | — | | | $ | 211,513 | | | $ | 126,763 | | | $ | — | | | $ | — | | | $ | 252,691 | | | $ | 28,713 | | | $ | — | |
| Series LD | | | | | — | | | | 166 | | | | — | | | | — | | | | — | | | | — | | | | — | | | | — | |
| Series M | | | | | — | | | | 105,630 | | | | 50,578 | | | | — | | | | — | | | | 153,920 | | | | — | | | | — | |
| Series R | | | | | — | | | | 11,725 | | | | — | | | | — | | | | — | | | | 45,732 | | | | — | | | | — | |
| Series TE | | | | | 2,097 | | | | 8 | | | | — | | | | — | | | | 870 | | | | 33 | | | | — | | | | — | |
| (7) | Includes short-term capital gains, if any, distributed. |
| (8) | A portion of the distributions made represents a tax return of capital. Return of capital distributions have been reclassified from undistributed net investment income to paid-in capital to more appropriately conform financial accounting to tax accounting. |
| | | | | | |
| | ANNUAL REPORT | | OCTOBER 31, 2014 | | 125 |
Notes to Financial Statements (Cont.)
October 31, 2014
15. SUBSEQUENT EVENTS
In preparing these financial statements, the Portfolios’ management has evaluated events and transactions for potential recognition or disclosure through the date the financial statements were issued.
On December 19, 2014, the following distributions were declared to shareholders payable December 19, 2014 to shareholders of record on December 18, 2014.
| | | | | | | | | | |
| | | | | Ordinary Income
Distributions | | | Long-Term
Capital Gain
Distributions | |
| Series C | | | | $ | 0.21235 | | | $ | 0.36287 | |
| Series LD | | | | | 0.1699 | | | | — | |
| Series M | | | | | 0.17205 | | | | 0.14384 | |
| Series R | | | | | 0.43582 | | | | — | |
There were no other subsequent events identified that require recognition or disclosure.
| | | | | | |
| 126 | | PIMCO MANAGED ACCOUNTS TRUST | | | | |
Report of Independent Registered Public Accounting Firm
To the Shareholders and Board of Trustees of
PIMCO Managed Accounts Trust (formerly AllianzGI Managed Accounts Trust)
In our opinion, the accompanying statements of assets and liabilities, including the schedules of investments, and the related statements of operations, of changes in net assets and of cash flows (for PIMCO Fixed Income SHares: Series LD, PIMCO Fixed Income SHares: Series M, and PIMCO Fixed Income SHares: Series R only) and the financial highlights present fairly, in all material respects, the financial position of PIMCO Fixed Income SHares: Series C, PIMCO Fixed Income SHares: Series LD, PIMCO Fixed Income SHares: Series M, PIMCO Fixed Income SHares: Series R, and PIMCO Fixed Income SHares: Series TE (constituting PIMCO Managed Accounts Trust, formerly AllianzGI Managed Accounts Trust, hereafter referred to as the “Portfolios”) at October 31, 2014, the results of their operations, the changes in each of their net assets, the cash flows (for PIMCO Fixed Income SHares: Series LD, PIMCO Fixed Income SHares: Series M, and PIMCO Fixed Income SHares: Series R only) and the financial highlights for each of the periods presented, in conformity with accounting principles generally accepted in the United States of America. These financial statements and financial highlights (hereafter referred to as “financial statements”) are the responsibility of the Portfolios’ management. Our responsibility is to express an opinion on these financial statements based on our audits. We conducted our audits of these financial statements in accordance with the standards of the Public Company Accounting Oversight Board (United States). Those standards require that we plan and perform the audits to obtain reasonable assurance about whether the financial statements are free of material misstatement. An audit includes examining, on a test basis, evidence supporting the amounts and disclosures in the financial statements, assessing the accounting principles used and significant estimates made by management, and evaluating the overall financial statement presentation. We believe that our audits, which included confirmation of securities at October 31, 2014 by correspondence with the custodian and brokers, provide a reasonable basis for our opinion.
PricewaterhouseCoopers LLP
Kansas City, Missouri
December 23, 2014
| | | | | | |
| | ANNUAL REPORT | | OCTOBER 31, 2014 | | 127 |
Glossary: (abbreviations that may be used in the preceding statements)
(Unaudited)
| | | | | | | | | | |
| | | | |
| Counterparty Abbreviations: | | | | | | | | |
| BCY | | Barclays Capital, Inc. | | FOB | | Credit Suisse Securities (USA) LLC | | MYC | | Morgan Stanley Capital Services, Inc. |
| BOA | | Bank of America N.A. | | GLM | | Goldman Sachs Bank USA | | RDR | | RBC Dain Rausher, Inc. |
| BOS | | Banc of America Securities LLC | | GSC | | Goldman Sachs & Co. | | RYL | | Royal Bank of Scotland Group PLC |
| BPG | | BNP Paribas Securities Corp. | | GST | | Goldman Sachs International | | SAL | | Citigroup Global Markets, Inc. |
| CBK | | Citibank N.A. | | HUS | | HSBC Bank USA N.A. | | SSB | | State Street Bank and Trust Co. |
| CFR | | Credit Suisse Securities (Europe) Ltd. | | JPM | | JPMorgan Chase Bank N.A. | | TDM | | TD Securities (USA) LLC |
| DEU | | Deutsche Bank Securities, Inc. | | JPS | | JPMorgan Securities, Inc. | | UAG | | UBS AG Stamford |
| DUB | | Deutsche Bank AG | | MSB | | Morgan Stanley Bank, N.A | | UBS | | UBS Securities LLC |
| FBF | | Credit Suisse International | | MSC | | Morgan Stanley & Co., Inc. | | WFS | | Wells Fargo Securities, LLC |
| | | | |
| Currency Abbreviations: | | | | | | | | |
| AUD | | Australian Dollar | | GBP | | British Pound | | MYR | | Malaysian Ringgit |
| BRL | | Brazilian Real | | HUF | | Hungarian Forint | | NZD | | New Zealand Dollar |
| CAD | | Canadian Dollar | | INR | | Indian Rupee | | PLN | | Polish Zloty |
| DKK | | Danish Krone | | JPY | | Japanese Yen | | USD (or $) | | United States Dollar |
| EUR | | Euro | | MXN | | Mexican Peso | | | | |
| | | | |
| Exchange Abbreviations: | | | | | | | | |
| CDX.EM | | Credit Derivatives Index - Emerging Markets | | | | | | | | |
| | | | |
| Index Abbreviations: | | | | | | | | |
| CMBX | | Commercial Mortgage-Backed Index | | MCDX | | Municipal Bond Credit Derivative Index | | UKRPI | | United Kingdom Retail Price Index |
| CPURNSA | | Consumer Price All Urban Non-Seasonally Adjusted Index | | | | | | | | |
| | | | |
| Municipal Bond or Agency Abbreviations: | | | | | | | | |
| PSF | | Public School Fund | | | | | | | | |
| | | | |
| Other Abbreviations: | | | | | | | | |
| BBR | | Bank Bill Rate | | JSC | | Joint Stock Company | | RMBS | | Residential Mortgage-Backed Security |
| BBSW | | Bank Bill Swap Reference Rate | | LIBOR | | London Interbank Offered Rate | | TIIE | | Tasa de Interés Interbancaria de Equilibrio |
| CDI | | Brazil Interbank Deposit Rate | | MBS | | Mortgage-Backed Security | | TBD | | To Be Determined |
| CLO | | Collateralized Loan Obligation | | NCUA | | National Credit Union Administration | | YOY | | Year-Over-Year |
| EURIBOR | | Euro Interbank Offered Rate | | OTC | | Over the Counter | | | | |
| | | | | | |
| 128 | | PIMCO MANAGED ACCOUNTS TRUST | | | | |
Management of the Portfolios
(Unaudited)
The chart below identifies Trustees and Officers of the Trust. Unless otherwise indicated, the address of all persons below is c/o Pacific Investment Management Company LLC, 1633 Broadway, New York, New York 10019.
The Trust’s Statement of Additional Information includes more information about the Trustees and Officers. To request a copy, call PIMCO at 800-927-4648 or visit the Funds’ website at pimco.com/FISH.
Trustees
| | | | | | | | |
Name, Year of Birth
and Position(s) Held
with the Trust | | Term of
Office and
Length of
Time Served | | Principal Occupation(s) During the Past 5 Years | | Number
of Portfolios
in Fund
Complex
Overseen
by Trustee | | Other
Directorships
Held by Trustee
During the
Past 5 Years |
Independent Trustees |
Hans W. Kertess 1939 Chairman of the Board, Trustee | | Trustee since 2005. | | President, H. Kertess & Co., a financial advisory company. Formerly, Managing Director, Royal Bank of Canada Capital Markets. | | 89 | | None |
Deborah A. DeCotis 1952 Trustee | | Trustee since 2011. | | Advisory Director, Morgan Stanley & Co., Inc. (since 1996); Co-Chair Special Projects Committee, Memorial Sloan Kettering (since 2005); Member, Circle Financial Group (since 2010); Trustee, Stanford University (since 2010); and Member, Council on Foreign Relations (since 2013). Formerly, Director, Helena Rubenstein Foundation (1997-2012). | | 89 | | None |
Bradford K. Gallagher 1944 Trustee | | Trustee since 2010. | | Retired. Chairman and Trustee, Atlantic Maritime Heritage Foundation (since 2007); Founder, Spyglass Investments LLC, a private investment vehicle (since 2001); and Founder, President and CEO, Cypress Holding Company and Cypress Tree Investment Management Company (since 1995). Formerly, Chairman and Trustee, The Common Fund (2005-2014); and Partner, New Technology Ventures Capital Management LLC, a venture capital fund (2011-2013). | | 89 | | Formerly, Chairman and Trustee of Grail Advisors ETF Trust (2009-2010) and Trustee of Nicholas-Applegate Institutional Funds (2007-2010). |
James A. Jacobson 1945 Trustee | | Trustee since 2010. | | Retired. Formerly, Vice Chairman and Managing Director, Spear, Leeds & Kellogg Specialists, LLC, a specialist firm on the New York Stock Exchange. | | 89 | | Trustee, Alpine Mutual Funds Complex consisting of 17 funds. |
William B. Ogden, IV 1945 Trustee | | Trustee since 2006. | | Asset Management Industry Consultant. Formerly, Managing Director, Investment Banking Division of Citigroup Global Markets Inc. | | 89 | | None |
| | | | | | |
| | ANNUAL REPORT | | OCTOBER 31, 2014 | | 129 |
Management of the Portfolios (Cont.)
| | | | | | | | |
Name, Year of Birth
and Position(s) Held
with the Trust | | Term of
Office and
Length of
Time Served | | Principal Occupation(s) During the Past 5 Years | | Number
of Portfolios
in Fund
Complex
Overseen
by Trustee | | Other
Directorships
Held by Trustee
During the
Past 5 Years |
Alan Rappaport 1953 Trustee | | Trustee since 2010. | | Advisory Director (formerly Vice Chairman) (since 2009), Roundtable Investment Partners; Chairman (formerly President), Private Bank of Bank of America; Vice Chairman, US Trust (2001-2008); Adjunct Professor, New York University Stern School of Business (since 2011); Lecturer, Stanford University Graduate School of Business (since 2013); Trustee, American Museum of Natural History (since 2005) and Trustee, NYU Langone Medical Center (since 2007). | | 89 | | None |
| Interested Trustees |
Craig A. Dawson* 1968 Trustee | | Trustee since 2014. | | Managing Director and Head of Strategic Business Management, PIMCO (since 2014). Director of a number of PIMCO’s European investment vehicles and affiliates (since 2008). Formerly, head of PIMCO’s Munich office and head of European product management for PIMCO. | | 25 | | None |
John C. Maney** 1959 Trustee | | Trustee since 2006. | | Member of the Management Board and a Managing Director of Allianz Global Investors Fund Management LLC; Managing Director of Allianz Asset Management of America L.P. (since January 2005) and a member of the Management Board and Chief Operating Officer of Allianz Asset Management of America L.P. (since November 2006). | | 89 | | None |
| * | Mr. Dawson is an “interested person” of the Trust, as defined in Section 2(a)(19) of the Act, due to his affiliation with PIMCO and its affiliates. Mr. Dawson’s address is 650 Newport Center Drive, Newport Beach, CA 92660. |
| ** | Mr. Maney is an “interested person” of the Trust, as defined in Section 2(a)(19) of the Act, due to his affiliation with Allianz Asset Management of America L.P. and its affiliates. Mr. Maney’s address is 680 Newport Center Drive, Suite 250, Newport Beach, CA 92660. |
| | | | | | |
| 130 | | PIMCO MANAGED ACCOUNTS TRUST | | | | |
(Unaudited)
Officers
| | | | | | |
Name, Address
and Year of Birth | | Position(s)
Held
with Trust | | Term of Office
and Length
of Time Served | | Principal Occupation(s) During the Past 5 Years |
Peter G. Strelow1 1970 | | President; Principal Executive Officer | | Since 2014 | | Managing Director, PIMCO. President and Principal Executive Officer, PIMCO-Sponsored Closed-End Funds. Senior Vice President, PIMCO Funds, PIMCO Variable Insurance Trust and PIMCO ETF Trust. President, PIMCO Equity Series and PIMCO Equity Series VIT. |
Youse Guia1 1972 | | Chief Compliance Officer | | Since 2014 | | Senior Vice President and Deputy Chief Compliance Officer, PIMCO. Chief Compliance Officer, PIMCO-Sponsored Closed-End Funds. Formerly, Head of Compliance, Allianz Global Investors U.S. Holdings LLC and Chief Compliance Officer of the Allianz Funds, Allianz Multi-Strategy Trust, Allianz Global Investors Sponsored Closed-End Funds, Premier Multi-Series VIT and The Korea Fund, Inc. |
Joshua D. Ratner 1976 | | Vice President, Secretary and Chief Legal Officer | | Since 2014 | | Senior Vice President and Senior Counsel, PIMCO. Chief Legal Officer, PIMCO Investments LLC. Vice President, Secretary and Chief Legal Officer, PIMCO-Sponsored Closed-End Funds. Vice President—Senior Counsel, Secretary, PIMCO Funds, PIMCO Variable Insurance Trust, PIMCO ETF Trust, PIMCO Equity Series and PIMCO Equity Series VIT. |
Eric D. Johnson 1970 | | Vice President | | Since 2014 | | Executive Vice President, PIMCO. Vice President, PIMCO-Sponsored Closed-End Funds, PIMCO Funds, PIMCO Variable Insurance Trust, PIMCO ETF Trust, PIMCO Equity Series and PIMCO Equity Series VIT. |
William G. Galipeau1 1974 | | Treasurer, Principal Financial & Accounting Officer | | Since 2014 | | Senior Vice President, PIMCO. Treasurer and Principal Financial & Accounting Officer, PIMCO-Sponsored Closed-End Funds. Vice President, PIMCO Funds, PIMCO Variable Insurance Trust, PIMCO ETF Trust, PIMCO Equity Series and PIMCO Equity Series VIT. Formerly, Vice President, Fidelity Investments. |
Erik C. Brown1 1967 | | Vice President | | Since 2014 | | Senior Vice President, PIMCO. Vice President, PIMCO-Sponsored Closed-End Funds. Assistant Treasurer, PIMCO Funds, PIMCO Variable Insurance Trust, PIMCO ETF Trust, PIMCO Equity Series and PIMCO Equity Series VIT. |
Trent W. Walker1 1974 | | Assistant Treasurer | | Since 2014 | | Senior Vice President, PIMCO. Assistant Treasurer, PIMCO-Sponsored Closed-End Funds. Treasurer, PIMCO Funds, PIMCO Variable Insurance Trust, PIMCO ETF Trust, PIMCO Equity Series and PIMCO Equity Series VIT. |
Stacie D. Anctil1 1969 | | Assistant Treasurer | | Since 2014 | | Senior Vice President, PIMCO. Assistant Treasurer, PIMCO-Sponsored Closed-End Funds, PIMCO Funds, PIMCO Variable Insurance Trust, PIMCO ETF Trust, PIMCO Equity Series and PIMCO Equity Series VIT. |
Ryan Leshaw1 1980 | | Assistant Secretary | | Since 2014 | | Vice President and Counsel, PIMCO. Assistant Secretary, PIMCO-Sponsored Closed-End Funds, PIMCO Funds, PIMCO Variable Insurance Trust, PIMCO ETF Trust, PIMCO Equity Series and PIMCO Equity Series VIT. Formerly, Associate, Willkie Farr & Gallagher LLP. |
| 1 | The address of these officers is Pacific Investment Management Company LLC, 650 Newport Center Drive, Newport Beach, California 92660. |
| | | | | | |
| | ANNUAL REPORT | | OCTOBER 31, 2014 | | 131 |
Shareholder Meeting Results
(Unaudited)
Special Shareholder Meeting Results:
PIMCO Managed Accounts Trust held a special meeting of shareholders on June 9, 2014. Shareholders voted as indicated below:
Proposal 1: Approval of a new Investment Advisory Contract between the Trust, on behalf of each Portfolio, and PIMCO
| | | | | | | | | | | | | | |
| | | | | For | | | Against | | | Abstain | |
| Fixed Income SHares: Series C | | | | | 233,270,735 | | | | 33,245 | | | | 13,440 | |
| Fixed Income SHares: Series LD | | | | | 609,405 | | | | 0 | | | | 0 | |
| Fixed Income SHares: Series M | | | | | 259,492,006 | | | | 28,645 | | | | 0 | |
| Fixed Income SHares: Series R | | | | | 22,605,603 | | | | 0 | | | | 23,948 | |
| Fixed Income SHares: Series TE | | | | | 8,163,877 | | | | 0 | | | | 0 | |
Proposal 2: Election of Trustees
| | | | | | | | | | |
| | | | | Affirmative | | | Withheld
Authority | |
| Re-election of Hans W. Kertess | | | | | 554,569,689 | | | | 173,580 | |
| Election of Craig A. Dawson1,2 | | | | | 554,653,581 | | | | 89,688 | |
| Election of Deborah A. DeCotis | | | | | 554,573,596 | | | | 169,673 | |
| Re-election of Bradford K. Gallagher | | | | | 554,579,171 | | | | 164,098 | |
| Re-election of James A. Jacobson | | | | | 554,579,171 | | | | 164,098 | |
| Re-election of John C. Maney3 | | | | | 554,569,689 | | | | 173,580 | |
| Re-election of William B. Ogden, IV | | | | | 554,569,689 | | | | 173,580 | |
| Re-election of Alan Rappaport | | | | | 554,569,689 | | | | 173,580 | |
| 1 | Mr. Dawson is an “interested person” of the Trust (as that term is defined in the 1940 Act) because of his affiliations with PIMCO and its affiliates. |
| 2 | The election of Mr. Dawson as a Trustee of the Trust became effective as of the close of business on September 5, 2014. |
| 3 | Mr. Maney is an “interested person” of the Trust (as that term is defined in the 1940 Act) because of his affiliations with Allianz Asset Management of America L.P. and its affiliates. |
| | | | | | |
| 132 | | PIMCO MANAGED ACCOUNTS TRUST | | | | |
Changes to Boards of Trustees
(Unaudited)
Effective at the close of business on September 5, 2014, Craig A. Dawson became a Trustee of PIMCO Managed Accounts Trust.
| | | | | | |
| | ANNUAL REPORT | | OCTOBER 31, 2014 | | 133 |
Matters Relating to the Trustees’ Consideration of the Investment Advisory and Portfolio Management Agreements
As discussed in Notes 1 and 8 in the Notes to Financial Statements, an Investment Advisory Contract between the FISH Portfolios (each a “Portfolio,” and, collectively, the “Portfolios”) and PIMCO (the “New Agreement”) became effective at the close of business on September 5, 2014, and at that time PIMCO replaced AGIFM as the investment adviser of each Portfolio and ceased serving as each Portfolio’s sub-adviser. Prior thereto, each Portfolio had in place an Investment Advisory Contract with AGIFM (the “Advisory Agreements”) and Portfolio Management Agreement between AGIFM and PIMCO (the “Sub-Advisory Agreements,” and, together with the Advisory Agreements, the “Previous Agreements”), which terminated at the close of business on September 5, 2014. However, the terms of the Previous Agreements with respect to Fixed Income SHares: Series C, Fixed Income SHares: Series M, Fixed Income SHares: Series R and Fixed Income SHares: Series TE (each, a “Renewal Portfolio and, together, the “Renewal Portfolios”) would have terminated before the New Agreement took effect, and, therefore, the Trustees were asked to approve the continuance of the Previous Agreements with respect to the Renewal Portfolios for an additional term which would expire upon the effectiveness of the New Agreement or, in the event the New Agreement had not been approved by shareholders of each Portfolio, for an additional one-year period. The Investment Company Act of 1940, as amended, required that both the full Board of Trustees of each Portfolio (the “Board” or the “Trustees”) and a majority of the non-interested Trustees (the “Independent Trustees”), voting separately, approve each Previous Agreement. Accordingly, the Trustees met in person on June 23-24, 2014 (the “contract review meeting”) for the specific purpose of considering whether to approve the continuation of the Previous Agreements with respect to the Renewal Portfolios. The Independent Trustees were assisted in their evaluation of the Previous Agreements by independent legal counsel, from whom they received separate legal advice and with whom they met separately from Portfolio management during the contract review meeting.
In connection with their deliberations regarding the proposed continuation of the Previous Agreements, the Trustees, including the Independent Trustees, considered such information and factors as they believed, in light of the legal advice furnished to them and their own business judgment, to be relevant. The Trustees considered the nature, quality, and extent of the various investment management and other services performed by AGIFM and PIMCO under the Previous Agreements.
In connection with their contract review meeting, the Trustees relied upon materials provided by AGIFM and PIMCO for the Meeting or for prior meetings, which included, among other items: (i) information regarding the investment performance and management fees for other funds and accounts managed by PIMCO, including institutional and separate accounts, if available, with strategies that have similarities (but are not substantially similar) to those of the Renewal Portfolios, (ii) the estimated profitability to AGIFM and its affiliates from their relationship with the Renewal Portfolios for the one-year period ended December 31, 2013, (iii) descriptions of various functions performed by AGIFM, its affiliates and PIMCO for the Renewal Portfolios, such as portfolio management, compliance monitoring and portfolio trading practices, and (iv) information regarding the overall organization of AGIFM and PIMCO, including information regarding senior management, portfolio managers and other personnel providing investment management, administrative and other services to the Renewal Portfolios.
The Trustees’ conclusions as to the continuation of the Previous Agreements were based on a comprehensive consideration of all information provided to the Trustees and were not the result of
| | | | | | |
| 134 | | PIMCO MANAGED ACCOUNTS TRUST | | | | |
(Unaudited)
any single factor. Some of the factors that figured particularly in their deliberations are described below, although individual Trustees may have evaluated the information presented differently from one another, attributing different weights to various factors.
In addition, it was noted that the Trustees considered matters bearing on the Renewal Portfolios and their advisory arrangements at their meetings throughout the year, including a review of performance data at each regular meeting.
The Trustees also considered the investment philosophy and research and decision-making processes of PIMCO; the experience of key advisory personnel of PIMCO responsible for portfolio management of the Renewal Portfolios; the ability of AGIFM and PIMCO to attract and retain capable personnel; and the capability of the senior management and staff of AGIFM and PIMCO. In addition, the Trustees reviewed the quality of AGIFM’s and PIMCO’s services with respect to regulatory compliance and compliance with the investment policies of the Renewal Portfolios and conditions that might have affected AGIFM’s and PIMCO’s ability to provide high quality services to the Renewal Portfolios in the future under the Previous Agreements, including AGIFM’s and PIMCO’s financial condition and operational stability. Based on the foregoing, the Trustees concluded that PIMCO’s investment process, research capabilities and philosophy were well suited to the Renewal Portfolios given their investment objectives and policies, and that AGIFM and PIMCO would be able to continue to meet any reasonably foreseeable obligations under the applicable Previous Agreement.
The Trustees also considered the performance of the Renewal Portfolios as compared to the performance of other accounts managed by PIMCO, including composites of such accounts. The Trustees considered the fact that the Renewal Portfolios do not have investment objectives or policies that align closely with any particular account or fund managed by PIMCO, but that management had provided information for various mutual funds and other accounts managed by PIMCO with strategies that have similarities (but are not substantially similar) to those of the Portfolios. In the course of their deliberations, the Trustees took into account information provided by AGIFM at this Meeting and by PIMCO prior Board meetings, as well as information provided during investment review meetings conducted with portfolio management personnel during the course of the year regarding each Renewal Portfolio’s performance.
The Trustees also gave substantial consideration to the fact that, with respect to the Renewal Portfolios, no fees were payable to AGIFM or PIMCO under either of the Previous Agreements. The Trustees did consider, however, the amounts paid by the sponsors of the “wrap” programs to PIMCO and/or other AGIFM affiliates with respect to the Trust, as well as the fees “imputed” to AGIFM and PIMCO, for purposes of arriving at an estimate of profitability arising from AGIFM’s and its affiliates’ relationships with the Renewal Portfolios. The Trustees determined that such profitability did not appear to be excessive. Because the Renewal Portfolios do not pay fees directly, the Trustees did not place emphasis on the extent to which economies of scale would be realized due to potential growth of assets in the Renewal Portfolios or whether fee and expense levels reflect economies of scale for the Renewal Portfolios’ shareholders.
The Trustees considered the fact that AGIFM, PIMCO and their affiliates may benefit from their relationships with the sponsors of wrap programs for which the Portfolios are an investment option,
| | | | | | |
| | ANNUAL REPORT | | OCTOBER 31, 2014 | | 135 |
Matters Relating to the Trustees’ Consideration of the Investment Advisory and Portfolio Management Agreements (Cont.) | (Unaudited) |
including the receipt by AGIFM, PIMCO and their affiliates of fees paid by the sponsor of the wrap program based on assets under management of the wrap program. The Trustees also took into account other so-called “fallout benefits” to AGIFM and PIMCO, such as reputational value derived from serving as investment adviser and portfolio manager to the Renewal Portfolios and the fact that AGIFM and/or PIMCO receive services from brokers who execute portfolio transactions for the Renewal Portfolios.
After reviewing these and other factors described herein, including that no fees were payable under the Previous Agreements, the Trustees concluded with respect to each Renewal Portfolio, within the context of their overall conclusions regarding the Previous Agreements and based on the information provided and related representations made by management, that they were satisfied with AGIFM’s and PIMCO’s responses and efforts relating to the investment performance of such Renewal Portfolio. Based on their evaluation of factors that they deemed to be material, including those factors described above, the Trustees, including the Independent Trustees, unanimously concluded that the nature, extent and quality of the services being provided by AGIFM and PIMCO to the Renewal Portfolios were reasonable, and that the continuation of the Previous Agreements was in the interests of each Renewal Portfolio and its shareholders, and should be approved.
| | | | | | |
| 136 | | PIMCO MANAGED ACCOUNTS TRUST | | | | |
Privacy Policy
(Unaudited)
The Portfolios1 consider customer privacy to be a fundamental aspect of their relationships with shareholders and are committed to maintaining the confidentiality, integrity and security of their current, prospective and former shareholders’ non-public personal information. The Portfolios have developed policies that are designed to protect this confidentiality, while allowing shareholder needs to be served.
Obtaining Personal Information
In the course of providing shareholders with products and services, the Portfolios and certain service providers to the Portfolios such as the Portfolios’ investment adviser (“Adviser”), may obtain non-public personal information about shareholders, which may come from sources such as account applications and other forms, from other written, electronic or verbal correspondence, from shareholder transactions, from a shareholder’s brokerage or financial advisory firm, financial advisor or consultant, and/or from information captured on applicable websites.
Respecting Your Privacy
As a matter of policy, the Portfolios do not disclose any non-public personal information provided by shareholders or gathered by the Portfolios to non-affiliated third parties, except as required or permitted by law or as necessary for such third parties to perform their agreements with respect to the Portfolios. As is common in the industry, non-affiliated companies may from time to time be used to provide certain services, such as preparing and mailing prospectuses, reports, account statements and other information, conducting research on shareholder satisfaction and gathering shareholder proxies. The Portfolios or their affiliates may also retain non-affiliated companies to market Portfolio shares or products which use Portfolio shares and enter into joint marketing arrangements with them and other companies. These companies may have access to a shareholder’s personal and account information, but are permitted to use this information solely to provide the specific service or as otherwise permitted by law. In most cases, the shareholders will be clients of a third party, but the Portfolios may also provide a shareholder’s personal and account information to the shareholder’s respective brokerage or financial advisory firm and/or financial advisor or consultant.
Sharing Information with Third Parties
The Portfolios reserve the right to disclose or report personal or account information to non-affiliated third parties in limited circumstances where the Portfolios believe in good faith that disclosure is required under law, to cooperate with regulators or law enforcement authorities, to protect their rights or property, or upon reasonable request by any fund advised by PIMCO in which a shareholder has invested. In addition, the Portfolios may disclose information about a shareholder or a shareholder’s accounts to a non-affiliated third party at the shareholder’s request or with the consent of the shareholder.
Sharing Information with Affiliates
The Portfolios may share shareholder information with their affiliates in connection with servicing shareholders’ accounts, and subject to applicable law may provide shareholders with information
| 1 | When distributing this Policy, a Portfolio may combine the distribution with any similar distribution of its investment adviser’s privacy policy. The distributed, combined policy may be written in the first person (i.e., by using “we” instead of “the Portfolios”). |
| | | | | | |
| | ANNUAL REPORT | | OCTOBER 31, 2014 | | 137 |
Privacy Policy (Cont.)
(Unaudited)
about products and services that the Portfolios or their Adviser or its affiliates (“Service Affiliates”) believe may be of interest to such shareholders. The information that the Portfolios may share may include, for example, a shareholder’s participation in the Portfolios or in other investment programs sponsored by a Service Affiliate, a shareholder’s ownership of certain types of accounts (such as IRAs), information about the Portfolios’ experiences or transactions with a shareholder, information captured on applicable websites, or other data about a shareholder’s accounts, subject to applicable law. The Portfolios’ Service Affiliates, in turn, are not permitted to share shareholder information with non-affiliated entities, except as required or permitted by law.
Procedures to Safeguard Private Information
The Portfolios take seriously the obligation to safeguard shareholder non-public personal information. In addition to this policy, the Portfolios have implemented procedures that are designed to restrict access to a shareholder’s non-public personal information to internal personnel who need to know that information to perform their jobs, such as servicing shareholder accounts or notifying shareholders of new products or services. Physical, electronic and procedural safeguards are in place to guard a shareholder’s non-public personal information.
Information Collected from Websites
Websites maintained by the Portfolios or their service providers may use a variety of technologies to collect information that help the Portfolios and their service providers understand how the website is used. Information collected from your web browser (including small files stored on your device that are commonly referred to as “cookies”) allow the websites to recognize your web browser and help to personalize and improve your user experience and enhance navigation of the website. In addition, the Portfolios or their Service Affiliates may use third parties to place advertisements for the Portfolios on other websites, including banner advertisements. Such third parties may collect anonymous information through the use of cookies or action tags (such as web beacons). The information these third parties collect is generally limited to technical and web navigation information, such as your IP address, web pages visited and browser type, and does not include personally identifiable information such as name, address, phone number or email address.
You can change your cookie preferences by changing the setting on your web browser to delete or reject cookies. If you delete or reject cookies, some website pages may not function properly.
Changes to the Privacy Policy
From time to time, the Portfolios may update or revise this privacy policy. If there are changes to the terms of this privacy policy, documents containing the revised policy on the relevant website will be updated.
Effective as of September 5, 2014.
| | | | | | |
| 138 | | PIMCO MANAGED ACCOUNTS TRUST | | | | |
General Information
Investment Adviser and Administrator
Pacific Investment Management Company LLC
650 Newport Center Drive
Newport Beach, CA 92660
Distributor
PIMCO Investments LLC
1633 Broadway
New York, NY 10019
Custodian
State Street Bank & Trust Co.
225 Franklin Street
Boston, MA 02110
Transfer Agent
Boston Financial Data Service
330 W. 9th Street
Kansas City, MO 64105
Legal Counsel
Ropes & Gray LLP
Prudential Tower
800 Boylston Street
Boston, MA 02199
Independent Registered Public Accounting Firm
PricewaterhouseCoopers LLP
1100 Walnut Street, Suite 1300
Kansas City, MO 64106
This report is submitted for the general information of the shareholders of PIMCO Managed Accounts Trust. PIMCO FISH Series C, PIMCO FISH Series LD, PIMCO FISH Series M, PIMCO FISH Series R and PIMCO FISH Series TE.

Sign up for e-delivery
To get future shareholder reports online and to eliminate mailings, go to: pimco.com/edelivery
pimco.com/investments

FISH3001AR_103114
As of the end of the period covered by this report, the Registrant has adopted a code of ethics (the “Code”) that applies to the Registrant’s principal executive officer and principal financial & accounting officer. The Registrant did not grant any waivers, including implicit waivers, from any provisions of the Code to the principal executive officer or principal financial & accounting officer during the period covered by this report.
A copy of the Code is included as an exhibit to this report.
| Item 3. | Audit Committee Financial Expert. |
(a) The Board of Trustees has determined that James A. Jacobson, who serves on the Board’s audit committee, qualifies as an “audit committee financial expert” as such term is defined in the instructions to this Item 3. The Board has also determined that Mr. Jacobson is “independent” as such term is interpreted under this Item 3.
| Item 4. | Principal Accountant Fees and Services. |
| | | | | | |
| (a) | | Fiscal Year Ended | | Audit Fees | | |
| | October 31, 2014 | | $ 172,663 | |
| | October 31, 2013 | | $ 224,350 | |
| | | | | |
| (b) | | Fiscal Year Ended | | Audit-Related Fees | |
| | October 31, 2014 | | $ — | |
| | October 31, 2013 | | $ — | |
| | | | | |
| (c) | | Fiscal Year Ended | | Tax Fees | |
| | October 31, 2014 | | $ 70,920 | |
| | October 31, 2013 | | $ 54,440 | |
| | | | | |
| (d) | | Fiscal Year Ended | | All Other Fees(1) | | |
| | October 31, 2014 | | $ — | | |
| | October 31, 2013 | | $ — | | |
“Audit Fees” represents fees billed for each of the last two fiscal years for professional services rendered for the audit and review of the Registrant’s annual financial statements for those fiscal years or services that are normally provided by the accountant in connection with statutory or regulatory filings or engagements for those fiscal years.
“Audit-Related Fees” represents fees billed for each of the last two fiscal years for assurance and related services that are reasonably related to the performance of the audit or review of the Registrant’s financial statements, but not reported under “Audit Fees” above, and that include accounting consultations, agreed-upon procedure reports, attestation reports and comfort letters for those fiscal years.
“Tax Fees” represents fees billed for each of the last two fiscal years for professional services related to tax compliance, tax advice and tax planning, including services relating to the filing or amendment of federal, state or local income tax returns, regulated investment company qualification reviews, and tax distribution and analysis reviews.
“All Other Fees” represents fees, if any, billed for other products and services rendered by the principal accountant to the Registrant other than those reported above under “Audit Fees,” “Audit-Related Fees” and “Tax Fees” for the last two fiscal years.
(1)There were no “All Other Fees” for the last two fiscal years.
| | (e) | Pre-approval policies and procedures |
(1) The Registrant’s Audit Committee has adopted pre-approval policies and procedures (the “Procedures”) to govern the Audit Committee’s pre-approval of (i) all audit services and permissible non-audit services to be provided to the Registrant by its independent accountant, and (ii) all permissible non-audit services to be provided by such independent accountant to the Registrant’s investment adviser and to any entity controlling, controlled by, or under common control with the investment adviser that provides ongoing services to the Registrant (collectively, the “Service Affiliates”) if the services provided directly relate to the Registrant’s operations and financial reporting. In accordance with the Procedures, the Audit Committee is responsible for the engagement of the independent accountant to certify the Registrant’s financial statements for each fiscal year. With respect to the pre-approval of non-audit services provided to the Registrant and its Service Affiliates, the Procedures provide that the Audit Committee may annually pre-approve a list of types or categories of non-audit services that may be provided to the Registrant or its Service Affiliates, or the Audit Committee may pre-approve such services on a project-by-project basis as they arise. Unless a type of service has received general pre-approval, it will require specific pre-approval by the Audit Committee if it is to be provided by the independent accountant. The Procedures also permit the Audit Committee to delegate authority to one or more of its members to pre-approve any proposed non-audit services that have not been previously pre-approved by the Committee, subject to the ratification by the full Audit Committee no later than its next scheduled meeting.
(2) With respect to the services described in paragraphs (b) through (d) of this Item 4, no amount was approved by the Audit Committee pursuant to paragraph (c)(7)(i)(C) of Rule 2-01 of Regulation S-X.
| | | | |
| | | Aggregate Non-Audit Fees Billed to Entity |
| | | | | | | | |
Entity | | | | | October 31, 2014 | | | |
PIMCO Managed Accounts Trust | | | $ 70,920 | | | |
Pacific Investment Management Company LLC (“PIMCO”) | | | 6,692,504 | | | |
Allianz Global Investors Fund Management LLC | | | 137,840 | | | |
| | | | | | |
Total | | | $ 6,901,264 | | | |
| | | | | | | | |
The aggregate non-audit fees billed by the Auditor for services rendered to the Registrant, and rendered to the Adviser, for the fiscal period ended October 31, 2013 was $7,490,693.
h) The Registrant’s Audit Committee has considered whether the provision of non-audit services that were rendered to the Registrant’s investment adviser, and any entity controlling, controlled by, or under common control with the investment adviser that provides ongoing services to the Registrant which were not pre-approved (not requiring preapproval) is compatible with maintaining the principal accountant’s independence.
| Item 5. | Audit Committee of Listed Registrants. |
The Registrant has a separately-designated standing audit committee established in accordance with Section 3(a)(58)(A) of the Securities Exchange Act of 1934, as amended. The audit committee is comprised of:
Deborah A. DeCotis;
Bradford K. Gallagher;
James A. Jacobson;
Hans W. Kertess;
William B. Ogden, IV; and
Alan Rappaport
| Item 6. | Schedule of Investments. |
The Schedule of Investments is included as part of the reports to shareholders under Item 1.
| Item 7. | Disclosure of Proxy Voting Policies and Procedures for Closed-End Management Investment Companies. |
Not applicable.
| Item 8. | Portfolio Managers of Closed-End Management Investment Companies. |
Not applicable.
| Item 9. | Purchases of Equity Securities by Closed-End Management Investment Company and Affiliated Purchasers. |
Not applicable.
| Item 10. | Submission of Matters to a Vote of Security Holders. |
There have been no material changes to the procedures by which shareholders may recommend nominees to the Fund’s Board of Trustees since the Fund last provided disclosure in response to this item.
| Item 11. | Controls and Procedures. |
| | (a) | The principal executive officer and principal financial & accounting officer have concluded that the Registrant’s disclosure controls and procedures (as defined in Rule 30a-3(c) under the Investment Company Act of 1940, as amended (“1940 Act”)) provide reasonable assurances that material information relating to the Registrant is made known to them by the appropriate persons, based on their evaluation of these controls and procedures as of a date within 90 days of the filing of this report. |
| | (b) | There were no changes in the Registrant’s internal control over financial reporting (as defined in Rule 30a-3(d) under the 1940 Act) that occurred during the second fiscal quarter of the period covered by this report that have materially affected, or are reasonably likely to materially affect, the Registrant’s internal control over financial reporting. |
| | (a)(1) | Exhibit 99.CODE—Code of Ethics pursuant to Section 406 of the Sarbanes-Oxley Act of 2002. |
| | (a)(2) | Exhibit 99.CERT—Certifications pursuant to Section 302 of the Sarbanes-Oxley Act of 2002. |
| | (b) | Exhibit 99.906CERT—Certifications pursuant to Section 906 of the Sarbanes-Oxley Act of 2002. |
Signatures
Pursuant to the requirements of the Securities Exchange Act of 1934 and the Investment Company Act of 1940, the registrant has duly caused this report to be signed on its behalf by the undersigned, thereunto duly authorized.
| | |
PIMCO Managed Accounts Trust |
| |
By: | | /s/ PETER G. STRELOW |
| | Peter G. Strelow |
| | President, Principal Executive Officer |
| |
| Date: | | December 29, 2014 |
Pursuant to the requirements of the Securities Exchange Act of 1934 and the Investment Company Act of 1940, this report has been signed below by the following persons on behalf of the registrant and in the capacities and on the dates indicated.
| | |
By: | | /s/ PETER G. STRELOW |
| | Peter G. Strelow |
| | President, Principal Executive Officer |
| |
| Date: | | December 29, 2014 |
| |
By: | | /s/ WILLIAM G. GALIPEAU |
| | William G. Galipeau |
| | Treasurer, Principal Financial & Accounting Officer |
| |
| Date: | | December 29, 2014 |