UNITED STATES
SECURITIES AND EXCHANGE COMMISSION
Washington, D.C. 20549
FORM N-CSR
CERTIFIED SHAREHOLDER REPORT OF REGISTERED MANAGEMENT INVESTMENT COMPANIES
Investment Company Act file number: 811-09729
Name of Fund: iShares Trust
Fund Address: c/o BlackRock Fund Advisors, 400 Howard Street, San Francisco, CA 94105
Name and address of agent for service: The Corporation Trust Company, 1209 Orange Street, Wilmington, DE 19801
Registrant’s telephone number, including area code: (415) 670-2000
Date of fiscal year end: 07/31/2024
Date of reporting period: 07/31/2024
Item 1 – Reports to Stockholders
(a) The Reports to Shareholders are attached herewith.
iShares ESG Aware Aggressive Allocation ETF
Annual Shareholder Report — July 31, 2024
This annual shareholder report contains important information about iShares ESG Aware Aggressive Allocation ETF (the “Fund”) for the period of August 1, 2023 to July 31, 2024. You can find additional information about the Fund at blackrock.com/fundreports. You can also request this information by contacting us at 1-800-iShares (1-800-474-2737).
What were the Fund costs for the last year?
(based on a hypothetical $10,000 investment)
| Fund name | Costs of a $10,000 investment | Costs paid as a percentage of a $10,000 investment |
|---|
| iShares ESG Aware Aggressive Allocation ETF | $2Footnote Reference(a) | 0.02%Footnote Reference(a) |
| Footnote | Description |
Footnote(a) | Excludes fees and expenses incurred indirectly as a result of investments in underlying funds. |
How did the Fund perform last year?
Slowing inflationary pressures and hopes of interest rate cuts drove global equities higher for the reporting period.
The U.S. Federal Reserve left rates on hold during the 12-month period as the central bank sought greater confidence in slowing inflationary pressures. As inflation measures became more subdued, expectations increased for interest rate cuts in 2024.
Bonds underperformed equities yet still delivered generally positive total returns during the reporting period. Amid economic growth concerns, central banks began to pivot away from higher interest rates to easing monetary policy, causing volatility in Treasury yields.
What contributed to performance?
U.S. equities were the largest component of the Fund, comprising approximately 55% during the reporting period, and were also the most significant driver of the Fund’s return. Driven by investor demand for artificial intelligence, a handful of U.S. information technology companies dominated market performance as they innovated rapidly, captured significant market share, and generated substantial profits. The U.S. financials sector also advanced, helped by solid earnings results. Stocks in international developed markets also advanced, led by the financials sector.
Bonds comprised approximately 19% of the Fund during the reporting period. As inflation measures began to subside and future interest rate cuts came into view, U.S. investment-grade bonds advanced given their potential for higher yield.
What detracted from performance?
Given the solid performance of both equities and fixed income securities, there were no meaningful detractors to the Fund’s performance during the reporting period.
The views expressed reflect the opinions of BlackRock as of the date of this report and are subject to change based on changes in market, economic or other conditions. These views are not intended to be a forecast of future events and are no guarantee of future results.
Cumulative performance: June 12, 2020 through July 31, 2024
Initial investment of $10,000
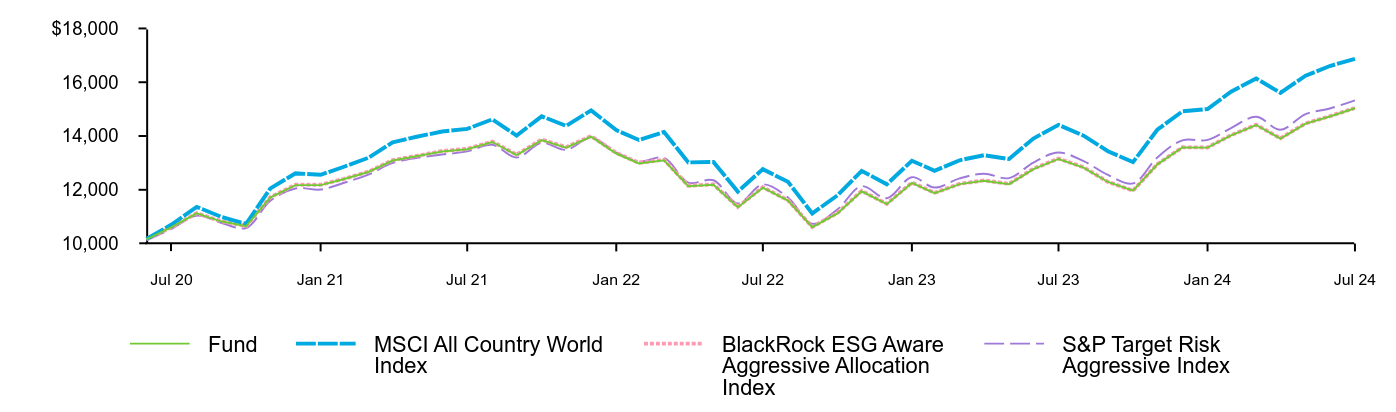
| Fund | MSCI All Country World Index | BlackRock ESG Aware Aggressive Allocation Index | S&P Target Risk Aggressive Index |
|---|
| Jun 20 | 10,154 | 10,171 | 10,157 | 10,119 |
| Jul 20 | 10,610 | 10,709 | 10,614 | 10,551 |
| Aug 20 | 11,122 | 11,364 | 11,128 | 11,038 |
| Sep 20 | 10,828 | 10,998 | 10,835 | 10,777 |
| Oct 20 | 10,648 | 10,731 | 10,654 | 10,580 |
| Nov 20 | 11,718 | 12,054 | 11,726 | 11,598 |
| Dec 20 | 12,174 | 12,614 | 12,186 | 12,051 |
| Jan 21 | 12,174 | 12,557 | 12,186 | 12,008 |
| Feb 21 | 12,390 | 12,848 | 12,399 | 12,252 |
| Mar 21 | 12,662 | 13,191 | 12,673 | 12,565 |
| Apr 21 | 13,088 | 13,768 | 13,100 | 13,000 |
| May 21 | 13,256 | 13,982 | 13,270 | 13,191 |
| Jun 21 | 13,425 | 14,166 | 13,441 | 13,309 |
| Jul 21 | 13,509 | 14,264 | 13,523 | 13,428 |
| Aug 21 | 13,778 | 14,621 | 13,794 | 13,673 |
| Sep 21 | 13,287 | 14,017 | 13,308 | 13,201 |
| Oct 21 | 13,848 | 14,732 | 13,870 | 13,745 |
| Nov 21 | 13,566 | 14,377 | 13,585 | 13,489 |
| Dec 21 | 13,974 | 14,952 | 13,998 | 13,934 |
| Jan 22 | 13,349 | 14,218 | 13,372 | 13,385 |
| Feb 22 | 12,981 | 13,851 | 13,002 | 13,048 |
| Mar 22 | 13,099 | 14,151 | 13,120 | 13,190 |
| Apr 22 | 12,132 | 13,018 | 12,151 | 12,266 |
| May 22 | 12,184 | 13,033 | 12,203 | 12,356 |
| Jun 22 | 11,354 | 11,934 | 11,367 | 11,490 |
| Jul 22 | 12,081 | 12,767 | 12,096 | 12,200 |
| Aug 22 | 11,600 | 12,297 | 11,614 | 11,710 |
| Sep 22 | 10,608 | 11,120 | 10,620 | 10,734 |
| Oct 22 | 11,124 | 11,791 | 11,138 | 11,269 |
| Nov 22 | 11,944 | 12,706 | 11,959 | 12,133 |
| Dec 22 | 11,467 | 12,206 | 11,480 | 11,686 |
| Jan 23 | 12,255 | 13,081 | 12,269 | 12,469 |
| Feb 23 | 11,878 | 12,706 | 11,890 | 12,084 |
| Mar 23 | 12,210 | 13,098 | 12,223 | 12,426 |
| Apr 23 | 12,337 | 13,286 | 12,350 | 12,600 |
| May 23 | 12,210 | 13,144 | 12,222 | 12,434 |
| Jun 23 | 12,771 | 13,907 | 12,785 | 13,014 |
| Jul 23 | 13,147 | 14,416 | 13,162 | 13,383 |
| Aug 23 | 12,824 | 14,013 | 12,838 | 13,064 |
| Sep 23 | 12,291 | 13,434 | 12,294 | 12,556 |
| Oct 23 | 11,966 | 13,030 | 11,969 | 12,237 |
| Nov 23 | 12,946 | 14,233 | 12,951 | 13,203 |
| Dec 23 | 13,572 | 14,917 | 13,579 | 13,838 |
| Jan 24 | 13,568 | 15,004 | 13,575 | 13,857 |
| Feb 24 | 14,021 | 15,648 | 14,028 | 14,297 |
| Mar 24 | 14,410 | 16,139 | 14,418 | 14,714 |
| Apr 24 | 13,907 | 15,607 | 13,915 | 14,233 |
| May 24 | 14,461 | 16,241 | 14,470 | 14,814 |
| Jun 24 | 14,726 | 16,603 | 14,737 | 15,025 |
| Jul 24 | 15,031 | 16,871 | 15,042 | 15,328 |
See “Average annual total returns” for additional information on fund performance.
Average annual total returns
| Average Annual Total Returns | 1 Year | Since Fund Inception |
|---|
Fund NAV........................................................................................................................................................................................................................................................................................................................................................................................................................................................................................................................................................................................................................................................................................................................................................................................................................................................................................................................................................................................................................................ | 14.34% | 10.35% |
Fund Market........................................................................................................................................................................................................................................................................................................................................................................................................................................................................................................................................................................................................................................................................................................................................................................................................................................................................................................................................................................................................................................ | 14.39 | 10.36 |
MSCI All Country World Index........................................................................................................................................................................................................................................................................................................................................................................................................................................................................................................................................................................................................................................................................................................................................................................................................................................................................................................................................................................................................................................ | 17.02 | 13.48 |
BlackRock ESG Aware Aggressive Allocation Index........................................................................................................................................................................................................................................................................................................................................................................................................................................................................................................................................................................................................................................................................................................................................................................................................................................................................................................................................................................................................................................ | 14.37 | 10.40 |
S&P Target Risk Aggressive Index........................................................................................................................................................................................................................................................................................................................................................................................................................................................................................................................................................................................................................................................................................................................................................................................................................................................................................................................................................................................................................................ | 14.54 | 10.88 |
Net Assets........................................................................................................................................................................................................................................................................................................................................................................................................................................................................................................................................................................................................................................................................................................................................................................................................................................................................................................................................................................................................................................ | $28,116,639 |
Number of Portfolio Holdings........................................................................................................................................................................................................................................................................................................................................................................................................................................................................................................................................................................................................................................................................................................................................................................................................................................................................................................................................................................................................................................ | 7 |
Net Investment Advisory Fees........................................................................................................................................................................................................................................................................................................................................................................................................................................................................................................................................................................................................................................................................................................................................................................................................................................................................................................................................................................................................................................ | $5,639 |
Portfolio Turnover Rate........................................................................................................................................................................................................................................................................................................................................................................................................................................................................................................................................................................................................................................................................................................................................................................................................................................................................................................................................................................................................................................ | 4% |
The Fund has added the MSCI All Country World Index in response to new regulatory requirements.
The inception date of the Fund was June 12, 2020. The first day of secondary market trading was June 18, 2020.
Past performance is not an indication of future results. Performance results do not reflect the deduction of taxes that a shareholder would pay on fund distributions or on the redemption or sale of fund shares. Visit iShares.com for more recent performance information.
What did the Fund invest in?
| Asset Class | Percent of Total InvestmentsFootnote Reference(a) |
|---|
Domestic Equity........................................................................................................................................................................................................................................................................................................................................................................................................................................................................................................................................................................................................................................................................................................................................................................................................................................................................................................................................................................................................................................ | 55.2% |
International Equity........................................................................................................................................................................................................................................................................................................................................................................................................................................................................................................................................................................................................................................................................................................................................................................................................................................................................................................................................................................................................................................ | 25.4 |
Domestic Fixed Income........................................................................................................................................................................................................................................................................................................................................................................................................................................................................................................................................................................................................................................................................................................................................................................................................................................................................................................................................................................................................................................ | 19.4 |
| Security | Percent of TotaI InvestmentsFootnote Reference(a) |
|---|
iShares ESG Aware MSCI USA ETF........................................................................................................................................................................................................................................................................................................................................................................................................................................................................................................................................................................................................................................................................................................................................................................................................................................................................................................................................................................................................................................ | 50.2% |
iShares ESG Aware U.S. Aggregate Bond ETF........................................................................................................................................................................................................................................................................................................................................................................................................................................................................................................................................................................................................................................................................................................................................................................................................................................................................................................................................................................................................................................ | 19.4 |
iShares ESG Aware MSCI EAFE ETF........................................................................................................................................................................................................................................................................................................................................................................................................................................................................................................................................................................................................................................................................................................................................................................................................................................................................................................................................................................................................................................ | 17.6 |
iShares ESG Aware MSCI EM ETF........................................................................................................................................................................................................................................................................................................................................................................................................................................................................................................................................................................................................................................................................................................................................................................................................................................................................................................................................................................................................................................ | 7.8 |
iShares ESG Aware MSCI USA Small-Cap ETF........................................................................................................................................................................................................................................................................................................................................................................................................................................................................................................................................................................................................................................................................................................................................................................................................................................................................................................................................................................................................................................ | 5.0 |
|
| Footnote | Description |
Footnote(a) | Excludes money market funds. |
If you wish to view additional information about the Fund, including but not limited to financial statements, the Fund’s prospectus, and proxy voting policies and procedures, please visit blackrock.com/fundreports. For proxy voting records, visit blackrock.com/proxyrecords.
Householding is an option available to certain fund investors. Householding is a method of delivery, based on the preference of the individual investor, in which a single copy of certain shareholder documents can be delivered to investors who share the same address, even if their accounts are registered under different names. Please contact your broker-dealer if you are interested in enrolling in householding and receiving a single copy of prospectuses and other shareholder documents, or if you are currently enrolled in householding and wish to change your householding status.
The Fund is not sponsored, endorsed, issued, sold, or promoted by MSCI Inc., S&P Dow Jones Indices LLC or BlackRock Index Services, LLC and its affiliates, nor do these companies make any representation regarding the advisability of investing in the Fund. With the exception of BlackRock Index Services, LLC, who is an affiliate, BlackRock is not affiliated with the companies listed above.
© 2024 BlackRock, Inc or its affiliates. All Rights Reserved. iSHARES and BLACKROCK are registered trademarks of BlackRock, Inc. or its affiliates. All other trademarks are those of their respective owners.
iShares ESG Aware Aggressive Allocation ETF
Annual Shareholder Report — July 31, 2024
iShares ESG Aware Conservative Allocation ETF
Annual Shareholder Report — July 31, 2024
This annual shareholder report contains important information about iShares ESG Aware Conservative Allocation ETF (the “Fund”) for the period of August 1, 2023 to July 31, 2024. You can find additional information about the Fund at blackrock.com/fundreports. You can also request this information by contacting us at 1-800-iShares (1-800-474-2737).
What were the Fund costs for the last year?
(based on a hypothetical $10,000 investment)
| Fund name | Costs of a $10,000 investment | Costs paid as a percentage of a $10,000 investment |
|---|
| iShares ESG Aware Conservative Allocation ETF | $6Footnote Reference(a) | 0.06%Footnote Reference(a) |
| Footnote | Description |
Footnote(a) | Excludes fees and expenses incurred indirectly as a result of investments in underlying funds. |
How did the Fund perform last year?
Slowing inflationary pressures and hopes of interest rate cuts drove global equities higher for the reporting period.
The U.S. Federal Reserve left rates on hold during the 12-month period as the central bank sought greater confidence in slowing inflationary pressures. As inflation measures became more subdued, expectations increased for interest rate cuts in 2024.
Bonds underperformed equities yet still delivered generally positive total returns during the reporting period. Amid economic growth concerns, central banks began to pivot away from higher interest rates to easing monetary policy, causing volatility in Treasury yields.
What contributed to performance?
The United States represented approximately 21% of the Fund on average during the reporting period and was the most significant driver of the Fund’s return. Driven by investor demand for artificial intelligence, a handful of information technology companies dominated market performance as they innovated rapidly, captured significant market share, and generated substantial profits. The financials sector also advanced, helped by solid earnings results. Stocks in international developed markets also advanced, led by the financials sector.
Bonds comprised approximately 68% of the Fund on average during the reporting period. As inflation measures began to subside and future interest rate cuts came into view, U.S. investment-grade bonds advanced given their potential for higher yield.
What detracted from performance?
Given the solid performance of both equities and fixed income securities, there were no meaningful detractors to the Fund’s performance during the reporting period.
The views expressed reflect the opinions of BlackRock as of the date of this report and are subject to change based on changes in market, economic or other conditions. These views are not intended to be a forecast of future events and are no guarantee of future results.
Cumulative performance: June 12, 2020 through July 31, 2024
Initial investment of $10,000
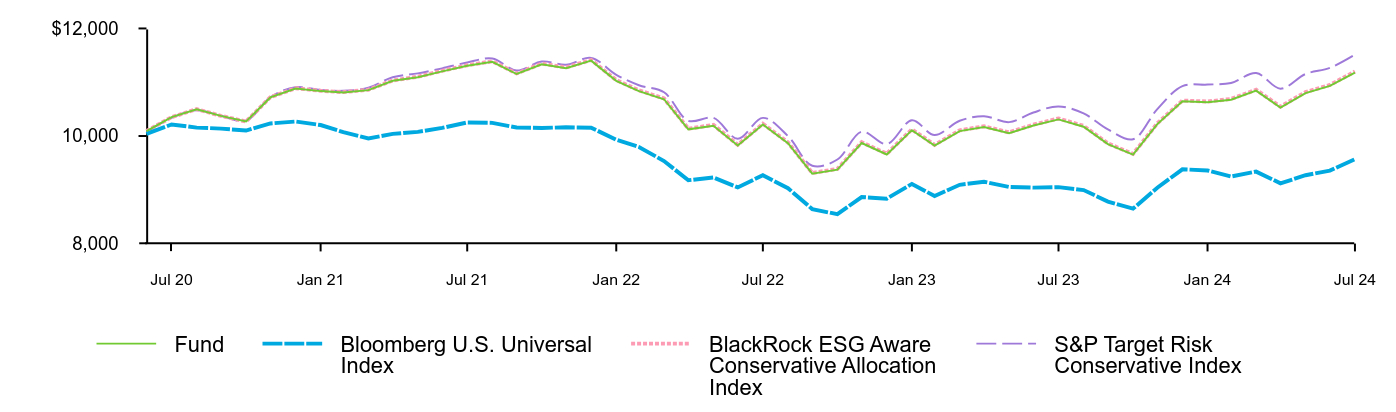
| Fund | Bloomberg U.S. Universal Index | BlackRock ESG Aware Conservative Allocation Index | S&P Target Risk Conservative Index |
|---|
| Jun 20 | 10,091 | 10,039 | 10,092 | 10,077 |
| Jul 20 | 10,350 | 10,215 | 10,351 | 10,336 |
| Aug 20 | 10,498 | 10,156 | 10,500 | 10,479 |
| Sep 20 | 10,374 | 10,138 | 10,375 | 10,376 |
| Oct 20 | 10,269 | 10,102 | 10,269 | 10,284 |
| Nov 20 | 10,717 | 10,234 | 10,722 | 10,720 |
| Dec 20 | 10,883 | 10,269 | 10,889 | 10,908 |
| Jan 21 | 10,835 | 10,204 | 10,842 | 10,854 |
| Feb 21 | 10,809 | 10,072 | 10,816 | 10,841 |
| Mar 21 | 10,853 | 9,955 | 10,861 | 10,897 |
| Apr 21 | 11,027 | 10,039 | 11,033 | 11,093 |
| May 21 | 11,094 | 10,077 | 11,103 | 11,165 |
| Jun 21 | 11,201 | 10,150 | 11,212 | 11,258 |
| Jul 21 | 11,306 | 10,252 | 11,316 | 11,368 |
| Aug 21 | 11,380 | 10,245 | 11,390 | 11,440 |
| Sep 21 | 11,153 | 10,158 | 11,163 | 11,219 |
| Oct 21 | 11,333 | 10,150 | 11,347 | 11,386 |
| Nov 21 | 11,262 | 10,162 | 11,275 | 11,325 |
| Dec 21 | 11,401 | 10,155 | 11,414 | 11,452 |
| Jan 22 | 11,026 | 9,932 | 11,040 | 11,138 |
| Feb 22 | 10,835 | 9,797 | 10,849 | 10,944 |
| Mar 22 | 10,684 | 9,534 | 10,698 | 10,813 |
| Apr 22 | 10,124 | 9,178 | 10,136 | 10,283 |
| May 22 | 10,192 | 9,228 | 10,206 | 10,337 |
| Jun 22 | 9,825 | 9,044 | 9,837 | 9,948 |
| Jul 22 | 10,215 | 9,271 | 10,228 | 10,337 |
| Aug 22 | 9,868 | 9,030 | 9,881 | 9,999 |
| Sep 22 | 9,301 | 8,641 | 9,313 | 9,447 |
| Oct 22 | 9,375 | 8,546 | 9,388 | 9,563 |
| Nov 22 | 9,869 | 8,865 | 9,884 | 10,080 |
| Dec 22 | 9,657 | 8,835 | 9,671 | 9,850 |
| Jan 23 | 10,109 | 9,109 | 10,124 | 10,293 |
| Feb 23 | 9,822 | 8,885 | 9,836 | 10,018 |
| Mar 23 | 10,092 | 9,093 | 10,106 | 10,283 |
| Apr 23 | 10,166 | 9,149 | 10,180 | 10,368 |
| May 23 | 10,053 | 9,054 | 10,068 | 10,258 |
| Jun 23 | 10,196 | 9,040 | 10,211 | 10,437 |
| Jul 23 | 10,309 | 9,049 | 10,326 | 10,549 |
| Aug 23 | 10,173 | 8,995 | 10,188 | 10,421 |
| Sep 23 | 9,850 | 8,781 | 9,862 | 10,122 |
| Oct 23 | 9,655 | 8,649 | 9,667 | 9,939 |
| Nov 23 | 10,222 | 9,038 | 10,235 | 10,500 |
| Dec 23 | 10,645 | 9,381 | 10,659 | 10,927 |
| Jan 24 | 10,626 | 9,359 | 10,641 | 10,956 |
| Feb 24 | 10,674 | 9,247 | 10,689 | 10,985 |
| Mar 24 | 10,844 | 9,338 | 10,860 | 11,171 |
| Apr 24 | 10,529 | 9,120 | 10,545 | 10,880 |
| May 24 | 10,799 | 9,271 | 10,816 | 11,153 |
| Jun 24 | 10,931 | 9,356 | 10,949 | 11,267 |
| Jul 24 | 11,180 | 9,568 | 11,199 | 11,514 |
See “Average annual total returns” for additional information on fund performance.
Average annual total returns
| Average Annual Total Returns | 1 Year | Since Fund Inception |
|---|
Fund NAV........................................................................................................................................................................................................................................................................................................................................................................................................................................................................................................................................................................................................................................................................................................................................................................................................................................................................................................................................................................................................................................ | 8.44% | 2.73% |
Fund Market........................................................................................................................................................................................................................................................................................................................................................................................................................................................................................................................................................................................................................................................................................................................................................................................................................................................................................................................................................................................................................................ | 8.33 | 2.71 |
Bloomberg U.S. Universal Index........................................................................................................................................................................................................................................................................................................................................................................................................................................................................................................................................................................................................................................................................................................................................................................................................................................................................................................................................................................................................................................ | 5.72 | (1.06) |
BlackRock ESG Aware Conservative Allocation Index........................................................................................................................................................................................................................................................................................................................................................................................................................................................................................................................................................................................................................................................................................................................................................................................................................................................................................................................................................................................................................................ | 8.49 | 2.78 |
S&P Target Risk Conservative Index........................................................................................................................................................................................................................................................................................................................................................................................................................................................................................................................................................................................................................................................................................................................................................................................................................................................................................................................................................................................................................................ | 9.15 | 3.47 |
Net Assets........................................................................................................................................................................................................................................................................................................................................................................................................................................................................................................................................................................................................................................................................................................................................................................................................................................................................................................................................................................................................................................ | $8,360,143 |
Number of Portfolio Holdings........................................................................................................................................................................................................................................................................................................................................................................................................................................................................................................................................................................................................................................................................................................................................................................................................................................................................................................................................................................................................................................ | 6 |
Net Investment Advisory Fees........................................................................................................................................................................................................................................................................................................................................................................................................................................................................................................................................................................................................................................................................................................................................................................................................................................................................................................................................................................................................................................ | $4,289 |
Portfolio Turnover Rate........................................................................................................................................................................................................................................................................................................................................................................................................................................................................................................................................................................................................................................................................................................................................................................................................................................................................................................................................................................................................................................ | 4% |
The Fund has added the Bloomberg U.S. Universal Index in response to new regulatory requirements.
The inception date of the Fund was June 12, 2020. The first day of secondary market trading was June 18, 2020.
Past performance is not an indication of future results. Performance results do not reflect the deduction of taxes that a shareholder would pay on fund distributions or on the redemption or sale of fund shares. Visit iShares.com for more recent performance information.
What did the Fund invest in?
| Asset Class | Percent of Total InvestmentsFootnote Reference(a) |
|---|
Domestic Fixed Income........................................................................................................................................................................................................................................................................................................................................................................................................................................................................................................................................................................................................................................................................................................................................................................................................................................................................................................................................................................................................................................ | 69.2% |
Domestic Equity........................................................................................................................................................................................................................................................................................................................................................................................................................................................................................................................................................................................................................................................................................................................................................................................................................................................................................................................................................................................................................................ | 21.1 |
International Equity........................................................................................................................................................................................................................................................................................................................................................................................................................................................................................................................................................................................................................................................................................................................................................................................................................................................................................................................................................................................................................................ | 9.7 |
| Security | Percent of TotaI InvestmentsFootnote Reference(a) |
|---|
iShares ESG Aware U.S. Aggregate Bond ETF........................................................................................................................................................................................................................................................................................................................................................................................................................................................................................................................................................................................................................................................................................................................................................................................................................................................................................................................................................................................................................................ | 69.2% |
iShares ESG Aware MSCI USA ETF........................................................................................................................................................................................................................................................................................................................................................................................................................................................................................................................................................................................................................................................................................................................................................................................................................................................................................................................................................................................................................................ | 19.2 |
iShares ESG Aware MSCI EAFE ETF........................................................................................................................................................................................................................................................................................................................................................................................................................................................................................................................................................................................................................................................................................................................................................................................................................................................................................................................................................................................................................................ | 6.7 |
iShares ESG Aware MSCI EM ETF........................................................................................................................................................................................................................................................................................................................................................................................................................................................................................................................................................................................................................................................................................................................................................................................................................................................................................................................................................................................................................................ | 3.0 |
iShares ESG Aware MSCI USA Small-Cap ETF........................................................................................................................................................................................................................................................................................................................................................................................................................................................................................................................................................................................................................................................................................................................................................................................................................................................................................................................................................................................................................................ | 1.9 |
|
| Footnote | Description |
Footnote(a) | Excludes money market funds. |
If you wish to view additional information about the Fund, including but not limited to financial statements, the Fund’s prospectus, and proxy voting policies and procedures, please visit blackrock.com/fundreports. For proxy voting records, visit blackrock.com/proxyrecords.
Householding is an option available to certain fund investors. Householding is a method of delivery, based on the preference of the individual investor, in which a single copy of certain shareholder documents can be delivered to investors who share the same address, even if their accounts are registered under different names. Please contact your broker-dealer if you are interested in enrolling in householding and receiving a single copy of prospectuses and other shareholder documents, or if you are currently enrolled in householding and wish to change your householding status.
The Fund is not sponsored, endorsed, issued, sold, or promoted by S&P Dow Jones Indices LLC, Bloomberg Index Services Limited or BlackRock Index Services, LLC and its affiliates, nor do these companies make any representation regarding the advisability of investing in the Fund. With the exception of BlackRock Index Services, LLC, who is an affiliate, BlackRock is not affiliated with the companies listed above.
© 2024 BlackRock, Inc or its affiliates. All Rights Reserved. iSHARES and BLACKROCK are registered trademarks of BlackRock, Inc. or its affiliates. All other trademarks are those of their respective owners.
iShares ESG Aware Conservative Allocation ETF
Annual Shareholder Report — July 31, 2024
iShares ESG Aware Growth Allocation ETF
Annual Shareholder Report — July 31, 2024
This annual shareholder report contains important information about iShares ESG Aware Growth Allocation ETF (the “Fund”) for the period of August 1, 2023 to July 31, 2024. You can find additional information about the Fund at blackrock.com/fundreports. You can also request this information by contacting us at 1-800-iShares (1-800-474-2737).
What were the Fund costs for the last year?
(based on a hypothetical $10,000 investment)
| Fund name | Costs of a $10,000 investment | Costs paid as a percentage of a $10,000 investment |
|---|
| iShares ESG Aware Growth Allocation ETF | $4Footnote Reference(a) | 0.04%Footnote Reference(a) |
| Footnote | Description |
Footnote(a) | Excludes fees and expenses incurred indirectly as a result of investments in underlying funds. |
How did the Fund perform last year?
Slowing inflationary pressures and hopes of interest rate cuts drove global equities higher for the reporting period.
The U.S. Federal Reserve left rates on hold during the 12-month period as the central bank sought greater confidence in slowing inflationary pressures. As inflation measures became more subdued, expectations increased for interest rate cuts in 2024.
Bonds underperformed equities yet still delivered generally positive total returns during the reporting period. Amid economic growth concerns, central banks began to pivot away from higher interest rates to easing monetary policy, causing volatility in Treasury yields.
What contributed to performance?
U.S. equities comprised approximately 42% of the Fund on average during the reporting period and were the most significant driver of performance. Driven by investor demand for artificial intelligence, a handful of information technology companies dominated market performance as they innovated rapidly, captured significant market share, and generated substantial profits. The financials sector also advanced, helped by solid earnings results. Stocks in international developed markets also advanced, led by the financials sector.
Bonds comprised approximately 38% of the Fund on average during the reporting period. As inflation measures began to subside and future interest rate cuts came into view, U.S. investment-grade bonds advanced given their potential for higher yield.
What detracted from performance?
Given the solid performance of both equities and fixed income securities, there were no meaningful detractors to the Fund’s performance during the reporting period.
The views expressed reflect the opinions of BlackRock as of the date of this report and are subject to change based on changes in market, economic or other conditions. These views are not intended to be a forecast of future events and are no guarantee of future results.
Cumulative performance: June 12, 2020 through July 31, 2024
Initial investment of $10,000
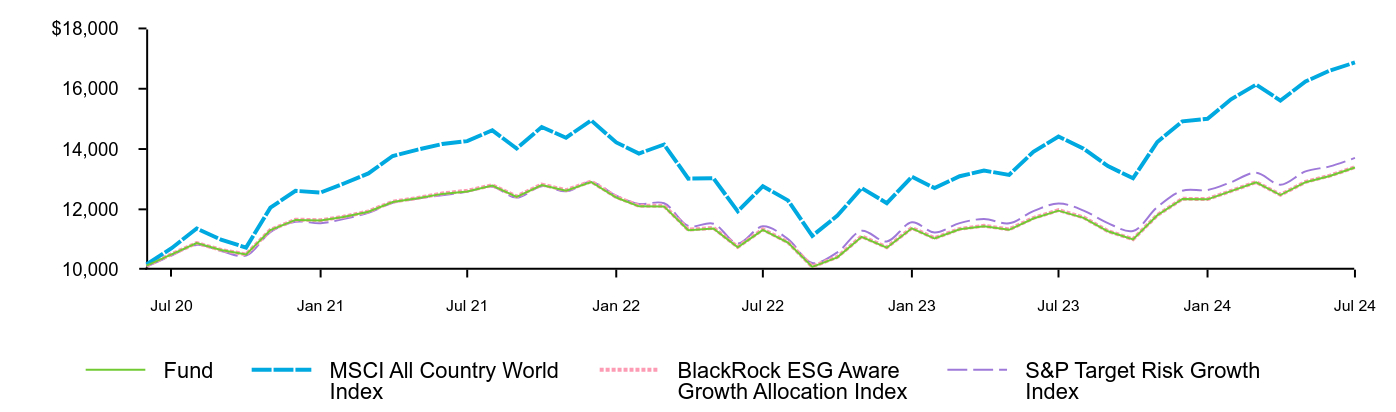
| Fund | MSCI All Country World Index | BlackRock ESG Aware Growth Allocation Index | S&P Target Risk Growth Index |
|---|
| Jun 20 | 10,131 | 10,171 | 10,131 | 10,102 |
| Jul 20 | 10,508 | 10,709 | 10,512 | 10,467 |
| Aug 20 | 10,878 | 11,364 | 10,884 | 10,820 |
| Sep 20 | 10,652 | 10,998 | 10,656 | 10,620 |
| Oct 20 | 10,500 | 10,731 | 10,504 | 10,464 |
| Nov 20 | 11,314 | 12,054 | 11,320 | 11,242 |
| Dec 20 | 11,649 | 12,614 | 11,659 | 11,586 |
| Jan 21 | 11,629 | 12,557 | 11,639 | 11,539 |
| Feb 21 | 11,745 | 12,848 | 11,753 | 11,676 |
| Mar 21 | 11,922 | 13,191 | 11,932 | 11,883 |
| Apr 21 | 12,243 | 13,768 | 12,254 | 12,219 |
| May 21 | 12,367 | 13,982 | 12,380 | 12,358 |
| Jun 21 | 12,512 | 14,166 | 12,525 | 12,466 |
| Jul 21 | 12,592 | 14,264 | 12,617 | 12,582 |
| Aug 21 | 12,786 | 14,621 | 12,801 | 12,752 |
| Sep 21 | 12,411 | 14,017 | 12,428 | 12,388 |
| Oct 21 | 12,806 | 14,732 | 12,825 | 12,768 |
| Nov 21 | 12,616 | 14,377 | 12,634 | 12,598 |
| Dec 21 | 12,908 | 14,952 | 12,926 | 12,903 |
| Jan 22 | 12,392 | 14,218 | 12,410 | 12,456 |
| Feb 22 | 12,100 | 13,851 | 12,119 | 12,181 |
| Mar 22 | 12,097 | 14,151 | 12,116 | 12,201 |
| Apr 22 | 11,308 | 13,018 | 11,325 | 11,448 |
| May 22 | 11,367 | 13,033 | 11,385 | 11,523 |
| Jun 22 | 10,741 | 11,934 | 10,754 | 10,867 |
| Jul 22 | 11,320 | 12,767 | 11,335 | 11,437 |
| Aug 22 | 10,896 | 12,297 | 10,911 | 11,013 |
| Sep 22 | 10,090 | 11,120 | 10,102 | 10,222 |
| Oct 22 | 10,409 | 11,791 | 10,423 | 10,572 |
| Nov 22 | 11,089 | 12,706 | 11,105 | 11,287 |
| Dec 22 | 10,727 | 12,206 | 10,741 | 10,934 |
| Jan 23 | 11,371 | 13,081 | 11,386 | 11,571 |
| Feb 23 | 11,032 | 12,706 | 11,045 | 11,232 |
| Mar 23 | 11,338 | 13,098 | 11,352 | 11,542 |
| Apr 23 | 11,441 | 13,286 | 11,456 | 11,678 |
| May 23 | 11,320 | 13,144 | 11,335 | 11,536 |
| Jun 23 | 11,696 | 13,907 | 11,713 | 11,939 |
| Jul 23 | 11,956 | 14,416 | 11,974 | 12,195 |
| Aug 23 | 11,715 | 14,013 | 11,732 | 11,960 |
| Sep 23 | 11,273 | 13,434 | 11,279 | 11,543 |
| Oct 23 | 11,005 | 13,030 | 11,010 | 11,283 |
| Nov 23 | 11,804 | 14,233 | 11,811 | 12,072 |
| Dec 23 | 12,342 | 14,917 | 12,351 | 12,617 |
| Jan 24 | 12,332 | 15,004 | 12,340 | 12,641 |
| Feb 24 | 12,603 | 15,648 | 12,611 | 12,898 |
| Mar 24 | 12,895 | 16,139 | 12,904 | 13,213 |
| Apr 24 | 12,475 | 15,607 | 12,483 | 12,815 |
| May 24 | 12,900 | 16,241 | 12,910 | 13,258 |
| Jun 24 | 13,105 | 16,603 | 13,116 | 13,426 |
| Jul 24 | 13,387 | 16,871 | 13,398 | 13,706 |
See “Average annual total returns” for additional information on fund performance.
Average annual total returns
| Average Annual Total Returns | 1 Year | Since Fund Inception |
|---|
Fund NAV........................................................................................................................................................................................................................................................................................................................................................................................................................................................................................................................................................................................................................................................................................................................................................................................................................................................................................................................................................................................................................................ | 11.97% | 7.31% |
Fund Market........................................................................................................................................................................................................................................................................................................................................................................................................................................................................................................................................................................................................................................................................................................................................................................................................................................................................................................................................................................................................................................ | 12.05 | 7.32 |
MSCI All Country World Index........................................................................................................................................................................................................................................................................................................................................................................................................................................................................................................................................................................................................................................................................................................................................................................................................................................................................................................................................................................................................................................ | 17.02 | 13.48 |
BlackRock ESG Aware Growth Allocation Index........................................................................................................................................................................................................................................................................................................................................................................................................................................................................................................................................................................................................................................................................................................................................................................................................................................................................................................................................................................................................................................ | 12.01 | 7.36 |
S&P Target Risk Growth Index........................................................................................................................................................................................................................................................................................................................................................................................................................................................................................................................................................................................................................................................................................................................................................................................................................................................................................................................................................................................................................................ | 12.38 | 7.92 |
Net Assets........................................................................................................................................................................................................................................................................................................................................................................................................................................................................................................................................................................................................................................................................................................................................................................................................................................................................................................................................................................................................................................ | $20,234,180 |
Number of Portfolio Holdings........................................................................................................................................................................................................................................................................................................................................................................................................................................................................................................................................................................................................................................................................................................................................................................................................................................................................................................................................................................................................................................ | 6 |
Net Investment Advisory Fees........................................................................................................................................................................................................................................................................................................................................................................................................................................................................................................................................................................................................................................................................................................................................................................................................................................................................................................................................................................................................................................ | $6,361 |
Portfolio Turnover Rate........................................................................................................................................................................................................................................................................................................................................................................................................................................................................................................................................................................................................................................................................................................................................................................................................................................................................................................................................................................................................................................ | 6% |
The Fund has added the MSCI All Country World Index in response to new regulatory requirements.
The inception date of the Fund was June 12, 2020. The first day of secondary market trading was June 18, 2020.
Past performance is not an indication of future results. Performance results do not reflect the deduction of taxes that a shareholder would pay on fund distributions or on the redemption or sale of fund shares. Visit iShares.com for more recent performance information.
What did the Fund invest in?
| Asset Class | Percent of Total InvestmentsFootnote Reference(a) |
|---|
Domestic Equity........................................................................................................................................................................................................................................................................................................................................................................................................................................................................................................................................................................................................................................................................................................................................................................................................................................................................................................................................................................................................................................ | 41.7% |
Domestic Fixed Income........................................................................................................................................................................................................................................................................................................................................................................................................................................................................................................................................................................................................................................................................................................................................................................................................................................................................................................................................................................................................................................ | 39.1 |
International Equity........................................................................................................................................................................................................................................................................................................................................................................................................................................................................................................................................................................................................................................................................................................................................................................................................................................................................................................................................................................................................................................ | 19.2 |
| Security | Percent of TotaI InvestmentsFootnote Reference(a) |
|---|
iShares ESG Aware U.S. Aggregate Bond ETF........................................................................................................................................................................................................................................................................................................................................................................................................................................................................................................................................................................................................................................................................................................................................................................................................................................................................................................................................................................................................................................ | 39.0% |
iShares ESG Aware MSCI USA ETF........................................................................................................................................................................................................................................................................................................................................................................................................................................................................................................................................................................................................................................................................................................................................................................................................................................................................................................................................................................................................................................ | 38.0 |
iShares ESG Aware MSCI EAFE ETF........................................................................................................................................................................................................................................................................................................................................................................................................................................................................................................................................................................................................................................................................................................................................................................................................................................................................................................................................................................................................................................ | 13.3 |
iShares ESG Aware MSCI EM ETF........................................................................................................................................................................................................................................................................................................................................................................................................................................................................................................................................................................................................................................................................................................................................................................................................................................................................................................................................................................................................................................ | 5.9 |
iShares ESG Aware MSCI USA Small-Cap ETF........................................................................................................................................................................................................................................................................................................................................................................................................................................................................................................................................................................................................................................................................................................................................................................................................................................................................................................................................................................................................................................ | 3.8 |
|
| Footnote | Description |
Footnote(a) | Excludes money market funds. |
If you wish to view additional information about the Fund, including but not limited to financial statements, the Fund’s prospectus, and proxy voting policies and procedures, please visit blackrock.com/fundreports. For proxy voting records, visit blackrock.com/proxyrecords.
Householding is an option available to certain fund investors. Householding is a method of delivery, based on the preference of the individual investor, in which a single copy of certain shareholder documents can be delivered to investors who share the same address, even if their accounts are registered under different names. Please contact your broker-dealer if you are interested in enrolling in householding and receiving a single copy of prospectuses and other shareholder documents, or if you are currently enrolled in householding and wish to change your householding status.
The Fund is not sponsored, endorsed, issued, sold, or promoted by MSCI Inc., S&P Dow Jones Indices LLC or BlackRock Index Services, LLC and its affiliates, nor do these companies make any representation regarding the advisability of investing in the Fund. With the exception of BlackRock Index Services, LLC, who is an affiliate, BlackRock is not affiliated with the companies listed above.
© 2024 BlackRock, Inc or its affiliates. All Rights Reserved. iSHARES and BLACKROCK are registered trademarks of BlackRock, Inc. or its affiliates. All other trademarks are those of their respective owners.
iShares ESG Aware Growth Allocation ETF
Annual Shareholder Report — July 31, 2024
iShares ESG Aware Moderate Allocation ETF
Annual Shareholder Report — July 31, 2024
This annual shareholder report contains important information about iShares ESG Aware Moderate Allocation ETF (the “Fund”) for the period of August 1, 2023 to July 31, 2024. You can find additional information about the Fund at blackrock.com/fundreports. You can also request this information by contacting us at 1-800-iShares (1-800-474-2737).
What were the Fund costs for the last year?
(based on a hypothetical $10,000 investment)
| Fund name | Costs of a $10,000 investment | Costs paid as a percentage of a $10,000 investment |
|---|
| iShares ESG Aware Moderate Allocation ETF | $5Footnote Reference(a) | 0.05%Footnote Reference(a) |
| Footnote | Description |
Footnote(a) | Excludes fees and expenses incurred indirectly as a result of investments in underlying funds. |
How did the Fund perform last year?
Slowing inflationary pressures and hopes of interest rate cuts drove global equities higher for the reporting period.
The U.S. Federal Reserve left rates on hold during the 12-month period as the central bank sought greater confidence in slowing inflationary pressures. As inflation measures became more subdued, expectations increased for interest rate cuts in 2024.
Bonds underperformed equities yet still delivered generally positive total returns during the reporting period. Amid economic growth concerns, central banks began to pivot away from higher interest rates to easing monetary policy, causing volatility in Treasury yields.
What contributed to performance?
U.S. equities comprised approximately 28% of the Fund on average during the reporting period and were the most significant driver of performance. Driven by investor demand for artificial intelligence, a handful of information technology companies dominated market performance as they innovated rapidly, captured significant market share, and generated substantial profits. The financials sector also advanced, helped by solid earnings results. Stocks in international developed markets also advanced, led by the financials sector.
Bonds comprised approximately 58% of the Fund on average during the reporting period. As inflation measures began to subside and future interest rate cuts came into view, U.S. investment-grade bonds advanced given their potential for higher yield.
What detracted from performance?
Given the solid performance of both equities and fixed income securities, there were no meaningful detractors to the Fund’s performance during the reporting period.
The views expressed reflect the opinions of BlackRock as of the date of this report and are subject to change based on changes in market, economic or other conditions. These views are not intended to be a forecast of future events and are no guarantee of future results.
Cumulative performance: June 12, 2020 through July 31, 2024
Initial investment of $10,000
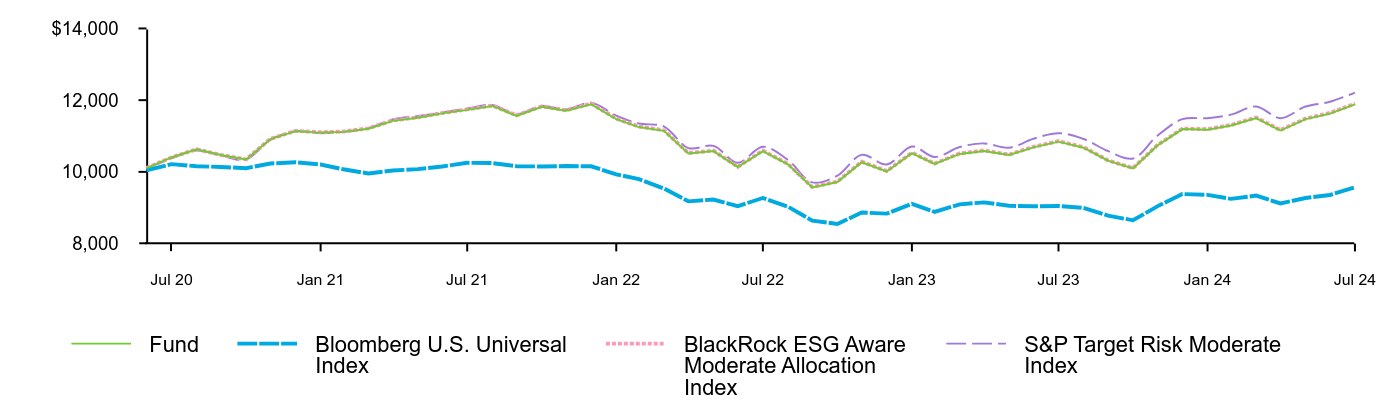
| Fund | Bloomberg U.S. Universal Index | BlackRock ESG Aware Moderate Allocation Index | S&P Target Risk Moderate Index |
|---|
| Jun 20 | 10,103 | 10,039 | 10,105 | 10,085 |
| Jul 20 | 10,402 | 10,215 | 10,406 | 10,380 |
| Aug 20 | 10,629 | 10,156 | 10,630 | 10,595 |
| Sep 20 | 10,470 | 10,138 | 10,471 | 10,459 |
| Oct 20 | 10,348 | 10,102 | 10,349 | 10,345 |
| Nov 20 | 10,915 | 10,234 | 10,920 | 10,893 |
| Dec 20 | 11,135 | 10,269 | 11,143 | 11,132 |
| Jan 21 | 11,095 | 10,204 | 11,105 | 11,080 |
| Feb 21 | 11,115 | 10,072 | 11,124 | 11,116 |
| Mar 21 | 11,203 | 9,955 | 11,213 | 11,221 |
| Apr 21 | 11,422 | 10,039 | 11,434 | 11,463 |
| May 21 | 11,510 | 10,077 | 11,521 | 11,556 |
| Jun 21 | 11,631 | 10,150 | 11,641 | 11,654 |
| Jul 21 | 11,729 | 10,252 | 11,742 | 11,766 |
| Aug 21 | 11,838 | 10,245 | 11,850 | 11,869 |
| Sep 21 | 11,563 | 10,158 | 11,578 | 11,603 |
| Oct 21 | 11,813 | 10,150 | 11,828 | 11,837 |
| Nov 21 | 11,704 | 10,162 | 11,719 | 11,742 |
| Dec 21 | 11,886 | 10,155 | 11,905 | 11,925 |
| Jan 22 | 11,471 | 9,932 | 11,487 | 11,569 |
| Feb 22 | 11,249 | 9,797 | 11,265 | 11,349 |
| Mar 22 | 11,143 | 9,534 | 11,159 | 11,264 |
| Apr 22 | 10,513 | 9,178 | 10,526 | 10,664 |
| May 22 | 10,579 | 9,228 | 10,592 | 10,725 |
| Jun 22 | 10,132 | 9,044 | 10,142 | 10,253 |
| Jul 22 | 10,580 | 9,271 | 10,593 | 10,698 |
| Aug 22 | 10,209 | 9,030 | 10,221 | 10,333 |
| Sep 22 | 9,567 | 8,641 | 9,577 | 9,706 |
| Oct 22 | 9,717 | 8,546 | 9,728 | 9,894 |
| Nov 22 | 10,269 | 8,865 | 10,283 | 10,474 |
| Dec 22 | 10,010 | 8,835 | 10,022 | 10,205 |
| Jan 23 | 10,523 | 9,109 | 10,536 | 10,709 |
| Feb 23 | 10,220 | 8,885 | 10,231 | 10,414 |
| Mar 23 | 10,500 | 9,093 | 10,513 | 10,693 |
| Apr 23 | 10,584 | 9,149 | 10,597 | 10,794 |
| May 23 | 10,469 | 9,054 | 10,482 | 10,674 |
| Jun 23 | 10,684 | 9,040 | 10,698 | 10,922 |
| Jul 23 | 10,843 | 9,049 | 10,857 | 11,079 |
| Aug 23 | 10,674 | 8,995 | 10,688 | 10,917 |
| Sep 23 | 10,313 | 8,781 | 10,322 | 10,581 |
| Oct 23 | 10,096 | 8,649 | 10,105 | 10,374 |
| Nov 23 | 10,735 | 9,038 | 10,745 | 11,006 |
| Dec 23 | 11,193 | 9,381 | 11,206 | 11,470 |
| Jan 24 | 11,177 | 9,359 | 11,191 | 11,497 |
| Feb 24 | 11,293 | 9,247 | 11,307 | 11,596 |
| Mar 24 | 11,501 | 9,338 | 11,516 | 11,822 |
| Apr 24 | 11,153 | 9,120 | 11,167 | 11,498 |
| May 24 | 11,470 | 9,271 | 11,485 | 11,823 |
| Jun 24 | 11,625 | 9,356 | 11,642 | 11,954 |
| Jul 24 | 11,884 | 9,568 | 11,902 | 12,212 |
See “Average annual total returns” for additional information on fund performance.
Average annual total returns
| Average Annual Total Returns | 1 Year | Since Fund Inception |
|---|
Fund NAV........................................................................................................................................................................................................................................................................................................................................................................................................................................................................................................................................................................................................................................................................................................................................................................................................................................................................................................................................................................................................................................ | 9.60% | 4.26% |
Fund Market........................................................................................................................................................................................................................................................................................................................................................................................................................................................................................................................................................................................................................................................................................................................................................................................................................................................................................................................................................................................................................................ | 9.60 | 4.26 |
Bloomberg U.S. Universal Index........................................................................................................................................................................................................................................................................................................................................................................................................................................................................................................................................................................................................................................................................................................................................................................................................................................................................................................................................................................................................................................ | 5.72 | (1.06) |
BlackRock ESG Aware Moderate Allocation Index........................................................................................................................................................................................................................................................................................................................................................................................................................................................................................................................................................................................................................................................................................................................................................................................................................................................................................................................................................................................................................................ | 9.66 | 4.31 |
S&P Target Risk Moderate Index........................................................................................................................................................................................................................................................................................................................................................................................................................................................................................................................................................................................................................................................................................................................................................................................................................................................................................................................................................................................................................................ | 10.22 | 4.96 |
Net Assets........................................................................................................................................................................................................................................................................................................................................................................................................................................................................................................................................................................................................................................................................................................................................................................................................................................................................................................................................................................................................................................ | $6,188,087 |
Number of Portfolio Holdings........................................................................................................................................................................................................................................................................................................................................................................................................................................................................................................................................................................................................................................................................................................................................................................................................................................................................................................................................................................................................................................ | 7 |
Net Investment Advisory Fees........................................................................................................................................................................................................................................................................................................................................................................................................................................................................................................................................................................................................................................................................................................................................................................................................................................................................................................................................................................................................................................ | $2,752 |
Portfolio Turnover Rate........................................................................................................................................................................................................................................................................................................................................................................................................................................................................................................................................................................................................................................................................................................................................................................................................................................................................................................................................................................................................................................ | 6% |
The Fund has added the Bloomberg U.S. Universal Index in response to new regulatory requirements.
The inception date of the Fund was June 12, 2020. The first day of secondary market trading was June 18, 2020.
Past performance is not an indication of future results. Performance results do not reflect the deduction of taxes that a shareholder would pay on fund distributions or on the redemption or sale of fund shares. Visit iShares.com for more recent performance information.
What did the Fund invest in?
| Asset Class | Percent of Total InvestmentsFootnote Reference(a) |
|---|
Domestic Fixed Income........................................................................................................................................................................................................................................................................................................................................................................................................................................................................................................................................................................................................................................................................................................................................................................................................................................................................................................................................................................................................................................ | 59.1% |
Domestic Equity........................................................................................................................................................................................................................................................................................................................................................................................................................................................................................................................................................................................................................................................................................................................................................................................................................................................................................................................................................................................................................................ | 28.0 |
International Equity........................................................................................................................................................................................................................................................................................................................................................................................................................................................................................................................................................................................................................................................................................................................................................................................................................................................................................................................................................................................................................................ | 12.9 |
| Security | Percent of TotaI InvestmentsFootnote Reference(a) |
|---|
iShares ESG Aware U.S. Aggregate Bond ETF........................................................................................................................................................................................................................................................................................................................................................................................................................................................................................................................................................................................................................................................................................................................................................................................................................................................................................................................................................................................................................................ | 59.1% |
iShares ESG Aware MSCI USA ETF........................................................................................................................................................................................................................................................................................................................................................................................................................................................................................................................................................................................................................................................................................................................................................................................................................................................................................................................................................................................................................................ | 25.5 |
iShares ESG Aware MSCI EAFE ETF........................................................................................................................................................................................................................................................................................................................................................................................................................................................................................................................................................................................................................................................................................................................................................................................................................................................................................................................................................................................................................................ | 8.9 |
iShares ESG Aware MSCI EM ETF........................................................................................................................................................................................................................................................................................................................................................................................................................................................................................................................................................................................................................................................................................................................................................................................................................................................................................................................................................................................................................................ | 4.0 |
iShares ESG Aware MSCI USA Small-Cap ETF........................................................................................................................................................................................................................................................................................................................................................................................................................................................................................................................................................................................................................................................................................................................................................................................................................................................................................................................................................................................................................................ | 2.5 |
|
| Footnote | Description |
Footnote(a) | Excludes money market funds. |
If you wish to view additional information about the Fund, including but not limited to financial statements, the Fund’s prospectus, and proxy voting policies and procedures, please visit blackrock.com/fundreports. For proxy voting records, visit blackrock.com/proxyrecords.
Householding is an option available to certain fund investors. Householding is a method of delivery, based on the preference of the individual investor, in which a single copy of certain shareholder documents can be delivered to investors who share the same address, even if their accounts are registered under different names. Please contact your broker-dealer if you are interested in enrolling in householding and receiving a single copy of prospectuses and other shareholder documents, or if you are currently enrolled in householding and wish to change your householding status.
The Fund is not sponsored, endorsed, issued, sold, or promoted by S&P Dow Jones Indices LLC, Bloomberg Index Services Limited or BlackRock Index Services, LLC and its affiliates, nor do these companies make any representation regarding the advisability of investing in the Fund. With the exception of BlackRock Index Services, LLC, who is an affiliate, BlackRock is not affiliated with the companies listed above.
© 2024 BlackRock, Inc or its affiliates. All Rights Reserved. iSHARES and BLACKROCK are registered trademarks of BlackRock, Inc. or its affiliates. All other trademarks are those of their respective owners.
iShares ESG Aware Moderate Allocation ETF
Annual Shareholder Report — July 31, 2024
iShares MSCI USA Small-Cap Min Vol Factor ETF
Annual Shareholder Report — July 31, 2024
This annual shareholder report contains important information about iShares MSCI USA Small-Cap Min Vol Factor ETF (the “Fund”) for the period of August 1, 2023 to July 31, 2024. You can find additional information about the Fund at blackrock.com/fundreports. You can also request this information by contacting us at 1-800-iShares (1-800-474-2737).
What were the Fund costs for the last year?
(based on a hypothetical $10,000 investment)
| Fund name | Costs of a $10,000 investment | Costs paid as a percentage of a $10,000 investment |
|---|
| iShares MSCI USA Small-Cap Min Vol Factor ETF | $22 | 0.20% |
How did the Fund perform last year?
Slowing inflationary pressures and hopes of interest rate cuts drove global stocks higher for the reporting period. U.S. equities led markets, propelled by the information technology sector and enthusiasm over artificial intelligence.
U.S. stocks powered markets higher, driven by the enthusiasm for artificial intelligence, particularly in the information technology sector.
In a risk-on environment, stocks with exposure to high volatility, those with significant degrees of price changes, outperformed those with lower volatility characteristics.
Market sentiment swung late in the period, shifting away from information technology stocks amid growing uncertainty about economic growth, geopolitics, and the upcoming U.S. presidential election.
What contributed to performance?
The industrials sector contributed the most to the Fund’s return during the reporting period, as the sector continued to benefit from a resilient U.S. economy and efforts to revitalize manufacturing in the country. Within the sector, commercial and professional services companies advanced, as firms that support government customers in their critical national security missions continued to benefit. In the capital goods industry, construction and engineering firms saw an influx of federal funding and caught the eye of global private equity and venture capitalist firms. Financial stocks also contributed to the Fund’s performance, most notably insurance companies in the property and casualty segment.
What detracted from performance?
Given the strength of equity markets during the reporting period ended July 31, 2024, there were no material detractors to the Fund’s performance.
The views expressed reflect the opinions of BlackRock as of the date of this report and are subject to change based on changes in market, economic or other conditions. These views are not intended to be a forecast of future events and are no guarantee of future results.
Cumulative performance: September 7, 2016 through July 31, 2024
Initial investment of $10,000

| Fund | MSCI USA Index | MSCI USA Small Cap Minimum Volatility (USD) Index |
|---|
| Sep 16 | 9,789 | 9,933 | 9,786 |
| Oct 16 | 9,594 | 9,745 | 9,585 |
| Nov 16 | 10,096 | 10,097 | 10,098 |
| Dec 16 | 10,409 | 10,285 | 10,418 |
| Jan 17 | 10,461 | 10,498 | 10,468 |
| Feb 17 | 10,702 | 10,911 | 10,713 |
| Mar 17 | 10,798 | 10,926 | 10,811 |
| Apr 17 | 11,004 | 11,044 | 11,020 |
| May 17 | 11,048 | 11,195 | 11,060 |
| Jun 17 | 11,158 | 11,265 | 11,174 |
| Jul 17 | 11,251 | 11,495 | 11,269 |
| Aug 17 | 11,251 | 11,533 | 11,271 |
| Sep 17 | 11,466 | 11,768 | 11,488 |
| Oct 17 | 11,600 | 12,037 | 11,622 |
| Nov 17 | 11,978 | 12,403 | 12,006 |
| Dec 17 | 11,860 | 12,537 | 11,889 |
| Jan 18 | 12,032 | 13,257 | 12,063 |
| Feb 18 | 11,591 | 12,771 | 11,622 |
| Mar 18 | 11,865 | 12,459 | 11,900 |
| Apr 18 | 11,996 | 12,509 | 12,036 |
| May 18 | 12,487 | 12,814 | 12,529 |
| Jun 18 | 12,771 | 12,901 | 12,818 |
| Jul 18 | 12,960 | 13,364 | 13,014 |
| Aug 18 | 13,544 | 13,807 | 13,602 |
| Sep 18 | 13,487 | 13,870 | 13,549 |
| Oct 18 | 12,728 | 12,907 | 12,783 |
| Nov 18 | 12,996 | 13,158 | 13,059 |
| Dec 18 | 12,036 | 11,973 | 12,095 |
| Jan 19 | 12,891 | 12,958 | 12,959 |
| Feb 19 | 13,323 | 13,392 | 13,395 |
| Mar 19 | 13,411 | 13,640 | 13,484 |
| Apr 19 | 13,731 | 14,187 | 13,809 |
| May 19 | 13,340 | 13,290 | 13,420 |
| Jun 19 | 13,931 | 14,223 | 14,017 |
| Jul 19 | 14,245 | 14,443 | 14,338 |
| Aug 19 | 14,236 | 14,192 | 14,335 |
| Sep 19 | 14,360 | 14,444 | 14,461 |
| Oct 19 | 14,511 | 14,758 | 14,612 |
| Nov 19 | 14,771 | 15,313 | 14,873 |
| Dec 19 | 14,984 | 15,762 | 15,088 |
| Jan 20 | 14,904 | 15,793 | 15,017 |
| Feb 20 | 13,633 | 14,505 | 13,736 |
| Mar 20 | 10,962 | 12,665 | 11,051 |
| Apr 20 | 11,908 | 14,331 | 11,997 |
| May 20 | 12,357 | 15,076 | 12,454 |
| Jun 20 | 12,317 | 15,420 | 12,418 |
| Jul 20 | 12,716 | 16,335 | 12,828 |
| Aug 20 | 13,035 | 17,561 | 13,154 |
| Sep 20 | 12,463 | 16,906 | 12,578 |
| Oct 20 | 12,583 | 16,466 | 12,699 |
| Nov 20 | 13,736 | 18,371 | 13,863 |
| Dec 20 | 14,527 | 19,129 | 14,660 |
| Jan 21 | 14,844 | 18,952 | 14,982 |
| Feb 21 | 15,381 | 19,447 | 15,525 |
| Mar 21 | 15,834 | 20,179 | 15,987 |
| Apr 21 | 16,393 | 21,277 | 16,555 |
| May 21 | 16,273 | 21,379 | 16,437 |
| Jun 21 | 16,387 | 21,974 | 16,550 |
| Jul 21 | 16,361 | 22,494 | 16,520 |
| Aug 21 | 16,663 | 23,158 | 16,839 |
| Sep 21 | 16,065 | 22,065 | 16,234 |
| Oct 21 | 16,485 | 23,604 | 16,657 |
| Nov 21 | 16,056 | 23,366 | 16,228 |
| Dec 21 | 16,956 | 24,289 | 17,142 |
| Jan 22 | 15,849 | 22,914 | 16,024 |
| Feb 22 | 15,724 | 22,243 | 15,899 |
| Mar 22 | 16,186 | 23,025 | 16,365 |
| Apr 22 | 15,376 | 20,938 | 15,545 |
| May 22 | 15,312 | 20,892 | 15,484 |
| Jun 22 | 14,891 | 19,163 | 15,061 |
| Jul 22 | 15,678 | 20,950 | 15,859 |
| Aug 22 | 15,120 | 20,129 | 15,291 |
| Sep 22 | 13,983 | 18,262 | 14,141 |
| Oct 22 | 15,191 | 19,712 | 15,365 |
| Nov 22 | 15,905 | 20,784 | 16,083 |
| Dec 22 | 15,280 | 19,562 | 15,461 |
| Jan 23 | 15,936 | 20,849 | 16,113 |
| Feb 23 | 15,766 | 20,351 | 15,951 |
| Mar 23 | 15,404 | 21,074 | 15,581 |
| Apr 23 | 15,324 | 21,341 | 15,498 |
| May 23 | 14,688 | 21,480 | 14,855 |
| Jun 23 | 15,263 | 22,912 | 15,434 |
| Jul 23 | 15,660 | 23,701 | 15,839 |
| Aug 23 | 15,289 | 23,302 | 15,470 |
| Sep 23 | 14,782 | 22,209 | 14,958 |
| Oct 23 | 14,521 | 21,698 | 14,690 |
| Nov 23 | 15,274 | 23,744 | 15,445 |
| Dec 23 | 16,039 | 24,863 | 16,228 |
| Jan 24 | 15,910 | 25,250 | 16,120 |
| Feb 24 | 16,413 | 26,605 | 16,606 |
| Mar 24 | 16,909 | 27,451 | 17,085 |
| Apr 24 | 16,292 | 26,318 | 16,470 |
| May 24 | 16,919 | 27,575 | 17,114 |
| Jun 24 | 16,877 | 28,561 | 17,062 |
| Jul 24 | 18,085 | 28,919 | 18,303 |
See “Average annual total returns” for additional information on fund performance.
Average annual total returns
| Average Annual Total Returns | 1 Year | 5 Years | Since Fund Inception |
|---|
Fund NAV........................................................................................................................................................................................................................................................................................................................................................................................................................................................................................................................................................................................................................................................................................................................................................................................................................................................................................................................................................................................................................................ | 15.49% | 4.89% | 7.79% |
Fund Market........................................................................................................................................................................................................................................................................................................................................................................................................................................................................................................................................................................................................................................................................................................................................................................................................................................................................................................................................................................................................................................ | 15.53 | 4.88 | 7.80 |
MSCI USA Index........................................................................................................................................................................................................................................................................................................................................................................................................................................................................................................................................................................................................................................................................................................................................................................................................................................................................................................................................................................................................................................ | 22.02 | 14.90 | 14.39 |
MSCI USA Small Cap Minimum Volatility (USD) Index........................................................................................................................................................................................................................................................................................................................................................................................................................................................................................................................................................................................................................................................................................................................................................................................................................................................................................................................................................................................................................................ | 15.67 | 5.02 | 7.97 |
Net Assets........................................................................................................................................................................................................................................................................................................................................................................................................................................................................................................................................................................................................................................................................................................................................................................................................................................................................................................................................................................................................................................ | $833,665,773 |
Number of Portfolio Holdings........................................................................................................................................................................................................................................................................................................................................................................................................................................................................................................................................................................................................................................................................................................................................................................................................................................................................................................................................................................................................................................ | 295 |
Net Investment Advisory Fees........................................................................................................................................................................................................................................................................................................................................................................................................................................................................................................................................................................................................................................................................................................................................................................................................................................................................................................................................................................................................................................ | $1,628,806 |
Portfolio Turnover Rate........................................................................................................................................................................................................................................................................................................................................................................................................................................................................................................................................................................................................................................................................................................................................................................................................................................................................................................................................................................................................................................ | 44% |
The Fund has added the MSCI USA Index in response to new regulatory requirements.
The inception date of the Fund was September 7, 2016. The first day of secondary market trading was September 9, 2016.
Past performance is not an indication of future results. Performance results do not reflect the deduction of taxes that a shareholder would pay on fund distributions or on the redemption or sale of fund shares. Visit iShares.com for more recent performance information.
What did the Fund invest in?
| Sector | Percent of Total InvestmentsFootnote Reference(a) |
|---|
Health Care........................................................................................................................................................................................................................................................................................................................................................................................................................................................................................................................................................................................................................................................................................................................................................................................................................................................................................................................................................................................................................................ | 18.0% |
Financials........................................................................................................................................................................................................................................................................................................................................................................................................................................................................................................................................................................................................................................................................................................................................................................................................................................................................................................................................................................................................................................ | 16.0 |
Industrials........................................................................................................................................................................................................................................................................................................................................................................................................................................................................................................................................................................................................................................................................................................................................................................................................................................................................................................................................................................................................................................ | 14.0 |
Consumer Discretionary........................................................................................................................................................................................................................................................................................................................................................................................................................................................................................................................................................................................................................................................................................................................................................................................................................................................................................................................................................................................................................................ | 9.2 |
Consumer Staples........................................................................................................................................................................................................................................................................................................................................................................................................................................................................................................................................................................................................................................................................................................................................................................................................................................................................................................................................................................................................................................ | 8.8 |
Information Technology........................................................................................................................................................................................................................................................................................................................................................................................................................................................................................................................................................................................................................................................................................................................................................................................................................................................................................................................................................................................................................................ | 7.7 |
Utilities........................................................................................................................................................................................................................................................................................................................................................................................................................................................................................................................................................................................................................................................................................................................................................................................................................................................................................................................................................................................................................................ | 7.1 |
Materials........................................................................................................................................................................................................................................................................................................................................................................................................................................................................................................................................................................................................................................................................................................................................................................................................................................................................................................................................................................................................................................ | 5.7 |
Energy........................................................................................................................................................................................................................................................................................................................................................................................................................................................................................................................................................................................................................................................................................................................................................................................................................................................................................................................................................................................................................................ | 5.1 |
Communication Services........................................................................................................................................................................................................................................................................................................................................................................................................................................................................................................................................................................................................................................................................................................................................................................................................................................................................................................................................................................................................................................ | 4.9 |
Real Estate........................................................................................................................................................................................................................................................................................................................................................................................................................................................................................................................................................................................................................................................................................................................................................................................................................................................................................................................................................................................................................................ | 3.5 |
| Security | Percent of Total InvestmentsFootnote Reference(a) |
|---|
Murphy USA, Inc......................................................................................................................................................................................................................................................................................................................................................................................................................................................................................................................................................................................................................................................................................................................................................................................................................................................................................................................................................................................................................................... | 1.6% |
Old Republic International Corp......................................................................................................................................................................................................................................................................................................................................................................................................................................................................................................................................................................................................................................................................................................................................................................................................................................................................................................................................................................................................................................... | 1.6 |
Royal Gold, Inc......................................................................................................................................................................................................................................................................................................................................................................................................................................................................................................................................................................................................................................................................................................................................................................................................................................................................................................................................................................................................................................... | 1.5 |
Chemed Corp......................................................................................................................................................................................................................................................................................................................................................................................................................................................................................................................................................................................................................................................................................................................................................................................................................................................................................................................................................................................................................................... | 1.4 |
Agree Realty Corp......................................................................................................................................................................................................................................................................................................................................................................................................................................................................................................................................................................................................................................................................................................................................................................................................................................................................................................................................................................................................................................... | 1.4 |
AptarGroup, Inc......................................................................................................................................................................................................................................................................................................................................................................................................................................................................................................................................................................................................................................................................................................................................................................................................................................................................................................................................................................................................................................... | 1.4 |
Axis Capital Holdings Ltd......................................................................................................................................................................................................................................................................................................................................................................................................................................................................................................................................................................................................................................................................................................................................................................................................................................................................................................................................................................................................................................... | 1.4 |
Exelixis, Inc......................................................................................................................................................................................................................................................................................................................................................................................................................................................................................................................................................................................................................................................................................................................................................................................................................................................................................................................................................................................................................................... | 1.3 |
Reinsurance Group of America, Inc......................................................................................................................................................................................................................................................................................................................................................................................................................................................................................................................................................................................................................................................................................................................................................................................................................................................................................................................................................................................................................................... | 1.2 |
RLI Corp......................................................................................................................................................................................................................................................................................................................................................................................................................................................................................................................................................................................................................................................................................................................................................................................................................................................................................................................................................................................................................................... | 1.2 |
| Footnote | Description |
Footnote(a) | Excludes money market funds. |
If you wish to view additional information about the Fund, including but not limited to financial statements, the Fund’s prospectus, and proxy voting policies and procedures, please visit blackrock.com/fundreports. For proxy voting records, visit blackrock.com/proxyrecords.
Householding is an option available to certain fund investors. Householding is a method of delivery, based on the preference of the individual investor, in which a single copy of certain shareholder documents can be delivered to investors who share the same address, even if their accounts are registered under different names. Please contact your broker-dealer if you are interested in enrolling in householding and receiving a single copy of prospectuses and other shareholder documents, or if you are currently enrolled in householding and wish to change your householding status.
The Fund is not sponsored, endorsed, issued, sold or promoted by MSCI Inc. and its affiliates, nor does this company make any representation regarding the advisability of investing in the Fund. BlackRock is not affiliated with the company listed above.
© 2024 BlackRock, Inc or its affiliates. All Rights Reserved. iSHARES and BLACKROCK are registered trademarks of BlackRock, Inc. or its affiliates. All other trademarks are those of their respective owners.
iShares MSCI USA Small-Cap Min Vol Factor ETF
Annual Shareholder Report — July 31, 2024
iShares U.S. Equity Factor ETF
Annual Shareholder Report — July 31, 2024
This annual shareholder report contains important information about iShares U.S. Equity Factor ETF (the “Fund”) for the period of August 1, 2023 to July 31, 2024. You can find additional information about the Fund at blackrock.com/fundreports. You can also request this information by contacting us at 1-800-iShares (1-800-474-2737).
What were the Fund costs for the last year?
(based on a hypothetical $10,000 investment)
| Fund name | Costs of a $10,000 investment | Costs paid as a percentage of a $10,000 investment |
|---|
| iShares U.S. Equity Factor ETF | $9 | 0.08% |
How did the Fund perform last year?
The recent market rally was heavily concentrated in a few mega-capitalization information technology companies even as economic growth slowed. Shares of small-capitalization firms underperformed their larger-capitalization peers.
The sharp increase in market fluctuations, along with a drop in index levels, caused trend-following, an investment strategy where investors make buy or sell decisions based on the current direction of market prices. This led to more selling in a falling market.
Market sentiment swung late in the period, shifting away from information technology stocks amid growing uncertainty about economic growth, geopolitics, and the upcoming U.S. presidential election.
What contributed to performance?
Momentum and quality stocks contributed the most to the Fund’s return during the reporting period, especially among companies with balance sheet strength that appeared poised to weather a sharper-than-anticipated slowdown in economic growth.
The information technology sector contributed the most to the Fund’s performance. The ongoing trend of artificial intelligence (“AI”) adoption created strong momentum across the sector, and firms benefited from the increased investment in technology spending. Within the information technology sector, companies responsible for the manufacturing of the semiconductor chips needed to power AI strongly contributed to the Fund’s performance, aided by increased demand for their products and strong tariffs limiting imports. The financials sector also contributed, as healthy bank balance sheets and the prospect of interest rates remaining higher for longer benefited the sector.
What detracted from performance?
Given the strength of equity markets during the reporting period ended July 31, 2024, there were no material detractors to the Fund’s performance.
The views expressed reflect the opinions of BlackRock as of the date of this report and are subject to change based on changes in market, economic or other conditions. These views are not intended to be a forecast of future events and are no guarantee of future results.
Cumulative performance: April 28, 2015 through July 31, 2024
Initial investment of $10,000
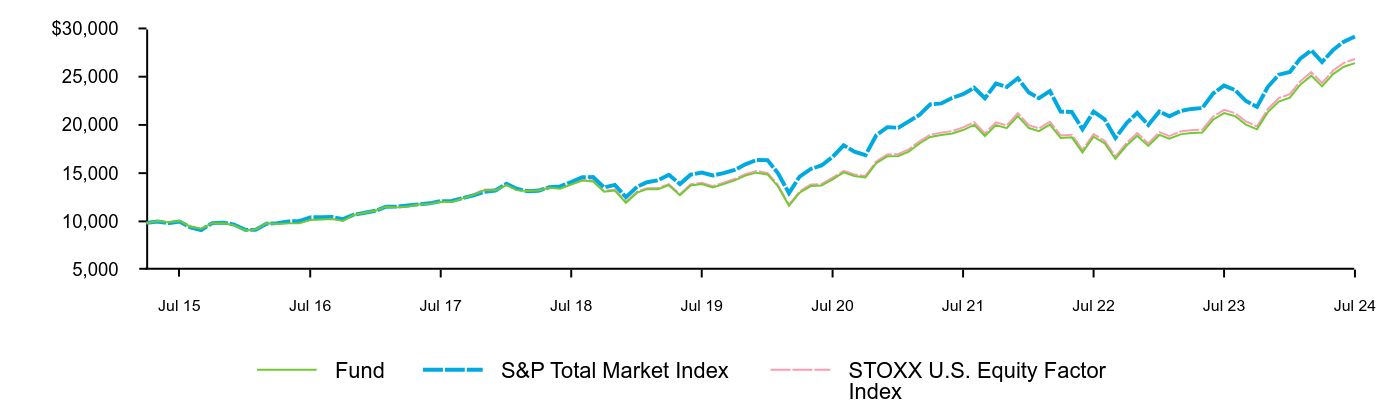
| Fund | S&P Total Market Index | STOXX U.S. Equity Factor Index |
|---|
| Apr 15 | 9,801 | 9,848 | 9,800 |
| May 15 | 10,048 | 9,986 | 10,050 |
| Jun 15 | 9,903 | 9,816 | 9,905 |
| Jul 15 | 10,043 | 9,978 | 10,051 |
| Aug 15 | 9,448 | 9,379 | 9,458 |
| Sep 15 | 9,241 | 9,103 | 9,251 |
| Oct 15 | 9,810 | 9,820 | 9,821 |
| Nov 15 | 9,798 | 9,875 | 9,814 |
| Dec 15 | 9,613 | 9,675 | 9,632 |
| Jan 16 | 9,060 | 9,125 | 9,077 |
| Feb 16 | 9,156 | 9,122 | 9,178 |
| Mar 16 | 9,809 | 9,764 | 9,838 |
| Apr 16 | 9,724 | 9,824 | 9,750 |
| May 16 | 9,796 | 10,000 | 9,829 |
| Jun 16 | 9,807 | 10,019 | 9,841 |
| Jul 16 | 10,135 | 10,418 | 10,177 |
| Aug 16 | 10,196 | 10,446 | 10,239 |
| Sep 16 | 10,240 | 10,465 | 10,286 |
| Oct 16 | 10,053 | 10,235 | 10,098 |
| Nov 16 | 10,671 | 10,690 | 10,721 |
| Dec 16 | 10,901 | 10,898 | 10,949 |
| Jan 17 | 11,126 | 11,110 | 11,178 |
| Feb 17 | 11,526 | 11,520 | 11,581 |
| Mar 17 | 11,454 | 11,529 | 11,513 |
| Apr 17 | 11,544 | 11,649 | 11,601 |
| May 17 | 11,753 | 11,767 | 11,812 |
| Jun 17 | 11,818 | 11,875 | 11,883 |
| Jul 17 | 12,037 | 12,099 | 12,105 |
| Aug 17 | 12,020 | 12,121 | 12,086 |
| Sep 17 | 12,389 | 12,417 | 12,461 |
| Oct 17 | 12,749 | 12,686 | 12,825 |
| Nov 17 | 13,233 | 13,071 | 13,313 |
| Dec 17 | 13,218 | 13,203 | 13,304 |
| Jan 18 | 13,759 | 13,904 | 13,849 |
| Feb 18 | 13,239 | 13,389 | 13,327 |
| Mar 18 | 13,148 | 13,124 | 13,241 |
| Apr 18 | 13,206 | 13,171 | 13,296 |
| May 18 | 13,478 | 13,543 | 13,572 |
| Jun 18 | 13,387 | 13,632 | 13,484 |
| Jul 18 | 13,827 | 14,088 | 13,926 |
| Aug 18 | 14,233 | 14,578 | 14,342 |
| Sep 18 | 14,137 | 14,601 | 14,247 |
| Oct 18 | 13,081 | 13,519 | 13,185 |
| Nov 18 | 13,191 | 13,790 | 13,296 |
| Dec 18 | 11,924 | 12,504 | 12,018 |
| Jan 19 | 12,978 | 13,581 | 13,085 |
| Feb 19 | 13,338 | 14,058 | 13,449 |
| Mar 19 | 13,341 | 14,260 | 13,456 |
| Apr 19 | 13,753 | 14,828 | 13,875 |
| May 19 | 12,708 | 13,871 | 12,821 |
| Jun 19 | 13,720 | 14,843 | 13,851 |
| Jul 19 | 13,880 | 15,061 | 14,016 |
| Aug 19 | 13,517 | 14,757 | 13,650 |
| Sep 19 | 13,869 | 15,012 | 14,009 |
| Oct 19 | 14,247 | 15,330 | 14,392 |
| Nov 19 | 14,742 | 15,910 | 14,893 |
| Dec 19 | 15,051 | 16,368 | 15,212 |
| Jan 20 | 14,867 | 16,348 | 15,029 |
| Feb 20 | 13,649 | 15,009 | 13,800 |
| Mar 20 | 11,615 | 12,937 | 11,743 |
| Apr 20 | 12,972 | 14,652 | 13,114 |
| May 20 | 13,661 | 15,439 | 13,815 |
| Jun 20 | 13,713 | 15,795 | 13,868 |
| Jul 20 | 14,365 | 16,687 | 14,530 |
| Aug 20 | 15,075 | 17,886 | 15,250 |
| Sep 20 | 14,701 | 17,228 | 14,873 |
| Oct 20 | 14,546 | 16,861 | 14,717 |
| Nov 20 | 16,024 | 18,922 | 16,216 |
| Dec 20 | 16,745 | 19,771 | 16,948 |
| Jan 21 | 16,781 | 19,707 | 16,990 |
| Feb 21 | 17,216 | 20,338 | 17,434 |
| Mar 21 | 18,074 | 21,046 | 18,306 |
| Apr 21 | 18,747 | 22,127 | 18,989 |
| May 21 | 18,947 | 22,228 | 19,200 |
| Jun 21 | 19,108 | 22,791 | 19,368 |
| Jul 21 | 19,469 | 23,183 | 19,738 |
| Aug 21 | 20,000 | 23,846 | 20,279 |
| Sep 21 | 18,852 | 22,764 | 19,114 |
| Oct 21 | 19,988 | 24,293 | 20,268 |
| Nov 21 | 19,666 | 23,935 | 19,947 |
| Dec 21 | 20,907 | 24,845 | 21,208 |
| Jan 22 | 19,676 | 23,353 | 19,965 |
| Feb 22 | 19,353 | 22,766 | 19,638 |
| Mar 22 | 20,037 | 23,503 | 20,336 |
| Apr 22 | 18,635 | 21,383 | 18,915 |
| May 22 | 18,708 | 21,340 | 18,990 |
| Jun 22 | 17,149 | 19,546 | 17,403 |
| Jul 22 | 18,772 | 21,379 | 19,051 |
| Aug 22 | 18,093 | 20,572 | 18,362 |
| Sep 22 | 16,474 | 18,654 | 16,720 |
| Oct 22 | 17,865 | 20,177 | 18,134 |
| Nov 22 | 18,875 | 21,242 | 19,159 |
| Dec 22 | 17,818 | 19,993 | 18,087 |
| Jan 23 | 18,960 | 21,387 | 19,246 |
| Feb 23 | 18,566 | 20,892 | 18,846 |
| Mar 23 | 19,024 | 21,442 | 19,313 |
| Apr 23 | 19,170 | 21,657 | 19,461 |
| May 23 | 19,214 | 21,751 | 19,508 |
| Jun 23 | 20,536 | 23,241 | 20,852 |
| Jul 23 | 21,229 | 24,078 | 21,557 |
| Aug 23 | 20,905 | 23,606 | 21,221 |
| Sep 23 | 20,037 | 22,476 | 20,353 |
| Oct 23 | 19,540 | 21,871 | 19,840 |
| Nov 23 | 21,297 | 23,924 | 21,629 |
| Dec 23 | 22,413 | 25,204 | 22,780 |
| Jan 24 | 22,832 | 25,483 | 23,190 |
| Feb 24 | 24,177 | 26,868 | 24,516 |
| Mar 24 | 25,106 | 27,736 | 25,465 |
| Apr 24 | 23,990 | 26,513 | 24,347 |
| May 24 | 25,268 | 27,771 | 25,635 |
| Jun 24 | 26,034 | 28,634 | 26,425 |
| Jul 24 | 26,406 | 29,160 | 26,832 |
See “Average annual total returns” for additional information on fund performance.
Average annual total returns
| Average Annual Total Returns | 1 Year | 5 Years | Since Fund Inception |
|---|
Fund NAV........................................................................................................................................................................................................................................................................................................................................................................................................................................................................................................................................................................................................................................................................................................................................................................................................................................................................................................................................................................................................................................ | 24.38% | 13.73% | 11.06% |
Fund Market........................................................................................................................................................................................................................................................................................................................................................................................................................................................................................................................................................................................................................................................................................................................................................................................................................................................................................................................................................................................................................................ | 24.48 | 13.75 | 11.06 |
S&P Total Market Index........................................................................................................................................................................................................................................................................................................................................................................................................................................................................................................................................................................................................................................................................................................................................................................................................................................................................................................................................................................................................................................ | 21.10 | 14.13 | 12.26 |
STOXX U.S. Equity Factor Index........................................................................................................................................................................................................................................................................................................................................................................................................................................................................................................................................................................................................................................................................................................................................................................................................................................................................................................................................................................................................................................ | 24.52 | 13.88 | 11.26 |
Net Assets........................................................................................................................................................................................................................................................................................................................................................................................................................................................................................................................................................................................................................................................................................................................................................................................................................................................................................................................................................................................................................................ | $2,051,025,522 |
Number of Portfolio Holdings........................................................................................................................................................................................................................................................................................................................................................................................................................................................................................................................................................................................................................................................................................................................................................................................................................................................................................................................................................................................................................................ | 283 |
Net Investment Advisory Fees........................................................................................................................................................................................................................................................................................................................................................................................................................................................................................................................................................................................................................................................................................................................................................................................................................................................................................................................................................................................................................................ | $1,330,043 |
Portfolio Turnover Rate........................................................................................................................................................................................................................................................................................................................................................................................................................................................................................................................................................................................................................................................................................................................................................................................................................................................................................................................................................................................................................................ | 21% |
The Fund has added the S&P Total Market Index in response to new regulatory requirements.
The inception date of the Fund was April 28, 2015. The first day of secondary market trading was April 30, 2015.
The performance of the STOXX U.S. Equity Factor Index in this report reflects the performance of the MSCI USA Diversified Multiple-Factor Index through May 31, 2022 and, beginning on June 1, 2022, the performance of the STOXX U.S. Equity Factor Index.
Past performance is not an indication of future results. Performance results do not reflect the deduction of taxes that a shareholder would pay on fund distributions or on the redemption or sale of fund shares. Visit iShares.com for more recent performance information.
What did the Fund invest in?
| Sector | Percent of Total InvestmentsFootnote Reference(a) |
|---|
Information Technology........................................................................................................................................................................................................................................................................................................................................................................................................................................................................................................................................................................................................................................................................................................................................................................................................................................................................................................................................................................................................................................ | 32.4% |
Health Care........................................................................................................................................................................................................................................................................................................................................................................................................................................................................................................................................................................................................................................................................................................................................................................................................................................................................................................................................................................................................................................ | 12.7 |
Financials........................................................................................................................................................................................................................................................................................................................................................................................................................................................................................................................................................................................................................................................................................................................................................................................................................................................................................................................................................................................................................................ | 12.3 |
Consumer Discretionary........................................................................................................................................................................................................................................................................................................................................................................................................................................................................................................................................................................................................................................................................................................................................................................................................................................................................................................................................................................................................................................ | 12.2 |
Industrials........................................................................................................................................................................................................................................................................................................................................................................................................................................................................................................................................................................................................................................................................................................................................................................................................................................................................................................................................................................................................................................ | 7.3 |
Consumer Staples........................................................................................................................................................................................................................................................................................................................................................................................................................................................................................................................................................................................................................................................................................................................................................................................................................................................................................................................................................................................................................................ | 6.4 |
Communication Services........................................................................................................................................................................................................................................................................................................................................................................................................................................................................................................................................................................................................................................................................................................................................................................................................................................................................................................................................................................................................................................ | 6.0 |
Energy........................................................................................................................................................................................................................................................................................................................................................................................................................................................................................................................................................................................................................................................................................................................................................................................................................................................................................................................................................................................................................................ | 3.7 |
Utilities........................................................................................................................................................................................................................................................................................................................................................................................................................................................................................................................................................................................................................................................................................................................................................................................................................................................................................................................................................................................................................................ | 2.9 |
Materials........................................................................................................................................................................................................................................................................................................................................................................................................................................................................................................................................................................................................................................................................................................................................................................................................................................................................................................................................................................................................................................ | 2.3 |
Real Estate........................................................................................................................................................................................................................................................................................................................................................................................................................................................................................................................................................................................................................................................................................................................................................................................................................................................................................................................................................................................................................................ | 1.8 |
| Security | Percent of Total InvestmentsFootnote Reference(a) |
|---|
Apple, Inc......................................................................................................................................................................................................................................................................................................................................................................................................................................................................................................................................................................................................................................................................................................................................................................................................................................................................................................................................................................................................................................... | 6.6% |
Microsoft Corp......................................................................................................................................................................................................................................................................................................................................................................................................................................................................................................................................................................................................................................................................................................................................................................................................................................................................................................................................................................................................................................... | 6.2 |
NVIDIA Corp......................................................................................................................................................................................................................................................................................................................................................................................................................................................................................................................................................................................................................................................................................................................................................................................................................................................................................................................................................................................................................................... | 5.7 |
Amazon.com, Inc......................................................................................................................................................................................................................................................................................................................................................................................................................................................................................................................................................................................................................................................................................................................................................................................................................................................................................................................................................................................................................................... | 2.8 |
Broadcom, Inc......................................................................................................................................................................................................................................................................................................................................................................................................................................................................................................................................................................................................................................................................................................................................................................................................................................................................................................................................................................................................................................... | 2.2 |
Alphabet, Inc., Class C, NVS........................................................................................................................................................................................................................................................................................................................................................................................................................................................................................................................................................................................................................................................................................................................................................................................................................................................................................................................................................................................................................................ | 1.9 |
Meta Platforms, Inc., Class A........................................................................................................................................................................................................................................................................................................................................................................................................................................................................................................................................................................................................................................................................................................................................................................................................................................................................................................................................................................................................................................ | 1.9 |
JPMorgan Chase & Co......................................................................................................................................................................................................................................................................................................................................................................................................................................................................................................................................................................................................................................................................................................................................................................................................................................................................................................................................................................................................................................... | 1.6 |
Procter & Gamble Co. (The)........................................................................................................................................................................................................................................................................................................................................................................................................................................................................................................................................................................................................................................................................................................................................................................................................................................................................................................................................................................................................................................ | 1.3 |
Visa, Inc., Class A........................................................................................................................................................................................................................................................................................................................................................................................................................................................................................................................................................................................................................................................................................................................................................................................................................................................................................................................................................................................................................................ | 1.2 |
| Footnote | Description |
Footnote(a) | Excludes money market funds. |
If you wish to view additional information about the Fund, including but not limited to financial statements, the Fund’s prospectus, and proxy voting policies and procedures, please visit blackrock.com/fundreports. For proxy voting records, visit blackrock.com/proxyrecords.
Householding is an option available to certain fund investors. Householding is a method of delivery, based on the preference of the individual investor, in which a single copy of certain shareholder documents can be delivered to investors who share the same address, even if their accounts are registered under different names. Please contact your broker-dealer if you are interested in enrolling in householding and receiving a single copy of prospectuses and other shareholder documents, or if you are currently enrolled in householding and wish to change your householding status.
The Fund is not sponsored, endorsed, issued, sold, or promoted by S&P Dow Jones Indices LLC, MSCI Inc. or STOXX and its affiliates, nor do these companies make any representation regarding the advisability of investing in the Fund. BlackRock is not affiliated with the companies listed above.
© 2024 BlackRock, Inc. or its affiliates. All Rights reserved. iSHARES and BLACKROCK are registered trademarks of BlackRock, Inc. or its affiliates. All other trademarks are those of their respective owners.
iShares U.S. Equity Factor ETF
Annual Shareholder Report — July 31, 2024
iShares U.S. Small-Cap Equity Factor ETF
Annual Shareholder Report — July 31, 2024
This annual shareholder report contains important information about iShares U.S. Small-Cap Equity Factor ETF (the “Fund”) for the period of August 1, 2023 to July 31, 2024. You can find additional information about the Fund at blackrock.com/fundreports. You can also request this information by contacting us at 1-800-iShares (1-800-474-2737).
This report describes changes to the Fund that occurred during the reporting period.
What were the Fund costs for the last year?
(based on a hypothetical $10,000 investment)
| Fund name | Costs of a $10,000 investment | Costs paid as a percentage of a $10,000 investment |
|---|
| iShares U.S. Small-Cap Equity Factor ETF | $16 | 0.15% |
How did the Fund perform last year?
The recent market rally was heavily concentrated in a few mega-capitalization information technology companies even as economic growth slowed. Shares of small-capitalization firms underperformed their larger-capitalization peers.
The sharp increase in market fluctuations, along with a drop in index levels, caused trend-following, an investment strategy where investors make buy or sell decisions based on the current direction of market prices. This led to more selling in a falling market.
Market sentiment swung late in the period, shifting away from information technology stocks amid growing uncertainty about economic growth, geopolitics, and the upcoming U.S. presidential election.
What contributed to performance?
Value and momentum stocks contributed to the Fund’s performance during the reporting period. The financials sector contributed the most to the Fund’s performance, as healthy bank balance sheets and the prospect of interest rates remaining higher for longer benefited financial companies. During the reporting period, the U.S. Federal Reserve held interest rates steady. Within the sector, companies in the capital markets advanced, helped by increasing investment banking revenues. The industrials sector also contributed to performance, most notably within the building products industry as cooling inflation boosted companies that make, distribute, and install construction materials. Within the consumer discretionary sector, several specialty retail stocks benefited from a jump in sales.
What detracted from performance?
Given the strength of equity markets during the reporting period ended July 31, 2024, there were no material detractors to the Fund’s performance.
The views expressed reflect the opinions of BlackRock as of the date of this report and are subject to change based on changes in market, economic or other conditions. These views are not intended to be a forecast of future events and are no guarantee of future results.
Cumulative performance: April 28, 2015 through July 31, 2024
Initial investment of $10,000
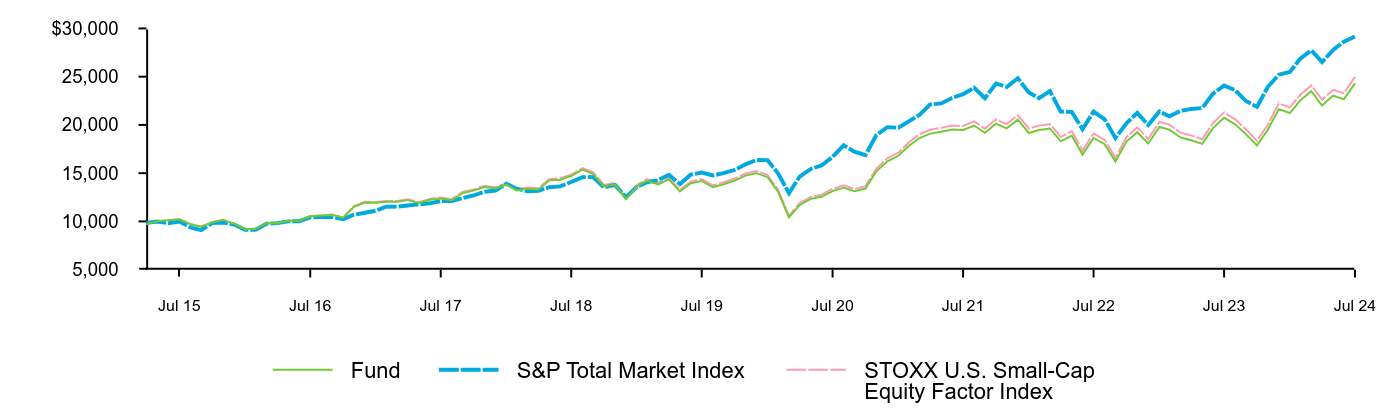
| Fund | S&P Total Market Index | STOXX U.S. Small-Cap Equity Factor Index |
|---|
| Apr 15 | 9,708 | 9,848 | 9,706 |
| May 15 | 10,030 | 9,986 | 10,037 |
| Jun 15 | 10,120 | 9,816 | 10,126 |
| Jul 15 | 10,223 | 9,978 | 10,234 |
| Aug 15 | 9,711 | 9,379 | 9,722 |
| Sep 15 | 9,458 | 9,103 | 9,460 |
| Oct 15 | 9,908 | 9,820 | 9,911 |
| Nov 15 | 10,155 | 9,875 | 10,162 |
| Dec 15 | 9,765 | 9,675 | 9,775 |
| Jan 16 | 9,193 | 9,125 | 9,204 |
| Feb 16 | 9,237 | 9,122 | 9,249 |
| Mar 16 | 9,810 | 9,764 | 9,830 |
| Apr 16 | 9,810 | 9,824 | 9,827 |
| May 16 | 10,065 | 10,000 | 10,084 |
| Jun 16 | 10,062 | 10,019 | 10,087 |
| Jul 16 | 10,532 | 10,418 | 10,562 |
| Aug 16 | 10,599 | 10,446 | 10,634 |
| Sep 16 | 10,685 | 10,465 | 10,722 |
| Oct 16 | 10,379 | 10,235 | 10,412 |
| Nov 16 | 11,522 | 10,690 | 11,569 |
| Dec 16 | 11,962 | 10,898 | 12,034 |
| Jan 17 | 11,932 | 11,110 | 12,009 |
| Feb 17 | 12,026 | 11,520 | 12,114 |
| Mar 17 | 12,030 | 11,529 | 12,116 |
| Apr 17 | 12,203 | 11,649 | 12,292 |
| May 17 | 11,909 | 11,767 | 11,999 |
| Jun 17 | 12,250 | 11,875 | 12,338 |
| Jul 17 | 12,382 | 12,099 | 12,489 |
| Aug 17 | 12,193 | 12,121 | 12,303 |
| Sep 17 | 12,939 | 12,417 | 13,057 |
| Oct 17 | 13,193 | 12,686 | 13,315 |
| Nov 17 | 13,567 | 13,071 | 13,697 |
| Dec 17 | 13,405 | 13,203 | 13,540 |
| Jan 18 | 13,807 | 13,904 | 13,946 |
| Feb 18 | 13,197 | 13,389 | 13,326 |
| Mar 18 | 13,380 | 13,124 | 13,507 |
| Apr 18 | 13,301 | 13,171 | 13,430 |
| May 18 | 14,254 | 13,543 | 14,389 |
| Jun 18 | 14,325 | 13,632 | 14,464 |
| Jul 18 | 14,701 | 14,088 | 14,857 |
| Aug 18 | 15,358 | 14,578 | 15,533 |
| Sep 18 | 14,925 | 14,601 | 15,100 |
| Oct 18 | 13,605 | 13,519 | 13,765 |
| Nov 18 | 13,834 | 13,790 | 14,003 |
| Dec 18 | 12,310 | 12,504 | 12,456 |
| Jan 19 | 13,615 | 13,581 | 13,782 |
| Feb 19 | 14,218 | 14,058 | 14,396 |
| Mar 19 | 13,831 | 14,260 | 14,009 |
| Apr 19 | 14,349 | 14,828 | 14,537 |
| May 19 | 13,096 | 13,871 | 13,269 |
| Jun 19 | 13,941 | 14,843 | 14,132 |
| Jul 19 | 14,194 | 15,061 | 14,394 |
| Aug 19 | 13,546 | 14,757 | 13,738 |
| Sep 19 | 13,856 | 15,012 | 14,055 |
| Oct 19 | 14,221 | 15,330 | 14,428 |
| Nov 19 | 14,750 | 15,910 | 14,971 |
| Dec 19 | 14,997 | 16,368 | 15,224 |
| Jan 20 | 14,581 | 16,348 | 14,808 |
| Feb 20 | 13,114 | 15,009 | 13,327 |
| Mar 20 | 10,426 | 12,937 | 10,592 |
| Apr 20 | 11,707 | 14,652 | 11,895 |
| May 20 | 12,335 | 15,439 | 12,538 |
| Jun 20 | 12,550 | 15,795 | 12,772 |
| Jul 20 | 13,145 | 16,687 | 13,380 |
| Aug 20 | 13,496 | 17,886 | 13,742 |
| Sep 20 | 13,132 | 17,228 | 13,375 |
| Oct 20 | 13,403 | 16,861 | 13,656 |
| Nov 20 | 15,168 | 18,922 | 15,456 |
| Dec 20 | 16,233 | 19,771 | 16,546 |
| Jan 21 | 16,798 | 19,707 | 17,129 |
| Feb 21 | 17,789 | 20,338 | 18,144 |
| Mar 21 | 18,644 | 21,046 | 19,021 |
| Apr 21 | 19,102 | 22,127 | 19,496 |
| May 21 | 19,291 | 22,228 | 19,696 |
| Jun 21 | 19,524 | 22,791 | 19,939 |
| Jul 21 | 19,471 | 23,183 | 19,890 |
| Aug 21 | 19,934 | 23,846 | 20,369 |
| Sep 21 | 19,181 | 22,764 | 19,604 |
| Oct 21 | 20,127 | 24,293 | 20,576 |
| Nov 21 | 19,641 | 23,935 | 20,086 |
| Dec 21 | 20,544 | 24,845 | 21,014 |
| Jan 22 | 19,161 | 23,353 | 19,608 |
| Feb 22 | 19,467 | 22,766 | 19,925 |
| Mar 22 | 19,634 | 23,503 | 20,101 |
| Apr 22 | 18,301 | 21,383 | 18,741 |
| May 22 | 18,895 | 21,340 | 19,356 |
| Jun 22 | 16,919 | 19,546 | 17,336 |
| Jul 22 | 18,648 | 21,379 | 19,109 |
| Aug 22 | 18,006 | 20,572 | 18,453 |
| Sep 22 | 16,199 | 18,654 | 16,607 |
| Oct 22 | 18,273 | 20,177 | 18,739 |
| Nov 22 | 19,244 | 21,242 | 19,742 |
| Dec 22 | 18,077 | 19,993 | 18,549 |
| Jan 23 | 19,786 | 21,387 | 20,305 |
| Feb 23 | 19,512 | 20,892 | 20,029 |
| Mar 23 | 18,704 | 21,442 | 19,205 |
| Apr 23 | 18,409 | 21,657 | 18,903 |
| May 23 | 18,033 | 21,751 | 18,513 |
| Jun 23 | 19,670 | 23,241 | 20,195 |
| Jul 23 | 20,742 | 24,078 | 21,296 |
| Aug 23 | 20,063 | 23,606 | 20,575 |
| Sep 23 | 19,050 | 22,476 | 19,548 |
| Oct 23 | 17,884 | 21,871 | 18,342 |
| Nov 23 | 19,473 | 23,924 | 20,000 |
| Dec 23 | 21,637 | 25,204 | 22,234 |
| Jan 24 | 21,236 | 25,483 | 21,811 |
| Feb 24 | 22,533 | 26,868 | 23,122 |
| Mar 24 | 23,509 | 27,736 | 24,098 |
| Apr 24 | 22,017 | 26,513 | 22,611 |
| May 24 | 23,048 | 27,771 | 23,631 |
| Jun 24 | 22,651 | 28,634 | 23,262 |
| Jul 24 | 24,308 | 29,160 | 24,977 |
See “Average annual total returns” for additional information on fund performance.
Average annual total returns
| Average Annual Total Returns | 1 Year | 5 Years | Since Fund Inception |
|---|
Fund NAV........................................................................................................................................................................................................................................................................................................................................................................................................................................................................................................................................................................................................................................................................................................................................................................................................................................................................................................................................................................................................................................ | 17.19% | 11.36% | 10.07% |
Fund Market........................................................................................................................................................................................................................................................................................................................................................................................................................................................................................................................................................................................................................................................................................................................................................................................................................................................................................................................................................................................................................................ | 17.29 | 11.37 | 10.08 |
S&P Total Market Index........................................................................................................................................................................................................................................................................................................................................................................................................................................................................................................................................................................................................................................................................................................................................................................................................................................................................................................................................................................................................................................ | 21.10 | 14.13 | 12.26 |
STOXX U.S. Small-Cap Equity Factor Index........................................................................................................................................................................................................................................................................................................................................................................................................................................................................................................................................................................................................................................................................................................................................................................................................................................................................................................................................................................................................................................ | 17.24 | 11.65 | 10.39 |
Net Assets........................................................................................................................................................................................................................................................................................................................................................................................................................................................................................................................................................................................................................................................................................................................................................................................................................................................................................................................................................................................................................................ | $1,227,251,197 |
Number of Portfolio Holdings........................................................................................................................................................................................................................................................................................................................................................................................................................................................................................................................................................................................................................................................................................................................................................................................................................................................................................................................................................................................................................................ | 881 |
Net Investment Advisory Fees........................................................................................................................................................................................................................................................................................................................................................................................................................................................................................................................................................................................................................................................................................................................................................................................................................................................................................................................................................................................................................................ | $1,345,520 |
Portfolio Turnover Rate........................................................................................................................................................................................................................................................................................................................................................................................................................................................................................................................................................................................................................................................................................................................................................................................................................................................................................................................................................................................................................................ | 23% |
The Fund has added the S&P Total Market Index in response to new regulatory requirements.
The inception date of the Fund was April 28, 2015. The first day of secondary market trading was April 30, 2015.
The performance of the STOXX U.S. Small-Cap Equity Factor Index in this report reflects the performance of the MSCI USA Small Cap Diversified Multiple-Factor Index through February 28, 2023 and, beginning on March 1, 2023, the performance of the STOXX U.S. Small-Cap Equity Factor Index.
Past performance is not an indication of future results. Performance results do not reflect the deduction of taxes that a shareholder would pay on fund distributions or on the redemption or sale of fund shares. Visit iShares.com for more recent performance information.
What did the Fund invest in?
| Sector | Percent of Total InvestmentsFootnote Reference(a) |
|---|
Industrials........................................................................................................................................................................................................................................................................................................................................................................................................................................................................................................................................................................................................................................................................................................................................................................................................................................................................................................................................................................................................................................ | 18.3% |
Financials........................................................................................................................................................................................................................................................................................................................................................................................................................................................................................................................................................................................................................................................................................................................................................................................................................................................................................................................................................................................................................................ | 16.3 |
Consumer Discretionary........................................................................................................................................................................................................................................................................................................................................................................................................................................................................................................................................................................................................................................................................................................................................................................................................................................................................................................................................................................................................................................ | 14.8 |
Information Technology........................................................................................................................................................................................................................................................................................................................................................................................................................................................................................................................................................................................................................................................................................................................................................................................................................................................................................................................................................................................................................................ | 14.1 |
Health Care........................................................................................................................................................................................................................................................................................................................................................................................................................................................................................................................................................................................................................................................................................................................................................................................................................................................................................................................................................................................................................................ | 11.2 |
Real Estate........................................................................................................................................................................................................................................................................................................................................................................................................................................................................................................................................................................................................................................................................................................................................................................................................................................................................................................................................................................................................................................ | 6.8 |
Energy........................................................................................................................................................................................................................................................................................................................................................................................................................................................................................................................................................................................................................................................................................................................................................................................................................................................................................................................................................................................................................................ | 5.1 |
Materials........................................................................................................................................................................................................................................................................................................................................................................................................................................................................................................................................................................................................................................................................................................................................................................................................................................................................................................................................................................................................................................ | 4.8 |
Consumer Staples........................................................................................................................................................................................................................................................................................................................................................................................................................................................................................................................................................................................................................................................................................................................................................................................................................................................................................................................................................................................................................................ | 3.8 |
Communication Services........................................................................................................................................................................................................................................................................................................................................................................................................................................................................................................................................................................................................................................................................................................................................................................................................................................................................................................................................................................................................................................ | 2.7 |
Utilities........................................................................................................................................................................................................................................................................................................................................................................................................................................................................................................................................................................................................................................................................................................................................................................................................................................................................................................................................................................................................................................ | 2.1 |
| Security | Percent of Total InvestmentsFootnote Reference(a) |
|---|
EMCOR Group, Inc......................................................................................................................................................................................................................................................................................................................................................................................................................................................................................................................................................................................................................................................................................................................................................................................................................................................................................................................................................................................................................................... | 0.8% |
Evercore, Inc., Class A........................................................................................................................................................................................................................................................................................................................................................................................................................................................................................................................................................................................................................................................................................................................................................................................................................................................................................................................................................................................................................................ | 0.7 |
Deckers Outdoor Corp......................................................................................................................................................................................................................................................................................................................................................................................................................................................................................................................................................................................................................................................................................................................................................................................................................................................................................................................................................................................................................................... | 0.7 |
Popular, Inc......................................................................................................................................................................................................................................................................................................................................................................................................................................................................................................................................................................................................................................................................................................................................................................................................................................................................................................................................................................................................................................... | 0.6 |
First Industrial Realty Trust, Inc......................................................................................................................................................................................................................................................................................................................................................................................................................................................................................................................................................................................................................................................................................................................................................................................................................................................................................................................................................................................................................................... | 0.6 |
Williams-Sonoma, Inc......................................................................................................................................................................................................................................................................................................................................................................................................................................................................................................................................................................................................................................................................................................................................................................................................................................................................................................................................................................................................................................... | 0.5 |
Weatherford International plc........................................................................................................................................................................................................................................................................................................................................................................................................................................................................................................................................................................................................................................................................................................................................................................................................................................................................................................................................................................................................................................ | 0.5 |
nVent Electric plc........................................................................................................................................................................................................................................................................................................................................................................................................................................................................................................................................................................................................................................................................................................................................................................................................................................................................................................................................................................................................................................ | 0.5 |
Reliance, Inc......................................................................................................................................................................................................................................................................................................................................................................................................................................................................................................................................................................................................................................................................................................................................................................................................................................................................................................................................................................................................................................... | 0.5 |
Jabil, Inc......................................................................................................................................................................................................................................................................................................................................................................................................................................................................................................................................................................................................................................................................................................................................................................................................................................................................................................................................................................................................................................... | 0.5 |
| Footnote | Description |
Footnote(a) | Excludes money market funds. |
This is a summary of certain changes to the Fund since July 31, 2023. For more complete information, you may review the Fund's next prospectus, which we expect to be available approximately 120 days after July 31, 2024 at blackrock.com/fundreports or upon request by contacting us at 1-800-iShares (1-800-474-2737).
The net expense ratio decreased from the prior fiscal year end primarily due to a change in the Fund’s investment advisory agreement during the prior fiscal year.
If you wish to view additional information about the Fund, including but not limited to financial statements, the Fund’s prospectus, and proxy voting policies and procedures, please visit blackrock.com/fundreports. For proxy voting records, visit blackrock.com/proxyrecords.
Householding is an option available to certain fund investors. Householding is a method of delivery, based on the preference of the individual investor, in which a single copy of certain shareholder documents can be delivered to investors who share the same address, even if their accounts are registered under different names. Please contact your broker-dealer if you are interested in enrolling in householding and receiving a single copy of prospectuses and other shareholder documents, or if you are currently enrolled in householding and wish to change your householding status.
The Fund is not sponsored, endorsed, issued, sold, or promoted by S&P Dow Jones Indices LLC, MSCI Inc. or STOXX and its affiliates, nor do these companies make any representation regarding the advisability of investing in the Fund. BlackRock is not affiliated with the companies listed above.
© 2024 BlackRock, Inc. or its affiliates. All Rights reserved. iSHARES and BLACKROCK are registered trademarks of BlackRock, Inc. or its affiliates. All other trademarks are those of their respective owners.
iShares U.S. Small-Cap Equity Factor ETF
Annual Shareholder Report — July 31, 2024
iShares U.S. Tech Breakthrough Multisector ETF
Annual Shareholder Report — July 31, 2024
This annual shareholder report contains important information about iShares U.S. Tech Breakthrough Multisector ETF (the “Fund”) for the period of August 1, 2023 to July 31, 2024. You can find additional information about the Fund at blackrock.com/fundreports. You can also request this information by contacting us at 1-800-iShares (1-800-474-2737).
This report describes changes to the Fund that occurred during the reporting period.
What were the Fund costs for the last year?
(based on a hypothetical $10,000 investment)
| Fund name | Costs of a $10,000 investment | Costs paid as a percentage of a $10,000 investment |
|---|
| iShares U.S. Tech Breakthrough Multisector ETF | $34 | 0.30% |
How did the Fund perform last year?
Slowing inflationary pressures and hopes of interest rate cuts drove global stocks higher for the reporting period. U.S. equities led markets, propelled by the information technology sector and enthusiasm over artificial intelligence.
U.S. stocks powered markets higher, driven by the enthusiasm for artificial intelligence, particularly in the information technology sector.
However, market sentiment swung late in the reporting period amid a shift away from information technology stocks as uncertainty surrounding economic growth, geopolitics, and the upcoming U.S. presidential election grew. Adding to the volatility was a technical outage stemming from a major cybersecurity supplier that impacted a wide variety of companies and prompted swift analyst downgrades of the company’s stock, sending shares tumbling.
What contributed to performance?
The information technology sector, which represented 57% of the Fund on average, strongly contributed to the Fund’s performance during the reporting period. The ongoing trend of artificial intelligence (“AI”) adoption created strong momentum across the sector, and firms benefited from the increased investment in technology spending. Within the information technology sector, companies responsible for the manufacturing of the semiconductor chips needed to power AI advanced, aided by increased demand for their products and strong tariffs limiting imports. Communication stocks also contributed to the Fund’s performance, most notably within the media and entertainment industry. Interactive media and services companies contributed the most, as global social media platforms capitalized on AI enthusiasm and increased digital advertising revenue.
What detracted from performance?
Given the strength of equity markets during the reporting period ended July 31, 2024, there were no material detractors to the Fund’s performance.
The views expressed reflect the opinions of BlackRock as of the date of this report and are subject to change based on changes in market, economic or other conditions. These views are not intended to be a forecast of future events and are no guarantee of future results.
Cumulative performance: January 8, 2020 through July 31, 2024
Initial investment of $10,000
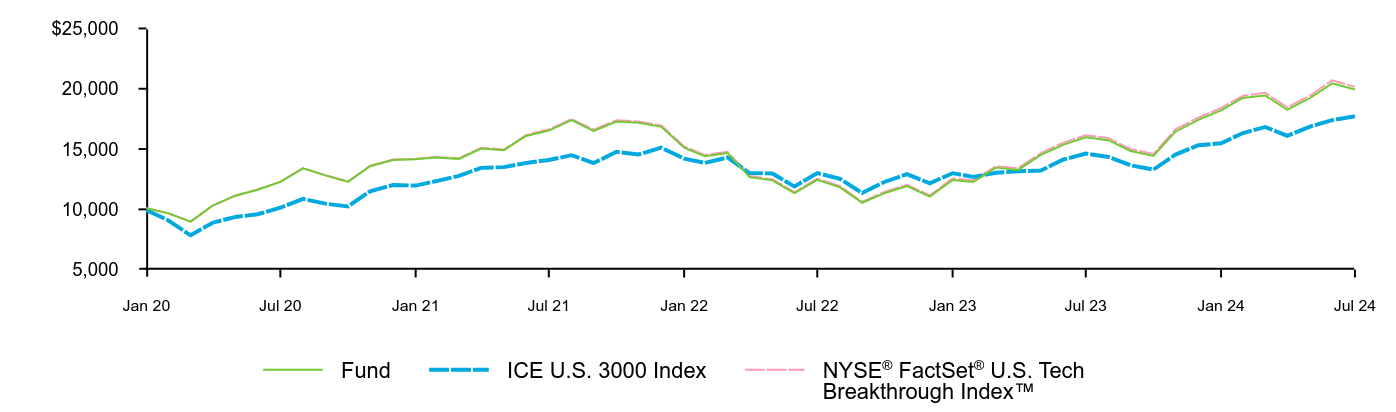
| Fund | ICE U.S. 3000 Index | NYSE®FactSet® U.S. Tech Breakthrough Index™ |
|---|
| Jan 20 | 10,087 | 9,921 | 10,089 |
| Feb 20 | 9,683 | 9,106 | 9,689 |
| Mar 20 | 8,984 | 7,850 | 8,989 |
| Apr 20 | 10,305 | 8,891 | 10,317 |
| May 20 | 11,132 | 9,368 | 11,146 |
| Jun 20 | 11,626 | 9,592 | 11,645 |
| Jul 20 | 12,273 | 10,133 | 12,299 |
| Aug 20 | 13,396 | 10,867 | 13,427 |
| Sep 20 | 12,815 | 10,470 | 12,848 |
| Oct 20 | 12,275 | 10,246 | 12,310 |
| Nov 20 | 13,575 | 11,494 | 13,619 |
| Dec 20 | 14,083 | 12,016 | 14,131 |
| Jan 21 | 14,147 | 11,970 | 14,197 |
| Feb 21 | 14,292 | 12,345 | 14,346 |
| Mar 21 | 14,184 | 12,779 | 14,241 |
| Apr 21 | 15,043 | 13,441 | 15,110 |
| May 21 | 14,907 | 13,497 | 14,974 |
| Jun 21 | 16,081 | 13,846 | 16,159 |
| Jul 21 | 16,535 | 14,089 | 16,622 |
| Aug 21 | 17,394 | 14,491 | 17,490 |
| Sep 21 | 16,507 | 13,842 | 16,603 |
| Oct 21 | 17,279 | 14,769 | 17,381 |
| Nov 21 | 17,179 | 14,552 | 17,291 |
| Dec 21 | 16,844 | 15,116 | 16,956 |
| Jan 22 | 15,118 | 14,209 | 15,222 |
| Feb 22 | 14,396 | 13,852 | 14,496 |
| Mar 22 | 14,675 | 14,300 | 14,781 |
| Apr 22 | 12,671 | 13,004 | 12,765 |
| May 22 | 12,401 | 12,972 | 12,495 |
| Jun 22 | 11,343 | 11,889 | 11,432 |
| Jul 22 | 12,449 | 13,005 | 12,550 |
| Aug 22 | 11,820 | 12,525 | 11,919 |
| Sep 22 | 10,545 | 11,357 | 10,634 |
| Oct 22 | 11,359 | 12,288 | 11,458 |
| Nov 22 | 11,935 | 12,916 | 12,044 |
| Dec 22 | 11,061 | 12,157 | 11,165 |
| Jan 23 | 12,440 | 12,999 | 12,560 |
| Feb 23 | 12,263 | 12,691 | 12,383 |
| Mar 23 | 13,457 | 13,028 | 13,593 |
| Apr 23 | 13,272 | 13,160 | 13,409 |
| May 23 | 14,518 | 13,216 | 14,672 |
| Jun 23 | 15,349 | 14,120 | 15,516 |
| Jul 23 | 15,970 | 14,627 | 16,147 |
| Aug 23 | 15,730 | 14,340 | 15,909 |
| Sep 23 | 14,831 | 13,655 | 14,985 |
| Oct 23 | 14,436 | 13,294 | 14,595 |
| Nov 23 | 16,440 | 14,539 | 16,629 |
| Dec 23 | 17,411 | 15,314 | 17,605 |
| Jan 24 | 18,208 | 15,479 | 18,400 |
| Feb 24 | 19,227 | 16,306 | 19,405 |
| Mar 24 | 19,442 | 16,832 | 19,659 |
| Apr 24 | 18,262 | 16,097 | 18,468 |
| May 24 | 19,232 | 16,861 | 19,425 |
| Jun 24 | 20,442 | 17,395 | 20,703 |
| Jul 24 | 19,936 | 17,715 | 20,156 |
See “Average annual total returns” for additional information on fund performance.
Average annual total returns
| Average Annual Total Returns | 1 Year | Since Fund Inception |
|---|
Fund NAV........................................................................................................................................................................................................................................................................................................................................................................................................................................................................................................................................................................................................................................................................................................................................................................................................................................................................................................................................................................................................................................ | 24.84% | 16.32% |
Fund Market........................................................................................................................................................................................................................................................................................................................................................................................................................................................................................................................................................................................................................................................................................................................................................................................................................................................................................................................................................................................................................................ | 24.84 | 16.32 |
ICE U.S. 3000 Index........................................................................................................................................................................................................................................................................................................................................................................................................................................................................................................................................................................................................................................................................................................................................................................................................................................................................................................................................................................................................................................ | 21.11 | 13.37 |
NYSE®FactSet® U.S. Tech Breakthrough Index™........................................................................................................................................................................................................................................................................................................................................................................................................................................................................................................................................................................................................................................................................................................................................................................................................................................................................................................................................................................................................................................ | 24.75 | 16.59 |
Net Assets........................................................................................................................................................................................................................................................................................................................................................................................................................................................................................................................................................................................................................................................................................................................................................................................................................................................................................................................................................................................................................................ | $409,722,523 |
Number of Portfolio Holdings........................................................................................................................................................................................................................................................................................................................................................................................................................................................................................................................................................................................................................................................................................................................................................................................................................................................................................................................................................................................................................................ | 170 |
Net Investment Advisory Fees........................................................................................................................................................................................................................................................................................................................................................................................................................................................................................................................................................................................................................................................................................................................................................................................................................................................................................................................................................................................................................................ | $1,073,978 |
Portfolio Turnover Rate........................................................................................................................................................................................................................................................................................................................................................................................................................................................................................................................................................................................................................................................................................................................................................................................................................................................................................................................................................................................................................................ | 15% |
The Fund has added the ICE U.S. 3000 Index in response to new regulatory requirements.
The inception date of the Fund was January 8, 2020. The first day of secondary market trading was January 10, 2020.
Past performance is not an indication of future results. Performance results do not reflect the deduction of taxes that a shareholder would pay on fund distributions or on the redemption or sale of fund shares. Visit iShares.com for more recent performance information.
What did the Fund invest in?
| Sector | Percent of Total InvestmentsFootnote Reference(a) |
|---|
Information Technology........................................................................................................................................................................................................................................................................................................................................................................................................................................................................................................................................................................................................................................................................................................................................................................................................................................................................................................................................................................................................................................ | 56.7% |
Communication Services........................................................................................................................................................................................................................................................................................................................................................................................................................................................................................................................................................................................................................................................................................................................................................................................................................................................................................................................................................................................................................................ | 12.3 |
Health Care........................................................................................................................................................................................................................................................................................................................................................................................................................................................................................................................................................................................................................................................................................................................................................................................................................................................................................................................................................................................................................................ | 12.0 |
Financials........................................................................................................................................................................................................................................................................................................................................................................................................................................................................................................................................................................................................................................................................................................................................................................................................................................................................................................................................................................................................................................ | 8.3 |
Consumer Discretionary........................................................................................................................................................................................................................................................................................................................................................................................................................................................................................................................................................................................................................................................................................................................................................................................................................................................................................................................................................................................................................................ | 6.3 |
Real Estate........................................................................................................................................................................................................................................................................................................................................................................................................................................................................................................................................................................................................................................................................................................................................................................................................................................................................................................................................................................................................................................ | 2.5 |
Industrials........................................................................................................................................................................................................................................................................................................................................................................................................................................................................................................................................................................................................................................................................................................................................................................................................................................................................................................................................................................................................................................ | 1.9 |
Materials........................................................................................................................................................................................................................................................................................................................................................................................................................................................................................................................................................................................................................................................................................................................................................................................................................................................................................................................................................................................................................................ | 0.0Footnote Reference(b) |
| Security | Percent of Total InvestmentsFootnote Reference(a) |
|---|
Apple, Inc......................................................................................................................................................................................................................................................................................................................................................................................................................................................................................................................................................................................................................................................................................................................................................................................................................................................................................................................................................................................................................................... | 4.5% |
Amazon.com, Inc......................................................................................................................................................................................................................................................................................................................................................................................................................................................................................................................................................................................................................................................................................................................................................................................................................................................................................................................................................................................................................................... | 4.0 |
Salesforce, Inc......................................................................................................................................................................................................................................................................................................................................................................................................................................................................................................................................................................................................................................................................................................................................................................................................................................................................................................................................................................................................................................... | 4.0 |
Microsoft Corp......................................................................................................................................................................................................................................................................................................................................................................................................................................................................................................................................................................................................................................................................................................................................................................................................................................................................................................................................................................................................................................... | 3.9 |
Alphabet, Inc., Class A........................................................................................................................................................................................................................................................................................................................................................................................................................................................................................................................................................................................................................................................................................................................................................................................................................................................................................................................................................................................................................................ | 3.9 |
Netflix, Inc......................................................................................................................................................................................................................................................................................................................................................................................................................................................................................................................................................................................................................................................................................................................................................................................................................................................................................................................................................................................................................................... | 3.9 |
NVIDIA Corp......................................................................................................................................................................................................................................................................................................................................................................................................................................................................................................................................................................................................................................................................................................................................................................................................................................................................................................................................................................................................................................... | 3.8 |
Meta Platforms, Inc., Class A........................................................................................................................................................................................................................................................................................................................................................................................................................................................................................................................................................................................................................................................................................................................................................................................................................................................................................................................................................................................................................................ | 3.8 |
Oracle Corp......................................................................................................................................................................................................................................................................................................................................................................................................................................................................................................................................................................................................................................................................................................................................................................................................................................................................................................................................................................................................................................... | 3.6 |
Adobe, Inc......................................................................................................................................................................................................................................................................................................................................................................................................................................................................................................................................................................................................................................................................................................................................................................................................................................................................................................................................................................................................................................... | 3.6 |
| Footnote | Description |
Footnote(a) | Excludes money market funds. |
Footnote(b) | Rounds to less than 0.1%. |
This is a summary of certain changes to the Fund since July 31, 2023. For more complete information, you may review the Fund's next prospectus, which we expect to be available approximately 120 days after July 31, 2024 at blackrock.com/fundreports or upon request by contacting us at 1-800-iShares (1-800-474-2737).
Effective June 28, 2024, for its investment advisory services to the Fund, BlackRock Fund Advisors (“BFA”) is entitled to an annual investment advisory fee of 0.30%. Prior to June 28, 2024, BFA was entitled to an annual investment advisory fee of 0.40%.
If you wish to view additional information about the Fund, including but not limited to financial statements, the Fund’s prospectus, and proxy voting policies and procedures, please visit blackrock.com/fundreports. For proxy voting records, visit blackrock.com/proxyrecords.
Householding is an option available to certain fund investors. Householding is a method of delivery, based on the preference of the individual investor, in which a single copy of certain shareholder documents can be delivered to investors who share the same address, even if their accounts are registered under different names. Please contact your broker-dealer if you are interested in enrolling in householding and receiving a single copy of prospectuses and other shareholder documents, or if you are currently enrolled in householding and wish to change your householding status.
The Fund is not sponsored, endorsed, issued, sold or promoted by ICE Data Indices, LLC and its affiliates, nor does this company make any representation regarding the advisability of investing in the Fund. BlackRock is not affiliated with the company listed above.
© 2024 BlackRock, Inc or its affiliates. All Rights Reserved. iSHARES and BLACKROCK are registered trademarks of BlackRock, Inc. or its affiliates. All other trademarks are those of their respective owners.
iShares U.S. Tech Breakthrough Multisector ETF
Annual Shareholder Report — July 31, 2024
(b) Not Applicable
Item 2 – Code of Ethics – The registrant has adopted a code of ethics, as of the end of the period covered by this report, applicable to the registrant’s principal executive officer, principal financial officer, principal accounting officer or controller, or persons performing similar functions. During the period covered by this report, the registrant has not amended the code of ethics and there have been no waivers granted under the code of ethics. The registrant undertakes to provide a copy of the code of ethics to any person upon request, without charge, by calling 1-800-474-2737.
Item 3 – Audit Committee Financial Expert – The registrant’s board of trustees (the “board of trustees”), has determined that (i) the registrant has the following audit committee financial experts serving on its audit committee and (ii) each audit committee financial expert is independent:
Richard L. Fagnani
Madhav V. Rajan
Under applicable securities laws, a person determined to be an audit committee financial expert will not be deemed an “expert” for any purpose, including without limitation for the purposes of Section 11 of the Securities Act of 1933, as a result of being designated or identified as an audit committee financial expert. The designation or identification of a person as an audit committee financial expert does not impose on such person any duties, obligations, or liabilities greater than the duties, obligations, and liabilities imposed on such person as a member of the audit committee and board of trustees in the absence of such designation or identification. The designation or identification of a person as an audit committee financial expert does not affect the duties, obligations, or liability of any other member of the audit committee or board of trustees.
Item 4 – Principal Accountant Fees and Services
The principal accountant fees disclosed in items 4(a), 4(b), 4(c), 4(d) and 4(g) are for the eight series of the registrant for which the fiscal year-end is July 31, 2024 (the “Funds”), and whose annual financial statements are reported in Item 1.
(a) Audit Fees – The aggregate fees billed for each of the last two fiscal years for professional services rendered by the principal accountant for the audit of the Funds’ annual financial statements or services that are normally provided by the accountant in connection with statutory and regulatory filings or engagements for those fiscal years were $88,100 for the fiscal year ended July 31, 2023 and $88,100 for the fiscal year ended July 31, 2024.
(b) Audit-Related Fees – There were no fees billed for the fiscal years ended July 31, 2023 and July 31, 2024 for assurance and related services by the principal accountant that were reasonably related to the performance of the audit of the Funds’ financial statements and are not reported under (a) of this Item.
(c) Tax Fees – The aggregate fees billed in each of the last two fiscal years for professional services rendered by the principal accountant for tax compliance, tax advice and tax planning for the Funds were $77,600 for the fiscal year ended July 31, 2023 and $77,600 for the fiscal year ended July 31, 2024. These services related to the review of the Funds’ tax returns and excise tax calculations.
(d) All Other Fees – There were no other fees billed in each of the fiscal years ended July 31, 2023 and July 31, 2024 for products and services provided by the principal accountant, other than the services reported in (a) through (c) of this Item.
(e)(1) Audit Committee Pre-Approval Policies and Procedures:
The registrant’s audit committee charter, as amended, provides that the audit committee is responsible for the approval, prior to appointment, of the engagement of the principal accountant to annually audit and provide their opinion on the registrant’s financial statements. The audit committee must also approve, prior to appointment, the engagement of the principal accountant to provide non-audit services to the registrant or to any entity controlling, controlled by or under common control with the registrant’s investment adviser (“Adviser Affiliate”) that provides ongoing services to the registrant, if the engagement relates directly to the operations and financial reporting of the registrant.
(e)(2) None of the services described in each of Items 4(b) through (d) were approved by the audit committee pursuant to paragraph (c)(7)(i)(C) of Rule 2-01 of Regulation S-X.
(f) Not Applicable
(g) The aggregate non-audit fees billed by the registrant’s principal accountant for services rendered to the Funds, and rendered to the registrant’s investment adviser, and any Adviser Affiliate that provides ongoing services to the registrant for the last two fiscal years were $77,600 for the fiscal year ended July 31, 2023 and $77,600 for the fiscal year ended July 31, 2024.
(h) The registrant’s audit committee has considered whether the provision of non-audit services rendered to the registrant’s investment adviser and any Adviser Affiliate that provides ongoing services to the registrant that were not pre-approved pursuant to paragraph (c)(7)(ii) of Rule 2-01 of Regulation S-X, if any, is compatible with maintaining the principal accountant’s independence, and has determined that the provision of these services, if any, does not compromise the principal accountant’s independence.
(i) – Not Applicable
(j) – Not Applicable
Item 5 – Audit Committee of Listed Registrant
(a) The following individuals are members of the registrant’s separately designated standing Committee established in accordance with Section 3(a)(58)(A) of the Securities Exchange Act of 1934 (15 U.S.C. 78c(a)(58)(A)):
Richard L. Fagnani
Laura F. Fergerson
Cecilia H. Herbert
Madhav V. Rajan
(b) Not Applicable
Item 6 – Investments
(a) The registrant’s Schedule of Investments is included as part of the Financial Statement and Financial Highlights for Open-End Management Investment Companies filed under Item 7 of this Form.
(b) Not Applicable due to no such divestments during the semi-annual period covered since the previous Form N-CSR filing.
Item 7 – Financial Statements and Financial Highlights for Open-End Management Investment Companies –
(a) The registrant’s Financial Statements are attached herewith.
(b) The registrant’s Financial Highlights are attached herewith.
2024
Annual
Financial
Statements
iShares
Trust
iShares
ESG
Aware
Aggressive
Allocation
ETF
|
EAOA
|
Cboe
BZX
iShares
ESG
Aware
Conservative
Allocation
ETF
|
EAOK
|
Cboe
BZX
iShares
ESG
Aware
Growth
Allocation
ETF
|
EAOR
|
Cboe
BZX
iShares
ESG
Aware
Moderate
Allocation
ETF
|
EAOM
|
Cboe
BZX
Schedules
of
Investments
.................................................................................................
3
Statements
of
Assets
and
Liabilities
...........................................................................................
11
Statements
of
Operations
.................................................................................................
12
Statements
of
Changes
in
Net
Assets
..........................................................................................
13
Financial
Highlights
.....................................................................................................
15
Notes
to
Financial
Statements
...............................................................................................
19
Report
of
Independent
Registered
Public
Accounting
Firm
..............................................................................
25
Important
Tax
Information
(Unaudited)
.................................................................................................
26
Additional
Information
....................................................................................................
27
Board
Review
and
Approval
of
Investment
Advisory
Contract
............................................................................
28
Glossary
of
Terms
Used
in
this
Report
..........................................................................................
30
Schedule
of
Investments
July
31,
2024
iShares
®
ESG
Aware
Aggressive
Allocation
ETF
(Percentages
shown
are
based
on
Net
Assets)
Affiliates
Investments
in
issuers
considered
to
be
affiliate(s)
of
the
Fund
during
the year
ended
July
31,
2024
for
purposes
of
Section
2(a)(3)
of
the
Investment
Company
Act
of
1940,
as
amended,
were
as
follows:
Security
Shares
Value
Investment
Companies
Domestic
Equity
—
55.2%
(a)
iShares
ESG
Aware
MSCI
USA
ETF
.......
116,584
$
14,113,659
iShares
ESG
Aware
MSCI
USA
Small-Cap
ETF
(b)
..........................
33,734
1,400,973
15,514,632
Domestic
Fixed
Income
—
19.3%
iShares
ESG
Aware
U.S.
Aggregate
Bond
ETF
(a)
..........................
114,528
5,446,952
International
Equity
—
25.4%
(a)
iShares
ESG
Aware
MSCI
EAFE
ETF
......
61,264
4,941,555
iShares
ESG
Aware
MSCI
EM
ETF
........
64,515
2,185,768
7,127,323
Total
Long-Term
Investments
—
99
.9
%
(Cost:
$
25,299,850
)
...............................
28,088,907
Security
Shares
Value
Short-Term
Securities
Money
Market
Funds
—
1
.0
%
(a)
(c)
BlackRock
Cash
Funds:
Institutional,
SL
Agency
Shares
,
5.45
%
(d)
...................
249,175
$
249,275
BlackRock
Cash
Funds:
Treasury,
SL
Agency
Shares
,
5.29
%
....................
28,098
28,098
Total
Short-Term
Securities
—
1
.0
%
(Cost:
$
277,373
)
.................................
277,373
Total
Investments
—
100
.9
%
(Cost:
$
25,577,223
)
...............................
28,366,280
Liabilities
in
Excess
of
Other
Assets
—
(
0.9
)
%
.............
(
249,642
)
Net
Assets
—
100.0%
...............................
$
28,116,639
(a)
Affiliate
of
the
Fund.
(b)
All
or
a
portion
of
this
security
is
on
loan.
(c)
Annualized
7-day
yield
as
of
period
end.
(d)
All
or
a
portion
of
this
security
was
purchased
with
the
cash
collateral
from
loaned
securities.
Affiliated
Issuer
Value
at
07/31/23
Purchases
at
Cost
Proceeds
from
Sales
Net
Realized
Gain
(Loss)
Change
in
Unrealized
Appreciation
(Depreciation)
Value
at
07/31/24
Shares
Held
at
07/31/24
Income
Capital
Gain
Distributions
from
Underlying
Funds
BlackRock
Cash
Funds:
Institutional,
SL
Agency
Shares
..............
$
—
$
250,571
(a)
$
—
$
(
1,296
)
$
—
$
249,275
249,175
$
3,532
(b)
$
—
BlackRock
Cash
Funds:
Treasury,
SL
Agency
Shares
37,051
—
(
8,953
)
(a)
—
—
28,098
28,098
2,261
—
iShares
ESG
Aware
MSCI
EAFE
ETF
...........
4,794,882
363,721
(
585,289
)
38,630
329,611
4,941,555
61,264
150,155
—
iShares
ESG
Aware
MSCI
EM
ETF
................
2,124,818
204,063
(
166,336
)
10,990
12,233
2,185,768
64,515
55,684
—
iShares
ESG
Aware
MSCI
USA
ETF
................
12,226,753
990,919
(
1,537,898
)
251,484
2,182,401
14,113,659
116,584
171,652
—
iShares
ESG
Aware
MSCI
USA
Small-Cap
ETF
........
1,305,484
97,228
(
140,879
)
21,459
117,681
1,400,973
33,734
16,239
—
iShares
ESG
Aware
U.S.
Aggregate
Bond
ETF
....
4,647,269
1,095,223
(
383,544
)
11,198
76,806
5,446,952
114,528
185,757
—
$
332,465
$
2,718,732
$
28,366,280
$
585,280
$
—
—
—
(a)
Represents
net
amount
purchased
(sold).
(b)
All
or
a
portion
represents
securities
lending
income
earned
from
the
reinvestment
of
cash
collateral
from
loaned
securities,
net
of
fees
and
collateral
investment
expenses,
and
other
payments
to
and
from
borrowers
of
securities.
2024
iShares
Annual
Financial
Statements
Schedule
of
Investments
(continued)
July
31,
2024
iShares
®
ESG
Aware
Aggressive
Allocation
ETF
Fair
Value
Hierarchy
as
of Period
End
Various
inputs
are
used
in
determining
the
fair
value
of
financial
instruments.
For
a
description
of
the
input
levels
and
information
about
the
Fund’s
policy
regarding
valuation
of
financial
instruments,
refer
to
the
Notes
to
Financial
Statements.
The
following
table
summarizes
the
Fund’s
financial
instruments
categorized
in
the
fair
value
hierarchy.
The
breakdown
of
the
Fund's
financial
instruments
into
major
categories
is
disclosed
in
the
Schedule
of
Investments
above.
See
notes
to
financial
statements.
Level
1
Level
2
Level
3
Total
Assets
Investments
Long-Term
Investments
Investment
Companies
.....................................
$
28,088,907
$
—
$
—
$
28,088,907
Short-Term
Securities
Money
Market
Funds
......................................
277,373
—
—
277,373
$
28,366,280
$
—
$
—
$
28,366,280
Schedule
of
Investments
July
31,
2024
iShares
®
ESG
Aware
Conservative
Allocation
ETF
(Percentages
shown
are
based
on
Net
Assets)
Affiliates
Investments
in
issuers
considered
to
be
affiliate(s)
of
the
Fund
during
the year
ended
July
31,
2024
for
purposes
of
Section
2(a)(3)
of
the
Investment
Company
Act
of
1940,
as
amended,
were
as
follows:
Security
Shares
Value
Investment
Companies
Domestic
Equity
—
21.1%
(a)
iShares
ESG
Aware
MSCI
USA
ETF
.......
13,254
$
1,604,529
iShares
ESG
Aware
MSCI
USA
Small-Cap
ETF
3,835
159,267
1,763,796
Domestic
Fixed
Income
—
69.1%
iShares
ESG
Aware
U.S.
Aggregate
Bond
ETF
(a)
..........................
121,518
5,779,396
International
Equity
—
9.7%
(a)
iShares
ESG
Aware
MSCI
EAFE
ETF
......
6,965
561,797
iShares
ESG
Aware
MSCI
EM
ETF
........
7,334
248,476
810,273
Total
Long-Term
Investments
—
99
.9
%
(Cost:
$
9,024,048
)
................................
8,353,465
Security
Shares
Value
Short-Term
Securities
Money
Market
Funds
—
0
.1
%
BlackRock
Cash
Funds:
Treasury,
SL
Agency
Shares
,
5.29
%
(a)
(b)
..................
6,460
$
6,460
Total
Short-Term
Securities
—
0
.1
%
(Cost:
$
6,460
)
...................................
6,460
Total
Investments
—
100
.0
%
(Cost:
$
9,030,508
)
................................
8,359,925
Other
Assets
Less
Liabilities
—
0.0
%
....................
218
Net
Assets
—
100.0%
...............................
$
8,360,143
(a)
Affiliate
of
the
Fund.
(b)
Annualized
7-day
yield
as
of
period
end.
Affiliated
Issuer
Value
at
07/31/23
Purchases
at
Cost
Proceeds
from
Sales
Net
Realized
Gain
(Loss)
Change
in
Unrealized
Appreciation
(Depreciation)
Value
at
07/31/24
Shares
Held
at
07/31/24
Income
Capital
Gain
Distributions
from
Underlying
Funds
BlackRock
Cash
Funds:
Institutional,
SL
Agency
Shares
(a)
............
$
—
$
113
(b)
$
—
$
(
113
)
$
—
$
—
—
$
573
(c)
$
—
BlackRock
Cash
Funds:
Treasury,
SL
Agency
Shares
20,602
—
(
14,142
)
(b)
—
—
6,460
6,460
696
—
iShares
ESG
Aware
MSCI
EAFE
ETF
...........
549,860
44,659
(
70,206
)
(
6,035
)
43,519
561,797
6,965
16,653
—
iShares
ESG
Aware
MSCI
EM
ETF
................
243,678
19,589
(
15,404
)
(
5,139
)
5,752
248,476
7,334
6,206
—
iShares
ESG
Aware
MSCI
USA
ETF
................
1,402,155
121,576
(
179,458
)
(
48
)
260,304
1,604,529
13,254
19,128
—
iShares
ESG
Aware
MSCI
USA
Small-Cap
ETF
........
149,704
11,816
(
16,770
)
(
2,603
)
17,120
159,267
3,835
1,812
—
iShares
ESG
Aware
U.S.
Aggregate
Bond
ETF
....
4,974,128
736,843
(
13,079
)
(
800
)
82,304
5,779,396
121,518
191,606
—
$
(
14,738
)
$
408,999
$
8,359,925
$
236,674
$
—
—
—
(a)
As
of
period
end,
the
entity
is
no
longer
held.
(b)
Represents
net
amount
purchased
(sold).
(c)
All
or
a
portion
represents
securities
lending
income
earned
from
the
reinvestment
of
cash
collateral
from
loaned
securities,
net
of
fees
and
collateral
investment
expenses,
and
other
payments
to
and
from
borrowers
of
securities.
2024
iShares
Annual
Financial
Statements
Schedule
of
Investments
(continued)
July
31,
2024
iShares
®
ESG
Aware
Conservative
Allocation
ETF
Fair
Value
Hierarchy
as
of Period
End
Various
inputs
are
used
in
determining
the
fair
value
of
financial
instruments.
For
a
description
of
the
input
levels
and
information
about
the
Fund’s
policy
regarding
valuation
of
financial
instruments,
refer
to
the
Notes
to
Financial
Statements.
The
following
table
summarizes
the
Fund’s
financial
instruments
categorized
in
the
fair
value
hierarchy.
The
breakdown
of
the
Fund's
financial
instruments
into
major
categories
is
disclosed
in
the
Schedule
of
Investments
above.
See
notes
to
financial
statements.
Level
1
Level
2
Level
3
Total
Assets
Investments
Long-Term
Investments
Investment
Companies
.....................................
$
8,353,465
$
—
$
—
$
8,353,465
Short-Term
Securities
Money
Market
Funds
......................................
6,460
—
—
6,460
$
8,359,925
$
—
$
—
$
8,359,925
Schedule
of
Investments
July
31,
2024
iShares
®
ESG
Aware
Growth
Allocation
ETF
(Percentages
shown
are
based
on
Net
Assets)
Affiliates
Investments
in
issuers
considered
to
be
affiliate(s)
of
the
Fund
during
the year
ended
July
31,
2024
for
purposes
of
Section
2(a)(3)
of
the
Investment
Company
Act
of
1940,
as
amended,
were
as
follows:
Security
Shares
Value
Investment
Companies
Domestic
Equity
—
41.7%
(a)
iShares
ESG
Aware
MSCI
USA
ETF
.......
63,409
$
7,676,294
iShares
ESG
Aware
MSCI
USA
Small-Cap
ETF
18,348
761,992
8,438,286
Domestic
Fixed
Income
—
39.0%
iShares
ESG
Aware
U.S.
Aggregate
Bond
ETF
(a)
..........................
166,109
7,900,144
International
Equity
—
19.2%
(a)
iShares
ESG
Aware
MSCI
EAFE
ETF
......
33,321
2,687,672
iShares
ESG
Aware
MSCI
EM
ETF
........
35,090
1,188,849
3,876,521
Total
Long-Term
Investments
—
99
.9
%
(Cost:
$
18,804,421
)
...............................
20,214,951
Security
Shares
Value
Short-Term
Securities
Money
Market
Funds
—
0
.1
%
BlackRock
Cash
Funds:
Treasury,
SL
Agency
Shares
,
5.29
%
(a)
(b)
..................
19,731
$
19,731
Total
Short-Term
Securities
—
0
.1
%
(Cost:
$
19,731
)
..................................
19,731
Total
Investments
—
100
.0
%
(Cost:
$
18,824,152
)
...............................
20,234,682
Liabilities
in
Excess
of
Other
Assets
—
(
0.0
)
%
.............
(
502
)
Net
Assets
—
100.0%
...............................
$
20,234,180
(a)
Affiliate
of
the
Fund.
(b)
Annualized
7-day
yield
as
of
period
end.
Affiliated
Issuer
Value
at
07/31/23
Purchases
at
Cost
Proceeds
from
Sales
Net
Realized
Gain
(Loss)
Change
in
Unrealized
Appreciation
(Depreciation)
Value
at
07/31/24
Shares
Held
at
07/31/24
Income
Capital
Gain
Distributions
from
Underlying
Funds
BlackRock
Cash
Funds:
Institutional,
SL
Agency
Shares
(a)
............
$
—
$
518
(b)
$
—
$
(
518
)
$
—
$
—
—
$
2,744
(c)
$
—
BlackRock
Cash
Funds:
Treasury,
SL
Agency
Shares
33,818
—
(
14,087
)
(b)
—
—
19,731
19,731
1,661
—
iShares
ESG
Aware
MSCI
EAFE
ETF
...........
2,492,499
748,077
(
741,490
)
66,312
122,274
2,687,672
33,321
79,269
—
iShares
ESG
Aware
MSCI
EM
ETF
................
1,104,518
320,504
(
248,402
)
(
704
)
12,933
1,188,849
35,090
30,290
—
iShares
ESG
Aware
MSCI
USA
ETF
................
6,355,794
2,018,963
(
1,939,271
)
236,362
1,004,446
7,676,294
63,409
90,538
—
iShares
ESG
Aware
MSCI
USA
Small-Cap
ETF
........
678,639
200,315
(
188,604
)
6,997
64,645
761,992
18,348
8,603
—
iShares
ESG
Aware
U.S.
Aggregate
Bond
ETF
....
6,442,028
2,835,681
(
1,505,471
)
30,172
97,734
7,900,144
166,109
255,678
—
$
338,621
$
1,302,032
$
20,234,682
$
468,783
$
—
—
—
(a)
As
of
period
end,
the
entity
is
no
longer
held.
(b)
Represents
net
amount
purchased
(sold).
(c)
All
or
a
portion
represents
securities
lending
income
earned
from
the
reinvestment
of
cash
collateral
from
loaned
securities,
net
of
fees
and
collateral
investment
expenses,
and
other
payments
to
and
from
borrowers
of
securities.
2024
iShares
Annual
Financial
Statements
Schedule
of
Investments
(continued)
July
31,
2024
iShares
®
ESG
Aware
Growth
Allocation
ETF
Fair
Value
Hierarchy
as
of Period
End
Various
inputs
are
used
in
determining
the
fair
value
of
financial
instruments.
For
a
description
of
the
input
levels
and
information
about
the
Fund’s
policy
regarding
valuation
of
financial
instruments,
refer
to
the
Notes
to
Financial
Statements.
The
following
table
summarizes
the
Fund’s
financial
instruments
categorized
in
the
fair
value
hierarchy.
The
breakdown
of
the
Fund's
financial
instruments
into
major
categories
is
disclosed
in
the
Schedule
of
Investments
above.
See
notes
to
financial
statements.
Level
1
Level
2
Level
3
Total
Assets
Investments
Long-Term
Investments
Investment
Companies
.....................................
$
20,214,951
$
—
$
—
$
20,214,951
Short-Term
Securities
Money
Market
Funds
......................................
19,731
—
—
19,731
$
20,234,682
$
—
$
—
$
20,234,682
Schedule
of
Investments
July
31,
2024
iShares
®
ESG
Aware
Moderate
Allocation
ETF
(Percentages
shown
are
based
on
Net
Assets)
Affiliates
Investments
in
issuers
considered
to
be
affiliate(s)
of
the
Fund
during
the year
ended
July
31,
2024
for
purposes
of
Section
2(a)(3)
of
the
Investment
Company
Act
of
1940,
as
amended,
were
as
follows:
Security
Shares
Value
Investment
Companies
Domestic
Equity
—
28.0%
(a)
iShares
ESG
Aware
MSCI
USA
ETF
.......
13,028
$
1,577,171
iShares
ESG
Aware
MSCI
USA
Small-Cap
ETF
(b)
..........................
3,770
156,568
1,733,739
Domestic
Fixed
Income
—
59.0%
iShares
ESG
Aware
U.S.
Aggregate
Bond
ETF
(a)
..........................
76,790
3,652,132
International
Equity
—
12.9%
(a)
iShares
ESG
Aware
MSCI
EAFE
ETF
......
6,846
552,198
iShares
ESG
Aware
MSCI
EM
ETF
........
7,209
244,241
796,439
Total
Long-Term
Investments
—
99
.9
%
(Cost:
$
6,415,250
)
................................
6,182,310
Security
Shares
Value
Short-Term
Securities
Money
Market
Funds
—
2
.6
%
(a)
(c)
BlackRock
Cash
Funds:
Institutional,
SL
Agency
Shares
,
5.45
%
(d)
...................
156,262
$
156,325
BlackRock
Cash
Funds:
Treasury,
SL
Agency
Shares
,
5.29
%
....................
5,860
5,860
Total
Short-Term
Securities
—
2
.6
%
(Cost:
$
162,185
)
.................................
162,185
Total
Investments
—
102
.5
%
(Cost:
$
6,577,435
)
................................
6,344,495
Liabilities
in
Excess
of
Other
Assets
—
(
2.5
)
%
.............
(
156,408
)
Net
Assets
—
100.0%
...............................
$
6,188,087
(a)
Affiliate
of
the
Fund.
(b)
All
or
a
portion
of
this
security
is
on
loan.
(c)
Annualized
7-day
yield
as
of
period
end.
(d)
All
or
a
portion
of
this
security
was
purchased
with
the
cash
collateral
from
loaned
securities.
Affiliated
Issuer
Value
at
07/31/23
Purchases
at
Cost
Proceeds
from
Sales
Net
Realized
Gain
(Loss)
Change
in
Unrealized
Appreciation
(Depreciation)
Value
at
07/31/24
Shares
Held
at
07/31/24
Income
Capital
Gain
Distributions
from
Underlying
Funds
BlackRock
Cash
Funds:
Institutional,
SL
Agency
Shares
..............
$
—
$
156,304
(a)
$
—
$
21
$
—
$
156,325
156,262
$
388
(b)
$
—
BlackRock
Cash
Funds:
Treasury,
SL
Agency
Shares
12,797
—
(
6,937
)
(a)
—
—
5,860
5,860
565
—
iShares
ESG
Aware
MSCI
EAFE
ETF
...........
511,284
73,158
(
70,174
)
(
5,473
)
43,403
552,198
6,846
16,099
—
iShares
ESG
Aware
MSCI
EM
ETF
................
226,565
30,438
(
14,890
)
(
5,655
)
7,783
244,241
7,209
5,901
—
iShares
ESG
Aware
MSCI
USA
ETF
................
1,303,716
200,199
(
180,476
)
(
6,266
)
259,998
1,577,171
13,028
18,687
—
iShares
ESG
Aware
MSCI
USA
Small-Cap
ETF
........
139,203
19,441
(
16,549
)
(
2,334
)
16,807
156,568
3,770
1,760
—
iShares
ESG
Aware
U.S.
Aggregate
Bond
ETF
....
2,973,048
683,164
(
56,660
)
(
2,993
)
55,573
3,652,132
76,790
120,155
—
$
(
22,700
)
$
383,564
$
6,344,495
$
163,555
$
—
—
—
(a)
Represents
net
amount
purchased
(sold).
(b)
All
or
a
portion
represents
securities
lending
income
earned
from
the
reinvestment
of
cash
collateral
from
loaned
securities,
net
of
fees
and
collateral
investment
expenses,
and
other
payments
to
and
from
borrowers
of
securities.
2024
iShares
Annual
Financial
Statements
Schedule
of
Investments
(continued)
July
31,
2024
iShares
®
ESG
Aware
Moderate
Allocation
ETF
Fair
Value
Hierarchy
as
of Period
End
Various
inputs
are
used
in
determining
the
fair
value
of
financial
instruments.
For
a
description
of
the
input
levels
and
information
about
the
Fund’s
policy
regarding
valuation
of
financial
instruments,
refer
to
the
Notes
to
Financial
Statements.
The
following
table
summarizes
the
Fund’s
financial
instruments
categorized
in
the
fair
value
hierarchy.
The
breakdown
of
the
Fund's
financial
instruments
into
major
categories
is
disclosed
in
the
Schedule
of
Investments
above.
See
notes
to
financial
statements.
Level
1
Level
2
Level
3
Total
Assets
Investments
Long-Term
Investments
Investment
Companies
.....................................
$
6,182,310
$
—
$
—
$
6,182,310
Short-Term
Securities
Money
Market
Funds
......................................
162,185
—
—
162,185
$
6,344,495
$
—
$
—
$
6,344,495
Statements
of
Assets
and
Liabilities
July
31,
2024
Statements
of
Assets
and
Liabilities
See
notes
to
financial
statements.
iShares
ESG
Aware
Aggressive
Allocation
ETF
iShares
ESG
Aware
Conservative
Allocation
ETF
iShares
ESG
Aware
Growth
Allocation
ETF
iShares
ESG
Aware
Moderate
Allocation
ETF
ASSETS
Investments,
at
value
—
affiliated
(a)
(b)
...........................................
$
28,366,280
$
8,359,925
$
20,234,682
$
6,344,495
Receivables:
–
–
–
–
Securities
lending
income
—
affiliated
........................................
474
114
273
11
Dividends
—
affiliated
...................................................
266
54
184
58
Other
assets
...........................................................
—
450
—
—
Total
a
ssets
...........................................................
28,367,020
8,360,543
20,235,139
6,344,564
LIABILITIES
Collateral
on
securities
loaned
...............................................
249,877
—
—
156,219
Payables:
–
–
–
–
Investment
advisory
fees
.................................................
504
400
583
258
Other
liabilities
.........................................................
—
—
376
—
Total
li
abilities
..........................................................
250,381
400
959
156,477
Commitments
and
contingent
liabilities
—
—
—
—
NET
ASSETS
..........................................................
$
28,116,639
$
8,360,143
$
20,234,180
$
6,188,087
NET
ASSETS
CONSIST
OF:
Paid-in
capital
..........................................................
$
25,551,115
$
9,141,496
$
18,974,801
$
6,508,948
Accumulated
earnings
(loss)
................................................
2,565,524
(
781,353
)
1,259,379
(
320,861
)
NET
ASSETS
..........................................................
$
28,116,639
$
8,360,143
$
20,234,180
$
6,188,087
NET
ASSET
VALUE
Shares
outstanding
......................................................
800,000
325,000
650,000
225,000
Net
asset
value
.........................................................
$
35.15
$
25.72
$
31.13
$
27.50
Shares
authorized
.......................................................
Unlimited
Unlimited
Unlimited
Unlimited
Par
value
.............................................................
None
None
None
None
(a)
Investments,
at
cost
—
affiliated
.........................................
$
25,577,223
$
9,030,508
$
18,824,152
$
6,577,435
(b)
Securities
loaned,
at
value
—
affiliated
.....................................
$
245,027
$
—
$
—
$
153,661
Statements
of
Operations
Year
Ended
July
31,
2024
2024
iShares
Annual
Financial
Statements
See
notes
to
financial
statements.
iShares
ESG
Aware
Aggressive
Allocation
ETF
iShares
ESG
Aware
Conservative
Allocation
ETF
iShares
ESG
Aware
Growth
Allocation
ETF
iShares
ESG
Aware
Moderate
Allocation
ETF
INVESTMENT
INCOME
–
–
–
–
Dividends
—
affiliated
...................................................
$
581,748
$
236,101
$
466,039
$
163,167
Securities
lending
income
—
affiliated
—
net
...................................
3,532
573
2,744
388
Total
investment
income
...................................................
585,280
236,674
468,783
163,555
EXPENSES
Investment
advisory
....................................................
46,921
13,430
32,080
9,881
Total
e
xpenses
.........................................................
46,921
13,430
32,080
9,881
Less:
–
–
–
–
Investment
advisory
fees
waived
...........................................
(
41,282
)
(
9,141
)
(
25,719
)
(
7,129
)
Total
ex
penses
after
fees
waived
.............................................
5,639
4,289
6,361
2,752
Net
investment
income
....................................................
579,641
232,385
462,422
160,803
REALIZED
AND
UNREALIZED
GAIN
(LOSS)
$
3,051,196
$
394,261
$
1,640,653
$
360,864
Net
realized
gain
(loss)
from:
Investments
—
affiliated
...............................................
$
(
43,461
)
$
(
14,738
)
$
(
39,499
)
$
(
22,700
)
In-kind
redemptions
—
affiliated
(a)
.........................................
375,926
—
378,120
—
332,465
(14,738)
338,621
(22,700)
Net
change
in
unrealized
appreciation
(depreciation)
on:
Investments
—
affiliated
...............................................
2,718,732
408,999
1,302,032
383,564
Net
realized
and
unrealized
gain
.............................................
3,051,197
394,261
1,640,653
360,864
NET
INCREASE
IN
NET
ASSETS
RESULTING
FROM
OPERATIONS
....................
$
3,630,838
$
626,646
$
2,103,075
$
521,667
(a)
See
Note
2
of
the
Notes
to
Financial
Statements.
Statements
of
Changes
in
Net
Assets
Statements
of
Changes
in
Net
Assets
See
notes
to
financial
statements.
iShares
ESG
Aware
Aggressive
Allocation
ETF
iShares
ESG
Aware
Conservative
Allocation
ETF
Year
Ended
07/31/24
Year
Ended
07/31/23
Year
Ended
07/31/24
Year
Ended
07/31/23
INCREASE
(DECREASE)
IN
NET
ASSETS
OPERATIONS
Net
investment
income
............................................
$
579,641
$
442,939
$
232,385
$
183,603
Net
realized
gain
(loss)
............................................
332,465
(
146,122
)
(
14,738
)
(
259,487
)
Net
change
in
unrealized
appreciation
(depreciation)
........................
2,718,732
1,625,892
408,999
62,711
Net
increase
(decrease)
in
net
assets
resulting
from
operations
...................
3,630,838
1,922,709
626,646
(13,173)
DISTRIBUTIONS
TO
SHAREHOLDERS
(a)
Decrease
in
net
assets
resulting
from
distributions
to
shareholders
.................
(579,193)
(442,363)
(231,882)
(183,635)
CAPITAL
SHARE
TRANSACTIONS
Net
increase
(decrease)
in
net
assets
derived
from
capital
share
transactions
.........
(71,650)
3,017,083
624,862
(1,159,461)
NET
ASSETS
Total
increase
(decrease)
in
net
assets
...................................
2,979,995
4,497,429
1,019,626
(
1,356,269
)
Beginning
of
year
..................................................
25,136,644
20,639,215
7,340,517
8,696,786
End
of
year
......................................................
$
28,116,639
$
25,136,644
$
8,360,143
$
7,340,517
(a)
Distributions
for
annual
periods
determined
in
accordance
with
U.S.
federal
income
tax
regulations.
Statements
of
Changes
in
Net
Assets
(continued)
2024
iShares
Annual
Financial
Statements
See
notes
to
financial
statements.
iShares
ESG
Aware
Growth
Allocation
ETF
iShares
ESG
Aware
Moderate
Allocation
ETF
Year
Ended
07/31/24
Year
Ended
07/31/23
Year
Ended
07/31/24
Year
Ended
07/31/23
INCREASE
(DECREASE)
IN
NET
ASSETS
OPERATIONS
Net
investment
income
............................................
$
462,422
$
361,179
$
160,803
$
125,839
Net
realized
gain
(loss)
............................................
338,621
209,098
(
22,700
)
(
41,207
)
Net
change
in
unrealized
appreciation
(depreciation)
........................
1,302,032
452,189
383,564
32,098
Net
increase
in
net
assets
resulting
from
operations
...........................
2,103,075
1,022,466
521,667
116,730
DISTRIBUTIONS
TO
SHAREHOLDERS
(a)
Decrease
in
net
assets
resulting
from
distributions
to
shareholders
.................
(461,734)
(361,288)
(160,717)
(125,927)
CAPITAL
SHARE
TRANSACTIONS
Net
increase
in
net
assets
derived
from
capital
share
transactions
.................
1,485,356
2,633,944
660,583
13,293
NET
ASSETS
Total
increase
in
net
assets
...........................................
3,126,697
3,295,122
1,021,533
4,096
Beginning
of
year
..................................................
17,107,483
13,812,361
5,166,554
5,162,458
End
of
year
......................................................
$
20,234,180
$
17,107,483
$
6,188,087
$
5,166,554
(a)
Distributions
for
annual
periods
determined
in
accordance
with
U.S.
federal
income
tax
regulations.
Financial
Highlights
(For
a
share
outstanding
throughout
each
period)
iShares
ESG
Aware
Aggressive
Allocation
ETF
Year
Ended
07/31/24
Year
Ended
07/31/23
Year
Ended
07/31/22
Year
Ended
07/31/21
Period
from
06/12/20
(a)
to
07/31/20
Net
asset
value,
beginning
of
period
...............................
$
31.42
$
29.48
$
33.57
$
26.74
$
25.32
Net
investment
income
(b)
.......................................
0
.72
0
.61
0
.58
0
.49
0
.10
Net
realized
and
unrealized
gain
(loss)
(c)
.............................
3.72
1.94
(4.10
)
6.78
1.44
Net
increase
(decrease)
from
investment
operations
......................
4.44
2.55
(3.52
)
7.27
1.54
Distributions
from
net
investment
income
(d)
..........................
(0.71
)
(0.61
)
(0.57
)
(0.44
)
(0.12
)
Net
asset
value,
end
of
period
....................................
$
35.15
$
31.42
$
29.48
$
33.57
$
26.74
Total
Return
(e)
—
—
—
—
—
Based
on
net
asset
value
........................................
14.34
%
8.82
%
(10.57
)%
27.32
%
6.10
%
(f)
Ratios
to
Average
Net
Assets
(g)
Total
expen
ses
...............................................
0.18
%
0.18
%
0.18
%
0.18
%
0.18
%
(h)
Total
expenses
after
fees
waived
...................................
0.02
%
0.02
%
0.02
%
0.02
%
0.03
%
(h)
Net
investment
income
..........................................
2.22
%
2.10
%
1.81
%
1.53
%
2.74
%
(h)
Supplemental
Data
Net
assets,
end
of
period
(000)
....................................
$
28,117
$
25,137
$
20,639
$
20,141
$
4,011
Portfolio
turnover
rate
(i)
..........................................
4
%
4
%
2
%
5
%
0
%
(j)
(a)
Commencement
of
operations.
(b)
Based
on
average
shares
outstanding.
(c)
The
amounts
reported
for
a
share
outstanding
may
not
accord
with
the
change
in
aggregate
gains
and
losses
in
securities
for
the
fiscal
period
due
to
the
timing
of
capital
share
transactions
in
relation
to
the
fluctuating
market
values
of
the
Fund’s
underlying
securities.
(d)
Distributions
for
annual
periods
determined
in
accordance
with
U.S.
federal
income
tax
regulations.
(e)
Where
applicable,
assumes
the
reinvestment
of
distributions.
(f)
Not
annualized.
(g)
Excludes
fees
and
expenses
incurred
indirectly
as
a
result
of
investments
in
underlying
funds.
(h)
Annualized.
(i)
Portfolio
turnover
rate
excludes
in-kind
transactions,
if
any.
(j)
Rounds
to
less
than
0.01%.
See
notes
to
financial
statements.
Financial
Highlights
(continued)
(For
a
share
outstanding
throughout
each
period)
2024
iShares
Annual
Financial
Statements
iShares
ESG
Aware
Conservative
Allocation
ETF
Year
Ended
07/31/24
Year
Ended
07/31/23
Year
Ended
07/31/22
Year
Ended
07/31/21
Period
from
06/12/20
(a)
to
07/31/20
Net
asset
value,
beginning
of
period
...............................
$
24.47
$
24.85
$
27.97
$
25.95
$
25.14
Net
investment
income
(b)
.......................................
0
.76
0
.58
0
.38
0
.33
0
.06
Net
realized
and
unrealized
gain
(loss)
(c)
.............................
1.25
(0.37
)
(3.06
)
2.05
0.82
Net
increase
(decrease)
from
investment
operations
......................
2.01
0.21
(2.68
)
2.38
0.88
Distributions
(d)
–
–
–
–
–
From
net
investment
income
....................................
(
0
.76
)
(
0
.59
)
(
0
.44
)
(
0
.36
)
(
0
.07
)
Return
of
capital
.............................................
—
—
—
—
(
0
.00
)
(e)
Total
distributions
.............................................
(0.76
)
(0.59
)
(0.44
)
(0.36
)
(0.07
)
Net
asset
value,
end
of
period
....................................
$
25.72
$
24.47
$
24.85
$
27.97
$
25.95
Total
Return
(f)
—
—
—
—
—
Based
on
net
asset
value
........................................
8.44
%
0.93
%
(9.65
)%
9.23
%
3.50
%
(g)
Ratios
to
Average
Net
Assets
(h)
Total
expen
ses
...............................................
0.18
%
0.18
%
0.18
%
0.18
%
0.18
%
(i)
Total
expenses
after
fees
waived
...................................
0.06
%
0.06
%
0.06
%
0.06
%
0.06
%
(i)
Net
investment
income
..........................................
3.11
%
2.42
%
1.41
%
1.21
%
1.63
%
(i)
Supplemental
Data
Net
assets,
end
of
period
(000)
....................................
$
8,360
$
7,341
$
8,697
$
5,594
$
3,893
Portfolio
turnover
rate
(j)
..........................................
4
%
4
%
3
%
4
%
0
%
(a)
Commencement
of
operations.
(b)
Based
on
average
shares
outstanding.
(c)
The
amounts
reported
for
a
share
outstanding
may
not
accord
with
the
change
in
aggregate
gains
and
losses
in
securities
for
the
fiscal
period
due
to
the
timing
of
capital
share
transactions
in
relation
to
the
fluctuating
market
values
of
the
Fund’s
underlying
securities.
(d)
Distributions
for
annual
periods
determined
in
accordance
with
U.S.
federal
income
tax
regulations.
(e)
Rounds
to
less
than
$0.01.
(f)
Where
applicable,
assumes
the
reinvestment
of
distributions.
(g)
Not
annualized.
(h)
Excludes
fees
and
expenses
incurred
indirectly
as
a
result
of
investments
in
underlying
funds.
(i)
Annualized.
(j)
Portfolio
turnover
rate
excludes
in-kind
transactions,
if
any.
See
notes
to
financial
statements.
Financial
Highlights
(continued)
(For
a
share
outstanding
throughout
each
period)
iShares
ESG
Aware
Growth
Allocation
ETF
Year
Ended
07/31/24
Year
Ended
07/31/23
Year
Ended
07/31/22
Year
Ended
07/31/21
Period
from
06/12/20
(a)
to
07/31/20
Net
asset
value,
beginning
of
period
...............................
$
28.51
$
27.62
$
31.24
$
26.43
$
25.25
Net
investment
income
(b)
.......................................
0
.75
0
.62
0
.50
0
.40
0
.08
Net
realized
and
unrealized
gain
(loss)
(c)
.............................
2.61
0.89
(3.64
)
4.81
1.20
Net
increase
(decrease)
from
investment
operations
......................
3.36
1.51
(3.14
)
5.21
1.28
Distributions
from
net
investment
income
(d)
..........................
(0.74
)
(0.62
)
(0.48
)
(0.40
)
(0.10
)
Net
asset
value,
end
of
period
....................................
$
31.13
$
28.51
$
27.62
$
31.24
$
26.43
Total
Return
(e)
—
—
—
—
—
Based
on
net
asset
value
........................................
11.97
%
5.62
%
(10.11
)%
19.83
%
5.08
%
(f)
Ratios
to
Average
Net
Assets
(g)
Total
expen
ses
...............................................
0.18
%
0.18
%
0.18
%
0.18
%
0.18
%
(h)
Total
expenses
after
fees
waived
...................................
0.04
%
0.04
%
0.04
%
0.03
%
0.04
%
(h)
Net
investment
income
..........................................
2.59
%
2.30
%
1.68
%
1.37
%
2.29
%
(h)
Supplemental
Data
Net
assets,
end
of
period
(000)
....................................
$
20,234
$
17,107
$
13,812
$
7,811
$
3,965
Portfolio
turnover
rate
(i)
..........................................
6
%
5
%
4
%
15
%
0
%
(j)
(a)
Commencement
of
operations.
(b)
Based
on
average
shares
outstanding.
(c)
The
amounts
reported
for
a
share
outstanding
may
not
accord
with
the
change
in
aggregate
gains
and
losses
in
securities
for
the
fiscal
period
due
to
the
timing
of
capital
share
transactions
in
relation
to
the
fluctuating
market
values
of
the
Fund’s
underlying
securities.
(d)
Distributions
for
annual
periods
determined
in
accordance
with
U.S.
federal
income
tax
regulations.
(e)
Where
applicable,
assumes
the
reinvestment
of
distributions.
(f)
Not
annualized.
(g)
Excludes
fees
and
expenses
incurred
indirectly
as
a
result
of
investments
in
underlying
funds.
(h)
Annualized.
(i)
Portfolio
turnover
rate
excludes
in-kind
transactions,
if
any.
(j)
Rounds
to
less
than
0.01%.
See
notes
to
financial
statements.
Financial
Highlights
(continued)
(For
a
share
outstanding
throughout
each
period)
2024
iShares
Annual
Financial
Statements
iShares
ESG
Aware
Moderate
Allocation
ETF
Year
Ended
07/31/24
Year
Ended
07/31/23
Year
Ended
07/31/22
Year
Ended
07/31/21
Period
from
06/12/20
(a)
to
07/31/20
Net
asset
value,
beginning
of
period
...............................
$
25.83
$
25.81
$
29.05
$
26.11
$
25.18
Net
investment
income
(b)
.......................................
0
.76
0
.59
0
.42
0
.35
0
.06
Net
realized
and
unrealized
gain
(loss)
(c)
.............................
1.67
0.02
(3.25
)
2.96
0.95
Net
increase
(decrease)
from
investment
operations
......................
2.43
0.61
(2.83
)
3.31
1.01
Distributions
(d)
–
–
–
–
–
From
net
investment
income
....................................
(
0
.76
)
(
0
.59
)
(
0
.41
)
(
0
.37
)
(
0
.08
)
Return
of
capital
.............................................
—
—
—
—
(
0
.00
)
(e)
Total
distributions
.............................................
(0.76
)
(0.59
)
(0.41
)
(0.37
)
(0.08
)
Net
asset
value,
end
of
period
....................................
$
27.50
$
25.83
$
25.81
$
29.05
$
26.11
Total
Return
(f)
—
—
—
—
—
Based
on
net
asset
value
........................................
9.60
%
2.48
%
(9.79
)%
12.76
%
4.02
%
(g)
Ratios
to
Average
Net
Assets
(h)
Total
expen
ses
...............................................
0.18
%
0.18
%
0.18
%
0.18
%
0.18
%
(i)
Total
expenses
after
fees
waived
...................................
0.05
%
0.05
%
0.05
%
0.05
%
0.05
%
(i)
Net
investment
income
..........................................
2.93
%
2.37
%
1.51
%
1.25
%
1.82
%
(i)
Supplemental
Data
Net
assets,
end
of
period
(000)
....................................
$
6,188
$
5,167
$
5,162
$
5,810
$
3,917
Portfolio
turnover
rate
(j)
..........................................
6
%
5
%
15
%
4
%
0
%
(a)
Commencement
of
operations.
(b)
Based
on
average
shares
outstanding.
(c)
The
amounts
reported
for
a
share
outstanding
may
not
accord
with
the
change
in
aggregate
gains
and
losses
in
securities
for
the
fiscal
period
due
to
the
timing
of
capital
share
transactions
in
relation
to
the
fluctuating
market
values
of
the
Fund’s
underlying
securities.
(d)
Distributions
for
annual
periods
determined
in
accordance
with
U.S.
federal
income
tax
regulations.
(e)
Rounds
to
less
than
$0.01.
(f)
Where
applicable,
assumes
the
reinvestment
of
distributions.
(g)
Not
annualized.
(h)
Excludes
fees
and
expenses
incurred
indirectly
as
a
result
of
investments
in
underlying
funds.
(i)
Annualized.
(j)
Portfolio
turnover
rate
excludes
in-kind
transactions,
if
any.
See
notes
to
financial
statements.
Notes
to
Financial
Statements
Notes
to
Financial
Statements
1.
ORGANIZATION
iShares
Trust
(the
“Trust”)
is
registered
under
the
Investment
Company
Act
of
1940,
as
amended
(the
“1940
Act”),
as
an
open-end
management
investment
company.
The
Trust
is
organized
as
a
Delaware
statutory
trust
and
is
authorized
to
have
multiple
series
or
portfolios.
These
financial
statements
relate
only
to
the
following
funds
(each,
a
“Fund”
and
collectively,
the
“Funds”):
Each
Fund
is
a
fund
of
funds
and
seeks
to
achieve
its
investment
objective
by
investing
primarily
in
other
iShares
funds
(each,
an
“underlying
fund”
and
collectively,
the
“underlying
funds”).
The
financial
statements,
including
the
accounting
policies,
and
Schedules
of
Investments
for
the
underlying
funds
are
available
on
iShares.com
and
should
be
read
in
conjunction
with
the
Funds’
financial
statements.
2.
Significant
Accounting
Policies
The
financial
statements
are
prepared
in
conformity
with
accounting
principles
generally
accepted
in
the
United
States
of
America
(“U.S.
GAAP”),
which
may
require
management
to
make
estimates
and
assumptions
that
affect
the
reported
amounts
of
assets
and
liabilities
in
the
financial
statements,
disclosure
of
contingent
assets
and
liabilities
at
the
date
of
the
financial
statements
and
the
reported
amounts
of
increases
and
decreases
in
net
assets
from
operations
during
the
reporting
period.
Actual
results
could
differ
from
those
estimates. Each
Fund
is
considered
an
investment
company
under
U.S.
GAAP
and
follows
the
accounting
and
reporting
guidance
applicable
to
investment
companies.
Below
is
a
summary
of
significant
accounting
policies:
Investment
Transactions
and
Income
Recognition
:
For
financial
reporting
purposes,
investment
transactions
are
recorded
on
the
dates
the
transactions
are
executed.
Realized
gains
and
losses
on
investment
transactions
are
determined
using
the
specific
identification
method.
Dividend
income
and
capital
gain
distributions
from
the
underlying
funds,
if
any,
are
recorded
on
the
ex-dividend
date.
Interest
income
is
recognized
daily
on
an
accrual
basis.
In-kind
Redemptions:
For
financial
reporting
purposes,
in-kind
redemptions
are
treated
as
sales
of
securities
resulting
in
realized
capital
gains
or
losses
to
the
Funds.
Because
such
gains
or
losses
are
not
taxable
to
the
Funds
and
are
not
distributed
to
existing
Fund
shareholders,
the
gains
or
losses
are
reclassified
from
accumulated
net
realized
gain
(loss)
to
paid-in
capital
at
the
end
of
the
Funds’
tax
year.
These
reclassifications
have
no
effect
on
net
assets
or
net
asset
value
(“NAV”)
per
share.
Distributions:
Dividends
and
distributions
paid
by
each
Fund
are
recorded
on
the
ex-dividend
dates.
Distributions
are
determined
on
a
tax
basis
and
may
differ
from
net
investment
income
and
net
realized
capital
gains
for
financial
reporting
purposes.
Dividends
and
distributions
are
paid
in
U.S.
dollars
and
cannot
be
automatically
reinvested
in
additional
shares
of
the
Funds.
Indemnifications:
In
the
normal
course
of
business,
each
Fund
enters
into
contracts
that
contain
a
variety
of
representations
that
provide
general
indemnification.
The
Funds’
maximum
exposure
under
these
arrangements
is
unknown
because
it
involves
future
potential
claims
against
the
Funds,
which
cannot
be
predicted
with
any
certainty.
3.
Investment
Valuation
and
Fair
Value
Measurements
Investment
Valuation
Policies:
Each
Fund’s
investments
are
valued
at
fair
value
(also
referred
to
as
“market
value”
within
the
financial
statements)
each
day
that
the
Fund’s
listing
exchange
is
open
and,
for
financial
reporting
purposes,
as
of
the
report
date.
U.S.
GAAP
defines
fair
value
as
the
price
a
fund
would
receive
to
sell
an
asset
or
pay
to
transfer
a
liability
in
an
orderly
transaction
between
market
participants
at
the
measurement
date.
The
Board
of
Trustees
of
the
Trust
(the
“Board”)
of each
Fund
has
approved
the
designation
of
BlackRock
Fund
Advisors
(“BFA”),
the
Funds’
investment
adviser, as
the
valuation
designee
for
each
Fund. Each
Fund
determines
the
fair
values
of
its
financial
instruments
using
various
independent
dealers
or
pricing
services
under
BFA’s
policies.
If
a
security’s
market
price
is
not
readily
available
or
does
not
otherwise
accurately
represent
the
fair
value
of
the
security,
the
security
will
be
valued
in
accordance
with
BFA’s policies
and
procedures as
reflecting
fair
value. BFA
has
formed
a
committee
(the
“Valuation
Committee”)
to
develop pricing
policies
and
procedures
and
to
oversee
the
pricing
function
for
all
financial
instruments,
with
assistance
from
other
BlackRock
pricing
committees.
Fair
Value
Inputs
and
Methodologies:
The
following
methods
and
inputs
are
used
to
establish
the
fair
value
of
each
Fund’s
assets
and
liabilities:
Exchange-traded
funds
and
closed-end
funds
traded
on
a
recognized
securities
exchange
are
valued
at
that
day’s official
closing
price,
as
applicable,
on
the
exchange
where
the
fund
is
primarily
traded.
Funds
traded
on
a
recognized
exchange
for
which
there
were
no
sales
on
that
day
may
be
valued
at
the
last
traded
price.
Investments
in
open-end
U.S.
mutual
funds
(including
money
market
funds)
are
valued
at
that
day’s
published
NAV.
If
events
(e.g.,
market
volatility,
company
announcement
or
a
natural
disaster)
occur
that
are
expected
to
materially
affect
the
value
of
such
investment,
or
in
the
event
that
application
of
these
methods
of
valuation
results
in
a
price
for
an
investment
that
is
deemed
not
to
be
representative
of
the
market
value
of
such
investment,
or
if
a
price
is
not
available,
the
investment
will
be
valued
by
the Valuation
Committee,
in
accordance
with
BFA’s
policies
and
procedures as
reflecting
fair
value
(“Fair
Valued
Investments”).
The
fair
valuation
approaches
that
may
be
used
by
the Valuation
Committee
include
market
approach,
income
approach
and
cost
approach.
Valuation
techniques
such
as
discounted
cash
flow,
use
of
market
comparables
and
matrix
pricing
are
types
of
valuation
approaches
and
are
typically
used
in
determining
fair
value.
When
determining
the
price
for
Fair
Valued
Investments,
the Valuation
Committee
seeks
to
determine
the
price
that each
Fund
might
reasonably
expect
to
receive
or
pay
from
the
current
sale
iShares
ETF
Diversification
Classification
ESG
Aware
Aggressive
Allocation
..........................................................................................
Diversified
ESG
Aware
Conservative
Allocation
........................................................................................
Diversified
ESG
Aware
Growth
Allocation
............................................................................................
Diversified
ESG
Aware
Moderate
Allocation
...........................................................................................
Diversified
Notes
to
Financial
Statements
(continued)
2024
iShares
Annual
Financial
Statements
or
purchase
of
that
asset
or
liability
in
an
arm’s-length
transaction.
Fair
value
determinations
shall
be
based
upon
all
available
factors
that
the Valuation
Committee
deems
relevant
and
consistent
with
the
principles
of
fair
value
measurement.
Fair
value
pricing
could
result
in
a
difference
between
the
prices
used
to
calculate
a
fund’s
NAV
and
the
prices
used
by
the
fund’s
underlying
index,
which
in
turn
could
result
in
a
difference
between
the
fund’s
performance
and
the
performance
of
the
fund’s
underlying
index.
Fair
Value
Hierarchy:
Various
inputs
are
used
in
determining
the
fair
value
of
financial
instruments.
These
inputs
to
valuation
techniques
are
categorized
into
a
fair
value
hierarchy
consisting
of
three
broad
levels
for
financial
reporting
purposes
as
follows:
Level
1
–
Unadjusted
price
quotations
in
active
markets/exchanges
for
identical
assets
or
liabilities
that each
Fund
has
the
ability
to
access;
Level
2
–
Other
observable
inputs
(including,
but
not
limited
to,
quoted
prices
for
similar
assets
or
liabilities
in
markets
that
are
active,
quoted
prices
for
identical
or
similar
assets
or
liabilities
in
markets
that
are
not
active,
inputs
other
than
quoted
prices
that
are
observable
for
the
assets
or
liabilities
(such
as
interest
rates,
yield
curves,
volatilities,
prepayment
speeds,
loss
severities,
credit
risks
and
default
rates)
or
other
market-corroborated
inputs);
and
Level
3
–
Unobservable
inputs
based
on
the
best
information
available
in
the
circumstances,
to
the
extent
observable
inputs
are
not
available,
(including
the Valuation
Committee’s
assumptions
used
in
determining
the
fair
value
of
financial
instruments).
The
hierarchy
gives
the
highest
priority
to
unadjusted
quoted
prices
in
active
markets
for
identical
assets
or
liabilities
(Level
1
measurements)
and
the
lowest
priority
to
unobservable
inputs
(Level
3
measurements).
Accordingly,
the
degree
of
judgment
exercised
in
determining
fair
value
is
greatest
for
instruments
categorized
in
Level
3.
The
inputs
used
to
measure
fair
value
may
fall
into
different
levels
of
the
fair
value
hierarchy.
In
such
cases,
for
disclosure
purposes,
the
fair
value
hierarchy
classification
is
determined
based
on
the
lowest
level
input
that
is
significant
to
the
fair
value
measurement
in
its
entirety.
Investments
classified
within
Level
3
have
significant
unobservable
inputs
used
by
the Valuation
Committee
in
determining
the
price
for
Fair
Valued
Investments.
Level
3
investments
include
equity
or
debt
issued
by
privately
held
companies
or
funds
that
may
not
have
a
secondary
market
and/or
may
have
a
limited
number
of
investors.
The
categorization
of
a
value
determined
for
financial
instruments
is
based
on
the
pricing
transparency
of
the
financial
instruments
and
is
not
necessarily
an
indication
of
the
risks
associated
with
investing
in
those
securities.
4.
Securities
and
Other
Investments
Securities
Lending:
Each
Fund
may
lend
its
securities
to
approved
borrowers,
such
as
brokers,
dealers
and
other
financial
institutions.
The
borrower
pledges
and
maintains
with
the
Fund
collateral
consisting
of
cash,
an
irrevocable
letter
of
credit
issued
by
an
approved
bank,
or
securities
issued
or
guaranteed
by
the
U.S.
government.
The
initial
collateral
received
by
each
Fund
is
required
to
have
a
value
of
at
least
102%
of
the
current
market
value
of
the
loaned
securities
for
securities
traded
on
U.S.
exchanges
and
a
value
of
at
least
105%
for
all
other
securities.
The
collateral
is
maintained
thereafter
at
a
value
equal
to
at
least
100%
of
the
current
value
of
the
securities
on
loan.
The
market
value
of
the
loaned
securities
is
determined
at
the
close
of
each
business
day
of
the
Fund
and
any
additional
required
collateral
is
delivered
to
the
Fund
or
excess
collateral
is
returned
by
the
Fund,
on
the
next
business
day.
During
the
term
of
the
loan,
each
Fund
is
entitled
to
all
distributions
made
on
or
in
respect
of
the
loaned
securities
but
does
not
receive
interest
income
on
securities
received
as
collateral.
Loans
of
securities
are
terminable
at
any
time
and
the
borrower,
after
notice,
is
required
to
return
borrowed
securities
within
the
standard
time
period
for
settlement
of
securities
transactions.
As
of
period
end,
any
securities
on
loan
were
collateralized
by
cash
and/or
U.S.
Government
obligations.
Cash
collateral
invested
in
money
market
funds
managed
by
BFA,
or
its
affiliates
is
disclosed
in
the
Schedule
of
Investments.
Any
non-cash
collateral
received
cannot
be
sold,
re-invested
or
pledged
by
the
Fund,
except
in
the
event
of
borrower
default.
The
securities
on
loan,
if
any,
are
also
disclosed
in
each
Fund’s
Schedule
of
Investments.
The
market
value
of
any
securities
on
loan
and
the
value
of
any
related
cash
collateral
are
disclosed
in
the
Statements
of
Assets
and
Liabilities.
Securities
lending
transactions
are
entered
into
by
the
Funds
under
Master
Securities
Lending
Agreements
(each,
an
“MSLA”)
which
provide
the
right,
in
the
event
of
default
(including
bankruptcy
or
insolvency)
for
the
non-defaulting
party
to
liquidate
the
collateral
and
calculate
a
net
exposure
to
the
defaulting
party
or
request
additional
collateral.
In
the
event
that
a
borrower
defaults,
the
Funds,
as
lender,
would
offset
the
market
value
of
the
collateral
received
against
the
market
value
of
the
securities
loaned.
When
the
value
of
the
collateral
is
greater
than
that
of
the
market
value
of
the
securities
loaned,
the
lender
is
left
with
a
net
amount
payable
to
the
defaulting
party.
However,
bankruptcy
or
insolvency
laws
of
a
particular
jurisdiction
may
impose
restrictions
on
or
prohibitions
against
such
a
right
of
offset
in
the
event
of
an
MSLA
counterparty’s
bankruptcy
or
insolvency.
Under
the
MSLA,
absent
an
event
of
default,
the
borrower
can
resell
or
re-pledge
the
loaned
securities,
and
the
Funds
can
reinvest
cash
collateral
received
in
connection
with
loaned
securities.
Upon
an
event
of
default,
the
parties’
obligations
to
return
the
securities
or
collateral
to
the
other
party
are
extinguished,
and
the
parties
can
resell
or
re-pledge
the
loaned
securities
or
the
collateral
received
in
connection
with
the
loaned
securities
in
order
to
satisfy
the
defaulting
party’s
net
payment
obligation
for
all
transactions
under
the
MSLA.
The
defaulting
party
remains
liable
for
any
deficiency.
As
of
period
end,
the
following
table
is
a
summary
of
the
securities
on
loan
by
counterparty
which
are
subject
to
offset
under
an
MSLA:
The
risks
of
securities
lending
include
the
risk
that
the
borrower
may
not
provide
additional
collateral
when
required
or
may
not
return
the
securities
when
due.
To
mitigate
these
risks,
each
Fund
benefits
from
a
borrower
default
indemnity
provided
by
BlackRock,
Inc.
(“BlackRock”).
BlackRock’s
indemnity
allows
for
full
replacement
of
the
iShares
ETF
and
Counterparty
Securities
Loaned
at
Value
Cash
Collateral
Received
(a)
Non-Cash
Collateral
Received,
at
Fair
Value
(a)
Net
Amount
ESG
Aware
Aggressive
Allocation
RBC
Capital
Markets
LLC
................................
$
245,027
$
(245,027)
$
–
$
–
m
ESG
Aware
Moderate
Allocation
RBC
Capital
Markets
LLC
................................
$
153,661
$
(153,661)
$
–
$
–
m
(a)
Collateral
received,
if
any,
in
excess
of
the
market
value
of
securities
on
loan
is
not
presented
in
this
table.
The
total
cash
collateral
received
by
each
Fund
is
disclosed
in
the
Fund’s
Statements
of
Assets
and
Liabilities.
Notes
to
Financial
Statements
(continued)
Notes
to
Financial
Statements
securities
loaned
to
the
extent
the
collateral
received
does
not
cover
the
value
of
the
securities
loaned
in
the
event
of
borrower
default.
Each
Fund
could
incur
a
loss
if
the
value
of
an
investment
purchased
with
cash
collateral
falls
below
the
market
value
of
the
loaned
securities
or
if
the
value
of
an
investment
purchased
with
cash
collateral
falls
below
the
value
of
the
original
cash
collateral
received.
Such
losses
are
borne
entirely
by
each
Fund.
5.
Investment
Advisory
Agreement
and
Other
Transactions
with
Affiliates
Investment
Advisory
Fees:
Pursuant
to
an
Investment
Advisory
Agreement
with
the
Trust
,
BFA
manages
the
investment
of each
Fund’s
assets.
BFA
is
a
California
corporation
indirectly owned
by
BlackRock. Under
the
Investment
Advisory
Agreement,
BFA
is
responsible
for
substantially
all
expenses
of
the
Funds,
except
(
i
)
interest
and
taxes;
(ii)
brokerage
commissions
and
other
expenses
connected
with
the
execution
of
portfolio
transactions;
(iii)
distribution
fees;
(iv)
the
advisory
fee
payable
to
BFA;
and
(v)
litigation
expenses
and
any
extraordinary
expenses
(in
each
case
as
determined
by
a
majority
of
the
independent
trustees
).
For
its
investment
advisory
services
to each of
the
following Funds,
BFA
is
entitled
to
an
annual
investment
advisory
fee,
accrued
daily
and
paid
monthly
by
the
Funds,
based
on
the
average
daily
net
assets
of each
Fund
as
follows:
Expense
Waivers:
A
fund
may
incur
its
pro
rata
share
of
fees
and
expenses
attributable
to
its
investments
in
other
investment
companies
(“acquired
fund
fees
and
expenses”).
The
total
of
the
investment
advisory
fee
and
acquired
fund
fees
and
expenses,
if
any,
is
a
fund’s
total
annual
operating
expenses.
Total
expenses
as
shown
in
the
Statements
of
Operations
does
not
include
acquired
fund
fees
and
expenses.
BFA
has
contractually
agreed
to
waive
a
portion
of
its
investment
advisory
fee
for
each
Fund
through
November
30,
2025,
in
an
amount
equal
to
the
acquired
fund
fees
and
expenses,
if
any,
attributable
to
each
Fund’s
investments
in
other
iShares
funds.
These
amounts are
included
in
investment
advisory
fees
waived
in
the
Statements
of
Operations.
For
the
year ended July
31,
2024,
the
amounts
waived
in
investment
advisory
fees
pursuant
to
this
arrangement
were
as
follows:
Distributor:
BlackRock
Investments,
LLC
(“BRIL”),
an
affiliate
of
BFA,
is
the
distributor
for
each
Fund.
Pursuant
to
the
distribution
agreement,
BFA
is
responsible
for
any
fees
or
expenses
for
distribution
services
provided
to
the
Funds.
ETF
Servicing
Fees:
Each
Fund
has
entered
into
an
ETF
Services
Agreement
with
BRIL
to
perform
certain
order
processing,
Authorized
Participant
communications,
and
related
services
in
connection
with
the
issuance
and
redemption
of
Creation
Units
(“ETF
Services”).
BRIL
is
entitled
to
a
transaction
fee
from
Authorized
Participants
on
each
creation
or
redemption
order
for
the
ETF
Services
provided. The Funds
do
not
pay
BRIL
for
ETF
Services.
Index
Provider:
BlackRock
Index
Services,
LLC,
an
affiliate
of
BFA,
created,
sponsors
and
publishes
the
underlying
index used
by each
Fund.
Each
Fund
uses
its
underlying
index
at
no
charge
pursuant
to
a
license
agreement
between
BlackRock
Index
Services,
LLC
(or
one
or
more
of
its
affiliates)
and
the
Trust,
on
behalf
of
the
Funds.
Securities
Lending:
The
U.S.
Securities
and
Exchange
Commission
(the
“SEC”)
has
issued
an
exemptive
order
which
permits
BlackRock
Institutional
Trust
Company,
N.A.
(“BTC”),
an
affiliate
of
BFA,
to
serve
as
securities
lending
agent
for
the
Funds,
subject
to
applicable
conditions.
As
securities
lending
agent,
BTC
bears
all
operational
costs
directly
related
to
securities
lending,
including
any
custodial
costs.
Each
Fund
is
responsible
for
fees
in
connection
with
the
investment
of
cash
collateral
received
for
securities
on
loan
(the
“collateral
investment
fees”).
The
cash
collateral
is
invested
in
a
money
market
fund,
BlackRock
Cash
Funds:
Institutional
or
BlackRock
Cash
Funds:
Treasury,
managed
by
BFA,
or
its
affiliates.
However,
BTC
has
agreed
to
reduce
the
amount
of
securities
lending
income
it
receives
in
order
to
effectively
limit
the
collateral
investment
fees
each
Fund
bears
to
an
annual
rate
of
0.04%.
The
SL
Agency
Shares
of
such
money
market
fund
will
not
be
subject
to
a
sales
load,
redemption
fee,
distribution
fee
or
service
fee.
The
money
market
fund
in
which
the
cash
collateral
has
been
invested
may
impose
a
discretionary
liquidity
fee
of
up
to
2%
of
the
value
redeemed,
if
such
fee
is
determined
to
be
in
the
best
interests
of
such
money
market
fund.
Securities
lending
income
is
generally
equal
to
the
total
of
income
earned
from
the
reinvestment
of
cash
collateral
(and
excludes
collateral
investment
fees),
and
any
fees
or
other
payments
to
and
from
borrowers
of
securities.
Each
Fund
retains
a
portion
of
the
securities
lending
income
and
remits
the
remaining
portion
to
BTC
as
compensation
for
its
services
as
securities
lending
agent.
Pursuant
to
the
current
securities
lending
agreement,
each
Fund
retains
82%
of
securities
lending
income
(which
excludes
collateral
investment
fees)
and
the
amount
retained
can
never
be
less
than
70%
of
the
total
of
securities
lending
income
plus
the
collateral
investment
fees.
In
addition,
commencing
the
business
day
following
the
date
that
the
aggregate
securities
lending
income
plus
the
collateral
investment
fees
generated
across
all
1940
Act
iShares
exchange-traded
funds
(the
“iShares
ETF
Complex”)
in
that
calendar
year
exceeds
a
specified
threshold,
each
Fund,
pursuant
to
the
securities
lending
agreement,
will
retain
for
the
remainder
of
that
calendar
year
85%
of
securities
lending
income
(which
excludes
collateral
investment
fees),
and
the
amount
retained
can
never
be
less
than
70%
of
the
total
of
securities
lending
income
plus
the
collateral
investment
fees.
iShares
ETF
Investment
Advisory
Fees
ESG
Aware
Aggressive
Allocation
.......................................................................................
0.18
%
ESG
Aware
Conservative
Allocation
.....................................................................................
0.18
ESG
Aware
Growth
Allocation
.........................................................................................
0.18
ESG
Aware
Moderate
Allocation
........................................................................................
0.18
iShares
ETF
Amounts
Waived
ESG
Aware
Aggressive
Allocation
..........................................................................................
$
41,282
ESG
Aware
Conservative
Allocation
........................................................................................
9,141
ESG
Aware
Growth
Allocation
............................................................................................
25,719
ESG
Aware
Moderate
Allocation
...........................................................................................
7,129
Notes
to
Financial
Statements
(continued)
2024
iShares
Annual
Financial
Statements
The
share
of
securities
lending
income
earned
by each
Fund
is
shown
as
securities
lending
income
–
affiliated
–
net
in
its
Statements
of
Operations.
For
the year ended
July
31,
2024,
the
Funds
paid
BTC
the
following
amounts
for
securities
lending
agent
services:
Officers
and
Trustees:
Certain
officers
and/or
trustees
of
the
Trust
are
officers
and/or
trustees
of
BlackRock
or
its
affiliates.
Other
Transactions:
Each
Fund
may
invest
its
positive
cash
balances
in
certain
money
market
funds
managed
by
BFA
or
an
affiliate.
The
income
earned
on
these
temporary
cash
investments
is
shown
as
dividends
–
affiliated
in
the
Statements
of
Operations.
6.
Purchases
and
Sales
For
the year ended
July
31,
2024,
purchases
and
sales
of
investments,
excluding
short-term securities
and
in-kind
transactions,
were
as
follows:
For
the year ended
July
31,
2024,
in-kind
transactions
were
as
follows:
7.
Income
Tax
Information
Each
Fund
is
treated
as
an
entity
separate
from
the
Trust’s other
funds
for
federal
income
tax
purposes.
It
is
each
Fund’s
policy
to
comply
with
the
requirements
of
the
Internal
Revenue
Code
of
1986,
as
amended,
applicable
to
regulated
investment
companies,
and
to
distribute
substantially
all
of
its
taxable
income
to
its
shareholders.
Therefore,
no
U.S.
federal
income
tax
provision
is
required.
Management
has
analyzed
tax
laws
and
regulations
and
their
application
to
the
Funds
as
of
July
31,
2024,
inclusive
of
the
open
tax
return
years,
and
does
not
believe
that
there
are
any
uncertain
tax
positions
that
require
recognition
of
a
tax
liability
in
the
Funds’
financial
statements.
U.S.
GAAP
requires
that
certain
components
of
net
assets
be
adjusted
to
reflect
permanent
differences
between
financial
and
tax
reporting.
These
reclassifications
have
no
effect
on
net
assets
or
NAV
per
share.
As
of July
31,
2024,
permanent
differences
attributable
to
realized
gains
(losses)
from
in-kind
redemptions
were
reclassified
to
the
following
accounts:
The
tax
character
of
distributions
paid
was
as
follows:
iShares
ETF
Amounts
ESG
Aware
Aggressive
Allocation
..............................................................................................
$
909
ESG
Aware
Conservative
Allocation
............................................................................................
151
ESG
Aware
Growth
Allocation
................................................................................................
679
ESG
Aware
Moderate
Allocation
...............................................................................................
110
iShares
ETF
Purchases
Sales
ESG
Aware
Aggressive
Allocation
...........................................................................
$
1,121,279
$
1,112,435
ESG
Aware
Conservative
Allocation
.........................................................................
310,045
294,915
ESG
Aware
Growth
Allocation
.............................................................................
1,063,347
1,044,137
ESG
Aware
Moderate
Allocation
............................................................................
347,722
338,750
iShares
ETF
In-kind
Purchases
In-kind
Sales
ESG
Aware
Aggressive
Allocation
...........................................................................
$
1,629,873
$
1,701,511
ESG
Aware
Conservative
Allocation
.........................................................................
624,437
—
ESG
Aware
Growth
Allocation
.............................................................................
5,060,194
3,579,102
ESG
Aware
Moderate
Allocation
............................................................................
658,678
—
iShares
ETF
Paid-in
Capital
Accumulated
Earnings
(Loss)
ESG
Aware
Aggressive
Allocation
................................................................
$
375,926
$
(375,926
)
ESG
Aware
Growth
Allocation
..................................................................
378,120
(378,120
)
iShares
ETF
Year
Ended
07/31/24
Year
Ended
07/31/23
ESG
Aware
Aggressive
Allocation
Ordinary
income
...........................................................................................
$
579,193
$
442,363
ESG
Aware
Conservative
Allocation
Ordinary
income
...........................................................................................
$
231,882
$
183,635
ESG
Aware
Growth
Allocation
Ordinary
income
...........................................................................................
$
461,734
$
361,288
ESG
Aware
Moderate
Allocation
Ordinary
income
...........................................................................................
$
160,717
$
125,927
Notes
to
Financial
Statements
(continued)
Notes
to
Financial
Statements
As
of
July
31,
2024,
the
tax
components
of
accumulated
net
earnings
(losses)
were
as
follows:
As
of
July
31,
2024,
gross
unrealized
appreciation
and
depreciation
based
on
cost
of
investments
(including
short
positions
and
derivatives,
if
any)
for
U.S.
federal
income
tax
purposes
were
as
follows:
8.
Principal
Risks
In
the
normal
course
of
business,
each
Fund
invests
in
securities
or
other
instruments
and
may
enter
into
certain
transactions,
and
such
activities
subject
the
Fund
to
various
risks,
including,
among
others,
fluctuations
in
the
market
(market
risk)
or
failure
of
an
issuer
to
meet
all
of
its
obligations.
The
value
of
securities
or
other
instruments
may
also
be
affected
by
various
factors,
including,
without
limitation:
(i)
the
general
economy;
(ii)
the
overall
market
as
well
as
local,
regional
or
global
political
and/or
social
instability;
(iii)
regulation,
taxation
or
international
tax
treaties
between
various
countries;
or
(iv)
currency,
interest
rate
or
price
fluctuations.
Local,
regional
or
global
events
such
as
war,
acts
of
terrorism,
the
spread
of
infectious
illness
or
other
public
health
issues,
recessions,
or
other
events
could
have
a
significant
impact
on
the
Funds
and
their
investments.
Each
Fund’s
prospectus
provides
details
of
the
risks
to
which
the
Fund
is
subject.
BFA
uses
an
indexing
approach
to
try
to
achieve
each
Fund’s
investment
objective.
The
Fund
is
not
actively
managed,
and
BFA
generally
does
not
attempt
to
take
defensive
positions
under
any
market
conditions,
including
declining
markets.
The
Funds
may
be
exposed
to
additional
risks
when
reinvesting
cash
collateral
in
money
market
funds
that
do
not
seek
to
maintain
a
stable
NAV
per
share
of
$1.00,
which
may
be
subject
to
discretionary
liquidity
fees
under
certain
circumstances.
Counterparty
Credit
Risk:
The
Funds
may
be
exposed
to
counterparty
credit
risk,
or
the
risk
that
an
entity
may
fail
to
or
be
unable
to
perform
on
its
commitments
related
to
unsettled
or
open
transactions,
including
making
timely
interest
and/or
principal
payments
or
otherwise
honoring
its
obligations.
The
Funds
manage
counterparty
credit
risk
by
entering
into
transactions
only
with
counterparties
that BFA
believes
have
the
financial
resources
to
honor
their
obligations
and
by
monitoring
the
financial
stability
of
those
counterparties.
Financial
assets,
which
potentially
expose
the
Funds
to
market,
issuer
and
counterparty
credit
risks,
consist
principally
of
financial
instruments
and
receivables
due
from
counterparties.
The
extent
of
the
Funds’
exposure
to
market,
issuer
and
counterparty
credit
risks
with
respect
to
these
financial
assets
is
approximately
their
value
recorded
in
the
Statements
of
Assets
and
Liabilities,
less
any
collateral
held
by
the
Funds.
Geographic/Asset
Class
Risk:
A
diversified
portfolio,
where
this
is
appropriate
and
consistent
with
a
fund’s
objectives,
minimizes
the
risk
that
a
price
change
of
a
particular
investment
will
have
a
material
impact
on
the
NAV
of
a
fund.
The
investment
concentrations
within
each
Fund’s
portfolio
are
disclosed
in
its
Schedule
of
Investments.
The
Funds
invest
a
significant
portion
of
their
assets
in
securities
of
issuers
located
in
the
United
States.
A
decrease
in
imports
or
exports,
changes
in
trade
regulations,
inflation
and/or
an
economic
recession
in
the
United
States
may
have
a
material
adverse
effect
on
the
U.S.
economy
and
the
securities
listed
on
U.S.
exchanges.
Proposed
and
adopted
policy
and
legislative
changes
in
the
United
States
may
also
have
a
significant
effect
on
U.S.
markets
generally,
as
well
as
on
the
value
of
certain
securities.
Governmental
agencies
project
that
the
United
States
will
continue
to
maintain
elevated
public
debt
levels
for
the
foreseeable
future
which
may
constrain
future
economic
growth.
Circumstances
could
arise
that
could
prevent
the
timely
payment
of
interest
or
principal
on
U.S.
government
debt,
such
as
reaching
the
legislative
“debt
ceiling.”
Such
non-payment
would
result
in
substantial
negative
consequences
for
the
U.S.
economy
and
the
global
financial
system.
If
U.S.
relations
with
certain
countries
deteriorate,
it
could
adversely
affect
issuers
that
rely
on
the
United
States
for
trade.
The
United
States
has
also
experienced
increased
internal
unrest
and
discord.
If
these
trends
were
to
continue,
they
may
have
an
adverse
impact
on
the
U.S.
economy
and
the
issuers
in
which
the Funds
invest.
Significant
Shareholder
Redemption
Risk:
Certain
shareholders
may
own
or
manage
a
substantial
amount
of
fund
shares
and/or
hold
their
fund
investments
for
a
limited
period
of
time.
Large
redemptions
of
fund
shares
by
these
shareholders
may
force
a
fund
to
sell
portfolio
securities,
which
may
negatively
impact
the
fund’s
NAV,
increase
the
fund’s
brokerage
costs,
and/or
accelerate
the
realization
of
taxable
income/gains
and
cause
the
fund
to
make
additional
taxable
distributions
to
shareholders.
iShares
ETF
Undistributed
Ordinary
Income
Non-Expiring
Capital
Loss
Carryforwards
(a)
Net
Unrealized
Gains
(Losses)
(b)
Total
ESG
Aware
Aggressive
Allocation
............................................
$
1,024
$
(167,348)
$
2,731,848
$
2,565,524
ESG
Aware
Conservative
Allocation
..........................................
503
(102,681)
(679,175)
(781,353)
ESG
Aware
Growth
Allocation
..............................................
688
(126,306)
1,384,997
1,259,379
ESG
Aware
Moderate
Allocation
.............................................
86
(79,690)
(241,257)
(320,861)
(a)
Amounts
available
to
offset
future
realized
capital
gains.
(b)
The
difference
between
book-basis
and
tax-basis
net
unrealized
gains
(losses)
were
attributable
primarily
to
the
tax
deferral
of
losses
on
wash
sales.
iShares
ETF
Tax
Cost
Gross
Unrealized
Appreciation
Gross
Unrealized
Depreciation
Net
Unrealized
Appreciation
(Depreciation)
ESG
Aware
Aggressive
Allocation
......................................
$
25,634,432
$
3,655,960
$
(924,112)
$
2,731,848
ESG
Aware
Conservative
Allocation
.....................................
9,039,100
220,785
(899,960)
(679,175)
ESG
Aware
Growth
Allocation
.........................................
18,849,685
2,049,191
(664,194)
1,384,997
ESG
Aware
Moderate
Allocation
.......................................
6,585,752
266,273
(507,530)
(241,257)
Notes
to
Financial
Statements
(continued)
2024
iShares
Annual
Financial
Statements
9.
Capital
Share
Transactions
Capital
shares
are
issued
and
redeemed
by
each
Fund
only
in
aggregations
of
a
specified
number
of
shares
or
multiples
thereof
(“Creation
Units”)
at
NAV.
Except
when
aggregated
in
Creation
Units,
shares
of
each
Fund
are
not
redeemable.
Transactions
in
capital
shares
were
as
follows:
The
consideration
for
the
purchase
of
Creation
Units
of
a
fund
in
the Trust
generally
consists
of
the
in-kind
deposit
of
a
designated
portfolio
of
securities
and
a
specified
amount
of
cash.
Certain
funds
in
the Trust
may
be
offered
in
Creation
Units
solely
or
partially
for
cash
in
U.S.
dollars. Authorized
Participants purchasing
and
redeeming
Creation
Units
may
pay
a
purchase
transaction
fee
and
a
redemption
transaction
fee
directly
to
BRIL,
to
offset
transfer
and
other
transaction
costs
associated
with
the
issuance
and
redemption
of
Creation
Units,
including
Creation
Units
for
cash.
Authorized
Participants
transacting
in
Creation
Units
for
cash
may
also
pay
an
additional
variable
charge
to
compensate
the
relevant
fund
for
certain
transaction
costs
(i.e.,
stamp
taxes,
taxes
on
currency
or
other
financial
transactions,
and
brokerage
costs)
and
market
impact
expenses
relating
to
investing
in
portfolio
securities.
Such
variable
charges,
if
any,
are
included
in
shares
sold
in
the
table
above.
To
the
extent
applicable,
to
facilitate
the
timely
settlement
of
orders
for
Funds
using
a
clearing
facility
outside
of
the
continuous
net
settlement
process,
the
Fund,
at
its
sole
discretion,
may
permit
an
Authorized
Participant
to
post
cash
as
collateral
in
anticipation
of
the
delivery
of
all
or
a
portion
of
the
applicable
Deposit
Securities
or
Fund
Securities,
as
further
described
in
the
applicable
Authorized
Participant
Agreement.
The
collateral
process
is
subject
to
a
Control
Agreement
among
the
Authorized
Participant,
each
Fund’s
custodian,
and
the
Funds.
In
the
event
that
the
Authorized
Participant
fails
to
deliver
all
or
a
portion
of
the
applicable
Deposit
Securities
or
Fund
Securities,
the
Fund
may
exercise
control
over
such
collateral
pursuant
to
the
terms
of
the
Control
Agreement
in
order
to
purchase
the
applicable
Deposit
Securities
or
Fund
Securities.
From
time
to
time,
settlement
of
securities
related
to
in-kind
contributions
or
in-kind
redemptions
may
be
delayed.
In
such
cases,
securities
related
to
in-kind
transactions
are
reflected
as
a
receivable
or
a
payable
in
the
Statements
of
Assets
and
Liabilities.
10.
Subsequent
Events
Management
has
evaluated
the
impact
of
all
subsequent
events
on
the
Funds
through
the
date
the
financial
statements
were
available
to
be
issued
and
has
determined
that
there
were
no
subsequent
events
requiring
adjustment
or
additional
disclosure
in
the
financial
statements.
Year
Ended
07/31/24
Year
Ended
07/31/23
iShares
ETF
Shares
Amount
Shares
Amount
ESG
Aware
Aggressive
Allocation
Shares
sold
50,000
$
1,631,752
100,000
$
3,017,083
Shares
redeemed
(50,000)
(1,703,402)
—
—
—
$
(71,650)
100,000
$
3,017,083
ESG
Aware
Conservative
Allocation
Shares
sold
25,000
$
624,862
150,000
$
3,624,706
Shares
redeemed
—
—
(200,000)
(4,784,167)
25,000
$
624,862
(50,000)
$
(1,159,461)
ESG
Aware
Growth
Allocation
Shares
sold
175,000
$
5,070,591
300,000
$
7,909,238
Shares
redeemed
(125,000)
(3,585,235)
(200,000)
(5,275,294)
50,000
$
1,485,356
100,000
$
2,633,944
ESG
Aware
Moderate
Allocation
Shares
sold
25,000
$
660,583
400,000
$
9,927,889
Shares
redeemed
—
—
(400,000)
(9,914,596)
25,000
$
660,583
—
$
13,293
Report
of
Independent
Registered
Public
Accounting
Firm
Report
of
Independent
Registered
Public
Accounting
Firm
To
the
Board
of
Trustees
of
iShares
Trust
and
Shareholders
of
each
of
the four
funds
listed
in
the
table
below
Opinions
on
the
Financial
Statements
We
have
audited
the
accompanying
statements
of
assets
and
liabilities,
including
the
schedules
of
investments,
of
each
of
the
funds
listed in
the
table
below
(four
of
the
funds
constituting
iShares
Trust,
hereafter
collectively
referred
to
as
the “Funds”)
as
of
July
31,
2024,
the
related
statements
of
operations
for
the
year
ended
July
31,
2024,
the
statements
of
changes
in
net
assets
for
each
of
the
two
years
in
the
period
ended
July
31,
2024,
including
the
related
notes,
and
the
financial
highlights
for
each
of
the
periods
indicated
therein
(collectively
referred
to
as
the
“financial
statements”).
In
our
opinion,
the
financial
statements
present
fairly,
in
all
material
respects,
the
financial
position
of
each
of
the
Funds listed
in
the
table
below
as
of
July
31,
2024,
the
results
of
each
of
their
operations
for
the
year
then
ended,
the
changes
in
each
of
their
net
assets
for
each
of
the
two
years
in
the
period
ended
July
31,
2024
and
each
of
the
financial
highlights
for
each of
the
periods
indicated
therein
in
conformity
with
accounting
principles
generally
accepted
in
the
United
States
of
America.
Basis
for
Opinions
These
financial
statements
are
the
responsibility
of
the
Funds’
management.
Our
responsibility
is
to
express
an
opinion
on
the
Funds’
financial
statements
based
on
our
audits.
We
are
a
public
accounting
firm
registered
with
the
Public
Company
Accounting
Oversight
Board
(United
States)
(PCAOB)
and
are
required
to
be
independent
with
respect
to
the
Funds
in
accordance
with
the
U.S.
federal
securities
laws
and
the
applicable
rules
and
regulations
of
the
Securities
and
Exchange
Commission
and
the
PCAOB.
We
conducted
our
audits
of
these
financial
statements
in
accordance
with
the
standards
of
the
PCAOB.
Those
standards
require
that
we
plan
and
perform
the
audit
to
obtain
reasonable
assurance
about
whether
the
financial
statements
are
free
of
material
misstatement,
whether
due
to
error
or
fraud.
Our
audits
included
performing
procedures
to
assess
the
risks
of
material
misstatement
of
the
financial
statements,
whether
due
to
error
or
fraud,
and
performing
procedures
that
respond
to
those
risks.
Such
procedures
included
examining,
on
a
test
basis,
evidence
regarding
the
amounts
and
disclosures
in
the
financial
statements.
Our
audits
also
included
evaluating
the
accounting
principles
used
and
significant
estimates
made
by
management,
as
well
as
evaluating
the
overall
presentation
of
the
financial
statements.
Our
procedures
included
confirmation
of
securities
owned
as
of
July
31,
2024
by
correspondence
with
the
custodian
and
transfer
agent.
We
believe
that
our
audits
provide
a
reasonable
basis
for
our
opinions.
/s/PricewaterhouseCoopers
LLP
Philadelphia,
Pennsylvania
September
23,
2024
We
have
served
as
the
auditor
of
one
or
more
BlackRock
investment
companies
since
2000.
iShares
ESG
Aware
Aggressive
Allocation
ETF
iShares
ESG
Aware
Conservative
Allocation
ETF
iShares
ESG
Aware
Growth
Allocation
ETF
iShares
ESG
Aware
Moderate
Allocation
ETF
Important
Tax
Information
(unaudited)
2024
iShares
Annual
Financial
Statements
The
following
amounts,
or
maximum
amounts
allowable
by
law,
are
hereby
designated
as
qualified
dividend
income
for
individuals
for
the
fiscal
year
ended
July
31,
2024:
The
Funds
intend
to
pass
through
to
their
shareholders
the
following
amounts,
or
maximum
amounts
allowable
by
law,
of
foreign
source
income
earned
and
foreign
taxes
paid
for
the
fiscal
year
ended
July
31,
2024:
The
following
percentages,
or
maximum
percentages
allowable
by
law,
of
ordinary
income
distributions
paid
during
the
fiscal
year
ended July
31,
2024
qualified
for
the
dividends-received
deduction
for
corporate
shareholders:
The
Funds
hereby
designate
the
following
amounts,
or
maximum
amounts
allowable
by
law,
as
interest
income
eligible
to
be
treated
as
a
Section
163(j)
interest
dividend
for
the
fiscal
year
ended
July
31,
2024:
The
Funds
hereby
designates
the
following
amounts,
or
maximum
amounts
allowable
by
law,
as
interest-related
dividends
eligible
for
exemption
from
U.S.
withholding
tax
for
nonresident
aliens
and
foreign
corporations
for
the
fiscal
year
ended July
31,
2024:
iShares
ETF
Qualified
Dividend
Income
ESG
Aware
Aggressive
Allocation
........................................................................................
$
357,606
ESG
Aware
Conservative
Allocation
......................................................................................
42,269
ESG
Aware
Growth
Allocation
..........................................................................................
203,453
ESG
Aware
Moderate
Allocation
.........................................................................................
39,446
iShares
ETF
Foreign
Source
Income
Earned
Foreign
Taxes
Paid
ESG
Aware
Aggressive
Allocation
.....................................................................
$
204,077
$
21,500
ESG
Aware
Conservative
Allocation
...................................................................
23,875
2,506
ESG
Aware
Growth
Allocation
.......................................................................
118,385
12,431
ESG
Aware
Moderate
Allocation
......................................................................
22,321
2,342
iShares
ETF
Dividends-Received
Deduction
ESG
Aware
Aggressive
Allocation
........................................................................................
32.66
%
ESG
Aware
Conservative
Allocation
......................................................................................
10.50
ESG
Aware
Growth
Allocation
..........................................................................................
23.12
ESG
Aware
Moderate
Allocation
.........................................................................................
14.36
iShares
ETF
Interest
Dividends
ESG
Aware
Aggressive
Allocation
........................................................................................
$
150,300
ESG
Aware
Conservative
Allocation
......................................................................................
164,041
ESG
Aware
Growth
Allocation
..........................................................................................
217,757
ESG
Aware
Moderate
Allocation
.........................................................................................
98,208
iShares
ETF
Interest-Related
Dividends
ESG
Aware
Aggressive
Allocation
........................................................................................
$
138,897
ESG
Aware
Conservative
Allocation
......................................................................................
151,467
ESG
Aware
Growth
Allocation
..........................................................................................
201,117
ESG
Aware
Moderate
Allocation
.........................................................................................
90,685
Premium/Discount
Information
Information
on
the
Fund’s
net
asset
value,
market
price,
premiums
and
discounts,
and
bid-ask
spreads
can
be
found
at
iShares.com
.
Regulation
under
the
Alternative
Investment
Fund
Managers
Directive
Not
applicable.
Electronic
Delivery
Shareholders
can
sign
up
for
e-mail
notifications
announcing
that
the
shareholder
report
or
prospectus
has
been
posted
on
the
iShares
website
at
iShares.com
.
Once
you
have
enrolled,
you
will
no
longer
receive
prospectuses
and
shareholder
reports
in
the
mail.
To
enroll
in
electronic
delivery:
•
Go
to
icsdelivery.com
.
•
If
your
brokerage
firm
is
not
listed,
electronic
delivery
may
not
be
available.
Please
contact
your
broker-dealer
or
financial
advisor.
Changes
in
and
Disagreements
with
Accountants
Not
applicable.
Proxy
Results
Not
applicable.
Remuneration
Paid
to
Trustees,
Officers,
and
Others
Because
BFA
has
agreed
in
the
Investment
Advisory
Agreements
to
cover
all
operating
expenses
of
the
Funds,
subject
to
certain
exclusions
as
provided
for
therein,
BFA
pays
the
compensation
to
each
Independent
Trustee
for
services
to
the
Funds
from
BFA's
investment
advisory
fees.
Availability
of
Portfolio
Holdings
Information
A
description
of
the
Trust’s
policies
and
procedures
with
respect
to
the
disclosure
of
the
Fund’s
portfolio
securities
is
available
in
the
Fund
Prospectus.
The
Fund
discloses
its
portfolio
holdings
daily
and
provides
information
regarding
its
top
holdings
in
Fund
fact
sheets
at
iShares.com
.
Board
Review
and
Approval
of
Investment
Advisory
Contract
2024
iShares
Annual
Financial
Statements
iShares
ESG
Aware
Aggressive
Allocation
ETF,
iShares
ESG
Aware
Conservative
Allocation
ETF,
iShares
ESG
Aware
Growth
Allocation
ETF,
iShares
ESG
Aware
Moderate
Allocation
ETF
(each
the
“Fund”)
Under
Section
15(c)
of
the
Investment
Company
Act
of
1940
(the
“1940
Act”),
the
Trust's
Board
of
Trustees
(the
“Board”),
including
a
majority
of
Board
Members
who
are
not
“interested
persons”
of
the
Trust
(as
that
term
is
defined
in
the
1940
Act)
(the
“Independent
Board
Members”),
is
required
annually
to
consider
the
approval
of
the
Investment
Advisory
Agreement
between
the
Trust
and
BFA
(the
“Advisory
Agreement”)
on
behalf
of
the
Fund.
The
Board’s
consideration
entails
a
year-long
process
whereby
the
Board
and
its
committees
(composed
solely
of
Independent
Board
Members)
assess
BlackRock’s
services
to
the
Fund,
including
investment
management;
fund
accounting;
administrative
and
shareholder
services;
oversight
of
the
Fund’s
service
providers;
risk
management
and
oversight;
and
legal
and
compliance
services;
including
the
ability
to
meet
applicable
legal
and
regulatory
requirements.
The
Independent
Board
Members
requested,
and
BFA
provided,
such
information
as
the
Independent
Board
Members,
with
advice
from
independent
counsel,
deemed
reasonably
necessary
to
evaluate
the
Advisory
Agreement.
At
meetings
held
on
May
6,
2024
and
May
17,
2024,
a
committee
composed
of
all
of
the
Independent
Board
Members
(the
“15(c)
Committee”),
with
independent
counsel,
met
with
management
and
reviewed
and
discussed
information
provided
in
response
to
initial
requests
of
the
15(c)
Committee
and/or
its
independent
counsel.
Prior
to
and
in
preparation
for
the
meeting,
the
Board
received
and
reviewed
materials
specifically
relating
to
matters
relevant
to
the
renewal
of
the
Advisory
Agreement.
Following
discussion,
the
15(c)
Committee
subsequently
requested
certain
additional
information,
which
management
agreed
to
provide.
At
a
meeting
held
on
June
4-5,
2024,
the
Board,
including
the
Independent
Board
Members,
reviewed
the
additional
information
provided
by
management
in
response
to
these
requests.
After
extensive
discussions
and
deliberations,
the
Board,
including
all
of
the
Independent
Board
Members,
approved
the
continuance
of
the
Advisory
Agreement
for
the
Fund,
based
on
a
review
of
qualitative
and
quantitative
information
provided
by
BFA
and
their
cumulative
experience
as
Board
Members.
The
Board
noted
its
satisfaction
with
the
extent
and
quality
of
information
provided
and
its
frequent
interactions
with
management,
as
well
as
the
detailed
responses
and
other
information
provided
by
BFA.
The
Independent
Board
Members
were
advised
by
their
independent
counsel
throughout
the
process,
including
about
the
legal
standards
applicable
to
their
review.
In
approving
the
continuance
of
the
Advisory
Agreement
for
the
Fund,
the
Board,
including
the
Independent
Board
Members,
considered
various
factors,
including:
(i)
the
expenses
and
performance
of
the
Fund;
(ii)
the
nature,
extent
and
quality
of
the
services
provided
by
BFA;
(iii)
the
costs
of
services
provided
to
the
Fund
and
profits
realized
by
BFA
and
its
affiliates;
(iv)
potential
economies
of
scale
and
the
sharing
of
related
benefits;
(v)
the
fees
and
services
provided
for
other
comparable
funds/accounts
managed
by
BFA
and
its
affiliates;
and
(vi)
other
benefits
to
BFA
and/or
its
affiliates.
The
Board
Members
did
not
identify
any
particular
information
or
any
single
factor
as
determinative,
and
each
Board
Member
may
have
attributed
different
weights
to
the
various
matters
and
factors
considered.
The
material
factors,
considerations
and
conclusions
that
formed
the
basis
for
the
Board,
including
the
Independent
Board
Members,
to
approve
the
continuance
of
the
Advisory
Agreement
are
discussed
below.
Expenses
and
Performance
of
the
Fund:
The
Board
reviewed
statistical
information
prepared
by
Broadridge
Financial
Solutions,
Inc.
(“Broadridge”),
an
independent
provider
of
investment
company
data,
regarding
the
expense
ratio
components,
including
gross
and
net
total
expenses,
fees
and
expenses
of
other
fund(s)
in
which
the
Fund
invests
(if
applicable),
and
waivers/reimbursements
(if
applicable)
of
the
Fund
in
comparison
with
the
same
information
for
other
ETFs,
objectively
selected
by
Broadridge
as
comprising
the
Fund’s
applicable
expense
peer
group
pursuant
to
Broadridge’s
proprietary
ETF
methodology
(the
“Peer
Group”).
The
Board
was
provided
with
a
detailed
description
of
the
proprietary
ETF
methodology
used
by
Broadridge
to
determine
the
Fund’s
Peer
Group.
The
Board
noted
that,
due
to
the
limitations
in
providing
comparable
funds
in
the
Peer
Group,
the
statistical
information
provided
in
Broadridge’s
report
may
or
may
not
provide
meaningful
direct
comparisons
to
the
Fund
in
all
instances.
The
Board
also
noted
that
the
investment
advisory
fee
rate
and
overall
expenses
(net
of
any
waivers
and
reimbursements)
for
the
Fund
were
lower
than
the
median
of
the
investment
advisory
fee
rates
and
overall
expenses
(net
of
any
waivers
and
reimbursements)
of
the
funds
in
its
Peer
Group,
excluding
iShares
funds.
In
addition,
to
the
extent
that
any
of
the
comparison
funds
included
in
the
Peer
Group,
excluding
iShares
funds,
track
the
same
index
as
the
Fund,
Broadridge
also
provided,
and
the
Board
reviewed,
a
comparison
of
the
Fund’s
performance
for
the
one-year,
three-year,
five-year,
ten-year,
and
since
inception
periods,
as
applicable,
and
for
the
quarter
ended
December
31,
2023,
to
that
of
such
relevant
comparison
fund(s)
for
the
same
periods.
The
Board
noted
that
the
Fund
seeks
to
track
its
specified
underlying
index
and
that,
during
the
year,
the
Board
received
periodic
reports
on
the
Fund’s
short-
and
longer-term
performance
in
comparison
with
its
underlying
index.
Such
periodic
comparative
performance
information,
including
additional
detailed
information
as
requested
by
the
Board,
was
also
considered.
The
Board
noted
that
the
Fund
generally
performed
in
line
with
its
underlying
index
over
the
relevant
periods.
Based
on
this
review,
the
other
relevant
factors
and
information
considered
at
the
meeting,
and
their
general
knowledge
of
ETF
pricing,
the
Board
concluded
that
the
investment
advisory
fee
rate
and
expense
level
and
the
historical
performance
of
the
Fund
supported
the
Board’s
approval
of
the
continuance
of
the
Advisory
Agreement
for
the
coming
year.
Nature,
Extent
and
Quality
of
Services
Provided:
Based
on
management’s
representations,
including
information
about
ongoing
enhancements
and
initiatives
with
respect
to
the
iShares
product
line
and
BFA’s
business,
including
with
respect
to
capital
markets
support
and
analysis,
technology,
portfolio
management,
product
design
and
quality,
compliance
and
risk
management,
global
public
policy
and
other
services,
the
Board
expected
that
there
would
be
no
diminution
in
the
scope
of
services
required
of
or
provided
by
BFA
under
the
Advisory
Agreement
for
the
coming
year
as
compared
with
the
scope
of
services
provided
by
BFA
during
prior
years.
In
reviewing
the
scope
of
these
services,
the
Board
considered
BFA’s
investment
philosophy
and
experience,
noting
that
BFA
and
its
affiliates
have
committed
significant
resources
over
time,
including
during
the
past
year,
to
support
the
iShares
funds
and
their
shareholders
and
have
made
significant
investments
into
the
iShares
business.
The
Board
also
considered
BFA’s
compliance
program
and
its
compliance
record
with
respect
to
the
Fund,
including
related
programs
implemented
pursuant
to
regulatory
requirements.
In
that
regard,
the
Board
noted
that
BFA
reports
to
the
Board
about
portfolio
management
and
compliance
matters
on
a
periodic
basis
in
connection
with
regularly
scheduled
meetings
of
the
Board,
and
on
other
occasions
as
necessary
and
appropriate,
and
has
provided
information
and
made
relevant
officers
and
other
employees
of
BFA
(and
its
affiliates)
available
as
needed
to
provide
further
assistance
with
these
matters.
The
Board
also
reviewed
the
background
and
experience
of
the
persons
responsible
for
the
day-to-day
management
of
the
Fund,
as
well
as
the
resources
available
to
them
in
managing
the
Fund.
In
addition
to
the
above
considerations,
the
Board
reviewed
and
considered
detailed
presentations
regarding
BFA’s
investment
performance,
investment
and
risk
management
processes
and
strategies
provided
at
the
May
6,
2024
meeting
and
throughout
the
year,
and
matters
related
to
BFA’s
portfolio
compliance
program
and
other
compliance
programs
and
services,
as
well
as
BlackRock’s
continued
investments
in
its
ETF
business.
Based
on
review
of
this
information,
and
the
performance
information
discussed
above,
the
Board
concluded
that
the
nature,
extent
and
quality
of
services
provided
to
the
Fund
under
the
Advisory
Agreement
supported
the
Board’s
approval
of
the
continuance
of
the
Advisory
Agreement
for
the
coming
year.
Board
Review
and
Approval
of
Investment
Advisory
Contract
(continued)
Board
Review
and
Approval
of
Investment
Advisory
Contract
Costs
of
Services
Provided
to
the
Fund
and
Profits
Realized
by
BFA
and
its
Affiliates:
The
Board
reviewed
information
about
the
estimated
profitability
to
BlackRock
in
managing
the
Fund,
based
on
the
fees
payable
to
BFA
and
its
affiliates
(including
fees
under
the
Advisory
Agreement),
and
other
sources
of
revenue
and
expense
to
BFA
and
its
affiliates
from
the
Fund’s
operations
for
the
last
calendar
year.
The
Board
reviewed
BlackRock’s
methodology
for
calculating
estimated
profitability
of
the
iShares
funds,
noting
that
the
15(c)
Committee
and
the
Board
had
focused
on
the
methodology
and
profitability
presentation.
The
Board
recognized
that
profitability
may
be
affected
by
numerous
factors,
including,
among
other
things,
fee
waivers
by
BFA,
the
types
of
funds
managed,
expense
allocations
and
business
mix.
The
Board
thus
recognized
that
calculating
and
comparing
profitability
at
individual
fund
levels
is
challenging.
The
Board
discussed
with
management
the
sources
of
direct
and
ancillary
revenue,
including
the
revenues
to
BTC,
a
BlackRock
affiliate,
from
securities
lending
by
the
Fund.
The
Board
also
discussed
BFA’s
estimated
profit
margin
as
reflected
in
the
Fund’s
profitability
analysis
and
reviewed
information
regarding
potential
economies
of
scale
(as
discussed
below).
Based
on
this
review,
the
Board
concluded
that
the
information
considered
with
respect
to
the
profits
realized
by
BFA
and
its
affiliates
under
the
Advisory
Agreement
and
from
other
relationships
between
the
Fund
and
BFA
and/or
its
affiliates,
if
any,
and
related
costs
of
the
services
provided
as
well
as
the
other
factors
considered
at
the
meeting,
supported
the
Board’s
approval
of
the
continuance
of
the
Advisory
Agreement
for
the
coming
year.
Economies
of
Scale:
The
Board
reviewed
information
and
considered
the
extent
to
which
economies
of
scale
might
be
realized
as
the
assets
of
the
Fund
increase,
noting
that
the
issue
of
potential
economies
of
scale
had
been
focused
on
by
the
15(c)
Committee
and
the
Board
during
their
meetings
and
addressed
by
management.
The
15(c)
Committee
and
the
Board
received
information
regarding
BlackRock’s
historical
estimated
profitability
(as
discussed
above),
including
BFA’s
and
its
affiliates’
estimated
costs
in
providing
services.
The
estimated
cost
information
distinguished,
among
other
things,
between
fixed
and
variable
costs,
and
showed
how
the
level
and
nature
of
fixed
and
variable
costs
may
impact
the
existence
or
size
of
scale
benefits,
with
the
Board
recognizing
that
potential
economies
of
scale
are
difficult
to
measure.
The
15(c)
Committee
and
the
Board
reviewed
information
provided
by
BFA
regarding
the
sharing
of
scale
benefits
with
the
iShares
funds
through
various
means,
including,
as
applicable,
through
breakpoints,
waivers,
or
other
fee
reductions,
as
well
as
through
additional
investment
in
the
iShares
business,
including
enhancements
to
or
the
provision
of
additional
infrastructure
and
services
to
the
iShares
funds
and
their
shareholders
and,
with
respect
to
New
Funds,
set
management
fees
at
levels
that
anticipate
scale
over
time.
The
Board
noted
that
the
Advisory
Agreement
for
the
Fund
did
not
provide
for
breakpoints
in
the
Fund’s
investment
advisory
fee
rate
as
the
assets
of
the
Fund
increase.
However,
the
Board
noted
that
it
would
continue
to
assess
the
appropriateness
of
adding
breakpoints
in
the
future.
The
Board
concluded
that
this
review
of
potential
economies
of
scale
and
the
sharing
of
related
benefits,
as
well
as
the
other
factors
considered
at
the
meeting,
supported
the
Board’s
approval
of
the
continuance
of
the
Advisory
Agreement
for
the
coming
year.
Fees
and
Services
Provided
for
Other
Comparable
Funds/Accounts
Managed
by
BFA
and
its
Affiliates:
The
Board
received
and
considered
information
regarding
the
investment
advisory/management
fee
rates
for
other
funds/accounts
in
the
U.S.
for
which
BFA
(or
its
affiliates)
provides
investment
advisory/management
services,
including
open-end
funds
registered
under
the
1940
Act
(including
sub-advised
funds),
collective
trust
funds
and
institutional
separate
accounts
(collectively,
the
“Other
Accounts”).
The
Board
received
detailed
information
regarding
how
the
Other
Accounts
generally
differ
from
the
Fund,
including
in
terms
of
the
types
of
services
and
generally
more
extensive
character
and
scope
of
services
provided
to
the
Fund,
as
well
as
other
significant
differences.
In
that
regard,
the
Board
considered
that
the
pricing
of
services
to
institutional
clients
is
typically
based
on
a
number
of
factors
beyond
the
nature
and
extent
of
the
specific
services
to
be
provided
and
often
depends
on
the
overall
relationship
between
the
client
and
its
affiliates
and
the
adviser
and
its
affiliates.
In
addition,
the
Board
considered
the
relative
complexity
and
inherent
risks
and
challenges
of
managing
and
providing
other
services
to
the
Fund,
as
a
publicly
traded
investment
vehicle,
as
compared
to
the
Other
Accounts,
particularly
those
that
are
institutional
clients,
in
light
of
differing
regulatory
requirements
and
client-imposed
mandates.
The
Board
acknowledged
BFA’s
representation
that
the
iShares
funds
are
fundamentally
different
investment
vehicles
from
the
Other
Accounts
in
its
consideration
of
relevant
qualitative
and
quantitative
comparative
information
provided.
The
Board
noted
that
BFA
and
its
affiliates
do
not
manage
Other
Accounts
with
substantially
the
same
investment
objective
and
strategy
as
the
Fund
and
that
track
the
same
index
as
the
Fund.
The
Board
also
acknowledged
management’s
assertion
that,
for
certain
iShares
funds,
and
for
client
segmentation
purposes,
BlackRock
has
launched
an
iShares
fund
that
may
provide
a
similar
investment
exposure
at
a
lower
investment
advisory
fee
rate.
The
Board
considered
the
“all-inclusive”
nature
of
the
Fund’s
advisory
fee
structure,
and
the
Fund’s
expenses
borne
by
BFA
under
this
arrangement
and
noted
that
the
investment
advisory
fee
rate
under
the
Advisory
Agreement
for
the
Fund
was
generally
higher
than
the
investment
advisory/management
fee
rates
for
certain
of
the
Other
Accounts
(particularly
institutional
clients)
and
concluded
that
the
differences
appeared
to
be
consistent
with
the
factors
discussed.
Other
Benefits
to
BFA
and/or
its
Affiliates:
The
Board
reviewed
other
benefits
or
ancillary
revenue
received
by
BFA
and/or
its
affiliates
in
connection
with
the
services
provided
to
the
Fund
by
BFA,
both
direct
and
indirect,
including,
but
not
limited
to,
payment
of
revenue
to
BTC,
the
Fund’s
securities
lending
agent,
for
loaning
portfolio
securities,
as
applicable
(which
was
included
in
the
profit
margins
reviewed
by
the
Board
pursuant
to
BFA’s
estimated
profitability
methodology),
payment
of
advisory
fees
or
other
fees
to
BFA
(or
its
affiliates)
in
connection
with
any
investments
by
the
Fund
in
other
funds
(including
cash
sweep
vehicles)
for
which
BFA
(or
its
affiliates)
provides
investment
advisory
services
or
other
services,
and
BlackRock’s
profile
in
the
investment
community.
The
Board
further
considered
other
direct
benefits
that
might
accrue
to
BFA,
including
actual
and
potential
reductions
in
the
Fund’s
expenses
that
are
borne
by
BFA
under
the
“all-inclusive”
management
fee
arrangement,
due
in
part
to
the
size
and
scope
of
BFA’s
investment
operations
servicing
the
Fund
(and
other
funds
in
the
iShares
complex)
as
well
as
in
response
to
a
changing
market
environment.
The
Board
also
reviewed
and
considered
information
provided
by
BFA
concerning
authorized
participant
primary
market
order
processing
services
that
are
provided
by
BlackRock
Investments,
LLC
(“BRIL”),
an
affiliate
of
BFA,
and
paid
for
by
authorized
participants
under
the
ETF
Servicing
Platform.
The
Board
also
noted
the
revenue
received
by
BFA
and/or
its
affiliates
pursuant
to
an
agreement
that
permits
a
service
provider
to
use
certain
portions
of
BlackRock’s
technology
platform
to
service
accounts
managed
by
BFA
and/or
its
affiliates,
including
the
iShares
funds.
The
Board
noted
that
BFA
generally
does
not
use
soft
dollars
or
consider
the
value
of
research
or
other
services
that
may
be
provided
to
BFA
(including
its
affiliates)
in
selecting
brokers
for
portfolio
transactions
for
the
Fund.
The
Board
concluded
that
any
such
ancillary
benefits
would
not
be
disadvantageous
to
the
Fund
and
thus
would
not
alter
the
Board’s
conclusion
with
respect
to
the
appropriateness
of
approving
the
continuance
of
the
Advisory
Agreement
for
the
coming
year.
Conclusion:
Based
on
a
review
of
the
factors
described
above,
as
well
as
such
other
factors
as
deemed
appropriate
by
the
Board,
the
Board,
including
all
of
the
Independent
Board
Members,
determined
that
the
Fund’s
investment
advisory
fee
rate
under
the
Advisory
Agreement
does
not
constitute
a
fee
that
is
so
disproportionately
large
as
to
bear
no
reasonable
relationship
to
the
services
rendered
and
that
could
not
have
been
the
product
of
arm’s-length
bargaining,
and
concluded
to
approve
the
continuance
of
the
Advisory
Agreement
for
the
coming
year.
Glossary
of
Terms
Used
in
this
Report
2024
iShares
Annual
Financial
Statements
Portfolio
Abbreviation
EAFE
Europe,
Australasia
and
Far
East
EM
Emerging
Markets
ESG
Environmental,
Social
And
Governance
ETF
Exchange-Traded
Fund
MSCI
Morgan
Stanley
Capital
International
Want
to
know
more?
iShares.com
|
1-800-474-2737
This
report
is
intended
for
the
Funds’
shareholders.
It
may
not
be
distributed
to
prospective
investors
unless
it
is
preceded
or
accompanied
by
the
current
prospectus.
Investing
involves
risk,
including
possible
loss
of
principal.
The
iShares
Funds
are
distributed
by
BlackRock
Investments,
LLC
(together
with
its
affiliates,
“BlackRock”).
The
iShares
Funds
are
not
sponsored,
endorsed,
issued,
sold
or
promoted
by BlackRock
Index
Services,
LLC,
nor
does
this
company
make
any
representation
regarding
the
advisability
of
investing
in
the
iShares
Funds.
BlackRock
is
affiliated
with
the
company
listed
above.
©2024
BlackRock,
Inc.
All
rights
reserved.
iSHARES
and
BLACKROCK
are
registered
trademarks
of
BlackRock,
Inc.
or
its
subsidiaries.
All
other
marks
are
the
property
of
their
respective
owners.
2024
Annual
Financial
Statements
iShares
Trust
iShares
MSCI
USA
Small-Cap
Min
Vol
Factor
ETF
|
SMMV
|Cboe
BZX
iShares
U.S.
Equity
Factor
ETF
|
LRGF
|
NYSE
Arca
iShares
U.S.
Small-Cap
Equity
Factor
ETF
|
SMLF
|
NYSE
Arca
iShares
U.S.
Tech
Breakthrough
Multisector
ETF
|
TECB
|
NYSE
Arca
Schedules
of
Investments
.................................................................................................
3
Statements
of
Assets
and
Liabilities
...........................................................................................
32
Statements
of
Operations
.................................................................................................
33
Statements
of
Changes
in
Net
Assets
..........................................................................................
34
Financial
Highlights
.....................................................................................................
36
Notes
to
Financial
Statements
...............................................................................................
40
Report
of
Independent
Registered
Public
Accounting
Firm
..............................................................................
50
Important
Tax
Information
.................................................................................................
51
Additional
Information
....................................................................................................
52
Board
Review
and
Approval
of
Investment
Advisory
Contract
............................................................................
53
Glossary
of
Terms
Used
in
this
Report
..........................................................................................
58
Schedule
of
Investments
July
31,
2024
iShares
®
MSCI
USA
Small-Cap
Min
Vol
Factor
ETF
(Percentages
shown
are
based
on
Net
Assets)
Security
Shares
Shares
Value
Common
Stocks
Aerospace
&
Defense
—
1.9%
BWX
Technologies,
Inc.
...............
55,096
$
5,481,501
Curtiss-Wright
Corp.
..................
19,309
5,690,362
Leonardo
DRS,
Inc.
(a)
(b)
................
92,830
2,617,806
National
Presto
Industries,
Inc.
...........
9,414
719,889
V2X,
Inc.
(b)
........................
21,762
1,134,453
15,644,011
Automobile
Components
—
1.3%
Dorman
Products,
Inc.
(b)
...............
5,112
518,203
Garrett
Motion,
Inc.
(a)
(b)
................
141,841
1,242,527
Gentex
Corp.
......................
264,342
8,210,463
Standard
Motor
Products,
Inc.
...........
33,603
1,099,826
11,071,019
Banks
—
0.6%
Bank
First
Corp.
....................
17,312
1,604,822
City
Holding
Co.
....................
10,091
1,230,093
Westamerica
Bancorp
................
37,887
2,044,383
4,879,298
Beverages
—
0.1%
Coca-Cola
Consolidated,
Inc.
............
429
491,587
Biotechnology
—
7.4%
(b)
ACADIA
Pharmaceuticals,
Inc.
...........
25,940
493,379
ADMA
Biologics,
Inc.
.................
98,406
1,208,426
Agios
Pharmaceuticals,
Inc.
.............
16,586
769,590
Alkermes
plc
.......................
221,612
6,054,440
AnaptysBio,
Inc.
....................
15,952
555,768
Arcellx,
Inc.
(a)
......................
11,123
687,513
ARS
Pharmaceuticals,
Inc.
.............
57,309
622,949
Biomea
Fusion,
Inc.
(a)
.................
34,888
194,326
Cargo
Therapeutics,
Inc.
...............
19,815
337,449
CG
oncology,
Inc.
...................
13,900
463,565
Crinetics
Pharmaceuticals,
Inc.
..........
43,179
2,293,668
Cullinan
Therapeutics,
Inc.
.............
17,406
336,806
Day
One
Biopharmaceuticals,
Inc.
........
26,368
377,326
Disc
Medicine,
Inc.
...................
22,780
983,185
Dynavax
Technologies
Corp.
(a)
...........
211,777
2,369,785
Exelixis,
Inc.
.......................
446,113
10,461,350
Halozyme
Therapeutics,
Inc.
(a)
...........
23,350
1,290,321
Ideaya
Biosciences,
Inc.
...............
79,001
3,400,993
Immunome,
Inc.
.....................
43,068
663,678
Insmed,
Inc.
.......................
77,394
5,630,414
Ionis
Pharmaceuticals,
Inc.
.............
116,543
5,764,217
Ironwood
Pharmaceuticals,
Inc.
,
Class
A
....
190,062
1,298,123
iTeos
Therapeutics,
Inc.
(a)
..............
22,570
397,006
Keros
Therapeutics,
Inc.
...............
8,002
401,380
Kiniksa
Pharmaceuticals
International
plc
....
67,614
1,798,532
Krystal
Biotech,
Inc.
..................
6,861
1,430,244
Mirum
Pharmaceuticals,
Inc.
............
54,781
2,221,370
Ultragenyx
Pharmaceutical,
Inc.
..........
35,353
1,591,592
Vaxcyte,
Inc.
(a)
......................
48,597
3,833,817
Xenon
Pharmaceuticals,
Inc.
(a)
...........
76,126
3,283,314
Zymeworks,
Inc.
....................
76,762
802,931
62,017,457
Broadline
Retail
—
0.3%
Ollie's
Bargain
Outlet
Holdings,
Inc.
(b)
......
23,026
2,248,259
Building
Products
—
0.4%
CSW
Industrials,
Inc.
.................
9,982
3,238,360
Capital
Markets
—
1.7%
Diamond
Hill
Investment
Group,
Inc.
.......
5,225
831,924
Houlihan
Lokey,
Inc.
,
Class
A
............
18,764
2,819,291
Security
Shares
Shares
Value
Capital
Markets
(continued)
Interactive
Brokers
Group,
Inc.
,
Class
A
.....
27,517
$
3,281,953
PJT
Partners,
Inc.
,
Class
A
.............
11,867
1,577,599
Virtu
Financial,
Inc.
,
Class
A
.............
128,411
3,508,189
WisdomTree,
Inc.
....................
207,293
2,475,078
14,494,034
Chemicals
—
1.4%
Ashland,
Inc.
.......................
26,947
2,604,428
Hawkins,
Inc.
......................
20,014
2,079,455
NewMarket
Corp.
....................
12,181
6,831,957
11,515,840
Commercial
Services
&
Supplies
—
2.2%
Brady
Corp.
,
Class
A,
NVS
.............
75,070
5,375,763
Casella
Waste
Systems,
Inc.
,
Class
A
(a)
(b)
....
28,931
2,996,094
CoreCivic,
Inc.
(b)
....................
68,871
960,062
Ennis,
Inc.
........................
41,608
991,935
GEO
Group,
Inc.
(The)
(b)
...............
30,014
435,203
Liquidity
Services,
Inc.
(b)
...............
37,970
853,186
MSA
Safety,
Inc.
....................
22,769
4,295,372
UniFirst
Corp.
......................
14,658
2,851,567
18,759,182
Communications
Equipment
—
0.4%
(b)
Ciena
Corp.
.......................
19,889
1,048,946
NETGEAR,
Inc.
.....................
30,414
482,974
NetScout
Systems,
Inc.
................
72,997
1,485,489
3,017,409
Construction
&
Engineering
—
1.1%
Argan,
Inc.
........................
21,033
1,660,135
MDU
Resources
Group,
Inc.
............
288,319
7,767,314
9,427,449
Construction
Materials
—
0.2%
United
States
Lime
&
Minerals,
Inc.
........
18,760
1,595,538
Consumer
Finance
—
0.6%
FirstCash
Holdings,
Inc.
...............
41,484
4,629,614
Consumer
Staples
Distribution
&
Retail
—
3.4%
BJ's
Wholesale
Club
Holdings,
Inc.
(b)
.......
73,992
6,508,336
Casey's
General
Stores,
Inc.
............
17,419
6,755,785
Grocery
Outlet
Holding
Corp.
(b)
...........
149,145
2,917,276
Ingles
Markets,
Inc.
,
Class
A
............
24,315
1,970,731
Maplebear,
Inc.
(b)
....................
12,602
434,643
SpartanNash
Co.
....................
60,852
1,285,194
Sprouts
Farmers
Market,
Inc.
(b)
...........
67,245
6,717,103
Weis
Markets,
Inc.
...................
20,017
1,510,283
28,099,351
Containers
&
Packaging
—
2.2%
AptarGroup,
Inc.
....................
79,067
11,621,268
Graphic
Packaging
Holding
Co.
..........
37,050
1,115,205
Silgan
Holdings,
Inc.
..................
23,717
1,219,765
Sonoco
Products
Co.
.................
78,742
4,245,769
18,202,007
Diversified
Consumer
Services
—
3.8%
Adtalem
Global
Education,
Inc.
(b)
.........
14,578
1,143,061
Graham
Holdings
Co.
,
Class
B
...........
5,720
4,432,142
Grand
Canyon
Education,
Inc.
(b)
..........
38,295
5,972,105
H&R
Block,
Inc.
.....................
69,598
4,032,508
Laureate
Education,
Inc.
...............
226,442
3,509,851
OneSpaWorld
Holdings
Ltd.
(b)
...........
120,040
1,931,444
Perdoceo
Education
Corp.
..............
109,286
2,709,200
Service
Corp.
International
.............
27,045
2,161,166
Strategic
Education,
Inc.
...............
7,543
795,032
2024
iShares
Annual
Financial
Statements
Schedule
of
Investments
(continued)
July
31,
2024
iShares
®
MSCI
USA
Small-Cap
Min
Vol
Factor
ETF
(Percentages
shown
are
based
on
Net
Assets)
Security
Shares
Shares
Value
Diversified
Consumer
Services
(continued)
Stride,
Inc.
(a)
(b)
......................
61,357
$
4,661,905
Universal
Technical
Institute,
Inc.
(b)
........
27,581
522,384
31,870,798
Diversified
Telecommunication
Services
—
1.3%
Anterix,
Inc.
(a)
(b)
.....................
18,053
726,814
Cogent
Communications
Holdings,
Inc.
(a)
....
74,304
5,245,119
Consolidated
Communications
Holdings,
Inc.
(b)
125,910
579,186
IDT
Corp.
,
Class
B
...................
27,846
1,064,552
Liberty
Global
Ltd.
,
Class
C,
NVS
(a)
(b)
.......
94,079
1,891,929
Shenandoah
Telecommunications
Co.
......
77,799
1,656,341
11,163,941
Electric
Utilities
—
5.0%
ALLETE,
Inc.
......................
35,716
2,303,682
IDACORP,
Inc.
.....................
84,641
8,273,658
MGE
Energy,
Inc.
....................
39,083
3,433,051
OGE
Energy
Corp.
...................
243,749
9,450,149
Pinnacle
West
Capital
Corp.
............
88,257
7,553,916
PNM
Resources,
Inc.
.................
143,851
5,981,324
Portland
General
Electric
Co.
............
94,610
4,482,622
41,478,402
Electronic
Equipment,
Instruments
&
Components
—
1.9%
Avnet,
Inc.
........................
60,552
3,255,276
Benchmark
Electronics,
Inc.
............
60,483
2,895,321
Insight
Enterprises,
Inc.
(a)
(b)
.............
17,590
3,948,955
OSI
Systems,
Inc.
(b)
..................
4,091
605,386
PC
Connection,
Inc.
..................
19,382
1,387,170
Plexus
Corp.
(b)
......................
6,072
778,248
Rogers
Corp.
(a)
(b)
....................
2,783
340,027
TD
SYNNEX
Corp.
...................
25,082
2,989,022
16,199,405
Energy
Equipment
&
Services
—
0.1%
Atlas
Energy
Solutions,
Inc.
.............
21,899
465,135
Entertainment
—
2.0%
Atlanta
Braves
Holdings,
Inc.
,
Class
A
(b)
.....
11,252
516,692
Atlanta
Braves
Holdings,
Inc.
,
Class
C,
NVS
(b)
75,727
3,288,823
Endeavor
Group
Holdings,
Inc.
,
Class
A
(a)
...
57,962
1,589,318
IMAX
Corp.
(b)
......................
24,338
513,532
Madison
Square
Garden
Sports
Corp.
(b)
.....
25,828
5,176,189
Marcus
Corp.
(The)
..................
43,679
549,919
TKO
Group
Holdings,
Inc.
,
Class
A
........
48,826
5,339,123
16,973,596
Financial
Services
—
0.2%
Enact
Holdings,
Inc.
..................
21,337
726,098
International
Money
Express,
Inc.
(b)
........
24,472
543,523
1,269,621
Food
Products
—
5.0%
Cal-Maine
Foods,
Inc.
.................
70,259
5,028,437
Flowers
Foods,
Inc.
..................
337,253
7,594,937
Ingredion,
Inc.
......................
45,848
5,702,116
J
&
J
Snack
Foods
Corp.
...............
25,715
4,338,120
John
B
Sanfilippo
&
Son,
Inc.
............
14,460
1,516,420
Lancaster
Colony
Corp.
...............
15,682
3,027,567
Pilgrim's
Pride
Corp.
(b)
................
42,360
1,746,503
Post
Holdings,
Inc.
(b)
..................
64,015
7,000,680
Seaboard
Corp.
.....................
175
568,384
Seneca
Foods
Corp.
,
Class
A
(b)
..........
8,497
512,709
Simply
Good
Foods
Co.
(The)
(b)
..........
73,766
2,502,143
TreeHouse
Foods,
Inc.
(b)
...............
18,859
759,640
Utz
Brands,
Inc.
,
Class
A
...............
26,440
392,370
Security
Shares
Shares
Value
Food
Products
(continued)
Vital
Farms,
Inc.
(b)
...................
25,232
$
920,716
41,610,742
Gas
Utilities
—
0.7%
Chesapeake
Utilities
Corp.
.............
4,988
588,734
New
Jersey
Resources
Corp.
............
44,081
2,060,787
ONE
Gas,
Inc.
......................
16,411
1,142,698
Southwest
Gas
Holdings,
Inc.
...........
20,815
1,543,640
Spire,
Inc.
.........................
8,710
579,999
5,915,858
Ground
Transportation
—
1.7%
Landstar
System,
Inc.
.................
39,156
7,449,429
Schneider
National,
Inc.
,
Class
B
.........
95,322
2,565,115
Werner
Enterprises,
Inc.
...............
101,550
3,979,744
13,994,288
Health
Care
Equipment
&
Supplies
—
0.3%
iRadimed
Corp.
.....................
7,417
346,448
LeMaitre
Vascular,
Inc.
................
9,902
860,385
Varex
Imaging
Corp.
(b)
................
69,134
1,022,492
2,229,325
Health
Care
Providers
&
Services
—
7.7%
Acadia
Healthcare
Co.,
Inc.
(b)
............
15,198
985,590
Addus
HomeCare
Corp.
(b)
..............
26,940
3,269,438
Amedisys,
Inc.
(b)
....................
54,379
5,331,861
Chemed
Corp.
......................
20,942
11,940,291
CorVel
Corp.
(a)
(b)
.....................
2,151
659,927
Cross
Country
Healthcare,
Inc.
(b)
.........
57,938
1,056,789
Encompass
Health
Corp.
..............
96,671
8,984,603
Ensign
Group,
Inc.
(The)
...............
65,496
9,218,562
HealthEquity,
Inc.
(a)
(b)
.................
110,199
8,648,418
National
HealthCare
Corp.
..............
22,901
3,118,200
National
Research
Corp.
...............
25,463
649,052
Option
Care
Health,
Inc.
(b)
..............
77,009
2,286,397
Patterson
Cos.,
Inc.
..................
136,252
3,440,363
Premier,
Inc.
,
Class
A
.................
202,292
4,244,086
US
Physical
Therapy,
Inc.
..............
4,949
482,527
64,316,104
Health
Care
REITs
—
1.3%
CareTrust
REIT,
Inc.
..................
190,628
5,139,331
LTC
Properties,
Inc.
..................
24,298
867,681
Omega
Healthcare
Investors,
Inc.
.........
132,154
4,810,406
10,817,418
Health
Care
Technology
—
0.1%
HealthStream,
Inc.
...................
39,132
1,162,612
Hotels,
Restaurants
&
Leisure
—
1.5%
Accel
Entertainment,
Inc.
,
Class
A
(b)
.......
79,250
966,850
Choice
Hotels
International,
Inc.
(a)
.........
11,764
1,499,322
Target
Hospitality
Corp.
(b)
..............
44,002
411,859
Texas
Roadhouse,
Inc.
................
27,896
4,870,920
Wendy's
Co.
(The)
...................
296,901
5,026,534
12,775,485
Household
Products
—
0.4%
Reynolds
Consumer
Products,
Inc.
........
106,849
2,972,539
Insurance
—
12.9%
AMERISAFE,
Inc.
...................
31,848
1,512,143
Axis
Capital
Holdings
Ltd.
..............
149,116
11,295,537
Employers
Holdings,
Inc.
...............
44,960
2,158,530
Enstar
Group
Ltd.
(b)
..................
13,227
4,290,839
Hamilton
Insurance
Group
Ltd.
,
Class
B
(b)
...
31,859
555,302
Hanover
Insurance
Group,
Inc.
(The)
......
61,899
8,510,494
Schedule
of
Investments
(continued)
July
31,
2024
iShares
®
MSCI
USA
Small-Cap
Min
Vol
Factor
ETF
(Percentages
shown
are
based
on
Net
Assets)
Security
Shares
Shares
Value
Insurance
(continued)
HCI
Group,
Inc.
.....................
7,136
$
672,639
Horace
Mann
Educators
Corp.
...........
70,904
2,451,151
Mercury
General
Corp.
................
47,632
2,851,728
Old
Republic
International
Corp.
..........
382,238
13,233,080
Reinsurance
Group
of
America,
Inc.
.......
44,324
9,991,959
RenaissanceRe
Holdings
Ltd.
...........
31,853
7,387,029
RLI
Corp.
.........................
64,067
9,647,850
Ryan
Specialty
Holdings,
Inc.
,
Class
A
......
87,523
5,390,542
Safety
Insurance
Group,
Inc.
............
25,215
2,157,143
Selective
Insurance
Group,
Inc.
..........
104,300
9,420,376
SiriusPoint
Ltd.
(b)
....................
108,727
1,562,407
Skyward
Specialty
Insurance
Group,
Inc.
(b)
...
58,281
2,306,179
Tiptree,
Inc.
.......................
34,570
682,758
United
Fire
Group,
Inc.
................
38,320
858,751
Universal
Insurance
Holdings,
Inc.
........
48,860
967,917
Unum
Group
.......................
38,582
2,219,622
White
Mountains
Insurance
Group
Ltd.
.....
4,371
7,806,606
107,930,582
Interactive
Media
&
Services
—
0.3%
Yelp,
Inc.
(b)
........................
61,428
2,237,822
IT
Services
—
0.2%
Hackett
Group,
Inc.
(The)
..............
39,623
1,080,915
Squarespace,
Inc.
,
Class
A
(b)
............
9,346
413,000
1,493,915
Leisure
Products
—
0.2%
Smith
&
Wesson
Brands,
Inc.
............
26,096
431,889
Sturm
Ruger
&
Co.,
Inc.
...............
29,298
1,321,633
1,753,522
Machinery
—
0.4%
Donaldson
Co.,
Inc.
..................
36,323
2,717,687
Enerpac
Tool
Group
Corp.
,
Class
A
........
16,491
662,938
3,380,625
Marine
Transportation
—
0.1%
Genco
Shipping
&
Trading
Ltd.
...........
18,300
355,203
Matson,
Inc.
.......................
4,617
612,722
967,925
Media
—
1.1%
Liberty
Media
Corp.-Liberty
SiriusXM
,
Class
A,
NVS
(a)
(b)
........................
48,429
1,095,464
New
York
Times
Co.
(The)
,
Class
A
........
67,999
3,644,067
Scholastic
Corp.
....................
17,337
543,168
TEGNA,
Inc.
.......................
254,524
4,054,567
9,337,266
Metals
&
Mining
—
1.8%
Arch
Resources,
Inc.
,
Class
A
...........
8,417
1,233,511
Ramaco
Resources,
Inc.
,
Class
A
.........
35,198
478,693
Royal
Gold,
Inc.
.....................
87,574
12,095,721
Warrior
Met
Coal,
Inc.
.................
21,565
1,490,357
15,298,282
Multi-Utilities
—
0.9%
Avista
Corp.
.......................
46,739
1,831,234
Northwestern
Energy
Group,
Inc.
.........
101,811
5,474,377
7,305,611
Office
REITs
—
0.4%
Equity
Commonwealth
(b)
...............
176,873
3,602,903
Oil,
Gas
&
Consumable
Fuels
—
5.0%
Antero
Midstream
Corp.
...............
210,895
3,028,452
CNX
Resources
Corp.
(a)
(b)
..............
41,768
1,105,599
Security
Shares
Shares
Value
Oil,
Gas
&
Consumable
Fuels
(continued)
CONSOL
Energy,
Inc.
(b)
...............
6,000
$
598,860
Delek
US
Holdings,
Inc.
...............
20,467
486,705
DT
Midstream,
Inc.
...................
100,040
7,539,014
Gulfport
Energy
Corp.
(b)
...............
16,781
2,470,331
Hess
Midstream
LP
,
Class
A
............
136,220
5,105,526
International
Seaways,
Inc.
.............
66,003
3,696,168
Kimbell
Royalty
Partners
LP
............
102,017
1,681,240
Kinetik
Holdings,
Inc.
,
Class
A
...........
65,879
2,732,661
PBF
Energy,
Inc.
,
Class
A
..............
15,972
650,859
Peabody
Energy
Corp.
................
17,636
391,696
Plains
GP
Holdings
LP
,
Class
A
..........
339,311
6,480,840
REX
American
Resources
Corp.
(b)
........
24,773
1,258,716
Viper
Energy,
Inc.
,
Class
A
.............
102,931
4,392,066
41,618,733
Paper
&
Forest
Products
—
0.1%
Clearwater
Paper
Corp.
(b)
..............
20,902
1,159,434
Pharmaceuticals
—
2.4%
ANI
Pharmaceuticals,
Inc.
(b)
.............
12,306
808,750
Collegium
Pharmaceutical,
Inc.
(a)
(b)
........
55,543
2,142,294
Corcept
Therapeutics,
Inc.
(a)
(b)
...........
51,072
1,974,954
Edgewise
Therapeutics,
Inc.
(b)
...........
21,801
371,271
Innoviva,
Inc.
(a)
(b)
....................
96,997
1,827,424
Intra-Cellular
Therapies,
Inc.
(b)
...........
8,599
676,913
Jazz
Pharmaceuticals
plc
(b)
.............
30,980
3,415,545
Liquidia
Corp.
(a)
(b)
....................
62,443
744,945
Perrigo
Co.
plc
.....................
48,412
1,368,607
Prestige
Consumer
Healthcare,
Inc.
(b)
......
83,086
5,883,320
Tarsus
Pharmaceuticals,
Inc.
(b)
...........
15,896
386,114
Theravance
Biopharma,
Inc.
(b)
...........
61,728
624,070
20,224,207
Professional
Services
—
5.1%
Barrett
Business
Services,
Inc.
...........
17,266
629,173
CACI
International,
Inc.
,
Class
A
(b)
........
15,280
7,051,415
CRA
International,
Inc.
................
11,740
2,052,152
Franklin
Covey
Co.
(b)
.................
18,032
788,179
FTI
Consulting,
Inc.
(b)
.................
27,763
6,051,501
Huron
Consulting
Group,
Inc.
(b)
...........
30,902
3,399,529
ICF
International,
Inc.
.................
9,813
1,443,492
KBR,
Inc.
.........................
64,602
4,301,847
Kelly
Services,
Inc.
,
Class
A,
NVS
........
50,383
1,185,512
Maximus,
Inc.
......................
26,003
2,415,419
Parsons
Corp.
(b)
.....................
80,032
7,312,524
Science
Applications
International
Corp.
....
18,545
2,306,998
Verra
Mobility
Corp.
,
Class
A
(b)
...........
121,249
3,653,232
42,590,973
Real
Estate
Management
&
Development
—
0.2%
FRP
Holdings,
Inc.
(a)
(b)
.................
23,686
712,712
RMR
Group,
Inc.
(The)
,
Class
A
..........
20,953
543,521
1,256,233
Retail
REITs
—
1.6%
Agree
Realty
Corp.
..................
169,623
11,698,898
NETSTREIT
Corp.
...................
112,782
1,857,520
13,556,418
Software
—
5.2%
A10
Networks,
Inc.
...................
97,335
1,274,115
Adeia,
Inc.
........................
37,043
435,255
Alarm.com
Holdings,
Inc.
(b)
.............
14,939
1,053,947
AvePoint,
Inc.
,
Class
A
(b)
...............
185,707
2,024,206
Blackbaud,
Inc.
(b)
....................
15,368
1,219,912
Box,
Inc.
,
Class
A
(b)
..................
17,837
501,576
CCC
Intelligent
Solutions
Holdings,
Inc.
(b)
....
448,851
4,605,211
2024
iShares
Annual
Financial
Statements
Schedule
of
Investments
(continued)
July
31,
2024
iShares
®
MSCI
USA
Small-Cap
Min
Vol
Factor
ETF
(Percentages
shown
are
based
on
Net
Assets)
Affiliates
Investments
in
issuers
considered
to
be
affiliate(s)
of
the
Fund
during
the year
ended
July
31,
2024
for
purposes
of
Section
2(a)(3)
of
the
Investment
Company
Act
of
1940,
as
amended,
were
as
follows:
Security
Shares
Shares
Value
Software
(continued)
Clearwater
Analytics
Holdings,
Inc.
,
Class
A
(b)
.
140,003
$
2,737,059
CommVault
Systems,
Inc.
(b)
.............
58,367
8,921,396
Daily
Journal
Corp.
(b)
.................
2,139
995,918
Dolby
Laboratories,
Inc.
,
Class
A
.........
100,307
7,900,179
Dropbox,
Inc.
,
Class
A
(b)
...............
91,466
2,187,867
Guidewire
Software,
Inc.
(b)
..............
4,286
643,200
InterDigital,
Inc.
.....................
14,785
1,815,007
LiveRamp
Holdings,
Inc.
(b)
..............
19,266
583,375
Mitek
Systems,
Inc.
(a)
(b)
................
33,860
450,677
N-able,
Inc.
(b)
.......................
85,794
1,195,968
Nutanix,
Inc.
,
Class
A
(b)
................
15,181
766,792
Progress
Software
Corp.
...............
67,923
3,966,703
43,278,363
Specialty
Retail
—
2.0%
Murphy
USA,
Inc.
(a)
..................
26,802
13,532,866
Valvoline,
Inc.
(b)
.....................
56,924
2,646,966
Winmark
Corp.
.....................
1,544
610,868
16,790,700
Trading
Companies
&
Distributors
—
1.0%
McGrath
RentCorp
...................
24,977
2,743,224
MSC
Industrial
Direct
Co.,
Inc.
,
Class
A
.....
61,219
5,445,430
8,188,654
Water
Utilities
—
0.5%
American
States
Water
Co.
.............
19,570
1,615,112
California
Water
Service
Group
..........
28,441
1,520,456
York
Water
Co.
(The)
.................
22,307
921,502
4,057,070
Wireless
Telecommunication
Services
—
0.1%
United
States
Cellular
Corp.
(a)
(b)
..........
15,721
845,004
Total
Common
Stocks
—
99
.7
%
(Cost:
$
687,285,772
)
..............................
831,419,926
Security
Shares
Shares
Value
Rights
Biotechnology
—
0.0%
Contra
Chinook
Therape,
CVR
(b)
(c)
........
72,502
$
45,676
Total
Rights
—
0
.0
%
(Cost:
$
28,276
)
.................................
45,676
Total
Long-Term
Investments
—
99.7%
(Cost:
$
687,314,048
)
..............................
831,465,602
Short-Term
Securities
Money
Market
Funds
—
4.3%
(d)(e)
BlackRock
Cash
Funds:
Institutional,
SL
Agency
Shares
,
5.45
%
(f)
..................
33,808,875
33,822,399
BlackRock
Cash
Funds:
Treasury,
SL
Agency
Shares
,
5.29
%
...................
1,763,241
1,763,241
Total
Short-Term
Securities
—
4
.3
%
(Cost:
$
35,572,372
)
...............................
35,585,640
Total
Investments
—
104
.0
%
(Cost:
$
722,886,420
)
..............................
867,051,242
Liabilities
in
Excess
of
Other
Assets
—
(
4.0
)
%
.............
(
33,385,469
)
Net
Assets
—
100.0%
...............................
$
833,665,773
(a)
All
or
a
portion
of
this
security
is
on
loan.
(b)
Non-income
producing
security.
(c)
Security
is
valued
using
significant
unobservable
inputs
and
is
classified
as
Level
3
in
the
fair
value
hierarchy.
(d)
Affiliate
of
the
Fund.
(e)
Annualized
7-day
yield
as
of
period
end.
(f)
All
or
a
portion
of
this
security
was
purchased
with
the
cash
collateral
from
loaned
securities.
Affiliated
Issuer
Value
at
07/31/23
Purchases
at
Cost
Proceeds
from
Sales
Net
Realized
Gain
(Loss)
Change
in
Unrealized
Appreciation
(Depreciation)
Value
at
07/31/24
Shares
Held
at
07/31/24
Income
Capital
Gain
Distributions
from
Underlying
Funds
BlackRock
Cash
Funds:
Institutional,
SL
Agency
Shares
..............
$
23,686,593
$
10,130,529
(a)
$
—
$
2,544
$
2,733
$
33,822,399
33,808,875
$
409,319
(b)
$
—
BlackRock
Cash
Funds:
Treasury,
SL
Agency
Shares
2,436,774
—
(
673,533
)
(a)
—
—
1,763,241
1,763,241
80,691
—
$
2,544
$
2,733
$
35,585,640
$
490,010
$
—
—
—
(a)
Represents
net
amount
purchased
(sold).
(b)
All
or
a
portion
represents
securities
lending
income
earned
from
the
reinvestment
of
cash
collateral
from
loaned
securities,
net
of
fees
and
collateral
investment
expenses,
and
other
payments
to
and
from
borrowers
of
securities.
Schedule
of
Investments
(continued)
July
31,
2024
iShares
®
MSCI
USA
Small-Cap
Min
Vol
Factor
ETF
Derivative
Financial
Instruments
Categorized
by
Risk
Exposure
For
more
information
about
the
Fund’s
investment
risks
regarding
derivative
financial
instruments,
refer
to
the
Notes
to
Financial
Statements.
Derivative
Financial
Instruments
Outstanding
as
of
Period
End
Futures
Contracts
Description
Number
of
Contracts
Expiration
Date
Notional
Amount
(000)
Value/
Unrealized
Appreciation
(Depreciation)
Long
Contracts
Dow
Jones
U.S.
Real
Estate
Index
..............................................
21
09/20/24
$
762
$
33,758
S&P
Midcap
400
E-Mini
Index
.................................................
4
09/20/24
1,248
73,207
$
106,965
As
of
period
end,
the
fair
values
of
derivative
financial
instruments
located
in
the
Statements
of
Assets
and
Liabilities
were
as
follows:
Commodity
Contracts
Credit
Contracts
Equity
Contracts
Foreign
Currency
Exchange
Contracts
Interest
Rate
Contracts
Other
Contracts
Total
Assets
—
Derivative
Financial
Instruments
Futures
contracts
Unrealized
appreciation
on
futures
contracts
(a)
......
$
—
$
—
$
106,965
$
—
$
—
$
—
$
106,965
(a)
Net
cumulative
unrealized
appreciation
(depreciation)
on
futures
contracts,
if
any,
are
reported
in
the
Schedule
of
Investments.
In
the
Statements
of
Assets
and
Liabilities,
only
current
day’s
variation
margin
is
reported
in
receivables
or
payables
and
the
net
cumulative
unrealized
appreciation
(depreciation)
is
included
in
accumulated
earnings
(loss).
For
the
period
ended
July
31,
2024,
the
effect
of
derivative
financial
instruments
in
the
Statements
of
Operations
was
as
follows:
Commodity
Contracts
Credit
Contracts
Equity
Contracts
Foreign
Currency
Exchange
Contracts
Interest
Rate
Contracts
Other
Contracts
Total
Net
Realized
Gain
(Loss)
from
Futures
c
ontracts
.......................
$
—
$
—
$
81,130
$
—
$
—
$
—
$
81,130
Net
Change
in
Unrealized
Appreciation
(Depreciation)
on
Futures
c
ontracts
.......................
$
—
$
—
$
64,989
$
—
$
—
$
—
$
64,989
Average
Quarterly
Balances
of
Outstanding
Derivative
Financial
Instruments
Futures
contracts
Average
notional
value
of
contracts
—
long
..................................................................................
$
1,885,785
2024
iShares
Annual
Financial
Statements
Schedule
of
Investments
(continued)
July
31,
2024
iShares
®
MSCI
USA
Small-Cap
Min
Vol
Factor
ETF
Fair
Value
Hierarchy
as
of Period
End
Various
inputs
are
used
in
determining
the
fair
value
of
financial
instruments.
For
a
description
of
the
input
levels
and
information
about
the
Fund’s
policy
regarding
valuation
of
financial
instruments,
refer
to
the
Notes
to
Financial
Statements.
The
following
table
summarizes
the
Fund’s
financial
instruments
categorized
in
the
fair
value
hierarchy.
The
breakdown
of
the
Fund's
financial
instruments
into
major
categories
is
disclosed
in
the
Schedule
of
Investments
above.
See
notes
to
financial
statements.
Level
1
Level
2
Level
3
Total
Assets
Investments
Long-Term
Investments
Common
Stocks
.........................................
$
831,419,926
$
—
$
—
$
831,419,926
Rights
................................................
—
—
45,676
45,676
Short-Term
Securities
Money
Market
Funds
......................................
35,585,640
—
—
35,585,640
$
867,005,566
$
—
$
45,676
$
867,051,242
Derivative
Financial
Instruments
(a)
Assets
Equity
contracts
...........................................
$
106,965
$
—
$
—
$
106,965
(a)
Derivative
financial
instruments
are
futures
contracts.
Futures
contracts
are
valued
at
the
unrealized
appreciation
(depreciation)
on
the
instrument.
Schedule
of
Investments
July
31,
2024
iShares
®
U.S.
Equity
Factor
ETF
(Percentages
shown
are
based
on
Net
Assets)
Security
Shares
Shares
Value
Common
Stocks
Aerospace
&
Defense
—
0.2%
Lockheed
Martin
Corp.
................
8,001
$
4,335,902
Air
Freight
&
Logistics
—
0.0%
Expeditors
International
of
Washington,
Inc.
..
1,685
210,321
FedEx
Corp.
.......................
843
254,797
465,118
Automobiles
—
1.3%
Ford
Motor
Co.
.....................
352,485
3,813,888
General
Motors
Co.
..................
201,838
8,945,460
Harley-Davidson,
Inc.
.................
52,188
1,957,050
Tesla,
Inc.
(a)
........................
46,303
10,745,537
Thor
Industries,
Inc.
..................
11,224
1,191,315
26,653,250
Banks
—
3.2%
Bank
of
America
Corp.
................
181,144
7,301,915
Citigroup,
Inc.
......................
109,941
7,132,972
Fifth
Third
Bancorp
..................
16,591
702,463
JPMorgan
Chase
&
Co.
...............
151,361
32,209,621
NU
Holdings
Ltd.
,
Class
A
(a)
.............
479,234
5,813,108
Popular,
Inc.
.......................
57,498
5,901,020
Wells
Fargo
&
Co.
...................
95,335
5,657,179
64,718,278
Beverages
—
1.8%
Coca-Cola
Co.
(The)
.................
216,833
14,471,434
Molson
Coors
Beverage
Co.
,
Class
B
......
23,316
1,232,251
PepsiCo,
Inc.
......................
116,993
20,201,181
35,904,866
Biotechnology
—
2.4%
AbbVie,
Inc.
.......................
118,251
21,914,275
Amgen,
Inc.
.......................
23,312
7,750,541
Biogen,
Inc.
(a)
(b)
.....................
952
202,966
Gilead
Sciences,
Inc.
.................
128,440
9,769,146
Moderna,
Inc.
(a)
.....................
21,309
2,540,459
Vertex
Pharmaceuticals,
Inc.
(a)
...........
12,397
6,145,441
48,322,828
Broadline
Retail
—
3.7%
Amazon.com,
Inc.
(a)
..................
305,522
57,126,503
Coupang,
Inc.
,
Class
A
(a)
...............
55,004
1,141,333
eBay,
Inc.
.........................
95,175
5,292,682
Etsy,
Inc.
(a)
........................
67,163
4,374,998
MercadoLibre,
Inc.
(a)
..................
5,264
8,785,090
76,720,606
Building
Products
—
0.9%
Builders
FirstSource,
Inc.
(a)
.............
68,877
11,527,944
Carrier
Global
Corp.
..................
21,301
1,450,811
Lennox
International,
Inc.
..............
966
563,661
Simpson
Manufacturing
Co.,
Inc.
.........
5,207
1,000,213
Trane
Technologies
plc
................
9,955
3,327,757
17,870,386
Capital
Markets
—
3.9%
Affiliated
Managers
Group,
Inc.
..........
26,474
4,914,104
Ameriprise
Financial,
Inc.
..............
16,817
7,232,487
Bank
of
New
York
Mellon
Corp.
(The)
......
175,602
11,426,422
BlackRock,
Inc.
(c)
....................
5,169
4,530,628
Goldman
Sachs
Group,
Inc.
(The)
........
22,241
11,321,336
Interactive
Brokers
Group,
Inc.
,
Class
A
.....
58,151
6,935,670
Janus
Henderson
Group
plc
............
130,937
4,874,785
Morgan
Stanley
.....................
17,624
1,818,973
MSCI,
Inc.
........................
13,477
7,287,823
Security
Shares
Shares
Value
Capital
Markets
(continued)
Nasdaq,
Inc.
.......................
63,439
$
4,293,552
S&P
Global,
Inc.
....................
18,587
9,009,676
State
Street
Corp.
...................
51,422
4,369,327
XP,
Inc.
,
Class
A
....................
135,208
2,313,409
80,328,192
Chemicals
—
1.3%
Dow,
Inc.
.........................
25,212
1,373,298
Linde
plc
.........................
44,876
20,351,266
LyondellBasell
Industries
NV
,
Class
A
......
9,602
955,015
Olin
Corp.
.........................
65,566
2,990,465
25,670,044
Commercial
Services
&
Supplies
—
0.7%
Cintas
Corp.
.......................
9,642
7,365,910
Tetra
Tech,
Inc.
.....................
10,510
2,241,152
Veralto
Corp.
.......................
53,646
5,716,518
15,323,580
Communications
Equipment
—
0.9%
Arista
Networks,
Inc.
(a)
................
17,448
6,046,604
Cisco
Systems,
Inc.
..................
155,947
7,555,632
Motorola
Solutions,
Inc.
...............
9,953
3,970,451
17,572,687
Construction
&
Engineering
—
0.2%
EMCOR
Group,
Inc.
..................
12,182
4,573,610
Consumer
Finance
—
1.1%
Ally
Financial,
Inc.
...................
185,297
8,340,218
American
Express
Co.
................
18,221
4,610,642
Capital
One
Financial
Corp.
.............
27,349
4,140,639
OneMain
Holdings,
Inc.
................
16,655
870,390
Synchrony
Financial
..................
89,320
4,536,563
22,498,452
Consumer
Staples
Distribution
&
Retail
—
2.0%
Costco
Wholesale
Corp.
...............
12,999
10,685,178
Kroger
Co.
(The)
....................
131,365
7,159,392
Target
Corp.
.......................
33,324
5,012,263
Walmart,
Inc.
.......................
271,250
18,618,600
41,475,433
Diversified
Consumer
Services
—
0.6%
Duolingo,
Inc.
,
Class
A
(a)
...............
30,140
5,182,272
H&R
Block,
Inc.
.....................
113,848
6,596,353
11,778,625
Diversified
Telecommunication
Services
—
0.9%
AT&T,
Inc.
.........................
586,585
11,291,761
Verizon
Communications,
Inc.
...........
155,646
6,306,776
17,598,537
Electric
Utilities
—
0.8%
Duke
Energy
Corp.
..................
41,824
4,570,108
Exelon
Corp.
.......................
91,168
3,391,450
FirstEnergy
Corp.
...................
25,015
1,048,379
NextEra
Energy,
Inc.
.................
58,288
4,452,620
Southern
Co.
(The)
..................
30,968
2,586,447
16,049,004
Electrical
Equipment
—
1.1%
Acuity
Brands,
Inc.
...................
8,525
2,142,759
Atkore,
Inc.
........................
29,257
3,949,695
Eaton
Corp.
plc
.....................
23,102
7,041,259
Emerson
Electric
Co.
.................
54,159
6,342,560
nVent
Electric
plc
....................
37,973
2,757,979
22,234,252
2024
iShares
Annual
Financial
Statements
Schedule
of
Investments
(continued)
July
31,
2024
iShares
®
U.S.
Equity
Factor
ETF
(Percentages
shown
are
based
on
Net
Assets)
Security
Shares
Shares
Value
Electronic
Equipment,
Instruments
&
Components
—
0.3%
Jabil,
Inc.
.........................
54,443
$
6,134,093
Energy
Equipment
&
Services
—
0.4%
Schlumberger
NV
...................
23,922
1,155,193
Weatherford
International
plc
(a)
...........
55,659
6,559,970
7,715,163
Entertainment
—
0.2%
(a)
Live
Nation
Entertainment,
Inc.
...........
3,684
354,364
Netflix,
Inc.
........................
5,155
3,239,144
Spotify
Technology
SA
................
3,717
1,278,425
4,871,933
Financial
Services
—
2.5%
Berkshire
Hathaway,
Inc.
,
Class
B
(a)
.......
19,648
8,615,648
Fiserv,
Inc.
(a)
.......................
11,846
1,937,650
Mastercard,
Inc.
,
Class
A
...............
30,470
14,129,244
Visa,
Inc.
,
Class
A
...................
92,772
24,646,737
Voya
Financial,
Inc.
..................
36,176
2,631,081
51,960,360
Food
Products
—
0.6%
Archer-Daniels-Midland
Co.
.............
28,841
1,788,430
General
Mills,
Inc.
...................
78,360
5,261,090
Hershey
Co.
(The)
...................
17,903
3,535,485
Kraft
Heinz
Co.
(The)
.................
6,155
216,718
Mondelez
International,
Inc.
,
Class
A
.......
33,080
2,261,018
13,062,741
Ground
Transportation
—
0.3%
Uber
Technologies,
Inc.
(a)
..............
80,656
5,199,892
Health
Care
Equipment
&
Supplies
—
2.2%
Abbott
Laboratories
..................
102,342
10,842,111
Becton
Dickinson
&
Co.
...............
1,688
406,909
Boston
Scientific
Corp.
(a)
...............
4,508
333,051
Dentsply
Sirona,
Inc.
.................
51,426
1,395,702
GE
HealthCare
Technologies,
Inc.
........
100,480
8,503,622
Hologic,
Inc.
(a)
......................
104,330
8,514,371
Lantheus
Holdings,
Inc.
(a)
..............
46,976
4,924,494
Medtronic
plc
......................
17,516
1,406,885
Solventum
Corp.
(a)
(b)
..................
87,070
5,126,682
Stryker
Corp.
......................
9,928
3,250,924
Zimmer
Biomet
Holdings,
Inc.
...........
5,950
662,533
45,367,284
Health
Care
Providers
&
Services
—
3.1%
Cigna
Group
(The)
...................
12,032
4,195,197
CVS
Health
Corp.
...................
100,653
6,072,396
DaVita,
Inc.
(a)
.......................
32,956
4,502,449
Elevance
Health,
Inc.
.................
16,044
8,535,889
Humana,
Inc.
......................
12,428
4,494,089
McKesson
Corp.
....................
18,267
11,271,104
Molina
Healthcare,
Inc.
(a)
...............
11,769
4,016,407
UnitedHealth
Group,
Inc.
...............
34,756
20,025,017
63,112,548
Hotels,
Restaurants
&
Leisure
—
2.6%
Airbnb,
Inc.
,
Class
A
(a)
.................
49,448
6,900,963
Booking
Holdings,
Inc.
................
4,339
16,119,428
Hyatt
Hotels
Corp.
,
Class
A
.............
4,498
662,690
McDonald's
Corp.
...................
47,194
12,525,288
MGM
Resorts
International
(a)
............
7,503
322,404
Starbucks
Corp.
.....................
55,192
4,302,216
Wingstop,
Inc.
......................
17,842
6,670,767
Yum!
Brands,
Inc.
...................
48,779
6,479,315
53,983,071
Security
Shares
Shares
Value
Household
Durables
—
0.1%
Taylor
Morrison
Home
Corp.
(a)
...........
17,671
$
1,185,371
Household
Products
—
1.3%
Procter
&
Gamble
Co.
(The)
............
168,126
27,027,936
Independent
Power
and
Renewable
Electricity
Producers
—
0.2%
Vistra
Corp.
.......................
39,424
3,123,169
Industrial
Conglomerates
—
0.2%
3M
Co.
...........................
31,010
3,955,326
Industrial
REITs
—
0.1%
Prologis,
Inc.
.......................
13,885
1,750,204
Insurance
—
1.5%
Aflac,
Inc.
.........................
76,679
7,313,643
American
International
Group,
Inc.
........
75,495
5,981,469
Arch
Capital
Group
Ltd.
(a)
..............
15,778
1,511,217
Everest
Group
Ltd.
...................
3,239
1,272,506
Fidelity
National
Financial,
Inc.
,
Class
A
.....
43,857
2,430,116
Globe
Life,
Inc.
.....................
22,330
2,070,884
Hartford
Financial
Services
Group,
Inc.
(The)
.
5,016
556,375
MetLife,
Inc.
.......................
3,235
248,610
Principal
Financial
Group,
Inc.
...........
7,752
631,865
Prudential
Financial,
Inc.
...............
33,949
4,254,489
Travelers
Cos.,
Inc.
(The)
..............
16,945
3,667,576
Unum
Group
.......................
24,318
1,399,014
31,337,764
Interactive
Media
&
Services
—
3.8%
Alphabet,
Inc.
,
Class
C,
NVS
............
226,697
39,252,586
Meta
Platforms,
Inc.
,
Class
A
............
82,588
39,215,260
78,467,846
IT
Services
—
1.0%
Accenture
plc
,
Class
A
................
13,724
4,537,429
Gartner,
Inc.
(a)
......................
14,977
7,506,322
International
Business
Machines
Corp.
.....
8,623
1,656,823
Okta,
Inc.
,
Class
A
(a)
..................
11,685
1,097,689
Wix.com
Ltd.
(a)
......................
41,431
6,460,129
21,258,392
Life
Sciences
Tools
&
Services
—
1.0%
Medpace
Holdings,
Inc.
(a)
..............
18,887
7,224,655
Mettler-Toledo
International,
Inc.
(a)
........
4,692
7,136,673
Thermo
Fisher
Scientific,
Inc.
............
11,436
7,014,156
21,375,484
Machinery
—
2.0%
AGCO
Corp.
.......................
7,498
707,961
Caterpillar,
Inc.
.....................
15,261
5,283,358
Crane
Co.
.........................
39,987
6,414,715
Deere
&
Co.
.......................
4,722
1,756,490
Illinois
Tool
Works,
Inc.
................
17,800
4,401,584
Mueller
Industries,
Inc.
................
92,693
6,575,641
Otis
Worldwide
Corp.
.................
61,043
5,768,563
PACCAR,
Inc.
......................
44,456
4,386,029
Parker-Hannifin
Corp.
.................
3,325
1,865,857
Watts
Water
Technologies,
Inc.
,
Class
A
.....
15,813
3,281,514
40,441,712
Media
—
1.1%
Charter
Communications,
Inc.
,
Class
A
(a)
(b)
...
4,154
1,577,357
Comcast
Corp.
,
Class
A
...............
209,032
8,626,751
Fox
Corp.
,
Class
A,
NVS
...............
156,384
5,948,847
Interpublic
Group
of
Cos.,
Inc.
(The)
.......
86,279
2,775,595
News
Corp.
,
Class
A,
NVS
.............
17,724
488,828
Schedule
of
Investments
(continued)
July
31,
2024
iShares
®
U.S.
Equity
Factor
ETF
(Percentages
shown
are
based
on
Net
Assets)
Security
Shares
Shares
Value
Media
(continued)
Omnicom
Group,
Inc.
.................
33,403
$
3,274,830
22,692,208
Metals
&
Mining
—
0.9%
Commercial
Metals
Co.
................
26,339
1,582,974
Nucor
Corp.
.......................
32,054
5,222,879
Reliance,
Inc.
......................
19,608
5,971,812
Steel
Dynamics,
Inc.
..................
41,885
5,579,920
18,357,585
Mortgage
Real
Estate
Investment
Trusts
(REITs)
—
0.1%
AGNC
Investment
Corp.
...............
99,534
996,335
Multi-Utilities
—
1.3%
Ameren
Corp.
......................
46,018
3,647,847
Consolidated
Edison,
Inc.
..............
119,274
11,631,600
DTE
Energy
Co.
....................
45,957
5,539,197
Public
Service
Enterprise
Group,
Inc.
......
9,152
730,055
Sempra
..........................
16,663
1,334,040
WEC
Energy
Group,
Inc.
...............
46,980
4,043,099
26,925,838
Office
REITs
—
0.0%
BXP,
Inc.
.........................
5,898
420,586
Oil,
Gas
&
Consumable
Fuels
—
3.3%
Antero
Resources
Corp.
(a)
..............
26,008
754,752
APA
Corp.
........................
107,581
3,355,451
Chesapeake
Energy
Corp.
.............
17,597
1,343,179
Chevron
Corp.
......................
73,961
11,868,522
ConocoPhillips
.....................
9,990
1,110,888
EOG
Resources,
Inc.
.................
4,157
527,108
Exxon
Mobil
Corp.
...................
172,896
20,503,737
Kinder
Morgan,
Inc.
..................
120,075
2,537,185
Marathon
Oil
Corp.
...................
69,817
1,958,367
Marathon
Petroleum
Corp.
.............
68,312
12,092,590
Murphy
Oil
Corp.
....................
13,651
564,878
Phillips
66
.........................
1,493
217,202
Range
Resources
Corp.
...............
162,428
5,072,626
Valero
Energy
Corp.
..................
35,507
5,742,192
67,648,677
Paper
&
Forest
Products
—
0.2%
Louisiana-Pacific
Corp.
................
40,750
4,000,020
Passenger
Airlines
—
0.0%
United
Airlines
Holdings,
Inc.
(a)
...........
7,101
322,527
Personal
Care
Products
—
0.2%
elf
Beauty,
Inc.
(a)
....................
27,770
4,792,547
Pharmaceuticals
—
3.9%
Bristol-Myers
Squibb
Co.
...............
275,332
13,094,790
Eli
Lilly
&
Co.
......................
30,244
24,324,342
Johnson
&
Johnson
..................
127,302
20,094,621
Merck
&
Co.,
Inc.
....................
128,853
14,577,140
Pfizer,
Inc.
........................
264,729
8,084,823
Royalty
Pharma
plc
,
Class
A
............
7,985
224,937
80,400,653
Professional
Services
—
0.7%
Automatic
Data
Processing,
Inc.
..........
11,635
3,055,584
Paychex,
Inc.
......................
65,489
8,383,902
Robert
Half,
Inc.
....................
37,085
2,380,486
13,819,972
Security
Shares
Shares
Value
Residential
REITs
—
0.5%
AvalonBay
Communities,
Inc.
...........
21,439
$
4,393,280
Equity
Residential
...................
88,275
6,146,588
10,539,868
Retail
REITs
—
0.6%
Brixmor
Property
Group,
Inc.
............
245,787
6,260,195
Simon
Property
Group,
Inc.
.............
36,525
5,604,396
11,864,591
Semiconductors
&
Semiconductor
Equipment
—
10.0%
Advanced
Micro
Devices,
Inc.
(a)
..........
21,996
3,177,982
Applied
Materials,
Inc.
................
42,839
9,090,436
Broadcom,
Inc.
.....................
274,746
44,146,187
Intel
Corp.
........................
20,321
624,668
KLA
Corp.
.........................
10,720
8,823,311
Lam
Research
Corp.
.................
4,247
3,912,506
Lattice
Semiconductor
Corp.
(a)
(b)
..........
17,579
931,687
Microchip
Technology,
Inc.
..............
26,949
2,392,532
NVIDIA
Corp.
......................
995,457
116,488,378
QUALCOMM,
Inc.
...................
60,374
10,924,675
Rambus,
Inc.
(a)
.....................
86,140
4,431,042
Texas
Instruments,
Inc.
................
4,647
947,105
205,890,509
Software
—
12.6%
Adobe,
Inc.
(a)
.......................
11,948
6,591,114
AppLovin
Corp.
,
Class
A
(a)
..............
61,888
4,771,565
Atlassian
Corp.
,
Class
A
(a)
..............
51,423
9,079,759
Cadence
Design
Systems,
Inc.
(a)
.........
30,599
8,190,128
Crowdstrike
Holdings,
Inc.
,
Class
A
(a)
.......
11,469
2,660,349
DocuSign,
Inc.
(a)
....................
91,236
5,061,773
Elastic
NV
(a)
.......................
25,154
2,758,639
Fair
Isaac
Corp.
(a)
....................
7,560
12,096,000
Fortinet,
Inc.
(a)
......................
115,507
6,704,026
Gitlab,
Inc.
,
Class
A
(a)
.................
102,170
5,234,169
HubSpot,
Inc.
(a)
.....................
4,771
2,371,330
Intuit,
Inc.
.........................
13,656
8,840,212
Manhattan
Associates,
Inc.
(a)
............
27,306
6,973,406
Microsoft
Corp.
.....................
300,883
125,874,403
Monday.com
Ltd.
(a)
...................
35,459
8,148,833
Nutanix,
Inc.
,
Class
A
(a)
(b)
...............
107,816
5,445,786
Oracle
Corp.
.......................
19,162
2,672,141
Palo
Alto
Networks,
Inc.
(a)
(b)
.............
16,800
5,455,464
Procore
Technologies,
Inc.
(a)
............
80,570
5,722,887
Qualys,
Inc.
(a)
(b)
.....................
30,006
4,475,095
Salesforce,
Inc.
.....................
7,928
2,051,767
Samsara,
Inc.
,
Class
A
(a)
(b)
..............
145,774
5,580,229
ServiceNow,
Inc.
(a)
(b)
..................
939
764,712
Smartsheet,
Inc.
,
Class
A
(a)
.............
40,070
1,921,757
Synopsys,
Inc.
(a)
....................
13,159
7,346,933
UiPath,
Inc.
,
Class
A
(a)
(b)
...............
45,336
551,739
Zscaler,
Inc.
(a)
(b)
.....................
11,564
2,074,004
259,418,220
Specialized
REITs
—
0.6%
Public
Storage
......................
15,468
4,577,291
Weyerhaeuser
Co.
...................
226,445
7,191,893
11,769,184
Specialty
Retail
—
3.2%
Abercrombie
&
Fitch
Co.
,
Class
A
(a)
........
41,685
6,147,704
AutoNation,
Inc.
(a)
....................
28,404
5,417,211
AutoZone,
Inc.
(a)
(b)
...................
1,020
3,196,364
Bath
&
Body
Works,
Inc.
...............
90,521
3,326,647
Best
Buy
Co.,
Inc.
...................
49,559
4,287,845
Dick's
Sporting
Goods,
Inc.
.............
22,330
4,831,095
Home
Depot,
Inc.
(The)
...............
31,623
11,642,324
2024
iShares
Annual
Financial
Statements
Schedule
of
Investments
(continued)
July
31,
2024
iShares
®
U.S.
Equity
Factor
ETF
(Percentages
shown
are
based
on
Net
Assets)
Affiliates
Investments
in
issuers
considered
to
be
affiliate(s)
of
the
Fund
during
the year
ended
July
31,
2024
for
purposes
of
Section
2(a)(3)
of
the
Investment
Company
Act
of
1940,
as
amended,
were
as
follows:
Security
Shares
Shares
Value
Specialty
Retail
(continued)
Lowe's
Cos.,
Inc.
....................
51,507
$
12,645,483
Murphy
USA,
Inc.
...................
6,872
3,469,810
Wayfair,
Inc.
,
Class
A
(a)
................
52,820
2,874,993
Williams-Sonoma,
Inc.
................
45,246
6,998,651
64,838,127
Technology
Hardware,
Storage
&
Peripherals
—
7.4%
Apple,
Inc.
........................
604,075
134,152,976
Dell
Technologies,
Inc.
,
Class
C
..........
41,455
4,712,604
Hewlett
Packard
Enterprise
Co.
..........
444,595
8,851,886
HP,
Inc.
..........................
113,972
4,113,250
NetApp,
Inc.
.......................
2,814
357,322
152,188,038
Textiles,
Apparel
&
Luxury
Goods
—
0.7%
Crocs,
Inc.
(a)
(b)
......................
7,363
989,366
Deckers
Outdoor
Corp.
(a)
...............
6,195
5,715,693
PVH
Corp.
........................
16,482
1,680,999
Ralph
Lauren
Corp.
,
Class
A
............
6,177
1,084,620
Tapestry,
Inc.
.......................
123,369
4,945,863
14,416,541
Tobacco
—
0.4%
Altria
Group,
Inc.
....................
15,936
781,023
Philip
Morris
International,
Inc.
...........
70,021
8,063,619
8,844,642
Trading
Companies
&
Distributors
—
1.0%
Applied
Industrial
Technologies,
Inc.
.......
9,248
2,017,821
Core
&
Main,
Inc.
,
Class
A
(a)
.............
156,737
8,380,727
Ferguson
plc
.......................
33,098
7,369,270
Security
Shares
Shares
Value
Trading
Companies
&
Distributors
(continued)
WW
Grainger,
Inc.
...................
1,987
$
1,940,922
19,708,740
Water
Utilities
—
0.6%
American
Water
Works
Co.,
Inc.
..........
88,279
12,567,398
Total
Long-Term
Investments
—
99
.7
%
(Cost:
$
1,588,735,994
)
............................
2,043,846,745
Short-Term
Securities
Money
Market
Funds
—
0.9%
(c)(d)
BlackRock
Cash
Funds:
Institutional,
SL
Agency
Shares
,
5.45
%
(e)
..................
13,295,321
13,300,639
BlackRock
Cash
Funds:
Treasury,
SL
Agency
Shares
,
5.29
%
...................
5,356,059
5,356,059
Total
Short-Term
Securities
—
0
.9
%
(Cost:
$
18,654,292
)
...............................
18,656,698
Total
Investments
—
100
.6
%
(Cost:
$
1,607,390,286
)
............................
2,062,503,443
Liabilities
in
Excess
of
Other
Assets
—
(
0.6
)
%
.............
(
11,477,921
)
Net
Assets
—
100.0%
...............................
$
2,051,025,522
(a)
Non-income
producing
security.
(b)
All
or
a
portion
of
this
security
is
on
loan.
(c)
Affiliate
of
the
Fund.
(d)
Annualized
7-day
yield
as
of
period
end.
(e)
All
or
a
portion
of
this
security
was
purchased
with
the
cash
collateral
from
loaned
securities.
Affiliated
Issuer
Value
at
07/31/23
Purchases
at
Cost
Proceeds
from
Sales
Net
Realized
Gain
(Loss)
Change
in
Unrealized
Appreciation
(Depreciation)
Value
at
07/31/24
Shares
Held
at
07/31/24
Income
Capital
Gain
Distributions
from
Underlying
Funds
BlackRock
Cash
Funds:
Institutional,
SL
Agency
Shares
..............
$
5,273,814
$
8,020,671
(a)
$
—
$
4,297
$
1,857
$
13,300,639
13,295,321
$
66,113
(b)
$
—
BlackRock
Cash
Funds:
Treasury,
SL
Agency
Shares
2,245,623
3,110,436
(a)
—
—
—
5,356,059
5,356,059
194,552
—
BlackRock,
Inc.
..........
3,257,590
899,032
(
325,604
)
45,863
653,747
4,530,628
5,169
96,555
—
$
50,160
$
655,604
$
23,187,326
$
357,220
$
—
—
—
(a)
Represents
net
amount
purchased
(sold).
(b)
All
or
a
portion
represents
securities
lending
income
earned
from
the
reinvestment
of
cash
collateral
from
loaned
securities,
net
of
fees
and
collateral
investment
expenses,
and
other
payments
to
and
from
borrowers
of
securities.
Schedule
of
Investments
(continued)
July
31,
2024
iShares
®
U.S.
Equity
Factor
ETF
Derivative
Financial
Instruments
Categorized
by
Risk
Exposure
For
more
information
about
the
Fund’s
investment
risks
regarding
derivative
financial
instruments,
refer
to
the
Notes
to
Financial
Statements.
Derivative
Financial
Instruments
Outstanding
as
of
Period
End
Futures
Contracts
Description
Number
of
Contracts
Expiration
Date
Notional
Amount
(000)
Value/
Unrealized
Appreciation
(Depreciation)
Long
Contracts
S&P
500
E-Mini
Index
.......................................................
22
09/20/24
$
6,114
$
25,256
S&P
Midcap
400
E-Mini
Index
.................................................
2
09/20/24
624
37,923
$
63,179
As
of
period
end,
the
fair
values
of
derivative
financial
instruments
located
in
the
Statements
of
Assets
and
Liabilities
were
as
follows:
Commodity
Contracts
Credit
Contracts
Equity
Contracts
Foreign
Currency
Exchange
Contracts
Interest
Rate
Contracts
Other
Contracts
Total
Assets
—
Derivative
Financial
Instruments
Futures
contracts
Unrealized
appreciation
on
futures
contracts
(a)
......
$
—
$
—
$
63,179
$
—
$
—
$
—
$
63,179
(a)
Net
cumulative
unrealized
appreciation
(depreciation)
on
futures
contracts,
if
any,
are
reported
in
the
Schedule
of
Investments.
In
the
Statements
of
Assets
and
Liabilities,
only
current
day’s
variation
margin
is
reported
in
receivables
or
payables
and
the
net
cumulative
unrealized
appreciation
(depreciation)
is
included
in
accumulated
earnings
(loss).
For
the
period
ended
July
31,
2024,
the
effect
of
derivative
financial
instruments
in
the
Statements
of
Operations
was
as
follows:
Commodity
Contracts
Credit
Contracts
Equity
Contracts
Foreign
Currency
Exchange
Contracts
Interest
Rate
Contracts
Other
Contracts
Total
Net
Realized
Gain
(Loss)
from
Futures
c
ontracts
.......................
$
—
$
—
$
566,393
$
—
$
—
$
—
$
566,393
Net
Change
in
Unrealized
Appreciation
(Depreciation)
on
Futures
c
ontracts
.......................
$
—
$
—
$
(
44,099
)
$
—
$
—
$
—
$
(
44,099
)
Average
Quarterly
Balances
of
Outstanding
Derivative
Financial
Instruments
Futures
contracts
Average
notional
value
of
contracts
—
long
..................................................................................
$
5,679,238
2024
iShares
Annual
Financial
Statements
Schedule
of
Investments
(continued)
July
31,
2024
iShares
®
U.S.
Equity
Factor
ETF
Fair
Value
Hierarchy
as
of Period
End
Various
inputs
are
used
in
determining
the
fair
value
of
financial
instruments.
For
a
description
of
the
input
levels
and
information
about
the
Fund’s
policy
regarding
valuation
of
financial
instruments,
refer
to
the
Notes
to
Financial
Statements.
The
following
table
summarizes
the
Fund’s
financial
instruments
categorized
in
the
fair
value
hierarchy.
The
breakdown
of
the
Fund's
financial
instruments
into
major
categories
is
disclosed
in
the
Schedule
of
Investments
above.
See
notes
to
financial
statements.
Level
1
Level
2
Level
3
Total
Assets
Investments
Long-Term
Investments
Common
Stocks
.........................................
$
2,043,846,745
$
—
$
—
$
2,043,846,745
Short-Term
Securities
Money
Market
Funds
......................................
18,656,698
—
—
18,656,698
$
2,062,503,443
$
—
$
—
$
2,062,503,443
Derivative
Financial
Instruments
(a)
Assets
Equity
contracts
...........................................
$
63,179
$
—
$
—
$
63,179
(a)
Derivative
financial
instruments
are
futures
contracts.
Futures
contracts
are
valued
at
the
unrealized
appreciation
(depreciation)
on
the
instrument.
Schedule
of
Investments
July
31,
2024
iShares
®
U.S.
Small-Cap
Equity
Factor
ETF
(Percentages
shown
are
based
on
Net
Assets)
Security
Shares
Shares
Value
Common
Stocks
Aerospace
&
Defense
—
0.7%
AeroVironment,
Inc.
(a)
(b)
................
2,186
$
390,289
Axon
Enterprise,
Inc.
(b)
................
12,386
3,715,924
BWX
Technologies,
Inc.
...............
13,445
1,337,643
Curtiss-Wright
Corp.
..................
8,212
2,420,076
Hexcel
Corp.
.......................
2,986
197,703
Moog,
Inc.
,
Class
A
..................
1,601
313,956
8,375,591
Automobile
Components
—
0.5%
Autoliv,
Inc.
........................
7,537
762,292
Dana,
Inc.
.........................
30,337
385,583
Mobileye
Global,
Inc.
,
Class
A
(a)
(b)
.........
11,515
241,815
Modine
Manufacturing
Co.
(a)
(b)
...........
27,408
3,224,825
Phinia,
Inc.
........................
5,627
251,527
Visteon
Corp.
(b)
.....................
10,627
1,227,844
6,093,886
Automobiles
—
0.4%
Harley-Davidson,
Inc.
.................
59,098
2,216,175
Thor
Industries,
Inc.
..................
15,097
1,602,395
Winnebago
Industries,
Inc.
.............
11,386
711,853
4,530,423
Banks
—
6.4%
1st
Source
Corp.
....................
31,038
1,972,465
Associated
Banc-Corp.
................
46,530
1,069,259
Axos
Financial,
Inc.
(b)
.................
37,602
2,745,322
BancFirst
Corp.
.....................
14,501
1,557,842
Bancorp,
Inc.
(The)
(a)
(b)
................
45,065
2,336,170
Bank
of
Hawaii
Corp.
.................
13,328
914,168
Bank
of
NT
Butterfield
&
Son
Ltd.
(The)
.....
24,436
936,876
Bank
OZK
........................
21,543
1,010,151
BankUnited,
Inc.
....................
70,798
2,727,139
BOK
Financial
Corp.
..................
2,180
224,191
Capitol
Federal
Financial,
Inc.
...........
81,713
516,426
City
Holding
Co.
....................
1,743
212,472
Comerica,
Inc.
......................
38,199
2,093,687
Commerce
Bancshares,
Inc.
............
44,148
2,856,817
Community
Trust
Bancorp,
Inc.
..........
12,683
643,282
Cullen/Frost
Bankers,
Inc.
..............
25,500
2,985,030
Customers
Bancorp,
Inc.
(b)
..............
22,186
1,430,553
CVB
Financial
Corp.
..................
27,153
517,536
Eagle
Bancorp,
Inc.
..................
15,674
337,304
East
West
Bancorp,
Inc.
...............
49,355
4,337,811
First
Bancorp
......................
150,245
3,333,724
First
Citizens
BancShares,
Inc.
,
Class
A
.....
1,651
3,446,776
First
Financial
Bankshares,
Inc.
..........
14,614
562,054
First
Foundation,
Inc.
.................
33,512
234,584
First
Hawaiian,
Inc.
..................
88,889
2,225,781
First
Horizon
Corp.
...................
28,864
482,895
Fulton
Financial
Corp.
.................
42,762
828,300
Hancock
Whitney
Corp.
...............
16,799
919,409
Hilltop
Holdings,
Inc.
..................
44,907
1,481,482
HomeStreet,
Inc.
....................
28,926
416,534
International
Bancshares
Corp.
..........
19,714
1,329,512
Kearny
Financial
Corp.
................
30,569
220,097
Metropolitan
Bank
Holding
Corp.
(b)
........
31,117
1,640,799
NBT
Bancorp,
Inc.
...................
10,582
518,730
New
York
Community
Bancorp,
Inc.
(a)
......
116,038
1,220,720
Northfield
Bancorp,
Inc.
...............
14,308
178,993
OFG
Bancorp
......................
95,165
4,322,394
Pathward
Financial,
Inc.
...............
27,634
1,866,400
Pinnacle
Financial
Partners,
Inc.
..........
10,240
986,317
Popular,
Inc.
.......................
75,656
7,764,575
Security
Shares
Shares
Value
Banks
(continued)
Preferred
Bank
.....................
19,822
$
1,705,881
ServisFirst
Bancshares,
Inc.
............
18,377
1,474,571
SouthState
Corp.
....................
1,941
192,101
Synovus
Financial
Corp.
...............
11,053
516,728
Texas
Capital
Bancshares,
Inc.
(b)
.........
4,779
315,892
Trustmark
Corp.
....................
34,342
1,192,698
UMB
Financial
Corp.
.................
14,263
1,455,111
WaFd,
Inc.
........................
44,562
1,585,962
Webster
Financial
Corp.
...............
11,189
555,198
Western
Alliance
Bancorp
..............
14,722
1,184,532
Wintrust
Financial
Corp.
...............
2,118
229,168
Zions
Bancorp
NA
...................
53,477
2,763,157
78,575,576
Beverages
—
0.7%
Boston
Beer
Co.,
Inc.
(The)
,
Class
A
(b)
......
841
235,657
Celsius
Holdings,
Inc.
(a)
(b)
...............
22,025
1,031,431
Coca-Cola
Consolidated,
Inc.
............
2,389
2,737,531
Vita
Coco
Co.,
Inc.
(The)
(b)
..............
158,049
4,083,986
8,088,605
Biotechnology
—
5.0%
(b)
89bio,
Inc.
........................
19,903
182,312
ACADIA
Pharmaceuticals,
Inc.
...........
84,992
1,616,548
Akero
Therapeutics,
Inc.
...............
10,159
271,550
Alkermes
plc
.......................
137,310
3,751,309
Allogene
Therapeutics,
Inc.
(a)
............
44,794
131,694
Amicus
Therapeutics,
Inc.
..............
59,029
608,589
AnaptysBio,
Inc.
....................
31,165
1,085,789
Anavex
Life
Sciences
Corp.
(a)
............
102,198
694,435
Apellis
Pharmaceuticals,
Inc.
(a)
...........
24,884
985,406
Arcellx,
Inc.
(a)
......................
23,026
1,423,237
Arcturus
Therapeutics
Holdings,
Inc.
.......
6,072
142,449
Arcus
Biosciences,
Inc.
................
36,716
602,510
Arrowhead
Pharmaceuticals,
Inc.
.........
21,991
628,063
ARS
Pharmaceuticals,
Inc.
(a)
............
23,907
259,869
Beam
Therapeutics,
Inc.
(a)
..............
35,116
1,111,070
BioCryst
Pharmaceuticals,
Inc.
...........
200,390
1,458,839
Blueprint
Medicines
Corp.
..............
12,091
1,309,455
Bridgebio
Pharma,
Inc.
................
6,970
180,872
Catalyst
Pharmaceuticals,
Inc.
...........
141,670
2,442,391
CRISPR
Therapeutics
AG
(a)
.............
6,329
362,588
Cullinan
Therapeutics,
Inc.
.............
27,327
528,777
Cytokinetics,
Inc.
....................
25,787
1,521,691
Day
One
Biopharmaceuticals,
Inc.
(a)
.......
10,324
147,736
Denali
Therapeutics,
Inc.
...............
91,985
2,241,674
Dynavax
Technologies
Corp.
(a)
...........
91,712
1,026,257
Dyne
Therapeutics,
Inc.
...............
5,728
245,789
Eagle
Pharmaceuticals,
Inc.
............
31,367
151,189
Erasca,
Inc.
.......................
81,646
257,185
Exelixis,
Inc.
.......................
90,038
2,111,391
Halozyme
Therapeutics,
Inc.
............
58,449
3,229,892
Insmed,
Inc.
.......................
8,294
603,389
Intellia
Therapeutics,
Inc.
(a)
.............
9,441
247,449
Ionis
Pharmaceuticals,
Inc.
(a)
............
48,528
2,400,195
Ironwood
Pharmaceuticals,
Inc.
,
Class
A
....
243,960
1,666,247
Madrigal
Pharmaceuticals,
Inc.
(a)
.........
4,903
1,395,688
MiMedx
Group,
Inc.
..................
68,466
510,072
Natera,
Inc.
........................
34,651
3,547,916
Nuvalent,
Inc.
,
Class
A
(a)
...............
11,268
900,764
Precigen,
Inc.
(a)
.....................
126,281
191,947
Prothena
Corp.
plc
...................
12,737
296,517
PTC
Therapeutics,
Inc.
................
6,466
218,874
REGENXBIO,
Inc.
...................
39,634
564,785
REVOLUTION
Medicines,
Inc.
...........
9,233
421,394
2024
iShares
Annual
Financial
Statements
Schedule
of
Investments
(continued)
July
31,
2024
iShares
®
U.S.
Small-Cap
Equity
Factor
ETF
(Percentages
shown
are
based
on
Net
Assets)
Security
Shares
Shares
Value
Biotechnology
(continued)
Roivant
Sciences
Ltd.
(a)
................
12,480
$
135,408
Sana
Biotechnology,
Inc.
...............
134,702
820,335
Sarepta
Therapeutics,
Inc.
..............
23,372
3,324,433
SpringWorks
Therapeutics,
Inc.
..........
4,599
165,150
Sutro
Biopharma,
Inc.
.................
29,516
117,179
Syndax
Pharmaceuticals,
Inc.
...........
18,422
418,179
TG
Therapeutics,
Inc.
(a)
................
6,998
138,281
Travere
Therapeutics,
Inc.
..............
43,610
416,039
United
Therapeutics
Corp.
..............
12,922
4,048,333
Vanda
Pharmaceuticals,
Inc.
............
71,944
420,153
Vaxcyte,
Inc.
.......................
12,257
966,955
Vera
Therapeutics,
Inc.
,
Class
A
..........
19,227
703,516
Veracyte,
Inc.
......................
65,535
1,572,840
Vericel
Corp.
.......................
7,023
354,802
Viking
Therapeutics,
Inc.
(a)
..............
10,837
617,709
Vir
Biotechnology,
Inc.
................
143,918
1,462,207
Xencor,
Inc.
.......................
92,346
1,885,705
61,243,017
Broadline
Retail
—
0.7%
Dillard's,
Inc.
,
Class
A
.................
8,964
3,572,961
Global-e
Online
Ltd.
(a)
(b)
................
14,537
498,910
Kohl's
Corp.
.......................
55,908
1,210,967
Macy's,
Inc.
.......................
151,905
2,624,919
Qurate
Retail,
Inc.
(b)
..................
385,562
276,332
8,184,089
Building
Products
—
2.0%
Advanced
Drainage
Systems,
Inc.
........
10,400
1,841,216
Allegion
plc
........................
14,468
1,979,367
Apogee
Enterprises,
Inc.
...............
17,822
1,223,302
AZEK
Co.,
Inc.
(The)
,
Class
A
(b)
..........
17,737
796,214
Carlisle
Cos.,
Inc.
...................
11,762
4,923,338
CSW
Industrials,
Inc.
.................
2,692
873,339
Griffon
Corp.
.......................
17,248
1,242,891
JELD-WEN
Holding,
Inc.
(b)
..............
23,349
389,695
Masterbrand,
Inc.
(b)
..................
7,408
133,714
Owens
Corning
.....................
12,032
2,242,524
Quanex
Building
Products
Corp.
..........
12,319
411,455
Simpson
Manufacturing
Co.,
Inc.
.........
10,313
1,981,024
Trex
Co.,
Inc.
(b)
.....................
43,662
3,651,453
UFP
Industries,
Inc.
..................
22,746
3,000,880
24,690,412
Capital
Markets
—
3.5%
Affiliated
Managers
Group,
Inc.
(a)
.........
16,084
2,985,512
Brightsphere
Investment
Group,
Inc.
.......
5,587
146,324
Cohen
&
Steers,
Inc.
.................
4,379
375,806
Donnelley
Financial
Solutions,
Inc.
(b)
.......
23,504
1,586,050
Evercore,
Inc.
,
Class
A
................
35,776
8,957,953
Federated
Hermes,
Inc.
,
Class
B
.........
33,499
1,150,021
Houlihan
Lokey,
Inc.
,
Class
A
............
12,400
1,863,100
Interactive
Brokers
Group,
Inc.
,
Class
A
.....
33,076
3,944,974
Invesco
Ltd.
.......................
71,409
1,232,519
Janus
Henderson
Group
plc
............
87,017
3,239,643
Jefferies
Financial
Group,
Inc.
...........
70,081
4,097,636
Lazard,
Inc.
.......................
25,386
1,248,230
Moelis
&
Co.
,
Class
A
.................
3,800
258,400
Piper
Sandler
Cos.
...................
13,204
3,608,389
Stifel
Financial
Corp.
.................
19,801
1,755,755
StoneX
Group,
Inc.
(b)
.................
13,763
1,147,008
TPG,
Inc.
,
Class
A
...................
40,233
2,051,481
Virtu
Financial,
Inc.
,
Class
A
.............
11,110
303,525
XP,
Inc.
,
Class
A
....................
183,141
3,133,542
43,085,868
Security
Shares
Shares
Value
Chemicals
—
1.7%
Ashland,
Inc.
.......................
11,994
$
1,159,220
Avient
Corp.
.......................
46,920
2,122,661
Axalta
Coating
Systems
Ltd.
(b)
...........
8,185
291,795
Balchem
Corp.
.....................
3,288
583,488
Cabot
Corp.
.......................
14,835
1,487,802
Chemours
Co.
(The)
..................
58,753
1,420,060
Element
Solutions,
Inc.
................
71,166
1,917,924
Hawkins,
Inc.
......................
6,071
630,777
Huntsman
Corp.
....................
66,947
1,602,042
Ingevity
Corp.
(b)
.....................
2,583
118,534
Innospec,
Inc.
......................
4,828
633,144
Mativ
Holdings,
Inc.
..................
89,829
1,714,836
Olin
Corp.
.........................
29,302
1,336,464
RPM
International,
Inc.
................
21,157
2,569,729
Scotts
Miracle-Gro
Co.
(The)
............
32,807
2,578,630
Trinseo
plc
........................
117,720
340,211
Tronox
Holdings
plc
..................
6,388
103,230
20,610,547
Commercial
Services
&
Supplies
—
1.3%
ACCO
Brands
Corp.
..................
111,964
572,136
Brady
Corp.
,
Class
A,
NVS
.............
29,585
2,118,582
Brink's
Co.
(The)
....................
8,479
932,605
Cimpress
plc
(a)
(b)
....................
15,919
1,452,927
Clean
Harbors,
Inc.
(b)
.................
3,402
812,160
CoreCivic,
Inc.
(b)
....................
69,726
971,981
Deluxe
Corp.
.......................
45,022
1,097,636
GEO
Group,
Inc.
(The)
(b)
...............
59,820
867,390
HNI
Corp.
.........................
7,628
419,159
Interface,
Inc.
......................
25,090
433,555
Matthews
International
Corp.
,
Class
A
......
4,343
125,730
MSA
Safety,
Inc.
....................
1,439
271,467
Steelcase,
Inc.
,
Class
A
...............
47,072
682,073
Tetra
Tech,
Inc.
.....................
18,439
3,931,932
Vestis
Corp.
.......................
53,727
696,839
15,386,172
Communications
Equipment
—
0.3%
(b)
Calix,
Inc.
.........................
21,532
885,611
Ciena
Corp.
.......................
5,598
295,238
Extreme
Networks,
Inc.
................
140,364
2,007,205
NetScout
Systems,
Inc.
................
37,085
754,680
Viavi
Solutions,
Inc.
..................
33,696
270,916
4,213,650
Construction
&
Engineering
—
2.0%
AECOM
..........................
23,381
2,118,552
API
Group
Corp.
(b)
...................
31,432
1,190,959
Arcosa,
Inc.
.......................
12,077
1,122,074
Argan,
Inc.
........................
7,103
560,640
Comfort
Systems
USA,
Inc.
.............
13,027
4,330,435
Dycom
Industries,
Inc.
(b)
...............
1,548
284,074
EMCOR
Group,
Inc.
..................
24,530
9,209,543
Fluor
Corp.
(b)
.......................
19,874
955,939
MDU
Resources
Group,
Inc.
............
28,162
758,684
Sterling
Infrastructure,
Inc.
(a)
(b)
...........
11,869
1,381,077
Valmont
Industries,
Inc.
................
5,818
1,735,859
WillScot
Holdings
Corp.
(b)
..............
32,070
1,314,870
24,962,706
Construction
Materials
—
0.1%
Knife
River
Corp.
(b)
...................
9,868
784,703
Consumer
Finance
—
1.1%
Bread
Financial
Holdings,
Inc.
...........
4,515
246,429
Credit
Acceptance
Corp.
(a)
(b)
.............
2,398
1,378,610
Enova
International,
Inc.
(b)
..............
13,110
1,133,622
Schedule
of
Investments
(continued)
July
31,
2024
iShares
®
U.S.
Small-Cap
Equity
Factor
ETF
(Percentages
shown
are
based
on
Net
Assets)
Security
Shares
Shares
Value
Consumer
Finance
(continued)
Navient
Corp.
......................
164,823
$
2,704,745
OneMain
Holdings,
Inc.
................
43,778
2,287,838
PROG
Holdings,
Inc.
.................
46,401
2,090,829
SLM
Corp.
........................
119,047
2,701,176
SoFi
Technologies,
Inc.
(a)
(b)
.............
59,151
445,999
12,989,248
Consumer
Staples
Distribution
&
Retail
—
1.1%
BJ's
Wholesale
Club
Holdings,
Inc.
(a)
(b)
......
23,606
2,076,384
Casey's
General
Stores,
Inc.
............
1,849
717,116
Grocery
Outlet
Holding
Corp.
(b)
...........
5,564
108,832
Ingles
Markets,
Inc.
,
Class
A
............
43,593
3,533,213
Sprouts
Farmers
Market,
Inc.
(b)
...........
55,890
5,582,852
United
Natural
Foods,
Inc.
(b)
.............
9,457
146,583
US
Foods
Holding
Corp.
(b)
..............
35,450
1,928,126
14,093,106
Containers
&
Packaging
—
0.6%
Berry
Global
Group,
Inc.
...............
20,122
1,322,418
Graphic
Packaging
Holding
Co.
..........
119,993
3,611,789
Greif,
Inc.
,
Class
A,
NVS
...............
2,525
168,367
O-I
Glass,
Inc.
(b)
.....................
33,700
450,232
Sealed
Air
Corp.
....................
8,365
318,288
Sonoco
Products
Co.
.................
24,480
1,319,962
7,191,056
Diversified
Consumer
Services
—
1.4%
ADT,
Inc.
.........................
94,972
738,882
Coursera,
Inc.
(b)
.....................
171,323
1,593,304
Duolingo,
Inc.
,
Class
A
(a)
(b)
..............
17,883
3,074,803
H&R
Block,
Inc.
.....................
88,042
5,101,153
Perdoceo
Education
Corp.
..............
113,206
2,806,377
Service
Corp.
International
.............
27,957
2,234,044
Stride,
Inc.
(a)
(b)
......................
20,850
1,584,183
Udemy,
Inc.
(b)
......................
48,557
448,667
17,581,413
Diversified
Telecommunication
Services
—
1.0%
Bandwidth,
Inc.
,
Class
A
(a)
(b)
.............
77,349
1,765,104
Frontier
Communications
Parent,
Inc.
(a)
(b)
....
50,536
1,480,705
IDT
Corp.
,
Class
B
...................
10,264
392,393
IHS
Holding
Ltd.
(a)
(b)
..................
95,594
270,531
Iridium
Communications,
Inc.
............
13,116
376,429
Liberty
Global
Ltd.
,
Class
A
(b)
............
154,207
3,005,494
Liberty
Global
Ltd.
,
Class
C,
NVS
(a)
(b)
.......
49,972
1,004,937
Liberty
Latin
America
Ltd.
,
Class
A
(b)
.......
161,102
1,688,349
Lumen
Technologies,
Inc.
(b)
.............
856,923
2,699,308
12,683,250
Electric
Utilities
—
0.9%
Hawaiian
Electric
Industries,
Inc.
.........
65,835
1,090,227
IDACORP,
Inc.
.....................
57,645
5,634,799
OGE
Energy
Corp.
...................
38,149
1,479,037
Otter
Tail
Corp.
.....................
10,485
1,016,206
PNM
Resources,
Inc.
.................
30,836
1,282,161
Portland
General
Electric
Co.
............
19,581
927,748
11,430,178
Electrical
Equipment
—
1.9%
Acuity
Brands,
Inc.
...................
12,999
3,267,299
Array
Technologies,
Inc.
(a)
(b)
.............
54,495
573,287
Atkore,
Inc.
........................
30,684
4,142,340
EnerSys
..........................
5,375
590,874
Fluence
Energy,
Inc.
,
Class
A
(a)
(b)
.........
25,548
418,476
Generac
Holdings,
Inc.
(b)
...............
10,300
1,603,504
NEXTracker,
Inc.
,
Class
A
(b)
.............
33,804
1,661,129
nVent
Electric
plc
....................
86,940
6,314,452
Security
Shares
Shares
Value
Electrical
Equipment
(continued)
Powell
Industries,
Inc.
.................
9,789
$
1,797,554
Regal
Rexnord
Corp.
.................
15,003
2,410,682
Thermon
Group
Holdings,
Inc.
(b)
..........
22,606
741,703
23,521,300
Electronic
Equipment,
Instruments
&
Components
—
2.3%
Advanced
Energy
Industries,
Inc.
.........
1,733
201,669
Arrow
Electronics,
Inc.
(a)
(b)
..............
20,037
2,478,376
Badger
Meter,
Inc.
...................
9,345
1,926,565
Belden,
Inc.
.......................
9,180
850,894
Crane
NXT
Co.
.....................
20,090
1,263,259
ePlus,
Inc.
(a)
(b)
......................
11,682
1,073,809
Flex
Ltd.
(b)
.........................
108,005
3,472,361
Insight
Enterprises,
Inc.
(a)
(b)
.............
5,165
1,159,542
Jabil,
Inc.
.........................
55,441
6,246,537
Knowles
Corp.
(b)
....................
56,610
1,034,265
Littelfuse,
Inc.
......................
2,773
740,696
Napco
Security
Technologies,
Inc.
........
17,497
976,508
Novanta,
Inc.
(a)
(b)
....................
10,542
1,910,000
OSI
Systems,
Inc.
(b)
..................
1,368
202,437
Sanmina
Corp.
(b)
....................
36,469
2,747,210
Vishay
Intertechnology,
Inc.
.............
69,286
1,684,343
Vontier
Corp.
.......................
17,452
684,642
28,653,113
Energy
Equipment
&
Services
—
1.7%
Archrock,
Inc.
......................
65,666
1,361,256
ChampionX
Corp.
...................
47,725
1,635,059
Expro
Group
Holdings
NV
(a)
(b)
............
16,110
374,074
Helmerich
&
Payne,
Inc.
...............
36,892
1,491,175
Nabors
Industries
Ltd.
(b)
...............
12,404
1,275,503
NOV,
Inc.
.........................
108,083
2,250,288
Oceaneering
International,
Inc.
(a)
(b)
........
51,811
1,555,366
Oil
States
International,
Inc.
(b)
............
27,883
159,491
Patterson-UTI
Energy,
Inc.
.............
172,688
1,897,841
Select
Water
Solutions,
Inc.
,
Class
A
.......
64,226
759,151
Transocean
Ltd.
(a)
(b)
..................
317,245
1,836,849
Valaris
Ltd.
(a)
(b)
......................
2,118
166,454
Weatherford
International
plc
(b)
...........
54,427
6,414,766
21,177,273
Entertainment
—
0.1%
Endeavor
Group
Holdings,
Inc.
,
Class
A
(a)
...
35,935
985,338
TKO
Group
Holdings,
Inc.
,
Class
A
........
2,196
240,132
1,225,470
Financial
Services
—
1.9%
AvidXchange
Holdings,
Inc.
(b)
............
68,669
613,901
Banco
Latinoamericano
de
Comercio
Exterior
SA
,
Class
E
.....................
93,278
3,015,678
Euronet
Worldwide,
Inc.
(b)
..............
10,984
1,120,258
EVERTEC,
Inc.
.....................
10,715
369,346
Federal
Agricultural
Mortgage
Corp.
,
Class
C,
NVS
..........................
6,327
1,304,754
Flywire
Corp.
(a)
(b)
....................
23,871
437,078
Hannon
Armstrong
Sustainable
Infrastructure
Capital,
Inc.
.....................
31,322
1,026,422
Jackson
Financial,
Inc.
,
Class
A
..........
10,446
919,875
MGIC
Investment
Corp.
...............
49,100
1,219,644
Mr
Cooper
Group,
Inc.
(b)
...............
61,598
5,536,428
NCR
Atleos
Corp.
(b)
..................
17,816
572,784
PennyMac
Financial
Services,
Inc.
........
4,932
483,928
Radian
Group,
Inc.
...................
16,691
619,236
Rocket
Cos.,
Inc.
,
Class
A
(a)
(b)
............
32,504
526,240
StoneCo
Ltd.
,
Class
A
(b)
...............
64,221
842,580
Toast,
Inc.
,
Class
A
(b)
.................
52,357
1,369,659
2024
iShares
Annual
Financial
Statements
Schedule
of
Investments
(continued)
July
31,
2024
iShares
®
U.S.
Small-Cap
Equity
Factor
ETF
(Percentages
shown
are
based
on
Net
Assets)
Security
Shares
Shares
Value
Financial
Services
(continued)
Voya
Financial,
Inc.
..................
26,565
$
1,932,072
Walker
&
Dunlop,
Inc.
.................
2,785
297,717
WEX,
Inc.
(b)
........................
6,774
1,242,690
23,450,290
Food
Products
—
0.5%
Adecoagro
SA
......................
99,814
964,203
Flowers
Foods,
Inc.
..................
36,395
819,615
Hain
Celestial
Group,
Inc.
(The)
(b)
.........
26,459
204,793
John
B
Sanfilippo
&
Son,
Inc.
............
27,312
2,864,209
Lancaster
Colony
Corp.
...............
1,759
339,593
Tootsie
Roll
Industries,
Inc.
.............
4,375
134,925
WK
Kellogg
Co.
.....................
31,038
546,269
5,873,607
Gas
Utilities
—
0.7%
National
Fuel
Gas
Co.
................
27,736
1,625,052
New
Jersey
Resources
Corp.
............
38,619
1,805,438
Northwest
Natural
Holding
Co.
...........
3,390
135,532
ONE
Gas,
Inc.
......................
22,908
1,595,084
Southwest
Gas
Holdings,
Inc.
...........
1,935
143,500
Spire,
Inc.
.........................
23,119
1,539,494
UGI
Corp.
.........................
54,515
1,350,882
8,194,982
Ground
Transportation
—
1.0%
ArcBest
Corp.
......................
6,412
808,233
Avis
Budget
Group,
Inc.
...............
11,093
1,120,504
Hertz
Global
Holdings,
Inc.
(a)
(b)
...........
32,320
131,865
Knight-Swift
Transportation
Holdings,
Inc.
...
8,991
489,380
Landstar
System,
Inc.
.................
6,848
1,302,832
Lyft,
Inc.
,
Class
A
(b)
...................
67,432
812,555
Ryder
System,
Inc.
...................
22,317
3,127,951
Saia,
Inc.
(a)
(b)
.......................
3,852
1,609,558
Schneider
National,
Inc.
,
Class
B
.........
21,089
567,505
XPO,
Inc.
(b)
........................
14,940
1,716,457
11,686,840
Health
Care
Equipment
&
Supplies
—
2.3%
AtriCure,
Inc.
(b)
.....................
12,066
260,264
Atrion
Corp.
.......................
624
285,979
Cerus
Corp.
(b)
......................
351,637
794,700
CONMED
Corp.
.....................
11,835
817,088
Dentsply
Sirona,
Inc.
.................
136,750
3,711,395
Embecta
Corp.
.....................
28,682
449,447
Envista
Holdings
Corp.
(b)
...............
35,399
604,261
Globus
Medical,
Inc.
,
Class
A
(b)
..........
4,283
308,205
Haemonetics
Corp.
(a)
(b)
................
28,957
2,607,578
Inari
Medical,
Inc.
(b)
..................
19,196
893,766
Inmode
Ltd.
(b)
......................
71,479
1,295,199
Inspire
Medical
Systems,
Inc.
(b)
..........
14,999
2,115,609
Integer
Holdings
Corp.
(a)
(b)
..............
4,542
539,408
iRhythm
Technologies,
Inc.
(b)
............
9,371
808,249
Lantheus
Holdings,
Inc.
(b)
..............
28,284
2,965,012
LeMaitre
Vascular,
Inc.
................
2,726
236,862
LivaNova
plc
(b)
......................
41,941
2,071,885
Masimo
Corp.
(b)
.....................
6,608
706,924
Merit
Medical
Systems,
Inc.
(b)
............
17,690
1,508,780
Nevro
Corp.
(b)
......................
12,192
121,066
Orthofix
Medical,
Inc.
(b)
................
24,734
397,723
Penumbra,
Inc.
(a)
(b)
...................
3,755
627,423
QuidelOrtho
Corp.
(b)
..................
12,198
479,259
Solventum
Corp.
(a)
(b)
..................
60,337
3,552,642
28,158,724
Security
Shares
Shares
Value
Health
Care
Providers
&
Services
—
1.7%
Acadia
Healthcare
Co.,
Inc.
(b)
............
14,489
$
939,612
Accolade,
Inc.
(a)
(b)
....................
116,031
475,727
Alignment
Healthcare,
Inc.
(b)
............
26,437
231,059
AMN
Healthcare
Services,
Inc.
(a)
(b)
........
17,835
1,206,003
Brookdale
Senior
Living,
Inc.
(b)
...........
86,029
665,004
Chemed
Corp.
......................
7,137
4,069,232
Encompass
Health
Corp.
..............
6,280
583,663
Ensign
Group,
Inc.
(The)
...............
12,541
1,765,146
Guardant
Health,
Inc.
(b)
................
82,929
2,913,296
HealthEquity,
Inc.
(b)
...................
1,653
129,728
Hims
&
Hers
Health,
Inc.
,
Class
A
(b)
........
55,463
1,178,034
National
Research
Corp.
...............
23,876
608,599
Option
Care
Health,
Inc.
(b)
..............
44,622
1,324,827
Owens
&
Minor,
Inc.
(b)
.................
45,627
749,195
Patterson
Cos.,
Inc.
..................
16,744
422,786
Tenet
Healthcare
Corp.
(b)
...............
25,209
3,773,787
21,035,698
Health
Care
REITs
—
0.2%
Medical
Properties
Trust,
Inc.
(a)
...........
179,722
864,463
National
Health
Investors,
Inc.
...........
7,397
553,739
Omega
Healthcare
Investors,
Inc.
.........
30,249
1,101,064
2,519,266
Health
Care
Technology
—
0.3%
Definitive
Healthcare
Corp.
,
Class
A
(b)
......
120,727
470,835
Doximity,
Inc.
,
Class
A
(b)
...............
38,279
1,071,812
Evolent
Health,
Inc.
,
Class
A
(b)
...........
17,629
411,108
Health
Catalyst,
Inc.
(b)
.................
17,730
130,670
HealthStream,
Inc.
...................
17,640
524,085
Teladoc
Health,
Inc.
(a)
(b)
................
149,923
1,413,774
4,022,284
Hotel
&
Resort
REITs
—
0.2%
Park
Hotels
&
Resorts,
Inc.
.............
47,019
708,106
Pebblebrook
Hotel
Trust
(a)
..............
7,770
106,371
RLJ
Lodging
Trust
...................
29,255
276,167
Ryman
Hospitality
Properties,
Inc.
........
1,541
154,886
Service
Properties
Trust
...............
106,954
606,429
Sunstone
Hotel
Investors,
Inc.
...........
19,111
197,990
Xenia
Hotels
&
Resorts,
Inc.
............
25,972
360,492
2,410,441
Hotels,
Restaurants
&
Leisure
—
2.6%
Arcos
Dorados
Holdings,
Inc.
,
Class
A
......
117,209
1,132,239
Bloomin'
Brands,
Inc.
.................
46,820
976,197
Boyd
Gaming
Corp.
..................
2,608
158,749
Cava
Group,
Inc.
(b)
...................
32,098
2,703,294
Cheesecake
Factory,
Inc.
(The)
..........
3,327
129,387
Churchill
Downs,
Inc.
.................
8,809
1,264,620
Dine
Brands
Global,
Inc.
...............
14,502
519,752
Everi
Holdings,
Inc.
(b)
.................
62,051
798,596
International
Game
Technology
plc
........
89,702
2,105,306
Jack
in
the
Box,
Inc.
..................
24,295
1,444,095
Life
Time
Group
Holdings,
Inc.
(a)
(b)
.........
15,199
315,683
Light
&
Wonder,
Inc.
,
Class
A
(b)
...........
23,680
2,538,496
MakeMyTrip
Ltd.
(a)
(b)
..................
14,768
1,382,137
Marriott
Vacations
Worldwide
Corp.
........
9,451
799,366
Papa
John's
International,
Inc.
...........
12,840
567,913
Planet
Fitness,
Inc.
,
Class
A
(b)
...........
12,289
905,699
PlayAGS,
Inc.
(b)
.....................
43,684
500,182
Six
Flags
Entertainment
Corp.
...........
16,457
783,847
Texas
Roadhouse,
Inc.
................
4,795
837,255
Travel
+
Leisure
Co.
..................
39,149
1,804,377
United
Parks
&
Resorts,
Inc.
(a)
(b)
..........
38,469
2,025,393
Wendy's
Co.
(The)
...................
86,998
1,472,876
Schedule
of
Investments
(continued)
July
31,
2024
iShares
®
U.S.
Small-Cap
Equity
Factor
ETF
(Percentages
shown
are
based
on
Net
Assets)
Security
Shares
Shares
Value
Hotels,
Restaurants
&
Leisure
(continued)
Wingstop,
Inc.
......................
14,175
$
5,299,749
Wyndham
Hotels
&
Resorts,
Inc.
.........
16,560
1,253,923
31,719,131
Household
Durables
—
1.9%
Cavco
Industries,
Inc.
(b)
................
4,477
1,856,254
GoPro,
Inc.
,
Class
A
(b)
.................
189,129
287,476
Helen
of
Troy
Ltd.
(a)
(b)
.................
8,224
486,121
Hovnanian
Enterprises,
Inc.
,
Class
A
(b)
......
8,563
1,797,288
Installed
Building
Products,
Inc.
..........
1,390
375,786
Lovesac
Co.
(The)
(a)
(b)
.................
46,498
1,272,185
SharkNinja,
Inc.
.....................
34,743
2,670,000
Skyline
Champion
Corp.
(b)
..............
20,787
1,694,348
Sonos,
Inc.
(b)
.......................
45,730
617,355
Taylor
Morrison
Home
Corp.
(b)
...........
17,299
1,160,417
Tempur
Sealy
International,
Inc.
..........
55,736
2,917,780
Toll
Brothers,
Inc.
....................
6,602
942,171
TopBuild
Corp.
(b)
....................
7,683
3,676,623
TRI
Pointe
Homes,
Inc.
(b)
...............
44,862
2,030,005
Worthington
Enterprises,
Inc.
............
25,801
1,287,728
23,071,537
Household
Products
—
0.2%
Central
Garden
&
Pet
Co.
,
Class
A,
NVS
(b)
...
22,382
769,046
Energizer
Holdings,
Inc.
...............
4,809
148,069
Spectrum
Brands
Holdings,
Inc.
..........
21,209
1,794,493
2,711,608
Independent
Power
and
Renewable
Electricity
Producers
—
0.3%
Atlantica
Sustainable
Infrastructure
plc
.....
84,038
1,857,240
Clearway
Energy,
Inc.
,
Class
A
...........
77,788
1,915,918
3,773,158
Industrial
REITs
—
1.0%
EastGroup
Properties,
Inc.
.............
6,940
1,297,711
First
Industrial
Realty
Trust,
Inc.
..........
141,484
7,742,004
Industrial
Logistics
Properties
Trust
........
205,305
1,055,268
LXP
Industrial
Trust
..................
96,713
996,144
STAG
Industrial,
Inc.
.................
13,753
561,260
11,652,387
Insurance
—
2.7%
Ambac
Financial
Group,
Inc.
(b)
...........
48,887
644,820
AMERISAFE,
Inc.
...................
5,519
262,042
Assurant,
Inc.
......................
10,411
1,820,572
Assured
Guaranty
Ltd.
................
37,692
3,104,690
Axis
Capital
Holdings
Ltd.
..............
1,881
142,486
CNO
Financial
Group,
Inc.
..............
54,273
1,891,957
Employers
Holdings,
Inc.
...............
25,928
1,244,803
First
American
Financial
Corp.
...........
34,475
2,088,495
Genworth
Financial,
Inc.
,
Class
A
(b)
........
212,866
1,441,103
Kinsale
Capital
Group,
Inc.
(a)
............
4,833
2,209,019
Mercury
General
Corp.
................
10,466
626,599
Old
Republic
International
Corp.
..........
143,979
4,984,553
Oscar
Health,
Inc.
,
Class
A
(b)
............
50,067
885,185
Primerica,
Inc.
......................
12,242
3,082,168
RenaissanceRe
Holdings
Ltd.
...........
10,844
2,514,832
RLI
Corp.
.........................
2,522
379,788
Ryan
Specialty
Holdings,
Inc.
,
Class
A
......
28,407
1,749,587
Universal
Insurance
Holdings,
Inc.
........
19,565
387,583
Unum
Group
.......................
22,675
1,304,493
White
Mountains
Insurance
Group
Ltd.
.....
1,069
1,909,234
32,674,009
Interactive
Media
&
Services
—
0.6%
Angi,
Inc.
,
Class
A
(a)
(b)
.................
354,280
821,930
Bumble,
Inc.
,
Class
A
(b)
................
32,426
302,859
Security
Shares
Shares
Value
Interactive
Media
&
Services
(continued)
Cargurus,
Inc.
,
Class
A
(b)
...............
30,178
$
749,018
Cars.com,
Inc.
(b)
.....................
57,631
1,188,351
Shutterstock,
Inc.
....................
45,524
2,013,071
Vimeo,
Inc.
(b)
.......................
246,920
992,618
Yelp,
Inc.
(b)
........................
20,150
734,065
ZipRecruiter,
Inc.
,
Class
A
(b)
.............
69,680
638,269
7,440,181
IT
Services
—
0.8%
(b)
ASGN,
Inc.
........................
1,942
183,849
BigCommerce
Holdings,
Inc.
............
15,654
126,798
Couchbase,
Inc.
....................
41,033
787,423
DigitalOcean
Holdings,
Inc.
(a)
............
12,662
419,492
Kyndryl
Holdings,
Inc.
.................
29,630
796,158
Rackspace
Technology,
Inc.
.............
74,481
174,286
Squarespace,
Inc.
,
Class
A
.............
43,806
1,935,787
Wix.com
Ltd.
.......................
35,640
5,557,167
9,980,960
Leisure
Products
—
1.0%
Acushnet
Holdings
Corp.
...............
25,149
1,825,315
Brunswick
Corp.
....................
14,733
1,200,003
Hasbro,
Inc.
.......................
39,105
2,520,708
Latham
Group,
Inc.
(b)
.................
54,849
199,650
Mattel,
Inc.
(b)
.......................
80,304
1,549,064
Polaris,
Inc.
........................
13,833
1,152,012
Topgolf
Callaway
Brands
Corp.
(b)
.........
34,113
562,865
Vista
Outdoor,
Inc.
(b)
..................
55,414
2,251,471
YETI
Holdings,
Inc.
(a)
(b)
................
27,140
1,122,239
12,383,327
Life
Sciences
Tools
&
Services
—
0.8%
AbCellera
Biologics,
Inc.
(a)
(b)
.............
33,656
109,719
Bruker
Corp.
.......................
33,467
2,292,824
Medpace
Holdings,
Inc.
(b)
..............
14,964
5,724,029
Repligen
Corp.
(a)
(b)
...................
7,242
1,211,949
9,338,521
Machinery
—
4.6%
AGCO
Corp.
.......................
28,282
2,670,387
Alamo
Group,
Inc.
...................
2,463
474,669
Albany
International
Corp.
,
Class
A
........
1,754
164,139
Allison
Transmission
Holdings,
Inc.
........
62,467
5,533,952
Chart
Industries,
Inc.
(a)
(b)
...............
3,596
579,244
Crane
Co.
.........................
26,603
4,267,653
Donaldson
Co.,
Inc.
..................
31,064
2,324,209
Enerpac
Tool
Group
Corp.
,
Class
A
........
18,950
761,790
Esab
Corp.
........................
18,307
1,859,991
Federal
Signal
Corp.
.................
3,047
304,609
Graco,
Inc.
........................
44,680
3,800,034
Hillenbrand,
Inc.
....................
36,084
1,595,995
Hydrofarm
Holdings
Group,
Inc.
(a)
(b)
........
159,024
101,108
ITT,
Inc.
..........................
26,819
3,793,816
Kadant,
Inc.
.......................
5,360
1,883,986
Lincoln
Electric
Holdings,
Inc.
...........
3,356
689,356
Manitowoc
Co.,
Inc.
(The)
(b)
.............
25,190
318,402
Middleby
Corp.
(The)
(a)
(b)
...............
8,022
1,087,623
Mueller
Industries,
Inc.
................
70,333
4,989,423
Nordson
Corp.
......................
10,043
2,514,064
SPX
Technologies,
Inc.
(b)
...............
23,865
3,521,042
Symbotic,
Inc.
,
Class
A
(a)
(b)
..............
10,536
282,470
Tennant
Co.
.......................
8,444
909,334
Terex
Corp.
........................
46,140
2,918,816
Timken
Co.
(The)
....................
32,552
2,830,396
Toro
Co.
(The)
......................
28,004
2,680,823
Trinity
Industries,
Inc.
.................
20,069
663,481
2024
iShares
Annual
Financial
Statements
Schedule
of
Investments
(continued)
July
31,
2024
iShares
®
U.S.
Small-Cap
Equity
Factor
ETF
(Percentages
shown
are
based
on
Net
Assets)
Security
Shares
Shares
Value
Machinery
(continued)
Wabash
National
Corp.
................
50,195
$
1,078,691
Watts
Water
Technologies,
Inc.
,
Class
A
.....
7,687
1,595,206
56,194,709
Marine
Transportation
—
0.3%
Matson,
Inc.
.......................
16,616
2,205,109
ZIM
Integrated
Shipping
Services
Ltd.
......
72,972
1,436,819
3,641,928
Media
—
0.9%
AMC
Networks,
Inc.
,
Class
A
(b)
...........
37,034
412,188
EchoStar
Corp.
,
Class
A
(b)
..............
109,041
2,189,543
John
Wiley
&
Sons,
Inc.
,
Class
A
.........
16,782
801,341
Magnite,
Inc.
(b)
......................
25,093
364,852
New
York
Times
Co.
(The)
,
Class
A
........
29,010
1,554,646
Nexstar
Media
Group,
Inc.
..............
5,878
1,086,196
Paramount
Global
,
Class
B,
NVS
.........
54,696
624,628
Sinclair,
Inc.
,
Class
A
.................
117,593
1,808,580
Stagwell,
Inc.
,
Class
A
(b)
...............
21,666
144,729
TechTarget,
Inc.
(b)
....................
13,511
432,352
TEGNA,
Inc.
.......................
72,117
1,148,824
10,567,879
Metals
&
Mining
—
1.9%
Alcoa
Corp.
........................
42,610
1,407,834
Algoma
Steel
Group,
Inc.
(a)
.............
16,776
148,468
Alpha
Metallurgical
Resources,
Inc.
.......
7,493
2,213,507
Arch
Resources,
Inc.
,
Class
A
...........
2,498
366,082
ATI,
Inc.
(a)
(b)
........................
31,478
2,131,375
Commercial
Metals
Co.
................
30,507
1,833,471
Kaiser
Aluminum
Corp.
................
2,251
177,131
Lithium
Americas
Corp.
(a)
(b)
.............
168,535
456,730
Materion
Corp.
.....................
13,788
1,660,489
Nexa
Resources
SA
(b)
.................
22,194
160,684
Reliance,
Inc.
......................
20,730
6,313,529
Royal
Gold,
Inc.
.....................
12,673
1,750,395
Ryerson
Holding
Corp.
................
15,877
377,714
United
States
Steel
Corp.
..............
35,737
1,468,433
Warrior
Met
Coal,
Inc.
.................
11,155
770,922
Worthington
Steel,
Inc.
................
66,731
2,660,565
23,897,329
Mortgage
Real
Estate
Investment
Trusts
(REITs)
—
0.6%
AGNC
Investment
Corp.
...............
221,380
2,216,014
ARMOUR
Residential
REIT,
Inc.
(a)
........
6,038
121,967
BrightSpire
Capital,
Inc.
,
Class
A
.........
66,204
379,349
Granite
Point
Mortgage
Trust,
Inc.
........
152,357
454,024
Invesco
Mortgage
Capital,
Inc.
...........
53,002
481,258
KKR
Real
Estate
Finance
Trust,
Inc.
.......
43,843
503,318
Ladder
Capital
Corp.
,
Class
A
...........
66,115
793,380
MFA
Financial,
Inc.
...................
131,677
1,473,465
Starwood
Property
Trust,
Inc.
............
39,138
780,803
Two
Harbors
Investment
Corp.
...........
26,542
357,521
7,561,099
Multi-Utilities
—
0.0%
Black
Hills
Corp.
....................
2,222
131,209
Unitil
Corp.
........................
2,223
136,226
267,435
Office
REITs
—
1.9%
Brandywine
Realty
Trust
...............
327,811
1,652,167
COPT
Defense
Properties
..............
13,877
402,017
Cousins
Properties,
Inc.
...............
34,943
961,282
Douglas
Emmett,
Inc.
.................
76,984
1,238,672
Equity
Commonwealth
(b)
...............
43,088
877,703
Highwoods
Properties,
Inc.
.............
73,831
2,286,546
Security
Shares
Shares
Value
Office
REITs
(continued)
Hudson
Pacific
Properties,
Inc.
...........
74,168
$
444,266
Kilroy
Realty
Corp.
...................
40,709
1,505,012
Office
Properties
Income
Trust
...........
218,073
543,002
Paramount
Group,
Inc.
................
424,778
2,225,837
Piedmont
Office
Realty
Trust,
Inc.
,
Class
A
...
230,991
1,998,072
SL
Green
Realty
Corp.
................
77,956
5,194,988
Vornado
Realty
Trust
.................
141,257
4,236,297
23,565,861
Oil,
Gas
&
Consumable
Fuels
—
3.4%
Antero
Midstream
Corp.
...............
322,929
4,637,260
Antero
Resources
Corp.
(b)
..............
91,183
2,646,131
APA
Corp.
........................
126,319
3,939,890
Berry
Corp.
........................
48,499
332,703
California
Resources
Corp.
.............
21,902
1,126,639
Chesapeake
Energy
Corp.
.............
39,298
2,999,616
Chord
Energy
Corp.
..................
2,703
463,997
CNX
Resources
Corp.
(a)
(b)
..............
19,708
521,671
CONSOL
Energy,
Inc.
(b)
...............
9,189
917,154
CVR
Energy,
Inc.
....................
23,971
685,571
Dorian
LPG
Ltd.
.....................
18,824
769,149
DT
Midstream,
Inc.
...................
37,262
2,808,064
HF
Sinclair
Corp.
....................
2,300
118,381
International
Seaways,
Inc.
.............
7,340
411,040
Kosmos
Energy
Ltd.
(b)
.................
164,014
906,997
Murphy
Oil
Corp.
....................
75,281
3,115,128
Ovintiv,
Inc.
........................
72,456
3,364,857
PBF
Energy,
Inc.
,
Class
A
..............
9,509
387,492
Permian
Resources
Corp.
,
Class
A
........
55,852
856,770
Range
Resources
Corp.
...............
75,448
2,356,241
SFL
Corp.
Ltd.
......................
81,323
962,864
SM
Energy
Co.
.....................
21,216
980,179
Southwestern
Energy
Co.
(b)
.............
19,768
127,503
Targa
Resources
Corp.
................
41,056
5,554,056
W&T
Offshore,
Inc.
...................
64,733
156,006
41,145,359
Paper
&
Forest
Products
—
0.5%
Louisiana-Pacific
Corp.
................
55,844
5,481,647
Mercer
International,
Inc.
...............
104,351
795,155
Sylvamo
Corp.
.....................
2,466
181,769
6,458,571
Passenger
Airlines
—
0.1%
Copa
Holdings
SA
,
Class
A,
NVS
.........
1,190
105,612
Joby
Aviation,
Inc.
,
Class
A
(a)
(b)
...........
123,321
737,460
843,072
Personal
Care
Products
—
0.8%
BellRing
Brands,
Inc.
(b)
................
10,436
535,158
Coty,
Inc.
,
Class
A
(a)
(b)
.................
97,810
973,209
Edgewell
Personal
Care
Co.
............
3,441
134,715
elf
Beauty,
Inc.
(a)
(b)
...................
20,907
3,608,130
Herbalife
Ltd.
(b)
.....................
72,314
888,016
Inter
Parfums,
Inc.
...................
12,949
1,821,665
Medifast,
Inc.
......................
47,744
1,047,026
Nu
Skin
Enterprises,
Inc.
,
Class
A
.........
36,587
410,506
Olaplex
Holdings,
Inc.
(b)
...............
62,894
130,820
USANA
Health
Sciences,
Inc.
(b)
..........
8,168
364,293
9,913,538
Pharmaceuticals
—
1.0%
Amphastar
Pharmaceuticals,
Inc.
(b)
........
19,866
864,568
Amylyx
Pharmaceuticals,
Inc.
(b)
..........
248,961
512,860
Athira
Pharma,
Inc.
(b)
.................
142,236
453,733
Axsome
Therapeutics,
Inc.
(a)
(b)
...........
29,832
2,604,632
Corcept
Therapeutics,
Inc.
(a)
(b)
...........
71,145
2,751,177
Schedule
of
Investments
(continued)
July
31,
2024
iShares
®
U.S.
Small-Cap
Equity
Factor
ETF
(Percentages
shown
are
based
on
Net
Assets)
Security
Shares
Shares
Value
Pharmaceuticals
(continued)
EyePoint
Pharmaceuticals,
Inc.
(b)
.........
35,395
$
349,702
Innoviva,
Inc.
(b)
.....................
63,202
1,190,726
Intra-Cellular
Therapies,
Inc.
(b)
...........
6,767
532,698
Ligand
Pharmaceuticals,
Inc.
(a)
(b)
..........
10,135
1,104,614
Omeros
Corp.
(a)
(b)
....................
49,736
268,077
Perrigo
Co.
plc
.....................
16,230
458,822
Prestige
Consumer
Healthcare,
Inc.
(b)
......
13,931
986,454
Supernus
Pharmaceuticals,
Inc.
(a)
(b)
........
9,696
289,135
Tilray
Brands,
Inc.
,
Class
2
(a)
(b)
...........
217,714
441,959
12,809,157
Professional
Services
—
2.5%
Alight,
Inc.
,
Class
A
(a)
(b)
................
152,838
1,156,984
CACI
International,
Inc.
,
Class
A
(b)
........
426
196,591
Clarivate
plc
(a)
(b)
.....................
64,217
432,823
Conduent,
Inc.
(b)
....................
75,888
309,623
Dun
&
Bradstreet
Holdings,
Inc.
..........
29,846
324,724
ExlService
Holdings,
Inc.
(b)
.............
66,924
2,359,740
Exponent,
Inc.
......................
16,032
1,700,675
Fiverr
International
Ltd.
(a)
(b)
..............
35,902
937,401
FTI
Consulting,
Inc.
(b)
.................
2,460
536,206
Heidrick
&
Struggles
International,
Inc.
.....
88,967
3,571,135
Huron
Consulting
Group,
Inc.
(b)
...........
27,138
2,985,451
ICF
International,
Inc.
.................
8,328
1,225,049
Insperity,
Inc.
.......................
19,730
2,026,666
KBR,
Inc.
.........................
30,600
2,037,654
Kforce,
Inc.
........................
36,179
2,513,355
Korn
Ferry
........................
3,250
239,590
Legalzoom.com,
Inc.
(b)
................
146,653
979,642
ManpowerGroup,
Inc.
.................
7,730
591,963
Maximus,
Inc.
......................
7,041
654,039
Paycor
HCM,
Inc.
(a)
(b)
.................
10,188
126,433
Paylocity
Holding
Corp.
(b)
..............
9,069
1,360,985
Robert
Half,
Inc.
....................
29,528
1,895,402
TriNet
Group,
Inc.
...................
18,573
1,936,235
Upwork,
Inc.
(b)
......................
11,322
137,223
30,235,589
Real
Estate
Management
&
Development
—
0.6%
Anywhere
Real
Estate,
Inc.
(b)
............
189,732
895,535
Cushman
&
Wakefield
plc
(b)
.............
6,946
91,062
DigitalBridge
Group,
Inc.
,
Class
A
.........
12,066
170,493
eXp
World
Holdings,
Inc.
...............
93,341
1,340,377
Kennedy-Wilson
Holdings,
Inc.
...........
113,683
1,183,440
Opendoor
Technologies,
Inc.
(a)
(b)
..........
174,342
404,473
Redfin
Corp.
(a)
(b)
.....................
53,811
438,022
St.
Joe
Co.
(The)
....................
48,858
3,013,561
7,536,963
Residential
REITs
—
0.3%
American
Homes
4
Rent
,
Class
A
.........
85,232
3,076,023
Apartment
Investment
&
Management
Co.
,
Class
A
(b)
.......................
95,986
850,436
Veris
Residential,
Inc.
.................
7,796
122,475
4,048,934
Retail
REITs
—
1.6%
Alexander's,
Inc.
....................
5,977
1,448,227
Brixmor
Property
Group,
Inc.
............
168,890
4,301,628
InvenTrust
Properties
Corp.
.............
68,224
1,921,870
Kimco
Realty
Corp.
..................
82,064
1,783,251
Kite
Realty
Group
Trust
................
83,210
2,051,959
Macerich
Co.
(The)
..................
212,509
3,402,269
NNN
REIT,
Inc.
.....................
30,771
1,381,310
SITE
Centers
Corp.
..................
75,794
1,171,017
Security
Shares
Shares
Value
Retail
REITs
(continued)
Tanger,
Inc.
........................
88,063
$
2,545,021
20,006,552
Semiconductors
&
Semiconductor
Equipment
—
2.1%
Allegro
MicroSystems,
Inc.
(b)
............
11,977
287,927
Axcelis
Technologies,
Inc.
(a)
(b)
............
19,901
2,514,491
Cirrus
Logic,
Inc.
(b)
...................
13,229
1,726,120
Credo
Technology
Group
Holding
Ltd.
(b)
.....
26,698
740,870
Entegris,
Inc.
.......................
29,127
3,445,433
Impinj,
Inc.
(b)
.......................
9,843
1,567,891
Kulicke
&
Soffa
Industries,
Inc.
...........
29,260
1,380,194
Lattice
Semiconductor
Corp.
(a)
(b)
..........
58,707
3,111,471
MACOM
Technology
Solutions
Holdings,
Inc.
(b)
8,811
889,206
MKS
Instruments,
Inc.
................
9,201
1,158,406
Onto
Innovation,
Inc.
(b)
................
11,985
2,292,731
Power
Integrations,
Inc.
...............
1,615
117,960
Rambus,
Inc.
(b)
.....................
56,658
2,914,488
Silicon
Laboratories,
Inc.
(b)
..............
3,954
474,994
SMART
Global
Holdings,
Inc.
(b)
...........
17,058
399,157
Synaptics,
Inc.
(a)
(b)
...................
17,196
1,501,555
Universal
Display
Corp.
...............
2,754
613,095
Veeco
Instruments,
Inc.
(b)
..............
29,425
1,218,489
26,354,478
Software
—
7.8%
A10
Networks,
Inc.
...................
91,250
1,194,462
Adeia,
Inc.
........................
67,781
796,427
Agilysys,
Inc.
(b)
.....................
4,530
507,768
Alarm.com
Holdings,
Inc.
(b)
.............
5,894
415,822
Amplitude,
Inc.
,
Class
A
(b)
..............
89,857
769,176
Appfolio,
Inc.
,
Class
A
(b)
...............
3,572
791,127
AppLovin
Corp.
,
Class
A
(b)
..............
63,655
4,907,800
Asana,
Inc.
,
Class
A
(a)
(b)
................
48,414
704,424
Aspen
Technology,
Inc.
(b)
...............
11,925
2,241,304
Bentley
Systems,
Inc.
,
Class
B
...........
38,222
1,862,940
BILL
Holdings,
Inc.
(b)
..................
18,535
926,009
Blackbaud,
Inc.
(b)
....................
19,585
1,554,657
BlackLine,
Inc.
(b)
....................
34,015
1,616,393
Box,
Inc.
,
Class
A
(b)
..................
31,019
872,254
Braze,
Inc.
,
Class
A
(b)
.................
47,093
2,074,918
Clear
Secure,
Inc.
,
Class
A
.............
135,005
2,882,357
Cognyte
Software
Ltd.
(b)
...............
80,491
614,146
CommVault
Systems,
Inc.
(b)
.............
5,936
907,318
Confluent,
Inc.
,
Class
A
(b)
..............
23,209
580,689
CyberArk
Software
Ltd.
(b)
...............
3,716
952,708
Domo,
Inc.
,
Class
B
(b)
.................
120,516
1,007,514
Elastic
NV
(b)
.......................
35,066
3,845,688
Five9,
Inc.
(b)
.......................
25,437
1,133,218
Gitlab,
Inc.
,
Class
A
(b)
.................
85,964
4,403,936
HashiCorp,
Inc.
,
Class
A
(b)
..............
10,957
369,799
Intapp,
Inc.
(b)
.......................
60,922
2,182,835
InterDigital,
Inc.
.....................
6,519
800,272
Jamf
Holding
Corp.
(a)
(b)
................
7,515
137,600
JFrog
Ltd.
(a)
(b)
......................
75,231
2,900,907
Klaviyo,
Inc.
,
Class
A
(a)
(b)
...............
4,901
128,406
LiveRamp
Holdings,
Inc.
(b)
..............
8,127
246,086
Manhattan
Associates,
Inc.
(b)
............
23,526
6,008,070
MicroStrategy,
Inc.
,
Class
A
(a)
(b)
...........
2,734
4,413,879
Mitek
Systems,
Inc.
(a)
(b)
................
13,921
185,289
Monday.com
Ltd.
(b)
...................
23,363
5,369,051
Nutanix,
Inc.
,
Class
A
(b)
................
103,480
5,226,775
PagerDuty,
Inc.
(a)
(b)
...................
53,398
1,117,620
Pegasystems,
Inc.
...................
11,458
798,852
Progress
Software
Corp.
...............
43,008
2,511,667
PROS
Holdings,
Inc.
(b)
................
9,898
238,542
2024
iShares
Annual
Financial
Statements
Schedule
of
Investments
(continued)
July
31,
2024
iShares
®
U.S.
Small-Cap
Equity
Factor
ETF
(Percentages
shown
are
based
on
Net
Assets)
Security
Shares
Shares
Value
Software
(continued)
Qualys,
Inc.
(a)
(b)
.....................
11,591
$
1,728,682
RADCOM
Ltd.
(b)
.....................
27,635
282,982
Rapid7,
Inc.
(a)
(b)
.....................
10,824
425,816
RingCentral,
Inc.
,
Class
A
(b)
.............
66,360
2,325,918
Samsara,
Inc.
,
Class
A
(a)
(b)
..............
123,974
4,745,725
Smartsheet,
Inc.
,
Class
A
(b)
.............
59,806
2,868,296
SolarWinds
Corp.
...................
9,599
114,516
Sprout
Social,
Inc.
,
Class
A
(b)
............
64,650
2,525,875
SPS
Commerce,
Inc.
(b)
................
8,086
1,741,886
Tenable
Holdings,
Inc.
(a)
(b)
..............
23,432
1,075,997
Teradata
Corp.
(b)
....................
22,350
724,587
Varonis
Systems,
Inc.
(b)
................
25,968
1,431,616
Workiva,
Inc.
,
Class
A
(b)
................
48,204
3,556,009
Yext,
Inc.
(b)
........................
251,744
1,450,045
Zuora,
Inc.
,
Class
A
(b)
.................
11,506
104,359
95,301,014
Specialized
REITs
—
0.9%
CubeSmart
........................
30,158
1,434,918
EPR
Properties
.....................
5,975
268,875
Gaming
&
Leisure
Properties,
Inc.
........
48,513
2,435,353
Lamar
Advertising
Co.
,
Class
A
..........
33,705
4,039,881
Outfront
Media,
Inc.
..................
26,924
436,707
PotlatchDeltic
Corp.
..................
13,780
611,281
Rayonier,
Inc.
......................
26,938
817,029
Safehold,
Inc.
......................
31,594
731,085
Uniti
Group,
Inc.
....................
154,783
594,367
11,369,496
Specialty
Retail
—
4.5%
1-800-Flowers.com,
Inc.
,
Class
A
(a)
(b)
.......
12,058
124,921
Aaron's
Co.,
Inc.
(The)
................
120,623
1,206,230
Abercrombie
&
Fitch
Co.
,
Class
A
(b)
........
23,107
3,407,820
Academy
Sports
&
Outdoors,
Inc.
.........
23,520
1,271,726
American
Eagle
Outfitters,
Inc.
...........
35,685
786,854
Asbury
Automotive
Group,
Inc.
(b)
..........
7,575
2,039,342
AutoNation,
Inc.
(b)
....................
18,680
3,562,650
Bath
&
Body
Works,
Inc.
...............
83,799
3,079,613
Buckle,
Inc.
(The)
...................
32,837
1,418,230
Caleres,
Inc.
.......................
34,031
1,312,235
Carvana
Co.
,
Class
A
(a)
(b)
...............
18,699
2,491,268
Chewy,
Inc.
,
Class
A
(a)
(b)
...............
6,673
161,353
Children's
Place,
Inc.
(The)
(a)
(b)
...........
14,347
112,194
Designer
Brands,
Inc.
,
Class
A
...........
52,647
429,600
Dick's
Sporting
Goods,
Inc.
.............
25,144
5,439,904
Five
Below,
Inc.
(b)
....................
1,049
76,304
Foot
Locker,
Inc.
....................
15,377
446,856
GameStop
Corp.
,
Class
A
(a)
(b)
............
76,976
1,745,046
Gap,
Inc.
(The)
.....................
80,714
1,895,165
Genesco,
Inc.
(b)
.....................
30,355
935,845
Group
1
Automotive,
Inc.
(a)
..............
9,002
3,292,211
Guess?,
Inc.
.......................
116,072
2,791,532
ODP
Corp.
(The)
(b)
...................
57,667
2,436,431
Petco
Health
&
Wellness
Co.,
Inc.
(b)
.......
45,264
156,613
RH
(b)
............................
1,128
327,210
Signet
Jewelers
Ltd.
..................
34,704
2,919,648
Sleep
Number
Corp.
(b)
................
41,384
488,331
Sonic
Automotive,
Inc.
,
Class
A
..........
8,084
481,321
Upbound
Group,
Inc.
.................
47,781
1,802,777
Wayfair,
Inc.
,
Class
A
(a)
(b)
...............
37,800
2,057,454
Williams-Sonoma,
Inc.
................
41,674
6,446,134
55,142,818
Security
Shares
Shares
Value
Technology
Hardware,
Storage
&
Peripherals
—
0.6%
Pure
Storage,
Inc.
,
Class
A
(b)
............
76,561
$
4,588,301
Xerox
Holdings
Corp.
.................
218,579
2,353,003
6,941,304
Textiles,
Apparel
&
Luxury
Goods
—
1.8%
Crocs,
Inc.
(b)
.......................
25,728
3,457,071
Deckers
Outdoor
Corp.
(b)
...............
8,874
8,187,419
G-III
Apparel
Group
Ltd.
(b)
..............
12,835
353,861
On
Holding
AG
,
Class
A
(a)
(b)
.............
24,240
1,004,021
Oxford
Industries,
Inc.
................
9,565
1,007,481
PVH
Corp.
........................
21,046
2,146,481
Ralph
Lauren
Corp.
,
Class
A
............
5,456
958,019
Tapestry,
Inc.
.......................
66,787
2,677,491
Under
Armour,
Inc.
,
Class
C,
NVS
(a)
(b)
......
205,924
1,398,224
VF
Corp.
.........................
23,135
392,370
21,582,438
Tobacco
—
0.4%
Turning
Point
Brands,
Inc.
..............
9,024
340,385
Universal
Corp.
.....................
15,620
834,421
Vector
Group
Ltd.
...................
338,568
4,326,899
5,501,705
Trading
Companies
&
Distributors
—
2.0%
Applied
Industrial
Technologies,
Inc.
.......
5,962
1,300,849
Beacon
Roofing
Supply,
Inc.
(b)
...........
8,881
912,967
Boise
Cascade
Co.
..................
20,032
2,846,347
Core
&
Main,
Inc.
,
Class
A
(b)
.............
87,864
4,698,088
DNOW,
Inc.
(b)
......................
88,104
1,353,277
GATX
Corp.
.......................
12,504
1,744,308
GMS,
Inc.
(b)
........................
10,503
1,010,704
H&E
Equipment
Services,
Inc.
...........
19,331
1,011,011
McGrath
RentCorp
...................
8,836
970,458
MRC
Global,
Inc.
(b)
...................
84,468
1,223,097
MSC
Industrial
Direct
Co.,
Inc.
,
Class
A
.....
2,319
206,275
Rush
Enterprises,
Inc.
,
Class
A
..........
12,513
638,288
SiteOne
Landscape
Supply,
Inc.
(a)
(b)
........
4,483
657,566
Watsco,
Inc.
.......................
7,679
3,758,794
WESCO
International,
Inc.
..............
13,458
2,354,477
24,686,506
Water
Utilities
—
0.1%
American
States
Water
Co.
.............
18,398
1,518,387
Middlesex
Water
Co.
.................
4,451
295,902
1,814,289
Wireless
Telecommunication
Services
—
0.0%
Telephone
&
Data
Systems,
Inc.
..........
19,216
407,379
Total
Long-Term
Investments
—
99
.3
%
(Cost:
$
1,045,159,445
)
............................
1,219,263,005
Schedule
of
Investments
(continued)
July
31,
2024
iShares
®
U.S.
Small-Cap
Equity
Factor
ETF
(Percentages
shown
are
based
on
Net
Assets)
Affiliates
Investments
in
issuers
considered
to
be
affiliate(s)
of
the
Fund
during
the year
ended
July
31,
2024
for
purposes
of
Section
2(a)(3)
of
the
Investment
Company
Act
of
1940,
as
amended,
were
as
follows:
Security
Shares
Shares
Value
Short-Term
Securities
Money
Market
Funds
—
7.0%
(c)(d)
BlackRock
Cash
Funds:
Institutional,
SL
Agency
Shares
,
5.45
%
(e)
..................
78,344,597
$
78,375,936
BlackRock
Cash
Funds:
Treasury,
SL
Agency
Shares
,
5.29
%
...................
6,946,192
6,946,192
Total
Short-Term
Securities
—
7
.0
%
(Cost:
$
85,302,478
)
...............................
85,322,128
Total
Investments
—
106
.3
%
(Cost:
$
1,130,461,923
)
............................
1,304,585,133
Liabilities
in
Excess
of
Other
Assets
—
(
6.3
)
%
.............
(
77,333,936
)
Net
Assets
—
100.0%
...............................
$
1,227,251,197
(a)
All
or
a
portion
of
this
security
is
on
loan.
(b)
Non-income
producing
security.
(c)
Affiliate
of
the
Fund.
(d)
Annualized
7-day
yield
as
of
period
end.
(e)
All
or
a
portion
of
this
security
was
purchased
with
the
cash
collateral
from
loaned
securities.
Affiliated
Issuer
Value
at
07/31/23
Purchases
at
Cost
Proceeds
from
Sales
Net
Realized
Gain
(Loss)
Change
in
Unrealized
Appreciation
(Depreciation)
Value
at
07/31/24
Shares
Held
at
07/31/24
Income
Capital
Gain
Distributions
from
Underlying
Funds
BlackRock
Cash
Funds:
Institutional,
SL
Agency
Shares
..............
$
54,600,717
$
23,765,971
(a)
$
—
$
(
8,698
)
$
17,946
$
78,375,936
78,344,597
$
342,710
(b)
$
—
BlackRock
Cash
Funds:
Treasury,
SL
Agency
Shares
2,452,652
4,493,540
(a)
—
—
—
6,946,192
6,946,192
254,171
—
$
(
8,698
)
$
17,946
$
85,322,128
$
596,881
$
—
—
—
(a)
Represents
net
amount
purchased
(sold).
(b)
All
or
a
portion
represents
securities
lending
income
earned
from
the
reinvestment
of
cash
collateral
from
loaned
securities,
net
of
fees
and
collateral
investment
expenses,
and
other
payments
to
and
from
borrowers
of
securities.
Derivative
Financial
Instruments
Outstanding
as
of
Period
End
Futures
Contracts
Description
Number
of
Contracts
Expiration
Date
Notional
Amount
(000)
Value/
Unrealized
Appreciation
(Depreciation)
Long
Contracts
Russell
2000
Micro
E-Mini
Index
................................................
116
09/20/24
$
1,318
$
34,062
S&P
Midcap
400
E-Mini
Index
.................................................
4
09/20/24
1,248
16,353
$
50,415
2024
iShares
Annual
Financial
Statements
Schedule
of
Investments
(continued)
July
31,
2024
iShares
®
U.S.
Small-Cap
Equity
Factor
ETF
(a)
The
Fund
receives
the
total
return
on
a
portfolio
of
long
positions
underlying the
total
return
swap.
The
Fund
pays
the
total
return
on
a
portfolio
of
short
positions
underlying
the
total
return
swap.
In
addition,
the
Fund
pays
or
receives
a
variable
rate
of
interest,
based
on
a
specified
benchmark.
The
benchmark
and
spread
are
determined
based
upon
the
country
and/or
currency
of
the
individual
underlying
positions.
The
following
are
the
specified
benchmarks
(plus
or
minus
a
range)
used
in
determining
the
variable
rate
of
interest:
OTC
Total
Return
Swaps
Reference
Entity
Payment
Frequency
Counterparty
(a)
Termination
Date
Net
Notional
Accrued
Unrealized
Appreciation
(Depreciation)
Net
Value
of
Reference
Entity
Gross
Notional
Amount
Net
Asset
Percentage
Equity
Securities
Long/Short
...
Monthly
Goldman
Sachs
Bank
USA
(b)
08/19/26
$
1,585,821
$
123,512
(c)
$
1,703,857
0
.1
%
Monthly
HSBC
Bank
plc
(d)
02/09/28
1,607,713
148,918
(e)
1,757,737
0
.1
Monthly
JPMorgan
Chase
Bank
NA
(f)
09/10/24
1,779,970
127,876
(g)
1,905,756
0
.1
$
400,306
$
5,367,350
(b)
(d)
(f)
Range:
40
basis
points
40
basis
points
40
basis
points
Benchmarks:
USD
-
1D
Overnight
Fed
Funds
Effective
Rate
(FEDL01)
USD
-
1D
Overnight
Bank
Funding
Rate
(OBFR01)
USD
-
1D
Overnight
Bank
Funding
Rate
(OBFR01)
(b)
Goldman
Sachs
USA
(c)
Amount
includes
$5,476
of
net
dividends
and
financing
fees.
(d)
HSBC
(e)
Amount
includes
$(1,106)
of
net
dividends
and
financing
fees.
(f)
JPMChase
(g)
Amount
includes
$2,090
of
net
dividends
and
financing
fees.
Schedule
of
Investments
(continued)
July
31,
2024
iShares
®
U.S.
Small-Cap
Equity
Factor
ETF
The
following
table
represents
the
individual
long
positions
and
related
values
of
the
equity
securities
underlying
the
total
return
swap
with
Goldman
Sachs
Bank
USA,
as
of
period
end,
termination
date
August
19,
2026:
Shares
Value
%
of
Basket
Value
Reference
Entity
—
Long
Common
Stocks
Banks
$
BankUnited,
Inc.
..........
704
$
27,118
1
.6
%
City
Holding
Co.
..........
579
70,580
4
.1
Eagle
Bancorp,
Inc.
........
527
11,341
0
.6
First
BanCorp
............
18,552
397,940
23
.4
NBT
Bancorp,
Inc.
.........
239
11,716
0
.7
Preferred
Bank
...........
8,390
722,043
42
.4
1,240,738
Diversified
Consumer
Services
Perdoceo
Education
Corp.
...
6,743
167,159
9
.8
Office
REITs
Douglas
Emmett,
Inc.
......
18,394
295,960
17
.4
Total
Reference
Entity
—
Long
............
1,703,857
Net
Value
of
Reference
Entity
—
Goldman
Sachs
Bank
USA
.........................
$
1,703,857
The
following
table
represents
the
individual
long
positions
and
related
values
of
the
equity
securities
underlying
the
total
return
swap
with
HSBC
Bank
plc,
as
of
period
end,
termination
date
February
9,
2028:
Shares
Value
%
of
Basket
Value
Reference
Entity
—
Long
Common
Stocks
Banks
$
Bancorp,
Inc.
(The)
........
732
37,947
2
.2
Bank
of
Hawaii
Corp.
.......
219
15,021
0
.9
BankUnited,
Inc.
..........
4,084
157,316
9
.0
Comerica,
Inc.
...........
632
34,640
2
.0
Eagle
Bancorp,
Inc.
........
619
13,321
0
.8
First
BanCorp
............
307
12,833
0
.7
Fulton
Financial
Corp.
......
1,635
31,670
1
.8
NBT
Bancorp,
Inc.
.........
526
25,784
1
.5
OFG
Bancorp
............
1,546
70,219
4
.0
Pathward
Financial,
Inc.
.....
449
30,325
1
.7
Preferred
Bank
...........
3,264
280,900
16
.0
Trustmark
Corp.
..........
561
19,484
1
.1
729,460
Capital
Markets
Moelis
&
Co.
,
Class
A
......
205
13,940
0
.8
Consumer
Finance
Bread
Financial
Holdings,
Inc.
.
1,272
69,426
3
.9
Green
Dot
Corp.
,
Class
A
....
10,193
97,445
5
.5
166,871
Containers
&
Packaging
Sealed
Air
Corp.
..........
2,533
96,381
5
.5
Diversified
Consumer
Services
Perdoceo
Education
Corp.
...
4,847
120,157
6
.8
Financial
Services
Radian
Group,
Inc.
........
5,968
221,413
12
.6
Shares
Value
%
of
Basket
Value
Insurance
Employers
Holdings,
Inc.
....
444
$
21,316
1
.2
%
Genworth
Financial,
Inc.
,
Class
A
..................
26,535
179,642
10
.2
200,958
Media
AMC
Networks,
Inc.
,
Class
A
..
2,263
25,187
1
.4
Office
REITs
Douglas
Emmett,
Inc.
......
6,149
98,937
5
.6
SL
Green
Realty
Corp.
......
1,267
84,433
4
.8
183,370
Total
Reference
Entity
—
Long
............
1,757,737
Net
Value
of
Reference
Entity
—
HSBC
Bank
plc
$
1,757,737
The
following
table
represents
the
individual
long
positions
and
related
values
of
the
equity
securities
underlying
the
total
return
swap
with
JPMorgan
Chase
Bank
NA,
as
of
period
end,
termination
date
September
10,
2024:
Shares
Value
%
of
Basket
Value
Reference
Entity
—
Long
Common
Stocks
Banks
$
Bancorp,
Inc.
(The)
........
1,834
95,075
5
.0
Bank
of
Hawaii
Corp.
.......
719
49,316
2
.6
Comerica,
Inc.
...........
2,330
127,707
6
.7
Eagle
Bancorp,
Inc.
........
1,086
23,371
1
.2
Fulton
Financial
Corp.
......
3,087
59,795
3
.1
OFG
Bancorp
............
3,874
175,957
9
.2
Pathward
Financial,
Inc.
.....
1,125
75,982
4
.0
Trustmark
Corp.
..........
1,596
55,429
2
.9
662,632
Consumer
Finance
Bread
Financial
Holdings,
Inc.
.
231
12,608
0
.7
Green
Dot
Corp.
,
Class
A
....
20,819
199,030
10
.4
211,638
Financial
Services
Jackson
Financial,
Inc.
,
Class
A
736
64,812
3
.4
Insurance
Employers
Holdings,
Inc.
....
2,495
119,785
6
.3
Unum
Group
............
10,712
616,261
32
.3
736,046
Office
REITs
Douglas
Emmett,
Inc.
......
1,134
18,246
1
.0
SL
Green
Realty
Corp.
......
3,187
212,382
11
.2
230,628
Total
Reference
Entity
—
Long
............
1,905,756
Net
Value
of
Reference
Entity
—
JPMorgan
Chase
Bank
NA
..........................
$
1,905,756
2024
iShares
Annual
Financial
Statements
Schedule
of
Investments
(continued)
July
31,
2024
iShares
®
U.S.
Small-Cap
Equity
Factor
ETF
Derivative
Financial
Instruments
Categorized
by
Risk
Exposure
For
more
information
about
the
Fund’s
investment
risks
regarding
derivative
financial
instruments,
refer
to
the
Notes
to
Financial
Statements.
Balances
Reported
in
the
Statements
of
Assets
and
Liabilities
for
OTC
Swaps
Description
Swap
Premiums
Paid
Swap
Premiums
Received
Unrealized
Appreciation
Unrealized
Depreciation
OTC
Swaps
...................................................................
$
—
$
—
$
400,306
$
—
As
of
period
end,
the
fair
values
of
derivative
financial
instruments
located
in
the
Statements
of
Assets
and
Liabilities
were
as
follows:
Commodity
Contracts
Credit
Contracts
Equity
Contracts
Foreign
Currency
Exchange
Contracts
Interest
Rate
Contracts
Other
Contracts
Total
Assets
—
Derivative
Financial
Instruments
Futures
contracts
Unrealized
appreciation
on
futures
contracts
(a)
......
$
—
$
—
$
50,415
$
—
$
—
$
—
$
50,415
Swaps
—
OTC
Unrealized
appreciation
on
OTC
swaps;
Swap
premiums
paid
................................
—
—
400,306
—
—
—
400,306
$
—
$
—
$
450,721
$
—
$
—
$
—
$
450,721
(a)
Net
cumulative
unrealized
appreciation
(depreciation)
on
futures
contracts,
if
any,
are
reported
in
the
Schedule
of
Investments.
In
the
Statements
of
Assets
and
Liabilities,
only
current
day’s
variation
margin
is
reported
in
receivables
or
payables
and
the
net
cumulative
unrealized
appreciation
(depreciation)
is
included
in
accumulated
earnings
(loss).
For
the
period
ended
July
31,
2024,
the
effect
of
derivative
financial
instruments
in
the
Statements
of
Operations
was
as
follows:
Commodity
Contracts
Credit
Contracts
Equity
Contracts
Foreign
Currency
Exchange
Contracts
Interest
Rate
Contracts
Other
Contracts
Total
Net
Realized
Gain
(Loss)
from
Futures
c
ontracts
.......................
$
—
$
—
$
447,823
$
—
$
—
$
—
$
447,823
Swaps
..............................
—
—
328,720
—
—
—
328,720
$
—
$
—
$
776,543
$
—
$
—
$
—
$
776,543
Net
Change
in
Unrealized
Appreciation
(Depreciation)
on
Futures
c
ontracts
.......................
$
—
$
—
$
950
$
—
$
—
$
—
$
950
Swaps
..............................
—
—
260,367
—
—
—
260,367
$
—
$
—
$
261,317
$
—
$
—
$
—
$
261,317
Average
Quarterly
Balances
of
Outstanding
Derivative
Financial
Instruments
Futures
contracts
Average
notional
value
of
contracts
—
long
..................................................................................
$
2,179,426
Total
return
swaps
Average
notional
value
...............................................................................................
$
3,304,581
Schedule
of
Investments
(continued)
July
31,
2024
iShares
®
U.S.
Small-Cap
Equity
Factor
ETF
Derivative
Financial
Instruments
—
Offsetting
as
of
Period
End
Fair
Value
Hierarchy
as
of Period
End
Various
inputs
are
used
in
determining
the
fair
value
of
financial
instruments.
For
a
description
of
the
input
levels
and
information
about
the
Fund’s
policy
regarding
valuation
of
financial
instruments,
refer
to
the
Notes
to
Financial
Statements.
The
following
table
summarizes
the
Fund’s
financial
instruments
categorized
in
the
fair
value
hierarchy.
The
breakdown
of
the
Fund's
financial
instruments
into
major
categories
is
disclosed
in
the
Schedule
of
Investments
above.
See
notes
to
financial
statements.
The
Fund’s
derivative
assets
and
liabilities
(by
type)
were
as
follows:
Assets
Liabilities
Derivative
Financial
Instruments
$
—
Futures
contracts
....................................................................................
$
13,837
$
—
Swaps
—
OTC
(a)
.....................................................................................
400,306
—
Total
d
erivative
assets
and
liabilities
in
the
Statements
of
Assets
and
Liabilities
...........................................
$
414,143
$
—
Derivatives
not
subject
to
a
Master
Netting
Agreement
or
similar
agreement
(“MNA”)
.........................................
(
13,837
)
—
Total
derivative
assets
and
liabilities
subject
to
an
MNA
............................................................
$
400,306
$
—
(a)
Includes
unrealized
appreciation
(depreciation)
on
OTC
swaps
and
swap
premiums
(paid/received)
in
the
Statements
of
Assets
and
Liabilities.
The
following
table
presents
the
Fund's
derivative
assets
by
counterparty
net
of
amounts
available
for
offset
under
an
MNA
and
net
of
the
related
collateral
received
by
the
Fund:
Counterparty
Derivative
Assets
Subject
to
an
MNA
by
Counterparty
Derivatives
Available
for
Offset
(a)
Non-cash
Collateral
Received
Cash
Collateral
Received
Net
Amount
of
Derivative
Assets
(b)
Goldman
Sachs
Bank
USA
.........................
$
123,512
$
—
$
—
$
—
$
123,512
HSBC
Bank
plc
.................................
148,918
—
—
—
148,918
JPMorgan
Chase
Bank
NA
.........................
127,876
—
—
—
127,876
$
400,306
$
—
$
—
$
—
$
400,306
(a)
The
amount
of
derivatives
available
for
offset
is
limited
to
the
amount
of
derivative
assets
and/or
liabilities
that
are
subject
to
an
MNA.
(b)
Net
amount
represents
the
net
amount
receivable
from
the
counterparty
in
the
event
of
default.
Level
1
Level
2
Level
3
Total
Assets
Investments
Long-Term
Investments
Common
Stocks
.........................................
$
1,219,263,005
$
—
$
—
$
1,219,263,005
Short-Term
Securities
Money
Market
Funds
......................................
85,322,128
—
—
85,322,128
$
1,304,585,133
$
—
$
—
$
1,304,585,133
Derivative
Financial
Instruments
(a)
Assets
Equity
contracts
...........................................
$
50,415
$
400,306
$
—
$
450,721
$
50,415
$
400,306
$
—
$
450,721
(a)
Derivative
financial
instruments
are
swaps
and
futures
contracts.
Swaps
and
futures
contracts
are
valued
at
the
unrealized
appreciation
(depreciation)
on
the
instrument.
2024
iShares
Annual
Financial
Statements
Schedule
of
Investments
July
31,
2024
iShares
®
U.S.
Tech
Breakthrough
Multisector
ETF
(Percentages
shown
are
based
on
Net
Assets)
Security
Shares
Shares
Value
Common
Stocks
Biotechnology
—
6.2%
Arcellx,
Inc.
(a)
......................
3,173
$
196,123
Arcturus
Therapeutics
Holdings,
Inc.
(a)
......
2,000
46,920
Arcus
Biosciences,
Inc.
(a)
...............
3,718
61,012
Beam
Therapeutics,
Inc.
(a)
(b)
.............
6,087
192,593
BioCryst
Pharmaceuticals,
Inc.
(a)
..........
15,702
114,311
Blueprint
Medicines
Corp.
(a)
.............
4,858
526,121
Dynavax
Technologies
Corp.
(a)
...........
10,179
113,903
Exelixis,
Inc.
(a)
......................
22,471
526,945
Geron
Corp.
(a)
(b)
.....................
39,603
187,718
Gilead
Sciences,
Inc.
.................
98,633
7,502,026
Incyte
Corp.
(a)
(b)
.....................
17,515
1,139,701
Intellia
Therapeutics,
Inc.
(a)
.............
7,503
196,654
Iovance
Biotherapeutics,
Inc.
(a)
...........
17,722
154,713
Moderna,
Inc.
(a)
.....................
26,693
3,182,340
Novavax,
Inc.
(a)
(b)
....................
10,567
135,363
Regeneron
Pharmaceuticals,
Inc.
(a)
........
8,413
9,079,226
REVOLUTION
Medicines,
Inc.
(a)
..........
10,871
496,152
Sarepta
Therapeutics,
Inc.
(a)
............
7,035
1,000,658
SpringWorks
Therapeutics,
Inc.
(a)
.........
5,189
186,337
Twist
Bioscience
Corp.
(a)
...............
4,416
246,457
Vir
Biotechnology,
Inc.
(a)
...............
7,218
73,335
Xencor,
Inc.
(a)
......................
4,670
95,361
25,453,969
Broadline
Retail
—
6.3%
Amazon.com,
Inc.
(a)
..................
88,286
16,507,716
Coupang,
Inc.
,
Class
A
(a)
...............
78,286
1,624,435
eBay,
Inc.
.........................
33,471
1,861,322
Etsy,
Inc.
(a)
........................
7,754
505,096
MercadoLibre,
Inc.
(a)
..................
3,141
5,242,015
25,740,584
Capital
Markets
—
0.5%
AssetMark
Financial
Holdings,
Inc.
(a)
.......
575
19,837
Coinbase
Global,
Inc.
,
Class
A
(a)
(b)
.........
5,217
1,170,486
Donnelley
Financial
Solutions,
Inc.
(a)
.......
766
51,690
MarketAxess
Holdings,
Inc.
.............
1,032
230,683
Open
Lending
Corp.
,
Class
A
(a)
...........
2,709
17,067
Tradeweb
Markets,
Inc.
,
Class
A
..........
3,199
357,264
Virtu
Financial,
Inc.
,
Class
A
.............
2,290
62,563
1,909,590
Chemicals
—
0.0%
Ginkgo
Bioworks
Holdings,
Inc.
,
Class
A
(a)
...
108,872
41,371
Communications
Equipment
—
0.4%
Calix,
Inc.
(a)
........................
7,169
294,861
Juniper
Networks,
Inc.
................
39,302
1,481,292
1,776,153
Consumer
Finance
—
0.1%
Enova
International,
Inc.
(a)
..............
667
57,676
OneMain
Holdings,
Inc.
................
3,259
170,315
SoFi
Technologies,
Inc.
(a)
(b)
.............
27,370
206,370
Upstart
Holdings,
Inc.
(a)
(b)
...............
2,136
59,658
World
Acceptance
Corp.
(a)
..............
147
17,952
511,971
Diversified
Telecommunication
Services
—
0.1%
Lumen
Technologies,
Inc.
(a)
.............
59,724
188,131
Electrical
Equipment
—
0.6%
AMETEK,
Inc.
......................
13,848
2,402,351
Security
Shares
Shares
Value
Electronic
Equipment,
Instruments
&
Components
—
0.2%
Cognex
Corp.
......................
10,312
$
511,681
PAR
Technology
Corp.
(a)
(b)
..............
925
46,842
558,523
Entertainment
—
3.9%
Netflix,
Inc.
(a)
.......................
25,365
15,938,098
Financial
Services
—
7.7%
Affirm
Holdings,
Inc.
,
Class
A
(a)
...........
6,884
194,748
AvidXchange
Holdings,
Inc.
(a)
............
4,532
40,516
Block,
Inc.
,
Class
A
(a)
.................
15,175
939,029
Corpay,
Inc.
(a)
......................
1,886
550,373
Euronet
Worldwide,
Inc.
(a)
..............
1,176
119,940
Fidelity
National
Information
Services,
Inc.
...
15,427
1,185,257
Fiserv,
Inc.
(a)
.......................
16,113
2,635,603
Flywire
Corp.
(a)
.....................
3,368
61,668
Global
Payments,
Inc.
................
7,024
713,919
Jack
Henry
&
Associates,
Inc.
...........
2,010
344,675
Marqeta,
Inc.
,
Class
A
(a)
...............
10,282
55,420
Mastercard,
Inc.
,
Class
A
...............
22,971
10,651,882
Payoneer
Global,
Inc.
(a)
................
5,992
33,136
PayPal
Holdings,
Inc.
(a)
................
28,935
1,903,344
Repay
Holdings
Corp.
,
Class
A
(a)
.........
2,204
21,203
Shift4
Payments,
Inc.
,
Class
A
(a)
(b)
.........
1,679
115,499
Toast,
Inc.
,
Class
A
(a)
(b)
................
10,517
275,125
Visa,
Inc.
,
Class
A
...................
43,557
11,571,788
WEX,
Inc.
(a)
........................
1,165
213,719
31,626,844
Health
Care
Equipment
&
Supplies
—
2.3%
Intuitive
Surgical,
Inc.
(a)
................
21,209
9,429,733
Interactive
Media
&
Services
—
8.2%
Alphabet,
Inc.
,
Class
A
................
93,266
15,998,850
Bumble,
Inc.
,
Class
A
(a)
................
5,327
49,754
Meta
Platforms,
Inc.
,
Class
A
............
33,007
15,672,714
Pinterest,
Inc.
,
Class
A
(a)
...............
35,530
1,135,183
Snap,
Inc.
,
Class
A,
NVS
(a)
.............
62,400
831,168
Vimeo,
Inc.
(a)
.......................
9,866
39,661
33,727,330
IT
Services
—
2.4%
(a)
Akamai
Technologies,
Inc.
..............
18,313
1,799,802
Couchbase,
Inc.
....................
2,546
48,858
DigitalOcean
Holdings,
Inc.
.............
3,838
127,153
Fastly,
Inc.
,
Class
A
(b)
.................
8,587
69,555
GoDaddy,
Inc.
,
Class
A
................
8,434
1,226,725
MongoDB,
Inc.
,
Class
A
...............
4,733
1,194,420
Okta,
Inc.
,
Class
A
...................
19,407
1,823,093
Snowflake,
Inc.
,
Class
A
...............
20,636
2,690,522
Twilio,
Inc.
,
Class
A
..................
10,816
639,550
9,619,678
Leisure
Products
—
0.0%
Peloton
Interactive,
Inc.
,
Class
A
(a)
........
19,759
70,342
Life
Sciences
Tools
&
Services
—
0.0%
(a)(c)
OmniAb,
Inc.,
12.50
Earnout
Shares
,
NVS
...
934
—
OmniAb,
Inc.,
15.00
Earnout
Shares
,
NVS
...
934
—
—
Machinery
—
0.0%
(a)
3D
Systems
Corp.
(b)
..................
8,112
29,609
Proto
Labs,
Inc.
.....................
1,484
51,673
Symbotic,
Inc.
,
Class
A
(b)
...............
2,015
54,022
135,304
Schedule
of
Investments
(continued)
July
31,
2024
iShares
®
U.S.
Tech
Breakthrough
Multisector
ETF
(Percentages
shown
are
based
on
Net
Assets)
Security
Shares
Shares
Value
Media
—
0.1%
Paramount
Global
,
Class
B,
NVS
.........
35,593
$
406,472
Sirius
XM
Holdings,
Inc.
(b)
..............
37,804
130,424
536,896
Pharmaceuticals
—
3.5%
Ligand
Pharmaceuticals,
Inc.
(a)
...........
1,404
153,022
Merck
&
Co.,
Inc.
....................
124,521
14,087,061
14,240,083
Professional
Services
—
1.3%
Booz
Allen
Hamilton
Holding
Corp.
........
15,538
2,226,751
Broadridge
Financial
Solutions,
Inc.
.......
3,257
696,998
CACI
International,
Inc.
,
Class
A
(a)
........
2,702
1,246,919
Science
Applications
International
Corp.
....
6,192
770,285
SS&C
Technologies
Holdings,
Inc.
........
5,955
434,417
5,375,370
Semiconductors
&
Semiconductor
Equipment
—
17.4%
Advanced
Micro
Devices,
Inc.
(a)
..........
96,764
13,980,463
Analog
Devices,
Inc.
..................
29,759
6,885,638
Intel
Corp.
........................
256,153
7,874,143
Lattice
Semiconductor
Corp.
(a)
(b)
..........
8,187
433,911
Microchip
Technology,
Inc.
..............
31,612
2,806,513
NVIDIA
Corp.
......................
134,597
15,750,541
QUALCOMM,
Inc.
...................
67,048
12,132,336
Silicon
Laboratories,
Inc.
(a)
(b)
.............
1,879
225,724
Texas
Instruments,
Inc.
................
54,735
11,155,540
71,244,809
Software
—
30.1%
A10
Networks,
Inc.
...................
8,847
115,807
ACI
Worldwide,
Inc.
(a)
.................
2,840
122,773
Adobe,
Inc.
(a)
.......................
26,857
14,815,664
Alarm.com
Holdings,
Inc.
(a)
.............
5,827
411,095
Alkami
Technology,
Inc.
(a)
(b)
.............
1,483
48,539
Altair
Engineering,
Inc.
,
Class
A
(a)
.........
3,357
296,624
ANSYS,
Inc.
(a)
......................
5,235
1,641,853
Appian
Corp.
,
Class
A
(a)
...............
2,672
98,704
Atlassian
Corp.
,
Class
A
(a)
..............
10,553
1,863,343
Autodesk,
Inc.
(a)
.....................
12,923
3,198,701
AvePoint,
Inc.
,
Class
A
(a)
...............
6,546
71,351
Bentley
Systems,
Inc.
,
Class
B
...........
7,808
380,562
BILL
Holdings,
Inc.
(a)
..................
2,833
141,537
BlackLine,
Inc.
(a)
....................
1,392
66,148
C3.ai,
Inc.
,
Class
A
(a)
.................
7,054
188,694
CCC
Intelligent
Solutions
Holdings,
Inc.
(a)
....
10,699
109,772
Clear
Secure,
Inc.
,
Class
A
.............
9,485
202,505
Clearwater
Analytics
Holdings,
Inc.
,
Class
A
(a)
.
3,223
63,010
CommVault
Systems,
Inc.
(a)
.............
2,843
434,552
Confluent,
Inc.
,
Class
A
(a)
(b)
.............
15,544
388,911
Crowdstrike
Holdings,
Inc.
,
Class
A
(a)
.......
27,664
6,416,941
Dropbox,
Inc.
,
Class
A
(a)
...............
16,012
383,007
Fortinet,
Inc.
(a)
......................
77,151
4,477,844
Freshworks,
Inc.
,
Class
A
(a)
.............
10,982
137,275
Gitlab,
Inc.
,
Class
A
(a)
.................
7,792
399,184
Guidewire
Software,
Inc.
(a)
..............
2,266
340,059
HubSpot,
Inc.
(a)
.....................
3,265
1,622,803
Informatica,
Inc.
,
Class
A
(a)
.............
8,855
211,989
Intapp,
Inc.
(a)
.......................
1,834
65,712
Intuit,
Inc.
.........................
7,541
4,881,666
Matterport,
Inc.
,
Class
A
(a)
..............
16,209
71,968
Microsoft
Corp.
.....................
38,389
16,060,038
MicroStrategy,
Inc.
,
Class
A
(a)
............
1,054
1,701,620
nCino,
Inc.
(a)
.......................
2,196
71,941
Nutanix,
Inc.
,
Class
A
(a)
................
16,278
822,202
Oracle
Corp.
.......................
106,740
14,884,893
Security
Shares
Shares
Value
Software
(continued)
Palo
Alto
Networks,
Inc.
(a)
(b)
.............
39,179
$
12,722,597
Pegasystems,
Inc.
...................
2,726
190,057
Progress
Software
Corp.
...............
2,848
166,323
Q2
Holdings,
Inc.
(a)
...................
1,580
106,603
Qualys,
Inc.
(a)
(b)
.....................
4,407
657,260
Rapid7,
Inc.
(a)
......................
7,384
290,486
Salesforce,
Inc.
.....................
63,089
16,327,433
SentinelOne,
Inc.
,
Class
A
(a)
.............
32,108
735,273
ServiceNow,
Inc.
(a)
...................
13,640
11,108,280
Sprinklr,
Inc.
,
Class
A
(a)
(b)
...............
7,692
75,612
Tenable
Holdings,
Inc.
(a)
...............
14,295
656,426
Teradata
Corp.
(a)
....................
6,376
206,710
Varonis
Systems,
Inc.
(a)
................
13,198
727,606
Vertex,
Inc.
,
Class
A
(a)
.................
1,439
57,056
Workiva,
Inc.
,
Class
A
(a)
................
1,343
99,073
Zscaler,
Inc.
(a)
......................
11,036
1,979,307
Zuora,
Inc.
,
Class
A
(a)
.................
9,153
83,018
123,398,407
Specialized
REITs
—
2.5%
Digital
Realty
Trust,
Inc.
...............
21,542
3,220,314
Equinix,
Inc.
.......................
6,327
4,999,848
Iron
Mountain,
Inc.
...................
19,642
2,014,484
10,234,646
Technology
Hardware,
Storage
&
Peripherals
—
6.1%
Apple,
Inc.
........................
82,641
18,352,913
HP,
Inc.
..........................
65,192
2,352,779
NetApp,
Inc.
.......................
13,741
1,744,832
Pure
Storage,
Inc.
,
Class
A
(a)
............
20,436
1,224,730
Western
Digital
Corp.
(a)
................
21,425
1,436,546
25,111,800
Total
Long-Term
Investments
—
99
.9
%
(Cost:
$
324,379,384
)
..............................
409,271,983
Short-Term
Securities
Money
Market
Funds
—
1.9%
(d)(e)
BlackRock
Cash
Funds:
Institutional,
SL
Agency
Shares
,
5.45
%
(f)
..................
7,225,089
7,227,979
BlackRock
Cash
Funds:
Treasury,
SL
Agency
Shares
,
5.29
%
...................
443,552
443,552
Total
Short-Term
Securities
—
1
.9
%
(Cost:
$
7,670,494
)
...............................
7,671,531
Total
Investments
—
101
.8
%
(Cost:
$
332,049,878
)
..............................
416,943,514
Liabilities
in
Excess
of
Other
Assets
—
(
1.8
)
%
.............
(
7,220,991
)
Net
Assets
—
100.0%
...............................
$
409,722,523
2024
iShares
Annual
Financial
Statements
Schedule
of
Investments
(continued)
July
31,
2024
iShares
®
U.S.
Tech
Breakthrough
Multisector
ETF
Affiliates
Investments
in
issuers
considered
to
be
affiliate(s)
of
the
Fund
during
the year
ended
July
31,
2024
for
purposes
of
Section
2(a)(3)
of
the
Investment
Company
Act
of
1940,
as
amended,
were
as
follows:
Derivative
Financial
Instruments
Categorized
by
Risk
Exposure
(a)
Non-income
producing
security.
(b)
All
or
a
portion
of
this
security
is
on
loan.
(c)
Security
is
valued
using
significant
unobservable
inputs
and
is
classified
as
Level
3
in
the
fair
value
hierarchy.
(d)
Affiliate
of
the
Fund.
(e)
Annualized
7-day
yield
as
of
period
end.
(f)
All
or
a
portion
of
this
security
was
purchased
with
the
cash
collateral
from
loaned
securities.
Affiliated
Issuer
Value
at
07/31/23
Purchases
at
Cost
Proceeds
from
Sales
Net
Realized
Gain
(Loss)
Change
in
Unrealized
Appreciation
(Depreciation)
Value
at
07/31/24
Shares
Held
at
07/31/24
Income
Capital
Gain
Distributions
from
Underlying
Funds
BlackRock
Cash
Funds:
Institutional,
SL
Agency
Shares
..............
$
15,736,390
$
—
$
(
8,511,048
)
(a)
$
863
$
1,774
$
7,227,979
7,225,089
$
68,984
(b)
$
—
BlackRock
Cash
Funds:
Treasury,
SL
Agency
Shares
413,027
30,525
(a)
—
—
—
443,552
443,552
25,200
—
$
863
$
1,774
$
7,671,531
$
94,184
$
—
—
—
(a)
Represents
net
amount
purchased
(sold).
(b)
All
or
a
portion
represents
securities
lending
income
earned
from
the
reinvestment
of
cash
collateral
from
loaned
securities,
net
of
fees
and
collateral
investment
expenses,
and
other
payments
to
and
from
borrowers
of
securities.
Derivative
Financial
Instruments
Outstanding
as
of
Period
End
Futures
Contracts
Description
Number
of
Contracts
Expiration
Date
Notional
Amount
(000)
Value/
Unrealized
Appreciation
(Depreciation)
Long
Contracts
Russell
2000
E-Mini
Index
....................................................
3
09/20/24
$
341
$
24,820
As
of
period
end,
the
fair
values
of
derivative
financial
instruments
located
in
the
Statements
of
Assets
and
Liabilities
were
as
follows:
Commodity
Contracts
Credit
Contracts
Equity
Contracts
Foreign
Currency
Exchange
Contracts
Interest
Rate
Contracts
Other
Contracts
Total
Assets
—
Derivative
Financial
Instruments
Futures
contracts
Unrealized
appreciation
on
futures
contracts
(a)
......
$
—
$
—
$
24,820
$
—
$
—
$
—
$
24,820
(a)
Net
cumulative
unrealized
appreciation
(depreciation)
on
futures
contracts,
if
any,
are
reported
in
the
Schedule
of
Investments.
In
the
Statements
of
Assets
and
Liabilities,
only
current
day’s
variation
margin
is
reported
in
receivables
or
payables
and
the
net
cumulative
unrealized
appreciation
(depreciation)
is
included
in
accumulated
earnings
(loss).
Schedule
of
Investments
(continued)
July
31,
2024
iShares
®
U.S.
Tech
Breakthrough
Multisector
ETF
For
more
information
about
the
Fund’s
investment
risks
regarding
derivative
financial
instruments,
refer
to
the
Notes
to
Financial
Statements.
Fair
Value
Hierarchy
as
of Period
End
Various
inputs
are
used
in
determining
the
fair
value
of
financial
instruments.
For
a
description
of
the
input
levels
and
information
about
the
Fund’s
policy
regarding
valuation
of
financial
instruments,
refer
to
the
Notes
to
Financial
Statements.
The
following
table
summarizes
the
Fund’s
financial
instruments
categorized
in
the
fair
value
hierarchy.
The
breakdown
of
the
Fund's
financial
instruments
into
major
categories
is
disclosed
in
the
Schedule
of
Investments
above.
See
notes
to
financial
statements.
For
the
period
ended
July
31,
2024,
the
effect
of
derivative
financial
instruments
in
the
Statements
of
Operations
was
as
follows:
Commodity
Contracts
Credit
Contracts
Equity
Contracts
Foreign
Currency
Exchange
Contracts
Interest
Rate
Contracts
Other
Contracts
Total
Net
Realized
Gain
(Loss)
from
Futures
c
ontracts
.......................
$
—
$
—
$
27,999
$
—
$
—
$
—
$
27,999
Net
Change
in
Unrealized
Appreciation
(Depreciation)
on
Futures
c
ontracts
.......................
$
—
$
—
$
7,226
$
—
$
—
$
—
$
7,226
Average
Quarterly
Balances
of
Outstanding
Derivative
Financial
Instruments
Futures
contracts
Average
notional
value
of
contracts
—
long
..................................................................................
$
312,579
Level
1
Level
2
Level
3
Total
Assets
Investments
Long-Term
Investments
Common
Stocks
.........................................
$
409,271,983
$
—
$
—
$
409,271,983
Short-Term
Securities
Money
Market
Funds
......................................
7,671,531
—
—
7,671,531
$
416,943,514
$
—
$
—
$
416,943,514
Derivative
Financial
Instruments
(a)
Assets
Equity
contracts
...........................................
$
24,820
$
—
$
—
$
24,820
(a)
Derivative
financial
instruments
are
futures
contracts.
Futures
contracts
are
valued
at
the
unrealized
appreciation
(depreciation)
on
the
instrument.
Statements
of
Assets
and
Liabilities
July
31,
2024
2024
iShares
Annual
Financial
Statements
See
notes
to
financial
statements.
iShares
MSCI
USA
Small-Cap
Min
Vol
Factor
ETF
iShares
U.S.
Equity
Factor
ETF
iShares
U.S.
Small-Cap
Equity
Factor
ETF
iShares
U.S.
Tech
Breakthrough
Multisector
ETF
ASSETS
Investments,
at
value
—
unaffiliated
(a)
(b)
.........................................
$
831,465,602
$
2,039,316,117
$
1,219,263,005
$
409,271,983
Investments,
at
value
—
affiliated
(c)
............................................
35,585,640
23,187,326
85,322,128
7,671,531
Cash
...............................................................
2,192
—
17,112
—
Cash
pledged:
Futures
contracts
......................................................
123,000
343,000
141,000
23,000
Receivables:
–
–
–
–
Investment
s
sold
......................................................
107,730
—
—
—
Securities
lending
income
—
affiliated
........................................
11,146
3,378
16,010
9,090
Swaps
............................................................
—
—
181,657
—
Dividends
—
unaffiliated
.................................................
333,606
1,484,772
392,272
86,299
Dividends
—
affiliated
...................................................
5,008
21,880
28,574
2,979
Variation
margin
on
futures
contracts
.........................................
7,887
93,644
13,837
2,068
Unrealized
appreciation
on:
–
–
–
–
OTC
swaps
..........................................................
—
—
400,306
—
Total
a
ssets
...........................................................
867,641,811
2,064,450,117
1,305,775,901
417,066,950
LIABILITIES
Collateral
on
securities
loaned
...............................................
33,839,463
13,286,284
78,381,235
7,237,588
Payables:
–
–
–
–
Investment
advisory
fees
.................................................
134,685
138,311
143,469
106,839
Variation
margin
on
futures
contracts
.........................................
1,890
—
—
—
Total
li
abilities
..........................................................
33,976,038
13,424,595
78,524,704
7,344,427
Commitments
and
contingent
liabilities
—
—
—
—
NET
ASSETS
..........................................................
$
833,665,773
$
2,051,025,522
$
1,227,251,197
$
409,722,523
NET
ASSETS
CONSIST
OF:
Paid-in
capital
..........................................................
$
823,593,985
$
1,673,389,206
$
1,150,303,351
$
351,139,732
Accumulated
earnings
....................................................
10,071,788
377,636,316
76,947,846
58,582,791
NET
ASSETS
..........................................................
$
833,665,773
$
2,051,025,522
$
1,227,251,197
$
409,722,523
NET
ASSET
VALUE
Shares
outstanding
......................................................
20,850,000
36,300,000
18,700,000
8,350,000
Net
asset
value
.........................................................
$
39.98
$
56.50
$
65.63
$
49.07
Shares
authorized
.......................................................
Unlimited
Unlimited
Unlimited
Unlimited
Par
value
.............................................................
None
None
None
None
(a)
Investments,
at
cost
—
unaffiliated
.......................................
$
687,314,048
$
1,585,130,718
$
1,045,159,445
$
324,379,384
(b)
Securities
loaned,
at
value
............................................
$
33,058,355
$
13,150,364
$
77,737,310
$
7,123,738
(c)
Investments,
at
cost
—
affiliated
.........................................
$
35,572,372
$
22,259,568
$
85,302,478
$
7,670,494
Statements
of
Operations
Year
Ended
July
31,
2024
See
notes
to
financial
statements.
iShares
MSCI
USA
Small-Cap
Min
Vol
Factor
ETF
iShares
U.S.
Equity
Factor
ETF
iShares
U.S.
Small-Cap
Equity
Factor
ETF
iShares
U.S.
Tech
Breakthrough
Multisector
ETF
INVESTMENT
INCOME
–
–
–
–
Dividends
—
unaffiliated
.................................................
$
13,689,187
$
25,281,382
$
13,234,430
$
2,095,559
Dividends
—
affiliated
...................................................
80,691
291,107
254,171
25,200
Interest
—
unaffiliated
...................................................
9,293
12,303
10,131
2,182
Securities
lending
income
—
affiliated
—
net
...................................
409,319
66,113
342,710
68,984
Foreign
taxes
withheld
..................................................
—
(
17,908
)
(
50,619
)
—
Total
investment
income
...................................................
14,188,490
25,632,997
13,790,823
2,191,925
EXPENSES
Investment
advisory
....................................................
1,628,806
1,330,043
1,345,520
1,392,890
Interest
expense
......................................................
1,548
—
—
—
Total
e
xpenses
.........................................................
1,630,354
1,330,043
1,345,520
1,392,890
Less:
–
–
–
–
Investment
advisory
fees
waived
...........................................
—
—
—
(
318,912
)
Total
ex
penses
after
fees
waived
.............................................
1,630,354
1,330,043
1,345,520
1,073,978
Net
investment
income
....................................................
12,558,136
24,302,954
12,445,303
1,117,947
REALIZED
AND
UNREALIZED
GAIN
(LOSS)
$
106,082,663
$
355,932,938
$
142,520,563
$
76,083,356
Net
realized
gain
(loss)
from:
Investments
—
unaffiliated
.............................................
(
13,186,871
)
23,676,911
19,894,687
(
5,863,487
)
Investments
—
affiliated
...............................................
2,544
4,297
(
8,698
)
863
Foreign
currency
transactions
...........................................
—
226
—
—
Futures
contracts
....................................................
81,130
566,393
447,823
27,999
In-kind
redemptions
—
unaffiliated
(a)
.......................................
30,618,263
49,729,447
11,981,353
33,331,515
In-kind
redemptions
—
affiliated
(a)
.........................................
—
45,863
—
—
Swaps
..........................................................
—
—
328,720
—
17,515,066
74,023,137
32,643,885
27,496,890
Net
change
in
unrealized
appreciation
(depreciation)
on:
Investments
—
unaffiliated
.............................................
88,499,873
281,298,295
109,597,416
48,577,466
Investments
—
affiliated
...............................................
2,733
655,604
17,946
1,774
Futures
contracts
....................................................
64,989
(
44,099
)
950
7,226
Swaps
..........................................................
—
—
260,367
—
88,567,595
281,909,800
109,876,679
48,586,466
Net
realized
and
unrealized
gain
.............................................
106,082,661
355,932,937
142,520,564
76,083,356
NET
INCREASE
IN
NET
ASSETS
RESULTING
FROM
OPERATIONS
....................
$
118,640,797
$
380,235,891
$
154,965,867
$
77,201,303
(a)
See
Note
2
of
the
Notes
to
Financial
Statements.
Statements
of
Changes
in
Net
Assets
2024
iShares
Annual
Financial
Statements
See
notes
to
financial
statements.
iShares
MSCI
USA
Small-Cap
Min
Vol
Factor
ETF
iShares
U.S.
Equity
Factor
ETF
Year
Ended
07/31/24
Year
Ended
07/31/23
Year
Ended
07/31/24
Year
Ended
07/31/23
INCREASE
(DECREASE)
IN
NET
ASSETS
OPERATIONS
Net
investment
income
............................................
$
12,558,136
$
15,341,638
$
24,302,954
$
21,254,678
Net
realized
gain
(loss)
............................................
17,515,066
(
25,851,619
)
74,023,137
17,639,283
Net
change
in
unrealized
appreciation
(depreciation)
........................
88,567,595
11,140,703
281,909,800
127,105,160
Net
increase
in
net
assets
resulting
from
operations
...........................
118,640,797
630,722
380,235,891
165,999,121
DISTRIBUTIONS
TO
SHAREHOLDERS
(a)
Decrease
in
net
assets
resulting
from
distributions
to
shareholders
.................
(13,041,539)
(14,809,861)
(23,451,638)
(20,833,016)
CAPITAL
SHARE
TRANSACTIONS
Net
increase
(decrease)
in
net
assets
derived
from
capital
share
transactions
.........
(100,219,913)
72,297,641
263,230,674
113,868,885
NET
ASSETS
Total
increase
in
net
assets
...........................................
5,379,345
58,118,502
620,014,927
259,034,990
Beginning
of
year
..................................................
828,286,428
770,167,926
1,431,010,595
1,171,975,605
End
of
year
......................................................
$
833,665,773
$
828,286,428
$
2,051,025,522
$
1,431,010,595
(a)
Distributions
for
annual
periods
determined
in
accordance
with
U.S.
federal
income
tax
regulations.
Statements
of
Changes
in
Net
Assets
(continued)
Statements
of
Changes
in
Net
Assets
See
notes
to
financial
statements.
iShares
U.S.
Small-Cap
Equity
Factor
ETF
iShares
U.S.
Tech
Breakthrough
Multisector
ETF
Year
Ended
07/31/24
Year
Ended
07/31/23
Year
Ended
07/31/24
Year
Ended
07/31/23
INCREASE
(DECREASE)
IN
NET
ASSETS
OPERATIONS
Net
investment
income
............................................
$
12,445,303
$
14,812,348
$
1,117,947
$
1,588,951
Net
realized
gain
................................................
32,643,885
82,232,494
27,496,890
45,206,708
Net
change
in
unrealized
appreciation
(depreciation)
........................
109,876,679
(
7,516,469
)
48,586,466
42,362,795
Net
increase
in
net
assets
resulting
from
operations
...........................
154,965,867
89,528,373
77,201,303
89,158,454
DISTRIBUTIONS
TO
SHAREHOLDERS
(a)
Decrease
in
net
assets
resulting
from
distributions
to
shareholders
.................
(9,354,694)
(14,979,392)
(892,942)
(1,590,805)
CAPITAL
SHARE
TRANSACTIONS
Net
increase
(decrease)
in
net
assets
derived
from
capital
share
transactions
.........
266,771,579
(250,139,646)
16,224,250
(116,096,855)
NET
ASSETS
Total
increase
(decrease)
in
net
assets
...................................
412,382,752
(
175,590,665
)
92,532,611
(
28,529,206
)
Beginning
of
year
..................................................
814,868,445
990,459,110
317,189,912
345,719,118
End
of
year
......................................................
$
1,227,251,197
$
814,868,445
$
409,722,523
$
317,189,912
(a)
Distributions
for
annual
periods
determined
in
accordance
with
U.S.
federal
income
tax
regulations.
Financial
Highlights
(For
a
share
outstanding
throughout
each
period)
2024
iShares
Annual
Financial
Statements
iShares
MSCI
USA
Small-Cap
Min
Vol
Factor
ETF
Year
Ended
07/31/24
Year
Ended
07/31/23
Year
Ended
07/31/22
Year
Ended
07/31/21
Year
Ended
07/31/20
Net
asset
value,
beginning
of
year
................................
$
35.17
$
35.91
$
37.96
$
29.91
$
34.10
Net
investment
income
(a)
.......................................
0
.55
0
.68
0
.47
0
.40
0
.54
Net
realized
and
unrealized
gain
(loss)
(b)
.............................
4.81
(0.76
)
(2.04
)
8.09
(4.17
)
Net
increase
(decrease)
from
investment
operations
......................
5.36
(0.08
)
(1.57
)
8.49
(3.63
)
Distributions
from
net
investment
income
(c)
..........................
(0.55
)
(0.66
)
(0.48
)
(0.44
)
(0.56
)
Net
asset
value,
end
of
year
.....................................
$
39.98
$
35.17
$
35.91
$
37.96
$
29.91
Total
Return
(d)
—
—
—
—
—
Based
on
net
asset
value
........................................
15.49
%
(0.12
)%
(4.17
)%
28.66
%
(10.73
)%
Ratios
to
Average
Net
Assets
(e)
Total
expen
ses
...............................................
0.20
%
0.20
%
0.20
%
0.20
%
0.20
%
Net
investment
income
..........................................
1.54
%
1.96
%
1.27
%
1.16
%
1.72
%
Supplemental
Data
Net
assets,
end
of
year
(000)
......................................
$
833,666
$
828,286
$
770,168
$
872,986
$
829,866
Portfolio
turnover
rate
(f)
..........................................
44
%
58
%
51
%
50
%
43
%
(a)
Based
on
average
shares
outstanding.
(b)
The
amounts
reported
for
a
share
outstanding
may
not
accord
with
the
change
in
aggregate
gains
and
losses
in
securities
for
the
fiscal
period
due
to
the
timing
of
capital
share
transactions
in
relation
to
the
fluctuating
market
values
of
the
Fund’s
underlying
securities.
(c)
Distributions
for
annual
periods
determined
in
accordance
with
U.S.
federal
income
tax
regulations.
(d)
Where
applicable,
assumes
the
reinvestment
of
distributions.
(e)
Excludes
fees
and
expenses
incurred
indirectly
as
a
result
of
investments
in
underlying
funds.
(f)
Portfolio
turnover
rate
excludes
in-kind
transactions,
if
any.
See
notes
to
financial
statements.
Financial
Highlights
(continued)
(For
a
share
outstanding
throughout
each
period)
iShares
U.S.
Equity
Factor
ETF
Year
Ended
07/31/24
Year
Ended
07/31/23
Year
Ended
07/31/22
Year
Ended
07/31/21
Year
Ended
07/31/20
Net
asset
value,
beginning
of
year
.................................
$
46.09
$
41.49
$
43.64
$
32.57
$
32.13
Net
investment
income
(a)
........................................
0
.73
0
.72
0
.65
0
.46
0
.57
Net
realized
and
unrealized
gain
(loss)
(b)
..............................
10.39
4.59
(2.19
)
11.03
0.50
Net
increase
(decrease)
from
investment
operations
.......................
11.12
5.31
(1.54
)
11.49
1.07
Distributions
from
net
investment
income
(c)
...........................
(0.71
)
(0.71
)
(0.61
)
(0.42
)
(0.63
)
Net
asset
value,
end
of
year
......................................
$
56.50
$
46.09
$
41.49
$
43.64
$
32.57
Total
Return
(d)
—
—
—
—
—
Based
on
net
asset
value
.........................................
24.38
%
13.09
%
(3.58
)%
35.53
%
3.50
%
Ratios
to
Average
Net
Assets
(e)
Total
expen
ses
................................................
0.08
%
0.08
%
0.16
%
0.20
%
0.20
%
Net
investment
income
...........................................
1.46
%
1.75
%
1.50
%
1.20
%
1.79
%
Supplemental
Data
Net
assets,
end
of
year
(000)
.......................................
$
2,051,026
$
1,431,011
$
1,171,976
$
1,095,476
$
832,254
Portfolio
turnover
rate
(f)
...........................................
21
%
21
%
95
%
43
%
42
%
(a)
Based
on
average
shares
outstanding.
(b)
The
amounts
reported
for
a
share
outstanding
may
not
accord
with
the
change
in
aggregate
gains
and
losses
in
securities
for
the
fiscal
period
due
to
the
timing
of
capital
share
transactions
in
relation
to
the
fluctuating
market
values
of
the
Fund’s
underlying
securities.
(c)
Distributions
for
annual
periods
determined
in
accordance
with
U.S.
federal
income
tax
regulations.
(d)
Where
applicable,
assumes
the
reinvestment
of
distributions.
(e)
Excludes
fees
and
expenses
incurred
indirectly
as
a
result
of
investments
in
underlying
funds.
(f)
Portfolio
turnover
rate
excludes
in-kind
transactions,
if
any.
See
notes
to
financial
statements.
Financial
Highlights
(continued)
(For
a
share
outstanding
throughout
each
period)
2024
iShares
Annual
Financial
Statements
iShares
U.S.
Small-Cap
Equity
Factor
ETF
Year
Ended
07/31/24
Year
Ended
07/31/23
Year
Ended
07/31/22
Year
Ended
07/31/21
Year
Ended
07/31/20
Net
asset
value,
beginning
of
year
.................................
$
56.59
$
51.72
$
54.65
$
37.38
$
40.96
Net
investment
income
(a)
........................................
0
.80
0
.81
0
.56
0
.42
0
.49
Net
realized
and
unrealized
gain
(loss)
(b)
..............................
8.83
4.87
(2.84
)
17.43
(3.53
)
Net
increase
(decrease)
from
investment
operations
.......................
9.63
5.68
(2.28
)
17.85
(3.04
)
Distributions
from
net
investment
income
(c)
...........................
(0.59
)
(0.81
)
(0.65
)
(0.58
)
(0.54
)
Net
asset
value,
end
of
year
......................................
$
65.63
$
56.59
$
51.72
$
54.65
$
37.38
Total
Return
(d)
—
—
—
—
—
Based
on
net
asset
value
.........................................
17.19
%
11.23
%
(4.23
)%
48.13
%
(7.39
)%
Ratios
to
Average
Net
Assets
(e)
Total
expen
ses
................................................
0.15
%
0.21
%
0.30
%
0.30
%
0.30
%
Net
investment
income
...........................................
1.39
%
1.58
%
1.04
%
0.87
%
1.31
%
Supplemental
Data
Net
assets,
end
of
year
(000)
.......................................
$
1,227,251
$
814,868
$
990,459
$
1,016,441
$
540,110
Portfolio
turnover
rate
(f)
...........................................
23
%
108
%
46
%
46
%
48
%
(a)
Based
on
average
shares
outstanding.
(b)
The
amounts
reported
for
a
share
outstanding
may
not
accord
with
the
change
in
aggregate
gains
and
losses
in
securities
for
the
fiscal
period
due
to
the
timing
of
capital
share
transactions
in
relation
to
the
fluctuating
market
values
of
the
Fund’s
underlying
securities.
(c)
Distributions
for
annual
periods
determined
in
accordance
with
U.S.
federal
income
tax
regulations.
(d)
Where
applicable,
assumes
the
reinvestment
of
distributions.
(e)
Excludes
fees
and
expenses
incurred
indirectly
as
a
result
of
investments
in
underlying
funds.
(f)
Portfolio
turnover
rate
excludes
in-kind
transactions,
if
any.
See
notes
to
financial
statements.
Financial
Highlights
(continued)
(For
a
share
outstanding
throughout
each
period)
iShares
U.S.
Tech
Breakthrough
Multisector
ETF
Year
Ended
07/31/24
Year
Ended
07/31/23
Year
Ended
07/31/22
Year
Ended
07/31/21
Period
from
01/08/20
(a)
to
07/31/20
Net
asset
value,
beginning
of
period
...............................
$
39.40
$
30.87
$
41.17
$
30.72
$
25.21
Net
investment
income
(b)
.......................................
0
.14
0
.15
0
.15
0
.15
0
.07
Net
realized
and
unrealized
gain
(loss)
(c)
.............................
9.64
8.53
(10.29
)
10.48
5.60
Net
increase
(decrease)
from
investment
operations
......................
9.78
8.68
(10.14
)
10.63
5.67
Distributions
(d)
–
–
–
–
–
From
net
investment
income
....................................
(
0
.11
)
(
0
.15
)
(
0
.16
)
(
0
.15
)
(
0
.16
)
From
net
realized
gain
.........................................
—
—
—
(
0
.03
)
—
Total
distributions
.............................................
(0.11
)
(0.15
)
(0.16
)
(0.18
)
(0.16
)
Net
asset
value,
end
of
period
....................................
$
49.07
$
39.40
$
30.87
$
41.17
$
30.72
Total
Return
(e)
—
—
—
—
—
Based
on
net
asset
value
........................................
24.84
%
28.28
%
(24.71
)%
34.72
%
22.73
%
(f)
Ratios
to
Average
Net
Assets
(g)
Total
expen
ses
...............................................
0.39
%
0.40
%
0.40
%
0.40
%
0.40
%
(h)
Total
expenses
after
fees
waived
...................................
0.30
%
0.30
%
0.30
%
0.30
%
0.30
%
(h)
Net
investment
income
..........................................
0.31
%
0.47
%
0.41
%
0.43
%
0.43
%
(h)
Supplemental
Data
Net
assets,
end
of
period
(000)
....................................
$
409,723
$
317,190
$
345,719
$
432,317
$
344,073
Portfolio
turnover
rate
(i)
..........................................
15
%
21
%
10
%
11
%
12
%
(a)
Commencement
of
operations.
(b)
Based
on
average
shares
outstanding.
(c)
The
amounts
reported
for
a
share
outstanding
may
not
accord
with
the
change
in
aggregate
gains
and
losses
in
securities
for
the
fiscal
period
due
to
the
timing
of
capital
share
transactions
in
relation
to
the
fluctuating
market
values
of
the
Fund’s
underlying
securities.
(d)
Distributions
for
annual
periods
determined
in
accordance
with
U.S.
federal
income
tax
regulations.
(e)
Where
applicable,
assumes
the
reinvestment
of
distributions.
(f)
Not
annualized.
(g)
Excludes
fees
and
expenses
incurred
indirectly
as
a
result
of
investments
in
underlying
funds.
(h)
Annualized.
(i)
Portfolio
turnover
rate
excludes
in-kind
transactions,
if
any.
See
notes
to
financial
statements.
Notes
to
Financial
Statements
2024
iShares
Annual
Financial
Statements
1.
ORGANIZATION
iShares
Trust
(the
“Trust”)
is
registered
under
the
Investment
Company
Act
of
1940,
as
amended
(the
“1940
Act”),
as
an
open-end
management
investment
company.
The
Trust
is
organized
as
a
Delaware
statutory
trust
and
is
authorized
to
have
multiple
series
or
portfolios.
These
financial
statements
relate
only
to
the
following
funds
(each,
a
“Fund”
and
collectively,
the
“Funds”):
2.
Significant
Accounting
Policies
The
financial
statements
are
prepared
in
conformity
with
accounting
principles
generally
accepted
in
the
United
States
of
America
(“U.S.
GAAP”),
which
may
require
management
to
make
estimates
and
assumptions
that
affect
the
reported
amounts
of
assets
and
liabilities
in
the
financial
statements,
disclosure
of
contingent
assets
and
liabilities
at
the
date
of
the
financial
statements
and
the
reported
amounts
of
increases
and
decreases
in
net
assets
from
operations
during
the
reporting
period.
Actual
results
could
differ
from
those
estimates. Each
Fund
is
considered
an
investment
company
under
U.S.
GAAP
and
follows
the
accounting
and
reporting
guidance
applicable
to
investment
companies.
Below
is
a
summary
of
significant
accounting
policies:
Investment Transactions
and
Income
Recognition:
For
financial
reporting
purposes,
investment
transactions
are
recorded
on
the
dates
the
transactions
are
executed.
Realized
gains
and
losses
on
investment
transactions
are
determined
using
the
specific
identification
method.
Dividend
income
and
capital
gain
distributions,
if
any,
are
recorded
on
the
ex-dividend
date.
Non-cash
dividends,
if
any,
are
recorded
on
the
ex-dividend
date
at
fair
value.
Dividends
from
foreign
securities
where
the
ex-dividend
date
may
have
passed
are
subsequently
recorded
when
the
Funds
are
informed
of
the
ex-dividend
date.
Under
the
applicable
foreign
tax
laws,
a
withholding
tax
at
various
rates
may
be
imposed
on
capital
gains,
dividends
and
interest.
Upon
notification
from
issuers
or
as
estimated
by
management,
a
portion
of
the
dividend
income
received
from
a
real
estate
investment
trust
may
be
redesignated
as
a
reduction
of
cost
of
the
related
investment
and/or
realized
gain. Interest
income,
including
amortization
and
accretion
of
premiums
and
discounts
on
debt
securities,
is
recognized
daily
on
an
accrual
basis.
Foreign
Currency
Translation:
Each
Fund’s
books
and
records
are
maintained
in
U.S.
dollars.
Securities
and
other
assets
and
liabilities
denominated
in
foreign
currencies
are
translated
into
U.S.
dollars
using
prevailing
market
rates
as
quoted
by
one
or
more
data
service
providers.
Purchases
and
sales
of
investments
are
recorded
at
the
rates
of
exchange
prevailing
on
the
respective
dates
of
such
transactions.
Generally,
when
the
U.S.
dollar
rises
in
value
against
a
foreign
currency,
the
investments
denominated
in
that
currency
will
lose
value;
the
opposite
effect
occurs
if
the
U.S.
dollar
falls
in
relative
value.
Each
Fund
does
not
isolate
the
effect
of
fluctuations
in
foreign
exchange
rates
from
the
effect
of
fluctuations
in
the
market
prices
of
investments
for
financial
reporting
purposes.
Accordingly,
the
effects
of
changes
in
exchange
rates
on
investments
are
not
segregated
in
the
Statements
of
Operations
from
the
effects
of
changes
in
market
prices
of
those
investments,
but
are
included
as
a
component
of
net
realized
and
unrealized
gain
(loss)
from
investments.
Each
Fund
reports
realized
currency
gains
(losses)
on
foreign
currency
related
transactions
as
components
of
net
realized
gain
(loss)
for
financial
reporting
purposes,
whereas
such
components
are
generally
treated
as
ordinary
income
for
U.S.
federal
income
tax
purposes.
Foreign
Taxes:
Certain
Funds
may
be
subject
to
foreign
taxes
(a
portion
of
which
may
be
reclaimable)
on
income,
stock
dividends,
capital
gains
on
investments,
or
certain
foreign
currency
transactions.
All
foreign
taxes
are
recorded
in
accordance
with
the
applicable
foreign
tax
regulations
and
rates
that
exist
in
the
foreign
jurisdictions
in
which
each
Fund
invests.
These
foreign
taxes,
if
any,
are
paid
by
each
Fund
and
are
reflected
in
its Statements
of
Operations
as
follows:
foreign
taxes
withheld
at
source
are
presented
as
a
reduction
of
income,
foreign
taxes
on
securities
lending
income
are
presented
as
a
reduction
of
securities
lending
income,
foreign
taxes
on
stock
dividends
are
presented
as
“Other
foreign
taxes”,
and
foreign
taxes
on
capital
gains
from
sales
of
investments
and
foreign
taxes
on
foreign
currency
transactions
are
included
in
their
respective
net
realized
gain
(loss)
categories.
Foreign
taxes
payable
or
deferred
as
of
July
31,
2024
,
if
any,
are
disclosed
in
the Statements
of
Assets
and
Liabilities.
The
Funds
file
withholding
tax
reclaims
in
certain
jurisdictions
to
recover
a
portion
of
amounts
previously
withheld.
The
Funds
may
record
a
reclaim
receivable
based
on
collectability,
which
includes
factors
such
as
the
jurisdiction’s
applicable
laws,
payment
history
and
market
convention.
The
Statements
of
Operations
include
tax
reclaims
recorded
as
well
as
professional
and
other
fees,
if
any,
associated
with
recovery
of
foreign
withholding
taxes.
Bank
Overdraft:
Certain
Funds
had
outstanding
cash
disbursements
exceeding
deposited
cash
amounts
at
the
custodian
during
the
reporting
period.
The
Funds
are obligated
to
repay
the
custodian
for
any
overdraft,
including
any
related
costs
or
expenses,
where
applicable.
For
financial
reporting
purposes,
overdraft
fees,
if
any,
are
included
in
interest
expense
in
the
Statements
of
Operations.
Collateralization:
If
required
by
an
exchange
or
counterparty
agreement,
the Funds
may
be
required
to
deliver/deposit
cash
and/or
securities
to/with
an
exchange,
or
broker-
dealer
or
custodian
as
collateral
for
certain
investments.
In-kind
Redemptions:
For
financial
reporting
purposes,
in-kind
redemptions
are
treated
as
sales
of
securities
resulting
in
realized
capital
gains
or
losses
to
the
Funds.
Because
such
gains
or
losses
are
not
taxable
to
the
Funds
and
are
not
distributed
to
existing
Fund
shareholders,
the
gains
or
losses
are
reclassified
from
accumulated
net
realized
gain
(loss)
to
paid-in
capital
at
the
end
of
the
Funds’
tax
year.
These
reclassifications
have
no
effect
on
net
assets
or
net
asset
value
(“NAV”)
per
share.
Distributions:
Dividends
and
distributions
paid
by
each
Fund
are
recorded
on
the
ex-dividend
dates.
Distributions
are
determined
on
a
tax
basis
and
may
differ
from
net
investment
income
and
net
realized
capital
gains
for
financial
reporting
purposes.
Dividends
and
distributions
are
paid
in
U.S.
dollars
and
cannot
be
automatically
reinvested
in
additional
shares
of
the
Funds.
iShares
ETF
Diversification
Classification
MSCI
USA
Small-Cap
Min
Vol
Factor
.......................................................................................
Diversified
U.S.
Equity
Factor
....................................................................................................
Diversified
U.S.
Small-Cap
Equity
Factor
............................................................................................
Diversified
U.S.
Tech
Breakthrough
Multisector
........................................................................................
Diversified
Notes
to
Financial
Statements
(continued)
Notes
to
Financial
Statements
Indemnifications:
In
the
normal
course
of
business,
each
Fund
enters
into
contracts
that
contain
a
variety
of
representations
that
provide
general
indemnification.
The
Funds’
maximum
exposure
under
these
arrangements
is
unknown
because
it
involves
future
potential
claims
against
the
Funds,
which
cannot
be
predicted
with
any
certainty.
3.
Investment
Valuation
and
Fair
Value
Measurements
Investment
Valuation
Policies:
Each
Fund’s
investments
are
valued
at
fair
value
(also
referred
to
as
“market
value”
within
the
financial
statements)
each
day
that
the
Fund’s
listing
exchange
is
open
and,
for
financial
reporting
purposes,
as
of
the
report
date.
U.S.
GAAP
defines
fair
value
as
the
price
a
fund
would
receive
to
sell
an
asset
or
pay
to
transfer
a
liability
in
an
orderly
transaction
between
market
participants
at
the
measurement
date.
The
Board
of
Trustees
of
the
Trust
(the
“Board”)
of each
Fund
has
approved
the
designation
of
BlackRock
Fund
Advisors
(“BFA”),
the
Funds’
investment
adviser, as
the
valuation
designee
for
each
Fund. Each
Fund
determines
the
fair
values
of
its
financial
instruments
using
various
independent
dealers
or
pricing
services
under
BFA’s
policies.
If
a
security’s
market
price
is
not
readily
available
or
does
not
otherwise
accurately
represent
the
fair
value
of
the
security,
the
security
will
be
valued
in
accordance
with
BFA’s policies
and
procedures as
reflecting
fair
value. BFA
has
formed
a
committee
(the
“Valuation
Committee”)
to
develop pricing
policies
and
procedures
and
to
oversee
the
pricing
function
for
all
financial
instruments,
with
assistance
from
other
BlackRock
pricing
committees.
Fair
Value
Inputs
and
Methodologies:
The
following
methods
and
inputs
are
used
to
establish
the
fair
value
of
each
Fund’s
assets
and
liabilities:
Equity
investments
traded
on
a
recognized
securities
exchange
are
valued
at
that
day’s
official
closing
price,
as
applicable,
on
the
exchange
where
the
stock
is
primarily
traded.
Equity
investments
traded
on
a
recognized
exchange
for
which
there
were
no
sales
on
that
day
are valued
at
the
last
traded
price.
Investments
in
open-end
U.S.
mutual
funds
(including
money
market
funds)
are
valued
at
that
day’s
published
NAV.
Futures
contracts
are
valued
based
on
that
day’s
last
reported
settlement
or
trade
price
on
the
exchange
where
the
contract
is
traded.
Swap
agreements
are
valued
utilizing
quotes
received
daily
by
independent
pricing
services
or
through
brokers,
which
are
derived
using
daily
swap
curves
and
models
that
incorporate
a
number
of
market
data
factors,
such
as
discounted
cash
flows,
trades
and
values
of
the
underlying
reference
instruments.
Generally,
trading
in
foreign
instruments
is
substantially
completed
each
day
at
various
times
prior
to
the
close
of
trading
on
the
New
York
Stock
Exchange
(“NYSE”).
Each
business
day,
the
Funds
use
current
market
factors
supplied
by
independent
pricing
services
to
value
certain
foreign
instruments
(“Systematic
Fair
Value
Price”).
The
Systematic
Fair
Value
Price
is
designed
to
value
such
foreign
securities
at
fair
value
as
of
the
close
of
trading
on
the
NYSE,
which
follows
the
close
of
the
local
markets.
If
events
(e.g.,
market
volatility,
company
announcement
or
a
natural
disaster)
occur
that
are
expected
to
materially
affect
the
value
of
such
investment,
or
in
the
event
that
application
of
these
methods
of
valuation
results
in
a
price
for
an
investment
that
is
deemed
not
to
be
representative
of
the
market
value
of
such
investment,
or
if
a
price
is
not
available,
the
investment
will
be
valued
by
the Valuation
Committee,
in
accordance
with
BFA’s
policies
and
procedures as
reflecting
fair
value
(“Fair
Valued
Investments”).
The
fair
valuation
approaches
that
may
be
used
by
the Valuation
Committee
include
market
approach,
income
approach
and
cost
approach.
Valuation
techniques
such
as
discounted
cash
flow,
use
of
market
comparables
and
matrix
pricing
are
types
of
valuation
approaches
and
are
typically
used
in
determining
fair
value.
When
determining
the
price
for
Fair
Valued
Investments,
the Valuation
Committee
seeks
to
determine
the
price
that each
Fund
might
reasonably
expect
to
receive
or
pay
from
the
current
sale
or
purchase
of
that
asset
or
liability
in
an
arm’s-length
transaction.
Fair
value
determinations
shall
be
based
upon
all
available
factors
that
the Valuation
Committee
deems
relevant
and
consistent
with
the
principles
of
fair
value
measurement.
Fair
value
pricing
could
result
in
a
difference
between
the
prices
used
to
calculate
a
fund’s
NAV
and
the
prices
used
by
the
fund’s
underlying
index,
which
in
turn
could
result
in
a
difference
between
the
fund’s
performance
and
the
performance
of
the
fund’s
underlying
index.
Fair
Value
Hierarchy:
Various
inputs
are
used
in
determining
the
fair
value
of
financial
instruments.
These
inputs
to
valuation
techniques
are
categorized
into
a
fair
value
hierarchy
consisting
of
three
broad
levels
for
financial
reporting
purposes
as
follows:
Level
1
–
Unadjusted
price
quotations
in
active
markets/exchanges
for
identical
assets
or
liabilities
that each
Fund
has
the
ability
to
access;
Level
2
–
Other
observable
inputs
(including,
but
not
limited
to,
quoted
prices
for
similar
assets
or
liabilities
in
markets
that
are
active,
quoted
prices
for
identical
or
similar
assets
or
liabilities
in
markets
that
are
not
active,
inputs
other
than
quoted
prices
that
are
observable
for
the
assets
or
liabilities
(such
as
interest
rates,
yield
curves,
volatilities,
prepayment
speeds,
loss
severities,
credit
risks
and
default
rates)
or
other
market-corroborated
inputs);
and
Level
3
–
Unobservable
inputs
based
on
the
best
information
available
in
the
circumstances,
to
the
extent
observable
inputs
are
not
available,
(including
the Valuation
Committee’s
assumptions
used
in
determining
the
fair
value
of
financial
instruments).
The
hierarchy
gives
the
highest
priority
to
unadjusted
quoted
prices
in
active
markets
for
identical
assets
or
liabilities
(Level
1
measurements)
and
the
lowest
priority
to
unobservable
inputs
(Level
3
measurements).
Accordingly,
the
degree
of
judgment
exercised
in
determining
fair
value
is
greatest
for
instruments
categorized
in
Level
3.
The
inputs
used
to
measure
fair
value
may
fall
into
different
levels
of
the
fair
value
hierarchy.
In
such
cases,
for
disclosure
purposes,
the
fair
value
hierarchy
classification
is
determined
based
on
the
lowest
level
input
that
is
significant
to
the
fair
value
measurement
in
its
entirety.
Investments
classified
within
Level
3
have
significant
unobservable
inputs
used
by
the Valuation
Committee
in
determining
the
price
for
Fair
Valued
Investments.
Level
3
investments
include
equity
or
debt
issued
by
privately
held
companies
or
funds
that
may
not
have
a
secondary
market
and/or
may
have
a
limited
number
of
investors.
The
categorization
of
a
value
determined
for
financial
instruments
is
based
on
the
pricing
transparency
of
the
financial
instruments
and
is
not
necessarily
an
indication
of
the
risks
associated
with
investing
in
those
securities.
Notes
to
Financial
Statements
(continued)
2024
iShares
Annual
Financial
Statements
4.
Securities
and
Other
Investments
Securities
Lending:
Each
Fund
may
lend
its
securities
to
approved
borrowers,
such
as
brokers,
dealers
and
other
financial
institutions.
The
borrower
pledges
and
maintains
with
the
Fund
collateral
consisting
of
cash,
an
irrevocable
letter
of
credit
issued
by
an
approved
bank,
or
securities
issued
or
guaranteed
by
the
U.S.
government.
The
initial
collateral
received
by
each
Fund
is
required
to
have
a
value
of
at
least
102%
of
the
current
market
value
of
the
loaned
securities
for
securities
traded
on
U.S.
exchanges
and
a
value
of
at
least
105%
for
all
other
securities.
The
collateral
is
maintained
thereafter
at
a
value
equal
to
at
least
100%
of
the
current
value
of
the
securities
on
loan.
The
market
value
of
the
loaned
securities
is
determined
at
the
close
of
each
business
day
of
the
Fund
and
any
additional
required
collateral
is
delivered
to
the
Fund
or
excess
collateral
is
returned
by
the
Fund,
on
the
next
business
day.
During
the
term
of
the
loan,
each
Fund
is
entitled
to
all
distributions
made
on
or
in
respect
of
the
loaned
securities
but
does
not
receive
interest
income
on
securities
received
as
collateral.
Loans
of
securities
are
terminable
at
any
time
and
the
borrower,
after
notice,
is
required
to
return
borrowed
securities
within
the
standard
time
period
for
settlement
of
securities
transactions.
As
of
period
end,
any
securities
on
loan
were
collateralized
by
cash
and/or
U.S.
Government
obligations.
Cash
collateral
invested
in
money
market
funds
managed
by
BFA,
or
its
affiliates
is
disclosed
in
the
Schedule
of
Investments.
Any
non-cash
collateral
received
cannot
be
sold,
re-invested
or
pledged
by
the
Fund,
except
in
the
event
of
borrower
default.
The
securities
on
loan,
if
any,
are
also
disclosed
in
each
Fund’s
Schedule
of
Investments.
The
market
value
of
any
securities
on
loan
and
the
value
of
any
related
cash
collateral
are
disclosed
in
the
Statements
of
Assets
and
Liabilities.
Securities
lending
transactions
are
entered
into
by
the
Funds
under
Master
Securities
Lending
Agreements
(each,
an
“MSLA”)
which
provide
the
right,
in
the
event
of
default
(including
bankruptcy
or
insolvency)
for
the
non-defaulting
party
to
liquidate
the
collateral
and
calculate
a
net
exposure
to
the
defaulting
party
or
request
additional
collateral.
In
the
event
that
a
borrower
defaults,
the
Funds,
as
lender,
would
offset
the
market
value
of
the
collateral
received
against
the
market
value
of
the
securities
loaned.
When
the
value
of
the
collateral
is
greater
than
that
of
the
market
value
of
the
securities
loaned,
the
lender
is
left
with
a
net
amount
payable
to
the
defaulting
party.
However,
bankruptcy
or
insolvency
laws
of
a
particular
jurisdiction
may
impose
restrictions
on
or
prohibitions
against
such
a
right
of
offset
in
the
event
of
an
MSLA
counterparty’s
bankruptcy
or
insolvency.
Under
the
MSLA,
absent
an
event
of
default,
the
borrower
can
resell
or
re-pledge
the
loaned
securities,
and
the
Funds
can
reinvest
cash
collateral
received
in
connection
with
loaned
securities.
Upon
an
event
of
default,
the
parties’
obligations
to
return
the
securities
or
collateral
to
the
other
party
are
extinguished,
and
the
parties
can
resell
or
re-pledge
the
loaned
securities
or
the
collateral
received
in
connection
with
the
loaned
securities
in
order
to
satisfy
the
defaulting
party’s
net
payment
obligation
for
all
transactions
under
the
MSLA.
The
defaulting
party
remains
liable
for
any
deficiency.
As
of
period
end,
the
following
table
is
a
summary
of
the
securities
on
loan
by
counterparty
which
are
subject
to
offset
under
an
MSLA:
iShares
ETF
and
Counterparty
Securities
Loaned
at
Value
Cash
Collateral
Received
(a)
Non-Cash
Collateral
Received,
at
Fair
Value
(a)
Net
Amount
MSCI
USA
Small-Cap
Min
Vol
Factor
Barclays
Bank
plc
......................................
$
5,823,071
$
(5,823,071)
$
–
$
–
BNP
Paribas
SA
.......................................
10,541,730
(10,541,730)
–
–
HSBC
Bank
plc
.......................................
4,571,959
(4,571,959)
–
–
J.P.
Morgan
Securities
LLC
...............................
3,433,111
(3,385,954)
–
47,157
(b)
Jefferies
LLC
.........................................
42,889
(42,329)
–
560
(b)
Morgan
Stanley
.......................................
2,201,973
(2,201,973)
–
–
National
Financial
Services
LLC
............................
4,096,545
(4,096,545)
–
–
State
Street
Bank
&
Trust
Co.
..............................
784,179
(784,179)
–
–
Toronto-Dominion
Bank
(The)
..............................
155,100
(155,100)
–
–
UBS
AG
............................................
1,193
(1,179)
–
14
Wells
Fargo
Bank
NA
...................................
1,406,605
(1,406,605)
–
–
$
33,058,355
$
(33,010,624)
$
–
$
47,731
U.S.
Equity
Factor
Barclays
Bank
plc
......................................
$
2,026,655
$
(2,026,655)
$
–
$
–
BNP
Paribas
SA
.......................................
63,960
(63,960)
–
–
BofA
Securities,
Inc.
....................................
1,890,048
(1,890,048)
–
–
Goldman
Sachs
&
Co.
LLC
...............................
1,202,861
(1,202,861)
–
–
HSBC
Bank
plc
.......................................
2,526
(2,503)
–
23
(b)
Jefferies
LLC
.........................................
81,439
(81,439)
–
–
RBC
Capital
Markets
LLC
................................
2,692,785
(2,692,785)
–
–
Toronto-Dominion
Bank
(The)
..............................
1,133,050
(1,118,569)
–
14,481
(b)
UBS
AG
............................................
792,846
(781,692)
–
11,154
(b)
UBS
Securities
LLC
....................................
3,133,690
(3,133,690)
–
–
Wells
Fargo
Bank
NA
...................................
99,367
(99,251)
–
116
(b)
Wells
Fargo
Securities
LLC
...............................
31,137
(31,137)
–
–
$
13,150,364
$
(13,124,590)
$
–
$
25,774
U.S.
Small-Cap
Equity
Factor
Barclays
Bank
plc
......................................
$
5,502,486
$
(5,502,486)
$
–
$
–
BNP
Paribas
SA
.......................................
5,174,959
(5,174,959)
–
–
BofA
Securities,
Inc.
....................................
8,314,267
(8,314,267)
–
–
Citadel
Clearing
LLC
....................................
327,760
(327,760)
–
–
Citigroup
Global
Markets,
Inc.
..............................
8,513,317
(8,513,317)
–
–
Goldman
Sachs
&
Co.
LLC
...............................
14,363,403
(13,861,349)
–
502,054
(b)
HSBC
Bank
plc
.......................................
5,247,684
(5,247,684)
–
–
J.P.
Morgan
Securities
LLC
...............................
8,210,822
(8,210,822)
–
–
Jefferies
LLC
.........................................
99,691
(99,691)
–
–
Morgan
Stanley
.......................................
13,246,883
(13,246,883)
–
–
Notes
to
Financial
Statements
(continued)
Notes
to
Financial
Statements
The
risks
of
securities
lending
include
the
risk
that
the
borrower
may
not
provide
additional
collateral
when
required
or
may
not
return
the
securities
when
due.
To
mitigate
these
risks,
each
Fund
benefits
from
a
borrower
default
indemnity
provided
by
BlackRock,
Inc.
(“BlackRock”).
BlackRock’s
indemnity
allows
for
full
replacement
of
the
securities
loaned
to
the
extent
the
collateral
received
does
not
cover
the
value
of
the
securities
loaned
in
the
event
of
borrower
default.
Each
Fund
could
incur
a
loss
if
the
value
of
an
investment
purchased
with
cash
collateral
falls
below
the
market
value
of
the
loaned
securities
or
if
the
value
of
an
investment
purchased
with
cash
collateral
falls
below
the
value
of
the
original
cash
collateral
received.
Such
losses
are
borne
entirely
by
each
Fund.
5.
Derivative
Financial
Instruments
Futures
Contracts:
Futures
contracts
are
purchased
or
sold
to
gain
exposure
to,
or
manage
exposure
to,
changes
in
interest
rates
(interest
rate
risk)
and
changes
in
the
value
of
equity
securities
(equity
risk)
or
foreign
currencies
(foreign
currency
exchange
rate
risk).
Futures
contracts
are
exchange-traded
agreements
between
the
Funds
and
a
counterparty
to
buy
or
sell
a
specific
quantity
of
an
underlying
instrument
at
a
specified
price
and
on
a
specified
date.
Depending
on
the
terms
of
a
contract,
it
is
settled
either
through
physical
delivery
of
the
underlying
instrument
on
the
settlement
date
or
by
payment
of
a
cash
amount
on
the
settlement
date.
Upon
entering
into
a
futures
contract,
the
Funds
are
required
to
deposit
initial
margin
with
the
broker
in
the
form
of
cash
or
securities
in
an
amount
that
varies
depending
on
a
contract’s
size
and
risk
profile.
The
initial
margin
deposit
must
then
be
maintained
at
an
established
level
over
the
life
of
the
contract.
Amounts
pledged,
which
are
considered
restricted,
are
included
in
cash
pledged
for
futures
contracts
in
the
Statements
of
Assets
and
Liabilities.
Securities
deposited
as
initial
margin
are
designated
in
the
Schedule
of
Investments
and
cash
deposited,
if
any,
are
shown
as
cash
pledged
for
futures
contracts
in
the
Statements
of
Assets
and
Liabilities.
Pursuant
to
the
contract,
the
Funds
agree
to
receive
from
or
pay
to
the
broker
an
amount
of
cash
equal
to
the
daily
fluctuation
in
market
value
of
the
contract
(“variation
margin”).
Variation
margin
is
recorded
as
unrealized
appreciation
(depreciation)
and,
if
any,
shown
as
variation
margin
receivable
(or
payable)
on
futures
contracts
in
the
Statements
of
Assets
and
Liabilities.
When
the
contract
is
closed,
a
realized
gain
or
loss
is
recorded
in
the
Statements
of
Operations
equal
to
the
difference
between
the
notional
amount
of
the
contract
at
the
time
it
was
opened
and
the
notional
amount
at
the
time
it
was
closed.
The
use
of
futures
contracts
involves
the
risk
of
an
imperfect
correlation
in
the
movements
in
the
price
of
futures
contracts
and
interest
rates,
foreign
currency
exchange
rates
or
underlying
assets.
Swaps:
Swap
contracts
are
entered
into
to
manage
exposure
to
issuers,
markets
and
securities.
Such
contracts
are
agreements
between
the
Funds
and
a
counterparty
to
make
periodic
net
payments
on
a
specified
notional
amount
or
a
net
payment
upon
termination.
Swap
agreements
are
privately
negotiated
in
the
over-the-counter
("OTC")
market
and
may
be
entered
into
as
a
bilateral
contract
(“OTC
swaps”)
or
centrally
cleared
(“centrally
cleared
swaps”).
For
OTC
swaps,
any
upfront
premiums
paid
and
any
upfront
fees
received
are
shown
as
swap
premiums
paid
and
swap
premiums
received,
respectively,
in
the
Statements
of
Assets
and
Liabilities
and
amortized
over
the
term
of
the
contract.
The
daily
fluctuation
in
market
value
is
recorded
as
unrealized
appreciation
(depreciation)
on
OTC
Swaps
in
the
Statements
of
Assets
and
Liabilities.
Payments
received
or
paid
are
recorded
in
the
Statements
of
Operations
as
realized
gains
or
losses,
respectively.
When
an
OTC
iShares
ETF
and
Counterparty
Securities
Loaned
at
Value
Cash
Collateral
Received
(a)
Non-Cash
Collateral
Received,
at
Fair
Value
(a)
Net
Amount
U.S.
Small-Cap
Equity
Factor
(continued)
National
Financial
Services
LLC
............................
2,582,290
(2,582,290)
–
–
Natixis
SA
...........................................
617,961
(617,961)
–
–
RBC
Capital
Markets
LLC
................................
1,370,486
(1,370,486)
–
–
Scotia
Capital
(USA),
Inc.
................................
1,268,679
(1,266,476)
–
2,203
(b)
SG
Americas
Securities
LLC
..............................
2,237
(2,146)
–
91
(b)
State
Street
Bank
&
Trust
Co.
..............................
1,094,534
(1,094,534)
–
–
Toronto-Dominion
Bank
(The)
..............................
968,694
(955,428)
–
13,266
(b)
UBS
AG
............................................
111,777
(109,177)
–
2,600
(b)
Virtu
Americas
LLC
.....................................
340,509
(338,303)
–
2,206
(b)
Wells
Fargo
Bank
NA
...................................
340,154
(340,154)
–
–
Wells
Fargo
Securities
LLC
...............................
38,717
(38,496)
–
221
(b)
$
77,737,310
$
(77,214,669)
$
–
$
522,641
U.S.
Tech
Breakthrough
Multisector
Barclays
Bank
plc
......................................
$
432,508
$
(421,742)
$
–
$
10,766
(b)
Barclays
Capital,
Inc.
...................................
101,603
(101,603)
–
–
BNP
Paribas
SA
.......................................
179,962
(179,962)
–
–
BofA
Securities,
Inc.
....................................
2,795,816
(2,787,273)
–
8,543
(b)
Citadel
Clearing
LLC
....................................
1,148,622
(1,148,622)
–
–
Citigroup
Global
Markets,
Inc.
..............................
1,433,467
(1,433,467)
–
–
HSBC
Bank
plc
.......................................
2,018
(2,018)
–
–
J.P.
Morgan
Securities
LLC
...............................
241,849
(241,849)
–
–
Morgan
Stanley
.......................................
646,750
(646,750)
–
–
Scotia
Capital
(USA),
Inc.
................................
20,712
(20,712)
–
–
State
Street
Bank
&
Trust
Co.
..............................
74,855
(74,855)
–
–
Toronto-Dominion
Bank
(The)
..............................
45,576
(45,576)
–
–
$
7,123,738
$
(7,104,429)
$
–
$
19,309
(a)
Collateral
received,
if
any,
in
excess
of
the
market
value
of
securities
on
loan
is
not
presented
in
this
table.
The
total
cash
collateral
received
by
each
Fund
is
disclosed
in
the
Fund’s
Statements
of
Assets
and
Liabilities.
(b)
The
market
value
of
the
loaned
securities
is
determined
as
of
July
31,
2024.
Additional
collateral
is
delivered
to
the
Fund
on
the
next
business
day
in
accordance
with
the
MSLA.
The
net
amount
would
be
subject
to
the
borrower
default
indemnity
in
the
event
of
default
by
the
counterparty.
Notes
to
Financial
Statements
(continued)
2024
iShares
Annual
Financial
Statements
swap
is
terminated,
a
realized
gain
or
loss
is
recorded
in
the
Statements
of
Operations
equal
to
the
difference
between
the
proceeds
from
(or
cost
of)
the
closing
transaction
and
the
Funds’
basis
in
the
contract,
if
any.
Generally,
the
basis
of
the
contract
is
the
premium
received
or
paid.
Total
return
swaps
are
entered
into by
the
U.S.
Small-Cap
Equity
Factor
to
obtain
exposure
to
a
security
or
market
without
owning
such
security
or
investing
directly
in
such
market
or
to
exchange
the
risk/return
of
one
security
or
market
(e.g.,
fixed-income)
with
another
security
or
market
(e.g.,
equity
or
commodity
prices)
(equity
risk,
commodity
price
risk
and/or
interest
rate
risk).
Total
return
swaps
are
agreements
in
which
there
is
an
exchange
of
cash
flows
whereby
one
party
commits
to
make
payments
based
on
the
total
return
(distributions
plus
capital
gains/losses)
of
an
underlying
instrument,
or
basket
or
underlying
instruments,
in
exchange
for
fixed
or
floating
rate
interest
payments.
If
the
total
return
of
the
instruments
or
index
underlying
the
transaction
exceeds
or
falls
short
of
the
offsetting
fixed
or
floating
interest
rate
obligation,
the
Fund
receives
payment
from
or
makes
a
payment
to
the
counterparty.
Certain
total
return
swaps
are
designed
to
function
as
a
portfolio
of
direct
investments
in
long
and
short
equity
positions.
This
means
that
the
Fund
has
the
ability
to
trade
in
and
out
of
these
long
and
short
positions
within
the
swap
and
will
receive
the
economic
benefits
and
risks
equivalent
to
direct
investment
in
these
positions,
subject
to
certain
adjustments
due
to
events
related
to
the
counterparty.
Benefits
and
risks
include
capital
appreciation
(depreciation),
corporate
actions
and
dividends
received
and
paid,
all
of
which
are
reflected
in
the
swap’s
market
value.
The
market
value
also
includes
interest
charges
and
credits
(“financing
fees”)
related
to
the
notional
values
of
the
long
and
short
positions
and
cash
balances
within
the
swap.
These
interest
charges
and
credits
are
based
on
a
specified
benchmark
rate
plus
or
minus
a
specified
spread
determined
based
upon
the
country
and/or
currency
of
the
positions
in
the
portfolio.
Positions
within
the
swap
and
financing
fees
are
reset
periodically.
During
a
reset,
any
unrealized
appreciation
(depreciation)
on
positions
and
accrued
financing
fees
become
available
for
cash
settlement
between
the
Fund
and
the
counterparty.
The
amounts
that
are
available
for
cash
settlement
are
recorded
as
realized
gains
or
losses
in
the
Statements
of
Operations.
Cash
settlement
in
and
out
of
the
swap
may
occur
at
a
reset
date
or
any
other
date,
at
the
discretion
of
the
Fund
and
the
counterparty,
over
the
life
of
the
agreement.
Certain
swaps
have
no
stated
expiration
and
can
be
terminated
by
either
party
at
any
time.
Swap
transactions
involve,
to
varying
degrees,
elements
of
interest
rate,
credit
and
market
risks
in
excess
of
the
amounts
recognized
in
the
Statements
of
Assets
and
Liabilities.
Such
risks
involve
the
possibility
that
there
will
be
no
liquid
market
for
these
agreements,
that
the
counterparty
to
the
agreements
may
default
on
its
obligation
to
perform
or
disagree
as
to
the
meaning
of
the
contractual
terms
in
the
agreements,
and
that
there
may
be
unfavorable
changes
in
interest
rates
and/or
market
values
associated
with
these
transactions.
Master
Netting
Arrangements:
In
order
to
define
its
contractual
rights
and
to
secure
rights
that
will
help
mitigate
its
counterparty
risk,
a
Fund
may
enter
into
an
International
Swaps
and
Derivatives
Association,
Inc.
Master
Agreement
(“ISDA
Master
Agreement”)
or
similar
agreement
with
its
derivative
contract
counterparties.
An
ISDA
Master
Agreement
is
a
bilateral
agreement
between
a
Fund
and
a
counterparty
that
governs
certain
OTC
derivatives
and
typically
contains,
among
other
things,
collateral
posting
terms
and
netting
provisions
in
the
event
of
a
default
and/or
termination
event.
Under
an
ISDA
Master
Agreement,
a
Fund
may,
under
certain
circumstances,
offset
with
the
counterparty
certain
derivative
financial
instruments’
payables
and/or
receivables
with
collateral
held
and/or
posted
and
create
one
single
net
payment.
The
provisions
of
the
ISDA
Master
Agreement
typically
permit
a
single
net
payment
in
the
event
of
default
including
the
bankruptcy
or
insolvency
of
the
counterparty.
However,
bankruptcy
or
insolvency
laws
of
a
particular
jurisdiction
may
impose
restrictions
on
or
prohibitions
against
the
right
of
offset
in
bankruptcy,
insolvency,
or
other
events.
For
derivatives
traded
under
an
ISDA
Master
Agreement,
the
collateral
requirements
are
typically
calculated
by
netting
the
mark-to-market
amount
for
each
transaction
under
such
agreement,
and
comparing
that
amount
to
the
value
of
any
collateral
currently
pledged
by
a
fund
and
the
counterparty.
Cash
collateral
that
has
been
pledged
to
cover
obligations
of
the
Funds
and
cash
collateral
received
from
the
counterparty,
if
any,
is
reported
separately
in
the
Statements
of
Assets
and
Liabilities
as
cash
pledged
as
collateral
and
cash
received
as
collateral,
respectively.
Non-cash
collateral
pledged
by
the
Funds,
if
any,
is
noted
in
the
Schedules
of
Investments.
Generally,
the
amount
of
collateral
due
from
or
to
a
counterparty
is
subject
to
a
certain
minimum
transfer
amount
threshold
before
a
transfer
is
required,
which
is
determined
at
the
close
of
business
of
the
Funds.
Any
additional
required
collateral
is
delivered
to/pledged
by
the
Funds
on
the
next
business
day.
Typically,
the
counterparty
is
not
permitted
to
sell,
re-pledge
or
use
cash
and
non-cash
collateral
it
receives.
A
fund
generally
agrees
not
to
use
non-cash
collateral
that
it
receives
but
may,
absent
default
or
certain
other
circumstances
defined
in
the
underlying
ISDA
Master
Agreement,
be
permitted
to
use
cash
collateral
received.
In
such
cases,
interest
may
be
paid
pursuant
to
the
collateral
arrangement
with
the
counterparty.
To
the
extent
amounts
due
to
the
Funds
from
the
counterparty
are
not
fully
collateralized,
each
Fund
bears
the
risk
of
loss
from
counterparty
non-performance.
Likewise,
to
the
extent
the
Funds
have
delivered
collateral
to
a
counterparty
and
stand
ready
to
perform
under
the
terms
of their
agreement
with
such
counterparty,
each
Fund
bears
the
risk
of
loss
from
a
counterparty
in
the
amount
of
the
value
of
the
collateral
in
the
event
the
counterparty
fails
to
return
such
collateral.
Based
on
the
terms
of
agreements,
collateral
may
not
be
required
for
all
derivative
contracts.
For
financial
reporting
purposes,
each
Fund
does
not
offset
derivative
assets
and
derivative
liabilities
that
are
subject
to
netting
arrangements,
if
any,
in
the
Statements
of
Assets
and
Liabilities.
6.
Investment
Advisory
Agreement
and
Other
Transactions
with
Affiliates
Investment
Advisory
Fees:
Pursuant
to
an
Investment
Advisory
Agreement
with
the
Trust
,
BFA
manages
the
investment
of each
Fund’s
assets.
BFA
is
a
California
corporation
indirectly owned
by
BlackRock. Under
the
Investment
Advisory
Agreement,
BFA
is
responsible
for
substantially
all
expenses
of
the
Funds,
except
(
i
)
interest
and
taxes;
(ii)
brokerage
commissions
and
other
expenses
connected
with
the
execution
of
portfolio
transactions;
(iii)
distribution
fees;
(iv)
the
advisory
fee
payable
to
BFA;
and
(v)
litigation
expenses
and
any
extraordinary
expenses
(in
each
case
as
determined
by
a
majority
of
the
independent
trustees
).
Notes
to
Financial
Statements
(continued)
Notes
to
Financial
Statements
For
its
investment
advisory
services
to each of
the
following Funds,
BFA
is
entitled
to
an
annual
investment
advisory
fee,
accrued
daily
and
paid
monthly
by
the
Funds,
based
on
the
average
daily
net
assets
of each
Fund
as
follows:
Effective
June
28,
2024,
for
its
investment
advisory
services
to
the
iShares
U.S.
Tech
Breakthrough
Multisector
ETF,
BFA
is
entitled
to
an
annual
investment
advisory
fee
of
0.30%,
accrued
daily
and
paid
monthly
by
the
Fund,
based
on
the
average
daily
net
assets
of
the
Fund.
Prior
to June
28,
2024,
BFA
was
entitled
to
an
annual
investment
advisory
fee
of
0.40%,
accrued
daily
and
paid
monthly
by
the
Fund,
based
on
the
average
daily
net
assets
of
the
Fund.
Expense
Waivers
:
BFA
may
from
time
to
time
voluntarily
waive
and/or
reimburse
fees
or
expenses
in
order
to
limit
total
annual
fund
operating
expenses
(excluding
acquired
fund
fees
and
expenses,
if
any).
Prior
to
June
28,
2024,
for
the
iShares
U.S.
Tech
Breakthrough
Multisector
ETF,
BFA
elected
to
implement
a
voluntary
fee
waiver
in
order
to
limit
the
Fund’s
total
annual
operating
expenses
after
fee
waiver
to
0.30%
and
currently
intends
to
keep
such
voluntary
fee
waiver
for
the
Fund
in
place
through
December
31,
2024.
Any
such
voluntary
waiver
or
reimbursement
may
be
eliminated
by
BFA
at
any
time.
These
amounts are
included
in
investment
advisory
fees
waived
in
the
Statements
of
Operations.
For
the
year ended July
31,
2024,
the
amounts
waived
in
investment
advisory
fees
pursuant
to
this
arrangement
were
as
follows:
Distributor:
BlackRock
Investments,
LLC
(“BRIL”),
an
affiliate
of
BFA,
is
the
distributor
for
each
Fund.
Pursuant
to
the
distribution
agreement,
BFA
is
responsible
for
any
fees
or
expenses
for
distribution
services
provided
to
the
Funds.
ETF
Servicing
Fees:
Each
Fund
has
entered
into
an
ETF
Services
Agreement
with
BRIL
to
perform
certain
order
processing,
Authorized
Participant
communications,
and
related
services
in
connection
with
the
issuance
and
redemption
of
Creation
Units
(“ETF
Services”).
BRIL
is
entitled
to
a
transaction
fee
from
Authorized
Participants
on
each
creation
or
redemption
order
for
the
ETF
Services
provided. The Funds
do
not
pay
BRIL
for
ETF
Services.
Securities
Lending:
The
U.S.
Securities
and
Exchange
Commission
(the
“SEC”)
has
issued
an
exemptive
order
which
permits
BlackRock
Institutional
Trust
Company,
N.A.
(“BTC”),
an
affiliate
of
BFA,
to
serve
as
securities
lending
agent
for
the
Funds,
subject
to
applicable
conditions.
As
securities
lending
agent,
BTC
bears
all
operational
costs
directly
related
to
securities
lending,
including
any
custodial
costs.
Each
Fund
is
responsible
for
fees
in
connection
with
the
investment
of
cash
collateral
received
for
securities
on
loan
(the
“collateral
investment
fees”).
The
cash
collateral
is
invested
in
a
money
market
fund,
BlackRock
Cash
Funds:
Institutional
or
BlackRock
Cash
Funds:
Treasury,
managed
by
BFA,
or
its
affiliates.
However,
BTC
has
agreed
to
reduce
the
amount
of
securities
lending
income
it
receives
in
order
to
effectively
limit
the
collateral
investment
fees
each
Fund
bears
to
an
annual
rate
of
0.04%.
The
SL
Agency
Shares
of
such
money
market
fund
will
not
be
subject
to
a
sales
load,
redemption
fee,
distribution
fee
or
service
fee.
The
money
market
fund
in
which
the
cash
collateral
has
been
invested
may
impose
a
discretionary
liquidity
fee
of
up
to
2%
of
the
value
redeemed,
if
such
fee
is
determined
to
be
in
the
best
interests
of
such
money
market
fund.
Securities
lending
income
is
generally
equal
to
the
total
of
income
earned
from
the
reinvestment
of
cash
collateral
(and
excludes
collateral
investment
fees),
and
any
fees
or
other
payments
to
and
from
borrowers
of
securities.
Each
Fund
retains
a
portion
of
the
securities
lending
income
and
remits
the
remaining
portion
to
BTC
as
compensation
for
its
services
as
securities
lending
agent.
Pursuant
to
the
current
securities
lending
agreement,
each
Fund
retains
81%
of
securities
lending
income
(which
excludes
collateral
investment
fees)
and
the
amount
retained
can
never
be
less
than
70%
of
the
total
of
securities
lending
income
plus
the
collateral
investment
fees.
In
addition,
commencing
the
business
day
following
the
date
that
the
aggregate
securities
lending
income
plus
the
collateral
investment
fees
generated
across
all
1940
Act
iShares
exchange-traded
funds
(the
“iShares
ETF
Complex”)
in
that
calendar
year
exceeds
a
specified
threshold,
each
Fund,
pursuant
to
the
securities
lending
agreement,
will
retain
for
the
remainder
of
that
calendar
year
81%
of
securities
lending
income
(which
excludes
collateral
investment
fees),
and
the
amount
retained
can
never
be
less
than
70%
of
the
total
of
securities
lending
income
plus
the
collateral
investment
fees.
The
share
of
securities
lending
income
earned
by each
Fund
is
shown
as
securities
lending
income
–
affiliated
–
net
in
its
Statements
of
Operations.
For
the year ended
July
31,
2024,
the
Funds
paid
BTC
the
following
amounts
for
securities
lending
agent
services:
Officers
and
Trustees:
Certain
officers
and/or
trustees
of
the
Trust
are
officers
and/or
trustees
of
BlackRock
or
its
affiliates.
Other
Transactions:
Cross
trading
is
the
buying
or
selling
of
portfolio
securities
between
funds
to
which
BFA
(or
an
affiliate)
serves
as
investment
adviser.
At
its
regularly
scheduled
quarterly
meetings,
the
Board
reviews
such
transactions
as
of
the
most
recent
calendar
quarter
for
compliance
with
the
requirements
and
restrictions
set
forth
by
Rule
17a-7.
iShares
ETF
Investment
Advisory
Fees
MSCI
USA
Small-Cap
Min
Vol
Factor
....................................................................................
0.20
%
U.S.
Equity
Factor
.................................................................................................
0.08
U.S.
Small-Cap
Equity
Factor
.........................................................................................
0.15
U.S.
Tech
Breakthrough
Multisector
.....................................................................................
0.30
iShares
ETF
Amounts
Waived
U.S.
Tech
Breakthrough
Multisector
........................................................................................
$
318,912
iShares
ETF
Amounts
MSCI
USA
Small-Cap
Min
Vol
Factor
...........................................................................................
$
106,968
U.S.
Equity
Factor
........................................................................................................
23,627
U.S.
Small-Cap
Equity
Factor
................................................................................................
106,265
U.S.
Tech
Breakthrough
Multisector
............................................................................................
19,729
Notes
to
Financial
Statements
(continued)
2024
iShares
Annual
Financial
Statements
For
the year ended July
31,
2024,
transactions
executed
by
the
Funds
pursuant
to
Rule
17a-7
under
the
1940
Act
were
as
follows:
Each
Fund
may
invest
its
positive
cash
balances
in
certain
money
market
funds
managed
by
BFA
or
an
affiliate.
The
income
earned
on
these
temporary
cash
investments
is
shown
as
dividends
–
affiliated
in
the
Statements
of
Operations.
A
fund,
in
order
to
improve
its
portfolio
liquidity
and
its
ability
to
track
its
underlying
index,
may
invest
in
shares
of
other
iShares
funds
that
invest
in
securities
in
the
fund’s
underlying
index.
7.
Purchases
and
Sales
For
the year ended
July
31,
2024,
purchases
and
sales
of
investments,
excluding
short-term securities
and
in-kind
transactions,
were
as
follows:
For
the year ended
July
31,
2024,
in-kind
transactions
were
as
follows:
8.
Income
Tax
Information
Each
Fund
is
treated
as
an
entity
separate
from
the
Trust’s other
funds
for
federal
income
tax
purposes.
It
is
each
Fund’s
policy
to
comply
with
the
requirements
of
the
Internal
Revenue
Code
of
1986,
as
amended,
applicable
to
regulated
investment
companies,
and
to
distribute
substantially
all
of
its
taxable
income
to
its
shareholders.
Therefore,
no
U.S.
federal
income
tax
provision
is
required.
Management
has
analyzed
tax
laws
and
regulations
and
their
application
to
the
Funds
as
of
July
31,
2024,
inclusive
of
the
open
tax
return
years,
and
does
not
believe
that
there
are
any
uncertain
tax
positions
that
require
recognition
of
a
tax
liability
in
the
Funds’ financial
statements.
U.S.
GAAP
requires
that
certain
components
of
net
assets
be
adjusted
to
reflect
permanent
differences
between
financial
and
tax
reporting.
These
reclassifications
have
no
effect
on
net
assets
or
NAV
per
share.
As
of
July
31,
2024,
permanent
differences
attributable
to
realized
gains
(losses)
from
in-kind
redemptions
were
reclassified
to
the
following
accounts:
The
tax
character
of
distributions
paid
was
as
follows:
Used
iShares
ETF
Purchases
Sales
Net
Realized
Gain
(Loss)
MSCI
USA
Small-Cap
Min
Vol
Factor
........................................................
$
74,898,580
$
21,382,024
$
(1,299,241)
U.S.
Equity
Factor
.....................................................................
129,266,566
142,003,637
4,836,525
U.S.
Small-Cap
Equity
Factor
.............................................................
52,196,259
57,716,886
12,026,552
U.S.
Tech
Breakthrough
Multisector
.........................................................
19,425,251
21,160,468
(4,215,522)
iShares
ETF
Purchases
Sales
MSCI
USA
Small-Cap
Min
Vol
Factor
........................................................................
$
352,959,919
$
355,451,721
U.S.
Equity
Factor
.....................................................................................
352,978,299
353,076,200
U.S.
Small-Cap
Equity
Factor
.............................................................................
219,948,501
207,664,386
U.S.
Tech
Breakthrough
Multisector
.........................................................................
51,842,324
52,493,321
iShares
ETF
In-kind
Purchases
In-kind
Sales
MSCI
USA
Small-Cap
Min
Vol
Factor
........................................................................
$
45,462,568
$
142,197,157
U.S.
Equity
Factor
.....................................................................................
415,620,011
153,835,696
U.S.
Small-Cap
Equity
Factor
.............................................................................
308,899,862
53,495,184
U.S.
Tech
Breakthrough
Multisector
.........................................................................
81,400,870
64,231,876
iShares
ETF
Paid-in
Capital
Accumulated
Earnings
(Loss)
MSCI
USA
Small-Cap
Min
Vol
Factor
.............................................................
$
30,551,055
$
(30,551,055)
U.S.
Equity
Factor
..........................................................................
49,633,802
(49,633,802)
U.S.
Small-Cap
Equity
Factor
..................................................................
11,946,015
(11,946,015)
U.S.
Tech
Breakthrough
Multisector
..............................................................
33,330,359
(33,330,359)
iShares
ETF
Year
Ended
07/31/24
Year
Ended
07/31/23
MSCI
USA
Small-Cap
Min
Vol
Factor
Ordinary
income
...........................................................................................
$
13,041,539
$
14,809,861
U.S.
Equity
Factor
Ordinary
income
...........................................................................................
$
23,451,638
$
20,833,016
U.S.
Small-Cap
Equity
Factor
Ordinary
income
...........................................................................................
$
9,354,694
$
14,979,392
U.S.
Tech
Breakthrough
Multisector
Ordinary
income
...........................................................................................
$
892,942
$
1,590,805
Notes
to
Financial
Statements
(continued)
Notes
to
Financial
Statements
As
of
July
31,
2024,
the
tax
components
of
accumulated
net
earnings
(losses)
were
as
follows:
For
the
year
ended
July
31,
2024,
the
Funds
listed
below
utilized
the
following
amounts
of
their
respective
capital
loss
carryforwards:
A
fund
may
own
shares
in
certain
foreign
investment
entities,
referred
to,
under
U.S.
tax
law,
as
“passive
foreign
investment
companies.”
Such
fund
may
elect
to
mark-to-
market
annually
the
shares
of
each
passive
foreign
investment
company
and
would
be
required
to
distribute
to
shareholders
any
such
marked-to-market
gains.
As
of
July
31,
2024,
gross
unrealized
appreciation
and
depreciation
based
on
cost
of
investments
(including
short
positions
and
derivatives,
if
any)
for
U.S.
federal
income
tax
purposes
were
as
follows:
9.
Principal
Risks
In
the
normal
course
of
business,
each
Fund
invests
in
securities
or
other
instruments
and
may
enter
into
certain
transactions,
and
such
activities
subject
the
Fund
to
various
risks,
including,
among
others,
fluctuations
in
the
market
(market
risk)
or
failure
of
an
issuer
to
meet
all
of
its
obligations.
The
value
of
securities
or
other
instruments
may
also
be
affected
by
various
factors,
including,
without
limitation:
(i)
the
general
economy;
(ii)
the
overall
market
as
well
as
local,
regional
or
global
political
and/or
social
instability;
(iii)
regulation,
taxation
or
international
tax
treaties
between
various
countries;
or
(iv)
currency,
interest
rate
or
price
fluctuations.
Local,
regional
or
global
events
such
as
war,
acts
of
terrorism,
the
spread
of
infectious
illness
or
other
public
health
issues,
recessions,
or
other
events
could
have
a
significant
impact
on
the
Funds
and
their
investments.
Each
Fund’s
prospectus
provides
details
of
the
risks
to
which
the
Fund
is
subject.
BFA
uses
an
indexing
approach
to
try
to
achieve
each
Fund’s
investment
objective.
The
Fund
is
not
actively
managed,
and
BFA
generally
does
not
attempt
to
take
defensive
positions
under
any
market
conditions,
including
declining
markets.
The
Funds
may
be
exposed
to
additional
risks
when
reinvesting
cash
collateral
in
money
market
funds
that
do
not
seek
to
maintain
a
stable
NAV
per
share
of
$1.00,
which
may
be
subject
to
discretionary
liquidity
fees
under
certain
circumstances.
Valuation
Risk:
The
market
values
of
equities,
such
as
common
stocks
and
preferred
securities
or
equity
related
investments,
such
as
futures
and
options,
may
decline
due
to
general
market
conditions
which
are
not
specifically
related
to
a
particular
company.
They
may
also
decline
due
to
factors
which
affect
a
particular
industry
or
industries.
A
fund
may
invest
in
illiquid
investments.
An
illiquid
investment
is
any
investment
that
a
fund
reasonably
expects
cannot
be
sold
or
disposed
of
in
current
market
conditions
in
seven
calendar
days
or
less
without
the
sale
or
disposition
significantly
changing
the
market
value
of
the
investment.
A
fund
may
experience
difficulty
in
selling
illiquid
investments
in
a
timely
manner
at
the
price
that
it
believes
the
investments
are
worth.
Prices
may
fluctuate
widely
over
short
or
extended
periods
in
response
to
company,
market
or
economic
news.
Markets
also
tend
to
move
in
cycles,
with
periods
of
rising
and
falling
prices.
This
volatility
may
cause
a
fund’s
NAV
to
experience
significant
increases
or
decreases
over
short
periods
of
time.
If
there
is
a
general
decline
in
the
securities
and
other
markets,
the
NAV
of
a
fund
may
lose
value,
regardless
of
the
individual
results
of
the
securities
and
other
instruments
in
which
a
fund
invests.
The
price
each
Fund
could
receive
upon
the
sale
of
any
particular
portfolio
investment
may
differ
from
each
Fund’s
valuation
of
the
investment,
particularly
for
securities
that
trade
in
thin
or
volatile
markets
or
that
are
valued
using
a
fair
valuation
technique
or
a
price
provided
by
an
independent
pricing
service.
Changes
to
significant
unobservable
inputs
and
assumptions
(i.e.,
publicly
traded
company
multiples,
growth
rate,
time
to
exit)
due
to
the
lack
of
observable
inputs
may
significantly
impact
the
resulting
fair
value
and
therefore
each
Fund’s
results
of
operations.
As
a
result,
the
price
received
upon
the
sale
of
an
investment
may
be
less
than
the
value
ascribed
by
each
Fund,
and
each
Fund
could
realize
a
greater
than
expected
loss
or
lesser
than
expected
gain
upon
the
sale
of
the
investment.
Each
Fund’s
ability
to
value
its
investments
may
also
be
impacted
by
technological
issues
and/or
errors
by
pricing
services
or
other
third-party
service
providers.
Counterparty
Credit
Risk:
The
Funds
may
be
exposed
to
counterparty
credit
risk,
or
the
risk
that
an
entity
may
fail
to
or
be
unable
to
perform
on
its
commitments
related
to
unsettled
or
open
transactions,
including
making
timely
interest
and/or
principal
payments
or
otherwise
honoring
its
obligations.
The
Funds
manage
counterparty
credit
risk
by
entering
into
transactions
only
with
counterparties
that BFA
believes
have
the
financial
resources
to
honor
their
obligations
and
by
monitoring
the
financial
stability
iShares
ETF
Undistributed
Ordinary
Income
Non-Expiring
Capital
Loss
Carryforwards
(a)
Net
Unrealized
Gains
(Losses)
(b)
Total
MSCI
USA
Small-Cap
Min
Vol
Factor
.........................................
$
398,889
$
(133,073,349)
$
142,746,248
$
10,071,788
U.S.
Equity
Factor
......................................................
3,265,386
(78,694,795)
453,065,725
377,636,316
U.S.
Small-Cap
Equity
Factor
..............................................
1,901,936
(89,031,369)
164,077,279
76,947,846
U.S.
Tech
Breakthrough
Multisector
..........................................
256,403
(25,845,953)
84,172,341
58,582,791
(a)
Amounts
available
to
offset
future
realized
capital
gains.
(b)
The
difference
between
book-basis
and
tax-basis
net
unrealized
gains
(losses)
were
attributable
primarily
to
the
tax
deferral
of
losses
on
wash
sales,
the
realization
for
tax
purposes
of
unrealized
gains
(losses)
on
certain
futures
contracts,
the
realization
for
tax
purposes
of
unrealized
gains
on
investments
in
passive
foreign
investment
companies,
the
timing
and
recognition
of
partnership
income,
the
accounting
for
swap
agreements
and
the
undistributed
capital
gains
from
underlying
REIT
investments.
iShares
ETF
Utilized
U.S.
Equity
Factor
....................................................................................................
$
24,640,665
U.S.
Small-Cap
Equity
Factor
............................................................................................
18,667,703
iShares
ETF
Tax
Cost
Gross
Unrealized
Appreciation
Gross
Unrealized
Depreciation
Net
Unrealized
Appreciation
(Depreciation)
MSCI
USA
Small-Cap
Min
Vol
Factor
....................................
$
724,304,994
$
166,879,943
$
(24,133,695)
$
142,746,248
U.S.
Equity
Factor
.................................................
1,609,437,718
488,142,452
(35,076,727)
453,065,725
U.S.
Small-Cap
Equity
Factor
.........................................
1,140,502,799
229,234,921
(65,152,587)
164,082,334
U.S.
Tech
Breakthrough
Multisector
.....................................
332,771,173
107,398,065
(23,225,724)
84,172,341
Notes
to
Financial
Statements
(continued)
2024
iShares
Annual
Financial
Statements
of
those
counterparties.
Financial
assets,
which
potentially
expose
the
Funds
to
market,
issuer
and
counterparty
credit
risks,
consist
principally
of
financial
instruments
and
receivables
due
from
counterparties.
The
extent
of
the
Funds’
exposure
to
market,
issuer
and
counterparty
credit
risks
with
respect
to
these
financial
assets
is
approximately
their
value
recorded
in
the
Statements
of
Assets
and
Liabilities,
less
any
collateral
held
by
the
Funds.
A
derivative
contract
may
suffer
a
mark-to-market
loss
if
the
value
of
the
contract
decreases
due
to
an
unfavorable
change
in
the
market
rates
or
values
of
the
underlying
instrument.
Losses
can
also
occur
if
the
counterparty
does
not
perform
under
the
contract.
With
exchange-traded
futures,
there
is
less
counterparty
credit
risk
to
the
Funds
since
the
exchange
or
clearinghouse,
as
counterparty
to
such
instruments,
guarantees
against
a
possible
default.
The
clearinghouse
stands
between
the
buyer
and
the
seller
of
the
contract;
therefore,
credit
risk
is
limited
to
failure
of
the
clearinghouse.
While
offset
rights
may
exist
applicable
law, a
Fund
does
not
have
a
contractual
right
of
offset
against
a
clearing
broker
or
clearinghouse
in
the
event
of
a
default
(including
the
bankruptcy
or
insolvency).
Additionally,
credit
risk
exists
in
exchange-traded
futures with
respect
to
initial
and
variation
margin
that
is
held
in
a
clearing
broker’s
customer
accounts.
While
clearing
brokers
are
required
to
segregate
customer
margin
from
their
own
assets,
in
the
event
that
a
clearing
broker
becomes
insolvent
or
goes
into
bankruptcy
and
at
that
time
there
is
a
shortfall
in
the
aggregate
amount
of
margin
held
by
the
clearing
broker
for
all
its
clients,
typically
the
shortfall
would
be
allocated
on
a
pro
rata
basis
across
all
the
clearing
broker’s
customers,
potentially
resulting
in
losses
to
the
Funds.
Geographic/Asset
Class
Risk:
A
diversified
portfolio,
where
this
is
appropriate
and
consistent
with
a
fund’s
objectives,
minimizes
the
risk
that
a
price
change
of
a
particular
investment
will
have
a
material
impact
on
the
NAV
of
a
fund.
The
investment
concentrations
within
each
Fund’s
portfolio
are
disclosed
in
its
Schedule
of
Investments.
The
Funds
invest
a
significant
portion
of
their
assets
in
securities
of
issuers
located
in
the
United
States.
A
decrease
in
imports
or
exports,
changes
in
trade
regulations,
inflation
and/or
an
economic
recession
in
the
United
States
may
have
a
material
adverse
effect
on
the
U.S.
economy
and
the
securities
listed
on
U.S.
exchanges.
Proposed
and
adopted
policy
and
legislative
changes
in
the
United
States
may
also
have
a
significant
effect
on
U.S.
markets
generally,
as
well
as
on
the
value
of
certain
securities.
Governmental
agencies
project
that
the
United
States
will
continue
to
maintain
elevated
public
debt
levels
for
the
foreseeable
future
which
may
constrain
future
economic
growth.
Circumstances
could
arise
that
could
prevent
the
timely
payment
of
interest
or
principal
on
U.S.
government
debt,
such
as
reaching
the
legislative
“debt
ceiling.”
Such
non-payment
would
result
in
substantial
negative
consequences
for
the
U.S.
economy
and
the
global
financial
system.
If
U.S.
relations
with
certain
countries
deteriorate,
it
could
adversely
affect
issuers
that
rely
on
the
United
States
for
trade.
The
United
States
has
also
experienced
increased
internal
unrest
and
discord.
If
these
trends
were
to
continue,
they
may
have
an
adverse
impact
on
the
U.S.
economy
and
the
issuers
in
which
the Funds
invest.
Certain
Funds
invest
a
significant
portion
of
their
assets
in
securities
within
a
single
or
limited
number
of
market
sectors.
When
a
fund
concentrates
its
investments
in
this
manner,
it
assumes
the
risk
that
economic,
regulatory,
political
and
social
conditions
affecting
such
sectors
may
have
a
significant
impact
on
the
Fund
and
could
affect
the
income
from,
or
the
value
or
liquidity
of,
the
Fund’s
portfolio.
Investment
percentages
in
specific
sectors
are
presented
in
the
Schedule
of
Investments.
Significant
Shareholder
Redemption
Risk:
Certain
shareholders
may
own
or
manage
a
substantial
amount
of
fund
shares
and/or
hold
their
fund
investments
for
a
limited
period
of
time.
Large
redemptions
of
fund
shares
by
these
shareholders
may
force
a
fund
to
sell
portfolio
securities,
which
may
negatively
impact
the
fund’s
NAV,
increase
the
fund’s
brokerage
costs,
and/or
accelerate
the
realization
of
taxable
income/gains
and
cause
the
fund
to
make
additional
taxable
distributions
to
shareholders.
10.
Capital
Share
Transactions
Capital
shares
are
issued
and
redeemed
by
each
Fund
only
in
aggregations
of
a
specified
number
of
shares
or
multiples
thereof
(“Creation
Units”)
at
NAV.
Except
when
aggregated
in
Creation
Units,
shares
of
each
Fund
are
not
redeemable.
Transactions
in
capital
shares
were
as
follows:
Year
Ended
07/31/24
Year
Ended
07/31/23
iShares
ETF
Shares
Amount
Shares
Amount
MSCI
USA
Small-Cap
Min
Vol
Factor
Shares
sold
1,350,000
$
47,345,408
2,800,000
$
96,635,404
Shares
redeemed
(4,050,000
)
(147,565,321
)
(700,000
)
(24,337,763
)
(2,700,000
)
$
(100,219,913
)
2,100,000
$
72,297,641
U.S.
Equity
Factor
Shares
sold
8,300,000
$
417,960,809
7,600,000
$
306,932,271
Shares
redeemed
(3,050,000
)
(154,730,135
)
(4,800,000
)
(193,063,386
)
5,250,000
$
263,230,674
2,800,000
$
113,868,885
U.S.
Small-Cap
Equity
Factor
Shares
sold
5,250,000
$
322,327,198
10,700,000
$
567,660,550
Shares
redeemed
(950,000
)
(55,555,619
)
(15,450,000
)
(817,800,196
)
4,300,000
$
266,771,579
(4,750,000
)
$
(250,139,646
)
Notes
to
Financial
Statements
(continued)
Notes
to
Financial
Statements
The
consideration
for
the
purchase
of
Creation
Units
of
a
fund
in
the Trust
generally
consists
of
the
in-kind
deposit
of
a
designated
portfolio
of
securities
and
a
specified
amount
of
cash.
Certain
funds
in
the Trust
may
be
offered
in
Creation
Units
solely
or
partially
for
cash
in
U.S.
dollars. Authorized
Participants purchasing
and
redeeming
Creation
Units
may
pay
a
purchase
transaction
fee
and
a
redemption
transaction
fee
directly
to
BRIL,
to
offset
transfer
and
other
transaction
costs
associated
with
the
issuance
and
redemption
of
Creation
Units,
including
Creation
Units
for
cash.
Authorized
Participants
transacting
in
Creation
Units
for
cash
may
also
pay
an
additional
variable
charge
to
compensate
the
relevant
fund
for
certain
transaction
costs
(i.e.,
stamp
taxes,
taxes
on
currency
or
other
financial
transactions,
and
brokerage
costs)
and
market
impact
expenses
relating
to
investing
in
portfolio
securities.
Such
variable
charges,
if
any,
are
included
in
shares
sold
in
the
table
above.
To
the
extent
applicable,
to
facilitate
the
timely
settlement
of
orders
for
Funds
using
a
clearing
facility
outside
of
the
continuous
net
settlement
process,
the
Fund,
at
its
sole
discretion,
may
permit
an
Authorized
Participant
to
post
cash
as
collateral
in
anticipation
of
the
delivery
of
all
or
a
portion
of
the
applicable
Deposit
Securities
or
Fund
Securities,
as
further
described
in
the
applicable
Authorized
Participant
Agreement.
The
collateral
process
is
subject
to
a
Control
Agreement
among
the
Authorized
Participant,
each
Fund’s
custodian,
and
the
Funds.
In
the
event
that
the
Authorized
Participant
fails
to
deliver
all
or
a
portion
of
the
applicable
Deposit
Securities
or
Fund
Securities,
the
Fund
may
exercise
control
over
such
collateral
pursuant
to
the
terms
of
the
Control
Agreement
in
order
to
purchase
the
applicable
Deposit
Securities
or
Fund
Securities.
From
time
to
time,
settlement
of
securities
related
to
in-kind
contributions
or
in-kind
redemptions
may
be
delayed.
In
such
cases,
securities
related
to
in-kind
transactions
are
reflected
as
a
receivable
or
a
payable
in
the
Statements
of
Assets
and
Liabilities.
11.
Subsequent
Events
Management
has
evaluated
the
impact
of
all
subsequent
events
on
the
Funds
through
the
date
the
financial
statements
were
available
to
be
issued
and
has
determined
that
there
were
no
subsequent
events
requiring
adjustment
or
additional
disclosure
in
the
financial
statements.
Year
Ended
07/31/24
Year
Ended
07/31/23
iShares
ETF
Shares
Amount
Shares
Amount
U.S.
Tech
Breakthrough
Multisector
Shares
sold
1,750,000
$
81,796,370
950,000
$
35,779,584
Shares
redeemed
(1,450,000
)
(65,572,120
)
(4,100,000
)
(151,876,439
)
300,000
$
16,224,250
(3,150,000
)
$
(116,096,855
)
Report
of
Independent
Registered
Public
Accounting
Firm
2024
iShares
Annual
Financial
Statements
To
the
Board
of
Trustees
of
iShares
Trust
and
Shareholders
of
each
of
the four
funds
listed
in
the
table
below
Opinions
on
the
Financial
Statements
We
have
audited
the
accompanying
statements
of
assets
and
liabilities,
including
the
schedules
of
investments,
of
each
of
the
funds
listed in
the
table
below
(four of
the
funds
constituting
iShares
Trust,
hereafter
collectively
referred
to
as
the “Funds”)
as
of
July
31,
2024,
the
related
statements
of
operations
for
the
year
ended
July
31,
2024,
the
statements
of
changes
in
net
assets
for
each
of
the
two
years
in
the
period
ended
July
31,
2024,
including
the
related
notes,
and
the
financial
highlights
for
each
of
the
periods
indicated
therein
(collectively
referred
to
as
the
“financial
statements”).
In
our
opinion,
the
financial
statements
present
fairly,
in
all
material
respects,
the
financial
position
of
each
of
the
Funds
listed
in
the
table
below
as
of
July
31,
2024,
the
results
of
each
of
their
operations
for
the
year
then
ended,
the
changes
in
each
of
their
net
assets
for
each
of
the
two
years
in
the
period
ended
July
31,
2024
and
each
of
the
financial
highlights
for
each
of
the
periods
indicated
therein
in
conformity
with
accounting
principles
generally
accepted
in
the
United
States
of
America.
Basis
for
Opinions
These
financial
statements
are
the
responsibility
of
the
Funds’
management.
Our
responsibility
is
to
express
an
opinion
on
the
Funds’
financial
statements
based
on
our
audits.
We
are
a
public
accounting
firm
registered
with
the
Public
Company
Accounting
Oversight
Board
(United
States)
(PCAOB)
and
are
required
to
be
independent
with
respect
to
the
Funds
in
accordance
with
the
U.S.
federal
securities
laws
and
the
applicable
rules
and
regulations
of
the
Securities
and
Exchange
Commission
and
the
PCAOB.
We
conducted
our
audits
of
these
financial
statements
in
accordance
with
the
standards
of
the
PCAOB.
Those
standards
require
that
we
plan
and
perform
the
audit
to
obtain
reasonable
assurance
about
whether
the
financial
statements
are
free
of
material
misstatement,
whether
due
to
error
or
fraud.
Our
audits
included
performing
procedures
to
assess
the
risks
of
material
misstatement
of
the
financial
statements,
whether
due
to
error
or
fraud,
and
performing
procedures
that
respond
to
those
risks.
Such
procedures
included
examining,
on
a
test
basis,
evidence
regarding
the
amounts
and
disclosures
in
the
financial
statements.
Our
audits
also
included
evaluating
the
accounting
principles
used
and
significant
estimates
made
by
management,
as
well
as
evaluating
the
overall
presentation
of
the
financial
statements.
Our
procedures
included
confirmation
of
securities
owned
as
of
July
31,
2024
by
correspondence
with
the
custodian,
transfer
agent
and
brokers;
when
replies
were
not
received
from
brokers,
we
performed
other
auditing
procedures.
We
believe
that
our
audits
provide
a
reasonable
basis
for
our
opinions.
/s/PricewaterhouseCoopers
LLP
Philadelphia,
Pennsylvania
September
23,
2024
We
have
served
as
the
auditor
of
one
or
more
BlackRock
investment
companies
since
2000.
iShares
MSCI
USA
Small-Cap
Min
Vol
Factor
ETF
iShares
U.S.
Equity
Factor
ETF
iShares
U.S.
Small-Cap
Equity
Factor
ETF
iShares
U.S.
Tech
Breakthrough
Multisector
ETF
The
following
amounts,
or
maximum
amounts
allowable
by
law,
are
hereby
designated
as
qualified
dividend
income
for
individuals
for
the
fiscal
year
ended
July
31,
2024:
The
following
amounts,
or
maximum
amounts
allowable
by
law,
are
hereby
designated
as
qualified business
income
for
individuals
for
the
fiscal
year
ended
July
31,
2024:
The
following
percentages,
or
maximum
percentages
allowable
by
law,
of
ordinary
income
distributions
paid
during
the
fiscal
year
ended July
31,
2024
qualified
for
the
dividends-received
deduction
for
corporate
shareholders:
iShares
ETF
Qualified
Dividend
Income
MSCI
USA
Small-Cap
Min
Vol
Factor
.....................................................................................
$
12,503,663
U.S.
Equity
Factor
..................................................................................................
23,826,748
U.S.
Small-Cap
Equity
Factor
..........................................................................................
10,476,418
U.S.
Tech
Breakthrough
Multisector
......................................................................................
1,949,259
iShares
ETF
Qualified
Business
Income
MSCI
USA
Small-Cap
Min
Vol
Factor
.....................................................................................
$
933,612
U.S.
Equity
Factor
..................................................................................................
1,069,191
U.S.
Small-Cap
Equity
Factor
..........................................................................................
1,996,607
U.S.
Tech
Breakthrough
Multisector
......................................................................................
81,720
iShares
ETF
Dividends-Received
Deduction
MSCI
USA
Small-Cap
Min
Vol
Factor
.....................................................................................
97.67
%
U.S.
Equity
Factor
..................................................................................................
95.86
U.S.
Small-Cap
Equity
Factor
..........................................................................................
89.76
U.S.
Tech
Breakthrough
Multisector
......................................................................................
100.00
2024
iShares
Annual
Financial
Statements
Premium/Discount
Information
Information
on
the
Fund’s
net
asset
value,
market
price,
premiums
and
discounts,
and
bid-ask
spreads
can
be
found
at
iShares.com
.
Electronic
Delivery
Shareholders
can
sign
up
for
e-mail
notifications
announcing
that
the
shareholder
report
or
prospectus
has
been
posted
on
the
iShares
website
at
iShares.com
.
Once
you
have
enrolled,
you
will
no
longer
receive
prospectuses
and
shareholder
reports
in
the
mail.
To
enroll
in
electronic
delivery:
•
Go
to
icsdelivery.com
.
•
If
your
brokerage
firm
is
not
listed,
electronic
delivery
may
not
be
available.
Please
contact
your
broker-dealer
or
financial
advisor.
Changes
in
and
Disagreements
with
Accountants
Not
applicable.
ProxyResults
Not
applicable.
Remuneration
Paid
to
Trustees
Officers,
and
Others
Because
BFA
has
agreed
in
the
Investment
Advisory
Agreements
to
cover
all
operating
expenses
of
the
Funds,
subject
to
certain
exclusions
as
provided
for
therein,
BFA
pays
the
compensation
to
each
Independent
Trustee
for
services
to
the
Funds
from
BFA's
investment
advisory
fees.
Availability
of
Portfolio
Holdings
Information
A
description
of
the
Trust's
policies
and
procedures
with
respect
to
the
disclosure
of
the
Fund’s
portfolio
securities
is
available
in
the
Fund
Prospectus.
The
Fund
discloses
its
portfolio
holdings
daily
and
provides
information
regarding
its
top
holdings
in
Fund
fact
sheets
at
iShares.com
.
Board
Review
and
Approval
of
Investment
Advisory
Contract
Board
Review
and
Approval
of
Investment
Advisory
Contract
iShares
MSCI
USA
Small-Cap
Min
Vol
Factor
ETF,
iShares
U.S.
Equity
Factor
ETF,
iShares
U.S.
Small-Cap
Equity
Factor
ETF
(each
the
“Fund”)
Under
Section
15(c)
of
the
Investment
Company
Act
of
1940
(the
“1940
Act”),
the
Trust's
Board
of
Trustees
(the
“Board”),
including
a
majority
of
Board
Members
who
are
not
“interested
persons”
of
the
Trust
(as
that
term
is
defined
in
the
1940
Act)
(the
“Independent
Board
Members”),
is
required
annually
to
consider
the
approval
of
the
Investment
Advisory
Agreement
between
the
Trust
and
BFA
(the
“Advisory
Agreement”)
on
behalf
of
the
Fund.
The
Board’s
consideration
entails
a
year-long
process
whereby
the
Board
and
its
committees
(composed
solely
of
Independent
Board
Members)
assess
BlackRock’s
services
to
the
Fund,
including
investment
management;
fund
accounting;
administrative
and
shareholder
services;
oversight
of
the
Fund’s
service
providers;
risk
management
and
oversight;
and
legal
and
compliance
services;
including
the
ability
to
meet
applicable
legal
and
regulatory
requirements.
The
Independent
Board
Members
requested,
and
BFA
provided,
such
information
as
the
Independent
Board
Members,
with
advice
from
independent
counsel,
deemed
reasonably
necessary
to
evaluate
the
Advisory
Agreement.
At
meetings
held
on
May
6,
2024
and
May
17,
2024,
a
committee
composed
of
all
of
the
Independent
Board
Members
(the
“15(c)
Committee”),
with
independent
counsel,
met
with
management
and
reviewed
and
discussed
information
provided
in
response
to
initial
requests
of
the
15(c)
Committee
and/or
its
independent
counsel.
Prior
to
and
in
preparation
for
the
meeting,
the
Board
received
and
reviewed
materials
specifically
relating
to
matters
relevant
to
the
renewal
of
the
Advisory
Agreement.
Following
discussion,
the
15(c)
Committee
subsequently
requested
certain
additional
information,
which
management
agreed
to
provide.
At
a
meeting
held
on
June
4-5,
2024,
the
Board,
including
the
Independent
Board
Members,
reviewed
the
additional
information
provided
by
management
in
response
to
these
requests.
After
extensive
discussions
and
deliberations,
the
Board,
including
all
of
the
Independent
Board
Members,
approved
the
continuance
of
the
Advisory
Agreement
for
the
Fund,
based
on
a
review
of
qualitative
and
quantitative
information
provided
by
BFA
and
their
cumulative
experience
as
Board
Members.
The
Board
noted
its
satisfaction
with
the
extent
and
quality
of
information
provided
and
its
frequent
interactions
with
management,
as
well
as
the
detailed
responses
and
other
information
provided
by
BFA.
The
Independent
Board
Members
were
advised
by
their
independent
counsel
throughout
the
process,
including
about
the
legal
standards
applicable
to
their
review.
In
approving
the
continuance
of
the
Advisory
Agreement
for
the
Fund,
the
Board,
including
the
Independent
Board
Members,
considered
various
factors,
including:
(i)
the
expenses
and
performance
of
the
Fund;
(ii)
the
nature,
extent
and
quality
of
the
services
provided
by
BFA;
(iii)
the
costs
of
services
provided
to
the
Fund
and
profits
realized
by
BFA
and
its
affiliates;
(iv)
potential
economies
of
scale
and
the
sharing
of
related
benefits;
(v)
the
fees
and
services
provided
for
other
comparable
funds/accounts
managed
by
BFA
and
its
affiliates;
and
(vi)
other
benefits
to
BFA
and/or
its
affiliates.
The
Board
Members
did
not
identify
any
particular
information
or
any
single
factor
as
determinative,
and
each
Board
Member
may
have
attributed
different
weights
to
the
various
matters
and
factors
considered.
The
material
factors,
considerations
and
conclusions
that
formed
the
basis
for
the
Board,
including
the
Independent
Board
Members,
to
approve
the
continuance
of
the
Advisory
Agreement
are
discussed
below.
Expenses
and
Performance
of
the
Fund:
The
Board
reviewed
statistical
information
prepared
by
Broadridge
Financial
Solutions,
Inc.
(“Broadridge”),
an
independent
provider
of
investment
company
data,
regarding
the
expense
ratio
components,
including
gross
and
net
total
expenses,
fees
and
expenses
of
other
fund(s)
in
which
the
Fund
invests
(if
applicable),
and
waivers/reimbursements
(if
applicable)
of
the
Fund
in
comparison
with
the
same
information
for
other
ETFs,
objectively
selected
by
Broadridge
as
comprising
the
Fund’s
applicable
expense
peer
group
pursuant
to
Broadridge’s
proprietary
ETF
methodology
(the
“Peer
Group”).
The
Board
was
provided
with
a
detailed
description
of
the
proprietary
ETF
methodology
used
by
Broadridge
to
determine
the
Fund’s
Peer
Group.
The
Board
noted
that,
due
to
the
limitations
in
providing
comparable
funds
in
the
Peer
Group,
the
statistical
information
provided
in
Broadridge’s
report
may
or
may
not
provide
meaningful
direct
comparisons
to
the
Fund
in
all
instances.
The
Board
also
noted
that
the
investment
advisory
fee
rate
and
overall
expenses
(net
of
any
waivers
and
reimbursements)
for
the
Fund
were
lower
than
the
median
of
the
investment
advisory
fee
rates
and
overall
expenses
(net
of
any
waivers
and
reimbursements)
of
the
funds
in
its
Peer
Group,
excluding
iShares
funds.
In
addition,
to
the
extent
that
any
of
the
comparison
funds
included
in
the
Peer
Group,
excluding
iShares
funds,
track
the
same
index
as
the
Fund,
Broadridge
also
provided,
and
the
Board
reviewed,
a
comparison
of
the
Fund’s
performance
for
the
one-year,
three-year,
five-year,
ten-year,
and
since
inception
periods,
as
applicable,
and
for
the
quarter
ended
December
31,
2023,
to
that
of
such
relevant
comparison
fund(s)
for
the
same
periods.
The
Board
noted
that
the
Fund
seeks
to
track
its
specified
underlying
index
and
that,
during
the
year,
the
Board
received
periodic
reports
on
the
Fund’s
short-
and
longer-term
performance
in
comparison
with
its
underlying
index.
Such
periodic
comparative
performance
information,
including
additional
detailed
information
as
requested
by
the
Board,
was
also
considered.
The
Board
noted
that
the
Fund
generally
performed
in
line
with
its
underlying
index
over
the
relevant
periods.
Based
on
this
review,
the
other
relevant
factors
and
information
considered
at
the
meeting,
and
their
general
knowledge
of
ETF
pricing,
the
Board
concluded
that
the
investment
advisory
fee
rate
and
expense
level
and
the
historical
performance
of
the
Fund
supported
the
Board’s
approval
of
the
continuance
of
the
Advisory
Agreement
for
the
coming
year.
Nature,
Extent
and
Quality
of
Services
Provided:
Based
on
management’s
representations,
including
information
about
ongoing
enhancements
and
initiatives
with
respect
to
the
iShares
product
line
and
BFA’s
business,
including
with
respect
to
capital
markets
support
and
analysis,
technology,
portfolio
management,
product
design
and
quality,
compliance
and
risk
management,
global
public
policy
and
other
services,
the
Board
expected
that
there
would
be
no
diminution
in
the
scope
of
services
required
of
or
provided
by
BFA
under
the
Advisory
Agreement
for
the
coming
year
as
compared
with
the
scope
of
services
provided
by
BFA
during
prior
years.
In
reviewing
the
scope
of
these
services,
the
Board
considered
BFA’s
investment
philosophy
and
experience,
noting
that
BFA
and
its
affiliates
have
committed
significant
resources
over
time,
including
during
the
past
year,
to
support
the
iShares
funds
and
their
shareholders
and
have
made
significant
investments
into
the
iShares
business.
The
Board
also
considered
BFA’s
compliance
program
and
its
compliance
record
with
respect
to
the
Fund,
including
related
programs
implemented
pursuant
to
regulatory
requirements.
In
that
regard,
the
Board
noted
that
BFA
reports
to
the
Board
about
portfolio
management
and
compliance
matters
on
a
periodic
basis
in
connection
with
regularly
scheduled
meetings
of
the
Board,
and
on
other
occasions
as
necessary
and
appropriate,
and
has
provided
information
and
made
relevant
officers
and
other
employees
of
BFA
(and
its
affiliates)
available
as
needed
to
provide
further
assistance
with
these
matters.
The
Board
also
reviewed
the
background
and
experience
of
the
persons
responsible
for
the
day-to-day
management
of
the
Fund,
as
well
as
the
resources
available
to
them
in
managing
the
Fund.
In
addition
to
the
above
considerations,
the
Board
reviewed
and
considered
detailed
presentations
regarding
BFA’s
investment
performance,
investment
and
risk
management
processes
and
strategies
provided
at
the
May
6,
2024
meeting
and
throughout
the
year,
and
matters
related
to
BFA’s
portfolio
compliance
program
and
other
compliance
programs
and
services,
as
well
as
BlackRock’s
continued
investments
in
its
ETF
business.
Based
on
review
of
this
information,
and
the
performance
information
discussed
above,
the
Board
concluded
that
the
nature,
extent
and
quality
of
services
provided
to
the
Fund
under
the
Advisory
Agreement
supported
the
Board’s
approval
of
the
continuance
of
the
Advisory
Agreement
for
the
coming
year.
Board
Review
and
Approval
of
Investment
Advisory
Contract
(continued)
2023
iShares
Annual
Report
to
Shareholders
Costs
of
Services
Provided
to
the
Fund
and
Profits
Realized
by
BFA
and
its
Affiliates:
The
Board
reviewed
information
about
the
estimated
profitability
to
BlackRock
in
managing
the
Fund,
based
on
the
fees
payable
to
BFA
and
its
affiliates
(including
fees
under
the
Advisory
Agreement),
and
other
sources
of
revenue
and
expense
to
BFA
and
its
affiliates
from
the
Fund’s
operations
for
the
last
calendar
year.
The
Board
reviewed
BlackRock’s
methodology
for
calculating
estimated
profitability
of
the
iShares
funds,
noting
that
the
15(c)
Committee
and
the
Board
had
focused
on
the
methodology
and
profitability
presentation.
The
Board
recognized
that
profitability
may
be
affected
by
numerous
factors,
including,
among
other
things,
fee
waivers
by
BFA,
the
types
of
funds
managed,
expense
allocations
and
business
mix.
The
Board
thus
recognized
that
calculating
and
comparing
profitability
at
individual
fund
levels
is
challenging.
The
Board
discussed
with
management
the
sources
of
direct
and
ancillary
revenue,
including
the
revenues
to
BTC,
a
BlackRock
affiliate,
from
securities
lending
by
the
Fund.
The
Board
also
discussed
BFA’s
estimated
profit
margin
as
reflected
in
the
Fund’s
profitability
analysis
and
reviewed
information
regarding
potential
economies
of
scale
(as
discussed
below).
Based
on
this
review,
the
Board
concluded
that
the
information
considered
with
respect
to
the
profits
realized
by
BFA
and
its
affiliates
under
the
Advisory
Agreement
and
from
other
relationships
between
the
Fund
and
BFA
and/or
its
affiliates,
if
any,
and
related
costs
of
the
services
provided
as
well
as
the
other
factors
considered
at
the
meeting,
supported
the
Board’s
approval
of
the
continuance
of
the
Advisory
Agreement
for
the
coming
year.
Economies
of
Scale:
The
Board
reviewed
information
and
considered
the
extent
to
which
economies
of
scale
might
be
realized
as
the
assets
of
the
Fund
increase,
noting
that
the
issue
of
potential
economies
of
scale
had
been
focused
on
by
the
15(c)
Committee
and
the
Board
during
their
meetings
and
addressed
by
management.
The
15(c)
Committee
and
the
Board
received
information
regarding
BlackRock’s
historical
estimated
profitability
(as
discussed
above),
including
BFA’s
and
its
affiliates’
estimated
costs
in
providing
services.
The
estimated
cost
information
distinguished,
among
other
things,
between
fixed
and
variable
costs,
and
showed
how
the
level
and
nature
of
fixed
and
variable
costs
may
impact
the
existence
or
size
of
scale
benefits,
with
the
Board
recognizing
that
potential
economies
of
scale
are
difficult
to
measure.
The
15(c)
Committee
and
the
Board
reviewed
information
provided
by
BFA
regarding
the
sharing
of
scale
benefits
with
the
iShares
funds
through
various
means,
including,
as
applicable,
through
breakpoints,
waivers,
or
other
fee
reductions,
as
well
as
through
additional
investment
in
the
iShares
business,
including
enhancements
to
or
the
provision
of
additional
infrastructure
and
services
to
the
iShares
funds
and
their
shareholders
and,
with
respect
to
New
Funds,
set
management
fees
at
levels
that
anticipate
scale
over
time.
The
Board
noted
that
the
Advisory
Agreement
for
the
Fund
did
not
provide
for
breakpoints
in
the
Fund’s
investment
advisory
fee
rate
as
the
assets
of
the
Fund
increase.
However,
the
Board
noted
that
it
would
continue
to
assess
the
appropriateness
of
adding
breakpoints
in
the
future.
The
Board
concluded
that
this
review
of
potential
economies
of
scale
and
the
sharing
of
related
benefits,
as
well
as
the
other
factors
considered
at
the
meeting,
supported
the
Board’s
approval
of
the
continuance
of
the
Advisory
Agreement
for
the
coming
year.
Fees
and
Services
Provided
for
Other
Comparable
Funds/Accounts
Managed
by
BFA
and
its
Affiliates:
The
Board
received
and
considered
information
regarding
the
investment
advisory/management
fee
rates
for
other
funds/accounts
in
the
U.S.
for
which
BFA
(or
its
affiliates)
provides
investment
advisory/management
services,
including
open-end
funds
registered
under
the
1940
Act
(including
sub-advised
funds),
collective
trust
funds
and
institutional
separate
accounts
(collectively,
the
“Other
Accounts”).
The
Board
received
detailed
information
regarding
how
the
Other
Accounts
generally
differ
from
the
Fund,
including
in
terms
of
the
types
of
services
and
generally
more
extensive
character
and
scope
of
services
provided
to
the
Fund,
as
well
as
other
significant
differences.
In
that
regard,
the
Board
considered
that
the
pricing
of
services
to
institutional
clients
is
typically
based
on
a
number
of
factors
beyond
the
nature
and
extent
of
the
specific
services
to
be
provided
and
often
depends
on
the
overall
relationship
between
the
client
and
its
affiliates
and
the
adviser
and
its
affiliates.
In
addition,
the
Board
considered
the
relative
complexity
and
inherent
risks
and
challenges
of
managing
and
providing
other
services
to
the
Fund,
as
a
publicly
traded
investment
vehicle,
as
compared
to
the
Other
Accounts,
particularly
those
that
are
institutional
clients,
in
light
of
differing
regulatory
requirements
and
client-imposed
mandates.
The
Board
acknowledged
BFA’s
representation
that
the
iShares
funds
are
fundamentally
different
investment
vehicles
from
the
Other
Accounts
in
its
consideration
of
relevant
qualitative
and
quantitative
comparative
information
provided.
The
Board
noted
that
BFA
and
its
affiliates
do
not
manage
Other
Accounts
with
substantially
the
same
investment
objective
and
strategy
as
the
Fund
and
that
track
the
same
index
as
the
Fund.
The
Board
also
acknowledged
management’s
assertion
that,
for
certain
iShares
funds,
and
for
client
segmentation
purposes,
BlackRock
has
launched
an
iShares
fund
that
may
provide
a
similar
investment
exposure
at
a
lower
investment
advisory
fee
rate.
The
Board
considered
the
“all-inclusive”
nature
of
the
Fund’s
advisory
fee
structure,
and
the
Fund’s
expenses
borne
by
BFA
under
this
arrangement
and
noted
that
the
investment
advisory
fee
rate
under
the
Advisory
Agreement
for
the
Fund
was
generally
higher
than
the
investment
advisory/management
fee
rates
for
certain
of
the
Other
Accounts
(particularly
institutional
clients)
and
concluded
that
the
differences
appeared
to
be
consistent
with
the
factors
discussed.
Other
Benefits
to
BFA
and/or
its
Affiliates:
The
Board
reviewed
other
benefits
or
ancillary
revenue
received
by
BFA
and/or
its
affiliates
in
connection
with
the
services
provided
to
the
Fund
by
BFA,
both
direct
and
indirect,
including,
but
not
limited
to,
payment
of
revenue
to
BTC,
the
Fund’s
securities
lending
agent,
for
loaning
portfolio
securities,
as
applicable
(which
was
included
in
the
profit
margins
reviewed
by
the
Board
pursuant
to
BFA’s
estimated
profitability
methodology),
payment
of
advisory
fees
or
other
fees
to
BFA
(or
its
affiliates)
in
connection
with
any
investments
by
the
Fund
in
other
funds
(including
cash
sweep
vehicles)
for
which
BFA
(or
its
affiliates)
provides
investment
advisory
services
or
other
services,
and
BlackRock’s
profile
in
the
investment
community.
The
Board
further
considered
other
direct
benefits
that
might
accrue
to
BFA,
including
actual
and
potential
reductions
in
the
Fund’s
expenses
that
are
borne
by
BFA
under
the
“all-inclusive”
management
fee
arrangement,
due
in
part
to
the
size
and
scope
of
BFA’s
investment
operations
servicing
the
Fund
(and
other
funds
in
the
iShares
complex)
as
well
as
in
response
to
a
changing
market
environment.
The
Board
also
reviewed
and
considered
information
provided
by
BFA
concerning
authorized
participant
primary
market
order
processing
services
that
are
provided
by
BlackRock
Investments,
LLC
(“BRIL”),
an
affiliate
of
BFA,
and
paid
for
by
authorized
participants
under
the
ETF
Servicing
Platform.
The
Board
also
noted
the
revenue
received
by
BFA
and/or
its
affiliates
pursuant
to
an
agreement
that
permits
a
service
provider
to
use
certain
portions
of
BlackRock’s
technology
platform
to
service
accounts
managed
by
BFA
and/or
its
affiliates,
including
the
iShares
funds.
The
Board
noted
that
BFA
generally
does
not
use
soft
dollars
or
consider
the
value
of
research
or
other
services
that
may
be
provided
to
BFA
(including
its
affiliates)
in
selecting
brokers
for
portfolio
transactions
for
the
Fund.
The
Board
concluded
that
any
such
ancillary
benefits
would
not
be
disadvantageous
to
the
Fund
and
thus
would
not
alter
the
Board’s
conclusion
with
respect
to
the
appropriateness
of
approving
the
continuance
of
the
Advisory
Agreement
for
the
coming
year.
Conclusion:
Based
on
a
review
of
the
factors
described
above,
as
well
as
such
other
factors
as
deemed
appropriate
by
the
Board,
the
Board,
including
all
of
the
Independent
Board
Members,
determined
that
the
Fund’s
investment
advisory
fee
rate
under
the
Advisory
Agreement
does
not
constitute
a
fee
that
is
so
disproportionately
large
as
to
bear
no
reasonable
relationship
to
the
services
rendered
and
that
could
not
have
been
the
product
of
arm’s-length
bargaining,
and
concluded
to
approve
the
continuance
of
the
Advisory
Agreement
for
the
coming
year.
Board
Review
and
Approval
of
Investment
Advisory
Contract
(continued)
Board
Review
and
Approval
of
Investment
Advisory
Contract
iShares
U.S.
Tech
Breakthrough
Multisector
ETF
(the
“Fund”)
Under
Section
15(c)
of
the
Investment
Company
Act
of
1940
(the
“1940
Act”),
the
Trust's
Board
of
Trustees
(the
“Board”),
including
a
majority
of
Board
Members
who
are
not
“interested
persons”
of
the
Trust
(as
that
term
is
defined
in
the
1940
Act)
(the
“Independent
Board
Members”),
is
required
annually
to
consider
the
approval
of
the
Investment
Advisory
Agreement
between
the
Trust
and
BFA
(the
“Advisory
Agreement”)
on
behalf
of
the
Fund.
The
Board’s
consideration
entails
a
year-long
process
whereby
the
Board
and
its
committees
(composed
solely
of
Independent
Board
Members)
assess
BlackRock’s
services
to
the
Fund,
including
investment
management;
fund
accounting;
administrative
and
shareholder
services;
oversight
of
the
Fund’s
service
providers;
risk
management
and
oversight;
and
legal
and
compliance
services;
including
the
ability
to
meet
applicable
legal
and
regulatory
requirements.
The
Independent
Board
Members
requested,
and
BFA
provided,
such
information
as
the
Independent
Board
Members,
with
advice
from
independent
counsel,
deemed
reasonably
necessary
to
evaluate
the
Advisory
Agreement.
At
meetings
held
on
May
6,
2024
and
May
17,
2024,
a
committee
composed
of
all
of
the
Independent
Board
Members
(the
“15(c)
Committee”),
with
independent
counsel,
met
with
management
and
reviewed
and
discussed
information
provided
in
response
to
initial
requests
of
the
15(c)
Committee
and/or
its
independent
counsel.
Prior
to
and
in
preparation
for
the
meeting,
the
Board
received
and
reviewed
materials
specifically
relating
to
matters
relevant
to
the
renewal
of
the
Advisory
Agreement.
Following
discussion,
the
15(c)
Committee
subsequently
requested
certain
additional
information,
which
management
agreed
to
provide.
At
a
meeting
held
on
June
4-5,
2024,
the
Board,
including
the
Independent
Board
Members,
reviewed
the
additional
information
provided
by
management
in
response
to
these
requests.
After
extensive
discussions
and
deliberations,
the
Board,
including
all
of
the
Independent
Board
Members,
approved
the
continuance
of
the
Advisory
Agreement
for
the
Fund,
based
on
a
review
of
qualitative
and
quantitative
information
provided
by
BFA
and
their
cumulative
experience
as
Board
Members.
The
Board
noted
its
satisfaction
with
the
extent
and
quality
of
information
provided
and
its
frequent
interactions
with
management,
as
well
as
the
detailed
responses
and
other
information
provided
by
BFA.
The
Independent
Board
Members
were
advised
by
their
independent
counsel
throughout
the
process,
including
about
the
legal
standards
applicable
to
their
review.
In
approving
the
continuance
of
the
Advisory
Agreement
for
the
Fund,
the
Board,
including
the
Independent
Board
Members,
considered
various
factors,
including:
(i)
the
expenses
and
performance
of
the
Fund;
(ii)
the
nature,
extent
and
quality
of
the
services
provided
by
BFA;
(iii)
the
costs
of
services
provided
to
the
Fund
and
profits
realized
by
BFA
and
its
affiliates;
(iv)
potential
economies
of
scale
and
the
sharing
of
related
benefits;
(v)
the
fees
and
services
provided
for
other
comparable
funds/accounts
managed
by
BFA
and
its
affiliates;
and
(vi)
other
benefits
to
BFA
and/or
its
affiliates.
The
Board
Members
did
not
identify
any
particular
information
or
any
single
factor
as
determinative,
and
each
Board
Member
may
have
attributed
different
weights
to
the
various
matters
and
factors
considered.
The
material
factors,
considerations
and
conclusions
that
formed
the
basis
for
the
Board,
including
the
Independent
Board
Members,
to
approve
the
continuance
of
the
Advisory
Agreement
are
discussed
below.
Expenses
and
Performance
of
the
Fund:
The
Board
reviewed
statistical
information
prepared
by
Broadridge
Financial
Solutions,
Inc.
(“Broadridge”),
an
independent
provider
of
investment
company
data,
regarding
the
expense
ratio
components,
including
gross
and
net
total
expenses,
fees
and
expenses
of
other
fund(s)
in
which
the
Fund
invests
(if
applicable),
and
waivers/reimbursements
(if
applicable)
of
the
Fund
in
comparison
with
the
same
information
for
other
ETFs,
objectively
selected
by
Broadridge
as
comprising
the
Fund’s
applicable
expense
peer
group
pursuant
to
Broadridge’s
proprietary
ETF
methodology
(the
“Peer
Group”).
The
Board
was
provided
with
a
detailed
description
of
the
proprietary
ETF
methodology
used
by
Broadridge
to
determine
the
Fund’s
Peer
Group.
The
Board
noted
that,
due
to
the
limitations
in
providing
comparable
funds
in
the
Peer
Group,
the
statistical
information
provided
in
Broadridge’s
report
may
or
may
not
provide
meaningful
direct
comparisons
to
the
Fund
in
all
instances.
The
Board
also
noted
that
the
investment
advisory
fee
rate
and
overall
expenses
(net
of
any
waivers
and
reimbursements)
for
the
Fund
were
lower
than
the
median
of
the
investment
advisory
fee
rates
and
overall
expenses
(net
of
any
waivers
and
reimbursements)
of
the
funds
in
its
Peer
Group,
excluding
iShares
funds.
In
addition,
to
the
extent
that
any
of
the
comparison
funds
included
in
the
Peer
Group,
excluding
iShares
funds,
track
the
same
index
as
the
Fund,
Broadridge
also
provided,
and
the
Board
reviewed,
a
comparison
of
the
Fund’s
performance
for
the
one-year,
three-year,
five-year,
ten-year,
and
since
inception
periods,
as
applicable,
and
for
the
quarter
ended
December
31,
2023,
to
that
of
such
relevant
comparison
fund(s)
for
the
same
periods.
The
Board
noted
that
the
Fund
seeks
to
track
its
specified
underlying
index
and
that,
during
the
year,
the
Board
received
periodic
reports
on
the
Fund’s
short-
and
longer-term
performance
in
comparison
with
its
underlying
index.
Such
periodic
comparative
performance
information,
including
additional
detailed
information
as
requested
by
the
Board,
was
also
considered.
The
Board
noted
that
the
Fund
generally
performed
in
line
with
its
underlying
index
over
the
relevant
periods.
Based
on
this
review,
the
other
relevant
factors
and
information
considered
at
the
meeting,
and
their
general
knowledge
of
ETF
pricing,
the
Board
concluded
that
the
investment
advisory
fee
rate
and
expense
level
and
the
historical
performance
of
the
Fund
supported
the
Board’s
approval
of
the
continuance
of
the
Advisory
Agreement
for
the
coming
year.
Nature,
Extent
and
Quality
of
Services
Provided:
Based
on
management’s
representations,
including
information
about
ongoing
enhancements
and
initiatives
with
respect
to
the
iShares
product
line
and
BFA’s
business,
including
with
respect
to
capital
markets
support
and
analysis,
technology,
portfolio
management,
product
design
and
quality,
compliance
and
risk
management,
global
public
policy
and
other
services,
the
Board
expected
that
there
would
be
no
diminution
in
the
scope
of
services
required
of
or
provided
by
BFA
under
the
Advisory
Agreement
for
the
coming
year
as
compared
with
the
scope
of
services
provided
by
BFA
during
prior
years.
In
reviewing
the
scope
of
these
services,
the
Board
considered
BFA’s
investment
philosophy
and
experience,
noting
that
BFA
and
its
affiliates
have
committed
significant
resources
over
time,
including
during
the
past
year,
to
support
the
iShares
funds
and
their
shareholders
and
have
made
significant
investments
into
the
iShares
business.
The
Board
also
considered
BFA’s
compliance
program
and
its
compliance
record
with
respect
to
the
Fund,
including
related
programs
implemented
pursuant
to
regulatory
requirements.
In
that
regard,
the
Board
noted
that
BFA
reports
to
the
Board
about
portfolio
management
and
compliance
matters
on
a
periodic
basis
in
connection
with
regularly
scheduled
meetings
of
the
Board,
and
on
other
occasions
as
necessary
and
appropriate,
and
has
provided
information
and
made
relevant
officers
and
other
employees
of
BFA
(and
its
affiliates)
available
as
needed
to
provide
further
assistance
with
these
matters.
The
Board
also
reviewed
the
background
and
experience
of
the
persons
responsible
for
the
day-to-day
management
of
the
Fund,
as
well
as
the
resources
available
to
them
in
managing
the
Fund.
In
addition
to
the
above
considerations,
the
Board
reviewed
and
considered
detailed
presentations
regarding
BFA’s
investment
performance,
investment
and
risk
management
processes
and
strategies
provided
at
the
May
6,
2024
meeting
and
throughout
the
year,
and
matters
related
to
BFA’s
portfolio
compliance
program
and
other
compliance
programs
and
services,
as
well
as
BlackRock’s
continued
investments
in
its
ETF
business.
Based
on
review
of
this
information,
and
the
performance
information
discussed
above,
the
Board
concluded
that
the
nature,
extent
and
quality
of
services
provided
to
the
Fund
under
the
Advisory
Agreement
supported
the
Board’s
approval
of
the
continuance
of
the
Advisory
Agreement
for
the
coming
year.
Board
Review
and
Approval
of
Investment
Advisory
Contract
(continued)
2023
iShares
Annual
Report
to
Shareholders
Costs
of
Services
Provided
to
the
Fund
and
Profits
Realized
by
BFA
and
its
Affiliates:
The
Board
reviewed
information
about
the
estimated
profitability
to
BlackRock
in
managing
the
Fund,
based
on
the
fees
payable
to
BFA
and
its
affiliates
(including
fees
under
the
Advisory
Agreement),
and
other
sources
of
revenue
and
expense
to
BFA
and
its
affiliates
from
the
Fund’s
operations
for
the
last
calendar
year.
The
Board
reviewed
BlackRock’s
methodology
for
calculating
estimated
profitability
of
the
iShares
funds,
noting
that
the
15(c)
Committee
and
the
Board
had
focused
on
the
methodology
and
profitability
presentation.
The
Board
recognized
that
profitability
may
be
affected
by
numerous
factors,
including,
among
other
things,
fee
waivers
by
BFA,
the
types
of
funds
managed,
expense
allocations
and
business
mix.
The
Board
thus
recognized
that
calculating
and
comparing
profitability
at
individual
fund
levels
is
challenging.
The
Board
discussed
with
management
the
sources
of
direct
and
ancillary
revenue,
including
the
revenues
to
BTC,
a
BlackRock
affiliate,
from
securities
lending
by
the
Fund.
The
Board
also
discussed
BFA’s
estimated
profit
margin
as
reflected
in
the
Fund’s
profitability
analysis
and
reviewed
information
regarding
potential
economies
of
scale
(as
discussed
below).
Based
on
this
review,
the
Board
concluded
that
the
information
considered
with
respect
to
the
profits
realized
by
BFA
and
its
affiliates
under
the
Advisory
Agreement
and
from
other
relationships
between
the
Fund
and
BFA
and/or
its
affiliates,
if
any,
and
related
costs
of
the
services
provided
as
well
as
the
other
factors
considered
at
the
meeting,
supported
the
Board’s
approval
of
the
continuance
of
the
Advisory
Agreement
for
the
coming
year.
Economies
of
Scale:
The
Board
reviewed
information
and
considered
the
extent
to
which
economies
of
scale
might
be
realized
as
the
assets
of
the
Fund
increase,
noting
that
the
issue
of
potential
economies
of
scale
had
been
focused
on
by
the
15(c)
Committee
and
the
Board
during
their
meetings
and
addressed
by
management.
The
15(c)
Committee
and
the
Board
received
information
regarding
BlackRock’s
historical
estimated
profitability
(as
discussed
above),
including
BFA’s
and
its
affiliates’
estimated
costs
in
providing
services.
The
estimated
cost
information
distinguished,
among
other
things,
between
fixed
and
variable
costs,
and
showed
how
the
level
and
nature
of
fixed
and
variable
costs
may
impact
the
existence
or
size
of
scale
benefits,
with
the
Board
recognizing
that
potential
economies
of
scale
are
difficult
to
measure.
The
15(c)
Committee
and
the
Board
reviewed
information
provided
by
BFA
regarding
the
sharing
of
scale
benefits
with
the
iShares
funds
through
various
means,
including,
as
applicable,
through
breakpoints,
waivers,
or
other
fee
reductions,
as
well
as
through
additional
investment
in
the
iShares
business,
including
enhancements
to
or
the
provision
of
additional
infrastructure
and
services
to
the
iShares
funds
and
their
shareholders
and,
with
respect
to
New
Funds,
set
management
fees
at
levels
that
anticipate
scale
over
time.
The
Board
noted
that
the
Advisory
Agreement
for
the
Fund
did
not
provide
for
any
breakpoints
in
the
Fund’s
investment
advisory
fee
rate
as
the
assets
of
the
Fund
increase.
However,
the
Board
noted
that
during
the
June
4-5,
2024
meeting,
the
Board
approved
a
permanent
reduction
to
the
advisory
fee
rate
charged
to
the
Fund.
In
addition,
the
Board
noted
that
it
would
continue
to
assess
the
appropriateness
of
adding
breakpoints
in
the
future.
The
Board
concluded
that
this
review
of
potential
economies
of
scale
and
the
sharing
of
related
benefits,
as
well
as
the
other
factors
considered
at
the
meeting,
supported
the
Board’s
approval
of
the
continuance
of
the
Advisory
Agreement
for
the
coming
year.
Fees
and
Services
Provided
for
Other
Comparable
Funds/Accounts
Managed
by
BFA
and
its
Affiliates:
The
Board
received
and
considered
information
regarding
the
investment
advisory/management
fee
rates
for
other
funds/accounts
in
the
U.S.
for
which
BFA
(or
its
affiliates)
provides
investment
advisory/management
services,
including
open-end
funds
registered
under
the
1940
Act
(including
sub-advised
funds),
collective
trust
funds
and
institutional
separate
accounts
(collectively,
the
“Other
Accounts”).
The
Board
received
detailed
information
regarding
how
the
Other
Accounts
generally
differ
from
the
Fund,
including
in
terms
of
the
types
of
services
and
generally
more
extensive
character
and
scope
of
services
provided
to
the
Fund,
as
well
as
other
significant
differences.
In
that
regard,
the
Board
considered
that
the
pricing
of
services
to
institutional
clients
is
typically
based
on
a
number
of
factors
beyond
the
nature
and
extent
of
the
specific
services
to
be
provided
and
often
depends
on
the
overall
relationship
between
the
client
and
its
affiliates
and
the
adviser
and
its
affiliates.
In
addition,
the
Board
considered
the
relative
complexity
and
inherent
risks
and
challenges
of
managing
and
providing
other
services
to
the
Fund,
as
a
publicly
traded
investment
vehicle,
as
compared
to
the
Other
Accounts,
particularly
those
that
are
institutional
clients,
in
light
of
differing
regulatory
requirements
and
client-imposed
mandates.
The
Board
acknowledged
BFA’s
representation
that
the
iShares
funds
are
fundamentally
different
investment
vehicles
from
the
Other
Accounts
in
its
consideration
of
relevant
qualitative
and
quantitative
comparative
information
provided.
The
Board
noted
that
BFA
and
its
affiliates
do
not
manage
Other
Accounts
with
substantially
the
same
investment
objective
and
strategy
as
the
Fund
and
that
track
the
same
index
as
the
Fund.
The
Board
also
acknowledged
management’s
assertion
that,
for
certain
iShares
funds,
and
for
client
segmentation
purposes,
BlackRock
has
launched
an
iShares
fund
that
may
provide
a
similar
investment
exposure
at
a
lower
investment
advisory
fee
rate.
The
Board
considered
the
“all-inclusive”
nature
of
the
Fund’s
advisory
fee
structure,
and
the
Fund’s
expenses
borne
by
BFA
under
this
arrangement
and
noted
that
the
investment
advisory
fee
rate
under
the
Advisory
Agreement
for
the
Fund
was
generally
higher
than
the
investment
advisory/management
fee
rates
for
certain
of
the
Other
Accounts
(particularly
institutional
clients)
and
concluded
that
the
differences
appeared
to
be
consistent
with
the
factors
discussed.
Other
Benefits
to
BFA
and/or
its
Affiliates:
The
Board
reviewed
other
benefits
or
ancillary
revenue
received
by
BFA
and/or
its
affiliates
in
connection
with
the
services
provided
to
the
Fund
by
BFA,
both
direct
and
indirect,
including,
but
not
limited
to,
payment
of
revenue
to
BTC,
the
Fund’s
securities
lending
agent,
for
loaning
portfolio
securities,
as
applicable
(which
was
included
in
the
profit
margins
reviewed
by
the
Board
pursuant
to
BFA’s
estimated
profitability
methodology),
payment
of
advisory
fees
or
other
fees
to
BFA
(or
its
affiliates)
in
connection
with
any
investments
by
the
Fund
in
other
funds
(including
cash
sweep
vehicles)
for
which
BFA
(or
its
affiliates)
provides
investment
advisory
services
or
other
services,
and
BlackRock’s
profile
in
the
investment
community.
The
Board
further
considered
other
direct
benefits
that
might
accrue
to
BFA,
including
actual
and
potential
reductions
in
the
Fund’s
expenses
that
are
borne
by
BFA
under
the
“all-inclusive”
management
fee
arrangement,
due
in
part
to
the
size
and
scope
of
BFA’s
investment
operations
servicing
the
Fund
(and
other
funds
in
the
iShares
complex)
as
well
as
in
response
to
a
changing
market
environment.
The
Board
also
reviewed
and
considered
information
provided
by
BFA
concerning
authorized
participant
primary
market
order
processing
services
that
are
provided
by
BlackRock
Investments,
LLC
(“BRIL”),
an
affiliate
of
BFA,
and
paid
for
by
authorized
participants
under
the
ETF
Servicing
Platform.
The
Board
also
noted
the
revenue
received
by
BFA
and/or
its
affiliates
pursuant
to
an
agreement
that
permits
a
service
provider
to
use
certain
portions
of
BlackRock’s
technology
platform
to
service
accounts
managed
by
BFA
and/or
its
affiliates,
including
the
iShares
funds.
The
Board
noted
that
BFA
generally
does
not
use
soft
dollars
or
consider
the
value
of
research
or
other
services
that
may
be
provided
to
BFA
(including
its
affiliates)
in
selecting
brokers
for
portfolio
transactions
for
the
Fund.
The
Board
concluded
that
any
such
ancillary
benefits
would
not
be
disadvantageous
to
the
Fund
and
thus
would
not
alter
the
Board’s
conclusion
with
respect
to
the
appropriateness
of
approving
the
continuance
of
the
Advisory
Agreement
for
the
coming
year.
Conclusion:
Based
on
a
review
of
the
factors
described
above,
as
well
as
such
other
factors
as
deemed
appropriate
by
the
Board,
the
Board,
including
all
of
the
Independent
Board
Members,
determined
that
the
Fund’s
investment
advisory
fee
rate
under
the
Advisory
Agreement
does
not
constitute
a
fee
that
is
so
disproportionately
large
as
to
Board
Review
and
Approval
of
Investment
Advisory
Contract
(continued)
Board
Review
and
Approval
of
Investment
Advisory
Contract
bear
no
reasonable
relationship
to
the
services
rendered
and
that
could
not
have
been
the
product
of
arm’s-length
bargaining,
and
concluded
to
approve
the
continuance
of
the
Advisory
Agreement
for
the
coming
year.
Glossary
of
Terms
Used
in
this
Report
2024
iShares
Annual
Financial
Statements
Portfolio
Abbreviation
CVR
Contingent
Value
Rights
MSCI
Morgan
Stanley
Capital
International
NVS
Non-Voting
Shares
OTC
Over-the-counter
REIT
Real
Estate
Investment
Trust
Currency
Abbreviation
USD
United
States
Dollar
Want
to
know
more?
iShares.com
|
1-800-474-2737
This
report
is
intended
for
the
Funds’
shareholders.
It
may
not
be
distributed
to
prospective
investors
unless
it
is
preceded
or
accompanied
by
the
current
prospectus.
Investing
involves
risk,
including
possible
loss
of
principal.
The
iShares
Funds
are
distributed
by
BlackRock
Investments,
LLC
(together
with
its
affiliates,
“BlackRock”).
The
iShares
Funds
are
not
sponsored,
endorsed,
issued,
sold
or
promoted
by MSCI,
Inc.,
STOXX
Ltd.,
or
ICE
Data
Indices
LLC
nor
do
these
companies
make
any
representation
regarding
the
advisability
of
investing
in
the
iShares
Funds.
BlackRock
is
not
affiliated
with
the
companies
listed
above.
©2024
BlackRock,
Inc.
All
rights
reserved.
iSHARES
and
BLACKROCK
are
registered
trademarks
of
BlackRock,
Inc.
or
its
subsidiaries.
All
other
marks
are
the
property
of
their
respective
owners.
Item 8 – Changes in and Disagreements with Accountants for Open-End Management Investment Companies – See Item 7
Item 9 – Proxy Disclosures for Open-End Management Investment Companies – See Item 7
Item 10 – Remuneration Paid to Directors, Officers, and Others of Open-End Management Investment Companies – See Item 7
Item 11 – Statement Regarding Basis for Approval of Investment Advisory Contract – See Item 7
Item 12 – Disclosure of Proxy Voting Policies and Procedures for Closed-End Management Investment Companies – Not Applicable
Item 13 – Portfolio Managers of Closed-End Management Investment Companies – Not Applicable
Item 14 – Purchases of Equity Securities by Closed-End Management Investment Company and Affiliated Purchasers – Not Applicable
Item 15 – Submission of Matters to a Vote of Security Holders – There have been no material changes to these procedures.
Item 16 – Controls and Procedures
(a) The registrant’s principal executive and principal financial officers, or persons performing similar functions, have concluded that the registrant’s disclosure controls and procedures (as defined in Rule 30a-3(c) under the Investment Company Act of 1940, as amended (the “1940 Act”)) are effective as of a date within 90 days of the filing date of this report based on the evaluation of these controls and procedures required by Rule 30a-3(b) under the 1940 Act and Rule 13a-15(b) or 15d-15(b) under the Securities Exchange Act of 1934, as amended.
(b) There were no changes in the registrant’s internal control over financial reporting (as defined in Rule 30a-3(d) under the 1940 Act) that occurred during the period covered by this report that have materially affected, or are reasonably likely to materially affect, the registrant’s internal control over financial reporting.
Item 17 – Disclosure of Securities Lending Activities for Closed-End Management Investment Companies –Not Applicable
Item 18 – Recovery of Erroneously Awarded Compensation – Not Applicable
Item 19 – Exhibits attached hereto
(a)(2) Any policy required by the listing standards adopted pursuant to Rule 10D-1 under the Exchange Act (17 CFR 240.10D-1) by the registered national securities exchange or registered national securities association upon which the registrant’s securities are listed – Not Applicable
(a)(4) Any written solicitation to purchase securities under Rule 23c-1 – Not Applicable
(a)(5) Change in registrant’s independent public accountant – Not Applicable
Pursuant to the requirements of the Securities Exchange Act of 1934 and the Investment Company Act of 1940, the registrant has duly caused this report to be signed on its behalf by the undersigned, thereunto duly authorized.
iShares Trust
By: /s/ Jessica Tan
Jessica Tan
President (principal executive officer) of
iSharesTrust
Date: September 23, 2024
Pursuant to the requirements of the Securities Exchange Act of 1934 and the Investment Company Act of 1940, this report has been signed below by the following persons on behalf of the registrant and in the capacities and on the dates indicated.
By: /s/ Jessica Tan
Jessica Tan
President (principal executive officer) of
iShares Trust
Date: September 23, 2024
By: /s/ Trent Walker
Trent Walker
Treasurer and Chief Financial Officer (principal financial officer) of
iShares Trust
Date: September 23, 2024