UNITED STATES
SECURITIES AND EXCHANGE COMMISSION
Washington, D.C. 20549
FORM N-CSR
CERTIFIED SHAREHOLDER REPORT OF REGISTERED MANAGEMENT INVESTMENT COMPANIES
Investment Company Act file number: 811-09729
Name of Fund: iShares Trust
Fund Address: c/o BlackRock Fund Advisors, 400 Howard Street, San Francisco, CA 94105
Name and address of agent for service: The Corporation Trust Company, 1209 Orange Street, Wilmington, DE 19801
Registrant’s telephone number, including area code: (415) 670-2000
Date of fiscal year end: 08/31/2024
Date of reporting period: 08/31/2024
Item 1 – Reports to Stockholders
(a) The Reports to Shareholders are attached herewith.
iShares ESG Aware MSCI USA ETF
Annual Shareholder Report — August 31, 2024
This annual shareholder report contains important information about iShares ESG Aware MSCI USA ETF (the “Fund”) for the period of September 1, 2023 to August 31, 2024. You can find additional information about the Fund at blackrock.com/fundreports. You can also request this information by contacting us at 1-800-iShares (1-800-474-2737).
What were the Fund costs for the last year?
(based on a hypothetical $10,000 investment)
| Fund name | Costs of a $10,000 investment | Costs paid as a percentage of a $10,000 investment |
|---|
| iShares ESG Aware MSCI USA ETF | $17 | 0.15% |
How did the Fund perform last year?
U.S. stocks registered solid gains during the reporting period, as investor confidence increased over hopes of interest rate cuts and robust corporate earnings.
The United States experienced stronger-than-expected economic growth driven by robust consumer spending and business investment. Meanwhile, inflation measures continued to trend downward, prompting comments by U.S. Federal Reserve Bank officials that indicated interest rate cuts would be forthcoming.
Powered by artificial intelligence (“AI”), information technology stocks led the market for the majority of the reporting period. However, market sentiment pivoted toward more defensive sectors late in the reporting period amid growing uncertainty surrounding economic growth, geopolitics, and the upcoming U.S. presidential election.
While environmental, social, and governance (“ESG”) issues continued to feature in headlines, investor interest in sustainable investing ETFs was mixed during the reporting period in the United States.
What contributed to performance?
For the reporting period, the largest contributor to the Fund’s performance was the information technology sector, particularly semiconductor manufacturers that provide the backbone for the complex calculations required for AI algorithms. The financials sector, most notably financial services, outperformed due to significant merger and acquisition activity; banks consolidated to manage rising costs and regulatory pressures, while digital transformation spurred acquisitions in financial technology. Companies within the industrials sector helped performance due to unexpectedly strong economic data, including higher durable goods orders and manufacturing growth. Enhanced infrastructure spending and reduced supply chain issues also fueled growth within the sector.
What detracted from performance?
There were no meaningful detractors to the Fund’s performance during the reporting period.
The views expressed reflect the opinions of BlackRock as of the date of this report and are subject to change based on changes in market, economic or other conditions. These views are not intended to be a forecast of future events and are no guarantee of future results.
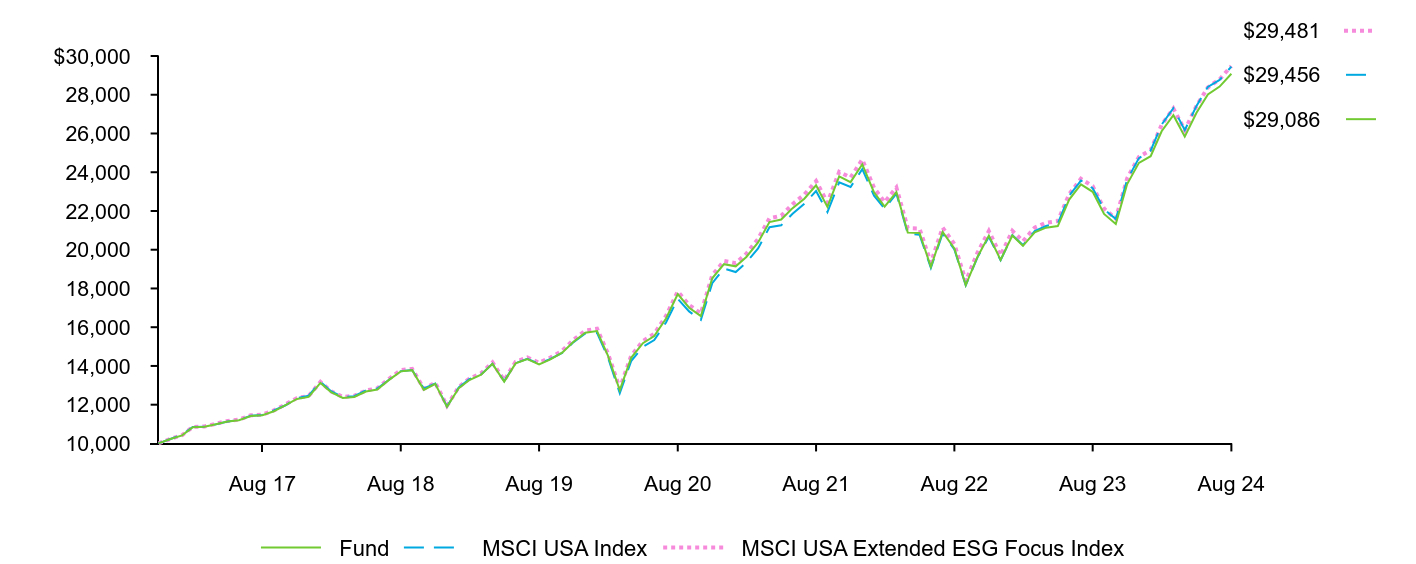
Cumulative performance: December 1, 2016 through August 31, 2024
Initial investment of $10,000
| Fund | MSCI USA Index | MSCI USA Extended ESG Focus Index |
|---|
| Nov 16 | $10,000 | $10,000 | $10,000 |
| Dec 16 | $10,228 | $10,228 | $10,237 |
| Jan 17 | $10,416 | $10,440 | $10,429 |
| Feb 17 | $10,833 | $10,851 | $10,851 |
| Mar 17 | $10,859 | $10,866 | $10,878 |
| Apr 17 | $10,989 | $10,983 | $11,013 |
| May 17 | $11,137 | $11,133 | $11,163 |
| Jun 17 | $11,201 | $11,203 | $11,230 |
| Jul 17 | $11,417 | $11,431 | $11,451 |
| Aug 17 | $11,455 | $11,469 | $11,490 |
| Sep 17 | $11,659 | $11,703 | $11,702 |
| Oct 17 | $11,982 | $11,971 | $12,020 |
| Nov 17 | $12,298 | $12,335 | $12,343 |
| Dec 17 | $12,402 | $12,469 | $12,451 |
| Jan 18 | $13,121 | $13,184 | $13,176 |
| Feb 18 | $12,641 | $12,700 | $12,691 |
| Mar 18 | $12,347 | $12,391 | $12,397 |
| Apr 18 | $12,402 | $12,440 | $12,454 |
| May 18 | $12,678 | $12,744 | $12,732 |
| Jun 18 | $12,786 | $12,830 | $12,842 |
| Jul 18 | $13,279 | $13,291 | $13,340 |
| Aug 18 | $13,721 | $13,731 | $13,787 |
| Sep 18 | $13,782 | $13,794 | $13,849 |
| Oct 18 | $12,768 | $12,836 | $12,826 |
| Nov 18 | $13,076 | $13,086 | $13,139 |
| Dec 18 | $11,889 | $11,907 | $11,945 |
| Jan 19 | $12,848 | $12,887 | $12,913 |
| Feb 19 | $13,274 | $13,318 | $13,345 |
| Mar 19 | $13,547 | $13,564 | $13,620 |
| Apr 19 | $14,107 | $14,108 | $14,185 |
| May 19 | $13,190 | $13,216 | $13,262 |
| Jun 19 | $14,133 | $14,144 | $14,215 |
| Jul 19 | $14,352 | $14,363 | $14,438 |
| Aug 19 | $14,076 | $14,113 | $14,162 |
| Sep 19 | $14,337 | $14,364 | $14,435 |
| Oct 19 | $14,685 | $14,677 | $14,787 |
| Nov 19 | $15,246 | $15,229 | $15,353 |
| Dec 19 | $15,718 | $15,675 | $15,830 |
| Jan 20 | $15,804 | $15,706 | $15,921 |
| Feb 20 | $14,516 | $14,425 | $14,626 |
| Mar 20 | $12,748 | $12,595 | $12,841 |
| Apr 20 | $14,418 | $14,252 | $14,524 |
| May 20 | $15,173 | $14,994 | $15,287 |
| Jun 20 | $15,542 | $15,336 | $15,661 |
| Jul 20 | $16,452 | $16,246 | $16,581 |
| Aug 20 | $17,707 | $17,466 | $17,847 |
| Sep 20 | $17,004 | $16,814 | $17,141 |
| Oct 20 | $16,576 | $16,377 | $16,713 |
| Nov 20 | $18,526 | $18,272 | $18,681 |
| Dec 20 | $19,253 | $19,025 | $19,417 |
| Jan 21 | $19,141 | $18,849 | $19,306 |
| Feb 21 | $19,626 | $19,341 | $19,798 |
| Mar 21 | $20,375 | $20,068 | $20,557 |
| Apr 21 | $21,427 | $21,161 | $21,621 |
| May 21 | $21,557 | $21,262 | $21,754 |
| Jun 21 | $22,145 | $21,854 | $22,354 |
| Jul 21 | $22,636 | $22,371 | $22,850 |
| Aug 21 | $23,322 | $23,031 | $23,547 |
| Sep 21 | $22,208 | $21,944 | $22,424 |
| Oct 21 | $23,783 | $23,475 | $24,018 |
| Nov 21 | $23,489 | $23,238 | $23,725 |
| Dec 21 | $24,409 | $24,157 | $24,656 |
| Jan 22 | $22,958 | $22,789 | $23,193 |
| Feb 22 | $22,227 | $22,121 | $22,457 |
| Mar 22 | $22,975 | $22,899 | $23,215 |
| Apr 22 | $20,891 | $20,823 | $21,111 |
| May 22 | $20,867 | $20,777 | $21,090 |
| Jun 22 | $19,117 | $19,058 | $19,323 |
| Jul 22 | $20,914 | $20,835 | $21,142 |
| Aug 22 | $20,067 | $20,019 | $20,288 |
| Sep 22 | $18,169 | $18,162 | $18,371 |
| Oct 22 | $19,625 | $19,604 | $19,846 |
| Nov 22 | $20,726 | $20,671 | $20,963 |
| Dec 22 | $19,474 | $19,455 | $19,699 |
| Jan 23 | $20,733 | $20,747 | $20,976 |
| Feb 23 | $20,202 | $20,240 | $20,441 |
| Mar 23 | $20,892 | $20,959 | $21,141 |
| Apr 23 | $21,139 | $21,225 | $21,393 |
| May 23 | $21,220 | $21,363 | $21,478 |
| Jun 23 | $22,589 | $22,788 | $22,867 |
| Jul 23 | $23,372 | $23,572 | $23,662 |
| Aug 23 | $22,990 | $23,175 | $23,279 |
| Sep 23 | $21,845 | $22,088 | $22,122 |
| Oct 23 | $21,330 | $21,580 | $21,605 |
| Nov 23 | $23,390 | $23,615 | $23,680 |
| Dec 23 | $24,483 | $24,728 | $24,789 |
| Jan 24 | $24,828 | $25,113 | $25,142 |
| Feb 24 | $26,115 | $26,460 | $26,448 |
| Mar 24 | $26,943 | $27,302 | $27,291 |
| Apr 24 | $25,836 | $26,175 | $26,172 |
| May 24 | $27,067 | $27,425 | $27,422 |
| Jun 24 | $28,011 | $28,406 | $28,382 |
| Jul 24 | $28,420 | $28,762 | $28,801 |
| Aug 24 | $29,086 | $29,456 | $29,481 |
See “Average annual total returns” for additional information on fund performance.
Average annual total returns
| ........................................................................................................................................................................................................................................................................................................................................................................................................................................................................................................................................................................................................................................................................................................................................................................................................................................................................................................................................................................................................................................ | 1 Year | 5 Years | Since Fund Inception |
|---|
Fund NAV........................................................................................................................................................................................................................................................................................................................................................................................................................................................................................................................................................................................................................................................................................................................................................................................................................................................................................................................................................................................................................................ | 26.51% | 15.62% | 14.77% |
Fund Market........................................................................................................................................................................................................................................................................................................................................................................................................................................................................................................................................................................................................................................................................................................................................................................................................................................................................................................................................................................................................................................ | 26.48 | 15.62 | 14.76 |
MSCI USA Index........................................................................................................................................................................................................................................................................................................................................................................................................................................................................................................................................................................................................................................................................................................................................................................................................................................................................................................................................................................................................................................ | 27.10 | 15.85 | 14.96 |
MSCI USA Extended ESG Focus Index........................................................................................................................................................................................................................................................................................................................................................................................................................................................................................................................................................................................................................................................................................................................................................................................................................................................................................................................................................................................................................................ | 26.64 | 15.79 | 14.97 |
Net Assets........................................................................................................................................................................................................................................................................................................................................................................................................................................................................................................................................................................................................................................................................................................................................................................................................................................................................................................................................................................................................................................ | $12,987,728,257 |
Number of Portfolio Holdings........................................................................................................................................................................................................................................................................................................................................................................................................................................................................................................................................................................................................................................................................................................................................................................................................................................................................................................................................................................................................................................ | 287 |
Net Investment Advisory Fees........................................................................................................................................................................................................................................................................................................................................................................................................................................................................................................................................................................................................................................................................................................................................................................................................................................................................................................................................................................................................................................ | $19,165,717 |
Portfolio Turnover Rate........................................................................................................................................................................................................................................................................................................................................................................................................................................................................................................................................................................................................................................................................................................................................................................................................................................................................................................................................................................................................................................ | 22% |
The Fund has added the MSCI USA Index in response to new regulatory requirements.
The inception date of the Fund was December 1, 2016. The first day of secondary market trading was December 2, 2016.
The performance of the MSCI USA Extended ESG Focus Index in this report reflects the performance of the MSCI USA ESG Focus Index through May 31, 2018 and, beginning on June 1, 2018, the performance of the MSCI USA Extended ESG Focus Index.
Past performance is not an indication of future results.Performance results do not reflect the deduction of taxes that a shareholder would pay on fund distributions or on the redemption or sale of fund shares. Visit iShares.com for more recent performance information.
What did the Fund invest in?
| Sector | Percent of Total InvestmentsFootnote Reference(a) |
|---|
Information Technology........................................................................................................................................................................................................................................................................................................................................................................................................................................................................................................................................................................................................................................................................................................................................................................................................................................................................................................................................................................................................................................ | 32.0% |
Health Care........................................................................................................................................................................................................................................................................................................................................................................................................................................................................................................................................................................................................................................................................................................................................................................................................................................................................................................................................................................................................................................ | 12.5 |
Financials........................................................................................................................................................................................................................................................................................................................................................................................................................................................................................................................................................................................................................................................................................................................................................................................................................................................................................................................................................................................................................................ | 12.1 |
Industrials........................................................................................................................................................................................................................................................................................................................................................................................................................................................................................................................................................................................................................................................................................................................................................................................................................................................................................................................................................................................................................................ | 9.9 |
Consumer Discretionary........................................................................................................................................................................................................................................................................................................................................................................................................................................................................................................................................................................................................................................................................................................................................................................................................................................................................................................................................................................................................................................ | 8.9 |
Communication Services........................................................................................................................................................................................................................................................................................................................................................................................................................................................................................................................................................................................................................................................................................................................................................................................................................................................................................................................................................................................................................................ | 7.8 |
Consumer Staples........................................................................................................................................................................................................................................................................................................................................................................................................................................................................................................................................................................................................................................................................................................................................................................................................................................................................................................................................................................................................................................ | 6.4 |
Energy........................................................................................................................................................................................................................................................................................................................................................................................................................................................................................................................................................................................................................................................................................................................................................................................................................................................................................................................................................................................................................................ | 3.8 |
Utilities........................................................................................................................................................................................................................................................................................................................................................................................................................................................................................................................................................................................................................................................................................................................................................................................................................................................................................................................................................................................................................................ | 2.3 |
Real Estate........................................................................................................................................................................................................................................................................................................................................................................................................................................................................................................................................................................................................................................................................................................................................................................................................................................................................................................................................................................................................................................ | 2.2 |
Materials........................................................................................................................................................................................................................................................................................................................................................................................................................................................................................................................................................................................................................................................................................................................................................................................................................................................................................................................................................................................................................................ | 2.1 |
| Security | Percent of Total InvestmentsFootnote Reference(a) |
|---|
Apple, Inc......................................................................................................................................................................................................................................................................................................................................................................................................................................................................................................................................................................................................................................................................................................................................................................................................................................................................................................................................................................................................................................... | 6.6% |
NVIDIA Corp......................................................................................................................................................................................................................................................................................................................................................................................................................................................................................................................................................................................................................................................................................................................................................................................................................................................................................................................................................................................................................................... | 6.1 |
Microsoft Corp......................................................................................................................................................................................................................................................................................................................................................................................................................................................................................................................................................................................................................................................................................................................................................................................................................................................................................................................................................................................................................................... | 6.1 |
Amazon.com, Inc......................................................................................................................................................................................................................................................................................................................................................................................................................................................................................................................................................................................................................................................................................................................................................................................................................................................................................................................................................................................................................................... | 3.3 |
Alphabet, Inc., Class C, NVS........................................................................................................................................................................................................................................................................................................................................................................................................................................................................................................................................................................................................................................................................................................................................................................................................................................................................................................................................................................................................................................ | 2.3 |
Meta Platforms, Inc., Class A........................................................................................................................................................................................................................................................................................................................................................................................................................................................................................................................................................................................................................................................................................................................................................................................................................................................................................................................................................................................................................................ | 2.2 |
Eli Lilly & Co......................................................................................................................................................................................................................................................................................................................................................................................................................................................................................................................................................................................................................................................................................................................................................................................................................................................................................................................................................................................................................................... | 1.6 |
Broadcom, Inc......................................................................................................................................................................................................................................................................................................................................................................................................................................................................................................................................................................................................................................................................................................................................................................................................................................................................................................................................................................................................................................... | 1.4 |
JPMorgan Chase & Co......................................................................................................................................................................................................................................................................................................................................................................................................................................................................................................................................................................................................................................................................................................................................................................................................................................................................................................................................................................................................................................... | 1.3 |
Tesla, Inc......................................................................................................................................................................................................................................................................................................................................................................................................................................................................................................................................................................................................................................................................................................................................................................................................................................................................................................................................................................................................................................... | 1.2 |
⁽ᵃ⁾ Excludes money market funds.
Additional information
If you wish to view additional information about the Fund, including but not limited to financial statements, the Fund’s prospectus, and proxy voting policies and procedures, please visit blackrock.com/fundreports. For proxy voting records, visit blackrock.com/proxyrecords.
Householding
Householding is an option available to certain fund investors. Householding is a method of delivery, based on the preference of the individual investor, in which a single copy of certain shareholder documents can be delivered to investors who share the same address, even if their accounts are registered under different names. Please contact your broker-dealer if you are interested in enrolling in householding and receiving a single copy of prospectuses and other shareholder documents, or if you are currently enrolled in householding and wish to change your householding status.
The Fund is not sponsored, endorsed, issued, sold or promoted by MSCI Inc. and its affiliates, nor does this company make any representation regarding the advisability of investing in the Fund. BlackRock is not affiliated with the company listed above.
©2024 BlackRock, Inc. or its affiliates. All rights reserved. iSHARES and BLACKROCK are registered trademarks of BlackRock, Inc. or its affiliates. All other trademarks are those of their respective owners.
iShares ESG Aware MSCI USA ETF
Annual Shareholder Report — August 31, 2024
iShares ESG Aware MSCI USA Growth ETF
Annual Shareholder Report — August 31, 2024
This annual shareholder report contains important information about iShares ESG Aware MSCI USA Growth ETF (the “Fund”) for the period of September 1, 2023 to August 31, 2024. You can find additional information about the Fund at blackrock.com/fundreports. You can also request this information by contacting us at 1-800-iShares (1-800-474-2737).
What were the Fund costs for the last year?
(based on a hypothetical $10,000 investment)
| Fund name | Costs of a $10,000 investment | Costs paid as a percentage of a $10,000 investment |
|---|
| iShares ESG Aware MSCI USA Growth ETF | $21 | 0.18% |
How did the Fund perform last year?
U.S. stocks registered solid gains during the reporting period, as investor confidence increased over hopes of interest rate cuts and robust corporate earnings.
The United States experienced stronger-than-expected economic growth driven by robust consumer spending and business investment. Meanwhile, inflation measures continued to trend downward, prompting comments by U.S. Federal Reserve Bank officials that indicated interest rate cuts would be forthcoming.
Powered by artificial intelligence (“AI”), information technology stocks led the market for the majority of the reporting period. However, market sentiment pivoted toward more defensive sectors late in the reporting period amid growing uncertainty surrounding economic growth, geopolitics, and the upcoming U.S. presidential election.
While environmental, social, and governance (“ESG”) issues continued to feature in headlines, investor interest in sustainable investing ETFs was mixed during the reporting period in the United States.
What contributed to performance?
For the reporting period, the largest contributor to the Fund’s performance was the information technology sector, particularly semiconductor manufacturers that provide the backbone for the complex calculations required for AI algorithms. The communications sector, namely interactive media and services and entertainment companies, benefited from rising consumer demand for digital connectivity and significant expansion in the fifth generation of wireless cellular technology, which is designed to be faster, more reliable, and more flexible than previous generations. The healthcare sector helped performance, driven by medical technology advancements, increased demand for diagnostic equipment, and robust growth in telehealth services.
What detracted from performance?
There were no meaningful detractors to the Fund’s performance during the reporting period.
The views expressed reflect the opinions of BlackRock as of the date of this report and are subject to change based on changes in market, economic or other conditions. These views are not intended to be a forecast of future events and are no guarantee of future results.
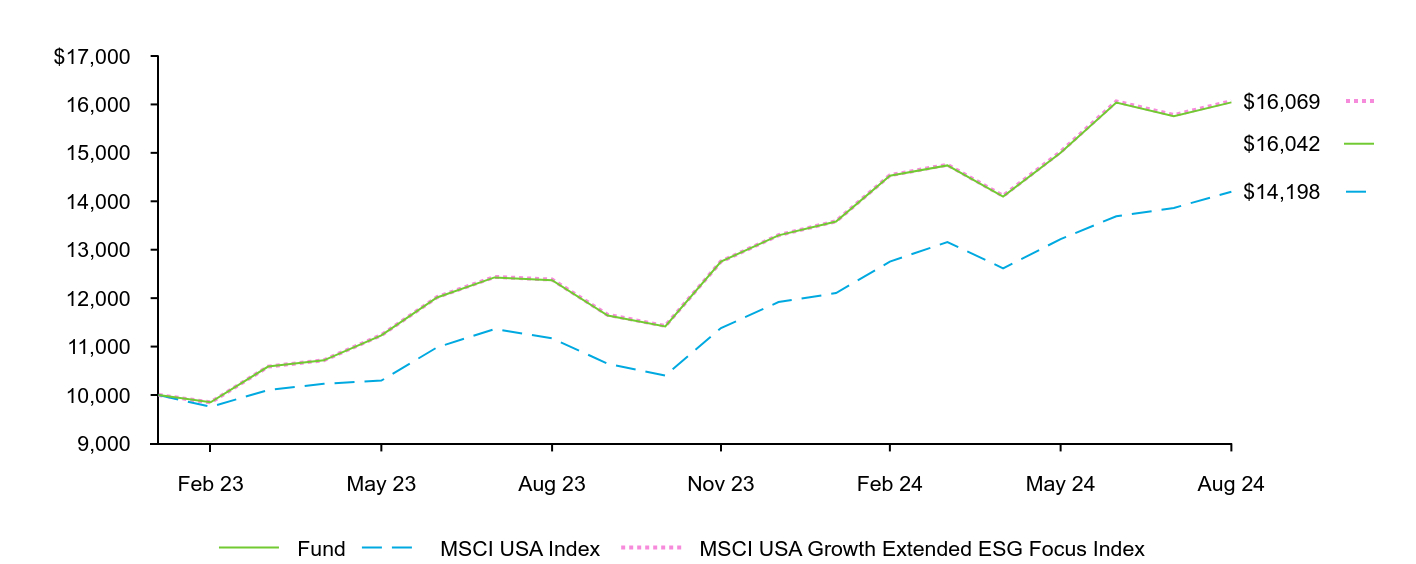
Cumulative performance: January 31, 2023 through August 31, 2024
Initial investment of $10,000
| Fund | MSCI USA Index | MSCI USA Growth Extended ESG Focus Index |
|---|
| Jan 23 | $10,000 | $10,000 | $10,000 |
| Feb 23 | $9,850 | $9,756 | $9,847 |
| Mar 23 | $10,587 | $10,102 | $10,587 |
| Apr 23 | $10,716 | $10,231 | $10,718 |
| May 23 | $11,232 | $10,297 | $11,237 |
| Jun 23 | $12,013 | $10,984 | $12,021 |
| Jul 23 | $12,428 | $11,362 | $12,439 |
| Aug 23 | $12,372 | $11,170 | $12,384 |
| Sep 23 | $11,642 | $10,646 | $11,654 |
| Oct 23 | $11,415 | $10,401 | $11,427 |
| Nov 23 | $12,755 | $11,382 | $12,757 |
| Dec 23 | $13,297 | $11,919 | $13,299 |
| Jan 24 | $13,582 | $12,104 | $13,588 |
| Feb 24 | $14,527 | $12,754 | $14,537 |
| Mar 24 | $14,741 | $13,159 | $14,755 |
| Apr 24 | $14,098 | $12,616 | $14,112 |
| May 24 | $15,003 | $13,219 | $15,021 |
| Jun 24 | $16,040 | $13,691 | $16,063 |
| Jul 24 | $15,757 | $13,863 | $15,781 |
| Aug 24 | $16,042 | $14,198 | $16,069 |
See “Average annual total returns” for additional information on fund performance.
Average annual total returns
| ........................................................................................................................................................................................................................................................................................................................................................................................................................................................................................................................................................................................................................................................................................................................................................................................................................................................................................................................................................................................................................................ | 1 Year | Since Fund Inception |
|---|
Fund NAV........................................................................................................................................................................................................................................................................................................................................................................................................................................................................................................................................................................................................................................................................................................................................................................................................................................................................................................................................................................................................................................ | 29.66% | 34.84% |
Fund Market........................................................................................................................................................................................................................................................................................................................................................................................................................................................................................................................................................................................................................................................................................................................................................................................................................................................................................................................................................................................................................................ | 29.54 | 34.80 |
MSCI USA Index........................................................................................................................................................................................................................................................................................................................................................................................................................................................................................................................................................................................................................................................................................................................................................................................................................................................................................................................................................................................................................................ | 27.10 | 24.82 |
MSCI USA Growth Extended ESG Focus Index........................................................................................................................................................................................................................................................................................................................................................................................................................................................................................................................................................................................................................................................................................................................................................................................................................................................................................................................................................................................................................................ | 29.76 | 34.99 |
Net Assets........................................................................................................................................................................................................................................................................................................................................................................................................................................................................................................................................................................................................................................................................................................................................................................................................................................................................................................................................................................................................................................ | $8,110,750 |
Number of Portfolio Holdings........................................................................................................................................................................................................................................................................................................................................................................................................................................................................................................................................................................................................................................................................................................................................................................................................................................................................................................................................................................................................................................ | 100 |
Net Investment Advisory Fees........................................................................................................................................................................................................................................................................................................................................................................................................................................................................................................................................................................................................................................................................................................................................................................................................................................................................................................................................................................................................................................ | $10,614 |
Portfolio Turnover Rate........................................................................................................................................................................................................................................................................................................................................................................................................................................................................................................................................................................................................................................................................................................................................................................................................................................................................................................................................................................................................................................ | 36% |
The Fund has added the MSCI USA Index in response to new regulatory requirements.
The inception date of the Fund was January 31, 2023. The first day of secondary market trading was February 2, 2023.
Past performance is not an indication of future results.Performance results do not reflect the deduction of taxes that a shareholder would pay on fund distributions or on the redemption or sale of fund shares. Visit iShares.com for more recent performance information.
What did the Fund invest in?
| Sector | Percent of Total InvestmentsFootnote Reference(a) |
|---|
Information Technology........................................................................................................................................................................................................................................................................................................................................................................................................................................................................................................................................................................................................................................................................................................................................................................................................................................................................................................................................................................................................................................ | 51.4% |
Communication Services........................................................................................................................................................................................................................................................................................................................................................................................................................................................................................................................................................................................................................................................................................................................................................................................................................................................................................................................................................................................................................................ | 11.5 |
Consumer Discretionary........................................................................................................................................................................................................................................................................................................................................................................................................................................................................................................................................................................................................................................................................................................................................................................................................................................................................................................................................................................................................................................ | 11.4 |
Health Care........................................................................................................................................................................................................................................................................................................................................................................................................................................................................................................................................................................................................................................................................................................................................................................................................................................................................................................................................................................................................................................ | 9.6 |
Industrials........................................................................................................................................................................................................................................................................................................................................................................................................................................................................................................................................................................................................................................................................................................................................................................................................................................................................................................................................................................................................................................ | 6.6 |
Financials........................................................................................................................................................................................................................................................................................................................................................................................................................................................................................................................................................................................................................................................................................................................................................................................................................................................................................................................................................................................................................................ | 5.0 |
Consumer Staples........................................................................................................................................................................................................................................................................................................................................................................................................................................................................................................................................................................................................................................................................................................................................................................................................................................................................................................................................................................................................................................ | 2.0 |
Energy........................................................................................................................................................................................................................................................................................................................................................................................................................................................................................................................................................................................................................................................................................................................................................................................................................................................................................................................................................................................................................................ | 1.3 |
Materials........................................................................................................................................................................................................................................................................................................................................................................................................................................................................................................................................................................................................................................................................................................................................................................................................................................................................................................................................................................................................................................ | 0.9 |
Real Estate........................................................................................................................................................................................................................................................................................................................................................................................................................................................................................................................................................................................................................................................................................................................................................................................................................................................................................................................................................................................................................................ | 0.3 |
| Security | Percent of Total InvestmentsFootnote Reference(a) |
|---|
Apple, Inc......................................................................................................................................................................................................................................................................................................................................................................................................................................................................................................................................................................................................................................................................................................................................................................................................................................................................................................................................................................................................................................... | 12.7% |
NVIDIA Corp......................................................................................................................................................................................................................................................................................................................................................................................................................................................................................................................................................................................................................................................................................................................................................................................................................................................................................................................................................................................................................................... | 11.9 |
Microsoft Corp......................................................................................................................................................................................................................................................................................................................................................................................................................................................................................................................................................................................................................................................................................................................................................................................................................................................................................................................................................................................................................................... | 11.7 |
Amazon.com, Inc......................................................................................................................................................................................................................................................................................................................................................................................................................................................................................................................................................................................................................................................................................................................................................................................................................................................................................................................................................................................................................................... | 6.3 |
Alphabet, Inc., Class C, NVS........................................................................................................................................................................................................................................................................................................................................................................................................................................................................................................................................................................................................................................................................................................................................................................................................................................................................................................................................................................................................................................ | 4.7 |
Meta Platforms, Inc., Class A........................................................................................................................................................................................................................................................................................................................................................................................................................................................................................................................................................................................................................................................................................................................................................................................................................................................................................................................................................................................................................................ | 4.0 |
Eli Lilly & Co......................................................................................................................................................................................................................................................................................................................................................................................................................................................................................................................................................................................................................................................................................................................................................................................................................................................................................................................................................................................................................................... | 3.1 |
Tesla, Inc......................................................................................................................................................................................................................................................................................................................................................................................................................................................................................................................................................................................................................................................................................................................................................................................................................................................................................................................................................................................................................................... | 2.4 |
Visa, Inc., Class A........................................................................................................................................................................................................................................................................................................................................................................................................................................................................................................................................................................................................................................................................................................................................................................................................................................................................................................................................................................................................................................ | 1.9 |
Alphabet, Inc., Class A........................................................................................................................................................................................................................................................................................................................................................................................................................................................................................................................................................................................................................................................................................................................................................................................................................................................................................................................................................................................................................................ | 1.9 |
⁽ᵃ⁾ Excludes money market funds.
Additional information
If you wish to view additional information about the Fund, including but not limited to financial statements, the Fund’s prospectus, and proxy voting policies and procedures, please visit blackrock.com/fundreports. For proxy voting records, visit blackrock.com/proxyrecords.
Householding
Householding is an option available to certain fund investors. Householding is a method of delivery, based on the preference of the individual investor, in which a single copy of certain shareholder documents can be delivered to investors who share the same address, even if their accounts are registered under different names. Please contact your broker-dealer if you are interested in enrolling in householding and receiving a single copy of prospectuses and other shareholder documents, or if you are currently enrolled in householding and wish to change your householding status.
The Fund is not sponsored, endorsed, issued, sold or promoted by MSCI Inc. and its affiliates, nor does this company make any representation regarding the advisability of investing in the Fund. BlackRock is not affiliated with the company listed above.
©2024 BlackRock, Inc. or its affiliates. All rights reserved. iSHARES and BLACKROCK are registered trademarks of BlackRock, Inc. or its affiliates. All other trademarks are those of their respective owners.
iShares ESG Aware MSCI USA Growth ETF
Annual Shareholder Report — August 31, 2024
iShares ESG Aware MSCI USA Small-Cap ETF
Annual Shareholder Report — August 31, 2024
This annual shareholder report contains important information about iShares ESG Aware MSCI USA Small-Cap ETF (the “Fund”) for the period of September 1, 2023 to August 31, 2024. You can find additional information about the Fund at blackrock.com/fundreports. You can also request this information by contacting us at 1-800-iShares (1-800-474-2737).
What were the Fund costs for the last year?
(based on a hypothetical $10,000 investment)
| Fund name | Costs of a $10,000 investment | Costs paid as a percentage of a $10,000 investment |
|---|
| iShares ESG Aware MSCI USA Small-Cap ETF | $18 | 0.17% |
How did the Fund perform last year?
U.S. stocks registered solid gains during the reporting period, as investor confidence increased over hopes of interest rate cuts and robust corporate earnings.
The United States experienced stronger-than-expected economic growth driven by robust consumer spending and business investment. Meanwhile, inflation measures continued to trend downward, prompting comments by U.S. Federal Reserve Bank officials that indicated interest rate cuts would be forthcoming.
Powered by artificial intelligence (“AI”), information technology stocks led the market for the majority of the reporting period. However, market sentiment pivoted toward more defensive sectors late in the reporting period amid growing uncertainty surrounding economic growth, geopolitics, and the upcoming U.S. presidential election.
While environmental, social, and governance (“ESG”) issues continued to feature in headlines, investor interest in sustainable investing ETFs was mixed during the reporting period in the United States.
What contributed to performance?
For the reporting period, the largest contributor to the Fund’s performance was the financials sector, most notably banks, which outperformed due to strong economic indicators such as solid retail sales. Improved market sentiment also lifted bank stocks. Stocks in the industrials sector helped performance due to unexpectedly strong economic data, including higher durable goods orders and manufacturing growth. Enhanced infrastructure spending and reduced supply chain issues also fueled sector growth. Within consumer discretionary, companies benefited from robust consumer spending, rising wages, and lower unemployment figures. Amid ongoing AI enthusiasm, the information technology sector also contributed positively to the Fund’s return, most notably among application software companies that have integrated AI into their product offerings.
What detracted from performance?
There were no meaningful detractors to the Fund’s performance during the reporting period.
The views expressed reflect the opinions of BlackRock as of the date of this report and are subject to change based on changes in market, economic or other conditions. These views are not intended to be a forecast of future events and are no guarantee of future results.
Cumulative performance: April 10, 2018 through August 31, 2024
Initial investment of $10,000
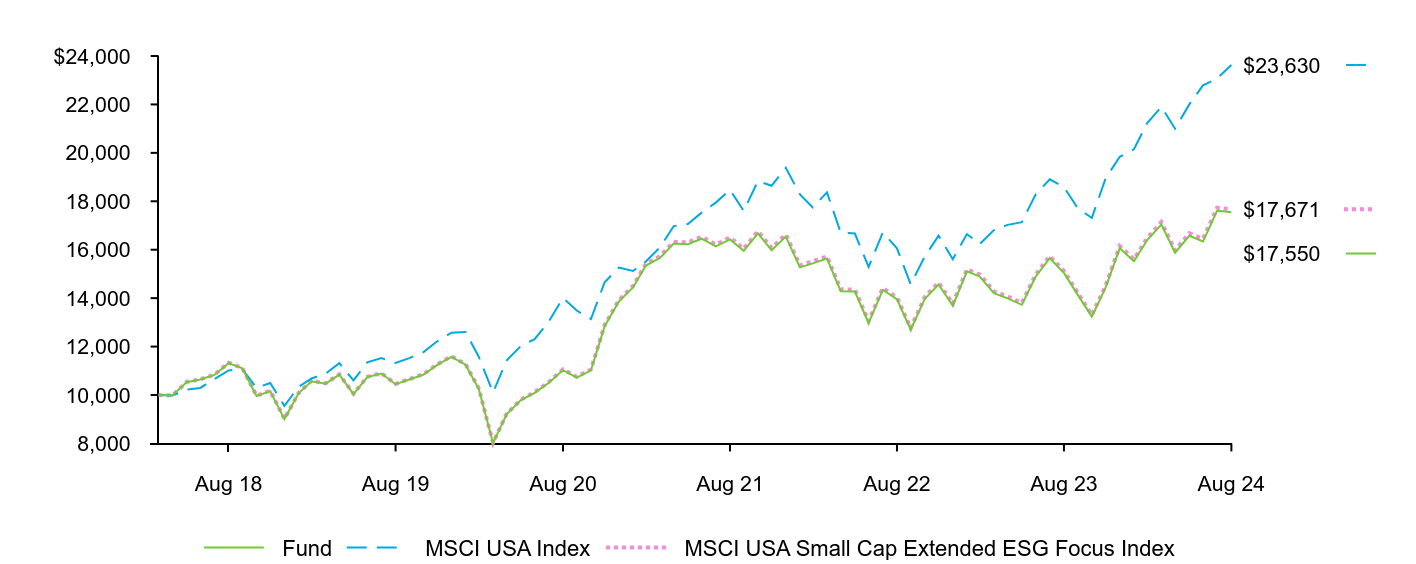
| Fund | MSCI USA Index | MSCI USA Small Cap Extended ESG Focus Index |
|---|
| Mar 18 | $10,000 | $10,000 | $10,000 |
| Apr 18 | $9,976 | $9,980 | $9,980 |
| May 18 | $10,530 | $10,223 | $10,535 |
| Jun 18 | $10,639 | $10,293 | $10,647 |
| Jul 18 | $10,828 | $10,662 | $10,837 |
| Aug 18 | $11,316 | $11,015 | $11,331 |
| Sep 18 | $11,099 | $11,065 | $11,113 |
| Oct 18 | $9,963 | $10,297 | $9,973 |
| Nov 18 | $10,160 | $10,498 | $10,173 |
| Dec 18 | $9,005 | $9,552 | $9,016 |
| Jan 19 | $10,071 | $10,338 | $10,084 |
| Feb 19 | $10,567 | $10,684 | $10,586 |
| Mar 19 | $10,469 | $10,881 | $10,484 |
| Apr 19 | $10,839 | $11,318 | $10,856 |
| May 19 | $10,040 | $10,602 | $10,050 |
| Jun 19 | $10,741 | $11,347 | $10,752 |
| Jul 19 | $10,888 | $11,522 | $10,900 |
| Aug 19 | $10,446 | $11,322 | $10,458 |
| Sep 19 | $10,643 | $11,523 | $10,660 |
| Oct 19 | $10,843 | $11,774 | $10,862 |
| Nov 19 | $11,246 | $12,217 | $11,268 |
| Dec 19 | $11,574 | $12,575 | $11,599 |
| Jan 20 | $11,253 | $12,599 | $11,275 |
| Feb 20 | $10,246 | $11,572 | $10,267 |
| Mar 20 | $8,012 | $10,104 | $8,027 |
| Apr 20 | $9,211 | $11,433 | $9,230 |
| May 20 | $9,790 | $12,028 | $9,808 |
| Jun 20 | $10,092 | $12,303 | $10,118 |
| Jul 20 | $10,507 | $13,033 | $10,536 |
| Aug 20 | $11,028 | $14,011 | $11,060 |
| Sep 20 | $10,720 | $13,489 | $10,755 |
| Oct 20 | $11,019 | $13,138 | $11,055 |
| Nov 20 | $12,844 | $14,658 | $12,889 |
| Dec 20 | $13,862 | $15,262 | $13,915 |
| Jan 21 | $14,443 | $15,121 | $14,505 |
| Feb 21 | $15,345 | $15,515 | $15,415 |
| Mar 21 | $15,664 | $16,099 | $15,735 |
| Apr 21 | $16,254 | $16,975 | $16,327 |
| May 21 | $16,226 | $17,057 | $16,303 |
| Jun 21 | $16,454 | $17,532 | $16,535 |
| Jul 21 | $16,136 | $17,946 | $16,215 |
| Aug 21 | $16,425 | $18,476 | $16,509 |
| Sep 21 | $15,952 | $17,604 | $16,038 |
| Oct 21 | $16,676 | $18,832 | $16,767 |
| Nov 21 | $15,981 | $18,642 | $16,070 |
| Dec 21 | $16,540 | $19,379 | $16,634 |
| Jan 22 | $15,272 | $18,281 | $15,357 |
| Feb 22 | $15,437 | $17,746 | $15,524 |
| Mar 22 | $15,638 | $18,370 | $15,725 |
| Apr 22 | $14,287 | $16,704 | $14,368 |
| May 22 | $14,272 | $16,668 | $14,354 |
| Jun 22 | $12,975 | $15,288 | $13,048 |
| Jul 22 | $14,341 | $16,714 | $14,421 |
| Aug 22 | $13,957 | $16,059 | $14,032 |
| Sep 22 | $12,696 | $14,570 | $12,763 |
| Oct 22 | $13,977 | $15,727 | $14,053 |
| Nov 22 | $14,562 | $16,582 | $14,645 |
| Dec 22 | $13,691 | $15,607 | $13,770 |
| Jan 23 | $15,107 | $16,644 | $15,192 |
| Feb 23 | $14,894 | $16,237 | $14,978 |
| Mar 23 | $14,204 | $16,814 | $14,284 |
| Apr 23 | $13,992 | $17,027 | $14,071 |
| May 23 | $13,725 | $17,138 | $13,802 |
| Jun 23 | $14,885 | $18,281 | $14,965 |
| Jul 23 | $15,652 | $18,910 | $15,737 |
| Aug 23 | $15,039 | $18,591 | $15,119 |
| Sep 23 | $14,144 | $17,720 | $14,220 |
| Oct 23 | $13,237 | $17,312 | $13,308 |
| Nov 23 | $14,437 | $18,944 | $14,514 |
| Dec 23 | $16,061 | $19,837 | $16,148 |
| Jan 24 | $15,524 | $20,146 | $15,608 |
| Feb 24 | $16,399 | $21,227 | $16,489 |
| Mar 24 | $17,043 | $21,902 | $17,141 |
| Apr 24 | $15,878 | $20,998 | $15,972 |
| May 24 | $16,576 | $22,001 | $16,681 |
| Jun 24 | $16,345 | $22,788 | $16,449 |
| Jul 24 | $17,615 | $23,074 | $17,733 |
| Aug 24 | $17,550 | $23,630 | $17,671 |
See “Average annual total returns” for additional information on fund performance.
Average annual total returns
| ........................................................................................................................................................................................................................................................................................................................................................................................................................................................................................................................................................................................................................................................................................................................................................................................................................................................................................................................................................................................................................................ | 1 Year | 5 Years | Since Fund Inception |
|---|
Fund NAV........................................................................................................................................................................................................................................................................................................................................................................................................................................................................................................................................................................................................................................................................................................................................................................................................................................................................................................................................................................................................................................ | 16.70% | 10.94% | 9.19% |
Fund Market........................................................................................................................................................................................................................................................................................................................................................................................................................................................................................................................................................................................................................................................................................................................................................................................................................................................................................................................................................................................................................................ | 16.73 | 10.93 | 9.21 |
MSCI USA Index........................................................................................................................................................................................................................................................................................................................................................................................................................................................................................................................................................................................................................................................................................................................................................................................................................................................................................................................................................................................................................................ | 27.10 | 15.85 | 14.40 |
MSCI USA Small Cap Extended ESG Focus Index........................................................................................................................................................................................................................................................................................................................................................................................................................................................................................................................................................................................................................................................................................................................................................................................................................................................................................................................................................................................................................................ | 16.88 | 11.06 | 9.32 |
Net Assets........................................................................................................................................................................................................................................................................................................................................................................................................................................................................................................................................................................................................................................................................................................................................................................................................................................................................................................................................................................................................................................ | $1,811,618,628 |
Number of Portfolio Holdings........................................................................................................................................................................................................................................................................................................................................................................................................................................................................................................................................................................................................................................................................................................................................................................................................................................................................................................................................................................................................................................ | 909 |
Net Investment Advisory Fees........................................................................................................................................................................................................................................................................................................................................................................................................................................................................................................................................................................................................................................................................................................................................................................................................................................................................................................................................................................................................................................ | $2,555,261 |
Portfolio Turnover Rate........................................................................................................................................................................................................................................................................................................................................................................................................................................................................................................................................................................................................................................................................................................................................................................................................................................................................................................................................................................................................................................ | 35% |
The Fund has added the MSCI USA Index in response to new regulatory requirements.
The inception date of the Fund was April 10, 2018. The first day of secondary market trading was April 12, 2018.
Past performance is not an indication of future results.Performance results do not reflect the deduction of taxes that a shareholder would pay on fund distributions or on the redemption or sale of fund shares. Visit iShares.com for more recent performance information.
What did the Fund invest in?
| Sector | Percent of Total InvestmentsFootnote Reference(a) |
|---|
Industrials........................................................................................................................................................................................................................................................................................................................................................................................................................................................................................................................................................................................................................................................................................................................................................................................................................................................................................................................................................................................................................................ | 18.9% |
Financials........................................................................................................................................................................................................................................................................................................................................................................................................................................................................................................................................................................................................................................................................................................................................................................................................................................................................................................................................................................................................................................ | 16.3 |
Consumer Discretionary........................................................................................................................................................................................................................................................................................................................................................................................................................................................................................................................................................................................................................................................................................................................................................................................................................................................................................................................................................................................................................................ | 14.7 |
Information Technology........................................................................................................................................................................................................................................................................................................................................................................................................................................................................................................................................................................................................................................................................................................................................................................................................................................................................................................................................................................................................................................ | 13.4 |
Health Care........................................................................................................................................................................................................................................................................................................................................................................................................................................................................................................................................................................................................................................................................................................................................................................................................................................................................................................................................................................................................................................ | 13.0 |
Real Estate........................................................................................................................................................................................................................................................................................................................................................................................................................................................................................................................................................................................................................................................................................................................................................................................................................................................................................................................................................................................................................................ | 5.8 |
Materials........................................................................................................................................................................................................................................................................................................................................................................................................................................................................................................................................................................................................................................................................................................................................................................................................................................................................................................................................................................................................................................ | 5.2 |
Energy........................................................................................................................................................................................................................................................................................................................................................................................................................................................................................................................................................................................................................................................................................................................................................................................................................................................................................................................................................................................................................................ | 4.6 |
Consumer Staples........................................................................................................................................................................................................................................................................................................................................................................................................................................................................................................................................................................................................................................................................................................................................................................................................................................................................................................................................................................................................................................ | 3.7 |
Utilities........................................................................................................................................................................................................................................................................................................................................................................................................................................................................................................................................................................................................................................................................................................................................................................................................................................................................................................................................................................................................................................ | 2.3 |
Communication Services........................................................................................................................................................................................................................................................................................................................................................................................................................................................................................................................................................................................................................................................................................................................................................................................................................................................................................................................................................................................................................................ | 2.1 |
| Security | Percent of Total InvestmentsFootnote Reference(a) |
|---|
Casey's General Stores, Inc......................................................................................................................................................................................................................................................................................................................................................................................................................................................................................................................................................................................................................................................................................................................................................................................................................................................................................................................................................................................................................................... | 0.5% |
U.S. Foods Holding Corp......................................................................................................................................................................................................................................................................................................................................................................................................................................................................................................................................................................................................................................................................................................................................................................................................................................................................................................................................................................................................................................... | 0.5 |
Janus Henderson Group PLC........................................................................................................................................................................................................................................................................................................................................................................................................................................................................................................................................................................................................................................................................................................................................................................................................................................................................................................................................................................................................................................ | 0.5 |
KBR, Inc......................................................................................................................................................................................................................................................................................................................................................................................................................................................................................................................................................................................................................................................................................................................................................................................................................................................................................................................................................................................................................................... | 0.4 |
Ingredion, Inc......................................................................................................................................................................................................................................................................................................................................................................................................................................................................................................................................................................................................................................................................................................................................................................................................................................................................................................................................................................................................................................... | 0.4 |
Rexford Industrial Realty, Inc......................................................................................................................................................................................................................................................................................................................................................................................................................................................................................................................................................................................................................................................................................................................................................................................................................................................................................................................................................................................................................................... | 0.4 |
Murphy USA, Inc......................................................................................................................................................................................................................................................................................................................................................................................................................................................................................................................................................................................................................................................................................................................................................................................................................................................................................................................................................................................................................................... | 0.4 |
Jones Lang LaSalle, Inc......................................................................................................................................................................................................................................................................................................................................................................................................................................................................................................................................................................................................................................................................................................................................................................................................................................................................................................................................................................................................................................... | 0.4 |
TechnipFMC PLC........................................................................................................................................................................................................................................................................................................................................................................................................................................................................................................................................................................................................................................................................................................................................................................................................................................................................................................................................................................................................................................ | 0.4 |
Guidewire Software, Inc......................................................................................................................................................................................................................................................................................................................................................................................................................................................................................................................................................................................................................................................................................................................................................................................................................................................................................................................................................................................................................................... | 0.4 |
⁽ᵃ⁾ Excludes money market funds.
Additional information
If you wish to view additional information about the Fund, including but not limited to financial statements, the Fund’s prospectus, and proxy voting policies and procedures, please visit blackrock.com/fundreports. For proxy voting records, visit blackrock.com/proxyrecords.
Householding
Householding is an option available to certain fund investors. Householding is a method of delivery, based on the preference of the individual investor, in which a single copy of certain shareholder documents can be delivered to investors who share the same address, even if their accounts are registered under different names. Please contact your broker-dealer if you are interested in enrolling in householding and receiving a single copy of prospectuses and other shareholder documents, or if you are currently enrolled in householding and wish to change your householding status.
The Fund is not sponsored, endorsed, issued, sold or promoted by MSCI Inc. and its affiliates, nor does this company make any representation regarding the advisability of investing in the Fund. BlackRock is not affiliated with the company listed above.
©2024 BlackRock, Inc. or its affiliates. All rights reserved. iSHARES and BLACKROCK are registered trademarks of BlackRock, Inc. or its affiliates. All other trademarks are those of their respective owners.
iShares ESG Aware MSCI USA Small-Cap ETF
Annual Shareholder Report — August 31, 2024
iShares ESG Aware MSCI USA Value ETF
Annual Shareholder Report — August 31, 2024
This annual shareholder report contains important information about iShares ESG Aware MSCI USA Value ETF (the “Fund”) for the period of September 1, 2023 to August 31, 2024. You can find additional information about the Fund at blackrock.com/fundreports. You can also request this information by contacting us at 1-800-iShares (1-800-474-2737).
What were the Fund costs for the last year?
(based on a hypothetical $10,000 investment)
| Fund name | Costs of a $10,000 investment | Costs paid as a percentage of a $10,000 investment |
|---|
| iShares ESG Aware MSCI USA Value ETF | $20 | 0.18% |
How did the Fund perform last year?
U.S. stocks registered solid gains during the reporting period, as investor confidence increased over hopes of interest rate cuts and robust corporate earnings.
The United States experienced stronger-than-expected economic growth driven by robust consumer spending and business investment. Meanwhile, inflation measures continued to trend downward, prompting comments by U.S. Federal Reserve Bank officials that indicated interest rate cuts would be forthcoming.
Powered by artificial intelligence (“AI”), information technology stocks led the market for the majority of the reporting period. However, market sentiment pivoted toward more defensive sectors late in the reporting period amid growing uncertainty surrounding economic growth, geopolitics, and the upcoming U.S. presidential election.
While environmental, social, and governance (“ESG”) issues continued to feature in headlines, investor interest in sustainable investing ETFs was mixed during the reporting period in the United States.
What contributed to performance?
For the reporting period, the largest contributor to the Fund’s performance was the financials sector, most notably financial services and banks, which outperformed due to strong economic indicators such as solid retail sales. Improved market sentiment and recovering risk assets also lifted bank stocks. Stocks in the industrials sector helped performance due to unexpectedly strong economic data, including higher durable goods orders and manufacturing growth. Enhanced infrastructure spending and reduced supply chain issues also fueled sector growth. The information technology sector contributed positively to the Fund’s performance, particularly semiconductor manufacturers that provide the backbone for the complex calculations required for AI algorithms.
What detracted from performance?
There were no meaningful detractors to the Fund’s performance during the reporting period.
The views expressed reflect the opinions of BlackRock as of the date of this report and are subject to change based on changes in market, economic or other conditions. These views are not intended to be a forecast of future events and are no guarantee of future results.
Cumulative performance: January 31, 2023 through August 31, 2024
Initial investment of $10,000
| Fund | MSCI USA Index | MSCI USA Value Extended ESG Focus Index |
|---|
| Jan 23 | $10,000 | $10,000 | $10,000 |
| Feb 23 | $9,615 | $9,756 | $9,612 |
| Mar 23 | $9,537 | $10,102 | $9,537 |
| Apr 23 | $9,645 | $10,231 | $9,646 |
| May 23 | $9,238 | $10,297 | $9,239 |
| Jun 23 | $9,783 | $10,984 | $9,787 |
| Jul 23 | $10,138 | $11,362 | $10,145 |
| Aug 23 | $9,862 | $11,170 | $9,869 |
| Sep 23 | $9,459 | $10,646 | $9,467 |
| Oct 23 | $9,175 | $10,401 | $9,186 |
| Nov 23 | $9,857 | $11,382 | $9,871 |
| Dec 23 | $10,391 | $11,919 | $10,407 |
| Jan 24 | $10,412 | $12,104 | $10,429 |
| Feb 24 | $10,773 | $12,754 | $10,792 |
| Mar 24 | $11,302 | $13,159 | $11,325 |
| Apr 24 | $10,833 | $12,616 | $10,857 |
| May 24 | $11,129 | $13,219 | $11,156 |
| Jun 24 | $11,122 | $13,691 | $11,151 |
| Jul 24 | $11,709 | $13,863 | $11,740 |
| Aug 24 | $12,043 | $14,198 | $12,079 |
See “Average annual total returns” for additional information on fund performance.
Average annual total returns
| ........................................................................................................................................................................................................................................................................................................................................................................................................................................................................................................................................................................................................................................................................................................................................................................................................................................................................................................................................................................................................................................ | 1 Year | Since Fund Inception |
|---|
Fund NAV........................................................................................................................................................................................................................................................................................................................................................................................................................................................................................................................................................................................................................................................................................................................................................................................................................................................................................................................................................................................................................................ | 22.12% | 12.48% |
Fund Market........................................................................................................................................................................................................................................................................................................................................................................................................................................................................................................................................................................................................................................................................................................................................................................................................................................................................................................................................................................................................................................ | 22.17 | 12.52 |
MSCI USA Index........................................................................................................................................................................................................................................................................................................................................................................................................................................................................................................................................................................................................................................................................................................................................................................................................................................................................................................................................................................................................................................ | 27.10 | 24.82 |
MSCI USA Value Extended ESG Focus Index........................................................................................................................................................................................................................................................................................................................................................................................................................................................................................................................................................................................................................................................................................................................................................................................................................................................................................................................................................................................................................................ | 22.39 | 12.69 |
Net Assets........................................................................................................................................................................................................................................................................................................................................................................................................................................................................................................................................................................................................................................................................................................................................................................................................................................................................................................................................................................................................................................ | $5,902,496 |
Number of Portfolio Holdings........................................................................................................................................................................................................................................................................................................................................................................................................................................................................................................................................................................................................................................................................................................................................................................................................................................................................................................................................................................................................................................ | 237 |
Net Investment Advisory Fees........................................................................................................................................................................................................................................................................................................................................................................................................................................................................................................................................................................................................................................................................................................................................................................................................................................................................................................................................................................................................................................ | $8,174 |
Portfolio Turnover Rate........................................................................................................................................................................................................................................................................................................................................................................................................................................................................................................................................................................................................................................................................................................................................................................................................................................................................................................................................................................................................................................ | 38% |
The Fund has added the MSCI USA Index in response to new regulatory requirements.
The inception date of the Fund was January 31, 2023. The first day of secondary market trading was February 2, 2023.
Past performance is not an indication of future results.Performance results do not reflect the deduction of taxes that a shareholder would pay on fund distributions or on the redemption or sale of fund shares. Visit iShares.com for more recent performance information.
What did the Fund invest in?
| Sector | Percent of Total InvestmentsFootnote Reference(a) |
|---|
Financials........................................................................................................................................................................................................................................................................................................................................................................................................................................................................................................................................................................................................................................................................................................................................................................................................................................................................................................................................................................................................................................ | 18.6% |
Health Care........................................................................................................................................................................................................................................................................................................................................................................................................................................................................................................................................................................................................................................................................................................................................................................................................................................................................................................................................................................................................................................ | 16.1 |
Industrials........................................................................................................................................................................................................................................................................................................................................................................................................................................................................................................................................................................................................................................................................................................................................................................................................................................................................................................................................................................................................................................ | 13.7 |
Information Technology........................................................................................................................................................................................................................................................................................................................................................................................................................................................................................................................................................................................................................................................................................................................................................................................................................................................................................................................................................................................................................................ | 13.0 |
Consumer Staples........................................................................................................................................................................................................................................................................................................................................................................................................................................................................................................................................................................................................................................................................................................................................................................................................................................................................................................................................................................................................................................ | 10.3 |
Energy........................................................................................................................................................................................................................................................................................................................................................................................................................................................................................................................................................................................................................................................................................................................................................................................................................................................................................................................................................................................................................................ | 7.0 |
Consumer Discretionary........................................................................................................................................................................................................................................................................................................................................................................................................................................................................................................................................................................................................................................................................................................................................................................................................................................................................................................................................................................................................................................ | 5.8 |
Utilities........................................................................................................................................................................................................................................................................................................................................................................................................................................................................................................................................................................................................................................................................................................................................................................................................................................................................................................................................................................................................................................ | 4.4 |
Real Estate........................................................................................................................................................................................................................................................................................................................................................................................................................................................................................................................................................................................................................................................................................................................................................................................................................................................................................................................................................................................................................................ | 4.2 |
Materials........................................................................................................................................................................................................................................................................................................................................................................................................................................................................................................................................................................................................................................................................................................................................................................................................................................................................................................................................................................................................................................ | 4.0 |
Communication Services........................................................................................................................................................................................................................................................................................................................................................................................................................................................................................................................................................................................................................................................................................................................................................................................................................................................................................................................................................................................................................................ | 2.9 |
| Security | Percent of Total InvestmentsFootnote Reference(a) |
|---|
Broadcom, Inc......................................................................................................................................................................................................................................................................................................................................................................................................................................................................................................................................................................................................................................................................................................................................................................................................................................................................................................................................................................................................................................... | 2.9% |
JPMorgan Chase & Co......................................................................................................................................................................................................................................................................................................................................................................................................................................................................................................................................................................................................................................................................................................................................................................................................................................................................................................................................................................................................................................... | 2.7 |
UnitedHealth Group, Inc......................................................................................................................................................................................................................................................................................................................................................................................................................................................................................................................................................................................................................................................................................................................................................................................................................................................................................................................................................................................................................................... | 2.1 |
Coca-Cola Co. (The)........................................................................................................................................................................................................................................................................................................................................................................................................................................................................................................................................................................................................................................................................................................................................................................................................................................................................................................................................................................................................................................ | 2.0 |
Home Depot, Inc. (The)........................................................................................................................................................................................................................................................................................................................................................................................................................................................................................................................................................................................................................................................................................................................................................................................................................................................................................................................................................................................................................................ | 1.9 |
Texas Instruments, Inc......................................................................................................................................................................................................................................................................................................................................................................................................................................................................................................................................................................................................................................................................................................................................................................................................................................................................................................................................................................................................................................... | 1.6 |
Johnson & Johnson........................................................................................................................................................................................................................................................................................................................................................................................................................................................................................................................................................................................................................................................................................................................................................................................................................................................................................................................................................................................................................................ | 1.6 |
Exxon Mobil Corp......................................................................................................................................................................................................................................................................................................................................................................................................................................................................................................................................................................................................................................................................................................................................................................................................................................................................................................................................................................................................................................... | 1.6 |
Procter & Gamble Co. (The)........................................................................................................................................................................................................................................................................................................................................................................................................................................................................................................................................................................................................................................................................................................................................................................................................................................................................................................................................................................................................................................ | 1.5 |
Berkshire Hathaway, Inc., Class B........................................................................................................................................................................................................................................................................................................................................................................................................................................................................................................................................................................................................................................................................................................................................................................................................................................................................................................................................................................................................................................ | 1.2 |
⁽ᵃ⁾ Excludes money market funds.
Additional information
If you wish to view additional information about the Fund, including but not limited to financial statements, the Fund’s prospectus, and proxy voting policies and procedures, please visit blackrock.com/fundreports. For proxy voting records, visit blackrock.com/proxyrecords.
Householding
Householding is an option available to certain fund investors. Householding is a method of delivery, based on the preference of the individual investor, in which a single copy of certain shareholder documents can be delivered to investors who share the same address, even if their accounts are registered under different names. Please contact your broker-dealer if you are interested in enrolling in householding and receiving a single copy of prospectuses and other shareholder documents, or if you are currently enrolled in householding and wish to change your householding status.
The Fund is not sponsored, endorsed, issued, sold or promoted by MSCI Inc. and its affiliates, nor does this company make any representation regarding the advisability of investing in the Fund. BlackRock is not affiliated with the company listed above.
©2024 BlackRock, Inc. or its affiliates. All rights reserved. iSHARES and BLACKROCK are registered trademarks of BlackRock, Inc. or its affiliates. All other trademarks are those of their respective owners.
iShares ESG Aware MSCI USA Value ETF
Annual Shareholder Report — August 31, 2024
iShares ESG MSCI USA Leaders ETF
Annual Shareholder Report — August 31, 2024
This annual shareholder report contains important information about iShares ESG MSCI USA Leaders ETF (the “Fund”) for the period of September 1, 2023 to August 31, 2024. You can find additional information about the Fund at blackrock.com/fundreports. You can also request this information by contacting us at 1-800-iShares (1-800-474-2737).
What were the Fund costs for the last year?
(based on a hypothetical $10,000 investment)
| Fund name | Costs of a $10,000 investment | Costs paid as a percentage of a $10,000 investment |
|---|
| iShares ESG MSCI USA Leaders ETF | $11 | 0.10% |
How did the Fund perform last year?
U.S. stocks registered solid gains during the reporting period, as investor confidence increased over hopes of interest rate cuts and robust corporate earnings.
The United States experienced stronger-than-expected economic growth driven by robust consumer spending and business investment. Meanwhile, inflation measures continued to trend downward, prompting comments by U.S. Federal Reserve Bank officials that indicated interest rate cuts would be forthcoming.
Powered by artificial intelligence (“AI”), information technology stocks led the market for the majority of the reporting period. However, market sentiment pivoted toward more defensive sectors late in the reporting period amid growing uncertainty surrounding economic growth, geopolitics, and the upcoming U.S. presidential election.
While environmental, social, and governance (“ESG”) issues continued to feature in headlines, investor interest in sustainable investing ETFs was mixed during the reporting period in the United States.
What contributed to performance?
For the reporting period, the largest contributor to the Fund’s performance was the information technology sector, particularly semiconductor manufacturers that provide the backbone for the complex calculations required for AI algorithms. The financials sector, most notably financial services, outperformed due to significant merger and acquisition activity; banks consolidated to manage rising costs and regulatory pressures, while digital transformation spurred acquisitions in financial technology. The healthcare sector helped performance, driven by medical technology advancements, increased demand for diagnostic equipment, and robust growth in telehealth services.
What detracted from performance?
There were no meaningful detractors to the Fund’s performance during the reporting period.
The views expressed reflect the opinions of BlackRock as of the date of this report and are subject to change based on changes in market, economic or other conditions. These views are not intended to be a forecast of future events and are no guarantee of future results.
Cumulative performance: May 7, 2019 through August 31, 2024
Initial investment of $10,000
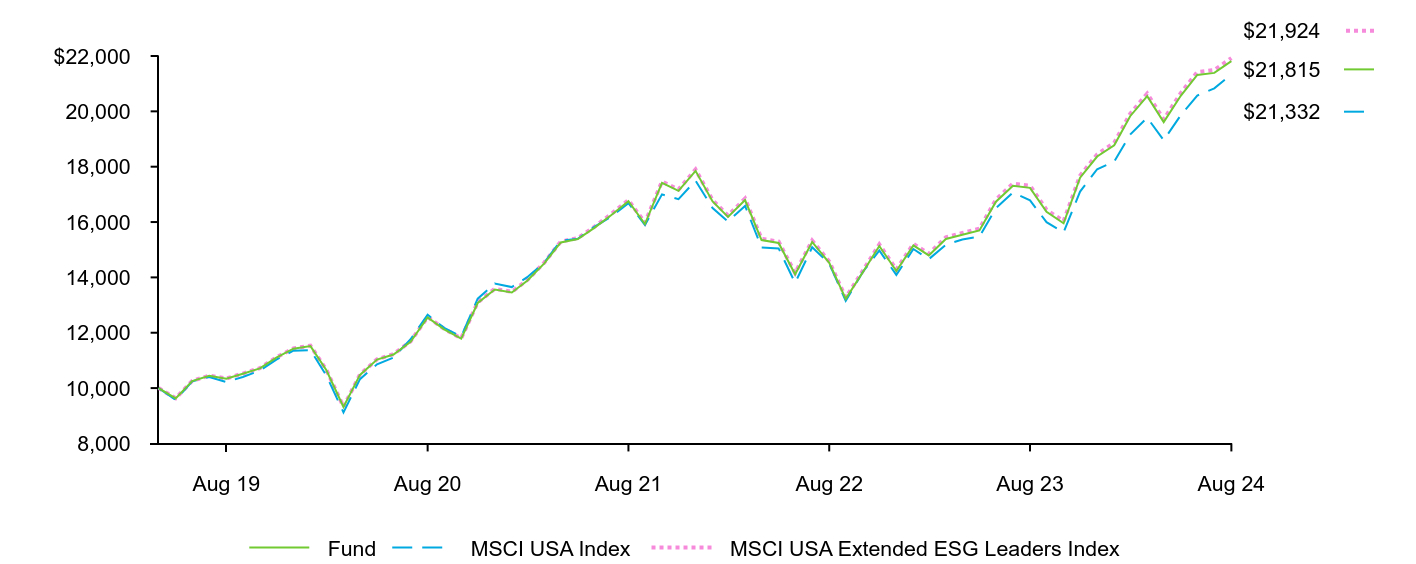
| Fund | MSCI USA Index | MSCI USA Extended ESG Leaders Index |
|---|
| Apr 19 | $10,000 | $10,000 | $10,000 |
| May 19 | $9,626 | $9,571 | $9,630 |
| Jun 19 | $10,252 | $10,243 | $10,258 |
| Jul 19 | $10,446 | $10,402 | $10,452 |
| Aug 19 | $10,338 | $10,221 | $10,346 |
| Sep 19 | $10,517 | $10,403 | $10,525 |
| Oct 19 | $10,712 | $10,629 | $10,720 |
| Nov 19 | $11,100 | $11,029 | $11,111 |
| Dec 19 | $11,422 | $11,352 | $11,434 |
| Jan 20 | $11,518 | $11,374 | $11,531 |
| Feb 20 | $10,645 | $10,447 | $10,658 |
| Mar 20 | $9,317 | $9,122 | $9,326 |
| Apr 20 | $10,476 | $10,322 | $10,487 |
| May 20 | $11,029 | $10,858 | $11,042 |
| Jun 20 | $11,211 | $11,106 | $11,226 |
| Jul 20 | $11,674 | $11,765 | $11,688 |
| Aug 20 | $12,555 | $12,649 | $12,572 |
| Sep 20 | $12,122 | $12,177 | $12,138 |
| Oct 20 | $11,784 | $11,860 | $11,802 |
| Nov 20 | $13,075 | $13,232 | $13,097 |
| Dec 20 | $13,564 | $13,778 | $13,588 |
| Jan 21 | $13,454 | $13,650 | $13,478 |
| Feb 21 | $13,876 | $14,007 | $13,902 |
| Mar 21 | $14,506 | $14,534 | $14,536 |
| Apr 21 | $15,261 | $15,325 | $15,294 |
| May 21 | $15,385 | $15,398 | $15,418 |
| Jun 21 | $15,790 | $15,827 | $15,826 |
| Jul 21 | $16,253 | $16,201 | $16,293 |
| Aug 21 | $16,753 | $16,679 | $16,795 |
| Sep 21 | $15,928 | $15,892 | $15,970 |
| Oct 21 | $17,420 | $17,000 | $17,468 |
| Nov 21 | $17,128 | $16,829 | $17,176 |
| Dec 21 | $17,849 | $17,494 | $17,900 |
| Jan 22 | $16,745 | $16,504 | $16,794 |
| Feb 22 | $16,186 | $16,020 | $16,235 |
| Mar 22 | $16,796 | $16,583 | $16,847 |
| Apr 22 | $15,348 | $15,080 | $15,395 |
| May 22 | $15,244 | $15,047 | $15,292 |
| Jun 22 | $14,114 | $13,801 | $14,160 |
| Jul 22 | $15,281 | $15,089 | $15,331 |
| Aug 22 | $14,526 | $14,498 | $14,575 |
| Sep 22 | $13,223 | $13,153 | $13,268 |
| Oct 22 | $14,187 | $14,197 | $14,237 |
| Nov 22 | $15,136 | $14,970 | $15,191 |
| Dec 22 | $14,230 | $14,090 | $14,283 |
| Jan 23 | $15,154 | $15,025 | $15,212 |
| Feb 23 | $14,793 | $14,658 | $14,851 |
| Mar 23 | $15,390 | $15,179 | $15,452 |
| Apr 23 | $15,543 | $15,371 | $15,607 |
| May 23 | $15,695 | $15,471 | $15,761 |
| Jun 23 | $16,736 | $16,503 | $16,808 |
| Jul 23 | $17,314 | $17,071 | $17,391 |
| Aug 23 | $17,236 | $16,783 | $17,313 |
| Sep 23 | $16,368 | $15,996 | $16,442 |
| Oct 23 | $15,957 | $15,628 | $16,031 |
| Nov 23 | $17,602 | $17,102 | $17,675 |
| Dec 23 | $18,367 | $17,908 | $18,444 |
| Jan 24 | $18,776 | $18,187 | $18,858 |
| Feb 24 | $19,824 | $19,162 | $19,912 |
| Mar 24 | $20,551 | $19,772 | $20,644 |
| Apr 24 | $19,614 | $18,956 | $19,705 |
| May 24 | $20,562 | $19,861 | $20,660 |
| Jun 24 | $21,317 | $20,572 | $21,420 |
| Jul 24 | $21,389 | $20,830 | $21,494 |
| Aug 24 | $21,815 | $21,332 | $21,924 |
See “Average annual total returns” for additional information on fund performance.
Average annual total returns
| ........................................................................................................................................................................................................................................................................................................................................................................................................................................................................................................................................................................................................................................................................................................................................................................................................................................................................................................................................................................................................................................ | 1 Year | 5 Years | Since Fund Inception |
|---|
Fund NAV........................................................................................................................................................................................................................................................................................................................................................................................................................................................................................................................................................................................................................................................................................................................................................................................................................................................................................................................................................................................................................................ | 26.57% | 16.11% | 15.79% |
Fund Market........................................................................................................................................................................................................................................................................................................................................................................................................................................................................................................................................................................................................................................................................................................................................................................................................................................................................................................................................................................................................................................ | 26.49 | 16.12 | 15.79 |
MSCI USA Index........................................................................................................................................................................................................................................................................................................................................................................................................................................................................................................................................................................................................................................................................................................................................................................................................................................................................................................................................................................................................................................ | 27.10 | 15.85 | 15.31 |
MSCI USA Extended ESG Leaders Index........................................................................................................................................................................................................................................................................................................................................................................................................................................................................................................................................................................................................................................................................................................................................................................................................................................................................................................................................................................................................................................ | 26.63 | 16.21 | 15.91 |
Net Assets........................................................................................................................................................................................................................................................................................................................................................................................................................................................................................................................................................................................................................................................................................................................................................................................................................................................................................................................................................................................................................................ | $1,085,399,444 |
Number of Portfolio Holdings........................................................................................................................................................................................................................................................................................................................................................................................................................................................................................................................................................................................................................................................................................................................................................................................................................................................................................................................................................................................................................................ | 296 |
Net Investment Advisory Fees........................................................................................................................................................................................................................................................................................................................................................................................................................................................................................................................................................................................................................................................................................................................................................................................................................................................................................................................................................................................................................................ | $1,095,637 |
Portfolio Turnover Rate........................................................................................................................................................................................................................................................................................................................................................................................................................................................................................................................................................................................................................................................................................................................................................................................................................................................................................................................................................................................................................................ | 8% |
The Fund has added the MSCI USA Index in response to new regulatory requirements.
The inception date of the Fund was May 7, 2019. The first day of secondary market trading was May 9, 2019.
Past performance is not an indication of future results.Performance results do not reflect the deduction of taxes that a shareholder would pay on fund distributions or on the redemption or sale of fund shares. Visit iShares.com for more recent performance information.
What did the Fund invest in?
| Sector | Percent of Total InvestmentsFootnote Reference(a) |
|---|
Information Technology........................................................................................................................................................................................................................................................................................................................................................................................................................................................................................................................................................................................................................................................................................................................................................................................................................................................................................................................................................................................................................................ | 34.4% |
Financials........................................................................................................................................................................................................................................................................................................................................................................................................................................................................................................................................................................................................................................................................................................................................................................................................................................................................................................................................................................................................................................ | 12.4 |
Health Care........................................................................................................................................................................................................................................................................................................................................................................................................................................................................................................................................................................................................................................................................................................................................................................................................................................................................................................................................................................................................................................ | 12.0 |
Consumer Discretionary........................................................................................................................................................................................................................................................................................................................................................................................................................................................................................................................................................................................................................................................................................................................................................................................................................................................................................................................................................................................................................................ | 9.7 |
Communication Services........................................................................................................................................................................................................................................................................................................................................................................................................................................................................................................................................................................................................................................................................................................................................................................................................................................................................................................................................................................................................................................ | 9.4 |
Industrials........................................................................................................................................................................................................................................................................................................................................................................................................................................................................................................................................................................................................................................................................................................................................................................................................................................................................................................................................................................................................................................ | 8.4 |
Consumer Staples........................................................................................................................................................................................................................................................................................................................................................................................................................................................................................................................................................................................................................................................................................................................................................................................................................................................................................................................................................................................................................................ | 5.5 |
Materials........................................................................................................................................................................................................................................................................................................................................................................................................................................................................................................................................................................................................................................................................................................................................................................................................................................................................................................................................................................................................................................ | 2.8 |
Real Estate........................................................................................................................................................................................................................................................................................................................................................................................................................................................................................................................................................................................................................................................................................................................................................................................................................................................................................................................................................................................................................................ | 2.4 |
Energy........................................................................................................................................................................................................................................................................................................................................................................................................................................................................................................................................................................................................................................................................................................................................................................................................................................................................................................................................................................................................................................ | 1.9 |
Utilities........................................................................................................................................................................................................................................................................................................................................................................................................................................................................................................................................................................................................................................................................................................................................................................................................................................................................................................................................................................................................................................ | 1.1 |
| Security | Percent of Total InvestmentsFootnote Reference(a) |
|---|
Microsoft Corp......................................................................................................................................................................................................................................................................................................................................................................................................................................................................................................................................................................................................................................................................................................................................................................................................................................................................................................................................................................................................................................... | 11.3% |
NVIDIA Corp......................................................................................................................................................................................................................................................................................................................................................................................................................................................................................................................................................................................................................................................................................................................................................................................................................................................................................................................................................................................................................................... | 11.3 |
Alphabet, Inc., Class A........................................................................................................................................................................................................................................................................................................................................................................................................................................................................................................................................................................................................................................................................................................................................................................................................................................................................................................................................................................................................................................ | 3.7 |
Alphabet, Inc., Class C, NVS........................................................................................................................................................................................................................................................................................................................................................................................................................................................................................................................................................................................................................................................................................................................................................................................................................................................................................................................................................................................................................................ | 3.2 |
Eli Lilly & Co......................................................................................................................................................................................................................................................................................................................................................................................................................................................................................................................................................................................................................................................................................................................................................................................................................................................................................................................................................................................................................................... | 3.0 |
Tesla, Inc......................................................................................................................................................................................................................................................................................................................................................................................................................................................................................................................................................................................................................................................................................................................................................................................................................................................................................................................................................................................................................................... | 2.4 |
Visa, Inc., Class A........................................................................................................................................................................................................................................................................................................................................................................................................................................................................................................................................................................................................................................................................................................................................................................................................................................................................................................................................................................................................................................ | 1.7 |
Procter & Gamble Co. (The)........................................................................................................................................................................................................................................................................................................................................................................................................................................................................................................................................................................................................................................................................................................................................................................................................................................................................................................................................................................................................................................ | 1.6 |
Mastercard, Inc., Class A........................................................................................................................................................................................................................................................................................................................................................................................................................................................................................................................................................................................................................................................................................................................................................................................................................................................................................................................................................................................................................................ | 1.5 |
Johnson & Johnson........................................................................................................................................................................................................................................................................................................................................................................................................................................................................................................................................................................................................................................................................................................................................................................................................................................................................................................................................................................................................................................ | 1.5 |
⁽ᵃ⁾ Excludes money market funds.
Additional information
If you wish to view additional information about the Fund, including but not limited to financial statements, the Fund’s prospectus, and proxy voting policies and procedures, please visit blackrock.com/fundreports. For proxy voting records, visit blackrock.com/proxyrecords.
Householding
Householding is an option available to certain fund investors. Householding is a method of delivery, based on the preference of the individual investor, in which a single copy of certain shareholder documents can be delivered to investors who share the same address, even if their accounts are registered under different names. Please contact your broker-dealer if you are interested in enrolling in householding and receiving a single copy of prospectuses and other shareholder documents, or if you are currently enrolled in householding and wish to change your householding status.
The Fund is not sponsored, endorsed, issued, sold or promoted by MSCI Inc. and its affiliates, nor does this company make any representation regarding the advisability of investing in the Fund. BlackRock is not affiliated with the company listed above.
©2024 BlackRock, Inc. or its affiliates. All rights reserved. iSHARES and BLACKROCK are registered trademarks of BlackRock, Inc. or its affiliates. All other trademarks are those of their respective owners.
iShares ESG MSCI USA Leaders ETF
Annual Shareholder Report — August 31, 2024
iShares Paris-Aligned Climate MSCI USA ETF
Annual Shareholder Report — August 31, 2024
This annual shareholder report contains important information about iShares Paris-Aligned Climate MSCI USA ETF (the “Fund”) for the period of September 1, 2023 to August 31, 2024. You can find additional information about the Fund at blackrock.com/fundreports. You can also request this information by contacting us at 1-800-iShares (1-800-474-2737).
What were the Fund costs for the last year?
(based on a hypothetical $10,000 investment)
| Fund name | Costs of a $10,000 investment | Costs paid as a percentage of a $10,000 investment |
|---|
| iShares Paris-Aligned Climate MSCI USA ETF | $11 | 0.10% |
How did the Fund perform last year?
U.S. stocks registered solid gains during the reporting period, as investor confidence increased over hopes of interest rate cuts and robust corporate earnings.
The United States experienced stronger-than-expected economic growth driven by robust consumer spending and business investment. Meanwhile, inflation measures continued to trend downward, prompting comments by U.S. Federal Reserve Bank officials that indicated interest rate cuts would be forthcoming.
The 2015 Paris Climate Accord set emissions goals for its nearly 200 signatory countries with the goal of limiting climate change to well below two degrees Celsius, above pre-industrial levels and preferably below 1.5 degrees.
Climate change has become an increasingly important investment topic.
What contributed to performance?
During the reporting period, U.S. large- and mid-capitalization stocks that are designed to be compatible with the objectives of the Paris Agreement advanced. The largest contributor to the Fund’s performance was the information technology sector, particularly semiconductor manufacturers that provide the backbone for the complex calculations required for artificial intelligence algorithms. The financials sector, most notably financial services, outperformed due to significant merger and acquisition activity; banks consolidated to manage rising costs and regulatory pressures, while digital transformation spurred acquisitions in financial technology.
What detracted from performance?
The consumer staples sector was a modest detractor to the Fund’s performance due to increased short selling, which was driven by concerns over declining consumer spending amid persistent inflation.
The views expressed reflect the opinions of BlackRock as of the date of this report and are subject to change based on changes in market, economic or other conditions. These views are not intended to be a forecast of future events and are no guarantee of future results.
Cumulative performance: February 8, 2022 through August 31, 2024
Initial investment of $10,000
| Fund | MSCI USA Index | MSCI USA Climate Paris Aligned Benchmark Extended Select Index |
|---|
| Jan 22 | $10,000 | $10,000 | $10,000 |
| Feb 22 | $9,684 | $9,690 | $9,685 |
| Mar 22 | $10,026 | $10,030 | $10,029 |
| Apr 22 | $9,014 | $9,121 | $9,016 |
| May 22 | $8,911 | $9,101 | $8,914 |
| Jun 22 | $8,257 | $8,348 | $8,259 |
| Jul 22 | $9,128 | $9,126 | $9,132 |
| Aug 22 | $8,658 | $8,769 | $8,662 |
| Sep 22 | $7,866 | $7,956 | $7,868 |
| Oct 22 | $8,363 | $8,587 | $8,366 |
| Nov 22 | $8,809 | $9,054 | $8,813 |
| Dec 22 | $8,237 | $8,522 | $8,242 |
| Jan 23 | $8,854 | $9,088 | $8,859 |
| Feb 23 | $8,668 | $8,866 | $8,674 |
| Mar 23 | $9,035 | $9,181 | $9,040 |
| Apr 23 | $9,138 | $9,297 | $9,144 |
| May 23 | $9,284 | $9,358 | $9,290 |
| Jun 23 | $9,907 | $9,982 | $9,914 |
| Jul 23 | $10,202 | $10,325 | $10,211 |
| Aug 23 | $10,055 | $10,151 | $10,064 |
| Sep 23 | $9,477 | $9,675 | $9,486 |
| Oct 23 | $9,206 | $9,453 | $9,216 |
| Nov 23 | $10,168 | $10,344 | $10,180 |
| Dec 23 | $10,692 | $10,831 | $10,704 |
| Jan 24 | $10,809 | $11,000 | $10,822 |
| Feb 24 | $11,384 | $11,590 | $11,398 |
| Mar 24 | $11,584 | $11,959 | $11,599 |
| Apr 24 | $11,007 | $11,465 | $11,022 |
| May 24 | $11,624 | $12,013 | $11,642 |
| Jun 24 | $12,108 | $12,442 | $12,127 |
| Jul 24 | $12,298 | $12,599 | $12,319 |
| Aug 24 | $12,667 | $12,902 | $12,690 |
See “Average annual total returns” for additional information on fund performance.
Average annual total returns
| ........................................................................................................................................................................................................................................................................................................................................................................................................................................................................................................................................................................................................................................................................................................................................................................................................................................................................................................................................................................................................................................ | 1 Year | Since Fund Inception |
|---|
Fund NAV........................................................................................................................................................................................................................................................................................................................................................................................................................................................................................................................................................................................................................................................................................................................................................................................................................................................................................................................................................................................................................................ | 25.98% | 9.68% |
Fund Market........................................................................................................................................................................................................................................................................................................................................................................................................................................................................................................................................................................................................................................................................................................................................................................................................................................................................................................................................................................................................................................ | 25.69 | 9.61 |
MSCI USA Index........................................................................................................................................................................................................................................................................................................................................................................................................................................................................................................................................................................................................................................................................................................................................................................................................................................................................................................................................................................................................................................ | 27.10 | 10.47 |
MSCI USA Climate Paris Aligned Benchmark Extended Select Index........................................................................................................................................................................................................................................................................................................................................................................................................................................................................................................................................................................................................................................................................................................................................................................................................................................................................................................................................................................................................................................ | 26.09 | 9.76 |
Net Assets........................................................................................................................................................................................................................................................................................................................................................................................................................................................................................................................................................................................................................................................................................................................................................................................................................................................................................................................................................................................................................................ | $2,030,240,457 |
Number of Portfolio Holdings........................................................................................................................................................................................................................................................................................................................................................................................................................................................................................................................................................................................................................................................................................................................................................................................................................................................................................................................................................................................................................................ | 241 |
Net Investment Advisory Fees........................................................................................................................................................................................................................................................................................................................................................................................................................................................................................................................................................................................................................................................................................................................................................................................................................................................................................................................................................................................................................................ | $1,683,491 |
Portfolio Turnover Rate........................................................................................................................................................................................................................................................................................................................................................................................................................................................................................................................................................................................................................................................................................................................................................................................................................................................................................................................................................................................................................................ | 11% |
The Fund has added the MSCI USA Index in response to new regulatory requirements.
The inception date of the Fund was February 8, 2022. The first day of secondary market trading was February 10, 2022.
Past performance is not an indication of future results.Performance results do not reflect the deduction of taxes that a shareholder would pay on fund distributions or on the redemption or sale of fund shares. Visit iShares.com for more recent performance information.
What did the Fund invest in?
| Sector | Percent of Total InvestmentsFootnote Reference(a) |
|---|
Information Technology........................................................................................................................................................................................................................................................................................................................................................................................................................................................................................................................................................................................................................................................................................................................................................................................................................................................................................................................................................................................................................................ | 36.2% |
Health Care........................................................................................................................................................................................................................................................................................................................................................................................................................................................................................................................................................................................................................................................................................................................................................................................................................................................................................................................................................................................................................................ | 14.2 |
Financials........................................................................................................................................................................................................................................................................................................................................................................................................................................................................................................................................................................................................................................................................................................................................................................................................................................................................................................................................................................................................................................ | 13.6 |
Consumer Discretionary........................................................................................................................................................................................................................................................................................................................................................................................................................................................................................................................................................................................................................................................................................................................................................................................................................................................................................................................................................................................................................................ | 10.1 |
Communication Services........................................................................................................................................................................................................................................................................................................................................................................................................................................................................................................................................................................................................................................................................................................................................................................................................................................................................................................................................................................................................................................ | 7.4 |
Real Estate........................................................................................................................................................................................................................................................................................................................................................................................................................................................................................................................................................................................................................................................................................................................................................................................................................................................................................................................................................................................................................................ | 7.4 |
Industrials........................................................................................................................................................................................................................................................................................................................................................................................................................................................................................................................................................................................................................................................................................................................................................................................................................................................................................................................................................................................................................................ | 6.5 |
Utilities........................................................................................................................................................................................................................................................................................................................................................................................................................................................................................................................................................................................................................................................................................................................................................................................................................................................................................................................................................................................................................................ | 2.2 |
Materials........................................................................................................................................................................................................................................................................................................................................................................................................................................................................................................................................................................................................................................................................................................................................................................................................................................................................................................................................................................................................................................ | 1.5 |
Consumer Staples........................................................................................................................................................................................................................................................................................................................................................................................................................................................................................................................................................................................................................................................................................................................................................................................................................................................................................................................................................................................................................................ | 0.9 |
| Security | Percent of Total InvestmentsFootnote Reference(a) |
|---|
Apple, Inc......................................................................................................................................................................................................................................................................................................................................................................................................................................................................................................................................................................................................................................................................................................................................................................................................................................................................................................................................................................................................................................... | 7.2% |
Microsoft Corp......................................................................................................................................................................................................................................................................................................................................................................................................................................................................................................................................................................................................................................................................................................................................................................................................................................................................................................................................................................................................................................... | 6.9 |
NVIDIA Corp......................................................................................................................................................................................................................................................................................................................................................................................................................................................................................................................................................................................................................................................................................................................................................................................................................................................................................................................................................................................................................................... | 6.8 |
Amazon.com, Inc......................................................................................................................................................................................................................................................................................................................................................................................................................................................................................................................................................................................................................................................................................................................................................................................................................................................................................................................................................................................................................................... | 3.4 |
Alphabet, Inc., Class C, NVS........................................................................................................................................................................................................................................................................................................................................................................................................................................................................................................................................................................................................................................................................................................................................................................................................................................................................................................................................................................................................................................ | 2.4 |
Meta Platforms, Inc., Class A........................................................................................................................................................................................................................................................................................................................................................................................................................................................................................................................................................................................................................................................................................................................................................................................................................................................................................................................................................................................................................................ | 2.4 |
Eli Lilly & Co......................................................................................................................................................................................................................................................................................................................................................................................................................................................................................................................................................................................................................................................................................................................................................................................................................................................................................................................................................................................................................................... | 2.2 |
Tesla, Inc......................................................................................................................................................................................................................................................................................................................................................................................................................................................................................................................................................................................................................................................................................................................................................................................................................................................................................................................................................................................................................................... | 2.1 |
Broadcom, Inc......................................................................................................................................................................................................................................................................................................................................................................................................................................................................................................................................................................................................................................................................................................................................................................................................................................................................................................................................................................................................................................... | 1.8 |
Visa, Inc., Class A........................................................................................................................................................................................................................................................................................................................................................................................................................................................................................................................................................................................................................................................................................................................................................................................................................................................................................................................................................................................................................................ | 1.6 |
⁽ᵃ⁾ Excludes money market funds.
Additional information
If you wish to view additional information about the Fund, including but not limited to financial statements, the Fund’s prospectus, and proxy voting policies and procedures, please visit blackrock.com/fundreports. For proxy voting records, visit blackrock.com/proxyrecords.
Householding
Householding is an option available to certain fund investors. Householding is a method of delivery, based on the preference of the individual investor, in which a single copy of certain shareholder documents can be delivered to investors who share the same address, even if their accounts are registered under different names. Please contact your broker-dealer if you are interested in enrolling in householding and receiving a single copy of prospectuses and other shareholder documents, or if you are currently enrolled in householding and wish to change your householding status.
The Fund is not sponsored, endorsed, issued, sold or promoted by MSCI Inc. and its affiliates, nor does this company make any representation regarding the advisability of investing in the Fund. BlackRock is not affiliated with the company listed above.
©2024 BlackRock, Inc. or its affiliates. All rights reserved. iSHARES and BLACKROCK are registered trademarks of BlackRock, Inc. or its affiliates. All other trademarks are those of their respective owners.
iShares Paris-Aligned Climate MSCI USA ETF
Annual Shareholder Report — August 31, 2024
iShares ESG Advanced MSCI USA ETF
Annual Shareholder Report — August 31, 2024
This annual shareholder report contains important information about iShares ESG Advanced MSCI USA ETF (the “Fund”) for the period of September 1, 2023 to August 31, 2024. You can find additional information about the Fund at blackrock.com/fundreports. You can also request this information by contacting us at 1-800-iShares (1-800-474-2737).
What were the Fund costs for the last year?
(based on a hypothetical $10,000 investment)
| Fund name | Costs of a $10,000 investment | Costs paid as a percentage of a $10,000 investment |
|---|
| iShares ESG Advanced MSCI USA ETF | $12 | 0.10% |
How did the Fund perform last year?
U.S. stocks registered solid gains during the reporting period, as investor confidence increased over hopes of interest rate cuts and robust corporate earnings.
The United States experienced stronger-than-expected economic growth driven by robust consumer spending and business investment. Meanwhile, inflation measures continued to trend downward, prompting comments by U.S. Federal Reserve Bank officials that indicated interest rate cuts would be forthcoming.
Powered by artificial intelligence (“AI”), information technology stocks led the market for the majority of the reporting period. However, market sentiment pivoted toward more defensive sectors late in the reporting period amid growing uncertainty surrounding economic growth, geopolitics, and the upcoming U.S. presidential election.
While environmental, social, and governance (“ESG”) issues continued to feature in headlines, investor interest in sustainable investing ETFs was mixed during the reporting period in the United States.
What contributed to performance?
For the reporting period, the largest contributor to the Fund’s performance was the information technology sector, particularly semiconductor manufacturers that provide the backbone for the complex calculations required for AI algorithms. The financials sector, most notably financial services, outperformed due to significant merger and acquisition activity; banks consolidated to manage rising costs and regulatory pressures, while digital transformation spurred acquisitions in financial technology. In the industrials sector, stocks were aided by federal and corporate investments in infrastructure.
What detracted from performance?
There were no meaningful detractors to the Fund’s performance during the reporting period.
The views expressed reflect the opinions of BlackRock as of the date of this report and are subject to change based on changes in market, economic or other conditions. These views are not intended to be a forecast of future events and are no guarantee of future results.
Cumulative performance: June 16, 2020 through August 31, 2024
Initial investment of $10,000
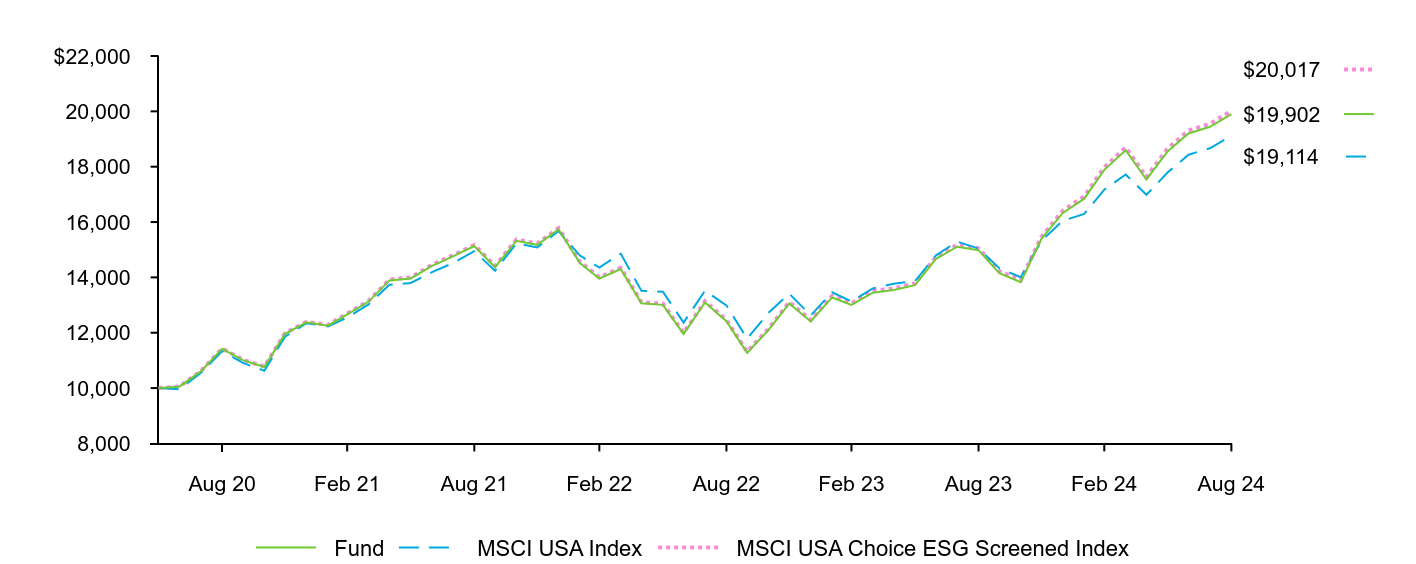
| Fund | MSCI USA Index | MSCI USA Choice ESG Screened Index |
|---|
| May 20 | $10,000 | $10,000 | $10,000 |
| Jun 20 | $10,051 | $9,952 | $10,056 |
| Jul 20 | $10,602 | $10,542 | $10,611 |
| Aug 20 | $11,420 | $11,334 | $11,432 |
| Sep 20 | $11,012 | $10,911 | $11,025 |
| Oct 20 | $10,763 | $10,627 | $10,778 |
| Nov 20 | $11,962 | $11,857 | $11,980 |
| Dec 20 | $12,375 | $12,346 | $12,395 |
| Jan 21 | $12,256 | $12,231 | $12,279 |
| Feb 21 | $12,667 | $12,550 | $12,694 |
| Mar 21 | $13,126 | $13,023 | $13,153 |
| Apr 21 | $13,891 | $13,731 | $13,926 |
| May 21 | $13,963 | $13,797 | $13,996 |
| Jun 21 | $14,411 | $14,182 | $14,449 |
| Jul 21 | $14,757 | $14,517 | $14,799 |
| Aug 21 | $15,134 | $14,945 | $15,177 |
| Sep 21 | $14,369 | $14,240 | $14,410 |
| Oct 21 | $15,325 | $15,233 | $15,371 |
| Nov 21 | $15,177 | $15,079 | $15,222 |
| Dec 21 | $15,729 | $15,675 | $15,780 |
| Jan 22 | $14,515 | $14,788 | $14,562 |
| Feb 22 | $13,959 | $14,355 | $14,004 |
| Mar 22 | $14,300 | $14,859 | $14,346 |
| Apr 22 | $13,062 | $13,512 | $13,105 |
| May 22 | $13,007 | $13,483 | $13,051 |
| Jun 22 | $11,957 | $12,367 | $11,998 |
| Jul 22 | $13,094 | $13,520 | $13,140 |
| Aug 22 | $12,418 | $12,990 | $12,463 |
| Sep 22 | $11,274 | $11,786 | $11,315 |
| Oct 22 | $12,103 | $12,721 | $12,147 |
| Nov 22 | $13,061 | $13,413 | $13,112 |
| Dec 22 | $12,408 | $12,625 | $12,457 |
| Jan 23 | $13,275 | $13,463 | $13,329 |
| Feb 23 | $13,006 | $13,134 | $13,060 |
| Mar 23 | $13,449 | $13,601 | $13,506 |
| Apr 23 | $13,541 | $13,773 | $13,599 |
| May 23 | $13,721 | $13,863 | $13,780 |
| Jun 23 | $14,662 | $14,787 | $14,727 |
| Jul 23 | $15,110 | $15,296 | $15,179 |
| Aug 23 | $14,983 | $15,038 | $15,053 |
| Sep 23 | $14,152 | $14,333 | $14,227 |
| Oct 23 | $13,830 | $14,004 | $13,905 |
| Nov 23 | $15,393 | $15,324 | $15,468 |
| Dec 23 | $16,330 | $16,046 | $16,411 |
| Jan 24 | $16,844 | $16,296 | $16,929 |
| Feb 24 | $17,886 | $17,170 | $17,979 |
| Mar 24 | $18,598 | $17,716 | $18,697 |
| Apr 24 | $17,539 | $16,985 | $17,633 |
| May 24 | $18,563 | $17,796 | $18,665 |
| Jun 24 | $19,201 | $18,433 | $19,307 |
| Jul 24 | $19,441 | $18,664 | $19,551 |
| Aug 24 | $19,902 | $19,114 | $20,017 |
See “Average annual total returns” for additional information on fund performance.
Average annual total returns
| ........................................................................................................................................................................................................................................................................................................................................................................................................................................................................................................................................................................................................................................................................................................................................................................................................................................................................................................................................................................................................................................ | 1 Year | Since Fund Inception |
|---|
Fund NAV........................................................................................................................................................................................................................................................................................................................................................................................................................................................................................................................................................................................................................................................................................................................................................................................................................................................................................................................................................................................................................................ | 32.83% | 17.76% |
Fund Market........................................................................................................................................................................................................................................................................................................................................................................................................................................................................................................................................................................................................................................................................................................................................................................................................................................................................................................................................................................................................................................ | 33.05 | 17.79 |
MSCI USA Index........................................................................................................................................................................................................................................................................................................................................................................................................................................................................................................................................................................................................................................................................................................................................................................................................................................................................................................................................................................................................................................ | 27.10 | 16.64 |
MSCI USA Choice ESG Screened Index........................................................................................................................................................................................................................................................................................................................................................................................................................................................................................................................................................................................................................................................................................................................................................................................................................................................................................................................................................................................................................................ | 32.97 | 17.93 |
Net Assets........................................................................................................................................................................................................................................................................................................................................................................................................................................................................................................................................................................................................................................................................................................................................................................................................................................................................................................................................................................................................................................ | $1,136,965,766 |
Number of Portfolio Holdings........................................................................................................................................................................................................................................................................................................................................................................................................................................................................................................................................................................................................................................................................................................................................................................................................................................................................................................................................................................................................................................ | 351 |
Net Investment Advisory Fees........................................................................................................................................................................................................................................................................................................................................................................................................................................................................................................................................................................................................................................................................................................................................................................................................................................................................................................................................................................................................................................ | $907,149 |
Portfolio Turnover Rate........................................................................................................................................................................................................................................................................................................................................................................................................................................................................................................................................................................................................................................................................................................................................................................................................................................................................................................................................................................................................................................ | 19% |
The Fund has added the MSCI USA Index in response to new regulatory requirements.
The inception date of the Fund was June 16, 2020. The first day of secondary market trading was June 18, 2020.
Past performance is not an indication of future results.Performance results do not reflect the deduction of taxes that a shareholder would pay on fund distributions or on the redemption or sale of fund shares. Visit iShares.com for more recent performance information.
What did the Fund invest in?
| Sector | Percent of Total InvestmentsFootnote Reference(a) |
|---|
Information Technology........................................................................................................................................................................................................................................................................................................................................................................................................................................................................................................................................................................................................................................................................................................................................................................................................................................................................................................................................................................................................................................ | 38.7% |
Financials........................................................................................................................................................................................................................................................................................................................................................................................................................................................................................................................................................................................................................................................................................................................................................................................................................................................................................................................................................................................................................................ | 18.8 |
Industrials........................................................................................................................................................................................................................................................................................................................................................................................................................................................................................................................................................................................................................................................................................................................................................................................................................................................................................................................................................................................................................................ | 11.1 |
Health Care........................................................................................................................................................................................................................................................................................................................................................................................................................................................................................................................................................................................................................................................................................................................................................................................................................................................................................................................................................................................................................................ | 9.6 |
Consumer Discretionary........................................................................................................................................................................................................................................................................................................................................................................................................................................................................................................................................................................................................................................................................................................................................................................................................................................................................................................................................................................................................................................ | 8.3 |
Real Estate........................................................................................................................................................................................................................................................................................................................................................................................................................................................................................................................................................................................................................................................................................................................................................................................................................................................................................................................................................................................................................................ | 4.7 |
Materials........................................................................................................................................................................................................................................................................................................................................................................................................................................................................................................................................................................................................................................................................................................................................................................................................................................................................................................................................................................................................................................ | 4.2 |
Communication Services........................................................................................................................................................................................................................................................................................................................................................................................................................................................................................................................................................................................................................................................................................................................................................................................................................................................................................................................................................................................................................................ | 2.5 |
Consumer Staples........................................................................................................................................................................................................................................................................................................................................................................................................................................................................................................................................................................................................................................................................................................................................................................................................................................................................................................................................................................................................................................ | 2.0 |
Utilities........................................................................................................................................................................................................................................................................................................................................................................................................................................................................................................................................................................................................................................................................................................................................................................................................................................................................................................................................................................................................................................ | 0.1 |
| Security | Percent of Total InvestmentsFootnote Reference(a) |
|---|
NVIDIA Corp......................................................................................................................................................................................................................................................................................................................................................................................................................................................................................................................................................................................................................................................................................................................................................................................................................................................................................................................................................................................................................................... | 15.0% |
Broadcom, Inc......................................................................................................................................................................................................................................................................................................................................................................................................................................................................................................................................................................................................................................................................................................................................................................................................................................................................................................................................................................................................................................... | 3.7 |
Visa, Inc., Class A........................................................................................................................................................................................................................................................................................................................................................................................................................................................................................................................................................................................................................................................................................................................................................................................................................................................................................................................................................................................................................................ | 2.2 |
Mastercard, Inc., Class A........................................................................................................................................................................................................................................................................................................................................................................................................................................................................................................................................................................................................................................................................................................................................................................................................................................................................................................................................................................................................................................ | 2.1 |
Home Depot, Inc. (The)........................................................................................................................................................................................................................................................................................................................................................................................................................................................................................................................................................................................................................................................................................................................................................................................................................................................................................................................................................................................................................................ | 1.9 |
Adobe, Inc......................................................................................................................................................................................................................................................................................................................................................................................................................................................................................................................................................................................................................................................................................................................................................................................................................................................................................................................................................................................................................................... | 1.3 |
Advanced Micro Devices, Inc......................................................................................................................................................................................................................................................................................................................................................................................................................................................................................................................................................................................................................................................................................................................................................................................................................................................................................................................................................................................................................................... | 1.2 |
Linde PLC........................................................................................................................................................................................................................................................................................................................................................................................................................................................................................................................................................................................................................................................................................................................................................................................................................................................................................................................................................................................................................................ | 1.2 |
QUALCOMM, Inc......................................................................................................................................................................................................................................................................................................................................................................................................................................................................................................................................................................................................................................................................................................................................................................................................................................................................................................................................................................................................................................... | 1.0 |
Texas Instruments, Inc......................................................................................................................................................................................................................................................................................................................................................................................................................................................................................................................................................................................................................................................................................................................................................................................................................................................................................................................................................................................................................................... | 1.0 |
⁽ᵃ⁾ Excludes money market funds.
Additional information
If you wish to view additional information about the Fund, including but not limited to financial statements, the Fund’s prospectus, and proxy voting policies and procedures, please visit blackrock.com/fundreports. For proxy voting records, visit blackrock.com/proxyrecords.
Householding
Householding is an option available to certain fund investors. Householding is a method of delivery, based on the preference of the individual investor, in which a single copy of certain shareholder documents can be delivered to investors who share the same address, even if their accounts are registered under different names. Please contact your broker-dealer if you are interested in enrolling in householding and receiving a single copy of prospectuses and other shareholder documents, or if you are currently enrolled in householding and wish to change your householding status.
The Fund is not sponsored, endorsed, issued, sold or promoted by MSCI Inc. and its affiliates, nor does this company make any representation regarding the advisability of investing in the Fund. BlackRock is not affiliated with the company listed above.
©2024 BlackRock, Inc. or its affiliates. All rights reserved. iSHARES and BLACKROCK are registered trademarks of BlackRock, Inc. or its affiliates. All other trademarks are those of their respective owners.
iShares ESG Advanced MSCI USA ETF
Annual Shareholder Report — August 31, 2024
iShares Climate Conscious & Transition MSCI USA ETF
Annual Shareholder Report — August 31, 2024
This annual shareholder report contains important information about iShares Climate Conscious & Transition MSCI USA ETF (the “Fund”) for the period of September 1, 2023 to August 31, 2024. You can find additional information about the Fund at blackrock.com/fundreports. You can also request this information by contacting us at 1-800-iShares (1-800-474-2737).
What were the Fund costs for the last year?
(based on a hypothetical $10,000 investment)
| Fund name | Costs of a $10,000 investment | Costs paid as a percentage of a $10,000 investment |
|---|
| iShares Climate Conscious & Transition MSCI USA ETF | $9 | 0.08% |
How did the Fund perform last year?
U.S. stocks registered solid gains during the reporting period, as investor confidence increased over hopes of interest rate cuts and robust corporate earnings.
The United States experienced stronger-than-expected economic growth driven by robust consumer spending and business investment. Meanwhile, inflation measures continued to trend downward, prompting comments by U.S. Federal Reserve Bank officials that indicated interest rate cuts would be forthcoming.
Powered by artificial intelligence (“AI”), information technology stocks led the market for the majority of the reporting period. However, market sentiment pivoted toward more defensive sectors late in the reporting period amid growing uncertainty surrounding economic growth, geopolitics, and the upcoming U.S. presidential election.
While environmental, social, and governance (“ESG”) issues continued to feature in headlines, investor interest in sustainable investing ETFs was mixed during the reporting period in the United States.
What contributed to performance?
For the reporting period, the largest contributor to the Fund’s performance was the information technology sector, particularly semiconductor manufacturers that provide the backbone for the complex calculations required for AI algorithms. The financials sector, most notably financial services, outperformed due to significant merger and acquisition activity; banks consolidated to manage rising costs and regulatory pressures, while digital transformation spurred acquisitions in financial technology. Additionally, communication stocks aided performance, most notably among interactive media and services companies that have incorporated AI into their platforms.
What detracted from performance?
There were no meaningful detractors to the Fund’s performance during the reporting period.
The views expressed reflect the opinions of BlackRock as of the date of this report and are subject to change based on changes in market, economic or other conditions. These views are not intended to be a forecast of future events and are no guarantee of future results.
Cumulative performance: June 6, 2023 through August 31, 2024
Initial investment of $10,000
| Fund | MSCI USA Index | MSCI USA Extended Climate Action Index |
|---|
| May 23 | $10,000 | $10,000 | $10,000 |
| Jun 23 | $10,384 | $10,403 | $10,377 |
| Jul 23 | $10,786 | $10,761 | $10,781 |
| Aug 23 | $10,641 | $10,580 | $10,650 |
| Sep 23 | $10,150 | $10,083 | $10,146 |
| Oct 23 | $9,880 | $9,851 | $9,877 |
| Nov 23 | $10,811 | $10,780 | $10,804 |
| Dec 23 | $11,295 | $11,288 | $11,289 |
| Jan 24 | $11,534 | $11,464 | $11,528 |
| Feb 24 | $12,212 | $12,079 | $12,207 |
| Mar 24 | $12,579 | $12,463 | $12,575 |
| Apr 24 | $12,093 | $11,949 | $12,089 |
| May 24 | $12,658 | $12,520 | $12,656 |
| Jun 24 | $13,156 | $12,967 | $13,155 |
| Jul 24 | $13,278 | $13,130 | $13,295 |
| Aug 24 | $13,602 | $13,447 | $13,620 |
See “Average annual total returns” for additional information on fund performance.
Average annual total returns
| ........................................................................................................................................................................................................................................................................................................................................................................................................................................................................................................................................................................................................................................................................................................................................................................................................................................................................................................................................................................................................................................ | 1 Year | Since Fund Inception |
|---|
Fund NAV........................................................................................................................................................................................................................................................................................................................................................................................................................................................................................................................................................................................................................................................................................................................................................................................................................................................................................................................................................................................................................................ | 27.83% | 28.27% |
Fund Market........................................................................................................................................................................................................................................................................................................................................................................................................................................................................................................................................................................................................................................................................................................................................................................................................................................................................................................................................................................................................................................ | 27.67 | 28.28 |
MSCI USA Index........................................................................................................................................................................................................................................................................................................................................................................................................................................................................................................................................................................................................................................................................................................................................................................................................................................................................................................................................................................................................................................ | 27.10 | 27.09 |
MSCI USA Extended Climate Action Index........................................................................................................................................................................................................................................................................................................................................................................................................................................................................................................................................................................................................................................................................................................................................................................................................................................................................................................................................................................................................................................ | 27.89 | 28.41 |
Net Assets........................................................................................................................................................................................................................................................................................................................................................................................................................................................................................................................................................................................................................................................................................................................................................................................................................................................................................................................................................................................................................................ | $2,151,977,668 |
Number of Portfolio Holdings........................................................................................................................................................................................................................................................................................................................................................................................................................................................................................................................................................................................................................................................................................................................................................................................................................................................................................................................................................................................................................................ | 299 |
Net Investment Advisory Fees........................................................................................................................................................................................................................................................................................................................................................................................................................................................................................................................................................................................................................................................................................................................................................................................................................................................................................................................................................................................................................................ | $1,659,031 |
Portfolio Turnover Rate........................................................................................................................................................................................................................................................................................................................................................................................................................................................................................................................................................................................................................................................................................................................................................................................................................................................................................................................................................................................................................................ | 21% |
The Fund has added the MSCI USA Index in response to new regulatory requirements.
The inception date of the Fund was June 6, 2023. The first day of secondary market trading was June 8, 2023.
Past performance is not an indication of future results.Performance results do not reflect the deduction of taxes that a shareholder would pay on fund distributions or on the redemption or sale of fund shares. Visit iShares.com for more recent performance information.
What did the Fund invest in?
| Sector | Percent of Total InvestmentsFootnote Reference(a) |
|---|
Information Technology........................................................................................................................................................................................................................................................................................................................................................................................................................................................................................................................................................................................................................................................................................................................................................................................................................................................................................................................................................................................................................................ | 28.5% |
Health Care........................................................................................................................................................................................................................................................................................................................................................................................................................................................................................................................................................................................................................................................................................................................................................................................................................................................................................................................................................................................................................................ | 13.2 |
Financials........................................................................................................................................................................................................................................................................................................................................................................................................................................................................................................................................................................................................................................................................................................................................................................................................................................................................................................................................................................................................................................ | 13.1 |
Consumer Discretionary........................................................................................................................................................................................................................................................................................................................................................................................................................................................................................................................................................................................................................................................................................................................................................................................................................................................................................................................................................................................................................................ | 10.9 |
Communication Services........................................................................................................................................................................................................................................................................................................................................................................................................................................................................................................................................................................................................................................................................................................................................................................................................................................................................................................................................................................................................................................ | 10.9 |
Industrials........................................................................................................................................................................................................................................................................................................................................................................................................................................................................................................................................................................................................................................................................................................................................................................................................................................................................................................................................................................................................................................ | 7.1 |
Consumer Staples........................................................................................................................................................................................................................................................................................................................................................................................................................................................................................................................................................................................................................................................................................................................................................................................................................................................................................................................................................................................................................................ | 5.5 |
Energy........................................................................................................................................................................................................................................................................................................................................................................................................................................................................................................................................................................................................................................................................................................................................................................................................................................................................................................................................................................................................................................ | 3.8 |
Materials........................................................................................................................................................................................................................................................................................................................................................................................................................................................................................................................................................................................................................................................................................................................................................................................................................................................................................................................................................................................................................................ | 2.4 |
Utilities........................................................................................................................................................................................................................................................................................................................................................................................................................................................................................................................................................................................................................................................................................................................................................................................................................................................................................................................................................................................................................................ | 2.3 |
Real Estate........................................................................................................................................................................................................................................................................................................................................................................................................................................................................................................................................................................................................................................................................................................................................................................................................................................................................................................................................................................................................................................ | 2.3 |
| Security | Percent of Total InvestmentsFootnote Reference(a) |
|---|
NVIDIA Corp......................................................................................................................................................................................................................................................................................................................................................................................................................................................................................................................................................................................................................................................................................................................................................................................................................................................................................................................................................................................................................................... | 5.8% |
Apple, Inc......................................................................................................................................................................................................................................................................................................................................................................................................................................................................................................................................................................................................................................................................................................................................................................................................................................................................................................................................................................................................................................... | 5.6 |
Amazon.com, Inc......................................................................................................................................................................................................................................................................................................................................................................................................................................................................................................................................................................................................................................................................................................................................................................................................................................................................................................................................................................................................................................... | 4.6 |
Microsoft Corp......................................................................................................................................................................................................................................................................................................................................................................................................................................................................................................................................................................................................................................................................................................................................................................................................................................................................................................................................................................................................................................... | 4.6 |
Meta Platforms, Inc., Class A........................................................................................................................................................................................................................................................................................................................................................................................................................................................................................................................................................................................................................................................................................................................................................................................................................................................................................................................................................................................................................................ | 3.3 |
Alphabet, Inc., Class A........................................................................................................................................................................................................................................................................................................................................................................................................................................................................................................................................................................................................................................................................................................................................................................................................................................................................................................................................................................................................................................ | 2.3 |
Eli Lilly & Co......................................................................................................................................................................................................................................................................................................................................................................................................................................................................................................................................................................................................................................................................................................................................................................................................................................................................................................................................................................................................................................... | 2.2 |
Broadcom, Inc......................................................................................................................................................................................................................................................................................................................................................................................................................................................................................................................................................................................................................................................................................................................................................................................................................................................................................................................................................................................................................................... | 2.1 |
Alphabet, Inc., Class C, NVS........................................................................................................................................................................................................................................................................................................................................................................................................................................................................................................................................................................................................................................................................................................................................................................................................................................................................................................................................................................................................................................ | 2.0 |
JPMorgan Chase & Co......................................................................................................................................................................................................................................................................................................................................................................................................................................................................................................................................................................................................................................................................................................................................................................................................................................................................................................................................................................................................................................... | 1.9 |
⁽ᵃ⁾ Excludes money market funds.
Additional information
If you wish to view additional information about the Fund, including but not limited to financial statements, the Fund’s prospectus, and proxy voting policies and procedures, please visit blackrock.com/fundreports. For proxy voting records, visit blackrock.com/proxyrecords.
Householding
Householding is an option available to certain fund investors. Householding is a method of delivery, based on the preference of the individual investor, in which a single copy of certain shareholder documents can be delivered to investors who share the same address, even if their accounts are registered under different names. Please contact your broker-dealer if you are interested in enrolling in householding and receiving a single copy of prospectuses and other shareholder documents, or if you are currently enrolled in householding and wish to change your householding status.
The Fund is not sponsored, endorsed, issued, sold or promoted by MSCI Inc. and its affiliates, nor does this company make any representation regarding the advisability of investing in the Fund. BlackRock is not affiliated with the company listed above.
©2024 BlackRock, Inc. or its affiliates. All rights reserved. iSHARES and BLACKROCK are registered trademarks of BlackRock, Inc. or its affiliates. All other trademarks are those of their respective owners.
iShares Climate Conscious & Transition MSCI USA ETF
Annual Shareholder Report — August 31, 2024
(b) Not Applicable
Item 2 – Code of Ethics – The registrant has adopted a code of ethics, as of the end of the period covered by this report, applicable to the registrant’s principal executive officer, principal financial officer, principal accounting officer or controller, or persons performing similar functions. During the period covered by this report, the registrant has not amended the code of ethics and there have been no waivers granted under the code of ethics. The registrant undertakes to provide a copy of the code of ethics to any person upon request, without charge, by calling 1-800-474-2737.
Item 3 – Audit Committee Financial Expert – The registrant’s board of trustees (the “board of trustees”), has determined that (i) the registrant has the following audit committee financial experts serving on its audit committee and (ii) each audit committee financial expert is independent:
Richard L. Fagnani
Madhav V. Rajan
Under applicable securities laws, a person determined to be an audit committee financial expert will not be deemed an “expert” for any purpose, including without limitation for the purposes of Section 11 of the Securities Act of 1933, as a result of being designated or identified as an audit committee financial expert. The designation or identification of a person as an audit committee financial expert does not impose on such person any duties, obligations, or liabilities greater than the duties, obligations, and liabilities imposed on such person as a member of the audit committee and board of trustees in the absence of such designation or identification. The designation or identification of a person as an audit committee financial expert does not affect the duties, obligations, or liability of any other member of the audit committee or board of trustees.
Item 4 – Principal Accountant Fees and Services
The principal accountant fees disclosed in items 4(a), 4(b), 4(c), 4(d) and 4(g) are for the eight series of the registrant for which the fiscal year-end is August 31, 2024 (the “Funds”), and whose annual financial statements are reported in Item 1.
(a) Audit Fees – The aggregate fees billed for each of the last two fiscal years for professional services rendered by the principal accountant for the audit of the Funds’ annual financial statements or services that are normally provided by the accountant in connection with statutory and regulatory filings or engagements for those fiscal years were $102,500 for the fiscal year ended August 31, 2023 and $106,400 for the fiscal year ended August 31, 2024.
(b) Audit-Related Fees – There were no fees billed for the fiscal years ended August 31, 2023 and August 31, 2024 for assurance and related services by the principal accountant that were reasonably related to the performance of the audit of the Funds financial statements and are not reported under (a) of this Item.
(c) Tax Fees – The aggregate fees billed in each of the last two fiscal years for professional services rendered by the principal accountant for tax compliance, tax advice and tax planning for the Funds were $77,600 for the fiscal year ended August 31, 2023 and $77,600 for the fiscal year ended August 31, 2024. These services related to the review of the Funds’ tax returns and excise tax calculations.
(d) All Other Fees – There were no other fees billed in each of the fiscal years ended August 31, 2023 and August 31, 2024 for products and services provided by the principal accountant, other than the services reported in (a) through (c) of this Item.
(e)(1) Audit Committee Pre-Approval Policies and Procedures:
The registrant’s audit committee charter, as amended, provides that the audit committee is responsible for the approval, prior to appointment, of the engagement of the principal accountant to annually audit and provide their opinion on the registrant’s financial statements. The audit committee must also approve, prior to appointment, the engagement of the principal accountant to provide non-audit services to the registrant or to any entity controlling, controlled by or under common control with the registrant’s investment adviser (“Adviser Affiliate”) that provides ongoing services to the registrant, if the engagement relates directly to the operations and financial reporting of the registrant.
(e)(2) None of the services described in each of Items 4(b) through (d) were approved by the audit committee pursuant to paragraph (c)(7)(i)(C) of Rule 2-01 of Regulation S-X.
(f) Not Applicable
(g) The aggregate non-audit fees billed by the registrant’s principal accountant for services rendered to the Funds, and rendered to the registrant’s investment adviser, and any Adviser Affiliate that provides ongoing services to the registrant for the last two fiscal years were $77,600 for the fiscal year ended August 31, 2023 and $77,600 for the fiscal year ended August 31, 2024.
(h) The registrant’s audit committee has considered whether the provision of non-audit services rendered to the registrant’s investment adviser and any Adviser Affiliate that provides ongoing services to the registrant that were not pre-approved pursuant to paragraph (c)(7)(ii) of Rule 2-01 of Regulation S-X, if any, is compatible with maintaining the principal accountant’s independence, and has determined that the provision of these services, if any, does not compromise the principal accountant’s independence.
(i) Not Applicable
(j) Not Applicable
Item 5 – Audit Committee of Listed Registrant
(a) The following individuals are members of the registrant’s separately designated standing Committee established in accordance with Section 3(a)(58)(A) of the Securities Exchange Act of 1934 (15 U.S.C. 78c(a)(58)(A)):
Richard L. Fagnani
Laura F. Fergerson
Cecilia H. Herbert
Madhav V. Rajan
(b) Not Applicable
Item 6 – Investments
(a) The registrant’s Schedule of Investments is included as part of the Financial Statements and Financial Highlights for Open-End Management Investment Companies filed under Item 7 of this Form.
(b) Not Applicable due to no such divestments during the semi-annual period covered since the previous Form N-CSR filing.
Item 7 – Financial Statements and Financial Highlights for Open-End Management Investment Companies
(a) The registrant’s Financial Statements are attached herewith.
(b) The registrant’s Financial Highlights are attached herewith.
2024
Annual
Financial
Statements
iShares
Trust
iShares
ESG
Aware
MSCI
USA
ETF
|
ESGU
|
NASDAQ
iShares
ESG
Aware
MSCI
USA
Growth
ETF
|
EGUS
|
Cboe
BZX
iShares
ESG
Aware
MSCI
USA
Small-Cap
ETF
|
ESML
|
Cboe
BZX
iShares
ESG
Aware
MSCI
USA
Value
ETF
|
EVUS
|
Cboe
BZX
iShares
ESG
MSCI
USA
Leaders
ETF
|
SUSL
|
NASDAQ
iShares
Paris-Aligned
Climate
MSCI
USA
ETF
|
PABU
|
NASDAQ
Schedules
of
Investments
.................................................................................................
3
Statements
of
Assets
and
Liabilities
...........................................................................................
39
Statements
of
Operations
.................................................................................................
41
Statements
of
Changes
in
Net
Assets
..........................................................................................
43
Financial
Highlights
.....................................................................................................
46
Notes
to
Financial
Statements
...............................................................................................
52
Report
of
Independent
Registered
Public
Accounting
Firm
..............................................................................
61
Important
Tax
Information
(unaudited)
.................................................................................................
62
Additional
Information
....................................................................................................
63
Board
Review
and
Approval
of
Investment
Advisory
Contract
...........................................................................
64
Glossary
of
Terms
Used
in
this
Report
..........................................................................................
68
iShares
®
ESG
Aware
MSCI
USA
ETF
Schedule
of
Investments
August
31,
2024
(Percentages
shown
are
based
on
Net
Assets)
Security
Shares
Value
a
Common
Stocks
Aerospace
&
Defense
—
1
.5
%
Axon
Enterprise,
Inc.
(a)
.....................
48,734
$
17,786,448
GE
Aerospace
...........................
340,359
59,433,488
Howmet
Aerospace,
Inc.
....................
133,921
12,944,804
Huntington
Ingalls
Industries,
Inc.
..............
46,535
13,158,702
Northrop
Grumman
Corp.
...................
52,732
27,589,910
RTX
Corp.
.............................
480,547
59,270,667
190,184,019
a
Air
Freight
&
Logistics
—
0
.7
%
CH
Robinson
Worldwide,
Inc.
................
251,254
26,007,301
Expeditors
International
of
Washington,
Inc.
.......
285,651
35,252,190
FedEx
Corp.
............................
48,448
14,474,809
United
Parcel
Service,
Inc.
,
Class
B
............
160,027
20,571,471
96,305,771
a
Automobiles
—
1
.2
%
Tesla,
Inc.
(a)
.............................
751,959
161,001,942
a
Banks
—
3
.1
%
Bank
of
America
Corp.
.....................
1,878,242
76,538,362
Citigroup,
Inc.
...........................
667,913
41,838,070
Huntington
Bancshares,
Inc.
.................
1,292,041
19,341,854
JPMorgan
Chase
&
Co.
....................
740,189
166,394,487
PNC
Financial
Services
Group,
Inc.
(The)
........
234,813
43,461,538
Truist
Financial
Corp.
......................
374,279
16,640,444
U.S.
Bancorp
...........................
469,056
22,153,515
Wells
Fargo
&
Co.
........................
228,132
13,338,878
399,707,148
a
Beverages
—
1
.8
%
Coca-Cola
Co.
(The)
......................
1,871,570
135,632,678
Keurig
Dr
Pepper,
Inc.
.....................
364,844
13,356,939
Molson
Coors
Beverage
Co.
,
Class
B
...........
409,305
22,090,191
PepsiCo,
Inc.
...........................
323,983
56,010,181
227,089,989
a
Biotechnology
—
2
.3
%
AbbVie,
Inc.
............................
336,188
65,997,066
Alnylam
Pharmaceuticals,
Inc.
(a)
...............
45,615
11,982,604
Amgen,
Inc.
............................
175,152
58,470,992
Biogen,
Inc.
(a)
(b)
..........................
62,323
12,761,258
Gilead
Sciences,
Inc.
......................
737,780
58,284,620
Moderna,
Inc.
(a)
..........................
147,306
11,401,484
Regeneron
Pharmaceuticals,
Inc.
(a)
.............
27,434
32,500,786
Vertex
Pharmaceuticals,
Inc.
(a)
................
92,387
45,813,790
297,212,600
a
Broadline
Retail
—
3
.5
%
Amazon.com,
Inc.
(a)
.......................
2,408,091
429,844,244
MercadoLibre,
Inc.
(a)
.......................
12,352
25,465,624
455,309,868
a
Building
Products
—
1
.1
%
Carrier
Global
Corp.
.......................
314,025
22,854,739
Fortune
Brands
Innovations,
Inc.
..............
182,161
14,465,405
Johnson
Controls
International
PLC
............
282,162
20,555,502
Lennox
International,
Inc.
...................
28,840
17,021,080
Owens
Corning
..........................
79,710
13,449,468
Trane
Technologies
PLC
....................
155,560
56,259,830
144,606,024
a
Capital
Markets
—
2
.8
%
Bank
of
New
York
Mellon
Corp.
(The)
...........
722,594
49,295,363
BlackRock,
Inc.
(c)
.........................
15,227
13,731,861
Security
Shares
Value
a
Capital
Markets
(continued)
Charles
Schwab
Corp.
(The)
.................
330,079
$
21,488,143
FactSet
Research
Systems,
Inc.
...............
44,016
18,611,725
Goldman
Sachs
Group,
Inc.
(The)
.............
91,272
46,571,538
KKR
&
Co.,
Inc.
..........................
112,505
13,924,744
Moody's
Corp.
...........................
84,301
41,116,970
Morgan
Stanley
..........................
539,573
55,905,158
Nasdaq,
Inc.
............................
351,183
25,313,271
Northern
Trust
Corp.
.......................
148,779
13,570,133
S&P
Global,
Inc.
.........................
126,360
64,853,006
364,381,912
a
Chemicals
—
1
.1
%
Ecolab,
Inc.
............................
219,389
55,544,907
International
Flavors
&
Fragrances,
Inc.
..........
130,832
13,605,220
Linde
PLC
.............................
103,665
49,577,786
PPG
Industries,
Inc.
.......................
230,997
29,967,241
148,695,154
a
Commercial
Services
&
Supplies
—
0
.2
%
Veralto
Corp.
............................
246,428
27,705,900
a
Communications
Equipment
—
0
.7
%
Arista
Networks,
Inc.
(a)
.....................
73,695
26,042,339
Cisco
Systems,
Inc.
.......................
1,116,086
56,406,986
Juniper
Networks,
Inc.
.....................
353,184
13,731,794
96,181,119
a
Construction
&
Engineering
—
0
.2
%
EMCOR
Group,
Inc.
.......................
34,868
13,705,216
Quanta
Services,
Inc.
(b)
.....................
47,991
13,203,764
26,908,980
a
Construction
Materials
—
0
.4
%
CRH
PLC
..............................
538,351
48,866,120
a
Consumer
Finance
—
0
.9
%
American
Express
Co.
.....................
205,233
53,083,515
Capital
One
Financial
Corp.
..................
90,502
13,297,459
Discover
Financial
Services
..................
183,291
25,424,295
Synchrony
Financial
.......................
467,793
23,511,276
115,316,545
a
Consumer
Staples
Distribution
&
Retail
—
1
.4
%
Costco
Wholesale
Corp.
....................
117,055
104,457,541
Dollar
Tree,
Inc.
(a)
.........................
129,113
10,908,757
Kroger
Co.
(The)
.........................
522,829
27,819,731
Sysco
Corp.
............................
167,324
13,046,252
Target
Corp.
............................
206,583
31,735,281
187,967,562
a
Containers
&
Packaging
—
0
.2
%
Ball
Corp.
..............................
202,352
12,912,081
International
Paper
Co.
.....................
269,907
13,068,897
25,980,978
a
Distributors
—
0
.4
%
LKQ
Corp.
.............................
813,744
33,843,613
Pool
Corp.
.............................
37,003
13,010,995
46,854,608
a
Diversified
Telecommunication
Services
—
0
.5
%
AT&T,
Inc.
..............................
969,599
19,295,020
Verizon
Communications,
Inc.
................
1,209,699
50,541,224
69,836,244
a
Schedule
of
Investments
(continued)
August
31,
2024
iShares
®
ESG
Aware
MSCI
USA
ETF
(Percentages
shown
are
based
on
Net
Assets)
2024
iShares
Annual
Financial
Statements
Security
Shares
Value
a
Electric
Utilities
—
1
.0
%
Constellation
Energy
Corp.
..................
67,149
$
13,208,208
Edison
International
.......................
174,521
15,188,563
Eversource
Energy
.......................
215,133
14,527,931
Exelon
Corp.
............................
563,930
21,480,094
NextEra
Energy,
Inc.
......................
731,581
58,899,586
123,304,382
a
Electrical
Equipment
—
0
.4
%
Eaton
Corp.
PLC
.........................
72,437
22,233,088
GE
Vernova,
Inc.
(a)
........................
69,603
13,990,203
Hubbell,
Inc.
............................
34,528
13,808,438
50,031,729
a
Electronic
Equipment,
Instruments
&
Components
—
0
.3
%
Keysight
Technologies,
Inc.
(a)
.................
181,625
27,992,045
Trimble,
Inc.
(a)
...........................
228,328
12,943,914
40,935,959
a
Energy
Equipment
&
Services
—
0
.2
%
Baker
Hughes
Co.
,
Class
A
..................
460,492
16,195,504
Schlumberger
N.V.
........................
314,249
13,823,813
30,019,317
a
Entertainment
—
1
.1
%
Electronic
Arts,
Inc.
.......................
141,462
21,476,761
Netflix,
Inc.
(a)
............................
98,288
68,934,289
Walt
Disney
Co.
(The)
.....................
551,377
49,833,453
140,244,503
a
Financial
Services
—
2
.7
%
Berkshire
Hathaway,
Inc.
,
Class
B
(a)
............
117,522
55,931,070
Fidelity
National
Information
Services,
Inc.
........
195,092
16,085,335
Fiserv,
Inc.
(a)
............................
79,298
13,845,431
Mastercard,
Inc.
,
Class
A
....................
245,393
118,608,253
PayPal
Holdings,
Inc.
(a)
.....................
223,242
16,169,418
Visa,
Inc.
,
Class
A
........................
458,193
126,630,800
347,270,307
a
Food
Products
—
1
.7
%
Archer-Daniels-Midland
Co.
..................
217,029
13,236,599
Bunge
Global
SA
.........................
268,768
27,247,700
Campbell
Soup
Co.
.......................
265,128
13,182,164
General
Mills,
Inc.
........................
747,923
54,067,354
Hormel
Foods
Corp.
.......................
396,277
12,898,816
Kellanova
..............................
810,963
65,371,727
Kraft
Heinz
Co.
(The)
......................
712,836
25,255,780
McCormick
&
Co.,
Inc.
,
NVS
.................
173,605
13,893,608
225,153,748
a
Ground
Transportation
—
0
.8
%
JB
Hunt
Transport
Services,
Inc.
..............
76,542
13,257,074
Old
Dominion
Freight
Line,
Inc.
...............
64,478
12,431,358
Uber
Technologies,
Inc.
(a)
...................
432,124
31,601,228
Union
Pacific
Corp.
.......................
168,806
43,229,529
100,519,189
a
Health
Care
Equipment
&
Supplies
—
1
.7
%
Cooper
Companies,
Inc.
(The)
(a)
...............
230,907
24,413,797
Dexcom,
Inc.
(a)
..........................
175,796
12,189,695
Edwards
Lifesciences
Corp.
(a)
................
488,727
34,191,341
Hologic,
Inc.
(a)
(b)
..........................
163,676
13,297,038
IDEXX
Laboratories,
Inc.
(a)
...................
73,042
35,157,306
Intuitive
Surgical,
Inc.
(a)
.....................
83,391
41,080,908
STERIS
PLC
............................
91,450
22,048,595
Stryker
Corp.
...........................
36,869
13,288,325
Teleflex,
Inc.
(b)
...........................
54,030
13,246,535
Security
Shares
Value
a
Health
Care
Equipment
&
Supplies
(continued)
Zimmer
Biomet
Holdings,
Inc.
................
114,717
$
13,245,225
222,158,765
a
Health
Care
Providers
&
Services
—
3
.2
%
Cardinal
Health,
Inc.
.......................
173,523
19,559,512
Cencora,
Inc.
...........................
125,049
29,957,989
Centene
Corp.
(a)
.........................
168,891
13,313,677
Cigna
Group
(The)
........................
115,676
41,852,734
DaVita,
Inc.
(a)
(b)
..........................
87,964
13,275,527
Elevance
Health,
Inc.
......................
114,158
63,573,449
HCA
Healthcare,
Inc.
......................
52,432
20,741,575
Labcorp
Holdings,
Inc.
.....................
56,780
13,053,154
McKesson
Corp.
.........................
70,784
39,715,487
Molina
Healthcare,
Inc.
(a)
....................
36,748
12,854,083
Quest
Diagnostics,
Inc.
.....................
117,899
18,506,606
UnitedHealth
Group,
Inc.
....................
216,467
127,758,823
414,162,616
a
Health
Care
REITs
—
0
.2
%
Welltower,
Inc.
...........................
235,996
28,479,997
a
Health
Care
Technology
—
0
.1
%
Veeva
Systems,
Inc.
,
Class
A
(a)
...............
69,234
14,985,007
a
Hotels,
Restaurants
&
Leisure
—
1
.4
%
Booking
Holdings,
Inc.
.....................
9,236
36,105,648
Chipotle
Mexican
Grill,
Inc.
(a)
.................
291,160
16,328,253
Flutter
Entertainment
PLC
(a)
..................
126,703
26,912,984
Hilton
Worldwide
Holdings,
Inc.
...............
59,350
13,035,634
McDonald's
Corp.
........................
141,549
40,859,534
Royal
Caribbean
Cruises
Ltd.
(a)
...............
80,885
13,315,289
Starbucks
Corp.
..........................
323,503
30,593,679
177,151,021
a
Household
Durables
—
0
.2
%
DR
Horton,
Inc.
..........................
71,305
13,459,532
PulteGroup,
Inc.
.........................
102,669
13,516,374
26,975,906
a
Household
Products
—
1
.5
%
Church
&
Dwight
Co.,
Inc.
...................
256,880
26,170,934
Clorox
Co.
(The)
.........................
206,215
32,645,897
Colgate-Palmolive
Co.
.....................
124,281
13,235,927
Kimberly-Clark
Corp.
......................
156,165
22,590,829
Procter
&
Gamble
Co.
(The)
.................
550,060
94,357,292
189,000,879
a
Industrial
Conglomerates
—
0
.7
%
3M
Co.
................................
335,412
45,176,643
Honeywell
International,
Inc.
.................
232,831
48,407,893
93,584,536
a
Industrial
REITs
—
0
.2
%
Prologis,
Inc.
............................
157,989
20,194,154
a
Insurance
—
2
.6
%
Aflac,
Inc.
..............................
144,240
15,918,326
Arch
Capital
Group
Ltd.
(a)
...................
161,114
18,220,382
Arthur
J
Gallagher
&
Co.
....................
50,970
14,912,293
Assurant,
Inc.
...........................
73,484
14,428,583
Hartford
Financial
Services
Group,
Inc.
(The)
......
297,258
34,511,654
Marsh
&
McLennan
Companies,
Inc.
............
105,335
23,964,766
MetLife,
Inc.
............................
504,127
39,059,760
Principal
Financial
Group,
Inc.
................
165,935
13,510,428
Progressive
Corp.
(The)
....................
221,288
55,808,834
Prudential
Financial,
Inc.
....................
578,053
70,036,901
iShares
®
ESG
Aware
MSCI
USA
ETF
Schedule
of
Investments
(continued)
August
31,
2024
(Percentages
shown
are
based
on
Net
Assets)
Security
Shares
Value
a
Insurance
(continued)
Travelers
Companies,
Inc.
(The)
...............
107,468
$
24,510,227
Willis
Towers
Watson
PLC
...................
45,502
13,291,589
338,173,743
a
Interactive
Media
&
Services
—
5
.6
%
Alphabet,
Inc.
,
Class
A
.....................
935,981
152,920,576
Alphabet,
Inc.
,
Class
C
,
NVS
.................
1,820,380
300,562,942
Meta
Platforms,
Inc.
,
Class
A
.................
534,508
278,644,365
732,127,883
a
IT
Services
—
1
.6
%
Accenture
PLC
,
Class
A
....................
165,842
56,709,672
Akamai
Technologies,
Inc.
(a)
..................
133,689
13,614,888
Gartner,
Inc.
(a)
...........................
42,179
20,750,381
GoDaddy,
Inc.
,
Class
A
(a)
....................
78,582
13,155,413
International
Business
Machines
Corp.
..........
340,918
68,909,755
MongoDB,
Inc.
,
Class
A
(a)
...................
50,572
14,705,832
Snowflake,
Inc.
,
Class
A
(a)
...................
97,080
11,089,448
Twilio,
Inc.
,
Class
A
(a)
......................
211,367
13,265,393
212,200,782
a
Life
Sciences
Tools
&
Services
—
1
.4
%
Agilent
Technologies,
Inc.
...................
121,626
17,382,788
Avantor,
Inc.
(a)
(b)
..........................
500,655
12,936,925
Danaher
Corp.
..........................
183,385
49,387,414
IQVIA
Holdings,
Inc.
(a)
(b)
.....................
85,501
21,507,777
Mettler-Toledo
International,
Inc.
(a)
.............
8,950
12,879,766
Thermo
Fisher
Scientific,
Inc.
.................
53,495
32,903,170
Waters
Corp.
(a)
(b)
.........................
65,343
22,631,548
West
Pharmaceutical
Services,
Inc.
............
42,815
13,428,068
183,057,456
a
Machinery
—
1
.9
%
Caterpillar,
Inc.
..........................
112,337
40,003,206
CNH
Industrial
N.V.
.......................
1,502,498
15,535,829
Cummins,
Inc.
...........................
173,659
54,329,218
Deere
&
Co.
............................
72,958
28,142,819
Fortive
Corp.
............................
249,154
18,537,058
IDEX
Corp.
.............................
64,351
13,287,194
Ingersoll
Rand,
Inc.
.......................
141,513
12,941,364
Pentair
PLC
............................
407,552
36,145,787
Xylem,
Inc.
.............................
243,652
33,509,459
252,431,934
a
Media
—
0
.5
%
Comcast
Corp.
,
Class
A
....................
622,361
24,626,825
Fox
Corp.
,
Class
B
........................
362,292
13,922,882
Interpublic
Group
of
Companies,
Inc.
(The)
.......
409,816
13,364,100
Paramount
Global
,
Class
B
,
NVS
..............
1,170,635
12,256,548
64,170,355
a
Metals
&
Mining
—
0
.4
%
Newmont
Corp.
..........................
481,236
25,693,190
Nucor
Corp.
............................
108,299
16,451,701
Steel
Dynamics,
Inc.
.......................
110,451
13,199,999
55,344,890
a
Multi-Utilities
—
1
.2
%
CMS
Energy
Corp.
........................
361,942
24,561,384
Consolidated
Edison,
Inc.
...................
126,700
12,867,652
Dominion
Energy,
Inc.
......................
359,836
20,114,832
NiSource,
Inc.
...........................
1,385,932
45,818,912
Public
Service
Enterprise
Group,
Inc.
...........
722,364
58,330,893
161,693,673
a
Security
Shares
Value
a
Oil,
Gas
&
Consumable
Fuels
—
3
.6
%
Cheniere
Energy,
Inc.
......................
125,952
$
23,333,868
Chevron
Corp.
...........................
511,403
75,662,074
ConocoPhillips
..........................
431,816
49,136,343
Diamondback
Energy,
Inc.
...................
67,494
13,168,754
EQT
Corp.
.............................
385,281
12,910,766
Exxon
Mobil
Corp.
........................
653,325
77,053,151
Hess
Corp.
.............................
294,607
40,673,442
Kinder
Morgan,
Inc.
,
Class
P
.................
1,603,709
34,592,003
Marathon
Oil
Corp.
........................
460,850
13,203,353
ONEOK,
Inc.
............................
476,504
44,009,909
Ovintiv,
Inc.
.............................
427,563
18,312,523
Phillips
66
..............................
138,356
19,412,730
Targa
Resources
Corp.
.....................
193,516
28,427,500
Valero
Energy
Corp.
.......................
90,683
13,305,917
463,202,333
a
Passenger
Airlines
—
0
.2
%
Delta
Air
Lines,
Inc.
.......................
485,026
20,608,755
a
Pharmaceuticals
—
3
.7
%
Bristol-Myers
Squibb
Co.
....................
417,972
20,877,701
Eli
Lilly
&
Co.
...........................
218,327
209,598,287
Johnson
&
Johnson
.......................
548,133
90,913,339
Merck
&
Co.,
Inc.
.........................
654,338
77,506,336
Pfizer,
Inc.
.............................
1,327,675
38,515,852
Zoetis,
Inc.
,
Class
A
.......................
259,751
47,661,711
485,073,226
a
Professional
Services
—
1
.5
%
Automatic
Data
Processing,
Inc.
...............
311,682
85,996,181
Broadridge
Financial
Solutions,
Inc.
............
269,131
57,287,225
Jacobs
Solutions,
Inc.
......................
127,181
19,189,069
Leidos
Holdings,
Inc.
......................
85,301
13,521,061
Paychex,
Inc.
...........................
102,251
13,415,331
189,408,867
a
Real
Estate
Management
&
Development
—
0
.2
%
CBRE
Group,
Inc.
,
Class
A
(a)
.................
182,069
20,963,425
a
Semiconductors
&
Semiconductor
Equipment
—
11
.1
%
Advanced
Micro
Devices,
Inc.
(a)
(b)
..............
437,645
65,016,541
Analog
Devices,
Inc.
.......................
80,674
18,945,482
Applied
Materials,
Inc.
.....................
364,296
71,861,029
Broadcom,
Inc.
..........................
1,120,016
182,361,005
First
Solar,
Inc.
(a)
.........................
57,570
13,089,691
Intel
Corp.
.............................
1,622,993
35,770,766
Lam
Research
Corp.
......................
56,302
46,224,505
Marvell
Technology,
Inc.
....................
250,357
19,087,218
Micron
Technology,
Inc.
.....................
258,605
24,888,145
NVIDIA
Corp.
...........................
6,576,912
785,085,985
NXP
Semiconductors
NV
...................
163,975
42,036,631
QUALCOMM,
Inc.
........................
233,465
40,926,415
Texas
Instruments,
Inc.
.....................
469,234
100,575,616
1,445,869,029
a
Software
—
10
.8
%
Adobe,
Inc.
(a)
............................
149,983
86,151,735
ANSYS,
Inc.
(a)
...........................
84,590
27,188,918
Atlassian
Corp.
,
Class
A
(a)
...................
81,942
13,569,595
Autodesk,
Inc.
(a)
..........................
168,497
43,539,625
Cadence
Design
Systems,
Inc.
(a)
..............
100,761
27,097,656
Fair
Isaac
Corp.
(a)
.........................
7,318
12,662,116
HubSpot,
Inc.
(a)
(b)
.........................
26,275
13,113,064
Intuit,
Inc.
..............................
119,835
75,527,207
Microsoft
Corp.
..........................
1,879,281
783,923,276
Oracle
Corp.
............................
435,251
61,496,614
Schedule
of
Investments
(continued)
August
31,
2024
iShares
®
ESG
Aware
MSCI
USA
ETF
(Percentages
shown
are
based
on
Net
Assets)
2024
iShares
Annual
Financial
Statements
Security
Shares
Value
a
Software
(continued)
Palo
Alto
Networks,
Inc.
(a)
(b)
..................
94,362
$
34,226,985
PTC,
Inc.
(a)
.............................
108,802
19,485,350
Salesforce,
Inc.
..........................
300,165
75,911,728
ServiceNow,
Inc.
(a)
........................
88,154
75,371,670
Synopsys,
Inc.
(a)
.........................
55,291
28,728,098
Workday,
Inc.
,
Class
A
(a)
....................
90,299
23,765,794
1,401,759,431
a
Specialized
REITs
—
1
.7
%
American
Tower
Corp.
.....................
214,737
48,113,972
Crown
Castle,
Inc.
........................
408,469
45,756,698
Digital
Realty
Trust,
Inc.
....................
176,396
26,743,398
Equinix,
Inc.
............................
49,759
41,516,919
Iron
Mountain,
Inc.
........................
178,036
20,164,357
SBA
Communications
Corp.
,
Class
A
............
81,012
18,362,180
Weyerhaeuser
Co.
........................
450,684
13,741,355
214,398,879
a
Specialty
Retail
—
1
.9
%
Best
Buy
Co.,
Inc.
........................
229,794
23,071,318
Home
Depot,
Inc.
(The)
....................
336,221
123,897,438
Lowe's
Companies,
Inc.
....................
193,309
48,037,286
Tractor
Supply
Co.
........................
69,961
18,718,066
Ulta
Beauty,
Inc.
(a)
........................
34,702
12,244,254
Williams-Sonoma,
Inc.
.....................
131,743
17,697,037
243,665,399
a
Technology
Hardware,
Storage
&
Peripherals
—
7
.2
%
Apple,
Inc.
.............................
3,739,169
856,269,701
Dell
Technologies,
Inc.
,
Class
C
...............
115,678
13,365,436
Hewlett
Packard
Enterprise
Co.
...............
1,062,420
20,579,076
HP,
Inc.
...............................
373,224
13,503,244
NetApp,
Inc.
............................
97,478
11,767,544
Seagate
Technology
Holdings
PLC
.............
123,678
12,312,145
Western
Digital
Corp.
(a)
.....................
198,801
13,039,358
940,836,504
a
Security
Shares
Value
a
Textiles,
Apparel
&
Luxury
Goods
—
0
.3
%
Deckers
Outdoor
Corp.
(a)
....................
25,561
$
24,520,412
Lululemon
Athletica,
Inc.
(a)
(b)
..................
49,143
12,751,134
37,271,546
a
Trading
Companies
&
Distributors
—
0
.7
%
Ferguson
Enterprises,
Inc.
...................
134,434
27,654,418
United
Rentals,
Inc.
.......................
21,757
16,127,594
WW
Grainger,
Inc.
........................
42,407
41,767,502
85,549,514
a
Water
Utilities
—
0
.1
%
Essential
Utilities,
Inc.
......................
324,098
12,636,581
a
Total
Long-Term
Investments — 99.6%
(Cost:
$
10,497,594,189
)
..............................
12,934,728,703
a
Short-Term
Securities
Money
Market
Funds
—
0
.8
%
BlackRock
Cash
Funds:
Institutional,
SL
Agency
Shares
,
5.45
%
(c)
(d)
(e)
......................
66,593,191
66,633,146
BlackRock
Cash
Funds:
Treasury,
SL
Agency
Shares
,
5.25
%
(c)
(d)
............................
41,297,684
41,297,684
a
Total
Short-Term
Securities — 0.8%
(Cost:
$
107,910,389
)
................................
107,930,830
Total
Investments
—
100.4%
(Cost:
$
10,605,504,578
)
..............................
13,042,659,533
Liabilities
in
Excess
of
Other
Assets
—
(
0
.4
)
%
...............
(
54,931,276
)
Net
Assets
—
100.0%
.................................
$
12,987,728,257
(a)
Non-income
producing
security.
(b)
All
or
a
portion
of
this
security
is
on
loan.
(c)
Affiliate
of
the
Fund.
(d)
Annualized
7-day
yield
as
of
period
end.
(e)
All
or
a
portion
of
this
security
was
purchased
with
the
cash
collateral
from
loaned
securities.
Affiliates
Investments
in
issuers
considered
to
be
affiliate(s)
of
the
Fund
during
the
year
ended
August
31,
2024
for
purposes
of
Section
2(a)(3)
of
the
Investment
Company
Act
of
1940,
as
amended,
were
as
follows:
Affiliated
Issuer
Value
at
08/31/23
Purchases
at
Cost
Proceeds
from
Sale
Net
Realized
Gain
(Loss)
Change
in
Unrealized
Appreciation
(Depreciation)
Value
at
08/31/24
Shares
Held
at
08/31/24
Income
Capital
Gain
Distributions
from
Underlying
Funds
BlackRock
Cash
Funds:
Institutional,
SL
Agency
Shares
$
51,503,808
$
15,126,759
(a)
$
—
$
(
11,372
)
$
13,951
$
66,633,146
66,593,191
$
198,442
(b)
$
—
BlackRock
Cash
Funds:
Treasury,
SL
Agency
Shares
......
68,480,952
—
(
27,183,268
)
(a)
—
—
41,297,684
41,297,684
2,098,050
—
BlackRock,
Inc.
..
21,839,335
4,816,293
(
17,038,844
)
1,359,127
2,755,950
13,731,861
15,227
530,580
—
$
1,347,755
$
2,769,901
$
121,662,691
$
2,827,072
$
—
(a)
Represents
net
amount
purchased
(sold).
(b)
All
or
a
portion
represents
securities
lending
income
earned
from
the
reinvestment
of
cash
collateral
from
loaned
securities,
net
of
fees
and
collateral
investment
expenses,
and
other
payments
to
and
from
borrowers
of
securities.
iShares
®
ESG
Aware
MSCI
USA
ETF
Schedule
of
Investments
(continued)
August
31,
2024
Derivative
Financial
Instruments
Outstanding
as
of
Period
End
Derivative
Financial
Instruments
Categorized
by
Risk
Exposure
As
of
period
end,
the
fair
values
of
derivative
financial
instruments
located
in
the
Statements
of
Assets
and
Liabilities
were
as
follows:
For
the period
ended
August
31,
2024,
the
effect
of
derivative
financial
instruments
in
the
Statements
of
Operations
was
as
follows:
Average
Quarterly
Balances
of
Outstanding
Derivative
Financial
Instruments
For
more
information
about
the
Fund’s
investment
risks
regarding
derivative
financial
instruments,
refer
to
the
Notes
to
Financial
Statements.
Futures
Contracts
Description
Number
of
Contracts
Expiration
Date
Notional
Amount
(000)
Value/
Unrealized
Appreciation
(Depreciation)
Long
Contracts
E-Mini
S&P
500
Index
...................................................................
178
09/20/24
$
50,383
$
1,113,228
Commodity
Contracts
Credit
Contracts
Equity
Contracts
Foreign
Currency
Exchange
Contracts
Interest
Rate
Contracts
Other
Contracts
Total
Assets
—
Derivative
Financial
Instruments
Futures
contracts
Unrealized
appreciation
on
futures
contracts
(a)
.............
$
—
$
—
$
1,113,228
$
—
$
—
$
—
$
1,113,228
(a)
Net
cumulative
unrealized
appreciation
(depreciation)
on
futures
contracts
are
reported
in
the
Schedule
of
Investments.
In
the
Statements
of
Assets
and
Liabilities,
only
current
day’s
variation
margin
is
reported
in
receivables
or
payables
and
the
net
cumulative
unrealized
appreciation
(depreciation)
is
included
in
accumulated
earnings
(loss).
Commodity
Contracts
Credit
Contracts
Equity
Contracts
Foreign
Currency
Exchange
Contracts
Interest
Rate
Contracts
Other
Contracts
Total
Net
Realized
Gain
(Loss)
from
Futures
contracts
.................................
$
—
$
—
$
10,225,046
$
—
$
—
$
—
$
10,225,046
Net
Change
in
Unrealized
Appreciation
(Depreciation)
on
Futures
contracts
.................................
$
—
$
—
$
(
615,278
)
$
—
$
—
$
—
$
(
615,278
)
Futures
contracts
Average
notional
value
of
contracts
—
long
...................................................................................
$
58,193,903
a
Schedule
of
Investments
(continued)
August
31,
2024
iShares
®
ESG
Aware
MSCI
USA
ETF
2024
iShares
Annual
Financial
Statements
Fair
Value
Hierarchy
as
of
Period
End
Various
inputs
are
used
in
determining
the
fair
value
of
financial
instruments.
For
a
description
of
the
input
levels
and
information
about
the
Fund’s
policy
regarding
valuation
of
financial
instruments,
refer
to
the
Notes
to
Financial
Statements.
The
following
table
summarizes
the
Fund’s
financial
instruments
categorized
in
the
fair
value
hierarchy.
The
breakdown
of
the
Fund’s
financial
instruments
into
major
categories
is
disclosed
in
the
Schedule
of
Investments
above.
See
notes
to
financial
statements.
Level
1
Level
2
Level
3
Total
Assets
Investments
Long-Term
Investments
Common
Stocks
.........................................
$
12,934,728,703
$
—
$
—
$
12,934,728,703
Short-Term
Securities
Money
Market
Funds
......................................
107,930,830
—
—
107,930,830
$
13,042,659,533
$
—
$
—
$
13,042,659,533
Derivative
Financial
Instruments
(a)
Assets
Equity
Contracts
...........................................
$
1,113,228
$
—
$
—
$
1,113,228
a
(a)
Derivative
financial
instruments
are
futures
contracts.
Futures
contracts
are
valued
at
the
unrealized
appreciation
(depreciation)
on
the
instrument.
iShares
®
ESG
Aware
MSCI
USA
Growth
ETF
Schedule
of
Investments
August
31,
2024
(Percentages
shown
are
based
on
Net
Assets)
Security
Shares
Value
a
Common
Stocks
Aerospace
&
Defense
—
1
.1
%
Axon
Enterprise,
Inc.
(a)
.....................
61
$
22,263
GE
Aerospace
...........................
362
63,213
85,476
a
Automobiles
—
2
.4
%
Tesla,
Inc.
(a)
.............................
905
193,770
a
Biotechnology
—
1
.1
%
Alnylam
Pharmaceuticals,
Inc.
(a)
...............
43
11,296
Moderna,
Inc.
(a)
..........................
169
13,081
Vertex
Pharmaceuticals,
Inc.
(a)
................
125
61,986
86,363
a
Broadline
Retail
—
6
.7
%
Amazon.com,
Inc.
(a)
.......................
2,881
514,259
MercadoLibre,
Inc.
(a)
.......................
14
28,863
543,122
a
Building
Products
—
1
.6
%
Lennox
International,
Inc.
...................
57
33,641
Trane
Technologies
PLC
....................
256
92,585
126,226
a
Capital
Markets
—
1
.2
%
FactSet
Research
Systems,
Inc.
...............
56
23,679
Moody's
Corp.
...........................
76
37,068
S&P
Global,
Inc.
.........................
64
32,848
93,595
a
Chemicals
—
0
.9
%
Ecolab,
Inc.
............................
289
73,169
a
Commercial
Services
&
Supplies
—
0
.6
%
Veralto
Corp.
............................
412
46,321
a
Communications
Equipment
—
0
.4
%
Arista
Networks,
Inc.
(a)
.....................
89
31,451
a
Construction
&
Engineering
—
0
.3
%
EMCOR
Group,
Inc.
.......................
51
20,046
Quanta
Services,
Inc.
......................
31
8,529
28,575
a
Consumer
Staples
Distribution
&
Retail
—
1
.3
%
Costco
Wholesale
Corp.
....................
120
107,086
a
Distributors
—
0
.2
%
Pool
Corp.
.............................
37
13,010
a
Electrical
Equipment
—
0
.2
%
Hubbell,
Inc.
............................
38
15,197
a
Electronic
Equipment,
Instruments
&
Components
—
0
.5
%
Keysight
Technologies,
Inc.
(a)
.................
269
41,458
a
Entertainment
—
1
.0
%
Netflix,
Inc.
(a)
............................
101
70,836
Warner
Bros
Discovery,
Inc.
,
Series
A
(a)
..........
1,050
8,232
79,068
a
Financial
Services
—
3
.4
%
Mastercard,
Inc.
,
Class
A
....................
253
122,285
Visa,
Inc.
,
Class
A
........................
550
152,004
274,289
a
Security
Shares
Value
a
Food
Products
—
0
.1
%
Lamb
Weston
Holdings,
Inc.
.................
132
$
8,173
a
Ground
Transportation
—
1
.1
%
Old
Dominion
Freight
Line,
Inc.
...............
62
11,954
Uber
Technologies,
Inc.
(a)
...................
411
30,056
Union
Pacific
Corp.
.......................
182
46,608
88,618
a
Health
Care
Equipment
&
Supplies
—
1
.7
%
Dexcom,
Inc.
(a)
..........................
112
7,766
Edwards
Lifesciences
Corp.
(a)
................
694
48,552
IDEXX
Laboratories,
Inc.
(a)
...................
118
56,797
Intuitive
Surgical,
Inc.
(a)
.....................
58
28,573
141,688
a
Health
Care
Providers
&
Services
—
1
.1
%
DaVita,
Inc.
(a)
............................
100
15,092
McKesson
Corp.
.........................
108
60,596
Molina
Healthcare,
Inc.
(a)
....................
44
15,391
91,079
a
Health
Care
Technology
—
0
.3
%
Veeva
Systems,
Inc.
,
Class
A
(a)
...............
107
23,159
a
Hotels,
Restaurants
&
Leisure
—
0
.6
%
Booking
Holdings,
Inc.
.....................
9
35,183
Chipotle
Mexican
Grill,
Inc.
(a)
.................
163
9,141
Hilton
Worldwide
Holdings,
Inc.
...............
38
8,346
52,670
a
Household
Products
—
0
.5
%
Church
&
Dwight
Co.,
Inc.
...................
435
44,318
a
Insurance
—
0
.4
%
Progressive
Corp.
(The)
....................
133
33,543
a
Interactive
Media
&
Services
—
10
.5
%
Alphabet,
Inc.
,
Class
A
.....................
926
151,290
Alphabet,
Inc.
,
Class
C
,
NVS
.................
2,308
381,074
Meta
Platforms,
Inc.
,
Class
A
.................
615
320,605
852,969
a
IT
Services
—
1
.2
%
Accenture
PLC
,
Class
A
....................
59
20,175
Gartner,
Inc.
(a)
...........................
52
25,582
GoDaddy,
Inc.
,
Class
A
(a)
....................
171
28,627
MongoDB,
Inc.
,
Class
A
(a)
...................
40
11,632
Okta,
Inc.
,
Class
A
(a)
.......................
91
7,164
Snowflake,
Inc.
,
Class
A
(a)
...................
62
7,082
100,262
a
Life
Sciences
Tools
&
Services
—
1
.2
%
Agilent
Technologies,
Inc.
...................
123
17,579
IQVIA
Holdings,
Inc.
(a)
......................
98
24,652
Mettler-Toledo
International,
Inc.
(a)
.............
6
8,634
Waters
Corp.
(a)
..........................
107
37,059
West
Pharmaceutical
Services,
Inc.
............
35
10,977
98,901
a
Machinery
—
0
.2
%
IDEX
Corp.
.............................
70
14,454
a
Oil,
Gas
&
Consumable
Fuels
—
1
.3
%
Cheniere
Energy,
Inc.
......................
150
27,789
Hess
Corp.
.............................
327
45,146
Schedule
of
Investments
(continued)
August
31,
2024
iShares
®
ESG
Aware
MSCI
USA
Growth
ETF
(Percentages
shown
are
based
on
Net
Assets)
2024
iShares
Annual
Financial
Statements
Security
Shares
Value
a
Oil,
Gas
&
Consumable
Fuels
(continued)
Targa
Resources
Corp.
.....................
244
$
35,843
108,778
a
Pharmaceuticals
—
4
.2
%
Eli
Lilly
&
Co.
...........................
258
247,685
Merck
&
Co.,
Inc.
.........................
253
29,968
Zoetis,
Inc.
,
Class
A
.......................
334
61,286
338,939
a
Professional
Services
—
0
.8
%
Broadridge
Financial
Solutions,
Inc.
............
265
56,408
Dayforce,
Inc.
(a)
(b)
.........................
139
7,947
64,355
a
Semiconductors
&
Semiconductor
Equipment
—
15
.3
%
Advanced
Micro
Devices,
Inc.
(a)
...............
532
79,034
Applied
Materials,
Inc.
.....................
498
98,235
Enphase
Energy,
Inc.
(a)
.....................
70
8,473
Lam
Research
Corp.
......................
76
62,397
Marvell
Technology,
Inc.
....................
328
25,006
NVIDIA
Corp.
...........................
8,086
965,226
1,238,371
a
Software
—
20
.9
%
Adobe,
Inc.
(a)
............................
196
112,584
ANSYS,
Inc.
(a)
...........................
145
46,606
Atlassian
Corp.
,
Class
A
(a)
...................
86
14,242
Autodesk,
Inc.
(a)
..........................
277
71,577
Cadence
Design
Systems,
Inc.
(a)
..............
115
30,927
Fair
Isaac
Corp.
(a)
.........................
5
8,651
HubSpot,
Inc.
(a)
..........................
24
11,978
Intuit,
Inc.
..............................
162
102,102
Microsoft
Corp.
..........................
2,278
950,245
Palo
Alto
Networks,
Inc.
(a)
(b)
..................
113
40,987
PTC,
Inc.
(a)
.............................
184
32,953
Salesforce,
Inc.
..........................
357
90,285
ServiceNow,
Inc.
(a)
........................
128
109,440
Synopsys,
Inc.
(a)
.........................
64
33,253
Workday,
Inc.
,
Class
A
(a)
....................
118
31,056
Zscaler,
Inc.
(a)
...........................
47
9,399
1,696,285
a
Specialized
REITs
—
0
.3
%
SBA
Communications
Corp.
,
Class
A
............
106
24,026
a
Security
Shares
Value
a
Specialty
Retail
—
0
.9
%
Burlington
Stores,
Inc.
(a)
....................
33
$
8,852
Tractor
Supply
Co.
........................
98
26,220
Williams-Sonoma,
Inc.
.....................
263
35,329
70,401
a
Technology
Hardware,
Storage
&
Peripherals
—
13
.0
%
Apple,
Inc.
.............................
4,490
1,028,210
Dell
Technologies,
Inc.
,
Class
C
...............
101
11,669
Seagate
Technology
Holdings
PLC
.............
141
14,037
1,053,916
a
Textiles,
Apparel
&
Luxury
Goods
—
0
.6
%
Deckers
Outdoor
Corp.
(a)
....................
41
39,331
Lululemon
Athletica,
Inc.
(a)
...................
33
8,562
47,893
a
Trading
Companies
&
Distributors
—
0
.8
%
WW
Grainger,
Inc.
........................
70
68,944
a
Total
Long-Term
Investments — 99.9%
(Cost:
$
7,059,449
)
..................................
8,099,918
a
Short-Term
Securities
Money
Market
Funds
—
0
.7
%
BlackRock
Cash
Funds:
Institutional,
SL
Agency
Shares
,
5.45
%
(c)
(d)
(e)
......................
46,686
46,714
BlackRock
Cash
Funds:
Treasury,
SL
Agency
Shares
,
5.25
%
(c)
(d)
............................
10,722
10,722
a
Total
Short-Term
Securities — 0.7%
(Cost:
$
57,436
)
....................................
57,436
Total
Investments
—
100.6%
(Cost:
$
7,116,885
)
..................................
8,157,354
Liabilities
in
Excess
of
Other
Assets
—
(
0
.6
)
%
...............
(
46,604
)
Net
Assets
—
100.0%
.................................
$
8,110,750
(a)
Non-income
producing
security.
(b)
All
or
a
portion
of
this
security
is
on
loan.
(c)
Affiliate
of
the
Fund.
(d)
Annualized
7-day
yield
as
of
period
end.
(e)
All
or
a
portion
of
this
security
was
purchased
with
the
cash
collateral
from
loaned
securities.
Affiliates
Investments
in
issuers
considered
to
be
affiliate(s)
of
the
Fund
during
the
year
ended
August
31,
2024
for
purposes
of
Section
2(a)(3)
of
the
Investment
Company
Act
of
1940,
as
amended,
were
as
follows:
Affiliated
Issuer
Value
at
08/31/23
Purchases
at
Cost
Proceeds
from
Sale
Net
Realized
Gain
(Loss)
Change
in
Unrealized
Appreciation
(Depreciation)
Value
at
08/31/24
Shares
Held
at
08/31/24
Income
Capital
Gain
Distributions
from
Underlying
Funds
BlackRock
Cash
Funds:
Institutional,
SL
Agency
Shares
$
4,212
$
42,811
(a)
$
—
$
(
308
)
$
(
1
)
$
46,714
46,686
$
78
(b)
$
—
BlackRock
Cash
Funds:
Treasury,
SL
Agency
Shares
6,805
3,917
(a)
—
—
—
10,722
10,722
505
—
$
(
308
)
$
(
1
)
$
57,436
$
583
$
—
iShares
®
ESG
Aware
MSCI
USA
Growth
ETF
Schedule
of
Investments
(continued)
August
31,
2024
For
the period
ended
August
31,
2024,
the
effect
of
derivative
financial
instruments
in
the
Statements
of
Operations
was
as
follows:
Average
Quarterly
Balances
of
Outstanding
Derivative
Financial
Instruments
For
more
information
about
the
Fund’s
investment
risks
regarding
derivative
financial
instruments,
refer
to
the
Notes
to
Financial
Statements.
Fair
Value
Hierarchy
as
of
Period
End
Various
inputs
are
used
in
determining
the
fair
value
of
financial
instruments.
For
a
description
of
the
input
levels
and
information
about
the
Fund’s
policy
regarding
valuation
of
financial
instruments,
refer
to
the
Notes
to
Financial
Statements.
The
following
table
summarizes
the
Fund’s
financial
instruments
categorized
in
the
fair
value
hierarchy.
The
breakdown
of
the
Fund’s
financial
instruments
into
major
categories
is
disclosed
in
the
Schedule
of
Investments
above.
See
notes
to
financial
statements.
(a)
Represents
net
amount
purchased
(sold).
(b)
All
or
a
portion
represents
securities
lending
income
earned
from
the
reinvestment
of
cash
collateral
from
loaned
securities,
net
of
fees
and
collateral
investment
expenses,
and
other
payments
to
and
from
borrowers
of
securities.
Commodity
Contracts
Credit
Contracts
Equity
Contracts
Foreign
Currency
Exchange
Contracts
Interest
Rate
Contracts
Other
Contracts
Total
Net
Realized
Gain
(Loss)
from
Futures
contracts
..................................
$
—
$
—
$
793
$
—
$
—
$
—
$
793
Futures
contracts
Average
notional
value
of
contracts
—
long
...................................................................................
$
25,595
a
Level
1
Level
2
Level
3
Total
Assets
Investments
Long-Term
Investments
Common
Stocks
.........................................
$
8,099,918
$
—
$
—
$
8,099,918
Short-Term
Securities
Money
Market
Funds
......................................
57,436
—
—
57,436
$
8,157,354
$
—
$
—
$
8,157,354
Schedule
of
Investments
August
31,
2024
iShares
®
ESG
Aware
MSCI
USA
Small-Cap
ETF
(Percentages
shown
are
based
on
Net
Assets)
2024
iShares
Annual
Financial
Statements
Security
Shares
Value
a
Common
Stocks
Aerospace
&
Defense
—
1
.8
%
AAR
Corp.
(a)
............................
16,462
$
1,082,870
AeroVironment,
Inc.
(a)
......................
11,773
2,398,867
BWX
Technologies,
Inc.
....................
44,265
4,559,295
Curtiss-Wright
Corp.
.......................
12,430
3,926,140
Ducommun,
Inc.
(a)
........................
15,762
1,025,791
Hexcel
Corp.
............................
43,591
2,758,874
Kratos
Defense
&
Security
Solutions,
Inc.
(a)
.......
57,784
1,325,565
Leonardo
DRS,
Inc.
(a)
......................
47,070
1,343,378
Mercury
Systems,
Inc.
(a)
....................
53,510
2,028,029
Moog,
Inc.
,
Class
A
.......................
21,243
4,193,368
Rocket
Lab
USA,
Inc.
(a)
(b)
....................
133,460
836,794
Spirit
AeroSystems
Holdings,
Inc.
,
Class
A
(a)
.......
32,193
1,133,516
Triumph
Group,
Inc.
(a)
......................
65,790
916,455
V2X,
Inc.
(a)
.............................
22,102
1,252,078
Woodward,
Inc.
..........................
21,539
3,589,474
32,370,494
a
Air
Freight
&
Logistics
—
0
.1
%
GXO
Logistics,
Inc.
(a)
(b)
.....................
52,061
2,605,653
a
Automobile
Components
—
1
.1
%
American
Axle
&
Manufacturing
Holdings,
Inc.
(a)
....
139,001
893,776
BorgWarner,
Inc.
.........................
97,900
3,335,453
Fox
Factory
Holding
Corp.
(a)
(b)
................
21,523
871,251
Gentherm,
Inc.
(a)
.........................
20,319
1,026,922
Goodyear
Tire
&
Rubber
Co.
(The)
(a)
............
138,311
1,219,903
LCI
Industries
...........................
17,640
2,078,698
Lear
Corp.
.............................
20,881
2,435,769
Modine
Manufacturing
Co.
(a)
.................
24,572
2,986,727
QuantumScape
Corp.
,
Class
A
(a)
(b)
.............
150,434
874,021
Standard
Motor
Products,
Inc.
................
28,706
927,491
Visteon
Corp.
(a)
..........................
19,733
1,997,572
XPEL,
Inc.
(a)
............................
20,936
906,319
19,553,902
a
Automobiles
—
0
.6
%
Harley-Davidson,
Inc.
......................
115,737
4,333,193
Lucid
Group,
Inc.
(a)
(b)
.......................
469,366
1,886,851
Thor
Industries,
Inc.
.......................
21,502
2,306,305
Winnebago
Industries,
Inc.
..................
37,463
2,235,043
10,761,392
a
Banks
—
7
.1
%
Amalgamated
Financial
Corp.
................
54,609
1,801,551
Ameris
Bancorp
..........................
29,866
1,840,642
Associated
Banc-Corp.
.....................
127,757
2,923,080
Atlantic
Union
Bankshares
Corp.
..............
48,841
1,938,011
Banc
of
California,
Inc.
.....................
75,914
1,079,497
Bancorp,
Inc.
(The)
(a)
(b)
.....................
26,460
1,386,504
Bank
of
Hawaii
Corp.
......................
20,323
1,348,838
Bank
OZK
.............................
54,394
2,357,980
BankUnited,
Inc.
.........................
28,928
1,111,703
Banner
Corp.
...........................
44,751
2,665,817
Berkshire
Hills
Bancorp,
Inc.
.................
122,187
3,365,030
Cadence
Bank
..........................
73,268
2,365,091
Camden
National
Corp.
....................
40,490
1,618,790
Central
Pacific
Financial
Corp.
................
84,982
2,337,855
Columbia
Banking
System,
Inc.
...............
81,978
2,064,206
Comerica,
Inc.
...........................
57,482
3,282,797
Commerce
Bancshares,
Inc.
.................
61,918
3,960,275
Community
Financial
System,
Inc.
.............
18,018
1,101,981
Cullen/Frost
Bankers,
Inc.
...................
13,319
1,494,791
Customers
Bancorp,
Inc.
(a)
...................
18,480
957,634
Security
Shares
Value
a
Banks
(continued)
CVB
Financial
Corp.
.......................
96,967
$
1,786,132
East
West
Bancorp,
Inc.
....................
73,678
6,194,109
Enterprise
Financial
Services
Corp.
............
36,371
1,924,390
First
BanCorp
...........................
171,045
3,656,942
First
Financial
Bancorp
.....................
34,652
917,238
First
Financial
Bankshares,
Inc.
...............
30,185
1,103,865
First
Horizon
Corp.
........................
222,023
3,683,362
First
Interstate
BancSystem,
Inc.
,
Class
A
........
87,765
2,725,103
Fulton
Financial
Corp.
......................
113,919
2,204,333
Glacier
Bancorp,
Inc.
......................
101,106
4,782,314
Hancock
Whitney
Corp.
....................
29,644
1,592,772
Hanmi
Financial
Corp.
.....................
51,227
1,014,807
Independent
Bank
Corp.
....................
92,911
3,775,508
International
Bancshares
Corp.
...............
16,980
1,072,796
National
Bank
Holdings
Corp.
,
Class
A
..........
21,142
926,231
NBT
Bancorp,
Inc.
........................
22,201
1,086,961
New
York
Community
Bancorp,
Inc.
(a)
...........
87,177
944,999
Old
National
Bancorp
......................
165,422
3,283,627
Pacific
Premier
Bancorp,
Inc.
.................
41,446
1,065,162
Pinnacle
Financial
Partners,
Inc.
...............
47,237
4,703,388
Popular,
Inc.
............................
15,488
1,587,520
Provident
Financial
Services,
Inc.
..............
44,398
846,670
Renasant
Corp.
..........................
44,252
1,548,820
Sandy
Spring
Bancorp,
Inc.
..................
40,795
1,276,884
ServisFirst
Bancshares,
Inc.
.................
12,021
974,422
SouthState
Corp.
.........................
48,896
4,747,313
Synovus
Financial
Corp.
....................
104,744
4,830,793
UMB
Financial
Corp.
......................
41,751
4,324,986
United
Bankshares,
Inc.
....................
77,326
3,005,662
Valley
National
Bancorp
....................
278,676
2,418,908
Veritex
Holdings,
Inc.
......................
38,334
965,633
Webster
Financial
Corp.
....................
87,210
4,136,370
Western
Alliance
Bancorp
...................
45,768
3,738,330
Wintrust
Financial
Corp.
....................
10,990
1,195,712
Zions
Bancorp
NA
........................
65,261
3,234,335
128,278,470
a
Beverages
—
0
.1
%
Coca-Cola
Consolidated,
Inc.
.................
895
1,201,448
a
Biotechnology
—
5
.1
%
89bio,
Inc.
(a)
............................
100,733
956,963
ADMA
Biologics,
Inc.
(a)
.....................
57,697
998,735
Agios
Pharmaceuticals,
Inc.
(a)
................
19,586
899,193
Alector,
Inc.
(a)
...........................
168,060
887,357
Alkermes
PLC
(a)
..........................
65,707
1,869,364
AnaptysBio,
Inc.
(a)
........................
24,311
926,006
Apellis
Pharmaceuticals,
Inc.
(a)
(b)
...............
22,442
872,994
Apogee
Therapeutics,
Inc.
(a)
..................
18,068
924,540
Arcellx,
Inc.
(a)
(b)
..........................
15,588
1,071,519
Arcturus
Therapeutics
Holdings,
Inc.
(a)
(b)
..........
41,236
870,080
Arcus
Biosciences,
Inc.
(a)
....................
49,906
854,391
Arcutis
Biotherapeutics,
Inc.
(a)
................
104,150
1,133,152
Arrowhead
Pharmaceuticals,
Inc.
(a)
.............
47,821
1,139,574
Avidity
Biosciences,
Inc.
(a)
...................
32,905
1,447,820
Beam
Therapeutics,
Inc.
(a)
...................
35,344
942,978
Biohaven
Ltd.
(a)
..........................
39,794
1,567,884
Blueprint
Medicines
Corp.
(a)
..................
15,363
1,467,781
Bridgebio
Pharma,
Inc.
(a)
....................
34,036
947,903
CareDx,
Inc.
(a)
...........................
20,843
640,505
Catalyst
Pharmaceuticals,
Inc.
(a)
...............
42,333
857,243
Celldex
Therapeutics,
Inc.
(a)
..................
28,807
1,190,593
Cogent
Biosciences,
Inc.
(a)
...................
88,487
950,350
Crinetics
Pharmaceuticals,
Inc.
(a)
..............
35,845
1,901,936
iShares
®
ESG
Aware
MSCI
USA
Small-Cap
ETF
Schedule
of
Investments
(continued)
August
31,
2024
(Percentages
shown
are
based
on
Net
Assets)
Security
Shares
Value
a
Biotechnology
(continued)
CRISPR
Therapeutics
AG
(a)
(b)
.................
31,652
$
1,510,433
Cullinan
Therapeutics,
Inc.
(a)
.................
49,823
976,531
Cytokinetics,
Inc.
(a)
........................
45,744
2,611,068
Denali
Therapeutics,
Inc.
(a)
..................
68,282
1,668,812
Disc
Medicine,
Inc.
(a)
.......................
17,625
895,702
Dyne
Therapeutics,
Inc.
(a)
...................
26,952
1,242,218
Geron
Corp.
(a)
...........................
243,548
1,156,853
Halozyme
Therapeutics,
Inc.
(a)
................
39,742
2,537,527
Ideaya
Biosciences,
Inc.
(a)
...................
39,313
1,552,864
Immunovant,
Inc.
(a)
(b)
.......................
27,897
862,017
Insmed,
Inc.
(a)
...........................
56,592
4,327,590
Intellia
Therapeutics,
Inc.
(a)
(b)
.................
48,657
1,091,863
Ionis
Pharmaceuticals,
Inc.
(a)
.................
23,543
1,122,530
Janux
Therapeutics,
Inc.
(a)
...................
19,568
919,305
Keros
Therapeutics,
Inc.
(a)
...................
18,563
841,832
Krystal
Biotech,
Inc.
(a)
......................
4,768
930,332
Kura
Oncology,
Inc.
(a)
......................
43,800
922,428
Kymera
Therapeutics,
Inc.
(a)
(b)
................
21,418
1,035,774
Madrigal
Pharmaceuticals,
Inc.
(a)
..............
3,371
833,075
MannKind
Corp.
(a)
........................
166,560
1,042,666
Merus
NV
(a)
(b)
............................
24,162
1,232,020
MoonLake
Immunotherapeutics
,
Class
A
(a)
(b)
.......
17,726
829,400
Myriad
Genetics,
Inc.
(a)
.....................
39,517
1,119,517
Natera,
Inc.
(a)
...........................
39,065
4,619,827
Novavax,
Inc.
(a)
..........................
67,331
833,558
Nurix
Therapeutics,
Inc.
(a)
...................
40,398
1,018,030
Nuvalent,
Inc.
,
Class
A
(a)
....................
11,508
979,676
Protagonist
Therapeutics,
Inc.
(a)
(b)
..............
23,126
991,874
Prothena
Corp.
PLC
(a)
......................
45,390
1,010,835
PTC
Therapeutics,
Inc.
(a)
....................
25,432
898,258
Recursion
Pharmaceuticals,
Inc.
,
Class
A
(a)
(b)
......
122,641
892,826
REVOLUTION
Medicines,
Inc.
(a)
...............
32,779
1,397,369
Rocket
Pharmaceuticals,
Inc.
(a)
(b)
..............
45,375
855,319
Roivant
Sciences,
Ltd.
(a)
....................
99,097
1,211,956
Sarepta
Therapeutics,
Inc.
(a)
.................
30,852
4,189,085
Savara,
Inc.
(a)
...........................
195,692
835,605
Soleno
Therapeutics,
Inc.
(a)
..................
17,219
842,870
SpringWorks
Therapeutics,
Inc.
(a)
..............
23,669
987,234
Syndax
Pharmaceuticals,
Inc.
(a)
...............
46,282
951,095
TG
Therapeutics,
Inc.
(a)
.....................
35,457
832,885
Twist
Bioscience
Corp.
(a)
(b)
...................
22,290
963,820
Ultragenyx
Pharmaceutical,
Inc.
(a)
..............
26,645
1,512,903
Vaxcyte,
Inc.
(a)
...........................
43,537
3,516,048
Vera
Therapeutics,
Inc.
,
Class
A
(a)
..............
21,855
826,556
Viking
Therapeutics,
Inc.
(a)
(b)
..................
38,996
2,500,424
Viridian
Therapeutics,
Inc.
(a)
..................
55,992
821,963
Xenon
Pharmaceuticals,
Inc.
(a)
................
50,525
2,038,178
Zymeworks,
Inc.
(a)
(b)
.......................
81,643
957,672
93,067,084
a
Broadline
Retail
—
0
.5
%
Etsy,
Inc.
(a)
.............................
37,564
2,069,401
Kohl's
Corp.
............................
50,755
984,140
Macy's,
Inc.
............................
154,685
2,408,445
Nordstrom,
Inc.
..........................
47,260
1,055,788
Ollie's
Bargain
Outlet
Holdings,
Inc.
(a)
...........
23,951
2,145,052
8,662,826
a
Building
Products
—
1
.6
%
AAON,
Inc.
.............................
36,265
3,463,670
Advanced
Drainage
Systems,
Inc.
.............
30,897
4,843,414
American
Woodmark
Corp.
(a)
.................
14,710
1,318,163
Armstrong
World
Industries,
Inc.
...............
28,925
3,666,533
AZEK
Co.,
Inc.
(The)
,
Class
A
(a)
...............
53,911
2,298,226
AZZ,
Inc.
..............................
17,235
1,433,435
Security
Shares
Value
a
Building
Products
(continued)
Gibraltar
Industries,
Inc.
(a)
...................
15,294
$
1,065,533
Hayward
Holdings,
Inc.
(a)
....................
62,505
927,574
JELD-WEN
Holding,
Inc.
(a)
...................
64,263
915,105
Resideo
Technologies,
Inc.
(a)
.................
171,769
3,462,863
Simpson
Manufacturing
Co.,
Inc.
..............
10,420
1,907,485
Trex
Co.,
Inc.
(a)
..........................
18,451
1,176,067
Zurn
Elkay
Water
Solutions
Corp.
..............
101,072
3,277,765
29,755,833
a
Capital
Markets
—
2
.5
%
Affiliated
Managers
Group,
Inc.
...............
18,976
3,298,598
Artisan
Partners
Asset
Management,
Inc.
,
Class
A
...
37,619
1,564,574
BGC
Group,
Inc.
,
Class
A
...................
96,008
948,559
Blue
Owl
Capital,
Inc.
,
Class
A
................
50,514
891,067
Donnelley
Financial
Solutions,
Inc.
(a)
............
36,822
2,454,555
Evercore,
Inc.
,
Class
A
.....................
7,401
1,818,722
Interactive
Brokers
Group,
Inc.
,
Class
A
..........
34,970
4,507,283
Invesco
Ltd.
............................
262,050
4,478,434
Janus
Henderson
Group
PLC
................
216,640
8,147,830
Jefferies
Financial
Group,
Inc.
................
27,581
1,653,481
Lazard,
Inc.
............................
57,189
2,865,741
Moelis
&
Co.
,
Class
A
......................
4,749
317,186
Morningstar,
Inc.
.........................
10,089
3,165,626
Piper
Sandler
Companies
...................
4,702
1,282,235
PJT
Partners,
Inc.
,
Class
A
..................
11,771
1,453,719
Stifel
Financial
Corp.
......................
29,435
2,594,401
Victory
Capital
Holdings,
Inc.
,
Class
A
...........
21,734
1,186,024
Virtus
Investment
Partners,
Inc.
...............
4,438
939,347
WisdomTree,
Inc.
.........................
92,580
938,761
44,506,143
a
Chemicals
—
1
.8
%
Arcadium
Lithium
PLC
(a)
....................
382,563
1,036,746
Ashland,
Inc.
............................
10,148
908,246
Aspen
Aerogels,
Inc.
(a)
(b)
....................
28,789
825,956
Avient
Corp.
............................
26,373
1,295,706
Axalta
Coating
Systems
Ltd.
(a)
................
126,700
4,624,550
Balchem
Corp.
..........................
14,202
2,514,180
Cabot
Corp.
............................
22,702
2,386,207
Chemours
Co.
(The)
.......................
52,187
1,014,515
Element
Solutions,
Inc.
.....................
92,945
2,485,349
FMC
Corp.
.............................
50,155
3,239,010
Hawkins,
Inc.
...........................
10,837
1,372,723
HB
Fuller
Co.
...........................
25,171
2,156,148
Innospec,
Inc.
...........................
12,140
1,399,256
Koppers
Holdings,
Inc.
.....................
38,905
1,539,860
Minerals
Technologies,
Inc.
..................
28,789
2,219,632
Sensient
Technologies
Corp.
.................
18,100
1,408,904
Stepan
Co.
.............................
24,725
1,919,402
Tronox
Holdings
PLC
......................
78,046
1,087,181
33,433,571
a
Commercial
Services
&
Supplies
—
1
.4
%
ABM
Industries,
Inc.
.......................
29,588
1,690,954
ACV
Auctions,
Inc.
,
Class
A
(a)
.................
57,411
1,074,160
Brady
Corp.
,
Class
A
......................
23,826
1,764,077
CECO
Environmental
Corp.
(a)
(b)
...............
34,920
1,010,934
Clean
Harbors,
Inc.
(a)
......................
4,387
1,078,763
Deluxe
Corp.
............................
45,599
938,883
HNI
Corp.
..............................
52,933
2,850,442
Interface,
Inc.
...........................
57,987
1,094,795
MillerKnoll,
Inc.
..........................
32,508
957,361
Montrose
Environmental
Group,
Inc.
(a)
...........
26,653
876,884
MSA
Safety,
Inc.
.........................
18,879
3,447,872
OPENLANE,
Inc.
(a)
........................
113,370
1,964,702
Schedule
of
Investments
(continued)
August
31,
2024
iShares
®
ESG
Aware
MSCI
USA
Small-Cap
ETF
(Percentages
shown
are
based
on
Net
Assets)
2024
iShares
Annual
Financial
Statements
Security
Shares
Value
a
Commercial
Services
&
Supplies
(continued)
Pitney
Bowes,
Inc.
........................
120,213
$
849,906
Tetra
Tech,
Inc.
..........................
14,671
3,487,883
Vestis
Corp.
............................
65,332
919,221
Viad
Corp.
(a)
............................
27,248
937,604
VSE
Corp.
.............................
12,685
1,180,085
26,124,526
a
Communications
Equipment
—
0
.6
%
Calix,
Inc.
(a)
.............................
35,282
1,313,902
Ciena
Corp.
(a)
...........................
51,029
2,941,822
Digi
International,
Inc.
(a)
.....................
30,138
887,865
Harmonic,
Inc.
(a)
(b)
........................
83,288
1,203,512
Infinera
Corp.
(a)
(b)
.........................
145,892
917,661
Lumentum
Holdings,
Inc.
(a)
..................
23,133
1,332,692
NETGEAR,
Inc.
(a)
.........................
66,023
1,071,553
Ribbon
Communications,
Inc.
(a)
...............
269,155
917,819
Viasat,
Inc.
(a)
............................
49,725
780,682
11,367,508
a
Construction
&
Engineering
—
1
.9
%
API
Group
Corp.
(a)
........................
31,400
1,116,270
Arcosa,
Inc.
(b)
...........................
25,836
2,363,736
Comfort
Systems
USA,
Inc.
..................
16,739
5,917,571
Dycom
Industries,
Inc.
(a)
....................
10,480
1,844,061
Fluor
Corp.
(a)
............................
39,211
1,963,295
Granite
Construction,
Inc.
...................
16,933
1,272,684
IES
Holdings,
Inc.
(a)
.......................
5,459
1,018,267
MasTec,
Inc.
(a)
...........................
24,413
2,761,843
MDU
Resources
Group,
Inc.
.................
196,709
5,053,454
MYR
Group,
Inc.
(a)
........................
20,021
2,018,117
Primoris
Services
Corp.
....................
33,931
1,915,066
Sterling
Infrastructure,
Inc.
(a)
(b)
................
13,557
1,620,468
Valmont
Industries,
Inc.
.....................
7,421
2,120,625
WillScot
Holdings
Corp.
,
Class
A
(a)
(b)
............
93,849
3,616,940
34,602,397
a
Construction
Materials
—
0
.4
%
Eagle
Materials,
Inc.
.......................
3,591
925,580
Knife
River
Corp.
(a)
........................
26,322
2,076,016
Summit
Materials,
Inc.
,
Class
A
(a)
(b)
.............
109,442
4,432,401
7,433,997
a
Consumer
Finance
—
0
.8
%
Encore
Capital
Group,
Inc.
(a)
.................
44,368
2,221,949
Green
Dot
Corp.
,
Class
A
(a)
..................
13,074
146,037
OneMain
Holdings,
Inc.
.....................
70,708
3,493,682
PRA
Group,
Inc.
(a)
........................
41,772
974,123
PROG
Holdings,
Inc.
......................
21,487
1,004,732
SLM
Corp.
.............................
128,474
2,834,137
SoFi
Technologies,
Inc.
(a)
....................
299,960
2,396,680
Upstart
Holdings,
Inc.
(a)
.....................
24,487
1,040,698
14,112,038
a
Consumer
Staples
Distribution
&
Retail
—
1
.8
%
Andersons,
Inc.
(The)
......................
23,843
1,215,278
BJ's
Wholesale
Club
Holdings,
Inc.
(a)
............
55,939
4,472,883
Casey's
General
Stores,
Inc.
.................
24,487
8,871,885
Grocery
Outlet
Holding
Corp.
(a)
(b)
...............
54,295
1,028,347
Maplebear,
Inc.
(a)
.........................
26,560
953,238
PriceSmart,
Inc.
..........................
10,331
925,451
Sprouts
Farmers
Market,
Inc.
(a)
................
58,134
6,048,843
U.S.
Foods
Holding
Corp.
(a)
..................
142,528
8,439,083
United
Natural
Foods,
Inc.
(a)
..................
67,034
1,014,224
32,969,232
a
Security
Shares
Value
a
Containers
&
Packaging
—
1
.0
%
AptarGroup,
Inc.
.........................
26,838
$
4,111,313
Berry
Global
Group,
Inc.
....................
48,865
3,364,844
Graphic
Packaging
Holding
Co.
...............
177,343
5,307,876
Greif,
Inc.
,
Class
A
........................
15,386
961,933
Greif,
Inc.
,
Class
B
........................
14,070
948,318
Sealed
Air
Corp.
.........................
36,275
1,267,811
Sonoco
Products
Co.
......................
42,773
2,419,669
18,381,764
a
Diversified
Consumer
Services
—
1
.5
%
ADT,
Inc.
..............................
314,320
2,291,393
Adtalem
Global
Education,
Inc.
(a)
..............
12,446
942,287
Bright
Horizons
Family
Solutions,
Inc.
(a)
..........
36,612
5,152,040
Coursera,
Inc.
(a)
..........................
107,877
873,804
Duolingo,
Inc.
,
Class
A
(a)
....................
10,768
2,288,954
European
Wax
Center,
Inc.
,
Class
A
(a)
...........
140,897
972,189
Frontdoor,
Inc.
(a)
..........................
74,548
3,584,268
Grand
Canyon
Education,
Inc.
(a)
...............
6,097
884,126
H&R
Block,
Inc.
..........................
60,980
3,860,644
Service
Corp.
International
..................
60,309
4,720,385
Stride,
Inc.
(a)
(b)
...........................
24,964
2,055,536
27,625,626
a
Diversified
REITs
—
0
.4
%
American
Assets
Trust,
Inc.
..................
46,133
1,257,124
Armada
Hoffler
Properties,
Inc.
...............
78,814
970,201
Broadstone
Net
Lease,
Inc.
..................
51,429
941,151
Empire
State
Realty
Trust,
Inc.
,
Class
A
..........
122,847
1,325,519
Essential
Properties
Realty
Trust,
Inc.
...........
106,031
3,383,449
7,877,444
a
Diversified
Telecommunication
Services
—
0
.4
%
Cogent
Communications
Holdings,
Inc.
..........
25,408
1,778,052
Frontier
Communications
Parent,
Inc.
(a)
(b)
.........
71,577
2,061,418
Iridium
Communications,
Inc.
.................
76,203
1,966,037
Lumen
Technologies,
Inc.
(a)
..................
417,593
2,192,363
7,997,870
a
Electrical
Equipment
—
1
.4
%
Acuity
Brands,
Inc.
........................
19,715
5,021,411
Atkore,
Inc.
.............................
19,226
1,794,363
Bloom
Energy
Corp.
,
Class
A
(a)
(b)
..............
76,286
908,566
Generac
Holdings,
Inc.
(a)
(b)
...................
22,443
3,513,003
NEXTracker,
Inc.
,
Class
A
(a)
..................
48,108
1,956,552
nVent
Electric
PLC
........................
50,690
3,444,892
Plug
Power,
Inc.
(a)
(b)
.......................
413,038
776,512
Powell
Industries,
Inc.
......................
6,121
1,024,900
Regal
Rexnord
Corp.
......................
16,942
2,843,037
Sensata
Technologies
Holding
PLC
............
45,953
1,771,488
Sunrun,
Inc.
(a)
...........................
87,473
1,794,946
24,849,670
a
Electronic
Equipment,
Instruments
&
Components
—
3
.6
%
Advanced
Energy
Industries,
Inc.
..............
28,391
3,012,001
Arlo
Technologies,
Inc.
(a)
....................
72,297
848,767
Arrow
Electronics,
Inc.
(a)
....................
14,221
1,920,973
Avnet,
Inc.
.............................
96,443
5,321,725
Badger
Meter,
Inc.
........................
25,983
5,376,922
Belden,
Inc.
............................
31,608
3,390,906
Benchmark
Electronics,
Inc.
.................
64,649
2,748,229
Cognex
Corp.
...........................
48,677
1,965,577
Coherent
Corp.
(a)
.........................
53,966
4,206,650
CTS
Corp.
.............................
26,026
1,281,780
ePlus,
Inc.
(a)
............................
14,225
1,365,031
Fabrinet
(a)
(b)
.............................
12,826
3,125,055
Flex
Ltd.
(a)
..............................
168,240
5,466,118
iShares
®
ESG
Aware
MSCI
USA
Small-Cap
ETF
Schedule
of
Investments
(continued)
August
31,
2024
(Percentages
shown
are
based
on
Net
Assets)
Security
Shares
Value
a
Electronic
Equipment,
Instruments
&
Components
(continued)
Insight
Enterprises,
Inc.
(a)
...................
15,736
$
3,415,814
Itron,
Inc.
(a)
.............................
31,888
3,259,591
Kimball
Electronics,
Inc.
(a)
...................
59,559
1,098,864
Littelfuse,
Inc.
...........................
10,528
2,865,722
Methode
Electronics,
Inc.
...................
85,494
890,847
Mirion
Technologies,
Inc.
,
Class
A
(a)
............
105,994
1,148,975
Novanta,
Inc.
(a)
..........................
21,569
3,953,166
PAR
Technology
Corp.
(a)
....................
19,681
1,062,577
Plexus
Corp.
(a)
(b)
..........................
21,267
2,724,515
Rogers
Corp.
(a)
..........................
12,790
1,371,855
TD
SYNNEX
Corp.
........................
12,812
1,555,633
Vontier
Corp.
............................
73,569
2,577,122
65,954,415
a
Energy
Equipment
&
Services
—
1
.5
%
Archrock,
Inc.
...........................
80,473
1,627,969
Cactus,
Inc.
,
Class
A
......................
34,894
2,076,891
ChampionX
Corp.
........................
103,404
3,218,967
Core
Laboratories,
Inc.
(b)
....................
58,540
1,145,042
Dril-Quip,
Inc.
(a)
..........................
58,710
957,560
Expro
Group
Holdings
NV
(a)
..................
74,645
1,482,450
Helix
Energy
Solutions
Group,
Inc.
(a)
............
85,923
964,056
NOV,
Inc.
..............................
179,565
3,190,870
Oceaneering
International,
Inc.
(a)
..............
45,291
1,222,404
Patterson-UTI
Energy,
Inc.
..................
100,387
924,564
TechnipFMC
PLC
........................
237,758
6,381,425
Weatherford
International
PLC
................
35,259
3,700,079
26,892,277
a
Entertainment
—
0
.5
%
AMC
Entertainment
Holdings,
Inc.
,
Class
A
(a)
......
176,733
851,853
Cinemark
Holdings,
Inc.
(a)
...................
51,965
1,422,802
Endeavor
Group
Holdings,
Inc.
,
Class
A
..........
32,466
892,166
IMAX
Corp.
(a)
...........................
72,901
1,544,772
Lions
Gate
Entertainment
Corp.
,
Class
A
(a)
........
107,948
838,756
TKO
Group
Holdings,
Inc.
,
Class
A
.............
26,055
3,080,482
8,630,831
a
Financial
Services
—
2
.1
%
Affirm
Holdings,
Inc.
,
Class
A
(a)
................
82,446
3,628,448
AvidXchange
Holdings,
Inc.
(a)
.................
109,890
886,812
Essent
Group
Ltd.
........................
23,952
1,539,874
Flywire
Corp.
(a)
..........................
53,259
964,521
HA
Sustainable
Infrastructure
Capital,
Inc.
........
66,860
2,164,927
Jackson
Financial,
Inc.
,
Class
A
...............
27,455
2,470,126
Marqeta,
Inc.
,
Class
A
(a)
....................
165,882
884,151
MGIC
Investment
Corp.
....................
183,885
4,676,196
Mr
Cooper
Group,
Inc.
(a)
....................
10,793
1,012,491
NMI
Holdings,
Inc.
(a)
.......................
44,054
1,809,298
Payoneer
Global,
Inc.
(a)
.....................
114,962
854,168
PennyMac
Financial
Services,
Inc.
.............
19,888
2,147,904
Radian
Group,
Inc.
........................
46,283
1,673,130
Rocket
Companies,
Inc.
,
Class
A
(a)
(b)
............
62,540
1,228,911
Shift4
Payments,
Inc.
,
Class
A
(a)
(b)
..............
12,232
1,016,479
Voya
Financial,
Inc.
.......................
39,117
2,770,657
Walker
&
Dunlop,
Inc.
......................
11,513
1,232,582
Western
Union
Co.
(The)
...................
121,788
1,485,814
WEX,
Inc.
(a)
.............................
26,315
5,026,691
37,473,180
a
Food
Products
—
1
.3
%
Cal-Maine
Foods,
Inc.
......................
13,476
970,811
Darling
Ingredients,
Inc.
(a)
...................
89,376
3,729,660
Flowers
Foods,
Inc.
.......................
37,082
861,786
Freshpet,
Inc.
(a)
..........................
24,342
3,310,512
Security
Shares
Value
a
Food
Products
(continued)
Hain
Celestial
Group,
Inc.
(The)
(a)
..............
140,873
$
1,126,984
Ingredion,
Inc.
...........................
54,356
7,300,554
Post
Holdings,
Inc.
(a)
.......................
15,140
1,752,758
Simply
Good
Foods
Co.
(The)
(a)
...............
26,726
844,274
TreeHouse
Foods,
Inc.
(a)
(b)
...................
24,830
1,020,265
Vital
Farms,
Inc.
(a)
........................
34,237
1,076,754
WK
Kellogg
Co
..........................
50,397
865,317
22,859,675
a
Gas
Utilities
—
1
.5
%
Chesapeake
Utilities
Corp.
..................
19,774
2,341,637
National
Fuel
Gas
Co.
.....................
63,832
3,814,600
New
Jersey
Resources
Corp.
.................
86,474
4,004,611
Northwest
Natural
Holding
Co.
................
35,334
1,421,134
ONE
Gas,
Inc.
...........................
80,825
5,572,076
Southwest
Gas
Holdings,
Inc.
................
32,743
2,381,071
Spire,
Inc.
..............................
40,029
2,640,713
UGI
Corp.
..............................
197,297
4,914,668
27,090,510
a
Ground
Transportation
—
1
.5
%
ArcBest
Corp.
...........................
8,296
881,865
Avis
Budget
Group,
Inc.
....................
9,952
815,965
Landstar
System,
Inc.
......................
21,419
3,910,253
Lyft,
Inc.
,
Class
A
(a)
........................
116,937
1,364,655
RXO,
Inc.
(a)
.............................
66,437
1,890,797
Ryder
System,
Inc.
........................
34,259
4,975,777
Saia,
Inc.
(a)
(b)
............................
9,980
3,750,783
Schneider
National,
Inc.
,
Class
B
..............
120,131
3,256,751
Werner
Enterprises,
Inc.
....................
58,390
2,158,094
XPO,
Inc.
(a)
.............................
42,807
4,906,538
27,911,478
a
Health
Care
Equipment
&
Supplies
—
2
.7
%
Artivion,
Inc.
(a)
...........................
37,631
1,021,305
AtriCure,
Inc.
(a)
(b)
.........................
39,722
1,041,114
CONMED
Corp.
..........................
12,965
949,297
Dentsply
Sirona,
Inc.
......................
50,984
1,289,385
Embecta
Corp.
..........................
65,383
1,068,358
Enovis
Corp.
(a)
(b)
..........................
34,261
1,596,563
Envista
Holdings
Corp.
(a)
(b)
...................
57,452
1,049,074
Establishment
Labs
Holdings,
Inc.
(a)
(b)
...........
19,888
911,268
Glaukos
Corp.
(a)
..........................
24,856
3,327,970
Globus
Medical,
Inc.
,
Class
A
(a)
...............
25,234
1,834,512
Haemonetics
Corp.
(a)
......................
25,925
1,959,412
ICU
Medical,
Inc.
(a)
........................
8,579
1,418,366
Inari
Medical,
Inc.
(a)
.......................
25,174
1,088,272
Inspire
Medical
Systems,
Inc.
(a)
(b)
..............
8,912
1,602,556
Integer
Holdings
Corp.
(a)
....................
18,528
2,409,937
Integra
LifeSciences
Holdings
Corp.
(a)
...........
43,299
880,702
Lantheus
Holdings,
Inc.
(a)
...................
24,726
2,632,577
LivaNova
PLC
(a)
..........................
19,023
958,569
Masimo
Corp.
(a)
..........................
7,465
877,287
Merit
Medical
Systems,
Inc.
(a)
.................
27,787
2,686,447
Neogen
Corp.
(a)
(b)
.........................
58,826
1,014,749
Novocure
Ltd.
(a)
..........................
50,121
974,352
Omnicell,
Inc.
(a)
..........................
21,303
947,557
Paragon
28,
Inc.
(a)
(b)
.......................
109,367
909,933
Penumbra,
Inc.
(a)
(b)
........................
13,921
2,816,497
PROCEPT
BioRobotics
Corp.
(a)
(b)
..............
18,618
1,470,822
QuidelOrtho
Corp.
(a)
.......................
21,111
891,940
RxSight,
Inc.
(a)
...........................
19,632
1,107,048
SI-BONE,
Inc.
(a)
..........................
62,357
1,036,373
STAAR
Surgical
Co.
(a)
......................
24,152
799,190
Tandem
Diabetes
Care,
Inc.
(a)
(b)
...............
26,583
1,156,361
Schedule
of
Investments
(continued)
August
31,
2024
iShares
®
ESG
Aware
MSCI
USA
Small-Cap
ETF
(Percentages
shown
are
based
on
Net
Assets)
2024
iShares
Annual
Financial
Statements
Security
Shares
Value
a
Health
Care
Equipment
&
Supplies
(continued)
TransMedics
Group,
Inc.
(a)
(b)
..................
11,458
$
1,925,631
Treace
Medical
Concepts,
Inc.
(a)
...............
139,465
860,499
UFP
Technologies,
Inc.
(a)
....................
3,332
1,136,978
Varex
Imaging
Corp.
(a)
.....................
82,101
1,024,620
48,675,521
a
Health
Care
Providers
&
Services
—
3
.0
%
Acadia
Healthcare
Co.,
Inc.
(a)
.................
46,105
3,777,383
Addus
HomeCare
Corp.
(a)
...................
8,295
1,103,318
agilon
health,
Inc.
(a)
(b)
......................
190,227
776,126
Alignment
Healthcare,
Inc.
(a)
(b)
................
104,189
938,743
Amedisys,
Inc.
(a)
.........................
17,953
1,759,573
AMN
Healthcare
Services,
Inc.
(a)
...............
33,223
1,761,816
Brookdale
Senior
Living,
Inc.
(a)
................
132,077
939,067
Castle
Biosciences,
Inc.
(a)
...................
32,609
967,509
Chemed
Corp.
...........................
4,590
2,690,520
CorVel
Corp.
(a)
...........................
5,038
1,615,838
Cross
Country
Healthcare,
Inc.
(a)
..............
63,004
940,020
Encompass
Health
Corp.
...................
54,256
5,048,521
Ensign
Group,
Inc.
(The)
....................
26,550
4,018,608
Fulgent
Genetics,
Inc.
(a)
....................
40,182
906,506
Guardant
Health,
Inc.
(a)
.....................
44,727
1,144,117
HealthEquity,
Inc.
(a)
........................
31,676
2,520,143
Hims
&
Hers
Health,
Inc.
,
Class
A
(a)
.............
63,338
932,969
NeoGenomics,
Inc.
(a)
......................
62,481
1,032,186
Option
Care
Health,
Inc.
(a)
...................
77,029
2,466,469
Owens
&
Minor,
Inc.
(a)
......................
56,240
873,970
Patterson
Companies,
Inc.
..................
126,962
2,855,375
Pennant
Group,
Inc.
(The)
(a)
..................
34,525
1,182,826
PetIQ,
Inc.
,
Class
A
(a)
......................
29,741
908,588
Premier,
Inc.
,
Class
A
......................
113,966
2,321,487
Privia
Health
Group,
Inc.
(a)
...................
71,210
1,434,169
Progyny,
Inc.
(a)
(b)
.........................
51,601
1,212,107
R1
RCM,
Inc.
(a)
..........................
79,408
1,120,447
RadNet,
Inc.
(a)
...........................
24,428
1,619,332
Select
Medical
Holdings
Corp.
................
35,362
1,275,507
Tenet
Healthcare
Corp.
(a)
....................
27,655
4,586,305
54,729,545
a
Health
Care
REITs
—
0
.4
%
Healthcare
Realty
Trust,
Inc.
,
Class
A
...........
90,221
1,605,934
Medical
Properties
Trust,
Inc.
(b)
................
220,800
993,600
Omega
Healthcare
Investors,
Inc.
..............
91,766
3,628,427
Sabra
Health
Care
REIT,
Inc.
.................
80,672
1,374,651
7,602,612
a
Health
Care
Technology
—
0
.1
%
Doximity,
Inc.
,
Class
A
(a)
(b)
...................
31,066
1,142,607
Teladoc
Health,
Inc.
(a)
......................
122,293
876,841
2,019,448
a
Hotel
&
Resort
REITs
—
0
.4
%
Park
Hotels
&
Resorts,
Inc.
..................
80,398
1,228,482
Pebblebrook
Hotel
Trust
....................
70,476
937,331
Ryman
Hospitality
Properties,
Inc.
.............
33,139
3,445,130
Xenia
Hotels
&
Resorts,
Inc.
.................
90,614
1,290,343
6,901,286
a
Hotels,
Restaurants
&
Leisure
—
3
.1
%
Accel
Entertainment,
Inc.
,
Class
A
(a)
............
78,836
919,228
Aramark
...............................
114,681
4,200,765
Boyd
Gaming
Corp.
.......................
15,853
951,497
Brinker
International,
Inc.
(a)
..................
25,904
1,852,654
Caesars
Entertainment,
Inc.
(a)
................
70,426
2,650,835
Cava
Group,
Inc.
(a)
(b)
.......................
17,614
2,008,701
Cheesecake
Factory,
Inc.
(The)
...............
23,537
925,239
Security
Shares
Value
a
Hotels,
Restaurants
&
Leisure
(continued)
Choice
Hotels
International,
Inc.
(b)
..............
7,167
$
914,438
Churchill
Downs,
Inc.
......................
18,252
2,536,480
Dave
&
Buster's
Entertainment,
Inc.
(a)
(b)
..........
27,547
863,323
Dutch
Bros,
Inc.
,
Class
A
(a)
..................
28,341
878,571
Everi
Holdings,
Inc.
(a)
......................
107,319
1,400,513
Hilton
Grand
Vacations,
Inc.
(a)
................
29,644
1,143,666
Light
&
Wonder,
Inc.
(a)
......................
38,900
4,271,998
Marriott
Vacations
Worldwide
Corp.
.............
16,614
1,229,436
Norwegian
Cruise
Line
Holdings
Ltd.
(a)
(b)
.........
175,474
3,139,230
Penn
Entertainment,
Inc.
(a)
...................
44,492
828,441
Planet
Fitness,
Inc.
,
Class
A
(a)
(b)
...............
39,809
3,232,889
Playa
Hotels
&
Resorts
NV
(a)
.................
160,094
1,261,541
Shake
Shack,
Inc.
,
Class
A
(a)
.................
13,653
1,357,245
Six
Flags
Entertainment
Corp.
(a)
...............
25,726
1,126,284
Sweetgreen,
Inc.
,
Class
A
(a)
..................
31,560
997,612
Texas
Roadhouse,
Inc.
.....................
10,034
1,693,237
Travel
+
Leisure
Co.
.......................
56,485
2,500,026
United
Parks
&
Resorts,
Inc.
(a)
................
26,561
1,307,332
Vail
Resorts,
Inc.
.........................
21,639
3,931,806
Wendy's
Co.
(The)
........................
90,109
1,524,644
Wingstop,
Inc.
...........................
10,731
4,143,346
Wyndham
Hotels
&
Resorts,
Inc.
..............
28,699
2,258,611
56,049,588
a
Household
Durables
—
2
.3
%
Century
Communities,
Inc.
..................
13,522
1,353,147
Champion
Homes,
Inc.
(a)
....................
10,241
956,612
Green
Brick
Partners,
Inc.
(a)
..................
11,914
938,585
Helen
of
Troy
Ltd.
(a)
.......................
17,298
923,367
Installed
Building
Products,
Inc.
...............
8,657
1,924,538
KB
Home
..............................
48,938
4,096,600
Leggett
&
Platt,
Inc.
.......................
87,982
1,112,092
M/I
Homes,
Inc.
(a)
.........................
6,513
1,037,977
Meritage
Homes
Corp.
.....................
17,373
3,441,070
Mohawk
Industries,
Inc.
(a)
...................
9,602
1,489,654
Newell
Brands,
Inc.
.......................
204,940
1,453,025
Sonos,
Inc.
(a)
............................
95,984
1,173,884
Taylor
Morrison
Home
Corp.
(a)
................
46,144
3,106,875
Tempur
Sealy
International,
Inc.
...............
49,630
2,602,101
Toll
Brothers,
Inc.
.........................
33,101
4,768,861
TopBuild
Corp.
(a)
(b)
........................
13,657
5,367,474
Tri
Pointe
Homes,
Inc.
(a)
....................
62,847
2,792,921
Whirlpool
Corp.
..........................
33,365
3,346,176
41,884,959
a
Household
Products
—
0
.3
%
Energizer
Holdings,
Inc.
....................
39,016
1,264,118
Spectrum
Brands
Holdings,
Inc.
...............
15,924
1,501,952
WD-40
Co.
.............................
7,469
1,963,152
4,729,222
a
Independent
Power
and
Renewable
Electricity
Producers
—
0
.4
%
Clearway
Energy,
Inc.
,
Class
A
................
38,321
1,029,685
Clearway
Energy,
Inc.
,
Class
C
...............
47,715
1,381,827
NextEra
Energy
Partners,
LP
.................
42,907
1,074,820
Ormat
Technologies,
Inc.
....................
25,321
1,887,174
Sunnova
Energy
International,
Inc.
(a)
............
90,832
1,009,144
6,382,650
a
Industrial
REITs
—
1
.0
%
Americold
Realty
Trust,
Inc.
..................
47,561
1,379,269
EastGroup
Properties,
Inc.
..................
22,783
4,246,751
First
Industrial
Realty
Trust,
Inc.
...............
32,068
1,819,218
LXP
Industrial
Trust
.......................
117,217
1,214,368
Rexford
Industrial
Realty,
Inc.
................
140,998
7,179,618
iShares
®
ESG
Aware
MSCI
USA
Small-Cap
ETF
Schedule
of
Investments
(continued)
August
31,
2024
(Percentages
shown
are
based
on
Net
Assets)
Security
Shares
Value
a
Industrial
REITs
(continued)
Terreno
Realty
Corp.
......................
32,451
$
2,240,417
18,079,641
a
Insurance
—
3
.5
%
Ambac
Financial
Group,
Inc.
(a)
................
78,393
917,198
Assured
Guaranty
Ltd.
.....................
12,115
970,169
Axis
Capital
Holdings
Ltd.
...................
42,450
3,390,906
Baldwin
Insurance
Group,
Inc.
(The)
,
Class
A
(a)
.....
35,161
1,648,699
CNO
Financial
Group,
Inc.
...................
96,601
3,373,307
First
American
Financial
Corp.
................
46,635
2,975,313
Globe
Life,
Inc.
..........................
21,431
2,251,327
Hanover
Insurance
Group,
Inc.
(The)
...........
21,355
3,138,971
Kemper
Corp.
...........................
14,416
901,144
Kinsale
Capital
Group,
Inc.
..................
7,993
3,925,282
Lincoln
National
Corp.
.....................
51,526
1,653,985
Old
Republic
International
Corp.
...............
66,681
2,391,848
Oscar
Health,
Inc.
,
Class
A
(a)
.................
51,464
941,791
Palomar
Holdings,
Inc.
(a)
....................
15,602
1,548,030
Primerica,
Inc.
...........................
14,971
3,940,816
Reinsurance
Group
of
America,
Inc.
............
25,018
5,522,974
RenaissanceRe
Holdings
Ltd.
................
17,993
4,584,437
RLI
Corp.
..............................
22,133
3,410,695
Ryan
Specialty
Holdings,
Inc.
,
Class
A
...........
37,342
2,413,413
Selective
Insurance
Group,
Inc.
...............
55,463
5,046,024
Stewart
Information
Services
Corp.
.............
21,872
1,616,560
Unum
Group
............................
64,878
3,600,080
White
Mountains
Insurance
Group
Ltd.
(b)
.........
1,316
2,427,020
62,589,989
a
Interactive
Media
&
Services
—
0
.2
%
Yelp,
Inc.
(a)
.............................
28,510
995,854
Ziff
Davis,
Inc.
(a)
(b)
.........................
28,723
1,403,693
ZoomInfo
Technologies,
Inc.
(a)
................
163,402
1,616,046
4,015,593
a
IT
Services
—
0
.5
%
ASGN,
Inc.
(a)
............................
29,869
2,872,203
Couchbase,
Inc.
(a)
........................
48,496
951,491
DigitalOcean
Holdings,
Inc.
(a)
.................
23,632
884,546
DXC
Technology
Co.
(a)
.....................
94,987
1,963,381
Kyndryl
Holdings,
Inc.
(a)
.....................
70,848
1,678,389
Squarespace,
Inc.
,
Class
A
(a)
.................
23,216
1,055,864
9,405,874
a
Leisure
Products
—
0
.7
%
Brunswick
Corp.
.........................
17,127
1,353,889
Hasbro,
Inc.
............................
57,074
3,890,164
Malibu
Boats,
Inc.
,
Class
A
(a)
.................
25,953
943,911
Mattel,
Inc.
(a)
(b)
...........................
129,099
2,450,299
Topgolf
Callaway
Brands
Corp.
(a)
..............
111,855
1,125,261
YETI
Holdings,
Inc.
(a)
......................
58,172
2,345,495
12,109,019
a
Life
Sciences
Tools
&
Services
—
0
.7
%
10X
Genomics,
Inc.
,
Class
A
(a)
(b)
...............
39,264
916,814
Azenta,
Inc.
(a)
(b)
..........................
31,418
1,555,819
Bruker
Corp.
............................
44,129
2,965,028
Fortrea
Holdings,
Inc.
(a)
.....................
46,015
1,061,106
Medpace
Holdings,
Inc.
(a)
...................
8,334
2,960,820
Repligen
Corp.
(a)
.........................
20,933
3,159,418
Sotera
Health
Co.
(a)
.......................
59,629
920,672
13,539,677
a
Machinery
—
4
.2
%
AGCO
Corp.
............................
27,485
2,502,234
Alamo
Group,
Inc.
........................
7,783
1,442,968
Security
Shares
Value
a
Machinery
(continued)
Allison
Transmission
Holdings,
Inc.
.............
42,718
$
3,962,094
Astec
Industries,
Inc.
......................
27,385
926,435
Chart
Industries,
Inc.
(a)
.....................
15,452
1,891,325
Columbus
McKinnon
Corp.
..................
29,117
996,093
Crane
Co.
..............................
21,374
3,385,214
Donaldson
Co.,
Inc.
.......................
61,467
4,470,495
Douglas
Dynamics,
Inc.
....................
36,034
1,003,187
Energy
Recovery,
Inc.
(a)
....................
98,145
1,593,875
Enerpac
Tool
Group
Corp.
,
Class
A
.............
50,622
2,087,651
Enpro,
Inc.
.............................
15,476
2,489,005
ESCO
Technologies,
Inc.
...................
12,335
1,479,090
Federal
Signal
Corp.
......................
31,162
2,944,497
Flowserve
Corp.
.........................
52,805
2,633,913
Franklin
Electric
Co.,
Inc.
...................
38,852
4,035,169
Gates
Industrial
Corp.
PLC
(a)
.................
64,618
1,173,463
Greenbrier
Companies,
Inc.
(The)
..............
19,159
928,254
Hillenbrand,
Inc.
.........................
37,576
1,238,505
ITT,
Inc.
...............................
35,714
4,972,103
John
Bean
Technologies
Corp.
................
13,653
1,226,586
Lincoln
Electric
Holdings,
Inc.
................
18,148
3,513,634
Lindsay
Corp.
...........................
12,767
1,583,746
Mueller
Water
Products,
Inc.
,
Class
A
...........
194,340
4,172,480
Oshkosh
Corp.
..........................
50,744
5,475,785
REV
Group,
Inc.
.........................
32,725
1,041,964
SPX
Technologies,
Inc.
(a)
....................
20,791
3,391,844
Tennant
Co.
............................
11,846
1,156,999
Terex
Corp.
.............................
29,148
1,654,732
Trinity
Industries,
Inc.
......................
51,209
1,690,409
Wabash
National
Corp.
.....................
48,085
935,734
Watts
Water
Technologies,
Inc.
,
Class
A
..........
18,812
3,700,320
75,699,803
a
Media
—
0
.8
%
Cable
One,
Inc.
..........................
6,260
2,208,027
EchoStar
Corp.
,
Class
A
(a)
...................
48,889
906,402
Liberty
Broadband
Corp.
,
Class
A
(a)
.............
24,401
1,494,561
Liberty
Broadband
Corp.
,
Class
C
,
NVS
(a)
........
13,573
846,684
Magnite,
Inc.
(a)
...........................
66,464
916,539
New
York
Times
Co.
(The)
,
Class
A
.............
62,419
3,428,676
Nexstar
Media
Group,
Inc.
...................
10,423
1,781,082
TEGNA,
Inc.
............................
214,268
2,974,040
14,556,011
a
Metals
&
Mining
—
1
.7
%
Alcoa
Corp.
.............................
89,436
2,870,896
ATI,
Inc.
(a)
..............................
48,980
3,128,842
Carpenter
Technology
Corp.
.................
16,834
2,437,058
Cleveland-Cliffs,
Inc.
(a)
.....................
104,599
1,366,063
Coeur
Mining,
Inc.
(a)
.......................
148,525
911,944
Commercial
Metals
Co.
.....................
70,720
3,789,885
Compass
Minerals
International,
Inc.
............
92,250
814,568
Hecla
Mining
Co.
.........................
146,108
866,420
Materion
Corp.
(b)
.........................
9,053
1,050,510
Metallus,
Inc.
(a)
..........................
53,369
867,780
Olympic
Steel,
Inc.
........................
22,526
903,293
Radius
Recycling,
Inc.
,
Class
A
...............
113,937
1,725,006
Royal
Gold,
Inc.
..........................
39,654
5,558,301
United
States
Steel
Corp.
...................
72,175
2,736,154
Warrior
Met
Coal,
Inc.
......................
15,000
919,650
29,946,370
a
Mortgage
REITs
—
0
.4
%
AGNC
Investment
Corp.
....................
228,916
2,337,232
Blackstone
Mortgage
Trust,
Inc.
,
Class
A
.........
79,736
1,471,926
Invesco
Mortgage
Capital,
Inc.
................
104,123
913,159
Schedule
of
Investments
(continued)
August
31,
2024
iShares
®
ESG
Aware
MSCI
USA
Small-Cap
ETF
(Percentages
shown
are
based
on
Net
Assets)
2024
iShares
Annual
Financial
Statements
Security
Shares
Value
a
Mortgage
REITs
(continued)
KKR
Real
Estate
Finance
Trust,
Inc.
............
104,632
$
1,248,260
Starwood
Property
Trust,
Inc.
.................
97,118
2,023,939
7,994,516
a
Multi-Utilities
—
0
.2
%
Avista
Corp.
............................
95,428
3,687,338
a
Office
REITs
—
1
.2
%
Brandywine
Realty
Trust
....................
207,112
1,083,196
COPT
Defense
Properties
...................
132,343
3,942,498
Cousins
Properties,
Inc.
....................
133,443
3,804,460
Douglas
Emmett,
Inc.
......................
20,767
332,272
Easterly
Government
Properties,
Inc.
...........
99,920
1,310,950
Highwoods
Properties,
Inc.
..................
80,377
2,589,747
Hudson
Pacific
Properties,
Inc.
................
175,409
903,356
JBG
SMITH
Properties
.....................
67,144
1,168,306
Kilroy
Realty
Corp.
........................
52,552
1,906,061
Paramount
Group,
Inc.
.....................
189,699
957,980
Piedmont
Office
Realty
Trust,
Inc.
,
Class
A
........
126,397
1,233,635
SL
Green
Realty
Corp.
.....................
25,400
1,692,656
Vornado
Realty
Trust
......................
39,230
1,348,335
22,273,452
a
Oil,
Gas
&
Consumable
Fuels
—
3
.1
%
Antero
Midstream
Corp.
....................
190,110
2,826,936
Antero
Resources
Corp.
(a)
...................
140,530
3,792,905
Berry
Corp.
.............................
144,572
894,901
California
Resources
Corp.
..................
33,698
1,768,134
Civitas
Resources,
Inc.
.....................
20,412
1,251,868
Clean
Energy
Fuels
Corp.
(a)
..................
386,400
1,193,976
CNX
Resources
Corp.
(a)
(b)
...................
140,040
3,874,907
Delek
U.S.
Holdings,
Inc.
...................
45,513
929,375
DT
Midstream,
Inc.
........................
53,527
4,206,687
EnLink
Midstream
LLC
.....................
230,788
3,314,116
Excelerate
Energy,
Inc.
,
Class
A
...............
45,844
835,736
Green
Plains,
Inc.
(a)
.......................
43,644
618,436
Hess
Midstream,
LP
,
Class
A
.................
68,552
2,560,417
Kinetik
Holdings,
Inc.
,
Class
A
................
60,574
2,679,794
Kosmos
Energy
Ltd.
(a)
......................
557,208
2,713,603
Murphy
Oil
Corp.
.........................
75,669
2,820,940
PBF
Energy,
Inc.
,
Class
A
...................
34,483
1,174,491
Permian
Resources
Corp.
,
Class
A
.............
233,795
3,329,241
Range
Resources
Corp.
....................
144,102
4,305,768
SM
Energy
Co.
..........................
25,996
1,186,197
Southwestern
Energy
Co.
(a)
..................
617,690
3,940,862
Talos
Energy,
Inc.
(a)
.......................
102,053
1,170,548
Uranium
Energy
Corp.
(a)
....................
174,834
914,382
VAALCO
Energy,
Inc.
......................
139,957
911,120
Viper
Energy,
Inc.
........................
23,094
1,099,274
World
Kinect
Corp.
........................
36,941
1,063,531
55,378,145
a
Paper
&
Forest
Products
—
0
.3
%
Clearwater
Paper
Corp.
(a)
...................
27,481
914,293
Louisiana-Pacific
Corp.
.....................
29,162
2,830,172
Sylvamo
Corp.
..........................
11,744
928,833
4,673,298
a
Passenger
Airlines
—
0
.2
%
Alaska
Air
Group,
Inc.
(a)
.....................
84,421
3,048,442
a
Personal
Care
Products
—
0
.3
%
BellRing
Brands,
Inc.
(a)
(b)
....................
25,508
1,426,662
Edgewell
Personal
Care
Co.
.................
24,517
986,074
Security
Shares
Value
a
Personal
Care
Products
(continued)
elf
Beauty,
Inc.
(a)
.........................
20,700
$
3,100,653
5,513,389
a
Pharmaceuticals
—
1
.3
%
Arvinas,
Inc.
(a)
...........................
35,104
918,321
Axsome
Therapeutics,
Inc.
(a)
.................
11,102
986,524
Cassava
Sciences,
Inc.
(a)
(b)
..................
29,456
845,682
Edgewise
Therapeutics,
Inc.
(a)
................
44,579
835,856
Elanco
Animal
Health,
Inc.
(a)
..................
223,011
3,449,980
Enliven
Therapeutics,
Inc.
(a)
..................
39,284
859,534
Intra-Cellular
Therapies,
Inc.
(a)
................
33,690
2,468,803
Jazz
Pharmaceuticals
PLC
(a)
.................
24,732
2,868,417
Longboard
Pharmaceuticals,
Inc.
(a)
.............
25,576
922,782
Nuvation
Bio,
Inc.
,
Class
A
(a)
(b)
................
305,455
983,565
Organon
&
Co.
..........................
106,894
2,389,081
Perrigo
Co.
PLC
.........................
49,168
1,430,789
Phathom
Pharmaceuticals,
Inc.
(a)
(b)
.............
68,926
1,138,658
Phibro
Animal
Health
Corp.
,
Class
A
............
48,892
1,026,732
Pliant
Therapeutics,
Inc.
(a)
...................
63,598
845,217
Tarsus
Pharmaceuticals,
Inc.
(a)
(b)
...............
33,452
906,884
22,876,825
a
Professional
Services
—
2
.7
%
CACI
International,
Inc.
,
Class
A
(a)
.............
8,141
3,973,785
CBIZ,
Inc.
(a)
.............................
13,333
981,309
Clarivate
PLC
(a)
..........................
205,726
1,411,280
Concentrix
Corp.
.........................
14,365
1,080,679
CRA
International,
Inc.
.....................
5,574
939,776
CSG
Systems
International,
Inc.
...............
37,027
1,796,550
ExlService
Holdings,
Inc.
(a)
..................
97,838
3,575,001
Exponent,
Inc.
...........................
10,731
1,161,845
First
Advantage
Corp.
(a)
.....................
107,800
2,064,370
FTI
Consulting,
Inc.
(a)
......................
18,284
4,174,420
Huron
Consulting
Group,
Inc.
(a)
................
9,328
1,030,184
ICF
International,
Inc.
......................
9,550
1,583,008
KBR,
Inc.
..............................
111,856
7,758,332
Kelly
Services,
Inc.
,
Class
A
,
NVS
.............
44,267
934,476
Korn
Ferry
.............................
21,914
1,600,818
ManpowerGroup,
Inc.
......................
19,147
1,415,346
Maximus,
Inc.
...........................
9,336
861,339
Parsons
Corp.
(a)
..........................
19,925
1,902,041
Paycor
HCM,
Inc.
(a)
.......................
67,303
953,011
Paylocity
Holding
Corp.
(a)
...................
18,911
3,052,236
Robert
Half,
Inc.
.........................
54,560
3,419,275
TriNet
Group,
Inc.
........................
15,804
1,625,125
Verra
Mobility
Corp.
,
Class
A
(a)
................
45,463
1,255,234
48,549,440
a
Real
Estate
Management
&
Development
—
0
.8
%
Anywhere
Real
Estate,
Inc.
(a)
.................
178,473
872,733
Compass,
Inc.
,
Class
A
(a)
....................
186,135
954,873
Cushman
&
Wakefield
PLC
(a)
.................
92,390
1,201,070
Howard
Hughes
Holdings,
Inc.
(a)
(b)
..............
48,288
3,632,223
Jones
Lang
LaSalle,
Inc.
(a)
...................
25,187
6,428,478
Marcus
&
Millichap,
Inc.
....................
24,230
961,204
14,050,581
a
Retail
REITs
—
0
.9
%
Agree
Realty
Corp.
.......................
28,512
2,081,661
Brixmor
Property
Group,
Inc.
.................
104,907
2,873,403
Federal
Realty
Investment
Trust
...............
51,878
5,965,970
Macerich
Co.
(The)
.......................
82,970
1,325,031
Phillips
Edison
&
Co.,
Inc.
...................
32,960
1,218,201
SITE
Centers
Corp.
(a)
......................
35,971
2,170,850
iShares
®
ESG
Aware
MSCI
USA
Small-Cap
ETF
Schedule
of
Investments
(continued)
August
31,
2024
(Percentages
shown
are
based
on
Net
Assets)
Security
Shares
Value
a
Retail
REITs
(continued)
Tanger,
Inc.
.............................
35,036
$
1,066,496
16,701,612
a
Semiconductors
&
Semiconductor
Equipment
—
2
.1
%
Cirrus
Logic,
Inc.
(a)
........................
27,635
4,026,143
Credo
Technology
Group
Holding,
Ltd.
(a)
.........
55,937
1,952,761
FormFactor,
Inc.
(a)
........................
17,729
864,643
Ichor
Holdings,
Ltd.
(a)
......................
28,732
890,692
Impinj,
Inc.
(a)
............................
7,793
1,310,003
Kulicke
&
Soffa
Industries,
Inc.
................
55,172
2,417,085
Lattice
Semiconductor
Corp.
(a)
................
57,325
2,714,912
MACOM
Technology
Solutions
Holdings,
Inc.
(a)
(b)
....
13,297
1,452,431
MaxLinear,
Inc.
(a)
.........................
70,269
1,066,683
MKS
Instruments,
Inc.
.....................
23,733
2,829,686
Onto
Innovation,
Inc.
(a)
.....................
24,524
5,229,007
PDF
Solutions,
Inc.
(a)
......................
32,332
1,020,075
Power
Integrations,
Inc.
....................
17,252
1,157,609
Rambus,
Inc.
(a)
..........................
50,004
2,236,179
Semtech
Corp.
(a)
.........................
24,180
1,059,568
Silicon
Laboratories,
Inc.
(a)
...................
16,256
1,924,223
SMART
Global
Holdings,
Inc.
(a)
................
42,388
878,279
SolarEdge
Technologies,
Inc.
(a)
(b)
..............
33,049
804,082
Universal
Display
Corp.
....................
8,757
1,696,406
Veeco
Instruments,
Inc.
(a)
...................
70,612
2,506,020
Wolfspeed,
Inc.
(a)
.........................
66,902
652,295
38,688,782
a
Software
—
6
.3
%
A10
Networks,
Inc.
........................
66,287
912,772
ACI
Worldwide,
Inc.
(a)
......................
56,325
2,836,527
Agilysys,
Inc.
(a)
..........................
8,684
982,160
Alarm.com
Holdings,
Inc.
(a)
..................
14,900
887,146
Alkami
Technology,
Inc.
(a)
...................
28,531
951,224
Altair
Engineering,
Inc.
,
Class
A
(a)
..............
25,878
2,338,336
Appfolio,
Inc.
,
Class
A
(a)
....................
9,181
2,129,900
Asana,
Inc.
,
Class
A
(a)
(b)
.....................
65,373
919,144
Aurora
Innovation,
Inc.
,
Class
A
(a)
(b)
.............
272,094
1,270,679
AvePoint,
Inc.
,
Class
A
(a)
....................
91,217
1,053,556
BILL
Holdings,
Inc.
(a)
.......................
31,806
1,735,335
Blackbaud,
Inc.
(a)
.........................
27,609
2,308,112
BlackLine,
Inc.
(a)
.........................
24,284
1,203,272
Box,
Inc.
,
Class
A
(a)
.......................
73,686
2,402,164
Braze,
Inc.
,
Class
A
(a)
(b)
.....................
22,957
1,028,015
C3.ai,
Inc.
,
Class
A
(a)
(b)
.....................
35,828
836,226
CCC
Intelligent
Solutions
Holdings,
Inc.
(a)
(b)
........
119,293
1,285,979
Cleanspark,
Inc.
(a)
(b)
.......................
75,883
811,189
Clearwater
Analytics
Holdings,
Inc.
,
Class
A
(a)
......
35,979
891,560
CommVault
Systems,
Inc.
(a)
..................
24,785
3,851,589
Confluent,
Inc.
,
Class
A
(a)
...................
97,673
2,072,621
Dolby
Laboratories,
Inc.
,
Class
A
..............
40,505
2,890,437
DoubleVerify
Holdings,
Inc.
(a)
.................
95,860
1,888,442
Dropbox,
Inc.
,
Class
A
(a)
....................
108,797
2,735,157
E2open
Parent
Holdings,
Inc.
,
Class
A
(a)
.........
210,119
941,333
Elastic
NV
(a)
............................
36,549
2,784,668
Envestnet,
Inc.
(a)
.........................
18,920
1,187,230
Five9,
Inc.
(a)
(b)
...........................
35,177
1,134,458
Freshworks,
Inc.
,
Class
A
(a)
(b)
.................
72,783
850,105
Gitlab,
Inc.
,
Class
A
(a)
......................
48,629
2,305,015
Guidewire
Software,
Inc.
(a)
(b)
..................
42,608
6,338,792
HashiCorp,
Inc.
,
Class
A
(a)
(b)
..................
55,521
1,884,383
Informatica,
Inc.
,
Class
A
(a)
..................
36,264
903,336
Intapp,
Inc.
(a)
............................
26,311
1,215,568
InterDigital,
Inc.
..........................
15,125
2,095,720
Jamf
Holding
Corp.
(a)
(b)
.....................
49,160
909,460
JFrog
Ltd.
(a)
.............................
35,670
990,199
Security
Shares
Value
a
Software
(continued)
Klaviyo,
Inc.
,
Class
A
(a)
(b)
....................
27,839
$
875,815
LiveRamp
Holdings,
Inc.
(a)
...................
34,806
902,172
Marathon
Digital
Holdings,
Inc.
(a)
(b)
.............
84,884
1,417,563
Matterport,
Inc.
,
Class
A
(a)
...................
201,838
914,326
ML
California
Sub,
Inc.
(a)
....................
41,163
939,751
N-able,
Inc.
(a)
............................
72,990
938,651
nCino,
Inc.
(a)
............................
25,665
768,923
NCR
Voyix
Corp.
(a)
........................
69,298
934,830
Nutanix,
Inc.
,
Class
A
(a)
.....................
97,826
6,181,625
PagerDuty,
Inc.
(a)
(b)
........................
53,760
1,063,373
Pegasystems,
Inc.
........................
22,833
1,618,403
Procore
Technologies,
Inc.
(a)
(b)
................
45,399
2,690,799
Progress
Software
Corp.
....................
67,207
3,908,087
PROS
Holdings,
Inc.
(a)
.....................
45,807
922,095
Q2
Holdings,
Inc.
(a)
(b)
.......................
23,198
1,721,524
RingCentral,
Inc.
,
Class
A
(a)
..................
28,086
936,106
SentinelOne,
Inc.
,
Class
A
(a)
..................
85,828
2,022,108
Smartsheet,
Inc.
,
Class
A
(a)
..................
47,722
2,328,834
Sprinklr,
Inc.
,
Class
A
(a)
.....................
97,959
878,692
Sprout
Social,
Inc.
,
Class
A
(a)
.................
25,980
807,978
SPS
Commerce,
Inc.
(a)
.....................
16,979
3,391,386
Tenable
Holdings,
Inc.
(a)
....................
45,149
1,863,751
Teradata
Corp.
(a)
.........................
62,173
1,755,766
UiPath,
Inc.
,
Class
A
(a)
.....................
159,905
2,059,576
Unity
Software,
Inc.
(a)
......................
88,455
1,448,008
Varonis
Systems,
Inc.
(a)
.....................
22,945
1,298,687
Verint
Systems,
Inc.
(a)
......................
44,002
1,388,263
Vertex,
Inc.
,
Class
A
(a)
(b)
.....................
24,576
950,845
Workiva,
Inc.
,
Class
A
(a)
.....................
42,000
3,283,140
Zuora,
Inc.
,
Class
A
(a)
......................
100,066
879,580
114,852,466
a
Specialized
REITs
—
0
.7
%
CubeSmart
.............................
80,651
4,180,141
EPR
Properties
..........................
23,420
1,111,748
Outfront
Media,
Inc.
.......................
77,583
1,322,790
PotlatchDeltic
Corp.
.......................
77,802
3,381,275
Rayonier,
Inc.
...........................
29,894
921,034
Uniti
Group,
Inc.
.........................
288,361
1,257,254
12,174,242
a
Specialty
Retail
—
3
.4
%
Abercrombie
&
Fitch
Co.
,
Class
A
(a)
.............
19,658
2,900,931
Advance
Auto
Parts,
Inc.
....................
25,783
1,168,228
American
Eagle
Outfitters,
Inc.
................
86,035
1,770,600
America's
Car-Mart,
Inc.
(a)
...................
14,879
900,626
Arko
Corp.
.............................
139,970
876,212
Asbury
Automotive
Group,
Inc.
(a)
(b)
..............
8,855
2,175,142
AutoNation,
Inc.
(a)
.........................
8,422
1,498,948
Boot
Barn
Holdings,
Inc.
(a)
(b)
..................
8,606
1,154,667
Caleres,
Inc.
............................
23,750
1,000,587
Carvana
Co.
,
Class
A
(a)
(b)
....................
37,979
5,720,397
Chewy,
Inc.
,
Class
A
(a)
.....................
47,509
1,356,382
Five
Below,
Inc.
(a)
.........................
22,581
1,703,285
Floor
&
Decor
Holdings,
Inc.
,
Class
A
(a)
(b)
.........
36,992
4,159,380
Foot
Locker,
Inc.
.........................
47,211
1,470,151
GameStop
Corp.
,
Class
A
(a)
..................
150,122
3,515,857
Gap,
Inc.
(The)
..........................
107,425
2,409,543
Group
1
Automotive,
Inc.
....................
8,962
3,376,523
Leslie's,
Inc.
(a)
(b)
..........................
280,697
847,705
Lithia
Motors,
Inc.
........................
11,199
3,371,795
MarineMax,
Inc.
(a)
.........................
28,804
913,663
Monro,
Inc.
.............................
33,074
895,975
Murphy
USA,
Inc.
........................
12,430
6,459,001
National
Vision
Holdings,
Inc.
(a)
...............
106,306
1,122,591
Schedule
of
Investments
(continued)
August
31,
2024
iShares
®
ESG
Aware
MSCI
USA
Small-Cap
ETF
(Percentages
shown
are
based
on
Net
Assets)
2024
iShares
Annual
Financial
Statements
Security
Shares
Value
a
Specialty
Retail
(continued)
RH
(a)
(b)
................................
3,729
$
946,047
Sally
Beauty
Holdings,
Inc.
(a)
.................
73,880
964,134
Signet
Jewelers
Ltd.
.......................
20,328
1,709,585
Upbound
Group,
Inc.
......................
37,564
1,250,881
Valvoline,
Inc.
(a)
..........................
76,447
3,226,063
Victoria's
Secret
&
Co.
(a)
....................
36,228
849,909
Warby
Parker,
Inc.
,
Class
A
(a)
(b)
................
65,280
973,978
Wayfair,
Inc.
,
Class
A
(a)
(b)
....................
27,726
1,179,741
61,868,527
a
Technology
Hardware,
Storage
&
Peripherals
—
0
.1
%
Xerox
Holdings
Corp.
......................
86,279
977,541
a
Textiles,
Apparel
&
Luxury
Goods
—
1
.5
%
Capri
Holdings
Ltd.
(a)
......................
30,914
1,104,248
Carter's,
Inc.
............................
13,929
917,921
Columbia
Sportswear
Co.
...................
14,750
1,190,768
Crocs,
Inc.
(a)
............................
28,066
4,102,407
Hanesbrands,
Inc.
(a)
.......................
175,384
1,113,688
Kontoor
Brands,
Inc.
.......................
32,870
2,460,320
Levi
Strauss
&
Co.
,
Class
A
..................
54,433
1,048,924
Movado
Group,
Inc.
.......................
56,678
1,352,337
PVH
Corp.
.............................
30,338
2,994,057
Ralph
Lauren
Corp.
,
Class
A
.................
8,219
1,407,586
Steven
Madden,
Ltd.
......................
48,506
2,187,621
Tapestry,
Inc.
............................
95,496
3,912,471
Under
Armour,
Inc.
,
Class
A
(a)
(b)
...............
105,493
811,241
VF
Corp.
..............................
174,121
3,170,743
27,774,332
a
Trading
Companies
&
Distributors
—
2
.0
%
Air
Lease
Corp.
,
Class
A
....................
40,317
1,865,467
Applied
Industrial
Technologies,
Inc.
............
8,965
1,838,901
Beacon
Roofing
Supply,
Inc.
(a)
(b)
...............
25,776
2,335,306
Boise
Cascade
Co.
.......................
21,866
2,965,467
Core
&
Main,
Inc.
,
Class
A
(a)
..................
98,944
4,752,280
DNOW,
Inc.
(a)
...........................
70,780
921,555
FTAI
Aviation,
Ltd.
........................
28,922
3,696,521
GATX
Corp.
............................
21,670
3,057,637
Herc
Holdings,
Inc.
........................
21,628
3,165,690
McGrath
RentCorp
........................
14,040
1,518,426
MRC
Global,
Inc.
(a)
........................
71,712
943,730
Rush
Enterprises,
Inc.
,
Class
A
...............
16,492
869,128
Rush
Enterprises,
Inc.
,
Class
B
...............
20,419
960,510
SiteOne
Landscape
Supply,
Inc.
(a)
..............
21,745
3,084,746
WESCO
International,
Inc.
...................
21,870
3,616,861
35,592,225
a
Security
Shares
Value
a
Water
Utilities
—
0
.2
%
American
States
Water
Co.
..................
11,130
$
906,205
California
Water
Service
Group
...............
16,362
905,309
SJW
Group
.............................
32,417
1,912,279
3,723,793
a
Wireless
Telecommunication
Services
—
0
.1
%
Gogo,
Inc.
(a)
............................
113,262
902,698
Telephone
and
Data
Systems,
Inc.
.............
50,770
1,199,188
2,101,886
a
Total
Common
Stocks — 99.7%
(Cost:
$
1,565,403,368
)
...............................
1,805,768,894
a
Rights
Biotechnology
—
0
.0
%
Chinook
Therapeutics,
Inc.
,
CVR
(Expires
01/01/26)
(a)
(c)
30,052
18,933
a
Total
Rights — 0.0%
(Cost:
$
–
)
........................................
18,933
Total
Long-Term
Investments — 99.7%
(Cost:
$
1,565,403,368
)
...............................
1,805,787,827
a
Short-Term
Securities
Money
Market
Funds
—
5
.6
%
BlackRock
Cash
Funds:
Institutional,
SL
Agency
Shares
,
5.45
%
(d)
(e)
(f)
......................
94,811,048
94,867,934
BlackRock
Cash
Funds:
Treasury,
SL
Agency
Shares
,
5.25
%
(d)
(e)
............................
6,966,077
6,966,077
a
Total
Short-Term
Securities — 5.6%
(Cost:
$
101,771,159
)
................................
101,834,011
Total
Investments
—
105.3%
(Cost:
$
1,667,174,527
)
...............................
1,907,621,838
Liabilities
in
Excess
of
Other
Assets
—
(
5
.3
)
%
...............
(
96,003,210
)
Net
Assets
—
100.0%
.................................
$
1,811,618,628
(a)
Non-income
producing
security.
(b)
All
or
a
portion
of
this
security
is
on
loan.
(c)
Security
is
valued
using
significant
unobservable
inputs
and
is
classified
as
Level
3
in
the
fair
value
hierarchy.
(d)
Affiliate
of
the
Fund.
(e)
Annualized
7-day
yield
as
of
period
end.
(f)
All
or
a
portion
of
this
security
was
purchased
with
the
cash
collateral
from
loaned
securities.
Affiliates
Investments
in
issuers
considered
to
be
affiliate(s)
of
the
Fund
during
the
year
ended
August
31,
2024
for
purposes
of
Section
2(a)(3)
of
the
Investment
Company
Act
of
1940,
as
amended,
were
as
follows:
Affiliated
Issuer
Value
at
08/31/23
Purchases
at
Cost
Proceeds
from
Sale
Net
Realized
Gain
(Loss)
Change
in
Unrealized
Appreciation
(Depreciation)
Value
at
08/31/24
Shares
Held
at
08/31/24
Income
Capital
Gain
Distributions
from
Underlying
Funds
BlackRock
Cash
Funds:
Institutional,
SL
Agency
Shares
$
109,796,514
$
—
$
(
14,951,237
)
(a)
$
6,989
$
15,668
$
94,867,934
94,811,048
$
728,725
(b)
$
—
iShares
®
ESG
Aware
MSCI
USA
Small-Cap
ETF
Schedule
of
Investments
(continued)
August
31,
2024
Derivative
Financial
Instruments
Outstanding
as
of
Period
End
Derivative
Financial
Instruments
Categorized
by
Risk
Exposure
As
of
period
end,
the
fair
values
of
derivative
financial
instruments
located
in
the
Statements
of
Assets
and
Liabilities
were
as
follows:
For
the period
ended
August
31,
2024,
the
effect
of
derivative
financial
instruments
in
the
Statements
of
Operations
was
as
follows:
Average
Quarterly
Balances
of
Outstanding
Derivative
Financial
Instruments
For
more
information
about
the
Fund’s
investment
risks
regarding
derivative
financial
instruments,
refer
to
the
Notes
to
Financial
Statements.
Affiliates
(continued)
Affiliated
Issuer
Value
at
08/31/23
Purchases
at
Cost
Proceeds
from
Sale
Net
Realized
Gain
(Loss)
Change
in
Unrealized
Appreciation
(Depreciation)
Value
at
08/31/24
Shares
Held
at
08/31/24
Income
Capital
Gain
Distributions
from
Underlying
Funds
BlackRock
Cash
Funds:
Treasury,
SL
Agency
Shares
$
5,304,286
$
1,661,791
(a)
$
—
$
—
$
—
$
6,966,077
6,966,077
$
223,332
$
—
$
6,989
$
15,668
$
101,834,011
$
952,057
$
—
(a)
Represents
net
amount
purchased
(sold).
(b)
All
or
a
portion
represents
securities
lending
income
earned
from
the
reinvestment
of
cash
collateral
from
loaned
securities,
net
of
fees
and
collateral
investment
expenses,
and
other
payments
to
and
from
borrowers
of
securities.
Futures
Contracts
Description
Number
of
Contracts
Expiration
Date
Notional
Amount
(000)
Value/
Unrealized
Appreciation
(Depreciation)
Long
Contracts
E-Mini
Russell
2000
Index
................................................................
25
09/20/24
$
2,779
$
125,105
E-Mini
S&P
MidCap
400
Index
.............................................................
7
09/20/24
2,169
79,930
$
205,035
Commodity
Contracts
Credit
Contracts
Equity
Contracts
Foreign
Currency
Exchange
Contracts
Interest
Rate
Contracts
Other
Contracts
Total
Assets
—
Derivative
Financial
Instruments
Futures
contracts
Unrealized
appreciation
on
futures
contracts
(a)
.............
$
—
$
—
$
205,035
$
—
$
—
$
—
$
205,035
(a)
Net
cumulative
unrealized
appreciation
(depreciation)
on
futures
contracts
are
reported
in
the
Schedule
of
Investments.
In
the
Statements
of
Assets
and
Liabilities,
only
current
day’s
variation
margin
is
reported
in
receivables
or
payables
and
the
net
cumulative
unrealized
appreciation
(depreciation)
is
included
in
accumulated
earnings
(loss).
Commodity
Contracts
Credit
Contracts
Equity
Contracts
Foreign
Currency
Exchange
Contracts
Interest
Rate
Contracts
Other
Contracts
Total
Net
Realized
Gain
(Loss)
from
Futures
contracts
..................................
$
—
$
—
$
866,369
$
—
$
—
$
—
$
866,369
Net
Change
in
Unrealized
Appreciation
(Depreciation)
on
Futures
contracts
..................................
$
—
$
—
$
170,255
$
—
$
—
$
—
$
170,255
Futures
contracts
Average
notional
value
of
contracts
—
long
...................................................................................
$
5,258,746
a
Schedule
of
Investments
(continued)
August
31,
2024
iShares
®
ESG
Aware
MSCI
USA
Small-Cap
ETF
2024
iShares
Annual
Financial
Statements
Fair
Value
Hierarchy
as
of
Period
End
Various
inputs
are
used
in
determining
the
fair
value
of
financial
instruments.
For
a
description
of
the
input
levels
and
information
about
the
Fund’s
policy
regarding
valuation
of
financial
instruments,
refer
to
the
Notes
to
Financial
Statements.
The
following
table
summarizes
the
Fund’s
financial
instruments
categorized
in
the
fair
value
hierarchy.
The
breakdown
of
the
Fund’s
financial
instruments
into
major
categories
is
disclosed
in
the
Schedule
of
Investments
above.
See
notes
to
financial
statements.
Level
1
Level
2
Level
3
Total
Assets
Investments
Long-Term
Investments
Common
Stocks
.........................................
$
1,805,768,894
$
—
$
—
$
1,805,768,894
Rights
................................................
—
—
18,933
18,933
Short-Term
Securities
Money
Market
Funds
......................................
101,834,011
—
—
101,834,011
$
1,907,602,905
$
—
$
18,933
$
1,907,621,838
Derivative
Financial
Instruments
(a)
Assets
Equity
Contracts
...........................................
$
205,035
$
—
$
—
$
205,035
a
(a)
Derivative
financial
instruments
are
futures
contracts.
Futures
contracts
are
valued
at
the
unrealized
appreciation
(depreciation)
on
the
instrument.
iShares
®
ESG
Aware
MSCI
USA
Value
ETF
Schedule
of
Investments
August
31,
2024
(Percentages
shown
are
based
on
Net
Assets)
Security
Shares
Value
a
Common
Stocks
Aerospace
&
Defense
—
1
.5
%
Huntington
Ingalls
Industries,
Inc.
..............
39
$
11,028
Northrop
Grumman
Corp.
...................
49
25,637
RTX
Corp.
.............................
399
49,213
85,878
a
Air
Freight
&
Logistics
—
1
.5
%
CH
Robinson
Worldwide,
Inc.
................
221
22,876
Expeditors
International
of
Washington,
Inc.
.......
260
32,087
FedEx
Corp.
............................
48
14,341
United
Parcel
Service,
Inc.
,
Class
B
............
146
18,768
88,072
a
Banks
—
6
.0
%
Bank
of
America
Corp.
.....................
1,724
70,253
Citigroup,
Inc.
...........................
605
37,897
Huntington
Bancshares,
Inc.
.................
980
14,671
JPMorgan
Chase
&
Co.
....................
698
156,910
PNC
Financial
Services
Group,
Inc.
(The)
........
181
33,501
Truist
Financial
Corp.
......................
304
13,516
U.S.
Bancorp
...........................
346
16,342
Wells
Fargo
&
Co.
........................
229
13,390
356,480
a
Beverages
—
3
.6
%
Coca-Cola
Co.
(The)
......................
1,606
116,387
Constellation
Brands,
Inc.
,
Class
A
.............
25
6,018
Keurig
Dr
Pepper,
Inc.
.....................
399
14,607
Molson
Coors
Beverage
Co.
,
Class
B
...........
328
17,702
PepsiCo,
Inc.
...........................
325
56,186
210,900
a
Biotechnology
—
3
.4
%
AbbVie,
Inc.
............................
332
65,175
Amgen,
Inc.
............................
159
53,079
Biogen,
Inc.
(a)
...........................
39
7,985
Gilead
Sciences,
Inc.
......................
658
51,982
Regeneron
Pharmaceuticals,
Inc.
(a)
.............
17
20,140
198,361
a
Building
Products
—
1
.3
%
Allegion
PLC
............................
67
9,302
Carrier
Global
Corp.
.......................
321
23,362
Fortune
Brands
Innovations,
Inc.
..............
189
15,009
Johnson
Controls
International
PLC
............
273
19,888
Owens
Corning
..........................
65
10,968
78,529
a
Capital
Markets
—
4
.7
%
Bank
of
New
York
Mellon
Corp.
(The)
...........
575
39,226
BlackRock,
Inc.
(b)
.........................
18
16,233
Cboe
Global
Markets,
Inc.
...................
32
6,573
Charles
Schwab
Corp.
(The)
.................
297
19,335
FactSet
Research
Systems,
Inc.
...............
24
10,148
Goldman
Sachs
Group,
Inc.
(The)
.............
87
44,392
Intercontinental
Exchange,
Inc.
...............
40
6,462
MarketAxess
Holdings,
Inc.
..................
25
6,060
Morgan
Stanley
..........................
487
50,458
Nasdaq,
Inc.
............................
283
20,399
Northern
Trust
Corp.
.......................
91
8,300
S&P
Global,
Inc.
.........................
79
40,546
State
Street
Corp.
........................
115
10,016
278,148
a
Security
Shares
Value
a
Chemicals
—
2
.2
%
Air
Products
and
Chemicals,
Inc.
..............
21
$
5,856
Dow,
Inc.
..............................
140
7,501
DuPont
de
Nemours,
Inc.
...................
67
5,645
Ecolab,
Inc.
............................
159
40,256
International
Flavors
&
Fragrances,
Inc.
..........
81
8,423
Linde
PLC
.............................
66
31,564
LyondellBasell
Industries
NV
,
Class
A
...........
59
5,823
PPG
Industries,
Inc.
.......................
167
21,665
126,733
a
Communications
Equipment
—
1
.0
%
Cisco
Systems,
Inc.
.......................
1,064
53,775
Juniper
Networks,
Inc.
.....................
191
7,426
61,201
a
Construction
Materials
—
0
.7
%
CRH
PLC
..............................
456
41,391
a
Consumer
Finance
—
1
.7
%
American
Express
Co.
.....................
189
48,885
Capital
One
Financial
Corp.
..................
58
8,522
Discover
Financial
Services
..................
158
21,916
Synchrony
Financial
.......................
447
22,466
101,789
a
Consumer
Staples
Distribution
&
Retail
—
1
.1
%
Dollar
General
Corp.
......................
46
3,817
Dollar
Tree,
Inc.
(a)
.........................
59
4,985
Kroger
Co.
(The)
.........................
425
22,614
Sysco
Corp.
............................
79
6,160
Target
Corp.
............................
167
25,654
63,230
a
Containers
&
Packaging
—
0
.5
%
Avery
Dennison
Corp.
......................
29
6,433
Ball
Corp.
..............................
106
6,764
Crown
Holdings,
Inc.
......................
65
5,877
International
Paper
Co.
.....................
172
8,328
27,402
a
Distributors
—
0
.4
%
LKQ
Corp.
.............................
618
25,703
a
Diversified
Telecommunication
Services
—
1
.2
%
AT&T,
Inc.
..............................
1,015
20,198
Verizon
Communications,
Inc.
................
1,143
47,755
67,953
a
Electric
Utilities
—
1
.8
%
Edison
International
.......................
198
17,232
Eversource
Energy
.......................
221
14,924
Exelon
Corp.
............................
545
20,759
NextEra
Energy,
Inc.
......................
641
51,607
104,522
a
Electrical
Equipment
—
0
.7
%
Eaton
Corp.
PLC
.........................
48
14,733
GE
Vernova,
Inc.
(a)
........................
41
8,241
Hubbell,
Inc.
............................
19
7,598
Rockwell
Automation,
Inc.
...................
28
7,617
38,189
a
Electronic
Equipment,
Instruments
&
Components
—
0
.5
%
Keysight
Technologies,
Inc.
(a)
.................
137
21,114
Trimble,
Inc.
(a)
...........................
169
9,581
30,695
a
Schedule
of
Investments
(continued)
August
31,
2024
iShares
®
ESG
Aware
MSCI
USA
Value
ETF
(Percentages
shown
are
based
on
Net
Assets)
2024
iShares
Annual
Financial
Statements
Security
Shares
Value
a
Energy
Equipment
&
Services
—
0
.6
%
Baker
Hughes
Co.
,
Class
A
..................
434
$
15,264
Schlumberger
N.V.
........................
392
17,244
32,508
a
Entertainment
—
1
.1
%
Electronic
Arts,
Inc.
.......................
148
22,469
Walt
Disney
Co.
(The)
.....................
473
42,750
65,219
a
Financial
Services
—
2
.0
%
Berkshire
Hathaway,
Inc.
,
Class
B
(a)
............
153
72,816
Fidelity
National
Information
Services,
Inc.
........
177
14,594
Fiserv,
Inc.
(a)
............................
106
18,508
PayPal
Holdings,
Inc.
(a)
.....................
171
12,385
118,303
a
Food
Products
—
3
.1
%
Archer-Daniels-Midland
Co.
..................
120
7,319
Bunge
Global
SA
.........................
213
21,594
Campbell
Soup
Co.
.......................
172
8,552
Conagra
Brands,
Inc.
......................
193
6,022
General
Mills,
Inc.
........................
572
41,350
Hormel
Foods
Corp.
.......................
244
7,942
Kellanova
..............................
671
54,089
Kraft
Heinz
Co.
(The)
......................
518
18,353
McCormick
&
Co.,
Inc.
,
NVS
.................
113
9,043
Mondelez
International,
Inc.
,
Class
A
............
77
5,529
179,793
a
Ground
Transportation
—
0
.2
%
JB
Hunt
Transport
Services,
Inc.
..............
55
9,526
a
Health
Care
Equipment
&
Supplies
—
1
.8
%
Abbott
Laboratories
.......................
126
14,272
Cooper
Companies,
Inc.
(The)
(a)
...............
183
19,349
GE
HealthCare
Technologies,
Inc.
.............
68
5,768
Hologic,
Inc.
(a)
...........................
107
8,693
ResMed,
Inc.
...........................
24
5,880
Solventum
Corp.
(a)
........................
103
6,603
STERIS
PLC
............................
84
20,252
Teleflex,
Inc.
............................
48
11,768
Zimmer
Biomet
Holdings,
Inc.
................
123
14,202
106,787
a
Health
Care
Providers
&
Services
—
5
.9
%
Cardinal
Health,
Inc.
.......................
160
18,035
Cencora,
Inc.
...........................
123
29,467
Centene
Corp.
(a)
.........................
184
14,505
Cigna
Group
(The)
........................
108
39,076
CVS
Health
Corp.
........................
97
5,552
Elevance
Health,
Inc.
......................
100
55,689
HCA
Healthcare,
Inc.
......................
53
20,966
Humana,
Inc.
...........................
22
7,798
Labcorp
Holdings,
Inc.
.....................
56
12,874
Quest
Diagnostics,
Inc.
.....................
111
17,424
UnitedHealth
Group,
Inc.
....................
213
125,713
347,099
a
Health
Care
REITs
—
0
.4
%
Welltower,
Inc.
...........................
202
24,377
a
Hotels,
Restaurants
&
Leisure
—
1
.3
%
Flutter
Entertainment
PLC
(a)
..................
83
17,630
McDonald's
Corp.
........................
131
37,814
Starbucks
Corp.
..........................
226
21,373
76,817
a
Security
Shares
Value
a
Household
Durables
—
0
.3
%
DR
Horton,
Inc.
..........................
60
$
11,325
PulteGroup,
Inc.
.........................
61
8,031
19,356
a
Household
Products
—
2
.6
%
Church
&
Dwight
Co.,
Inc.
...................
155
15,791
Clorox
Co.
(The)
.........................
154
24,380
Kimberly-Clark
Corp.
......................
160
23,145
Procter
&
Gamble
Co.
(The)
.................
531
91,088
154,404
a
Industrial
Conglomerates
—
1
.4
%
3M
Co.
................................
280
37,713
Honeywell
International,
Inc.
.................
228
47,404
85,117
a
Industrial
REITs
—
0
.3
%
Prologis,
Inc.
............................
158
20,196
a
Insurance
—
4
.0
%
Aflac,
Inc.
..............................
124
13,685
Arch
Capital
Group
Ltd.
(a)
...................
99
11,196
Assurant,
Inc.
...........................
55
10,799
Chubb
Ltd.
.............................
26
7,389
Hartford
Financial
Services
Group,
Inc.
(The)
......
244
28,328
Marsh
&
McLennan
Companies,
Inc.
............
67
15,243
MetLife,
Inc.
............................
385
29,830
Principal
Financial
Group,
Inc.
................
87
7,083
Progressive
Corp.
(The)
....................
92
23,202
Prudential
Financial,
Inc.
....................
493
59,732
Travelers
Companies,
Inc.
(The)
...............
108
24,632
Willis
Towers
Watson
PLC
...................
26
7,595
238,714
a
IT
Services
—
2
.0
%
Accenture
PLC
,
Class
A
....................
96
32,827
Akamai
Technologies,
Inc.
(a)
..................
82
8,351
International
Business
Machines
Corp.
..........
335
67,713
Twilio,
Inc.
,
Class
A
(a)
......................
101
6,339
115,230
a
Life
Sciences
Tools
&
Services
—
1
.3
%
Agilent
Technologies,
Inc.
...................
91
13,006
Avantor,
Inc.
(a)
(c)
..........................
253
6,537
Danaher
Corp.
..........................
183
49,284
Thermo
Fisher
Scientific,
Inc.
.................
13
7,996
76,823
a
Machinery
—
3
.9
%
Caterpillar,
Inc.
..........................
119
42,376
CNH
Industrial
N.V.
.......................
1,330
13,752
Cummins,
Inc.
...........................
130
40,670
Deere
&
Co.
............................
65
25,073
Dover
Corp.
............................
32
5,953
Fortive
Corp.
............................
214
15,922
IDEX
Corp.
.............................
47
9,705
Illinois
Tool
Works,
Inc.
.....................
25
6,329
Ingersoll
Rand,
Inc.
.......................
80
7,316
Pentair
PLC
............................
363
32,194
Toro
Co.
(The)
...........................
60
5,556
Xylem,
Inc.
.............................
203
27,919
232,765
a
Media
—
0
.6
%
Comcast
Corp.
,
Class
A
....................
571
22,594
Fox
Corp.
,
Class
B
........................
172
6,610
iShares
®
ESG
Aware
MSCI
USA
Value
ETF
Schedule
of
Investments
(continued)
August
31,
2024
(Percentages
shown
are
based
on
Net
Assets)
Security
Shares
Value
a
Media
(continued)
Interpublic
Group
of
Companies,
Inc.
(The)
.......
185
$
6,033
35,237
a
Metals
&
Mining
—
0
.7
%
Newmont
Corp.
..........................
388
20,715
Nucor
Corp.
............................
103
15,647
Steel
Dynamics,
Inc.
.......................
49
5,856
42,218
a
Multi-Utilities
—
2
.4
%
CMS
Energy
Corp.
........................
339
23,005
Consolidated
Edison,
Inc.
...................
154
15,640
Dominion
Energy,
Inc.
......................
292
16,323
NiSource,
Inc.
...........................
1,090
36,035
Public
Service
Enterprise
Group,
Inc.
...........
641
51,761
142,764
a
Office
REITs
—
0
.1
%
BXP,
Inc.
..............................
89
6,695
a
Oil,
Gas
&
Consumable
Fuels
—
6
.4
%
Chevron
Corp.
...........................
475
70,276
ConocoPhillips
..........................
436
49,613
Diamondback
Energy,
Inc.
...................
38
7,414
EQT
Corp.
.............................
215
7,205
Exxon
Mobil
Corp.
........................
780
91,993
Kinder
Morgan,
Inc.
,
Class
P
.................
1,751
37,769
Marathon
Oil
Corp.
........................
382
10,944
ONEOK,
Inc.
............................
413
38,145
Ovintiv,
Inc.
.............................
533
22,828
Phillips
66
..............................
151
21,187
Valero
Energy
Corp.
.......................
99
14,526
Williams
Companies,
Inc.
(The)
...............
169
7,735
379,635
a
Passenger
Airlines
—
0
.2
%
Delta
Air
Lines,
Inc.
.......................
281
11,940
a
Pharmaceuticals
—
3
.7
%
Bristol-Myers
Squibb
Co.
....................
430
21,479
Johnson
&
Johnson
.......................
562
93,213
Merck
&
Co.,
Inc.
.........................
324
38,378
Pfizer,
Inc.
.............................
1,329
38,554
Zoetis,
Inc.
,
Class
A
.......................
147
26,973
218,597
a
Professional
Services
—
2
.3
%
Automatic
Data
Processing,
Inc.
...............
250
68,977
Broadridge
Financial
Solutions,
Inc.
............
196
41,721
Jacobs
Solutions,
Inc.
......................
94
14,183
Leidos
Holdings,
Inc.
......................
40
6,340
Paychex,
Inc.
...........................
51
6,691
137,912
a
Real
Estate
Management
&
Development
—
0
.3
%
CBRE
Group,
Inc.
,
Class
A
(a)
.................
159
18,307
a
Semiconductors
&
Semiconductor
Equipment
—
7
.2
%
Analog
Devices,
Inc.
.......................
76
17,848
Broadcom,
Inc.
..........................
1,058
172,263
First
Solar,
Inc.
(a)
.........................
33
7,503
Intel
Corp.
.............................
1,422
31,341
Micron
Technology,
Inc.
.....................
254
24,445
NXP
Semiconductors
NV
...................
142
36,403
QUALCOMM,
Inc.
........................
232
40,670
Security
Shares
Value
a
Semiconductors
&
Semiconductor
Equipment
(continued)
Texas
Instruments,
Inc.
.....................
441
$
94,524
424,997
a
Software
—
1
.5
%
ANSYS,
Inc.
(a)
...........................
61
19,607
Aspen
Technology,
Inc.
(a)
....................
25
5,854
Gen
Digital,
Inc.
..........................
226
5,980
Oracle
Corp.
............................
418
59,059
90,500
a
Specialized
REITs
—
3
.0
%
American
Tower
Corp.
.....................
177
39,659
Crown
Castle,
Inc.
........................
347
38,871
Digital
Realty
Trust,
Inc.
....................
152
23,045
Equinix,
Inc.
............................
40
33,374
Iron
Mountain,
Inc.
........................
178
20,160
Public
Storage
...........................
18
6,187
Weyerhaeuser
Co.
........................
505
15,397
176,693
a
Specialty
Retail
—
3
.6
%
Best
Buy
Co.,
Inc.
........................
193
19,377
CarMax,
Inc.
(a)
...........................
67
5,665
Home
Depot,
Inc.
(The)
....................
307
113,130
Lowe's
Companies,
Inc.
....................
172
42,742
TJX
Companies,
Inc.
(The)
..................
88
10,320
Tractor
Supply
Co.
........................
51
13,645
Ulta
Beauty,
Inc.
(a)
........................
17
5,998
210,877
a
Technology
Hardware,
Storage
&
Peripherals
—
0
.7
%
Hewlett
Packard
Enterprise
Co.
...............
983
19,041
HP,
Inc.
...............................
272
9,841
NetApp,
Inc.
............................
46
5,553
Western
Digital
Corp.
(a)
.....................
109
7,149
41,584
a
Textiles,
Apparel
&
Luxury
Goods
—
0
.1
%
Nike,
Inc.
,
Class
B
........................
72
5,999
a
Trading
Companies
&
Distributors
—
0
.7
%
Ferguson
Enterprises,
Inc.
...................
128
26,331
United
Rentals,
Inc.
.......................
20
14,825
41,156
a
Water
Utilities
—
0
.2
%
Essential
Utilities,
Inc.
......................
319
12,438
a
Total
Long-Term
Investments — 99.7%
(Cost:
$
5,328,810
)
..................................
5,885,759
Schedule
of
Investments
(continued)
August
31,
2024
iShares
®
ESG
Aware
MSCI
USA
Value
ETF
(Percentages
shown
are
based
on
Net
Assets)
2024
iShares
Annual
Financial
Statements
Derivative
Financial
Instruments
Outstanding
as
of
Period
End
Derivative
Financial
Instruments
Categorized
by
Risk
Exposure
As
of
period
end,
the
fair
values
of
derivative
financial
instruments
located
in
the
Statements
of
Assets
and
Liabilities
were
as
follows:
Security
Shares
Value
a
Short-Term
Securities
Money
Market
Funds
—
0
.3
%
BlackRock
Cash
Funds:
Institutional,
SL
Agency
Shares
,
5.45
%
(b)
(d)
(e)
.....................
5,298
$
5,301
BlackRock
Cash
Funds:
Treasury,
SL
Agency
Shares
,
5.25
%
(b)
(d)
............................
10,185
10,185
a
Total
Short-Term
Securities — 0.3%
(Cost:
$
15,485
)
....................................
15,486
Total
Investments
—
100.0%
(Cost:
$
5,344,295
)
..................................
5,901,245
Other
Assets
Less
Liabilities
—
0
.0
%
.....................
1,251
Net
Assets
—
100.0%
.................................
$
5,902,496
(a)
Non-income
producing
security.
(b)
Affiliate
of
the
Fund.
(c)
All
or
a
portion
of
this
security
is
on
loan.
(d)
Annualized
7-day
yield
as
of
period
end.
(e)
All
or
a
portion
of
this
security
was
purchased
with
the
cash
collateral
from
loaned
securities.
Affiliates
Investments
in
issuers
considered
to
be
affiliate(s)
of
the
Fund
during
the
year
ended
August
31,
2024
for
purposes
of
Section
2(a)(3)
of
the
Investment
Company
Act
of
1940,
as
amended,
were
as
follows:
Affiliated
Issuer
Value
at
08/31/23
Purchases
at
Cost
Proceeds
from
Sale
Net
Realized
Gain
(Loss)
Change
in
Unrealized
Appreciation
(Depreciation)
Value
at
08/31/24
Shares
Held
at
08/31/24
Income
Capital
Gain
Distributions
from
Underlying
Funds
BlackRock
Cash
Funds:
Institutional,
SL
Agency
Shares
$
4,259
$
1,045
(a)
$
—
$
(
4
)
$
1
$
5,301
5,298
$
68
(b)
$
—
BlackRock
Cash
Funds:
Treasury,
SL
Agency
Shares
4,698
5,487
(a)
—
—
—
10,185
10,185
507
—
BlackRock,
Inc.
...
18,214
9,041
(
15,209
)
756
3,431
16,233
18
469
—
$
752
$
3,432
$
31,719
$
1,044
$
—
(a)
Represents
net
amount
purchased
(sold).
(b)
All
or
a
portion
represents
securities
lending
income
earned
from
the
reinvestment
of
cash
collateral
from
loaned
securities,
net
of
fees
and
collateral
investment
expenses,
and
other
payments
to
and
from
borrowers
of
securities.
Futures
Contracts
Description
Number
of
Contracts
Expiration
Date
Notional
Amount
(000)
Value/
Unrealized
Appreciation
(Depreciation)
Long
Contracts
Micro
E-Mini
Russell
2000
Index
............................................................
1
09/20/24
$
11
$
967
Commodity
Contracts
Credit
Contracts
Equity
Contracts
Foreign
Currency
Exchange
Contracts
Interest
Rate
Contracts
Other
Contracts
Total
Assets
—
Derivative
Financial
Instruments
Futures
contracts
Unrealized
appreciation
on
futures
contracts
(a)
.............
$
—
$
—
$
967
$
—
$
—
$
—
$
967
(a)
Net
cumulative
unrealized
appreciation
(depreciation)
on
futures
contracts
are
reported
in
the
Schedule
of
Investments.
In
the
Statements
of
Assets
and
Liabilities,
only
current
day’s
variation
margin
is
reported
in
receivables
or
payables
and
the
net
cumulative
unrealized
appreciation
(depreciation)
is
included
in
accumulated
earnings
(loss).
iShares
®
ESG
Aware
MSCI
USA
Value
ETF
Schedule
of
Investments
(continued)
August
31,
2024
For
the period
ended
August
31,
2024,
the
effect
of
derivative
financial
instruments
in
the
Statements
of
Operations
was
as
follows:
Average
Quarterly
Balances
of
Outstanding
Derivative
Financial
Instruments
For
more
information
about
the
Fund’s
investment
risks
regarding
derivative
financial
instruments,
refer
to
the
Notes
to
Financial
Statements.
Fair
Value
Hierarchy
as
of
Period
End
Various
inputs
are
used
in
determining
the
fair
value
of
financial
instruments.
For
a
description
of
the
input
levels
and
information
about
the
Fund’s
policy
regarding
valuation
of
financial
instruments,
refer
to
the
Notes
to
Financial
Statements.
The
following
table
summarizes
the
Fund’s
financial
instruments
categorized
in
the
fair
value
hierarchy.
The
breakdown
of
the
Fund’s
financial
instruments
into
major
categories
is
disclosed
in
the
Schedule
of
Investments
above.
See
notes
to
financial
statements.
Commodity
Contracts
Credit
Contracts
Equity
Contracts
Foreign
Currency
Exchange
Contracts
Interest
Rate
Contracts
Other
Contracts
Total
Net
Realized
Gain
(Loss)
from
Futures
contracts
..................................
$
—
$
—
$
218
$
—
$
—
$
—
$
218
Net
Change
in
Unrealized
Appreciation
(Depreciation)
on
Futures
contracts
..................................
$
—
$
—
$
967
$
—
$
—
$
—
$
967
Futures
contracts
Average
notional
value
of
contracts
—
long
...................................................................................
$
7,616
a
Level
1
Level
2
Level
3
Total
Assets
Investments
Long-Term
Investments
Common
Stocks
.........................................
$
5,885,759
$
—
$
—
$
5,885,759
Short-Term
Securities
Money
Market
Funds
......................................
15,486
—
—
15,486
$
5,901,245
$
—
$
—
$
5,901,245
Derivative
Financial
Instruments
(a)
Assets
Equity
Contracts
...........................................
$
967
$
—
$
—
$
967
a
(a)
Derivative
financial
instruments
are
futures
contracts.
Futures
contracts
are
valued
at
the
unrealized
appreciation
(depreciation)
on
the
instrument.
Schedule
of
Investments
August
31,
2024
iShares
®
ESG
MSCI
USA
Leaders
ETF
(Percentages
shown
are
based
on
Net
Assets)
2024
iShares
Annual
Financial
Statements
Security
Shares
Value
a
Common
Stocks
Aerospace
&
Defense
—
0
.8
%
Axon
Enterprise,
Inc.
(a)
.....................
3,001
$
1,095,275
GE
Aerospace
...........................
45,639
7,969,482
9,064,757
a
Air
Freight
&
Logistics
—
0
.5
%
CH
Robinson
Worldwide,
Inc.
................
4,896
506,785
Expeditors
International
of
Washington,
Inc.
.......
5,958
735,277
United
Parcel
Service,
Inc.
,
Class
B
............
30,412
3,909,462
5,151,524
a
Automobile
Components
—
0
.1
%
Aptiv
PLC
(a)
.............................
11,294
807,860
a
Automobiles
—
2
.4
%
Rivian
Automotive,
Inc.
,
Class
A
(a)
(b)
.............
30,894
436,532
Tesla,
Inc.
(a)
.............................
119,674
25,623,400
26,059,932
a
Banks
—
1
.1
%
Citizens
Financial
Group,
Inc.
................
18,984
817,261
Huntington
Bancshares,
Inc.
.................
60,293
902,586
KeyCorp
...............................
39,312
670,663
PNC
Financial
Services
Group,
Inc.
(The)
........
16,594
3,071,383
Regions
Financial
Corp.
....................
38,056
891,272
Truist
Financial
Corp.
......................
55,791
2,480,468
U.S.
Bancorp
...........................
65,062
3,072,878
11,906,511
a
Beverages
—
2
.2
%
Coca-Cola
Co.
(The)
......................
170,637
12,366,063
Keurig
Dr
Pepper,
Inc.
.....................
45,216
1,655,358
PepsiCo,
Inc.
...........................
57,270
9,900,838
23,922,259
a
Biotechnology
—
1
.2
%
Amgen,
Inc.
............................
22,366
7,466,442
Biogen,
Inc.
(a)
...........................
6,075
1,243,917
Gilead
Sciences,
Inc.
......................
51,945
4,103,655
Neurocrine
Biosciences,
Inc.
(a)
................
4,208
534,668
13,348,682
a
Broadline
Retail
—
0
.5
%
eBay,
Inc.
..............................
20,931
1,237,022
MercadoLibre,
Inc.
(a)
.......................
1,902
3,921,277
5,158,299
a
Building
Products
—
0
.9
%
Allegion
PLC
............................
3,628
503,712
Carrier
Global
Corp.
.......................
33,810
2,460,692
Fortune
Brands
Innovations,
Inc.
..............
5,213
413,964
Johnson
Controls
International
PLC
............
28,220
2,055,827
Lennox
International,
Inc.
...................
1,327
783,182
Owens
Corning
..........................
3,605
608,272
Trane
Technologies
PLC
....................
9,438
3,413,347
10,238,996
a
Capital
Markets
—
3
.8
%
Ameriprise
Financial,
Inc.
...................
4,149
1,864,727
Bank
of
New
York
Mellon
Corp.
(The)
...........
30,769
2,099,061
BlackRock,
Inc.
(c)
.........................
6,195
5,586,713
Cboe
Global
Markets,
Inc.
...................
4,369
897,393
Charles
Schwab
Corp.
(The)
.................
62,987
4,100,454
FactSet
Research
Systems,
Inc.
...............
1,577
666,819
Franklin
Resources,
Inc.
....................
11,994
242,759
Intercontinental
Exchange,
Inc.
...............
23,915
3,863,468
Security
Shares
Value
a
Capital
Markets
(continued)
LPL
Financial
Holdings,
Inc.
..................
3,132
$
702,633
MarketAxess
Holdings,
Inc.
..................
1,567
379,825
Moody's
Corp.
...........................
6,852
3,341,995
Morgan
Stanley
..........................
50,792
5,262,559
Nasdaq,
Inc.
............................
18,029
1,299,530
Northern
Trust
Corp.
.......................
8,572
781,852
Raymond
James
Financial,
Inc.
...............
8,225
983,463
S&P
Global,
Inc.
.........................
13,346
6,849,701
State
Street
Corp.
........................
12,503
1,089,011
T
Rowe
Price
Group,
Inc.
...................
9,260
981,930
40,993,893
a
Chemicals
—
1
.7
%
Air
Products
and
Chemicals,
Inc.
..............
9,269
2,584,660
Ecolab,
Inc.
............................
10,716
2,713,077
International
Flavors
&
Fragrances,
Inc.
..........
10,682
1,110,821
Linde
PLC
.............................
20,043
9,585,565
LyondellBasell
Industries
NV
,
Class
A
...........
10,891
1,074,942
PPG
Industries,
Inc.
.......................
9,749
1,264,738
18,333,803
a
Commercial
Services
&
Supplies
—
0
.4
%
Cintas
Corp.
............................
3,808
3,065,897
Veralto
Corp.
............................
10,308
1,158,928
4,224,825
a
Communications
Equipment
—
0
.1
%
Juniper
Networks,
Inc.
.....................
13,436
522,392
a
Construction
&
Engineering
—
0
.2
%
EMCOR
Group,
Inc.
.......................
1,949
766,074
Quanta
Services,
Inc.
......................
6,104
1,679,393
2,445,467
a
Construction
Materials
—
0
.4
%
CRH
PLC
..............................
28,648
2,600,379
Martin
Marietta
Materials,
Inc.
................
2,557
1,365,847
3,966,226
a
Consumer
Finance
—
1
.0
%
Ally
Financial,
Inc.
........................
11,330
489,343
American
Express
Co.
.....................
24,001
6,207,859
Capital
One
Financial
Corp.
..................
15,924
2,339,713
Discover
Financial
Services
..................
10,396
1,442,029
Synchrony
Financial
.......................
16,473
827,933
11,306,877
a
Consumer
Staples
Distribution
&
Retail
—
0
.5
%
Albertsons
Companies,
Inc.
,
Class
A
............
15,694
307,916
Kroger
Co.
(The)
.........................
28,594
1,521,487
Target
Corp.
............................
19,289
2,963,176
Walgreens
Boots
Alliance,
Inc.
................
30,368
280,904
5,073,483
a
Containers
&
Packaging
—
0
.3
%
Avery
Dennison
Corp.
......................
3,333
739,426
Ball
Corp.
..............................
13,039
832,019
International
Paper
Co.
.....................
13,851
670,665
Smurfit
WestRock
PLC
.....................
21,653
1,026,785
3,268,895
a
Distributors
—
0
.2
%
Genuine
Parts
Co.
........................
5,848
837,784
LKQ
Corp.
.............................
11,050
459,570
Pool
Corp.
.............................
1,588
558,373
1,855,727
a
iShares
®
ESG
MSCI
USA
Leaders
ETF
Schedule
of
Investments
(continued)
August
31,
2024
(Percentages
shown
are
based
on
Net
Assets)
Security
Shares
Value
a
Diversified
Telecommunication
Services
—
0
.7
%
Verizon
Communications,
Inc.
................
175,502
$
7,332,474
a
Electric
Utilities
—
0
.4
%
Edison
International
.......................
16,058
1,397,528
Eversource
Energy
.......................
14,687
991,813
Exelon
Corp.
............................
41,695
1,588,162
NRG
Energy,
Inc.
.........................
8,692
738,907
4,716,410
a
Electrical
Equipment
—
0
.6
%
Eaton
Corp.
PLC
.........................
16,669
5,116,216
Rockwell
Automation,
Inc.
...................
4,748
1,291,599
6,407,815
a
Electronic
Equipment,
Instruments
&
Components
—
0
.2
%
Keysight
Technologies,
Inc.
(a)
.................
7,299
1,124,922
Trimble,
Inc.
(a)
...........................
10,112
573,249
1,698,171
a
Energy
Equipment
&
Services
—
0
.5
%
Baker
Hughes
Co.
,
Class
A
..................
41,450
1,457,796
Halliburton
Co.
..........................
36,862
1,146,040
Schlumberger
N.V.
........................
59,595
2,621,584
5,225,420
a
Entertainment
—
0
.9
%
Electronic
Arts,
Inc.
.......................
10,517
1,596,691
Take-Two
Interactive
Software,
Inc.
(a)
............
6,932
1,120,974
Walt
Disney
Co.
(The)
.....................
75,963
6,865,536
9,583,201
a
Financial
Services
—
4
.1
%
Equitable
Holdings,
Inc.
....................
13,257
563,688
Fidelity
National
Information
Services,
Inc.
........
23,193
1,912,263
Fiserv,
Inc.
(a)
............................
24,450
4,268,970
Mastercard,
Inc.
,
Class
A
....................
34,616
16,731,297
PayPal
Holdings,
Inc.
(a)
.....................
41,414
2,999,616
Visa,
Inc.
,
Class
A
........................
65,633
18,138,992
44,614,826
a
Food
Products
—
0
.6
%
Bunge
Global
SA
.........................
5,938
601,994
Campbell
Soup
Co.
.......................
8,026
399,053
Conagra
Brands,
Inc.
......................
19,799
617,729
General
Mills,
Inc.
........................
23,379
1,690,068
Hormel
Foods
Corp.
.......................
12,474
406,028
J
M
Smucker
Co.
(The)
.....................
4,396
504,133
Kellanova
..............................
11,457
923,549
Lamb
Weston
Holdings,
Inc.
.................
5,978
370,158
McCormick
&
Co.,
Inc.
,
NVS
.................
10,562
845,277
6,357,989
a
Gas
Utilities
—
0
.1
%
Atmos
Energy
Corp.
.......................
6,249
816,994
a
Ground
Transportation
—
1
.1
%
CSX
Corp.
.............................
81,510
2,793,348
JB
Hunt
Transport
Services,
Inc.
..............
3,424
593,037
Knight-Swift
Transportation
Holdings,
Inc.
,
Class
A
..
6,832
357,860
Old
Dominion
Freight
Line,
Inc.
...............
8,166
1,574,405
Union
Pacific
Corp.
.......................
25,439
6,514,673
11,833,323
a
Health
Care
Equipment
&
Supplies
—
1
.1
%
Align
Technology,
Inc.
(a)
.....................
2,964
703,120
Cooper
Companies,
Inc.
(The)
(a)
...............
8,346
882,423
Dexcom,
Inc.
(a)
..........................
16,581
1,149,727
Security
Shares
Value
a
Health
Care
Equipment
&
Supplies
(continued)
Edwards
Lifesciences
Corp.
(a)
................
25,125
$
1,757,745
GE
HealthCare
Technologies,
Inc.
.............
18,080
1,533,546
Hologic,
Inc.
(a)
...........................
9,723
789,896
IDEXX
Laboratories,
Inc.
(a)
...................
3,442
1,656,738
Insulet
Corp.
(a)
(b)
..........................
2,898
587,627
Solventum
Corp.
(a)
........................
6,080
389,789
STERIS
PLC
............................
4,139
997,913
Teleflex,
Inc.
............................
1,949
477,836
Zimmer
Biomet
Holdings,
Inc.
................
8,589
991,686
11,918,046
a
Health
Care
Providers
&
Services
—
1
.8
%
Cencora,
Inc.
...........................
7,484
1,792,942
Cigna
Group
(The)
........................
11,844
4,285,278
DaVita,
Inc.
(a)
............................
2,221
335,193
Elevance
Health,
Inc.
......................
9,690
5,396,264
HCA
Healthcare,
Inc.
......................
8,217
3,250,563
Henry
Schein,
Inc.
(a)
.......................
5,320
375,326
Humana,
Inc.
...........................
5,024
1,780,857
Labcorp
Holdings,
Inc.
.....................
3,530
811,512
Molina
Healthcare,
Inc.
(a)
....................
2,426
848,591
Quest
Diagnostics,
Inc.
.....................
4,655
730,695
19,607,221
a
Health
Care
REITs
—
0
.3
%
Healthpeak
Properties,
Inc.
..................
29,387
654,742
Welltower,
Inc.
...........................
24,930
3,008,553
3,663,295
a
Hotels,
Restaurants
&
Leisure
—
2
.1
%
Booking
Holdings,
Inc.
.....................
1,413
5,523,742
Darden
Restaurants,
Inc.
...................
5,014
792,964
Domino's
Pizza,
Inc.
.......................
1,444
598,119
DoorDash,
Inc.
,
Class
A
(a)
...................
12,731
1,638,607
Hilton
Worldwide
Holdings,
Inc.
...............
10,411
2,286,672
McDonald's
Corp.
........................
30,048
8,673,656
Royal
Caribbean
Cruises
Ltd.
(a)
(b)
..............
10,194
1,678,136
Yum!
Brands,
Inc.
........................
11,742
1,584,231
22,776,127
a
Household
Durables
—
0
.4
%
DR
Horton,
Inc.
..........................
12,369
2,334,773
NVR,
Inc.
(a)
.............................
131
1,201,592
PulteGroup,
Inc.
.........................
8,783
1,156,282
4,692,647
a
Household
Products
—
2
.2
%
Church
&
Dwight
Co.,
Inc.
...................
10,205
1,039,685
Clorox
Co.
(The)
.........................
5,212
825,112
Colgate-Palmolive
Co.
.....................
32,497
3,460,930
Kimberly-Clark
Corp.
......................
14,039
2,030,882
Procter
&
Gamble
Co.
(The)
.................
98,411
16,881,423
24,238,032
a
Industrial
Conglomerates
—
0
.3
%
3M
Co.
................................
23,029
3,101,776
a
Industrial
REITs
—
0
.5
%
Prologis,
Inc.
............................
38,603
4,934,235
a
Insurance
—
2
.3
%
Aflac,
Inc.
..............................
22,507
2,483,872
Allstate
Corp.
(The)
.......................
11,004
2,079,096
Arch
Capital
Group
Ltd.
(a)
...................
15,656
1,770,537
Assurant,
Inc.
...........................
2,154
422,938
Hartford
Financial
Services
Group,
Inc.
(The)
......
12,312
1,429,423
Schedule
of
Investments
(continued)
August
31,
2024
iShares
®
ESG
MSCI
USA
Leaders
ETF
(Percentages
shown
are
based
on
Net
Assets)
2024
iShares
Annual
Financial
Statements
Security
Shares
Value
a
Insurance
(continued)
Marsh
&
McLennan
Companies,
Inc.
............
20,578
$
4,681,701
Principal
Financial
Group,
Inc.
................
9,740
793,031
Progressive
Corp.
(The)
....................
24,420
6,158,724
Prudential
Financial,
Inc.
....................
14,968
1,813,523
Travelers
Companies,
Inc.
(The)
...............
9,548
2,177,612
Willis
Towers
Watson
PLC
...................
4,242
1,239,131
25,049,588
a
Interactive
Media
&
Services
—
6
.9
%
Alphabet,
Inc.
,
Class
A
.....................
244,913
40,013,886
Alphabet,
Inc.
,
Class
C
,
NVS
.................
210,778
34,801,556
74,815,442
IT
Services
—
1
.8
%
Accenture
PLC
,
Class
A
....................
26,117
8,930,708
Akamai
Technologies,
Inc.
(a)
..................
6,385
650,249
Gartner,
Inc.
(a)
...........................
3,225
1,586,571
International
Business
Machines
Corp.
..........
38,301
7,741,781
Twilio,
Inc.
,
Class
A
(a)
......................
6,780
425,513
19,334,822
a
Life
Sciences
Tools
&
Services
—
1
.4
%
Agilent
Technologies,
Inc.
...................
12,138
1,734,763
Avantor,
Inc.
(a)
...........................
28,127
726,802
Bio-Techne
Corp.
.........................
6,511
481,749
Danaher
Corp.
..........................
27,794
7,485,202
IQVIA
Holdings,
Inc.
(a)
......................
7,597
1,911,025
Mettler-Toledo
International,
Inc.
(a)
.............
893
1,285,099
Waters
Corp.
(a)
(b)
.........................
2,483
859,987
West
Pharmaceutical
Services,
Inc.
............
3,032
950,926
15,435,553
a
Machinery
—
2
.2
%
Caterpillar,
Inc.
..........................
20,391
7,261,235
CNH
Industrial
N.V.
.......................
36,104
373,315
Cummins,
Inc.
...........................
5,703
1,784,184
Deere
&
Co.
............................
10,915
4,210,352
Dover
Corp.
............................
5,749
1,069,486
Fortive
Corp.
............................
14,701
1,093,754
Graco,
Inc.
.............................
7,111
592,702
IDEX
Corp.
.............................
3,131
646,489
Illinois
Tool
Works,
Inc.
.....................
12,442
3,150,066
Ingersoll
Rand,
Inc.
.......................
16,831
1,539,195
Pentair
PLC
............................
6,971
618,258
Toro
Co.
(The)
...........................
4,325
400,495
Xylem,
Inc.
.............................
10,109
1,390,291
24,129,822
a
Media
—
0
.9
%
Charter
Communications,
Inc.
,
Class
A
(a)
.........
3,888
1,351,235
Comcast
Corp.
,
Class
A
....................
163,200
6,457,824
Fox
Corp.
,
Class
A
,
NVS
....................
9,638
398,724
Fox
Corp.
,
Class
B
........................
5,855
225,008
Interpublic
Group
of
Companies,
Inc.
(The)
.......
15,685
511,488
Omnicom
Group,
Inc.
......................
8,218
825,334
9,769,613
a
Metals
&
Mining
—
0
.4
%
Newmont
Corp.
..........................
48,080
2,566,991
Nucor
Corp.
............................
9,972
1,514,846
Steel
Dynamics,
Inc.
.......................
6,225
743,950
4,825,787
a
Mortgage
REITs
—
0
.0
%
Annaly
Capital
Management,
Inc.
..............
20,725
417,816
a
Security
Shares
Value
a
Multi-Utilities
—
0
.5
%
CMS
Energy
Corp.
........................
12,504
$
848,521
Consolidated
Edison,
Inc.
...................
14,419
1,464,394
NiSource,
Inc.
...........................
18,692
617,958
Sempra
...............................
26,386
2,168,401
5,099,274
a
Office
REITs
—
0
.0
%
BXP,
Inc.
..............................
6,156
463,054
a
Oil,
Gas
&
Consumable
Fuels
—
1
.4
%
Cheniere
Energy,
Inc.
......................
9,554
1,769,974
HF
Sinclair
Corp.
.........................
6,846
336,412
Marathon
Petroleum
Corp.
..................
14,690
2,601,893
ONEOK,
Inc.
............................
24,335
2,247,581
Phillips
66
..............................
17,716
2,485,732
Targa
Resources
Corp.
.....................
8,755
1,286,109
Valero
Energy
Corp.
.......................
13,646
2,002,278
Williams
Companies,
Inc.
(The)
...............
50,815
2,325,802
15,055,781
a
Passenger
Airlines
—
0
.0
%
Delta
Air
Lines,
Inc.
.......................
6,683
283,961
a
Pharmaceuticals
—
6
.4
%
Bristol-Myers
Squibb
Co.
....................
84,519
4,221,724
Catalent,
Inc.
(a)
..........................
7,493
456,773
Eli
Lilly
&
Co.
...........................
33,683
32,336,354
Johnson
&
Johnson
.......................
100,345
16,643,222
Merck
&
Co.,
Inc.
.........................
105,604
12,508,794
Zoetis,
Inc.
,
Class
A
.......................
19,025
3,490,897
69,657,764
a
Professional
Services
—
0
.8
%
Automatic
Data
Processing,
Inc.
...............
17,065
4,708,404
Broadridge
Financial
Solutions,
Inc.
............
4,927
1,048,761
Dayforce,
Inc.
(a)
(b)
.........................
6,584
376,407
Paychex,
Inc.
...........................
13,514
1,773,037
TransUnion
.............................
8,044
778,740
8,685,349
a
Real
Estate
Management
&
Development
—
0
.1
%
CBRE
Group,
Inc.
,
Class
A
(a)
.................
12,793
1,472,986
a
Semiconductors
&
Semiconductor
Equipment
—
15
.0
%
Advanced
Micro
Devices,
Inc.
(a)
...............
67,391
10,011,607
Applied
Materials,
Inc.
.....................
34,522
6,809,810
Enphase
Energy,
Inc.
(a)
.....................
5,710
691,138
First
Solar,
Inc.
(a)
.........................
4,258
968,141
Intel
Corp.
.............................
177,493
3,911,946
Lam
Research
Corp.
......................
5,451
4,475,325
Marvell
Technology,
Inc.
....................
36,091
2,751,578
NVIDIA
Corp.
...........................
1,025,683
122,435,780
NXP
Semiconductors
NV
...................
10,661
2,733,054
Texas
Instruments,
Inc.
.....................
37,962
8,136,775
162,925,154
a
Software
—
16
.9
%
Adobe,
Inc.
(a)
............................
18,488
10,619,692
ANSYS,
Inc.
(a)
...........................
3,651
1,173,504
Aspen
Technology,
Inc.
(a)
....................
1,182
276,754
Atlassian
Corp.
,
Class
A
(a)
...................
6,641
1,099,750
Autodesk,
Inc.
(a)
..........................
8,986
2,321,982
Cadence
Design
Systems,
Inc.
(a)
..............
11,346
3,051,280
DocuSign,
Inc.
(a)
.........................
8,507
503,700
Fair
Isaac
Corp.
(a)
.........................
1,031
1,783,908
Gen
Digital,
Inc.
..........................
23,740
628,160
iShares
®
ESG
MSCI
USA
Leaders
ETF
Schedule
of
Investments
(continued)
August
31,
2024
(Percentages
shown
are
based
on
Net
Assets)
Security
Shares
Value
a
Software
(continued)
HubSpot,
Inc.
(a)
..........................
2,019
$
1,007,622
Intuit,
Inc.
..............................
11,656
7,346,311
Manhattan
Associates,
Inc.
(a)
.................
2,551
674,561
Microsoft
Corp.
..........................
294,391
122,802,262
Palo
Alto
Networks,
Inc.
(a)
(b)
..................
13,501
4,897,083
PTC,
Inc.
(a)
.............................
5,015
898,136
Salesforce,
Inc.
..........................
40,402
10,217,666
ServiceNow,
Inc.
(a)
........................
8,547
7,307,685
Synopsys,
Inc.
(a)
.........................
6,388
3,319,077
Workday,
Inc.
,
Class
A
(a)
....................
8,839
2,326,336
Zscaler,
Inc.
(a)
...........................
3,781
756,124
183,011,593
a
Specialized
REITs
—
1
.4
%
American
Tower
Corp.
.....................
19,470
4,362,448
Crown
Castle,
Inc.
........................
18,117
2,029,466
Digital
Realty
Trust,
Inc.
....................
13,530
2,051,283
Equinix,
Inc.
............................
3,957
3,301,563
Iron
Mountain,
Inc.
........................
12,222
1,384,264
SBA
Communications
Corp.
,
Class
A
............
4,480
1,015,437
Weyerhaeuser
Co.
........................
30,566
931,957
15,076,418
a
Specialty
Retail
—
3
.4
%
AutoZone,
Inc.
(a)
.........................
715
2,274,758
Bath
&
Body
Works,
Inc.
....................
8,850
272,226
Best
Buy
Co.,
Inc.
........................
8,544
857,818
Burlington
Stores,
Inc.
(a)
....................
2,671
716,469
CarMax,
Inc.
(a)
...........................
6,519
551,181
Home
Depot,
Inc.
(The)
....................
41,345
15,235,632
Lowe's
Companies,
Inc.
....................
23,759
5,904,112
O'Reilly
Automotive,
Inc.
(a)
...................
2,456
2,775,206
TJX
Companies,
Inc.
(The)
..................
47,121
5,525,880
Tractor
Supply
Co.
........................
4,512
1,207,186
Ulta
Beauty,
Inc.
(a)
........................
1,998
704,974
Williams-Sonoma,
Inc.
.....................
5,363
720,412
36,745,854
a
Technology
Hardware,
Storage
&
Peripherals
—
0
.5
%
Hewlett
Packard
Enterprise
Co.
...............
54,405
1,053,825
HP,
Inc.
...............................
40,800
1,476,144
NetApp,
Inc.
............................
8,546
1,031,673
Security
Shares
Value
a
Technology
Hardware,
Storage
&
Peripherals
(continued)
Seagate
Technology
Holdings
PLC
.............
8,244
$
820,690
Western
Digital
Corp.
(a)
.....................
13,681
897,337
5,279,669
a
Textiles,
Apparel
&
Luxury
Goods
—
0
.6
%
Deckers
Outdoor
Corp.
(a)
....................
1,064
1,020,685
Lululemon
Athletica,
Inc.
(a)
...................
4,759
1,234,818
Nike,
Inc.
,
Class
B
........................
50,511
4,208,576
6,464,079
a
Trading
Companies
&
Distributors
—
0
.5
%
Ferguson
Enterprises,
Inc.
...................
8,402
1,728,375
United
Rentals,
Inc.
.......................
2,784
2,063,668
WW
Grainger,
Inc.
........................
1,843
1,815,208
5,607,251
a
Water
Utilities
—
0
.1
%
American
Water
Works
Co.,
Inc.
...............
8,144
1,165,569
Essential
Utilities,
Inc.
......................
10,759
419,494
1,585,063
a
Total
Long-Term
Investments — 99.7%
(Cost:
$
865,637,651
)
................................
1,082,360,103
a
Short-Term
Securities
Money
Market
Funds
—
0
.9
%
BlackRock
Cash
Funds:
Institutional,
SL
Agency
Shares
,
5.45
%
(c)
(d)
(e)
......................
6,729,409
6,733,446
BlackRock
Cash
Funds:
Treasury,
SL
Agency
Shares
,
5.25
%
(c)
(d)
............................
2,605,907
2,605,907
a
Total
Short-Term
Securities — 0.9%
(Cost:
$
9,338,595
)
..................................
9,339,353
Total
Investments
—
100.6%
(Cost:
$
874,976,246
)
................................
1,091,699,456
Liabilities
in
Excess
of
Other
Assets
—
(
0
.6
)
%
...............
(
6,300,012
)
Net
Assets
—
100.0%
.................................
$
1,085,399,444
(a)
Non-income
producing
security.
(b)
All
or
a
portion
of
this
security
is
on
loan.
(c)
Affiliate
of
the
Fund.
(d)
Annualized
7-day
yield
as
of
period
end.
(e)
All
or
a
portion
of
this
security
was
purchased
with
the
cash
collateral
from
loaned
securities.
Affiliates
Investments
in
issuers
considered
to
be
affiliate(s)
of
the
Fund
during
the
year
ended
August
31,
2024
for
purposes
of
Section
2(a)(3)
of
the
Investment
Company
Act
of
1940,
as
amended,
were
as
follows:
Affiliated
Issuer
Value
at
08/31/23
Purchases
at
Cost
Proceeds
from
Sale
Net
Realized
Gain
(Loss)
Change
in
Unrealized
Appreciation
(Depreciation)
Value
at
08/31/24
Shares
Held
at
08/31/24
Income
Capital
Gain
Distributions
from
Underlying
Funds
BlackRock
Cash
Funds:
Institutional,
SL
Agency
Shares
$
1,150,322
$
5,577,527
(a)
$
—
$
4,992
$
605
$
6,733,446
6,729,409
$
46,348
(b)
$
—
BlackRock
Cash
Funds:
Treasury,
SL
Agency
Shares
.
1,878,833
727,074
(a)
—
—
—
2,605,907
2,605,907
133,491
—
BlackRock,
Inc.
...
5,850,210
631,138
(
2,298,767
)
120,001
1,284,131
5,586,713
6,195
151,680
—
$
124,993
$
1,284,736
$
14,926,066
$
331,519
$
—
Schedule
of
Investments
(continued)
August
31,
2024
iShares
®
ESG
MSCI
USA
Leaders
ETF
2024
iShares
Annual
Financial
Statements
Derivative
Financial
Instruments
Outstanding
as
of
Period
End
Derivative
Financial
Instruments
Categorized
by
Risk
Exposure
As
of
period
end,
the
fair
values
of
derivative
financial
instruments
located
in
the
Statements
of
Assets
and
Liabilities
were
as
follows:
For
the period
ended
August
31,
2024,
the
effect
of
derivative
financial
instruments
in
the
Statements
of
Operations
was
as
follows:
Average
Quarterly
Balances
of
Outstanding
Derivative
Financial
Instruments
For
more
information
about
the
Fund’s
investment
risks
regarding
derivative
financial
instruments,
refer
to
the
Notes
to
Financial
Statements.
(a)
Represents
net
amount
purchased
(sold).
(b)
All
or
a
portion
represents
securities
lending
income
earned
from
the
reinvestment
of
cash
collateral
from
loaned
securities,
net
of
fees
and
collateral
investment
expenses,
and
other
payments
to
and
from
borrowers
of
securities.
Futures
Contracts
Description
Number
of
Contracts
Expiration
Date
Notional
Amount
(000)
Value/
Unrealized
Appreciation
(Depreciation)
Long
Contracts
E-Mini
S&P
500
Index
...................................................................
10
09/20/24
$
2,831
$
52,585
Commodity
Contracts
Credit
Contracts
Equity
Contracts
Foreign
Currency
Exchange
Contracts
Interest
Rate
Contracts
Other
Contracts
Total
Assets
—
Derivative
Financial
Instruments
Futures
contracts
Unrealized
appreciation
on
futures
contracts
(a)
.............
$
—
$
—
$
52,585
$
—
$
—
$
—
$
52,585
(a)
Net
cumulative
unrealized
appreciation
(depreciation)
on
futures
contracts
are
reported
in
the
Schedule
of
Investments.
In
the
Statements
of
Assets
and
Liabilities,
only
current
day’s
variation
margin
is
reported
in
receivables
or
payables
and
the
net
cumulative
unrealized
appreciation
(depreciation)
is
included
in
accumulated
earnings
(loss).
Commodity
Contracts
Credit
Contracts
Equity
Contracts
Foreign
Currency
Exchange
Contracts
Interest
Rate
Contracts
Other
Contracts
Total
Net
Realized
Gain
(Loss)
from
Futures
contracts
..................................
$
—
$
—
$
556,462
$
—
$
—
$
—
$
556,462
Net
Change
in
Unrealized
Appreciation
(Depreciation)
on
Futures
contracts
..................................
$
—
$
—
$
18,170
$
—
$
—
$
—
$
18,170
Futures
contracts
Average
notional
value
of
contracts
—
long
...................................................................................
$
3,068,444
a
iShares
®
ESG
MSCI
USA
Leaders
ETF
Schedule
of
Investments
(continued)
August
31,
2024
Fair
Value
Hierarchy
as
of
Period
End
Various
inputs
are
used
in
determining
the
fair
value
of
financial
instruments.
For
a
description
of
the
input
levels
and
information
about
the
Fund’s
policy
regarding
valuation
of
financial
instruments,
refer
to
the
Notes
to
Financial
Statements.
The
following
table
summarizes
the
Fund’s
financial
instruments
categorized
in
the
fair
value
hierarchy.
The
breakdown
of
the
Fund’s
financial
instruments
into
major
categories
is
disclosed
in
the
Schedule
of
Investments
above.
See
notes
to
financial
statements.
Level
1
Level
2
Level
3
Total
Assets
Investments
Long-Term
Investments
Common
Stocks
.........................................
$
1,082,360,103
$
—
$
—
$
1,082,360,103
Short-Term
Securities
Money
Market
Funds
......................................
9,339,353
—
—
9,339,353
$
1,091,699,456
$
—
$
—
$
1,091,699,456
Derivative
Financial
Instruments
(a)
Assets
Equity
Contracts
...........................................
$
52,585
$
—
$
—
$
52,585
a
(a)
Derivative
financial
instruments
are
futures
contracts.
Futures
contracts
are
valued
at
the
unrealized
appreciation
(depreciation)
on
the
instrument.
Schedule
of
Investments
August
31,
2024
iShares
®
Paris-Aligned
Climate
MSCI
USA
ETF
(Percentages
shown
are
based
on
Net
Assets)
2024
iShares
Annual
Financial
Statements
Security
Shares
Value
a
Common
Stocks
Aerospace
&
Defense
— 0.3%
Axon
Enterprise,
Inc.
(a)
.....................
17,137
$
6,254,491
a
Automobiles
— 2.5%
Rivian
Automotive,
Inc.,
Class
A
(a)(b)
.............
588,611
8,317,074
Tesla,
Inc.
(a)
.............................
194,267
41,594,507
49,911,581
a
Banks
— 1.7%
JPMorgan
Chase
&
Co.
....................
119,560
26,877,088
M&T
Bank
Corp.
.........................
9,740
1,676,351
U.S.
Bancorp
...........................
35,803
1,690,976
Wells
Fargo
&
Co.
........................
61,296
3,583,977
33,828,392
a
Beverages
— 0.7%
Brown-Forman
Corp.,
Class
B,
NVS
............
147,434
6,721,516
Constellation
Brands,
Inc.,
Class
A
.............
2,413
580,833
Keurig
Dr
Pepper,
Inc.
.....................
49,569
1,814,721
Monster
Beverage
Corp.
(a)(b)
..................
93,445
4,404,063
13,521,133
a
Biotechnology
— 1.9%
AbbVie,
Inc.
............................
73,702
14,468,440
Alnylam
Pharmaceuticals,
Inc.
(a)
...............
11,300
2,968,397
Amgen,
Inc.
............................
15,887
5,303,557
Biogen,
Inc.
(a)
...........................
7,446
1,524,643
BioMarin
Pharmaceutical,
Inc.
(a)
...............
17,156
1,564,799
Exact
Sciences
Corp.
(a)
.....................
3,509
216,470
Neurocrine
Biosciences,
Inc.
(a)
................
6,600
838,596
Regeneron
Pharmaceuticals,
Inc.
(a)
.............
5,377
6,370,078
Vertex
Pharmaceuticals,
Inc.
(a)
................
12,316
6,107,381
39,362,361
a
Broadline
Retail
— 3.8%
Amazon.com,
Inc.
(a)
.......................
382,345
68,248,583
eBay,
Inc.
..............................
58,598
3,463,142
MercadoLibre,
Inc.
(a)
.......................
2,961
6,104,575
77,816,300
a
Building
Products
— 0.1%
Allegion
PLC
............................
11,503
1,597,076
a
Capital
Markets
— 3.9%
Ameriprise
Financial,
Inc.
...................
1,910
858,430
Bank
of
New
York
Mellon
Corp.
(The)
...........
62,630
4,272,619
BlackRock,
Inc.
(c)
.........................
10,717
9,664,698
Cboe
Global
Markets,
Inc.
...................
11,462
2,354,295
Charles
Schwab
Corp.
(The)
.................
110,079
7,166,143
CME
Group,
Inc.,
Class
A
...................
29,787
6,426,247
Coinbase
Global,
Inc.,
Class
A
(a)
...............
1,429
262,021
FactSet
Research
Systems,
Inc.
...............
4,387
1,854,999
Intercontinental
Exchange,
Inc.
...............
37,584
6,071,695
KKR
&
Co.,
Inc.
..........................
23,308
2,884,831
MarketAxess
Holdings,
Inc.
..................
3,416
828,004
Moody's
Corp.
...........................
21,551
10,511,285
Nasdaq,
Inc.
............................
33,419
2,408,842
Northern
Trust
Corp.
.......................
19,308
1,761,083
Raymond
James
Financial,
Inc.
...............
2,735
327,024
S&P
Global,
Inc.
.........................
33,069
16,972,334
SEI
Investments
Co.
.......................
29,211
1,975,540
T
Rowe
Price
Group,
Inc.
...................
18,977
2,012,321
Tradeweb
Markets,
Inc.,
Class
A
...............
3,163
373,993
78,986,404
a
Security
Shares
Value
a
Chemicals
— 1.5%
Sherwin-Williams
Co.
(The)
..................
82,672
$
30,536,557
a
Commercial
Services
&
Supplies
— 0.9%
Cintas
Corp.
............................
8,244
6,637,409
Copart,
Inc.
(a)
...........................
54,973
2,911,370
Rollins,
Inc.
.............................
72,673
3,646,731
Veralto
Corp.
............................
36,927
4,151,703
17,347,213
a
Communications
Equipment
— 2.0%
Arista
Networks,
Inc.
(a)
.....................
9,036
3,193,142
Cisco
Systems,
Inc.
.......................
286,914
14,500,634
F5,
Inc.
(a)
..............................
31,376
6,374,034
Juniper
Networks,
Inc.
.....................
156,647
6,090,435
Motorola
Solutions,
Inc.
....................
22,557
9,971,096
40,129,341
a
Construction
&
Engineering
— 0.5%
AECOM
...............................
105,102
10,524,914
a
Consumer
Finance
— 0.5%
American
Express
Co.
.....................
30,300
7,837,095
Discover
Financial
Services
..................
14,731
2,043,337
9,880,432
a
Distributors
— 0.0%
Pool
Corp.
.............................
855
300,635
a
Diversified
REITs
— 0.0%
WP
Carey,
Inc.
..........................
8,281
555,005
a
Electric
Utilities
— 1.3%
Edison
International
.......................
311,331
27,095,137
a
Electrical
Equipment
— 0.5%
AMETEK,
Inc.
...........................
44,697
7,645,422
Rockwell
Automation,
Inc.
...................
12,041
3,275,513
10,920,935
a
Electronic
Equipment,
Instruments
&
Components
— 0.7%
Amphenol
Corp.,
Class
A
...................
46,383
3,128,533
CDW
Corp.
.............................
20,900
4,715,876
Keysight
Technologies,
Inc.
(a)
.................
19,354
2,982,838
TE
Connectivity
Ltd.
.......................
6,768
1,039,565
Trimble,
Inc.
(a)
...........................
40,695
2,307,000
14,173,812
a
Entertainment
— 1.1%
Liberty
Media
Corp.-Liberty
Formula
One,
Series
C,
NVS
(a)
...............................
17,438
1,361,036
Netflix,
Inc.
(a)
............................
20,323
14,253,536
Take-Two
Interactive
Software,
Inc.
(a)
............
2,856
461,844
Walt
Disney
Co.
(The)
.....................
75,534
6,826,763
22,903,179
a
Financial
Services
— 3.7%
Berkshire
Hathaway,
Inc.,
Class
B
(a)
............
24,700
11,755,224
Corpay,
Inc.
(a)(b)
..........................
5,756
1,816,306
Fidelity
National
Information
Services,
Inc.
........
12,348
1,018,093
Fiserv,
Inc.
(a)
............................
33,110
5,781,006
Global
Payments,
Inc.
.....................
12,554
1,393,619
Jack
Henry
&
Associates,
Inc.
................
1,496
258,853
Mastercard,
Inc.,
Class
A
....................
38,359
18,540,439
PayPal
Holdings,
Inc.
(a)
.....................
41,390
2,997,878
Visa,
Inc.,
Class
A
........................
114,323
31,595,447
75,156,865
a
iShares
®
Paris-Aligned
Climate
MSCI
USA
ETF
Schedule
of
Investments
(continued)
August
31,
2024
(Percentages
shown
are
based
on
Net
Assets)
Security
Shares
Value
a
Food
Products
— 0.1%
Hershey
Co.
(The)
........................
6,053
$
1,168,592
a
Ground
Transportation
— 0.6%
Old
Dominion
Freight
Line,
Inc.
...............
19,964
3,849,059
Uber
Technologies,
Inc.
(a)
...................
39,313
2,874,960
Union
Pacific
Corp.
.......................
18,855
4,828,577
11,552,596
a
Health
Care
Equipment
&
Supplies
— 2.7%
Align
Technology,
Inc.
(a)
.....................
2,649
628,396
Becton
Dickinson
&
Co.
....................
9,732
2,359,134
Boston
Scientific
Corp.
(a)
....................
77,454
6,334,963
Cooper
Companies,
Inc.
(The)
(a)
...............
21,192
2,240,630
Dexcom,
Inc.
(a)
..........................
19,726
1,367,801
Edwards
Lifesciences
Corp.
(a)
................
112,042
7,838,458
Hologic,
Inc.
(a)
...........................
22,600
1,836,024
IDEXX
Laboratories,
Inc.
(a)
...................
17,926
8,628,322
Insulet
Corp.
(a)
...........................
3,626
735,244
Intuitive
Surgical,
Inc.
(a)
.....................
14,866
7,323,438
Medtronic
PLC
..........................
40,360
3,575,089
ResMed,
Inc.
...........................
10,532
2,580,551
Stryker
Corp.
...........................
18,994
6,845,817
Teleflex,
Inc.
............................
4,037
989,751
Zimmer
Biomet
Holdings,
Inc.
................
14,253
1,645,651
54,929,269
a
Health
Care
Providers
&
Services
— 1.5%
Elevance
Health,
Inc.
......................
11,812
6,577,985
Quest
Diagnostics,
Inc.
.....................
2,372
372,333
UnitedHealth
Group,
Inc.
....................
39,218
23,146,463
30,096,781
a
Health
Care
REITs
— 1.1%
Alexandria
Real
Estate
Equities,
Inc.
............
96,272
11,511,243
Healthpeak
Properties,
Inc.
..................
304,601
6,786,510
Ventas,
Inc.
............................
11,934
741,221
Welltower,
Inc.
...........................
34,215
4,129,066
23,168,040
a
Health
Care
Technology
— 0.1%
Veeva
Systems,
Inc.,
Class
A
(a)
...............
7,078
1,531,962
a
Hotels,
Restaurants
&
Leisure
— 2.1%
Airbnb,
Inc.,
Class
A
(a)
......................
25,089
2,943,191
Booking
Holdings,
Inc.
.....................
160
625,477
Chipotle
Mexican
Grill,
Inc.
(a)
.................
46,380
2,600,990
Hilton
Worldwide
Holdings,
Inc.
...............
8,294
1,821,694
Marriott
International,
Inc.,
Class
A
.............
6,890
1,617,014
McDonald's
Corp.
........................
78,601
22,688,965
Starbucks
Corp.
..........................
64,147
6,066,382
Wynn
Resorts
Ltd.
........................
4,680
359,798
Yum!
Brands,
Inc.
........................
27,395
3,696,133
42,419,644
a
Household
Durables
— 0.2%
Garmin
Ltd.
.............................
25,762
4,721,917
a
Household
Products
— 0.1%
Church
&
Dwight
Co.,
Inc.
...................
27,262
2,777,453
a
Industrial
REITs
— 0.9%
Prologis,
Inc.
............................
140,825
18,000,251
a
Insurance
— 3.8%
Aflac,
Inc.
..............................
113,062
12,477,522
Allstate
Corp.
(The)
.......................
17,767
3,356,897
Security
Shares
Value
a
Insurance
(continued)
American
Financial
Group,
Inc.
...............
30,965
$
4,137,543
Aon
PLC,
Class
A
........................
4,387
1,507,900
Arch
Capital
Group
Ltd.
(a)
...................
55,687
6,297,643
Arthur
J
Gallagher
&
Co.
....................
8,556
2,503,229
Brown
&
Brown,
Inc.
.......................
41,723
4,386,339
Chubb
Ltd.
.............................
29,585
8,407,465
Cincinnati
Financial
Corp.
...................
20,342
2,787,464
Erie
Indemnity
Co.,
Class
A,
NVS
..............
5,072
2,577,743
Hartford
Financial
Services
Group,
Inc.
(The)
......
33,991
3,946,355
Markel
Group,
Inc.
(a)
.......................
2,083
3,334,216
Marsh
&
McLennan
Companies,
Inc.
............
31,613
7,192,274
MetLife,
Inc.
............................
41,374
3,205,657
Progressive
Corp.
(The)
....................
31,254
7,882,259
Willis
Towers
Watson
PLC
...................
9,544
2,787,898
76,788,404
a
Interactive
Media
&
Services
— 5.8%
Alphabet,
Inc.,
Class
A
.....................
129,483
21,154,933
Alphabet,
Inc.,
Class
C,
NVS
.................
290,001
47,882,065
Match
Group,
Inc.
(a)
.......................
12,989
483,321
Meta
Platforms,
Inc.,
Class
A
.................
91,682
47,794,743
Pinterest,
Inc.,
Class
A
(a)
....................
15,026
481,433
Snap,
Inc.,
Class
A,
NVS
(a)
..................
27,556
257,373
118,053,868
a
IT
Services
— 1.7%
Accenture
PLC,
Class
A
....................
23,382
7,995,475
Gartner,
Inc.
(a)
...........................
960
472,282
International
Business
Machines
Corp.
..........
118,720
23,996,874
Okta,
Inc.,
Class
A
(a)
.......................
3,463
272,642
Snowflake,
Inc.,
Class
A
(a)
...................
3,183
363,594
VeriSign,
Inc.
(a)
..........................
10,054
1,848,930
34,949,797
a
Life
Sciences
Tools
&
Services
— 2.0%
Avantor,
Inc.
(a)
...........................
8,393
216,875
Bio-Rad
Laboratories,
Inc.,
Class
A
(a)
............
2,336
787,980
Bio-Techne
Corp.
.........................
62,133
4,597,221
Danaher
Corp.
..........................
29,590
7,968,883
Illumina,
Inc.
(a)
...........................
12,861
1,689,935
IQVIA
Holdings,
Inc.
(a)
......................
4,160
1,046,448
Mettler-Toledo
International,
Inc.
(a)
.............
3,346
4,815,162
Revvity,
Inc.
(b)
...........................
24,829
3,042,546
Thermo
Fisher
Scientific,
Inc.
.................
21,264
13,078,848
Waters
Corp.
(a)
..........................
1,704
590,180
West
Pharmaceutical
Services,
Inc.
............
12,091
3,792,100
41,626,178
a
Machinery
— 2.5%
Fortive
Corp.
............................
66,030
4,912,632
Graco,
Inc.
.............................
58,547
4,879,893
IDEX
Corp.
.............................
34,919
7,210,075
Ingersoll
Rand,
Inc.
.......................
35,055
3,205,780
Pentair
PLC
............................
39,051
3,463,433
Westinghouse
Air
Brake
Technologies
Corp.
.......
3,265
553,646
Xylem,
Inc.
.............................
195,670
26,910,495
51,135,954
a
Media
— 0.5%
Charter
Communications,
Inc.,
Class
A
(a)(b)
........
7,104
2,468,924
Comcast
Corp.,
Class
A
....................
115,736
4,579,673
Fox
Corp.,
Class
A,
NVS
....................
13,060
540,292
Fox
Corp.,
Class
B
........................
21,559
828,513
Trade
Desk,
Inc.
(The),
Class
A
(a)
..............
13,543
1,415,650
9,833,052
a
Schedule
of
Investments
(continued)
August
31,
2024
iShares
®
Paris-Aligned
Climate
MSCI
USA
ETF
(Percentages
shown
are
based
on
Net
Assets)
2024
iShares
Annual
Financial
Statements
Security
Shares
Value
a
Mortgage
REITs
— 0.0%
Annaly
Capital
Management,
Inc.
..............
9,169
$
184,847
a
Office
REITs
— 0.4%
BXP,
Inc.
..............................
120,711
9,079,881
a
Personal
Care
Products
— 0.0%
Estee
Lauder
Companies,
Inc.
(The),
Class
A
......
5,051
462,975
a
Pharmaceuticals
— 5.9%
Bristol-Myers
Squibb
Co.
....................
142,596
7,122,670
Catalent,
Inc.
(a)
..........................
14,236
867,827
Eli
Lilly
&
Co.
...........................
46,804
44,932,776
Johnson
&
Johnson
.......................
123,403
20,467,622
Merck
&
Co.,
Inc.
.........................
148,933
17,641,114
Pfizer,
Inc.
.............................
301,126
8,735,665
Royalty
Pharma
PLC,
Class
A
................
207,885
6,034,901
Zoetis,
Inc.,
Class
A
.......................
77,602
14,239,191
120,041,766
a
Professional
Services
— 0.9%
Automatic
Data
Processing,
Inc.
...............
21,386
5,900,611
Booz
Allen
Hamilton
Holding
Corp.,
Class
A
.......
7,384
1,172,431
Equifax,
Inc.
............................
8,105
2,489,289
Paychex,
Inc.
...........................
36,926
4,844,691
Paycom
Software,
Inc.
.....................
1,051
171,082
SS&C
Technologies
Holdings,
Inc.
.............
2,999
225,195
Verisk
Analytics,
Inc.
.......................
11,219
3,060,768
17,864,067
a
Real
Estate
Management
&
Development
— 0.2%
CoStar
Group,
Inc.
(a)
.......................
38,247
2,956,493
Zillow
Group,
Inc.,
Class
C,
NVS
(a)
.............
4,385
242,491
3,198,984
a
Residential
REITs
— 0.8%
AvalonBay
Communities,
Inc.
................
45,954
10,373,197
Equity
Residential
........................
31,805
2,381,558
Essex
Property
Trust,
Inc.
...................
8,418
2,540,468
15,295,223
a
Retail
REITs
— 0.6%
Realty
Income
Corp.
.......................
94,726
5,883,432
Regency
Centers
Corp.
....................
31,471
2,287,627
Simon
Property
Group,
Inc.
..................
18,711
3,131,286
11,302,345
a
Semiconductors
&
Semiconductor
Equipment
— 13.1%
Advanced
Micro
Devices,
Inc.
(a)
...............
87,416
12,986,521
Analog
Devices,
Inc.
.......................
61,924
14,542,232
Broadcom,
Inc.
..........................
224,363
36,530,784
Enphase
Energy,
Inc.
(a)
.....................
74,318
8,995,451
First
Solar,
Inc.
(a)
.........................
69,488
15,799,487
Intel
Corp.
.............................
257,012
5,664,544
KLA
Corp.
..............................
6,407
5,250,088
Marvell
Technology,
Inc.
....................
86,155
6,568,457
NVIDIA
Corp.
...........................
1,155,720
137,958,296
QUALCOMM,
Inc.
........................
42,972
7,532,992
Texas
Instruments,
Inc.
.....................
68,147
14,606,628
266,435,480
a
Software
— 11.4%
Adobe,
Inc.
(a)
............................
22,354
12,840,361
ANSYS,
Inc.
(a)
...........................
3,473
1,116,292
Autodesk,
Inc.
(a)
..........................
13,473
3,481,423
Fortinet,
Inc.
(a)
...........................
30,855
2,366,887
Intuit,
Inc.
..............................
18,161
11,446,152
Security
Shares
Value
a
Software
(continued)
Microsoft
Corp.
..........................
337,467
$
140,770,984
Oracle
Corp.
............................
94,561
13,360,524
Palo
Alto
Networks,
Inc.
(a)(b)
..................
14,185
5,145,183
Roper
Technologies,
Inc.
....................
6,081
3,371,367
Salesforce,
Inc.
..........................
51,376
12,992,990
ServiceNow,
Inc.
(a)
........................
23,810
20,357,550
Tyler
Technologies,
Inc.
(a)
...................
1,580
928,835
Workday,
Inc.,
Class
A
(a)
....................
6,168
1,623,356
Zoom
Video
Communications,
Inc.,
Class
A
(a)
......
10,546
728,518
230,530,422
a
Specialized
REITs
— 3.4%
American
Tower
Corp.
.....................
23,871
5,348,536
Crown
Castle,
Inc.
........................
6,339
710,095
Digital
Realty
Trust,
Inc.
....................
195,437
29,630,204
Equinix,
Inc.
............................
19,996
16,683,862
Extra
Space
Storage,
Inc.
...................
12,493
2,211,261
Public
Storage
...........................
16,600
5,705,752
VICI
Properties,
Inc.
.......................
276,236
9,248,381
69,538,091
a
Specialty
Retail
— 1.3%
Home
Depot,
Inc.
(The)
....................
39,486
14,550,591
Ross
Stores,
Inc.
.........................
22,162
3,337,819
TJX
Companies,
Inc.
(The)
..................
54,541
6,396,023
Ulta
Beauty,
Inc.
(a)
........................
4,012
1,415,594
25,700,027
a
Technology
Hardware,
Storage
&
Peripherals
— 7.2%
Apple,
Inc.
.............................
639,253
146,388,937
a
Textiles,
Apparel
&
Luxury
Goods
— 0.2%
Lululemon
Athletica,
Inc.
(a)
...................
9,525
2,471,452
Nike,
Inc.,
Class
B
........................
19,981
1,664,817
4,136,269
a
Trading
Companies
&
Distributors
— 0.2%
Fastenal
Co.
............................
64,637
4,413,414
United
Rentals,
Inc.
.......................
683
506,281
4,919,695
a
Water
Utilities
— 0.9%
American
Water
Works
Co.,
Inc.
...............
123,646
17,696,216
a
Total
Long-Term
Investments — 99.8%
(Cost:
$1,620,743,868)
...............................
2,026,330,746
a
Short-Term
Securities
Money
Market
Funds
—
0.9%
BlackRock
Cash
Funds:
Institutional,
SL
Agency
Shares,
5.45%
(c)(d)(e)
......................
16,257,988
16,267,743
BlackRock
Cash
Funds:
Treasury,
SL
Agency
Shares,
5.25%
(c)(d)
............................
2,360,904
2,360,904
a
Total
Short-Term
Securities — 0.9%
(Cost:
$18,625,299)
.................................
18,628,647
Total
Investments
—
100.7%
(Cost:
$1,639,369,167)
...............................
2,044,959,393
Liabilities
in
Excess
of
Other
Assets
—
(0.7)%
...............
(14,718,936)
Net
Assets
—
100.0%
.................................
$
2,030,240,457
iShares
®
Paris-Aligned
Climate
MSCI
USA
ETF
Schedule
of
Investments
(continued)
August
31,
2024
Derivative
Financial
Instruments
Outstanding
as
of
Period
End
Derivative
Financial
Instruments
Categorized
by
Risk
Exposure
As
of
period
end,
the
fair
values
of
derivative
financial
instruments
located
in
the
Statements
of
Assets
and
Liabilities
were
as
follows:
(a)
Non-income
producing
security.
(b)
All
or
a
portion
of
this
security
is
on
loan.
(c)
Affiliate
of
the
Fund.
(d)
Annualized
7-day
yield
as
of
period
end.
(e)
All
or
a
portion
of
this
security
was
purchased
with
the
cash
collateral
from
loaned
securities.
Affiliates
Investments
in
issuers
considered
to
be
affiliate(s)
of
the
Fund
during
the
year
ended
August
31,
2024
for
purposes
of
Section
2(a)(3)
of
the
Investment
Company
Act
of
1940,
as
amended,
were
as
follows:
Affiliated
Issuer
Value
at
08/31/23
Purchases
at
Cost
Proceeds
from
Sale
Net
Realized
Gain
(Loss)
Change
in
Unrealized
Appreciation
(Depreciation)
Value
at
08/31/24
Shares
Held
at
08/31/24
Income
Capital
Gain
Distributions
from
Underlying
Funds
BlackRock
Cash
Funds:
Institutional,
SL
Agency
Shares
$
18,112,745
$
—
$
(1,856,680
)
(a)
$
10,761
$
917
$
16,267,743
16,257,988
$
333,714
(b)
$
—
BlackRock
Cash
Funds:
Treasury,
SL
Agency
Shares
2,674,081
—
(
313,177
)
(a)
—
—
2,360,904
2,360,904
144,926
—
BlackRock,
Inc.
...
6,798,741
2,428,251
(1,640,894
)
295,554
1,783,046
9,664,698
10,717
201,501
—
$
306,315
$
1,783,963
$
28,293,345
$
680,141
$
—
(a)
Represents
net
amount
purchased
(sold).
(b)
All
or
a
portion
represents
securities
lending
income
earned
from
the
reinvestment
of
cash
collateral
from
loaned
securities,
net
of
fees
and
collateral
investment
expenses,
and
other
payments
to
and
from
borrowers
of
securities.
Futures
Contracts
Description
Number
of
Contracts
Expiration
Date
Notional
Amount
(000)
Value/
Unrealized
Appreciation
(Depreciation)
Long
Contracts
E-Mini
Health
Care
Select
Sector
Index
.......................................................
7
09/20/24
$
1,113
$
59,283
E-Mini
NASDAQ
100
Index
...............................................................
7
09/20/24
2,747
15,203
$
74,486
Commodity
Contracts
Credit
Contracts
Equity
Contracts
Foreign
Currency
Exchange
Contracts
Interest
Rate
Contracts
Other
Contracts
Total
Assets
—
Derivative
Financial
Instruments
Futures
contracts
Unrealized
appreciation
on
futures
contracts
(a)
.............
$
—
$
—
$
74,486
$
—
$
—
$
—
$
74,486
(a)
Net
cumulative
unrealized
appreciation
(depreciation)
on
futures
contracts
are
reported
in
the
Schedule
of
Investments.
In
the
Statements
of
Assets
and
Liabilities,
only
current
day’s
variation
margin
is
reported
in
receivables
or
payables
and
the
net
cumulative
unrealized
appreciation
(depreciation)
is
included
in
accumulated
earnings
(loss).
Schedule
of
Investments
(continued)
August
31,
2024
iShares
®
Paris-Aligned
Climate
MSCI
USA
ETF
2024
iShares
Annual
Financial
Statements
For
the period
ended
August
31,
2024,
the
effect
of
derivative
financial
instruments
in
the
Statements
of
Operations
was
as
follows:
Average
Quarterly
Balances
of
Outstanding
Derivative
Financial
Instruments
For
more
information
about
the
Fund’s
investment
risks
regarding
derivative
financial
instruments,
refer
to
the
Notes
to
Financial
Statements.
Fair
Value
Hierarchy
as
of
Period
End
Various
inputs
are
used
in
determining
the
fair
value
of
financial
instruments.
For
a
description
of
the
input
levels
and
information
about
the
Fund’s
policy
regarding
valuation
of
financial
instruments,
refer
to
the
Notes
to
Financial
Statements.
The
following
table
summarizes
the
Fund’s
financial
instruments
categorized
in
the
fair
value
hierarchy.
The
breakdown
of
the
Fund’s
financial
instruments
into
major
categories
is
disclosed
in
the
Schedule
of
Investments
above.
See
notes
to
financial
statements.
Commodity
Contracts
Credit
Contracts
Equity
Contracts
Foreign
Currency
Exchange
Contracts
Interest
Rate
Contracts
Other
Contracts
Total
Net
Realized
Gain
(Loss)
from
Futures
contracts
..................................
$
—
$
—
$
597,454
$
—
$
—
$
—
$
597,454
Net
Change
in
Unrealized
Appreciation
(Depreciation)
on
Futures
contracts
..................................
$
—
$
—
$
(28,025
)
$
—
$
—
$
—
$
(28,025
)
Futures
contracts
Average
notional
value
of
contracts
—
long
...................................................................................
$
3,775,158
a
Level
1
Level
2
Level
3
Total
Assets
Investments
Long-Term
Investments
Common
Stocks
.........................................
$
2,026,330,746
$
—
$
—
$
2,026,330,746
Short-Term
Securities
Money
Market
Funds
......................................
18,628,647
—
—
18,628,647
$
2,044,959,393
$
—
$
—
$
2,044,959,393
Derivative
Financial
Instruments
(a)
Assets
Equity
Contracts
...........................................
$
74,486
$
—
$
—
$
74,486
a
(a)
Derivative
financial
instruments
are
futures
contracts.
Futures
contracts
are
valued
at
the
unrealized
appreciation
(depreciation)
on
the
instrument.
Statements
of
Assets
and
Liabilities
Statements
of
Assets
and
Liabilities
August
31,
2024
See
notes
to
financial
statements.
iShares
ESG
Aware
MSCI
USA
ETF
iShares
ESG
Aware
MSCI
USA
Growth
ETF
iShares
ESG
Aware
MSCI
USA
Small-Cap
ETF
iShares
ESG
Aware
MSCI
USA
Value
ETF
ASSETS
Investments,
at
value
—
unaffiliated
(a)
(b)
......................................
$
12,920,996,842
$
8,099,918
$
1,805,787,827
$
5,869,526
Investments,
at
value
—
affiliated
(c)
.........................................
121,662,691
57,436
101,834,011
31,719
Cash
pledged:
Futures
contracts
...................................................
2,929,000
—
432,000
1,000
Receivables:
Investments
sold
...................................................
653,686,450
366,137
88,080,303
491,077
Securities
lending
income
—
affiliated
.....................................
9,894
1
70,873
2
Capital
shares
sold
..................................................
—
—
—
1,172
Dividends
—
unaffiliated
..............................................
15,029,605
3,614
1,301,147
11,844
Dividends
—
affiliated
................................................
164,488
44
23,975
52
Variation
margin
on
futures
contracts
......................................
485,467
—
41,837
137
Total
assets
........................................................
13,714,964,437
8,527,150
1,997,571,973
6,406,529
LIABILITIES
Due
to
broker
.......................................................
—
—
704,249
—
Collateral
on
securities
loaned
............................................
66,616,221
46,714
94,837,505
5,302
Payables:
Investments
purchased
...............................................
659,015,922
368,482
90,161,997
491,332
Capital
shares
redeemed
..............................................
—
—
—
6,520
Investment
advisory
fees
..............................................
1,604,037
1,204
249,594
879
Total
liabilities
.......................................................
727,236,180
416,400
185,953,345
504,033
Commitments
and
contingent
liabilities
NET
ASSETS
.......................................................
$
12,987,728,257
$
8,110,750
$
1,811,618,628
$
5,902,496
NET
ASSETS
CONSIST
OF:
Paid-in
capital
.......................................................
$
12,245,699,350
$
7,154,366
$
1,742,979,127
$
5,395,418
Accumulated
earnings
.................................................
742,028,907
956,384
68,639,501
507,078
NET
ASSETS
.......................................................
$
12,987,728,257
$
8,110,750
$
1,811,618,628
$
5,902,496
NET
ASSET
VALUE
Shares
outstanding
...................................................
104,850,000
200,000
43,800,000
200,000
Net
asset
value
......................................................
$
123.87
$
40.55
$
41.36
$
29.51
Shares
authorized
....................................................
Unlimited
Unlimited
Unlimited
Unlimited
Par
value
..........................................................
None
None
None
None
(a)
Securities
loaned,
at
value
............................................
$
59,880,251
$
46,129
$
92,539,913
$
5,168
(b)
Investments,
at
cost
—
unaffiliated
.......................................
$
10,487,237,752
$
7,059,449
$
1,565,403,368
$
5,314,483
(c)
Investments,
at
cost
—
affiliated
.........................................
$
118,266,826
$
57,436
$
101,771,159
$
29,812
2024
iShares
Annual
Financial
Statements
Statements
of
Assets
and
Liabilities
(continued)
August
31,
2024
See
notes
to
financial
statements.
iShares
ESG
MSCI
USA
Leaders
ETF
iShares
Paris-Aligned
Climate
MSCI
USA
ETF
ASSETS
Investments,
at
value
—
unaffiliated
(a)
(b)
.....................................................................
$
1,076,773,390
$
2,016,666,048
Investments,
at
value
—
affiliated
(c)
........................................................................
14,926,066
28,293,345
Cash
pledged:
Futures
contracts
..................................................................................
182,000
207,000
Receivables:
Investments
sold
..................................................................................
5,455,061
2,327,502
Securities
lending
income
—
affiliated
....................................................................
583
2,814
Dividends
—
unaffiliated
.............................................................................
1,180,789
1,799,360
Dividends
—
affiliated
...............................................................................
10,131
12,494
Variation
margin
on
futures
contracts
.....................................................................
32,785
39,165
Total
assets
.......................................................................................
1,098,560,805
2,049,347,728
LIABILITIES
Collateral
on
securities
loaned
...........................................................................
6,736,751
16,253,480
Payables:
Investments
purchased
..............................................................................
6,335,619
2,668,569
Capital
shares
redeemed
.............................................................................
—
18,059
Investment
advisory
fees
.............................................................................
88,991
167,163
Total
liabilities
......................................................................................
13,161,361
19,107,271
Commitments
and
contingent
liabilities
NET
ASSETS
......................................................................................
$
1,085,399,444
$
2,030,240,457
NET
ASSETS
CONSIST
OF:
Paid-in
capital
......................................................................................
$
954,455,865
$
1,655,135,176
Accumulated
earnings
................................................................................
130,943,579
375,105,281
NET
ASSETS
......................................................................................
$
1,085,399,444
$
2,030,240,457
NET
ASSET
VALUE
Shares
outstanding
..................................................................................
10,900,000
32,650,000
Net
asset
value
.....................................................................................
$
99.58
$
62.18
Shares
authorized
...................................................................................
Unlimited
Unlimited
Par
value
.........................................................................................
None
None
(a)
Securities
loaned,
at
value
...........................................................................
$
6,656,429
$
15,972,369
(b)
Investments,
at
cost
—
unaffiliated
......................................................................
$
860,407,225
$
1,612,731,223
(c)
Investments,
at
cost
—
affiliated
........................................................................
$
14,569,021
$
26,637,944
Statements
of
Operations
Year
Ended
August
31,
2024
See
notes
to
financial
statements.
iShares
ESG
Aware
MSCI
USA
ETF
iShares
ESG
Aware
MSCI
USA
Growth
ETF
iShares
ESG
Aware
MSCI
USA
Small-Cap
ETF
iShares
ESG
Aware
MSCI
USA
Value
ETF
INVESTMENT
INCOME
Dividends
—
unaffiliated
............................................
$
183,856,722
$
28,828
$
20,372,662
$
113,072
Dividends
—
affiliated
..............................................
2,628,630
505
223,332
976
Interest
—
unaffiliated
..............................................
189,672
18
40,138
10
Securities
lending
income
—
affiliated
—
net
...............................
198,442
78
728,725
68
Foreign
taxes
withheld
.............................................
(
166,318
)
(
76
)
(
14,339
)
(
101
)
Total
investment
income
..............................................
186,707,148
29,353
21,350,518
114,025
EXPENSES
Investment
advisory
...............................................
19,165,717
10,614
2,555,261
8,174
Interest
expense
.................................................
3
1
—
8
Total
expenses
....................................................
19,165,720
10,615
2,555,261
8,182
Net
investment
income
...............................................
167,541,428
18,738
18,795,257
105,843
—
—
—
—
REALIZED
AND
UNREALIZED
GAIN
(LOSS)
Net
realized
gain
(loss)
from:
Investments
—
unaffiliated
.........................................
(
91,567,518
)
(
62,724
)
(
56,218,924
)
3,324
Investments
—
affiliated
...........................................
421,272
(
308
)
6,989
39
Futures
contracts
...............................................
10,225,046
793
866,369
218
In-kind
redemptions
—
unaffiliated
(a)
...................................
997,623,231
1,391,550
28,659,203
280,472
In-kind
redemptions
—
affiliated
(a)
....................................
926,483
—
—
713
917,628,514
1,329,311
(
26,686,363
)
284,766
Net
change
in
unrealized
appreciation
(depreciation)
on:
Investments
—
unaffiliated
.........................................
1,951,792,581
63,461
246,320,024
590,856
Investments
—
affiliated
...........................................
2,769,901
(
1
)
15,668
3,432
Futures
contracts
...............................................
(
615,278
)
—
170,255
967
1,953,947,204
63,460
246,505,947
595,255
Net
realized
and
unrealized
gain
........................................
2,871,575,718
1,392,771
219,819,584
880,021
NET
INCREASE
IN
NET
ASSETS
RESULTING
FROM
OPERATIONS
...............
$
3,039,117,146
$
1,411,509
$
238,614,841
$
985,864
(a)
See
Note
2
of
the
Notes
to
Financial
Statements.
2024
iShares
Annual
Financial
Statements
Statements
of
Operations
(continued)
Year
Ended
August
31,
2024
See
notes
to
financial
statements.
iShares
ESG
MSCI
USA
Leaders
ETF
iShares
Paris-Aligned
Climate
MSCI
USA
ETF
INVESTMENT
INCOME
Dividends
—
unaffiliated
............................................................................
$
14,157,212
$
19,595,015
Dividends
—
affiliated
..............................................................................
285,171
346,427
Interest
—
unaffiliated
..............................................................................
10,037
12,556
Securities
lending
income
—
affiliated
—
net
...............................................................
46,348
333,714
Foreign
taxes
withheld
.............................................................................
(
9,095
)
(
2,541
)
Total
investment
income
..............................................................................
14,489,673
20,285,171
EXPENSES
Investment
advisory
...............................................................................
1,095,637
1,683,491
Interest
expense
.................................................................................
1
—
Total
expenses
....................................................................................
1,095,638
1,683,491
Net
investment
income
...............................................................................
13,394,035
18,601,680
—
—
REALIZED
AND
UNREALIZED
GAIN
(LOSS)
Net
realized
gain
(loss)
from:
Investments
—
unaffiliated
.........................................................................
(
4,215,758
)
(
12,392,982
)
Investments
—
affiliated
...........................................................................
(
31,507
)
12,733
Futures
contracts
...............................................................................
556,462
597,454
In-kind
redemptions
—
unaffiliated
(a)
...................................................................
89,583,927
103,447,102
In-kind
redemptions
—
affiliated
(a)
....................................................................
156,500
293,582
86,049,624
91,957,889
Net
change
in
unrealized
appreciation
(depreciation)
on:
Investments
—
unaffiliated
.........................................................................
158,842,554
291,794,331
Investments
—
affiliated
...........................................................................
1,284,736
1,783,963
Futures
contracts
...............................................................................
18,170
(
28,025
)
160,145,460
293,550,269
Net
realized
and
unrealized
gain
........................................................................
246,195,084
385,508,158
NET
INCREASE
IN
NET
ASSETS
RESULTING
FROM
OPERATIONS
...............................................
$
259,589,119
$
404,109,838
(a)
See
Note
2
of
the
Notes
to
Financial
Statements.
Statements
of
Changes
in
Net
Assets
Statements
of
Changes
in
Net
Assets
See
notes
to
financial
statements.
iShares
ESG
Aware
MSCI
USA
ETF
iShares
ESG
Aware
MSCI
USA
Growth
ETF
Year
Ended
08/31/24
Year
Ended
08/31/23
Year
Ended
08/31/24
Period
From
01/31/23
(a)
to
08/31/23
INCREASE
(DECREASE)
IN
NET
ASSETS
OPERATIONS
Net
investment
income
.........................................
$
167,541,428
$
265,400,305
$
18,738
$
13,168
Net
realized
gain
(loss)
.........................................
917,628,514
1,167,339,918
1,329,311
(
27,157
)
Net
change
in
unrealized
appreciation
(depreciation)
.....................
1,953,947,204
335,543,629
63,460
977,009
Net
increase
in
net
assets
resulting
from
operations
........................
3,039,117,146
1,768,283,852
1,411,509
963,020
DISTRIBUTIONS
TO
SHAREHOLDERS
(b)
Decrease
in
net
assets
resulting
from
distributions
to
shareholders
..............
(
167,716,956
)
(
299,525,568
)
(
17,879
)
(
8,725
)
CAPITAL
SHARE
TRANSACTIONS
Net
increase
(decrease)
in
net
assets
derived
from
capital
share
transactions
......
(
2,708,499,065
)
(
10,838,359,355
)
1,696,327
4,066,498
NET
ASSETS
Total
increase
(decrease)
in
net
assets
................................
162,901,125
(
9,369,601,071
)
3,089,957
5,020,793
Beginning
of
period
.............................................
12,824,827,132
22,194,428,203
5,020,793
—
End
of
period
.................................................
$
12,987,728,257
$
12,824,827,132
$
8,110,750
$
5,020,793
(a)
Commencement
of
operations.
(b)
Distributions
for
annual
periods
determined
in
accordance
with
U.S.
federal
income
tax
regulations.
2024
iShares
Annual
Financial
Statements
Statements
of
Changes
in
Net
Assets
(continued)
See
notes
to
financial
statements.
iShares
ESG
Aware
MSCI
USA
Small-Cap
ETF
iShares
ESG
Aware
MSCI
USA
Value
ETF
Year
Ended
08/31/24
Year
Ended
08/31/23
Year
Ended
08/31/24
Period
From
01/31/23
(a)
to
08/31/23
INCREASE
(DECREASE)
IN
NET
ASSETS
OPERATIONS
Net
investment
income
.........................................
$
18,795,257
$
19,907,542
$
105,843
$
61,708
Net
realized
gain
(loss)
.........................................
(
26,686,363
)
33,582,091
284,766
(
82,612
)
Net
change
in
unrealized
appreciation
(depreciation)
.....................
246,505,947
52,617,686
595,255
(
37,338
)
Net
increase
(decrease)
in
net
assets
resulting
from
operations
................
238,614,841
106,107,319
985,864
(
58,242
)
DISTRIBUTIONS
TO
SHAREHOLDERS
(b)
Decrease
in
net
assets
resulting
from
distributions
to
shareholders
..............
(
18,566,377
)
(
21,620,054
)
(
102,690
)
(
37,227
)
CAPITAL
SHARE
TRANSACTIONS
Net
increase
(decrease)
in
net
assets
derived
from
capital
share
transactions
......
187,992,696
(
160,006,934
)
1,058,677
4,056,114
NET
ASSETS
Total
increase
(decrease)
in
net
assets
................................
408,041,160
(
75,519,669
)
1,941,851
3,960,645
Beginning
of
period
.............................................
1,403,577,468
1,479,097,137
3,960,645
—
End
of
period
.................................................
$
1,811,618,628
$
1,403,577,468
$
5,902,496
$
3,960,645
(a)
Commencement
of
operations.
(b)
Distributions
for
annual
periods
determined
in
accordance
with
U.S.
federal
income
tax
regulations.
Statements
of
Changes
in
Net
Assets
Statements
of
Changes
in
Net
Assets
(continued)
See
notes
to
financial
statements.
iShares
ESG
MSCI
USA
Leaders
ETF
iShares
Paris-Aligned
Climate
MSCI
USA
ETF
Year
Ended
08/31/24
Year
Ended
08/31/23
Year
Ended
08/31/24
Year
Ended
08/31/23
INCREASE
(DECREASE)
IN
NET
ASSETS
OPERATIONS
Net
investment
income
.........................................
$
13,394,035
$
40,619,626
$
18,601,680
$
13,137,751
Net
realized
gain
(loss)
.........................................
86,049,624
595,291,557
91,957,889
(
1,045,884
)
Net
change
in
unrealized
appreciation
(depreciation)
.....................
160,145,460
(
237,898,685
)
293,550,269
183,255,399
Net
increase
in
net
assets
resulting
from
operations
........................
259,589,119
398,012,498
404,109,838
195,347,266
DISTRIBUTIONS
TO
SHAREHOLDERS
(a)
Decrease
in
net
assets
resulting
from
distributions
to
shareholders
..............
(
13,649,428
)
(
47,370,942
)
(
17,622,634
)
(
11,538,632
)
CAPITAL
SHARE
TRANSACTIONS
Net
increase
(decrease)
in
net
assets
derived
from
capital
share
transactions
......
(
299,846,767
)
(
2,327,985,279
)
153,979,428
549,083,534
NET
ASSETS
Total
increase
(decrease)
in
net
assets
................................
(
53,907,076
)
(
1,977,343,723
)
540,466,632
732,892,168
Beginning
of
year
...............................................
1,139,306,520
3,116,650,243
1,489,773,825
756,881,657
End
of
year
...................................................
$
1,085,399,444
$
1,139,306,520
$
2,030,240,457
$
1,489,773,825
(a)
Distributions
for
annual
periods
determined
in
accordance
with
U.S.
federal
income
tax
regulations.
2024
iShares
Annual
Financial
Statements
Financial
Highlights
(For
a
share
outstanding
throughout
each
period)
See
notes
to
financial
statements.
iShares
ESG
Aware
MSCI
USA
ETF
Year
Ended
08/31/24
Year
Ended
08/31/23
Year
Ended
08/31/22
Year
Ended
08/31/21
Year
Ended
08/31/20
Net
asset
value,
beginning
of
year
..........................
$
99.22
$
88.13
$
103.69
$
79.74
$
64.33
Net
investment
income
(a)
................................
1
.42
1
.37
1
.29
1
.18
1
.22
Net
realized
and
unrealized
gain
(loss)
(b)
......................
24.64
11.23
(
15.62
)
23.87
15.13
Net
increase
(decrease)
from
investment
operations
...............
26.06
12.60
(
14.33
)
25.05
16.35
Distributions
from
net
investment
income
(c)
......................
(
1
.41
)
(
1
.51
)
(
1
.23
)
(
1
.10
)
(
0
.94
)
Net
asset
value,
end
of
year
..............................
$
123.87
$
99.22
$
88.13
$
103.69
$
79.74
Total
Return
(d)
–
–
–
–
–
Based
on
net
asset
value
.................................
26.51
%
14.57
%
(
13.96
)
%
31.71
%
25.79
%
Ratios
to
Average
Net
Assets
(e)
–
–
–
–
–
Total
expenses
........................................
0
.15
%
0
.15
%
0
.15
%
0
.15
%
0
.15
%
Net
investment
income
...................................
1
.31
%
1
.54
%
1
.32
%
1
.30
%
1
.76
%
Supplemental
Data
Net
assets,
end
of
year
(000)
...............................
$
12,987,728
$
12,824,827
$
22,194,428
$
22,262,630
$
8,991,145
Portfolio
turnover
rate
(f)
...................................
22
%
25
%
22
%
21
%
38
%
(a)
Based
on
average
shares
outstanding.
(b)
The
amounts
reported
for
a
share
outstanding
may
not
accord
with
the
change
in
aggregate
gains
and
losses
in
securities
for
the
fiscal
period
due
to
the
timing
of
capital
share
transactions
in
relation
to
the
fluctuating
market
values
of
the
Fund’s
underlying
securities.
(c)
Distributions
for
annual
periods
determined
in
accordance
with
U.S.
federal
income
tax
regulations.
(d)
Where
applicable,
assumes
the
reinvestment
of
distributions.
(e)
Excludes
fees
and
expenses
incurred
indirectly
as
a
result
of
investments
in
underlying
funds.
(f)
Portfolio
turnover
rate
excludes
in-kind
transactions,
if
any.
Financial
Highlights
(continued)
(For
a
share
outstanding
throughout
each
period)
See
notes
to
financial
statements.
iShares
ESG
Aware
MSCI
USA
Growth
ETF
Year
Ended
08/31/24
Period
From
01/31/23
(a)
to
08/31/23
Net
asset
value,
beginning
of
period
......................................................................
$
31.38
$
25.42
Net
investment
income
(b)
..............................................................................
0
.11
0
.08
Net
realized
and
unrealized
gain
(c)
........................................................................
9
.17
5
.93
Net
increase
from
investment
operations
.....................................................................
9
.28
6
.01
Distributions
from
net
investment
income
(d)
....................................................................
(
0
.11
)
(
0
.05
)
Net
asset
value,
end
of
period
...........................................................................
$
40.55
$
31.38
Total
Return
(e)
–
–
Based
on
net
asset
value
...............................................................................
29.66
%
23.72
%
(f)
Ratios
to
Average
Net
Assets
(g)
–
–
Total
expenses
......................................................................................
0
.18
%
0
.18
%
(h)
Net
investment
income
.................................................................................
0
.32
%
0
.50
%
(h)
Supplemental
Data
Net
assets,
end
of
period
(000)
...........................................................................
$
8,111
$
5,021
Portfolio
turnover
rate
(i)
.................................................................................
36
%
20
%
(a)
Commencement
of
operations.
(b)
Based
on
average
shares
outstanding.
(c)
The
amounts
reported
for
a
share
outstanding
may
not
accord
with
the
change
in
aggregate
gains
and
losses
in
securities
for
the
fiscal
period
due
to
the
timing
of
capital
share
transactions
in
relation
to
the
fluctuating
market
values
of
the
Fund’s
underlying
securities.
(d)
Distributions
for
annual
periods
determined
in
accordance
with
U.S.
federal
income
tax
regulations.
(e)
Where
applicable,
assumes
the
reinvestment
of
distributions.
(f)
Not
annualized.
(g)
Excludes
fees
and
expenses
incurred
indirectly
as
a
result
of
investments
in
underlying
funds.
(h)
Annualized.
(i)
Portfolio
turnover
rate
excludes
in-kind
transactions,
if
any.
2024
iShares
Annual
Financial
Statements
Financial
Highlights
(continued)
(For
a
share
outstanding
throughout
each
period)
See
notes
to
financial
statements.
iShares
ESG
Aware
MSCI
USA
Small-Cap
ETF
Year
Ended
08/31/24
Year
Ended
08/31/23
Year
Ended
08/31/22
Year
Ended
08/31/21
Year
Ended
08/31/20
Net
asset
value,
beginning
of
year
..........................
$
35.90
$
33.85
$
40.26
$
27.34
$
26.21
Net
investment
income
(a)
................................
0
.47
0
.48
0
.42
0
.35
0
.33
Net
realized
and
unrealized
gain
(loss)
(b)
......................
5
.46
2
.09
(
6
.43
)
12.95
1
.10
Net
increase
(decrease)
from
investment
operations
...............
5
.93
2
.57
(
6
.01
)
13.30
1
.43
Distributions
from
net
investment
income
(c)
......................
(
0
.47
)
(
0
.52
)
(
0
.40
)
(
0
.38
)
(
0
.30
)
Net
asset
value,
end
of
year
..............................
$
41.36
$
35.90
$
33.85
$
40.26
$
27.34
Total
Return
(d)
–
–
–
–
–
Based
on
net
asset
value
.................................
16.70
%
7
.75
%
(
15.03
)
%
48.95
%
5
.57
%
Ratios
to
Average
Net
Assets
(e)
–
–
–
–
–
Total
expenses
........................................
0
.17
%
0
.17
%
0
.17
%
0
.17
%
0
.17
%
Net
investment
income
...................................
1
.25
%
1
.41
%
1
.15
%
0
.96
%
1
.32
%
Supplemental
Data
Net
assets,
end
of
year
(000)
...............................
$
1,811,619
$
1,403,577
$
1,479,097
$
1,099,038
$
366,339
Portfolio
turnover
rate
(f)
...................................
35
%
37
%
37
%
33
%
50
%
(a)
Based
on
average
shares
outstanding.
(b)
The
amounts
reported
for
a
share
outstanding
may
not
accord
with
the
change
in
aggregate
gains
and
losses
in
securities
for
the
fiscal
period
due
to
the
timing
of
capital
share
transactions
in
relation
to
the
fluctuating
market
values
of
the
Fund’s
underlying
securities.
(c)
Distributions
for
annual
periods
determined
in
accordance
with
U.S.
federal
income
tax
regulations.
(d)
Where
applicable,
assumes
the
reinvestment
of
distributions.
(e)
Excludes
fees
and
expenses
incurred
indirectly
as
a
result
of
investments
in
underlying
funds.
(f)
Portfolio
turnover
rate
excludes
in-kind
transactions,
if
any.
Financial
Highlights
(continued)
(For
a
share
outstanding
throughout
each
period)
See
notes
to
financial
statements.
iShares
ESG
Aware
MSCI
USA
Value
ETF
Year
Ended
08/31/24
Period
From
01/31/23
(a)
to
08/31/23
Net
asset
value,
beginning
of
period
......................................................................
$
24.75
$
25.35
Net
investment
income
(b)
..............................................................................
0
.61
0
.39
Net
realized
and
unrealized
gain
(loss)
(c)
....................................................................
4
.76
(
0
.76
)
Net
increase
(decrease)
from
investment
operations
.............................................................
5
.37
(
0
.37
)
Distributions
from
net
investment
income
(d)
....................................................................
(
0
.61
)
(
0
.23
)
Net
asset
value,
end
of
period
...........................................................................
$
29.51
$
24.75
Total
Return
(e)
–
–
Based
on
net
asset
value
...............................................................................
22.12
%
(
1
.38
)
%
(f)
Ratios
to
Average
Net
Assets
(g)
–
–
Total
expenses
......................................................................................
0
.18
%
0
.18
%
(h)
Net
investment
income
.................................................................................
2
.33
%
2
.72
%
(h)
Supplemental
Data
Net
assets,
end
of
period
(000)
...........................................................................
$
5,902
$
3,961
Portfolio
turnover
rate
(i)
.................................................................................
38
%
21
%
(a)
Commencement
of
operations.
(b)
Based
on
average
shares
outstanding.
(c)
The
amounts
reported
for
a
share
outstanding
may
not
accord
with
the
change
in
aggregate
gains
and
losses
in
securities
for
the
fiscal
period
due
to
the
timing
of
capital
share
transactions
in
relation
to
the
fluctuating
market
values
of
the
Fund’s
underlying
securities.
(d)
Distributions
for
annual
periods
determined
in
accordance
with
U.S.
federal
income
tax
regulations.
(e)
Where
applicable,
assumes
the
reinvestment
of
distributions.
(f)
Not
annualized.
(g)
Excludes
fees
and
expenses
incurred
indirectly
as
a
result
of
investments
in
underlying
funds.
(h)
Annualized.
(i)
Portfolio
turnover
rate
excludes
in-kind
transactions,
if
any.
2024
iShares
Annual
Financial
Statements
Financial
Highlights
(continued)
(For
a
share
outstanding
throughout
each
period)
See
notes
to
financial
statements.
iShares
ESG
MSCI
USA
Leaders
ETF
Year
Ended
08/31/24
Year
Ended
08/31/23
Year
Ended
08/31/22
Year
Ended
08/31/21
Year
Ended
08/31/20
Net
asset
value,
beginning
of
year
..........................
$
79.67
$
68.20
$
79.65
$
60.55
$
50.77
Net
investment
income
(a)
................................
1
.07
1
.08
1
.00
0
.94
0
.94
Net
realized
and
unrealized
gain
(loss)
(b)
......................
19.91
11.45
(
11.48
)
19.08
9
.75
Net
increase
(decrease)
from
investment
operations
...............
20.98
12.53
(
10.48
)
20.02
10.69
Distributions
from
net
investment
income
(c)
......................
(
1
.07
)
(
1
.06
)
(
0
.97
)
(
0
.92
)
(
0
.91
)
Net
asset
value,
end
of
year
..............................
$
99.58
$
79.67
$
68.20
$
79.65
$
60.55
Total
Return
(d)
–
–
–
–
–
Based
on
net
asset
value
.................................
26.57
%
18.66
%
(
13.29
)
%
33.44
%
21.45
%
Ratios
to
Average
Net
Assets
(e)
–
–
–
–
–
Total
expenses
........................................
0
.10
%
0
.10
%
0
.10
%
0
.10
%
0
.10
%
Net
investment
income
...................................
1
.22
%
1
.55
%
1
.32
%
1
.38
%
1
.77
%
Supplemental
Data
Net
assets,
end
of
year
(000)
...............................
$
1,085,399
$
1,139,307
$
3,116,650
$
4,077,962
$
2,564,228
Portfolio
turnover
rate
(f)
...................................
8
%
14
%
10
%
12
%
9
%
(a)
Based
on
average
shares
outstanding.
(b)
The
amounts
reported
for
a
share
outstanding
may
not
accord
with
the
change
in
aggregate
gains
and
losses
in
securities
for
the
fiscal
period
due
to
the
timing
of
capital
share
transactions
in
relation
to
the
fluctuating
market
values
of
the
Fund’s
underlying
securities.
(c)
Distributions
for
annual
periods
determined
in
accordance
with
U.S.
federal
income
tax
regulations.
(d)
Where
applicable,
assumes
the
reinvestment
of
distributions.
(e)
Excludes
fees
and
expenses
incurred
indirectly
as
a
result
of
investments
in
underlying
funds.
(f)
Portfolio
turnover
rate
excludes
in-kind
transactions,
if
any.
Financial
Highlights
(continued)
(For
a
share
outstanding
throughout
each
period)
See
notes
to
financial
statements.
iShares
Paris-Aligned
Climate
MSCI
USA
ETF
Year
Ended
08/31/24
Year
Ended
08/31/23
Period
From
02/08/22
(a)
to
08/31/22
Net
asset
value,
beginning
of
period
......................................................
$
49.91
$
43.50
$
50.43
Net
investment
income
(b)
..............................................................
0
.60
0
.55
0
.32
Net
realized
and
unrealized
gain
(loss)
(c)
....................................................
12.25
6
.38
(
7
.08
)
Net
increase
(decrease)
from
investment
operations
.............................................
12.85
6
.93
(
6
.76
)
Distributions
from
net
investment
income
(d)
....................................................
(
0
.58
)
(
0
.52
)
(
0
.17
)
Net
asset
value,
end
of
period
...........................................................
$
62.18
$
49.91
$
43.50
Total
Return
(e)
–
–
–
Based
on
net
asset
value
...............................................................
25.98
%
16.13
%
(
13.42
)
%
(f)
Ratios
to
Average
Net
Assets
(g)
–
–
–
Total
expenses
......................................................................
0
.10
%
0
.10
%
0
.11
%
(h)
Total
expenses
after
fees
waived
..........................................................
0
.10
%
0
.10
%
0
.10
%
(h)
Net
investment
income
.................................................................
1
.10
%
1
.23
%
1
.26
%
(h)
Supplemental
Data
Net
assets,
end
of
period
(000)
...........................................................
$
2,030,240
$
1,489,774
$
756,882
Portfolio
turnover
rate
(i)
.................................................................
11
%
12
%
6
%
(a)
Commencement
of
operations.
(b)
Based
on
average
shares
outstanding.
(c)
The
amounts
reported
for
a
share
outstanding
may
not
accord
with
the
change
in
aggregate
gains
and
losses
in
securities
for
the
fiscal
period
due
to
the
timing
of
capital
share
transactions
in
relation
to
the
fluctuating
market
values
of
the
Fund’s
underlying
securities.
(d)
Distributions
for
annual
periods
determined
in
accordance
with
U.S.
federal
income
tax
regulations.
(e)
Where
applicable,
assumes
the
reinvestment
of
distributions.
(f)
Not
annualized.
(g)
Excludes
fees
and
expenses
incurred
indirectly
as
a
result
of
investments
in
underlying
funds.
(h)
Annualized.
(i)
Portfolio
turnover
rate
excludes
in-kind
transactions,
if
any.
Notes
to
Financial
Statements
2024
iShares
Annual
Financial
Statements
1.
Organization
iShares
Trust
(the
“Trust”)
is
registered
under
the
Investment
Company
Act
of
1940,
as
amended
(the
“1940
Act”),
as
an
open-end
management
investment
company.
The
Trust
is
organized
as
a
Delaware
statutory
trust
and
is
authorized
to
have
multiple
series
or
portfolios.
These
financial
statements
relate
only
to
the
following
funds
(each,
a
“Fund”
and
collectively,
the
“Funds”):
2.
Significant
Accounting
Policies
The
financial
statements
are
prepared
in
conformity
with
accounting
principles
generally
accepted
in
the
United
States
of
America
(“U.S.
GAAP”),
which
may
require
management
to
make
estimates
and
assumptions
that
affect
the
reported
amounts
of
assets
and
liabilities
in
the
financial
statements,
disclosure
of
contingent
assets
and
liabilities
at
the
date
of
the
financial
statements
and
the
reported
amounts
of
increases
and
decreases
in
net
assets
from
operations
during
the
reporting
period.
Actual
results
could
differ
from
those
estimates. Each
Fund
is
considered
an
investment
company
under
U.S.
GAAP
and
follows
the
accounting
and
reporting
guidance
applicable
to
investment
companies.
Below
is
a
summary
of
significant
accounting
policies:
Investment
Transactions
and
Income
Recognition:
For
financial
reporting
purposes,
investment
transactions
are
recorded
on
the
dates
the
transactions
are
executed.
Realized
gains
and
losses
on
investment
transactions
are
determined
using
the
specific
identification
method. Dividend
income
and
capital
gain
distributions,
if
any,
are
recorded
on
the
ex-dividend
date.
Non-cash
dividends,
if
any,
are
recorded
on
the
ex-dividend
date
at
fair
value. Dividends
from
foreign
securities
where
the
ex-dividend
date
may
have
passed
are
subsequently
recorded
when
the
Funds
are
informed
of
the
ex-dividend
date.
Under
the
applicable
foreign
tax
laws,
a
withholding
tax
at
various
rates
may
be
imposed
on
capital
gains,
dividends
and
interest. Upon
notification
from
issuers
or
as
estimated
by
management,
a
portion
of
the
dividend
income
received
from
a
real
estate
investment
trust
may
be
redesignated
as
a
reduction
of
cost
of
the
related
investment
and/or
realized
gain. Interest
income,
including
amortization
and
accretion
of
premiums
and
discounts
on
debt
securities,
is
recognized
daily
on
an
accrual
basis.
Foreign
Taxes:
The
Funds
may
be
subject
to
foreign
taxes
(a
portion
of
which
may
be
reclaimable)
on
income,
stock
dividends,
capital
gains
on
investments,
or
certain
foreign
currency
transactions.
All
foreign
taxes
are
recorded
in
accordance
with
the
applicable
foreign
tax
regulations
and
rates
that
exist
in
the
foreign
jurisdictions
in
which
each
Fund
invests.
These
foreign
taxes,
if
any,
are
paid
by
each
Fund
and
are
reflected
in
its
Statements
of
Operations
as
follows:
foreign
taxes
withheld
at
source
are
presented
as
a
reduction
of
income,
foreign
taxes
on
securities
lending
income
are
presented
as
a
reduction
of
securities
lending
income,
foreign
taxes
on
stock
dividends
are
presented
as
“Other
foreign
taxes”,
and
foreign
taxes
on
capital
gains
from
sales
of
investments
and
foreign
taxes
on
foreign
currency
transactions
are
included
in
their
respective
net
realized
gain
(loss)
categories.
Foreign
taxes
payable
or
deferred
as
of
August
31,
2024,
if
any,
are
disclosed
in
the
Statements
of
Assets
and
Liabilities.
The Funds
file
withholding
tax
reclaims
in
certain
jurisdictions
to
recover
a
portion
of
amounts
previously
withheld.
The
Funds
may
record
a
reclaim
receivable
based
on
collectability,
which
includes
factors
such
as
the
jurisdiction’s
applicable
laws,
payment
history
and
market
convention.
The
Statements
of
Operations
include
tax
reclaims
recorded
as
well
as
professional
and
other
fees,
if
any,
associated
with
recovery
of
foreign
withholding
taxes.
Bank
Overdraft:
Certain
Funds
had
outstanding
cash
disbursements
exceeding
deposited
cash
amounts
at
the
custodian
during
the
reporting
period. The
Funds
are
obligated
to
repay
the
custodian
for
any
overdraft,
including
any
related
costs
or
expenses,
where
applicable.
For
financial
reporting
purposes,
overdraft
fees,
if
any,
are
included
in
interest
expense
in
the
Statements
of
Operations.
Collateralization:
If
required
by
an
exchange
or
counterparty
agreement,
the
Funds
may
be
required
to
deliver/deposit
cash
and/or
securities
to/with
an
exchange,
or
broker-
dealer
or
custodian
as
collateral
for
certain
investments.
In-kind
Redemptions:
For
financial
reporting
purposes,
in-kind
redemptions
are
treated
as
sales
of
securities
resulting
in
realized
capital
gains
or
losses
to
the
Funds.
Because
such
gains
or
losses
are
not
taxable
to
the
Funds
and
are
not
distributed
to
existing
Fund
shareholders,
the
gains
or
losses
are
reclassified
from
accumulated
net
realized
gain
(loss)
to
paid-in
capital
at
the
end
of
the
Funds’
tax
year.
These
reclassifications
have
no
effect
on
net
assets
or
net
asset
value
(“NAV”)
per
share.
Distributions:
Dividends
and
distributions
paid
by
each
Fund
are
recorded
on
the
ex-dividend
dates.
Distributions
are
determined
on
a
tax
basis
and
may
differ
from
net
investment
income,
and net
realized
capital
gains
for
financial
reporting
purposes.
Dividends
and
distributions
are
paid
in
U.S.
dollars
and
cannot
be
automatically
reinvested
in
additional
shares
of
the
Funds.
Indemnifications:
In
the
normal
course
of
business,
each
Fund
enters
into
contracts
that
contain
a
variety
of
representations
that
provide
general
indemnification.
The
Funds’
maximum
exposure
under
these
arrangements
is
unknown
because
it
involves
future
potential
claims
against
the
Funds,
which
cannot
be
predicted
with
any
certainty.
iShares
ETF
Diversification
Classification
ESG
Aware
MSCI
USA
.................................................................................................
Diversified
ESG
Aware
MSCI
USA
Growth
...........................................................................................
Non-diversified
ESG
Aware
MSCI
USA
Small-Cap
.........................................................................................
Diversified
ESG
Aware
MSCI
USA
Value
.............................................................................................
Non-diversified
ESG
MSCI
USA
Leaders
................................................................................................
Non-diversified
Paris-Aligned
Climate
MSCI
USA
..........................................................................................
Non-diversified
Notes
to
Financial
Statements
(
continued)
Notes
to
Financial
Statements
3.
Investment
Valuation
and
Fair
Value
Measurements
Investment
Valuation
Policies:
Each
Fund’s
investments
are
valued
at
fair
value
(also
referred
to
as
“market
value”
within
the
financial
statements)
each
day
that
the
Fund’s
listing
exchange
is
open
and,
for
financial
reporting
purposes,
as
of
the
report
date.
U.S.
GAAP
defines
fair
value
as
the
price
a
fund
would
receive
to
sell
an
asset
or
pay
to
transfer
a
liability
in
an
orderly
transaction
between
market
participants
at
the
measurement
date.
The
Board
of Trustees of
the
Trust (the
“Board”)
of
each
Fund
has
approved
the
designation
of
BlackRock
Fund
Advisors
(“BFA”),
the
Funds’
investment
adviser,
as
the
valuation
designee
for each
Fund. Each
Fund
determines
the
fair
values
of
its
financial
instruments
using
various
independent
dealers
or
pricing
services
under
BFA’s
policies.
If
a
security’s
market
price
is
not
readily
available
or
does
not
otherwise
accurately
represent
the
fair
value
of
the
security,
the
security
will
be
valued
in
accordance
with
BFA’s
policies
and
procedures
as
reflecting
fair
value. BFA
has
formed
a
committee
(the
“Valuation
Committee”)
to
develop
pricing
policies
and
procedures
and
to
oversee
the
pricing
function
for
all
financial
instruments,
with
assistance
from
other
BlackRock
pricing
committees.
Fair
Value
Inputs
and
Methodologies:
The
following
methods
and
inputs
are
used
to
establish
the
fair
value
of each
Fund’s
assets
and
liabilities:
Equity
investments
traded
on
a
recognized
securities
exchange
are
valued
at
that
day’s
official
closing
price,
as
applicable,
on
the
exchange
where
the
stock
is
primarily
traded.
Equity
investments
traded
on
a
recognized
exchange
for
which
there
were
no
sales
on
that
day
are
valued
at
the
last
traded
price.
Investments
in
open-end
U.S.
mutual
funds
(including
money
market
funds)
are
valued
at
that
day’s
published
NAV.
Futures
contracts
are
valued
based
on
that
day’s
last
reported
settlement
or
trade
price
on
the
exchange
where
the
contract
is
traded.
If
events
(e.g.,
market
volatility,
company
announcement
or
a
natural
disaster)
occur
that
are
expected
to
materially
affect
the
value
of
such
investment,
or
in
the
event
that
application
of
these
methods
of
valuation
results
in
a
price
for
an
investment
that
is
deemed
not
to
be
representative
of
the
market
value
of
such
investment,
or
if
a
price
is
not
available,
the
investment
will
be
valued
by
the
Valuation
Committee,
in
accordance
with BFA’s
policies
and
procedures
as
reflecting
fair
value
(“Fair
Valued
Investments”).
The
fair
valuation
approaches
that
may
be
used
by
the
Valuation
Committee
include
market
approach,
income
approach
and
cost
approach.
Valuation
techniques
such
as
discounted
cash
flow,
use
of
market
comparables
and
matrix
pricing
are
types
of
valuation
approaches
and
are
typically
used
in
determining
fair
value.
When
determining
the
price
for
Fair
Valued
Investments,
the
Valuation
Committee
seeks
to
determine
the
price
that each
Fund
might
reasonably
expect
to
receive
or
pay
from
the
current
sale
or
purchase
of
that
asset
or
liability
in
an
arm’s-length
transaction.
Fair
value
determinations
shall
be
based
upon
all
available
factors
that
the
Valuation
Committee
deems
relevant
and
consistent
with
the
principles
of
fair
value
measurement.
Fair
value
pricing
could
result
in
a
difference
between
the
prices
used
to
calculate
a
fund’s
NAV
and
the
prices
used
by
the
fund’s
underlying
index,
which
in
turn
could
result
in
a
difference
between
the
fund’s
performance
and
the
performance
of
the
fund’s
underlying
index.
Fair
Value
Hierarchy:
Various
inputs
are
used
in
determining
the
fair
value
of
financial
instruments.
These
inputs
to
valuation
techniques
are
categorized
into
a
fair
value
hierarchy
consisting
of
three
broad
levels
for
financial
reporting
purposes
as
follows:
Level
1
–
Unadjusted
price
quotations
in
active
markets/exchanges
for
identical
assets
or
liabilities
that each
Fund
has
the
ability
to
access;
Level
2
–
Other
observable
inputs
(including,
but
not
limited
to,
quoted
prices
for
similar
assets
or
liabilities
in
markets
that
are
active,
quoted
prices
for
identical
or
similar
assets
or
liabilities
in
markets
that
are
not
active,
inputs
other
than
quoted
prices
that
are
observable
for
the
assets
or
liabilities
(such
as
interest
rates,
yield
curves,
volatilities,
prepayment
speeds,
loss
severities,
credit
risks
and
default
rates)
or
other
market-corroborated
inputs);
and
Level
3
–
Unobservable
inputs
based
on
the
best
information
available
in
the
circumstances,
to
the
extent
observable
inputs
are
not
available,
(including
the
Valuation
Committee’s
assumptions
used
in
determining
the
fair
value
of
financial
instruments).
The
hierarchy
gives
the
highest
priority
to
unadjusted
quoted
prices
in
active
markets
for
identical
assets
or
liabilities
(Level
1
measurements)
and
the
lowest
priority
to
unobservable
inputs
(Level
3
measurements).
Accordingly,
the
degree
of
judgment
exercised
in
determining
fair
value
is
greatest
for
instruments
categorized
in
Level
3.
The
inputs
used
to
measure
fair
value
may
fall
into
different
levels
of
the
fair
value
hierarchy.
In
such
cases,
for
disclosure
purposes,
the
fair
value
hierarchy
classification
is
determined
based
on
the
lowest
level
input
that
is
significant
to
the
fair
value
measurement
in
its
entirety.
Investments
classified
within
Level
3
have
significant
unobservable
inputs
used
by
the
Valuation
Committee
in
determining
the
price
for
Fair
Valued
Investments.
Level
3
investments
include
equity
or
debt
issued
by
privately
held
companies
or
funds
that
may
not
have
a
secondary
market
and/or
may
have
a
limited
number
of
investors.
The
categorization
of
a
value
determined
for
financial
instruments
is
based
on
the
pricing
transparency
of
the
financial
instruments
and
is
not
necessarily
an
indication
of
the
risks
associated
with
investing
in
those
securities.
4.
Securities
and
Other
Investments
Securities
Lending:
Each
Fund
may
lend
its
securities
to
approved
borrowers,
such
as
brokers,
dealers
and
other
financial
institutions.
The
borrower
pledges
and
maintains
with
the
Fund
collateral
consisting
of
cash,
an
irrevocable
letter
of
credit
issued
by
an
approved
bank,
or
securities
issued
or
guaranteed
by
the
U.S.
government.
The
initial
collateral
received
by
each
Fund
is
required
to
have
a
value
of
at
least
102%
of
the
current
market
value
of
the
loaned
securities
for
securities
traded
on
U.S.
exchanges
and
a
value
of
at
least
105%
for
all
other
securities.
The
collateral
is
maintained
thereafter
at
a
value
equal
to
at
least
100%
of
the
current
value
of
the
securities
on
loan.
The
market
value
of
the
loaned
securities
is
determined
at
the
close
of
each
business
day
of
the
Fund
and
any
additional
required
collateral
is
delivered
to
the
Fund
or
excess
collateral
is
returned
by
the
Fund,
on
the
next
business
day.
During
the
term
of
the
loan,
each
Fund
is
entitled
to
all
distributions
made
on
or
in
respect
of
the
loaned
securities
but
does
not
receive
interest
income
on
securities
received
as
collateral.
Loans
of
securities
are
terminable
at
any
time
and
the
borrower,
after
notice,
is
required
to
return
borrowed
securities
within
the
standard
time
period
for
settlement
of
securities
transactions.
As
of
period
end,
any
securities
on
loan
were
collateralized
by
cash
and/or
U.S.
Government
obligations.
Cash
collateral
invested
in
money
market
funds
managed
by
BFA,
or
its
affiliates
is
disclosed
in
the
Schedule
of
Investments.
Any
non-cash
collateral
received
cannot
be
sold,
re-invested
or
pledged
by
the
Fund,
except
in
the
event
of
borrower
Notes
to
Financial
Statements
(continued)
2024
iShares
Annual
Financial
Statements
default.
The
securities
on
loan,
if
any,
are
also
disclosed
in
each
Fund’s
Schedule
of
Investments.
The
market
value
of
any
securities
on
loan
and
the
value
of
any
related
cash
collateral
are
disclosed
in
the Statements
of
Assets
and
Liabilities.
Securities
lending
transactions
are
entered
into
by
the
Funds
under
Master
Securities
Lending
Agreements
(each,
an
“MSLA”)
which
provide
the
right,
in
the
event
of
default
(including
bankruptcy
or
insolvency)
for
the
non-defaulting
party
to
liquidate
the
collateral
and
calculate
a
net
exposure
to
the
defaulting
party
or
request
additional
collateral.
In
the
event
that
a
borrower
defaults,
the
Funds,
as
lender,
would
offset
the
market
value
of
the
collateral
received
against
the
market
value
of
the
securities
loaned.
When
the
value
of
the
collateral
is
greater
than
that
of
the
market
value
of
the
securities
loaned,
the
lender
is
left
with
a
net
amount
payable
to
the
defaulting
party.
However,
bankruptcy
or
insolvency
laws
of
a
particular
jurisdiction
may
impose
restrictions
on
or
prohibitions
against
such
a
right
of
offset
in
the
event
of
an
MSLA
counterparty’s
bankruptcy
or
insolvency.
Under
the
MSLA,
absent
an
event
of
default,
the
borrower
can
resell
or
re-pledge
the
loaned
securities,
and
the
Funds
can
reinvest
cash
collateral
received
in
connection
with
loaned
securities.
Upon
an
event
of
default,
the
parties’
obligations
to
return
the
securities
or
collateral
to
the
other
party
are
extinguished,
and
the
parties
can
resell
or
re-pledge
the
loaned
securities
or
the
collateral
received
in
connection
with
the
loaned
securities
in
order
to
satisfy
the
defaulting
party’s
net
payment
obligation
for
all
transactions
under
the
MSLA.
The
defaulting
party
remains
liable
for
any
deficiency.
As
of
period
end,
the
following
table
is
a
summary
of
the
securities
on
loan
by
counterparty
which
are
subject
to
offset
under
an
MSLA:
iShares
ETF
and
Counterparty
Securities
Loaned
at
Value
Cash
Collateral
Received
(a)
Non-Cash
Collateral
Received,
at
Fair
Value
(a)
Net
Amount
(b)
ESG
Aware
MSCI
USA
BNP
Paribas
SA
.................................................
$
1,470,296
$
(1,470,296)
$
—
$
—
BofA
Securities,
Inc.
..............................................
3,018,400
(3,018,400)
—
—
Citigroup
Global
Markets,
Inc.
........................................
16,322
(16,322)
—
—
HSBC
Bank
PLC
................................................
7,362,522
(7,362,522)
—
—
J.P.
Morgan
Securities
LLC
.........................................
7,769,070
(7,769,070)
—
—
Jefferies
LLC
...................................................
123,999
(123,999)
—
—
Nomura
Securities
International,
Inc.
...................................
24,517
(24,517)
—
—
SG
Americas
Securities
LLC
........................................
2,944,513
(2,944,513)
—
—
UBS
AG
......................................................
57,493
(57,445)
—
48
Wells
Fargo
Bank
NA
.............................................
37,093,119
(37,093,119)
—
—
$
59,880,251
$
(59,880,203)
$
—
$
48
a
ESG
Aware
MSCI
USA
Growth
Citigroup
Global
Markets,
Inc.
........................................
38,811
(38,811)
—
—
J.P.
Morgan
Securities
LLC
.........................................
7,318
(7,318)
—
—
$
46,129
$
(46,129)
$
—
$
—
a
ESG
Aware
MSCI
USA
Small-Cap
Barclays
Capital,
Inc.
.............................................
2,468,145
(2,468,145)
—
—
BMO
Capital
Markets
Corp.
.........................................
13,664
(13,664)
—
—
BNP
Paribas
SA
.................................................
2,145,841
(2,145,841)
—
—
BofA
Securities,
Inc.
..............................................
13,717,270
(13,717,270)
—
—
Citadel
Clearing
LLC
..............................................
1,012,598
(1,012,598)
—
—
Citigroup
Global
Markets,
Inc.
........................................
7,492,989
(7,492,989)
—
—
HSBC
Bank
PLC
................................................
1,215,377
(1,215,377)
—
—
J.P.
Morgan
Securities
LLC
.........................................
17,516,008
(17,516,008)
—
—
Jefferies
LLC
...................................................
1,029,318
(1,029,318)
—
—
Morgan
Stanley
.................................................
27,075,316
(27,075,316)
—
—
National
Financial
Services
LLC
......................................
2,976,931
(2,976,931)
—
—
RBC
Capital
Markets
LLC
..........................................
2,077,872
(2,077,872)
—
—
State
Street
Bank
&
Trust
Co.
........................................
1,614,777
(1,614,777)
—
—
Toronto-Dominion
Bank
............................................
2,664,835
(2,664,835)
—
—
UBS
AG
......................................................
3,104,087
(3,104,087)
—
—
UBS
Securities
LLC
..............................................
588,428
(588,428)
—
—
Wells
Fargo
Bank
NA
.............................................
3,827,989
(3,827,989)
—
—
Wells
Fargo
Securities
LLC
.........................................
1,998,468
(1,998,468)
—
—
$
92,539,913
$
(92,539,913)
$
—
$
—
a
ESG
Aware
MSCI
USA
Value
J.P.
Morgan
Securities
LLC
.........................................
5,168
(5,168)
—
—
$
5,168
$
(5,168)
$
—
$
—
a
Notes
to
Financial
Statements
(
continued)
Notes
to
Financial
Statements
The
risks
of
securities
lending
include
the
risk
that
the
borrower
may
not
provide
additional
collateral
when
required
or
may
not
return
the
securities
when
due.
To
mitigate
these
risks,
each
Fund
benefits
from
a
borrower
default
indemnity
provided
by
BlackRock,
Inc.
(“BlackRock”).
BlackRock’s
indemnity
allows
for
full
replacement
of
the
securities
loaned
to
the
extent
the
collateral
received
does
not
cover
the
value
of
the
securities
loaned
in
the
event
of
borrower
default.
Each
Fund
could
incur
a
loss
if
the
value
of
an
investment
purchased
with
cash
collateral
falls
below
the
market
value
of
the
loaned
securities
or
if
the
value
of
an
investment
purchased
with
cash
collateral
falls
below
the
value
of
the
original
cash
collateral
received.
Such
losses
are
borne
entirely
by
each
Fund.
5.
Derivative
Financial
Instruments
Futures
Contracts:
Futures
contracts
are
purchased
or
sold
to
gain
exposure
to,
or
manage
exposure
to,
changes
in
interest
rates
(interest
rate
risk)
and
changes
in
the
value
of
equity
securities
(equity
risk)
or
foreign
currencies
(foreign
currency
exchange
rate
risk).
Futures
contracts
are
exchange-traded
agreements
between
the Funds
and
a
counterparty
to
buy
or
sell
a
specific
quantity
of
an
underlying
instrument
at
a
specified
price
and
on
a
specified
date.
Depending
on
the
terms
of
a
contract,
it
is
settled
either
through
physical
delivery
of
the
underlying
instrument
on
the
settlement
date
or
by
payment
of
a
cash
amount
on
the
settlement
date.
Upon
entering
into
a
futures
contract,
the Funds
are
required
to
deposit
initial
margin
with
the
broker
in
the
form
of
cash
or
securities
in
an
amount
that
varies
depending
on
a
contract’s
size
and
risk
profile.
The
initial
margin
deposit
must
then
be
maintained
at
an
established
level
over
the
life
of
the
contract.
Amounts
pledged,
which
are
considered
restricted,
are
included
in
cash
pledged
for
futures
contracts
in
the
Statements
of
Assets
and
Liabilities.
Securities
deposited
as
initial
margin
are
designated
in
the
Schedule
of
Investments
and
cash
deposited,
if
any,
are
shown
as
cash
pledged
for
futures
contracts
in
the
Statements
of
Assets
and
Liabilities.
Pursuant
to
the
contract,
the Funds
agree
to
receive
from
or
pay
to
the
broker
an
amount
of
cash
equal
to
the
daily
fluctuation
in
market
value
of
the
contract
(“variation
margin”).
Variation
margin
is
recorded
as
unrealized
appreciation
(depreciation)
and,
if
any,
shown
as
variation
margin
receivable
(or
payable)
on
futures
contracts
in
the
Statements
of
Assets
and
Liabilities.
When
the
contract
is
closed,
a
realized
gain
or
loss
is
recorded
in
the
Statements
of
Operations
equal
to
the
difference
between
the
notional
amount
of
the
contract
at
the
time
it
was
opened
and
the
notional
amount
at
the
time
it
was
closed.
The
use
of
futures
contracts
involves
the
risk
of
an
imperfect
correlation
in
the
movements
in
the
price
of
futures
contracts
and
interest
rates,
foreign
currency
exchange
rates
or
underlying
assets.
6.
Investment
Advisory
Agreement
and
Other
Transactions
with
Affiliates
Investment
Advisory
Fees:
Pursuant
to
an
Investment
Advisory
Agreement
with
the
Trust, BFA manages
the
investment
of
each
Fund’s
assets.
BFA
is
a
California
corporation
indirectly
owned
by BlackRock.
Under
the
Investment
Advisory
Agreement,
BFA
is
responsible
for
substantially
all
expenses
of
the
Funds,
except
(i)
interest
and
taxes;
(ii)
brokerage
commissions
and
other
expenses
connected
with
the
execution
of
portfolio
transactions;
(iii)
distribution
fees;
(iv)
the
advisory
fee
payable
to
BFA;
and
(v)
litigation
expenses
and
any
extraordinary
expenses
(in
each
case
as
determined
by
a
majority
of
the
independent
trustees).
iShares
ETF
and
Counterparty
Securities
Loaned
at
Value
Cash
Collateral
Received
(a)
Non-Cash
Collateral
Received,
at
Fair
Value
(a)
Net
Amount
(b)
ESG
MSCI
USA
Leaders
Barclays
Capital,
Inc.
.............................................
$
33,912
$
(33,912)
$
—
$
—
BNP
Paribas
SA
.................................................
224,870
(224,870)
—
—
BofA
Securities,
Inc.
..............................................
833,162
(833,162)
—
—
Citigroup
Global
Markets,
Inc.
........................................
4,738,574
(4,738,574)
—
—
Goldman
Sachs
&
Co.
LLC
.........................................
336,845
(336,845)
—
—
J.P.
Morgan
Securities
LLC
.........................................
42,413
(42,413)
—
—
Morgan
Stanley
.................................................
381,001
(381,001)
—
—
Wells
Fargo
Bank
NA
.............................................
65,652
(65,652)
—
—
$
6,656,429
$
(6,656,429)
$
—
$
—
a
Paris-Aligned
Climate
MSCI
USA
BofA
Securities,
Inc.
..............................................
80,202
(80,202)
—
—
Citigroup
Global
Markets,
Inc.
........................................
3,028,782
(3,028,782)
—
—
Goldman
Sachs
&
Co.
LLC
.........................................
589,066
(589,066)
—
—
J.P.
Morgan
Securities
LLC
.........................................
1,519,611
(1,519,611)
—
—
Jefferies
LLC
...................................................
1,589,625
(1,589,625)
—
—
Virtu
Americas
LLC
...............................................
915,095
(915,095)
—
—
Wells
Fargo
Bank
NA
.............................................
5,915,562
(5,915,562)
—
—
Wells
Fargo
Securities
LLC
.........................................
2,334,426
(2,334,426)
—
—
$
15,972,369
$
(15,972,369)
$
—
$
—
a
(a)
Collateral
received,
if
any,
in
excess
of
the
market
value
of
securities
on
loan
is
not
presented
in
this
table.
The
total
cash
collateral
received
by
each
Fund
is
disclosed
in
the
Funds’
Statements
of
Assets
and
Liabilities.
(b)
The
market
value
of
the
loaned
securities
is
determined
as
of
August
31,
2024.
Additional
collateral
is
delivered
to
the
Fund
on
the
next
business
day
in
accordance
with
the
MSLA.
The
net
amount
would
be
subject
to
the
borrower
default
indemnity
in
the
event
of
default
by
the
counterparty.
Notes
to
Financial
Statements
(continued)
2024
iShares
Annual
Financial
Statements
For
its
investment
advisory
services
to
each
of
the
following
Funds,
BFA
is
entitled
to
an
annual
investment
advisory
fee,
accrued
daily
and
paid
monthly
by
the
Funds,
based
on
the
average
daily
net
assets
of
each
Fund
as
follows:
Distributor:
BlackRock
Investments,
LLC
(“BRIL”),
an
affiliate
of
BFA,
is
the
distributor
for
each
Fund.
Pursuant
to
the
distribution
agreement,
BFA
is
responsible
for
any
fees
or
expenses
for
distribution
services
provided
to
the
Funds.
ETF
Servicing
Fees:
Each
Fund
has
entered
into
an
ETF
Services
Agreement
with
BRIL
to
perform
certain
order
processing,
Authorized
Participant
communications,
and
related
services
in
connection
with
the
issuance
and
redemption
of
Creation
Units
(“ETF
Services”).
BRIL
is
entitled
to
a
transaction
fee
from
Authorized
Participants
on
each
creation
or
redemption
order
for
the
ETF
Services
provided. The
Funds
do
not
pay
BRIL
for
ETF
Services.
Securities
Lending:
The
U.S.
Securities
and
Exchange
Commission
(the
“SEC”)
has
issued
an
exemptive
order
which
permits
BlackRock
Institutional
Trust
Company,
N.A.
(“BTC”),
an
affiliate
of
BFA,
to
serve
as
securities
lending
agent
for
the
Funds,
subject
to
applicable
conditions.
As
securities
lending
agent,
BTC
bears
all
operational
costs
directly
related
to
securities
lending,
including
any
custodial
costs.
Each
Fund
is
responsible
for
fees
in
connection
with
the
investment
of
cash
collateral
received
for
securities
on
loan
(the
“collateral
investment
fees”).
The
cash
collateral
is
invested
in
a
money
market
fund,
BlackRock
Cash
Funds:
Institutional
or
BlackRock
Cash
Funds:
Treasury,
managed
by
BFA,
or
its
affiliates.
However,
BTC
has
agreed
to
reduce
the
amount
of
securities
lending
income
it
receives
in
order
to
effectively
limit
the
collateral
investment
fees
each
Fund
bears
to
an
annual
rate
of
0.04%.
The
SL
Agency
Shares
of
such
money
market
fund
will
not
be
subject
to
a
sales
load,
redemption
fee,
distribution
fee
or
service
fee.
The
money
market
fund
in
which
the
cash
collateral
has
been
invested
may
impose
a
discretionary
liquidity
fee
of
up
to
2%
of
the
value
redeemed,
if
such
fee
is
determined
to
be
in
the
best
interests
of
such
money
market
fund.
Securities
lending
income
is
generally
equal
to
the
total
of
income
earned
from
the
reinvestment
of
cash
collateral
(and
excludes
collateral
investment
fees),
and
any
fees
or
other
payments
to
and
from
borrowers
of
securities.
Each
Fund
retains
a
portion
of
the
securities
lending
income
and
remits
the
remaining
portion
to
BTC
as
compensation
for
its
services
as
securities
lending
agent.
Pursuant
to
the
current
securities
lending
agreement,
each
Fund
retains
81%
of
securities
lending
income
(which
excludes
collateral
investment
fees)
and
the
amount
retained
can
never
be
less
than
70%
of
the
total
of
securities
lending
income
plus
the
collateral
investment
fees.
In
addition,
commencing
the
business
day
following
the
date
that
the
aggregate
securities
lending
income
plus
the
collateral
investment
fees
generated
across
all
1940
Act
iShares
exchange-traded
funds
(the
“iShares
ETF
Complex”)
in
that
calendar
year
exceeds
a
specified
threshold,
each
Fund,
pursuant
to
the
securities
lending
agreement,
will
retain
for
the
remainder
of
that
calendar
year
81%
of
securities
lending
income
(which
excludes
collateral
investment
fees),
and
the
amount
retained
can
never
be
less
than
70%
of
the
total
of
securities
lending
income
plus
the
collateral
investment
fees.
The
share
of
securities
lending
income
earned
by
each
Fund
is
shown
as
securities
lending
income
–
affiliated
–
net
in
its Statements
of
Operations.
For
the year
ended August
31,
2024,
the
Funds
paid
BTC
the
following
amounts
for
securities
lending
agent
services:
Officers
and
Trustees:
Certain
officers
and/or
trustees
of
the
Trust
are
officers
and/or trustees
of
BlackRock
or
its
affiliates.
Other
Transactions:
Cross
trading
is
the
buying
or
selling
of
portfolio
securities
between
funds
to
which
BFA
(or
an
affiliate)
serves
as
investment
adviser.
At
its
regularly
scheduled
quarterly
meetings,
the
Board
reviews
such
transactions
as
of
the
most
recent
calendar
quarter
for
compliance
with
the
requirements
and
restrictions
set
forth
by
Rule
17a-7.
For
the
year
ended
August
31,
2024,
transactions
executed
by
the
Funds
pursuant
to
Rule
17a-7
under
the
1940
Act
were
as
follows:
Each
Fund
may
invest
its
positive
cash
balances
in
certain
money
market
funds
managed
by
BFA
or
an
affiliate.
The
income
earned
on
these
temporary
cash
investments
is
shown
as
dividends
–
affiliated
in
the
Statements
of
Operations.
iShares
ETF
Investment
Advisory
Fees
ESG
Aware
MSCI
USA
.
.
.
.
.
.
.
.
.
.
.
.
.
.
.
.
.
.
.
.
.
.
.
.
.
.
.
.
.
.
.
.
.
.
.
.
.
.
.
.
.
.
.
.
.
.
.
.
.
.
.
.
.
.
.
.
.
.
.
.
.
.
.
.
.
.
.
.
.
.
.
.
.
.
.
.
.
.
.
.
.
.
.
.
.
.
.
.
.
.
.
.
.
.
.
.
.
.
.
.
.
.
.
.
.
.
.
.
.
.
.
.
0.15%
ESG
Aware
MSCI
USA
Growth
.
.
.
.
.
.
.
.
.
.
.
.
.
.
.
.
.
.
.
.
.
.
.
.
.
.
.
.
.
.
.
.
.
.
.
.
.
.
.
.
.
.
.
.
.
.
.
.
.
.
.
.
.
.
.
.
.
.
.
.
.
.
.
.
.
.
.
.
.
.
.
.
.
.
.
.
.
.
.
.
.
.
.
.
.
.
.
.
.
.
.
.
.
.
.
.
.
.
.
.
.
.
.
.
.
.
0.18
ESG
Aware
MSCI
USA
Small-Cap
.
.
.
.
.
.
.
.
.
.
.
.
.
.
.
.
.
.
.
.
.
.
.
.
.
.
.
.
.
.
.
.
.
.
.
.
.
.
.
.
.
.
.
.
.
.
.
.
.
.
.
.
.
.
.
.
.
.
.
.
.
.
.
.
.
.
.
.
.
.
.
.
.
.
.
.
.
.
.
.
.
.
.
.
.
.
.
.
.
.
.
.
.
.
.
.
.
.
.
.
.
.
.
0.17
ESG
Aware
MSCI
USA
Value
.
.
.
.
.
.
.
.
.
.
.
.
.
.
.
.
.
.
.
.
.
.
.
.
.
.
.
.
.
.
.
.
.
.
.
.
.
.
.
.
.
.
.
.
.
.
.
.
.
.
.
.
.
.
.
.
.
.
.
.
.
.
.
.
.
.
.
.
.
.
.
.
.
.
.
.
.
.
.
.
.
.
.
.
.
.
.
.
.
.
.
.
.
.
.
.
.
.
.
.
.
.
.
.
.
.
.
0.18
ESG
MSCI
USA
Leaders
.
.
.
.
.
.
.
.
.
.
.
.
.
.
.
.
.
.
.
.
.
.
.
.
.
.
.
.
.
.
.
.
.
.
.
.
.
.
.
.
.
.
.
.
.
.
.
.
.
.
.
.
.
.
.
.
.
.
.
.
.
.
.
.
.
.
.
.
.
.
.
.
.
.
.
.
.
.
.
.
.
.
.
.
.
.
.
.
.
.
.
.
.
.
.
.
.
.
.
.
.
.
.
.
.
.
.
.
.
.
.
0.10
Paris-Aligned
Climate
MSCI
USA
.
.
.
.
.
.
.
.
.
.
.
.
.
.
.
.
.
.
.
.
.
.
.
.
.
.
.
.
.
.
.
.
.
.
.
.
.
.
.
.
.
.
.
.
.
.
.
.
.
.
.
.
.
.
.
.
.
.
.
.
.
.
.
.
.
.
.
.
.
.
.
.
.
.
.
.
.
.
.
.
.
.
.
.
.
.
.
.
.
.
.
.
.
.
.
.
.
.
.
.
.
.
.
.
0.10
iShares
ETF
Amounts
ESG
Aware
MSCI
USA
................................................................................................
$
69,759
ESG
Aware
MSCI
USA
Growth
..........................................................................................
32
ESG
Aware
MSCI
USA
Small-Cap
........................................................................................
211,325
ESG
Aware
MSCI
USA
Value
............................................................................................
19
ESG
MSCI
USA
Leaders
...............................................................................................
12,386
Paris-Aligned
Climate
MSCI
USA
.........................................................................................
82,781
iShares
ETF
Purchases
Sales
Net
Realized
Gain
(Loss)
ESG
Aware
MSCI
USA
............................................................
$
675,363,099
$
876,664,540
$
(37,866,730
)
ESG
Aware
MSCI
USA
Small-Cap
....................................................
157,241,073
91,280,813
9,599,557
ESG
MSCI
USA
Leaders
...........................................................
44,693,042
31,225,515
(2,720,379
)
Paris-Aligned
Climate
MSCI
USA
.....................................................
77,106,951
87,661,428
(7,313,511
)
Notes
to
Financial
Statements
(
continued)
Notes
to
Financial
Statements
A
fund,
in
order
to
improve
its
portfolio
liquidity
and
its
ability
to
track
its
underlying
index,
may
invest
in
shares
of
other
iShares
funds
that
invest
in
securities
in
the
fund’s
underlying
index.
7.
Purchases
and
Sales
For
the year
ended
August
31,
2024,
purchases
and
sales
of
investments,
excluding
short-term
securities
and
in-kind
transactions,
were
as
follows:
For
the year ended
August
31,
2024,
in-kind
transactions
were
as
follows:
8.
Income
Tax
Information
Each
Fund
is
treated
as
an
entity
separate
from
the
Trust’s
other
funds
for
federal
income
tax
purposes.
It
is
each
Fund’s
policy
to
comply
with
the
requirements
of
the
Internal
Revenue
Code
of
1986,
as
amended,
applicable
to
regulated
investment
companies,
and
to
distribute
substantially
all
of
its
taxable
income
to
its
shareholders.
Therefore,
no
U.S.
federal
income
tax
provision
is
required.
Management
has
analyzed
tax
laws
and
regulations
and
their
application
to
the
Funds
as
of
August
31,
2024,
inclusive
of
the
open
tax
return
years,
and
does
not
believe
that
there
are
any
uncertain
tax
positions
that
require
recognition
of
a
tax
liability
in
the
Funds’
financial
statements.
Management’s
analysis
is
based
on
the
tax
laws
and
judicial
and
administrative
interpretations
thereof
in
effect
as
of
the
date
of
these
financial
statements,
all
of
which
are
subject
to
change,
possibly
with
retroactive
effect,
which
may
impact
the
Funds’
NAV.
U.S.
GAAP
requires
that
certain
components
of
net
assets
be
adjusted
to
reflect
permanent
differences
between
financial
and
tax
reporting.
These
reclassifications
have
no
effect
on
net
assets
or
NAV
per
share.
As
of
August
31,
2024,
permanent
differences
attributable
to
nondeductible
expenses
and
realized
gains
(losses)
from
in-kind
redemptions
were
reclassified
to
the
following
accounts:
The
tax
character
of
distributions
paid
was
as
follows:
iShares
ETF
Purchases
Sales
ESG
Aware
MSCI
USA
..............................................................................
$
2,894,334,683
$
2,853,381,551
ESG
Aware
MSCI
USA
Growth
........................................................................
2,126,708
2,137,166
ESG
Aware
MSCI
USA
Small-Cap
......................................................................
535,835,219
525,925,347
ESG
Aware
MSCI
USA
Value
..........................................................................
1,723,666
1,728,650
ESG
MSCI
USA
Leaders
.............................................................................
85,826,176
84,421,666
Paris-Aligned
Climate
MSCI
USA
.......................................................................
188,416,917
186,657,478
iShares
ETF
In-kind
Purchases
In-kind
Sales
ESG
Aware
MSCI
USA
..............................................................................
$
1,567,927,913
$
4,261,176,567
ESG
Aware
MSCI
USA
Growth
........................................................................
4,687,670
2,978,313
ESG
Aware
MSCI
USA
Small-Cap
......................................................................
305,160,454
125,355,616
ESG
Aware
MSCI
USA
Value
..........................................................................
2,241,191
1,174,001
ESG
MSCI
USA
Leaders
.............................................................................
110,176,408
408,603,740
Paris-Aligned
Climate
MSCI
USA
.......................................................................
510,249,450
356,845,570
iShares
ETF
Paid-in
Capital
Accumulated
Earnings
(Loss)
ESG
Aware
MSCI
USA
..............................................................................
$
997,980,862
$
(997,980,862
)
ESG
Aware
MSCI
USA
Growth
........................................................................
1,391,541
(1,391,541
)
ESG
Aware
MSCI
USA
Small-Cap
......................................................................
28,616,774
(28,616,774
)
ESG
Aware
MSCI
USA
Value
..........................................................................
280,627
(280,627
)
ESG
MSCI
USA
Leaders
.............................................................................
89,415,593
(89,415,593
)
Paris-Aligned
Climate
MSCI
USA
.......................................................................
103,729,649
(103,729,649
)
iShares
ETF
Year
Ended
08/31/24
Year
Ended
08/31/23
ESG
Aware
MSCI
USA
Ordinary
income
..........................................................................................
$
167,716,956
$
299,525,568
ESG
Aware
MSCI
USA
Growth
(a)
Ordinary
income
..........................................................................................
$
17,879
$
8,725
ESG
Aware
MSCI
USA
Small-Cap
Ordinary
income
..........................................................................................
$
18,566,377
$
21,620,054
ESG
Aware
MSCI
USA
Value
(a)
Ordinary
income
..........................................................................................
$
102,690
$
37,227
Notes
to
Financial
Statements
(continued)
2024
iShares
Annual
Financial
Statements
As
of
August
31,
2024,
the
tax
components
of
accumulated
net earnings
(losses)
were
as
follows:
For
the
year
ended
August
31,
2024,
the
Fund
listed
below
utilized
the
following
amount
of its
respective
capital
loss
carryforwards.
A
fund
may
own
shares
in
certain
foreign
investment
entities,
referred
to,
under
U.S.
tax
law,
as
“passive
foreign
investment
companies.”
Such
fund
may
elect
to
mark-to-
market
annually
the
shares
of
each
passive
foreign
investment
company
and
would
be
required
to
distribute
to
shareholders
any
such
marked-to-market
gains.
As
of
August
31,
2024,
gross
unrealized
appreciation
and
depreciation
based
on
cost
of
investments
(including
short
positions
and
derivatives,
if
any)
for
U.S.
federal
income
tax
purposes
were
as
follows:
9.
Principal
Risks
In
the
normal
course
of
business,
each
Fund
invests
in
securities
or
other
instruments
and
may
enter
into
certain
transactions,
and
such
activities
subject
the
Fund
to
various
risks,
including,
among
others,
fluctuations
in
the
market
(market
risk)
or
failure
of
an
issuer
to
meet
all
of
its
obligations.
The
value
of
securities
or
other
instruments
may
also
be
affected
by
various
factors,
including,
without
limitation:
(i)
the
general
economy;
(ii)
the
overall
market
as
well
as
local,
regional
or
global
political
and/or
social
instability;
(iii)
regulation,
taxation
or
international
tax
treaties
between
various
countries;
or
(iv)
currency,
interest
rate
or
price
fluctuations.
Local,
regional
or
global
events
such
as
war,
acts
of
terrorism,
the
spread
of
infectious
illness
or
other
public
health
issues,
recessions,
or
other
events
could
have
a
significant
impact
on
the
Funds
and
their
investments.
Each
Fund’s
prospectus
provides
details
of
the
risks
to
which
the
Fund
is
subject.
BFA
uses
an
indexing
approach
to
try
to
achieve
each
Fund’s
investment
objective.
The
Fund
is
not
actively
managed,
and
BFA
generally
does
not
attempt
to
take
defensive
positions
under
any
market
conditions,
including
declining
markets.
The
Funds
may
be
exposed
to
additional
risks
when
reinvesting
cash
collateral
in
money
market
funds
that
do
not
seek
to
maintain
a
stable
NAV
per
share
of
$1.00,
which
may
be
subject
to
discretionary
liquidity
fees
under
certain
circumstances.
Valuation
Risk:
The
market
values
of
equities,
such
as
common
stocks
and
preferred
securities
or
equity
related
investments,
such
as
futures
and
options,
may
decline
due
to
general
market
conditions
which
are
not
specifically
related
to
a
particular
company.
They
may
also
decline
due
to
factors
which
affect
a
particular
industry
or
industries.
A
fund
may
invest
in
illiquid
investments.
An
illiquid
investment
is
any
investment
that
a
fund
reasonably
expects
cannot
be
sold
or
disposed
of
in
current
market
conditions
iShares
ETF
Year
Ended
08/31/24
Year
Ended
08/31/23
ESG
MSCI
USA
Leaders
Ordinary
income
..........................................................................................
$
13,649,428
$
47,370,942
Paris-Aligned
Climate
MSCI
USA
Ordinary
income
..........................................................................................
$
17,622,634
$
11,538,632
(a)
The
Fund
commenced
operations
on
January
31,
2023.
iShares
ETF
Undistributed
Ordinary
Income
Non-Expiring
Capital
Loss
Carryforwards
(a)
Net
Unrealized
Gains
(Losses)
(b)
Total
ESG
Aware
MSCI
USA
..........................................
$
35,084,637
$
(1,721,944,164
)
$
2,428,888,434
$
742,028,907
ESG
Aware
MSCI
USA
Growth
....................................
5,309
(88,690
)
1,039,765
956,384
ESG
Aware
MSCI
USA
Small-Cap
..................................
5,700,303
(171,051,167
)
233,990,365
68,639,501
ESG
Aware
MSCI
USA
Value
......................................
27,634
(76,256
)
555,700
507,078
ESG
MSCI
USA
Leaders
.........................................
2,597,703
(82,352,585
)
210,698,461
130,943,579
Paris-Aligned
Climate
MSCI
USA
...................................
4,928,199
(33,906,532
)
404,083,614
375,105,281
(a)
Amounts
available
to
offset
future
realized
capital
gains.
(b)
The
difference
between
book-basis
and
tax-basis
net
unrealized
gains
(losses)
was
attributable
primarily
to
the
tax
deferral
of
losses
on
wash
sales,
the
realization
for
tax
purposes
of
unrealized
gains
(losses)
on
certain
futures
contracts,
the
realization
for
tax
purposes
of
unrealized
gains
on
investments
in
passive
foreign
investment
companies
and
the
characterization
of
corporate
actions.
iShares
ETF
Utilized
ESG
Aware
MSCI
USA
Value
............................................................................................
$
4,481
iShares
ETF
Tax
Cost
Gross
Unrealized
Appreciation
Gross
Unrealized
Depreciation
Net
Unrealized
Appreciation
(Depreciation)
ESG
Aware
MSCI
USA
..........................................
$
10,613,771,099
$
2,877,789,264
$
(448,900,830
)
$
2,428,888,434
ESG
Aware
MSCI
USA
Growth
....................................
7,117,589
1,088,092
(48,327
)
1,039,765
ESG
Aware
MSCI
USA
Small-Cap
..................................
1,673,631,473
353,135,318
(119,144,953
)
233,990,365
ESG
Aware
MSCI
USA
Value
......................................
5,345,545
632,231
(76,531
)
555,700
ESG
MSCI
USA
Leaders
.........................................
881,000,995
271,364,462
(60,666,001
)
210,698,461
Paris-Aligned
Climate
MSCI
USA
...................................
1,640,875,779
449,061,039
(44,977,425
)
404,083,614
Notes
to
Financial
Statements
(
continued)
Notes
to
Financial
Statements
in
seven
calendar
days
or
less
without
the
sale
or
disposition
significantly
changing
the
market
value
of
the
investment.
A
fund
may
experience
difficulty
in
selling
illiquid
investments
in
a
timely
manner
at
the
price
that
it
believes
the
investments
are
worth.
Prices
may
fluctuate
widely
over
short
or
extended
periods
in
response
to
company,
market
or
economic
news.
Markets
also
tend
to
move
in
cycles,
with
periods
of
rising
and
falling
prices.
This
volatility
may
cause
a
fund’s
NAV
to
experience
significant
increases
or
decreases
over
short
periods
of
time.
If
there
is
a
general
decline
in
the
securities
and
other
markets,
the
NAV
of
a
fund
may
lose
value,
regardless
of
the
individual
results
of
the
securities
and
other
instruments
in
which
a
fund
invests.
The
price
each
Fund
could
receive
upon
the
sale
of
any
particular
portfolio
investment
may
differ
from
each
Fund’s
valuation
of
the
investment,
particularly
for
securities
that
trade
in
thin
or
volatile
markets
or
that
are
valued
using
a
fair
valuation
technique
or
a
price
provided
by
an
independent
pricing
service.
Changes
to
significant
unobservable
inputs
and
assumptions
(i.e.,
publicly
traded
company
multiples,
growth
rate,
time
to
exit)
due
to
the
lack
of
observable
inputs
may
significantly
impact
the
resulting
fair
value
and
therefore
each
Fund’s
results
of
operations.
As
a
result,
the
price
received
upon
the
sale
of
an
investment
may
be
less
than
the
value
ascribed
by
each
Fund,
and
each
Fund
could
realize
a
greater
than
expected
loss
or
lesser
than
expected
gain
upon
the
sale
of
the
investment.
Each
Fund’s
ability
to
value
its
investments
may
also
be
impacted
by
technological
issues
and/or
errors
by
pricing
services
or
other
third-party
service
providers.
Counterparty
Credit
Risk:
The
Funds
may
be
exposed
to
counterparty
credit
risk,
or
the
risk
that
an
entity
may
fail
to
or
be
unable
to
perform
on
its
commitments
related
to
unsettled
or
open
transactions,
including
making
timely
interest
and/or
principal
payments
or
otherwise
honoring
its
obligations.
The
Funds
manage
counterparty
credit
risk
by
entering
into
transactions
only
with
counterparties
that
BFA
believes
have
the
financial
resources
to
honor
their
obligations
and
by
monitoring
the
financial
stability
of
those
counterparties.
Financial
assets,
which
potentially
expose
the
Funds
to
market,
issuer
and
counterparty
credit
risks,
consist
principally
of
financial
instruments
and
receivables
due
from
counterparties.
The
extent
of
the
Funds’
exposure
to
market,
issuer
and
counterparty
credit
risks
with
respect
to
these
financial
assets
is
approximately
their
value
recorded
in
the
Statements
of
Assets
and
Liabilities,
less
any
collateral
held
by
the
Funds.
A
derivative
contract
may
suffer
a
mark-to-market
loss
if
the
value
of
the
contract
decreases
due
to
an
unfavorable
change
in
the
market
rates
or
values
of
the
underlying
instrument.
Losses
can
also
occur
if
the
counterparty
does
not
perform
under
the
contract.
With
exchange-traded
futures,
there
is
less
counterparty
credit
risk
to
the
Funds
since
the
exchange
or
clearinghouse,
as
counterparty
to
such
instruments,
guarantees
against
a
possible
default.
The
clearinghouse
stands
between
the
buyer
and
the
seller
of
the
contract;
therefore,
credit
risk
is
limited
to
failure
of
the
clearinghouse.
While
offset
rights
may
exist
under
applicable
law, a
Fund
does
not
have
a
contractual
right
of
offset
against
a
clearing
broker
or
clearinghouse
in
the
event
of
a
default
(including
the
bankruptcy
or
insolvency).
Additionally,
credit
risk
exists
in
exchange-traded
futures
with
respect
to
initial
and
variation
margin
that
is
held
in
a
clearing
broker’s
customer
accounts.
While
clearing
brokers
are
required
to
segregate
customer
margin
from
their
own
assets,
in
the
event
that
a
clearing
broker
becomes
insolvent
or
goes
into
bankruptcy
and
at
that
time
there
is
a
shortfall
in
the
aggregate
amount
of
margin
held
by
the
clearing
broker
for
all
its
clients,
typically
the
shortfall
would
be
allocated
on
a
pro
rata
basis
across
all
the
clearing
broker’s
customers,
potentially
resulting
in
losses
to
the
Funds.
Geographic/Asset
Class
Risk:
A
diversified
portfolio,
where
this
is
appropriate
and
consistent
with
a
fund’s
objectives,
minimizes
the
risk
that
a
price
change
of
a
particular
investment
will
have
a
material
impact
on
the
NAV
of
a
fund.
The
investment
concentrations
within
each
Fund’s
portfolio
are
disclosed
in
its
Schedule
of
Investments.
The Funds
invest
a
significant
portion
of
their
assets
in securities
of
issuers
located
in
the
United
States.
A
decrease
in
imports
or
exports,
changes
in
trade
regulations,
inflation
and/or
an
economic
recession
in
the
United
States
may
have
a
material
adverse
effect
on
the
U.S.
economy
and
the
securities
listed
on
U.S.
exchanges.
Proposed
and
adopted
policy
and
legislative
changes
in
the
United
States
may
also
have
a
significant
effect
on
U.S.
markets
generally,
as
well
as
on
the
value
of
certain
securities.
Governmental
agencies
project
that
the
United
States
will
continue
to
maintain
elevated
public
debt
levels
for
the
foreseeable
future
which
may
constrain
future
economic
growth.
Circumstances
could
arise
that
could
prevent
the
timely
payment
of
interest
or
principal
on
U.S.
government
debt,
such
as
reaching
the
legislative
“debt
ceiling.”
Such
non-payment
would
result
in
substantial
negative
consequences
for
the
U.S.
economy
and
the
global
financial
system.
If
U.S.
relations
with
certain
countries
deteriorate,
it
could
adversely
affect
issuers
that
rely
on
the
United
States
for
trade.
The
United
States
has
also
experienced
increased
internal
unrest
and
discord.
If
these
trends
were
to
continue,
they
may
have
an
adverse
impact
on
the
U.S.
economy
and
the
issuers
in
which
the
Funds
invest.
Certain Funds
invest
a
significant
portion
of
their
assets
in
securities
within
a
single
or
limited
number
of
market
sectors.
When
a
fund
concentrates
its
investments
in
this
manner,
it
assumes
the
risk
that
economic,
regulatory,
political
and
social
conditions
affecting
such
sectors
may
have
a
significant
impact
on
the
Fund
and
could
affect
the
income
from,
or
the
value
or
liquidity
of,
the
Fund’s
portfolio.
Investment
percentages
in
specific
sectors
are
presented
in
the
Schedule
of
Investments.
Significant
Shareholder
Redemption
Risk:
Certain
shareholders
may
own
or
manage
a
substantial
amount
of
fund
shares
and/or
hold
their
fund
investments
for
a
limited
period
of
time.
Large
redemptions
of
fund
shares
by
these
shareholders
may
force
a
fund
to
sell
portfolio
securities,
which
may
negatively
impact
the
fund’s
NAV,
increase
the
fund’s
brokerage
costs,
and/or
accelerate
the
realization
of
taxable
income/gains
and
cause
the
fund
to
make
additional
taxable
distributions
to
shareholders.
Notes
to
Financial
Statements
(continued)
2024
iShares
Annual
Financial
Statements
10.
Capital
Share
Transactions
Capital
shares
are
issued
and
redeemed
by each
Fund
only
in
aggregations
of
a
specified
number
of
shares
or
multiples
thereof
(“Creation
Units”)
at
NAV.
Except
when
aggregated
in
Creation
Units,
shares
of each
Fund
are
not
redeemable.
Transactions
in
capital
shares
were
as
follows:
The
consideration
for
the
purchase
of
Creation
Units
of
a
fund
in
the
Trust
generally
consists
of
the
in-kind
deposit
of
a
designated
portfolio
of
securities
and
a
specified
amount
of
cash.
Certain
funds
in
the
Trust
may
be
offered
in
Creation
Units
solely
or
partially
for
cash
in
U.S.
dollars.
Authorized
Participants
purchasing
and
redeeming
Creation
Units
may
pay
a
purchase
transaction
fee
and
a
redemption
transaction
fee
directly
to
BRIL,
to
offset
transfer
and
other
transaction
costs
associated
with
the
issuance
and
redemption
of
Creation
Units,
including
Creation
Units
for
cash.
Authorized
Participants
transacting
in
Creation
Units
for
cash
may
also
pay
an
additional
variable
charge
to
compensate
the
relevant
fund
for
certain
transaction
costs
(i.e.,
stamp
taxes,
taxes
on
currency
or
other
financial
transactions,
and
brokerage
costs)
and
market
impact
expenses
relating
to
investing
in
portfolio
securities.
Such
variable
charges,
if
any,
are
included
in
shares
sold
in
the
table
above.
To
the
extent
applicable,
to
facilitate
the
timely
settlement
of
orders
for
the
Funds
using
a
clearing
facility
outside
of
the
continuous
net
settlement
process,
the
Funds,
at
their
sole
discretion,
may
permit
an
Authorized
Participant
to
post
cash
as
collateral
in
anticipation
of
the
delivery
of
all
or
a
portion
of
the
applicable
Deposit
Securities
or
Fund
Securities,
as
further
described
in
the
applicable
Authorized
Participant
Agreement.
The
collateral
process
is
subject
to
a
Control
Agreement
among
the
Authorized
Participant,
each
Funds’
custodian,
and
the
Funds.
In
the
event
that
the
Authorized
Participant
fails
to
deliver
all
or
a
portion
of
the
applicable
Deposit
Securities
or
Fund
Securities,
the
Funds
may
exercise
control
over
such
collateral
pursuant
to
the
terms
of
the
Control
Agreement
in
order
to
purchase
the
applicable
Deposit
Securities
or
Fund
Securities.
From
time
to
time,
settlement
of
securities
related
to
in-kind
contributions
or
in-kind
redemptions
may
be
delayed.
In
such
cases,
securities
related
to
in-kind
transactions
are
reflected
as
a
receivable
or
a
payable
in
the
Statements
of
Assets
and
Liabilities.
11.
Subsequent
Events
Management
has
evaluated
the
impact
of
all
subsequent
events
on
the
Funds
through
the
date
the
financial
statements
were
available
to
be
issued
and
has
determined
that
there
were
no
subsequent
events
requiring
adjustment
or
additional
disclosure
in
the
financial
statements.
Year
Ended
08/31/24
Year
Ended
08/31/23
iShares
ETF
Shares
Amount
Shares
Amount
ESG
Aware
MSCI
USA
Shares
sold
...............................................
14,200,000
$
1,575,093,815
17,200,000
$
1,558,381,916
Shares
redeemed
...........................................
(38,600,000
)
(4,283,592,880
)
(139,800,000
)
(12,396,741,271
)
(24,400,000
)
$
(2,708,499,065
)
(122,600,000
)
$
(10,838,359,355
)
ESG
Aware
MSCI
USA
Growth
(a)
Shares
sold
...............................................
120,000
$
4,685,067
160,000
$
4,066,498
Shares
redeemed
...........................................
(80,000
)
(2,988,740
)
—
—
40,000
$
1,696,327
160,000
$
4,066,498
ESG
Aware
MSCI
USA
Small-Cap
Shares
sold
...............................................
8,400,000
$
318,168,579
4,400,000
$
151,123,851
Shares
redeemed
...........................................
(3,700,000
)
(130,175,883
)
(9,000,000
)
(311,130,785
)
4,700,000
$
187,992,696
(4,600,000
)
$
(160,006,934
)
ESG
Aware
MSCI
USA
Value
(a)
Shares
sold
...............................................
80,000
$
2,239,198
160,000
$
4,056,114
Shares
redeemed
...........................................
(40,000
)
(1,180,521
)
—
—
40,000
$
1,058,677
160,000
$
4,056,114
ESG
MSCI
USA
Leaders
Shares
sold
...............................................
1,250,000
$
110,627,798
5,000,000
$
345,135,056
Shares
redeemed
...........................................
(4,650,000
)
(410,474,565
)
(36,400,000
)
(2,673,120,335
)
(3,400,000
)
$
(299,846,767
)
(31,400,000
)
$
(2,327,985,279
)
Paris-Aligned
Climate
MSCI
USA
Shares
sold
...............................................
9,250,000
$
512,305,990
14,200,000
$
633,618,230
Shares
redeemed
...........................................
(6,450,000
)
(358,326,562
)
(1,750,000
)
(84,534,696
)
2,800,000
$
153,979,428
12,450,000
$
549,083,534
(a)
The
Fund
commenced
operations
on
January
31,
2023.
Report
of
Independent
Registered
Public
Accounting
Firm
Report
of
Independent
Registered
Public
Accounting
Firm
To
the
Board
of
Trustees
of
iShares
Trust
and
Shareholders
of
each
of
the
six
funds
listed
in
the
table
below
Opinions
on
the
Financial
Statements
We
have
audited
the
accompanying
statements
of
assets
and
liabilities,
including
the
schedules
of
investments,
of
each
of
the
funds
listed
in
the
table
below
(six
of
the
funds
constituting
iShares
Trust,
hereafter
collectively
referred
to
as
the
“Funds”)
as
of
August
31,
2024,
the
related
statements
of
operations
and
of
changes
in
net
assets
for
each
of
the
periods
indicated
in
the
table
below,
including
the
related
notes,
and
the
financial
highlights
for
each
of
the
periods
indicated
therein
(collectively
referred
to
as
the
“financial
statements”).
In
our
opinion,
the
financial
statements
present
fairly,
in
all
material
respects,
the
financial
position
of
each
of
the
Funds
listed
in
the
table
below
as
of
August
31,
2024,
the
results
of
each
of
their
operations
and
the
changes
in
each
of
their
net
assets
for
the
periods
indicated
in
the
table
below,
and
each
of
the
financial
highlights
for
each
of
the
periods
indicated
therein,
in
conformity
with
accounting
principles
generally
accepted
in
the
United
States
of
America.
(1)
Statement
of
operations
for
the
year
ended
August
31,
2024
and
statement
of
changes
in
net
assets
for
each
of
the
two
years
in
the
period
ended
August
31,
2024
(2)
Statement
of
operations
for
the
year
ended
August
31,
2024
and
statement
of
changes
in
net
assets
for
the
period
January
31,
2023
(commencement
of
operations)
through
August
31,
2024
Basis
for
Opinions
These
financial
statements
are
the
responsibility
of
the
Funds’
management.
Our
responsibility
is
to
express
an
opinion
on
the
Funds’
financial
statements
based
on
our
audits.
We
are
a
public
accounting
firm
registered
with
the
Public
Company
Accounting
Oversight
Board
(United
States)
(PCAOB)
and
are
required
to
be
independent
with
respect
to
the
Funds
in
accordance
with
the
U.S.
federal
securities
laws
and
the
applicable
rules
and
regulations
of
the
Securities
and
Exchange
Commission
and
the
PCAOB.
We
conducted
our
audits
of
these
financial
statements
in
accordance
with
the
standards
of
the
PCAOB.
Those
standards
require
that
we
plan
and
perform
the
audit
to
obtain
reasonable
assurance
about
whether
the
financial
statements
are
free
of
material
misstatement,
whether
due
to
error
or
fraud.
Our
audits
included
performing
procedures
to
assess
the
risks
of
material
misstatement
of
the
financial
statements,
whether
due
to
error
or
fraud,
and
performing
procedures
that
respond
to
those
risks.
Such
procedures
included
examining,
on
a
test
basis,
evidence
regarding
the
amounts
and
disclosures
in
the
financial
statements.
Our
audits
also
included
evaluating
the
accounting
principles
used
and
significant
estimates
made
by
management,
as
well
as
evaluating
the
overall
presentation
of
the
financial
statements.
Our
procedures
included
confirmation
of
securities
owned
as
of
August
31,
2024
by
correspondence
with
the
custodian,
transfer
agent
and
brokers;
when
replies
were
not
received
from
brokers,
we
performed
other
auditing
procedures.
We
believe
that
our
audits
provide
a
reasonable
basis
for
our
opinions.
/s/PricewaterhouseCoopers
LLP
Philadelphia,
Pennsylvania
October
24,
2024
We
have
served
as
the
auditor
of
one
or
more
BlackRock
investment
companies
since
2000.
iShares
ESG
Aware
MSCI
USA
ETF
(1)
iShares
ESG
Aware
MSCI
USA
Growth
ETF
(2)
iShares
ESG
Aware
MSCI
USA
Small-Cap
ETF
(1)
iShares
ESG
Aware
MSCI
USA
Value
ETF
(2)
iShares
ESG
MSCI
USA
Leaders
ETF
(1)
iShares
Paris-Aligned
Climate
MSCI
USA
ETF
(1)
Important
Tax
Information
(unaudited)
2024
iShares
Annual
Financial
Statements
The
following
amounts,
or
maximum
amounts
allowable
by
law,
are
hereby
designated
as
qualified
dividend
income
for
individuals
for
the
fiscal
year
ended
August
31,
2024:
The
following
amounts,
or
maximum
amounts
allowable
by
law,
are
hereby
designated
as
qualified
business
income
for
individuals
for
the
fiscal
year
ended
August
31,
2024:
The
following
percentages,
or
maximum
percentages
allowable
by
law,
of
ordinary
income
distributions
paid
during
the
fiscal
year
ended August
31,
2024
qualified
for
the
dividends-received
deduction
for
corporate
shareholders:
iShares
ETF
Qualified
Dividend
Income
ESG
Aware
MSCI
USA
.................................................................................................
$
176,827,787
ESG
Aware
MSCI
USA
Growth
...........................................................................................
27,450
ESG
Aware
MSCI
USA
Small-Cap
.........................................................................................
16,423,360
ESG
Aware
MSCI
USA
Value
.............................................................................................
107,927
ESG
MSCI
USA
Leaders
................................................................................................
13,859,153
Paris-Aligned
Climate
MSCI
USA
..........................................................................................
15,779,860
iShares
ETF
Qualified
Business
Income
ESG
Aware
MSCI
USA
.................................................................................................
$
6,433,280
ESG
Aware
MSCI
USA
Growth
...........................................................................................
910
ESG
Aware
MSCI
USA
Small-Cap
.........................................................................................
3,542,746
ESG
Aware
MSCI
USA
Value
.............................................................................................
4,419
ESG
MSCI
USA
Leaders
................................................................................................
650,087
Paris-Aligned
Climate
MSCI
USA
..........................................................................................
3,363,246
iShares
ETF
Dividends-Received
Deduction
ESG
Aware
MSCI
USA
.................................................................................................
100
.00
%
ESG
Aware
MSCI
USA
Growth
...........................................................................................
100
.00
ESG
Aware
MSCI
USA
Small-Cap
.........................................................................................
76
.87
ESG
Aware
MSCI
USA
Value
.............................................................................................
97
.00
ESG
MSCI
USA
Leaders
................................................................................................
98
.06
Paris-Aligned
Climate
MSCI
USA
..........................................................................................
80
.79
Premium/Discount
Information
Information
on
the
Fund’s
net
asset
value,
market
price,
premiums
and
discounts,
and
bid-ask
spreads
can
be
found
at
iShares.com
.
Electronic
Delivery
Shareholders
can
sign
up
for
e-mail
notifications
announcing
that
the
shareholder
report
or
prospectus
has
been
posted
on
the
iShares
website
at
iShares.com
.
Once
you
have
enrolled,
you
will
no
longer
receive
prospectuses
and
shareholder
reports
in
the
mail.
To
enroll
in
electronic
delivery:
Go
to
icsdelivery.com
If
your
brokerage
firm
is
not
listed,
electronic
delivery
may
not
be
available.
Please
contact
your
broker-dealer
or
financial
advisor.
Changes
in
and
Disagreements
with
Accountants
Not
applicable.
Proxy
Results
Not
applicable.
Remuneration
Paid
to
Trustees,
Officers,
and
Others
Because
BFA
has
agreed in
the
Investment
Advisory
Agreements
to
cover
all
operating
expenses
of
the
Funds,
subject
to
certain
exclusions as
provided
for
therein,
BFA
pays
the
compensation
to
each
Independent Trustee
for
services
to
the
Funds
from
BFA’s
investment
advisory
fees.
Availability
of
Portfolio
Holdings
Information
A
description
of
the
Trust’s policies
and
procedures
with
respect
to
the
disclosure
of
the
Funds’
portfolio
securities
is
available
in
the
Fund
Prospectus.
The
Fund
discloses its
portfolio
holdings
daily
and
provide
information
regarding its
top
holdings
in
Fund
fact
sheets,
when
available, at
iShares.com
.
Board
Review
and
Approval
of
Investment
Advisory
Contract
2024
iShares
Annual
Financial
Statements
iShares
ESG
Aware
MSCI
USA
Growth
ETF,
iShares
ESG
Aware
MSCI
USA
Value
ETF,
iShares
ESG
MSCI
USA
Leaders
ETF,
iShares
Paris-Aligned
Climate
MSCI
USA
ETF
(each
the
“Fund”)
Under
Section
15(c)
of
the
Investment
Company
Act
of
1940
(the
“1940
Act”),
the
Trust’s
Board
of
Trustees
(the
“Board”),
including
a
majority
of
Board
Members
who
are
not
“interested
persons”
of
the
Trust
(as
that
term
is
defined
in
the
1940
Act)
(the
“Independent
Board
Members”),
is
required
annually
to
consider
the
approval
of
the
Investment
Advisory
Agreement
between
the
Trust
and
BFA
(the
“Advisory
Agreement”)
on
behalf
of
the
Fund.
The
Board’s
consideration
entails
a
year-long
process
whereby
the
Board
and
its
committees
(composed
solely
of
Independent
Board
Members)
assess
BlackRock’s
services
to
the
Fund,
including
investment
management;
fund
accounting;
administrative
and
shareholder
services;
oversight
of
the
Fund’s
service
providers;
risk
management
and
oversight;
and
legal
and
compliance
services;
including
the
ability
to
meet
applicable
legal
and
regulatory
requirements.
The
Independent
Board
Members
requested,
and
BFA
provided,
such
information
as
the
Independent
Board
Members,
with
advice
from
independent
counsel,
deemed
reasonably
necessary
to
evaluate
the
Advisory
Agreement.
At
meetings
held
on
May
6,
2024
and
May
17,
2024,
a
committee
composed
of
all
of
the
Independent
Board
Members
(the
“15(c)
Committee”),
with
independent
counsel,
met
with
management
and
reviewed
and
discussed
information
provided
in
response
to
initial
requests
of
the
15(c)
Committee
and/or
its
independent
counsel.
Prior
to
and
in
preparation
for
the
meeting,
the
Board
received
and
reviewed
materials
specifically
relating
to
matters
relevant
to
the
renewal
of
the
Advisory
Agreement.
Following
discussion,
the
15(c)
Committee
subsequently
requested
certain
additional
information,
which
management
agreed
to
provide.
At
a
meeting
held
on
June
4-5,
2024,
the
Board,
including
the
Independent
Board
Members,
reviewed
the
additional
information
provided
by
management
in
response
to
these
requests.
After
extensive
discussions
and
deliberations,
the
Board,
including
all
of
the
Independent
Board
Members,
approved
the
continuance
of
the
Advisory
Agreement
for
the
Fund,
based
on
a
review
of
qualitative
and
quantitative
information
provided
by
BFA
and
their
cumulative
experience
as
Board
Members.
The
Board
noted
its
satisfaction
with
the
extent
and
quality
of
information
provided
and
its
frequent
interactions
with
management,
as
well
as
the
detailed
responses
and
other
information
provided
by
BFA.
The
Independent
Board
Members
were
advised
by
their
independent
counsel
throughout
the
process,
including
about
the
legal
standards
applicable
to
their
review.
In
approving
the
continuance
of
the
Advisory
Agreement
for
the
Fund,
the
Board,
including
the
Independent
Board
Members,
considered
various
factors,
including:
(i)
the
expenses
and
performance
of
the
Fund;
(ii)
the
nature,
extent
and
quality
of
the
services
provided
by
BFA;
(iii)
the
costs
of
services
provided
to
the
Fund
and
profits
realized
by
BFA
and
its
affiliates;
(iv)
potential
economies
of
scale
and
the
sharing
of
related
benefits;
(v)
the
fees
and
services
provided
for
other
comparable
funds/accounts
managed
by
BFA
and
its
affiliates;
and
(vi)
other
benefits
to
BFA
and/or
its
affiliates.
The
Board
Members
did
not
identify
any
particular
information
or
any
single
factor
as
determinative,
and
each
Board
Member
may
have
attributed
different
weights
to
the
various
matters
and
factors
considered.
The
material
factors,
considerations
and
conclusions
that
formed
the
basis
for
the
Board,
including
the
Independent
Board
Members,
to
approve
the
continuance
of
the
Advisory
Agreement
are
discussed
below.
Expenses
and
Performance
of
the
Fund:
The
Board
reviewed
statistical
information
prepared
by
Broadridge
Financial
Solutions,
Inc.
(“Broadridge”),
an
independent
provider
of
investment
company
data,
regarding
the
expense
ratio
components,
including
gross
and
net
total
expenses,
fees
and
expenses
of
other
fund(s)
in
which
the
Fund
invests
(if
applicable),
and
waivers/reimbursements
(if
applicable)
of
the
Fund
in
comparison
with
the
same
information
for
other
ETFs,
objectively
selected
by
Broadridge
as
comprising
the
Fund’s
applicable
expense
peer
group
pursuant
to
Broadridge’s
proprietary
ETF
methodology
(the
“Peer
Group”).
The
Board
was
provided
with
a
detailed
description
of
the
proprietary
ETF
methodology
used
by
Broadridge
to
determine
the
Fund’s
Peer
Group.
The
Board
noted
that,
due
to
the
limitations
in
providing
comparable
funds
in
the
Peer
Group,
the
statistical
information
provided
in
Broadridge’s
report
may
or
may
not
provide
meaningful
direct
comparisons
to
the
Fund
in
all
instances.
The
Board
also
noted
that
the
investment
advisory
fee
rate
and
overall
expenses
(net
of
any
waivers
and
reimbursements)
for
the
Fund
were
lower
than
the
median
of
the
investment
advisory
fee
rates
and
overall
expenses
(net
of
any
waivers
and
reimbursements)
of
the
funds
in
its
Peer
Group,
excluding
iShares
funds.
In
addition,
to
the
extent
that
any
of
the
comparison
funds
included
in
the
Peer
Group,
excluding
iShares
funds,
track
the
same
index
as
the
Fund,
Broadridge
also
provided,
and
the
Board
reviewed,
a
comparison
of
the
Fund’s
performance
for
the
one-year,
three-year,
five-year,
ten-year,
and
since
inception
periods,
as
applicable,
and
for
the
quarter
ended
December
31,
2023,
to
that
of
such
relevant
comparison
fund(s)
for
the
same
periods.
The
Board
noted
that
the
Fund
seeks
to
track
its
specified
underlying
index
and
that,
during
the
year,
the
Board
received
periodic
reports
on
the
Fund’s
short-
and
longer-term
performance
in
comparison
with
its
underlying
index.
Such
periodic
comparative
performance
information,
including
additional
detailed
information
as
requested
by
the
Board,
was
also
considered.
The
Board
noted
that
the
Fund
generally
performed
in
line
with
its
underlying
index
over
the
relevant
periods.
Based
on
this
review,
the
other
relevant
factors
and
information
considered
at
the
meeting,
and
their
general
knowledge
of
ETF
pricing,
the
Board
concluded
that
the
investment
advisory
fee
rate
and
expense
level
and
the
historical
performance
of
the
Fund
supported
the
Board’s
approval
of
the
continuance
of
the
Advisory
Agreement
for
the
coming
year.
Nature,
Extent
and
Quality
of
Services
Provided:
Based
on
management’s
representations,
including
information
about
ongoing
enhancements
and
initiatives
with
respect
to
the
iShares
product
line
and
BFA’s
business,
including
with
respect
to
capital
markets
support
and
analysis,
technology,
portfolio
management,
product
design
and
quality,
compliance
and
risk
management,
global
public
policy
and
other
services,
the
Board
expected
that
there
would
be
no
diminution
in
the
scope
of
services
required
of
or
provided
by
BFA
under
the
Advisory
Agreement
for
the
coming
year
as
compared
with
the
scope
of
services
provided
by
BFA
during
prior
years.
In
reviewing
the
scope
of
these
services,
the
Board
considered
BFA’s
investment
philosophy
and
experience,
noting
that
BFA
and
its
affiliates
have
committed
significant
resources
over
time,
including
during
the
past
year,
to
support
the
iShares
funds
and
their
shareholders
and
have
made
significant
investments
into
the
iShares
business.
The
Board
also
considered
BFA’s
compliance
program
and
its
compliance
record
with
respect
to
the
Fund,
including
related
programs
implemented
pursuant
to
regulatory
requirements.
In
that
regard,
the
Board
noted
that
BFA
reports
to
the
Board
about
portfolio
management
and
compliance
matters
on
a
periodic
basis
in
connection
with
regularly
scheduled
meetings
of
the
Board,
and
on
other
occasions
as
necessary
and
appropriate,
and
has
provided
information
and
made
relevant
officers
and
other
employees
of
BFA
(and
its
affiliates)
available
as
needed
to
provide
further
assistance
with
these
matters.
The
Board
also
reviewed
the
background
and
experience
of
the
persons
responsible
for
the
day-to-day
management
of
the
Fund,
as
well
as
the
resources
available
to
them
in
managing
the
Fund.
In
addition
to
the
above
considerations,
the
Board
reviewed
and
considered
detailed
presentations
regarding
BFA’s
investment
performance,
investment
and
risk
management
processes
and
strategies
provided
at
the
May
6,
2024
meeting
and
throughout
the
year,
and
matters
related
to
BFA’s
portfolio
compliance
program
and
other
compliance
programs
and
services,
as
well
as
BlackRock’s
continued
investments
in
its
ETF
business.
Based
on
review
of
this
information,
and
the
performance
information
discussed
above,
the
Board
concluded
that
the
nature,
extent
and
quality
of
services
provided
to
the
Fund
under
the
Advisory
Agreement
supported
the
Board’s
approval
of
the
continuance
of
the
Advisory
Agreement
for
the
coming
year.
Board
Review
and
Approval
of
Investment
Advisory
Contract
(
continued)
Board
Review
and
Approval
of
Investment
Advisory
Contract
Costs
of
Services
Provided
to
the
Fund
and
Profits
Realized
by
BFA
and
its
Affiliates:
The
Board
reviewed
information
about
the
estimated
profitability
to
BlackRock
in
managing
the
Fund,
based
on
the
fees
payable
to
BFA
and
its
affiliates
(including
fees
under
the
Advisory
Agreement),
and
other
sources
of
revenue
and
expense
to
BFA
and
its
affiliates
from
the
Fund’s
operations
for
the
last
calendar
year.
The
Board
reviewed
BlackRock’s
methodology
for
calculating
estimated
profitability
of
the
iShares
funds,
noting
that
the
15(c)
Committee
and
the
Board
had
focused
on
the
methodology
and
profitability
presentation.
The
Board
recognized
that
profitability
may
be
affected
by
numerous
factors,
including,
among
other
things,
fee
waivers
by
BFA,
the
types
of
funds
managed,
expense
allocations
and
business
mix.
The
Board
thus
recognized
that
calculating
and
comparing
profitability
at
individual
fund
levels
is
challenging.
The
Board
discussed
with
management
the
sources
of
direct
and
ancillary
revenue,
including
the
revenues
to
BTC,
a
BlackRock
affiliate,
from
securities
lending
by
the
Fund.
The
Board
also
discussed
BFA’s
estimated
profit
margin
as
reflected
in
the
Fund’s
profitability
analysis
and
reviewed
information
regarding
potential
economies
of
scale
(as
discussed
below).
Based
on
this
review,
the
Board
concluded
that
the
information
considered
with
respect
to
the
profits
realized
by
BFA
and
its
affiliates
under
the
Advisory
Agreement
and
from
other
relationships
between
the
Fund
and
BFA
and/or
its
affiliates,
if
any,
and
related
costs
of
the
services
provided
as
well
as
the
other
factors
considered
at
the
meeting,
supported
the
Board’s
approval
of
the
continuance
of
the
Advisory
Agreement
for
the
coming
year.
Economies
of
Scale:
The
Board
reviewed
information
and
considered
the
extent
to
which
economies
of
scale
might
be
realized
as
the
assets
of
the
Fund
increase,
noting
that
the
issue
of
potential
economies
of
scale
had
been
focused
on
by
the
15(c)
Committee
and
the
Board
during
their
meetings
and
addressed
by
management.
The
15(c)
Committee
and
the
Board
received
information
regarding
BlackRock’s
historical
estimated
profitability
(as
discussed
above),
including
BFA’s
and
its
affiliates’
estimated
costs
in
providing
services.
The
estimated
cost
information
distinguished,
among
other
things,
between
fixed
and
variable
costs,
and
showed
how
the
level
and
nature
of
fixed
and
variable
costs
may
impact
the
existence
or
size
of
scale
benefits,
with
the
Board
recognizing
that
potential
economies
of
scale
are
difficult
to
measure.
The
15(c)
Committee
and
the
Board
reviewed
information
provided
by
BFA
regarding
the
sharing
of
scale
benefits
with
the
iShares
funds
through
various
means,
including,
as
applicable,
through
breakpoints,
waivers,
or
other
fee
reductions,
as
well
as
through
additional
investment
in
the
iShares
business,
including
enhancements
to
or
the
provision
of
additional
infrastructure
and
services
to
the
iShares
funds
and
their
shareholders
and,
with
respect
to
New
Funds,
set
management
fees
at
levels
that
anticipate
scale
over
time.
The
Board
noted
that
the
Advisory
Agreement
for
the
Fund
did
not
provide
for
breakpoints
in
the
Fund’s
investment
advisory
fee
rate
as
the
assets
of
the
Fund
increase.
However,
the
Board
noted
that
it
would
continue
to
assess
the
appropriateness
of
adding
breakpoints
in
the
future.
The
Board
concluded
that
this
review
of
potential
economies
of
scale
and
the
sharing
of
related
benefits,
as
well
as
the
other
factors
considered
at
the
meeting,
supported
the
Board’s
approval
of
the
continuance
of
the
Advisory
Agreement
for
the
coming
year.
Fees
and
Services
Provided
for
Other
Comparable
Funds/Accounts
Managed
by
BFA
and
its
Affiliates:
The
Board
received
and
considered
information
regarding
the
investment
advisory/management
fee
rates
for
other
funds/accounts
in
the
U.S.
for
which
BFA
(or
its
affiliates)
provides
investment
advisory/management
services,
including
open-end
funds
registered
under
the
1940
Act
(including
sub-advised
funds),
collective
trust
funds
and
institutional
separate
accounts
(collectively,
the
“Other
Accounts”).
The
Board
received
detailed
information
regarding
how
the
Other
Accounts
generally
differ
from
the
Fund,
including
in
terms
of
the
types
of
services
and
generally
more
extensive
character
and
scope
of
services
provided
to
the
Fund,
as
well
as
other
significant
differences.
In
that
regard,
the
Board
considered
that
the
pricing
of
services
to
institutional
clients
is
typically
based
on
a
number
of
factors
beyond
the
nature
and
extent
of
the
specific
services
to
be
provided
and
often
depends
on
the
overall
relationship
between
the
client
and
its
affiliates
and
the
adviser
and
its
affiliates.
In
addition,
the
Board
considered
the
relative
complexity
and
inherent
risks
and
challenges
of
managing
and
providing
other
services
to
the
Fund,
as
a
publicly
traded
investment
vehicle,
as
compared
to
the
Other
Accounts,
particularly
those
that
are
institutional
clients,
in
light
of
differing
regulatory
requirements
and
client-imposed
mandates.
The
Board
acknowledged
BFA’s
representation
that
the
iShares
funds
are
fundamentally
different
investment
vehicles
from
the
Other
Accounts
in
its
consideration
of
relevant
qualitative
and
quantitative
comparative
information
provided.
The
Board
noted
that
BFA
and
its
affiliates
do
not
manage
Other
Accounts
with
substantially
the
same
investment
objective
and
strategy
as
the
Fund
and
that
track
the
same
index
as
the
Fund.
The
Board
also
acknowledged
management’s
assertion
that,
for
certain
iShares
funds,
and
for
client
segmentation
purposes,
BlackRock
has
launched
an
iShares
fund
that
may
provide
a
similar
investment
exposure
at
a
lower
investment
advisory
fee
rate.
The
Board
considered
the
“all-inclusive”
nature
of
the
Fund’s
advisory
fee
structure,
and
the
Fund’s
expenses
borne
by
BFA
under
this
arrangement
and
noted
that
the
investment
advisory
fee
rate
under
the
Advisory
Agreement
for
the
Fund
was
generally
higher
than
the
investment
advisory/management
fee
rates
for
certain
of
the
Other
Accounts
(particularly
institutional
clients)
and
concluded
that
the
differences
appeared
to
be
consistent
with
the
factors
discussed.
Other
Benefits
to
BFA
and/or
its
Affiliates:
The
Board
reviewed
other
benefits
or
ancillary
revenue
received
by
BFA
and/or
its
affiliates
in
connection
with
the
services
provided
to
the
Fund
by
BFA,
both
direct
and
indirect,
including,
but
not
limited
to,
payment
of
revenue
to
BTC,
the
Fund’s
securities
lending
agent,
for
loaning
portfolio
securities,
as
applicable
(which
was
included
in
the
profit
margins
reviewed
by
the
Board
pursuant
to
BFA’s
estimated
profitability
methodology),
payment
of
advisory
fees
or
other
fees
to
BFA
(or
its
affiliates)
in
connection
with
any
investments
by
the
Fund
in
other
funds
(including
cash
sweep
vehicles)
for
which
BFA
(or
its
affiliates)
provides
investment
advisory
services
or
other
services,
and
BlackRock’s
profile
in
the
investment
community.
The
Board
further
considered
other
direct
benefits
that
might
accrue
to
BFA,
including
actual
and
potential
reductions
in
the
Fund’s
expenses
that
are
borne
by
BFA
under
the
“all-inclusive”
management
fee
arrangement,
due
in
part
to
the
size
and
scope
of
BFA’s
investment
operations
servicing
the
Fund
(and
other
funds
in
the
iShares
complex)
as
well
as
in
response
to
a
changing
market
environment.
The
Board
also
reviewed
and
considered
information
provided
by
BFA
concerning
authorized
participant
primary
market
order
processing
services
that
are
provided
by
BlackRock
Investments,
LLC
(“BRIL”),
an
affiliate
of
BFA,
and
paid
for
by
authorized
participants
under
the
ETF
Servicing
Platform.
The
Board
also
noted
the
revenue
received
by
BFA
and/or
its
affiliates
pursuant
to
an
agreement
that
permits
a
service
provider
to
use
certain
portions
of
BlackRock’s
technology
platform
to
service
accounts
managed
by
BFA
and/or
its
affiliates,
including
the
iShares
funds.
The
Board
noted
that
BFA
generally
does
not
use
soft
dollars
or
consider
the
value
of
research
or
other
services
that
may
be
provided
to
BFA
(including
its
affiliates)
in
selecting
brokers
for
portfolio
transactions
for
the
Fund.
The
Board
concluded
that
any
such
ancillary
benefits
would
not
be
disadvantageous
to
the
Fund
and
thus
would
not
alter
the
Board’s
conclusion
with
respect
to
the
appropriateness
of
approving
the
continuance
of
the
Advisory
Agreement
for
the
coming
year.
Conclusion:
Based
on
a
review
of
the
factors
described
above,
as
well
as
such
other
factors
as
deemed
appropriate
by
the
Board,
the
Board,
including
all
of
the
Independent
Board
Members,
determined
that
the
Fund’s
investment
advisory
fee
rate
under
the
Advisory
Agreement
does
not
constitute
a
fee
that
is
so
disproportionately
large
as
to
bear
no
reasonable
relationship
to
the
services
rendered
and
that
could
not
have
been
the
product
of
arm’s-length
bargaining,
and
concluded
to
approve
the
continuance
of
the
Advisory
Agreement
for
the
coming
year.
Board
Review
and
Approval
of
Investment
Advisory
Contract
(continued)
2024
iShares
Annual
Financial
Statements
iShares
ESG
Aware
MSCI
USA
ETF,
iShares
ESG
Aware
MSCI
USA
Small-Cap
ETF
(each
the
“Fund”)
Under
Section
15(c)
of
the
Investment
Company
Act
of
1940
(the
“1940
Act”),
the
Trust’s
Board
of
Trustees
(the
“Board”),
including
a
majority
of
Board
Members
who
are
not
“interested
persons”
of
the
Trust
(as
that
term
is
defined
in
the
1940
Act)
(the
“Independent
Board
Members”),
is
required
annually
to
consider
the
approval
of
the
Investment
Advisory
Agreement
between
the
Trust
and
BFA
(the
“Advisory
Agreement”)
on
behalf
of
the
Fund.
The
Board’s
consideration
entails
a
year-long
process
whereby
the
Board
and
its
committees
(composed
solely
of
Independent
Board
Members)
assess
BlackRock’s
services
to
the
Fund,
including
investment
management;
fund
accounting;
administrative
and
shareholder
services;
oversight
of
the
Fund’s
service
providers;
risk
management
and
oversight;
and
legal
and
compliance
services;
including
the
ability
to
meet
applicable
legal
and
regulatory
requirements.
The
Independent
Board
Members
requested,
and
BFA
provided,
such
information
as
the
Independent
Board
Members,
with
advice
from
independent
counsel,
deemed
reasonably
necessary
to
evaluate
the
Advisory
Agreement.
At
meetings
held
on
May
6,
2024
and
May
17,
2024,
a
committee
composed
of
all
of
the
Independent
Board
Members
(the
“15(c)
Committee”),
with
independent
counsel,
met
with
management
and
reviewed
and
discussed
information
provided
in
response
to
initial
requests
of
the
15(c)
Committee
and/or
its
independent
counsel.
Prior
to
and
in
preparation
for
the
meeting,
the
Board
received
and
reviewed
materials
specifically
relating
to
matters
relevant
to
the
renewal
of
the
Advisory
Agreement.
Following
discussion,
the
15(c)
Committee
subsequently
requested
certain
additional
information,
which
management
agreed
to
provide.
At
a
meeting
held
on
June
4-5,
2024,
the
Board,
including
the
Independent
Board
Members,
reviewed
the
additional
information
provided
by
management
in
response
to
these
requests.
After
extensive
discussions
and
deliberations,
the
Board,
including
all
of
the
Independent
Board
Members,
approved
the
continuance
of
the
Advisory
Agreement
for
the
Fund,
based
on
a
review
of
qualitative
and
quantitative
information
provided
by
BFA
and
their
cumulative
experience
as
Board
Members.
The
Board
noted
its
satisfaction
with
the
extent
and
quality
of
information
provided
and
its
frequent
interactions
with
management,
as
well
as
the
detailed
responses
and
other
information
provided
by
BFA.
The
Independent
Board
Members
were
advised
by
their
independent
counsel
throughout
the
process,
including
about
the
legal
standards
applicable
to
their
review.
In
approving
the
continuance
of
the
Advisory
Agreement
for
the
Fund,
the
Board,
including
the
Independent
Board
Members,
considered
various
factors,
including:
(i)
the
expenses
and
performance
of
the
Fund;
(ii)
the
nature,
extent
and
quality
of
the
services
provided
by
BFA;
(iii)
the
costs
of
services
provided
to
the
Fund
and
profits
realized
by
BFA
and
its
affiliates;
(iv)
potential
economies
of
scale
and
the
sharing
of
related
benefits;
(v)
the
fees
and
services
provided
for
other
comparable
funds/accounts
managed
by
BFA
and
its
affiliates;
and
(vi)
other
benefits
to
BFA
and/or
its
affiliates.
The
Board
Members
did
not
identify
any
particular
information
or
any
single
factor
as
determinative,
and
each
Board
Member
may
have
attributed
different
weights
to
the
various
matters
and
factors
considered.
The
material
factors,
considerations
and
conclusions
that
formed
the
basis
for
the
Board,
including
the
Independent
Board
Members,
to
approve
the
continuance
of
the
Advisory
Agreement
are
discussed
below.
Expenses
and
Performance
of
the
Fund:
The
Board
reviewed
statistical
information
prepared
by
Broadridge
Financial
Solutions,
Inc.
(“Broadridge”),
an
independent
provider
of
investment
company
data,
regarding
the
expense
ratio
components,
including
gross
and
net
total
expenses,
fees
and
expenses
of
other
fund(s)
in
which
the
Fund
invests
(if
applicable),
and
waivers/reimbursements
(if
applicable)
of
the
Fund
in
comparison
with
the
same
information
for
other
ETFs,
objectively
selected
by
Broadridge
as
comprising
the
Fund’s
applicable
expense
peer
group
pursuant
to
Broadridge’s
proprietary
ETF
methodology
(the
“Peer
Group”).
The
Board
was
provided
with
a
detailed
description
of
the
proprietary
ETF
methodology
used
by
Broadridge
to
determine
the
Fund’s
Peer
Group.
The
Board
noted
that,
due
to
the
limitations
in
providing
comparable
funds
in
the
Peer
Group,
the
statistical
information
provided
in
Broadridge’s
report
may
or
may
not
provide
meaningful
direct
comparisons
to
the
Fund
in
all
instances.
The
Board
also
noted
that
the
investment
advisory
fee
rate
and
overall
expenses
(net
of
any
waivers
and
reimbursements)
for
the
Fund
were
within
range
of
the
median
of
the
investment
advisory
fee
rates
and
overall
expenses
(net
of
any
waivers
and
reimbursements)
of
the
funds
in
its
Peer
Group,
excluding
iShares
funds.
In
addition,
to
the
extent
that
any
of
the
comparison
funds
included
in
the
Peer
Group,
excluding
iShares
funds,
track
the
same
index
as
the
Fund,
Broadridge
also
provided,
and
the
Board
reviewed,
a
comparison
of
the
Fund’s
performance
for
the
one-year,
three-year,
five-year,
ten-year,
and
since
inception
periods,
as
applicable,
and
for
the
quarter
ended
December
31,
2023,
to
that
of
such
relevant
comparison
fund(s)
for
the
same
periods.
The
Board
noted
that
the
Fund
seeks
to
track
its
specified
underlying
index
and
that,
during
the
year,
the
Board
received
periodic
reports
on
the
Fund’s
short-
and
longer-term
performance
in
comparison
with
its
underlying
index.
Such
periodic
comparative
performance
information,
including
additional
detailed
information
as
requested
by
the
Board,
was
also
considered.
The
Board
noted
that
the
Fund
generally
performed
in
line
with
its
underlying
index
over
the
relevant
periods.
Based
on
this
review,
the
other
relevant
factors
and
information
considered
at
the
meeting,
and
their
general
knowledge
of
ETF
pricing,
the
Board
concluded
that
the
investment
advisory
fee
rate
and
expense
level
and
the
historical
performance
of
the
Fund
supported
the
Board’s
approval
of
the
continuance
of
the
Advisory
Agreement
for
the
coming
year.
Nature,
Extent
and
Quality
of
Services
Provided:
Based
on
management’s
representations,
including
information
about
ongoing
enhancements
and
initiatives
with
respect
to
the
iShares
product
line
and
BFA’s
business,
including
with
respect
to
capital
markets
support
and
analysis,
technology,
portfolio
management,
product
design
and
quality,
compliance
and
risk
management,
global
public
policy
and
other
services,
the
Board
expected
that
there
would
be
no
diminution
in
the
scope
of
services
required
of
or
provided
by
BFA
under
the
Advisory
Agreement
for
the
coming
year
as
compared
with
the
scope
of
services
provided
by
BFA
during
prior
years.
In
reviewing
the
scope
of
these
services,
the
Board
considered
BFA’s
investment
philosophy
and
experience,
noting
that
BFA
and
its
affiliates
have
committed
significant
resources
over
time,
including
during
the
past
year,
to
support
the
iShares
funds
and
their
shareholders
and
have
made
significant
investments
into
the
iShares
business.
The
Board
also
considered
BFA’s
compliance
program
and
its
compliance
record
with
respect
to
the
Fund,
including
related
programs
implemented
pursuant
to
regulatory
requirements.
In
that
regard,
the
Board
noted
that
BFA
reports
to
the
Board
about
portfolio
management
and
compliance
matters
on
a
periodic
basis
in
connection
with
regularly
scheduled
meetings
of
the
Board,
and
on
other
occasions
as
necessary
and
appropriate,
and
has
provided
information
and
made
relevant
officers
and
other
employees
of
BFA
(and
its
affiliates)
available
as
needed
to
provide
further
assistance
with
these
matters.
The
Board
also
reviewed
the
background
and
experience
of
the
persons
responsible
for
the
day-to-day
management
of
the
Fund,
as
well
as
the
resources
available
to
them
in
managing
the
Fund.
In
addition
to
the
above
considerations,
the
Board
reviewed
and
considered
detailed
presentations
regarding
BFA’s
investment
performance,
investment
and
risk
management
processes
and
strategies
provided
at
the
May
6,
2024
meeting
and
throughout
the
year,
and
matters
related
to
BFA’s
portfolio
compliance
program
and
other
compliance
programs
and
services,
as
well
as
BlackRock’s
continued
investments
in
its
ETF
business.
Based
on
review
of
this
information,
and
the
performance
information
discussed
above,
the
Board
concluded
that
the
nature,
extent
and
quality
of
services
provided
to
the
Fund
under
the
Advisory
Agreement
supported
the
Board’s
approval
of
the
continuance
of
the
Advisory
Agreement
for
the
coming
year.
Board
Review
and
Approval
of
Investment
Advisory
Contract
(
continued)
Board
Review
and
Approval
of
Investment
Advisory
Contract
Costs
of
Services
Provided
to
the
Fund
and
Profits
Realized
by
BFA
and
its
Affiliates:
The
Board
reviewed
information
about
the
estimated
profitability
to
BlackRock
in
managing
the
Fund,
based
on
the
fees
payable
to
BFA
and
its
affiliates
(including
fees
under
the
Advisory
Agreement),
and
other
sources
of
revenue
and
expense
to
BFA
and
its
affiliates
from
the
Fund’s
operations
for
the
last
calendar
year.
The
Board
reviewed
BlackRock’s
methodology
for
calculating
estimated
profitability
of
the
iShares
funds,
noting
that
the
15(c)
Committee
and
the
Board
had
focused
on
the
methodology
and
profitability
presentation.
The
Board
recognized
that
profitability
may
be
affected
by
numerous
factors,
including,
among
other
things,
fee
waivers
by
BFA,
the
types
of
funds
managed,
expense
allocations
and
business
mix.
The
Board
thus
recognized
that
calculating
and
comparing
profitability
at
individual
fund
levels
is
challenging.
The
Board
discussed
with
management
the
sources
of
direct
and
ancillary
revenue,
including
the
revenues
to
BTC,
a
BlackRock
affiliate,
from
securities
lending
by
the
Fund.
The
Board
also
discussed
BFA’s
estimated
profit
margin
as
reflected
in
the
Fund’s
profitability
analysis
and
reviewed
information
regarding
potential
economies
of
scale
(as
discussed
below).
Based
on
this
review,
the
Board
concluded
that
the
information
considered
with
respect
to
the
profits
realized
by
BFA
and
its
affiliates
under
the
Advisory
Agreement
and
from
other
relationships
between
the
Fund
and
BFA
and/or
its
affiliates,
if
any,
and
related
costs
of
the
services
provided
as
well
as
the
other
factors
considered
at
the
meeting,
supported
the
Board’s
approval
of
the
continuance
of
the
Advisory
Agreement
for
the
coming
year.
Economies
of
Scale:
The
Board
reviewed
information
and
considered
the
extent
to
which
economies
of
scale
might
be
realized
as
the
assets
of
the
Fund
increase,
noting
that
the
issue
of
potential
economies
of
scale
had
been
focused
on
by
the
15(c)
Committee
and
the
Board
during
their
meetings
and
addressed
by
management.
The
15(c)
Committee
and
the
Board
received
information
regarding
BlackRock’s
historical
estimated
profitability
(as
discussed
above),
including
BFA’s
and
its
affiliates’
estimated
costs
in
providing
services.
The
estimated
cost
information
distinguished,
among
other
things,
between
fixed
and
variable
costs,
and
showed
how
the
level
and
nature
of
fixed
and
variable
costs
may
impact
the
existence
or
size
of
scale
benefits,
with
the
Board
recognizing
that
potential
economies
of
scale
are
difficult
to
measure.
The
15(c)
Committee
and
the
Board
reviewed
information
provided
by
BFA
regarding
the
sharing
of
scale
benefits
with
the
iShares
funds
through
various
means,
including,
as
applicable,
through
breakpoints,
waivers,
or
other
fee
reductions,
as
well
as
through
additional
investment
in
the
iShares
business,
including
enhancements
to
or
the
provision
of
additional
infrastructure
and
services
to
the
iShares
funds
and
their
shareholders
and,
with
respect
to
New
Funds,
set
management
fees
at
levels
that
anticipate
scale
over
time.
The
Board
noted
that
the
Advisory
Agreement
for
the
Fund
did
not
provide
for
breakpoints
in
the
Fund’s
investment
advisory
fee
rate
as
the
assets
of
the
Fund
increase.
However,
the
Board
noted
that
it
would
continue
to
assess
the
appropriateness
of
adding
breakpoints
in
the
future.
The
Board
concluded
that
this
review
of
potential
economies
of
scale
and
the
sharing
of
related
benefits,
as
well
as
the
other
factors
considered
at
the
meeting,
supported
the
Board’s
approval
of
the
continuance
of
the
Advisory
Agreement
for
the
coming
year.
Fees
and
Services
Provided
for
Other
Comparable
Funds/Accounts
Managed
by
BFA
and
its
Affiliates:
The
Board
received
and
considered
information
regarding
the
investment
advisory/management
fee
rates
for
other
funds/accounts
in
the
U.S.
for
which
BFA
(or
its
affiliates)
provides
investment
advisory/management
services,
including
open-end
funds
registered
under
the
1940
Act
(including
sub-advised
funds),
collective
trust
funds
and
institutional
separate
accounts
(collectively,
the
“Other
Accounts”).
The
Board
received
detailed
information
regarding
how
the
Other
Accounts
generally
differ
from
the
Fund,
including
in
terms
of
the
types
of
services
and
generally
more
extensive
character
and
scope
of
services
provided
to
the
Fund,
as
well
as
other
significant
differences.
In
that
regard,
the
Board
considered
that
the
pricing
of
services
to
institutional
clients
is
typically
based
on
a
number
of
factors
beyond
the
nature
and
extent
of
the
specific
services
to
be
provided
and
often
depends
on
the
overall
relationship
between
the
client
and
its
affiliates
and
the
adviser
and
its
affiliates.
In
addition,
the
Board
considered
the
relative
complexity
and
inherent
risks
and
challenges
of
managing
and
providing
other
services
to
the
Fund,
as
a
publicly
traded
investment
vehicle,
as
compared
to
the
Other
Accounts,
particularly
those
that
are
institutional
clients,
in
light
of
differing
regulatory
requirements
and
client-imposed
mandates.
The
Board
acknowledged
BFA’s
representation
that
the
iShares
funds
are
fundamentally
different
investment
vehicles
from
the
Other
Accounts
in
its
consideration
of
relevant
qualitative
and
quantitative
comparative
information
provided.
The
Board
noted
that
BFA
and
its
affiliates
do
not
manage
Other
Accounts
with
substantially
the
same
investment
objective
and
strategy
as
the
Fund
and
that
track
the
same
index
as
the
Fund.
The
Board
also
acknowledged
management’s
assertion
that,
for
certain
iShares
funds,
and
for
client
segmentation
purposes,
BlackRock
has
launched
an
iShares
fund
that
may
provide
a
similar
investment
exposure
at
a
lower
investment
advisory
fee
rate.
The
Board
considered
the
“all-inclusive”
nature
of
the
Fund’s
advisory
fee
structure,
and
the
Fund’s
expenses
borne
by
BFA
under
this
arrangement
and
noted
that
the
investment
advisory
fee
rate
under
the
Advisory
Agreement
for
the
Fund
was
generally
higher
than
the
investment
advisory/management
fee
rates
for
certain
of
the
Other
Accounts
(particularly
institutional
clients)
and
concluded
that
the
differences
appeared
to
be
consistent
with
the
factors
discussed.
Other
Benefits
to
BFA
and/or
its
Affiliates:
The
Board
reviewed
other
benefits
or
ancillary
revenue
received
by
BFA
and/or
its
affiliates
in
connection
with
the
services
provided
to
the
Fund
by
BFA,
both
direct
and
indirect,
including,
but
not
limited
to,
payment
of
revenue
to
BTC,
the
Fund’s
securities
lending
agent,
for
loaning
portfolio
securities,
as
applicable
(which
was
included
in
the
profit
margins
reviewed
by
the
Board
pursuant
to
BFA’s
estimated
profitability
methodology),
payment
of
advisory
fees
or
other
fees
to
BFA
(or
its
affiliates)
in
connection
with
any
investments
by
the
Fund
in
other
funds
(including
cash
sweep
vehicles)
for
which
BFA
(or
its
affiliates)
provides
investment
advisory
services
or
other
services,
and
BlackRock’s
profile
in
the
investment
community.
The
Board
further
considered
other
direct
benefits
that
might
accrue
to
BFA,
including
actual
and
potential
reductions
in
the
Fund’s
expenses
that
are
borne
by
BFA
under
the
“all-inclusive”
management
fee
arrangement,
due
in
part
to
the
size
and
scope
of
BFA’s
investment
operations
servicing
the
Fund
(and
other
funds
in
the
iShares
complex)
as
well
as
in
response
to
a
changing
market
environment.
The
Board
also
reviewed
and
considered
information
provided
by
BFA
concerning
authorized
participant
primary
market
order
processing
services
that
are
provided
by
BlackRock
Investments,
LLC
(“BRIL”),
an
affiliate
of
BFA,
and
paid
for
by
authorized
participants
under
the
ETF
Servicing
Platform.
The
Board
also
noted
the
revenue
received
by
BFA
and/or
its
affiliates
pursuant
to
an
agreement
that
permits
a
service
provider
to
use
certain
portions
of
BlackRock’s
technology
platform
to
service
accounts
managed
by
BFA
and/or
its
affiliates,
including
the
iShares
funds.
The
Board
noted
that
BFA
generally
does
not
use
soft
dollars
or
consider
the
value
of
research
or
other
services
that
may
be
provided
to
BFA
(including
its
affiliates)
in
selecting
brokers
for
portfolio
transactions
for
the
Fund.
The
Board
concluded
that
any
such
ancillary
benefits
would
not
be
disadvantageous
to
the
Fund
and
thus
would
not
alter
the
Board’s
conclusion
with
respect
to
the
appropriateness
of
approving
the
continuance
of
the
Advisory
Agreement
for
the
coming
year.
Conclusion:
Based
on
a
review
of
the
factors
described
above,
as
well
as
such
other
factors
as
deemed
appropriate
by
the
Board,
the
Board,
including
all
of
the
Independent
Board
Members,
determined
that
the
Fund’s
investment
advisory
fee
rate
under
the
Advisory
Agreement
does
not
constitute
a
fee
that
is
so
disproportionately
large
as
to
bear
no
reasonable
relationship
to
the
services
rendered
and
that
could
not
have
been
the
product
of
arm’s-length
bargaining,
and
concluded
to
approve
the
continuance
of
the
Advisory
Agreement
for
the
coming
year.
Glossary
of
Terms
Used
in
this
Report
2024
iShares
Annual
Financial
Statements
Portfolio
Abbreviation
CVR
Contingent
Value
Rights
NVS
Non-Voting
Shares
REIT
Real
Estate
Investment
Trust
Want
to
know
more?
iShares.com
|
1-800-474-2737
This
report
is
intended
for
the
Funds’
shareholders.
It
may
not
be
distributed
to
prospective
investors
unless
it
is
preceded
or
accompanied
by
the
current
prospectus.
Investing
involves
risk,
including
possible
loss
of
principal.
The
iShares
Funds
are
distributed
by
BlackRock
Investments,
LLC
(together
with
its
affiliates,
“BlackRock”).
The
iShares
Funds
are
not
sponsored,
endorsed,
issued,
sold
or
promoted
by
MSCI
Inc.,
nor
does
this
company
make
any
representation
regarding
the
advisability
of
investing
in
the
iShares
Funds.
BlackRock
is
not
affiliated
with
the
company
listed
above.
©2024
BlackRock,
Inc.
All
rights
reserved.
iSHARES
and
BLACKROCK
are
registered
trademarks
of
BlackRock,
or
its
subsidiaries.
All
other
marks
are
the
property
of
their
respective
owners.
2024
Annual
Financial
Statements
iShares
Trust
iShares
Climate
Conscious
&
Transition
MSCI
USA
ETF
|
USCL
|
NASDAQ
iShares
ESG
Advanced
MSCI
USA
ETF
|
USXF
|
NASDAQ
Schedules
of
Investments
.................................................................................................
3
Statements
of
Assets
and
Liabilities
...........................................................................................
15
Statements
of
Operations
.................................................................................................
16
Statements
of
Changes
in
Net
Assets
..........................................................................................
17
Financial
Highlights
.....................................................................................................
18
Notes
to
Financial
Statements
...............................................................................................
20
Report
of
Independent
Registered
Public
Accounting
Firm
..............................................................................
27
Important
Tax
Information
(unaudited)
.................................................................................................
28
Additional
Information
....................................................................................................
29
Board
Review
and
Approval
of
Investment
Advisory
Contract
...........................................................................
30
Glossary
of
Terms
Used
in
this
Report
..........................................................................................
32
iShares
®
Climate
Conscious
&
Transition
MSCI
USA
ETF
Schedule
of
Investments
August
31,
2024
(Percentages
shown
are
based
on
Net
Assets)
Security
Shares
Value
a
Common
Stocks
Air
Freight
&
Logistics
—
0
.5
%
Expeditors
International
of
Washington,
Inc.
.......
8,873
$
1,095,017
FedEx
Corp.
............................
14,426
4,310,056
United
Parcel
Service,
Inc.
,
Class
B
............
45,173
5,806,989
11,212,062
a
Automobiles
—
2
.1
%
Ford
Motor
Co.
..........................
242,864
2,717,648
General
Motors
Co.
.......................
70,627
3,515,812
Tesla,
Inc.
(a)
.............................
177,761
38,060,408
44,293,868
a
Banks
—
3
.5
%
Bank
of
America
Corp.
.....................
435,895
17,762,721
JPMorgan
Chase
&
Co.
....................
177,847
39,980,006
U.S.
Bancorp
...........................
96,642
4,564,402
Wells
Fargo
&
Co.
........................
215,913
12,624,433
74,931,562
a
Beverages
—
1
.9
%
Coca-Cola
Co.
(The)
......................
253,459
18,368,174
Constellation
Brands,
Inc.
,
Class
A
.............
10,144
2,441,762
Keurig
Dr
Pepper,
Inc.
.....................
67,305
2,464,036
Molson
Coors
Beverage
Co.
,
Class
B
...........
11,482
619,683
Monster
Beverage
Corp.
(a)
...................
45,869
2,161,806
PepsiCo,
Inc.
...........................
85,068
14,706,556
40,762,017
a
Biotechnology
—
2
.6
%
AbbVie,
Inc.
............................
109,363
21,469,051
Amgen,
Inc.
............................
33,222
11,090,500
Biogen,
Inc.
(a)
...........................
8,963
1,835,264
Gilead
Sciences,
Inc.
......................
77,158
6,095,482
Incyte
Corp.
(a)
...........................
10,084
662,115
Regeneron
Pharmaceuticals,
Inc.
(a)
.............
6,711
7,950,455
Vertex
Pharmaceuticals,
Inc.
(a)
................
15,982
7,925,314
57,028,181
a
Broadline
Retail
—
5
.0
%
Amazon.com,
Inc.
(a)
.......................
556,225
99,286,163
eBay,
Inc.
..............................
31,090
1,837,419
MercadoLibre,
Inc.
(a)
.......................
2,826
5,826,251
106,949,833
a
Building
Products
—
0
.5
%
Carlisle
Companies,
Inc.
....................
2,947
1,248,939
Johnson
Controls
International
PLC
............
42,019
3,061,084
Lennox
International,
Inc.
...................
1,978
1,167,396
Owens
Corning
..........................
5,363
904,899
Trane
Technologies
PLC
....................
14,008
5,066,133
11,448,451
a
Capital
Markets
—
3
.6
%
Bank
of
New
York
Mellon
Corp.
(The)
...........
45,703
3,117,859
BlackRock,
Inc.
(b)
.........................
9,188
8,285,830
Blackstone,
Inc.
,
NVS
......................
44,259
6,300,711
Carlyle
Group,
Inc.
(The)
....................
14,465
580,480
Cboe
Global
Markets,
Inc.
...................
6,505
1,336,127
Charles
Schwab
Corp.
(The)
.................
93,559
6,090,691
CME
Group,
Inc.
,
Class
A
...................
22,309
4,812,944
FactSet
Research
Systems,
Inc.
...............
2,350
993,674
Goldman
Sachs
Group,
Inc.
(The)
.............
19,971
10,190,203
Intercontinental
Exchange,
Inc.
...............
35,523
5,738,740
Moody's
Corp.
...........................
10,178
4,964,218
Morgan
Stanley
..........................
75,659
7,839,029
Security
Shares
Value
a
Capital
Markets
(continued)
Nasdaq,
Inc.
............................
26,638
$
1,920,067
Northern
Trust
Corp.
.......................
12,580
1,147,422
S&P
Global,
Inc.
.........................
19,824
10,174,470
State
Street
Corp.
........................
18,618
1,621,628
T
Rowe
Price
Group,
Inc.
...................
13,790
1,462,291
Tradeweb
Markets,
Inc.
,
Class
A
...............
7,149
845,298
77,421,682
a
Chemicals
—
1
.5
%
Albemarle
Corp.
.........................
7,218
651,424
Corteva,
Inc.
............................
43,092
2,469,172
DuPont
de
Nemours,
Inc.
...................
26,035
2,193,449
Ecolab,
Inc.
............................
15,875
4,019,232
Linde
PLC
.............................
29,778
14,241,329
PPG
Industries,
Inc.
.......................
14,511
1,882,512
RPM
International,
Inc.
.....................
8,059
936,859
Sherwin-Williams
Co.
(The)
..................
14,885
5,498,072
31,892,049
a
Commercial
Services
&
Supplies
—
0
.9
%
Cintas
Corp.
............................
5,660
4,556,979
Copart,
Inc.
(a)
...........................
53,778
2,848,083
Republic
Services,
Inc.
.....................
13,595
2,830,615
Waste
Connections,
Inc.
....................
15,887
2,962,925
Waste
Management,
Inc.
....................
24,863
5,271,951
18,470,553
a
Communications
Equipment
—
0
.6
%
Cisco
Systems,
Inc.
.......................
249,790
12,624,387
a
Construction
&
Engineering
—
0
.2
%
AECOM
...............................
8,515
852,692
Quanta
Services,
Inc.
......................
9,026
2,483,324
3,336,016
a
Construction
Materials
—
0
.3
%
CRH
PLC
..............................
42,386
3,847,377
Martin
Marietta
Materials,
Inc.
................
3,806
2,033,013
5,880,390
a
Consumer
Finance
—
0
.5
%
American
Express
Co.
.....................
35,650
9,220,873
Discover
Financial
Services
..................
15,476
2,146,676
11,367,549
a
Consumer
Staples
Distribution
&
Retail
—
1
.2
%
Target
Corp.
............................
28,652
4,401,520
Walmart,
Inc.
............................
273,982
21,159,630
25,561,150
a
Containers
&
Packaging
—
0
.1
%
Avery
Dennison
Corp.
......................
4,965
1,101,485
Ball
Corp.
..............................
19,411
1,238,616
Crown
Holdings,
Inc.
......................
7,410
669,938
3,010,039
a
Diversified
Telecommunication
Services
—
0
.9
%
AT&T,
Inc.
..............................
444,060
8,836,794
Verizon
Communications,
Inc.
................
260,686
10,891,461
19,728,255
a
Electric
Utilities
—
1
.6
%
Alliant
Energy
Corp.
.......................
15,702
914,956
American
Electric
Power
Co.,
Inc.
..............
32,659
3,275,045
Constellation
Energy
Corp.
..................
19,550
3,845,485
Duke
Energy
Corp.
.......................
47,797
5,446,468
Eversource
Energy
.......................
21,878
1,477,421
Schedule
of
Investments
(continued)
August
31,
2024
iShares
®
Climate
Conscious
&
Transition
MSCI
USA
ETF
(Percentages
shown
are
based
on
Net
Assets)
2024
iShares
Annual
Financial
Statements
Security
Shares
Value
a
Electric
Utilities
(continued)
Exelon
Corp.
............................
62,203
$
2,369,312
NextEra
Energy,
Inc.
......................
127,241
10,244,173
Southern
Co.
(The)
.......................
67,754
5,853,946
Xcel
Energy,
Inc.
.........................
34,250
2,097,127
35,523,933
a
Electrical
Equipment
—
0
.8
%
AMETEK,
Inc.
...........................
14,382
2,460,041
Eaton
Corp.
PLC
.........................
24,760
7,599,587
Emerson
Electric
Co.
......................
35,473
3,738,499
Hubbell,
Inc.
............................
3,313
1,324,935
Rockwell
Automation,
Inc.
...................
7,068
1,922,708
17,045,770
a
Electronic
Equipment,
Instruments
&
Components
—
0
.0
%
Trimble,
Inc.
(a)
...........................
15,058
853,638
a
Energy
Equipment
&
Services
—
0
.3
%
Baker
Hughes
Co.
,
Class
A
..................
61,712
2,170,411
Schlumberger
N.V.
........................
88,521
3,894,039
6,064,450
a
Entertainment
—
1
.4
%
Liberty
Media
Corp.-Liberty
Formula
One
,
Series
C
,
NVS
(a)
...............................
12,879
1,005,206
Netflix,
Inc.
(a)
............................
26,710
18,733,058
Walt
Disney
Co.
(The)
.....................
112,904
10,204,264
29,942,528
a
Financial
Services
—
3
.4
%
Apollo
Global
Management,
Inc.
...............
24,522
2,837,931
Block,
Inc.
,
Class
A
(a)
......................
34,561
2,283,791
Fidelity
National
Information
Services,
Inc.
........
34,450
2,840,402
Fiserv,
Inc.
(a)
............................
36,236
6,326,805
Global
Payments,
Inc.
.....................
15,906
1,765,725
Jack
Henry
&
Associates,
Inc.
................
4,565
789,882
Mastercard,
Inc.
,
Class
A
....................
51,396
24,841,743
PayPal
Holdings,
Inc.
(a)
.....................
61,690
4,468,207
Visa,
Inc.
,
Class
A
........................
97,567
26,964,592
73,119,078
a
Food
Products
—
0
.6
%
Campbell
Soup
Co.
.......................
12,075
600,369
General
Mills,
Inc.
........................
34,809
2,516,342
Hershey
Co.
(The)
........................
9,207
1,777,503
Kellanova
..............................
16,970
1,367,952
McCormick
&
Co.,
Inc.
,
NVS
.................
15,522
1,242,226
Mondelez
International,
Inc.
,
Class
A
............
83,022
5,961,810
13,466,202
a
Gas
Utilities
—
0
.1
%
Atmos
Energy
Corp.
.......................
9,299
1,215,751
a
Ground
Transportation
—
1
.4
%
CSX
Corp.
.............................
120,796
4,139,679
JB
Hunt
Transport
Services,
Inc.
..............
5,076
879,163
Norfolk
Southern
Corp.
.....................
14,013
3,589,570
Old
Dominion
Freight
Line,
Inc.
...............
12,076
2,328,253
Uber
Technologies,
Inc.
(a)
...................
116,467
8,517,231
Union
Pacific
Corp.
.......................
37,786
9,676,617
29,130,513
a
Health
Care
Equipment
&
Supplies
—
1
.2
%
Abbott
Laboratories
.......................
107,738
12,203,483
Boston
Scientific
Corp.
(a)
....................
91,051
7,447,061
Edwards
Lifesciences
Corp.
(a)
................
37,385
2,615,455
IDEXX
Laboratories,
Inc.
(a)
...................
5,123
2,465,854
Security
Shares
Value
a
Health
Care
Equipment
&
Supplies
(continued)
Teleflex,
Inc.
............................
2,901
$
711,238
Zimmer
Biomet
Holdings,
Inc.
................
12,645
1,459,992
26,903,083
a
Health
Care
Providers
&
Services
—
2
.2
%
CVS
Health
Corp.
........................
77,594
4,441,480
DaVita,
Inc.
(a)
............................
3,305
498,791
Humana,
Inc.
...........................
7,433
2,634,775
Labcorp
Holdings,
Inc.
.....................
5,185
1,191,980
McKesson
Corp.
.........................
8,033
4,507,156
UnitedHealth
Group,
Inc.
....................
57,001
33,641,990
46,916,172
a
Health
Care
REITs
—
0
.3
%
Alexandria
Real
Estate
Equities,
Inc.
............
9,709
1,160,905
Healthpeak
Properties,
Inc.
..................
43,455
968,177
Welltower,
Inc.
...........................
37,030
4,468,781
6,597,863
a
Hotels,
Restaurants
&
Leisure
—
2
.2
%
Airbnb,
Inc.
,
Class
A
(a)
......................
27,292
3,201,625
Booking
Holdings,
Inc.
.....................
2,101
8,213,292
Chipotle
Mexican
Grill,
Inc.
(a)
.................
85,294
4,783,287
Hilton
Worldwide
Holdings,
Inc.
...............
15,498
3,403,981
Hyatt
Hotels
Corp.
,
Class
A
..................
2,778
422,034
Las
Vegas
Sands
Corp.
....................
22,969
895,561
Marriott
International,
Inc.
,
Class
A
.............
15,036
3,528,799
McDonald's
Corp.
........................
44,633
12,883,762
MGM
Resorts
International
(a)
.................
14,659
551,032
Starbucks
Corp.
..........................
70,150
6,634,085
Wynn
Resorts
Ltd.
........................
6,107
469,506
Yum!
Brands,
Inc.
........................
17,505
2,361,775
47,348,739
a
Household
Durables
—
0
.1
%
Garmin
Ltd.
.............................
9,459
1,733,740
a
Household
Products
—
1
.7
%
Church
&
Dwight
Co.,
Inc.
...................
15,249
1,553,568
Clorox
Co.
(The)
.........................
7,652
1,211,388
Colgate-Palmolive
Co.
.....................
48,240
5,137,560
Kimberly-Clark
Corp.
......................
20,773
3,005,022
Procter
&
Gamble
Co.
(The)
.................
146,177
25,075,203
35,982,741
a
Industrial
Conglomerates
—
0
.2
%
3M
Co.
................................
34,241
4,611,920
a
Industrial
REITs
—
0
.3
%
Prologis,
Inc.
............................
57,339
7,329,071
a
Insurance
—
2
.1
%
American
International
Group,
Inc.
.............
41,102
3,166,909
Aon
PLC
,
Class
A
........................
12,119
4,165,543
Arch
Capital
Group
Ltd.
(a)
...................
23,323
2,637,598
Arthur
J
Gallagher
&
Co.
....................
13,532
3,959,057
Chubb
Ltd.
.............................
23,891
6,789,344
Hartford
Financial
Services
Group,
Inc.
(The)
......
18,333
2,128,461
Marsh
&
McLennan
Companies,
Inc.
............
30,565
6,953,843
Progressive
Corp.
(The)
....................
36,273
9,148,051
Travelers
Companies,
Inc.
(The)
...............
14,119
3,220,120
W
R
Berkley
Corp.
........................
18,982
1,133,226
Willis
Towers
Watson
PLC
...................
6,319
1,845,843
45,147,995
a
iShares
®
Climate
Conscious
&
Transition
MSCI
USA
ETF
Schedule
of
Investments
(continued)
August
31,
2024
(Percentages
shown
are
based
on
Net
Assets)
Security
Shares
Value
a
Interactive
Media
&
Services
—
7
.7
%
Alphabet,
Inc.
,
Class
A
.....................
304,505
$
49,750,027
Alphabet,
Inc.
,
Class
C
,
NVS
.................
262,064
43,269,387
Match
Group,
Inc.
(a)
.......................
15,631
581,630
Meta
Platforms,
Inc.
,
Class
A
.................
135,720
70,752,193
Pinterest,
Inc.
,
Class
A
(a)
....................
37,207
1,192,112
Snap,
Inc.
,
Class
A
,
NVS
(a)
..................
64,577
603,149
166,148,498
a
IT
Services
—
1
.7
%
Accenture
PLC
,
Class
A
....................
38,786
13,262,873
Akamai
Technologies,
Inc.
(a)
..................
9,506
968,091
Cloudflare,
Inc.
,
Class
A
(a)
...................
18,647
1,531,664
Cognizant
Technology
Solutions
Corp.
,
Class
A
.....
30,696
2,387,228
Gartner,
Inc.
(a)
...........................
4,800
2,361,408
International
Business
Machines
Corp.
..........
56,891
11,499,378
Okta,
Inc.
,
Class
A
(a)
.......................
9,918
780,844
Snowflake,
Inc.
,
Class
A
(a)
...................
18,736
2,140,213
Twilio,
Inc.
,
Class
A
(a)
......................
10,071
632,056
35,563,755
a
Life
Sciences
Tools
&
Services
—
1
.8
%
Agilent
Technologies,
Inc.
...................
18,069
2,582,422
Charles
River
Laboratories
International,
Inc.
(a)
.....
3,208
634,382
Danaher
Corp.
..........................
41,285
11,118,463
Illumina,
Inc.
(a)
...........................
9,798
1,287,457
IQVIA
Holdings,
Inc.
(a)
......................
11,309
2,844,779
Mettler-Toledo
International,
Inc.
(a)
.............
1,319
1,898,147
Revvity,
Inc.
............................
7,667
939,514
Thermo
Fisher
Scientific,
Inc.
.................
23,640
14,540,255
Waters
Corp.
(a)
..........................
3,651
1,264,524
West
Pharmaceutical
Services,
Inc.
............
4,515
1,416,039
38,525,982
a
Machinery
—
1
.7
%
Caterpillar,
Inc.
..........................
30,288
10,785,557
Cummins,
Inc.
...........................
8,503
2,660,164
Deere
&
Co.
............................
16,213
6,254,003
Dover
Corp.
............................
8,471
1,575,860
Fortive
Corp.
............................
21,666
1,611,950
Graco,
Inc.
.............................
10,517
876,592
IDEX
Corp.
.............................
4,740
978,715
Illinois
Tool
Works,
Inc.
.....................
18,433
4,666,867
PACCAR,
Inc.
...........................
32,309
3,107,480
Pentair
PLC
............................
10,194
904,106
Westinghouse
Air
Brake
Technologies
Corp.
.......
10,916
1,851,026
Xylem,
Inc.
.............................
15,065
2,071,889
37,344,209
a
Media
—
0
.5
%
Charter
Communications,
Inc.
,
Class
A
(a)
(c)
........
5,788
2,011,561
Comcast
Corp.
,
Class
A
....................
242,412
9,592,243
11,603,804
a
Metals
&
Mining
—
0
.5
%
Freeport-McMoRan,
Inc.
....................
89,014
3,941,540
Newmont
Corp.
..........................
71,488
3,816,744
Nucor
Corp.
............................
14,845
2,255,104
Steel
Dynamics,
Inc.
.......................
9,263
1,107,021
11,120,409
a
Multi-Utilities
—
0
.5
%
Consolidated
Edison,
Inc.
...................
21,516
2,185,165
Dominion
Energy,
Inc.
......................
52,014
2,907,583
Public
Service
Enterprise
Group,
Inc.
...........
30,742
2,482,416
Security
Shares
Value
a
Multi-Utilities
(continued)
Sempra
...............................
39,237
$
3,224,497
10,799,661
a
Office
REITs
—
0
.0
%
BXP,
Inc.
..............................
9,197
691,798
a
Oil,
Gas
&
Consumable
Fuels
—
3
.5
%
Chevron
Corp.
...........................
108,431
16,042,366
ConocoPhillips
..........................
72,107
8,205,056
Diamondback
Energy,
Inc.
...................
11,045
2,154,990
EOG
Resources,
Inc.
......................
35,593
4,585,090
Exxon
Mobil
Corp.
........................
277,821
32,766,209
Hess
Corp.
.............................
17,218
2,377,117
Kinder
Morgan,
Inc.
,
Class
P
.................
123,158
2,656,518
Marathon
Oil
Corp.
........................
35,589
1,019,625
Occidental
Petroleum
Corp.
..................
40,993
2,335,781
ONEOK,
Inc.
............................
36,197
3,343,155
75,485,907
a
Personal
Care
Products
—
0
.1
%
Estee
Lauder
Companies,
Inc.
(The)
,
Class
A
......
14,362
1,316,421
a
Pharmaceuticals
—
5
.3
%
Bristol-Myers
Squibb
Co.
....................
125,542
6,270,823
Catalent,
Inc.
(a)
..........................
11,159
680,253
Eli
Lilly
&
Co.
...........................
50,031
48,030,761
Johnson
&
Johnson
.......................
149,050
24,721,433
Merck
&
Co.,
Inc.
.........................
156,861
18,580,185
Pfizer,
Inc.
.............................
350,941
10,180,798
Zoetis,
Inc.
,
Class
A
.......................
28,231
5,180,106
113,644,359
a
Professional
Services
—
0
.9
%
Automatic
Data
Processing,
Inc.
...............
25,341
6,991,835
Booz
Allen
Hamilton
Holding
Corp.
,
Class
A
.......
7,999
1,270,081
Broadridge
Financial
Solutions,
Inc.
............
7,363
1,567,288
Dayforce,
Inc.
(a)
(c)
.........................
9,779
559,066
Equifax,
Inc.
............................
7,660
2,352,616
Paychex,
Inc.
...........................
20,140
2,642,368
Paycom
Software,
Inc.
.....................
3,171
516,175
TransUnion
(c)
............................
12,040
1,165,592
Verisk
Analytics,
Inc.
.......................
8,802
2,401,362
19,466,383
a
Real
Estate
Management
&
Development
—
0
.1
%
CBRE
Group,
Inc.
,
Class
A
(a)
.................
19,034
2,191,575
a
Residential
REITs
—
0
.2
%
AvalonBay
Communities,
Inc.
................
8,853
1,998,388
Equity
Residential
........................
21,027
1,574,502
3,572,890
a
Retail
REITs
—
0
.4
%
Kimco
Realty
Corp.
.......................
41,305
960,754
Realty
Income
Corp.
.......................
53,928
3,349,468
Regency
Centers
Corp.
....................
10,975
797,773
Simon
Property
Group,
Inc.
..................
20,221
3,383,985
8,491,980
a
Semiconductors
&
Semiconductor
Equipment
—
10
.4
%
Advanced
Micro
Devices,
Inc.
(a)
...............
100,101
14,871,004
Analog
Devices,
Inc.
.......................
30,732
7,217,103
Broadcom,
Inc.
..........................
273,870
44,591,513
First
Solar,
Inc.
(a)
.........................
6,270
1,425,610
Intel
Corp.
.............................
263,899
5,816,334
NVIDIA
Corp.
...........................
1,050,524
125,401,050
Schedule
of
Investments
(continued)
August
31,
2024
iShares
®
Climate
Conscious
&
Transition
MSCI
USA
ETF
(Percentages
shown
are
based
on
Net
Assets)
2024
iShares
Annual
Financial
Statements
Security
Shares
Value
a
Semiconductors
&
Semiconductor
Equipment
(continued)
QUALCOMM,
Inc.
........................
69,116
$
12,116,035
Texas
Instruments,
Inc.
.....................
56,388
12,086,204
223,524,853
a
Software
—
10
.0
%
Adobe,
Inc.
(a)
............................
27,461
15,773,873
ANSYS,
Inc.
(a)
...........................
5,381
1,729,561
Aspen
Technology,
Inc.
(a)
....................
1,786
418,174
Atlassian
Corp.
,
Class
A
(a)
...................
9,865
1,633,644
Autodesk,
Inc.
(a)
..........................
13,347
3,448,865
Bentley
Systems,
Inc.
,
Class
B
................
9,780
503,377
Cadence
Design
Systems,
Inc.
(a)
..............
16,885
4,540,883
Crowdstrike
Holdings,
Inc.
,
Class
A
(a)
............
14,299
3,964,827
Fortinet,
Inc.
(a)
...........................
40,271
3,089,188
Gen
Digital,
Inc.
..........................
35,093
928,561
HubSpot,
Inc.
(a)
..........................
3,010
1,502,201
Intuit,
Inc.
..............................
17,313
10,911,691
Manhattan
Associates,
Inc.
(a)
.................
3,796
1,003,776
Microsoft
Corp.
..........................
237,414
99,034,876
Oracle
Corp.
............................
102,515
14,484,344
Palantir
Technologies,
Inc.
,
Class
A
(a)
...........
125,418
3,948,159
Palo
Alto
Networks,
Inc.
(a)
(c)
..................
20,053
7,273,624
PTC,
Inc.
(a)
.............................
7,372
1,320,251
Roper
Technologies,
Inc.
....................
6,637
3,679,619
Salesforce,
Inc.
..........................
60,012
15,177,035
ServiceNow,
Inc.
(a)
........................
12,696
10,855,080
Synopsys,
Inc.
(a)
.........................
9,489
4,930,295
Workday,
Inc.
,
Class
A
(a)
....................
13,130
3,455,685
Zscaler,
Inc.
(a)
(c)
..........................
5,572
1,114,288
214,721,877
a
Specialized
REITs
—
1
.0
%
American
Tower
Corp.
.....................
28,921
6,480,039
Crown
Castle,
Inc.
........................
26,792
3,001,240
Digital
Realty
Trust,
Inc.
....................
20,097
3,046,906
Equinix,
Inc.
............................
5,877
4,903,534
VICI
Properties,
Inc.
.......................
64,931
2,173,890
Weyerhaeuser
Co.
........................
44,981
1,371,471
20,977,080
a
Specialty
Retail
—
1
.1
%
Home
Depot,
Inc.
(The)
....................
61,412
22,630,322
Ulta
Beauty,
Inc.
(a)
(c)
.......................
2,976
1,050,052
Security
Shares
Value
a
Specialty
Retail
(continued)
Williams-Sonoma,
Inc.
.....................
7,965
$
1,069,938
24,750,312
a
Technology
Hardware,
Storage
&
Peripherals
—
5
.8
%
Apple,
Inc.
.............................
525,728
120,391,712
Dell
Technologies,
Inc.
,
Class
C
...............
17,429
2,013,746
Hewlett
Packard
Enterprise
Co.
...............
80,156
1,552,622
123,958,080
a
Textiles,
Apparel
&
Luxury
Goods
—
0
.4
%
Deckers
Outdoor
Corp.
(a)
....................
1,582
1,517,597
Lululemon
Athletica,
Inc.
(a)
...................
7,085
1,838,345
Nike,
Inc.
,
Class
B
........................
75,028
6,251,333
9,607,275
a
Water
Utilities
—
0
.1
%
American
Water
Works
Co.,
Inc.
...............
12,012
1,719,158
Essential
Utilities,
Inc.
......................
16,288
635,069
2,354,227
a
Wireless
Telecommunication
Services
—
0
.3
%
T-Mobile
U.S.,
Inc.
........................
32,750
6,508,080
a
Total
Long-Term
Investments — 99.8%
(Cost:
$
1,673,715,095
)
...............................
2,147,220,646
a
Short-Term
Securities
Money
Market
Funds
—
0
.6
%
BlackRock
Cash
Funds:
Institutional,
SL
Agency
Shares
,
5.45
%
(b)
(d)
(e)
.....................
9,977,355
9,983,342
BlackRock
Cash
Funds:
Treasury,
SL
Agency
Shares
,
5.25
%
(b)
(d)
............................
2,727,829
2,727,829
a
Total
Short-Term
Securities — 0.6%
(Cost:
$
12,711,081
)
.................................
12,711,171
Total
Investments
—
100.4%
(Cost:
$
1,686,426,176
)
...............................
2,159,931,817
Liabilities
in
Excess
of
Other
Assets
—
(
0
.4
)
%
...............
(
7,954,149
)
Net
Assets
—
100.0%
.................................
$
2,151,977,668
(a)
Non-income
producing
security.
(b)
Affiliate
of
the
Fund.
(c)
All
or
a
portion
of
this
security
is
on
loan.
(d)
Annualized
7-day
yield
as
of
period
end.
(e)
All
or
a
portion
of
this
security
was
purchased
with
the
cash
collateral
from
loaned
securities.
Affiliates
Investments
in
issuers
considered
to
be
affiliate(s)
of
the
Fund
during
the
year
ended
August
31,
2024
for
purposes
of
Section
2(a)(3)
of
the
Investment
Company
Act
of
1940,
as
amended,
were
as
follows:
Affiliated
Issuer
Value
at
08/31/23
Purchases
at
Cost
Proceeds
from
Sale
Net
Realized
Gain
(Loss)
Change
in
Unrealized
Appreciation
(Depreciation)
Value
at
08/31/24
Shares
Held
at
08/31/24
Income
Capital
Gain
Distributions
from
Underlying
Funds
BlackRock
Cash
Funds:
Institutional,
SL
Agency
Shares
$
6,588,268
$
3,395,487
(a)
$
—
$
(
503
)
$
90
$
9,983,342
9,977,355
$
36,569
(b)
$
—
iShares
®
Climate
Conscious
&
Transition
MSCI
USA
ETF
Schedule
of
Investments
(continued)
August
31,
2024
Derivative
Financial
Instruments
Outstanding
as
of
Period
End
Derivative
Financial
Instruments
Categorized
by
Risk
Exposure
As
of
period
end,
the
fair
values
of
derivative
financial
instruments
located
in
the
Statements
of
Assets
and
Liabilities
were
as
follows:
For
the period
ended
August
31,
2024,
the
effect
of
derivative
financial
instruments
in
the
Statements
of
Operations
was
as
follows:
Average
Quarterly
Balances
of
Outstanding
Derivative
Financial
Instruments
For
more
information
about
the
Fund’s
investment
risks
regarding
derivative
financial
instruments,
refer
to
the
Notes
to
Financial
Statements.
Affiliates
(continued)
Affiliated
Issuer
Value
at
08/31/23
Purchases
at
Cost
Proceeds
from
Sale
Net
Realized
Gain
(Loss)
Change
in
Unrealized
Appreciation
(Depreciation)
Value
at
08/31/24
Shares
Held
at
08/31/24
Income
Capital
Gain
Distributions
from
Underlying
Funds
BlackRock
Cash
Funds:
Treasury,
SL
Agency
Shares
......
$
5,087,833
$
—
$
(
2,360,004
)
(a)
$
—
$
—
$
2,727,829
2,727,829
$
225,338
$
—
BlackRock,
Inc.
..
9,649,238
1,650,495
(
5,275,524
)
558,084
1,703,537
8,285,830
9,188
221,867
—
$
557,581
$
1,703,627
$
20,997,001
$
483,774
$
—
(a)
Represents
net
amount
purchased
(sold).
(b)
All
or
a
portion
represents
securities
lending
income
earned
from
the
reinvestment
of
cash
collateral
from
loaned
securities,
net
of
fees
and
collateral
investment
expenses,
and
other
payments
to
and
from
borrowers
of
securities.
Futures
Contracts
Description
Number
of
Contracts
Expiration
Date
Notional
Amount
(000)
Value/
Unrealized
Appreciation
(Depreciation)
Long
Contracts
E-Mini
S&P
500
Index
...................................................................
16
09/20/24
$
4,529
$
96,704
Commodity
Contracts
Credit
Contracts
Equity
Contracts
Foreign
Currency
Exchange
Contracts
Interest
Rate
Contracts
Other
Contracts
Total
Assets
—
Derivative
Financial
Instruments
Futures
contracts
Unrealized
appreciation
on
futures
contracts
(a)
.............
$
—
$
—
$
96,704
$
—
$
—
$
—
$
96,704
(a)
Net
cumulative
unrealized
appreciation
(depreciation)
on
futures
contracts
are
reported
in
the
Schedule
of
Investments.
In
the
Statements
of
Assets
and
Liabilities,
only
current
day’s
variation
margin
is
reported
in
receivables
or
payables
and
the
net
cumulative
unrealized
appreciation
(depreciation)
is
included
in
accumulated
earnings
(loss).
Commodity
Contracts
Credit
Contracts
Equity
Contracts
Foreign
Currency
Exchange
Contracts
Interest
Rate
Contracts
Other
Contracts
Total
Net
Realized
Gain
(Loss)
from
Futures
contracts
..................................
$
—
$
—
$
751,277
$
—
$
—
$
—
$
751,277
Net
Change
in
Unrealized
Appreciation
(Depreciation)
on
Futures
contracts
..................................
$
—
$
—
$
72,576
$
—
$
—
$
—
$
72,576
Futures
contracts
Average
notional
value
of
contracts
—
long
...................................................................................
$
6,196,809
a
Schedule
of
Investments
(continued)
August
31,
2024
iShares
®
Climate
Conscious
&
Transition
MSCI
USA
ETF
2024
iShares
Annual
Financial
Statements
Fair
Value
Hierarchy
as
of
Period
End
Various
inputs
are
used
in
determining
the
fair
value
of
financial
instruments.
For
a
description
of
the
input
levels
and
information
about
the
Fund’s
policy
regarding
valuation
of
financial
instruments,
refer
to
the
Notes
to
Financial
Statements.
The
following
table
summarizes
the
Fund’s
financial
instruments
categorized
in
the
fair
value
hierarchy.
The
breakdown
of
the
Fund’s
financial
instruments
into
major
categories
is
disclosed
in
the
Schedule
of
Investments
above.
See
notes
to
financial
statements.
Level
1
Level
2
Level
3
Total
Assets
Investments
Long-Term
Investments
Common
Stocks
.........................................
$
2,147,220,646
$
—
$
—
$
2,147,220,646
Short-Term
Securities
Money
Market
Funds
......................................
12,711,171
—
—
12,711,171
$
2,159,931,817
$
—
$
—
$
2,159,931,817
Derivative
Financial
Instruments
(a)
Assets
Equity
Contracts
...........................................
$
96,704
$
—
$
—
$
96,704
a
(a)
Derivative
financial
instruments
are
futures
contracts.
Futures
contracts
are
valued
at
the
unrealized
appreciation
(depreciation)
on
the
instrument.
iShares
®
ESG
Advanced
MSCI
USA
ETF
Schedule
of
Investments
August
31,
2024
(Percentages
shown
are
based
on
Net
Assets)
Security
Shares
Value
a
Common
Stocks
Aerospace
&
Defense
—
0
.3
%
Axon
Enterprise,
Inc.
(a)
.....................
4,167
$
1,520,830
Howmet
Aerospace,
Inc.
....................
22,499
2,174,753
3,695,583
a
Air
Freight
&
Logistics
—
0
.1
%
CH
Robinson
Worldwide,
Inc.
................
6,794
703,247
Expeditors
International
of
Washington,
Inc.
.......
8,195
1,011,345
1,714,592
a
Banks
—
1
.5
%
Huntington
Bancshares,
Inc.
.................
83,895
1,255,908
KeyCorp
...............................
54,705
933,267
M&T
Bank
Corp.
.........................
9,681
1,666,197
PNC
Financial
Services
Group,
Inc.
(The)
........
23,092
4,274,098
Regions
Financial
Corp.
....................
52,946
1,239,995
Truist
Financial
Corp.
......................
77,636
3,451,697
U.S.
Bancorp
...........................
90,538
4,276,110
17,097,272
a
Beverages
—
0
.2
%
Keurig
Dr
Pepper,
Inc.
.....................
62,920
2,303,501
a
Biotechnology
—
3
.0
%
Alnylam
Pharmaceuticals,
Inc.
(a)
...............
7,339
1,927,882
Amgen,
Inc.
............................
31,124
10,390,125
Biogen,
Inc.
(a)
...........................
8,448
1,729,813
BioMarin
Pharmaceutical,
Inc.
(a)
...............
11,059
1,008,691
Exact
Sciences
Corp.
(a)
.....................
10,756
663,538
Incyte
Corp.
(a)
...........................
9,447
620,290
Moderna,
Inc.
(a)
..........................
18,903
1,463,092
Neurocrine
Biosciences,
Inc.
(a)
................
5,839
741,903
Regeneron
Pharmaceuticals,
Inc.
(a)
.............
6,287
7,448,146
United
Therapeutics
Corp.
(a)
..................
2,445
888,880
Vertex
Pharmaceuticals,
Inc.
(a)
................
14,972
7,424,465
34,306,825
a
Broadline
Retail
—
0
.6
%
eBay,
Inc.
..............................
29,126
1,721,347
MercadoLibre,
Inc.
(a)
.......................
2,647
5,457,214
7,178,561
a
Building
Products
—
1
.1
%
A
O
Smith
Corp.
.........................
7,015
587,296
Allegion
PLC
............................
5,026
697,810
Builders
FirstSource,
Inc.
(a)
..................
7,108
1,236,792
Carlisle
Companies,
Inc.
....................
2,757
1,168,417
Fortune
Brands
Innovations,
Inc.
..............
7,184
570,481
Lennox
International,
Inc.
...................
1,853
1,093,622
Masco
Corp.
............................
12,811
1,019,243
Owens
Corning
..........................
5,019
846,856
Trane
Technologies
PLC
....................
13,133
4,749,681
11,970,198
a
Capital
Markets
—
5
.5
%
Ameriprise
Financial,
Inc.
...................
5,762
2,589,673
Bank
of
New
York
Mellon
Corp.
(The)
...........
42,817
2,920,976
BlackRock,
Inc.
(b)
.........................
8,621
7,774,504
Carlyle
Group,
Inc.
(The)
....................
13,526
542,798
Cboe
Global
Markets,
Inc.
...................
6,091
1,251,092
Charles
Schwab
Corp.
(The)
.................
87,650
5,706,015
CME
Group,
Inc.
,
Class
A
...................
20,891
4,507,024
FactSet
Research
Systems,
Inc.
...............
2,218
937,859
Franklin
Resources,
Inc.
....................
16,496
333,879
Intercontinental
Exchange,
Inc.
...............
33,279
5,376,223
Security
Shares
Value
a
Capital
Markets
(continued)
LPL
Financial
Holdings,
Inc.
..................
4,335
$
972,514
MarketAxess
Holdings,
Inc.
..................
2,181
528,653
Moody's
Corp.
...........................
9,535
4,650,601
Morgan
Stanley
..........................
70,682
7,323,362
Nasdaq,
Inc.
............................
25,088
1,808,343
Northern
Trust
Corp.
.......................
11,886
1,084,122
Raymond
James
Financial,
Inc.
...............
11,448
1,368,837
S&P
Global,
Inc.
.........................
18,572
9,531,893
State
Street
Corp.
........................
17,402
1,515,714
T
Rowe
Price
Group,
Inc.
...................
12,927
1,370,779
62,094,861
a
Chemicals
—
2
.5
%
Air
Products
and
Chemicals,
Inc.
..............
12,898
3,596,607
CF
Industries
Holdings,
Inc.
..................
10,605
881,169
International
Flavors
&
Fragrances,
Inc.
..........
14,821
1,541,236
Linde
PLC
.............................
27,891
13,338,871
Mosaic
Co.
(The)
.........................
18,675
533,545
PPG
Industries,
Inc.
.......................
13,567
1,760,047
RPM
International,
Inc.
.....................
7,471
868,504
Sherwin-Williams
Co.
(The)
..................
13,975
5,161,946
Westlake
Corp.
..........................
2,237
325,349
28,007,274
a
Commercial
Services
&
Supplies
—
1
.7
%
Cintas
Corp.
............................
5,299
4,266,331
Copart,
Inc.
(a)
...........................
50,249
2,661,187
Republic
Services,
Inc.
.....................
12,791
2,663,214
Rollins,
Inc.
.............................
16,810
843,526
Veralto
Corp.
............................
14,322
1,610,222
Waste
Connections,
Inc.
....................
14,970
2,791,905
Waste
Management,
Inc.
....................
23,271
4,934,383
19,770,768
a
Communications
Equipment
—
0
.6
%
Arista
Networks,
Inc.
(a)
.....................
15,454
5,461,134
F5,
Inc.
(a)
..............................
3,397
690,101
Juniper
Networks,
Inc.
.....................
18,699
727,017
6,878,252
a
Construction
&
Engineering
—
0
.4
%
AECOM
...............................
7,869
788,002
EMCOR
Group,
Inc.
.......................
2,716
1,067,551
Quanta
Services,
Inc.
......................
8,493
2,336,679
4,192,232
a
Construction
Materials
—
0
.7
%
CRH
PLC
..............................
39,865
3,618,546
Martin
Marietta
Materials,
Inc.
................
3,586
1,915,498
Vulcan
Materials
Co.
......................
7,673
1,881,496
7,415,540
a
Consumer
Finance
—
1
.4
%
Ally
Financial,
Inc.
........................
15,873
685,555
American
Express
Co.
.....................
33,399
8,638,652
Capital
One
Financial
Corp.
..................
22,159
3,255,822
Discover
Financial
Services
..................
14,554
2,018,785
Synchrony
Financial
.......................
22,924
1,152,160
15,750,974
a
Consumer
Staples
Distribution
&
Retail
—
0
.5
%
Dollar
General
Corp.
......................
12,758
1,058,532
Target
Corp.
............................
26,842
4,123,468
Walgreens
Boots
Alliance,
Inc.
................
42,569
393,763
5,575,763
a
Schedule
of
Investments
(continued)
August
31,
2024
iShares
®
ESG
Advanced
MSCI
USA
ETF
(Percentages
shown
are
based
on
Net
Assets)
2024
iShares
Annual
Financial
Statements
Security
Shares
Value
a
Containers
&
Packaging
—
0
.5
%
Avery
Dennison
Corp.
......................
4,650
$
1,031,603
Ball
Corp.
..............................
18,157
1,158,598
Crown
Holdings,
Inc.
......................
7,029
635,492
International
Paper
Co.
.....................
19,232
931,213
Packaging
Corp.
of
America
.................
5,179
1,085,208
Smurfit
WestRock
PLC
.....................
30,131
1,428,812
6,270,926
a
Distributors
—
0
.2
%
Genuine
Parts
Co.
........................
8,082
1,157,828
LKQ
Corp.
.............................
15,524
645,643
Pool
Corp.
.............................
2,221
780,948
2,584,419
a
Diversified
REITs
—
0
.1
%
WP
Carey,
Inc.
..........................
8,469
759,913
a
Diversified
Telecommunication
Services
—
0
.9
%
Verizon
Communications,
Inc.
................
244,221
10,203,553
a
Electrical
Equipment
—
1
.5
%
AMETEK,
Inc.
...........................
13,430
2,297,202
Eaton
Corp.
PLC
.........................
23,196
7,119,548
GE
Vernova,
Inc.
(a)
........................
15,902
3,196,302
Hubbell,
Inc.
............................
3,120
1,247,750
Rockwell
Automation,
Inc.
...................
6,605
1,796,758
Vertiv
Holdings
Co.
,
Class
A
.................
20,634
1,713,241
17,370,801
a
Electronic
Equipment,
Instruments
&
Components
—
1
.3
%
Amphenol
Corp.
,
Class
A
...................
69,694
4,700,860
CDW
Corp.
.............................
7,798
1,759,541
Corning,
Inc.
............................
47,216
1,975,990
Jabil,
Inc.
..............................
6,582
719,281
Keysight
Technologies,
Inc.
(a)
.................
10,127
1,560,773
TE
Connectivity
Ltd.
.......................
17,724
2,722,406
Trimble,
Inc.
(a)
...........................
14,202
805,111
Zebra
Technologies
Corp.
,
Class
A
(a)
............
2,989
1,032,341
15,276,303
a
Entertainment
—
0
.4
%
Electronic
Arts,
Inc.
.......................
14,662
2,225,985
Liberty
Media
Corp.-Liberty
Formula
One
,
Series
C
,
NVS
(a)
...............................
12,065
941,673
Live
Nation
Entertainment,
Inc.
(a)
..............
9,331
911,359
Warner
Bros
Discovery,
Inc.
,
Series
A
(a)
..........
135,059
1,058,862
5,137,879
a
Financial
Services
—
5
.9
%
Apollo
Global
Management,
Inc.
...............
23,110
2,674,520
Fidelity
National
Information
Services,
Inc.
........
32,274
2,660,991
Fiserv,
Inc.
(a)
............................
33,948
5,927,321
Global
Payments,
Inc.
.....................
14,880
1,651,829
Jack
Henry
&
Associates,
Inc.
................
4,230
731,917
Mastercard,
Inc.
,
Class
A
....................
48,169
23,282,005
PayPal
Holdings,
Inc.
(a)
.....................
57,654
4,175,879
Toast,
Inc.
,
Class
A
(a)
......................
21,026
522,706
Visa,
Inc.
,
Class
A
........................
91,332
25,241,425
66,868,593
a
Food
Products
—
0
.7
%
Campbell
Soup
Co.
.......................
11,264
560,046
Conagra
Brands,
Inc.
......................
27,652
862,743
General
Mills,
Inc.
........................
32,384
2,341,039
Hormel
Foods
Corp.
.......................
17,464
568,453
J
M
Smucker
Co.
(The)
.....................
6,175
708,149
Security
Shares
Value
a
Food
Products
(continued)
Kellanova
..............................
15,819
$
1,275,170
Lamb
Weston
Holdings,
Inc.
.................
8,355
517,342
McCormick
&
Co.,
Inc.
,
NVS
.................
14,641
1,171,719
8,004,661
a
Ground
Transportation
—
0
.3
%
JB
Hunt
Transport
Services,
Inc.
..............
4,776
827,203
Knight-Swift
Transportation
Holdings,
Inc.
,
Class
A
..
9,446
494,781
Old
Dominion
Freight
Line,
Inc.
...............
11,346
2,187,509
U-Haul
Holding
Co.
,
Series
N
,
NVS
.............
5,550
379,343
3,888,836
a
Health
Care
Equipment
&
Supplies
—
2
.2
%
Align
Technology,
Inc.
(a)
.....................
4,167
988,496
Dexcom,
Inc.
(a)
..........................
23,074
1,599,951
Edwards
Lifesciences
Corp.
(a)
................
34,963
2,446,011
GE
HealthCare
Technologies,
Inc.
.............
25,160
2,134,071
Hologic,
Inc.
(a)
...........................
13,532
1,099,340
IDEXX
Laboratories,
Inc.
(a)
...................
4,786
2,303,645
Insulet
Corp.
(a)
...........................
4,049
821,016
ResMed,
Inc.
...........................
8,524
2,088,550
Solventum
Corp.
(a)
........................
8,461
542,435
STERIS
PLC
............................
5,741
1,384,155
Stryker
Corp.
...........................
19,892
7,169,475
Teleflex,
Inc.
............................
2,742
672,256
Zimmer
Biomet
Holdings,
Inc.
................
11,936
1,378,131
24,627,532
a
Health
Care
Providers
&
Services
—
1
.6
%
DaVita,
Inc.
(a)
............................
3,099
467,701
Elevance
Health,
Inc.
......................
13,484
7,509,105
HCA
Healthcare,
Inc.
......................
11,397
4,508,539
Henry
Schein,
Inc.
(a)
.......................
7,427
523,975
Humana,
Inc.
...........................
6,991
2,478,100
Molina
Healthcare,
Inc.
(a)
....................
3,373
1,179,842
Quest
Diagnostics,
Inc.
.....................
6,446
1,011,828
17,679,090
a
Health
Care
REITs
—
0
.7
%
Alexandria
Real
Estate
Equities,
Inc.
............
9,165
1,095,859
Healthpeak
Properties,
Inc.
..................
40,972
912,856
Ventas,
Inc.
............................
23,485
1,458,653
Welltower,
Inc.
...........................
34,691
4,186,510
7,653,878
a
Health
Care
Technology
—
0
.2
%
Veeva
Systems,
Inc.
,
Class
A
(a)
...............
8,910
1,928,480
a
Hotel
&
Resort
REITs
—
0
.1
%
Host
Hotels
&
Resorts,
Inc.
..................
40,907
724,054
a
Hotels,
Restaurants
&
Leisure
—
1
.8
%
Booking
Holdings,
Inc.
.....................
1,969
7,697,274
Darden
Restaurants,
Inc.
...................
6,957
1,100,249
Domino's
Pizza,
Inc.
.......................
2,029
840,432
DoorDash,
Inc.
,
Class
A
(a)
...................
17,716
2,280,226
Hilton
Worldwide
Holdings,
Inc.
...............
14,489
3,182,364
Hyatt
Hotels
Corp.
,
Class
A
..................
2,611
396,663
Royal
Caribbean
Cruises
Ltd.
(a)
...............
14,185
2,335,135
Yum!
Brands,
Inc.
........................
16,340
2,204,593
20,036,936
a
Household
Durables
—
0
.7
%
DR
Horton,
Inc.
..........................
17,162
3,239,499
Garmin
Ltd.
.............................
8,915
1,634,030
NVR,
Inc.
(a)
.............................
182
1,669,388
iShares
®
ESG
Advanced
MSCI
USA
ETF
Schedule
of
Investments
(continued)
August
31,
2024
(Percentages
shown
are
based
on
Net
Assets)
Security
Shares
Value
a
Household
Durables
(continued)
PulteGroup,
Inc.
.........................
12,225
$
1,609,421
8,152,338
a
Household
Products
—
0
.2
%
Church
&
Dwight
Co.,
Inc.
...................
14,187
1,445,371
Clorox
Co.
(The)
.........................
7,218
1,142,682
2,588,053
a
Industrial
REITs
—
0
.6
%
Prologis,
Inc.
............................
53,717
6,866,107
a
Insurance
—
4
.5
%
Aflac,
Inc.
..............................
31,320
3,456,475
American
International
Group,
Inc.
.............
38,506
2,966,887
Aon
PLC
,
Class
A
........................
11,354
3,902,597
Arch
Capital
Group
Ltd.
(a)
...................
21,786
2,463,779
Arthur
J
Gallagher
&
Co.
....................
12,677
3,708,910
Assurant,
Inc.
...........................
3,000
589,050
Brown
&
Brown,
Inc.
.......................
14,068
1,478,969
Chubb
Ltd.
.............................
22,382
6,360,517
Everest
Group
Ltd.
........................
2,521
988,837
Hartford
Financial
Services
Group,
Inc.
(The)
......
17,130
1,988,793
Marsh
&
McLennan
Companies,
Inc.
............
28,635
6,514,749
Principal
Financial
Group,
Inc.
................
13,619
1,108,859
Progressive
Corp.
(The)
....................
33,982
8,570,260
Prudential
Financial,
Inc.
....................
20,829
2,523,642
Travelers
Companies,
Inc.
(The)
...............
13,286
3,030,138
Willis
Towers
Watson
PLC
...................
5,923
1,730,167
51,382,629
a
IT
Services
—
1
.3
%
Akamai
Technologies,
Inc.
(a)
..................
8,853
901,589
Cloudflare,
Inc.
,
Class
A
(a)
...................
17,469
1,434,904
Cognizant
Technology
Solutions
Corp.
,
Class
A
.....
28,847
2,243,431
EPAM
Systems,
Inc.
(a)
......................
3,381
678,770
Gartner,
Inc.
(a)
...........................
4,494
2,210,868
GoDaddy,
Inc.
,
Class
A
(a)
....................
8,177
1,368,912
MongoDB,
Inc.
,
Class
A
(a)
...................
4,256
1,237,602
Okta,
Inc.
,
Class
A
(a)
.......................
9,352
736,283
Snowflake,
Inc.
,
Class
A
(a)
...................
17,483
1,997,083
Twilio,
Inc.
,
Class
A
(a)
......................
9,435
592,141
VeriSign,
Inc.
(a)
..........................
5,226
961,061
14,362,644
a
Life
Sciences
Tools
&
Services
—
2
.2
%
Agilent
Technologies,
Inc.
...................
16,891
2,414,062
Avantor,
Inc.
(a)
...........................
39,581
1,022,773
Bio-Rad
Laboratories,
Inc.
,
Class
A
(a)
............
1,140
384,545
Bio-Techne
Corp.
.........................
9,177
679,006
Charles
River
Laboratories
International,
Inc.
(a)
.....
2,967
586,724
Danaher
Corp.
..........................
38,677
10,416,103
Illumina,
Inc.
(a)
...........................
9,243
1,214,530
IQVIA
Holdings,
Inc.
(a)
......................
10,571
2,659,135
Mettler-Toledo
International,
Inc.
(a)
.............
1,239
1,783,020
Revvity,
Inc.
............................
7,139
874,813
Waters
Corp.
(a)
..........................
3,442
1,192,137
West
Pharmaceutical
Services,
Inc.
............
4,214
1,321,637
24,548,485
a
Machinery
—
3
.2
%
CNH
Industrial
N.V.
.......................
51,369
531,156
Cummins,
Inc.
...........................
7,936
2,482,778
Deere
&
Co.
............................
15,189
5,859,005
Dover
Corp.
............................
7,983
1,485,078
Fortive
Corp.
............................
20,425
1,519,620
IDEX
Corp.
.............................
4,405
909,544
Security
Shares
Value
a
Machinery
(continued)
Illinois
Tool
Works,
Inc.
.....................
17,313
$
4,383,305
Ingersoll
Rand,
Inc.
.......................
23,407
2,140,570
Nordson
Corp.
...........................
3,156
809,703
Otis
Worldwide
Corp.
......................
23,464
2,221,806
PACCAR,
Inc.
...........................
30,411
2,924,930
Parker-Hannifin
Corp.
......................
7,458
4,476,292
Pentair
PLC
............................
9,564
848,231
Snap-on,
Inc.
...........................
3,069
870,798
Stanley
Black
&
Decker,
Inc.
.................
8,892
910,185
Toro
Co.
(The)
...........................
6,065
561,619
Westinghouse
Air
Brake
Technologies
Corp.
.......
10,241
1,736,566
Xylem,
Inc.
.............................
14,067
1,934,635
36,605,821
a
Media
—
1
.1
%
Charter
Communications,
Inc.
,
Class
A
(a)
(c)
........
5,432
1,887,837
Comcast
Corp.
,
Class
A
....................
227,101
8,986,387
Interpublic
Group
of
Companies,
Inc.
(The)
.......
21,841
712,235
Omnicom
Group,
Inc.
......................
11,412
1,146,107
12,732,566
a
Metals
&
Mining
—
0
.5
%
Newmont
Corp.
..........................
66,905
3,572,058
Reliance,
Inc.
...........................
3,318
951,105
Steel
Dynamics,
Inc.
.......................
8,652
1,034,000
5,557,163
a
Mortgage
REITs
—
0
.0
%
Annaly
Capital
Management,
Inc.
..............
29,107
586,797
a
Office
REITs
—
0
.1
%
BXP,
Inc.
..............................
8,659
651,330
a
Personal
Care
Products
—
0
.3
%
Estee
Lauder
Companies,
Inc.
(The)
,
Class
A
......
13,555
1,242,451
Kenvue,
Inc.
............................
111,097
2,438,579
3,681,030
a
Pharmaceuticals
—
0
.5
%
Catalent,
Inc.
(a)
..........................
10,512
640,812
Royalty
Pharma
PLC
,
Class
A
................
22,297
647,282
Zoetis,
Inc.
,
Class
A
.......................
26,474
4,857,714
6,145,808
a
Professional
Services
—
1
.4
%
Automatic
Data
Processing,
Inc.
...............
23,747
6,552,035
Booz
Allen
Hamilton
Holding
Corp.
,
Class
A
.......
7,523
1,194,502
Broadridge
Financial
Solutions,
Inc.
............
6,861
1,460,433
Dayforce,
Inc.
(a)
(c)
.........................
9,161
523,734
Paychex,
Inc.
...........................
18,805
2,467,216
Paycom
Software,
Inc.
.....................
2,959
481,666
TransUnion
.............................
11,315
1,095,405
Verisk
Analytics,
Inc.
.......................
8,278
2,258,404
16,033,395
a
Real
Estate
Management
&
Development
—
0
.3
%
CBRE
Group,
Inc.
,
Class
A
(a)
.................
17,802
2,049,722
CoStar
Group,
Inc.
(a)
.......................
23,701
1,832,088
3,881,810
a
Residential
REITs
—
0
.5
%
American
Homes
4
Rent
,
Class
A
..............
18,953
753,761
AvalonBay
Communities,
Inc.
................
8,254
1,863,176
Equity
Residential
........................
19,789
1,481,800
Invitation
Homes,
Inc.
......................
35,579
1,310,730
5,409,467
a
Schedule
of
Investments
(continued)
August
31,
2024
iShares
®
ESG
Advanced
MSCI
USA
ETF
(Percentages
shown
are
based
on
Net
Assets)
2024
iShares
Annual
Financial
Statements
Security
Shares
Value
a
Retail
REITs
—
0
.4
%
Kimco
Realty
Corp.
.......................
39,062
$
908,582
Regency
Centers
Corp.
....................
10,187
740,493
Simon
Property
Group,
Inc.
..................
18,911
3,164,756
4,813,831
a
Semiconductors
&
Semiconductor
Equipment
—
27
.3
%
Advanced
Micro
Devices,
Inc.
(a)
...............
93,778
13,931,660
Analog
Devices,
Inc.
.......................
28,790
6,761,043
Applied
Materials,
Inc.
.....................
48,039
9,476,173
Broadcom,
Inc.
..........................
256,572
41,775,053
Enphase
Energy,
Inc.
(a)
.....................
7,905
956,821
Entegris,
Inc.
............................
8,780
1,017,339
First
Solar,
Inc.
(a)
.........................
5,874
1,335,571
Intel
Corp.
.............................
246,991
5,443,682
KLA
Corp.
..............................
7,812
6,401,387
Lam
Research
Corp.
......................
7,586
6,228,182
Marvell
Technology,
Inc.
....................
50,222
3,828,925
Microchip
Technology,
Inc.
...................
31,140
2,558,462
Micron
Technology,
Inc.
.....................
64,335
6,191,600
Monolithic
Power
Systems,
Inc.
...............
2,820
2,635,798
NVIDIA
Corp.
...........................
1,427,291
170,375,727
NXP
Semiconductors
NV
...................
14,835
3,803,101
ON
Semiconductor
Corp.
(a)
..................
24,962
1,943,791
Qorvo,
Inc.
(a)
............................
5,564
644,812
QUALCOMM,
Inc.
........................
64,750
11,350,675
Skyworks
Solutions,
Inc.
....................
9,349
1,024,557
Teradyne,
Inc.
...........................
9,058
1,238,500
Texas
Instruments,
Inc.
.....................
52,826
11,322,725
310,245,584
a
Software
—
7
.6
%
Adobe,
Inc.
(a)
............................
25,727
14,777,846
ANSYS,
Inc.
(a)
...........................
5,072
1,630,242
Aspen
Technology,
Inc.
(a)
....................
1,672
391,482
Atlassian
Corp.
,
Class
A
(a)
...................
9,242
1,530,475
Autodesk,
Inc.
(a)
..........................
12,504
3,231,034
Bentley
Systems,
Inc.
,
Class
B
................
9,134
470,127
Cadence
Design
Systems,
Inc.
(a)
..............
15,789
4,246,136
Crowdstrike
Holdings,
Inc.
,
Class
A
(a)
............
13,396
3,714,443
Datadog,
Inc.
,
Class
A
(a)
....................
16,107
1,872,600
DocuSign,
Inc.
(a)
.........................
11,836
700,809
Dynatrace,
Inc.
(a)
.........................
16,437
832,041
Fair
Isaac
Corp.
(a)
.........................
1,433
2,479,477
Fortinet,
Inc.
(a)
...........................
37,675
2,890,049
Gen
Digital,
Inc.
..........................
32,915
870,931
HubSpot,
Inc.
(a)
..........................
2,809
1,401,888
Intuit,
Inc.
..............................
16,219
10,222,187
Manhattan
Associates,
Inc.
(a)
.................
3,562
941,900
MicroStrategy,
Inc.
,
Class
A
(a)
(c)
................
9,095
1,204,360
Palo
Alto
Networks,
Inc.
(a)
(c)
..................
18,787
6,814,421
PTC,
Inc.
(a)
.............................
6,948
1,244,317
Roper
Technologies,
Inc.
....................
6,211
3,443,440
Samsara,
Inc.
,
Class
A
(a)
(c)
...................
12,034
494,236
ServiceNow,
Inc.
(a)
........................
11,894
10,169,370
Synopsys,
Inc.
(a)
.........................
8,890
4,619,066
Tyler
Technologies,
Inc.
(a)
...................
2,463
1,447,924
Workday,
Inc.
,
Class
A
(a)
....................
12,300
3,237,237
Zscaler,
Inc.
(a)
...........................
5,262
1,052,295
85,930,333
a
Specialized
REITs
—
2
.0
%
American
Tower
Corp.
.....................
27,094
6,070,682
Crown
Castle,
Inc.
........................
25,211
2,824,136
Digital
Realty
Trust,
Inc.
....................
18,828
2,854,513
Equinix,
Inc.
............................
5,506
4,593,986
Security
Shares
Value
a
Specialized
REITs
(continued)
Iron
Mountain,
Inc.
........................
17,008
$
1,926,326
Public
Storage
...........................
9,176
3,153,975
SBA
Communications
Corp.
,
Class
A
............
6,226
1,411,185
22,834,803
a
Specialty
Retail
—
4
.7
%
AutoZone,
Inc.
(a)
.........................
991
3,152,847
Bath
&
Body
Works,
Inc.
....................
12,250
376,810
Best
Buy
Co.,
Inc.
........................
11,890
1,193,756
CarMax,
Inc.
(a)
...........................
9,007
761,542
Home
Depot,
Inc.
(The)
....................
57,533
21,200,911
Lowe's
Companies,
Inc.
....................
33,062
8,215,907
O'Reilly
Automotive,
Inc.
(a)
...................
3,417
3,861,107
Ross
Stores,
Inc.
.........................
19,362
2,916,111
TJX
Companies,
Inc.
(The)
..................
65,571
7,689,511
Tractor
Supply
Co.
........................
6,255
1,673,525
Ulta
Beauty,
Inc.
(a)
........................
2,776
979,484
Williams-Sonoma,
Inc.
.....................
7,462
1,002,370
53,023,881
a
Technology
Hardware,
Storage
&
Peripherals
—
0
.5
%
Hewlett
Packard
Enterprise
Co.
...............
75,512
1,462,667
NetApp,
Inc.
............................
11,889
1,435,240
Pure
Storage,
Inc.
,
Class
A
(a)
.................
17,982
922,297
Seagate
Technology
Holdings
PLC
.............
11,574
1,152,192
Western
Digital
Corp.
(a)
.....................
18,979
1,244,833
6,217,229
a
Textiles,
Apparel
&
Luxury
Goods
—
0
.3
%
Deckers
Outdoor
Corp.
(a)
....................
1,477
1,416,871
Lululemon
Athletica,
Inc.
(a)
...................
6,623
1,718,470
3,135,341
a
Trading
Companies
&
Distributors
—
1
.0
%
Fastenal
Co.
............................
33,219
2,268,193
Ferguson
Enterprises,
Inc.
...................
11,729
2,412,773
United
Rentals,
Inc.
.......................
3,874
2,871,642
Watsco,
Inc.
............................
2,016
958,447
WW
Grainger,
Inc.
........................
2,562
2,523,365
11,034,420
a
Water
Utilities
—
0
.1
%
American
Water
Works
Co.,
Inc.
...............
11,310
1,618,687
a
Total
Long-Term
Investments — 99.8%
(Cost:
$
895,807,619
)
................................
1,135,007,602
a
Short-Term
Securities
Money
Market
Funds
—
1
.0
%
BlackRock
Cash
Funds:
Institutional,
SL
Agency
Shares
,
5.45
%
(b)
(d)
(e)
.....................
9,732,534
9,738,373
BlackRock
Cash
Funds:
Treasury,
SL
Agency
Shares
,
5.25
%
(b)
(d)
............................
1,860,375
1,860,375
a
Total
Short-Term
Securities — 1.0%
(Cost:
$
11,596,018
)
.................................
11,598,748
Total
Investments
—
100.8%
(Cost:
$
907,403,637
)
................................
1,146,606,350
Liabilities
in
Excess
of
Other
Assets
—
(
0
.8
)
%
...............
(
9,640,584
)
Net
Assets
—
100.0%
.................................
$
1,136,965,766
iShares
®
ESG
Advanced
MSCI
USA
ETF
Schedule
of
Investments
(continued)
August
31,
2024
Derivative
Financial
Instruments
Outstanding
as
of
Period
End
Derivative
Financial
Instruments
Categorized
by
Risk
Exposure
As
of
period
end,
the
fair
values
of
derivative
financial
instruments
located
in
the
Statements
of
Assets
and
Liabilities
were
as
follows:
(a)
Non-income
producing
security.
(b)
Affiliate
of
the
Fund.
(c)
All
or
a
portion
of
this
security
is
on
loan.
(d)
Annualized
7-day
yield
as
of
period
end.
(e)
All
or
a
portion
of
this
security
was
purchased
with
the
cash
collateral
from
loaned
securities.
Affiliates
Investments
in
issuers
considered
to
be
affiliate(s)
of
the
Fund
during
the
year
ended
August
31,
2024
for
purposes
of
Section
2(a)(3)
of
the
Investment
Company
Act
of
1940,
as
amended,
were
as
follows:
Affiliated
Issuer
Value
at
08/31/23
Purchases
at
Cost
Proceeds
from
Sale
Net
Realized
Gain
(Loss)
Change
in
Unrealized
Appreciation
(Depreciation)
Value
at
08/31/24
Shares
Held
at
08/31/24
Income
Capital
Gain
Distributions
from
Underlying
Funds
BlackRock
Cash
Funds:
Institutional,
SL
Agency
Shares
$
14,467,489
$
—
$
(
4,733,597
)
(a)
$
3,432
$
1,049
$
9,738,373
9,732,534
$
58,421
(b)
$
—
BlackRock
Cash
Funds:
Treasury,
SL
Agency
Shares
1,047,206
813,169
(a)
—
—
—
1,860,375
1,860,375
77,919
—
BlackRock,
Inc.
..
4,082,047
2,415,318
(
225,003
)
40,252
1,461,890
7,774,504
8,621
142,516
—
$
43,684
$
1,462,939
$
19,373,252
$
278,856
$
—
(a)
Represents
net
amount
purchased
(sold).
(b)
All
or
a
portion
represents
securities
lending
income
earned
from
the
reinvestment
of
cash
collateral
from
loaned
securities,
net
of
fees
and
collateral
investment
expenses,
and
other
payments
to
and
from
borrowers
of
securities.
Futures
Contracts
Description
Number
of
Contracts
Expiration
Date
Notional
Amount
(000)
Value/
Unrealized
Appreciation
(Depreciation)
Long
Contracts
E-Mini
S&P
500
Index
..................................................................
4
09/20/24
$
1,132
$
36,641
E-Mini
Technology
Select
Sector
Index
......................................................
3
09/20/24
668
(
15,911
)
$
20,730
Commodity
Contracts
Credit
Contracts
Equity
Contracts
Foreign
Currency
Exchange
Contracts
Interest
Rate
Contracts
Other
Contracts
Total
Assets
—
Derivative
Financial
Instruments
Futures
contracts
Unrealized
appreciation
on
futures
contracts
(a)
.............
$
—
$
—
$
36,641
$
—
$
—
$
—
$
36,641
Liabilities
—
Derivative
Financial
Instruments
Futures
contracts
–
–
Unrealized
depreciation
on
futures
contracts
(a)
.............
$
—
$
—
$
15,911
$
—
$
—
$
—
$
15,911
(a)
Net
cumulative
unrealized
appreciation
(depreciation)
on
futures
contracts
are
reported
in
the
Schedule
of
Investments.
In
the
Statements
of
Assets
and
Liabilities,
only
current
day’s
variation
margin
is
reported
in
receivables
or
payables
and
the
net
cumulative
unrealized
appreciation
(depreciation)
is
included
in
accumulated
earnings
(loss).
Schedule
of
Investments
(continued)
August
31,
2024
iShares
®
ESG
Advanced
MSCI
USA
ETF
2024
iShares
Annual
Financial
Statements
For
the period
ended
August
31,
2024,
the
effect
of
derivative
financial
instruments
in
the
Statements
of
Operations
was
as
follows:
Average
Quarterly
Balances
of
Outstanding
Derivative
Financial
Instruments
For
more
information
about
the
Fund’s
investment
risks
regarding
derivative
financial
instruments,
refer
to
the
Notes
to
Financial
Statements.
Fair
Value
Hierarchy
as
of
Period
End
Various
inputs
are
used
in
determining
the
fair
value
of
financial
instruments.
For
a
description
of
the
input
levels
and
information
about
the
Fund’s
policy
regarding
valuation
of
financial
instruments,
refer
to
the
Notes
to
Financial
Statements.
The
following
table
summarizes
the
Fund’s
financial
instruments
categorized
in
the
fair
value
hierarchy.
The
breakdown
of
the
Fund’s
financial
instruments
into
major
categories
is
disclosed
in
the
Schedule
of
Investments
above.
See
notes
to
financial
statements.
Commodity
Contracts
Credit
Contracts
Equity
Contracts
Foreign
Currency
Exchange
Contracts
Interest
Rate
Contracts
Other
Contracts
Total
Net
Realized
Gain
(Loss)
from
Futures
contracts
.................................
$
—
$
—
$
252,341
$
—
$
—
$
—
$
252,341
Net
Change
in
Unrealized
Appreciation
(Depreciation)
on
Futures
contracts
.................................
$
—
$
—
$
(
5,168
)
$
—
$
—
$
—
$
(
5,168
)
Futures
contracts
Average
notional
value
of
contracts
—
long
...................................................................................
$
2,202,200
a
Level
1
Level
2
Level
3
Total
Assets
Investments
Long-Term
Investments
Common
Stocks
.........................................
$
1,135,007,602
$
—
$
—
$
1,135,007,602
Short-Term
Securities
Money
Market
Funds
......................................
11,598,748
—
—
11,598,748
$
1,146,606,350
$
—
$
—
$
1,146,606,350
Derivative
Financial
Instruments
(a)
Assets
Equity
Contracts
...........................................
$
36,641
$
—
$
—
$
36,641
Liabilities
Equity
Contracts
...........................................
(
15,911
)
—
—
(
15,911
)
$
20,730
$
—
$
—
$
20,730
a
(a)
Derivative
financial
instruments
are
futures
contracts.
Futures
contracts
are
valued
at
the
unrealized
appreciation
(depreciation)
on
the
instrument.
Statements
of
Assets
and
Liabilities
Statements
of
Assets
and
Liabilities
August
31,
2024
See
notes
to
financial
statements.
iShares
Climate
Conscious
&
Transition
MSCI
USA
ETF
iShares
ESG
Advanced
MSCI
USA
ETF
ASSETS
Investments,
at
value
—
unaffiliated
(a)
(b)
.....................................................................
$
2,138,934,816
$
1,127,233,098
Investments,
at
value
—
affiliated
(c)
........................................................................
20,997,001
19,373,252
Cash
............................................................................................
29,646
—
Cash
pledged:
Futures
contracts
..................................................................................
246,000
126,000
Receivables:
Investments
sold
..................................................................................
6,470,664
12,243,860
Securities
lending
income
—
affiliated
....................................................................
684
1,182
Dividends
—
unaffiliated
.............................................................................
2,509,113
827,630
Dividends
—
affiliated
...............................................................................
18,227
7,030
Variation
margin
on
futures
contracts
.....................................................................
40,800
23,906
Total
assets
.......................................................................................
2,169,246,951
1,159,835,958
LIABILITIES
Collateral
on
securities
loaned
...........................................................................
9,983,755
9,734,485
Payables:
Investments
purchased
..............................................................................
7,144,140
13,042,410
Investment
advisory
fees
.............................................................................
141,388
93,297
Total
liabilities
......................................................................................
17,269,283
22,870,192
Commitments
and
contingent
liabilities
NET
ASSETS
......................................................................................
$
2,151,977,668
$
1,136,965,766
NET
ASSETS
CONSIST
OF:
Paid-in
capital
......................................................................................
$
1,688,440,391
$
926,295,760
Accumulated
earnings
................................................................................
463,537,277
210,670,006
NET
ASSETS
......................................................................................
$
2,151,977,668
$
1,136,965,766
NET
ASSET
VALUE
Shares
outstanding
..................................................................................
32,050,000
23,550,000
Net
asset
value
.....................................................................................
$
67.14
$
48.28
Shares
authorized
...................................................................................
Unlimited
Unlimited
Par
value
.........................................................................................
None
None
(a)
Securities
loaned,
at
value
...........................................................................
$
9,830,937
$
9,599,255
(b)
Investments,
at
cost
—
unaffiliated
......................................................................
$
1,667,405,568
$
889,494,973
(c)
Investments,
at
cost
—
affiliated
........................................................................
$
19,020,608
$
17,908,664
2024
iShares
Annual
Financial
Statements
Statements
of
Operations
Year
Ended
August
31,
2024
See
notes
to
financial
statements.
iShares
Climate
Conscious
&
Transition
MSCI
USA
ETF
iShares
ESG
Advanced
MSCI
USA
ETF
INVESTMENT
INCOME
Dividends
—
unaffiliated
............................................................................
$
29,395,061
$
11,091,762
Dividends
—
affiliated
..............................................................................
447,205
220,435
Interest
—
unaffiliated
..............................................................................
21,148
8,909
Securities
lending
income
—
affiliated
—
net
...............................................................
36,569
58,421
Foreign
taxes
withheld
.............................................................................
(
3,026
)
(
11,537
)
Total
investment
income
..............................................................................
29,896,957
11,367,990
EXPENSES
Investment
advisory
...............................................................................
1,659,031
907,149
Interest
expense
.................................................................................
1,684
—
Total
expenses
....................................................................................
1,660,715
907,149
Net
investment
income
...............................................................................
28,236,242
10,460,841
—
—
REALIZED
AND
UNREALIZED
GAIN
(LOSS)
Net
realized
gain
(loss)
from:
Investments
—
unaffiliated
.........................................................................
(
15,803,859
)
503,347
Investments
—
affiliated
...........................................................................
9,014
2,436
Futures
contracts
...............................................................................
751,277
252,341
In-kind
redemptions
—
unaffiliated
(a)
...................................................................
143,098,548
41,308,357
In-kind
redemptions
—
affiliated
(a)
....................................................................
548,567
41,248
128,603,547
42,107,729
Net
change
in
unrealized
appreciation
(depreciation)
on:
Investments
—
unaffiliated
.........................................................................
346,095,104
207,206,258
Investments
—
affiliated
...........................................................................
1,703,627
1,462,939
Futures
contracts
...............................................................................
72,576
(
5,168
)
347,871,307
208,664,029
Net
realized
and
unrealized
gain
........................................................................
476,474,854
250,771,758
NET
INCREASE
IN
NET
ASSETS
RESULTING
FROM
OPERATIONS
...............................................
$
504,711,096
$
261,232,599
(a)
See
Note
2
of
the
Notes
to
Financial
Statements.
Statements
of
Changes
in
Net
Assets
Statements
of
Changes
in
Net
Assets
See
notes
to
financial
statements.
iShares
Climate
Conscious
&
Transition
MSCI
USA
ETF
iShares
ESG
Advanced
MSCI
USA
ETF
Year
Ended
08/31/24
Period
From
06/06/23
(a)
to
08/31/23
Year
Ended
08/31/24
Year
Ended
08/31/23
INCREASE
(DECREASE)
IN
NET
ASSETS
OPERATIONS
Net
investment
income
..........................................
$
28,236,242
$
7,650,854
$
10,460,841
$
8,992,143
Net
realized
gain
..............................................
128,603,547
572,163
42,107,729
1,566,048
Net
change
in
unrealized
appreciation
(depreciation)
......................
347,871,307
125,731,038
208,664,029
117,603,944
Net
increase
in
net
assets
resulting
from
operations
.........................
504,711,096
133,954,055
261,232,599
128,162,135
DISTRIBUTIONS
TO
SHAREHOLDERS
(b)
Decrease
in
net
assets
resulting
from
distributions
to
shareholders
...............
(
30,930,637
)
—
(
10,313,476
)
(
8,675,446
)
CAPITAL
SHARE
TRANSACTIONS
Net
increase
(decrease)
in
net
assets
derived
from
capital
share
transactions
.......
(
620,848,490
)
2,165,091,644
163,052,552
14,324,978
NET
ASSETS
Total
increase
(decrease)
in
net
assets
.................................
(
147,068,031
)
2,299,045,699
413,971,675
133,811,667
Beginning
of
period
..............................................
2,299,045,699
—
722,994,091
589,182,424
End
of
period
..................................................
$
2,151,977,668
$
2,299,045,699
$
1,136,965,766
$
722,994,091
(a)
Commencement
of
operations.
(b)
Distributions
for
annual
periods
determined
in
accordance
with
U.S.
federal
income
tax
regulations.
2024
iShares
Annual
Financial
Statements
Financial
Highlights
(For
a
share
outstanding
throughout
each
period)
See
notes
to
financial
statements.
iShares
Climate
Conscious
&
Transition
MSCI
USA
ETF
Year
Ended
08/31/24
Period
From
06/06/23
(a)
to
08/31/23
Net
asset
value,
beginning
of
period
......................................................................
$
53.28
$
50.07
Net
investment
income
(b)
..............................................................................
0
.79
0
.18
Net
realized
and
unrealized
gain
(c)
........................................................................
13.88
3
.03
Net
increase
from
investment
operations
.....................................................................
14.67
3
.21
Distributions
from
net
investment
income
(d)
....................................................................
(
0
.81
)
—
Net
asset
value,
end
of
period
...........................................................................
$
67.14
$
53.28
Total
Return
(e)
–
–
Based
on
net
asset
value
...............................................................................
27.83
%
6
.41
%
(f)
Ratios
to
Average
Net
Assets
(g)
–
–
Total
expenses
......................................................................................
0
.08
%
0
.08
%
(h)
Net
investment
income
.................................................................................
1
.36
%
1
.48
%
(h)
Supplemental
Data
Net
assets,
end
of
period
(000)
...........................................................................
$
2,151,978
$
2,299,046
Portfolio
turnover
rate
(i)
.................................................................................
21
%
1
%
(a)
Commencement
of
operations.
(b)
Based
on
average
shares
outstanding.
(c)
The
amounts
reported
for
a
share
outstanding
may
not
accord
with
the
change
in
aggregate
gains
and
losses
in
securities
for
the
fiscal
period
due
to
the
timing
of
capital
share
transactions
in
relation
to
the
fluctuating
market
values
of
the
Fund’s
underlying
securities.
(d)
Distributions
for
annual
periods
determined
in
accordance
with
U.S.
federal
income
tax
regulations.
(e)
Where
applicable,
assumes
the
reinvestment
of
distributions.
(f)
Not
annualized.
(g)
Excludes
fees
and
expenses
incurred
indirectly
as
a
result
of
investments
in
underlying
funds.
(h)
Annualized.
(i)
Portfolio
turnover
rate
excludes
in-kind
transactions,
if
any.
Financial
Highlights
(continued)
(For
a
share
outstanding
throughout
each
period)
See
notes
to
financial
statements.
iShares
ESG
Advanced
MSCI
USA
ETF
Year
Ended
08/31/24
Year
Ended
08/31/23
Year
Ended
08/31/22
Year
Ended
08/31/21
Period
From
06/16/20
(a)
to
08/31/20
Net
asset
value,
beginning
of
period
.......................
$
36.79
$
30.93
$
38.10
$
29.04
$
25.43
Net
investment
income
(b)
...............................
0
.48
0
.45
0
.42
0
.38
0
.06
Net
realized
and
unrealized
gain
(loss)
(c)
.....................
11.50
5
.85
(
7
.20
)
8
.99
3
.55
Net
increase
(decrease)
from
investment
operations
..............
11.98
6
.30
(
6
.78
)
9
.37
3
.61
Distributions
(d)
–
–
–
–
–
From
net
investment
income
............................
(
0
.49
)
(
0
.44
)
(
0
.39
)
(
0
.30
)
—
From
net
realized
gains
................................
—
—
—
(
0
.01
)
—
Total
distributions
.....................................
(
0
.49
)
(
0
.44
)
(
0
.39
)
(
0
.31
)
—
Net
asset
value,
end
of
period
............................
$
48.28
$
36.79
$
30.93
$
38.10
$
29.04
Total
Return
(e)
–
–
–
–
–
Based
on
net
asset
value
................................
32.83
%
20.65
%
(
17.95
)
%
32.53
%
14.20
%
(f)
Ratios
to
Average
Net
Assets
(g)
–
–
–
–
–
Total
expenses
.......................................
0
.10
%
0
.10
%
0
.10
%
0
.10
%
0
.10
%
(h)
Net
investment
income
..................................
1
.15
%
1
.39
%
1
.23
%
1
.09
%
1
.16
%
(h)
Supplemental
Data
Net
assets,
end
of
period
(000)
............................
$
1,136,966
$
722,994
$
589,182
$
419,105
$
5,808
Portfolio
turnover
rate
(i)
..................................
19
%
12
%
24
%
29
%
4
%
(a)
Commencement
of
operations.
(b)
Based
on
average
shares
outstanding.
(c)
The
amounts
reported
for
a
share
outstanding
may
not
accord
with
the
change
in
aggregate
gains
and
losses
in
securities
for
the
fiscal
period
due
to
the
timing
of
capital
share
transactions
in
relation
to
the
fluctuating
market
values
of
the
Fund’s
underlying
securities.
(d)
Distributions
for
annual
periods
determined
in
accordance
with
U.S.
federal
income
tax
regulations.
(e)
Where
applicable,
assumes
the
reinvestment
of
distributions.
(f)
Not
annualized.
(g)
Excludes
fees
and
expenses
incurred
indirectly
as
a
result
of
investments
in
underlying
funds.
(h)
Annualized.
(i)
Portfolio
turnover
rate
excludes
in-kind
transactions,
if
any.
Notes
to
Financial
Statements
2024
iShares
Annual
Financial
Statements
1.
Organization
iShares
Trust
(the
“Trust”)
is
registered
under
the
Investment
Company
Act
of
1940,
as
amended
(the
“1940
Act”),
as
an
open-end
management
investment
company.
The
Trust
is
organized
as
a
Delaware
statutory
trust
and
is
authorized
to
have
multiple
series
or
portfolios.
These
financial
statements
relate
only
to
the
following
funds
(each,
a
“Fund”
and
collectively,
the
“Funds”):
2.
Significant
Accounting
Policies
The
financial
statements
are
prepared
in
conformity
with
accounting
principles
generally
accepted
in
the
United
States
of
America
(“U.S.
GAAP”),
which
may
require
management
to
make
estimates
and
assumptions
that
affect
the
reported
amounts
of
assets
and
liabilities
in
the
financial
statements,
disclosure
of
contingent
assets
and
liabilities
at
the
date
of
the
financial
statements
and
the
reported
amounts
of
increases
and
decreases
in
net
assets
from
operations
during
the
reporting
period.
Actual
results
could
differ
from
those
estimates. Each
Fund
is
considered
an
investment
company
under
U.S.
GAAP
and
follows
the
accounting
and
reporting
guidance
applicable
to
investment
companies.
Below
is
a
summary
of
significant
accounting
policies:
Investment
Transactions
and
Income
Recognition:
For
financial
reporting
purposes,
investment
transactions
are
recorded
on
the
dates
the
transactions
are
executed.
Realized
gains
and
losses
on
investment
transactions
are
determined
using
the
specific
identification
method. Dividend
income
and
capital
gain
distributions,
if
any,
are
recorded
on
the
ex-dividend
date.
Non-cash
dividends,
if
any,
are
recorded
on
the
ex-dividend
date
at
fair
value. Dividends
from
foreign
securities
where
the
ex-dividend
date
may
have
passed
are
subsequently
recorded
when
the
Funds
are
informed
of
the
ex-dividend
date.
Under
the
applicable
foreign
tax
laws,
a
withholding
tax
at
various
rates
may
be
imposed
on
capital
gains,
dividends
and
interest. Upon
notification
from
issuers
or
as
estimated
by
management,
a
portion
of
the
dividend
income
received
from
a
real
estate
investment
trust
may
be
redesignated
as
a
reduction
of
cost
of
the
related
investment
and/or
realized
gain. Interest
income,
including
amortization
and
accretion
of
premiums
and
discounts
on
debt
securities,
is
recognized
daily
on
an
accrual
basis.
Foreign
Taxes:
The
Funds
may
be
subject
to
foreign
taxes
(a
portion
of
which
may
be
reclaimable)
on
income,
stock
dividends,
capital
gains
on
investments,
or
certain
foreign
currency
transactions.
All
foreign
taxes
are
recorded
in
accordance
with
the
applicable
foreign
tax
regulations
and
rates
that
exist
in
the
foreign
jurisdictions
in
which
each
Fund
invests.
These
foreign
taxes,
if
any,
are
paid
by
each
Fund
and
are
reflected
in
its
Statements
of
Operations
as
follows:
foreign
taxes
withheld
at
source
are
presented
as
a
reduction
of
income,
foreign
taxes
on
securities
lending
income
are
presented
as
a
reduction
of
securities
lending
income,
foreign
taxes
on
stock
dividends
are
presented
as
“Other
foreign
taxes”,
and
foreign
taxes
on
capital
gains
from
sales
of
investments
and
foreign
taxes
on
foreign
currency
transactions
are
included
in
their
respective
net
realized
gain
(loss)
categories.
Foreign
taxes
payable
or
deferred
as
of
August
31,
2024,
if
any,
are
disclosed
in
the
Statements
of
Assets
and
Liabilities.
The Funds
file
withholding
tax
reclaims
in
certain
jurisdictions
to
recover
a
portion
of
amounts
previously
withheld.
The
Funds
may
record
a
reclaim
receivable
based
on
collectability,
which
includes
factors
such
as
the
jurisdiction’s
applicable
laws,
payment
history
and
market
convention.
The
Statements
of
Operations
include
tax
reclaims
recorded
as
well
as
professional
and
other
fees,
if
any,
associated
with
recovery
of
foreign
withholding
taxes.
Bank
Overdraft:
Certain
Funds
had
outstanding
cash
disbursements
exceeding
deposited
cash
amounts
at
the
custodian
during
the
reporting
period. The
Funds
are
obligated
to
repay
the
custodian
for
any
overdraft,
including
any
related
costs
or
expenses,
where
applicable.
For
financial
reporting
purposes,
overdraft
fees,
if
any,
are
included
in
interest
expense
in
the
Statements
of
Operations.
Collateralization:
If
required
by
an
exchange
or
counterparty
agreement,
the
Funds
may
be
required
to
deliver/deposit
cash
and/or
securities
to/with
an
exchange,
or
broker-
dealer
or
custodian
as
collateral
for
certain
investments.
In-kind
Redemptions:
For
financial
reporting
purposes,
in-kind
redemptions
are
treated
as
sales
of
securities
resulting
in
realized
capital
gains
or
losses
to
the
Funds.
Because
such
gains
or
losses
are
not
taxable
to
the
Funds
and
are
not
distributed
to
existing
Fund
shareholders,
the
gains
or
losses
are
reclassified
from
accumulated
net
realized
gain
(loss)
to
paid-in
capital
at
the
end
of
the
Funds’
tax
year.
These
reclassifications
have
no
effect
on
net
assets
or
net
asset
value
(“NAV”)
per
share.
Distributions:
Dividends
and
distributions
paid
by
each
Fund
are
recorded
on
the
ex-dividend
dates.
Distributions
are
determined
on
a
tax
basis
and
may
differ
from
net
investment
income,
and net
realized
capital
gains
for
financial
reporting
purposes.
Dividends
and
distributions
are
paid
in
U.S.
dollars
and
cannot
be
automatically
reinvested
in
additional
shares
of
the
Funds.
Indemnifications:
In
the
normal
course
of
business,
each
Fund
enters
into
contracts
that
contain
a
variety
of
representations
that
provide
general
indemnification.
The
Funds’
maximum
exposure
under
these
arrangements
is
unknown
because
it
involves
future
potential
claims
against
the
Funds,
which
cannot
be
predicted
with
any
certainty.
3.
Investment
Valuation
and
Fair
Value
Measurements
Investment
Valuation
Policies:
Each
Fund’s
investments
are
valued
at
fair
value
(also
referred
to
as
“market
value”
within
the
financial
statements)
each
day
that
the
Fund’s
listing
exchange
is
open
and,
for
financial
reporting
purposes,
as
of
the
report
date.
U.S.
GAAP
defines
fair
value
as
the
price
a
fund
would
receive
to
sell
an
asset
or
pay
to
transfer
a
liability
in
an
orderly
transaction
between
market
participants
at
the
measurement
date.
The
Board
of Trustees of
the
Trust (the
“Board”)
of
each
Fund
has
approved
the
designation
of
BlackRock
Fund
Advisors
(“BFA”),
the
Funds’
investment
adviser,
as
the
valuation
designee
for each
Fund. Each
Fund
determines
the
fair
values
of
its
financial
instruments
using
various
independent
dealers
or
pricing
services
under
BFA’s
policies.
If
a
security’s
market
price
is
not
readily
available
or
does
not
otherwise
accurately
represent
the
fair
value
of
the
security,
the
security
will
be
valued
in
accordance
with
BFA’s
policies
and
procedures
as
reflecting
fair
value. BFA
has
iShares
ETF
Diversification
Classification
Climate
Conscious
&
Transition
MSCI
USA
...................................................................................
Non-diversified
ESG
Advanced
MSCI
USA
..............................................................................................
Non-diversified
Notes
to
Financial
Statements
(
continued)
Notes
to
Financial
Statements
formed
a
committee
(the
“Valuation
Committee”)
to
develop
pricing
policies
and
procedures
and
to
oversee
the
pricing
function
for
all
financial
instruments,
with
assistance
from
other
BlackRock
pricing
committees.
Fair
Value
Inputs
and
Methodologies:
The
following
methods
and
inputs
are
used
to
establish
the
fair
value
of each
Fund’s
assets
and
liabilities:
Equity
investments
traded
on
a
recognized
securities
exchange
are
valued
at
that
day’s
official
closing
price,
as
applicable,
on
the
exchange
where
the
stock
is
primarily
traded.
Equity
investments
traded
on
a
recognized
exchange
for
which
there
were
no
sales
on
that
day
are
valued
at
the
last
traded
price.
Investments
in
open-end
U.S.
mutual
funds
(including
money
market
funds)
are
valued
at
that
day’s
published
NAV.
Futures
contracts
are
valued
based
on
that
day’s
last
reported
settlement
or
trade
price
on
the
exchange
where
the
contract
is
traded.
If
events
(e.g.,
market
volatility,
company
announcement
or
a
natural
disaster)
occur
that
are
expected
to
materially
affect
the
value
of
such
investment,
or
in
the
event
that
application
of
these
methods
of
valuation
results
in
a
price
for
an
investment
that
is
deemed
not
to
be
representative
of
the
market
value
of
such
investment,
or
if
a
price
is
not
available,
the
investment
will
be
valued
by
the
Valuation
Committee,
in
accordance
with BFA’s
policies
and
procedures
as
reflecting
fair
value
(“Fair
Valued
Investments”).
The
fair
valuation
approaches
that
may
be
used
by
the
Valuation
Committee
include
market
approach,
income
approach
and
cost
approach.
Valuation
techniques
such
as
discounted
cash
flow,
use
of
market
comparables
and
matrix
pricing
are
types
of
valuation
approaches
and
are
typically
used
in
determining
fair
value.
When
determining
the
price
for
Fair
Valued
Investments,
the
Valuation
Committee
seeks
to
determine
the
price
that each
Fund
might
reasonably
expect
to
receive
or
pay
from
the
current
sale
or
purchase
of
that
asset
or
liability
in
an
arm’s-length
transaction.
Fair
value
determinations
shall
be
based
upon
all
available
factors
that
the
Valuation
Committee
deems
relevant
and
consistent
with
the
principles
of
fair
value
measurement.
Fair
value
pricing
could
result
in
a
difference
between
the
prices
used
to
calculate
a
fund’s
NAV
and
the
prices
used
by
the
fund’s
underlying
index,
which
in
turn
could
result
in
a
difference
between
the
fund’s
performance
and
the
performance
of
the
fund’s
underlying
index.
Fair
Value
Hierarchy:
Various
inputs
are
used
in
determining
the
fair
value
of
financial
instruments.
These
inputs
to
valuation
techniques
are
categorized
into
a
fair
value
hierarchy
consisting
of
three
broad
levels
for
financial
reporting
purposes
as
follows:
Level
1
–
Unadjusted
price
quotations
in
active
markets/exchanges
for
identical
assets
or
liabilities
that each
Fund
has
the
ability
to
access;
Level
2
–
Other
observable
inputs
(including,
but
not
limited
to,
quoted
prices
for
similar
assets
or
liabilities
in
markets
that
are
active,
quoted
prices
for
identical
or
similar
assets
or
liabilities
in
markets
that
are
not
active,
inputs
other
than
quoted
prices
that
are
observable
for
the
assets
or
liabilities
(such
as
interest
rates,
yield
curves,
volatilities,
prepayment
speeds,
loss
severities,
credit
risks
and
default
rates)
or
other
market-corroborated
inputs);
and
Level
3
–
Unobservable
inputs
based
on
the
best
information
available
in
the
circumstances,
to
the
extent
observable
inputs
are
not
available,
(including
the
Valuation
Committee’s
assumptions
used
in
determining
the
fair
value
of
financial
instruments).
The
hierarchy
gives
the
highest
priority
to
unadjusted
quoted
prices
in
active
markets
for
identical
assets
or
liabilities
(Level
1
measurements)
and
the
lowest
priority
to
unobservable
inputs
(Level
3
measurements).
Accordingly,
the
degree
of
judgment
exercised
in
determining
fair
value
is
greatest
for
instruments
categorized
in
Level
3.
The
inputs
used
to
measure
fair
value
may
fall
into
different
levels
of
the
fair
value
hierarchy.
In
such
cases,
for
disclosure
purposes,
the
fair
value
hierarchy
classification
is
determined
based
on
the
lowest
level
input
that
is
significant
to
the
fair
value
measurement
in
its
entirety.
Investments
classified
within
Level
3
have
significant
unobservable
inputs
used
by
the
Valuation
Committee
in
determining
the
price
for
Fair
Valued
Investments.
Level
3
investments
include
equity
or
debt
issued
by
privately
held
companies
or
funds
that
may
not
have
a
secondary
market
and/or
may
have
a
limited
number
of
investors.
The
categorization
of
a
value
determined
for
financial
instruments
is
based
on
the
pricing
transparency
of
the
financial
instruments
and
is
not
necessarily
an
indication
of
the
risks
associated
with
investing
in
those
securities.
4.
Securities
and
Other
Investments
Securities
Lending:
Each
Fund
may
lend
its
securities
to
approved
borrowers,
such
as
brokers,
dealers
and
other
financial
institutions.
The
borrower
pledges
and
maintains
with
the
Fund
collateral
consisting
of
cash,
an
irrevocable
letter
of
credit
issued
by
an
approved
bank,
or
securities
issued
or
guaranteed
by
the
U.S.
government.
The
initial
collateral
received
by
each
Fund
is
required
to
have
a
value
of
at
least
102%
of
the
current
market
value
of
the
loaned
securities
for
securities
traded
on
U.S.
exchanges
and
a
value
of
at
least
105%
for
all
other
securities.
The
collateral
is
maintained
thereafter
at
a
value
equal
to
at
least
100%
of
the
current
value
of
the
securities
on
loan.
The
market
value
of
the
loaned
securities
is
determined
at
the
close
of
each
business
day
of
the
Fund
and
any
additional
required
collateral
is
delivered
to
the
Fund
or
excess
collateral
is
returned
by
the
Fund,
on
the
next
business
day.
During
the
term
of
the
loan,
each
Fund
is
entitled
to
all
distributions
made
on
or
in
respect
of
the
loaned
securities
but
does
not
receive
interest
income
on
securities
received
as
collateral.
Loans
of
securities
are
terminable
at
any
time
and
the
borrower,
after
notice,
is
required
to
return
borrowed
securities
within
the
standard
time
period
for
settlement
of
securities
transactions.
As
of
period
end,
any
securities
on
loan
were
collateralized
by
cash
and/or
U.S.
Government
obligations.
Cash
collateral
invested
in
money
market
funds
managed
by
BFA,
or
its
affiliates
is
disclosed
in
the
Schedule
of
Investments.
Any
non-cash
collateral
received
cannot
be
sold,
re-invested
or
pledged
by
the
Fund,
except
in
the
event
of
borrower
default.
The
securities
on
loan,
if
any,
are
also
disclosed
in
each
Fund’s
Schedule
of
Investments.
The
market
value
of
any
securities
on
loan
and
the
value
of
any
related
cash
collateral
are
disclosed
in
the Statements
of
Assets
and
Liabilities.
Securities
lending
transactions
are
entered
into
by
the
Funds
under
Master
Securities
Lending
Agreements
(each,
an
“MSLA”)
which
provide
the
right,
in
the
event
of
default
(including
bankruptcy
or
insolvency)
for
the
non-defaulting
party
to
liquidate
the
collateral
and
calculate
a
net
exposure
to
the
defaulting
party
or
request
additional
collateral.
In
the
event
that
a
borrower
defaults,
the
Funds,
as
lender,
would
offset
the
market
value
of
the
collateral
received
against
the
market
value
of
the
securities
loaned.
When
the
value
of
the
collateral
is
greater
than
that
of
the
market
value
of
the
securities
loaned,
the
lender
is
left
with
a
net
amount
payable
to
the
defaulting
party.
However,
bankruptcy
or
insolvency
laws
of
a
particular
jurisdiction
may
impose
restrictions
on
or
prohibitions
against
such
a
right
of
offset
in
the
event
of
an
MSLA
counterparty’s
bankruptcy
or
insolvency.
Under
the
MSLA,
absent
an
event
of
default,
the
borrower
can
resell
or
re-pledge
the
loaned
securities,
and
the
Funds
can
reinvest
cash
collateral
received
in
Notes
to
Financial
Statements
(continued)
2024
iShares
Annual
Financial
Statements
connection
with
loaned
securities.
Upon
an
event
of
default,
the
parties’
obligations
to
return
the
securities
or
collateral
to
the
other
party
are
extinguished,
and
the
parties
can
resell
or
re-pledge
the
loaned
securities
or
the
collateral
received
in
connection
with
the
loaned
securities
in
order
to
satisfy
the
defaulting
party’s
net
payment
obligation
for
all
transactions
under
the
MSLA.
The
defaulting
party
remains
liable
for
any
deficiency.
As
of
period
end,
the
following
table
is
a
summary
of
the
securities
on
loan
by
counterparty
which
are
subject
to
offset
under
an
MSLA:
The
risks
of
securities
lending
include
the
risk
that
the
borrower
may
not
provide
additional
collateral
when
required
or
may
not
return
the
securities
when
due.
To
mitigate
these
risks,
each
Fund
benefits
from
a
borrower
default
indemnity
provided
by
BlackRock,
Inc.
(“BlackRock”).
BlackRock’s
indemnity
allows
for
full
replacement
of
the
securities
loaned
to
the
extent
the
collateral
received
does
not
cover
the
value
of
the
securities
loaned
in
the
event
of
borrower
default.
Each
Fund
could
incur
a
loss
if
the
value
of
an
investment
purchased
with
cash
collateral
falls
below
the
market
value
of
the
loaned
securities
or
if
the
value
of
an
investment
purchased
with
cash
collateral
falls
below
the
value
of
the
original
cash
collateral
received.
Such
losses
are
borne
entirely
by
each
Fund.
5.
Derivative
Financial
Instruments
Futures
Contracts:
Futures
contracts
are
purchased
or
sold
to
gain
exposure
to,
or
manage
exposure
to,
changes
in
interest
rates
(interest
rate
risk)
and
changes
in
the
value
of
equity
securities
(equity
risk)
or
foreign
currencies
(foreign
currency
exchange
rate
risk).
Futures
contracts
are
exchange-traded
agreements
between
the Funds
and
a
counterparty
to
buy
or
sell
a
specific
quantity
of
an
underlying
instrument
at
a
specified
price
and
on
a
specified
date.
Depending
on
the
terms
of
a
contract,
it
is
settled
either
through
physical
delivery
of
the
underlying
instrument
on
the
settlement
date
or
by
payment
of
a
cash
amount
on
the
settlement
date.
Upon
entering
into
a
futures
contract,
the Funds
are
required
to
deposit
initial
margin
with
the
broker
in
the
form
of
cash
or
securities
in
an
amount
that
varies
depending
on
a
contract’s
size
and
risk
profile.
The
initial
margin
deposit
must
then
be
maintained
at
an
established
level
over
the
life
of
the
contract.
Amounts
pledged,
which
are
considered
restricted,
are
included
in
cash
pledged
for
futures
contracts
in
the
Statements
of
Assets
and
Liabilities.
Securities
deposited
as
initial
margin
are
designated
in
the
Schedule
of
Investments
and
cash
deposited,
if
any,
are
shown
as
cash
pledged
for
futures
contracts
in
the
Statements
of
Assets
and
Liabilities.
Pursuant
to
the
contract,
the Funds
agree
to
receive
from
or
pay
to
the
broker
an
amount
of
cash
equal
to
the
daily
fluctuation
in
market
value
of
the
contract
(“variation
margin”).
Variation
margin
is
recorded
as
unrealized
appreciation
(depreciation)
and,
if
any,
shown
as
variation
margin
receivable
(or
payable)
on
futures
contracts
in
the
Statements
of
Assets
and
Liabilities.
When
the
contract
is
closed,
a
realized
gain
or
loss
is
recorded
in
the
Statements
of
Operations
equal
to
the
difference
between
the
notional
amount
of
the
contract
at
the
time
it
was
opened
and
the
notional
amount
at
the
time
it
was
closed.
The
use
of
futures
contracts
involves
the
risk
of
an
imperfect
correlation
in
the
movements
in
the
price
of
futures
contracts
and
interest
rates,
foreign
currency
exchange
rates
or
underlying
assets.
iShares
ETF
and
Counterparty
Securities
Loaned
at
Value
Cash
Collateral
Received
(a)
Non-Cash
Collateral
Received,
at
Fair
Value
(a)
Net
Amount
Climate
Conscious
&
Transition
MSCI
USA
Citigroup
Global
Markets,
Inc.
....................................
$
8,051,207
$
(8,051,207
)
$
—
$
—
J.P.
Morgan
Securities
LLC
.....................................
497,551
(497,551
)
—
—
RBC
Capital
Markets
LLC
......................................
219,978
(219,978
)
—
—
UBS
AG
..................................................
68,334
(68,334
)
—
—
UBS
Securities
LLC
..........................................
832,566
(832,566
)
—
—
Wells
Fargo
Bank
NA
.........................................
142,186
(142,186
)
—
—
Wells
Fargo
Securities
LLC
.....................................
19,115
(19,115
)
—
—
$
9,830,937
$
(9,830,937
)
$
—
$
—
a
ESG
Advanced
MSCI
USA
Barclays
Bank
PLC
...........................................
266,126
(266,126
)
—
—
Barclays
Capital,
Inc.
.........................................
36,272
(36,272
)
—
—
Citigroup
Global
Markets,
Inc.
....................................
967,466
(967,466
)
—
—
J.P.
Morgan
Securities
LLC
.....................................
98,904
(98,904
)
—
—
Morgan
Stanley
.............................................
120,370
(120,370
)
—
—
Scotia
Capital
(USA),
Inc.
......................................
88,156
(88,156
)
—
—
UBS
AG
..................................................
25,955
(25,955
)
—
—
Wells
Fargo
Bank
NA
.........................................
6,157,172
(6,157,172
)
—
—
Wells
Fargo
Securities
LLC
.....................................
1,838,834
(1,838,834
)
—
—
$
9,599,255
$
(9,599,255
)
$
—
$
—
a
(a)
Collateral
received,
if
any,
in
excess
of
the
market
value
of
securities
on
loan
is
not
presented
in
this
table.
The
total
cash
collateral
received
by
each
Fund
is
disclosed
in
the
Funds’
Statements
of
Assets
and
Liabilities.
Notes
to
Financial
Statements
(
continued)
Notes
to
Financial
Statements
6.
Investment
Advisory
Agreement
and
Other
Transactions
with
Affiliates
Investment
Advisory
Fees:
Pursuant
to
an
Investment
Advisory
Agreement
with
the
Trust, BFA manages
the
investment
of
each
Fund’s
assets.
BFA
is
a
California
corporation
indirectly
owned
by BlackRock.
Under
the
Investment
Advisory
Agreement,
BFA
is
responsible
for
substantially
all
expenses
of
the
Funds,
except
(i)
interest
and
taxes;
(ii)
brokerage
commissions
and
other
expenses
connected
with
the
execution
of
portfolio
transactions;
(iii)
distribution
fees;
(iv)
the
advisory
fee
payable
to
BFA;
and
(v)
litigation
expenses
and
any
extraordinary
expenses
(in
each
case
as
determined
by
a
majority
of
the
independent
trustees).
For
its
investment
advisory
services
to
each
of
the
following
Funds,
BFA
is
entitled
to
an
annual
investment
advisory
fee,
accrued
daily
and
paid
monthly
by
the
Funds,
based
on
the
average
daily
net
assets
of
each
Fund
as
follows:
Distributor:
BlackRock
Investments,
LLC
(“BRIL”),
an
affiliate
of
BFA,
is
the
distributor
for
each
Fund.
Pursuant
to
the
distribution
agreement,
BFA
is
responsible
for
any
fees
or
expenses
for
distribution
services
provided
to
the
Funds.
ETF
Servicing
Fees:
Each
Fund
has
entered
into
an
ETF
Services
Agreement
with
BRIL
to
perform
certain
order
processing,
Authorized
Participant
communications,
and
related
services
in
connection
with
the
issuance
and
redemption
of
Creation
Units
(“ETF
Services”).
BRIL
is
entitled
to
a
transaction
fee
from
Authorized
Participants
on
each
creation
or
redemption
order
for
the
ETF
Services
provided. The
Funds
do
not
pay
BRIL
for
ETF
Services.
Securities
Lending:
The
U.S.
Securities
and
Exchange
Commission
(the
“SEC”)
has
issued
an
exemptive
order
which
permits
BlackRock
Institutional
Trust
Company,
N.A.
(“BTC”),
an
affiliate
of
BFA,
to
serve
as
securities
lending
agent
for
the
Funds,
subject
to
applicable
conditions.
As
securities
lending
agent,
BTC
bears
all
operational
costs
directly
related
to
securities
lending,
including
any
custodial
costs.
Each
Fund
is
responsible
for
fees
in
connection
with
the
investment
of
cash
collateral
received
for
securities
on
loan
(the
“collateral
investment
fees”).
The
cash
collateral
is
invested
in
a
money
market
fund,
BlackRock
Cash
Funds:
Institutional
or
BlackRock
Cash
Funds:
Treasury,
managed
by
BFA,
or
its
affiliates.
However,
BTC
has
agreed
to
reduce
the
amount
of
securities
lending
income
it
receives
in
order
to
effectively
limit
the
collateral
investment
fees
each
Fund
bears
to
an
annual
rate
of
0.04%.
The
SL
Agency
Shares
of
such
money
market
fund
will
not
be
subject
to
a
sales
load,
redemption
fee,
distribution
fee
or
service
fee.
The
money
market
fund
in
which
the
cash
collateral
has
been
invested
may
impose
a
discretionary
liquidity
fee
of
up
to
2%
of
the
value
redeemed,
if
such
fee
is
determined
to
be
in
the
best
interests
of
such
money
market
fund.
Securities
lending
income
is
generally
equal
to
the
total
of
income
earned
from
the
reinvestment
of
cash
collateral
(and
excludes
collateral
investment
fees),
and
any
fees
or
other
payments
to
and
from
borrowers
of
securities.
Each
Fund
retains
a
portion
of
the
securities
lending
income
and
remits
the
remaining
portion
to
BTC
as
compensation
for
its
services
as
securities
lending
agent.
Pursuant
to
the
current
securities
lending
agreement,
each
Fund
retains
81%
of
securities
lending
income
(which
excludes
collateral
investment
fees)
and
the
amount
retained
can
never
be
less
than
70%
of
the
total
of
securities
lending
income
plus
the
collateral
investment
fees.
In
addition,
commencing
the
business
day
following
the
date
that
the
aggregate
securities
lending
income
plus
the
collateral
investment
fees
generated
across
all
1940
Act
iShares
exchange-traded
funds
(the
“iShares
ETF
Complex”)
in
that
calendar
year
exceeds
a
specified
threshold,
each
Fund,
pursuant
to
the
securities
lending
agreement,
will
retain
for
the
remainder
of
that
calendar
year
81%
of
securities
lending
income
(which
excludes
collateral
investment
fees),
and
the
amount
retained
can
never
be
less
than
70%
of
the
total
of
securities
lending
income
plus
the
collateral
investment
fees.
The
share
of
securities
lending
income
earned
by
each
Fund
is
shown
as
securities
lending
income
–
affiliated
–
net
in
its Statements
of
Operations.
For
the year
ended August
31,
2024,
the
Funds
paid
BTC
the
following
amounts
for
securities
lending
agent
services:
Officers
and
Trustees:
Certain
officers
and/or
trustees
of
the
Trust
are
officers
and/or trustees
of
BlackRock
or
its
affiliates.
Other
Transactions:
Cross
trading
is
the
buying
or
selling
of
portfolio
securities
between
funds
to
which
BFA
(or
an
affiliate)
serves
as
investment
adviser.
At
its
regularly
scheduled
quarterly
meetings,
the
Board
reviews
such
transactions
as
of
the
most
recent
calendar
quarter
for
compliance
with
the
requirements
and
restrictions
set
forth
by
Rule
17a-7.
For
the year
ended
August
31,
2024,
transactions
executed
by
the
Funds
pursuant
to
Rule
17a-7
under
the
1940
Act
were
as
follows:
Each
Fund
may
invest
its
positive
cash
balances
in
certain
money
market
funds
managed
by
BFA
or
an
affiliate.
The
income
earned
on
these
temporary
cash
investments
is
shown
as
dividends
–
affiliated
in
the
Statements
of
Operations.
A
fund,
in
order
to
improve
its
portfolio
liquidity
and
its
ability
to
track
its
underlying
index,
may
invest
in
shares
of
other
iShares
funds
that
invest
in
securities
in
the
fund’s
underlying
index.
iShares
ETF
Investment
Advisory
Fees
Climate
Conscious
&
Transition
MSCI
USA
.
.
.
.
.
.
.
.
.
.
.
.
.
.
.
.
.
.
.
.
.
.
.
.
.
.
.
.
.
.
.
.
.
.
.
.
.
.
.
.
.
.
.
.
.
.
.
.
.
.
.
.
.
.
.
.
.
.
.
.
.
.
.
.
.
.
.
.
.
.
.
.
.
.
.
.
.
.
.
.
.
.
.
.
.
.
.
.
.
.
.
.
.
.
.
.
0.08%
ESG
Advanced
MSCI
USA
.
.
.
.
.
.
.
.
.
.
.
.
.
.
.
.
.
.
.
.
.
.
.
.
.
.
.
.
.
.
.
.
.
.
.
.
.
.
.
.
.
.
.
.
.
.
.
.
.
.
.
.
.
.
.
.
.
.
.
.
.
.
.
.
.
.
.
.
.
.
.
.
.
.
.
.
.
.
.
.
.
.
.
.
.
.
.
.
.
.
.
.
.
.
.
.
.
.
.
.
.
.
.
.
.
.
.
.
.
0.10
iShares
ETF
Amounts
Climate
Conscious
&
Transition
MSCI
USA
..................................................................................
$
12,209
ESG
Advanced
MSCI
USA
.............................................................................................
17,873
iShares
ETF
Purchases
Sales
Net
Realized
Gain
(Loss)
Climate
Conscious
&
Transition
MSCI
USA
..............................................
$
195,308,236
$
283,750,027
$
(12,094,693
)
ESG
Advanced
MSCI
USA
.........................................................
51,333,729
56,689,387
(680,196
)
Notes
to
Financial
Statements
(continued)
2024
iShares
Annual
Financial
Statements
7.
Purchases
and
Sales
For
the year
ended
August
31,
2024,
purchases
and
sales
of
investments,
excluding
short-term
securities
and
in-kind
transactions,
were
as
follows:
For
the year ended
August
31,
2024,
in-kind
transactions
were
as
follows:
8.
Income
Tax
Information
Each
Fund
is
treated
as
an
entity
separate
from
the
Trust’s
other
funds
for
federal
income
tax
purposes.
It
is
each
Fund’s
policy
to
comply
with
the
requirements
of
the
Internal
Revenue
Code
of
1986,
as
amended,
applicable
to
regulated
investment
companies,
and
to
distribute
substantially
all
of
its
taxable
income
to
its
shareholders.
Therefore,
no
U.S.
federal
income
tax
provision
is
required.
Management
has
analyzed
tax
laws
and
regulations
and
their
application
to
the
Funds
as
of
August
31,
2024,
inclusive
of
the
open
tax
return
years,
and
does
not
believe
that
there
are
any
uncertain
tax
positions
that
require
recognition
of
a
tax
liability
in
the
Funds’
financial
statements.
Management’s
analysis
is
based
on
the
tax
laws
and
judicial
and
administrative
interpretations
thereof
in
effect
as
of
the
date
of
these
financial
statements,
all
of
which
are
subject
to
change,
possibly
with
retroactive
effect,
which
may
impact
the
Funds’
NAV.
U.S.
GAAP
requires
that
certain
components
of
net
assets
be
adjusted
to
reflect
permanent
differences
between
financial
and
tax
reporting.
These
reclassifications
have
no
effect
on
net
assets
or
NAV
per
share.
As
of
August
31,
2024,
permanent
differences
attributable
to
nondeductible
expenses
and
realized
gains
(losses)
from
in-kind
redemptions
were
reclassified
to
the
following
accounts:
The
tax
character
of
distributions
paid
was
as
follows:
As
of
August
31,
2024,
the
tax
components
of
accumulated
net earnings
(losses)
were
as
follows:
For
the
year
ended
August
31,
2024,
the
Fund
listed
below
utilized
the
following
amount
of
its
respective
capital
loss
carryforwards.
iShares
ETF
Purchases
Sales
Climate
Conscious
&
Transition
MSCI
USA
................................................................
$
441,629,638
$
444,146,182
ESG
Advanced
MSCI
USA
...........................................................................
178,500,625
175,395,041
iShares
ETF
In-kind
Purchases
In-kind
Sales
Climate
Conscious
&
Transition
MSCI
USA
................................................................
$
386,744,212
$
1,003,768,399
ESG
Advanced
MSCI
USA
...........................................................................
334,103,424
172,531,010
iShares
ETF
Paid-in
Capital
Accumulated
Earnings
(Loss)
Climate
Conscious
&
Transition
MSCI
USA
................................................................
$
143,638,068
$
(143,638,068
)
ESG
Advanced
MSCI
USA
...........................................................................
40,860,677
(40,860,677
)
iShares
ETF
Year
Ended
08/31/24
Year
Ended
08/31/23
Climate
Conscious
&
Transition
MSCI
USA
(a)
Ordinary
income
..........................................................................................
$
30,930,637
$
—
ESG
Advanced
MSCI
USA
Ordinary
income
..........................................................................................
$
10,313,476
$
8,675,446
(a)
The
Fund
commenced
operations
on
June
6,
2023.
iShares
ETF
Undistributed
Ordinary
Income
Non-Expiring
Capital
Loss
Carryforwards
(a)
Net
Unrealized
Gains
(Losses)
(b)
Total
Climate
Conscious
&
Transition
MSCI
USA
............................
$
6,321,434
$
(16,121,811
)
$
473,337,654
$
463,537,277
ESG
Advanced
MSCI
USA
.......................................
2,774,675
(28,566,491
)
236,461,822
210,670,006
(a)
Amounts
available
to
offset
future
realized
capital
gains.
(b)
The
difference
between
book-basis
and
tax-basis
net
unrealized
gains
(losses)
was
attributable
primarily
to
the
tax
deferral
of
losses
on
wash
sales,
the
realization
for
tax
purposes
of
unrealized
gains
(losses)
on
certain
futures
contracts,
the
realization
for
tax
purposes
of
unrealized
gains
on
investments
in
passive
foreign
investment
companies,
the
characterization
of
corporate
actions
and
undistributed
capital
gains
from
underlying
REIT
investments.
iShares
ETF
Utilized
ESG
Advanced
MSCI
USA
..............................................................................................
$
1,415,436
Notes
to
Financial
Statements
(
continued)
Notes
to
Financial
Statements
A
fund
may
own
shares
in
certain
foreign
investment
entities,
referred
to,
under
U.S.
tax
law,
as
“passive
foreign
investment
companies.”
Such
fund
may
elect
to
mark-to-
market
annually
the
shares
of
each
passive
foreign
investment
company
and
would
be
required
to
distribute
to
shareholders
any
such
marked-to-market
gains.
As
of
August
31,
2024,
gross
unrealized
appreciation
and
depreciation
based
on
cost
of
investments
(including
short
positions
and
derivatives,
if
any)
for
U.S.
federal
income
tax
purposes
were
as
follows:
9.
Principal
Risks
In
the
normal
course
of
business,
each
Fund
invests
in
securities
or
other
instruments
and
may
enter
into
certain
transactions,
and
such
activities
subject
the
Fund
to
various
risks,
including,
among
others,
fluctuations
in
the
market
(market
risk)
or
failure
of
an
issuer
to
meet
all
of
its
obligations.
The
value
of
securities
or
other
instruments
may
also
be
affected
by
various
factors,
including,
without
limitation:
(i)
the
general
economy;
(ii)
the
overall
market
as
well
as
local,
regional
or
global
political
and/or
social
instability;
(iii)
regulation,
taxation
or
international
tax
treaties
between
various
countries;
or
(iv)
currency,
interest
rate
or
price
fluctuations.
Local,
regional
or
global
events
such
as
war,
acts
of
terrorism,
the
spread
of
infectious
illness
or
other
public
health
issues,
recessions,
or
other
events
could
have
a
significant
impact
on
the
Funds
and
their
investments.
Each
Fund’s
prospectus
provides
details
of
the
risks
to
which
the
Fund
is
subject.
BFA
uses
an
indexing
approach
to
try
to
achieve
each
Fund’s
investment
objective.
The
Fund
is
not
actively
managed,
and
BFA
generally
does
not
attempt
to
take
defensive
positions
under
any
market
conditions,
including
declining
markets.
The
Funds
may
be
exposed
to
additional
risks
when
reinvesting
cash
collateral
in
money
market
funds
that
do
not
seek
to
maintain
a
stable
NAV
per
share
of
$1.00,
which
may
be
subject
to
discretionary
liquidity
fees
under
certain
circumstances.
Valuation
Risk:
The
market
values
of
equities,
such
as
common
stocks
and
preferred
securities
or
equity
related
investments,
such
as
futures
and
options,
may
decline
due
to
general
market
conditions
which
are
not
specifically
related
to
a
particular
company.
They
may
also
decline
due
to
factors
which
affect
a
particular
industry
or
industries.
A
fund
may
invest
in
illiquid
investments.
An
illiquid
investment
is
any
investment
that
a
fund
reasonably
expects
cannot
be
sold
or
disposed
of
in
current
market
conditions
in
seven
calendar
days
or
less
without
the
sale
or
disposition
significantly
changing
the
market
value
of
the
investment.
A
fund
may
experience
difficulty
in
selling
illiquid
investments
in
a
timely
manner
at
the
price
that
it
believes
the
investments
are
worth.
Prices
may
fluctuate
widely
over
short
or
extended
periods
in
response
to
company,
market
or
economic
news.
Markets
also
tend
to
move
in
cycles,
with
periods
of
rising
and
falling
prices.
This
volatility
may
cause
a
fund’s
NAV
to
experience
significant
increases
or
decreases
over
short
periods
of
time.
If
there
is
a
general
decline
in
the
securities
and
other
markets,
the
NAV
of
a
fund
may
lose
value,
regardless
of
the
individual
results
of
the
securities
and
other
instruments
in
which
a
fund
invests.
Counterparty
Credit
Risk:
The
Funds
may
be
exposed
to
counterparty
credit
risk,
or
the
risk
that
an
entity
may
fail
to
or
be
unable
to
perform
on
its
commitments
related
to
unsettled
or
open
transactions,
including
making
timely
interest
and/or
principal
payments
or
otherwise
honoring
its
obligations.
The
Funds
manage
counterparty
credit
risk
by
entering
into
transactions
only
with
counterparties
that
BFA
believes
have
the
financial
resources
to
honor
their
obligations
and
by
monitoring
the
financial
stability
of
those
counterparties.
Financial
assets,
which
potentially
expose
the
Funds
to
market,
issuer
and
counterparty
credit
risks,
consist
principally
of
financial
instruments
and
receivables
due
from
counterparties.
The
extent
of
the
Funds’
exposure
to
market,
issuer
and
counterparty
credit
risks
with
respect
to
these
financial
assets
is
approximately
their
value
recorded
in
the
Statements
of
Assets
and
Liabilities,
less
any
collateral
held
by
the
Funds.
A
derivative
contract
may
suffer
a
mark-to-market
loss
if
the
value
of
the
contract
decreases
due
to
an
unfavorable
change
in
the
market
rates
or
values
of
the
underlying
instrument.
Losses
can
also
occur
if
the
counterparty
does
not
perform
under
the
contract.
With
exchange-traded
futures,
there
is
less
counterparty
credit
risk
to
the
Funds
since
the
exchange
or
clearinghouse,
as
counterparty
to
such
instruments,
guarantees
against
a
possible
default.
The
clearinghouse
stands
between
the
buyer
and
the
seller
of
the
contract;
therefore,
credit
risk
is
limited
to
failure
of
the
clearinghouse.
While
offset
rights
may
exist
under
applicable
law, a
Fund
does
not
have
a
contractual
right
of
offset
against
a
clearing
broker
or
clearinghouse
in
the
event
of
a
default
(including
the
bankruptcy
or
insolvency).
Additionally,
credit
risk
exists
in
exchange-traded
futures
with
respect
to
initial
and
variation
margin
that
is
held
in
a
clearing
broker’s
customer
accounts.
While
clearing
brokers
are
required
to
segregate
customer
margin
from
their
own
assets,
in
the
event
that
a
clearing
broker
becomes
insolvent
or
goes
into
bankruptcy
and
at
that
time
there
is
a
shortfall
in
the
aggregate
amount
of
margin
held
by
the
clearing
broker
for
all
its
clients,
typically
the
shortfall
would
be
allocated
on
a
pro
rata
basis
across
all
the
clearing
broker’s
customers,
potentially
resulting
in
losses
to
the
Funds.
Geographic/Asset
Class
Risk:
A
diversified
portfolio,
where
this
is
appropriate
and
consistent
with
a
fund’s
objectives,
minimizes
the
risk
that
a
price
change
of
a
particular
investment
will
have
a
material
impact
on
the
NAV
of
a
fund.
The
investment
concentrations
within
each
Fund’s
portfolio
are
disclosed
in
its
Schedule
of
Investments.
The Funds
invest
a
significant
portion
of
their
assets
in securities
of
issuers
located
in
the
United
States.
A
decrease
in
imports
or
exports,
changes
in
trade
regulations,
inflation
and/or
an
economic
recession
in
the
United
States
may
have
a
material
adverse
effect
on
the
U.S.
economy
and
the
securities
listed
on
U.S.
exchanges.
Proposed
and
adopted
policy
and
legislative
changes
in
the
United
States
may
also
have
a
significant
effect
on
U.S.
markets
generally,
as
well
as
on
the
value
of
certain
securities.
Governmental
agencies
project
that
the
United
States
will
continue
to
maintain
elevated
public
debt
levels
for
the
foreseeable
future
which
may
constrain
future
economic
growth.
Circumstances
could
arise
that
could
prevent
the
timely
payment
of
interest
or
principal
on
U.S.
government
debt,
such
as
reaching
the
legislative
“debt
ceiling.”
Such
non-payment
would
result
in
substantial
negative
consequences
for
the
U.S.
economy
and
the
global
financial
system.
If
U.S.
relations
with
certain
countries
deteriorate,
it
could
adversely
affect
issuers
that
rely
on
the
United
States
for
trade.
The
United
States
has
also
experienced
increased
internal
unrest
and
discord.
If
these
trends
were
to
continue,
they
may
have
an
adverse
impact
on
the
U.S.
economy
and
the
issuers
in
which
the
Funds
invest.
iShares
ETF
Tax
Cost
Gross
Unrealized
Appreciation
Gross
Unrealized
Depreciation
Net
Unrealized
Appreciation
(Depreciation)
Climate
Conscious
&
Transition
MSCI
USA
............................
$
1,686,591,108
$
502,198,559
$
(28,857,850
)
$
473,340,709
ESG
Advanced
MSCI
USA
.......................................
910,140,338
284,239,684
(47,773,672
)
236,466,012
Notes
to
Financial
Statements
(continued)
2024
iShares
Annual
Financial
Statements
The Funds
invest
a
significant
portion
of
their
assets
in
securities
within
a
single
or
limited
number
of
market
sectors.
When
a
fund
concentrates
its
investments
in
this
manner,
it
assumes
the
risk
that
economic,
regulatory,
political
and
social
conditions
affecting
such
sectors
may
have
a
significant
impact
on
the
Fund
and
could
affect
the
income
from,
or
the
value
or
liquidity
of,
the
Fund's
portfolio.
Investment
percentages
in
specific
sectors
are
presented
in
the
Schedule
of
Investments.
Significant
Shareholder
Redemption
Risk:
Certain
shareholders
may
own
or
manage
a
substantial
amount
of
fund
shares
and/or
hold
their
fund
investments
for
a
limited
period
of
time.
Large
redemptions
of
fund
shares
by
these
shareholders
may
force
a
fund
to
sell
portfolio
securities,
which
may
negatively
impact
the
fund’s
NAV,
increase
the
fund’s
brokerage
costs,
and/or
accelerate
the
realization
of
taxable
income/gains
and
cause
the
fund
to
make
additional
taxable
distributions
to
shareholders.
10.
Capital
Share
Transactions
Capital
shares
are
issued
and
redeemed
by each
Fund
only
in
aggregations
of
a
specified
number
of
shares
or
multiples
thereof
(“Creation
Units”)
at
NAV.
Except
when
aggregated
in
Creation
Units,
shares
of each
Fund
are
not
redeemable.
Transactions
in
capital
shares
were
as
follows:
The
consideration
for
the
purchase
of
Creation
Units
of
a
fund
in
the
Trust
generally
consists
of
the
in-kind
deposit
of
a
designated
portfolio
of
securities
and
a
specified
amount
of
cash.
Certain
funds
in
the
Trust
may
be
offered
in
Creation
Units
solely
or
partially
for
cash
in
U.S.
dollars.
Authorized
Participants
purchasing
and
redeeming
Creation
Units
may
pay
a
purchase
transaction
fee
and
a
redemption
transaction
fee
directly
to
BRIL,
to
offset
transfer
and
other
transaction
costs
associated
with
the
issuance
and
redemption
of
Creation
Units,
including
Creation
Units
for
cash.
Authorized
Participants
transacting
in
Creation
Units
for
cash
may
also
pay
an
additional
variable
charge
to
compensate
the
relevant
fund
for
certain
transaction
costs
(i.e.,
stamp
taxes,
taxes
on
currency
or
other
financial
transactions,
and
brokerage
costs)
and
market
impact
expenses
relating
to
investing
in
portfolio
securities.
Such
variable
charges,
if
any,
are
included
in
shares
sold
in
the
table
above.
To
the
extent
applicable,
to
facilitate
the
timely
settlement
of
orders
for
the
Funds
using
a
clearing
facility
outside
of
the
continuous
net
settlement
process,
the
Funds,
at
their
sole
discretion,
may
permit
an
Authorized
Participant
to
post
cash
as
collateral
in
anticipation
of
the
delivery
of
all
or
a
portion
of
the
applicable
Deposit
Securities
or
Fund
Securities,
as
further
described
in
the
applicable
Authorized
Participant
Agreement.
The
collateral
process
is
subject
to
a
Control
Agreement
among
the
Authorized
Participant,
each
Funds’
custodian,
and
the
Funds.
In
the
event
that
the
Authorized
Participant
fails
to
deliver
all
or
a
portion
of
the
applicable
Deposit
Securities
or
Fund
Securities,
the
Funds
may
exercise
control
over
such
collateral
pursuant
to
the
terms
of
the
Control
Agreement
in
order
to
purchase
the
applicable
Deposit
Securities
or
Fund
Securities.
From
time
to
time,
settlement
of
securities
related
to
in-kind
contributions
or
in-kind
redemptions
may
be
delayed.
In
such
cases,
securities
related
to
in-kind
transactions
are
reflected
as
a
receivable
or
a
payable
in
the
Statements
of
Assets
and
Liabilities.
11.
Subsequent
Events
Management
has
evaluated
the
impact
of
all
subsequent
events
on
the
Funds
through
the
date
the
financial
statements
were
available
to
be
issued
and
has
determined
that
there
were
no
subsequent
events
requiring
adjustment
or
additional
disclosure
in
the
financial
statements.
Year
Ended
08/31/24
Year
Ended
08/31/23
iShares
ETF
Shares
Amount
Shares
Amount
Climate
Conscious
&
Transition
MSCI
USA
(a)
Shares
sold
...............................................
6,850,000
$
388,408,682
43,275,000
$
2,171,705,502
Shares
redeemed
...........................................
(17,950,000
)
(1,009,257,172
)
(125,000
)
(6,613,858
)
(11,100,000
)
$
(620,848,490
)
43,150,000
$
2,165,091,644
ESG
Advanced
MSCI
USA
Shares
sold
...............................................
7,850,000
$
335,482,317
2,400,000
$
75,640,973
Shares
redeemed
...........................................
(3,950,000
)
(172,429,765
)
(1,800,000
)
(61,315,995
)
3,900,000
$
163,052,552
600,000
$
14,324,978
(a)
The
Fund
commenced
operations
on
June
6,
2023.
Report
of
Independent
Registered
Public
Accounting
Firm
Report
of
Independent
Registered
Public
Accounting
Firm
To
the
Board
of
Trustees
of
iShares
Trust
and
Shareholders
of
each
of
the
two
funds
listed
in
the
table
below
Opinions
on
the
Financial
Statements
We
have
audited
the
accompanying
statements
of
assets
and
liabilities,
including
the
schedules
of
investments,
of
each
of
the
funds
listed
in
the
table
below
(two
of
the
funds
constituting
iShares
Trust,
hereafter
collectively
referred
to
as
the
“Funds”)
as
of
August
31,
2024,
the
related
statements
of
operations
and
of
changes
in
net
assets
for
each
of
the
periods
indicated
in
the
table
below,
including
the
related
notes,
and
the
financial
highlights
for
each
of
the
periods
indicated
therein
(collectively
referred
to
as
the
“financial
statements”).
In
our
opinion,
the
financial
statements
present
fairly,
in
all
material
respects,
the
financial
position
of
each
of
the
Funds
listed
in
the
table
below
as
of
August
31,
2024,
the
results
of
each
of
their
operations
and
the
changes
in
each
of
their
net
assets
for
the
periods
indicated
in
the
table
below,
and
each
of
the
financial
highlights
for
each
of
the
periods
indicated
therein,
in
conformity
with
accounting
principles
generally
accepted
in
the
United
States
of
America.
(1)
Statement
of
operations
for
the
year
ended
August
31,
2024,
and
statement
of
changes
in
net
assets
for
the
year
ended
August
31,
2024
and
the
period
June
6,
2023
(commencement
of
operations)
through
August
31,
2023
(2)
Statement
of
operations
for
the
year
ended
August
31,
2024
and
statement
of
changes
in
net
assets
for
each
of
the
two
years
in
the
period
ended
August
31,
2024
Basis
for
Opinions
These
financial
statements
are
the
responsibility
of
the
Funds’
management.
Our
responsibility
is
to
express
an
opinion
on
the
Funds’
financial
statements
based
on
our
audits.
We
are
a
public
accounting
firm
registered
with
the
Public
Company
Accounting
Oversight
Board
(United
States)
(PCAOB)
and
are
required
to
be
independent
with
respect
to
the
Funds
in
accordance
with
the
U.S.
federal
securities
laws
and
the
applicable
rules
and
regulations
of
the
Securities
and
Exchange
Commission
and
the
PCAOB.
We
conducted
our
audits
of
these
financial
statements
in
accordance
with
the
standards
of
the
PCAOB.
Those
standards
require
that
we
plan
and
perform
the
audit
to
obtain
reasonable
assurance
about
whether
the
financial
statements
are
free
of
material
misstatement,
whether
due
to
error
or
fraud.
Our
audits
included
performing
procedures
to
assess
the
risks
of
material
misstatement
of
the
financial
statements,
whether
due
to
error
or
fraud,
and
performing
procedures
that
respond
to
those
risks.
Such
procedures
included
examining,
on
a
test
basis,
evidence
regarding
the
amounts
and
disclosures
in
the
financial
statements.
Our
audits
also
included
evaluating
the
accounting
principles
used
and
significant
estimates
made
by
management,
as
well
as
evaluating
the
overall
presentation
of
the
financial
statements.
Our
procedures
included
confirmation
of
securities
owned
as
of
August
31,
2024
by
correspondence
with
the
custodian,
transfer
agent
and
brokers;
when
replies
were
not
received
from
brokers,
we
performed
other
auditing
procedures.
We
believe
that
our
audits
provide
a
reasonable
basis
for
our
opinions.
/s/PricewaterhouseCoopers
LLP
Philadelphia,
Pennsylvania
October
24
,
2024
We
have
served
as
the
auditor
of
one
or
more
BlackRock
investment
companies
since
2000.
iShares
Climate
Conscious
&
Transition
MSCI
USA
ETF
(1)
iShares
ESG
Advanced
MSCI
USA
ETF
(2)
Important
Tax
Information
(unaudited)
2024
iShares
Annual
Financial
Statements
The
following
amounts,
or
maximum
amounts
allowable
by
law,
are
hereby
designated
as
qualified
dividend
income
for
individuals
for
the
fiscal
year
ended
August
31,
2024:
The
following
amounts,
or
maximum
amounts
allowable
by
law,
are
hereby
designated
as
qualified
business
income
for
individuals
for
the
fiscal
year
ended
August
31,
2024:
The
following
percentages,
or
maximum
percentages
allowable
by
law,
of
ordinary
income
distributions
paid
during
the
fiscal
year
ended August
31,
2024
qualified
for
the
dividends-received
deduction
for
corporate
shareholders:
iShares
ETF
Qualified
Dividend
Income
Climate
Conscious
&
Transition
MSCI
USA
...................................................................................
$
29,219,351
ESG
Advanced
MSCI
USA
..............................................................................................
10,466,213
iShares
ETF
Qualified
Business
Income
Climate
Conscious
&
Transition
MSCI
USA
...................................................................................
$
1,457,025
ESG
Advanced
MSCI
USA
..............................................................................................
1,117,680
iShares
ETF
Dividends-Received
Deduction
Climate
Conscious
&
Transition
MSCI
USA
...................................................................................
95.25
%
ESG
Advanced
MSCI
USA
..............................................................................................
89.60
Premium/Discount
Information
Information
on
the
Fund’s
net
asset
value,
market
price,
premiums
and
discounts,
and
bid-ask
spreads
can
be
found
at
iShares.com
.
Electronic
Delivery
Shareholders
can
sign
up
for
e-mail
notifications
announcing
that
the
shareholder
report
or
prospectus
has
been
posted
on
the
iShares
website
at
iShares.com
.
Once
you
have
enrolled,
you
will
no
longer
receive
prospectuses
and
shareholder
reports
in
the
mail.
To
enroll
in
electronic
delivery:
Go
to
icsdelivery.com
If
your
brokerage
firm
is
not
listed,
electronic
delivery
may
not
be
available.
Please
contact
your
broker-dealer
or
financial
advisor.
Changes
in
and
Disagreements
with
Accountants
Not
applicable.
Proxy
Results
Not
applicable.
Remuneration
Paid
to
Trustees,
Officers,
and
Others
Because
BFA
has
agreed in
the
Investment
Advisory
Agreements
to
cover
all
operating
expenses
of
the
Funds,
subject
to
certain
exclusions as
provided
for
therein,
BFA
pays
the
compensation
to
each
Independent Trustee
for
services
to
the
Funds
from
BFA’s
investment
advisory
fees.
Availability
of
Portfolio
Holdings
Information
A
description
of
the
Trust’s policies
and
procedures
with
respect
to
the
disclosure
of
the
Funds’
portfolio
securities
is
available
in
the
Fund
Prospectus.
The
Fund
discloses its
portfolio
holdings
daily
and
provide
information
regarding its
top
holdings
in
Fund
fact
sheets,
when
available, at
iShares.com
.
Board
Review
and
Approval
of
Investment
Advisory
Contract
2024
iShares
Annual
Financial
Statements
iShares
Climate
Conscious
&
Transition
MSCI
USA
ETF,
iShares
ESG
Advanced
MSCI
USA
ETF
(each
the
“Fund”)
Under
Section
15(c)
of
the
Investment
Company
Act
of
1940
(the
“1940
Act”),
the
Trust’s
Board
of
Trustees
(the
“Board”),
including
a
majority
of
Board
Members
who
are
not
“interested
persons”
of
the
Trust
(as
that
term
is
defined
in
the
1940
Act)
(the
“Independent
Board
Members”),
is
required
annually
to
consider
the
approval
of
the
Investment
Advisory
Agreement
between
the
Trust
and
BFA
(the
“Advisory
Agreement”)
on
behalf
of
the
Fund.
The
Board’s
consideration
entails
a
year-long
process
whereby
the
Board
and
its
committees
(composed
solely
of
Independent
Board
Members)
assess
BlackRock’s
services
to
the
Fund,
including
investment
management;
fund
accounting;
administrative
and
shareholder
services;
oversight
of
the
Fund’s
service
providers;
risk
management
and
oversight;
and
legal
and
compliance
services;
including
the
ability
to
meet
applicable
legal
and
regulatory
requirements.
The
Independent
Board
Members
requested,
and
BFA
provided,
such
information
as
the
Independent
Board
Members,
with
advice
from
independent
counsel,
deemed
reasonably
necessary
to
evaluate
the
Advisory
Agreement.
At
meetings
held
on
May
6,
2024
and
May
17,
2024,
a
committee
composed
of
all
of
the
Independent
Board
Members
(the
“15(c)
Committee”),
with
independent
counsel,
met
with
management
and
reviewed
and
discussed
information
provided
in
response
to
initial
requests
of
the
15(c)
Committee
and/or
its
independent
counsel.
Prior
to
and
in
preparation
for
the
meeting,
the
Board
received
and
reviewed
materials
specifically
relating
to
matters
relevant
to
the
renewal
of
the
Advisory
Agreement.
Following
discussion,
the
15(c)
Committee
subsequently
requested
certain
additional
information,
which
management
agreed
to
provide.
At
a
meeting
held
on
June
4-5,
2024,
the
Board,
including
the
Independent
Board
Members,
reviewed
the
additional
information
provided
by
management
in
response
to
these
requests.
After
extensive
discussions
and
deliberations,
the
Board,
including
all
of
the
Independent
Board
Members,
approved
the
continuance
of
the
Advisory
Agreement
for
the
Fund,
based
on
a
review
of
qualitative
and
quantitative
information
provided
by
BFA
and
their
cumulative
experience
as
Board
Members.
The
Board
noted
its
satisfaction
with
the
extent
and
quality
of
information
provided
and
its
frequent
interactions
with
management,
as
well
as
the
detailed
responses
and
other
information
provided
by
BFA.
The
Independent
Board
Members
were
advised
by
their
independent
counsel
throughout
the
process,
including
about
the
legal
standards
applicable
to
their
review.
In
approving
the
continuance
of
the
Advisory
Agreement
for
the
Fund,
the
Board,
including
the
Independent
Board
Members,
considered
various
factors,
including:
(i)
the
expenses
and
performance
of
the
Fund;
(ii)
the
nature,
extent
and
quality
of
the
services
provided
by
BFA;
(iii)
the
costs
of
services
provided
to
the
Fund
and
profits
realized
by
BFA
and
its
affiliates;
(iv)
potential
economies
of
scale
and
the
sharing
of
related
benefits;
(v)
the
fees
and
services
provided
for
other
comparable
funds/accounts
managed
by
BFA
and
its
affiliates;
and
(vi)
other
benefits
to
BFA
and/or
its
affiliates.
The
Board
Members
did
not
identify
any
particular
information
or
any
single
factor
as
determinative,
and
each
Board
Member
may
have
attributed
different
weights
to
the
various
matters
and
factors
considered.
The
material
factors,
considerations
and
conclusions
that
formed
the
basis
for
the
Board,
including
the
Independent
Board
Members,
to
approve
the
continuance
of
the
Advisory
Agreement
are
discussed
below.
Expenses
and
Performance
of
the
Fund:
The
Board
reviewed
statistical
information
prepared
by
Broadridge
Financial
Solutions,
Inc.
(“Broadridge”),
an
independent
provider
of
investment
company
data,
regarding
the
expense
ratio
components,
including
gross
and
net
total
expenses,
fees
and
expenses
of
other
fund(s)
in
which
the
Fund
invests
(if
applicable),
and
waivers/reimbursements
(if
applicable)
of
the
Fund
in
comparison
with
the
same
information
for
other
ETFs,
objectively
selected
by
Broadridge
as
comprising
the
Fund’s
applicable
expense
peer
group
pursuant
to
Broadridge’s
proprietary
ETF
methodology
(the
“Peer
Group”).
The
Board
was
provided
with
a
detailed
description
of
the
proprietary
ETF
methodology
used
by
Broadridge
to
determine
the
Fund’s
Peer
Group.
The
Board
noted
that,
due
to
the
limitations
in
providing
comparable
funds
in
the
Peer
Group,
the
statistical
information
provided
in
Broadridge’s
report
may
or
may
not
provide
meaningful
direct
comparisons
to
the
Fund
in
all
instances.
The
Board
also
noted
that
the
investment
advisory
fee
rate
and
overall
expenses
(net
of
any
waivers
and
reimbursements)
for
the
Fund
were
lower
than
the
median
of
the
investment
advisory
fee
rates
and
overall
expenses
(net
of
any
waivers
and
reimbursements)
of
the
funds
in
its
Peer
Group,
excluding
iShares
funds.
In
addition,
to
the
extent
that
any
of
the
comparison
funds
included
in
the
Peer
Group,
excluding
iShares
funds,
track
the
same
index
as
the
Fund,
Broadridge
also
provided,
and
the
Board
reviewed,
a
comparison
of
the
Fund’s
performance
for
the
one-year,
three-year,
five-year,
ten-year,
and
since
inception
periods,
as
applicable,
and
for
the
quarter
ended
December
31,
2023,
to
that
of
such
relevant
comparison
fund(s)
for
the
same
periods.
The
Board
noted
that
the
Fund
seeks
to
track
its
specified
underlying
index
and
that,
during
the
year,
the
Board
received
periodic
reports
on
the
Fund’s
short-
and
longer-term
performance
in
comparison
with
its
underlying
index.
Such
periodic
comparative
performance
information,
including
additional
detailed
information
as
requested
by
the
Board,
was
also
considered.
The
Board
noted
that
the
Fund
generally
performed
in
line
with
its
underlying
index
over
the
relevant
periods.
Based
on
this
review,
the
other
relevant
factors
and
information
considered
at
the
meeting,
and
their
general
knowledge
of
ETF
pricing,
the
Board
concluded
that
the
investment
advisory
fee
rate
and
expense
level
and
the
historical
performance
of
the
Fund
supported
the
Board’s
approval
of
the
continuance
of
the
Advisory
Agreement
for
the
coming
year.
Nature,
Extent
and
Quality
of
Services
Provided:
Based
on
management’s
representations,
including
information
about
ongoing
enhancements
and
initiatives
with
respect
to
the
iShares
product
line
and
BFA’s
business,
including
with
respect
to
capital
markets
support
and
analysis,
technology,
portfolio
management,
product
design
and
quality,
compliance
and
risk
management,
global
public
policy
and
other
services,
the
Board
expected
that
there
would
be
no
diminution
in
the
scope
of
services
required
of
or
provided
by
BFA
under
the
Advisory
Agreement
for
the
coming
year
as
compared
with
the
scope
of
services
provided
by
BFA
during
prior
years.
In
reviewing
the
scope
of
these
services,
the
Board
considered
BFA’s
investment
philosophy
and
experience,
noting
that
BFA
and
its
affiliates
have
committed
significant
resources
over
time,
including
during
the
past
year,
to
support
the
iShares
funds
and
their
shareholders
and
have
made
significant
investments
into
the
iShares
business.
The
Board
also
considered
BFA’s
compliance
program
and
its
compliance
record
with
respect
to
the
Fund,
including
related
programs
implemented
pursuant
to
regulatory
requirements.
In
that
regard,
the
Board
noted
that
BFA
reports
to
the
Board
about
portfolio
management
and
compliance
matters
on
a
periodic
basis
in
connection
with
regularly
scheduled
meetings
of
the
Board,
and
on
other
occasions
as
necessary
and
appropriate,
and
has
provided
information
and
made
relevant
officers
and
other
employees
of
BFA
(and
its
affiliates)
available
as
needed
to
provide
further
assistance
with
these
matters.
The
Board
also
reviewed
the
background
and
experience
of
the
persons
responsible
for
the
day-to-day
management
of
the
Fund,
as
well
as
the
resources
available
to
them
in
managing
the
Fund.
In
addition
to
the
above
considerations,
the
Board
reviewed
and
considered
detailed
presentations
regarding
BFA’s
investment
performance,
investment
and
risk
management
processes
and
strategies
provided
at
the
May
6,
2024
meeting
and
throughout
the
year,
and
matters
related
to
BFA’s
portfolio
compliance
program
and
other
compliance
programs
and
services,
as
well
as
BlackRock’s
continued
investments
in
its
ETF
business.
Based
on
review
of
this
information,
and
the
performance
information
discussed
above,
the
Board
concluded
that
the
nature,
extent
and
quality
of
services
provided
to
the
Fund
under
the
Advisory
Agreement
supported
the
Board’s
approval
of
the
continuance
of
the
Advisory
Agreement
for
the
coming
year.
Board
Review
and
Approval
of
Investment
Advisory
Contract
(
continued)
Board
Review
and
Approval
of
Investment
Advisory
Contract
Costs
of
Services
Provided
to
the
Fund
and
Profits
Realized
by
BFA
and
its
Affiliates:
The
Board
reviewed
information
about
the
estimated
profitability
to
BlackRock
in
managing
the
Fund,
based
on
the
fees
payable
to
BFA
and
its
affiliates
(including
fees
under
the
Advisory
Agreement),
and
other
sources
of
revenue
and
expense
to
BFA
and
its
affiliates
from
the
Fund’s
operations
for
the
last
calendar
year.
The
Board
reviewed
BlackRock’s
methodology
for
calculating
estimated
profitability
of
the
iShares
funds,
noting
that
the
15(c)
Committee
and
the
Board
had
focused
on
the
methodology
and
profitability
presentation.
The
Board
recognized
that
profitability
may
be
affected
by
numerous
factors,
including,
among
other
things,
fee
waivers
by
BFA,
the
types
of
funds
managed,
expense
allocations
and
business
mix.
The
Board
thus
recognized
that
calculating
and
comparing
profitability
at
individual
fund
levels
is
challenging.
The
Board
discussed
with
management
the
sources
of
direct
and
ancillary
revenue,
including
the
revenues
to
BTC,
a
BlackRock
affiliate,
from
securities
lending
by
the
Fund.
The
Board
also
discussed
BFA’s
estimated
profit
margin
as
reflected
in
the
Fund’s
profitability
analysis
and
reviewed
information
regarding
potential
economies
of
scale
(as
discussed
below).
Based
on
this
review,
the
Board
concluded
that
the
information
considered
with
respect
to
the
profits
realized
by
BFA
and
its
affiliates
under
the
Advisory
Agreement
and
from
other
relationships
between
the
Fund
and
BFA
and/or
its
affiliates,
if
any,
and
related
costs
of
the
services
provided
as
well
as
the
other
factors
considered
at
the
meeting,
supported
the
Board’s
approval
of
the
continuance
of
the
Advisory
Agreement
for
the
coming
year.
Economies
of
Scale:
The
Board
reviewed
information
and
considered
the
extent
to
which
economies
of
scale
might
be
realized
as
the
assets
of
the
Fund
increase,
noting
that
the
issue
of
potential
economies
of
scale
had
been
focused
on
by
the
15(c)
Committee
and
the
Board
during
their
meetings
and
addressed
by
management.
The
15(c)
Committee
and
the
Board
received
information
regarding
BlackRock’s
historical
estimated
profitability
(as
discussed
above),
including
BFA’s
and
its
affiliates’
estimated
costs
in
providing
services.
The
estimated
cost
information
distinguished,
among
other
things,
between
fixed
and
variable
costs,
and
showed
how
the
level
and
nature
of
fixed
and
variable
costs
may
impact
the
existence
or
size
of
scale
benefits,
with
the
Board
recognizing
that
potential
economies
of
scale
are
difficult
to
measure.
The
15(c)
Committee
and
the
Board
reviewed
information
provided
by
BFA
regarding
the
sharing
of
scale
benefits
with
the
iShares
funds
through
various
means,
including,
as
applicable,
through
breakpoints,
waivers,
or
other
fee
reductions,
as
well
as
through
additional
investment
in
the
iShares
business,
including
enhancements
to
or
the
provision
of
additional
infrastructure
and
services
to
the
iShares
funds
and
their
shareholders
and,
with
respect
to
New
Funds,
set
management
fees
at
levels
that
anticipate
scale
over
time.
The
Board
noted
that
the
Advisory
Agreement
for
the
Fund
did
not
provide
for
breakpoints
in
the
Fund’s
investment
advisory
fee
rate
as
the
assets
of
the
Fund
increase.
However,
the
Board
noted
that
it
would
continue
to
assess
the
appropriateness
of
adding
breakpoints
in
the
future.
The
Board
concluded
that
this
review
of
potential
economies
of
scale
and
the
sharing
of
related
benefits,
as
well
as
the
other
factors
considered
at
the
meeting,
supported
the
Board’s
approval
of
the
continuance
of
the
Advisory
Agreement
for
the
coming
year.
Fees
and
Services
Provided
for
Other
Comparable
Funds/Accounts
Managed
by
BFA
and
its
Affiliates:
The
Board
received
and
considered
information
regarding
the
investment
advisory/management
fee
rates
for
other
funds/accounts
in
the
U.S.
for
which
BFA
(or
its
affiliates)
provides
investment
advisory/management
services,
including
open-end
funds
registered
under
the
1940
Act
(including
sub-advised
funds),
collective
trust
funds
and
institutional
separate
accounts
(collectively,
the
“Other
Accounts”).
The
Board
received
detailed
information
regarding
how
the
Other
Accounts
generally
differ
from
the
Fund,
including
in
terms
of
the
types
of
services
and
generally
more
extensive
character
and
scope
of
services
provided
to
the
Fund,
as
well
as
other
significant
differences.
In
that
regard,
the
Board
considered
that
the
pricing
of
services
to
institutional
clients
is
typically
based
on
a
number
of
factors
beyond
the
nature
and
extent
of
the
specific
services
to
be
provided
and
often
depends
on
the
overall
relationship
between
the
client
and
its
affiliates
and
the
adviser
and
its
affiliates.
In
addition,
the
Board
considered
the
relative
complexity
and
inherent
risks
and
challenges
of
managing
and
providing
other
services
to
the
Fund,
as
a
publicly
traded
investment
vehicle,
as
compared
to
the
Other
Accounts,
particularly
those
that
are
institutional
clients,
in
light
of
differing
regulatory
requirements
and
client-imposed
mandates.
The
Board
acknowledged
BFA’s
representation
that
the
iShares
funds
are
fundamentally
different
investment
vehicles
from
the
Other
Accounts
in
its
consideration
of
relevant
qualitative
and
quantitative
comparative
information
provided.
The
Board
noted
that
BFA
and
its
affiliates
do
not
manage
Other
Accounts
with
substantially
the
same
investment
objective
and
strategy
as
the
Fund
and
that
track
the
same
index
as
the
Fund.
The
Board
also
acknowledged
management’s
assertion
that,
for
certain
iShares
funds,
and
for
client
segmentation
purposes,
BlackRock
has
launched
an
iShares
fund
that
may
provide
a
similar
investment
exposure
at
a
lower
investment
advisory
fee
rate.
The
Board
considered
the
“all-inclusive”
nature
of
the
Fund’s
advisory
fee
structure,
and
the
Fund’s
expenses
borne
by
BFA
under
this
arrangement
and
noted
that
the
investment
advisory
fee
rate
under
the
Advisory
Agreement
for
the
Fund
was
generally
higher
than
the
investment
advisory/management
fee
rates
for
certain
of
the
Other
Accounts
(particularly
institutional
clients)
and
concluded
that
the
differences
appeared
to
be
consistent
with
the
factors
discussed.
Other
Benefits
to
BFA
and/or
its
Affiliates:
The
Board
reviewed
other
benefits
or
ancillary
revenue
received
by
BFA
and/or
its
affiliates
in
connection
with
the
services
provided
to
the
Fund
by
BFA,
both
direct
and
indirect,
including,
but
not
limited
to,
payment
of
revenue
to
BTC,
the
Fund’s
securities
lending
agent,
for
loaning
portfolio
securities,
as
applicable
(which
was
included
in
the
profit
margins
reviewed
by
the
Board
pursuant
to
BFA’s
estimated
profitability
methodology),
payment
of
advisory
fees
or
other
fees
to
BFA
(or
its
affiliates)
in
connection
with
any
investments
by
the
Fund
in
other
funds
(including
cash
sweep
vehicles)
for
which
BFA
(or
its
affiliates)
provides
investment
advisory
services
or
other
services,
and
BlackRock’s
profile
in
the
investment
community.
The
Board
further
considered
other
direct
benefits
that
might
accrue
to
BFA,
including
actual
and
potential
reductions
in
the
Fund’s
expenses
that
are
borne
by
BFA
under
the
“all-inclusive”
management
fee
arrangement,
due
in
part
to
the
size
and
scope
of
BFA’s
investment
operations
servicing
the
Fund
(and
other
funds
in
the
iShares
complex)
as
well
as
in
response
to
a
changing
market
environment.
The
Board
also
reviewed
and
considered
information
provided
by
BFA
concerning
authorized
participant
primary
market
order
processing
services
that
are
provided
by
BlackRock
Investments,
LLC
(“BRIL”),
an
affiliate
of
BFA,
and
paid
for
by
authorized
participants
under
the
ETF
Servicing
Platform.
The
Board
also
noted
the
revenue
received
by
BFA
and/or
its
affiliates
pursuant
to
an
agreement
that
permits
a
service
provider
to
use
certain
portions
of
BlackRock’s
technology
platform
to
service
accounts
managed
by
BFA
and/or
its
affiliates,
including
the
iShares
funds.
The
Board
noted
that
BFA
generally
does
not
use
soft
dollars
or
consider
the
value
of
research
or
other
services
that
may
be
provided
to
BFA
(including
its
affiliates)
in
selecting
brokers
for
portfolio
transactions
for
the
Fund.
The
Board
concluded
that
any
such
ancillary
benefits
would
not
be
disadvantageous
to
the
Fund
and
thus
would
not
alter
the
Board’s
conclusion
with
respect
to
the
appropriateness
of
approving
the
continuance
of
the
Advisory
Agreement
for
the
coming
year.
Conclusion:
Based
on
a
review
of
the
factors
described
above,
as
well
as
such
other
factors
as
deemed
appropriate
by
the
Board,
the
Board,
including
all
of
the
Independent
Board
Members,
determined
that
the
Fund’s
investment
advisory
fee
rate
under
the
Advisory
Agreement
does
not
constitute
a
fee
that
is
so
disproportionately
large
as
to
bear
no
reasonable
relationship
to
the
services
rendered
and
that
could
not
have
been
the
product
of
arm’s-length
bargaining,
and
concluded
to
approve
the
continuance
of
the
Advisory
Agreement
for
the
coming
year.
Glossary
of
Terms
Used
in
this
Report
2024
iShares
Annual
Financial
Statements
Portfolio
Abbreviation
NVS
Non-Voting
Shares
REIT
Real
Estate
Investment
Trust
Want
to
know
more?
iShares.com
|
1-800-474-2737
This
report
is
intended
for
the
Fund’s
shareholders.
It
may
not
be
distributed
to
prospective
investors
unless
it
is
preceded
or
accompanied
by
the
current
prospectus.
Investing
involves
risk,
including
possible
loss
of
principal.
The
iShares
Funds
are
distributed
by
BlackRock
Investments,
LLC
(together
with
its
affiliates,
“BlackRock”).
The
iShares
Funds
are
not
sponsored,
endorsed,
issued,
sold
or
promoted
by
MSCI
Inc.,
nor
does
this
company
make
any
representation
regarding
the
advisability
of
investing
in
the
iShares
Funds.
BlackRock
is
not
affiliated
with
the
company
listed
above.
©2024
BlackRock,
Inc.
All
rights
reserved.
iSHARES
and
BLACKROCK
are
registered
trademarks
of
BlackRock,
Inc.
or
its
subsidiaries.
All
other
marks
are
the
property
of
their
respective
owners.
Item 8 – Changes in and Disagreements with Accountants for Open-End Management Investment Companies – See Item 7
Item 9 – Proxy Disclosures for Open-End Management Investment Companies – See Item 7
Item 10 – Remuneration Paid to Directors, Officers, and Others of Open-End Management Investment Companies – See Item 7
Item 11 – Statement Regarding Basis for Approval of Investment Advisory Contract – See Item 7
Item 12 – Disclosure of Proxy Voting Policies and Procedures for Closed-End Management Investment Companies – Not Applicable
Item 13 – Portfolio Managers of Closed-End Management Investment Companies – Not Applicable
Item 14 – Purchases of Equity Securities by Closed-End Management Investment Company and Affiliated Purchasers – Not Applicable
Item 15 – Submission of Matters to a Vote of Security Holders – There have been no material changes to these procedures.
Item 16 – Controls and Procedures
(a) The registrant’s principal executive and principal financial officers, or persons performing similar functions, have concluded that the registrant’s disclosure controls and procedures (as defined in Rule 30a-3(c) under the Investment Company Act of 1940, as amended (the “1940 Act”)) are effective as of a date within 90 days of the filing date of this report based on the evaluation of these controls and procedures required by Rule 30a-3(b) under the 1940 Act and Rule 13a-15(b) or 15d-15(b) under the Securities Exchange Act of 1934, as amended.
(b) There were no changes in the registrant’s internal control over financial reporting (as defined in Rule 30a-3(d) under the 1940 Act) that occurred during the period covered by this report that have materially affected, or are reasonably likely to materially affect, the registrant’s internal control over financial reporting.
Item 17 – Disclosure of Securities Lending Activities for Closed-End Management Investment Companies –Not Applicable
Item 18 – Recovery of Erroneously Awarded Compensation – Not Applicable
Item 19 – Exhibits attached hereto
(a)(2) Any policy required by the listing standards adopted pursuant to Rule 10D-1 under the Exchange Act (17 CFR 240.10D-1) by the registered national securities exchange or registered national securities association upon which the registrant’s securities are listed – Not Applicable
(a)(4) Any written solicitation to purchase securities under Rule 23c-1 – Not Applicable
(a)(5) Change in registrant’s independent public accountant – Not Applicable
Pursuant to the requirements of the Securities Exchange Act of 1934 and the Investment Company Act of 1940, the registrant has duly caused this report to be signed on its behalf by the undersigned, thereunto duly authorized.
iShares Trust
By: /s/ Jessica Tan____________________
Jessica Tan
President (principal executive officer) of
iShares Trust
Date: October 24, 2024
Pursuant to the requirements of the Securities Exchange Act of 1934 and the Investment Company Act of 1940, this report has been signed below by the following persons on behalf of the registrant and in the capacities and on the dates indicated.
By: /s/ Jessica Tan____________________
Jessica Tan
President (principal executive officer) of
iShares Trust
Date: October 24, 2024
By: /s/ Trent Walker___________________
Trent Walker
Treasurer and Chief Financial Officer (principal financial officer) of
iShares Trust
Date: October 24, 2024