Table of Contents
Exhibit 3
| (Mark One) | ||
| o | REGISTRATION STATEMENT PURSUANT TO SECTION 12(b) OR 12(g) OF THE SECURITIES EXCHANGE ACT OF 1934 | |
| or | ||
| þ | ANNUAL REPORT PURSUANT TO SECTION 13 OR 15(d) OF THE SECURITIES EXCHANGE ACT OF 1934 | |
| For the fiscal year ended December 31, 2004 | ||
| or | ||
o | TRANSITION REPORT PURSUANT TO SECTION 13 OR 15(d) OF THE SECURITIES EXCHANGE ACT OF 1934 | |
| For the transition period from to | ||
STATS ChipPAC Ltd.
| Republic of Singapore | 10 Ang Mo Kio Street 65, | |
(Jurisdiction of Incorporation or Organization) | #05-17/20 Techpoint, | |
| Singapore 569059 | ||
| (Address of Principal Executive Offices) |
1
Table of Contents
| Item 1. | Identity of Directors, Senior Management and Advisers |
| Item 2. | Offer Statistics and Expected Timetable |
| Item 3. | Key Information |
| A. | Selected Financial Data |
2
Table of Contents
| Year Ended December 31, | ||||||||||||||||||||||
| 2000 | 2001 | 2002 | 2003 | 2004 | ||||||||||||||||||
| (In thousands of US$, except per ordinary share and per ADS data) | ||||||||||||||||||||||
Income Statement Data: | ||||||||||||||||||||||
| Net revenues | $ | 331,271 | $ | 145,866 | $ | 225,738 | $ | 380,691 | $ | 769,121 | ||||||||||||
| Cost of revenues | (231,944 | ) | (217,789 | ) | (247,943 | ) | (328,014 | ) | (643,540 | ) | ||||||||||||
| Gross profit (loss) | 99,327 | (71,923 | ) | (22,205 | ) | 52,677 | 125,581 | |||||||||||||||
| Operating expenses: | ||||||||||||||||||||||
| Selling, general and administrative(1) | 41,246 | 37,065 | 36,693 | 36,475 | 84,965 | |||||||||||||||||
| Research and development | 14,636 | 15,160 | 18,856 | 15,295 | 17,637 | |||||||||||||||||
| Goodwill impairment(2) | — | — | — | — | 453,000 | |||||||||||||||||
| Equipment impairments(3) | — | 23,735 | 14,666 | — | — | |||||||||||||||||
| Prepaid leases written off(4) | — | 3,145 | 764 | — | — | |||||||||||||||||
| Other general expenses (income), net | (22 | ) | 101 | 548 | 374 | (464 | ) | |||||||||||||||
| Total operating expenses | 55,860 | 79,206 | 71,527 | 52,144 | 555,138 | |||||||||||||||||
| Operating income (loss) | 43,467 | (151,129 | ) | (93,732 | ) | 533 | (429,557 | ) | ||||||||||||||
| Other income (expense): | ||||||||||||||||||||||
| Interest income (expense), net | 8,214 | 5,222 | (5,143 | ) | (9,209 | ) | (24,386 | ) | ||||||||||||||
| Foreign currency exchange gain (loss) | 2,018 | 775 | (512 | ) | 1,634 | (1,122 | ) | |||||||||||||||
| Other non-operating income (expense), net | 3,525 | 1,990 | 3,419 | 7,570 | (936 | ) | ||||||||||||||||
| Total other income (expense), net | 13,757 | 7,987 | (2,236 | ) | (5 | ) | (26,444 | ) | ||||||||||||||
| Income (loss) before income taxes | 57,224 | (143,142 | ) | (95,968 | ) | 528 | (456,001 | ) | ||||||||||||||
| Income tax benefit (expense) | (2,865 | ) | 8,810 | 7,163 | (705 | ) | (7,894 | ) | ||||||||||||||
| Income (loss) before minority interest | $ | 54,359 | $ | (134,332 | ) | $ | (88,805 | ) | $ | (177 | ) | $ | (463,895 | ) | ||||||||
| Minority interest | — | $ | 313 | $ | (514 | ) | $ | (1,539 | ) | $ | (3,828 | ) | ||||||||||
| Net income (loss) | $ | 54,359 | $ | (134,019 | ) | $ | (89,319 | ) | $ | (1,716 | ) | $ | (467,723 | ) | ||||||||
3
Table of Contents
| Year Ended December 31, | |||||||||||||||||||||
| 2000 | 2001 | 2002 | 2003 | 2004 | |||||||||||||||||
| (In thousands of US$, except per ordinary share and per ADS data) | |||||||||||||||||||||
| Net income (loss) per ordinary share: | |||||||||||||||||||||
| Basic | $ | 0.06 | $ | (0.14 | ) | $ | (0.09 | ) | $ | (0.00 | ) | $ | (0.33 | ) | |||||||
| Diluted | $ | 0.06 | $ | (0.14 | ) | $ | (0.09 | ) | $ | (0.00 | ) | $ | (0.33 | ) | |||||||
| Net income (loss) per ADS: | |||||||||||||||||||||
| Basic | $ | 0.56 | $ | (1.36 | ) | $ | (0.90 | ) | $ | (0.02 | ) | $ | (3.27 | ) | |||||||
| Diluted | $ | 0.56 | $ | (1.36 | ) | $ | (0.90 | ) | $ | (0.02 | ) | $ | (3.27 | ) | |||||||
| Ordinary shares (in thousands) used in per ordinary share calculation: | |||||||||||||||||||||
| Basic | 962,828 | 989,083 | 991,549 | 1,005,374 | 1,428,954 | ||||||||||||||||
| Diluted | 970,631 | 989,083 | 991,549 | 1,005,374 | 1,428,954 | ||||||||||||||||
| ADSs (in thousands) used in per ADS calculation: | |||||||||||||||||||||
| Basic | 96,283 | 98,908 | 99,155 | 100,537 | 142,895 | ||||||||||||||||
| Diluted | 97,063 | 98,908 | 99,155 | 100,537 | 142,895 | ||||||||||||||||
| Year Ended December 31, | ||||||||||||||||||||
| 2000 | 2001 | 2002 | 2003 | 2004 | ||||||||||||||||
| (In thousands of US$, except share data) | ||||||||||||||||||||
Balance Sheet Data: | ||||||||||||||||||||
| Cash and cash equivalents | $ | 141,733 | $ | 115,214 | $ | 167,661 | $ | 313,163 | �� | $ | 227,509 | |||||||||
| Working capital (deficit) | 188,521 | 109,447 | 165,851 | 328,583 | 124,028 | |||||||||||||||
| Total assets | 711,758 | 576,578 | 721,968 | 993,852 | 2,271,702 | |||||||||||||||
| Current installments of obligations under capital leases | — | 2,564 | 6,558 | 5,296 | 7,587 | |||||||||||||||
| Short-term borrowings and current installments of long-term debt | 14,799 | 14,045 | 21,588 | 6,841 | 174,281 | |||||||||||||||
| Obligation under capital leases, excluding current installments | — | 7,689 | 5,520 | 812 | 10,771 | |||||||||||||||
| Long-term debt, excluding current installments | 29,599 | 14,045 | 218,370 | 358,789 | 642,175 | |||||||||||||||
| Shareholders’ equity | 585,197 | 452,795 | 366,512 | 475,956 | 1,159,350 | |||||||||||||||
| Share capital | 159,461 | 159,961 | 160,295 | 172,434 | 298,233 | |||||||||||||||
| Ordinary shares outstanding (in thousands) | 986,172 | 989,683 | 992,115 | 1,076,620 | 1,944,330 | |||||||||||||||
| (1) | Includes stock-based compensation expenses of $448,000, $1,024,000, $60,000, $97,000 and $658,000 in 2000, 2001, 2002, 2003 and 2004, respectively. |
| (2) | We recorded impairment charges of $453,000,000 in 2004 on our goodwill associated with purchase accounting for the acquisition of ChipPAC. |
| (3) | The impairment charges were recognized in 2001 in accordance with SFAS No. 121, “Accounting for the Impairment of Long-Lived Assets and for Long-Lived Assets to be Disposed Of” and in 2002 in accordance with SFAS No. 144, “Accounting for the Impairment or Disposal of Long-Lived Assets.” |
| (4) | We recorded impairment charges of $3,145,000 in 2001 and $764,000 in 2002 to write off prepaid leases for testers for which we had no expectation of future use. |
4
Table of Contents
| B. | Capitalization and Indebtedness |
| C. | Reasons for the Offer and Use of Proceeds |
| D. | Risk Factors |
| • | integration of the two companies’ products and services, sales and marketing, information and software systems and other operations; | |
| • | retention and integration of management and other employees; | |
| • | achievement of the expected cost savings; | |
| • | coordination of ongoing and future research and development efforts and marketing activities; | |
| • | retention of existing customers of both companies and attraction of additional customers; | |
| • | retention of strategic partners of each company and attraction of new strategic partners; | |
| • | developing and maintaining uniform standards, controls, procedures and policies; | |
| • | minimization of disruption of the combined company’s ongoing business and distraction of its management; and | |
| • | limiting expenses related to integration. |
| • | the impairment of relationships with employees, customers and business partners; | |
| • | our ability to attract and retain key management, sales, marketing and technical personnel; | |
| • | a delay in, or cancellation of, purchasing decisions by current and prospective customers and business partners; | |
| • | the potential disruption of the combined company’s ongoing business and distraction of its management; | |
| • | the difficulty of incorporating acquired technology and rights into the products and service offerings of the combined company; and | |
| • | unanticipated expenses and potential delays related to the integration of STATS and ChipPAC. |
5
Table of Contents
| • | rapid technological change; | |
| • | evolving industry standards; | |
| • | intense competition; and | |
| • | fluctuations in end-user demand. |
6
Table of Contents
| • | overall industry conditions; | |
| • | installation of new equipment in anticipation of future business; | |
| • | the level of customer orders; | |
| • | operating efficiencies; | |
| • | mechanical failure; | |
| • | disruption of operations due to expansion of operations, introduction of new packages or relocation of equipment; | |
| • | disruption in supply of raw materials; | |
| • | changes in product mix; and | |
| • | fire or other natural disasters. |
7
Table of Contents
| • | general economic conditions in the semiconductor industry; | |
| • | a shift by integrated device manufacturers, or IDMs, between internal and outsourced test and packaging services; | |
| • | general economic conditions in the markets addressed by end-users of semiconductors; | |
| • | the seasonality of the semiconductor industry; | |
| • | the short-term nature of our customers’ commitments; | |
| • | the rescheduling or cancellation of large orders; | |
| • | the timing and volume of orders relative to our capacity; | |
| • | changes in capacity utilization; | |
| • | the erosion of the selling prices of packages; | |
| • | changes in our product mix; | |
| • | the rescheduling, cancellation and timing of expenditures in anticipation of future orders; | |
| • | disruptions caused by the installation of new equipment; | |
| • | the ability to obtain adequate equipment and materials on a timely and cost-effective basis; | |
| • | any exposure to currency and interest rate fluctuations that may not be adequately covered under our hedging policy; | |
| • | weakness in the supply of wafers; | |
| • | loss of key personnel or the shortage of available skilled workers; and | |
| • | changes in effective tax rates. |
8
Table of Contents
9
Table of Contents
| • | contaminants in the manufacturing environment; | |
| • | human error; | |
| • | equipment malfunction; | |
| • | defective raw materials; or | |
| • | defective plating services. |
10
Table of Contents
| • | limit the ability of our China subsidiaries to pay dividends or require us to seek consents for the payment of dividends, upon which we rely in order to pay the interest on the convertible notes; | |
| • | increase our vulnerability to general adverse economic and industry conditions; | |
| • | limit our ability to pursue our growth plan; | |
| • | require us to dedicate a substantial portion of our cash flow from operations to payments on our debt, thereby reducing the availability of our cash flow to fund capital expenditures, working capital and other general corporate purposes; and | |
| • | limit our flexibility in planning for, or reacting to, changes in our business and our industry. |
11
Table of Contents
| • | incur additional debt and issue certain preferred stock; | |
| • | consolidate or merge with another entity; | |
| • | create liens; | |
| • | pay dividends, repurchase stock and make other distributions; | |
| • | prepay subordinated debt; | |
| • | make investments and other restricted payments; | |
| • | enter into sale and leaseback transactions; | |
| • | sell assets; and | |
| • | enter into transactions with affiliates. |
12
Table of Contents
| • | increasing our vulnerability to general adverse economic and industry conditions by limiting our flexibility in planning for, or reacting to, changes in the business and the industry in which we operate; | |
| • | requiring us to dedicate a substantial portion of our cash flow from operations to payments on our indebtedness, thus reducing the availability of cash flow to fund working capital, capital expenditures, research and development efforts and other general corporate purposes; | |
| • | placing us at a competitive disadvantage relative to our competitors that have less leverage; and | |
| • | limiting, along with the financial and other restrictive covenants in the indebtedness, our ability to borrow additional funds. |
| • | our ability to identify suitable opportunities for investment or acquisition; | |
| • | our ability to finance any future acquisition or investment on terms acceptable to us or at all; | |
| • | whether we are able to reach an acquisition or investment agreement on terms that are satisfactory to us or at all; | |
| • | the extent to which we are able to exercise control over the acquired company; |
13
Table of Contents
| • | the economic, business or other strategic objectives and goals of the acquired company compared to those of our company; and | |
| • | our ability to successfully integrate the acquired company or business with our business. |
| • | their desire to realize higher utilization of their existing test and packaging capacity; | |
| • | their unwillingness to disclose proprietary technology; | |
| • | their possession of more advanced packaging and testing technologies; and | |
| • | the guaranteed availability of their own packaging and test capacity. |
14
Table of Contents
| • | stop using certain processes or other intellectual property; | |
| • | cease manufacturing, using, importing or selling infringing packages; | |
| • | pay substantial damages; | |
| • | develop non-infringing technologies; or | |
| • | attempt to acquire licenses to use the infringed technology. |
15
Table of Contents
| • | the election of directors; | |
| • | the merger or consolidation of our company with any other entity; | |
| • | any sale of all or substantially all of our assets; and | |
| • | the timing and payment of dividends. |
16
Table of Contents
17
Table of Contents
18
Table of Contents
| • | regulatory limitations imposed by foreign governments; | |
| • | fluctuations in currency exchange rates; | |
| • | political, military and terrorist risks; | |
| • | disruptions or delays in shipments caused by customs brokers or government agencies; | |
| • | unexpected changes in regulatory requirements, tariffs, customs, duties and other trade barriers; | |
| • | difficulties in staffing and managing foreign operations; and | |
| • | potentially adverse tax consequences resulting from changes in tax laws. |
19
Table of Contents
| Item 4. | Information On Our Company |
| A. | History and Development of Our Company |
| B. | Business Overview |
| • | Packaging services: for leaded, power and array packages designed to provide customers with a broad range of packaging solutions and full backend turnkey services for a wide variety of electronics applications. We also provide redistribution and wafer bumping services. As part of customer support on packaging services, we also offer package design, electrical, mechanical and thermal simulation, measurement and design of lead-frames and substrates; |
20
Table of Contents
| • | Test services: including wafer probe and final testing, on a diverse selection of test platforms, covering the major test platforms in the industry. We have expertise in testing a broad variety of semiconductors, especially mixed-signal and high-performance digital devices. We also offer test-related services such as burn-in process support, reliability testing, thermal and electrical characterization, dry pack and tape and reel; and | |
| • | Pre-production and post-production services: such as package development, test software and related hardware development, warehousing and drop shipment services. |
21
Table of Contents
| Semiconductor Manufacturing Process |
| • | wafer fabrication, including wafer probe; | |
| • | assembly of bare semiconductors, or die, into finished semiconductors (referred to as “assembly” or “packaging”); and | |
| • | final testing of assembled semiconductors. |
22
Table of Contents
23
Table of Contents
| STATS ChipPAC | |||||||||||||||||||||||||
| STATS Historical | |||||||||||||||||||||||||
| Year Ended | Pro Forma | Historical | Pro Forma | ||||||||||||||||||||||
| December 31, | Year Ended | Year Ended | Year Ended | ||||||||||||||||||||||
| December 31, | December 31, | December 31, | |||||||||||||||||||||||
| 2001 | 2002 | 2003 | 2003 | 2004 | 2004 | ||||||||||||||||||||
| Packaging — array | 12.1 | % | 14.8 | % | 20.6 | % | 40.9 | % | 40.6 | % | 47.2 | % | |||||||||||||
| Packaging — leaded | 41.7 | 34.0 | 26.9 | 27.1 | 20.9 | 21.0 | |||||||||||||||||||
| Test and other services | 46.2 | 51.2 | 52.5 | 32.0 | 38.5 | 31.8 | |||||||||||||||||||
| Total | 100.0 | % | 100.0 | % | 100.0 | % | 100.0 | % | 100.0 | % | 100.0 | % | |||||||||||||
| Packaging Services |
| Number | |||||||||
| Package Format | of Leads | Description | Typical Applications | ||||||
| Plastic Dual In-line Package | |||||||||
| (PDIP) | 8-40 | Lead-frame package of low pin count with two-side leads and plated-through-hole (PTH) technology | Automotive electronics, power management, audio and remote control | ||||||
| Small Outline Integrated | |||||||||
| Circuit (SOIC) | 8-32 | Lead-frame package of low pin count with two-side leads, and a surface mount technology (SMT) designed for logic, linear, digital and read-only-memory devices | Automotive electronics, power management, audio and remote control | ||||||
24
Table of Contents
| Number | |||||||||
| Package Format | of Leads | Description | Typical Applications | ||||||
| Plastic Leaded Chip Carrier | |||||||||
| (PLCC) | 20-84 | Traditional lead-frame package designed for applications that do not have space constraints and do not require a high number of interconnects | Personal computer (PC), access equipment and multimedia | ||||||
| Micro Small outline Package | |||||||||
| (MSOP) | 8-10 | Lead-frame package of very low pin count with thickness below 1.0mm designed for logic, analog and mixed-signal devices such as analog and operation amplifiers, controllers and drivers, logic, memory and radio frequency (RF)/ wireless devices | Mobile phone, mass storage, multimedia and PDA | ||||||
| Shrink Small Outline | |||||||||
| Package (SSOP) | 36-56 | Traditional lead-frame package designed for logic, analog and mixed-signal devices such as Flash, SRAM, EPROM, EEPROM and DRAM | PC, mass storage and multimedia | ||||||
| Thin Shrink Small Outline | |||||||||
| Package (TSSOP) | 8-56 | Traditional lead-frame package with thickness below 1.0mm designed for logic, analog and mixed-signal devices such as Flash, SRAM, EPROM, EEPROM and DRAM | Mobile phone, mass storage, multimedia and PDA | ||||||
| Thin Small Outline Package | |||||||||
| (TSOP) | 28-56 | Traditional lead-frame package with two-side leads, and a SMT designed for memory, RF/wireless, logic, linear and automotive devices | PC, portable electronics, networking equipment and automotive electronics | ||||||
| Thin Quad Flat Package | |||||||||
| (TQFP) | 32-128 | Advanced QFP with thickness of 1.0mm for use in low profile, space constrained applications | Mobile phone, mass storage and multimedia | ||||||
25
Table of Contents
| Number | |||||||||
| Package Format | of Leads | Description | Typical Applications | ||||||
| Low Quad Flat Package | |||||||||
| (LQFP) | 32-208 | Advanced QFP with thickness of 1.4mm for use in low profile, space constrained applications | Mobile phone, mass storage and multimedia | ||||||
| Metric Quad Flat Package | |||||||||
| (MQFP) | 44-240 | Traditional QFP designed for application-specific integrated circuits (ASICs), field programmable gate arrays (FPGAs) and digital signal processors (DSPs) | Access/LAN equipment, multimedia and mass storage | ||||||
| Number | |||||||||
| Package Format | of Leads | Description | Typical Applications | ||||||
| Quad Leadless Package | |||||||||
| (QLPp) | 8-68 | Lead-frame based near chip scale | Mobile phone, PDA, GPS | ||||||
| Bumped Chip Carrier (BCC) | 16-84 | Lead-frame based near chip scale | Mobile phone, PDA, GPS | ||||||
| Lead-frame CSP (LFCSPs) | 8-64 | Lead-frame based near chip scale | Mobile phone, PDA, GPS | ||||||
| Exposed Pad Low Quad Flat | |||||||||
| Package (LQFP-ep) | 48-216 | Thermally enhanced QFP with 30% greater thermal dissipation than MQFP | Access/WAN/LAN equipment and PC/graphics, HDD | ||||||
| Exposed Pad Thin Quad Flat | |||||||||
| Package (TQFP-ep) | 32-100 | Thermally enhanced TQFP with 30% greater thermal dissipation than TQFP | Access/WAN/LAN equipment, PC/graphics, HDD, PDA, GPS and mobile phone | ||||||
| Exposed Drop-in Heat Sink | |||||||||
| Quad Flat Package | |||||||||
| (MQFP-ed) | 128-240 | Thermally enhanced QFP with 60% greater thermal dissipation than MQFP | Access/WAN/LAN equipment and PC/graphics | ||||||
| Drop-in Heat Sink Quad Flat | |||||||||
| Package (MQFP-d) | 64-208 | Thermally enhanced QFP with 30% greater thermal dissipation than MQFP | Access/WAN/LAN equipment and PC/graphics | ||||||
26
Table of Contents
| Number | |||||||||
| Package Format | of Leads | Description | Typical Applications | ||||||
| Exposed Pad Thin Shrink | |||||||||
| Small Outline Package | |||||||||
| (TSSOP-ep) | 16-38 | Thermally enhanced TSSOP with 30% greater thermal dissipation than TSSOP | Mobile phone, mass storage multimedia and PDA | ||||||
| Stacked Die Quad Flat | |||||||||
| Package (LQFP-SD) | 32-208 | Compact multiple die designed for space constrained applications | Mobile phone, PDA, GPS, disk drive and multimedia | ||||||
| Stacked Die Exposed Pad | |||||||||
| Low Quad Flat Package | |||||||||
| (LQFP-ep-SD) | 32-216 | Thermally enhanced LQFP-SD designed for space constrained applications with thickness of 1.4mm and greater thermal dissipation than LQFP-SD | PC, mobile phone, PDA, GPS, disk drive, MP3, pagers and consumer electronics | ||||||
| Stacked Die Exposed Pad | |||||||||
| Thin Quad Flat Package | |||||||||
| (TQFP-ep-SD) | 32-100 | Thermally enhanced with multiple die TQFP designed for space constrained applications with thickness of 1.0mm and greater thermal dissipation than LQFP-SD | PC, mobile phone, PDA, GPS, disk drive, MP3 and consumer electronics | ||||||
27
Table of Contents
| • | smaller size; | |
| • | greater pin count, or number of connections to the printed circuit board; | |
| • | greater reliability; | |
| • | higher power dissipation; | |
| • | better electrical signal integrity; and | |
| • | easier attachment to a printed circuit board. |
| • | Standard BGA. Standard BGA packaging has a grid array of balls on the underside of the integrated circuit, and is used in high-performance applications, like PC chipsets, graphic controllers and DSPs. A BGA generally has greater than 100 pins. | |
| • | Chip-Scale. Chip-scale packaging includes all packages where the package is less than 1.2 times the size of the silicon die. Chip-scale BGA is a substrate (laminate or tape)-based package that is designed for memory devices and other medium pin count semiconductors and requires dense ball arrays in very small package sizes, like wireless telephones and personal digital assistants, video cameras, digital cameras and pagers. | |
| • | System-in-Package. SiP is a family of chip-scale-packages that contain several semiconductor dies along with passive components such as resistors, capacitors and inductors in one package. Dies can be either stacked on top of each other or side by side. This technology allows greater functionality in the same package footprint and thickness without significant cost increase. These packages are used in wireless handsets, consumer products and mobile computing applications. | |
| • | Flip-Chip BGA. Flip-chip BGA packaging, in which the silicon die is directly attached to the substrate using gold or solder bumps instead of wire bonds, provides the most dense interconnect with the highest electrical and thermal performance. Flip-chip BGA technology is used in a wide array of applications ranging from consumer products to highly sophisticated ASICs, PC chipsets, graphics and memory packages. |
28
Table of Contents
| Number of | ||||||
| Package Format | Balls | Description | Typical Applications | |||
| Flip-Chip Low Profile Fine Pitch BGA (fcLFBGA) | 49-144 | CSP BGA with Flip- Chip/bump interconnect, instead of wire bonding | Mobile phone, WAN/LAN equipment | |||
| Flip-Chip BGA (fcBGA) | 225-1152 | BGA with Flip-Chip/bump interconnect instead of wire bonding | DSP, ASIC, FPGA | |||
| Tape based Very Thin Fine Pitch BGA (VFBGA-T) | 81-169 | Thin CSP BGA (<1.0mm) characterized by flex-tape substrate for high density circuits | Mobile phone, PDA and multimedia | |||
| Stacked Die Low Profile Fine Pitch BGA (LFBGA-SD) | 72-409 | Compact multiple die designed for space sensitive applications. Capability to stack up to seven dies in one package | Mobile phone, PDA and multimedia | |||
| Tape Enhanced Plastic base BGA (TBGA) | 208-792 | BGA characterized by a flex- tape substrate mounted on a copper heatspreader. This package has a high thermal performance | WAN/LAN equipment and base station | |||
| Enhanced BGA (EBGA) | 159-1140 | High pin count, thermally enhanced BGA suitable for high power applications which utilize heat sinks for thermal dissipation | WAN/LAN equipment and base station | |||
| Low Profile Fine Pitch BGA (LFBGA) | 16-450 | Smaller and thinner BGA designed for applications which are space constrained and require electrical performance | Mobile phone, PDA, GPS and multimedia | |||
| Plastic Ball Grid Array (PBGA) | 169-1152 | Electrically enhanced BGA package designed for high I/O replacement | Access/LAN equipment, PC/graphics and base station | |||
| Thin Fine Pitch BGA (TFBGA) | 41-280 | CSP BGA characterized by a thin core laminate substrate | Mobile phone, PDA and multimedia | |||
| Exposed Drop-in Heat Spreader Plastic BGA (PBGA-H) | 208-841 | Thermally Enhanced PBGA with 20% greater thermal dissipation than PBGA | Access/LAN/PC/graphics and base station equipment | |||
| Multi Chip Module Plastic BGA (PBGA-MC) | 80-600 | BGA integrated with two or more multiple die within a PBGA | Access/LAN/PC/graphics and base station equipment |
29
Table of Contents
| Test Services |
30
Table of Contents
| • | Burn-in process support. Burn-in is the process of electrically stressing semiconductors, usually at high temperature and voltage, for a period of time long enough to cause the failure of marginal semiconductors. During burn-in process support, we perform an analysis of burn-in rejects in order to determine the cause of failure. | |
| • | Reliability testing. Reliability testing is the process of testing a semiconductor to evaluate its life span. It is performed on a sample of devices that have passed final testing. | |
| • | Thermal and electrical characterization. Thermal and electrical characterization is the process of testing a semiconductor for performance consistency under thermal and electrical stress. | |
| • | Dry pack. Dry pack is the process of baking the semiconductors in order to prevent the failure of any semiconductors due to exposure to moisture during shipping. We “dry pack” many of our packaged integrated circuits in specially sealed, environmentally secure containers. |
| Pre-production and Post-production Services |
31
Table of Contents
| STATS ChipPAC Test Services, Inc. |
32
Table of Contents
| • | Land Grid Array (LGA); | |
| • | System-in-Package LFBGA (LFBGA-SiP); | |
| • | System-in-Package LGA (LGA-SiP); | |
| • | Flip-Chip BGA with Buildup Substrate and Heat Sink (fcBGA-H); | |
| • | Lead free Flip-Chip Land Grid Array (fcLGA); | |
| • | Wafer Level CSP (WLCSP); | |
| • | Thin Quad Leadless Package (UQLPp); | |
| • | Chip Scale Module Package (LFBGA-CSMP, fcLGA-CSMP); | |
| • | Low profile, Fine pitch BGA with Heatspreader (LFBGA-H); |
33
Table of Contents
| • | Redistributed wafer bumping (RDL); | |
| • | Dual Row Leadframe CSP (LFCSP-dr); | |
| • | 0.4mm Leadframe CSP; | |
| • | Dual Row Quad Leadless Package (QLPp-dr); | |
| • | Molded multi-die chip scale package family with the following chip-stack combinations in package profile thickness ranging from 0.8 to 1.4mm (LF/TF/VFBGA): |
| • | Two-chip stack, same chip size; | |
| • | Three-chip stack, “pyramid stack”; | |
| • | Three-chip stack with the two chip same size; | |
| • | Four-chip stack, “pyramid stack”; | |
| • | Four-chip stack with two chips same size; | |
| • | Five-chip stack, “pyramid stack”; | |
| • | Five-chip stack with three chips same size; | |
| • | Six-chip stack, “pyramid stack”; | |
| • | Six-chip stack with three chips same size; and | |
| • | Seven-chip stack with four chips same size; |
| • | Lead-frame chip scale package (LFCSPtm); | |
| • | Bumped Chip Carrier package family (BCC, BCC+, BCC++); | |
| • | “Gigabit-Green-Gold-to-Gold” flip chip interconnection package family of CSPs and BGAs (G4tm); | |
| • | Higher thermal performance PBGA with embedded heatslug (PBG-H); | |
| • | Thermally enhanced ball grid array family with integrated passive components (PBGA-H-SiP); | |
| • | Flip-Chip Multi Package Module family module (fcBGA-MP); | |
| • | Flip-Chip BGA with High Lead bumping (fcBGA-Hi Lead); | |
| • | Enhanced BGA with Multi Cavity (EBGA-MC); | |
| • | Flip-Chip on lead-frame substrate (fcLFCSPs); | |
| • | Package-in-Package (PiP) stacking — LFBGA-PiP; and | |
| • | Package-on-Package (PoP) — LFBGA-PoP. |
34
Table of Contents
| STATS ChipPAC | |||||||||||||||||||||||||
| STATS Historical | |||||||||||||||||||||||||
| Year Ended | Pro Forma | Historical | Pro Forma | ||||||||||||||||||||||
| December 31, | Year Ended | Year Ended | Year Ended | ||||||||||||||||||||||
| December 31, | December 31, | December 31, | |||||||||||||||||||||||
| 2001 | 2002 | 2003 | 2003 | 2004 | 2004 | ||||||||||||||||||||
| Communications | 61.3 | % | 53.4 | % | 58.3 | % | 50.2 | % | 60.1 | % | 57.9 | % | |||||||||||||
| Personal computers | 34.9 | 31.2 | 29.9 | 23.6 | 22.8 | 21.1 | |||||||||||||||||||
| Consumer and others | 3.8 | 15.4 | 11.8 | 26.2 | 17.1 | 21.0 | |||||||||||||||||||
| Total | 100.0 | % | 100.0 | % | 100.0 | % | 100.0 | % | 100.0 | % | 100.0 | % | |||||||||||||
| STATS ChipPAC | |||||||||||||||||||||||||
| STATS Historical | |||||||||||||||||||||||||
| Year Ended | Pro Forma | Historical | Pro Forma | ||||||||||||||||||||||
| December 31, | Year Ended | Year Ended | Year Ended | ||||||||||||||||||||||
| December 31, | December 31, | December 31, | |||||||||||||||||||||||
| 2001 | 2002 | 2003 | 2003 | 2004 | 2004 | ||||||||||||||||||||
| United States of America | 78.4 | % | 80.8 | % | 81.3 | % | 83.7 | % | 77.2 | % | 77.4 | % | |||||||||||||
| Europe | 13.0 | 6.2 | 4.7 | 3.3 | 4.6 | 4.3 | |||||||||||||||||||
| Asia | 8.6 | 13.0 | 14.0 | 13.0 | 18.2 | 18.3 | |||||||||||||||||||
| Total | 100.0 | % | 100.0 | % | 100.0 | % | 100.0 | % | 100.0 | % | 100.0 | % | |||||||||||||
35
Table of Contents
36
Table of Contents
| Raw Materials |
| Equipment |
37
Table of Contents
| • | Advanced Semiconductor Engineering, Inc. — South Korea, Taiwan, Malaysia, Hong Kong and the United States; | |
| • | Amkor Technology, Inc. — South Korea, Japan, Taiwan, the Philippines and the United States; | |
| • | ASE Test Limited — South Korea, Taiwan, Malaysia, Hong Kong and the United States; and | |
| • | Siliconware Precision Industries Co., Ltd. — Taiwan. |
38
Table of Contents
| • | their desire to realize higher utilization of their existing packaging or test capacity; | |
| • | their unwillingness to disclose proprietary technology; | |
| • | their possession of more advanced packaging or testing technologies; and | |
| • | the guaranteed availability of their own packaging or test capacity. |
39
Table of Contents
| C. | Organizational Structure |
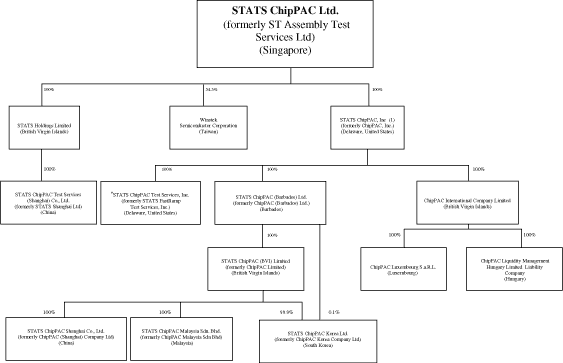
| (1) | STATS ChipPAC, Inc (formerly ST Assembly Test Services, Inc.) was merged into ChipPAC, Inc., effective as of January 20, 2005 and the entity surviving the merger was renamed STATS ChipPAC, Inc. |
40
Table of Contents
| D. | Property, Plants and Equipment |
| Area | Principal Packaging or Services | ||||||||
| Property/Location(1) | (Sq. Feet) | Functions/Services | Provided | ||||||
| Yishun, Singapore(2) | 594,036 | Turnkey packaging and test services, research and development, warehousing services, and drop shipment services | Test services, including mixed- signal and high performance testing, wafer sort and probe, traditional and advanced leaded and array packaging, including BGA, flip-chip packaging, wafer level packaging and CSP, and drop shipment services | ||||||
| Icheon, South Korea | 504,086 | Turnkey packaging and test services, research and development, warehousing services, and drop shipment services | Advanced array packaging such as stacked die, SiP and flip- chip, standard array packaging such as BGA and CSP and test services | ||||||
| Kuala Lumpur, Malaysia(3) | 488,448 | Turnkey packaging and test services, research and development, warehousing services, and drop shipment services | Packaging of discrete power, integrated circuits, leaded packages, test and distribution services | ||||||
| Qing Pu, Shanghai, | |||||||||
| China(4) | 421,748 | Turnkey packaging and test services, research and development, warehousing services, and drop shipment services | Packaging of memory card, leaded packages, CSP, BGA, memory card, wafer probe, test and distribution services | ||||||
| Hsin-Chu Hsien, Taiwan(5) | 220,000 | Test services, research and development, warehousing services, and drop shipment services | Test development, final test, wafer probe and distribution services | ||||||
| Fremont, California, | |||||||||
| United States | 56,320 | Sales, marketing, administration and research and development | Sales, marketing, administration and design review services | ||||||
| Milpitas, California, | |||||||||
| United States | 34,000 | Package design, test facility and sales office | Sales, marketing, administration, design and test engineering services | ||||||
| Ang Mo Kio, Singapore | 31,261 | Corporate executive, administrative, sales and marketing and finance office | Corporate administration and finance, sales and marketing | ||||||
| Pu Dong, Shanghai, China | 20,736 | Test facility | Wafer probe and distribution services | ||||||
| San Diego, California(6), | |||||||||
| United States | 20,000 | Test facility | Test engineering services | ||||||
41
Table of Contents
| Area | Principal Packaging or Services | ||||||||
| Property/Location(1) | (Sq. Feet) | Functions/Services | Provided | ||||||
| Tempe, Arizona, | |||||||||
| United States | 9,300 | Package design, research and development and sales office | Sales, marketing, administration, design and characterization services | ||||||
| (1) | We lease all of our facilities except where otherwise noted. |
| (2) | We own the production assets but lease the land from the statutory housing development board of the Government of Singapore under a long-term lease with an initial term expiring in March 2026 with an option to renew. |
| (3) | We own the building and improvements and lease the land from the State Government of Malaysia, but the land and all buildings on the land will revert to the lessor upon the expiration of the long-term lease in 2086. |
| (4) | We own the building and improvements and lease the land, but the land and all buildings on the land will revert to the lessor upon the expiration of the long-term lease in 2044. |
| (5) | Winstek owns the land and building, which is subject to mortgages and certain other security interests. |
| (6) | Situated within the campus of Conexant Systems Inc. |
| Item 5. | Operating and Financial Review and Prospects |
42
Table of Contents
43
Table of Contents
| (a) longer than expected slow-down in the industry beginning late 2004 as customers corrected excess inventory position. This reduction in demand, coupled with the competitive pressures in the testing and packaging business, affected our short-term earnings expectation; and | |
| (b) a revision of the industry outlook beyond 2005 as compared to the time the merger was announced. |
44
Table of Contents
| • | historical experience for equipment in the China and Malaysia factories | |
| • | expected economic life of assets | |
| • | equipment’s potential re-use among product lines | |
| • | prevailing industry practice | |
| • | consultation with equipment manufacturers |
45
Table of Contents
46
Table of Contents
| Year Ended December 31, | |||||||||||||
| 2002 | 2003 | 2004 | |||||||||||
| Net revenues | |||||||||||||
| Packaging — array | 14.8 | 20.6 | 40.6 | ||||||||||
| Packaging — leaded | 34.0 | 26.9 | 20.9 | ||||||||||
| Test and other services | 51.2 | 52.5 | 38.5 | ||||||||||
| Total net revenues | 100.0 | % | 100.0 | % | 100.0 | % | |||||||
| Gross profit (loss) | (9.8 | ) | 13.8 | 16.3 | |||||||||
| Selling, general and administrative | 16.3 | 9.6 | 11.0 | ||||||||||
| Research and development | 8.4 | 4.0 | 2.3 | ||||||||||
| Goodwill and asset impairments | 6.5 | 0.0 | 58.9 | ||||||||||
| Prepaid leases written off | 0.3 | 0.0 | 0.0 | ||||||||||
| Others, net | 0.2 | 0.1 | (0.1 | ) | |||||||||
| Operating income (loss) | (41.5 | )% | 0.1 | % | (55.9 | )% | |||||||
47
Table of Contents
48
Table of Contents
49
Table of Contents
50
Table of Contents
| Quarter Ended | ||||||||||||||||||||||||||||||||
| Mar-03 | Jun-03 | Sep-03 | Dec-03 | Mar-04 | Jun-04 | Sep-04 | Dec-04 | |||||||||||||||||||||||||
| (In thousands of US $) | ||||||||||||||||||||||||||||||||
| Net revenues | 75,531 | 87,602 | 97,922 | 119,636 | 132,328 | 138,995 | 231,951 | 265,847 | ||||||||||||||||||||||||
| Cost of revenues | 72,015 | 77,680 | 81,517 | 96,802 | 111,949 | 114,358 | 193,600 | 223,634 | ||||||||||||||||||||||||
| Gross profit | 3,516 | 9,922 | 16,405 | 22,834 | 20,379 | 24,637 | 38,351 | 42,213 | ||||||||||||||||||||||||
| Operating expenses: | ||||||||||||||||||||||||||||||||
| Selling, general and administrative | 8,704 | 8,273 | 9,288 | 10,210 | 10,252 | 11,648 | 28,286 | 34,778 | ||||||||||||||||||||||||
| Research and development | 4,492 | 4,033 | 3,550 | 3,220 | 3,086 | 2,903 | 5,781 | 5,867 | ||||||||||||||||||||||||
| Goodwill impairment | — | — | — | — | — | — | — | 453,000 | ||||||||||||||||||||||||
| Others, net | (387 | ) | 281 | 77 | 403 | (37 | ) | (511 | ) | 11 | 73 | |||||||||||||||||||||
| Total operating expenses | 12,809 | 12,587 | 12,915 | 13,833 | 13,301 | 14,040 | 34,078 | 493,718 | ||||||||||||||||||||||||
| Operating income (loss) | (9,293 | ) | (2,665 | ) | 3,490 | 9,001 | 7,078 | 10,597 | 4,273 | (451,505 | ) | |||||||||||||||||||||
| Other income (expenses): | ||||||||||||||||||||||||||||||||
| Interest income (expenses) net | (1,666 | ) | (1,911 | ) | (2,467 | ) | (3,165 | ) | (3,328 | ) | (3,620 | ) | (8,365 | ) | (9,073 | ) | ||||||||||||||||
| Foreign currency exchange gain (loss) | (236 | ) | 389 | (132 | ) | 1,613 | 1,026 | (1,299 | ) | 151 | (1,000 | ) | ||||||||||||||||||||
| Other non-operating income (expenses), net | 990 | 5,176 | 1,022 | 383 | 81 | (435 | ) | (438 | ) | (144 | ) | |||||||||||||||||||||
| Total other income (expenses) | (912 | ) | 3,654 | (1,577 | ) | (1,169 | ) | (2,221 | ) | (5,354 | ) | (8,652 | ) | (10,217 | ) | |||||||||||||||||
| Income (loss) before income taxes | (10,205 | ) | 989 | 1,913 | 7,832 | 4,857 | 5,243 | (4,379 | ) | (461,722 | ) | |||||||||||||||||||||
| Income tax benefit (expense) | 1,111 | (1,273 | ) | (565 | ) | 22 | (509 | ) | (123 | ) | (1,713 | ) | (5,549 | ) | ||||||||||||||||||
| Income (loss) before minority interest | (9,094 | ) | (284 | ) | 1,348 | 7,854 | 4,348 | 5,120 | (6,092 | ) | (467,271 | ) | ||||||||||||||||||||
| Minority interest | (533 | ) | (418 | ) | (572 | ) | (16 | ) | (282 | ) | (463 | ) | (1,352 | ) | (1,731 | ) | ||||||||||||||||
| Net income (loss) | (9,627 | ) | (702 | ) | 776 | 7,838 | 4,066 | 4,657 | (7,444 | ) | (469,002 | ) | ||||||||||||||||||||
51
Table of Contents
| As a Percentage of Revenues | ||||||||||||||||||||||||||||||||
| Mar-03 | Jun-03 | Sep-03 | Dec-03 | Mar-04 | Jun-04 | Sep-04 | Dec-04 | |||||||||||||||||||||||||
| Net revenues | 100.0 | % | 100.0 | % | 100.0 | % | 100.0 | % | 100.0 | % | 100.0 | % | 100.0 | % | 100.0 | % | ||||||||||||||||
| Cost of revenues | 95.3 | % | 88.7 | % | 83.2 | % | 80.9 | % | 84.6 | % | 82.3 | % | 83.5 | % | 84.1 | % | ||||||||||||||||
| Gross profit | 4.7 | % | 11.3 | % | 16.8 | % | 19.1 | % | 15.4 | % | 17.7 | % | 16.5 | % | 15.9 | % | ||||||||||||||||
| Operating expenses: | ||||||||||||||||||||||||||||||||
| Selling, general and administrative | 11.5 | % | 9.4 | % | 9.5 | % | 8.5 | % | 7.7 | % | 8.5 | % | 12.2 | % | 13.1 | % | ||||||||||||||||
| Research and development | 5.9 | % | 4.6 | % | 3.6 | % | 2.7 | % | 2.3 | % | 2.1 | % | 2.5 | % | 2.2 | % | ||||||||||||||||
| Goodwill impairment | 0.0 | % | 0.0 | % | 0.0 | % | 0.0 | % | 0.0 | % | 0.0 | % | 0.0 | % | 170.4 | % | ||||||||||||||||
| Others, net | (0.4 | )% | 0.3 | % | 0.2 | % | 0.4 | % | 0.1 | % | (0.5 | )% | 0.0 | % | 0.0 | % | ||||||||||||||||
| Total operating expenses | 17.0 | % | 14.3 | % | 13.3 | % | 11.6 | % | 10.1 | % | 10.1 | % | 14.7 | % | 185.7 | % | ||||||||||||||||
| Operating income (loss) | (12.3 | )% | (3.0 | )% | 3.5 | % | 7.5 | % | 5.3 | % | 7.6 | % | 1.8 | % | (169.8 | )% | ||||||||||||||||
| Other income (expenses): | ||||||||||||||||||||||||||||||||
| Interest income (expenses) net | (2.2 | )% | (2.2 | )% | (2.5 | )% | (2.6 | )% | (2.5 | )% | (2.6 | )% | (3.6 | )% | (3.4 | )% | ||||||||||||||||
| Foreign currency exchange gain (loss) | (0.3 | )% | 0.4 | % | (0.1 | )% | 1.3 | % | 0.8 | % | (0.9 | )% | 0.1 | % | (0.4 | )% | ||||||||||||||||
| Other non-operating income (expenses), net | 1.3 | % | 5.9 | % | 1.1 | % | 0.3 | % | 0.1 | % | (0.3 | )% | (0.2 | )% | (0.1 | )% | ||||||||||||||||
| Total other income (expenses) | (1.2 | )% | 4.1 | % | (1.5 | )% | (1.0 | )% | (1.6 | )% | (3.8 | )% | (3.7 | )% | (3.9 | )% | ||||||||||||||||
| Income (loss) before income taxes | (13.5 | )% | 1.1 | % | 2.0 | % | 6.5 | % | 3.7 | % | 3.8 | % | (1.9 | )% | (173.7 | )% | ||||||||||||||||
| Income tax benefit (expense) | 1.5 | % | (1.4 | % | (0.6 | )% | 0.1 | % | (0.4 | )% | (0.1 | )% | (0.7 | )% | (2.1 | )% | ||||||||||||||||
| Income (loss) before minority interest | (12.0 | )% | (0.3 | )% | 1.4 | % | 6.6 | % | 3.3 | % | 3.7 | % | (2.6 | )% | (175.8 | )% | ||||||||||||||||
| Minority interest | (0.7 | )% | (0.5 | )% | (0.6 | )% | 0.0 | % | (0.2 | )% | (0.3 | )% | (0.6 | )% | (0.6 | )% | ||||||||||||||||
| Net income (loss) | (12.7 | )% | (0.8 | )% | 0.8 | % | 6.6 | % | 3.1 | % | 3.4 | % | (3.2 | )% | (176.4 | )% | ||||||||||||||||
52
Table of Contents
53
Table of Contents
| Payments Due | ||||||||||||||||||||||
| Within | More Than | |||||||||||||||||||||
| 1 Year | 1-3 Years | 3-5 Years | 5 Years | Total | ||||||||||||||||||
| On balance sheet commitments: | ||||||||||||||||||||||
| 1.75% convertible notes due 2007 | $ | 137,107 | $ | 63,492 | $ | — | $ | — | $ | 200,599 | ||||||||||||
| Zero coupon convertible notes due 2008 | — | — | 120,690 | — | 120,690 | |||||||||||||||||
| 2.5% convertible subordinated notes due 2008 | — | — | 150,000 | — | 150,000 | |||||||||||||||||
| 8% convertible subordinated notes due 2011 | — | — | — | 50,000 | 50,000 | |||||||||||||||||
| 6.75% senior notes due 2011 | — | — | — | 215,000 | 215,000 | |||||||||||||||||
| Capital lease obligations | 7,587 | 10,771 | — | — | 18,358 | |||||||||||||||||
| Long-term loans | 17,300 | 34,099 | 8,894 | — | 60,293 | |||||||||||||||||
| Short-term loans | 19,874 | — | — | — | 19,874 | |||||||||||||||||
Total on balance sheet commitments | 181,868 | 108,362 | 279,584 | 265,000 | 834,814 | |||||||||||||||||
| Payments Due | |||||||||||||||||||||||
| Within | More Than | ||||||||||||||||||||||
| 1 Year | 1-3 Years | 3-5 Years | 5 Years | Total | |||||||||||||||||||
| Off balance sheet commitments: | |||||||||||||||||||||||
| Operating leases | 12,792 | 18,906 | 10,226 | 30,908 | 72,832 | ||||||||||||||||||
| Royalty/licensing agreements | 476 | 1,100 | 634 | — | 2,210 | ||||||||||||||||||
| Contingent payments to Cirrus | 1,000 | 1,500 | — | — | 2,500 | ||||||||||||||||||
| Purchase obligations | — | — | — | — | — | ||||||||||||||||||
| — Capital commitments | 36,315 | — | — | — | 36,315 | ||||||||||||||||||
| — Inventory purchase commitments | 47,210 | — | — | — | 47,210 | ||||||||||||||||||
Total off balance sheet commitments | 97,793 | 21,506 | 10,860 | 30,908 | 161,067 | ||||||||||||||||||
Total commitments | $ | 279,661 | $ | 129,868 | $ | 290,444 | $ | 295,908 | $ | 995,881 | |||||||||||||
54
Table of Contents
55
Table of Contents
56
Table of Contents
57
Table of Contents
| Item 6. | Directors, Senior Management and Employees |
| A. | Directors and Senior Management |
| Name | Age | Position | ||||
Board of Directors | ||||||
| Charles Richard Wofford(1)(2)(3) | 71 | Chairman of the Board of Directors | ||||
| Lim Ming Seong(2)(3)(4) | 57 | Deputy Chairman of the Board of Directors | ||||
| Tan Lay Koon | 46 | Director, President & Chief Executive Officer | ||||
| Peter Seah Lim Huat(5)(6) | 58 | Director | ||||
| Tay Siew Choon(7)(8) | 57 | Director | ||||
| Steven Hugh Hamblin(8)(9) | 56 | Director | ||||
| Richard John Agnich(10) | 61 | Director | ||||
| Robert W. Conn | 62 | Director | ||||
| R. Douglas Norby(9) | 69 | Director | ||||
| Park Chong Sup(7) | 57 | Director | ||||
Senior Management | ||||||
| Wan Choong Hoe | 51 | Chief Operating Officer | ||||
| Michael G. Potter | 38 | Chief Financial Officer | ||||
| Han Byung Joon | 45 | Chief Technology Officer | ||||
| Jeffrey R. Osmun | 41 | Vice President, Worldwide Sales and Marketing | ||||
| Ng Tiong Gee | 42 | Chief Information Officer | ||||
| Scott J. Jewler | 39 | Chief Strategy Officer | ||||
| Dennis W. Daniels | 50 | Vice President, Corporate Human Resources | ||||
| (1) | Chairman of the Executive Committee. |
| (2) | Member of the Executive Resource & Compensation Committee. |
| (3) | Member of the Nominating Committee. |
| (4) | Chairman of the Budget Committee. |
| (5) | Chairman of the Executive Resource & Compensation Committee. |
| (6) | Chairman of the Nominating Committee. |
| (7) | Member of the Budget Committee. |
| (8) | Member of the Executive Committee. |
| (9) | Member of the Audit Committee. |
| (10) | Chairman of the Audit Committee. |
58
Table of Contents
| Board of Directors |
| Charles Richard Wofford |
| Lim Ming Seong |
| Tan Lay Koon |
| Peter Seah Lim Huat |
59
Table of Contents
| Tay Siew Choon |
| Steven Hugh Hamblin |
| Richard J. Agnich |
| Robert W. Conn |
60
Table of Contents
| R. Douglas Norby |
| Park Chong Sup |
| Senior Management |
| Wan Choong Hoe |
| Michael G. Potter |
| Han Byung Joon |
61
Table of Contents
| Jeffrey R. Osmun |
| Ng Tiong Gee |
| Scott J. Jewler |
| Dennis W. Daniels |
62
Table of Contents
| B. | Compensation of Directors and Senior Management |
| Executive | Non executive | |||||||||||
| Directors | Directors(1) | Total(2) | ||||||||||
| Charles Richard Wofford | $ | 111,000 | $ | 111,000 | ||||||||
| Lim Ming Seong | 53,000 | 53,000 | ||||||||||
| Tan Lay Koon | $ | 659,224 | 659,224 | |||||||||
| Peter Seah Lim Huat | 30,000 | 30,000 | ||||||||||
| Tay Siew Choon | 37,000 | 37,000 | ||||||||||
| Quek Swee Kuan(3) | 3,577 | 3,577 | ||||||||||
| Koh Beng Seng(3) | 21,590 | 21,590 | ||||||||||
| Steven H. Hamblin | 77,000 | 77,000 | ||||||||||
| Teng Cheong Kwee(3) | 24,500 | 24,500 | ||||||||||
| William J. Meder(3) | 32,590 | 32,590 | ||||||||||
| Richard J. Agnich | 48,250 | 48,250 | ||||||||||
| Eleana Tan Ai Ching(4) | 0 | 0 | ||||||||||
| Dennis P. McKenna(5)(6) | 16,000 | 16,000 | ||||||||||
| Robert W. Conn(5) | 14,340 | 14,340 | ||||||||||
| R. Douglas Norby(5) | 15,420 | 15,420 | ||||||||||
| Park Chong Sup(5) | 15,800 | 15,800 | ||||||||||
| Senior management (excluding Executive Directors) as a group | 1,248,239 | |||||||||||
| $ | 659,224 | $ | 500,067 | $ | 2,407,530 | |||||||
| (1) | We will seek approval at our annual general meeting in 2005 for the payment of directors’ fees of approximately $500,067 for the financial year ended December 31, 2004. |
| (2) | No compensation was given in the form of stock options. For more information on share options granted to our directors and senior management, see “E. Share Ownership for Directors and Senior Management.” |
| (3) | Resigned on August 5, 2004 pursuant to the merger with ChipPAC. |
| (4) | Resigned on September 10, 2004. |
| (5) | Appointed on August 5, 2004 pursuant to the merger with ChipPAC. |
| (6) | Resigned on December 8, 2004. |
63
Table of Contents
64
Table of Contents
| C. | Board Practices |
| Board of Directors |
| Committees of the Board of Directors |
| (i) Audit Committee |
65
Table of Contents
| (ii) Executive Resource & Compensation Committee |
| (iii) Budget Committee |
| (iv) Executive Committee |
| (v) Nominating Committee |
| D. | Employees |
66
Table of Contents
| STATS as of | |||||||||||||
| December 31 | STATS ChipPAC | ||||||||||||
| as of | |||||||||||||
| 2002 | 2003 | December 31, 2004 | |||||||||||
Function | |||||||||||||
| Direct and Indirect Labor (Manufacturing) | 2,346 | 3,596 | 10,398 | (1) | |||||||||
| Indirect Labor (Administration) | 257 | 279 | 653 | ||||||||||
| Research and Development | 164 | 129 | 229 | ||||||||||
| Total(1) | 2,767 | 4,004 | 11,280 | ||||||||||
Location | |||||||||||||
| Singapore | 2,419 | 3,461 | 3,828 | ||||||||||
| China | — | 16 | 2,459 | ||||||||||
| Malaysia | — | — | 2,310 | ||||||||||
| South Korea | — | — | 2,031 | ||||||||||
| Taiwan | 224 | 376 | 443 | ||||||||||
| United States | 112 | 145 | 198 | ||||||||||
| Others | 12 | 6 | 11 | ||||||||||
| Total(1) | 2,767 | 4,004 | 11,280 | ||||||||||
| (1) | The approximate 182% increase in headcount was the result of additional hires in 2004 to support the increase in the volume of our operations and the addition of ChipPAC employees as a result of the merger with ChipPAC. |
| E. | Share Ownership for Directors and Senior Management |
67
Table of Contents
| Share Options for Directors |
| Number of Ordinary | Per Share | |||||||||||
| Shares Issuable on | Exercise Price | |||||||||||
| Exercise of Option | S$ | Exercisable Period | ||||||||||
| Charles R. Wofford | 40,000 | 6.93 | 04/20/2001 to 04/19/2005 | |||||||||
| 50,000 | 1.592 | 04/24/2002 to 04/23/2006 | ||||||||||
| 70,000 | 2.885 | 04/29/2003 to 04/28/2007 | ||||||||||
| 100,000 | 1.99 | 08/06/2004 to 08/05/2008 | ||||||||||
| 50,000 | 1.91 | 02/17/2005 to 02/16/2009 | ||||||||||
| 50,000 | 1.06 | 08/11/2005 to 08/10/2009 | ||||||||||
| Lim Ming Seong | 200,000 | 1.592 | 04/24/2002 to 04/23/2011 | |||||||||
| 70,000 | 2.885 | 04/29/2003 to 04/28/2007 | ||||||||||
| 70,000 | 1.99 | 08/06/2004 to 08/05/2008 | ||||||||||
| 35,000 | 1.91 | 02/17/2005 to 02/16/2009 | ||||||||||
| 35,000 | 1.06 | 08/11/2005 to 08/10/2009 | ||||||||||
| Tan Lay Koon | 500,000 | 6.93 | 04/20/2001 to 04/19/2010 | |||||||||
| 700,000 | 2.826 | 10/19/2001 to 10/18/2010 | ||||||||||
| 449,000 | 1.592 | 04/24/2002 to 04/23/2011 | ||||||||||
| 325,000 | 2.885 | 04/29/2003 to 04/28/2012 | ||||||||||
| 2,000,000 | 2.2 | 06/26/2003 to 06/25/2012 | ||||||||||
| 700,000 | 1.99 | 08/06/2004 to 08/05/2013 | ||||||||||
| 500,000 | 1.91 | 02/17/2005 to 02/16/2014 | ||||||||||
| 500,000 | 1.06 | 08/11/2005 to 08/10/2014 | ||||||||||
| Peter Seah Lim Huat | 70,000 | 1.99 | 08/06/2004 to 08/05/2013 | |||||||||
| 35,000 | 1.91 | 02/17/2005 to 02/16/2014 | ||||||||||
| 35,000 | 1.06 | 08/11/2005 to 08/10/2014 | ||||||||||
| Tay Siew Choon | 70,000 | 1.99 | 08/06/2004 to 08/05/2013 | |||||||||
| 35,000 | 1.91 | 02/17/2005 to 02/16/2014 | ||||||||||
| 35,000 | 1.06 | 08/11/2005 to 08/10/2009 | ||||||||||
| Steven H. Hamblin | 40,000 | 6.93 | 04/20/2001 to 04/19/2005 | |||||||||
| 50,000 | 1.592 | 04/24/2002 to 04/23/2006 | ||||||||||
| 70,000 | 2.885 | 04/29/2003 to 04/28/2007 | ||||||||||
| 70,000 | 1.99 | 08/06/2004 to 08/05/2008 | ||||||||||
| 35,000 | 1.91 | 02/17/2005 to 02/16/2009 | ||||||||||
| 35,000 | 1.06 | 08/11/2005 to 08/10/2009 | ||||||||||
| Richard J. Agnich | 20,000 | 1.298 | 10/23/2002 to 10/22/2006 | |||||||||
| 50,000 | 2.885 | 04/29/2003 to 04/28/2007 | ||||||||||
| 50,000 | 1.99 | 08/06/2004 to 08/05/2008 | ||||||||||
| 25,000 | 1.91 | 02/17/2005 to 02/16/2009 | ||||||||||
| 25,000 | 1.06 | 08/11/2005 to 08/10/2009 | ||||||||||
| Robert W. Conn(1) | 174,000 | 1.88 | 04/15/2003 to 08/04/2009 | |||||||||
| 130,500 | 0.50 | 03/17/2004 to 08/04/2009 | ||||||||||
| 130,500 | 1.36 | 02/05/2005 to 08/04/2009 | ||||||||||
68
Table of Contents
| Number of Ordinary | Per Share | |||||||||||
| Shares Issuable on | Exercise Price | |||||||||||
| Exercise of Option | S$ | Exercisable Period | ||||||||||
| R. Douglas Norby(1) | 174,000 | 1.88 | 04/15/2003 to 08/04/2009 | |||||||||
| 130,500 | 0.50 | 03/17/2004 to 08/04/2009 | ||||||||||
| 130,500 | 1.36 | 02/05/2005 to 08/04/2009 | ||||||||||
| Park Chong Sup(1) | 130,500 | 1.57 | 10/20/2001 to 08/04/2009 | |||||||||
| 43,500 | 0.38 | 09/27/2002 to 08/04/2009 | ||||||||||
| 130,500 | 0.50 | 03/17/2004 to 08/04/2009 | ||||||||||
| 130,500 | 1.36 | 02/05/2005 to 08/04/2009 | ||||||||||
| (1) | The exercise prices for Dr. Conn’s, Mr. Norby’s and Dr. Park’s options are denominated in U.S. dollars and presented here in Singapore dollars for comparability purposes using the exchange rate based on Bloomberg Close Quote on August 5, 2004 of S$1.7214 per $1.00. |
| Employees’ Share Ownership Scheme |
| Share Option Plan |
69
Table of Contents
| Item 7. | Major Shareholders and Related Party Transactions |
| A. | Major Shareholders |
| • | the election of directors; | |
| • | the merger or consolidation of us with any other entity; | |
| • | any sale of all or substantially all of our assets; and | |
| • | the timing and payment of dividends. |
| Number of Shares | Percentage(2) | |||||||
| Name of Beneficial Owner | Beneficially Owned | Beneficially Owned | ||||||
| Singapore Technologies Semiconductors Pte Ltd(1) | 713,386,050 | 36.69 | % | |||||
| (1) | Includes 2.41% of shares lent to Deutsche Bank AG, Singapore Branch, and Morgan Stanley & Co. International Limited as of January 31, 2005 pursuant to a Global Master Securities Lending Agreement in connection with the issue of convertible notes due 2008 by STATS ChipPAC. Temasek Holdings, the |
70
Table of Contents
| principal holding company through which the corporate investments of the Government of Singapore are held, owns 100% of the ordinary shares of STSPL. Temasek Holdings is deemed to beneficially own ordinary shares which are owned directly by STSPL. | |
| (2) | Based on an aggregate 1,944,384,070 ordinary shares outstanding as of January 31, 2005. |
| B. | Related Party Transactions |
71
Table of Contents
| C. | Interest of Experts and Counsel |
| Item 8. | Financial Information |
| A. | Consolidated Statements and Other Financial Information |
| Legal Proceedings |
| Dividend Policy |
| B. | Significant Changes |
72
Table of Contents
| Item 9. | The Offer and Listing |
| A. | Offer and Listing Details |
| Price range of our ordinary shares and ADSs |
| Price per | ||||||||||||||||
| Ordinary Share | Price per ADS | |||||||||||||||
| on the SGX | on Nasdaq | |||||||||||||||
| (in S$) | (in US$) | |||||||||||||||
| High | Low | High | Low | |||||||||||||
| Annual for 2000 | 10.90 | 2.72 | 63.63 | 13.13 | ||||||||||||
| Annual for 2001 | 2.84 | 0.99 | 16.00 | 5.60 | ||||||||||||
| Annual for 2002 | 3.16 | 0.87 | 17.25 | 4.89 | ||||||||||||
| Annual for 2003 | 2.73 | 1.05 | 15.75 | 6.16 | ||||||||||||
| Annual for 2004 | 2.45 | 0.92 | 14.74 | 5.40 | ||||||||||||
| Quarterly highs and lows: | ||||||||||||||||
| — quarter ending March 31, 2003 | 1.44 | 1.05 | 8.00 | 6.16 | ||||||||||||
| — quarter ending June 30, 2003 | 1.83 | 1.15 | 10.30 | 6.65 | ||||||||||||
| — quarter ending September 30, 2003 | 2.59 | 1.72 | 14.89 | 9.55 | ||||||||||||
| — quarter ending December 31, 2003 | 2.73 | 1.93 | 15.75 | 11.40 | ||||||||||||
| — quarter ending March 31, 2004 | 2.45 | 1.64 | 14.74 | 9.51 | ||||||||||||
| — quarter ending June 30, 2004 | 1.88 | 1.30 | 10.71 | 7.38 | ||||||||||||
| — quarter ending September 30, 2004 | 1.43 | 1.00 | 7.84 | 5.50 | ||||||||||||
| — quarter ending December 31, 2004 | 1.12 | 0.92 | 6.61 | 5.40 | ||||||||||||
| Monthly highs and lows: | ||||||||||||||||
| September 2004 | 1.15 | 1.02 | 6.98 | 5.90 | ||||||||||||
| October 2004 | 1.12 | 0.975 | 6.61 | 5.69 | ||||||||||||
| November 2004 | 1.01 | 0.92 | 6.00 | 5.40 | ||||||||||||
| December 2004 | 1.05 | 0.915 | 6.38 | 5.51 | ||||||||||||
| January 2005 | 1.04 | 0.88 | 6.27 | 5.37 | ||||||||||||
| February 2005 | 1.09 | 0.935 | 6.49 | 5.78 | ||||||||||||
| B. | Plan of Distribution |
| C. | Markets |
73
Table of Contents
| D. | Selling Shareholders |
| E. | Dilution |
| F. | Expenses of the Issue |
| Item 10. | Additional Information |
| A. | Share Capital |
| B. | Memorandum and Articles of Association |
| Objects |
| Board of Directors |
74
Table of Contents
| Ordinary Shares |
| New Ordinary Shares |
| Shareholders |
| Transfer of Ordinary Shares |
75
Table of Contents
| General Meetings of Shareholders |
| Voting Rights |
| Dividends |
| Bonus and Rights Issue |
76
Table of Contents
| Take-Overs |
| Liquidation or Other Return of Capital |
| Indemnity |
77
Table of Contents
| Limitations on Rights to Hold or Vote Shares |
| Substantial Shareholdings |
| Minority Rights |
| C. | Material Contracts |
78
Table of Contents
79
Table of Contents
80
Table of Contents
| D. | Exchange Controls |
| Exchange Rates |
81
Table of Contents
| Singapore Dollars per US$1.00 | ||||||||||||||||
| Noon Buying Rate | ||||||||||||||||
| Average(1) | Low | High | Period End | |||||||||||||
| Year Ended December 31, | ||||||||||||||||
| 2000 | 1.73 | 1.65 | 1.76 | 1.73 | ||||||||||||
| 2001 | 1.80 | 1.73 | 1.85 | 1.85 | ||||||||||||
| 2002 | 1.79 | 1.73 | 1.85 | 1.74 | ||||||||||||
| 2003 | 1.74 | 1.70 | 1.78 | 1.70 | ||||||||||||
| 2004 | 1.69 | 1.63 | 1.73 | 1.63 | ||||||||||||
| Month | ||||||||||||||||
| September 2004 | — | 1.68 | 1.71 | 1.68 | ||||||||||||
| October 2004 | — | 1.66 | 1.69 | 1.66 | ||||||||||||
| November 2004 | — | 1.64 | 1.67 | 1.64 | ||||||||||||
| December 2004 | — | 1.63 | 1.65 | 1.63 | ||||||||||||
| January 2005 | — | 1.63 | 1.65 | 1.64 | ||||||||||||
| February 2005 | — | 1.62 | 1.65 | 1.62 | ||||||||||||
| (1) | The average of the daily Noon Buying Rates on the last business day of each month during the year. |
| E. | Taxation |
| Singapore Taxation |
| Income Tax |
| General |
82
Table of Contents
| Dividend Distributions |
| Dividends paid out of Tax-Exempt Income or Income subject to Concessionary Tax Rate |
| Dividends paid out of Income subject to Normal Corporate Taxation |
| Imputation System |
| New One-tier Corporate Tax System |
83
Table of Contents
| Capital Gains on Disposal of Ordinary Shares and ADSs |
| Stamp Duty |
| Estate Duty |
84
Table of Contents
| United States Federal Income Taxation |
| Distributions on Ordinary Shares or ADSs |
85
Table of Contents
| Sale or Exchange of the Ordinary Shares or ADSs |
| Passive Foreign Investment Company |
| F. | Dividends and Paying Agents |
| G. | Statements by Experts |
| H. | Documents on Display |
| I. | Subsidiary Information |
| Item 11. | Quantitative and Qualitative Disclosures About Market Risk |
86
Table of Contents
| Limitations |
| Item 12. | Description of Securities Other Than Equity Securities |
| Item 13. | Defaults, Dividend Arrearages and Delinquencies |
| Item 14. | Material Modifications to the Rights of Security Holders and Use of Proceeds |
87
Table of Contents
| Item 15. | Controls and Procedures |
| Evaluation of disclosure controls and procedures |
| Changes to internal controls |
| Item 16A. | Audit Committee Financial Expert |
| Item 16B. | Code of Ethics |
| Item 16C. | Principal Accountant Fees and Services |
88
Table of Contents
| December 31, | |||||||||
| 2003 | 2004 | ||||||||
| (In thousands of | |||||||||
| US$) | |||||||||
| Audit Fees | $ | 374 | $ | 918 | |||||
| Audit-Related Fees | 7 | 160 | |||||||
| Tax Fees | 71 | 42 | |||||||
| All Other Fees | — | 35 | |||||||
| Total | $ | 452 | $ | 1,155 | |||||
| Audit Committee Pre-approval Process |
| Item 16D. | Exemptions from the Listing Standards for Audit Committee |
| Item 16E. | Issuer Purchases of Equity Securities |
89
Table of Contents
| Item 17. | Financial Statements |
| Item 18. | Financial Statements |
| Item 19. | Exhibits |
| 1 | .1 | Memorandum and Articles of Association of STATS ChipPAC Ltd. — incorporated by reference to Exhibit 3.2 to Form F-4 of STATS ChipPAC Ltd., as filed with the Securities and Exchange Commission on April 6, 2004 | ||
| 2 | .1 | Form of specimen certificate representing ST Assembly Test Services Ltd’s ordinary shares — incorporated by reference to Exhibit 4.1 of Amendment No. 1 to Form F-1 of ST Assembly Test Services Ltd filed with the Securities and Exchange Commission on January 3, 2000 | ||
| 2 | .2 | Deposit Agreement among ST Assembly Test Services Ltd, Citibank, N.A., as depositary, and the holders from time to time of ADRs issued thereunder (including the form of ADR) — incorporated by reference to Exhibit 2.2 of Form 20-F of ST Assembly Test Services Ltd filed with the Securities and Exchange Commission on March 30, 2001 | ||
| 4 | .1 | ST Group Management & Support Services Agreement dated December 27, 1999 by and between Singapore Technologies Pte Ltd and ST Assembly Test Services Ltd — incorporated by reference to Exhibit 10.1 of Amendment No. 1 to Form F-1 of ST Assembly Test Services Ltd filed with the Securities and Exchange Commission on January 3, 2000 | ||
| 4 | .2 | Lease Agreement dated November 18, 1996 by and between the Housing and Development Board and ST Assembly Test Services Ltd — incorporated by reference to Exhibit 10.4 of Amendment No. 1 to Form F-1 of ST Assembly Test Services Ltd filed with the Securities and Exchange Commission on January 3, 2000 | ||
| 4 | .3 | Agreement for the period January 1, 2003 to March 31, 2003, for the extension of the BGA Immunity Agreement entered into on October 18, 1996 between Motorola Inc and ST Assembly Test Services Ltd — incorporated by reference to Exhibit 4.6 of Form 20-F of ST Assembly Test Services filed with the Securities and Exchange Commission on March 31, 2003 | ||
| 4 | .4 | Program Agreement dated January 10, 2002 by and between Citicorp Investment Bank (Singapore) Limited and ST Assembly Test Services Ltd establishing a S$500,000,000 Multicurrency Medium Term Note Program — incorporated by reference to Exhibit 4.6 of Form 20-F of ST Assembly Test Services Ltd filed with the Securities and Exchange Commission on February 28, 2002 | ||
| 4 | .5 | Trust Deed dated January 10, 2002 by and between British and Malayan Trustees Limited and ST Assembly Test Services Ltd establishing a S$500,000,000 Multicurrency Medium Term Note Program — incorporated by reference to Exhibit 4.7 of Form 20-F of ST Assembly Test Services Ltd filed with the Securities and Exchange Commission on February 28, 2002 |
90
Table of Contents
| 4 | .6 | Agency Agreement dated January 10, 2002 by and between British and Malayan Trustees Limited, Citicorp Investment Bank (Singapore) Limited and ST Assembly Test Services Ltd establishing a S$500,000,000 Multicurrency Medium Term Note Program — incorporated by reference to Exhibit 4.8 of Form 20-F of ST Assembly Test Services Ltd filed with the Securities and Exchange Commission on February 28, 2002 | ||
| 4 | .7 | Indenture dated March 18, 2002 by and between ST Assembly Test Services Ltd and the Bank of New York relating to the 1.75% Convertible Notes Due 2007 — incorporated by reference to Exhibit 4.10 of Form 20-F of ST Assembly Test Services Ltd filed with the Securities and Exchange Commission on March 31, 2003 | ||
| 4 | .8 | US$168 Million Reg S Global Note issued by ST Assembly Test Services Ltd in relation to the 1.75% Convertible Notes Due 2007 — incorporated by reference to Exhibit 4.11 of Form 20-F of ST Assembly Test Services Ltd filed with the Securities and Exchange Commission on March 31, 2003 | ||
| 4 | .9 | US$25 Million Reg S Global Note issued by ST Assembly Test Services Ltd in relation to the 1.75% Convertible Notes Due 2007 — incorporated by reference to Exhibit 4.12 of Form 20-F of ST Assembly Test Services Ltd filed with the Securities and Exchange Commission on March 31, 2003 | ||
| 4 | .10 | US$7 Million Restricted Global Note issued by ST Assembly Test Services Ltd in relation to the 1.75% Convertible Notes Due 2007 — incorporated by reference to Exhibit 4.13 of Form 20-F of ST Assembly Test Services Ltd filed with the Securities and Exchange Commission on March 31, 2003 | ||
| 4 | .11 | Terms and Conditions of Appointment of Tan Lay Koon as President and Chief Executive Officer of ST Assembly Test Services Ltd dated March 24, 2003 by and between Tan Lay Koon and ST Assembly Test Services Ltd — incorporated by reference to Exhibit 4.16 of Form 20-F of ST Assembly Test Services Ltd filed with the Securities and Exchange Commission on March 31, 2003 | ||
| 4 | .12 | ChipPAC, Inc. Employee Retention and Severance Plan — incorporated by reference to Exhibit 10.41 to the Annual Report on Form 10-K of ChipPAC, Inc. for the fiscal year ended December 31, 2003, as filed with the Securities and Exchange Commission on March 12, 2004 | ||
| 4 | .13 | Separation Agreement, dated as of February 10, 2004, among ST Assembly Test Services Ltd, ChipPAC, Inc. and Dennis P. McKenna — incorporated by reference to Exhibit 10.33 to the Annual Report on Form 10-K of ChipPAC, Inc. for the fiscal year ended December 31, 2003, as filed with the Securities and Exchange Commission on March 12, 2004 | ||
| 4 | .14 | Amendment Agreement dated April 22, 2003 renewing the Immunity Agreement dated October 18, 1996 by and between Motorola Inc. and ST Assembly Test Services Ltd — incorporated by reference to Exhibit 4.12 of Form 20-F of ST Assembly Test Services Ltd filed with the Securities and Exchange Commission on March 19, 2004 | ||
| 4 | .15 | Securities Pledge Agreement dated January 16, 2004 by and between ST Assembly Test Services Ltd as Pledgor and Deutsche Bank AG, London Branch as Pledgee — incorporated by reference to Exhibit 4.13 of Form 20-F of ST Assembly Test Services Ltd filed with the Securities and Exchange Commission on March 19, 2004 | ||
| 4 | .16 | Confirmation Letter Agreement dated January 8, 2004 by and between ST Assembly Test Services Ltd and Deutsche Bank AG, London Branch — incorporated by reference to Exhibit 4.14 of Form 20-F of ST Assembly Test Services Ltd filed with the Securities and Exchange Commission on March 19, 2004 | ||
| 4 | .17 | Agreement and Plan of Merger and Reorganization dated February 10, 2004 by and between ST Assembly Test Services Ltd, ChipPAC, Inc. and Camelot Merger, Inc. — incorporated by reference to Exhibit 4.15 of Form 20-F of ST Assembly Test Services Ltd filed with the Securities and Exchange Commission on March 19, 2004 | ||
| 4 | .18 | Strategic Assistance Loan Agreement dated June 20, 2003 by and between ST Assembly Test Services Ltd and Simmtech Co Ltd — incorporated by reference to Exhibit 4.16 of Form 20-F of ST Assembly Test Services Ltd filed with the Securities and Exchange Commission on March 19, 2004 | ||
| 4 | .19 | The Yangdo Tambo Agreement dated June 20, 2003 by and between ST Assembly Test Services Ltd and Simmtech Co. Ltd — incorporated by reference to Exhibit 4.17 of Form 20-F of ST Assembly Test Services Ltd filed with the Securities and Exchange Commission on March 19, 2004 |
91
Table of Contents
| 4 | .20 | Pledge Agreement dated June 20, 2003 by and between ST Assembly Test Services Ltd and Simmtech Co. Ltd — incorporated by reference to Exhibit 4.18 of Form 20-F of ST Assembly Test Services Ltd filed with the Securities and Exchange Commission on March 19, 2004 | ||
| 4 | .21 | Loan Agreement dated December 26, 2003 by and between ST Assembly Test Services Ltd and Simmtech Co. Ltd and Se-Ho Chun — incorporated by reference to Exhibit 4.19 of Form 20-F of ST Assembly Test Services Ltd filed with the Securities and Exchange Commission on March 19, 2004 | ||
| 4 | .22 | Yangdo Tambo Agreement dated December 26, 2003 by and between ST Assembly Test Services Ltd and Simmtech Co. Ltd — incorporated by reference to Exhibit 4.20 of Form 20-F of ST Assembly Test Services Ltd filed with the Securities and Exchange Commission on March 19, 2004 | ||
| 4 | .23 | Share Pledge Agreement dated December 26, 2003 by and between ST Assembly Test Services Ltd and Se-Ho Chun — incorporated by reference to Exhibit 4.21 of Form 20-F of ST Assembly Test Services Ltd filed with the Securities and Exchange Commission on March 19, 2004 | ||
| 4 | .24 | Factory Kun Mortgage Agreement dated December 26, 2003 by and between ST Assembly Test Services Ltd and Simmtech Co. Ltd — incorporated by reference to Exhibit 4.22 of Form 20-F of ST Assembly Test Services Ltd filed with the Securities and Exchange Commission on March 19, 2004 | ||
| 4 | .25 | Base Capacity and Continuing Support Agreement dated December 26, 2003 by and between ST Assembly Test Services Ltd and Simmtech Co. Ltd — incorporated by reference to Exhibit 4.23 of Form 20-F of ST Assembly Test Services Ltd filed with the Securities and Exchange Commission on March 19, 2004 | ||
| 4 | .26 | Indenture dated November 7, 2003 by and between ST Assembly Test Services Ltd and the Bank of New York relating to the Convertible Notes Due 2008 — incorporated by reference to Exhibit 4.24 of Form 20-F of ST Assembly Test Services Ltd filed with the Securities and Exchange Commission on March 19, 2004 | ||
| 4 | .27 | US$115 Million Reg S Global Note issued by ST Assembly Test Services Ltd under the Indenture relating to the Convertible Notes Due 2008 — incorporated by reference to Exhibit 4.25 of Form 20-F of ST Assembly Test Services Ltd filed with the Securities and Exchange Commission on March 19, 2004 | ||
| 4 | .28 | Purchase Agreement, dated as of May 22, 2003, by and between ChipPAC, Inc. and Lehman Brothers Inc. — incorporated by reference to Exhibit 4.5 of Form S-3 of ChipPAC, Inc. filed with the Securities and Exchange Commission on August 26, 2003 | ||
| 4 | .29 | Registration Rights Agreement, dated March 28, 2003, by and between ChipPAC, Inc. and Lehman brothers Inc. — incorporated by reference to Exhibit 10.39 of Form 10-Q of ChipPAC, Inc. filed with the Securities and Exchange Commission on August 8, 2003 for the period ended June 30, 2003 | ||
| 4 | .30 | Indenture, dated as of May 28, 2003, by and between ChipPAC, Inc. and U.S. Bank National Association, as trustee incorporated by reference to Exhibit 10.40 of Form 10-Q of ChipPAC, Inc. filed with the Securities and Exchange Commission on August 8, 2003 for the period ended June 30, 2003 | ||
| 4 | .31 | Employment Agreement, dated as of February 26, 2004, among ST Assembly Test Services Ltd, ChipPAC, Inc. and Dennis Daniels — incorporated by reference to Exhibit 4.7 of Form F-4 of STATS ChipPAC Ltd., as filed with the Securities and Exchange Commission on April 6, 2004 | ||
| 4 | .32 | Employment Agreement, dated as of March 17, 2004, among ST Assembly Test Services Ltd, ChipPAC, Inc. and Michael G. Potter — incorporated by reference to Exhibit 4.8 of Form F-4 of STATS ChipPAC Ltd., as filed with the Securities and Exchange Commission on April 6, 2004 | ||
| 4 | .33 | Retention Agreement, entered into on April 18, 2004, among ST Assembly Test Services Ltd, ChipPAC, Inc. and Robert Krakauer — incorporated by reference to Exhibit 10.42 to the Quarterly Report on Form 10-Q of ChipPAC, Inc. for the three months ended March 31, 2004, as filed with the Securities and Exchange Commission on May 10, 2004 | ||
| 4 | .34 | Retention Agreement, dated as of May 11, 2004, between ChipPAC, Inc. and Patricia McCall — incorporated by reference to Exhibit 10.44 to the Quarterly Report on Form 10-Q of ChipPAC, Inc. for the three months ended June 30, 3002, as filed with the Securities and Exchange Commission on July 30, 2004 |
92
Table of Contents
| 4 | .35 | First Supplemental Indenture among ChipPAC Inc., as Company, ST Assembly Test Services Ltd, as Parent, and U.S. Bank National Association, as Trustee, dated August 4, 2004 — incorporated by reference to Exhibit 42 of Form F-3 of STATS ChipPAC, Inc. filed with the Securities and Exchange Commission on October 13, 2004 | ||
| 4 | .36 | STATS ChipPAC Ltd. Substitute Share Purchase and Option Plan — incorporated by reference to Exhibit 4.4 to Form S-8 POS of STATS ChipPAC Ltd. of August 25, 2004 | ||
| 4 | .37 | STATS ChipPAC Ltd. Substitute Equity Incentive Plan — incorporated by reference to Exhibit 4.5 to Form S-8 POS of STATS ChipPAC Ltd. of August 25, 2004 | ||
| 4 | .38 | STATS ChipPAC Ltd. Share Option Plan — incorporated by reference to Exhibit 4.3 to Form S-8 of STATS ChipPAC Ltd. of August 25, 2004 | ||
| 4 | .39 | STATS ChipPAC Ltd. Employee Share Purchase Plan 2004 — incorporated by reference to Exhibit 4.4 to Form S-8 of STATS ChipPAC Ltd. of August 25, 2004 | ||
| 4 | .40 | Indenture, dated November 18, 2004, by and between STATS ChipPAC Ltd. and U.S. Bank National Association | ||
| 4 | .41 | Purchase Agreement, dated as of November 5, 2004 by and between STATS ChipPAC Ltd, Deutsche Bank AG, Singapore Branch and Lehman Brothers International (Europe) | ||
| 4 | .42 | Registration Rights Agreement, dated November 18, 2004, by and between STATS ChipPAC Ltd. and STATS ChipPAC, Inc., STATS ChipPAC Test Services, Inc., STATS Holdings Limited, ChipPAC, Inc., ChipPAC International Company Limited, ChipPAC Luxembourg S.a.R.L., ChipPAC Liquidity Management Hungary Limited Liability Company, STATS ChipPAC (Barbados) Ltd., STATS ChipPAC (BVI) Limited, STATS ChipPAC Malaysia Sdn. Bhd., and STATS ChipPAC Korea Ltd. (collectively, the ‘Subsidiary Guarantors”) and Deutsche Bank AG, Singapore Branch and Lehman Brothers International (Europe) | ||
| 4 | .43 | Subsidiary Guarantee Agreement, dated November 18, 2004, by and between STATS ChipPAC Ltd., the Subsidiary Guarantors and U.S. Bank National Association, as Trustee | ||
| 4 | .44 | Second Supplemental Indenture among ChipPAC International, as Issuer, ChipPAC, Inc., as Guarantor, and U.S. Bank National Association as Trustee, dated October 7, 2004 | ||
| 4 | .45 | Second Supplemental Indenture among ChipPAC Inc., as Company, STATS ChipPAC Ltd., as Parent, and U.S. Bank National Association, as Trustee, dated October 11, 2004 | ||
| 4 | .46 | Third Supplemental Indenture among ChipPAC Inc., as Company, STATS ChipPAC Ltd., as Parent, and U.S. Bank National Association, as Trustee, dated November 2, 2004 | ||
| 8 | .1 | List of subsidiaries | ||
| 12 | .1 | Certification by the Chief Executive Officer pursuant to 17 CFR 240. 15d-14(a), as adopted pursuant to Section 302 of the Sarbanes-Oxley Act of 2002 | ||
| 12 | .2 | Certification by the Chief Financial Officer pursuant to 17 CFR 240. 15D-14(a), as adopted pursuant to Section 302 of the Sarbanes-Oxley Act of 2002 | ||
| 13 | .1 | Certification by the Chief Executive Officer and Chief Financial Officer pursuant to 18 U.S.C. Section 1350, as adopted pursuant to Section 906 of the Sarbanes-Oxley Act of 2002 | ||
| 15 | .1 | Consent of Pricewaterhouse Coopers, Singapore, independent registered public accounting firm | ||
| 15 | .2 | Consent of KPMG, independent registered public accounting firm |
93
Table of Contents
| STATS CHIPPAC LTD. |
| By | /s/Tan Lay Koon |
| Tan Lay Koon | |
| President and Chief Executive Officer |
94
| Page | ||||
FINANCIAL STATEMENTS | ||||
| F-2 | ||||
| F-4 | ||||
| F-5 | ||||
| F-6 | ||||
| F-7 | ||||
| F-8 | ||||
| F-9 | ||||
F-1
Table of Contents
F-2
Table of Contents
F-3
Table of Contents
| Note | 2003 | 2004 | ||||||||||||
| ASSETS | ||||||||||||||
| Current assets: | ||||||||||||||
| Cash and cash equivalents | 3 | $ | 313,163 | $ | 227,509 | |||||||||
| Short-term marketable securities | 4 | 11,144 | 2,060 | |||||||||||
| Accounts receivable, net | 5 | 79,899 | 149,650 | |||||||||||
| Amounts due from affiliates | 2 | 7,050 | 2,623 | |||||||||||
| Other receivables | 6 | 2,773 | 16,813 | |||||||||||
| Inventories | 7 | 19,839 | 54,690 | |||||||||||
| Prepaid expenses and other current assets | 8 | 14,863 | 38,836 | |||||||||||
| Total current assets | 448,731 | 492,181 | ||||||||||||
| Long-term marketable securities | 4 | 23,313 | 18,121 | |||||||||||
| Property, plant and equipment, net | 9 | 474,133 | 1,035,803 | |||||||||||
| Intangible assets | 10 | 1,940 | 125,830 | |||||||||||
| Goodwill | 11 | 2,209 | 523,598 | |||||||||||
| Prepaid expenses and other non-current assets | 8 | 43,526 | 76,169 | |||||||||||
| Total assets | $ | 993,852 | $ | 2,271,702 | ||||||||||
| LIABILITIES AND SHAREHOLDERS’ EQUITY | ||||||||||||||
| Current liabilities: | ||||||||||||||
| Accounts and other payable | $ | 8,042 | $ | 68,573 | ||||||||||
| Payables related to property, plant and equipment purchases | 54,089 | 51,638 | ||||||||||||
| Accrued operating expenses | 13 | 40,661 | 63,899 | |||||||||||
| Income taxes payable | 3,383 | 2,038 | ||||||||||||
| Short-term borrowings | 15 | — | 19,874 | |||||||||||
| Amounts due to affiliates | 2 | 1,836 | 137 | |||||||||||
| Current obligations under capital leases | 16 | 5,296 | 7,587 | |||||||||||
| Current installments of long-term debt | 17 | 6,841 | 154,407 | |||||||||||
| Total current liabilities | 120,148 | 368,153 | ||||||||||||
| Obligations under capital leases, excluding current installments | 16 | 812 | 10,771 | |||||||||||
| Long-term debt, excluding current installments | 17 | 358,789 | 642,175 | |||||||||||
| Other non-current liabilities | 19 | 4,463 | 50,362 | |||||||||||
| Total liabilities | 484,212 | 1,071,461 | ||||||||||||
| Minority interest | 33,684 | 40,891 | ||||||||||||
| Share capital: | ||||||||||||||
| Ordinary shares — par value S$0.25, | ||||||||||||||
| Authorized 3,200,000,000 shares | ||||||||||||||
| Issued ordinary shares — 1,076,620,120 in 2003 and 1,944,330,450 in 2004 | 20 | 172,434 | 298,233 | |||||||||||
| Additional paid-in capital | 21 | 489,355 | 1,507,612 | |||||||||||
| Accumulated other comprehensive loss | 22 | (9,921 | ) | (2,860 | ) | |||||||||
| Accumulated deficit | (175,912 | ) | (643,635 | ) | ||||||||||
| Total shareholders’ equity | 475,956 | 1,159,350 | ||||||||||||
| Commitments and contingencies | 24 | |||||||||||||
| Total liabilities and shareholders’ equity | $ | 993,852 | $ | 2,271,702 | ||||||||||
F-4
Table of Contents
| Note | 2002 | 2003 | 2004 | |||||||||||||||
| Net revenues | $ | 225,738 | $ | 380,691 | $ | 769,121 | ||||||||||||
| Cost of revenues | (247,943 | ) | (328,014 | ) | (643,540 | ) | ||||||||||||
| Gross profit (loss) | (22,205 | ) | 52,677 | 125,581 | ||||||||||||||
| Operating expenses: | ||||||||||||||||||
| Selling, general and administrative | 36,693 | 36,475 | 84,965 | |||||||||||||||
| Research and development | 18,856 | 15,295 | 17,637 | |||||||||||||||
| Goodwill and asset impairments | 9, 11 | 14,666 | — | 453,000 | ||||||||||||||
| Prepaid leases written off | 764 | — | — | |||||||||||||||
| Other general expenses (income), net | 548 | 374 | (464 | ) | ||||||||||||||
| Total operating expenses | 71,527 | 52,144 | 555,138 | |||||||||||||||
| Operating income (loss) | (93,732 | ) | 533 | (429,557 | ) | |||||||||||||
| Other income (expense), net: | ||||||||||||||||||
| Interest income | 5,271 | 4,785 | 4,430 | |||||||||||||||
| Interest expense | (10,414 | ) | (13,994 | ) | (28,816 | ) | ||||||||||||
| Foreign currency exchange gain (loss) | (512 | ) | 1,634 | (1,122 | ) | |||||||||||||
| Other non-operating income (expense), net | 25 | 3,419 | 7,570 | (936 | ) | |||||||||||||
| Total other income (expense), net | (2,236 | ) | (5 | ) | (26,444 | ) | ||||||||||||
| Income (loss) before income taxes | (95,968 | ) | 528 | (456,001 | ) | |||||||||||||
| Income tax benefit (expense) | 14 | 7,163 | (705 | ) | (7,894 | ) | ||||||||||||
| Loss before minority interest | (88,805 | ) | (177 | ) | (463,895 | ) | ||||||||||||
| Minority interest | (514 | ) | (1,539 | ) | (3,828 | ) | ||||||||||||
| Net loss | $ | (89,319 | ) | $ | (1,716 | ) | $ | (467,723 | ) | |||||||||
| Basic and diluted net loss per ordinary share | $ | (0.09 | ) | $ | (0.00 | ) | $ | (0.33 | ) | |||||||||
| Basic and diluted net loss per ADS | $ | (0.90 | ) | $ | (0.02 | ) | $ | (3.27 | ) | |||||||||
| Ordinary shares (in thousands) used in per ordinary share calculation: | ||||||||||||||||||
| — basic and diluted | 991,549 | 1,005,374 | 1,428,954 | |||||||||||||||
| ADS (in thousands) used in per ADS calculation: | ||||||||||||||||||
| — basic and diluted | 99,155 | 100,537 | 142,895 | |||||||||||||||
F-5
Table of Contents
| 2002 | 2003 | 2004 | |||||||||||
| Net loss | $ | (89,319 | ) | $ | (1,716 | ) | $ | (467,723 | ) | ||||
| Other comprehensive loss: | |||||||||||||
| Unrealized gain (loss) on available-for-sale marketable securities | 1,012 | 3,687 | (548 | ) | |||||||||
| Realized (gain) loss on available-for-sale marketable securities included in net loss | (125 | ) | (5,040 | ) | 537 | ||||||||
| Unrealized gain on hedging instruments | — | — | 3,953 | ||||||||||
| Realized gain on hedging instruments | — | — | (168 | ) | |||||||||
| Foreign currency translation adjustment | (212 | ) | 698 | 3,287 | |||||||||
| Comprehensive loss | $ | (88,644 | ) | $ | (2,371 | ) | $ | (460,662 | ) | ||||
F-6
Table of Contents
| Accumulated | ||||||||||||||||||||||||
| Additional | Other | Accumulated | Total | |||||||||||||||||||||
| Ordinary | Paid-In | Comprehensive | Earnings | Shareholders’ | ||||||||||||||||||||
| Shares | Capital | Loss | (Deficit) | Equity | ||||||||||||||||||||
| No. | ||||||||||||||||||||||||
| (In thousands) | $ | $ | $ | $ | $ | |||||||||||||||||||
| Balances at January 1, 2002 | 989,683 | 159,961 | 387,652 | (9,941 | ) | (84,877 | ) | 452,795 | ||||||||||||||||
| Share issuances | 2,432 | 334 | 944 | — | — | 1,278 | ||||||||||||||||||
| Non-cash compensation | — | — | 1,023 | — | — | 1,023 | ||||||||||||||||||
| Stock compensation | — | — | 60 | — | — | 60 | ||||||||||||||||||
| Net loss | — | — | — | — | (89,319 | ) | (89,319 | ) | ||||||||||||||||
| Other comprehensive income | — | — | — | 675 | — | 675 | ||||||||||||||||||
| Balances at December 31, 2002 | 992,115 | 160,295 | 389,679 | (9,266 | ) | (174,196 | ) | 366,512 | ||||||||||||||||
| Share issuances | 84,505 | 12,139 | 99,579 | — | — | 111,718 | ||||||||||||||||||
| Stock compensation | — | — | 97 | — | — | 97 | ||||||||||||||||||
| Net loss | — | — | — | — | (1,716 | ) | (1,716 | ) | ||||||||||||||||
| Other comprehensive loss | — | — | — | (655 | ) | — | (655 | ) | ||||||||||||||||
| Balances at December 31, 2003 | 1,076,620 | 172,434 | 489,355 | (9,921 | ) | (175,912 | ) | 475,956 | ||||||||||||||||
| Share issuances | 5,802 | 856 | 1,112 | — | — | 1,968 | ||||||||||||||||||
| Share issuances and assumption of share options in connection with acquisition | 861,908 | 124,943 | 1,016,549 | — | — | 1,141,492 | ||||||||||||||||||
| Stock compensation | — | — | 658 | — | — | 658 | ||||||||||||||||||
| Effect of subsidiary’s equity transaction | — | — | (62 | ) | — | — | (62 | ) | ||||||||||||||||
| Net loss | — | — | — | — | (467,723 | ) | (467,723 | ) | ||||||||||||||||
| Other comprehensive income | — | — | — | 7,061 | — | 7,061 | ||||||||||||||||||
| Balances at December 31, 2004 | 1,944,330 | 298,233 | 1,507,612 | (2,860 | ) | (643,635 | ) | 1,159,350 | ||||||||||||||||
F-7
Table of Contents
| 2002 | 2003 | 2004 | |||||||||||
Cash Flows From Operating Activities | |||||||||||||
| Net loss | $ | (89,319 | ) | $ | (1,716 | ) | $ | (467,723 | ) | ||||
| Adjustments to reconcile net loss to net cash provided by operating activities: | |||||||||||||
| Depreciation and amortization | 105,466 | 120,610 | 188,683 | ||||||||||
| Goodwill and asset impairments and prepaid leases written off | 15,430 | — | 453,000 | ||||||||||
| Amortization of leasing prepayments | 19,222 | 11,732 | 25,718 | ||||||||||
| Debt issuance cost amortization | 882 | 1,155 | 1,913 | ||||||||||
| Loss (gain) on sale of property, plant and equipment | 702 | 100 | (656 | ) | |||||||||
| Accretion of discount on convertible notes | 5,013 | 7,366 | 11,437 | ||||||||||
| Loss from repurchase of senior and convertible notes | — | — | 797 | ||||||||||
| Foreign currency exchange loss (gain) | 367 | (3,367 | ) | (830 | ) | ||||||||
| Deferred income taxes | (8,189 | ) | (1,246 | ) | 15,005 | ||||||||
| Non-cash compensation | 1,023 | — | — | ||||||||||
| Minority interest in income of subsidiary | 514 | 1,539 | 3,828 | ||||||||||
| Loss (gain) on sale and maturity of marketable securities | (125 | ) | (5,040 | ) | 537 | ||||||||
| Others | (3 | ) | (54 | ) | 1,029 | ||||||||
| Changes in operating working capital: | |||||||||||||
| Accounts receivable | (23,633 | ) | (30,277 | ) | 8,149 | ||||||||
| Amounts due from affiliates | (2,030 | ) | (2,932 | ) | 4,427 | ||||||||
| Inventories | (2,482 | ) | (10,095 | ) | (1,171 | ) | |||||||
| Other receivables, prepaid expenses and other assets | (893 | ) | (16,783 | ) | (64,421 | ) | |||||||
| Accounts payable, accrued operating expenses and other payables | 7,163 | 11,769 | (41,406 | ) | |||||||||
| Amounts due to affiliates | (611 | ) | (213 | ) | (1,699 | ) | |||||||
| Net cash provided by operating activities | 28,497 | 82,548 | 136,617 | ||||||||||
Cash Flows From Investing Activities | |||||||||||||
| Proceeds from sales of marketable securities | 110,962 | 77,566 | 130,497 | ||||||||||
| Proceeds from maturity of marketable securities | 2,844 | 5,753 | 46,687 | ||||||||||
| Purchases of marketable securities | (157,976 | ) | (43,850 | ) | (160,943 | ) | |||||||
| Acquisition of intangible assets | (65 | ) | — | (1,428 | ) | ||||||||
| Acquisition of subsidiary, net of cash acquired | — | (467 | ) | 7,208 | |||||||||
| Purchases of property, plant and equipment | (113,169 | ) | (209,326 | ) | (287,574 | ) | |||||||
| Others, net | 751 | (3,946 | ) | 729 | |||||||||
| Net cash used in investing activities | (156,653 | ) | (174,270 | ) | (264,824 | ) | |||||||
Cash Flows From Financing Activities | |||||||||||||
| Repayment of short-term debt | $ | — | $ | (27,419 | ) | $ | (72,006 | ) | |||||
| Repayment of long-term debt | (14,321 | ) | (19,713 | ) | (8,982 | ) | |||||||
| Proceeds from issuance of shares, net of expenses | 1,278 | 117,477 | 1,968 | ||||||||||
| Proceeds from issuance of convertible and senior notes, net of expenses | 195,032 | 112,345 | 210,458 | ||||||||||
| Repurchase of senior and convertible notes | — | — | (193,647 | ) | |||||||||
| Proceeds from bank borrowings | 20,592 | 49,839 | 107,620 | ||||||||||
| Decrease (increase) in restricted cash | (13,026 | ) | 8,223 | 2,927 | |||||||||
| Grants received | 1,150 | 6,784 | — | ||||||||||
| Capital lease payments | (10,082 | ) | (12,862 | ) | (7,210 | ) | |||||||
| Net cash provided by financing activities | 180,623 | 234,674 | 41,128 | ||||||||||
| Net increase (decrease) in cash and cash equivalents | 52,467 | 142,952 | (87,079 | ) | |||||||||
| Effect of exchange rate changes on cash and cash equivalents | (20 | ) | 2,550 | 1,425 | |||||||||
| Cash and cash equivalents at beginning of the year | 115,214 | 167,661 | 313,163 | ||||||||||
| Cash and cash equivalents at end of the year | $ | 167,661 | $ | 313,163 | $ | 227,509 | |||||||
Supplementary Cash Flow Information | |||||||||||||
| Interest paid (net of amount capitalized) | $ | 3,312 | $ | 5,580 | $ | 21,974 | |||||||
| Income taxes paid | $ | 1,333 | $ | 669 | $ | 1,023 | |||||||
| Non-cash items | |||||||||||||
| Issuance of shares and assumption of share options in connection with acquisition | $ | — | $ | — | $ | 1,066,994 | |||||||
| Equipment acquired under capital leases | $ | 11,576 | $ | 2,663 | $ | — | |||||||
| Compensation paid by Singapore Technologies Pte Ltd. | $ | 1,023 | $ | — | $ | — | |||||||
F-8
Table of Contents
| 1. | Background and Summary of Significant Accounting Policies |
| (a) | Business and Organization |
| (b) | Accounting Principles |
| (c) | Principles of Consolidation |
| (d) | Issuances of Stock by Subsidiaries |
| (e) | Use of Estimates |
F-9
Table of Contents
| (f) | Reclassifications |
| (g) | Foreign Currency Transactions |
| (h) | Certain Risks and Concentrations |
F-10
Table of Contents
| (i) | Cash and Cash Equivalents |
| (j) | Derivative Instruments and Hedging Activities |
| (k) | Marketable Securities |
F-11
Table of Contents
| (l) | Inventories |
| (m) | Business Combination |
| (n) | Goodwill |
| (o) | Intangible assets |
| Tradenames | 7 years | |||
| Technology and intellectual property | 10 years | |||
| Customer relationships | 2 years | |||
| Software and licenses | 3 to 5 years |
F-12
Table of Contents
| (p) | Property, Plant and Equipment |
| Land use rights | 50 to 99 years | |||
| Building, mechanical and electrical installation | 3 to 25 years | |||
| Equipment | 2 to 8 years |
| (q) | Long-Lived Assets |
| (r) | Comprehensive Loss |
| (s) | Revenue Recognition |
F-13
Table of Contents
| For the Year Ended | ||||||||||||
| December 31, | ||||||||||||
| 2002 | 2003 | 2004 | ||||||||||
| % | % | % | ||||||||||
| Revenue | ||||||||||||
| — packaging — array | 14.8 | 20.6 | 40.6 | |||||||||
| — packaging — leaded | 34.0 | 26.9 | 20.9 | |||||||||
| — test | 51.2 | 52.5 | 38.5 | |||||||||
| Total | 100.0 | 100.0 | 100.0 | |||||||||
| (t) | Grants |
F-14
Table of Contents
| (u) | Stock-Based Employee Compensation |
| For the Year Ended December 31, | |||||||||||||
| 2002 | 2003 | 2004 | |||||||||||
| Net loss as reported | $ | (89,319 | ) | $ | (1,716 | ) | $ | (467,723 | ) | ||||
| Add: Total stock-based employee compensation expenses included in reported net loss, net of related tax effects | 60 | 97 | 658 | ||||||||||
| Deduct: Total stock-based employee compensation expenses determined under the fair value method for all awards, net of related tax effects | (9,390 | ) | (10,496 | ) | (18,492 | ) | |||||||
| Pro forma net loss | $ | (98,649 | ) | $ | (12,115 | ) | $ | (485,557 | ) | ||||
| Basic and diluted net loss per share: | |||||||||||||
| As reported | $ | (0.09 | ) | $ | (0.00 | ) | $ | (0.33 | ) | ||||
| Pro forma | $ | (0.10 | ) | $ | (0.01 | ) | $ | (0.34 | ) | ||||
| Basic and diluted net loss per ADS: | |||||||||||||
| As reported | $ | (0.90 | ) | $ | (0.02 | ) | $ | (3.27 | ) | ||||
| Pro forma | $ | (0.99 | ) | $ | (0.12 | ) | $ | (3.40 | ) | ||||
| For the Year Ended December 31, | ||||||||||||
| 2002 | 2003 | 2004 | ||||||||||
| Expected lives | 5 years | 5 – 10 years | 5 – 10 years | |||||||||
| Dividend yield | 0.0% | 0.0% | 0.0% | |||||||||
| Risk free interest rate | 1.8% – 3.0% | 2.5% – 3.6% | 0.8% – 4.3% | |||||||||
| Expected volatility | 52.1% – 59.1% | 59.7% – 67.4% | 55.9% – 64.9% | |||||||||
| (v) | Employee Benefit Plans |
F-15
Table of Contents
| (w) | Operating Leases |
| (x) | Product Warranties |
F-16
Table of Contents
| (y) | Research and Development |
| (z) | Income Taxes |
| (aa) | Net Loss Per Share |
| Year Ended December 31, | ||||||||||||
| 2002 | 2003 | 2004 | ||||||||||
| Convertible debt | 106,895 | 172,513 | 369,235 | |||||||||
| Stock options | 54,275 | 61,022 | 131,997 | |||||||||
| (bb) | New Accounting Pronouncements |
F-17
Table of Contents
| 2. | Related Party Transactions |
F-18
Table of Contents
| December 31, | |||||||||
| 2003 | 2004 | ||||||||
| Amounts due from affiliates | |||||||||
| Accounts receivable, net of allowance for sales returns | $ | 7,050 | $ | 2,623 | |||||
| Amounts due to affiliates | |||||||||
| Other payables | $ | (1,122 | ) | $ | — | ||||
| Accounts payable | (714 | ) | (137 | ) | |||||
| $ | (1,836 | ) | $ | (137 | ) | ||||
F-19
Table of Contents
| 3. | Cash and Cash Equivalents |
| December 31, | |||||||||
| 2003 | 2004 | ||||||||
| Cash at banks and on hand | $ | 2,140 | $ | 37,100 | |||||
| Cash equivalents | |||||||||
| Bank fixed deposits | 176,737 | 152,849 | |||||||
| STPL pooled cash | 3,201 | — | |||||||
| STPL treasury deposits | 80,202 | — | |||||||
| Premium deposit | 5,858 | — | |||||||
| Investment fund | 45,025 | 37,560 | |||||||
| $ | 313,163 | $ | 227,509 | ||||||
| 4. | Marketable Securities |
| December 31, | ||||||||||||||||||||||||||||||||
| 2003 | 2004 | |||||||||||||||||||||||||||||||
| Gross | Gross | Gross | Gross | |||||||||||||||||||||||||||||
| Amortized | Unrealized | Unrealized | Amortized | Unrealized | Unrealized | |||||||||||||||||||||||||||
| Cost | Gains | Losses | Fair Value | Cost | Gains | Losses | Fair Value | |||||||||||||||||||||||||
| Available-for-sale corporate debt securities | $ | 35,389 | $ | 69 | $ | (1,001 | ) | $ | 34,457 | $ | 20,961 | $ | — | $ | (780 | ) | $ | 20,181 | ||||||||||||||
| December 31, | ||||||||
| 2003 | 2004 | |||||||
| Corporate debt securities: | ||||||||
| Due in one year or less | $ | 11,144 | $ | 2,060 | ||||
| Due after one year through five years | 23,313 | 18,121 | ||||||
| $ | 34,457 | $ | 20,181 | |||||
F-20
Table of Contents
| 5. | Accounts Receivable |
| December 31, | ||||||||
| 2003 | 2004 | |||||||
| Accounts receivable — third parties | $ | 81,261 | $ | 151,549 | ||||
| Allowance for sales returns | (1,362 | ) | (1,899 | ) | ||||
| $ | 79,899 | $ | 149,650 | |||||
| �� | ||||||||
| 2002 | 2003 | 2004 | ||||||||||
| Beginning | $ | 784 | $ | 1,625 | $ | 1,362 | ||||||
| Utilized during the year | (36 | ) | (1,102 | ) | (4,511 | ) | ||||||
| Charged during the year | 877 | 839 | 5,048 | |||||||||
| Ending | $ | 1,625 | $ | 1,362 | $ | 1,899 | ||||||
| 6. | Other Receivables |
| December 31, | ||||||||
| 2003 | 2004 | |||||||
| Deposits and staff advances | $ | 405 | $ | 580 | ||||
| Grants receivable | 722 | 1,322 | ||||||
| Forward contract receivable | — | 3,785 | ||||||
| Taxes receivable | — | 9,492 | ||||||
| Other receivables | 1,646 | 1,634 | ||||||
| $ | 2,773 | $ | 16,813 | |||||
| 7. | Inventories |
| December 31, | ||||||||
| 2003 | 2004 | |||||||
| Raw materials | $ | 14,704 | $ | 42,267 | ||||
| Work-in-progress | 5,092 | 11,472 | ||||||
| Finished goods | 43 | 951 | ||||||
| $ | 19,839 | $ | 54,690 | |||||
F-21
Table of Contents
| 8. | Prepaid Expenses and Other Assets |
| December 31, | ||||||||
| 2003 | 2004 | |||||||
| Leasing prepayments | $ | 10,950 | $ | 27,137 | ||||
| Other prepayments and assets | 1,030 | 4,004 | ||||||
| Deferred income tax assets | 1,203 | 2,422 | ||||||
| Loans to vendors | 900 | 4,879 | ||||||
| Fixed deposits pledge for bank loans | 780 | 394 | ||||||
| $ | 14,863 | $ | 38,836 | |||||
| December 31, | ||||||||
| 2003 | 2004 | |||||||
| Leasing prepayments | $ | 6,283 | $ | 7,071 | ||||
| Deferred income tax assets | 22,471 | 33,992 | ||||||
| Fixed deposits pledged for bank loans | 3,732 | 727 | ||||||
| Other deposits | — | 5,225 | ||||||
| Loans to vendors | 4,100 | 13,771 | ||||||
| Debt issuance cost, net of accumulated amortization of $2,036 and $3,481 | 6,154 | 10,677 | ||||||
| Others | 786 | 4,706 | ||||||
| $ | 43,526 | $ | 76,169 | |||||
F-22
Table of Contents
| 9. | Property, Plant and Equipment |
| December 31, | ||||||||||
| 2003 | 2004 | |||||||||
| Cost: | ||||||||||
| Freehold land | $ | 5,760 | $ | 6,147 | ||||||
| Land and land use rights | — | 19,864 | ||||||||
| Buildings, mechanical and electrical installation | 70,661 | 164,083 | ||||||||
| Equipment | 805,830 | 1,404,959 | ||||||||
| Total cost | $ | 882,251 | $ | 1,595,053 | ||||||
| Total accumulated depreciation | $ | 408,118 | $ | 559,250 | ||||||
| Property, plant and equipment, net | $ | 474,133 | $ | 1,035,803 | ||||||
F-23
Table of Contents
| 10. | Intangible Assets |
| December 31, 2003 | December 31, 2004 | |||||||||||||||||||||||
| Gross | Accumulated | Net | Gross | Accumulated | ||||||||||||||||||||
| Assets | Amortization | Assets | Assets | Amortization | Net Assets | |||||||||||||||||||
| Tradenames | $ | — | $ | — | $ | — | $ | 7,700 | $ | (458 | ) | $ | 7,242 | |||||||||||
| Technology and intellectual property | — | — | — | 32,000 | (1,333 | ) | 30,667 | |||||||||||||||||
| Customer relationships | — | — | — | 99,300 | (20,688 | ) | 78,612 | |||||||||||||||||
| Software and licenses | 3,582 | (1,642 | ) | 1,940 | 13,180 | (3,871 | ) | 9,309 | ||||||||||||||||
| $ | 3,582 | $ | (1,642 | ) | $ | 1,940 | $ | 152,180 | $ | (26,350 | ) | $ | 125,830 | |||||||||||
| For the Year Ended | ||||||||||||
| December 31, | ||||||||||||
| 2002 | 2003 | 2004 | ||||||||||
| Tradenames | $ | — | $ | — | $ | 458 | ||||||
| Technology and intellectual property | — | — | 1,333 | |||||||||
| Customer relationships | — | — | 20,688 | |||||||||
| Software and licenses | 606 | 512 | 2,229 | |||||||||
| $ | 606 | $ | 512 | $ | 24,708 | |||||||
| 2005 | $ | 57,457 | ||
| 2006 | 35,734 | |||
| 2007 | 6,059 | |||
| 2008 | 4,893 | |||
| 2009 | 4,631 | |||
| Thereafter | 17,056 | |||
| Total | $ | 125,830 | ||
F-24
Table of Contents
| 11. | Goodwill |
| December 31, | ||||||||
| 2003 | 2004 | |||||||
| Beginning | $ | 1,321 | $ | 2,209 | ||||
| Goodwill related to acquisitions | 888 | 974,389 | ||||||
| Impairment charges | — | (453,000 | ) | |||||
| Ending | $ | 2,209 | $ | 523,598 | ||||
| (a) longer than expected slow-down in the industry beginning late 2004 as customers corrected excess inventory position. This reduction in demand, coupled with the competitive pressures in the testing and packaging business had affected the short-term earnings expectation of the Company; and | |
| (b) a revision of the industry outlook beyond 2005 as compared to the time the merger was announced. |
| 12. | Business Combination |
F-25
Table of Contents
| Value of STATS ChipPAC ADSs issued | $ | 1,068,955 | ||
| Value of STATS substitute options | 74,548 | |||
| Total value of STATS securities | 1,143,503 | |||
| Estimated direct transaction costs | 9,369 | |||
| Total estimated purchase price | $ | 1,152,872 | ||
| Current and other assets | $ | 170,332 | |||
| Property, plant and equipment | 447,568 | ||||
| Current liabilities | (161,203 | ) | |||
| Long-term debts | (375,519 | ) | |||
| Other long-term liabilities | (51,924 | ) | |||
| Net assets | 29,254 | ||||
| Amortizable intangible assets: | |||||
| Tradenames | 7,700 | ||||
| Technology and intellectual property | 32,000 | ||||
| Customer relationships | 99,300 | ||||
| Software and licenses | 8,218 | ||||
| Unearned compensation on unvested options | 2,011 | ||||
| Goodwill | 974,389 | ||||
| $ | 1,152,872 | ||||
F-26
Table of Contents
F-27
Table of Contents
| For the Year Ended | ||||||||
| December 31, | ||||||||
| 2003 | 2004 | |||||||
| Revenues | $ | 809,880 | $ | 1,084,165 | ||||
| Net loss | (75,154 | ) | (484,695 | ) | ||||
| Net loss per ordinary share: | ||||||||
| Basic and diluted | $ | (0.04 | ) | $ | (0.25 | ) | ||
| Net loss per ADS: | ||||||||
| Basic and diluted | $ | (0.41 | ) | $ | (2.52 | ) | ||
| 13. | Accrued Operating Expenses |
| December 31, | ||||||||
| 2003 | 2004 | |||||||
| Staff costs | $ | 5,384 | $ | 22,609 | ||||
| Purchase of raw materials | 18,293 | 12,789 | ||||||
| Maintenance fees, license fees and royalties | 1,237 | 2,832 | ||||||
| Interest expense | 1,001 | 3,060 | ||||||
| Provision for vacation liability | 2,610 | 3,511 | ||||||
| Others | 12,136 | 19,098 | ||||||
| $ | 40,661 | $ | 63,899 | |||||
| 14. | Income Taxes |
| For the Year Ended December 31, | ||||||||||||
| 2002 | 2003 | 2004 | ||||||||||
| Singapore | $ | (91,852 | ) | $ | (122 | ) | $ | 6,674 | ||||
| Foreign | (4,116 | ) | 650 | (462,675 | ) | |||||||
| $ | (95,968 | ) | $ | 528 | $ | (456,001 | ) | |||||
F-28
Table of Contents
| For the Year Ended December 31, | |||||||||||||
| 2002 | 2003 | 2004 | |||||||||||
| Current: | |||||||||||||
| Singapore | $ | (850 | ) | $ | (1,706 | ) | $ | 7,283 | |||||
| Foreign | (176 | ) | (225 | ) | (172 | ) | |||||||
| $ | (1,026 | ) | $ | (1,931 | ) | $ | 7,111 | ||||||
| Deferred: | |||||||||||||
| Singapore | $ | 8,661 | $ | 741 | $ | (9,145 | ) | ||||||
| Foreign | (472 | ) | 485 | (5,860 | ) | ||||||||
| $ | 8,189 | $ | 1,226 | $ | (15,005 | ) | |||||||
| $ | 7,163 | $ | (705 | ) | $ | (7,894 | ) | ||||||
F-29
Table of Contents
| For the Year Ended December 31, | ||||||||||||
| 2002 | 2003 | 2004 | ||||||||||
| Income tax expense (benefit) computed at Singapore statutory rate of 20.0% (2003: 22.0%, 2002: 22.0%) | $ | (21,113 | ) | $ | 116 | $ | (91,200 | ) | ||||
| Non-deductible expenses, including goodwill impairment charges | 318 | 175 | 91,488 | |||||||||
| Non-taxable income | (308 | ) | (253 | ) | (1,212 | ) | ||||||
| Differences in tax rates | (692 | ) | (121 | ) | 6,898 | |||||||
| Effect of recognizing deferred tax assets at concessionary tax rate and tax credits | 10,393 | (5,781 | ) | (13,199 | ) | |||||||
| Change in valuation allowance | 2,292 | 6,383 | 12,722 | |||||||||
| Benefit of tax status change | — | — | (935 | ) | ||||||||
| Taxable foreign exchange adjustment | — | — | 2,639 | |||||||||
| All other items, net | 1,947 | 186 | 693 | |||||||||
| Income tax expense (benefit) | $ | (7,163 | ) | $ | 705 | $ | 7,894 | |||||
F-30
Table of Contents
| December 31, | |||||||||
| 2003 | 2004 | ||||||||
| Deferred income tax assets: | |||||||||
| Operating loss carryforwards | $ | 4,574 | $ | 29,372 | |||||
| Investment tax credits | 9,133 | 45,656 | |||||||
| Property, plant and equipment | 25,708 | 18,276 | |||||||
| Other | 592 | 67 | |||||||
| 40,007 | 99,371 | ||||||||
| Valuation allowance: | (8,675 | ) | (56,957 | ) | |||||
| $ | 31,332 | $ | 36,414 | ||||||
| Deferred income tax liabilities: | |||||||||
| Unrealized tax credits | $ | 3,250 | $ | — | |||||
| Property, plant and equipment | 7,658 | 17,855 | |||||||
| Allowances and reserves | — | 12,764 | |||||||
| 10,908 | 30,619 | ||||||||
| Net deferred income tax assets | $ | 20,424 | $ | 5,795 | |||||
F-31
Table of Contents
| 15. | Short-Term Borrowings |
| 16. | Capital Leases |
| 2004 | |||||
| Payable in year ending December 31, | |||||
| 2005 | $ | 8,245 | |||
| 2006 | 7,428 | ||||
| 2007 | 3,730 | ||||
| 2008 | — | ||||
| Thereafter | — | ||||
| Total minimum obligations | 19,403 | ||||
| Less amounts representing interest at rates ranging from 4.4% to 7.1% per annum | (1,045 | ) | |||
| Present value of minimum obligations | 18,358 | ||||
| Current installments of obligations under capital leases | (7,587 | ) | |||
| Obligations under capital leases, excluding current Installments | $ | 10,771 | |||
F-32
Table of Contents
| 17. | Long-term debt |
| December 31, | ||||||||
| 2003 | 2004 | |||||||
| 1.75% coupon senior fixed-rate convertible notes | $ | 200,000 | $ | 183,500 | ||||
| 0% coupon senior fixed-rate convertible notes | 115,000 | 115,000 | ||||||
| 2.5% convertible subordinated notes | — | 150,000 | ||||||
| 8% convertible subordinated notes | — | 50,000 | ||||||
| 6.75% senior notes | — | 215,000 | ||||||
| Taiwan dollar loans at floating rates | 35,540 | 51,951 | ||||||
| Taiwan dollar loans and commercial papers at fixed rates | 2,711 | 8,342 | ||||||
| Accrued yield-to-maturity interest on notes | 12,379 | 22,789 | ||||||
| 365,630 | 796,582 | |||||||
| Less current amounts | (6,841 | ) | (154,407 | ) | ||||
| $ | 358,789 | $ | 642,175 | |||||
F-33
Table of Contents
F-34
Table of Contents
F-35
Table of Contents
F-36
Table of Contents
| Payable in year ending December 31, | |||||
| 2005 | $ | 154,407 | |||
| 2006 | 22,248 | ||||
| 2007 | 75,343 | ||||
| 2008 | 276,244 | ||||
| 2009 | 3,340 | ||||
| Thereafter | 265,000 | ||||
| $ | 796,582 | ||||
| 18. | Unutilized Credit Facilities |
| 19. | Other Non-Current Liabilities |
| December 31, | ||||||||
| 2003 | 2004 | |||||||
| Deferred grant | $ | 1,211 | $ | 3,412 | ||||
| Deferred tax liabilities | 3,250 | 30,619 | ||||||
| Others | 2 | 16,331 | ||||||
| $ | 4,463 | $ | 50,362 | |||||
F-37
Table of Contents
| 20. | Share Capital |
| 21. | Additional Paid-in Capital |
| 22. | Accumulated Other Comprehensive Loss |
| December 31, | ||||||||
| 2003 | 2004 | |||||||
| Currency translation loss | $ | 9,152 | $ | 5,865 | ||||
| Unrealized gain on hedging instruments | — | (3,785 | ) | |||||
| Unrealized loss on available-for-sale marketable securities | 769 | 780 | ||||||
| $ | 9,921 | $ | 2,860 | |||||
F-38
Table of Contents
| 23. | Share Options and Incentive Plans |
F-39
Table of Contents
| Weighted | ||||||||
| Average | ||||||||
| Options | Exercise Price | |||||||
| (In thousands) | ||||||||
| Options outstanding at January 1, 2002 | 51,770 | 1.70 | ||||||
| Granted during the year | 19,653 | 1.36 | ||||||
| Lapsed during the year | (14,716 | ) | 1.64 | |||||
| Exercised during the year | (2,432 | ) | 0.53 | |||||
| Options outstanding at December 31, 2002 | 54,275 | 1.65 | ||||||
| Granted during the year | 10,956 | 1.17 | ||||||
| Lapsed during the year | (3,094 | ) | 1.69 | |||||
| Exercised during the year | (1,115 | ) | 0.62 | |||||
| Options outstanding at December 31, 2003 | 61,022 | 1.58 | ||||||
| Assumed through ChipPAC acquisition | 76,493 | 0.55 | ||||||
| Granted during the year | 11,523 | 0.87 | ||||||
| Lapsed during the year | (11,239 | ) | 1.16 | |||||
| Exercised during the year | (5,802 | ) | 0.33 | |||||
| Options outstanding at December 31, 2004 | 131,997 | $ | 1.01 | |||||
| Exercisable at December 31, 2002 | 13,636 | $ | 2.01 | |||||
| Exercisable at December 31, 2003 | 33,728 | $ | 1.66 | |||||
| Exercisable at December 31, 2004 | 66,097 | $ | 1.13 | |||||
| Options Outstanding | ||||||||||||||||||||
| Weighted | Options Exercisable | |||||||||||||||||||
| Average | Weighted | |||||||||||||||||||
| Number | Remaining | Average | Number | Weighted | ||||||||||||||||
| Outstanding at | Contractual | Exercise | Exercisable at | Average | ||||||||||||||||
| Range of Exercise Prices | 12/31/2004 | Life | Price | 12/31/2004 | Exercise Price | |||||||||||||||
| (In thousands) | (In thousands) | |||||||||||||||||||
| $0.14 to $0.15 | 215 | 4.8 years | $ | 0.15 | 215 | $ | 0.15 | |||||||||||||
| $0.21 to $0.29 | 22,884 | 7.7 years | $ | 0.26 | 12,975 | $ | 0.25 | |||||||||||||
| $0.32 to $0.47 | 11,944 | 6.2 years | $ | 0.41 | 9,045 | $ | 0.40 | |||||||||||||
| $0.53 to $0.89 | 47,266 | 8.0 years | $ | 0.76 | 15,669 | $ | 0.78 | |||||||||||||
| $0.91 to $1.09 | 1,961 | 7.5 years | $ | 0.95 | 1,156 | $ | 0.96 | |||||||||||||
| $1.16 to $1.66 | 37,877 | 7.4 years | $ | 1.38 | 18,532 | $ | 1.46 | |||||||||||||
| $2.01 to $2.61 | 3,391 | 5.0 years | $ | 2.06 | 3,338 | $ | 2.06 | |||||||||||||
| $3.99 | 6,459 | 5.3 years | $ | 3.99 | 5,167 | $ | 3.99 | |||||||||||||
| 131,997 | 66,097 | |||||||||||||||||||
F-40
Table of Contents
| 24. | Commitments and Contingencies |
| (a) | Commitments |
| December 31, | ||||||||
| 2003 | 2004 | |||||||
Capital commitments | ||||||||
| Building, mechanical and electrical installation | $ | 6,341 | $ | 1,598 | ||||
| Plant and machinery | 42,969 | 34,717 | ||||||
Other commitments | ||||||||
| Inventories | $ | 8,413 | $ | 47,210 | ||||
| Payable in year ending December 31, | |||||
| 2005 | $ | 12,792 | |||
| 2006 | 11,007 | ||||
| 2007 | 7,899 | ||||
| 2008 | 7,656 | ||||
| 2009 | 2,570 | ||||
| Thereafter | 30,908 | ||||
| $ | 72,832 | ||||
| (b) | Contingent liabilities |
F-41
Table of Contents
| 25. | Other Non-Operating Income (Expense), net |
| For the Year Ended | ||||||||||||
| December 31, | ||||||||||||
| 2002 | 2003 | 2004 | ||||||||||
| Government grant income | $ | 1,830 | $ | 2,347 | $ | — | ||||||
| Gain (loss) on sale and maturity of marketable securities | 125 | 5,040 | (537 | ) | ||||||||
| Other income (expense), net | 1,464 | 183 | (399 | ) | ||||||||
| $ | 3,419 | $ | 7,570 | $ | (936 | ) | ||||||
F-42
Table of Contents
| 26. | Fair Value of Financial Instruments |
| December 31, | |||||||||||||||||
| 2003 | 2004 | ||||||||||||||||
| Carrying | Estimated | Carrying | Estimated | ||||||||||||||
| Amount | Fair Value | Amount | Fair Value | ||||||||||||||
| $ | $ | $ | $ | ||||||||||||||
Financial Assets: | |||||||||||||||||
| Cash and cash equivalents | 313,163 | 313,163 | 227,509 | 227,509 | |||||||||||||
| Marketable securities | 34,457 | 34,457 | 20,181 | 20,181 | |||||||||||||
| Fixed deposits pledged | 4,512 | 4,512 | 1,121 | 1,121 | |||||||||||||
Financial Liabilities: | |||||||||||||||||
| Short-term borrowings | — | — | 19,874 | 19,874 | |||||||||||||
| Long-term debt, excluding senior and convertible notes | 38,251 | 38,099 | 60,293 | 60,163 | |||||||||||||
| Senior and convertible notes | 327,379 | 339,138 | 736,289 | 748,907 | |||||||||||||
| Cash and cash equivalents |
| Marketable securities |
| Fixed deposits |
| Short-term borrowings and long-term debt |
F-43
Table of Contents
| Senior and convertible notes |
| Limitations |
| 27. | Business Segment, Geographic and Major Customer Data |
F-44
Table of Contents
| For the Year Ended December 31, | ||||||||||||
| 2002 | 2003 | 2004 | ||||||||||
| Singapore | ||||||||||||
| — packaging — array | $ | 11 | $ | 1 | $ | 6 | ||||||
| — packaging — leaded | 811 | 638 | 830 | |||||||||
| — test | 10,160 | 13,301 | 17,708 | |||||||||
| 10,982 | 13,940 | 18,544 | ||||||||||
| United States | ||||||||||||
| — packaging — array | 32,469 | 76,485 | 253,595 | |||||||||
| — packaging — leaded | 71,574 | 93,841 | 145,511 | |||||||||
| — test | 78,272 | 139,388 | 195,082 | |||||||||
| 182,315 | 309,714 | 594,188 | ||||||||||
| Rest of Asia | ||||||||||||
| — packaging — array | 341 | 998 | 49,500 | |||||||||
| — packaging — leaded | 1,647 | 3,895 | 8,585 | |||||||||
| — test | 16,569 | 34,200 | 63,197 | |||||||||
| 18,557 | 39,093 | 121,282 | ||||||||||
| Europe | ||||||||||||
| — packaging — array | 672 | 932 | 9,264 | |||||||||
| — packaging — leaded | 2,740 | 4,015 | 6,172 | |||||||||
| — test | 10,472 | 12,997 | 19,671 | |||||||||
| Total | 13,884 | 17,944 | 35,107 | |||||||||
| — packaging — array | 33,493 | 78,416 | 312,365 | |||||||||
| — packaging — leaded | 76,772 | 102,389 | 161,098 | |||||||||
| — test | 115,473 | 199,886 | 295,658 | |||||||||
| $ | 225,738 | $ | 380,691 | $ | 769,121 | |||||||
| For the Year Ended | ||||||||
| December 31, | ||||||||
| 2003 | 2004 | |||||||
| Singapore | $ | 364,246 | $ | 391,522 | ||||
| United States | 12,144 | 27,704 | ||||||
| Rest of Asia | 97,743 | 619,577 | ||||||
| Total | $ | 474,133 | $ | 1,035,803 | ||||
F-45
Table of Contents
| For the Year Ended | ||||||||
| December 31, | ||||||||
| 2003 | 2004 | |||||||
| Singapore | $ | 480,451 | $ | 689,100 | ||||
| United States | (6,214 | ) | 23,190 | |||||
| Rest of Asia | 1,719 | 447,060 | ||||||
| Total | $ | 475,956 | $ | 1,159,350 | ||||
| For the Year Ended | ||||||||||||
| December 31, | ||||||||||||
| 2002 | 2003 | 2004 | ||||||||||
| % | % | % | ||||||||||
| Customer A | 29.8 | 31.6 | 20.6 | |||||||||
| Customer B | 13.3 | 12.0 | 11.1 | |||||||||
| Customer C | 12.6 | 13.6 | 8.5 | |||||||||
| Others | 44.3 | 42.8 | 59.8 | |||||||||
| 100.0 | 100.0 | 100.0 | ||||||||||
| 28. | Condensed Consolidating Financial Information |
F-46
Table of Contents
| STATS | Guarantor | Non-Guarantor | ||||||||||||||||||||
| ChipPAC | Subsidiaries | Subsidiaries | Eliminations | Consolidated | ||||||||||||||||||
| Net revenues | $ | 204,788 | $ | 4,045 | $ | 17,573 | $ | (668 | ) | $ | 225,738 | |||||||||||
| Cost of revenues | (227,811 | ) | (7,415 | ) | (13,115 | ) | 398 | (247,943 | ) | |||||||||||||
| Gross profit (loss) | (23,023 | ) | (3,370 | ) | 4,458 | (270 | ) | (22,205 | ) | |||||||||||||
| Operating expenses: | ||||||||||||||||||||||
| Selling, general and administrative | 34,062 | 1,513 | 1,574 | (456 | ) | 36,693 | ||||||||||||||||
| Research and development | 18,507 | — | 585 | (236 | ) | 18,856 | ||||||||||||||||
| Asset impairments | 14,666 | — | — | — | 14,666 | |||||||||||||||||
| Prepaid leases written off | 764 | — | — | — | 764 | |||||||||||||||||
| Other general expenses (income), net | (681 | ) | — | — | 1,229 | 548 | ||||||||||||||||
| Total operating expenses | 67,318 | 1,513 | 2,159 | 537 | 71,527 | |||||||||||||||||
| Operating income (loss) | (90,341 | ) | (4,883 | ) | 2,299 | (807 | ) | (93,732 | ) | |||||||||||||
| Other income (expense), net: | ||||||||||||||||||||||
| Interest income | 5,075 | 3 | 193 | — | 5,271 | |||||||||||||||||
| Interest expense | (9,595 | ) | — | (819 | ) | — | (10,414 | ) | ||||||||||||||
| Foreign currency exchange gain (loss) | (366 | ) | — | (146 | ) | — | (512 | ) | ||||||||||||||
| Equity loss from investment in subsidiaries | (4,470 | ) | — | — | 4,470 | — | ||||||||||||||||
| Other non-operating income, net | 3,375 | — | 44 | — | 3,419 | |||||||||||||||||
| Total other income (expense), net | (5,981 | ) | 3 | (728 | ) | 4,470 | (2,236 | ) | ||||||||||||||
| Income (loss) before income taxes | (96,322 | ) | (4,880 | ) | 1,571 | 3,663 | (95,968 | ) | ||||||||||||||
| Income tax benefit (expense) | 7,810 | (124 | ) | (523 | ) | — | 7,163 | |||||||||||||||
| Loss before minority interest | (88,512 | ) | (5,004 | ) | 1,048 | 3,663 | (88,805 | ) | ||||||||||||||
| Minority interest | — | — | — | (514 | ) | (514 | ) | |||||||||||||||
| Net income (loss) | $ | (88,512 | ) | $ | (5,004 | ) | $ | 1,048 | $ | 3,149 | $ | (89,319 | ) | |||||||||
F-47
Table of Contents
| STATS | Guarantor | Non-Guarantor | |||||||||||||||||||
| ChipPAC | Subsidiaries | Subsidiaries | Eliminations | Consolidated | |||||||||||||||||
Cash Flows From Operating Activities | |||||||||||||||||||||
| Net income (loss) | $ | (88,512 | ) | $ | (5,004 | ) | $ | 1,048 | $ | 3,149 | $ | (89,319 | ) | ||||||||
| Adjustments to reconcile net income (loss) to net cash provided by operating activities: | |||||||||||||||||||||
| Depreciation and amortization | 92,685 | 4,978 | 8,204 | (401 | ) | 105,466 | |||||||||||||||
| Asset impairments and prepaid expenses written off | 15,430 | — | — | — | 15,430 | ||||||||||||||||
| Amortization of leasing prepayments | 18,755 | 467 | — | — | 19,222 | ||||||||||||||||
| Debt issuance cost amortization | 882 | — | — | — | 882 | ||||||||||||||||
| Loss (gain) on sale of property, plant and equipment | (667 | ) | 19 | 142 | 1,208 | 702 | |||||||||||||||
| Accretion of discount on convertible notes | 5,013 | — | — | — | 5,013 | ||||||||||||||||
| Foreign currency exchange loss | 367 | — | — | — | 367 | ||||||||||||||||
| Deferred income taxes | (8,660 | ) | 208 | 263 | — | (8,189 | ) | ||||||||||||||
| Non-cash compensation | 1,023 | — | — | — | 1,023 | ||||||||||||||||
| Minority interest in income of subsidiary | — | — | — | 514 | 514 | ||||||||||||||||
| Loss (gain) on sale and maturity of marketable securities | (134 | ) | — | 9 | — | (125 | ) | ||||||||||||||
| Equity loss from investment in subsidiaries | 4,470 | — | — | (4,470 | ) | — | |||||||||||||||
| Others | (3 | ) | — | — | — | (3 | ) | ||||||||||||||
| Changes in operating working capital: | |||||||||||||||||||||
| Accounts receivable | (19,270 | ) | (880 | ) | (3,483 | ) | — | (23,633 | ) | ||||||||||||
| Amounts due from affiliates | (2,345 | ) | (406 | ) | — | 721 | (2,030 | ) | |||||||||||||
| Inventories | (2,482 | ) | — | — | — | (2,482 | ) | ||||||||||||||
| Other receivables, prepaid expenses and other assets | (867 | ) | (8 | ) | (18 | ) | — | (893 | ) | ||||||||||||
| Accounts payable, accrued operating expenses and other payables | 4,610 | 1,179 | 1,374 | — | 7,163 | ||||||||||||||||
| Amounts due to affiliates | (104 | ) | 214 | — | (721 | ) | (611 | ) | |||||||||||||
| Net cash provided by operating activities | $ | 20,191 | $ | 767 | $ | 7,539 | $ | — | $ | 28,497 | |||||||||||
Cash Flows From Investing Activities | |||||||||||||||||||||
| Proceeds from sales of marketable securities | $ | 105,829 | $ | — | $ | 5,133 | $ | — | $ | 110,962 | |||||||||||
| Proceeds from maturity of marketable securities | 2,844 | — | — | — | 2,844 | ||||||||||||||||
| Purchases of marketable securities | (151,748 | ) | — | (6,228 | ) | — | (157,976 | ) | |||||||||||||
| Acquisition of intangible assets | (65 | ) | — | — | — | (65 | ) | ||||||||||||||
| Acquisition of subsidiary, net of cash acquired | (13,831 | ) | — | — | 13,831 | — | |||||||||||||||
| Purchases of property, plant and equipment | (73,131 | ) | (14,251 | ) | (27,447 | ) | 1,660 | (113,169 | ) | ||||||||||||
| Others, net | 2,342 | 10 | 59 | (1,660 | ) | 751 | |||||||||||||||
| Net cash used in investing activities | $ | (127,760 | ) | $ | (14,241 | ) | $ | (28,483 | ) | $ | 13,831 | $ | (156,653 | ) | |||||||
Cash Flows From Financing Activities | |||||||||||||||||||||
| Repayment of long-term debt | $ | (14,321 | ) | $ | — | $ | — | $ | — | $ | (14,321 | ) | |||||||||
| Proceeds from issuance of shares | 1,256 | — | 22 | — | 1,278 | ||||||||||||||||
| Proceeds from issuance of convertible notes, net of expenses | 195,032 | — | — | — | 195,032 | ||||||||||||||||
| Proceeds from bank borrowings | 21 | — | 20,571 | — | 20,592 | ||||||||||||||||
| Increase in restricted cash | (3,500 | ) | — | (9,526 | ) | — | (13,026 | ) | |||||||||||||
| Grants received | 1,150 | — | — | — | 1,150 | ||||||||||||||||
| Capital lease payments | (7,993 | ) | — | (2,089 | ) | — | (10,082 | ) | |||||||||||||
| Cash proceeds from parent company | — | 13,831 | — | (13,831 | ) | — | |||||||||||||||
| Net cash provided by financing activities | $ | 171,645 | $ | 13,831 | $ | 8,978 | $ | (13,831 | ) | $ | 180,623 | ||||||||||
F-48
Table of Contents
| STATS | Guarantor | Non-Guarantor | ||||||||||||||||||
| ChipPAC | Subsidiaries | Subsidiaries | Eliminations | Consolidated | ||||||||||||||||
| Net increase (decrease) in cash and cash equivalents | $ | 64,076 | $ | 357 | $ | (11,966 | ) | $ | — | $ | 52,467 | |||||||||
| Effect of exchange rate changes on cash and cash equivalents | (340 | ) | — | 320 | — | (20 | ) | |||||||||||||
| Cash and cash equivalents at beginning of the year | 99,910 | 41 | 15,263 | — | 115,214 | |||||||||||||||
| Cash and cash equivalents at end of the year | $ | 163,646 | $ | 398 | $ | 3,617 | $ | — | $ | 167,661 | ||||||||||
F-49
Table of Contents
| STATS | Guarantor | Non-Guarantor | ||||||||||||||||||||
| ChipPAC | Subsidiaries | Subsidiaries | Eliminations | Consolidated | ||||||||||||||||||
| ASSETS | ||||||||||||||||||||||
| Current assets: | ||||||||||||||||||||||
| Cash and cash equivalents | $ | 297,165 | $ | 221 | $ | 15,777 | $ | — | $ | 313,163 | ||||||||||||
| Short-term marketable securities | 5,272 | — | 5,872 | — | 11,144 | |||||||||||||||||
| Accounts receivable, net | 70,545 | 1,760 | 7,594 | — | 79,899 | |||||||||||||||||
| Amounts due from affiliates | 8,362 | �� | 5,905 | — | (7,217 | ) | 7,050 | |||||||||||||||
| Other receivables | 2,459 | 213 | 101 | — | 2,773 | |||||||||||||||||
| Inventories | 19,839 | — | — | — | 19,839 | |||||||||||||||||
| Prepaid expenses and other assets | 12,200 | 139 | 2,524 | — | 14,863 | |||||||||||||||||
| Total current assets | 415,842 | 8,238 | 31,868 | (7,217 | ) | 448,731 | ||||||||||||||||
| Long-term marketable securities | 23,162 | — | 151 | — | 23,313 | |||||||||||||||||
| Prepaid expenses | 6,283 | — | — | — | 6,283 | |||||||||||||||||
| Property, plant and equipment, net | 364,246 | 12,780 | 97,361 | (254 | ) | 474,133 | ||||||||||||||||
| Intangible assets | 1,548 | — | 392 | — | 1,940 | |||||||||||||||||
| Investment in subsidiaries | 60,824 | — | — | (60,824 | ) | — | ||||||||||||||||
| Goodwill | — | — | — | 2,209 | 2,209 | |||||||||||||||||
| Other assets | 29,316 | — | 7,927 | — | 37,243 | |||||||||||||||||
| Total assets | $ | 901,221 | $ | 21,018 | $ | 137,699 | $ | (66,086 | ) | $ | 993,852 | |||||||||||
| LIABILITIES AND SHAREHOLDERS’ EQUITY | ||||||||||||||||||||||
| Current liabilities: | ||||||||||||||||||||||
| Accounts and other payable | $ | 6,649 | $ | 358 | $ | 1,035 | $ | — | $ | 8,042 | ||||||||||||
| Payables related to property, plant and equipment purchases | 40,825 | 384 | 12,880 | — | 54,089 | |||||||||||||||||
| Accrued operating expenses | 36,623 | 1,944 | 2,094 | — | 40,661 | |||||||||||||||||
| Income taxes payable | 2,195 | — | 1,188 | — | 3,383 | |||||||||||||||||
| Amounts due to affiliates | 7,862 | 134 | 1,057 | (7,217 | ) | 1,836 | ||||||||||||||||
| Current obligations under capital leases | 1,880 | 2,662 | 754 | — | 5,296 | |||||||||||||||||
| Current installments of long-term debt | — | — | 6,841 | — | 6,841 | |||||||||||||||||
| Total current liabilities | 96,034 | 5,482 | 25,849 | (7,217 | ) | 120,148 | ||||||||||||||||
| Obligations under capital leases, excluding current installments | 812 | — | — | — | 812 | |||||||||||||||||
| Long-term debt, excluding current installments | 327,379 | — | 31,410 | — | 358,789 | |||||||||||||||||
| Other non-current liabilities | 1,212 | — | 3,251 | — | 4,463 | |||||||||||||||||
| Total liabilities | 425,437 | 5,482 | 60,510 | (7,217 | ) | 484,212 | ||||||||||||||||
F-50
Table of Contents
| STATS | Guarantor | Non-Guarantor | |||||||||||||||||||
| ChipPAC | Subsidiaries | Subsidiaries | Eliminations | Consolidated | |||||||||||||||||
| Minority interest | — | — | — | 33,684 | 33,684 | ||||||||||||||||
| Issued shares | 172,434 | — | 71,140 | (71,140 | ) | 172,434 | |||||||||||||||
| Additional paid-in capital | 489,337 | 21,903 | 6,765 | (28,650 | ) | 489,355 | |||||||||||||||
| Accumulated other comprehensive loss | (9,921 | ) | — | (2,189 | ) | 2,189 | (9,921 | ) | |||||||||||||
| Accumulated earnings (deficit) | (176,066 | ) | (6,367 | ) | 1,473 | 5,048 | (175,912 | ) | |||||||||||||
| Total shareholders’ equity | 475,784 | 15,536 | 77,189 | (92,553 | ) | 475,956 | |||||||||||||||
| Total liabilities and shareholder’s equity | $ | 901,221 | $ | 21,018 | $ | 137,699 | $ | (66,086 | ) | $ | 993,852 | ||||||||||
F-51
Table of Contents
| STATS | Guarantor | Non-Guarantor | ||||||||||||||||||||
| ChipPAC | Subsidiaries | Subsidiaries | Eliminations | Consolidated | ||||||||||||||||||
| Net revenues | $ | 337,934 | $ | 12,137 | $ | 31,041 | $ | (421 | ) | $ | 380,691 | |||||||||||
| Cost of revenues | (291,769 | ) | (12,546 | ) | (23,908 | ) | 209 | (328,014 | ) | |||||||||||||
| Gross profit (loss) | 46,165 | (409 | ) | 7,133 | (212 | ) | 52,677 | |||||||||||||||
| Operating expenses: | ||||||||||||||||||||||
| Selling, general and administrative | 32,228 | 2,307 | 2,264 | (324 | ) | 36,475 | ||||||||||||||||
| Research and development | 14,808 | — | 672 | (185 | ) | 15,295 | ||||||||||||||||
| Other general expenses, net | 502 | 536 | — | (664 | ) | 374 | ||||||||||||||||
| Total operating expenses | 47,538 | 2,843 | 2,936 | (1,173 | ) | 52,144 | ||||||||||||||||
| Operating income (loss) | (1,373 | ) | (3,252 | ) | 4,197 | 961 | 533 | |||||||||||||||
| Other income (expense), net: | ||||||||||||||||||||||
| Interest income | 4,618 | — | 167 | — | 4,785 | |||||||||||||||||
| Interest expense | (12,474 | ) | — | (1,520 | ) | — | (13,994 | ) | ||||||||||||||
| Foreign currency exchange gain (loss) | 1,496 | — | 138 | — | 1,634 | |||||||||||||||||
| Equity loss from investment in subsidiaries | (1,590 | ) | — | — | 1,590 | — | ||||||||||||||||
| Other non-operating income (expense), net | 7,611 | — | (41 | ) | — | 7,570 | ||||||||||||||||
| Total other income (expense), net | (339 | ) | — | (1,256 | ) | 1,590 | (5 | ) | ||||||||||||||
| Income (loss) before income taxes | (1,712 | ) | (3,252 | ) | 2,941 | 2,551 | 528 | |||||||||||||||
| Income tax benefit (expense) | (965 | ) | 774 | (514 | ) | — | (705 | ) | ||||||||||||||
| Loss before minority interest | (2,677 | ) | (2,478 | ) | 2,427 | 2,551 | (177 | ) | ||||||||||||||
| Minority interest | — | — | — | (1,539 | ) | (1,539 | ) | |||||||||||||||
| Net income (loss) | $ | (2,677 | ) | $ | (2,478 | ) | $ | 2,427 | $ | 1,012 | $ | (1,716 | ) | |||||||||
F-52
Table of Contents
| STATS | Guarantor | Non-Guarantor | ||||||||||||||||||
| ChipPAC | Subsidiaries | Subsidiaries | Eliminations | Consolidated | ||||||||||||||||
Cash Flows From Operating Activities | ||||||||||||||||||||
| Net income (loss) | $ | (2,677 | ) | $ | (2,478 | ) | $ | 2,427 | $ | 1,012 | $ | (1,716 | ) | |||||||
| Adjustments to reconcile net income (loss) to net cash provided by operating activities: | ||||||||||||||||||||
| Depreciation and amortization | 98,823 | 5,761 | 16,235 | (209 | ) | 120,610 | ||||||||||||||
| Amortization of leasing prepayments | 11,732 | — | — | — | 11,732 | |||||||||||||||
| Debt issuance cost amortization | 1,155 | — | — | — | 1,155 | |||||||||||||||
| Loss (gain) on sale of property, plant and equipment | 503 | 307 | 42 | (752 | ) | 100 | ||||||||||||||
| Accretion of discount on convertible notes | 7,366 | — | — | — | 7,366 | |||||||||||||||
| Foreign currency exchange loss (gain) | (2,875 | ) | — | (492 | ) | — | (3,367 | ) | ||||||||||||
| Loss (gain) on sale and maturity of marketable securities | (5,025 | ) | — | (15 | ) | — | (5,040 | ) | ||||||||||||
| Deferred income taxes | (741 | ) | — | (505 | ) | — | (1,246 | ) | ||||||||||||
| Minority interest in loss of subsidiary | — | — | — | 1,539 | 1,539 | |||||||||||||||
| Equity loss from investment in subsidiaries | 1,590 | — | — | (1,590 | ) | — | ||||||||||||||
| Others | — | — | (54 | ) | — | (54 | ) | |||||||||||||
| Changes in operating working capital: | ||||||||||||||||||||
| Accounts receivable | (27,196 | ) | (865 | ) | (2,216 | ) | — | (30,277 | ) | |||||||||||
| Amounts due to affiliates | (2,827 | ) | (643 | ) | 1 | 537 | (2,932 | ) | ||||||||||||
| Inventories | (10,095 | ) | — | — | — | (10,095 | ) | |||||||||||||
| Other receivables, prepaid expenses and other assets | (15,854 | ) | 604 | (1,533 | ) | — | (16,783 | ) | ||||||||||||
| Accounts payable, accrued operating expenses and other payables | 9,640 | 368 | 1,761 | — | 11,769 | |||||||||||||||
| Amounts due to affiliates | 1,010 | (743 | ) | 57 | (537 | ) | (213 | ) | ||||||||||||
| Net cash provided by operating activities | $ | 64,529 | $ | 2,311 | $ | 15,708 | $ | — | $ | 82,548 | ||||||||||
Cash Flows From Investing Activities | ||||||||||||||||||||
| Proceeds from sales of marketable securities | $ | 70,238 | $ | — | $ | 7,328 | $ | — | $ | 77,566 | ||||||||||
| Proceeds from maturity of marketable securities | 5,753 | — | — | — | 5,753 | |||||||||||||||
| Purchases of marketable securities | (32,924 | ) | — | (10,926 | ) | — | (43,850 | ) | ||||||||||||
| Acquisition of subsidiary, net of cash acquired | (15,533 | ) | — | 3,092 | 12,441 | — | ||||||||||||||
| Purchase of additional shares in subsidiary | (467 | ) | — | — | — | (467 | ) | |||||||||||||
| Purchases of property, plant and equipment | (168,968 | ) | (2,172 | ) | (38,186 | ) | — | (209,326 | ) | |||||||||||
| Others, net | (4,136 | ) | 1 | 189 | — | (3,946 | ) | |||||||||||||
| Net cash used in investing activities | $ | (146,037 | ) | $ | (2,171 | ) | $ | (38,503 | ) | $ | 12,441 | $ | (174,270 | ) | ||||||
Cash Flows From Financing Activities | ||||||||||||||||||||
| Repayment of short-term debt | $ | — | $ | — | $ | (27,419 | ) | $ | — | $ | (27,419 | ) | ||||||||
| Repayment of long-term debt | (14,768 | ) | — | (4,945 | ) | — | (19,713 | ) | ||||||||||||
| Proceeds from issuance of shares | 112,245 | — | 17,673 | (12,441 | ) | 117,477 | ||||||||||||||
| Proceeds from issuance of convertible | ||||||||||||||||||||
| notes, net of expenses | 112,345 | — | — | — | 112,345 | |||||||||||||||
| Proceeds from bank borrowings | — | — | 49,839 | — | 49,839 | |||||||||||||||
| Decrease in restricted cash | 3,500 | — | 4,723 | — | 8,223 | |||||||||||||||
| Grants received | 6,784 | — | — | — | 6,784 | |||||||||||||||
| Capital lease payments | (7,405 | ) | (317 | ) | (5,140 | ) | — | (12,862 | ) | |||||||||||
| Net cash provided by (used in) financing activities | $ | 212,701 | $ | (317 | ) | $ | 34,731 | $ | (12,441 | ) | $ | 234,674 | ||||||||
F-53
Table of Contents
| STATS | Guarantor | Non-Guarantor | ||||||||||||||||||
| ChipPAC | Subsidiaries | Subsidiaries | Eliminations | Consolidated | ||||||||||||||||
| Net increase (decrease) in cash and cash equivalents | $ | 131,193 | $ | (177 | ) | $ | 11,936 | $ | — | $ | 142,952 | |||||||||
| Effect of exchange rate changes on cash and cash equivalents | 2,326 | — | 224 | — | 2,550 | |||||||||||||||
| Cash and cash equivalents at beginning of the year | 163,646 | 398 | 3,617 | — | 167,661 | |||||||||||||||
| Cash and cash equivalents at end of the year | $ | 297,165 | $ | 221 | $ | 15,777 | $ | — | $ | 313,163 | ||||||||||
F-54
Table of Contents
| STATS | Guarantor | Non-Guarantor | ||||||||||||||||||||||||
| ChipPAC | ChipPAC | Subsidiaries | Subsidiaries | Eliminations | Consolidated | |||||||||||||||||||||
| ASSETS | ||||||||||||||||||||||||||
| Current assets: | ||||||||||||||||||||||||||
| Cash and cash equivalents | $ | 184,824 | $ | 533 | $ | 20,978 | $ | 21,174 | $ | — | $ | 227,509 | ||||||||||||||
| Marketable securities | — | — | 787 | 1,273 | — | 2,060 | ||||||||||||||||||||
| Accounts receivable, net | 66,875 | — | 70,444 | 12,331 | — | 149,650 | ||||||||||||||||||||
| Amounts due from affiliates | 250,479 | 194,605 | 32,635 | 3,719 | (478,815 | ) | 2,623 | |||||||||||||||||||
| Other receivables | 8,022 | 70 | 8,483 | 238 | — | 16,813 | ||||||||||||||||||||
| Inventories | 19,916 | — | 28,440 | 6,334 | — | 54,690 | ||||||||||||||||||||
| Prepaid expenses and other assets | 32,971 | 1,525 | 1,013 | 3,327 | — | 38,836 | ||||||||||||||||||||
| Total current assets | 563,087 | 196,733 | 162,780 | 48,396 | (478,815 | ) | 492,181 | |||||||||||||||||||
| Marketable securities | 18,097 | — | — | 24 | — | 18,121 | ||||||||||||||||||||
| Prepaid expenses | 7,072 | — | 5,224 | — | — | 12,296 | ||||||||||||||||||||
| Property, plant and equipment, net | 391,523 | 4,912 | 376,014 | 263,530 | (176 | ) | 1,035,803 | |||||||||||||||||||
| Investment in subsidiaries | 750,620 | — | — | — | (750,620 | ) | — | |||||||||||||||||||
| Intangible assets | 1,398 | 2,802 | 120,174 | 1,456 | — | 125,830 | ||||||||||||||||||||
| Goodwill | — | — | 415,349 | 106,040 | 2,209 | 523,598 | ||||||||||||||||||||
| Other assets | 34,614 | 487 | 23,202 | 5,570 | — | 63,873 | ||||||||||||||||||||
| Total assets | $ | 1,766,411 | $ | 204,934 | $ | 1,102,743 | $ | 425,016 | $ | (1,227,402 | ) | $ | 2,271,702 | |||||||||||||
| LIABILITIES AND SHAREHOLDERS’ EQUITY | ||||||||||||||||||||||||||
| Current liabilities: | ||||||||||||||||||||||||||
| Accounts payable | $ | 7,957 | $ | 2,314 | $ | 43,596 | $ | 14,714 | $ | (8 | ) | $ | 68,573 | |||||||||||||
| Payables related to property, plant and equipment purchases | 20,028 | 4 | 17,878 | 13,728 | — | 51,638 | ||||||||||||||||||||
| Accrued operating expenses | 36,773 | 8,307 | 11,335 | 7,484 | — | 63,899 | ||||||||||||||||||||
| Income taxes payable | — | 13 | 2,005 | 20 | — | 2,038 | ||||||||||||||||||||
| Short term borrowings | — | — | 19,874 | — | — | 19,874 | ||||||||||||||||||||
| Amounts due to affiliates | 4,941 | 173 | 440,622 | 33,216 | (478,815 | ) | 137 | |||||||||||||||||||
| Current obligations under capital leases | 805 | — | 6,782 | — | — | 7,587 | ||||||||||||||||||||
| Current installments of long-term debt | 137,107 | — | — | 17,300 | — | 154,407 | ||||||||||||||||||||
| Total current liabilities | 207,611 | 10,811 | 542,092 | 86,462 | (478,823 | ) | 368,153 | |||||||||||||||||||
| Obligations under capital leases, excluding current installments | — | — | 10,771 | — | — | 10,771 | ||||||||||||||||||||
| Long-term debt, excluding current installments | 399,182 | 200,000 | — | 42,993 | — | 642,175 | ||||||||||||||||||||
| Other non-current liabilities | 268 | — | 45,981 | 4,113 | — | 50,362 | ||||||||||||||||||||
| Total liabilities | 607,061 | 210,811 | 598,844 | 133,568 | (478,823 | ) | 1,071,461 | |||||||||||||||||||
F-55
Table of Contents
| STATS | Guarantor | Non-Guarantor | |||||||||||||||||||||||
| ChipPAC | ChipPAC | Subsidiaries | Subsidiaries | Eliminations | Consolidated | ||||||||||||||||||||
| Minority interest | — | — | — | — | 40,891 | 40,891 | |||||||||||||||||||
| Issued shares | 298,233 | 991 | — | 81,535 | (82,526 | ) | 298,233 | ||||||||||||||||||
| Additional paid-in capital | 1,507,854 | 291,795 | 682,651 | 261,866 | (1,236,554 | ) | 1,507,612 | ||||||||||||||||||
| Accumulated other comprehensive loss | (2,860 | ) | (5,993 | ) | 12,492 | 4,417 | (10,916 | ) | (2,860 | ) | |||||||||||||||
| Accumulated earnings (deficit) | (643,877 | ) | (292,670 | ) | (191,244 | ) | (56,370 | ) | 540,526 | (643,635 | ) | ||||||||||||||
| Total shareholders’ equity | 1,159,350 | (5,877 | ) | 503,899 | 291,448 | (789,470 | ) | 1,159,350 | |||||||||||||||||
| Total liabilities and shareholder’s equity | $ | 1,766,411 | $ | 204,934 | $ | 1,102,743 | $ | 425,016 | $ | (1,227,402 | ) | $ | 2,271,702 | ||||||||||||
F-56
Table of Contents
| STATS | Guarantor | Non-Guarantor | ||||||||||||||||||||||||
| ChipPAC | ChipPAC | Subsidiaries | Subsidiaries | Eliminations | Consolidated | |||||||||||||||||||||
| Net revenues | $ | 462,697 | $ | 9,703 | $ | 259,785 | $ | 83,382 | $ | (46,446 | ) | $ | 769,121 | |||||||||||||
| Cost of revenues | (390,673 | ) | (203 | ) | (225,543 | ) | (73,690 | ) | 46,569 | (643,540 | ) | |||||||||||||||
| Gross profit (loss) | 72,024 | 9,500 | 34,242 | 9,692 | 123 | 125,581 | ||||||||||||||||||||
| Operating expenses: | ||||||||||||||||||||||||||
| Selling, general and administrative | 42,887 | 7,682 | 29,133 | 5,273 | — | 84,965 | ||||||||||||||||||||
| Research and development | 10,811 | 1,047 | 4,885 | 894 | — | 17,637 | ||||||||||||||||||||
| Goodwill impairment | — | — | 360,869 | 92,131 | — | 453,000 | ||||||||||||||||||||
| Other general expenses (income), net | (618 | ) | 121 | 33 | (44 | ) | 44 | (464 | ) | |||||||||||||||||
| Total operating expenses | 53,070 | 8,850 | 394,920 | 98,254 | 44 | 555,138 | ||||||||||||||||||||
| Operating income (loss) | 18,954 | 650 | (360,678 | ) | (88,562 | ) | 79 | (429,557 | ) | |||||||||||||||||
| Other income (expense), net: | ||||||||||||||||||||||||||
| Interest income | 7,774 | 9 | 2,770 | 123 | (6,246 | ) | 4,430 | |||||||||||||||||||
| Interest expense | (19,173 | ) | (2,875 | ) | (11,458 | ) | (1,556 | ) | 6,246 | (28,816 | ) | |||||||||||||||
| Foreign currency exchange gain (loss) | (206 | ) | — | (1,034 | ) | 118 | — | (1,122 | ) | |||||||||||||||||
| Equity income (loss) from investment in subsidiaries | (472,535 | ) | (67,882 | ) | (87,677 | ) | — | 628,094 | — | |||||||||||||||||
| Other non-operating income, net | (675 | ) | 12 | (531 | ) | 258 | — | (936 | ) | |||||||||||||||||
| Total other income (expense), net | (484,815 | ) | (70,736 | ) | (97,930 | ) | (1,057 | ) | 628,094 | (26,444 | ) | |||||||||||||||
| Income (loss) before income taxes | (465,861 | ) | (70,086 | ) | (458,608 | ) | (89,619 | ) | 628,173 | (456,001 | ) | |||||||||||||||
| Income tax benefit (expense) | (1,862 | ) | (14 | ) | (7,015 | ) | 997 | — | (7,894 | ) | ||||||||||||||||
| Loss before minority interest | (467,723 | ) | (70,100 | ) | (465,623 | ) | (88,622 | ) | 628,173 | (463,895 | ) | |||||||||||||||
| Minority interest | — | — | — | — | (3,828 | ) | (3,828 | ) | ||||||||||||||||||
| Net income (loss) | $ | (467,723 | ) | $ | (70,100 | ) | $ | (465,623 | ) | $ | (88,622 | ) | $ | 624,345 | $ | (467,723 | ) | |||||||||
F-57
Table of Contents
| STATS | Guarantor | Non-Guarantor | ||||||||||||||||||||||
| ChipPAC | ChipPAC | Subsidiaries | Subsidiaries | Eliminations | Consolidated | |||||||||||||||||||
Cash Flows From Operating Activities | ||||||||||||||||||||||||
| Net income (loss) | $ | (467,723 | ) | $ | (70,100 | ) | $ | (465,623 | ) | $ | (88,622 | ) | $ | 624,345 | $ | (467,723 | ) | |||||||
| Adjustments to reconcile net income (loss) to net cash provided by operating activities: | ||||||||||||||||||||||||
| Depreciation and amortization | 104,141 | 628 | 54,320 | 29,638 | (44 | ) | 188,683 | |||||||||||||||||
| Goodwill impairment | — | — | 360,869 | 92,131 | — | 453,000 | ||||||||||||||||||
| Amortization of leasing prepayments | 25,718 | — | — | — | — | 25,718 | ||||||||||||||||||
| Debt issuance cost amortization | 1,741 | — | — | 172 | — | 1,913 | ||||||||||||||||||
| Loss (gain) on sale of property, plant and equipment | (631 | ) | — | 5 | (30 | ) | — | (656 | ) | |||||||||||||||
| Accretion of discount on convertible notes | 11,923 | — | (486 | ) | — | — | 11,437 | |||||||||||||||||
| Loss from early debt extinguishment | 266 | — | 531 | — | — | 797 | ||||||||||||||||||
| Foreign currency exchange loss (gain) | (516 | ) | — | — | (314 | ) | — | (830 | ) | |||||||||||||||
| Deferred income taxes | 9,145 | — | 6,665 | (805 | ) | — | 15,005 | |||||||||||||||||
| Minority interest in income (loss) of subsidiary | — | — | — | — | 3,828 | 3,828 | ||||||||||||||||||
| Equity loss from investment in subsidiaries | 472,535 | 67,882 | 87,677 | — | (628,094 | ) | — | |||||||||||||||||
| (Gain) Loss on sale and maturity of marketable securities | 503 | — | — | 34 | — | 537 | ||||||||||||||||||
| Others | 1,162 | 127 | (193 | ) | (32 | ) | (35 | ) | 1,029 | |||||||||||||||
| Changes in operating working capital: | ||||||||||||||||||||||||
| Accounts receivable | 3,670 | — | 8,789 | (4,310 | ) | — | 8,149 | |||||||||||||||||
| Amounts due from affiliates | (242,237 | ) | 26,486 | 6,882 | 15,986 | 197,310 | 4,427 | |||||||||||||||||
| Inventories | (77 | ) | — | (946 | ) | (148 | ) | — | (1,171 | ) | ||||||||||||||
| Other receivables, prepaid expenses and other assets | (64,078 | ) | (1,442 | ) | 224 | 875 | — | (64,421 | ) | |||||||||||||||
| Accounts payable, accrued operating expenses and other payables | (2,709 | ) | (23,934 | ) | (11,138 | ) | (3,625 | ) | — | (41,406 | ) | |||||||||||||
| Amounts due to affiliates | (2,918 | ) | (85 | ) | 190,199 | 8,415 | (197,310 | ) | (1,699 | ) | ||||||||||||||
| Net cash provided by operating activities | $ | (150,085 | ) | $ | (438 | ) | $ | 237,775 | $ | 49,365 | $ | — | $ | 136,617 | ||||||||||
Cash Flows From Investing Activities | ||||||||||||||||||||||||
| Proceeds from sales of marketable securities | $ | 101,323 | $ | — | $ | — | $ | 29,174 | $ | — | $ | 130,497 | ||||||||||||
| Proceeds from maturity of marketable securities | 46,687 | — | — | — | — | 46,687 | ||||||||||||||||||
| Purchases of marketable securities | (137,124 | ) | — | 222 | (24,041 | ) | — | (160,943 | ) | |||||||||||||||
| Acquisition of intangible assets | — | (399 | ) | (555 | ) | (474 | ) | — | (1,428 | ) | ||||||||||||||
| Acquisition of subsidiary, net of cash acquired | (14,049 | ) | — | — | 4,680 | 16,577 | 7,208 | |||||||||||||||||
| Purchases of property, plant and equipment | (172,320 | ) | (1,090 | ) | (60,327 | ) | (81,225 | ) | 27,388 | (287,574 | ) | |||||||||||||
| Others, net | 20,926 | 33 | 3,144 | 4,014 | (27,388 | ) | 729 | |||||||||||||||||
| Net cash used in investing activities | $ | (154,557 | ) | $ | (1,456 | ) | $ | (57,516 | ) | $ | (67,872 | ) | $ | 16,577 | $ | (264,824 | ) | |||||||
Cash Flows From Financing Activities | ||||||||||||||||||||||||
| Repayment of short-term debt | $ | (50,000 | ) | $ | — | $ | — | $ | (22,006 | ) | $ | — | $ | (72,006 | ) | |||||||||
| Repayment of long-term debt | — | — | — | (8,982 | ) | — | (8,982 | ) | ||||||||||||||||
| Proceeds from issuance of shares, net of expenses | 1,968 | — | — | — | — | 1,968 | ||||||||||||||||||
| Proceeds from issuance of convertible and senior notes, net of expenses | 210,458 | — | — | — | — | 210,458 | ||||||||||||||||||
| Repurchase of senior and convertible notes | (18,083 | ) | — | (175,564 | ) | — | — | (193,647 | ) | |||||||||||||||
| Proceeds from bank borrowings | 50,000 | — | 8,016 | 49,604 | — | 107,620 | ||||||||||||||||||
| Decrease in restricted cash | — | — | — | 2,927 | — | 2,927 | ||||||||||||||||||
| Capital lease payments | (2,042 | ) | — | (4,390 | ) | (778 | ) | — | (7,210 | ) | ||||||||||||||
| Net cash provided by (used in) financing activities | $ | 192,301 | $ | — | $ | (171,938 | ) | $ | 20,765 | $ | — | $ | 41,128 | |||||||||||
F-58
Table of Contents
| STATS | Guarantor | Non-Guarantor | ||||||||||||||||||||||
| ChipPAC | ChipPAC | Subsidiaries | Subsidiaries | Eliminations | Consolidated | |||||||||||||||||||
| Net decrease in cash and cash equivalents | $ | (112,341 | ) | $ | (1,894 | ) | $ | 8,321 | $ | 2,258 | $ | 16,577 | $ | (87,079 | ) | |||||||||
| Effect of exchange rate changes on cash and cash equivalents | — | — | — | 1,425 | — | 1,425 | ||||||||||||||||||
| Cash and cash equivalents at beginning of the year/period | 297,165 | 2,427 | 12,657 | 17,491 | (16,577 | ) | 313,163 | |||||||||||||||||
| Cash and cash equivalents at end of the year | $ | 184,824 | $ | 533 | $ | 20,978 | $ | 21,174 | $ | — | $ | 227,509 | ||||||||||||
F-59
Table of Contents
| S-1 | ||||
| S-14 | ||||
| S-15 | ||||
| S-16 |
Table of Contents
STATS CHIPPAC LTD.
AND ITS SUBSIDIARIES
DIRECTORS’ REPORT
For the financial year ended 31 December 2004
The directors present their report to the members together with the audited financial statements of the Group for the financial year ended 31 December 2004 and the balance sheet of the Company at 31 December 2004.
Directors
The directors of the Company in office at the date of this report are:
| Charles Richard Wofford | (Chairman) | |
| Lim Ming Seong | (Deputy Chairman) | |
| Tan Lay Koon | (Director, President and Chief Executive Officer) | |
| Peter Seah Lim Huat | ||
| Tay Siew Choon | ||
| Steven Hugh Hamblin | ||
| Richard John Agnich | ||
| Robert W. Conn | (Appointed on 5 August 2004) | |
| Rockford Douglas Norby | (Appointed on 5 August 2004) | |
| Park Chong Sup | (Appointed on 5 August 2004) |
On 5 August 2004, the Company’s name was changed from ST Assembly Test Services Ltd (“STATS”) to STATS ChipPAC Ltd., pursuant to a merger with ChipPAC, Inc. (“ChipPAC”) in a stock-for-stock transaction, wherein former ChipPAC stockholders received 0.87 American Depositary Shares of STATS for each stock of ChipPAC Class A common stock, par value $0.01 per stock, owned by such stockholders.
Arrangements to enable directors to acquire shares and debentures
Neither at the end of nor at any time during the financial year was the Company a party to any arrangement whose object is to enable the directors of the Company to acquire benefits by means of the acquisition of shares in, or debentures of, the Company or any other body corporate, other than as disclosed under “Share Options”.
Directors’ interests in shares or debentures
| (a) | According to the register of directors’ shareholdings, none of the directors holding office at the end of the financial year had any interest or was deemed to have any interest in the shares or debentures of the Company or related corporations, except as follows : |
S-1
Table of Contents
STATS CHIPPAC LTD.
AND ITS SUBSIDIARIES
DIRECTORS’ REPORT
For the financial year ended 31 December 2004
The Company — Ordinary shares of S$0.25 each fully paid
| At 1.1.2004 or date of | At | |||||||
| appointment, if later | 31.12.2004 | |||||||
| Charles Richard Wofford | 60,000 | 105,000 | ||||||
| Tan Lay Koon | 63,000 | 63,000 | ||||||
| Tay Siew Choon | 4,000 | 4,000 | ||||||
| Steven Hugh Hamblin | 55,000 | 85,000 | ||||||
| Park Chong Sup | 67,120 | 67,120 | ||||||
The Company — Share options in unissued ordinary shares of S$0.25 each1
| At 1.1.2004 | Per Share | |||||||||||||
| or date of | Exercise | |||||||||||||
| appointment, | At | Price | ||||||||||||
| if later | 31.12.2004 | S$ | Exercisable Period | |||||||||||
| Charles Richard Wofford | 20,000 | — | 0.25 | 09/02/2000 to 11/06/2004 | ||||||||||
| 20,000 | — | 3.554 | 09/02/2000 to 21/11/2004 | |||||||||||
| 25,000 | — | 0.42 | 09/02/2000 to 09/12/2004 | |||||||||||
| 40,000 | 40,000 | 6.93 | 20/04/2001 to 19/04/2005 | |||||||||||
| 50,000 | 50,000 | 1.592 | 24/04/2002 to 23/04/2006 | |||||||||||
| 70,000 | 70,000 | 2.885 | 29/04/2003 to 28/04/2007 | |||||||||||
| 100,000 | 100,000 | 1.99 | 06/08/2004 to 05/08/2008 | |||||||||||
| — | 50,000 | 1.91 | 17/02/2005 to 16/02/2009 | |||||||||||
| — | 50,000 | 1.06 | 11/08/2005 to 10/08/2009 | |||||||||||
| Lim Ming Seong | 200,000 | 200,000 | 1.592 | 24/04/2002 to 23/04/2011 | ||||||||||
| 70,000 | 70,000 | 2.885 | 29/04/2003 to 28/04/2007 | |||||||||||
| 70,000 | 70,000 | 1.99 | 06/08/2004 to 05/08/2008 | |||||||||||
| — | 35,000 | 1.91 | 17/02/2005 to 16/02/2009 | |||||||||||
| — | 35,000 | 1.06 | 11/08/2005 to 10/08/2009 | |||||||||||
| Tan Lay Koon | 500,000 | 500,000 | 6.93 | 20/04/2001 to 19/04/2010 | ||||||||||
| 700,000 | 700,000 | 2.826 | 19/10/2001 to 18/10/2010 | |||||||||||
| 449,000 | 449,000 | 1.592 | 24/04/2002 to 23/04/2011 | |||||||||||
| 325,000 | 325,000 | 2.885 | 29/04/2003 to 28/04/2012 | |||||||||||
| 2,000,000 | 2,000,000 | 2.20 | 26/06/2003 to 25/06/2012 | |||||||||||
| 700,000 | 700,000 | 1.99 | 06/08/2004 to 05/08/2013 | |||||||||||
| — | 500,000 | 1.91 | 17/02/2005 to 16/02/2014 | |||||||||||
| — | 500,000 | 1.06 | 11/08/2005 to 10/08/2014 | |||||||||||
| Peter Seah Lim Huat | 70,000 | 70,000 | 1.99 | 06/08/2004 to 05/08/2013 | ||||||||||
| — | 35,000 | 1.91 | 17/02/2005 to 16/02/2014 | |||||||||||
| — | 35,000 | 1.06 | 11/08/2005 to 10/08/2014 | |||||||||||
S-2
Table of Contents
STATS CHIPPAC LTD.
AND ITS SUBSIDIARIES
DIRECTORS’ REPORT
For the financial year ended 31 December 2004
The Company — Share options in unissued ordinary shares of S$0.25 each1
| At 1.1.2004 | Per Share | |||||||||||||
| or date of | Exercise | |||||||||||||
| appointment, | At | Price | ||||||||||||
| if later | 31.12.2004 | S$ | Exercisable Period | |||||||||||
| Tay Siew Choon | 70,000 | 70,000 | 1.99 | 06/08/2004 to 05/08/2013 | ||||||||||
| — | 35,000 | 1.91 | 17/02/2005 to 16/02/2014 | |||||||||||
| — | 35,000 | 1.06 | 11/08/2005 to 10/08/2009 | |||||||||||
| Steven Hugh Hamblin | 20,000 | — | 0.25 | 09/02/2000 to 11/06/2004 | ||||||||||
| 10,000 | — | 0.25 | 09/02/2000 to 09/12/2004 | |||||||||||
| 30,000 | — | 3.554 | 09/02/2000 to 21/11/2004 | |||||||||||
| 40,000 | 40,000 | 6.93 | 20/04/2001 to 19/04/2005 | |||||||||||
| 50,000 | 50,000 | 1.592 | 24/04/2002 to 23/04/2006 | |||||||||||
| 70,000 | 70,000 | 2.885 | 29/04/2003 to 28/04/2007 | |||||||||||
| 70,000 | 70,000 | 1.99 | 06/08/2004 to 05/08/2008 | |||||||||||
| — | 35,000 | 1.91 | 17/02/2005 to 16/02/2009 | |||||||||||
| — | 35,000 | 1.06 | 11/08/2005 to 10/08/2009 | |||||||||||
| Richard John Agnich | 20,000 | 20,000 | 1.298 | 23/10/2002 to 22/10/2006 | ||||||||||
| 50,000 | 50,000 | 2.885 | 29/04/2003 to 28/04/2007 | |||||||||||
| 50,000 | 50,000 | 1.99 | 06/08/2004 to 05/08/2008 | |||||||||||
| — | 25,000 | 1.91 | 17/02/2005 to 16/02/2009 | |||||||||||
| — | 25,000 | 1.06 | 11/08/2005 to 10/08/2009 | |||||||||||
| Robert W. Conn | 174,000 | 174,000 | 1.88 | 15/04/2003 to 04/08/2009 | ||||||||||
| 130,500 | 130,500 | 0.50 | 17/03/2004 to 04/08/2009 | |||||||||||
| 130,500 | 130,500 | 1.36 | 05/02/2005 to 04/08/2009 | |||||||||||
| Rockford Douglas Norby | 174,000 | 174,000 | 1.88 | 15/04/2003 to 04/08/2009 | ||||||||||
| 130,500 | 130,500 | 0.50 | 17/03/2004 to 04/08/2009 | |||||||||||
| 130,500 | 130,500 | 1.36 | 05/02/2005 to 04/08/2009 | |||||||||||
| Park Chong Sup | 130,500 | 130,500 | 1.57 | 20/10/2001 to 04/08/2009 | ||||||||||
| 43,500 | 43,500 | 0.38 | 27/09/2002 to 04/08/2009 | |||||||||||
| 130,500 | 130,500 | 0.50 | 17/03/2004 to 04/08/2009 | |||||||||||
| 130,500 | 130,500 | 1.36 | 05/02/2005 to 04/08/2009 | |||||||||||
S-3
Table of Contents
STATS CHIPPAC LTD.
AND ITS SUBSIDIARIES
DIRECTORS’ REPORT
For the financial year ended 31 December 2004
CapitaLand Limited — Ordinary shares of S$1.00 each fully paid
| At 1.1.2004 or date of | At | |||||||
| appointment, if later | 31.12.2004 | |||||||
| Lim Ming Seong | 13,250 | NA2 | ||||||
| Tan Lay Koon | 3,000 | NA2 | ||||||
| Peter Seah Lim Huat | 113,000 | NA2 | ||||||
CapitaLand Limited — Share options in unissued ordinary shares of S$1.00 each
| At 1.1.2004 | Per Share | |||||||||||||||
| or date of | Exercise | |||||||||||||||
| appointment, | At | Price | ||||||||||||||
| if later | 31.12.2004 | S$ | Exercisable Period | |||||||||||||
| Peter Seah Lim Huat | 90,000 | NA2 | 1.71 | 11/05/2003 to 10/05/2007 | ||||||||||||
| 90,000 | NA2 | 1.02 | 01/03/2004 to 28/02/2008 | |||||||||||||
| Tay Siew Choon | 53,850 | NA2 | 2.54 | 13/06/2001 to 11/06/2005 | ||||||||||||
| 50,000 | NA2 | 2.50 | 19/06/2002 to 18/06/2006 | |||||||||||||
| 40,000 | NA2 | 1.71 | 11/05/2003 to 10/05/2007 | |||||||||||||
| 19,000 | NA2 | 1.02 | 01/03/2004 to 28/02/2013 | |||||||||||||
CapitaMall Trust Management Limited — Unit holdings in CapitaMall Trust
| At 1.1.2004 or date of | At | |||||||
| appointment, if later | 31.12.2004 | |||||||
| Lim Ming Seong | 10,000 | NA2 | ||||||
| Peter Seah Lim Huat | 55,000 | NA2 | ||||||
| Tay Siew Choon | 1,165,000 | NA2 | ||||||
PT Indosat Tbk — Share options in unissued ordinary shares of Rp100 each
| At 1.1.2004 | ||||||||||||||||
| or date of | Per Share | |||||||||||||||
| appointment, | At | Exercise | ||||||||||||||
| if later | 31.12.2004 | Price | Exercisable Period | |||||||||||||
| Peter Seah Lim Huat | 150,000 | NA2 | Rp1,567.44 | 01/08/2004 to 31/07/2005 | ||||||||||||
S-4
Table of Contents
STATS CHIPPAC LTD.
AND ITS SUBSIDIARIES
DIRECTORS’ REPORT
For the financial year ended 31 December 2004
Chartered Semiconductor Manufacturing Ltd
— Share options in unissued ordinary shares of S$0.26 each
| At 1.1.2004 | Per Share | |||||||||||||||
| or date of | Exercise | |||||||||||||||
| appointment, | At | Price | ||||||||||||||
| if later | 31.12.2004 | S$ | Exercisable Period | |||||||||||||
| Lim Ming Seong | 58,609 | NA2 | 4.05 | 28/03/2002 to 28/03/2006 | ||||||||||||
| 58,609 | NA2 | 4.26 | 15/08/2002 to 15/08/2006 | |||||||||||||
| 58,609 | NA2 | 3.46 | 22/02/2003 to 22/02/2007 | |||||||||||||
| 58,609 | NA2 | 1.86 | 30/08/2003 to 30/08/2007 | |||||||||||||
| 45,000 | NA2 | 0.72 | 28/02/2004 to 28/02/2008 | |||||||||||||
| 45,000 | NA2 | 1.10 | 29/08/2004 to 29/08/2008 | |||||||||||||
| Peter Seah Lim Huat | 23,443 | NA2 | 3.46 | 22/02/2003 to 22/02/2007 | ||||||||||||
| 46,887 | NA2 | 1.86 | 30/08/2003 to 30/08/2007 | |||||||||||||
| 40,000 | NA2 | 0.72 | 28/02/2004 to 28/02/2008 | |||||||||||||
| 45,000 | NA2 | 1.10 | 29/08/2004 to 29/08/2008 | |||||||||||||
| Tay Siew Choon | 234,439 | NA2 | 3.88 | 01/05/2002 to 01/05/2007 | ||||||||||||
| 23,443 | NA2 | 4.26 | 15/08/2002 to 15/08/2006 | |||||||||||||
| 29,304 | NA2 | 3.46 | 22/02/2003 to 22/02/2007 | |||||||||||||
| 46,887 | NA2 | 1.86 | 30/08/2003 to 30/08/2007 | |||||||||||||
| 25,000 | NA2 | 0.72 | 28/02/2004 to 28/02/2008 | |||||||||||||
| 35,000 | NA2 | 1.10 | 29/08/2004 to 29/08/2008 | |||||||||||||
Green Dot Internet Services Pte Ltd
— Share Options in unissued ordinary shares of S$1.00 each
| At 1.1.2004 | Per Share | |||||||||||||||
| or date of | Exercise | |||||||||||||||
| appointment, | At | Price | ||||||||||||||
| if later | 31.12.2004 | S$ | Exercisable Period | |||||||||||||
| Tay Siew Choon | 16,627 | NA2 | 1.00 | 12/03/2003 to 11/03/2013 | ||||||||||||
Raffles Holdings Limited — Ordinary shares of S$0.50 each fully paid
| At 1.1.2004 or date of | At | |||||||
| appointment, if later | 31.12.2004 | |||||||
| Lim Ming Seong | 12,000 | NA2 | ||||||
| Tay Siew Choon | 10,000 | NA2 | ||||||
S-5
Table of Contents
STATS CHIPPAC LTD.
AND ITS SUBSIDIARIES
DIRECTORS’ REPORT
For the financial year ended 31 December 2004
Singapore Computer Systems Limited — Ordinary shares of S$0.25 each fully paid
| At 1.1.2004 or date of | At | |||||||
| appointment, if later | 31.12.2004 | |||||||
| Tay Siew Choon | 771,000 | NA2 | ||||||
Singapore Computer Systems Limited
— Share Options in unissued ordinary shares of S$0.25 each
| At 1.1.2004 or | Per Share | |||||||||||||||
| date of | Exercise | |||||||||||||||
| appointment, | At | Price | ||||||||||||||
| if later | 31.12.2004 | S$ | Exercisable Period | |||||||||||||
| Tay Siew Choon | 80,000 | NA2 | 2.20 | 19/10/2001 to 18/10/2005 | ||||||||||||
| 100,000 | NA2 | 2.08 | 15/03/2002 to 14/03/2006 | |||||||||||||
| 75,000 | NA2 | 1.55 | 08/03/2003 to 07/03/2007 | |||||||||||||
| 75,000 | NA2 | 0.86 | 22/02/2004 to 21/02/2008 | |||||||||||||
Singapore Computer Systems Limited
— Conditional Award over the following ordinary shares of S$0.25 each in Singapore Computer Systems Limited “SCS” granted under the Green Dot Capital Restricted Stock Plan
| At 1.1.2004 or date of | At | |||||||
| appointment, if later | 31.12.2004 | |||||||
| Tay Siew Choon | 400,000 | 3 | NA2 | |||||
Singapore Food Industries Limited — Ordinary shares of S$0.05 each fully paid
| At 1.1.2004 or date of | At | |||||||
| appointment, if later | 31.12.2004 | |||||||
| Tay Siew Choon | 531,000 | NA2 | ||||||
Singapore Food Industries Limited
— Share Options in unissued ordinary shares of S$0.05 each
| At 1.1.2004 | Per Share | |||||||||||||||
| or date of | Exercise | |||||||||||||||
| appointment, | At | Price | ||||||||||||||
| if later | 31.12.2004 | S$ | Exercisable Period | |||||||||||||
| Tay Siew Choon | 150,000 | NA2 | 0.55 | 24/08/2002 to 23/08/2005 | ||||||||||||
S-6
Table of Contents
STATS CHIPPAC LTD.
AND ITS SUBSIDIARIES
DIRECTORS’ REPORT
For the financial year ended 31 December 2004
Singapore Technologies Engineering Ltd
— Share Options in unissued ordinary shares of S$0.10 each
| At 1.1.2004 | Per Share | |||||||||||||||
| or date of | Exercise | |||||||||||||||
| appointment, | At | Price | ||||||||||||||
| if later | 31.12.2004 | S$ | Exercisable Period | |||||||||||||
| Lim Ming Seong | 15,000 | NA2 | 2.29 | 08/02/2003 to 07/02/2007 | ||||||||||||
| 7,500 | NA2 | 1.79 | 07/02/2004 to 06/02/2008 | |||||||||||||
| 7,500 | NA2 | 1.86 | 12/08/2004 to 11/08/2008 | |||||||||||||
| Peter Seah Lim Huat | 89,000 | NA2 | 1.92 | 13/08/2003 to 12/08/2007 | ||||||||||||
| 44,500 | NA2 | 1.79 | 07/02/2004 to 06/02/2008 | |||||||||||||
| 40,500 | NA2 | 1.86 | 12/08/2004 to 11/08/2008 | |||||||||||||
SembCorp Industries Ltd — Ordinary shares of S$0.25 each fully paid
| At 1.1.2004 or date of | At | |||||||
| appointment, if later | 31.12.2004 | |||||||
| Lim Ming Seong | 91,551 | NA2 | ||||||
| Tay Siew Choon | 54,598 | NA2 | ||||||
SembCorp Industries Ltd
— Share options in unissued ordinary shares of S$0.25 each
| At 1.1.2004 | Per Share | |||||||||||||||
| or date of | Exercise | |||||||||||||||
| appointment, | At | Price | ||||||||||||||
| if later | 31.12.2004 | S$ | Exercisable Period | |||||||||||||
| Peter Seah Lim Huat | 140,000 | NA2 | 1.99 | 27/06/2001 to 26/06/2005 | ||||||||||||
| 140,000 | NA2 | 1.55 | 20/04/2002 to 19/04/2006 | |||||||||||||
| 70,000 | NA2 | 1.59 | 08/05/2003 to 07/05/2007 | |||||||||||||
| 70,000 | NA2 | 0.98 | 18/10/2003 to 17/10/2007 | |||||||||||||
| 70,000 | NA2 | 1.14 | 03/06/2004 to 02/06/2008 | |||||||||||||
| 70,000 | NA2 | 1.29 | 19/11/2004 to 18/11/2008 | |||||||||||||
| Tay Siew Choon | 500,000 | NA2 | 2.26 | 20/05/2001 to 19/05/2009 | ||||||||||||
| 500,000 | NA2 | 1.99 | 27/06/2001 to 26/06/2010 | |||||||||||||
| 50,000 | NA2 | 1.55 | 20/04/2002 to 19/04/2006 | |||||||||||||
| 25,000 | NA2 | 1.59 | 08/05/2003 to 07/05/2007 | |||||||||||||
| 25,000 | NA2 | 0.98 | 18/10/2003 to 17/10/2007 | |||||||||||||
| 25,000 | NA2 | 1.14 | 03/06/2004 to 02/06/2008 | |||||||||||||
| 25,000 | NA2 | 1.29 | 19/11/2004 to 18/11/2008 | |||||||||||||
S-7
Table of Contents
STATS CHIPPAC LTD.
AND ITS SUBSIDIARIES
DIRECTORS’ REPORT
For the financial year ended 31 December 2004
Singapore Telecommunications Limited — Ordinary shares of S$0.15 each fully paid
| At 1.1.2004 or date of | At | |||||||
| appointment, if later | 31.12.2004 | |||||||
| Lim Ming Seong | 3,620 | NA2 | ||||||
| Tan Lay Koon | 3,220 | NA2 | ||||||
| Peter Seah Lim Huat | 3,420 | NA2 | ||||||
| Tay Siew Choon | 3,220 | NA2 | ||||||
SMRT Corporation Ltd — Ordinary shares of S$0.10 each fully paid
| At 1.1.2004 or date of | At | |||||||
| appointment, if later | 31.12.2004 | |||||||
| Tay Siew Choon | 30,000 | 4 | NA2 | |||||
SNP Corporation Ltd — Share options in unissued ordinary shares of S$0.50 each
| At 1.1.2004 | Per Share | |||||||||||||||
| or date of | Exercise | |||||||||||||||
| appointment, | At | Price | ||||||||||||||
| if later | 31.12.2004 | S$ | Exercisable Period | |||||||||||||
| Tay Siew Choon | 20,000 | NA2 | 0.50 | 23/04/2002 to 22/04/2011 | ||||||||||||
| 50,000 | NA2 | 0.69 | 17/04/2003 to 16/04/2007 | |||||||||||||
| 50,000 | NA2 | 0.59 | 15/04/2004 to 14/04/2008 | |||||||||||||
STT Communications Ltd — Share options in unissued ordinary shares of S$0.50 each
| At 1.1.2004 | Per Share | |||||||||||||||
| or date of | Exercise | |||||||||||||||
| appointment, | At | Price | ||||||||||||||
| if later | 31.12.2004 | S$ | Exercisable Period | |||||||||||||
| Lim Ming Seong | 25,000 | NA2 | 0.92 | 28/04/2002 to 27/04/2011 | ||||||||||||
| 50,000 | NA2 | 0.50 | 24/11/2002 to 23/11/2011 | |||||||||||||
| 100,000 | NA2 | 0.50 | 29/06/2003 to 28/06/2007 | |||||||||||||
| 150,000 | NA2 | 0.57 | 30/07/2004 to 29/07/2008 | |||||||||||||
| Peter Seah Lim Huat | 8,000 | NA2 | 0.50 | 29/06/2003 to 28/06/2012 | ||||||||||||
| 39,000 | NA2 | 0.57 | 30/07/2004 to 29/07/2013 | |||||||||||||
| Tay Siew Choon | 100,000 | NA2 | 1.42 | 19/09/2001 to 18/09/2010 | ||||||||||||
| 15,000 | NA2 | 0.92 | 28/04/2002 to 27/04/2011 | |||||||||||||
| 30,000 | NA2 | 0.50 | 24/11/2002 to 23/11/2011 | |||||||||||||
| 80,000 | NA2 | 0.50 | 29/06/2003 to 28/06/2012 | |||||||||||||
| 100,000 | NA2 | 0.57 | 30/07/2004 to 29/07/2013 | |||||||||||||
S-8
Table of Contents
STATS CHIPPAC LTD.
AND ITS SUBSIDIARIES
DIRECTORS’ REPORT
For the financial year ended 31 December 2004
StarHub Ltd — Share options in unissued ordinary shares of S$0.40 each
(formerly known as StarHub Pte Ltd which was listed on SGX-ST in October 2004.)
| At 1.1.2004 | Per Share | |||||||||||||||
| or date of | Exercise | |||||||||||||||
| appointment, | At | Price | ||||||||||||||
| if later | 31.12.2004 | S$ | Exercisable Period | |||||||||||||
| Lim Ming Seong | 250,000 | NA2 | 0.22 | 30/11/2003 to 29/11/2007 | ||||||||||||
| 75,000 | NA2 | 0.22 | 31/05/2004 to 30/05/2008 | |||||||||||||
| 75,000 | NA2 | 0.22 | 29/11/2004 to 28/11/2008 | |||||||||||||
| Peter Seah Lim Huat | 37,500 | NA2 | 0.88 | 30/11/2003 to 29/11/2007 | ||||||||||||
| 18,750 | NA2 | 0.88 | 31/05/2004 to 30/05/2008 | |||||||||||||
| 18,750 | NA2 | 0.88 | 29/11/2004 to 28/11/2008 | |||||||||||||
The Ascott Group Limited
— Share options in unissued ordinary shares of S$0.20 each
| At 1.1.2004 | Per Share | |||||||||||
| or date of | Exercise | |||||||||||
| appointment, | At | Price | ||||||||||
| if later | 31.12.2004 | S$ | Exercisable Period | |||||||||
| Lim Ming Seong | 12,000 | NA2 | 0.32 | 30/06/2002 to 29/06/2011 | ||||||||
| Peter Seah Lim Huat | 12,000 | NA2 | 0.353 | 05/05/2003 to 30/12/2006 | ||||||||
| 30,000 | NA2 | 0.321 | 10/05/2004 to 30/12/2006 | |||||||||
| Tay Siew Choon | 10,000 | NA2 | 0.37 | 21/12/2001 to 20/12/2010 | ||||||||
| 12,000 | NA2 | 0.32 | 30/06/2002 to 29/06/2011 | |||||||||
| 12,000 | NA2 | 0.353 | 05/05/2003 to 04/05/2012 | |||||||||
| 23,000 | NA2 | 0.321 | 10/05/2004 to 09/05/2013 | |||||||||
Vertex Investment (II) Ltd — Ordinary shares of US$1.00 each fully paid
| At 1.1.2004 or date of | At | |||||||
| appointment, if later | 31.12.2004 | |||||||
| Tay Siew Choon | 2 | 4 | NA2 | |||||
S-9
Table of Contents
STATS CHIPPAC LTD.
AND ITS SUBSIDIARIES
DIRECTORS’ REPORT
For the financial year ended 31 December 2004
Vertex Technology Fund Ltd — Ordinary shares of US$1.00 each fully paid
| At 1.1.2004 or date of | At | |||||||
| appointment, if later | 31.12.2004 | |||||||
| Lim Ming Seong | 300 | 4 | NA2 | |||||
| Tay Siew Choon | 20 | 4 | NA2 | |||||
Vertex Technology Fund (II) Ltd — Ordinary shares of US$1.00 each fully paid
| At 1.1.2004 or date of | At | |||||||
| appointment, if later | 31.12.2004 | |||||||
| Charles Richard Wofford | 25 | NA2 | ||||||
| Lim Ming Seong | 50 | 4 | NA2 | |||||
| Tay Siew Choon | 500 | 4 | NA2 | |||||
| Steven Hugh Hamblin | 50 | NA2 | ||||||
Vertex Technology Fund (II) Ltd — Redeemable Preference Shares of US$0.01 each fully paid
| At 1.1.2004 or date of | At | |||||||
| appointment, if later | 31.12.2004 | |||||||
| Charles Richard Wofford | 25 | NA2 | ||||||
| Lim Ming Seong | 50 | 4 | NA2 | |||||
| Tay Siew Choon | 500 | 4 | NA2 | |||||
| Steven Hugh Hamblin | 50 | NA2 | ||||||
| Notes: | ||
| 1 | Options which have been granted with exercise prices denominated in U.S. dollars are presented here in Singapore dollars using the exchange rate based on Bloomberg Close Quote prevailing on the date of grant. | |
| 2 | Ceased to be a related corporation of STATS ChipPAC Ltd. with effect from 5 August 2004. | |
| 3 | Vesting schedule is as follows:- | |
| (a) | 16/12/2002 to 20/06/2003 — 200,000 SCS shares. | |||
| (b) | 01/07/2003 to 30/06/2004 — 200,000 SCS shares. | |||
| (c) | 01/07/2004 to 30/06/2005 — 200,000 SCS shares. | |||
| 4 | Held in trust by a trustee company on behalf of the directors. |
S-10
Table of Contents
STATS CHIPPAC LTD.
AND ITS SUBSIDIARIES
DIRECTORS’ REPORT
For the financial year ended 31 December 2004
Directors’ contractual benefits
Since the end of the previous financial year, no director has received or become entitled to receive a benefit by reason of a contract made by the Company or a related corporation with the director or with a firm of which he is a member or with a company in which he has a substantial financial interest.
Share options — Options Granted
During the financial year, the Company granted the following options to eligible participants pursuant to the:-
| (a) | STATS ChipPAC Ltd. Share Option Plan | |||
| Options to subscribe for 11,522,800 ordinary shares of S$0.25 each fully paid (“Shares”) for cash were granted. The exercise prices of these options range from S$1.035 to S$1.91. The expiration dates of the options range from 17 February 2009 to 7 October 2014. | ||||
| (b) | STATS ChipPAC Ltd. Substitute Share Purchase and Option Plan | |||
| Options to subscribe for 6,461,601 Shares for cash were granted. The exercise prices of these options range from S$0.25 to S$2.50. The expiration dates of the options range from 29 August 2005 to 31 July 2010. | ||||
| (c) | STATS ChipPAC Ltd. Substitute Equity Incentive Plan | |||
| Options to subscribe for 70,031,350 Shares for cash were granted. The exercise prices of these options range from S$0.36 to S$2.53. The expiration dates of the options range from 29 August 2005 to 16 June 2014. | ||||
Options granted to eligible participants under the:-
| (a) | STATS ChipPAC Ltd. Share Option Plan become exercisable at least as rapidly as 20% per year over the five-year period commencing on the date of grant. The exercisability of options outstanding under the STATS ChipPAC Ltd. Share Option Plan may be fully or partially accelerated under certain circumstances such as a change in control of the Company, as defined in the STATS ChipPAC Ltd. Share Option Plan. | |||
| (b) | STATS ChipPAC Ltd. Substitute Equity Incentive Plan become exercisable at least as rapidly as 20% per year over the first two years and 30% per year over the third and fourth years from the date of grant. The exercisability of options outstanding under the STATS ChipPAC Ltd. Substitute Equity Incentive Plan may be fully or partially accelerated under certain circumstances such as a change in control of the Company, as defined in the STATS ChipPAC Ltd. Substitute Equity Incentive Plan and as provided in the Option Agreement. | |||
S-11
Table of Contents
STATS CHIPPAC LTD.
AND ITS SUBSIDIARIES
DIRECTORS’ REPORT
For the financial year ended 31 December 2004
Issue of Shares Under Option
During the financial year, the Company issued a total of 5,802,800 ordinary shares of S$0.25 each, fully paid, (“Shares”) comprising:-
| (a) | 368,540 Shares pursuant to the exercise of options granted under the Company’s Share Option Plan at exercise prices ranging from S$0.25 to S$1.624 per share for cash; and | |||
| (b) | 5,434,260 Shares pursuant to the exercise of options granted under the Company’s Substitute Equity Incentive Plan at exercise prices ranging from S$0.38 to S$0.74 per share for cash. | |||
Unissued Shares under Option
At the end of the financial year, there were 131,996,282 unissued shares of the Company under the Share Option Plan, Substitute Share Purchase and Option Plan and Substitute Equity Incentive Plan. The exercise prices of these options range from S$0.25 to S$6.93. The expiration dates of the options range from 20 April 2005 to 7 October 2014.
The options granted by the Company do not entitle the holders of the options, by virtue of such holdings, to any right to participate in any share issue of any other company.
Other details of the Company’s Share Option and Incentive Plans are set out in the accompanying consolidated financial statements.
Audit Committee
The members of the Audit Committee (all of whom are independent non-executive directors) at the date of this report are as follows:
Richard John Agnich (Chairman)
Steven Hugh Hamblin
Rockford Douglas Norby
The Audit Committee performs the functions specified by Section 201B of the Companies Act, Cap. 50. It meets with the Company’s external auditors and the internal auditors, and reviews the audit plans, the internal audit programme, the results of their examination and findings on their evaluation of the system of internal controls, the scope and results of the internal audit procedures and the response from the Company’s management and the
S-12
Table of Contents
STATS CHIPPAC LTD.
AND ITS SUBSIDIARIES
DIRECTORS’ REPORT
For the financial year ended 31 December 2004
assistance given by the officers of the Company to the auditors. It also reviews interested person transactions and the Company’s relationship with the external auditors, including their independence and objectivity. The Audit Committee reviews the financial statements of the Company and the consolidated financial statements of the Group and the auditors’ report thereon and submits them to the Board of Directors. The Audit Committee has full access to and the cooperation of the management and has been given the resources required for it to discharge its functions. The Audit Committee has full discretion to invite any Director and executive officer to attend its meetings.
The Audit Committee has recommended to the Board of Directors that PricewaterhouseCoopers be nominated for re-appointment as auditors of the Company at the forthcoming Annual General Meeting.
Auditors
The auditors, PricewaterhouseCoopers, have expressed their willingness to accept re-appointment.
On behalf of the Board of Directors
| /s/ Charles Richard Wofford | /s/ Lim Ming Seong | ||
| Charles Richard Wofford | Lim Ming Seong | ||
| Chairman | Deputy Chairman |
11 March 2005
S-13
Table of Contents
STATS CHIPPAC LTD.
AND ITS SUBSIDIARIES
STATEMENT BY DIRECTORS
For the financial year ended 31 December 2004
In the opinion of the directors,
| (a) | the consolidated financial statements of the Group and the balance sheet of the Company as set out in the Annual Report are drawn up so as to give a true and fair view of the state of affairs of the Group and the Company at 31 December 2004, and of the results of the business, changes in equity and cash flows of the Group for the financial year then ended; and | |||
| (b) | at the date of this statement, there are reasonable grounds to believe that the Company will be able to pay its debts as and when they fall due. | |||
On behalf of the Board of Directors
| /s/ Charles Richard Wofford | /s/ Lim Ming Seong | ||
| Charles Richard Wofford | Lim Ming Seong | ||
| Chairman | Deputy Chairman |
11 March 2005
S-14
Table of Contents
AUDITORS’ REPORT TO THE MEMBERS OF STATS CHIPPAC LTD.
(In compliance with the requirements of the Singapore Companies Act)
We have audited the consolidated financial statements of STATS ChipPAC Ltd. and its subsidiaries (the “Group”) as at 31 December 2004 and for the year ended 31 December 2004, in accordance with the auditing standards of the Public Company Accounting Oversight Board (United States). The consolidated financial statements of the Group are prepared in accordance with accounting principles generally accepted in the United States of America (“US GAAP”). We reported separately on these financial statements of the Group on 11 March 2005 and our report is included thereon.
The balance sheet of STATS ChipPAC Ltd. (the “Company”) as at 31 December 2004 and notes therein are presented as required by the Singapore Companies Act, Cap. 50 (the “Act”). Our audit of the consolidated financial statements referred to above included an audit of the balance sheet of the Company. In our opinion, this balance sheet presents fairly the information set forth therein, in all material respects in relation to the consolidated financial statements taken as a whole.
In our opinion,
| (a) | the accompanying balance sheet of the Company and the consolidated financial statements of the Group are properly drawn up in accordance with the provisions of the Act and US GAAP, so as to give a true and fair view of the state of affairs of the Company and of the Group as at 31 December 2004, and the results, changes in equity and cash flows of the Group for the financial year ended on that date; and | |||
| (b) | the accounting and other records required by the Act to be kept by the Company have been properly kept in accordance with the provisions of the Act. | |||
The consolidated financial statements of the Group as of 31 December 2003 and for the two years then ended were audited by other auditors whose report dated 6 February 2004 expressed an unqualified opinion on those consolidated financial statements.
The balance sheet of the Company as of 31 December 2003, without any accompanying notes, were audited by other auditors whose report dated 6 February 2004 expressed an unqualified opinion on that balance sheet. The notes to the balance sheet as of 31 December 2003 were not previously presented, and accordingly the comparatives in the accompanying notes to the balance sheet are unaudited.
/s/ PricewaterhouseCoopers
PricewaterhouseCoopers
Certified Public Accountants
Singapore, 11 March 2005
S-15
Table of Contents
STATS CHIPPAC LTD.
BALANCE SHEET
For the financial year ended 31 December 2004
In thousands of US dollars
| 31 December | ||||||||||||
| Note | 2003 | 2004 | ||||||||||
| $ | $ | |||||||||||
ASSETS | ||||||||||||
| Current assets: | ||||||||||||
| Cash and cash equivalents | 3 | 297,165 | 184,824 | |||||||||
| Short-term marketable securities | 4 | 5,272 | — | |||||||||
| Accounts receivable, net | 5 | 70,545 | 66,875 | |||||||||
| Amounts due from affiliates | 7,170 | 2,623 | ||||||||||
| Amounts due from subsidiaries | 1,192 | 247,856 | ||||||||||
| Other receivables | 6 | 2,459 | 8,022 | |||||||||
| Inventories | 7 | 19,839 | 19,916 | |||||||||
| Prepaid expenses and other current assets | 8 | 12,200 | 32,971 | |||||||||
| Total current assets | 415,842 | 563,087 | ||||||||||
| Long-term marketable securities | 4 | 23,162 | 18,097 | |||||||||
| Property, plant and equipment, net | 9 | 364,246 | 391,523 | |||||||||
| Intangible assets | 10 | 1,548 | 1,398 | |||||||||
| Investment in subsidiaries | 11 | 60,824 | 750,620 | |||||||||
| Prepaid expenses and other non-current assets | 8 | 35,599 | 41,686 | |||||||||
| Total assets | $ | 901,221 | $ | 1,766,411 | ||||||||
LIABILITIES AND SHAREHOLDERS’ EQUITY | ||||||||||||
| Current liabilities: | ||||||||||||
| Accounts and other payable | 6,649 | 7,957 | ||||||||||
| Payables related to property, plant and equipment purchases | 40,825 | 20,028 | ||||||||||
| Accrued operating expenses | 12 | 36,623 | 36,773 | |||||||||
| Income taxes payable | 2,195 | — | ||||||||||
| Amounts due to affiliates | 1,836 | 137 | ||||||||||
| Amount due to subsidiaries | 6,026 | 4,804 | ||||||||||
| Current obligations under capital leases | 14 | 1,880 | 805 | |||||||||
| Current installments of long-term debt | 15 | — | 137,107 | |||||||||
| Total current liabilities | 96,034 | 207,611 | ||||||||||
| Obligations under capital leases, excluding current installments | 812 | — | ||||||||||
| Long-term debt, excluding current installments | 15 | 327,379 | 399,182 | |||||||||
| Other non-current liabilities | 17 | 1,212 | 268 | |||||||||
| Total liabilities | 425,437 | 607,061 | ||||||||||
| Share capital: | ||||||||||||
| Ordinary shares — par value S$0.25, Authorized 3,200,000,000 shares Issued ordinary shares —1,076,620,120 in 2003 and 1,944,330,450 in 2004 | 18 | 172,434 | 298,233 | |||||||||
| Additional paid-in capital | 18 | 489,337 | 1,507,854 | |||||||||
| Accumulated other comprehensive loss | 19 | (9,921 | ) | (2,860 | ) | |||||||
| Accumulated deficit | (176,066 | ) | (643,877 | ) | ||||||||
| Total shareholders’ equity | 475,784 | 1,159,350 | ||||||||||
| Commitments and contingencies | 20 | |||||||||||
| Total liabilities and shareholders’ equity | $ | 901,221 | $ | 1,766,411 | ||||||||
The accompanying notes form an integral part of these balance sheets
S-16
Table of Contents
STATS CHIPPAC LTD.
NOTES TO THE BALANCE SHEET
For the financial year ended 31 December 2004
In thousands of US dollars
| 1. | Background and Summary of Significant Accounting Policies | |||
| (a) | Business and Organization | |||
| STATS ChipPAC Ltd. (the “Company”) is incorporated in Singapore and its ordinary shares are listed on the Singapore Exchange (“SGX-ST”) and its American Depository Shares (“ADS”) are quoted on the NASDAQ National Market. The Company, formerly known as ST Assembly Test Services Ltd, was renamed in connection with the merger of ST Assembly Test Services Ltd and ChipPAC, Inc. (“ChipPAC”), which was consummated on 5 August 2004. In the merger, former ChipPAC stockholders received 0.87 ADS of the Company for each stock ChipPAC Class A common stock, par value $0.01 per stock, owned by such stockholder. Upon consummation of the merger, the Company and ChipPAC’s former shareholders owned approximately 56% and 44%, respectively, of the Company’s total share outstanding. As a result of the merger, ChipPAC became a wholly-owned subsidiary of the Company. The transaction was accounted for using the purchase method. | ||||
| The principal activities of the Company are the provision of a full range of semiconductor packaging design, assembly, test and distribution solutions. | ||||
| The Company is required to prepare balance sheet of the Company in accordance with the provisions of the Singapore Companies Act, Cap.50 (the “Act”) for filing with the Accounting and Corporate Regulatory Authority (“ACRA”). | ||||
| Under the Companies (Accounting Standards for Listed Companies) Order 2003 of the Singapore Companies (Amendment) Act, where a SGX-ST listed company is also listed on a foreign exchange which requires the company to comply with accounting standards other than Financial Reporting Standards, the company shall apply the alternative accounting standards if they are approved accounting standards by SGX-ST and the company has notified the Registrar its intention. As accounting principles generally accepted in the United States of America (“US GAAP”) is an approved accounting standard and the Company has notified the Registrar of its intention, the Company balance sheet has been prepared in accordance with US GAAP. | ||||
| The balance sheet of the Company should be read in conjunction with the consolidated financial statements, its basis of preparation and significant accounting policies. The consolidated financial statements are prepared in accordance with US GAAP and are included in the annual report of the Company. | ||||
| The notes to the balance sheet as of 31 December 2003 were not previously presented, and accordingly the comparatives in the accompanying notes to the balance sheet are unaudited. | ||||
| The financial statements are expressed in US dollars as the principal currency in which the Company conducts its business is the US dollars. | ||||
S-17
Table of Contents
STATS CHIPPAC LTD.
NOTES TO BALANCE SHEET
For the financial year ended 31 December 2004
In thousands of US dollars
| 1. | Background and Summary of Significant Accounting Policies(continued) | |||
| (b) | Subsidiaries | |||
| The Company has subsidiaries in China, South Korea, Malaysia, Taiwan, the British Virgin Island, Luxembourg, Barbados, Hungary and in the United States, its principal market. | ||||
| Prior to 2004, the Company accounted for its investments in subsidiaries at cost for the purpose of presenting the unconsolidated Company balance sheet. In 2004, the Company changed its accounting policy to present its investments in subsidiaries using the equity accounting method. The change was applied retroactively and prior year comparatives were changed to conform with this change in accounting policy. | ||||
| (c) | Reclassifications | |||
| Certain reclassifications have been made in prior year’s balance sheet to conform with classifications used in the current year. | ||||
| 2. | Related Parties | |||
| As at 31 December 2004, Temasek Holdings (Private) Limited beneficially owns approximately 37% of the outstanding ordinary shares. Please refer to Note 2 of the consolidated financial statements for details of relationships with affiliates. | ||||
| 3. | Cash and Cash Equivalents | |||
| Cash and cash equivalents consist of the following: | ||||
| 31 December | ||||||||
| 2003 | 2004 | |||||||
| $ | $ | |||||||
| (unaudited) | ||||||||
| Cash at banks and on hand | 2,096 | 6,155 | ||||||
| Cash equivalents | ||||||||
| Bank fixed deposits | 244,186 | 141,109 | ||||||
| Premium deposit | 5,858 | — | ||||||
| Investment fund | 45,025 | 37,560 | ||||||
| 297,165 | 184,824 | |||||||
| The premium deposit is a bank fixed deposit which gives enhanced yield. Upon its maturity, the Company redeems the principal and interest either in S$ or US$ depending on the position of the US$ to S$ rate against a pre-determined strike price on a future calculation time and date. |
S-18
Table of Contents
STATS CHIPPAC LTD.
NOTES TO BALANCE SHEET
For the financial year ended 31 December 2004
In thousands of US dollars
| 4. | Marketable Securities | |||
| Marketable securities consist of the following: | ||||
| 31 December | ||||||||||||||||||||||||||||||||
| 2003 (unaudited) | 2004 | |||||||||||||||||||||||||||||||
| Gross | Gross | Gross | Gross | |||||||||||||||||||||||||||||
| Amortized | Unrealized | Unrealized | Fair | Amortized | Unrealized | Unrealized | Fair | |||||||||||||||||||||||||
| Cost | Gains | Losses | Value | Cost | Gains | Losses | Value | |||||||||||||||||||||||||
| $ | $ | $ | $ | $ | $ | $ | $ | |||||||||||||||||||||||||
| Available-for- sale corporate debt securities | 29,228 | 15 | (809 | ) | 28,434 | 18,877 | — | (780 | ) | 18,097 | ||||||||||||||||||||||
| Maturities of available-for-sale debt securities are as follows (at fair value): |
| 31 December | ||||||||
| 2003 | 2004 | |||||||
| $ | $ | |||||||
| (unaudited) | ||||||||
| Corporate debt securities: | ||||||||
| Due in one year or less | 5,272 | — | ||||||
| Due after one year through five years | 23,162 | 18,097 | ||||||
| 28,434 | 18,097 | |||||||
| 5. | Accounts Receivable | |||
| Accounts receivable consists of the following: | ||||
| 31 December | ||||||||
| 2003 | 2004 | |||||||
| $ | $ | |||||||
| (unaudited) | ||||||||
| Accounts receivable — third parties | 71,815 | 68,184 | ||||||
| Allowance for sales returns | (1,270 | ) | (1,309 | ) | ||||
| 70,545 | 66,875 | |||||||
S-19
Table of Contents
STATS CHIPPAC LTD.
NOTES TO BALANCE SHEET
For the financial year ended 31 December 2004
In thousands of US dollars
| 6. | Other Receivables | |||
| Other receivables consist of the following: | ||||
| 31 December | ||||||||
| 2003 | 2004 | |||||||
| $ | $ | |||||||
| (unaudited) | ||||||||
| Deposits and staff advances | 178 | 164 | ||||||
| Grants receivable | 722 | 1,322 | ||||||
| Taxes receivable | — | 5,039 | ||||||
| Other receivables | 1,559 | 1,497 | ||||||
| 2,459 | 8,022 | |||||||
| 7. | Inventories | |||
| Inventories consist of the following: | ||||
| 31 December | ||||||||
| 2003 | 2004 | |||||||
| $ | $ | |||||||
| (unaudited) | ||||||||
| Raw materials | 14,704 | 16,517 | ||||||
| Work-in-progress | 5,092 | 3,299 | ||||||
| Finished goods | 43 | 100 | ||||||
| 19,839 | 19,916 | |||||||
| 8. | Prepaid Expenses and Other Assets | |||
| Prepaid expenses and other current assets consist of the following: | ||||
| 31 December | ||||||||
| 2003 | 2004 | |||||||
| $ | $ | |||||||
| (unaudited) | ||||||||
| Leasing prepayments | 10,949 | 27,137 | ||||||
| Other prepayments and assets | 351 | 620 | ||||||
| Deferred income tax assets (Note 13) | — | 335 | ||||||
| Loans to vendors | 900 | 4,879 | ||||||
| 12,200 | 32,971 | |||||||
S-20
Table of Contents
STATS CHIPPAC LTD.
NOTES TO BALANCE SHEET
For the financial year ended 31 December 2004
In thousands of US dollars
| 8. | Prepaid Expenses and Other Assets(continued) | |||
| Prepaid expenses and other non-current assets consist of the following: | ||||
| 31 December | ||||||||
| 2003 | 2004 | |||||||
| $ | $ | |||||||
| (unaudited) | ||||||||
| Leasing prepayments | 6,283 | 7,071 | ||||||
| Deferred income tax assets (Note 13) | 19,062 | 9,582 | ||||||
| Loans to vendors | 4,100 | 13,771 | ||||||
| Debt issuance cost, net of accumulated amortization of $2,036 and $3,481 | 6,154 | 10,295 | ||||||
| Others | — | 967 | ||||||
| 35,599 | 41,686 | |||||||
| Leasing prepayments represent prepayments of lease rental obligations for certain plant and machinery. | ||||
| Included in current and non-current loan to vendors are amounts of $5,000 and $15,000. Please refer to Note 8 of the consolidated financial statements for the details. | ||||
| 9. | Property, Plant and Equipment | |||
| Property, plant and equipment consist of the following: | ||||
| 31 December | ||||||||
| 2003 | 2004 | |||||||
| $ | $ | |||||||
| (unaudited) | ||||||||
| Cost: | ||||||||
| Buildings, mechanical and electrical installation | 57,767 | 60,628 | ||||||
| Equipment | 681,317 | 791,352 | ||||||
| Total cost | 739,084 | 851,980 | ||||||
| Total accumulated depreciation | (374,838 | ) | (460,457 | ) | ||||
| Property, plant and equipment, net | 364,246 | 391,523 | ||||||
| In the third quarter of 2004, following the consummation of the merger, the Company adopted ChipPAC’s policy to depreciate equipment and machinery on a straight line basis over 8 years, from 5 years previously. |
S-21
Table of Contents
STATS CHIPPAC LTD.
NOTES TO BALANCE SHEET
For the financial year ended 31 December 2004
In thousands of US dollars
| 9. | Property, Plant and Equipment (continued) | |||
| Included in property, plant and equipment are equipment acquired under capital lease at cost of $11,483 as at 31 December 2003 and 2004, respectively. The accumulated depreciation for these leased assets for the year ended 31 December 2003 and 2004 amounted to $4,207 and $6,050 respectively. | ||||
| 10. | Intangible Assets | |||
| Intangible assets consist of the following: | ||||
| 31 December | ||||||||||||||||||||||||
| 2003 (unaudited) | 2004 | |||||||||||||||||||||||
| Accumulated | Net | Gross | Accumulated | Net | ||||||||||||||||||||
| Gross Assets | Amortization | Assets | Assets | Amortization | Assets | |||||||||||||||||||
| $ | $ | $ | $ | $ | $ | |||||||||||||||||||
| Software and licenses | 1,981 | (433 | ) | 1,548 | 2,019 | (621 | ) | 1,398 | ||||||||||||||||
| 11. | Investment in Subsidiaries | |||
| Net interest in subsidiaries is summarized as follows: | ||||
| 31 December | ||||||||
| 2003 | 2004 | |||||||
| $ | $ | |||||||
| (unaudited) | ||||||||
| Unquoted equity shares at cost | 65,491 | 1,223,043 | ||||||
| Less: shares of profit/(loss) of subsidiaries | (4,667 | ) | (472,423 | ) | ||||
| 60,824 | 750,620 | |||||||
| The Company had accounted for its investment in subsidiaries at cost in prior periods. In 2004, the Company changed its accounting policy to present its investments in subsidiaries using the equity method. The change was applied retroactively and the corresponding difference has been adjusted against the accumulated deficit. | ||||
| On 5 August 2004, STATS and ChipPAC consummated the previously announced merger which resulted in ChipPAC becoming a wholly-owned subsidiary of STATS. Please refer to Note 12 of the consolidated financial statements for the details of the merger. | ||||
| In connection with the merger with ChipPAC, the Company assumed certain obligations and guarantees of the outstanding borrowings of ChipPAC. | ||||
S-22
Table of Contents
STATS CHIPPAC LTD.
NOTES TO BALANCE SHEET
For the financial year ended 31 December 2004
In thousands of US dollars
| ChipPAC has an outstanding $50,000 8.0% convertible subordinated notes due 2011. These convertible notes can be converted into the Company’s ADSs at a conversion price of $11.448 per ADS. The conversion price may be subject to adjustments for certain events. | ||||
| ChipPAC also has a $150,000 2.5% convertible subordinated notes due 2008. These convertible notes can be convertible into the Company’s ADSs at a conversion price of $9.267 per ADS. The conversion price may be subject to adjustments for certain events. On 11 October 2004, STATS ChipPAC, ChipPAC and the trustee for these convertible notes entered into a second supplemental indenture to provide for an unconditional guarantee of these convertible notes on a subordinated basis by STATS ChipPAC (but not by any of its subsidiaries). | ||||
| Please refer to Note 17 of the consolidated financial statements for details of the terms of these notes. | ||||
| 12. | Accrued Operating Expenses | |||
| Accrued operating expenses consist of the following: | ||||
| 31 December | ||||||||
| 2003 | 2004 | |||||||
| $ | $ | |||||||
| (unaudited) | ||||||||
| Staff costs | 4,683 | 5,851 | ||||||
| Purchase of raw materials | 18,293 | 12,744 | ||||||
| Maintenance fees, license fees and royalties | 1,237 | 1,452 | ||||||
| Interest expense | 1,001 | 2,735 | ||||||
| Provision for vacation liability | 2,030 | 2,846 | ||||||
| Others | 9,379 | 11,145 | ||||||
| 36,623 | 36,773 | |||||||
S-23
Table of Contents
STATS CHIPPAC LTD.
NOTES TO BALANCE SHEET
For the financial year ended 31 December 2004
In thousands of US dollars
| 13. | Income Taxes | |||
| The Company was previously granted pioneer status under the Singapore Economic Expansion Incentives (Relief from Income Tax) Act, Chapter 86, for “Subcontract Assembly And Testing Of Integrated Circuits Including Wafer Probing Services”. In December 2003, an application was submitted to the Singapore Economic Development Board (“EDB”) to revoke the Company’s pioneer status granted from 1 January 1996 to 31 December 2003. The Company’s pioneer trade was in an adjusted tax loss position due to the substantial amount of capital allowances claimed arising from capital expenditure on its plant and machinery and trade losses in certain years. As a result, the Company has not enjoyed any tax exemption in respect of its income arising from the pioneer activities. On the other hand, the Company has paid taxes in respect of its interest and rental income as losses arising from the pioneer trade cannot be set-off against the non-qualifying income during the pioneer incentive period due to the application of the law in respect of the pioneer incentive. In September 2004, the application of for the revocation was approved by EDB. Accordingly, the Company expects to receive a refund of taxes amounting to approximately $5,039 paid previously on interest and rental income as the unutilized tax losses and capital allowances arising from the trading activities would then be allowed to set-off against the income derived in previous years. The Company is in the process of working with the EDB for a new tax incentive for its Singapore operations. | ||||
| Deferred income taxes reflect the net tax effects of (a) temporary differences between the carrying amounts of assets and liabilities for financial reporting purposes and the amounts used for income tax purposes, and (b) operating loss, unutilized capital allowance and investment tax credit carryforwards. The tax effect of significant items comprising the Company’s deferred income tax assets at 31 December 2003 and 2004 are as follows: | ||||
| 31 December | ||||||||
| 2003 | 2004 | |||||||
| $ | $ | |||||||
| (unaudited) | ||||||||
| Deferred income tax assets: | ||||||||
| Operating loss carryforwards | $ | 2,391 | — | |||||
| Property, plant and equipment | 16,403 | 16,842 | ||||||
| Other | 268 | 358 | ||||||
| 19,062 | 17,200 | |||||||
| Valuation allowance: | — | (7,283 | ) | |||||
| Net deferred income tax assets | 19,062 | 9,917 | ||||||
S-24
Table of Contents
STATS CHIPPAC LTD.
NOTES TO BALANCE SHEET
For the financial year ended 31 December 2004
In thousands of US dollars
| 14. | Capital Leases | |||
| Future minimum lease payments under capital leases for equipment and machinery are as follows: | ||||
| 2004 | ||||
| $ | ||||
| Payable in year ending 31 December 2005 | 817 | |||
| Total minimum obligations | 817 | |||
| Less amounts representing interest at rates ranging from 6.6% to 7.1% per annum | (12 | ) | ||
| Present value of minimum obligations | 805 | |||
| All leasing arrangements are for testers with 1 or 4-year terms. At the end of the lease term, the Company may choose to terminate, renew the lease or purchase the equipment at fair market value. | ||||
| 15. | Long-term Debt | |||
| Long-term debt consists of the following: | ||||
| 31 December | ||||||||
| 2003 | 2004 | |||||||
| $ | $ | |||||||
| (unaudited) | ||||||||
| 1.75% coupon senior fixed-rate convertible notes | 200,000 | 183,500 | ||||||
| 0% coupon senior fixed-rate convertible notes | 115,000 | 115,000 | ||||||
| 6.75% senior notes | — | 215,000 | ||||||
| Accrued yield-to-maturity interest on notes | 12,379 | 22,789 | ||||||
| 327,379 | 536,289 | |||||||
| Less current amounts | — | (137,107 | ) | |||||
| 327,379 | 399,182 | |||||||
| Please refer to Note 17 of the consolidated financial statements for details of the long-term debt. |
S-25
Table of Contents
STATS CHIPPAC LTD.
NOTES TO BALANCE SHEET
For the financial year ended 31 December 2004
In thousands of US dollars
| 15. | Long-term Debt (continued) | |||
| Annual maturities of long-term debt as of 31 December 2004 are as follows: | ||||
| 2004 | ||||
| $ | ||||
| Payable in year ending 31 December | ||||
| 2005 | 137,107 | |||
| 2006 | — | |||
| 2007 | 63,492 | |||
| 2008 | 120,690 | |||
| 2009 | — | |||
| Thereafter | 215,000 | |||
| 536,289 | ||||
| 16. | Unutilized Credit Facilities | |||
| At 31 December 2004, the Company has undrawn banking and credit facilities consisting of long-term loans and bank guarantees of $77,698 with financial institutions. | ||||
| 17. | Other Non-Current Liabilities | |||
| Other non-current liabilities consist of the following: | ||||
| 31 December | ||||||||
| 2003 | 2004 | |||||||
| $ | $ | |||||||
| (unaudited) | ||||||||
| Deferred grant | 1,212 | 268 | ||||||
| The deferred grant refers to a 5-year grant of $13,878 obtained by the Company from the Economic Development Board (“EDB”) under its Research Incentive Scheme for Companies in 1997 to acquire equipment to be used in certain research and development projects. The grant, which is a reimbursement of specified costs, has no requirement for repayment. Amounts received for asset-related grant are deferred and recognized in other income over the life of the related asset. |
S-26
Table of Contents
STATS CHIPPAC LTD.
NOTES TO BALANCE SHEET
For the financial year ended 31 December 2004
In thousands of US dollars
| 18. | Share Capital, Additional Paid-In Capital and Share Options | |||
| Please refer to Note 20, 21 and 23 for details of the Share Capital, Additional Paid-in Capital and Share Options, respectively. | ||||
| 19. | Accumulated Other Comprehensive Loss | |||
| The components of accumulated other comprehensive loss are as follows: | ||||
| 31 December | ||||||||
| 2003 | 2004 | |||||||
| $ | $ | |||||||
| (unaudited) | ||||||||
| Loss arising from change in functional currency | (9,732 | ) | (9,732 | ) | ||||
| Unrealized gain on hedging instruments | — | 483 | ||||||
| Unrealized loss on available-for-sale marketable Securities | (793 | ) | (780 | ) | ||||
| Share of subsidiaries’ other comprehensive loss | 604 | 7,169 | ||||||
| (9,921 | ) | (2,860 | ) | |||||
| 20. | Commitments and Contingencies | |||
| (a) | Commitments | |||
| As of 31 December 2003 and 2004, capital commitments consist of the following: | ||||
| 31 December | ||||||||
| 2003 | 2004 | |||||||
| $ | $ | |||||||
| (unaudited) | ||||||||
Capital commitments | ||||||||
| Building, mechanical and electrical installation | 6,284 | — | ||||||
| Plant and machinery | 42,086 | 24,011 | ||||||
Other commitments | ||||||||
| Inventories | 8,413 | 25,499 | ||||||
| The Company leases certain of its facilities in Singapore under operation lease arrangements and has a lease agreement for the land located in Singapore related to its facilities. The Company has also leased certain plant and equipment under operating leases and under sale and lease-back arrangements. |
S-27
Table of Contents
STATS CHIPPAC LTD.
NOTES TO BALANCE SHEET
For the financial year ended 31 December 2004
In thousands of US dollars
| 20. | Commitments and Contingencies(continued) | |||
| Future minimum lease payments under non-cancelable operating leases as of 31 December 2004 were: | ||||
| $ | ||||
| Payable in year ending 31 December | ||||
| 2005 | 2,718 | |||
| 2006 | 1,845 | |||
| 2007 | 926 | |||
| 2008 | 811 | |||
| 2009 | 811 | |||
| Thereafter | 13,119 | |||
| 20,230 | ||||
| (b) | Contingencies | |||
| In the normal course of business, the Company is subject to claims and litigations. These claims may include allegations of infringement of intellectual property rights of others as well as other claims of liability. In addition, the company is subject to various taxes in the jurisdiction in which it operates. These include taxes on income, property, goods and services, and other taxes. The Company submits tax returns and claims with the respective government taxing authorities, which are subject to agreement by those taxing authorities. The Company accrues costs associated with these matters when they are probable and reasonably estimable. The Company does not believe that it is probable that losses associated with these matters beyond those already recognized will be incurred in amounts that would be material to its financial position, results of operations, or cash flows. | ||||
| 21. | Fair Value of Financial Instruments | |||
| 31 December | ||||||||||||||||
| 2003 (unaudited) | 2004 | |||||||||||||||
| Carrying | Estimated | Carrying | Estimated | |||||||||||||
| Amount | Fair Value | Amount | Fair Value | |||||||||||||
| $ | $ | $ | $ | |||||||||||||
Financial Assets: | ||||||||||||||||
| Cash and cash equivalents | 297,165 | 297,165 | 184,824 | 184,824 | ||||||||||||
| Marketable securities | 28,434 | 28,434 | 18,097 | 18,097 | ||||||||||||
Financial Liabilities: | ||||||||||||||||
| Senior and convertible notes | 327,379 | 339,138 | 536,289 | 545,367 | ||||||||||||
| Please refer to Note 26 of the consolidated financial statements for the methods and assumptions used to estimate the fair values of the financial instruments. |
S-28