U.S. SECURTIES AND EXCHANGE COMMISSION
Washington, D. C. 20549
Form 10-Q
(Mark One)
x | Quarterly report under Section 13 or 15(d) of the Securities Exchange Act of 1934 |
For the quarterly period ended March 31, 2016
¨ | Transition report under Section 13 or 15(d) of the Exchange Act |
For the transition period from to
Commission file number 000-32017
CENTERSTATE BANKS, INC.
(Exact Name of Registrant as Specified in Its Charter)
Florida |
| 59-3606741 |
(State or Other Jurisdiction |
| (I.R.S. Employer |
42745 U.S. Highway 27
Davenport, Florida 33837
(Address of Principal Executive Offices)
(863) 419-7750
(Issuer’s Telephone Number, Including Area Code)
Check whether the issuer: (1) filed all reports required to be filed by Section 13 or 15(d) of the Exchange Act during the past 12 months (or for such shorter period that the registrant was required to file such reports), and (2) has been subject to such filing requirements for the past 90 days:
YES x NO ¨
Check whether the registrant is a large accelerated filer, an accelerated filer, non-accelerated filer or a smaller reporting company.
Large accelerated filer | ¨ | Accelerated filer | x |
Non-accelerated filer | ¨ | Smaller reporting company | ¨ |
Indicate by check mark whether the registrant has submitted electronically and posted on its corporate Web site, if any, every Interactive Data File required to be submitted and posted pursuant to Rule 405 of Regulation S-T (§ 232.405 of this chapter) during the preceding 12 months (or for such shorter period that the registrant was required to submit and post such files).
YES x NO ¨
Indicate by check mark whether the registrant is a shell company (as defined in Rule 12b-2 of the Exchange Act):
YES ¨ NO x
State the number of shares outstanding of each of the issuer’s classes of common stock, as of the latest practicable date:
| Common stock, par value $.01 per share |
|
|
| 47,958,486 shares |
|
(class) |
| Outstanding at April 28, 2016 | ||||
CENTERSTATE BANKS, INC. AND SUBSIDIARIES
INDEX
|
| Page |
PART I. FINANCIAL INFORMATION |
|
|
Item 1. Financial Statements |
|
|
Condensed consolidated balance sheets (unaudited) at March 31, 2016 and December 31, 2015 |
| 3 |
|
| 4 |
|
| 6 |
|
| 7 |
Notes to condensed consolidated financial statements (unaudited) |
| 9 |
Item 2. Management’s Discussion and Analysis of Financial Condition and Results of Operations |
| 35 |
Item 3. Quantitative and Qualitative Disclosures About Market Risk |
| 51 |
|
| 51 |
PART II. OTHER INFORMATION |
|
|
|
| 52 |
|
| 52 |
Item 2. Unregistered Sales of Equity Securities and Use of Proceeds |
| 52 |
|
| 52 |
|
| 52 |
|
| 52 |
|
| 52 |
|
| 53 |
CERTIFICATIONS |
|
|
2
CenterState Banks, Inc. and Subsidiaries
CONDENSED CONSOLIDATED BALANCE SHEETS (unaudited)
(in thousands of dollars, except per share data)
|
| March 31, 2016 |
|
| December 31, 2015 |
| ||
ASSETS |
|
|
|
|
|
|
|
|
Cash and due from banks |
| $ | 65,560 |
|
| $ | 50,902 |
|
Federal funds sold and Federal Reserve Bank deposits |
|
| 296,459 |
|
|
| 101,580 |
|
Cash and cash equivalents |
|
| 362,019 |
|
|
| 152,482 |
|
Trading securities, at fair value |
|
| 2,719 |
|
|
| 2,107 |
|
Investment securities available for sale, at fair value |
|
| 707,573 |
|
|
| 604,739 |
|
Investment securities held to maturity (fair value of $259,599 and $273,983 |
|
|
|
|
|
|
|
|
at March 31, 2016 and December 31, 2015, respectively) |
|
| 256,849 |
|
|
| 272,840 |
|
Loans held for sale |
|
| 2,186 |
|
|
| 1,529 |
|
|
|
|
|
|
|
|
|
|
Loans, excluding purchased credit impaired |
|
| 2,911,705 |
|
|
| 2,383,248 |
|
Purchased credit impaired loans |
|
| 236,516 |
|
|
| 210,528 |
|
Allowance for loan losses |
|
| (23,122 | ) |
|
| (22,264 | ) |
Net Loans |
|
| 3,125,099 |
|
|
| 2,571,512 |
|
|
|
|
|
|
|
|
|
|
Bank premises and equipment, net |
|
| 116,734 |
|
|
| 101,821 |
|
Accrued interest receivable |
|
| 11,677 |
|
|
| 10,286 |
|
Federal Home Loan Bank and Federal Reserve Bank stock, at cost |
|
| 17,003 |
|
|
| 14,041 |
|
Goodwill |
|
| 105,492 |
|
|
| 76,739 |
|
Core deposit intangible, net |
|
| 17,803 |
|
|
| 12,164 |
|
Trust intangible, net |
|
| 802 |
|
|
| 837 |
|
Bank owned life insurance |
|
| 86,455 |
|
|
| 85,890 |
|
Other repossessed real estate owned covered by FDIC loss share agreements |
|
| - |
|
|
| 9,629 |
|
Other repossessed real estate owned |
|
| 15,937 |
|
|
| 1,567 |
|
FDIC indemnification asset |
|
| - |
|
|
| 25,795 |
|
Deferred income tax asset, net |
|
| 69,470 |
|
|
| 46,220 |
|
Bank property held for sale |
|
| 8,069 |
|
|
| 1,665 |
|
Prepaid expense and other assets |
|
| 63,768 |
|
|
| 30,854 |
|
TOTAL ASSETS |
| $ | 4,969,655 |
|
| $ | 4,022,717 |
|
|
|
|
|
|
|
|
|
|
LIABILITIES AND STOCKHOLDERS' EQUITY |
|
|
|
|
|
|
|
|
Deposits: |
|
|
|
|
|
|
|
|
Demand - non-interest bearing |
| $ | 1,489,530 |
|
| $ | 1,133,138 |
|
Demand - interest bearing |
|
| 756,129 |
|
|
| 679,714 |
|
Savings and money market accounts |
|
| 1,214,083 |
|
|
| 979,906 |
|
Time deposits |
|
| 632,425 |
|
|
| 422,420 |
|
Total deposits |
|
| 4,092,167 |
|
|
| 3,215,178 |
|
|
|
|
|
|
|
|
|
|
Securities sold under agreement to repurchase |
|
| 31,474 |
|
|
| 27,472 |
|
Federal funds purchased |
|
| 225,298 |
|
|
| 200,250 |
|
Other borrowed funds |
|
| 650 |
|
|
| 25,000 |
|
Corporate debentures |
|
| 25,782 |
|
|
| 24,093 |
|
Accrued interest payable |
|
| 1,056 |
|
|
| 218 |
|
Payables and accrued expenses |
|
| 73,767 |
|
|
| 39,992 |
|
Total liabilities |
|
| 4,450,194 |
|
|
| 3,532,203 |
|
|
|
|
|
|
|
|
|
|
Stockholders' equity: |
|
|
|
|
|
|
|
|
Common stock, $.01 par value: 100,000,000 shares |
|
|
|
|
|
|
|
|
authorized; 47,942,643 and 45,459,195 shares issued and outstanding |
|
|
|
|
|
|
|
|
at March 31, 2016 and December 31, 2015, respectively |
|
| 479 |
|
|
| 455 |
|
Additional paid-in capital |
|
| 426,267 |
|
|
| 393,191 |
|
Retained earnings |
|
| 88,708 |
|
|
| 95,430 |
|
Accumulated other comprehensive income |
|
| 4,007 |
|
|
| 1,438 |
|
Total stockholders' equity |
|
| 519,461 |
|
|
| 490,514 |
|
|
|
|
|
|
|
|
|
|
TOTAL LIABILITIES AND STOCKHOLDERS' EQUITY |
| $ | 4,969,655 |
|
| $ | 4,022,717 |
|
See notes to the accompanying condensed consolidated financial statements
3
CenterState Banks, Inc. and Subsidiaries
CONDENSED CONSOLIDATED STATEMENTS OF EARNINGS AND COMPREHENSIVE INCOME (LOSS) (unaudited)
(in thousands of dollars, except per share data)
|
| Three months ended |
| |||||
|
| March 31, 2016 |
|
| March 31, 2015 |
| ||
Interest income: |
|
|
|
|
|
|
|
|
Loans |
| $ | 37,118 |
|
| $ | 34,268 |
|
Investment securities available for sale: |
|
|
|
|
|
|
|
|
Taxable |
|
| 5,062 |
|
|
| 4,282 |
|
Tax-exempt |
|
| 780 |
|
|
| 539 |
|
Federal funds sold and other |
|
| 538 |
|
|
| 396 |
|
|
|
| 43,498 |
|
|
| 39,485 |
|
Interest expense: |
|
|
|
|
|
|
|
|
Deposits |
|
| 1,481 |
|
|
| 1,447 |
|
Securities sold under agreement to repurchase |
|
| 27 |
|
|
| 49 |
|
Federal funds purchased |
|
| 267 |
|
|
| 132 |
|
Corporate debentures |
|
| 248 |
|
|
| 237 |
|
|
|
| 2,023 |
|
|
| 1,865 |
|
|
|
|
|
|
|
|
|
|
|
|
|
|
|
|
|
|
|
Net interest income |
|
| 41,475 |
|
|
| 37,620 |
|
Provision for loan losses |
|
| 510 |
|
|
| 1,642 |
|
Net interest income after loan loss provision |
|
| 40,965 |
|
|
| 35,978 |
|
|
|
|
|
|
|
|
|
|
|
|
|
|
|
|
|
|
|
Non interest income: |
|
|
|
|
|
|
|
|
Correspondent banking capital markets revenue |
|
| 7,371 |
|
|
| 5,694 |
|
Other correspondent banking related revenue |
|
| 1,404 |
|
|
| 1,106 |
|
Service charges on deposit accounts |
|
| 2,736 |
|
|
| 2,261 |
|
Debit, prepaid, ATM and merchant card related fees |
|
| 2,046 |
|
|
| 1,701 |
|
Wealth management related revenue |
|
| 735 |
|
|
| 970 |
|
FDIC indemnification income |
|
| 96 |
|
|
| 667 |
|
FDIC indemnification asset amortization |
|
| (1,166 | ) |
|
| (4,350 | ) |
Bank owned life insurance income |
|
| 565 |
|
|
| 593 |
|
Other service charges and fees |
|
| 774 |
|
|
| 439 |
|
Total other income |
|
| 14,561 |
|
|
| 9,081 |
|
See notes to the accompanying condensed consolidated financial statements.
4
CenterState Banks, Inc. and Subsidiaries
CONDENSED CONSOLIDATED STATEMENTS OF EARNINGS AND COMPREHENSIVE INCOME (LOSS) (unaudited)
(in thousands of dollars, except per share data)
|
| Three months ended |
| |||||
|
| March 31, 2016 |
|
| March 31, 2015 |
| ||
Non interest expense: |
|
|
|
|
|
|
|
|
Salaries, wages and employee benefits |
|
| 21,455 |
|
|
| 19,580 |
|
Occupancy expense |
|
| 2,147 |
|
|
| 2,080 |
|
Depreciation of premises and equipment |
|
| 1,497 |
|
|
| 1,433 |
|
Supplies, stationary and printing |
|
| 299 |
|
|
| 365 |
|
Marketing expenses |
|
| 690 |
|
|
| 538 |
|
Data processing expense |
|
| 1,527 |
|
|
| 1,695 |
|
Legal, audit and other professional fees |
|
| 903 |
|
|
| 735 |
|
Core deposit intangible ("CDI") amortization |
|
| 643 |
|
|
| 628 |
|
Postage and delivery |
|
| 355 |
|
|
| 368 |
|
ATM and debit card related expenses |
|
| 596 |
|
|
| 433 |
|
Bank regulatory expenses |
|
| 810 |
|
|
| 910 |
|
Gain on sale of repossessed real estate (“OREO”) |
|
| (158 | ) |
|
| (1,528 | ) |
Valuation write down of repossessed real estate (“OREO”) |
|
| 22 |
|
|
| 389 |
|
Loss (gain) on repossessed assets other than real estate |
|
| 6 |
|
|
| (1 | ) |
Foreclosure related expenses |
|
| 489 |
|
|
| 589 |
|
Merger and acquisition related expenses |
|
| 11,172 |
|
|
| - |
|
Branch closure and efficiency initiatives |
|
| 456 |
|
|
| - |
|
Loss from termination of FDIC loss share agreements |
|
| 17,560 |
|
|
| - |
|
Other expenses |
|
| 2,384 |
|
|
| 2,389 |
|
Total other expenses |
|
| 62,853 |
|
|
| 30,603 |
|
|
|
|
|
|
|
|
|
|
(Loss) income before provision for income taxes |
|
| (7,327 | ) |
|
| 14,456 |
|
(Benefit) provision for income taxes |
|
| (2,523 | ) |
|
| 5,308 |
|
Net (loss) income |
| $ | (4,804 | ) |
| $ | 9,148 |
|
|
|
|
|
|
|
|
|
|
Other comprehensive income, net of tax: |
|
|
|
|
|
|
|
|
Unrealized securities holding gain, net of income taxes |
| $ | 2,569 |
|
| $ | 1,014 |
|
Less: reclassified adjustments for gain included in net income, net of income taxes, of $0, and $0 ,respectively |
|
| - |
|
|
| - |
|
Net unrealized gain on available for sale securities, net of income taxes |
| $ | 2,569 |
|
| $ | 1,014 |
|
|
|
|
|
|
|
|
|
|
Total comprehensive (loss) income |
| $ | (2,235 | ) |
| $ | 10,162 |
|
|
|
|
|
|
|
|
|
|
(Loss) earnings per share: |
|
|
|
|
|
|
|
|
Basic |
| $ | (0.10 | ) |
| $ | 0.20 |
|
Diluted |
| $ | (0.10 | ) |
| $ | 0.20 |
|
Common shares used in the calculation of (loss) earnings per share: |
|
|
|
|
|
|
|
|
Basic (1) |
|
| 46,343,033 |
|
|
| 45,127,940 |
|
Diluted (1) |
|
| 46,343,033 |
|
|
| 45,657,624 |
|
| (1) | Excludes participating shares. |
See notes to the accompanying condensed consolidated financial statements
5
CenterState Banks, Inc. and Subsidiaries
CONDENSED CONSOLIDATED STATEMENTS OF CHANGES IN STOCKHOLDERS’ EQUITY
For the three months ended March 31, 2016 and 2015 (unaudited)
(in thousands of dollars, except per share data)
|
|
|
|
|
|
|
|
|
|
|
|
|
|
|
|
|
| Accumulated |
|
|
|
|
| |
|
| Number of |
|
|
|
|
|
| Additional |
|
|
|
|
|
| other |
|
| Total |
| ||||
|
| common |
|
| Common |
|
| paid in |
|
| Retained |
|
| comprehensive |
|
| stockholders' |
| ||||||
|
| shares |
|
| stock |
|
| capital |
|
| earnings |
|
| income |
|
| equity |
| ||||||
Balances at January 1, 2015 |
|
| 45,323,553 |
|
| $ | 453 |
|
| $ | 388,698 |
|
| $ | 59,273 |
|
| $ | 4,053 |
|
| $ | 452,477 |
|
|
|
|
|
|
|
|
|
|
|
|
|
|
|
|
|
|
|
|
|
|
|
|
|
|
Net income |
|
|
|
|
|
|
|
|
|
|
|
|
|
| 9,148 |
|
|
|
|
|
|
| 9,148 |
|
Unrealized holding gain on |
|
|
|
|
|
|
|
|
|
|
|
|
|
|
|
|
|
|
|
|
|
|
|
|
available for sale securities, net of |
|
|
|
|
|
|
|
|
|
|
|
|
|
|
|
|
|
|
|
|
|
|
|
|
deferred income tax of $637 |
|
|
|
|
|
|
|
|
|
|
|
|
|
|
|
|
|
| 1,014 |
|
|
| 1,014 |
|
|
|
|
|
|
|
|
|
|
|
|
|
|
|
|
|
|
|
|
|
|
|
|
|
|
Dividends paid - common ($0.01 per share) |
|
|
|
|
|
|
|
|
|
|
|
|
|
| (455 | ) |
|
|
|
|
|
| (455 | ) |
Stock grants issued |
|
| 45,053 |
|
|
| 1 |
|
|
| 607 |
|
|
|
|
|
|
|
|
|
|
| 608 |
|
Stock based compensation expense |
|
|
|
|
|
|
|
|
|
| 56 |
|
|
|
|
|
|
|
|
|
|
| 56 |
|
Stock options exercised, including tax benefit |
|
| 40,318 |
|
|
| - |
|
|
| 217 |
|
|
|
|
|
|
|
|
|
|
| 217 |
|
Balances at March 31, 2015 |
|
| 45,408,924 |
|
| $ | 454 |
|
| $ | 389,578 |
|
| $ | 67,966 |
|
| $ | 5,067 |
|
| $ | 463,065 |
|
|
|
|
|
|
|
|
|
|
|
|
|
|
|
|
|
|
|
|
|
|
|
|
|
|
|
|
|
|
|
|
|
|
|
|
|
|
|
|
|
|
|
|
|
|
|
|
|
|
|
Balances at January 1, 2016 |
|
| 45,459,195 |
|
| $ | 455 |
|
| $ | 393,191 |
|
| $ | 95,430 |
|
| $ | 1,438 |
|
| $ | 490,514 |
|
|
|
|
|
|
|
|
|
|
|
|
|
|
|
|
|
|
|
|
|
|
|
|
|
|
Net loss |
|
|
|
|
|
|
|
|
|
|
|
|
|
| (4,804 | ) |
|
|
|
|
|
| (4,804 | ) |
Unrealized holding gain on |
|
|
|
|
|
|
|
|
|
|
|
|
|
|
|
|
|
|
|
|
|
|
|
|
available for sale securities, net of |
|
|
|
|
|
|
|
|
|
|
|
|
|
|
|
|
|
|
|
|
|
|
|
|
deferred income tax of $1,613 |
|
|
|
|
|
|
|
|
|
|
|
|
|
|
|
|
|
| 2,569 |
|
|
| 2,569 |
|
|
|
|
|
|
|
|
|
|
|
|
|
|
|
|
|
|
|
|
|
|
|
|
|
|
Dividends paid - common ($0.04 per share) |
|
|
|
|
|
|
|
|
|
|
|
|
|
| (1,918 | ) |
|
|
|
|
|
| (1,918 | ) |
Stock grants issued |
|
| 171,709 |
|
|
| 1 |
|
|
| 198 |
|
|
|
|
|
|
|
|
|
|
| 199 |
|
Stock based compensation expense |
|
|
|
|
|
|
|
|
|
| 1,080 |
|
|
|
|
|
|
|
|
|
|
| 1,080 |
|
Stock options exercised, including tax benefit |
|
| 59,980 |
|
|
| 1 |
|
|
| 302 |
|
|
|
|
|
|
|
|
|
|
| 303 |
|
Stock repurchase |
|
| (24,283 | ) |
|
| (1 | ) |
|
| (346 | ) |
|
|
|
|
|
|
|
|
|
| (347 | ) |
Stock issued pursuant to Community Bank acquisition |
|
| 2,276,042 |
|
|
| 23 |
|
|
| 31,842 |
|
|
|
|
|
|
|
|
|
|
| 31,865 |
|
Balances at March 31, 2016 |
|
| 47,942,643 |
|
| $ | 479 |
|
| $ | 426,267 |
|
| $ | 88,708 |
|
| $ | 4,007 |
|
| $ | 519,461 |
|
See notes to the accompanying condensed consolidated financial statements
6
CenterState Banks, Inc. and Subsidiaries
CONDENSED CONSOLIDATED STATEMENTS OF CASH FLOWS (unaudited)
(in thousands of dollars, except per share data)
|
| Three months ended March 31, |
| |||||
|
| 2016 |
|
| 2015 |
| ||
Cash flows from operating activities: |
|
|
|
|
|
|
|
|
Net (loss) income |
| $ | (4,804 | ) |
| $ | 9,148 |
|
Adjustments to reconcile net (loss) income to net cash provided by operating activities: |
|
|
|
|
|
|
|
|
Provision for loan losses |
|
| 510 |
|
|
| 1,642 |
|
Depreciation of premises and equipment |
|
| 1,497 |
|
|
| 1,433 |
|
Accretion of purchase accounting adjustments |
|
| (9,523 | ) |
|
| (10,523 | ) |
Net amortization of investment securities |
|
| 2,061 |
|
|
| 2,013 |
|
Net deferred loan origination fees |
|
| (77 | ) |
|
| 139 |
|
Trading securities revenue |
|
| (354 | ) |
|
| (174 | ) |
Purchases of trading securities |
|
| (47,734 | ) |
|
| (38,082 | ) |
Proceeds from sale of trading securities |
|
| 47,476 |
|
|
| 40,659 |
|
Repossessed real estate owned valuation write down |
|
| 22 |
|
|
| 389 |
|
Gain on sale of repossessed real estate owned |
|
| (158 | ) |
|
| (1,528 | ) |
Loss (gain) on repossessed assets other than real estate |
|
| 6 |
|
|
| (1 | ) |
Gain on sale of loans held for sale |
|
| (98 | ) |
|
| (164 | ) |
Loans originated and held for sale |
|
| (5,425 | ) |
|
| (7,431 | ) |
Proceeds from sale of loans held for sale |
|
| 5,598 |
|
|
| 8,324 |
|
Gain on disposal of bank property held for sale |
|
| (2 | ) |
|
| (41 | ) |
Impairment on bank property held for sale |
|
| 458 |
|
|
| 682 |
|
Deferred income taxes |
|
| (9,979 | ) |
|
| 452 |
|
Stock based compensation expense |
|
| 1,080 |
|
|
| 830 |
|
Bank owned life insurance income |
|
| (565 | ) |
|
| (593 | ) |
FDIC indemnification asset amortization |
|
| 1,166 |
|
|
| 4,350 |
|
Loss from termination of FDIC loss share agreements |
|
| 17,560 |
|
|
| - |
|
Net cash from changes in: |
|
|
|
|
|
|
|
|
Net changes in accrued interest receivable, prepaid expenses, and other assets |
|
| (28,966 | ) |
|
| (4,177 | ) |
Net change in accrued interest payable, accrued expense, and other liabilities |
|
| 31,180 |
|
|
| 3,804 |
|
Net cash provided by operating activities |
| $ | 929 |
|
|
| 11,151 |
|
See notes to the accompanying condensed consolidated financial statements.
7
CenterState Banks, Inc. and Subsidiaries
CONDENSED CONSOLIDATED STATEMENTS OF CASH FLOWS (unaudited)
(in thousands of dollars, except per share data)
(continued)
|
| Three months ended March 31, |
| |||||
|
| 2016 |
|
| 2015 |
| ||
Cash flows from investing activities: |
|
|
|
|
|
|
|
|
Available for sale securities: |
|
|
|
|
|
|
|
|
Purchases of investment securities |
| $ | - |
|
| $ | (1,004 | ) |
Purchases of mortgage backed securities |
|
| (122,807 | ) |
|
| (22,306 | ) |
Proceeds from pay-downs of mortgage backed securities |
|
| 21,486 |
|
|
| 20,554 |
|
Proceeds from sales of investment securities |
|
| 79,297 |
|
|
| - |
|
Proceeds from sales of mortgage backed securities |
|
| 62,418 |
|
|
| - |
|
Proceeds from called investment securities |
|
| 920 |
|
|
| - |
|
Held to maturity securities: |
|
|
|
|
|
|
|
|
Purchases of investment securities |
|
| (11,149 | ) |
|
| (37,882 | ) |
Purchases of mortgage backed securities |
|
| - |
|
|
| - |
|
Proceeds from called investment securities |
|
| 20,600 |
|
|
| 37,110 |
|
Proceeds from pay-downs of mortgage backed securities |
|
| 6,227 |
|
|
| 8,868 |
|
Purchases of FHLB and FRB stock |
|
| - |
|
|
| - |
|
Proceeds from sales of FHLB and FRB stock |
|
| 29 |
|
|
| 208 |
|
Net (increase) decrease in loans |
|
| (32,123 | ) |
|
| (28,103 | ) |
Cash received from FDIC loss sharing agreements |
|
| 5,482 |
|
|
| 3,654 |
|
Purchases of premises and equipment, net |
|
| (1,604 | ) |
|
| (3,111 | ) |
Proceeds from sale of repossessed real estate |
|
| 4,541 |
|
|
| 11,589 |
|
Proceeds from sale of fixed assets |
|
| - |
|
|
| - |
|
Proceeds from sale of bank property held for sale |
|
| 690 |
|
|
| 555 |
|
Net cash from bank acquisitions |
|
| 41,885 |
|
|
| - |
|
Net cash provided by (used in) investing activities |
| $ | 75,892 |
|
| $ | (9,868 | ) |
Cash flows from financing activities: |
|
|
|
|
|
|
|
|
Net increase in deposits |
|
| 171,278 |
|
|
| 57,567 |
|
Net increase in securities sold under agreement to repurchase |
|
| 3,458 |
|
|
| 4,049 |
|
Net increase in federal funds purchased |
|
| 25,048 |
|
|
| 35,451 |
|
Net decrease in other borrowings |
|
| (56,768 | ) |
|
| - |
|
Extinguishment of debt |
|
| (8,680 | ) |
|
| - |
|
Net (decrease) increase in payable to shareholders for acquisitions |
|
| 342 |
|
|
| (184 | ) |
Stock options exercised, including tax benefit |
|
| 303 |
|
|
| 217 |
|
Stock repurchased |
|
| (347 | ) |
|
| - |
|
Dividends paid |
|
| (1,918 | ) |
|
| (455 | ) |
Net cash provided by financing activities |
| $ | 132,716 |
|
| $ | 96,645 |
|
|
|
|
|
|
|
|
|
|
Net increase in cash and cash equivalents |
|
| 209,537 |
|
|
| 97,928 |
|
Cash and cash equivalents, beginning of period |
|
| 152,482 |
|
|
| 158,413 |
|
Cash and cash equivalents, end of period |
| $ | 362,019 |
|
| $ | 256,341 |
|
|
|
|
|
|
|
|
|
|
Transfer of loans to other real estate owned |
| $ | 2,372 |
|
| $ | 3,264 |
|
Transfers of bank property to held for sale |
| $ | 2,803 |
|
| $ | 970 |
|
|
|
|
|
|
|
|
|
|
Cash paid during the period for: |
|
|
|
|
|
|
|
|
Interest |
| $ | 1,421 |
|
| $ | 2,187 |
|
Income taxes |
| $ | 2,923 |
|
| $ | 170 |
|
See notes to the accompanying condensed consolidated financial statements.
8
CenterState Banks, Inc. and Subsidiaries
NOTES TO CONDENSED CONSOLIDATED FINANCIAL STATEMENTS (unaudited)
(in thousands of dollars, except per share data)
NOTE 1: Nature of operations and basis of presentation
The consolidated financial statements include the accounts of CenterState Banks, Inc. (the “Parent Company,” “Company” or “CSFL”), and its wholly owned subsidiary bank, CenterState Bank of Florida, N.A. (“CenterState”), and non bank subsidiaries, R4ALL, Inc. and CSFL Insurance Corp. The subsidiary bank operates through 72 full service banking locations in 22 counties throughout Florida, providing traditional deposit and lending products and services to its commercial and retail customers. R4ALL, Inc. is a separate non bank subsidiary of CSFL. Its purpose is to purchase troubled loans from the subsidiary bank and manage their eventual disposition. CSFL Insurance Corp. is a non bank subsidiary of CSFL and its primary purpose is to function as a captive insurance subsidiary pursuant to Section 831(b) of the U.S. Tax Code.
In addition, the Company also operates a correspondent banking and capital markets division. The division is integrated with and part of the subsidiary bank located in Winter Haven, Florida, although the majority of its bond salesmen, traders and operational personnel are physically housed in leased facilities located in Birmingham, Alabama, Atlanta, Georgia and Winston Salem, North Carolina. The business lines of this division are primarily divided into three inter-related revenue generating activities. The first, and largest, revenue generator is commissions earned on fixed income security sales, fees from hedging services, loan brokerage fees and consulting fees for services related to these activities. The second category includes correspondent bank deposits (i.e. federal funds purchased) and correspondent bank checking account deposits. The third revenue generating category includes fees from safe-keeping activities, bond accounting services for correspondents, asset/liability consulting related activities, international wires, and other clearing and corporate checking account services. The customer base includes small to medium size financial institutions primarily located in the Southeastern United States.
The accompanying unaudited condensed consolidated financial statements have been prepared in accordance with accounting principles generally accepted in the United States of America for interim financial statements and with the instructions to Form 10-Q. Accordingly, they do not include all of the information and footnotes required by accounting principles generally accepted in the United States of America for complete financial statements. These statements should be read in conjunction with the consolidated financial statements included in the Annual Report on Form 10-K for the year ended December 31, 2015. In the Company’s opinion, all adjustments, consisting primarily of normal recurring adjustments, necessary for a fair presentation of the results for the interim periods have been made. The results of operations of the three month periods ended March 31, 2016 are not necessarily indicative of the results expected for the full year.
Some items in the prior period financial statements were reclassified to conform to the current presentation. Reclassifications had no effect on prior period net income or shareholders’ equity.
9
CenterState Banks, Inc. and Subsidiaries
NOTES TO CONDENSED CONSOLIDATED FINANCIAL STATEMENTS (unaudited)
(in thousands of dollars, except per share data)
NOTE 2: Common stock outstanding and earnings per share data
The two-class method is used in the calculation of basic and diluted earnings per share. Under the two-class method, earnings available to common shareholders for the period are allocated between common shareholders and participating securities according to dividends declared (or accumulated) and participation rights in undistributed earnings. There were an average of 890,410 and 586,620 stock options that were not considered in computing diluted earnings per common share because they were anti-dilutive during the three month periods ending March 31, 2016 and 2015, respectively. The following table presents the factors used in the earnings per share computations for the periods indicated.
| Three months ended March 31, |
| |||||
| 2016 |
|
| 2015 |
| ||
Basic |
|
|
|
|
|
|
|
Net (loss) income available to common shareholders | $ | (4,804 | ) |
| $ | 9,148 |
|
Less: Earnings allocated to participating securities |
| - |
|
|
| (51 | ) |
Net (loss) income allocated to common shareholders | $ | (4,804 | ) |
| $ | 9,097 |
|
|
|
|
|
|
|
|
|
Weighted average common shares outstanding |
|
|
|
|
|
|
|
including participating securities |
| 46,343,033 |
|
|
| 45,379,982 |
|
Less: Participating securities (1) |
| - |
|
|
| (252,042 | ) |
Average shares |
| 46,343,033 |
|
|
| 45,127,940 |
|
Basic (loss) earnings per common share | $ | (0.10 | ) |
| $ | 0.20 |
|
|
|
|
|
|
|
|
|
Diluted |
|
|
|
|
|
|
|
Net income available to common shareholders | $ | (4,804 | ) |
| $ | 9,097 |
|
Weighted average common shares outstanding for |
|
|
|
|
|
|
|
basic earnings per common share |
| 46,343,033 |
|
|
| 45,127,940 |
|
Add: Dilutive effects of stock based compensation awards |
| - |
|
|
| 529,684 |
|
Average shares and dilutive potential common shares |
| 46,343,033 |
|
|
| 45,657,624 |
|
Diluted (loss) earnings per common share | $ | (0.10 | ) |
| $ | 0.20 |
|
| 1. | Participating securities are restricted stock awards whereby the stock certificates have been issued, are included in outstanding shares, receive dividends and can be voted, but have not vested. |
NOTE 3: Fair value
Generally accepted accounting principles establish a fair value hierarchy which requires an entity to maximize the use of observable inputs and minimize the use of unobservable inputs when measuring fair value. The standard describes three levels of inputs that may be used to measure fair value:
Level 1: Quoted prices (unadjusted) for identical assets or liabilities in active markets that the entity has the ability to access as of the measurement date.
Level 2: Significant other observable inputs other than Level 1 prices such as quoted prices for similar assets or liabilities; quoted prices in markets that are not active; or other inputs that are observable or can be corroborated by observable market data.
Level 3: Significant unobservable inputs that reflect a reporting entity’s own assumptions about the assumptions that market participants would use in pricing and asset or liability.
The fair values of securities available for sale are determined by obtaining quoted prices on nationally recognized securities exchanges (Level 1 inputs) or matrix pricing, which is a mathematical technique widely used in the industry to value debt securities without relying exclusively on quoted prices for the specific securities but rather by relying on the securities’ relationship to other benchmark quoted securities (Level 2 inputs).
The fair values of trading securities are determined as follows: (1) for those securities that have traded prior to the date of the consolidated balance sheet but have not settled (date of sale) until after such date, the sales price is used as the fair value; and, (2) for those securities which have not traded as of the date of the consolidated balance sheet, the fair value was determined by broker price indications of similar or same securities.
10
CenterState Banks, Inc. and Subsidiaries
NOTES TO CONDENSED CONSOLIDATED FINANCIAL STATEMENTS (unaudited)
(in thousands of dollars, except per share data)
The fair value of derivatives is based on valuation models using observable market data as of the measurement date (Level 2). Assets and liabilities measured at fair value on a recurring basis are summarized below.
|
|
|
|
|
| Fair value measurements using | ||||||
|
|
|
|
|
|
|
| Significant |
|
|
| |
|
|
|
|
|
| Quoted prices in |
| other |
|
| Significant | |
|
|
|
|
|
| active markets for |
| observable |
|
| unobservable | |
|
| Carrying |
|
| identical assets |
| inputs |
|
| inputs | ||
|
| value |
|
| (Level 1) |
| (Level 2) |
|
| (Level 3) | ||
at March 31, 2016 |
|
|
|
|
|
|
|
|
|
|
|
|
Assets: |
|
|
|
|
|
|
|
|
|
|
|
|
Trading securities |
| $ | 2,719 |
|
| — |
| $ | 2,719 |
|
| — |
Available for sale securities |
|
|
|
|
|
|
|
|
|
|
|
|
U.S. Treasury securities |
|
| 1,002 |
|
| — |
|
| 1,002 |
|
| — |
Mortgage backed securities |
|
| 672,328 |
|
| — |
|
| 672,328 |
|
| — |
Municipal securities |
|
| 34,243 |
|
| — |
|
| 34,243 |
|
| — |
Interest rate swap derivatives |
|
| 41,111 |
|
| — |
|
| 41,111 |
|
| — |
|
|
|
|
|
|
|
|
|
|
|
|
|
Liabilities: |
|
|
|
|
|
|
|
|
|
|
|
|
Interest rate swap derivatives |
|
| 42,893 |
|
| — |
|
| 42,893 |
|
| — |
|
|
|
|
|
|
|
|
|
|
|
|
|
at December 31, 2015 |
|
|
|
|
|
|
|
|
|
|
|
|
Assets: |
|
|
|
|
|
|
|
|
|
|
|
|
Trading securities |
| $ | 2,107 |
|
| — |
| $ | 2,107 |
|
| — |
Available for sale securities |
|
|
|
|
|
|
|
|
|
|
|
|
U.S. Treasury securities |
|
| 1,000 |
|
| — |
|
| 1,000 |
|
| — |
Mortgage backed securities |
|
| 568,452 |
|
| — |
|
| 568,452 |
|
| — |
Municipal securities |
|
| 35,287 |
|
| — |
|
| 35,287 |
|
| — |
Interest rate swap derivatives |
|
| 18,619 |
|
| — |
|
| 18,619 |
|
| — |
|
|
|
|
|
|
|
|
|
|
|
|
|
Liabilities: |
|
|
|
|
|
|
|
|
|
|
|
|
Interest rate swap derivatives |
|
| 19,822 |
|
| — |
|
| 19,822 |
|
| — |
11
CenterState Banks, Inc. and Subsidiaries
NOTES TO CONDENSED CONSOLIDATED FINANCIAL STATEMENTS (unaudited)
(in thousands of dollars, except per share data)
The fair value of impaired loans with specific valuation allowance for loan losses and other real estate owned is based on recent real estate appraisals. For residential real estate impaired loans and other real estate owned, appraised values are based on the comparative sales approach. For commercial and commercial real estate impaired loans, and other real estate owned, appraisers may use either a single valuation approach or a combination of approaches such as comparative sales, cost or the income approach. A significant unobservable input in the income approach is the estimated income capitalization rate for a given piece of collateral. At March 31, 2016, the range of capitalization rates utilized to determine the fair value of the underlying collateral ranged from 7% to 10%. Adjustments to appraisals may be made by the appraiser to reflect local market conditions or other economic factors and may result in changes in the fair value of a given asset over time. As such, the fair value of impaired loans and other real estate owned are considered a Level 3 in the fair value hierarchy.
Assets and liabilities measured at fair value on a non-recurring basis are summarized below.
|
|
|
|
|
| Fair value measurements using |
| |||||
|
|
|
|
|
|
|
| Significant |
|
|
|
|
|
|
|
|
|
| Quoted prices in |
| other |
| Significant |
| |
|
|
|
|
|
| active markets for |
| observable |
| unobservable |
| |
|
| Carrying |
|
| identical assets |
| inputs |
| inputs |
| ||
|
| value |
|
| (Level 1) |
| (Level 2) |
| (Level 3) |
| ||
at March 31, 2016 |
|
|
|
|
|
|
|
|
|
|
|
|
Assets: |
|
|
|
|
|
|
|
|
|
|
|
|
Impaired loans |
|
|
|
|
|
|
|
|
|
|
|
|
Residential real estate |
| $ | 3,593 |
|
| — |
| — |
| $ | 3,593 |
|
Commercial real estate |
|
| 7,475 |
|
| — |
| — |
|
| 7,475 |
|
Land, land development and construction |
|
| 1,540 |
|
| — |
| — |
|
| 1,540 |
|
Commercial |
|
| 1,257 |
|
| — |
| — |
|
| 1,257 |
|
Consumer |
|
| 87 |
|
| — |
| — |
|
| 87 |
|
Other real estate owned |
|
|
|
|
|
|
|
|
|
|
|
|
Residential real estate |
| — |
|
| — |
| — |
| — |
| ||
Commercial real estate |
|
| 1,725 |
|
| — |
| — |
|
| 1,725 |
|
Land, land development and construction |
|
| 1,543 |
|
| — |
| — |
|
| 1,543 |
|
Bank property held for sale |
|
| 8,069 |
|
| — |
| — |
|
| 8,069 |
|
|
|
|
|
|
|
|
|
|
|
|
|
|
at December 31, 2015 |
|
|
|
|
|
|
|
|
|
|
|
|
Assets: |
|
|
|
|
|
|
|
|
|
|
|
|
Impaired loans |
|
|
|
|
|
|
|
|
|
|
|
|
Residential real estate |
| $ | 3,288 |
|
| — |
| — |
| $ | 3,288 |
|
Commercial real estate |
|
| 7,061 |
|
| — |
| — |
|
| 7,061 |
|
Land, land development and construction |
|
| 1,767 |
|
| — |
| — |
|
| 1,767 |
|
Commercial |
|
| 280 |
|
| — |
| — |
|
| 280 |
|
Consumer |
|
| 90 |
|
| — |
| — |
|
| 90 |
|
Other real estate owned |
|
|
|
|
|
|
|
|
|
|
|
|
Residential real estate |
|
| 85 |
|
| — |
| — |
|
| 85 |
|
Commercial real estate |
|
| 1,506 |
|
| — |
| — |
|
| 1,506 |
|
Land, land development and construction |
|
| 2,002 |
|
| — |
| — |
|
| 2,002 |
|
Bank property held for sale |
|
| 1,665 |
|
| — |
| — |
|
| 1,665 |
|
Impaired loans measured at fair value had a recorded investment of $13,952 with a valuation allowance of $805, at March 31, 2016, and a recorded investment of $13,293, with a valuation allowance of $807, at December 31, 2015. The Company recorded a provision for loan loss expense of $115 on these loans during the three month period ending March 31, 2016. The Company recorded a provision for loan loss expense of $120 on impaired loans carried at fair value during the three month period ending March 31, 2015.
Other real estate owned had a decline in fair value of $22 and $389 during the three month periods ending March 31, 2016 and 2015, respectively. Changes in fair value were recorded directly to current earnings through non interest expense.
12
CenterState Banks, Inc. and Subsidiaries
NOTES TO CONDENSED CONSOLIDATED FINANCIAL STATEMENTS (unaudited)
(in thousands of dollars, except per share data)
Bank property held for sale represents certain branch office buildings which the Company has closed and consolidated with other existing branches. The real estate was transferred out of the Bank Premises and Equipment category into bank property held for sale at the lower of amortized cost or fair value less estimated costs to sell. The fair values were based upon comparative sales data provided by real estate brokers. The Company transferred five properties from bank premises to bank property held for sale during the first quarter of 2016. The Company recognized an impairment charge of $456 and $682 during the three month periods ending March 31, 2016 and 2015, respectively, related to bank properties held for sale. In addition, the Company acquired seven branch properties held for sale as a result of the acquisitions of Community Bank of South Florida, Inc. (“Community”) and Hometown of Homestead Banking Company (“Hometown”) on March 1, 2016.
Fair Value of Financial Instruments
The methods and assumptions, not previously presented, used to estimate fair value are described as follows:
Cash and Cash Equivalents: The carrying amounts of cash and cash equivalents approximate fair values and are classified as Level 1.
FHLB and FRB Stock: It is not practical to determine the fair value of FHLB and FRB stock due to restrictions placed on their transferability.
Investment securities held to maturity: The fair values of securities held to maturity are determined by obtaining quoted prices on nationally recognized securities exchanges (Level 1 inputs) or matrix pricing, which is a mathematical technique widely used in the industry to value debt securities without relying exclusively on quoted prices for the specific securities but rather by relying on the securities’ relationship to other benchmark quoted securities (Level 2 inputs).
Loans held for sale: The fair value of loans held for sale is estimated based upon binding contracts from third party investors resulting in a Level 2 classification.
Loans, net: Fair values of loans, excluding loans held for sale, are estimated as follows: For variable rate loans that reprice frequently and with no significant change in credit risk, fair values are based on carrying values resulting in a Level 3 classification. Fair values for other loans are estimated using discounted cash flow analyses, using interest rates currently being offered for loans with similar terms to borrowers of similar credit quality resulting in a Level 3 classification. Impaired loans are valued as described previously. The methods utilized to estimate the fair value of loans do not necessarily represent an exit price.
FDIC Indemnification Asset: It is not practical to determine the fair value of the FDIC indemnification asset due to restrictions placed on its transferability.
Accrued Interest Receivable: The carrying amount of accrued interest receivable approximates fair value and is classified as Level 2 for accrued interest receivable related to investment securities and Level 3 for accrued interest receivable related to loans.
Deposits: The fair values disclosed for demand deposits (e.g., interest and non-interest checking, savings, and money market accounts) are, by definition, equal to the amount payable on demand at the reporting date (i.e., their carrying amount) resulting in Level 1 classification. Fair values for fixed rate certificates of deposit are estimated using a discounted cash flows calculation that applies interest rates currently being offered on certificates to a schedule of aggregated expected monthly maturities on time deposits resulting in a Level 2 classification.
Short-term Borrowings: The carrying amounts of federal funds purchased, borrowings under repurchase agreements, and other short-term borrowings, generally maturing within ninety days, approximate their fair values resulting in a Level 2 classification.
Corporate Debentures: The fair values of the Company’s corporate debentures are estimated using discounted cash flow analyses based on the current borrowing rates for similar types of borrowing arrangements resulting in a Level 3 classification.
Accrued Interest Payable: The carrying amount of accrued interest payable approximates fair value resulting in a Level 2 classification.
Off-balance Sheet Instruments: The fair value of off-balance-sheet items is not considered material.
13
CenterState Banks, Inc. and Subsidiaries
NOTES TO CONDENSED CONSOLIDATED FINANCIAL STATEMENTS (unaudited)
(in thousands of dollars, except per share data)
The following table presents the carry amounts and estimated fair values of the Company’s financial instruments:
|
|
|
|
|
| Fair value measurements |
|
|
|
|
| |||||||||
at March 31, 2016 |
| Carrying amount |
|
| Level 1 |
|
| Level 2 |
|
| Level 3 |
|
| Total |
| |||||
Financial assets: |
|
|
|
|
|
|
|
|
|
|
|
|
|
|
|
|
|
|
|
|
Cash and cash equivalents |
| $ | 362,019 |
|
| $ | 362,019 |
|
| $ | - |
|
| $ | - |
|
| $ | 362,019 |
|
Trading securities |
|
| 2,719 |
|
|
| - |
|
|
| 2,719 |
|
|
| - |
|
|
| 2,719 |
|
Investment securities available for sale |
|
| 707,573 |
|
|
| - |
|
|
| 707,573 |
|
|
| - |
|
|
| 707,573 |
|
Investment securities held to maturity |
|
| 256,849 |
|
|
| - |
|
|
| 259,599 |
|
|
| - |
|
|
| 259,599 |
|
FHLB and FRB stock |
|
| 17,003 |
|
|
| - |
|
|
| - |
|
|
| - |
|
| n/a |
| |
Loans held for sale |
|
| 2,186 |
|
|
| - |
|
|
| 2,186 |
|
|
| - |
|
|
| 2,186 |
|
Loans, less allowance for loan losses of $23,122 |
|
| 3,125,099 |
|
|
| - |
|
|
| - |
|
|
| 3,127,172 |
|
|
| 3,127,172 |
|
Interest rate swap derivatives |
|
| 41,111 |
|
|
| - |
|
|
| 41,111 |
|
|
| - |
|
|
| 41,111 |
|
Accrued interest receivable |
|
| 11,677 |
|
|
| - |
|
|
| 3,601 |
|
|
| 8,076 |
|
|
| 11,677 |
|
|
|
|
|
|
|
|
|
|
|
|
|
|
|
|
|
|
|
|
|
|
Financial liabilities: |
|
|
|
|
|
|
|
|
|
|
|
|
|
|
|
|
|
|
|
|
Deposits- without stated maturities |
| $ | 3,459,742 |
|
| $ | 3,459,742 |
|
| $ | - |
|
| $ | - |
|
| $ | 3,459,742 |
|
Deposits- with stated maturities |
|
| 632,425 |
|
|
| - |
|
|
| 633,637 |
|
|
| - |
|
|
| 633,637 |
|
Securities sold under agreement to repurchase |
|
| 31,474 |
|
|
| - |
|
|
| 31,474 |
|
|
| - |
|
|
| 31,474 |
|
Federal funds purchased |
|
| 225,298 |
|
|
| - |
|
|
| 225,298 |
|
|
| - |
|
|
| 225,298 |
|
Corporate debentures |
|
| 25,782 |
|
|
| - |
|
|
| - |
|
|
| 21,912 |
|
|
| 21,912 |
|
Interest rate swap derivatives |
|
| 42,893 |
|
|
| - |
|
|
| 42,893 |
|
|
| - |
|
|
| 42,893 |
|
Accrued interest payable |
|
| 1,056 |
|
|
| - |
|
|
| 1,056 |
|
|
| - |
|
|
| 1,056 |
|
|
|
|
|
|
|
|
|
|
|
|
|
|
|
|
|
|
|
|
|
|
|
|
|
|
|
| Fair value measurements |
|
|
|
|
| |||||||||
at December 31, 2015 |
| Carrying amount |
|
| Level 1 |
|
| Level 2 |
|
| Level 3 |
|
| Total |
| |||||
Financial assets: |
|
|
|
|
|
|
|
|
|
|
|
|
|
|
|
|
|
|
|
|
Cash and cash equivalents |
| $ | 152,482 |
|
| $ | 152,482 |
|
| $ | - |
|
| $ | - |
|
| $ | 152,482 |
|
Trading securities |
|
| 2,107 |
|
|
| - |
|
|
| 2,107 |
|
|
| - |
|
|
| 2,107 |
|
Investment securities available for sale |
|
| 604,739 |
|
|
| - |
|
|
| 604,739 |
|
|
| - |
|
|
| 604,739 |
|
Investment securities held to maturity |
|
| 272,840 |
|
|
| - |
|
|
| 273,983 |
|
|
| - |
|
|
| 273,983 |
|
FHLB and FRB stock |
|
| 14,041 |
|
|
| - |
|
|
| - |
|
|
| - |
|
| n/a |
| |
Loans held for sale |
|
| 1,529 |
|
|
| - |
|
|
| 1,529 |
|
|
| - |
|
|
| 1,529 |
|
Loans, less allowance for loan losses of $22,264 |
|
| 2,571,512 |
|
|
| - |
|
|
| - |
|
|
| 2,574,516 |
|
|
| 2,574,516 |
|
FDIC indemnification asset |
|
| 25,795 |
|
|
| - |
|
|
| - |
|
|
| - |
|
| n/a |
| |
Interest rate swap derivatives |
|
| 18,619 |
|
|
| - |
|
|
| 18,619 |
|
|
| - |
|
|
| 18,619 |
|
Accrued interest receivable |
|
| 10,286 |
|
|
| - |
|
|
| - |
|
|
| 10,286 |
|
|
| 10,286 |
|
|
|
|
|
|
|
|
|
|
|
|
|
|
|
|
|
|
|
|
|
|
Financial liabilities: |
|
|
|
|
|
|
|
|
|
|
|
|
|
|
|
|
|
|
|
|
Deposits- without stated maturities |
| $ | 2,792,758 |
|
| $ | 2,792,758 |
|
| $ | - |
|
| $ | - |
|
| $ | 2,792,758 |
|
Deposits- with stated maturities |
|
| 422,420 |
|
|
| - |
|
|
| 423,391 |
|
|
| - |
|
|
| 423,391 |
|
Securities sold under agreement to repurchase |
|
| 27,472 |
|
|
| - |
|
|
| 27,472 |
|
|
| - |
|
|
| 27,472 |
|
Federal funds purchased |
|
| 200,250 |
|
|
| - |
|
|
| 200,250 |
|
|
| - |
|
|
| 200,250 |
|
Other borrowed funds |
|
| 25,000 |
|
|
| - |
|
|
| 25,000 |
|
|
| - |
|
|
| 25,000 |
|
Corporate debentures |
|
| 24,093 |
|
|
| - |
|
|
| - |
|
|
| 19,734 |
|
|
| 19,734 |
|
Interest rate swap derivatives |
|
| 19,822 |
|
|
| - |
|
|
| 19,822 |
|
|
| - |
|
|
| 19,822 |
|
Accrued interest payable |
|
| 218 |
|
|
| - |
|
|
| 218 |
|
|
| - |
|
|
| 218 |
|
14
CenterState Banks, Inc. and Subsidiaries
NOTES TO CONDENSED CONSOLIDATED FINANCIAL STATEMENTS (unaudited)
(in thousands of dollars, except per share data)
NOTE 4: Reportable segments
The Company’s reportable segments represent the distinct product lines the Company offers and are viewed separately for strategic planning purposes by management. The table below is a reconciliation of the reportable segment revenues, expenses, and profit to the Company’s consolidated total for the three month periods ending March 31, 2016 and 2015.
| Three month period ending March 31, 2016 |
|
|
|
|
|
|
|
|
| |||||||||
|
|
|
|
| Correspondent |
|
| Corporate |
|
|
|
|
|
|
|
|
| ||
| Commercial |
|
| banking and |
|
| overhead |
|
|
|
|
|
|
|
|
| |||
| and retail |
|
| capital markets |
|
| and |
|
| Elimination |
|
|
|
|
| ||||
| banking |
|
| division |
|
| administration |
|
| entries |
|
| Total |
| |||||
Interest income | $ | 41,434 |
|
| $ | 2,064 |
|
| $ | - |
|
| $ | - |
|
| $ | 43,498 |
|
Interest expense |
| (1,513 | ) |
|
| (262 | ) |
|
| (248 | ) |
|
| - |
|
|
| (2,023 | ) |
Net interest income (expense) |
| 39,921 |
|
|
| 1,802 |
|
|
| (248 | ) |
|
| - |
|
|
| 41,475 |
|
Provision for loan losses |
| (458 | ) |
|
| (52 | ) |
|
| - |
|
|
| - |
|
|
| (510 | ) |
Non interest income |
| 5,478 |
|
|
| 8,775 |
|
|
| 308 |
|
|
| - |
|
|
| 14,561 |
|
Non interest expense |
| (56,022 | ) |
|
| (5,782 | ) |
|
| (1,049 | ) |
|
| - |
|
|
| (62,853 | ) |
Net (loss) income before taxes |
| (11,081 | ) |
|
| 4,743 |
|
|
| (989 | ) |
|
| - |
|
|
| (7,327 | ) |
Income tax benefit (provision) |
| 3,983 |
|
|
| (1,830 | ) |
|
| 370 |
|
|
| - |
|
|
| 2,523 |
|
Net (loss) income | $ | (7,098 | ) |
| $ | 2,913 |
|
| $ | (619 | ) |
| $ | - |
|
| $ | (4,804 | ) |
Total assets | $ | 4,596,420 |
|
| $ | 366,956 |
|
| $ | 552,369 |
|
| $ | (546,090 | ) |
| $ | 4,969,655 |
|
| Three month period ending March 31, 2015 |
|
|
|
|
|
|
|
|
| |||||||||
|
|
|
|
| Correspondent |
|
| Corporate |
|
|
|
|
|
|
|
|
| ||
| Commercial |
|
| banking and |
|
| overhead |
|
|
|
|
|
|
|
|
| |||
| and retail |
|
| capital markets |
|
| and |
|
| Elimination |
|
|
|
|
| ||||
| banking |
|
| division |
|
| administration |
|
| entries |
|
| Total |
| |||||
Interest income | $ | 37,751 |
|
| $ | 1,734 |
|
| $ | - |
|
| - |
|
| $ | 39,485 |
| |
Interest expense |
| (1,496 | ) |
|
| (132 | ) |
|
| (237 | ) |
| - |
|
|
| (1,865 | ) | |
Net interest income (expense) |
| 36,255 |
|
|
| 1,602 |
|
|
| (237 | ) |
| - |
|
|
| 37,620 |
| |
Provision for loan losses |
| (1,511 | ) |
|
| (131 | ) |
|
| - |
|
| - |
|
|
| (1,642 | ) | |
Non interest income |
| 2,281 |
|
|
| 6,800 |
|
|
| - |
|
| - |
|
|
| 9,081 |
| |
Non interest expense |
| (23,899 | ) |
|
| (5,595 | ) |
|
| (1,109 | ) |
| - |
|
|
| (30,603 | ) | |
Net income before taxes |
| 13,126 |
|
|
| 2,676 |
|
|
| (1,346 | ) |
|
| - |
|
|
| 14,456 |
|
Income tax (provision) benefit |
| (4,792 | ) |
|
| (1,032 | ) |
|
| 516 |
|
| - |
|
|
| (5,308 | ) | |
Net income (loss) | $ | 8,334 |
|
| $ | 1,644 |
|
| $ | (830 | ) |
| - |
|
| $ | 9,148 |
| |
Total assets | $ | 3,573,573 |
|
| $ | 305,667 |
|
| $ | 493,374 |
|
| $ | (484,042 | ) |
| $ | 3,888,572 |
|
Commercial and retail banking: The Company’s primary business is commercial and retail banking. Currently, the Company operates through its subsidiary bank and two non bank subsidiaries, R4ALL and CSFL Insurance Corp., with 72 full service banking locations in 22 counties throughout Florida providing traditional deposit and lending products and services to its commercial and retail customers.
Correspondent banking and capital markets division: Operating as a division of our subsidiary bank, its primary revenue generating activities are related to the capital markets division which includes commissions earned on fixed income security sales, fees from hedging services, loan brokerage fees and consulting fees for services related to these activities. Income generated related to the correspondent banking services includes spread income earned on correspondent bank deposits (i.e. federal funds purchased) and fees generated from safe-keeping activities, bond accounting services, asset/liability consulting services, international wires, clearing and corporate checking account services and other correspondent banking related services. The fees derived from the correspondent banking services are less volatile than those generated through the capital markets group. The customer base includes small to medium size financial institutions primarily located in Southeastern United States.
Corporate overhead and administration: Corporate overhead and administration is comprised primarily of compensation and benefits for certain members of management, interest on parent company debt, office occupancy and depreciation of parent company facilities, certain merger related costs and other expenses.
15
CenterState Banks, Inc. and Subsidiaries
NOTES TO CONDENSED CONSOLIDATED FINANCIAL STATEMENTS (unaudited)
(in thousands of dollars, except per share data)
NOTE 5: Investment securities
Available-for-Sale
All of the mortgage backed securities listed below were issued by U.S. government sponsored entities and agencies, primarily Fannie Mae, Freddie Mac and Ginnie Mae, institutions which the government has affirmed its commitment to support. The fair value of available for sale securities and the related gross unrealized gains and losses recognized in accumulated other comprehensive income (loss) were as follows:
|
| March 31, 2016 |
| |||||||||||||
|
|
|
|
|
| Gross |
|
| Gross |
|
|
|
|
| ||
|
| Amortized |
|
| Unrealized |
|
| Unrealized |
|
| Fair |
| ||||
|
| Cost |
|
| Gains |
|
| Losses |
|
| Value |
| ||||
U.S. Treasury securities |
| $ | 1,002 |
|
| $ | - |
|
| $ | - |
|
| $ | 1,002 |
|
Mortgage backed securities |
|
| 666,911 |
|
|
| 6,472 |
|
|
| 1,055 |
|
|
| 672,328 |
|
Municipal securities |
|
| 33,137 |
|
|
| 1,106 |
|
|
| - |
|
|
| 34,243 |
|
Total available-for-sale |
| $ | 701,050 |
|
| $ | 7,578 |
|
| $ | 1,055 |
|
| $ | 707,573 |
|
|
|
|
|
|
|
|
|
|
|
|
|
|
|
|
|
|
|
|
|
|
|
|
|
|
|
|
|
|
|
|
|
|
|
|
| December 31, 2015 |
| |||||||||||||
|
|
|
|
|
| Gross |
|
| Gross |
|
|
|
|
| ||
|
| Amortized |
|
| Unrealized |
|
| Unrealized |
|
| Fair |
| ||||
|
| Cost |
|
| Gains |
|
| Losses |
|
| Value |
| ||||
U.S. Treasury securities |
| $ | 1,002 |
|
| $ | - |
|
| $ | 2 |
|
| $ | 1,000 |
|
Mortgage backed securities |
|
| 567,264 |
|
|
| 4,102 |
|
|
| 2,914 |
|
|
| 568,452 |
|
Municipal securities |
|
| 34,131 |
|
|
| 1,156 |
|
|
| - |
|
|
| 35,287 |
|
Total available-for-sale |
| $ | 602,397 |
|
| $ | 5,258 |
|
| $ | 2,916 |
|
| $ | 604,739 |
|
The cost of securities sold is determined using the specific identification method. The securities sold during the first quarter of 2016 were securities acquired through the acquisitions of Community and Hometown on March 1, 2016. These acquired securities were marked to fair value and subsequently sold after the acquisition date, and no gain or loss was recognized from the sale of these securities. Sales of available for sale securities for the three months ended March 31, 2016 and 2015 were as follows:
For the three months ended: |
| March 31, 2016 |
|
| March 31, 2015 |
| ||
Proceeds |
| $ | 141,715 |
|
| $ | - |
|
Gross gains |
|
| - |
|
|
| - |
|
Gross losses |
|
| - |
|
|
| - |
|
The tax provision related to these net realized gains was $0 and $0, respectively.
The fair value of available for sale securities at March 31, 2016 by contractual maturity were as follows. Securities not due at a single maturity date, primarily mortgage-backed securities, are shown separately.
|
| Fair |
|
| Amortized |
| ||
Investment securities available for sale: |
| Value |
|
| Cost |
| ||
Due in one year or less |
| $ | 1,630 |
|
| $ | 1,618 |
|
Due after one year through five years |
|
| 5,004 |
|
|
| 4,868 |
|
Due after five years through ten years |
|
| 12,431 |
|
|
| 12,119 |
|
Due after ten years through thirty years |
|
| 16,180 |
|
|
| 15,534 |
|
Mortgage backed securities |
|
| 672,328 |
|
|
| 666,911 |
|
Total available-for-sale |
| $ | 707,573 |
|
| $ | 701,050 |
|
Available for sale securities pledged at March 31, 2016 and December 31, 2015 had a carrying amount (estimated fair value) of $198,002 and $195,753 respectively. These securities were pledged primarily to secure public deposits and repurchase agreements.
At March 31, 2016 and December 31, 2015, there were no holdings of securities of any one issuer, other than mortgage backed securities issued by U.S. Government sponsored entities and agencies, in an amount greater than 10% of stockholders’ equity.
16
CenterState Banks, Inc. and Subsidiaries
NOTES TO CONDENSED CONSOLIDATED FINANCIAL STATEMENTS (unaudited)
(in thousands of dollars, except per share data)
The following tables show the Company’s available for sale investments’ gross unrealized losses and fair value, aggregated by investment category and length of time that individual securities have been in a continuous unrealized loss position, at March 31, 2016 and December 31, 2015.
|
| March 31, 2016 |
| |||||||||||||||||||||
|
| Less than 12 months |
|
| 12 months or more |
|
| Total |
| |||||||||||||||
|
| Fair |
|
| Unrealized |
|
| Fair |
|
| Unrealized |
|
| Fair |
|
| Unrealized |
| ||||||
|
| Value |
|
| Losses |
|
| Value |
|
| Losses |
|
| Value |
|
| Losses |
| ||||||
U.S. Treasury securities |
| $ | - |
|
| $ | - |
|
| $ | - |
|
| $ | - |
|
| $ | - |
|
| $ | - |
|
Mortgage backed securities |
|
| 107,881 |
|
|
| 325 |
|
|
| 31,900 |
|
|
| 730 |
|
|
| 139,781 |
|
|
| 1,055 |
|
Total temporarily impaired |
|
|
|
|
|
|
|
|
|
|
|
|
|
|
|
|
|
|
|
|
|
|
|
|
available-for-sale securities |
| $ | 107,881 |
|
| $ | 325 |
|
| $ | 31,900 |
|
| $ | 730 |
|
| $ | 139,781 |
|
| $ | 1,055 |
|
|
|
|
|
|
|
|
|
|
|
|
|
|
|
|
|
|
|
|
|
|
|
|
|
|
|
| December 31, 2015 |
| |||||||||||||||||||||
|
| Less than 12 months |
|
| 12 months or more |
|
| Total |
| |||||||||||||||
|
|
|
|
|
| Unrealized |
|
|
|
|
|
| Unrealized |
|
|
|
|
|
| Unrealized |
| |||
|
| Fair Value |
|
| Losses |
|
| Fair Value |
|
| Losses |
|
| Fair Value |
|
| Losses |
| ||||||
U.S. Treasury securities |
| $ | 1,000 |
|
| $ | 2 |
|
| $ | - |
|
| $ | - |
|
| $ | 1,000 |
|
| $ | 2 |
|
Mortgage backed securities |
|
| 282,299 |
|
|
| 1,599 |
|
|
| 32,892 |
|
|
| 1,315 |
|
|
| 315,191 |
|
|
| 2,914 |
|
Total temporarily impaired |
|
|
|
|
|
|
|
|
|
|
|
|
|
|
|
|
|
|
|
|
|
|
|
|
available-for-sale securities |
| $ | 283,299 |
|
| $ | 1,601 |
|
| $ | 32,892 |
|
| $ | 1,315 |
|
| $ | 316,191 |
|
| $ | 2,916 |
|
At March 31, 2016, 100% of the mortgage-backed securities held by the Company were issued by U.S. government-sponsored entities and agencies, primarily Fannie Mae, Freddie Mac, and Ginnie Mae, institutions which the government has affirmed its commitment to support. Because the decline in fair value is attributable to changes in interest rates and illiquidity, and not credit quality, and because the Company does not have the intent to sell these mortgage-backed securities and it is likely that it will not be required to sell the securities before their anticipated recovery, the Company does not consider these securities to be other-than-temporarily impaired at March 31, 2016.
Unrealized losses on municipal securities have not been recognized into income because the issuers bonds are of high quality, and because management does not intend to sell these investments or more likely than not will not be required to sell these investments before their anticipated recovery. The fair value is expected to recover as the securities approach maturity.
Held-to-Maturity
The following reflects the fair value of held-to-maturity securities and the related gross unrecognized gains and losses as of March 31, 2016 and December 31, 2015.
|
| March 31, 2016 |
| ||||||||||||||||||||
|
|
|
|
|
| Gross |
|
| Gross |
|
|
|
|
| |||||||||
|
| Amortized |
|
| Unrecognized |
|
| Unrecognized |
|
| Fair |
| |||||||||||
|
| Cost |
|
| Gains |
|
| Losses |
|
| Value |
| |||||||||||
Obligations of U.S. government sponsored entities and agencies |
| $ | 37,114 |
|
| $ | 91 |
|
| $ | 35 |
|
| $ | 37,170 |
| |||||||
Mortgage backed securities |
|
| 149,368 |
|
|
| 644 |
|
|
| 73 |
|
|
| 149,939 |
| |||||||
Municipal securities |
|
| 70,367 |
|
|
| 2,153 |
|
|
| 30 |
|
|
| 72,490 |
| |||||||
Total held-to-maturity |
| $ | 256,849 |
|
| $ | 2,888 |
|
| $ | 138 |
|
| $ | 259,599 |
| |||||||
|
|
|
|
|
|
|
|
|
|
|
|
|
|
|
|
| |||||||
|
|
|
|
|
|
|
|
|
|
|
|
|
|
|
|
| |||||||
|
| December 31, 2015 |
| ||||||||||||||||||||
|
|
|
|
|
| Gross |
|
| Gross |
|
|
|
|
| |||||||||
|
| Amortized |
|
| Unrecognized |
|
| Unrecognized |
|
| Fair |
| |||||||||||
|
| Cost |
|
| Gains |
|
| Losses |
|
| Value |
| |||||||||||
Obligations of U.S. government sponsored entities and agencies |
| $ | 57,610 |
|
| $ | 141 |
|
| $ | 23 |
|
| $ | 57,728 |
| |||||||
Mortgage backed securities |
|
| 155,942 |
|
|
| 71 |
|
|
| 601 |
|
|
| 155,412 |
| |||||||
Municipal securities |
|
| 59,288 |
|
|
| 1,566 |
|
|
| 11 |
|
|
| 60,843 |
| |||||||
Total held-to-maturity |
| $ | 272,840 |
|
| $ | 1,778 |
|
| $ | 635 |
|
| $ | 273,983 |
| |||||||
17
CenterState Banks, Inc. and Subsidiaries
NOTES TO CONDENSED CONSOLIDATED FINANCIAL STATEMENTS (unaudited)
(in thousands of dollars, except per share data)
Held-to-maturity securities pledged at March 31, 2016 and December 31, 2015 had an estimated fair value of $45,997 and $48,246 respectively. These securities were pledged primarily to secure public deposits and repurchase agreements.
At March 31, 2016, there were no holdings of held-to-maturity securities of any one issuer in an amount greater than 10% of stockholders’ equity.
The fair value and amortized cost of held to maturity securities at March 31, 2016 by contractual maturity were as follows. Mortgage-backed securities are not due at a single maturity date and are shown separately.
|
| Fair |
|
| Amortized |
| ||
Investment securities held-to-maturity |
| Value |
|
| Cost |
| ||
Due after five years through ten years |
| $ | 32,802 |
|
| $ | 32,763 |
|
Due after ten years through thirty years |
|
| 76,858 |
|
|
| 74,718 |
|
Mortgage backed securities |
|
| 149,939 |
|
|
| 149,368 |
|
Total held-to-maturity |
| $ | 259,599 |
|
| $ | 256,849 |
|
The following table shows the Company’s held to maturity investments’ gross unrecognized losses and fair value, aggregated by investment category and length of time the individual securities have been in a continuous unrecognized loss position, at March 31, 2016 and December 31, 2015.
|
| March 31, 2016 |
| |||||||||||||||||||||
|
| Less than 12 months |
|
| 12 months or more |
|
| Total |
| |||||||||||||||
|
| Fair |
|
| Unrecognized |
|
| Fair |
|
| Unrecognized |
|
| Fair |
|
| Unrecognized |
| ||||||
|
| Value |
|
| Losses |
|
| Value |
|
| Losses |
|
| Value |
|
| Losses |
| ||||||
Obligations of U.S. government sponsored entities and agencies |
| $ | 9,947 |
|
| $ | 35 |
|
| $ | - |
|
| $ | - |
|
| $ | 9,947 |
|
| $ | 35 |
|
Mortgage backed securities |
|
| 28,072 |
|
|
| 73 |
|
|
| - |
|
|
| - |
|
|
| 28,072 |
|
|
| 73 |
|
Municipal securities |
|
| 1,687 |
|
|
| 30 |
|
|
| - |
|
|
| - |
|
|
| 1,687 |
|
|
| 30 |
|
Total temporarily impaired |
|
|
|
|
|
|
|
|
|
|
|
|
|
|
|
|
|
|
|
|
|
|
|
|
held-to-maturity securities |
| $ | 39,706 |
|
| $ | 138 |
|
| $ | - |
|
| $ | - |
|
| $ | 39,706 |
|
| $ | 138 |
|
|
|
|
|
|
|
|
|
|
|
|
|
|
|
|
|
|
|
|
|
|
|
|
|
|
|
| December 31, 2015 |
| |||||||||||||||||||||
|
| Less than 12 months |
|
| 12 months or more |
|
| Total |
| |||||||||||||||
|
|
|
|
|
| Unrecognized |
|
|
|
|
|
| Unrecognized |
|
|
|
|
|
| Unrecognized |
| |||
|
| Fair Value |
|
| Losses |
|
| Fair Value |
|
| Losses |
|
| Fair Value |
|
| Losses |
| ||||||
Obligations of U.S. government sponsored entities and agencies |
| $ | 9,958 |
|
| $ | 23 |
|
| $ | - |
|
| $ | - |
|
|
| 9,958 |
|
|
| 23 |
|
Mortgage backed securities |
|
| 119,546 |
|
|
| 601 |
|
|
| - |
|
|
| - |
|
|
| 119,546 |
|
|
| 601 |
|
Municipal securities |
|
| 1,735 |
|
|
| 11 |
|
|
| - |
|
|
| - |
|
|
| 1,735 |
|
|
| 11 |
|
Total temporarily impaired |
|
|
|
|
|
|
|
|
|
|
|
|
|
|
|
|
|
|
|
|
|
|
|
|
held-to-maturity securities |
| $ | 131,239 |
|
| $ | 635 |
|
| $ | - |
|
| $ | - |
|
| $ | 131,239 |
|
| $ | 635 |
|
At March 31, 2016, 100% of the mortgage-backed securities held by the Company were issued by U.S. government-sponsored entities and agencies, primarily Fannie Mae, Freddie Mac, and Ginnie Mae, institutions which the government has affirmed its commitment to support. Because the decline in fair value is attributable to changes in interest rates and illiquidity, and not credit quality, and because the Company does not have the intent to sell these mortgage-backed securities and it is likely that it will not be required to sell the securities before their anticipated recovery, the Company does not consider these securities to be other-than-temporarily impaired at March 31, 2016.
Unrealized losses on municipal securities have not been recognized into income because the issuers bonds are of high quality, and because management does not intend to sell these investments or more likely than not will not be required to sell these investments before their anticipated recovery. The fair value is expected to recover as the securities approach maturity.
18
CenterState Banks, Inc. and Subsidiaries
NOTES TO CONDENSED CONSOLIDATED FINANCIAL STATEMENTS (unaudited)
(in thousands of dollars, except per share data)
NOTE 6: Loans
The following table sets forth information concerning the loan portfolio by collateral types as of the dates indicated.
|
| March 31, 2016 |
|
| December 31, 2015 |
| ||
Loans excluding PCI loans |
|
|
|
|
|
|
|
|
Real estate loans |
|
|
|
|
|
|
|
|
Residential |
| $ | 799,721 |
|
| $ | 647,496 |
|
Commercial |
|
| 1,530,579 |
|
|
| 1,254,782 |
|
Land, development and construction |
|
| 131,146 |
|
|
| 105,276 |
|
Total real estate |
|
| 2,461,446 |
|
|
| 2,007,554 |
|
Commercial |
|
| 373,628 |
|
|
| 307,321 |
|
Consumer and other loans |
|
| 75,835 |
|
|
| 67,500 |
|
Loans before unearned fees and deferred cost |
|
| 2,910,909 |
|
|
| 2,382,375 |
|
Net unearned fees and costs |
|
| 796 |
|
|
| 873 |
|
Total loans excluding PCI loans |
|
| 2,911,705 |
|
|
| 2,383,248 |
|
PCI loans (note 1) |
|
|
|
|
|
|
|
|
Real estate loans |
|
|
|
|
|
|
|
|
Residential |
|
| 82,595 |
|
|
| 86,104 |
|
Commercial |
|
| 127,354 |
|
|
| 105,629 |
|
Land, development and construction |
|
| 19,912 |
|
|
| 15,548 |
|
Total real estate |
|
| 229,861 |
|
|
| 207,281 |
|
Commercial |
|
| 6,020 |
|
|
| 2,771 |
|
Consumer and other loans |
|
| 635 |
|
|
| 476 |
|
Total PCI loans |
|
| 236,516 |
|
|
| 210,528 |
|
Total loans |
|
| 3,148,221 |
|
|
| 2,593,776 |
|
Allowance for loan losses for loans that are not PCI loans |
|
| (23,002 | ) |
|
| (22,143 | ) |
Allowance for loan losses for PCI loans |
|
| (120 | ) |
|
| (121 | ) |
Total loans, net of allowance for loan losses |
| $ | 3,125,099 |
|
| $ | 2,571,512 |
|
note 1: | Purchased credit impaired (“PCI”) loans are being accounted for pursuant to ASC Topic 310-30. |
The table below set forth the activity in the allowance for loan losses for the periods presented.
|
| Allowance for loan losses for loans that are not PCI loans |
|
| Allowance for loan losses on PCI loans |
|
| Total |
| |||
Three months ended March 31, 2016 |
|
|
|
|
|
|
|
|
|
|
|
|
Balance at beginning of period |
| $ | 22,143 |
|
| $ | 121 |
|
| $ | 22,264 |
|
Loans charged-off |
|
| (495 | ) |
|
| - |
|
|
| (495 | ) |
Recoveries of loans previously charged-off |
|
| 843 |
|
|
| - |
|
|
| 843 |
|
Net recoveries |
|
| 348 |
|
|
| - |
|
|
| 348 |
|
Provision (recovery) for loan losses |
|
| 511 |
|
|
| (1 | ) |
|
| 510 |
|
Balance at end of period |
| $ | 23,002 |
|
| $ | 120 |
|
| $ | 23,122 |
|
|
|
|
|
|
|
|
|
|
|
|
|
|
Three months ended March 31, 2015 |
|
|
|
|
|
|
|
|
|
|
|
|
Balance at beginning of period |
| $ | 19,384 |
|
| $ | 514 |
|
| $ | 19,898 |
|
Loans charged-off |
|
| (949 | ) |
|
| (77 | ) |
|
| (1,026 | ) |
Recoveries of loans previously charged-off |
|
| 466 |
|
|
| - |
|
|
| 466 |
|
Net charge-offs |
|
| (483 | ) |
|
| (77 | ) |
|
| (560 | ) |
Provision (recovery) for loan losses |
|
| 1,941 |
|
|
| (299 | ) |
|
| 1,642 |
|
Balance at end of period |
| $ | 20,842 |
|
| $ | 138 |
|
| $ | 20,980 |
|
|
|
|
|
|
|
|
|
|
|
|
|
|
|
|
|
|
|
|
|
|
|
|
|
|
|
19
CenterState Banks, Inc. and Subsidiaries
NOTES TO CONDENSED CONSOLIDATED FINANCIAL STATEMENTS (unaudited)
(in thousands of dollars, except per share data)
The following tables present the activity in the allowance for loan losses by portfolio segment for the periods presented.
|
| Real Estate Loans |
|
|
|
|
|
|
|
|
|
|
|
|
| |||||||||
|
| Residential |
|
| Commercial |
|
| Land, develop., constr. |
|
| Comm. & industrial |
|
| Consumer & other |
|
| Total |
| ||||||
Allowance for loan losses for loans that are not PCI loans: |
|
|
|
|
|
|
|
|
|
|
|
|
|
|
|
|
|
|
|
|
| |||
|
|
|
|
|
|
|
|
|
|
|
|
|
|
|
|
|
|
|
|
|
|
|
|
|
Three months ended March 31, 2016 |
|
|
|
|
|
|
|
|
|
|
|
|
|
|
|
|
|
|
|
|
|
|
|
|
Beginning of the period |
| $ | 6,015 |
|
| $ | 10,559 |
|
| $ | 936 |
|
| $ | 3,212 |
|
| $ | 1,421 |
|
| $ | 22,143 |
|
Charge-offs |
|
| (81 | ) |
|
| (225 | ) |
|
| (34 | ) |
|
| - |
|
|
| (155 | ) |
|
| (495 | ) |
Recoveries |
|
| 318 |
|
|
| 204 |
|
|
| 205 |
|
|
| 58 |
|
|
| 58 |
|
|
| 843 |
|
(Recovery) provision for loan losses |
|
| (428 | ) |
|
| 871 |
|
|
| (211 | ) |
|
| 163 |
|
|
| 116 |
|
|
| 511 |
|
Balance at end of period |
| $ | 5,824 |
|
| $ | 11,409 |
|
| $ | 896 |
|
| $ | 3,433 |
|
| $ | 1,440 |
|
| $ | 23,002 |
|
|
|
|
|
|
|
|
|
|
|
|
|
|
|
|
|
|
|
|
|
|
|
|
|
|
Three months ended March 31, 2015 |
|
|
|
|
|
|
|
|
|
|
|
|
|
|
|
|
|
|
|
|
|
|
|
|
Beginning of the period |
| $ | 6,743 |
|
| $ | 8,269 |
|
| $ | 752 |
|
| $ | 2,330 |
|
| $ | 1,290 |
|
| $ | 19,384 |
|
Charge-offs |
|
| (328 | ) |
|
| (60 | ) |
|
| (71 | ) |
|
| (278 | ) |
|
| (212 | ) |
|
| (949 | ) |
Recoveries |
|
| 314 |
|
|
| 45 |
|
|
| 1 |
|
|
| 46 |
|
|
| 60 |
|
|
| 466 |
|
Provision for loan losses |
|
| 37 |
|
|
| 1,057 |
|
|
| 147 |
|
|
| 435 |
|
|
| 265 |
|
|
| 1,941 |
|
Balance at end of period |
| $ | 6,766 |
|
| $ | 9,311 |
|
| $ | 829 |
|
| $ | 2,533 |
|
| $ | 1,403 |
|
| $ | 20,842 |
|
|
|
|
|
|
|
|
|
|
|
|
|
|
|
|
|
|
|
|
|
|
|
|
|
|
|
|
|
|
|
|
|
|
|
|
|
|
|
|
|
|
|
|
|
|
|
|
|
|
|
|
| Real Estate Loans |
|
|
|
|
|
|
|
|
|
|
|
|
| |||||||||
|
| Residential |
|
| Commercial |
|
| Land, develop., constr. |
|
| Comm. & industrial |
|
| Consumer & other |
|
| Total |
| ||||||
Allowance for loan losses for loans that are PCI loans: |
|
|
|
|
|
|
|
|
|
|
|
|
|
|
|
|
|
|
|
|
| |||
|
|
|
|
|
|
|
|
|
|
|
|
|
|
|
|
|
|
|
|
|
|
|
|
|
Three months ended March 31, 2016 |
|
|
|
|
|
|
|
|
|
|
|
|
|
|
|
|
|
|
|
|
|
|
|
|
Beginning of the period |
| $ | - |
|
| $ | 103 |
|
| $ | 1 |
|
| $ | 3 |
|
| $ | 14 |
|
| $ | 121 |
|
Charge-offs |
|
| - |
|
|
| - |
|
|
| - |
|
|
| - |
|
|
| - |
|
|
| - |
|
Recoveries |
|
| - |
|
|
| - |
|
|
| - |
|
|
| - |
|
|
| - |
|
|
| - |
|
Recovery of loan losses |
|
| - |
|
|
| - |
|
|
| - |
|
|
| (1 | ) |
|
| - |
|
|
| (1 | ) |
Balance at end of period |
| $ | - |
|
| $ | 103 |
|
| $ | 1 |
|
| $ | 2 |
|
| $ | 14 |
|
| $ | 120 |
|
|
|
|
|
|
|
|
|
|
|
|
|
|
|
|
|
|
|
|
|
|
|
|
|
|
Three months ended March 31, 2015 |
|
|
|
|
|
|
|
|
|
|
|
|
|
|
|
|
|
|
|
|
|
|
|
|
Beginning of the period |
| $ | - |
|
| $ | 372 |
|
| $ | 6 |
|
| $ | 136 |
|
| $ | - |
|
| $ | 514 |
|
Charge-offs |
|
| - |
|
|
| (77 | ) |
|
| - |
|
|
| - |
|
|
| - |
|
|
| (77 | ) |
Recoveries |
|
| - |
|
|
| - |
|
|
| - |
|
|
| - |
|
|
| - |
|
|
| - |
|
Recovery of loan losses |
|
| - |
|
|
| (165 | ) |
|
| (2 | ) |
|
| (132 | ) |
|
| - |
|
|
| (299 | ) |
Balance at end of period |
| $ | - |
|
| $ | 130 |
|
| $ | 4 |
|
| $ | 4 |
|
| $ | - |
|
| $ | 138 |
|
20
CenterState Banks, Inc. and Subsidiaries
NOTES TO CONDENSED CONSOLIDATED FINANCIAL STATEMENTS (unaudited)
(in thousands of dollars, except per share data)
The following tables present the balance in the allowance for loan losses and the recorded investment in loans by portfolio segment and based on impairment method as of March 31, 2016 and December 31, 2015. Accrued interest receivable and unearned loan fees and costs are not included in the recorded investment because they are not material.
|
| Real Estate Loans |
|
|
|
|
|
|
|
|
|
|
|
|
| |||||||||
As of March 31, 2016 |
| Residential |
|
| Commercial |
|
| Land, develop., constr. |
|
| Comm. & industrial |
|
| Consumer & other |
|
| Total |
| ||||||
Allowance for loan losses: |
|
|
|
|
|
|
|
|
|
|
|
|
|
|
|
|
|
|
|
|
|
|
|
|
Ending allowance balance attributable to loans: |
|
|
|
|
|
|
|
|
|
|
|
|
|
|
|
|
|
|
|
|
| |||
Individually evaluated for impairment |
| $ | 445 |
|
| $ | 441 |
|
| $ | 163 |
|
| $ | 7 |
|
| $ | 28 |
|
| $ | 1,084 |
|
Collectively evaluated for impairment |
|
| 5,379 |
|
|
| 10,968 |
|
|
| 733 |
|
|
| 3,426 |
|
|
| 1,412 |
|
|
| 21,918 |
|
Purchased credit impaired |
|
| - |
|
|
| 103 |
|
|
| 1 |
|
|
| 2 |
|
|
| 14 |
|
|
| 120 |
|
Total ending allowance balance |
| $ | 5,824 |
|
| $ | 11,512 |
|
| $ | 897 |
|
| $ | 3,435 |
|
| $ | 1,454 |
|
| $ | 23,122 |
|
|
|
|
|
|
|
|
|
|
|
|
|
|
|
|
|
|
|
|
|
|
|
|
|
|
Loans: |
|
|
|
|
|
|
|
|
|
|
|
|
|
|
|
|
|
|
|
|
|
|
|
|
Individually evaluated for impairment |
| $ | 8,462 |
|
| $ | 15,169 |
|
| $ | 2,025 |
|
| $ | 1,992 |
|
| $ | 266 |
|
| $ | 27,914 |
|
Collectively evaluated for impairment |
|
| 791,259 |
|
|
| 1,515,410 |
|
|
| 129,121 |
|
|
| 371,636 |
|
|
| 75,569 |
|
|
| 2,882,995 |
|
Purchased credit impaired |
|
| 82,595 |
|
|
| 127,354 |
|
|
| 19,912 |
|
|
| 6,020 |
|
|
| 635 |
|
|
| 236,516 |
|
Total ending loan balances |
| $ | 882,316 |
|
| $ | 1,657,933 |
|
| $ | 151,058 |
|
| $ | 379,648 |
|
| $ | 76,470 |
|
| $ | 3,147,425 |
|
| Real Estate Loans |
|
|
|
|
|
|
|
|
|
|
|
|
|
|
| ||||||||
As of December 31, 2015 |
| Residential |
|
| Commercial |
|
| Land, develop., constr. |
|
| Comm. & industrial |
|
| Consumer & other |
|
| Total |
| ||||||
Allowance for loan losses: |
|
|
|
|
|
|
|
|
|
|
|
| �� |
|
|
|
|
|
|
|
|
|
|
|
Ending allowance balance attributable to loans: |
|
|
|
|
|
|
|
|
|
|
|
|
|
|
|
|
|
|
|
|
| |||
Individually evaluated for impairment |
| $ | 402 |
|
| $ | 478 |
|
| $ | 164 |
|
| $ | 7 |
|
| $ | 29 |
|
| $ | 1,080 |
|
Collectively evaluated for impairment |
|
| 5,613 |
|
|
| 10,081 |
|
|
| 772 |
|
|
| 3,205 |
|
|
| 1,392 |
|
|
| 21,063 |
|
Purchased credit impaired |
|
| - |
|
|
| 103 |
|
|
| 1 |
|
|
| 3 |
|
|
| 14 |
|
|
| 121 |
|
Total ending allowance balance |
| $ | 6,015 |
|
| $ | 10,662 |
|
| $ | 937 |
|
| $ | 3,215 |
|
| $ | 1,435 |
|
| $ | 22,264 |
|
|
|
|
|
|
|
|
|
|
|
|
|
|
|
|
|
|
|
|
|
|
|
|
|
|
Loans: |
|
|
|
|
|
|
|
|
|
|
|
|
|
|
|
|
|
|
|
|
|
|
|
|
Individually evaluated for impairment |
| $ | 8,096 |
|
| $ | 11,482 |
|
| $ | 2,267 |
|
| $ | 1,057 |
|
| $ | 273 |
|
| $ | 23,175 |
|
Collectively evaluated for impairment |
|
| 639,400 |
|
|
| 1,243,300 |
|
|
| 103,009 |
|
|
| 306,264 |
|
|
| 67,227 |
|
|
| 2,359,200 |
|
Purchased credit impaired |
|
| 86,104 |
|
|
| 105,629 |
|
|
| 15,548 |
|
|
| 2,771 |
|
|
| 476 |
|
|
| 210,528 |
|
Total ending loan balance |
| $ | 733,600 |
|
| $ | 1,360,411 |
|
| $ | 120,824 |
|
| $ | 310,092 |
|
| $ | 67,976 |
|
| $ | 2,592,903 |
|
Loans collectively evaluated for impairment reported at March 31, 2016 include loans acquired from First Southern Bank (“FSB”) on June 1, 2014 and from Gulfstream Business Bank (“GSB”) on January 17, 2014 that are not PCI loans. These loans were performing loans recorded at estimated fair value at the acquisition date. The aggregate fair value adjustment for these loans at their respective acquisition dates was approximately $17,761, or approximately 2.10% of the aggregate acquisition date balances. The amount is accreted into interest income over the remaining lives of the related loans on a level yield basis. The aggregate unamortized acquisition date fair value adjustment was approximately $8,639 and $9,354, which represents approximately 1.52% and 1.59% of the remaining outstanding balance of these acquired loans at March 31, 2016 and December 31, 2015, respectively. Management has also estimated probable incurred losses based on performance since the respective acquisition dates, and based on these estimates, has included $2,571 in the Company’s general loan allowance with respect to these acquired loans. Management believes the Company’s allowance for loan losses is adequate at March 31, 2016. However, management recognizes that many factors can adversely impact various segments of the Company’s markets and customers, and therefore there is no assurance as to the amount of losses or probable losses which may develop in the future.
Loans collectively evaluated for impairment reported at March 31, 2016 also include loans acquired from Community and Hometown on March 1, 2016. The acquired loans were recorded at estimated fair value at acquisition; therefore, no allowance for loan losses was recorded for these loans at March 31, 2016.
21
CenterState Banks, Inc. and Subsidiaries
NOTES TO CONDENSED CONSOLIDATED FINANCIAL STATEMENTS (unaudited)
(in thousands of dollars, except per share data)
The table below summarizes impaired loan data for the periods presented.
|
| Mar. 31, 2016 |
|
| Dec. 31, 2015 |
| ||
Performing TDRs (these are not included in nonperforming loans ("NPLs")) |
| $ | 9,969 |
|
| $ | 10,254 |
|
Nonperforming TDRs (these are included in NPLs) |
|
| 5,381 |
|
|
| 4,873 |
|
Total TDRs (these are included in impaired loans) |
|
| 15,350 |
|
|
| 15,127 |
|
Impaired loans that are not TDRs |
|
| 12,564 |
|
|
| 8,048 |
|
Total impaired loans |
| $ | 27,914 |
|
| $ | 23,175 |
|
In certain situations it has become more common to restructure or modify the terms of certain loans under certain conditions (i.e. troubled debt restructure or “TDRs”). In those circumstances it may be beneficial to restructure the terms of a loan and work with the borrower for the benefit of both parties, versus forcing the property into foreclosure and having to dispose of it in a distressed sale. When the terms of a loan have been modified, usually the monthly payment and/or interest rate is reduced for generally twelve to twenty-four months. Material principal amounts on any loan modifications have not been forgiven to date.
TDRs as of March 31, 2016 and December 31, 2015 quantified by loan type classified separately as accrual (performing loans) and non-accrual (non performing loans) are presented in the tables below.
As of March 31, 2016 |
| Accruing |
|
| Non Accrual |
|
| Total |
| |||
Real estate loans: |
|
|
|
|
|
|
|
|
|
|
|
|
Residential |
| $ | 6,290 |
|
| $ | 2,172 |
|
| $ | 8,462 |
|
Commercial |
|
| 1,944 |
|
|
| 3,008 |
|
|
| 4,952 |
|
Land, development, construction |
|
| 575 |
|
|
| 91 |
|
|
| 666 |
|
Total real estate loans |
|
| 8,809 |
|
|
| 5,271 |
|
|
| 14,080 |
|
Commercial |
|
| 940 |
|
|
| 63 |
|
|
| 1,003 |
|
Consumer and other |
|
| 220 |
|
|
| 47 |
|
|
| 267 |
|
Total TDRs |
| $ | 9,969 |
|
| $ | 5,381 |
|
| $ | 15,350 |
|
|
|
|
|
|
|
|
|
|
|
|
|
|
|
|
|
|
|
|
|
|
|
|
|
|
|
As of December 31, 2015 |
| Accruing |
|
| Non-Accrual |
|
| Total |
| |||
Real estate loans: |
|
|
|
|
|
|
|
|
|
|
|
|
Residential |
| $ | 5,987 |
|
| $ | 2,108 |
|
| $ | 8,095 |
|
Commercial |
|
| 2,458 |
|
|
| 2,558 |
|
|
| 5,016 |
|
Land, development, construction |
|
| 593 |
|
|
| 93 |
|
|
| 686 |
|
Total real estate loans |
|
| 9,038 |
|
|
| 4,759 |
|
|
| 13,797 |
|
Commercial |
|
| 991 |
|
|
| 66 |
|
|
| 1,057 |
|
Consumer and other |
|
| 225 |
|
|
| 48 |
|
|
| 273 |
|
Total TDRs |
| $ | 10,254 |
|
| $ | 4,873 |
|
| $ | 15,127 |
|
Our policy is to return non accrual TDR loans to accrual status when all the principal and interest amounts contractually due, pursuant to its modified terms, are brought current and future payments are reasonably assured. Our policy also considers the payment history of the borrower, but is not dependent upon a specific number of payments. The Company recorded a provision for loan loss expense of $112 and partial charge offs of $63 on the TDR loans described above during the three month period ending March 31, 2016. The Company recorded a provision for loan loss expense of $94 and partial charge-offs of $63 on TDR loans during the three month period ending March 31, 2015.
Loans are modified to minimize loan losses when we believe the modification will improve the borrower’s financial condition and ability to repay the loan. We typically do not forgive principal. We generally either reduce interest rates or decrease monthly payments for a temporary period of time and those reductions of cash flows are capitalized into the loan balance. We may also extend maturities, convert balloon loans to longer term amortizing loans, or vice versa, or change interest rates between variable and fixed rate. Each borrower and situation is unique and we try to accommodate the borrower and minimize the Company’s potential losses. Approximately 65% of our TDRs are current pursuant to their modified terms, and $5,381, or approximately 35% of our total TDRs are not performing pursuant to their modified terms. There does not appear to be any significant difference in success rates with one type of concession versus another.
Loans modified as TDRs during the three period ending March 31, 2016 were $1,049. The Company recorded a loan loss provision of $23 for loans modified during the three month period ending March 31, 2016. Loans modified as TDRs during the three month period ending March 31, 2015 were $909. The Company recorded a loan loss provision of $48 for loans modified during the three month period ending March 31, 2015.
22
CenterState Banks, Inc. and Subsidiaries
NOTES TO CONDENSED CONSOLIDATED FINANCIAL STATEMENTS (unaudited)
(in thousands of dollars, except per share data)
The following table presents loans by class modified and for which there was a payment default within twelve months following the modification during the periods ending March 31, 2016 and 2015.
|
| Period ending |
|
| Period ending |
| ||||||||||
|
| March 31, 2016 |
|
| March 31, 2015 |
| ||||||||||
|
| Number |
|
| Recorded |
|
| Number |
|
| Recorded |
| ||||
|
| of loans |
|
| investment |
|
| of loans |
|
| investment |
| ||||
Residential |
|
| - |
|
| $ | - |
|
|
| 3 |
|
| $ | 529 |
|
Commercial real estate |
|
| 2 |
|
|
| 1,004 |
|
|
| 3 |
|
|
| 467 |
|
Land, development, construction |
|
| - |
|
|
| - |
|
|
| 2 |
|
|
| 235 |
|
Commercial and Industrial |
|
| 1 |
|
|
| 63 |
|
|
| 1 |
|
|
| 43 |
|
Consumer and other |
|
| - |
|
|
| - |
|
|
| 2 |
|
|
| 34 |
|
Total |
|
| 3 |
|
| $ | 1,067 |
|
|
| 11 |
|
| $ | 1,308 |
|
The Company recorded a provision for loan loss expense of $7 and $40 and partial charge offs of $19 and $31 on TDR loans that subsequently defaulted as described above during the three month periods ending March 31, 2016 and 2015, respectively.
The following tables present loans individually evaluated for impairment by class of loans as of March 31, 2016 and December 31, 2015, excluding purchased credit impaired loans accounted for pursuant to ASC Topic 310-30. The recorded investment is less than the unpaid principal balance due to partial charge-offs.
As of March 31, 2016 |
| Unpaid principal balance |
|
| Recorded investment |
|
| Allowance for loan losses allocated |
| |||
With no related allowance recorded: |
|
|
|
|
|
|
|
|
|
|
|
|
Residential real estate |
| $ | 5,719 |
|
| $ | 5,394 |
|
| $ | - |
|
Commercial real estate |
|
| 13,354 |
|
|
| 12,929 |
|
|
| - |
|
Land, development, construction |
|
| 1,033 |
|
|
| 989 |
|
|
| - |
|
Commercial and industrial |
|
| 1,651 |
|
|
| 1,635 |
|
|
| - |
|
Consumer, other |
|
| 106 |
|
|
| 100 |
|
|
| - |
|
|
|
|
|
|
|
|
|
|
|
|
|
|
With an allowance recorded: |
|
|
|
|
|
|
|
|
|
|
|
|
Residential real estate |
|
| 3,141 |
|
|
| 3,068 |
|
|
| 445 |
|
Commercial real estate |
|
| 2,525 |
|
|
| 2,240 |
|
|
| 441 |
|
Land, development, construction |
|
| 1,062 |
|
|
| 1,036 |
|
|
| 163 |
|
Commercial and industrial |
|
| 357 |
|
|
| 357 |
|
|
| 7 |
|
Consumer, other |
|
| 176 |
|
|
| 166 |
|
|
| 28 |
|
Total |
| $ | 29,124 |
|
| $ | 27,914 |
|
| $ | 1,084 |
|
23
CenterState Banks, Inc. and Subsidiaries
NOTES TO CONDENSED CONSOLIDATED FINANCIAL STATEMENTS (unaudited)
(in thousands of dollars, except per share data)
As of December 31, 2015 |
| Unpaid principal balance |
|
| Recorded investment |
|
| Allowance for loan losses allocated |
| |||
With no related allowance recorded: |
|
|
|
|
|
|
|
|
|
|
|
|
Residential real estate |
| $ | 5,784 |
|
| $ | 5,465 |
|
| $ | - |
|
Commercial real estate |
|
| 9,595 |
|
|
| 9,202 |
|
|
| - |
|
Land, development, construction |
|
| 1,869 |
|
|
| 1,229 |
|
|
| - |
|
Commercial and industrial |
|
| 585 |
|
|
| 577 |
|
|
| - |
|
Consumer, other |
|
| 109 |
|
|
| 103 |
|
|
| - |
|
|
|
|
|
|
|
|
|
|
|
|
|
|
With an allowance recorded: |
|
|
|
|
|
|
|
|
|
|
|
|
Residential real estate |
|
| 2,682 |
|
|
| 2,631 |
|
|
| 402 |
|
Commercial real estate |
|
| 2,538 |
|
|
| 2,280 |
|
|
| 478 |
|
Land, development, construction |
|
| 1,065 |
|
|
| 1,038 |
|
|
| 164 |
|
Commercial and industrial |
|
| 484 |
|
|
| 480 |
|
|
| 7 |
|
Consumer, other |
|
| 179 |
|
|
| 170 |
|
|
| 29 |
|
Total |
| $ | 24,890 |
|
| $ | 23,175 |
|
| $ | 1,080 |
|
Three month period ending March 31, 2016 |
| Average of impaired loans |
|
| Interest income recognized during impairment |
|
| Cash basis interest income recognized |
| |||
Real estate loans: |
|
|
|
|
|
|
|
|
|
|
|
|
Residential |
| $ | 8,278 |
|
| $ | 57 |
|
| $ | - |
|
Commercial |
|
| 13,326 |
|
|
| 55 |
|
|
| - |
|
Land, development, construction |
|
| 2,146 |
|
|
| 12 |
|
|
| - |
|
Total real estate loans |
|
| 23,750 |
|
|
| 124 |
|
|
| - |
|
|
|
|
|
|
|
|
|
|
|
|
|
|
Commercial and industrial |
|
| 1,525 |
|
|
| 12 |
|
|
| - |
|
Consumer and other loans |
|
| 270 |
|
|
| 3 |
|
|
| - |
|
Total |
| $ | 25,545 |
|
| $ | 139 |
|
| $ | - |
|
Three month period ending March 31, 2015 |
| Average of impaired loans |
|
| Interest income recognized during impairment |
|
| Cash basis interest income recognized |
| |||
Real estate loans: |
|
|
|
|
|
|
|
|
|
|
|
|
Residential |
| $ | 9,279 |
|
| $ | 63 |
|
| $ | - |
|
Commercial |
|
| 10,661 |
|
|
| 63 |
|
|
| - |
|
Land, development, construction |
|
| 2,317 |
|
|
| 6 |
|
|
| - |
|
Total real estate loans |
|
| 22,257 |
|
|
| 132 |
|
|
| - |
|
|
|
|
|
|
|
|
|
|
|
|
|
|
Commercial and industrial |
|
| 1,099 |
|
|
| 8 |
|
|
| - |
|
Consumer and other loans |
|
| 360 |
|
|
| 5 |
|
|
| - |
|
Total |
| $ | 23,716 |
|
| $ | 145 |
|
| $ | - |
|
Nonperforming loans include both smaller balance homogeneous loans that are collectively evaluated for impairment and individually classified impaired loans, excluding purchased credit impaired loans accounted for pursuant to ASC Topic 310-30.
Nonperforming loans were as follows: |
| Mar. 31, 2016 |
|
| Dec. 31, 2015 |
| ||
Non accrual loans |
| $ | 24,865 |
|
| $ | 20,833 |
|
Loans past due over 90 days and still accruing interest |
|
| - |
|
|
| - |
|
Total non performing loans |
| $ | 24,865 |
|
| $ | 20,833 |
|
24
CenterState Banks, Inc. and Subsidiaries
NOTES TO CONDENSED CONSOLIDATED FINANCIAL STATEMENTS (unaudited)
(in thousands of dollars, except per share data)
The following table presents the recorded investment in nonaccrual loans and loans past due over 90 days still on accrual by class of loans as of March 31, 2016 and December 31, 2015, excluding purchased credit impaired loans:
As of March 31, 2016 |
| Nonaccrual |
|
| Loans past due over 90 days still accruing |
| ||
Residential real estate |
| $ | 8,678 |
|
| $ | - |
|
Commercial real estate |
|
| 13,012 |
|
|
| - |
|
Land, development, construction |
|
| 1,384 |
|
|
| - |
|
Commercial |
|
| 1,531 |
|
|
| - |
|
Consumer, other |
|
| 260 |
|
|
| - |
|
Total |
| $ | 24,865 |
|
| $ | - |
|
|
|
|
|
|
|
|
|
|
As of December 31, 2015 |
| Nonaccrual |
|
| Loans past due over 90 days still accruing |
| ||
Residential real estate |
| $ | 9,540 |
|
| $ | - |
|
Commercial real estate |
|
| 9,145 |
|
|
| - |
|
Land, development, construction |
|
| 1,608 |
|
|
| - |
|
Commercial |
|
| 187 |
|
|
| - |
|
Consumer, other |
|
| 353 |
|
|
| - |
|
Total |
| $ | 20,833 |
|
| $ | - |
|
The following table presents the aging of the recorded investment in past due loans as of March 31, 2016 and December 31, 2015, excluding purchased credit impaired loans:
|
|
|
|
|
|
|
|
|
| Accruing Loans |
|
|
|
|
|
|
|
|
|
|
|
|
| |||||
|
| Total |
|
| 30 - 59 days past due |
|
| 60 - 89 days past due |
|
| Greater than 90 days past due |
|
| Total Past Due |
|
| Loans Not Past Due |
|
| Nonaccrual Loans |
| |||||||
As of March 31, 2016 |
|
|
|
|
|
|
|
|
|
|
|
|
|
|
|
|
|
|
|
|
|
|
|
|
|
|
|
|
Residential real estate |
| $ | 799,721 |
|
| $ | 3,525 |
|
| $ | 180 |
|
| $ | - |
|
| $ | 3,705 |
|
| $ | 787,338 |
|
| $ | 8,678 |
|
Commercial real estate |
|
| 1,530,579 |
|
|
| 4,071 |
|
|
| 602 |
|
|
| - |
|
|
| 4,673 |
|
|
| 1,512,894 |
|
|
| 13,012 |
|
Land/dev/construction |
|
| 131,146 |
|
|
| 101 |
|
|
| 157 |
|
|
| - |
|
|
| 258 |
|
|
| 129,504 |
|
|
| 1,384 |
|
Commercial |
|
| 373,628 |
|
|
| 2,642 |
|
|
| 152 |
|
|
| - |
|
|
| 2,794 |
|
|
| 369,303 |
|
|
| 1,531 |
|
Consumer |
|
| 75,835 |
|
|
| 286 |
|
|
| 63 |
|
|
| - |
|
|
| 349 |
|
|
| 75,226 |
|
|
| 260 |
|
|
| $ | 2,910,909 |
|
| $ | 10,625 |
|
| $ | 1,154 |
|
| $ | - |
|
| $ | 11,779 |
|
| $ | 2,874,265 |
|
| $ | 24,865 |
|
|
|
|
|
|
|
|
|
|
|
|
|
|
|
|
|
|
|
|
|
|
|
|
|
|
|
|
|
|
|
|
|
|
|
|
|
|
|
|
|
|
|
|
|
|
|
|
|
|
|
|
|
|
|
|
|
|
|
|
|
|
|
|
|
|
|
|
| Accruing Loans |
|
|
|
|
|
|
|
|
|
|
|
|
| |||||
|
| Total |
|
| 30 - 59 days past due |
|
| 60 - 89 days past due |
|
| Greater than 90 days past due |
|
| Total Past Due |
|
| Loans Not Past Due |
|
| Nonaccrual Loans |
| |||||||
As of December 31, 2015 |
|
|
|
|
|
|
|
|
|
|
|
|
|
|
|
|
|
|
|
|
|
|
|
|
|
|
|
|
Residential real estate |
| $ | 647,496 |
|
| $ | 2,118 |
|
| $ | 3,089 |
|
| $ | - |
|
| $ | 5,207 |
|
| $ | 632,749 |
|
| $ | 9,540 |
|
Commercial real estate |
|
| 1,254,782 |
|
|
| 4,647 |
|
|
| 2,170 |
|
|
| - |
|
|
| 6,817 |
|
|
| 1,238,820 |
|
|
| 9,145 |
|
Land/dev/construction |
|
| 105,276 |
|
|
| 280 |
|
|
| 595 |
|
|
| - |
|
|
| 875 |
|
|
| 102,793 |
|
|
| 1,608 |
|
Commercial |
|
| 307,321 |
|
|
| 1,101 |
|
|
| 348 |
|
|
| - |
|
|
| 1,449 |
|
|
| 305,685 |
|
|
| 187 |
|
Consumer |
|
| 67,500 |
|
|
| 285 |
|
|
| 90 |
|
|
| - |
|
|
| 375 |
|
|
| 66,772 |
|
|
| 353 |
|
|
| $ | 2,382,375 |
|
| $ | 8,431 |
|
| $ | 6,292 |
|
| $ | - |
|
| $ | 14,723 |
|
| $ | 2,346,819 |
|
| $ | 20,833 |
|
25
CenterState Banks, Inc. and Subsidiaries
NOTES TO CONDENSED CONSOLIDATED FINANCIAL STATEMENTS (unaudited)
(in thousands of dollars, except per share data)
Credit Quality Indicators:
The Company categorizes loans into risk categories based on relevant information about the ability of borrowers to service their debt such as: current financial information, historical payment experience, credit documentation, public information, and current economic trends, among other factors. The Company analyzes loans individually by classifying the loans as to credit risk. This analysis is performed on at least an annual basis. The Company uses the following definitions for risk ratings:
Special Mention: Loans classified as special mention have a potential weakness that deserves management’s close attention. If left uncorrected, these potential weaknesses may result in deterioration of the repayment prospects for the loan or of the institution’s credit position at some future date.
Substandard: Loans classified as substandard are inadequately protected by the current net worth and paying capacity of the obligor or of the collateral pledged, if any. Loans so classified have a well-defined weakness or weaknesses that jeopardize the liquidation of the debt. They are characterized by the distinct possibility that the institution will sustain some loss if the deficiencies are not corrected.
Doubtful: Loans classified as doubtful have all the weaknesses inherent in those classified as substandard, with the added characteristic that the weaknesses make collection or liquidation in full, on the basis of currently existing facts, conditions, and values, highly questionable and improbable.
Loans not meeting the criteria above that are analyzed individually as part of the above described process are considered to be pass rated loans. As of March 31, 2016 and December 31, 2015, and based on the most recent analysis performed, the risk category of loans by class of loans, excluding purchased credit impaired loans accounted for pursuant to ASC Topic 310-30:
|
|
|
|
|
| As of March 31, 2016 |
|
|
|
|
| |||||
Loan Category |
| Pass |
|
| Special Mention |
|
| Substandard |
|
| Doubtful |
| ||||
Residential real estate | $ | 771,539 |
|
| $ | 9,980 |
|
| $ | 18,202 |
|
| $ | - |
| |
Commercial real estate |
| 1,437,536 |
|
|
| 65,336 |
|
|
| 27,707 |
|
|
| - |
| |
Land/dev/construction |
| 121,837 |
|
|
| 6,570 |
|
|
| 2,739 |
|
|
| - |
| |
Commercial |
| 365,368 |
|
|
| 4,506 |
|
|
| 3,754 |
|
|
| - |
| |
Consumer |
|
| 75,014 |
|
|
| 287 |
|
|
| 534 |
|
|
| - |
|
Total |
| $ | 2,771,294 |
|
| $ | 86,679 |
|
| $ | 52,936 |
|
| $ | - |
|
|
|
|
|
|
|
|
|
|
|
|
|
|
|
|
|
|
|
|
|
|
|
|
|
|
|
|
|
|
|
|
|
|
|
|
|
|
|
|
| As of December 31, 2015 |
|
|
|
|
| |||||
Loan Category |
| Pass |
|
| Special Mention |
|
| Substandard |
|
| Doubtful |
| ||||
Residential real estate | $ | 620,313 |
|
| $ | 9,585 |
|
| $ | 17,598 |
|
| $ - |
| ||
Commercial real estate |
| 1,174,990 |
|
|
| 47,885 |
|
|
| 31,907 |
|
| - |
| ||
Land/dev/construction |
| 95,885 |
|
|
| 5,896 |
|
|
| 3,495 |
|
| - |
| ||
Commercial |
| 299,742 |
|
|
| 4,077 |
|
|
| 3,502 |
|
| - |
| ||
Consumer |
|
| 66,683 |
|
|
| 297 |
|
|
| 520 |
|
| - |
| |
Total |
| $ | 2,257,613 |
|
| $ | 67,740 |
|
| $ | 57,022 |
|
| $ | - |
|
The Company considers the performance of the loan portfolio and its impact on the allowance for loan losses. For residential and consumer loan classes, the Company also evaluates credit quality based on the aging status of the loan, which was previously presented, and by payment activity. The following table presents the recorded investment in residential and consumer loans, excluding purchased credit impaired loans, based on payment activity as of March 31, 2016 and December 31, 2015:
As of March 31, 2016 |
| Residential |
|
| Consumer |
| ||
Performing |
| $ | 791,043 |
|
| $ | 75,575 |
|
Nonperforming |
|
| 8,678 |
|
|
| 260 |
|
Total |
| $ | 799,721 |
|
| $ | 75,835 |
|
|
|
|
|
|
|
|
|
|
As of December 31, 2015 |
| Residential |
|
| Consumer |
| ||
Performing |
| $ | 637,956 |
|
| $ | 67,147 |
|
Nonperforming |
|
| 9,540 |
|
|
| 353 |
|
Total |
| $ | 647,496 |
|
| $ | 67,500 |
|
26
CenterState Banks, Inc. and Subsidiaries
NOTES TO CONDENSED CONSOLIDATED FINANCIAL STATEMENTS (unaudited)
(in thousands of dollars, except per share data)
Purchased Credit Impaired (“PCI”) loans:
Income is recognized on PCI loans pursuant to ASC Topic 310-30. A portion of the fair value discount has been ascribed as an accretable yield that is accreted into interest income over the estimated remaining life of the loans. The remaining non-accretable difference represents cash flows not expected to be collected.
The table below summarizes the total contractually required principal and interest cash payments, management’s estimate of expected total cash payments and carrying value of the loans as of March 31, 2016 and December 31, 2015. Contractually required principal and interest payments have been adjusted for estimated prepayments.
|
| Mar. 31, 2016 |
|
| Dec. 31, 2015 |
| ||
Contractually required principal and interest |
| $ | 373,886 |
|
| $ | 332,570 |
|
Non-accretable difference |
|
| (22,227 | ) |
|
| (19,452 | ) |
Cash flows expected to be collected |
|
| 351,659 |
|
|
| 313,118 |
|
Accretable yield |
|
| (115,143 | ) |
|
| (102,590 | ) |
Carrying value of acquired loans |
|
| 236,516 |
|
|
| 210,528 |
|
Allowance for loan losses |
|
| (120 | ) |
|
| (121 | ) |
Carrying value less allowance for loan losses |
| $ | 236,396 |
|
| $ | 210,407 |
|
We adjusted our estimates of future expected losses, cash flows and renewal assumptions during the current quarter. These adjustments resulted in an increase in expected cash flows and accretable yield, and a decrease in the non-accretable difference. We reclassified approximately $3,364 and $6,057 from non-accretable difference to accretable yield during the three month periods ending March 31, 2016 and 2015 to reflect our adjusted estimates of future expected cash flows. The table below summarizes the changes in total contractually required principal and interest cash payments, management’s estimate of expected total cash payments and carrying value of the loans during the three month periods ending March 31, 2016 and 2015.
Activity during the |
|
|
|
|
| Effect of |
|
| income |
|
| all other |
|
|
|
|
| |||
three month period ending March 31, 2016 |
| Dec. 31, 2015 |
|
| acquisitions |
|
| accretion |
|
| adjustments |
|
| Mar. 31, 2016 |
| |||||
Contractually required principal and interest |
| $ | 332,570 |
|
| $ | 73,005 |
|
| $ | - |
|
| $ | (31,689 | ) |
| $ | 373,886 |
|
Non-accretable difference |
|
| (19,452 | ) |
|
| (9,295 | ) |
|
| - |
|
|
| 6,520 |
|
|
| (22,227 | ) |
Cash flows expected to be collected |
|
| 313,118 |
|
|
| 63,710 |
|
|
| - |
|
|
| (25,169 | ) |
|
| 351,659 |
|
Accretable yield |
|
| (102,590 | ) |
|
| (18,585 | ) |
|
| 8,908 |
|
|
| (2,876 | ) |
|
| (115,143 | ) |
Carry value of acquired loans |
| $ | 210,528 |
|
| $ | 45,125 |
|
| $ | 8,908 |
|
| $ | (28,045 | ) |
| $ | 236,516 |
|
|
|
|
|
|
|
|
|
|
|
|
|
|
|
|
|
|
|
|
|
|
Activity during the |
|
|
|
|
| Effect of |
|
| income |
|
| all other |
|
|
|
|
| |||
three month period ending March 31, 2015 |
| Dec. 31, 2014 |
|
| acquisitions |
|
| accretion |
|
| adjustments |
|
| Mar. 31, 2015 |
| |||||
Contractually required principal and interest |
| $ | 460,836 |
|
| $ | - |
|
| $ | - |
|
| $ | (49,601 | ) |
| $ | 411,235 |
|
Non-accretable difference |
|
| (68,757 | ) |
|
| - |
|
|
| - |
|
|
| 32,448 |
|
|
| (36,309 | ) |
Cash flows expected to be collected |
|
| 392,079 |
|
|
| - |
|
|
| - |
|
|
| (17,153 | ) |
|
| 374,926 |
|
Accretable yield |
|
| (115,313 | ) |
|
| - |
|
|
| 9,930 |
|
|
| (6,275 | ) |
|
| (111,658 | ) |
Carry value of acquired loans |
| $ | 276,766 |
|
| $ | - |
|
| $ | 9,930 |
|
| $ | (23,428 | ) |
| $ | 263,268 |
|
27
CenterState Banks, Inc. and Subsidiaries
NOTES TO CONDENSED CONSOLIDATED FINANCIAL STATEMENTS (unaudited)
(in thousands of dollars, except per share data)
NOTE 7: FDIC indemnification asset
The FDIC indemnification asset represents the estimated amounts due from the FDIC pursuant to the Loss Share Agreements related to the acquisition of the three failed banks acquired in 2010, the acquisition of two failed banks in 2012 and the assumption of Loss Share Agreements of two failed banks assumed by the Company pursuant to its acquisition of FSB in June 2014. On February 3, 2016, the FDIC bought out the remaining FDIC loss share agreements. As such, the FDIC indemnification asset was written-off effectively accelerating all future FDIC indemnification asset amortization expense as well as ending any future FDIC indemnification income. The activity in the FDIC loss share indemnification asset is as follows:
|
| Three month period ended Mar. 31, 2016 |
|
| Twelve month period ended Dec. 31, 2015 |
| ||
Beginning of the year |
| $ | 25,795 |
|
| $ | 49,054 |
|
Amortization, net |
|
| (1,133 | ) |
|
| (16,282 | ) |
Indemnification revenue |
|
| 96 |
|
|
| 1,900 |
|
Indemnification of foreclosure expense |
|
| (197 | ) |
|
| (4,001 | ) |
Proceeds from FDIC |
|
| (5,482 | ) |
|
| (4,662 | ) |
Impairment (recovery) of loan pool |
|
| - |
|
|
| (214 | ) |
Loss from termination of loss share agreements |
|
| (19,079 | ) |
|
| - |
|
Period end balance |
| $ | - |
|
| $ | 25,795 |
|
The FDIC agreements allow for the recovery of some payments made for loss share reimbursements under certain conditions based on the actual performance of the portfolios acquired. This true-up payment was estimated and accrued for as part of the overall FDIC indemnification asset analysis and was reflected as a separate liability. The accrual for this liability was reflected as additional amortization income or expense in noninterest income. On February 3, 2016, the FDIC clawback liability was written-off as a result of the termination of FDIC loss share agreements as discussed above. The activity in the true-up payment liability is as follows:
|
| Three month period ended Mar. 31, 2016 |
|
| Twelve month period ended Dec. 31, 2015 |
| ||
Beginning of the year |
| $ | 1,486 |
|
| $ | 1,205 |
|
True-up liability accrual |
|
| 33 |
|
|
| 281 |
|
Gain from termination of loss share agreements |
|
| (1,519 | ) |
|
| - |
|
Period end balance |
| $ | - |
|
| $ | 1,486 |
|
Impairment of loan pools
When a loan pool (with loss share) is impaired, the impairment expense is included in provision for loan losses, and the percentage of that loss to be reimbursed by the FDIC is recognized as income from FDIC reimbursement, and included in this line item. During the three month period ended March 31, 2016, there was no recovery of a prior period impairment, and therefore no reduction of indemnification income was recognized.
Indemnification revenue
Indemnification revenue represents the percentage of the cost incurred that is reimbursable by the FDIC pursuant to the related Loss Share Agreement for expenses related to the repossession process and losses incurred on the sale of OREO, or writedown of OREO values to current fair value.
Amortization, net
On the date of an FDIC acquisition, the Company estimated the amount and the timing of expected future losses that would be covered by the FDIC loss sharing agreements. The FDIC indemnification asset was initially recorded as the discounted value of the reimbursement of losses from the FDIC. Discount accretion was recognized over the estimated period of losses. The Company also updated its estimate of future losses and the timing of the losses each quarter. To the extent management estimated that future losses were less than initial estimate of future losses, management adjusted its estimates of future expected reimbursements and any decrease in the expected future reimbursements was amortized over the shorter of the loss share period or the life of the related loan by amortization in this line item.
28
CenterState Banks, Inc. and Subsidiaries
NOTES TO CONDENSED CONSOLIDATED FINANCIAL STATEMENTS (unaudited)
(in thousands of dollars, except per share data)
Indemnification of foreclosure expense
Indemnification of foreclosure expense represents the percentage of foreclosure related expenses incurred and reimbursable from the FDIC. Foreclosure expense is included in non interest expense. The amount of the reimbursable portion of the expense reduces foreclosure expense included in non interest expense.
NOTE 8: Securities sold under agreement to repurchase
Our subsidiary bank enters into borrowing arrangements with our retail business customers by agreements to repurchase (“securities sold under agreements to repurchase”) under which the bank pledges investment securities owned and under their control as collateral against these one-day borrowing arrangement. These short-term borrowings totaled $31,474 at March 31, 2016 compared to $27,472 at December 31, 2015. The following table provides additional details for the periods presented.
|
| MBS |
|
| Municipal |
|
|
|
|
| ||
As of March 31, 2016 |
| Securities |
|
| Securities |
|
| Total |
| |||
Market value of securities pledged |
| $ | 46,039 |
|
| $ | 1,145 |
|
| $ | 47,184 |
|
Borrowings related to pledged amounts |
|
| 30,977 |
|
| 497 |
|
|
| 31,474 |
| |
Market value pledged as a % of borrowings |
|
| 149 | % |
|
| 230 | % |
|
| 150 | % |
|
|
|
|
|
|
|
|
|
|
|
|
|
As of December 31, 2015 |
|
|
|
|
|
|
|
|
|
|
|
|
Market value of securities pledged |
| $ | 45,745 |
|
| $ | 1,653 |
|
| $ | 47,398 |
|
Borrowings related to pledged amounts |
|
| 27,179 |
|
| 293 |
|
|
| 27,472 |
| |
Market value pledged as a % of borrowings |
|
| 168 | % |
|
| 564 | % |
|
| 173 | % |
Any risk related to these arrangements, primarily market value changes, are minimized due to the overnight (one day) maturity and the additional collateral pledged over the borrowed amounts.
NOTE 9: Business Combinations
Acquisition of Community Bank of South Florida, Inc.
On March 1, 2016, the Company completed its acquisition of Community Bank of South Florida, Inc. (“Community”) whereby Community merged with and into the Company. Pursuant to and simultaneously with the merger of Community with and into the Company, Community’s wholly owned subsidiary bank, Community Bank of Florida, Inc. merged with and into the Company’s subsidiary bank, CenterState Bank of Florida, N.A.
The Company’s primary reasons for the transaction were to further solidify its market share in the Central and South Florida markets and expand its customer base to enhance deposit fee income and leverage operating cost through economies of scale. The acquisition increased the Company’s total assets and total deposits by approximately 12% and 14%, respectively, as compared with the balances at December 31, 2015, and is expected to positively affect the Company’s operating results to the extent the Company earns more from interest earning assets than it pays in interest on its interest bearing liabilities.
The acquisition was accounted for under the acquisition method of accounting in accordance with ASC Topic 805, Business Combinations. The Company recognized goodwill on this acquisition of $25,464 which is nondeductible for tax purposes as this acquisition is a nontaxable transaction. The goodwill is calculated based on the fair values of the assets acquired and liabilities assumed as of the acquisition date. Fair value estimates are based on the information available, and are subject to change for up to one year after the closing date of the acquisition as additional information relative to closing date fair values becomes available. Fair values are preliminary estimates due to pending appraisals on loans and other real estate owned.
The Company acquired 100% of the outstanding common stock of Community. The purchase price consisted of both cash and stock. Each share of Community common stock was either exchanged for $13.31 cash or 0.9148 shares of the Company’s common stock. Based on the closing price of the Company’s common stock on February 29, 2016, the resulting purchase price was $64,986. The table below summarizes the purchase price calculation.
29
CenterState Banks, Inc. and Subsidiaries
NOTES TO CONDENSED CONSOLIDATED FINANCIAL STATEMENTS (unaudited)
(in thousands of dollars, except per share data)
Number of shares of Community common stock exchanged for CenterState common stock |
|
| 2,488,260 |
|
Per share exchange ratio |
|
| 0.9148 |
|
Number of shares of CenterState common stock less 218 of fractional shares |
|
| 2,276,042 |
|
Multiplied by CenterState common stock price per share on February 29, 2016 |
| $ | 14.00 |
|
Fair value of CenterState common stock issued |
| $ | 31,865 |
|
Total Community common shares exchanged for cash |
|
| 2,488,261 |
|
Multiplied by the cash consideration each Community share is entitled to receive |
| $ | 13.31 |
|
Total cash consideration, plus $3 for 218 of fractional shares |
| $ | 33,121 |
|
Total purchase price |
| $ | 64,986 |
|
The list below summarizes the estimates of the fair value of the assets purchased, including goodwill, and liabilities assumed as of the March 31, 2016 purchase date.
|
| March 1, 2016 |
| |
Assets: |
|
|
|
|
Cash and cash equivalents |
| $ | 79,800 |
|
Loans, held for investment |
|
| 273,146 |
|
Purchased credit impaired loans |
|
| 43,298 |
|
Loans held for sale |
|
| 732 |
|
Investments |
|
| 63,716 |
|
Accrued interest receivable |
|
| 995 |
|
Branch real estate |
|
| 10,646 |
|
Furniture and fixtures |
|
| 459 |
|
Bank property held for sale |
|
| 850 |
|
FHLB stock |
|
| 420 |
|
Other repossessed real estate owned |
|
| 4,819 |
|
Core deposit intangible |
|
| 3,684 |
|
Goodwill |
|
| 25,464 |
|
Deferred tax asset |
|
| 11,754 |
|
Other assets |
|
| 758 |
|
Total assets acquired |
| $ | 520,541 |
|
Liabilities: |
|
|
|
|
Deposits |
| $ | 452,935 |
|
Notes payable |
|
| 650 |
|
Accrued interest payable |
|
| 604 |
|
Other liabilities |
|
| 1,366 |
|
Total liabilities assumed |
| $ | 455,555 |
|
In the acquisition, the Company purchased $316,444 of loans at fair value, net of $20,439, or 6.1%, estimated discount to the outstanding principal balance, representing 12.2% of the Company’s total loans at December 31, 2015. Of the total loans acquired, management identified $43,298 with credit deficiencies. All loans that were on non-accrual status, impaired loans including TDRs and other substandard loans were considered by management to be credit impaired and are accounted for pursuant to ASC Topic 310-30. The table below summarizes the total contractually required principal and interest cash payments, management’s estimate of expected total cash payments and fair value of the loans as of March 1, 2016 for purchased credit impaired loans. Contractually required principal and interest payments have been adjusted for estimated prepayments.
Contractually required principal and interest |
| $ | 69,400 |
|
Non-accretable difference |
|
| (8,383 | ) |
Cash flows expected to be collected |
|
| 61,017 |
|
Accretable yield |
|
| (17,719 | ) |
Total purchased credit-impaired loans acquired |
| $ | 43,298 |
|
30
CenterState Banks, Inc. and Subsidiaries
NOTES TO CONDENSED CONSOLIDATED FINANCIAL STATEMENTS (unaudited)
(in thousands of dollars, except per share data)
The table below presents information with respect to the fair value of acquired loans, as well as their unpaid principal balance (“Book Balance”) at acquisition date.
|
| Book Balance |
|
| Fair Value |
| ||
Loans: |
|
|
|
|
|
|
|
|
Single family residential real estate |
| $ | 76,035 |
|
| $ | 73,737 |
|
Commercial real estate |
|
| 160,875 |
|
|
| 155,678 |
|
Construction/development/land |
|
| 18,391 |
|
|
| 17,587 |
|
Commercial loans |
|
| 19,467 |
|
|
| 19,294 |
|
Consumer and other loans |
|
| 6,914 |
|
|
| 6,850 |
|
Purchased credit-impaired |
|
| 55,201 |
|
|
| 43,298 |
|
Total earning assets |
| $ |
|
| $ | 316,444 |
| |
In its assumption of the deposit liabilities, the Company believed the deposits assumed from the acquisition have an intangible value. The Company applied ASC Topic 805, which prescribes the accounting for goodwill and other intangible assets such as core deposit intangibles, in a business combination. The Company determined the estimated fair value of the core deposit intangible asset totaled $3,684, which will be amortized utilizing an accelerated amortization method over an estimated economic life not to exceed ten years. In determining the valuation amount, deposits were analyzed based on factors such as type of deposit, deposit retention, interest rates and age of deposit relationships.
Acquisition of Hometown of Homestead Banking Company
On March 1, 2016, the Company completed its acquisition of Hometown of Homestead Banking Company (“Hometown”) whereby a newly formed wholly-owned subsidiary of the Company merged with and into Hometown and, immediately thereafter, Hometown merged with and into the Company. Pursuant to and simultaneously with the merger of Hometown with and into the Company, Hometown’s subsidiary bank, 1st National Bank of South Florida, merged with and into the Company’s subsidiary bank, CenterState Bank of Florida, N.A.
The Company’s primary reasons for the transaction were to expand its market share in the southeast Florida market, together with its acquisition of Community as described above, and expand its customer base to enhance deposit fee income and leverage operating cost through economies of scale. The acquisition increased the Company’s total assets and total deposits by approximately 8% and 8%, respectively, as compared with the balances at December 31, 2015, and is expected to positively affect the Company’s operating results to the extent the Company earns more from interest earning assets than it pays in interest on its interest bearing liabilities.
The acquisition was accounted for under the acquisition method of accounting in accordance with ASC Topic 805, Business Combinations. The Company recognized goodwill on this acquisition of $3,289 which is nondeductible for tax purposes as this acquisition is a nontaxable transaction. The goodwill is calculated based on the fair values of the assets acquired and liabilities assumed as of the acquisition date. Fair value estimates are based on the information available, and are subject to change for up to one year after the closing date of the acquisition as additional information relative to closing date fair values becomes available. Fair values are preliminary estimates due to pending appraisals on loans and other real estate owned.
The Company acquired 100% of the outstanding common stock of Hometown. Each share of Hometown common stock was exchanged for $1.25, resulting in a purchase price of $19,150. The table below summarizes the purchase price calculation.
Number of shares of Hometown common stock outstanding at February 29, 2016 |
|
| 15,319,622 |
|
Multiplied by the cash consideration each Hometown share is entitled to receive |
| $ | 1.25 |
|
Total purchase price |
| $ | 19,150 |
|
31
CenterState Banks, Inc. and Subsidiaries
NOTES TO CONDENSED CONSOLIDATED FINANCIAL STATEMENTS (unaudited)
(in thousands of dollars, except per share data)
The list below summarizes the preliminary estimates of the fair value of the assets purchased, including goodwill, and liabilities assumed as of the March 1, 2016 purchase date.
|
| March 1, 2016 |
| |
Assets: |
|
|
|
|
Cash and cash equivalents |
| $ | 14,356 |
|
Loans, held for investment |
|
| 195,960 |
|
Purchased credit impaired loans |
|
| 1,827 |
|
Investments |
|
| 77,999 |
|
Accrued interest receivable |
|
| 1,163 |
|
Branch real estate |
|
| 6,830 |
|
Furniture and fixtures |
|
| 132 |
|
Bank property held for sale |
|
| 3,897 |
|
Federal Reserve Bank and Federal Home Loan Bank stock |
|
| 2,571 |
|
Other repossessed real estate owned |
|
| 1,955 |
|
Core deposit intangible |
|
| 2,598 |
|
Goodwill |
|
| 3,289 |
|
Deferred tax asset |
|
| 3,130 |
|
Other assets |
|
| 842 |
|
Total assets acquired |
| $ | 316,549 |
|
Liabilities: |
|
|
|
|
Deposits |
| $ | 252,977 |
|
Repurchase agreements |
|
| 544 |
|
FHLB advances |
|
| 31,768 |
|
Corporate debentures |
|
| 10,640 |
|
Accrued interest payable |
|
| 314 |
|
Other liabilities |
|
| 1,156 |
|
Total liabilities assumed |
| $ | 297,399 |
|
In the acquisition, the Company purchased $197,787 of loans at fair value, net of $3,051, or 1.5%, estimated discount to the outstanding principal balance, representing 7.6% of the Company’s total loans at December 31, 2015. Of the total loans acquired, management identified $1,827 with credit deficiencies. All loans that were on non-accrual status, impaired loans including TDRs and other substandard loans were considered by management to be credit impaired and are accounted for pursuant to ASC Topic 310-30. The table below summarizes the total contractually required principal and interest cash payments, management’s estimate of expected total cash payments and fair value of the loans as of March 1, 2016 for purchased credit impaired loans. Contractually required principal and interest payments have been adjusted for estimated prepayments.
Contractually required principal and interest |
| $ | 3,605 |
|
Non-accretable difference |
|
| (912 | ) |
Cash flows expected to be collected |
|
| 2,693 |
|
Accretable yield |
|
| (866 | ) |
Total purchased credit-impaired loans acquired |
| $ | 1,827 |
|
The table below presents information with respect to the fair value of acquired loans, as well as their unpaid principal balance (“Book Balance”) at acquisition date.
|
| Book |
|
| Fair |
| ||
|
| Balance |
|
| Value |
| ||
Loans: |
|
|
|
|
|
|
|
|
Single family residential real estate |
| $ | 73,178 |
|
| $ | 72,994 |
|
Commercial real estate |
|
| 111,175 |
|
|
| 109,837 |
|
Construction/development/land |
|
| 6,491 |
|
|
| 6,173 |
|
Commercial loans |
|
| 3,531 |
|
|
| 3,482 |
|
Consumer and other loans |
|
| 3,529 |
|
|
| 3,474 |
|
Purchased credit-impaired |
|
| 2,934 |
|
|
| 1,827 |
|
Total earning assets |
| $ | 200,838 |
|
| $ | 197,787 |
|
32
CenterState Banks, Inc. and Subsidiaries
NOTES TO CONDENSED CONSOLIDATED FINANCIAL STATEMENTS (unaudited)
(in thousands of dollars, except per share data)
In its assumption of the deposit liabilities, the Company believed the deposits assumed from the acquisition have an intangible value. The Company applied ASC Topic 805, which prescribes the accounting for goodwill and other intangible assets such as core deposit intangibles, in a business combination. The Company determined the estimated fair value of the core deposit intangible asset totaled $2,598, which will be amortized utilizing an accelerated amortization method over an estimated economic life not to exceed ten years. In determining the valuation amount, deposits were analyzed based on factors such as type of deposit, deposit retention, interest rates and age of deposit relationships.
Pro-forma information
The pro-forma information for the periods presented below assumes the Community and Hometown acquisitions occurred at the beginning of 2015.
|
| Three month periods ended | ||
|
| Mar. 31, 2016 |
| Mar. 31, 2015 |
Net interest income |
| $46,376 |
| $45,879 |
Net income available to common shareholders |
| $1,774 |
| $10,995 |
EPS - basic |
| $0.04 |
| $0.23 |
EPS - diluted |
| $0.04 |
| $0.23 |
NOTE 11: Recently Issued Accounting Standards
In May 2014, the FASB amended existing guidance related to revenue from contracts with customers. This amendment supersedes and replaces nearly all existing revenue recognition guidance, including industry-specific guidance, establishes a new control-based revenue recognition model, changes the basis for deciding when revenue is recognized over time or at a point in time, provides new and more detailed guidance on specific topics and expands and improves disclosures about revenue. In addition, this amendment specifies the accounting for some costs to obtain or fulfill a contract with a customer. These amendments are effective for annual reporting periods beginning after December 15, 2017, including interim periods within that reporting period. Early application is permitted only as of annual reporting periods beginning after December 31, 2016, including interim periods within that period. These amendments should be applied retrospectively to all periods presented or retrospectively with the cumulative effect recognized at the date of initial application. The Company is currently evaluating the impact of this new accounting standard on the consolidated financial statements.
In January 2016, the FASB amended existing guidance related to the recognition and measurement of financial assets and financial liabilities. The amendments in this update impact public business entities as follows: 1) Require equity investments (except those accounted for under the equity method of accounting or those that result in consolidation of the investee) to be measured at fair value with changes in fair value recognized in net income. 2) Simplify the impairment assessment of equity investments without readily determinable fair values by requiring a qualitative assessment to identify impairment. When a qualitative assessment indicates that impairment exists, an entity is required to measure the investment at fair value. 3) Eliminate the requirement to disclose the methods and significant assumptions used to estimate the fair value that is required to be disclosed for financial instruments measured at amortized cost on the balance sheet. 4) Require entities to use the exit price notion when measuring the fair value of financial instruments for disclosure purposes. 5) Require an entity to present separately in other comprehensive income the portion of the total change in fair value of a liability resulting from a change in the instrument-specific credit risk when the entity has elected to measure the liability at fair value in accordance with the fair value option for financial instruments. 6) Require separate presentation of financial assets and financial liabilities by measurement category and form of financial asset (that is, securities or loans and receivables) on the balance sheet or the accompanying notes to the financial statements. 7) Clarify that an entity should evaluate the need for a valuation allowance on a deferred tax asset related to available-for-sale securities in combination with the entity’s other deferred tax assets. The amendments are effective for public business entities for fiscal years beginning after December 15, 2017, including interim periods within those fiscal years. These amendments should be applied by means of a cumulative-effect adjustment to the balance sheet as of the beginning of the fiscal year of adoption. The amendments related to equity securities without readily determinable fair values (including disclosure requirements) should be applied prospectively to equity investments that exist as of the date of adoption. The Company is currently evaluating the impact of adopting the new guidance on the consolidated financial statements.
In February 2016, the FASB amended existing guidance related to the recognition of lease assets and lease liabilities on the balance sheet and disclosures on key information about leasing arrangements. The amendments in this update affect any entity that enters into a lease, with some specified scope exemptions. The main difference between previous guidance and this amendment is the recognition of lease assets and lease liabilities by lessees for those leases classified as operating leases under previous guidance. The
33
CenterState Banks, Inc. and Subsidiaries
NOTES TO CONDENSED CONSOLIDATED FINANCIAL STATEMENTS (unaudited)
(in thousands of dollars, except per share data)
Board decided that lessees should be required to recognize the assets and liabilities arising from leases on the balance sheet. In addition, disclosures are required by lessees and lessors to meet the objective of enabling users of financial statements to assess the amount, timing, and uncertainty of cash flows arising from leases. To meet that objective, the Board decided to require qualitative disclosures along with specific quantitative disclosures. The Board’s intention is to require enough information to supplement the amounts recorded in the financial statements so that users can understand more about the nature of an entity’s leasing activities. In transition, lessees and lessors are required to recognize and measure leases at the beginning of the earliest period presented using a modified retrospective approach. The modified retrospective approach includes a number of optional practical expedients that entities may elect to apply. An entity that elects to apply the practical expedients will, in effect, continue to account for leases that commence before the effective date in accordance with previous guidance unless the lease is modified, except that lessees are required to recognize a right-of-use asset and a lease liability for all operating leases at each reporting date based on the present value of the remaining minimum rental payments that were tracked and disclosed under previous guidance. The transition guidance in the amendment also provides specific guidance for sale and leaseback transactions, build-to-suit leases, leveraged leases, and amounts previously recognized in accordance with the business combinations guidance for leases. The amendments in this update are effective for public business entities for fiscal years beginning after December 15, 2018, including interim periods within those fiscal years. Early application of the amendments in this update is permitted. The Company is currently evaluating the impact of adopting the new guidance on the consolidated financial statements.
34
(All dollar amounts presented herein are in thousands, except per share data, or unless otherwise noted.)
COMPARISON OF BALANCE SHEETS AT MARCH 31, 2016 AND DECEMBER 31, 2015
Overview
Our total assets increased approximately 24% between March 31, 2016 and December 31, 2015 which was primarily the result of the acquisitions on March 1, 2016. In addition to the growth through acqusitions, organic deposit growth increased $171,077 or 5% primarily in commercial checking. The growth in liquidity from the liability increases was used primarily to support the 10% annualized loan growth (excluding PCI loans) during the period. Our loan to deposit ratio was 76.9% and 80.7% at March 31, 2016 and December 31, 2015, respectively.
On March 1, 2016, we closed our previously announced transactions with Community Bank of South Florida, Inc. (“CBKS” or “Community”) and Hometown of Homestead Banking Company (“HBC” or “Hometown”) , whereby we acquired approximately $837,090 of assets including $514,231 of loans and additionally $705,912 of deposits. Furthermore, we acquired 17 branch locations of which 15 are located in Miami-Dade and Monroe Counties and two are located in Polk County. The two branches in Polk County were closed in March 2016 and six additional branches are scheduled to close in May 2016.
In February 2016, we terminated all existing loss share agreements with the FDIC. As a result, the Company wrote off the remaining indemnification asset and the claw back liability, received cash from the FDIC and recognized a pretax loss on the transaction of approximately $17,560 during the current quarter.
These changes are discussed and analyzed below and on the following pages.
Federal funds sold and Federal Reserve Bank deposits
Federal funds sold and Federal Reserve Bank deposits were $296,459 at March 31, 2016 (approximately 6% of total assets) as compared to $101,580 at December 31, 2015 (approximately 3% of total assets). We use our available-for-sale securities portfolio, as well as federal funds sold and Federal Reserve Bank deposits for liquidity management and for investment yields. These accounts, as a group, will fluctuate as a function of loans outstanding, and to some degree the amount of correspondent bank deposits (i.e. federal funds purchased) outstanding.
Investment securities available for sale
Securities available-for-sale, consisting primarily of U.S. government sponsored enterprises and municipal tax exempt securities, were $707,573 at March 31, 2016 (approximately 14% of total assets) compared to $604,739 at December 31, 2015 (approximately 15% of total assets), an increase of $102,834 or 17%. We use our available-for-sale securities portfolio, as well as federal funds sold and Federal Reserve Bank deposits for liquidity management and for investment yields. These accounts, as a group, will fluctuate as a function of loans outstanding as discussed above, under the caption “Federal funds sold and Federal Reserve Bank deposits.” We classify the majority of our securities as “available for sale” to provide for greater flexibility to respond to changes in interest rates as well as future liquidity needs. Our available for sale securities are carried at fair value.
Trading securities
We also have a trading securities portfolio. Realized and unrealized gains and losses are included in trading securities revenue, a component of our non interest income, in our Condensed Consolidated Statement of Earnings and Comprehensive Income. Securities purchased for this portfolio have primarily been various municipal securities. A list of the activity in this portfolio is summarized below.
| three month |
| three month |
| period ended |
| period ended |
| Mar. 31, 2016 |
| Mar. 31, 2015 |
Beginning balance | $ 2,107 |
| $ 3,420 |
Purchases | 47,734 |
| 38,082 |
Proceeds from sales | (47,476) |
| (40,659) |
Net realized gain on sales | 326 |
| 136 |
Net unrealized gains | 28 |
| 38 |
Ending balance | $ 2,719 |
| $ 1,017 |
35
Investment securities held to maturity
At March 31, 2016, we had $256,849 (unamortized cost basis) of securities with an estimated fair value of $259,599, resulting in a net unrecognized gain of $2,750, compared to $272,840 (unamortized cost basis) of securities with an estimated fair value of $273,983 and a net unrecognized gain of $1,143 at December 31, 2015. This portfolio generally holds longer term securities for the primary purpose of yield. This classification was chosen to minimize temporary effects on our tangible equity and tangible equity ratio due to increases and decreases in general market interest rates.
Loans held for sale
We also have a loans held for sale portfolio, whereby we originate single family home loans and sell those mortgages into the secondary market, servicing released. These loans are recorded at the lower of cost or market. Gains and losses on the sale of loans held for sale are included as a component of non-interest income in our Condensed Consolidated Statement of Earnings and Comprehensive Income. A list of the activity in this portfolio is summarized below.
| three month |
| three month |
| period ended |
| period ended |
| Mar. 31, 2016 |
| Mar. 31, 2015 |
Beginning balance | $ 1,529 |
| $ 1,251 |
Acquired from Community | 732 |
| --- |
Loans originated | 5,425 |
| 7,431 |
Proceeds from sales | (5,598) |
| (8,324) |
Net realized gain on sales | 98 |
| 164 |
Ending balance | $ 2,186 |
| $ 522 |
Loans
Lending-related income is the most important component of our net interest income and is a major contributor to profitability. The loan portfolio is the largest component of earning assets, and it therefore generates the largest portion of revenues. The absolute volume of loans and the volume of loans as a percentage of earning assets is an important determinant of net interest margin as loans are expected to produce higher yields than securities and other earning assets. Average loans during the three months ended March 31, 2016, were $2,784,238 or 71.4% of average earning assets, as compared to $2,443,756, or 71.7% of average earning assets, for the three month period ending March 31, 2015. Total loans at March 31, 2016 and December 31, 2015 were $3,148,221 and $2,593,776, respectively. This represents a loan to total asset ratio of 63.3% and 64.5% and a loan to deposit ratio of 76.9% and 80.7%, at March 31, 2016 and December 31, 2015, respectively.
Non-PCI loans
At March 31, 2016, we have total Non-PCI loans of $2,911,705. Total new loans originated during the three month period ended March 31, 2016 approximated $226.4 million, of which $188.9 million were funded. The weighted average interest rate on funded loans was approximately 3.6% during the three month period. The graph below summarizes total loan production and funded loan production over the past nine quarters. The loan origination pipeline is approximately $354 million at March 31, 2016 compared to $266 million at December 31, 2015.
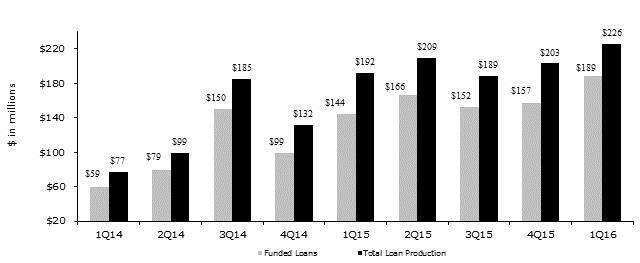
36
PCI loans
Total Purchased Credit Impaired (“PCI”) loans at March 31, 2016 were $236,516 compared to $210,528 at December 31, 2015. We acquired $45,125 of PCI loans at fair value, net of $13,010 estimated discount, with the acquisitions of Community and Hometown.
Loan concentrations are considered to exist where there are amounts loaned to multiple borrowers engaged in similar activities, which collectively could be similarly impacted by economic or other conditions and when the total of such amounts would exceed 25% of total capital. Due to the lack of diversified industry and the relative proximity of markets served, the Company has concentrations in geographic as well as in types of loans funded.
Total loans at March 31, 2016 are equal to $3,148,221. Of this amount, approximately 85.5% are collateralized by real estate, 12.1% are commercial non real estate loans and the remaining 2.4% are consumer and other non real estate loans. We have approximately $882,315 of single family residential loans which represents about 28% of our total loan portfolio. Our largest category of loans is commercial real estate which represents approximately 52.7% of our total loan portfolio.
The following table sets forth information concerning the loan portfolio by collateral types as of the dates indicated.
|
| March 31, 2016 |
|
| December 31, 2015 |
| ||
Loans excluding PCI loans |
|
|
|
|
|
|
|
|
Real estate loans |
|
|
|
|
|
|
|
|
Residential |
| $ | 799,721 |
|
| $ | 647,496 |
|
Commercial |
|
| 1,530,579 |
|
|
| 1,254,782 |
|
Land, development and construction |
|
| 131,146 |
|
|
| 105,276 |
|
Total real estate |
|
| 2,461,446 |
|
|
| 2,007,554 |
|
Commercial |
|
| 373,628 |
|
|
| 307,321 |
|
Consumer and other loans |
|
| 75,835 |
|
|
| 67,500 |
|
Loans before unearned fees and deferred cost |
|
| 2,910,909 |
|
|
| 2,382,375 |
|
Net unearned fees and costs |
|
| 796 |
|
|
| 873 |
|
Total loans excluding PCI loans |
|
| 2,911,705 |
|
|
| 2,383,248 |
|
PCI loans (note 1) |
|
|
|
|
|
|
|
|
Real estate loans |
|
|
|
|
|
|
|
|
Residential |
|
| 82,595 |
|
|
| 86,104 |
|
Commercial |
|
| 127,354 |
|
|
| 105,629 |
|
Land, development and construction |
|
| 19,912 |
|
|
| 15,548 |
|
Total real estate |
|
| 229,861 |
|
|
| 207,281 |
|
Commercial |
|
| 6,020 |
|
|
| 2,771 |
|
Consumer and other loans |
|
| 635 |
|
|
| 476 |
|
Total PCI loans |
|
| 236,516 |
|
|
| 210,528 |
|
Total loans |
|
| 3,148,221 |
|
|
| 2,593,776 |
|
Allowance for loan losses for loans that are not PCI loans |
|
| (23,002 | ) |
|
| (22,143 | ) |
Allowance for loan losses for PCI loans |
|
| (120 | ) |
|
| (121 | ) |
Total loans, net of allowance for loan losses |
| $ | 3,125,099 |
|
| $ | 2,571,512 |
|
note 1: | PCI loans are accounted for pursuant to ASC Topic 310-30. |
37
The table below summarizes the Company’s loan mix for the periods presented.
|
| March 31, 2016 |
|
| December 31, 2015 |
| ||
Originated Loans |
|
|
|
|
|
|
|
|
Real estate loans |
|
|
|
|
|
|
|
|
Residential |
| $ | 507,835 |
|
| $ | 491,149 |
|
Commercial |
|
| 824,702 |
|
|
| 781,419 |
|
Land, development and construction loans |
|
| 99,605 |
|
|
| 91,817 |
|
Total real estate loans |
|
| 1,432,142 |
|
|
| 1,364,385 |
|
Commercial loans |
|
| 290,658 |
|
|
| 251,855 |
|
Consumer and other loans |
|
| 69,528 |
|
|
| 67,026 |
|
Total loans before unearned fees and costs |
|
| 1,792,328 |
|
|
| 1,683,266 |
|
Unearned fees and costs |
|
| 796 |
|
|
| 873 |
|
Total originated loans |
|
| 1,793,124 |
|
|
| 1,684,139 |
|
|
|
|
|
|
|
|
|
|
Acquired Loans (1) |
|
|
|
|
|
|
|
|
Real estate loans |
|
|
|
|
|
|
|
|
Residential |
|
| 291,886 |
|
|
| 156,347 |
|
Commercial |
|
| 705,877 |
|
|
| 473,363 |
|
Land, development and construction loans |
|
| 31,541 |
|
|
| 13,459 |
|
Total real estate loans |
|
| 1,029,304 |
|
|
| 643,169 |
|
Commercial loans |
|
| 82,970 |
|
|
| 55,466 |
|
Consumer and other loans |
|
| 6,307 |
|
| 474 |
| |
Total acquired loans |
|
| 1,118,581 |
|
|
| 699,109 |
|
|
|
|
|
|
|
|
|
|
PCI loans |
|
|
|
|
|
|
|
|
Real estate loans |
|
|
|
|
|
|
|
|
Residential |
|
| 82,595 |
|
|
| 86,104 |
|
Commercial |
|
| 127,354 |
|
|
| 105,629 |
|
Land, development and construction loans |
|
| 19,912 |
|
|
| 15,548 |
|
Total real estate loans |
|
| 229,861 |
|
|
| 207,281 |
|
Commercial loans |
|
| 6,020 |
|
|
| 2,771 |
|
Consumer and other loans |
| 635 |
|
| 476 |
| ||
Total PCI loans |
|
| 236,516 |
|
|
| 210,528 |
|
|
|
|
|
|
|
|
|
|
Total Loans |
| $ | 3,148,221 |
|
| $ | 2,593,776 |
|
| (1) | Acquired loans include the non-PCI loans purchased pursuant to the following acquisitions: |
| · | Branch and loan transaction form TD Bank (year 2011); |
| · | Federal Trust Bank acquisition (year 2011); |
| · | Gulfstream Bank acquisition (year 2014); |
| · | First Southern Bank acquisition (year 2014); |
| · | Community Bank of South Florida Bank acquisition (year 2016); and |
| · | Hometown of Homestead Banking Company (year 2016). |
Credit quality and allowance for loan losses
We maintain an allowance for loan losses that we believe is adequate to absorb probable losses incurred in our loan portfolio. The allowance is increased by the provision for loan losses, which is a charge to current period earnings and decreased by loan charge-offs net of recoveries of prior period loan charge-offs. Loans are charged against the allowance when management believes collection of the principal is unlikely.
The allowance consists of three components. The first component is an allocation for impaired loans, as defined by ASC 310. Impaired loans are those loans whereby management has arrived at a determination that the Company will not be repaid according to the original terms of the loan agreement. Each of these loans is required to have a written analysis supporting the amount of specific allowance allocated to the particular loan, if any. That is to say, a loan may be impaired (i.e., not expected to be repaid as agreed), but
38
may be sufficiently collateralized such that we expect to recover all principal and interest eventually, and therefore no specific allowance is warranted.
Commercial, commercial real estate, land, land development and construction loans in excess of $500 are monitored and evaluated for impairment on an individual loan basis. Commercial, commercial real estate, land, land development and construction loans less than $500 are evaluated for impairment on a pool basis. All consumer and single family residential loans are evaluated for impairment on a pool basis.
On at least a quarterly basis, management reviews each impaired loan to determine whether it should have a specific reserve or partial charge-off. Management relies on appraisals to help make this determination. Updated appraisals are obtained for collateral dependent loans when a loan is scheduled for renewal or refinance. In addition, if the classification of the loan is downgraded to substandard, identified as impaired, or placed on nonaccrual status (collectively “Problem Loans”), an updated appraisal is obtained if the loan amount is greater than $500 and individually evaluated for impairment.
After an updated appraisal is obtained for a Problem Loan, as described above, an additional updated appraisal will be obtained on at least an annual basis. Thus, current appraisals for Problem Loans in excess of $500 will not be older than one year.
After the initial updated appraisal is obtained for a Problem Loan and before its next annual appraisal update is due, management considers the need for a downward adjustment to the current appraisal amount to reflect current market conditions, based on management’s analysis, judgment and experience. In an extremely volatile market, we may update the appraisal prior to the one year anniversary date.
The second component is a general allowance on all of the Company’s loans other than PCI loans and those identified as impaired. The general component covers non-impaired loans and is based on historical loss experience adjusted for current factors. The historical loss experience is determined by portfolio segment and is based on the actual loss history experienced by the Company over the most recent two years. The portfolio segments identified by the Company are residential loans, commercial real estate loans, construction and land development loans, commercial and industrial and consumer and other. This actual loss experience is supplemented with other economic factors based on the risks present for each portfolio segment. These economic, or qualitative, factors include consideration of the following: levels of and trends in delinquencies and impaired loans; levels of and trends in charge-offs and recoveries; trends in volume and terms of loans; effects of any changes in risk selection and underwriting standards; other changes in lending policies, procedures, and practices; experience, ability, and depth of lending management and other relevant staff; national and local economic trends and conditions; industry conditions; levels and trends in special mention and substandard loans; and effects of changes in credit concentrations.
The third component consists of amounts reserved for purchased credit impaired loans. On a quarterly basis, the Company updates the amount of loan principal and interest cash flows expected to be collected, incorporating assumptions regarding default rates, loss severities, the amounts and timing of prepayments and other factors that are reflective of current market conditions. Probable decreases in expected loan principal cash flows trigger the recognition of impairment, which is then measured as the present value of the expected principal loss plus any related foregone interest cash flows discounted at the pool’s effective interest rate. Impairments that occur after the acquisition date are recognized through the provision for loan losses. Probable and significant increases in expected principal cash flows would first reverse any previously recorded allowance for loan losses; any remaining increases are recognized prospectively as interest income. The impacts of (i) prepayments, (ii) changes in variable interest rates, and (iii) any other changes in the timing of expected cash flows are recognized prospectively as adjustments to interest income. Disposals of loans, which may include sales of loans, receipt of payments in full by the borrower, or foreclosure, result in removal of the loan from the PCI portfolio. The aggregate of these three components results in our total allowance for loan losses.
39
In the table below we have shown the components, as discussed above, of our allowance for loan losses at March 31, 2016 and December 31, 2015.
| Mar. 31, 2016 |
| Dec. 31, 2015 |
| increase (decrease) | ||||||
| loan | ALLL |
|
| loan | ALLL |
|
| loan | ALLL |
|
| balance | balance | % |
| balance | balance | % |
| balance | balance |
|
Originated loans | $1,768,628 | $ 18,417 | 1.04% |
| $1,664,056 | $ 17,326 | 1.04% |
| $ 104,572 | $ 1,091 | --- bps |
Impaired originated loans | 24,496 | 768 | 3.14% |
| 20,083 | 757 | 3.77% |
| 4,413 | 11 | (63) bps |
Total originated loans | 1,793,124 | 19,185 | 1.07% |
| 1,684,139 | 18,083 | 1.07% |
| 108,985 | 1,102 | --- bps |
|
|
|
|
|
|
|
|
|
|
|
|
Acquired loans (2) | 1,115,163 | 3,501 | 0.31% |
| 696,017 | 3,737 | 0.54% |
| 419,146 | (236) | (23) bps |
Impaired acquired loans (1) | 3,418 | 316 | 9.25% |
| 3,092 | 323 | 10.45% |
| 326 | (7) | (120)bps |
Total acquired loans | 1,118,581 | 3,817 | 0.34% |
| 699,109 | 4,060 | 0.58% |
| 419,472 | (243) | (24) bps |
|
|
|
|
|
|
|
|
|
|
|
|
Total non-PCI loans | 2,911,705 | 23,002 |
|
| 2,383,248 | 22,143 |
|
| 528,457 | 859 |
|
PCI loans | 236,516 | 120 |
|
| 210,528 | 121 |
|
| 25,988 | (1) |
|
Total loans | $3,148,221 | $23,122 |
|
| $2,593,776 | $22,264 |
|
| $ 554,445 | $858 |
|
(1) | These are loans that were acquired as performing loans that subsequently became impaired. |
(2) | These are performing acquired loans that were recorded at estimated fair value on the related acquisition dates. The total net unamortized fair value adjustment at March 31, 2016 was approximately $19,030 or 1.7% of the aggregate outstanding related loan balances. Prior to March 31, 2016, the Company did not previously include loans acquired pursuant to the TD Bank and Federal Trust acquisitions that occurred in 2011. Acquired loans currently include performing loans acquired from the TD Bank acquisition (year 2011), the Federal Trust acquisition (year 2011), the Gulfstream Bank acquisition (year 2014), the First Southern Bank acquisition (year 2014), the Community Bank acquisition (year 2016) and the Hometown of Homestead Banking Company acquisition (year 2016). All prior periods have been reclassified to conform to this new presentation format. |
The general loan loss allowance (non-impaired loans) relating to originated loans increased by $1,091 resulting primarily from an increase in loans outstanding. Net changes resulting from a mixture of decreases and increases in the Company’s various two year historical loss factors and qualitative factors also slightly affected the net change.
The general loan loss allowance (non-impaired loans) relating to acquired loans decreased by $236 resulting primarily from a decrease in loans outstanding, excluding the two bank acquisitions (Community Bank and Hometown of Homestead Banking Company) which occurred during the current quarter. At March 31, 2016 the loans acquired from these two acquisitions were equal to approximately $456,398. These loans were recorded at estimated fair value at the March 1, 2016 acquisition date. As such, there is no allowance for loan losses associated with these loans as of March 31, 2016. The unamortized acquisition date fair value adjustment related to these loans at March 31, 2016 was approximately $10,162, or 2.2% of the related aggregate outstanding loan balances.
The specific loan loss allowance (impaired loans) for both originated loans and acquired loans is the aggregate of the results of individual analyses prepared for each one of the impaired loans, excluding PCI loans. Total impaired loans at March 31, 2016 are equal to $27,914 ($24,496 originated impaired loans plus $3,418 acquired impaired loans).
The Company recorded partial charge offs in lieu of specific allowance for a number of the impaired loans. The Company’s impaired loans have been written down by $1,210 to $27,914 ($26,830 when the $1,084 specific allowance is considered) from their legal unpaid principal balance outstanding of $29,124. In the aggregate, total impaired loans have been written down to approximately 92% of their legal unpaid principal balance, and non-performing impaired loans have been written down to approximately 90% of their legal unpaid principal balance. Approximately $13,395 of the Company’s impaired loans (48%) are accruing performing loans. This group of impaired loans is not included in the Company’s non-performing loans or non-performing assets categories.
PCI loans are accounted for pursuant to ASC Topic 310-30. PCI loan pools are evaluated for impairment each quarter. If a pool is impaired, an allowance for loan loss is recorded.
The allowance is increased by the provision for loan losses, which is a charge to current period earnings and decreased by loan charge-offs net of recoveries of prior period loan charge-offs. Loans are charged against the allowance when management believes collection of the principal is unlikely. We believe our allowance for loan losses was adequate at March 31, 2016. However, we recognize that many factors can adversely impact various segments of the Company’s markets and customers, and therefore there is no assurance as to the amount of losses or probable losses which may develop in the future.
40
The tables below summarize the changes in allowance for loan losses during the periods presented.
|
| Allowance for loan losses for loans that are not PCI loans |
|
| Allowance for loan losses on PCI loans |
|
| Total |
| |||
Three months ended March 31, 2016 |
|
|
|
|
|
|
|
|
|
|
|
|
Balance at beginning of period |
| $ | 22,143 |
|
| $ | 121 |
|
| $ | 22,264 |
|
Loans charged-off |
|
| (495 | ) |
|
| - |
|
|
| (495 | ) |
Recoveries of loans previously charged-off |
|
| 843 |
|
|
| - |
|
|
| 843 |
|
Net recoveries |
|
| 348 |
|
|
| - |
|
|
| 348 |
|
Provision (recovery) for loan losses |
|
| 511 |
|
|
| (1 | ) |
|
| 510 |
|
Balance at end of period |
| $ | 23,002 |
|
| $ | 120 |
|
| $ | 23,122 |
|
|
|
|
|
|
|
|
|
|
|
|
|
|
Three months ended March 31, 2015 |
|
|
|
|
|
|
|
|
|
|
|
|
Balance at beginning of period |
| $ | 19,384 |
|
| $ | 514 |
|
| $ | 19,898 |
|
Loans charged-off |
|
| (949 | ) |
|
| (77 | ) |
|
| (1,026 | ) |
Recoveries of loans previously charged-off |
|
| 466 |
|
|
| - |
|
|
| 466 |
|
Net charge-offs |
|
| (483 | ) |
|
| (77 | ) |
|
| (560 | ) |
Provision (recovery) for loan losses |
|
| 1,941 |
|
|
| (299 | ) |
|
| 1,642 |
|
Balance at end of period |
| $ | 20,842 |
|
| $ | 138 |
|
| $ | 20,980 |
|
Nonperforming loans and nonperforming assets
Non performing loans exclude PCI loans and are defined as non accrual loans plus loans past due 90 days or more and still accruing interest. Generally, we place loans on non accrual status when they are past due 90 days and management believes the borrower’s financial condition, after giving consideration to economic conditions and collection efforts, is such that collection of interest is doubtful. When we place a loan on non accrual status, interest accruals cease and uncollected interest is reversed and charged against current income. Interest received on such loans is accounted for on the cash-basis or cost-recovery method, until qualifying for return to accrual. Loans are returned to accrual status when all the principal and interest amounts contractually due are brought current and future payments are reasonably assured. Non performing loans, as defined above, as a percentage of total non-PCI loans, were 0.85% at March 31, 2016, compared to 0.87% at December 31, 2015.
Non performing assets, excluding assets covered by FDIC loss share agreements, (which we define as non performing loans, as defined above, plus (a) OREO (i.e., real estate acquired through foreclosure, in substance foreclosure, or deed in lieu of foreclosure); and (b) other repossessed assets that are not real estate), were $40,888 at March 31, 2016, compared to $22,545 at December 31, 2015. Non performing assets as a percentage of total assets were 0.82% at March 31, 2016, compared to 0.56% at December 31, 2015. The table below summarizes selected credit quality data at the dates indicated.
41
The table below summarizes selected credit quality data at the dates indicated.
| Mar. 31, 2016 |
| Dec 31, 2015 |
Non-accrual loans (note 1) | $24,865 |
| $ 20,833 |
Accruing loans 90 days or more past due (note 1) | --- |
| --- |
Total non-performing loans ("NPLs") (note 1) | 24,865 |
| 20,833 |
Other real estate owned ("OREO") (note 2) | 15,937 |
| 1,567 |
Repossessed assets other than real estate ("ORAs") (note 1) | 86 |
| 145 |
Total non-performing assets ("NPAs") (note 2) | 40,888 |
| 22,545 |
OREO covered by FDIC loss share agreements |
|
|
|
80% covered | --- |
| 4,828 |
30% covered | --- |
| 4,742 |
0% covered | --- |
| 59 |
Total NPAs including FDIC covered OREO | $40,888 |
| $ 32,174 |
|
|
|
|
NPLs as percentage of total loans (note 1) | 0.85% |
| 0.87% |
NPAs as percentage of total assets |
|
|
|
excluding FDIC covered OREO | 0.82% |
| 0.56% |
including FDIC covered OREO | 0.82% |
| 0.80% |
NPAs as percentage of loans and OREO and ORAs (note 1) |
|
|
|
excluding FDIC covered OREO | 1.40% |
| 0.95% |
including FDIC covered OREO | 1.40% |
| 1.34% |
30-89 days past due accruing loans as percentage of total loans (note 1) | 0.40% |
| 0.62% |
Allowance for loan losses as percentage of NPLs (note 1) | 93% |
| 106% |
note 1: | Excludes PCI loans. |
note 2: | Excludes OREO covered by FDIC loss share agreements. |
As shown in the table above, the largest component of non performing loans excluding loans covered by FDIC loss share agreements is non accrual loans. As of March 31, 2016 the Company had non accrual loans with an aggregate carrying value of $24,865 compared to December 31, 2015 when an aggregate book value of $20,833 was reported.
The second largest component of non performing assets after non accrual loans is OREO. At March 31, 2016, total OREO was $15,937 compared to $11,196 at December 31, 2015 (of which $9,629 was previously covered by FDIC loss sharing agreements). On March 1, 2016, we acquired $6,774 in OREO from Community and Hometown after fair value adjustments. OREO is carried at the lower of cost or market less the estimated cost to sell. Further declines in real estate values can affect the market value of these assets. Any further decline in market value beyond its cost basis is recorded as a current expense in the Company’s Condensed Consolidated Statement of Earnings and Comprehensive Income.
Impaired loans are defined as loans that management has determined will not repay as agreed pursuant to the terms of the related loan agreement. Small balance homogeneous loans are not considered for impairment purposes. Once management has determined a loan is impaired, we perform a specific reserve analysis to determine if it is probable that we will eventually collect all contractual cash flows. If management determines that a shortfall is probable, then a specific valuation allowance is placed against the loan. This loan is then placed on non accrual basis, even if the borrower is current with his/her contractual payments, and will remain on non accrual until payments collected reduce the loan balance such that it eliminates the specific valuation allowance or equivalent partial charge-down or other economic conditions change. At March 31, 2016 we have identified a total of $27,914 impaired loans, excluding PCI loans. A specific valuation allowance of $1,084 has been attached to $6,867 of impaired loans included in the total $27,914 of identified impaired loans. It should also be noted that the total carrying balance of the impaired loans, or $27,914, has been partially charged down by $1,210 from their aggregate legal unpaid balance of $29,124.
42
The table below summarizes impaired loan data for the periods presented.
| Mar. 31, 2016 |
| Dec. 31, 2015 |
Impaired loans with a specific valuation allowance | $ 6,867 |
| $ 6,599 |
Impaired loans without a specific valuation allowance | 21,047 |
| 16,576 |
Total impaired loans | $ 27,914 |
| $ 23,175 |
|
|
|
|
Performing TDRs (these are not included in NPLs) | $9,969 |
| $ 10,254 |
Non performing TDRs (these are included in NPLs) | 5,381 |
| 4,873 |
Total TDRs | 15,350 |
| 15,127 |
Impaired loans that are not TDRs | 12,564 |
| 8,048 |
Total impaired loans | $ 27,914 |
| $ 23,175 |
Bank premises and equipment
Bank premises and equipment was $116,734 at March 31, 2016 compared to $101,821 at December 31, 2015, an increase of $14,913 or 14.6%. The primary component of the increase is $22,814 of branch real estate acquired on March 1, 2016 with the purchase of Community and Hometown. In addition, we transferred $7,550 of branch real estate that is no longer in use to held for sale at estimated fair value less estimated cost to sell. A summary of our bank premises and equipment for the period end indicated is presented in the table below.
| Mar. 31, 2016 |
|
| Dec 31, 2015 |
| ||
Land | $ | 43,032 |
|
| $ | 35,941 |
|
Land improvements |
| 1,049 |
|
|
| 995 |
|
Buildings |
| 70,114 |
|
|
| 62,109 |
|
Leasehold improvements |
| 5,923 |
|
|
| 5,917 |
|
Furniture, fixtures and equipment |
| 32,528 |
|
|
| 31,666 |
|
Construction in progress |
| 1,290 |
|
|
| 1,263 |
|
Subtotal |
| 153,936 |
|
|
| 137,891 |
|
Less: accumulated depreciation |
| 37,202 |
|
|
| 36,070 |
|
Total | $ | 116,734 |
|
| $ | 101,821 |
|
We transferred branch real estate that is no longer in use to held for sale at estimated fair value less estimated cost to sell and sold two properties during the three months ending March 31, 2016. Our branch real estate held for sale at March 31, 2016 and December 31, 2015 was $8,069 and $1,665, respectively, a net increase of $6,404. The reduction due to the two sold properties is offset by the transfers into held for sale of $7,092, after impairment expense of $458.
Deposits
The cost of interest bearing deposits in the current quarter remained at 0.26% compared to the prior quarter. The overall cost of total deposits (i.e. includes non-interest bearing checking accounts) in the current quarter increased 1 bp to 0.17% compared to the prior quarter. On March 1, 2016, we acquired approximately $705.9 million in deposits from Community and Hometown. See “Overview” for additional information on regarding this transaction. The table below summarizes the Company’s deposit mix for the periods presented.
.
| Mar. 31, 2016 |
|
| % of |
|
| Dec 31, 2015 |
|
| % of |
| ||||
Demand - non-interest bearing | $ | 1,489,530 |
|
|
| 36 | % |
| $ | 1,133,138 |
|
|
| 35 | % |
Demand - interest bearing |
| 756,129 |
|
|
| 19 | % |
|
| 679,714 |
|
|
| 21 | % |
Savings deposits |
| 341,864 |
|
|
| 9 | % |
|
| 241,605 |
|
|
| 8 | % |
Money market accounts |
| 872,219 |
|
|
| 21 | % |
|
| 738,301 |
|
|
| 23 | % |
Time deposits |
| 632,425 |
|
|
| 15 | % |
|
| 422,420 |
|
|
| 13 | % |
Total deposits | $ | 4,092,167 |
|
|
| 100 | % |
| $ | 3,215,178 |
|
|
| 100 | % |
Securities sold under agreement to repurchase
Our subsidiary bank enters into borrowing arrangements with our retail business customers by agreements to repurchase (“securities sold under agreements to repurchase”) under which the bank pledges investment securities owned and under their control as collateral against these one-day borrowing arrangement. These short-term borrowings totaled $31,474 at March 31, 2016 compared to $27,472 at December 31, 2015.
43
Federal funds purchased
Federal funds purchased are overnight deposits from correspondent banks. Federal funds purchased acquired from other than our correspondent bank deposits are included with Federal Home Loan Bank advances and other borrowed funds as described below, if any. At March 31, 2016 we had $225,298 of correspondent bank deposits or federal funds purchased, compared to $200,250 at December 31, 2015.
Federal Home Loan Bank advances and other borrowed funds
From time to time, we borrow either through Federal Home Loan Bank advances or Federal Funds Purchased, other than correspondent bank deposits (i.e. federal funds purchased) listed above. At March 31, 2016 there were no outstanding advances compared to $25,000 at December 31, 2015.
Corporate debentures
On January 22, 2016, we purchased, redeemed and terminated the Gulfstream Bancshares Capital Trust I $7,000 corporate debenture and recognized a gain on early extinguishment of debt of approximately $308. On March 1, 2016, we assumed $16,000 in corporate debentures from Hometown of which we partially redeemed and terminated $6,000. These corporate debentures were assumed through acquisitions, and as a result, were carried at less than par value at the time of termination.
Below is a schedule of statutory trust entities and the related corporate debentures formed and assumed through various acquisitions:
| Amount |
| Interest Rate |
| Maturity |
CenterState Banks of Florida Statutory Trust I | $10,000 |
| LIBOR + 3.05% |
| Sep. 2033 |
Valrico Capital Statutory Trust | $2,500 |
| LIBOR + 2.70% |
| Sep. 2034 |
Federal Trust Statutory Trust I | $5,000 |
| LIBOR + 2.95% |
| Sep. 2033 |
Gulfstream Bancshares Capital Trust II | $3,000 |
| LIBOR + 1.70% |
| Mar. 2037 |
Homestead Statutory Trust I | $10,000 |
| LIBOR + 1.65% |
| Jul. 2036 |
Stockholders’ equity
Stockholders’ equity at March 31, 2016, was $519,461, or 10.5% of total assets, compared to $490,514, or 12.2% of total assets at December 31, 2015. The increase in stockholders’ equity was due to the following items:
$490,514 | Total stockholders' equity at December 31, 2015 |
(4,804) | Net loss during the period |
(1,918) | Dividends paid on common shares ($0.04 per common share) |
2,569 | Net increase in market value of securities available for sale, net of deferred taxes |
303 | Stock options exercised, including tax benefit |
1,279 | Employee equity based compensation |
(347) | Stock Repurchase (24,283 shares, average price of $14.28 per share) |
31,865 | Stock issued pursuant to acquisition of Community |
$519,461 | Total stockholders' equity at March 31, 2016 |
The federal bank regulatory agencies have established risk-based capital requirements for banks. These guidelines are intended to provide an additional measure of a bank’s capital adequacy by assigning weighted levels of risk to asset categories. Banks are also required to systematically maintain capital against such “off- balance sheet” activities as loans sold with recourse, loan commitments, guarantees and standby letters of credit. These guidelines are intended to strengthen the quality of capital by increasing the emphasis on common equity and restricting the amount of loan loss reserves and other forms of equity such as preferred stock that may be included in capital. As of March 31, 2016, our subsidiary bank exceeded the minimum capital levels to be considered “well capitalized” under the terms of the guidelines.
The U.S. Basel III Capital Rules require the Company and the Bank to maintain minimum amounts and ratios. The Company and the Bank are now subject to a capital conservation buffer in addition to the minimum risk-based capital ratios. The Company and Bank capital conservation buffer is determined by calculating the margin between the Company’s and Bank’s three risk-based asset ratios and the minimum required adequately capitalized ratio, with the lowest of the three margins resulting in the capital conservation buffer. The required buffer will be phased in over three years beginning January 1, 2016, and the phase-in amount for 2016 is 0.625 percent of risk-weighted assets. Failure to maintain the buffer will result in restrictions on the ability to make capital distributions and
44
to pay discretionary bonuses to executive officers. As of March 31, 2016, management believes that the Company and the Bank met all capital adequacy requirements to which they were subject.
Selected consolidated capital ratios at March 31, 2016 and December 31, 2015 for the Company and for the Company’s subsidiary bank, CenterState Bank of Florida, N.A., are presented in the tables below.
CenterState Banks, Inc. (the Company) |
| Actual |
|
| Capital Adequacy |
| Excess |
| ||||||||||
|
| Amount |
|
| Ratio |
|
| Amount |
|
| Ratio |
| Amount |
| ||||
March 31, 2016 |
|
|
|
|
|
|
|
|
|
|
|
|
|
|
|
|
|
|
Total capital (to risk weighted assets) |
| $ | 426,475 |
|
|
| 12.1 | % |
| $ | 280,912 |
|
| >8.0% |
| $ | 145,563 |
|
Tier 1 capital (to risk weighted assets) |
|
| 403,353 |
|
|
| 11.5 | % |
|
| 210,684 |
|
| >6.0% |
|
| 192,669 |
|
Common equity Tier 1 capital (to risk weighted assets |
|
| 383,231 |
|
|
| 10.9 | % |
|
| 158,013 |
|
| >4.5% |
|
| 225,218 |
|
Tier 1 capital (to average assets) |
|
| 403,353 |
|
|
| 9.6 | % |
|
| 168,531 |
|
| >4.0% |
|
| 234,822 |
|
|
|
|
|
|
|
|
|
|
|
|
|
|
|
|
|
|
|
|
December 31, 2015 |
|
|
|
|
|
|
|
|
|
|
|
|
|
|
|
|
|
|
Total capital (to risk weighted assets) |
| $ | 438,748 |
|
|
| 15.8 | % |
| $ | 222,322 |
|
| >8.0% |
| $ | 216,426 |
|
Tier 1 capital (to risk weighted assets) |
|
| 416,484 |
|
|
| 15.0 | % |
|
| 166,742 |
|
| >6.0% |
|
| 249,742 |
|
Common equity Tier 1 capital (to risk weighted assets |
|
| 399,876 |
|
|
| 14.4 | % |
|
| 125,056 |
|
| >4.5% |
|
| 274,820 |
|
Tier 1 capital (to average assets) |
|
| 416,484 |
|
|
| 10.5 | % |
|
| 158,206 |
|
| >4.0% |
|
| 258,278 |
|
|
|
|
|
|
|
|
|
|
|
|
|
|
|
|
|
|
|
|
CenterState Bank of Florida, N.A. |
| Actual |
|
| Well Capitalized |
| Excess |
| ||||||||||
|
| Amount |
|
| Ratio |
|
| Amount |
|
| Ratio |
| Amount |
| ||||
March 31, 2016 |
|
|
|
|
|
|
|
|
|
|
|
|
|
|
|
|
|
|
Total capital (to risk weighted assets) |
| $ | 392,808 |
|
|
| 11.1 | % |
| $ | 352,984 |
|
| >10.0% |
| $ | 39,824 |
|
Tier 1 capital (to risk weighted assets) |
|
| 369,693 |
|
|
| 10.5 | % |
|
| 282,387 |
|
| >8.0% |
|
| 87,306 |
|
Common equity Tier 1 capital (to risk weighted assets |
|
| 369,693 |
|
|
| 10.5 | % |
|
| 229,440 |
|
| >6.5% |
|
| 140,253 |
|
Tier 1 capital (to average assets) |
|
| 369,693 |
|
|
| 8.8 | % |
|
| 210,500 |
|
| >5.0% |
|
| 159,193 |
|
|
|
|
|
|
|
|
|
|
|
|
|
|
|
|
|
|
|
|
December 31, 2015 |
|
|
|
|
|
|
|
|
|
|
|
|
|
|
|
|
|
|
Total capital (to risk weighted assets) |
| $ | 411,627 |
|
|
| 14.7 | % |
| $ | 279,517 |
|
| >10.0% |
| $ | 132,110 |
|
Tier 1 capital (to risk weighted assets) |
|
| 389,371 |
|
|
| 13.9 | % |
|
| 223,613 |
|
| >8.0% |
|
| 165,758 |
|
Common equity Tier 1 capital (to risk weighted assets |
|
| 389,371 |
|
|
| 13.9 | % |
|
| 181,686 |
|
| >6.5% |
|
| 207,685 |
|
Tier 1 capital (to average assets) |
|
| 389,371 |
|
|
| 9.9 | % |
|
| 197,514 |
|
| >5.0% |
|
| 191,857 |
|
45
COMPARISON OF RESULTS OF OPERATIONS FOR THE THREE MONTH PERIODS ENDED MARCH 2016 AND 2015
Overview
We recognized a net loss of $4,804 or $0.10 per share basic and diluted for the three month period ended March 31, 2016, compared to net income of $9,148 or $0.20 per share basic and diluted for the same period in 2015. A summary of the differences are listed in the table below.
| 3 months ended |
|
| 3 months ended |
|
| increase |
| |||
| Mar. 31, 2016 |
|
| Mar. 31, 2015 |
|
| (decrease) |
| |||
Net interest income | $ | 41,475 |
|
| $ | 37,620 |
|
| $ | 3,855 |
|
Provision for loan losses | 510 |
|
|
| 1,642 |
|
|
| (1,132 | ) | |
Net interest income after loan loss provision |
| 40,965 |
|
|
| 35,978 |
|
|
| 4,987 |
|
|
|
|
|
|
|
|
|
|
|
|
|
Correspondent banking and capital markets division |
| 8,775 |
|
|
| 6,800 |
|
|
| 1,975 |
|
IA amortization |
| (1,166 | ) |
|
| (4,350 | ) |
|
| 3,184 |
|
FDIC revenue |
| 96 |
|
|
| 667 |
|
|
| (571 | ) |
Gain from early extinguishment of debt | 308 |
|
|
| - |
|
|
| 308 |
| |
All other non interest income |
| 6,548 |
|
|
| 5,964 |
|
|
| 584 |
|
Total non interest income |
| 14,561 |
|
|
| 9,081 |
|
|
| 5,480 |
|
|
|
|
|
|
|
|
|
|
|
|
|
Correspondent banking and capital markets division |
| 5,782 |
|
|
| 5,595 |
|
|
| 187 |
|
Credit related expenses | 359 |
|
|
| (551 | ) |
|
| 910 |
| |
Merger related expenses |
| 11,172 |
|
|
| - |
|
|
| 11,172 |
|
Impairment of branch real estate held for sale | 456 |
|
|
| 641 |
|
|
| (185 | ) | |
Termination of FDIC loss share agreements |
| 17,560 |
|
|
| - |
|
|
| 17,560 |
|
All other non interest expense |
| 27,524 |
|
|
| 24,918 |
|
|
| 2,606 |
|
Total non interest expense |
| 62,853 |
|
|
| 30,603 |
|
|
| 32,250 |
|
|
|
|
|
|
|
|
|
|
|
|
|
Net income before provision for income taxes |
| (7,327 | ) |
|
| 14,456 |
|
|
| (21,783 | ) |
Provision for income taxes |
| (2,523 | ) |
|
| 5,308 |
|
|
| (7,831 | ) |
Net income | $ | (4,804 | ) |
| $ | 9,148 |
|
|
| (13,952 | ) |
The primary differences between the two quarters presented above relate to the termination of the FDIC loss share agreements in February 2016 resulting in a charge of $17,560 and merger related expenses of $11,172 for the acquisitions of Community and Hometown on March 1, 2016. Other differences between both quarters include lower IA amortization expense due to the termination of FDIC loss share agreements as stated above, increased correspondent revenue from our capital markets division and higher net interest income.
The increase in our net interest income relates primarily to the increase in our average interest earning assets as a result of the loan growth and the increase in interest accretion in our PCI loan portfolio. The increase in our “all other non interest expense,” which represents the operating expenses of our commercial/retail banking segment, is primarily due to the acquisition of Community and Hometown as of March 1, 2016. These items along with others are discussed and analyzed below.
Net interest income/margin
Net interest income increased $3,855 or 10.3% to $41,475 during the three month period ended March 31, 2016 compared to $37,620 for the same period in 2015. The $3,855 increase was the result of a $4,013 increase in interest income and a $158 increase in interest expense.
Interest earning assets averaged $3,899,028 during the three month period ended March 31, 2016 as compared to $3,406,822 for the same period in 2015, an increase of $492,206, or 14.4%. The yield on average interest earning assets decreased 21bps to 4.49% (19 bps to 4.56% tax equivalent basis) during the three month period ended March 31, 2016, compared to 4.70% (4.75% tax equivalent basis) for the same period in 2015. The combined effects of the $492,206 increase in average interest earning assets and the 21bps (19bps tax equivalent basis) decrease in yield on average interest earning assets resulted in the $4,013 ($4,274 tax equivalent basis) increase in interest income between the two periods.
Interest bearing liabilities averaged $2,519,372 during the three month period ended March 31, 2016 as compared to $2,265,656 for the same period in 2015, an increase of $253,716 or 11.2%. The cost of average interest bearing liabilities decreased 1bp to 0.32%
46
during the three month period ended March 31, 2016, compared to 0.33% for the same period in 2015. The combined effects of the $253,716 increase in average interest bearing liabilities and the 1bp decrease in cost of average interest bearing liabilities resulted in the $158 increase in interest expense between the two periods.
The table below summarizes the analysis of changes in interest income and interest expense for the three month periods ended March 31, 2016 and 2015 on a tax equivalent basis.
| Three months ended March 31, |
| ||||||||||||||||||||||||||
| 2016 |
|
| 2015 |
| |||||||||||||||||||||||
| Average |
|
| Interest |
|
| Average |
|
| Average |
|
| Interest |
|
| Average |
| |||||||||||
| Balance |
|
| inc / exp |
|
| rate |
|
| balance |
|
| inc / exp |
|
| rate |
| |||||||||||
Loans (notes 1, 2, 8) | $ | 2,569,240 |
|
| $ | 28,489 |
|
|
| 4.46 | % |
| $ | 2,172,621 |
|
| $ | 24,482 |
|
|
| 4.57 | % | |||||
PCI loans (note 9) |
| 214,998 |
|
|
| 8,908 |
|
|
| 16.66 | % |
|
| 271,135 |
|
|
| 9,930 |
|
|
| 14.85 | % | |||||
Securities- taxable |
| 791,292 |
|
|
| 5,062 |
|
|
| 2.57 | % |
|
| 688,027 |
|
|
| 4,282 |
|
|
| 2.52 | % | |||||
Securities- tax exempt (note 8) |
| 98,196 |
|
|
| 1,186 |
|
|
| 4.86 | % |
|
| 63,792 |
|
|
| 819 |
|
|
| 5.21 | % | |||||
Fed funds sold and other (note 3) |
| 225,302 |
|
| 538 |
|
|
| 0.96 | % |
|
| 211,247 |
|
| 396 |
|
|
| 0.76 | % | |||||||
Total interest earning assets |
| 3,899,028 |
|
|
| 44,183 |
|
|
| 4.56 | % |
|
| 3,406,822 |
|
|
| 39,909 |
|
|
| 4.75 | % | |||||
|
|
|
|
|
|
|
|
|
|
|
|
|
|
|
|
|
|
|
|
|
|
|
| |||||
Allowance for loan losses |
| (22,616 | ) |
|
|
|
|
|
|
|
|
|
| (20,980 | ) |
|
|
|
|
|
|
|
| |||||
All other assets |
| 479,454 |
|
|
|
|
|
|
|
|
|
|
| 468,645 |
|
|
|
|
|
|
|
|
| |||||
Total assets | $ | 4,355,866 |
|
|
|
|
|
|
|
|
|
| $ | 3,854,487 |
|
|
|
|
|
|
|
|
| |||||
|
|
|
|
|
|
|
|
|
|
|
|
|
|
|
|
|
|
|
|
|
|
|
| |||||
Interest bearing deposits (note 4) |
| 2,266,700 |
|
|
| 1,481 |
|
|
| 0.26 | % |
|
| 2,034,864 |
|
|
| 1,447 |
|
|
| 0.29 | % | |||||
Fed funds purchased |
| 197,335 |
|
| 262 |
|
|
| 0.53 | % |
|
| 176,109 |
|
| 132 |
|
|
| 0.30 | % | |||||||
Other borrowings (note 5) |
| 34,285 |
|
| 32 |
|
|
| 0.38 | % |
|
| 30,744 |
|
| 49 |
|
|
| 0.65 | % | |||||||
Corporate debenture (note 10) |
| 21,052 |
|
| 248 |
|
|
| 4.74 | % |
|
| 23,939 |
|
| 237 |
|
|
| 4.02 | % | |||||||
Total interest bearing liabilities |
| 2,519,372 |
|
|
| 2,023 |
|
|
| 0.32 | % |
|
| 2,265,656 |
|
|
| 1,865 |
|
|
| 0.33 | % | |||||
Demand deposits |
| 1,282,422 |
|
|
|
|
|
|
|
|
|
|
| 1,098,236 |
|
|
|
|
|
|
|
|
| |||||
Other liabilities |
| 56,650 |
|
|
|
|
|
|
|
|
|
|
| 32,373 |
|
|
|
|
|
|
|
|
| |||||
Stockholders’ equity |
| 497,422 |
|
|
|
|
|
|
|
|
|
|
| 458,222 |
|
|
|
|
|
|
|
|
| |||||
Total liabilities and stockholders’ equity | $ | 4,355,866 |
|
|
|
|
|
|
|
|
|
| $ | 3,854,487 |
|
|
|
|
|
|
|
|
| |||||
Net interest spread (tax equivalent basis) (note 6) |
|
|
|
|
|
|
|
|
| 4.24 | % |
|
|
|
|
|
|
|
|
|
| 4.42 | % | |||||
Net interest income (tax equivalent basis) |
|
|
|
| $ | 42,160 |
|
|
|
|
|
|
|
|
|
| $ | 38,044 |
|
|
|
|
| |||||
Net interest margin (tax equivalent basis) (note 7) |
|
|
|
|
|
|
|
|
| 4.35 | % |
|
|
|
|
|
|
|
|
|
| 4.53 | % | |||||
note 1: | Loan balances are net of deferred origination fees and costs. |
note 2: | Interest income on average loans includes amortization of loan fee recognition of $112 and ($34) for the three month periods ended March 31, 2016 and 2015. |
note 3: | Includes federal funds sold, interest earned on deposits at the Federal Reserve Bank and earnings on Federal Reserve Bank stock and Federal Home Loan Bank stock. |
note 4: | Includes interest bearing deposits only. Non-interest bearing checking accounts are included in the demand deposits listed above. Also, includes net amortization of fair market value adjustments related to various acquisitions of time deposits of ($200) and ($235) for the three month periods ended March 31, 2016 and 2015. |
note 5: | Includes securities sold under agreements to repurchase and Federal Home Loan Bank advances. |
note 6: | Represents the average rate earned on interest earning assets minus the average rate paid on interest bearing liabilities. |
note 7: | Represents net interest income divided by total interest earning assets. |
note 8: | Interest income and rates include the effects of a tax equivalent adjustment using applicable statutory tax rates to adjust tax exempt interest income on tax exempt investment securities and loans to a fully taxable basis. |
note 9: | PCI loans are accounted for pursuant to ASC 310-30. |
note 10: | Includes amortization of fair value adjustments related to various acquisitions of corporate debentures of $37 and $44 for the three month periods ended March 31, 2016 and 2015. |
The primary reason for the decrease in our net interest margin (“NIM”) during the current quarter was due to the mix of interest earning assets between the two quarters. Higher average balances in lower yielding assets, such as taxable securities and federal funds sold, and lower average balances in higher yielding assets, such as PCI loans, in the current quarter compared to the prior quarter contributed to the decrease in NIM.
The Company acquired two banks, Community and Hometown (the “Homestead” banks), on March 1, 2016. As such, the acquired assets and assumed liabilities were included in the current quarter averages, but only for one month. In addition to the effect these two banks had on the Company’s average interest earning assets and interest bearing liabilities, there also was acceleration of
47
certain loan interest income accretion. The tables below summarize these effects on the Company’s yield on both PCI loans and non-PCI loans during the current quarter compared to the prior quarter.
| Three months ended | ||||||
| March 31, 2016 |
| December 31, 2015 | ||||
| average | interest | average |
| average | interest | average |
| balance | income | rate |
| balance | income | rate |
Loans (Non-PCI), as reported | $2,569,240 | $28,489 | 4.46% |
| $2,363,060 | $26,337 | 4.42% |
Estimated average Homestead loans | (155,500) | (2,216) | 5.73% |
|
|
| �� |
Estimated effect of rate increase on floating rate loans |
| (337) |
|
|
|
|
|
Accelerated accretion and other interest adjustments |
| (486) |
|
|
| (742) |
|
Adjusted loans (note 1) | $2,413,740 | $25,450 | 4.24% |
| $2,363,060 | $25,595 | 4.30% |
| Three months ended | ||||||
| March 31, 2016 |
| December 31, 2015 | ||||
| average | interest | average |
| average | interest | average |
| balance | income | rate |
| balance | income | rate |
PCI loans, as reported | $214,998 | $8,908 | 16.66% |
| $222,685 | $9,420 | 16.78% |
Estimated average Homestead loans | (14,939) | (309) | 8.32% |
|
|
|
|
Accelerated accretion |
| (686) |
|
|
|
|
|
Adjusted loans (note 1) | $200,059 | $7,913 | 15.91% |
| $222,685 | $9,420 | 16.78% |
Note 1: | Excludes the estimated effect of the Homestead acquisitions, estimated effect of the Fed’s interest rate increase in December 2015 on the Company’s floating interest rate loans, accelerated accretion and other interest adjustments. |
The adjusted average interest rate on Non-PCI loans, as shown in the table above, decreased from 4.30% during the fourth quarter of 2015 to 4.24% during the first quarter of 2016. The primary reason for this, after adjustments, is due to new loan production being added during the current quarter at an approximate average interest rate of 3.6%. Until the Company’s new loan production average interest rate approximates the average existing portfolio interest rate, it will have a contracting effect on the overall average interest rate on the loan portfolio, as shown in the above table. The average interest rate on the acquired Homestead loans added on March 1, 2016 is higher than the average existing portfolio rate, which results in a positive effect on the loan portfolio. These loans will be outstanding for the entire quarter during the second quarter of 2016 versus one month during the first quarter of 2016, and as such are expected to partially offset the contracting effect of lower interest rates on new loan production.
The recently acquired Homestead PCI loans have an average accretable yield (8.32%) that is lower than the Company’s existing accretable yield as shown in the PCI loan table above. Although the blended average interest rate on this portfolio is lower when these are added, the interest income amount will be larger, which produces a positive effect on our NIM. As with the Non-PCI loans, the acquired Homestead PCI loans will be outstanding for the entire second quarter of 2016 versus one month during the first quarter of 2016.
The table below summarizes the Company’s NIM, as reported on the previous page, and the NIM excluding accelerated interest income accretion related to both PCI and non-PCI loans for the periods presented.
| Three months ended | ||||
| March 31, 2016 |
| December 31, 2015 | ||
| net interest |
|
| net interest |
|
| income (1) | NIM |
| income (1) | NIM |
NIM, as reported | $42,160 | 4.35% |
| $39,897 | 4.37% |
Accelerated interest income accretion (2) | (1,172) |
|
| (742) |
|
NIM, excluding accelerated accretion | $40,988 | 4.23% |
| $39,155 | 4.29% |
Note 1:Tax equivalent basis.
Note 2:Includes both PCI and non-PCI loans.
As shown in the tables above, the Company’s reported NIMs for the current quarter and the previous quarter were 4.35% and 4.37%, respectively. Excluding the accelerated interest income accretion, as shown above, the NIMs for the current quarter and the previous quarter were 4.23% and 4.29%, respectively. If the PCI loans were producing a yield similar to the Company’s non-PCI loans, the NIMs during the current quarter and previous quarter would have been approximately 3.68% and 3.61%, respectively. The primary reason for the increase to 3.68% was the higher average rate on the Homestead non-PCI loan yields that were acquired March 1, 2016 and the effect of the December 2015 Fed’s interest rate increase on the Company’s floating rate loans less the effect of the lower average interest rates on the Company’s new loan production.
48
Provision for loan losses
The provision for loan losses decreased $1,132 to $510 during the three month period ending March 31, 2016 compared to provision expense of $1,642 for the comparable period in 2015. Our policy is to maintain the allowance for loan losses at a level sufficient to absorb probable incurred losses in the loan portfolio. The allowance is increased by the provision for loan losses, which is a charge to current period earnings, and is decreased by charge-offs, net of recoveries on prior loan charge-offs. Therefore, the provision for loan losses (Income Statement effect) is a residual of management’s determination of allowance for loan losses (Balance Sheet approach). In determining the adequacy of the allowance for loan losses, we consider the conditions of individual borrowers, the historical loan loss experience, the general economic environment, the overall portfolio composition, and other information. As these factors change, the level of loan loss provision changes. The decrease in our loan loss provision between the comparable periods is primarily a result of net recoveries versus net charge-offs, as well as improved credit metrics used to determine the appropriate allowance for loan losses. See “Credit quality and allowance for loan losses” for additional information regarding the allowance for loan losses.
Non-interest income
Non-interest income for the three months ended March 31, 2016 was $14,561 compared to $9,081 for the comparable period in 2015. This increase was the result of the following components listed in the table below.
|
| Mar 31, |
|
| Mar 31, |
|
| $ increase |
|
| % increase |
|
| ||||
Three month period ending: |
| 2016 |
|
| 2015 |
|
| (decrease) |
|
| (decrease) |
|
| ||||
Income from correspondent banking capital markets division (note 1) |
| $ | 7,371 |
|
| $ | 5,694 |
|
| $ | 1,677 |
|
|
| 29.5 |
| % |
Other correspondent banking related revenue (note 2) |
|
| 1,404 |
|
|
| 1,106 |
|
|
| 298 |
|
|
| 26.9 |
| % |
Wealth management related revenue |
|
| 735 |
|
|
| 970 |
|
|
| (235 | ) |
|
| (24.2 | ) | % |
Service charges on deposit accounts |
|
| 2,736 |
|
|
| 2,261 |
|
|
| 475 |
|
|
| 21.0 |
| % |
Debit, prepaid, ATM and merchant card related fees |
|
| 2,046 |
|
|
| 1,701 |
|
|
| 345 |
|
|
| 20.3 |
| % |
BOLI income |
|
| 565 |
|
|
| 593 |
|
|
| (28 | ) |
|
| (4.7 | ) | % |
Other service charges and fees |
|
| 466 |
|
|
| 439 |
|
|
| 27 |
|
|
| 6.2 |
| % |
Subtotal |
| $ | 15,323 |
|
| $ | 12,764 |
|
| $ | 2,559 |
|
|
| 20.0 |
| % |
Gain on early extinguishment of debt |
|
| 308 |
|
|
| - |
|
|
| 308 |
|
| NM |
| % | |
FDIC indemnification asset-amortization(see explanation below) |
|
| (1,166 | ) |
|
| (4,350 | ) |
|
| 3,184 |
|
|
| (73.2 | ) | % |
FDIC indemnification income |
|
| 96 |
|
|
| 667 |
|
|
| (571 | ) |
|
| (85.6 | ) | % |
Total non-interest income |
| $ | 14,561 |
|
| $ | 9,081 |
|
| $ | 5,480 |
|
|
| 60.3 |
| % |
note 1: | Includes gross commissions earned on bond sales, fees from hedging services, loan brokering fees and related consulting fees. The fee income in this category is based on sales volume in any particular period and is therefore volatile between comparable periods. |
note 2: | Includes fees from safe-keeping activities, bond accounting services, asset/liability consulting services, international wires, clearing and corporate checking account services and other correspondent banking related revenue and fees. The fees included in this category are less volatile than those described above in note 1. |
“Income from correspondent banking capital markets division” increased between the two periods presented above due to increased fees from hedging services and loan brokering fees. In addition, the termination of the FDIC loss share agreements in February resulted in no further FDIC indemnification asset amortization which increased non-interest income by $3,184 compared to the same period in 2015. Lastly, the early extinguishment of trust preferred debt in the period resulted in a gain of $308.
49
Non-interest expense
Non-interest expense for the three months ended March 31, 2016 increased $32,250, or 105.4%, to $62,853, compared to $30,603 for the same period in 2015. Components of our non-interest expenses are listed in the table below.
|
| Mar 31, |
|
| Mar 31, |
|
| $ increase |
|
| % increase |
|
| ||||
Three month period ending: |
| 2016 |
|
| 2015 |
|
| (decrease) |
|
| (decrease) |
|
| ||||
Salaries and wages |
| $ | 16,137 |
|
| $ | 14,535 |
|
| $ | 1,602 |
|
|
| 11.0 |
| % |
Incentive/bonus compensation |
|
| 1,259 |
|
|
| 1,200 |
|
|
| 59 |
|
|
| 4.9 |
| % |
Stock based compensation |
|
| 1,080 |
|
|
| 830 |
|
|
| 250 |
|
|
| 30.1 |
| % |
Employer 401K matching contributions |
|
| 477 |
|
|
| 435 |
|
|
| 42 |
|
|
| 9.7 |
| % |
Deferred compensation expense |
|
| 160 |
|
|
| 161 |
|
|
| (1 | ) |
|
| (0.6 | ) | % |
Health insurance and other employee benefits |
|
| 1,260 |
|
|
| 1,330 |
|
|
| (70 | ) |
|
| (5.3 | ) | % |
Payroll taxes |
|
| 1,423 |
|
|
| 1,403 |
|
|
| 20 |
|
|
| 1.4 |
| % |
Other employee related expenses |
|
| 291 |
|
|
| 238 |
|
|
| 53 |
|
|
| 22.3 |
| % |
Incremental direct cost of loan origination |
|
| (632 | ) |
|
| (552 | ) |
|
| (80 | ) |
|
| 14.5 |
| % |
Total salaries, wages and employee benefits |
|
| 21,455 |
|
|
| 19,580 |
|
|
| 1,875 |
|
|
| 9.6 |
| % |
|
|
|
|
|
|
|
|
|
|
|
|
|
|
|
|
|
|
Loss on sale of OREO |
|
| (158 | ) |
|
| (547 | ) |
|
| 389 |
|
|
| (71.1 | ) | % |
(Gain) loss on sale of FDIC covered OREO |
|
| - |
|
|
| (981 | ) |
|
| 981 |
|
|
| (100.0 | ) | % |
Valuation write down of OREO |
|
| 22 |
|
|
| 61 |
|
|
| (39 | ) |
|
| (63.9 | ) | % |
Valuation write down of FDIC covered OREO |
|
| - |
|
|
| 328 |
|
|
| (328 | ) |
|
| (100.0 | ) | % |
Loss on repossessed assets other than real estate |
|
| 6 |
|
|
| (1 | ) |
|
| 7 |
|
|
| (700.0 | ) | % |
Foreclosure and repossession related expenses |
|
| 489 |
|
|
| 503 |
|
|
| (14 | ) |
|
| (2.8) |
| % |
Foreclosure and repo expense, FDIC (note 1) |
|
| - |
|
|
| 86 |
|
|
| (86 | ) |
|
| (100.0 | ) | % |
Total credit related expenses |
|
| 359 |
|
|
| (551 | ) |
|
| 910 |
|
|
| (165.2 | ) | % |
|
|
|
|
|
|
|
|
|
|
|
|
|
|
|
|
|
|
Occupancy expense |
|
| 2,147 |
|
|
| 2,080 |
|
|
| 67 |
|
|
| 3.2 |
| % |
Depreciation of premises and equipment |
|
| 1,497 |
|
|
| 1,433 |
|
|
| 64 |
|
|
| 4.5 |
| % |
Supplies, stationary and printing |
|
| 299 |
|
|
| 365 |
|
|
| (66 | ) |
|
| (18.1 | ) | % |
Marketing expenses |
|
| 690 |
|
|
| 538 |
|
|
| 152 |
|
|
| 28.3 |
| % |
Data processing expense |
|
| 1,527 |
|
|
| 1,695 |
|
|
| (168 | ) |
|
| (9.9 | ) | % |
Legal, auditing and other professional fees |
|
| 903 |
|
|
| 735 |
|
|
| 168 |
|
|
| 22.9 |
| % |
Bank regulatory related expenses |
|
| 810 |
|
|
| 910 |
|
|
| (100 | ) |
|
| (11.0 | ) | % |
Postage and delivery |
|
| 355 |
|
|
| 368 |
|
|
| (13 | ) |
|
| (3.5 | ) | % |
Debit, prepaid, ATM and merchant card related expenses |
|
| 596 |
|
|
| 433 |
|
|
| 163 |
|
|
| 37.6 |
| % |
CDI and Trust intangible amortization |
|
| 678 |
|
|
| 666 |
|
|
| 12 |
|
|
| 1.8 |
| % |
Internet and telephone banking |
|
| 564 |
|
|
| 534 |
|
|
| 30 |
|
|
| 5.6 |
| % |
Operational write-offs and losses |
|
| 8 |
|
|
| 260 |
|
|
| (252 | ) |
|
| (96.9 | ) | % |
Correspondent accounts and Federal Reserve charges |
|
| 176 |
|
|
| 168 |
|
|
| 8 |
|
|
| 4.8 |
| % |
Conferences/Seminars/Education/Training |
|
| 133 |
|
|
| 117 |
|
|
| 16 |
|
|
| 13.7 |
| % |
Director fees |
|
| 209 |
|
|
| 179 |
|
|
| 30 |
|
|
| 16.8 |
| % |
Travel expenses |
|
| 79 |
|
|
| 84 |
|
|
| (5 | ) |
|
| (6.0 | ) | % |
Other expenses |
|
| 1,180 |
|
|
| 965 |
|
|
| 215 |
|
|
| 22.3 |
| % |
Subtotal |
|
| 33,665 |
|
|
| 30,559 |
|
|
| 3,106 |
|
|
| 10.2 |
| % |
Impairment of bank property held for sale, net |
|
| 456 |
|
|
| 641 |
|
|
| (185 | ) |
| (28.9) |
| % | |
Lease termination recovery |
|
| - |
|
|
| (597 | ) |
|
| 597 |
|
|
| (100.0 | ) | % |
Merger and acquisition related expenses |
|
| 11,172 |
|
|
| - |
|
|
| 11,172 |
|
| NM |
| % | |
Loss from termination of FDIC loss share agreements |
|
| 17,560 |
|
|
| - |
|
|
| 17,560 |
|
| NM |
| % | |
Total non-interest expense |
|
| 62,853 |
|
|
| 30,603 |
|
|
| 32,250 |
|
|
| 105.4 |
| % |
note 1: | These are foreclosure and repossession related expenses related to FDIC covered assets, and are shown net of FDIC reimbursable amounts pursuant to FDIC loss share agreements. |
Excluding net impairments on bank property held for sale, merger related expenses and charges related to termination of FDIC loss sharing agreements, our non interest expenses increased $3,106, or 10.2% to $33,665 during the current quarter compared to $30,559 during the same quarter last year. The overall primary reason for the increase relates to the acquisitions of Community and Hometown on March 1, 2016.
50
Provision for income taxes
We recognized an income tax benefit for the three months ended March 31, 2016 of $2,523 on a pre-tax loss of $7,327 (an effective tax rate of 34.4%) compared to an income tax provision of $5,308 on pre-tax income of $14,456 (an effective tax rate of 36.7%) for the comparable quarter in 2015. The primary reason for the decrease in the effective tax rates is due to a larger percentage of tax exempt interest income relative to total revenue and the impact of CSFL Insurance Corp, the Company’s captive insurance subsidiary, incorporated in December 2015 pursuant to section 831(b) of the U.S. Tax Code.
Liquidity
Liquidity is defined as the ability to meet anticipated customer demands for funds under credit commitments and deposit withdrawals at a reasonable cost and on a timely basis. We measure liquidity position by giving consideration to both on- and off-balance sheet sources of and demands for funds on a daily and weekly basis.
Our subsidiary bank regularly assesses the amount and likelihood of projected funding requirements through a review of factors such as historical deposit volatility and funding patterns, present and forecasted market and economic conditions, individual client funding needs, and existing and planned business activities. The subsidiary bank’s asset/liability committee (ALCO) provides oversight to the liquidity management process and recommends guidelines, subject to the approval of its board of directors, and courses of action to address actual and projected liquidity needs.
Short term sources of funding and liquidity include cash and cash equivalents, net of federal requirements to maintain reserves against deposit liabilities; investment securities eligible for pledging to secure borrowings from customers pursuant to securities sold under repurchase agreements; loan repayments; deposits and certain interest rate-sensitive deposits; and borrowings under overnight federal fund lines available from correspondent banks. In addition to interest rate-sensitive deposits, the primary demand for liquidity is anticipated fundings under credit commitments to customers.
Off-Balance Sheet Arrangements
We do not have any material off-balance sheet arrangements except for approved and unfunded loans and letters of credit to our customers in the ordinary course of business.
Market risk
We believe interest rate risk is the most significant market risk impacting us. We monitor and manage interest rate risk using interest rate sensitivity “gap” analysis to measure the impact of market interest rate changes on net interest income. See our Annual Report on Form 10-K for the fiscal year ended December 31, 2015 for disclosure of the quantitative and qualitative information regarding the interest rate risk inherent in interest rate risk sensitive instruments as of December 31, 2015. There have been no changes in the assumptions used in monitoring interest rate risk as of March 31, 2016. The impact of other types of market risk, such as foreign currency exchange risk and equity price risk, is deemed immaterial.
As of the end of the period covered by this report, an evaluation was carried out under the supervision and with the participation of our management, including the Chief Executive Officer (CEO) and Chief Financial Officer (CFO), of the effectiveness of the design and operation of our disclosure controls and procedures (as defined in Rules 13a-15(e) or 15d-15(e)). Based on that evaluation, the CEO and CFO have concluded that our disclosure controls and procedures are effective to ensure that information required to be disclosed by us in reports that we file or submit under the Securities Exchange Act of 1934 are recorded, processed, summarized and reported within the time periods specified in Securities and Exchange Commission rules and forms. There was no change in our internal control over financial reporting (as defined in Rules 13a-15(f) or 15d-15(f)) during the quarter covered by this report that has materially affected, or is reasonably likely to materially affect, our internal control over financial reporting.
51
PART II. OTHER INFORMATION
None.
There has been no material changes in our risk factors from our disclosure in Item 1A of our December 31, 2015 annual report on Form 10-K.
|
|
|
| Total Number | Maximum Number |
|
|
|
| of Shares | of Shares that |
|
| Total |
| Purchased as | may yet be |
|
| Number of | Average | part of Publicly | Purchased Under |
Period | Shares | Price paid | Announced Plans | the Plans or | |
Beginning | Ending | Purchased | per Share | or Programs | Programs |
January 1, 2016 | January 31, 2016 | 2,221 (1) | $14.20 | --- | 1,934,735 |
February 1, 2016 | February 29, 2016 | 16,521 (1) | $14.09 | --- | 1,934,735 |
March 1, 2016 | March 31, 2016 | 5,541 (1) | $14.89 | --- | 1,934,735 |
Total for quarter ending March 31, 2016 | 24,283 | $14.28 | --- | 1,934,735 | |
| (1) | We did not repurchase any shares of our common stock during the first quarter of 2016 pursuant to our stock repurchase plan currently in place. We repurchased 24,283 shares of our common stock from our employees during the first quarter of 2016 for settlement of certain tax withholding obligations related to certain equity based compensation awards. |
Item 3. | Defaults Upon Senior Securities |
None.
None
Exhibit 31.1 |
| The Chairman, President and Chief Executive Officer’s certification required under section 302 of the Sarbanes-Oxley Act of 2002 |
Exhibit 31.2 |
|
The Chief Financial Officer’s certification required under section 302 of the Sarbanes-Oxley Act of 2002 |
Exhibit 32.1 |
|
The Chairman, President and Chief Executive Officer’s certification required under section 906 of the Sarbanes-Oxley Act of 2002 |
Exhibit 32.2 |
|
The Chief Financial Officer’s certification required under section 906 of the Sarbanes-Oxley Act of 2002 |
Exhibit 101.1 |
|
Interactive Data File |
101.INS |
|
XBRL Instance Document |
101.SCH |
|
XBRL Schema Document |
101.CAL |
|
XBRL Calculation Linkbase Document |
101.DEF |
|
XBRL Definition Linkbase Document |
101.LAB |
|
XBRL Label Linkbase Document |
101.PRE |
|
XBRL Presentation Linkbase Document |
52
SIGNATURES
In accordance with the requirements of the Securities Exchange Act of 1934, the Registrant has duly caused this report to be signed on its behalf by the undersigned thereunto duly authorized.
CENTERSTATE BANKS, INC.
(Registrant)
Date: May 4, 2016 |
|
|
| By: |
| /s/ John C. Corbett |
|
|
|
|
|
| John C. Corbett |
|
|
|
|
|
| President and Chief Executive Officer |
Date: May 4, 2016 |
|
|
| By: |
| /s/ James J. Antal |
|
|
|
|
|
| James J. Antal |
|
|
|
|
|
| Senior Vice President |
|
|
|
|
|
| and Chief Financial Officer |
53