U.S. SECURTIES AND EXCHANGE COMMISSION
Washington, D. C. 20549
Form 10-Q
(Mark One)
☒ | QUARTERLY REPORT PURSUANT TO SECTION 13 OR 15(d) OF THE SECURITIES EXCHANGE ACT OF 1934 |
For the quarterly period ended March 31, 2017
OR
☐ | TRANSITION REPORT PURSUANT TO SECTION 13 OR 15(d) OF THE SECURITIES EXCHANGE ACT OF 1934 |
For the transition period from to
Commission file number 000-32017
CENTERSTATE BANKS, INC.
(Exact Name of Registrant as Specified in Its Charter)
Florida | | 59-3606741 |
(State or Other Jurisdiction
of Incorporation or Organization) | | (I.R.S. Employer
Identification No.) |
1101 First Street South, Suite 202
Winter Haven, Florida 33880
(Address of Principal Executive Offices)
(863) 293-4710
(Issuer’s Telephone Number, Including Area Code)
Indicate by check mark whether the registrant (1) has filed all reports required to be filed by Section 13 or 15(d) of the Securities Exchange Act of 1934 during the preceding 12 months (or for such shorter period that the registrant was required to file such reports), and (2) has been subject to such filing requirements for the past 90 days. Yes ☒ No ☐
Indicate by check mark whether the registrant has submitted electronically and posted on its corporate Web site, if any, every Interactive Data File required to be submitted and posted pursuant to Rule 405 of Regulation S-T (§ 232.405 of this chapter) during the preceding 12 months (or for such shorter period that the registrant was required to submit and post such files). Yes ☒ No ☐
Indicate by check mark whether the registrant is a large accelerated filer, an accelerated filer, a non-accelerated filer, smaller reporting company, or an emerging growth company. See the definitions of “large accelerated filer,” “accelerated filer,” “smaller reporting company,” and “emerging growth company” in Rule 12b-2 of the Exchange Act.
Large accelerated filer | | ☐ | | Accelerated filer | | ☒ |
| | | |
Non-accelerated filer | | ☐ (Do not check if a small reporting company) | | Small reporting company | | ☐ |
| | | | | | |
Emerging growth company | | ☐ | | | | |
If an emerging growth company, indicate by check mark if the registrant has elected not to use the extended transition period for complying with any new or revised financial accounting standards provided pursuant to Section 13(a) of the Exchange Act. ☐
Indicate by check mark whether the registrant is a shell company (as defined in Rule 12b-2 of the Exchange Act). Yes ☐ No ☒
State the number of shares outstanding of each of the issuer’s classes of common stock, as of the latest practicable date:
| Common stock, par value $.01 per share | | | | 55,413,925 shares | |
(class) | | Outstanding at April 28, 2017 |
CENTERSTATE BANKS, INC. AND SUBSIDIARIES
INDEX
2
CenterState Banks, Inc. and Subsidiaries
CONDENSED CONSOLIDATED BALANCE SHEETS (unaudited)
(in thousands of dollars, except per share data)
| | March 31, 2017 | | | December 31, 2016 | |
ASSETS | | | | | | | | |
Cash and due from banks | | $ | 65,114 | | | $ | 66,368 | |
Federal funds sold and Federal Reserve Bank deposits | | | 214,369 | | | | 109,286 | |
Cash and cash equivalents | | | 279,483 | | | | 175,654 | |
Trading securities, at fair value | | | — | | | | 12,383 | |
Investment securities available for sale, at fair value | | | 819,352 | | | | 740,702 | |
Investment securities held to maturity (fair value of $238,348 and $242,693 | | | | | | | | |
at March 31, 2017 and December 31, 2016, respectively) | | | 243,812 | | | | 250,543 | |
Loans held for sale | | | 2,637 | | | | 2,285 | |
| | | | | | | | |
Loans, excluding purchased credit impaired | | | 3,343,946 | | | | 3,243,823 | |
Purchased credit impaired loans | | | 176,058 | | | | 185,924 | |
Allowance for loan losses | | | (27,819 | ) | | | (27,041 | ) |
Net Loans | | | 3,492,185 | | | | 3,402,706 | |
| | | | | | | | |
Bank premises and equipment, net | | | 115,400 | | | | 114,815 | |
Accrued interest receivable | | | 12,971 | | | | 12,112 | |
Federal Home Loan Bank and Federal Reserve Bank stock, at cost | | | 17,910 | | | | 17,669 | |
Goodwill | | | 106,028 | | | | 106,028 | |
Core deposit intangible, net | | | 14,785 | | | | 15,510 | |
Trust intangible, net | | | 665 | | | | 699 | |
Bank owned life insurance | | | 99,065 | | | | 98,424 | |
Other repossessed real estate owned | | | 7,201 | | | | 7,090 | |
Deferred income tax asset, net | | | 56,792 | | | | 63,208 | |
Bank property held for sale | | | 5,307 | | | | 8,599 | |
Interest rate swap derivatives, at fair value | | | 35,107 | | | | 31,817 | |
Prepaid expense and other assets | | | 20,296 | | | | 18,315 | |
TOTAL ASSETS | | $ | 5,328,996 | | | $ | 5,078,559 | |
| | | | | | | | |
LIABILITIES AND STOCKHOLDERS' EQUITY | | | | | | | | |
Deposits: | | | | | | | | |
Demand - non-interest bearing | | $ | 1,585,963 | | | $ | 1,426,624 | |
Demand - interest bearing | | | 893,945 | | | | 917,004 | |
Savings and money market accounts | | | 1,294,258 | | | | 1,263,479 | |
Time deposits | | | 522,957 | | | | 545,437 | |
Total deposits | | | 4,297,123 | | | | 4,152,544 | |
| | | | | | | | |
Securities sold under agreement to repurchase | | | 37,866 | | | | 28,427 | |
Federal funds purchased | | | 268,377 | | | | 261,986 | |
Corporate debentures | | | 26,016 | | | | 25,958 | |
Accrued interest payable | | | 711 | | | | 851 | |
Interest rate swap derivatives, at fair value | | | 35,979 | | | | 32,691 | |
Payables and accrued expenses | | | 28,523 | | | | 23,645 | |
Total liabilities | | | 4,694,595 | | | | 4,526,102 | |
| | | | | | | | |
Stockholders' equity: | | | | | | | | |
Common stock, $.01 par value: 100,000,000 shares | | | | | | | | |
authorized; 51,126,126 and 48,146,981 shares issued and outstanding | | | | | | | | |
at March 31, 2017 and December 31, 2016, respectively | | | 511 | | | | 482 | |
Additional paid-in capital | | | 495,642 | | | | 430,459 | |
Retained earnings | | | 143,623 | | | | 130,090 | |
Accumulated other comprehensive loss | | | (5,375 | ) | | | (8,574 | ) |
Total stockholders' equity | | | 634,401 | | | | 552,457 | |
| | | | | | | | |
TOTAL LIABILITIES AND STOCKHOLDERS' EQUITY | | $ | 5,328,996 | | | $ | 5,078,559 | |
See notes to the accompanying condensed consolidated financial statements
3
CenterState Banks, Inc. and Subsidiaries
CONDENSED CONSOLIDATED STATEMENTS OF OPERATIONS AND COMPREHENSIVE INCOME (unaudited)
(in thousands of dollars, except per share data)
| | Three months ended March 31, | |
| | 2017 | | | 2016 | |
Interest income: | | | | | | | | |
Loans | | $ | 44,249 | | | $ | 37,118 | |
Investment securities available for sale: | | | | | | | | |
Taxable | | | 5,001 | | | | 5,062 | |
Tax-exempt | | | 1,202 | | | | 780 | |
Federal funds sold and other | | | 651 | | | | 538 | |
| | | 51,103 | | | | 43,498 | |
Interest expense: | | | | | | | | |
Deposits | | | 1,897 | | | | 1,481 | |
Securities sold under agreement to repurchase | | | 30 | | | | 27 | |
Federal funds purchased | | | 537 | | | | 267 | |
Corporate debentures | | | 318 | | | | 248 | |
| | | 2,782 | | | | 2,023 | |
| | | | | | | | |
| | | | | | | | |
Net interest income | | | 48,321 | | | | 41,475 | |
Provision for loan losses | | | 995 | | | | 510 | |
Net interest income after loan loss provision | | | 47,326 | | | | 40,965 | |
| | | | | | | | |
| | | | | | | | |
Non interest income: | | | | | | | | |
Correspondent banking capital markets revenue | | | 5,376 | | | | 7,371 | |
Other correspondent banking related revenue | | | 1,073 | | | | 1,404 | |
Service charges on deposit accounts | | | 3,575 | | | | 2,736 | |
Debit, prepaid, ATM and merchant card related fees | | | 2,265 | | | | 2,046 | |
Wealth management related revenue | | | 893 | | | | 735 | |
FDIC indemnification income | | | — | | | | 96 | |
FDIC indemnification asset amortization | | | — | | | | (1,166 | ) |
Bank owned life insurance income | | | 641 | | | | 565 | |
Other non interest income | | | 679 | | | | 774 | |
Total other income | | | 14,502 | | | | 14,561 | |
See notes to the accompanying condensed consolidated financial statements.
4
CenterState Banks, Inc. and Subsidiaries
CONDENSED CONSOLIDATED STATEMENTS OF OPERATIONS AND COMPREHENSIVE INCOME (unaudited)
(in thousands of dollars, except per share data)
| | Three months ended March 31, | |
| | 2017 | | | 2016 | |
Non interest expense: | | | | | | | | |
Salaries, wages and employee benefits | | | 22,882 | | | | 21,455 | |
Occupancy expense | | | 2,749 | | | | 2,147 | |
Depreciation of premises and equipment | | | 1,684 | | | | 1,497 | |
Supplies, stationary and printing | | | 354 | | | | 299 | |
Marketing expenses | | | 852 | | | | 690 | |
Data processing expense | | | 1,826 | | | | 1,527 | |
Legal, audit and other professional fees | | | 888 | | | | 903 | |
Core deposit intangible ("CDI") amortization | | | 725 | | | | 643 | |
Postage and delivery | | | 428 | | | | 355 | |
ATM and debit card related expenses | | | 706 | | | | 596 | |
Bank regulatory expenses | | | 727 | | | | 810 | |
Gain on sale of repossessed real estate (“OREO”) | | | (104 | ) | | | (158 | ) |
Valuation write down of repossessed real estate (“OREO”) | | | 161 | | | | 22 | |
(Gain) loss on repossessed assets other than real estate | | | (7 | ) | | | 6 | |
Foreclosure related expenses | | | 605 | | | | 489 | |
Merger and acquisition related expenses | | | 870 | | | | 11,172 | |
Branch closure and efficiency initiatives | | | 77 | | | | 456 | |
Loss from termination of FDIC loss share agreements | | | — | | | | 17,560 | |
Other expenses | | | 2,620 | | | | 2,384 | |
Total other expenses | | | 38,043 | | | | 62,853 | |
| | | | | | | | |
Income (loss) before provision for income taxes | | | 23,785 | | | | (7,327 | ) |
Provision (benefit) for income taxes | | | 7,185 | | | | (2,523 | ) |
Net income (loss) | | $ | 16,600 | | | $ | (4,804 | ) |
| | | | | | | | |
Other comprehensive income, net of tax: | | | | | | | | |
Unrealized securities holding gain, net of income taxes | | $ | 3,199 | | | $ | 2,569 | |
Less: reclassified adjustments for gain included in net income, net of income taxes, of $0 and $0, respectively | | | — | | | | — | |
Net unrealized gain on available for sale securities, net of income taxes | | $ | 3,199 | | | $ | 2,569 | |
| | | | | | | | |
Total comprehensive income (loss) | | $ | 19,799 | | | $ | (2,235 | ) |
| | | | | | | | |
Earnings (loss) per share: | | | | | | | | |
Basic | | $ | 0.33 | | | $ | (0.10 | ) |
Diluted | | $ | 0.32 | | | $ | (0.10 | ) |
Common shares used in the calculation of earnings (loss) per share: | | | | | | | | |
Basic (1) | | | 50,632,011 | | | | 46,343,033 | |
Diluted (1) | | | 51,407,704 | | | | 46,343,033 | |
| (1) | Excludes participating shares. |
See notes to the accompanying condensed consolidated financial statements
5
CenterState Banks, Inc. and Subsidiaries
CONDENSED CONSOLIDATED STATEMENTS OF CHANGES IN STOCKHOLDERS’ EQUITY
For the three months ended March 31, 2017 and 2016 (unaudited)
(in thousands of dollars, except per share data)
| | | | | | | | | | | | | | | | | | Accumulated | | | | | |
| | Number of | | | | | | | Additional | | | | | | | other | | | Total | |
| | common | | | Common | | | paid in | | | Retained | | | comprehensive | | | stockholders' | |
| | shares | | | stock | | | capital | | | earnings | | | income (loss) | | | equity | |
Balances at January 1, 2016 | | | 45,459,195 | | | $ | 455 | | | $ | 393,191 | | | $ | 95,430 | | | $ | 1,438 | | | $ | 490,514 | |
| | | | | | | | | | | | | | | | | | | | | | | | |
Net loss | | | | | | | | | | | | | | | (4,804 | ) | | | | | | | (4,804 | ) |
Unrealized holding gain on | | | | | | | | | | | | | | | | | | | | | | | | |
available for sale securities, net of | | | | | | | | | | | | | | | | | | | | | | | | |
deferred income tax of $1,613 | | | | | | | | | | | | | | | | | | | 2,569 | | | | 2,569 | |
| | | | | | | | | | | | | | | | | | | | | | | | |
Dividends paid - common ($0.04 per share) | | | | | | | | | | | | | | | (1,918 | ) | | | | | | | (1,918 | ) |
Stock grants issued | | | 171,709 | | | | 1 | | | | 198 | | | | | | | | | | | | 199 | |
Stock based compensation expense | | | | | | | | | | | 1,080 | | | | | | | | | | | | 1,080 | |
Stock options exercised, including tax benefit | | | 59,980 | | | | 1 | | | | 302 | | | | | | | | | | | | 303 | |
Stock repurchase | | | (24,283 | ) | | | (1 | ) | | | (346 | ) | | | | | | | | | | | (347 | ) |
Stock issued pursuant to Community Bank acquisition | | | 2,276,042 | | | | 23 | | | | 31,842 | | | | | | | | | | | | 31,865 | |
Balances at March 31, 2016 | | | 47,942,643 | | | $ | 479 | | | $ | 426,267 | | | $ | 88,708 | | | $ | 4,007 | | | $ | 519,461 | |
| | | | | | | | | | | | | | | | | | | | | | | | |
| | | | | | | | | | | | | | | | | | | | | | | | |
Balances at January 1, 2017 | | | 48,146,981 | | | $ | 482 | | | $ | 430,459 | | | $ | 130,090 | | | $ | (8,574 | ) | | $ | 552,457 | |
| | | | | | | | | | | | | | | | | | | | | | | | |
Net income | | | | | | | | | | | | | | | 16,600 | | | | | | | | 16,600 | |
Unrealized holding gain on | | | | | | | | | | | | | | | | | | | | | | | | |
available for sale securities, net of | | | | | | | | | | | | | | | | | | | | | | | | |
deferred income tax of $2,009 | | | | | | | | | | | | | | | | | | | 3,199 | | | | 3,199 | |
| | | | | | | | | | | | | | | | | | | | | | | | |
Dividends paid - common ($0.06 per share) | | | | | | | | | | | | | | | (3,067 | ) | | | | | | | (3,067 | ) |
Stock grants issued | | | 199,718 | | | | 2 | | | | 204 | | | | | | | | | | | | 206 | |
Stock based compensation expense | | | | | | | | | | | 1,139 | | | | | | | | | | | | 1,139 | |
Stock options exercised | | | 114,901 | | | | 1 | | | | 1,347 | | | | | | | | | | | | 1,348 | |
Stock repurchase | | | (30,474 | ) | | | (1 | ) | | | (742 | ) | | | | | | | | | | | (743 | ) |
Stock issued pursuant to public offering, net of costs of $529 | | | 2,695,000 | | | | 27 | | | | 63,235 | | | | | | | | | | | | 63,262 | |
Balances at March 31, 2017 | | | 51,126,126 | | | $ | 511 | | | $ | 495,642 | | | $ | 143,623 | | | $ | (5,375 | ) | | $ | 634,401 | |
See notes to the accompanying condensed consolidated financial statements
6
CenterState Banks, Inc. and Subsidiaries
CONDENSED CONSOLIDATED STATEMENTS OF CASH FLOWS (unaudited)
(in thousands of dollars, except per share data)
| | Three months ended March 31, | |
| | 2017 | | | 2016 | |
Cash flows from operating activities: | | | | | | | | |
Net income (loss) | | $ | 16,600 | | | $ | (4,804 | ) |
Adjustments to reconcile net income to net cash provided by operating activities: | | | | | | | | |
Provision for loan losses | | | 995 | | | | 510 | |
Depreciation of premises and equipment | | | 1,684 | | | | 1,497 | |
Accretion of purchase accounting adjustments | | | (9,289 | ) | | | (9,523 | ) |
Net amortization of investment securities | | | 2,582 | | | | 2,061 | |
Net deferred loan origination fees | | | 384 | | | | (77 | ) |
Trading securities revenue | | | (81 | ) | | | (354 | ) |
Purchases of trading securities | | | (25,934 | ) | | | (47,734 | ) |
Proceeds from sale of trading securities | | | 38,398 | | | | 47,476 | |
Repossessed real estate owned valuation write down | | | 161 | | | | 22 | |
Gain on sale of repossessed real estate owned | | | (104 | ) | | | (158 | ) |
(Gain) loss on repossessed assets other than real estate | | | (7 | ) | | | 6 | |
Gain on sale of residential loans held for sale | | | (231 | ) | | | (98 | ) |
Residential loans originated and held for sale | | | (10,722 | ) | | | (5,425 | ) |
Proceeds from sale of residential loans held for sale | | | 10,601 | | | | 5,598 | |
Gain on disposal of bank property held for sale | | | (129 | ) | | | (2 | ) |
Impairment on bank property held for sale | | | 77 | | | | 458 | |
Gain on extinguishment of debt | | | — | | | | (308 | ) |
Gain on sale of small business administration loans | | | (14 | ) | | | — | |
Small business administration loans originated for sale | | | (326 | ) | | | — | |
Proceeds from sale of small business administration loans | | | 340 | | | | — | |
Deferred income taxes | | | 4,408 | | | | (9,979 | ) |
Tax deduction in excess of book deduction for stock awards | | | (1,083 | ) | | | — | |
Stock based compensation expense | | | 1,139 | | | | 1,080 | |
Bank owned life insurance income | | | (641 | ) | | | (565 | ) |
FDIC indemnification asset amortization | | | — | | | | 1,166 | |
Loss from termination of FDIC loss share agreements | | | — | | | | 17,560 | |
Net cash from changes in: | | | | | | | | |
Net changes in accrued interest receivable, prepaid expenses, and other assets | | | (5,065 | ) | | | (13,342 | ) |
Net change in accrued interest payable, accrued expense, and other liabilities | | | 8,280 | | | | 15,864 | |
Net cash provided by operating activities | | $ | 32,023 | | | | 929 | |
See notes to the accompanying condensed consolidated financial statements.
7
CenterState Banks, Inc. and Subsidiaries
CONDENSED CONSOLIDATED STATEMENTS OF CASH FLOWS (unaudited)
(in thousands of dollars, except per share data)
(continued)
| | Three months ended March 31, | |
| | 2017 | | | 2016 | |
Cash flows from investing activities: | | | | | | | | |
Available for sale securities: | | | | | | | | |
Purchases of investment securities | | $ | (5,000 | ) | | $ | — | |
Purchases of mortgage backed securities | | | (102,253 | ) | | | (122,807 | ) |
Proceeds from pay-downs of mortgage backed securities | | | 30,685 | | | | 21,486 | |
Proceeds from sales of investment securities | | | — | | | | 79,297 | |
Proceeds from sales of mortgage backed securities | | | — | | | | 62,418 | |
Proceeds from called investment securities | | | — | | | | 920 | |
Proceeds from maturities of investment securities | | | 1,000 | | | | — | |
Held to maturity securities: | | | | | | | | |
Purchases of investment securities | | | — | | | | (11,149 | ) |
Proceeds from called investment securities | | | — | | | | 20,600 | |
Proceeds from pay-downs of mortgage backed securities | | | 6,274 | | | | 6,227 | |
Purchases of FHLB and FRB stock | | | (241 | ) | | | — | |
Proceeds from sales of FHLB and FRB stock | | | — | | | | 29 | |
Net increase in loans | | | (82,699 | ) | | | (32,123 | ) |
Cash received from FDIC loss sharing agreements | | | — | | | | 5,482 | |
Purchases of premises and equipment, net | | | (2,269 | ) | | | (1,604 | ) |
Proceeds from sale of repossessed real estate | | | 1,656 | | | | 4,541 | |
Proceeds from sale of bank property held for sale | | | 3,344 | | | | 690 | |
�� Net cash from bank acquisitions | | | — | | | | 41,885 | |
Net cash (used in) provided by investing activities | | $ | (149,503 | ) | | $ | 75,892 | |
Cash flows from financing activities: | | | | | | | | |
Net increase in deposits | | | 144,691 | | | | 171,278 | |
Net increase in securities sold under agreement to repurchase | | | 9,439 | | | | 3,458 | |
Net increase in federal funds purchased | | | 6,391 | | | | 25,048 | |
Net decrease in other borrowings | | | — | | | | (56,768 | ) |
Extinguishment of debt | | | — | | | | (8,680 | ) |
Net (decrease) increase in payable to shareholders for acquisitions | | | (12 | ) | | | 342 | |
Stock options exercised | | | 1,348 | | | | 303 | |
Proceeds from stock offering, net of offering costs | | | 63,262 | | | | — | |
Stock repurchased | | | (743 | ) | | | (347 | ) |
Dividends paid | | | (3,067 | ) | | | (1,918 | ) |
Net cash provided by financing activities | | $ | 221,309 | | | $ | 132,716 | |
| | | | | | | | |
Net increase in cash and cash equivalents | | | 103,829 | | | | 209,537 | |
Cash and cash equivalents, beginning of period | | | 175,654 | | | | 152,482 | |
Cash and cash equivalents, end of period | | $ | 279,483 | | | $ | 362,019 | |
| | | | | | | | |
Transfer of loans to other real estate owned | | $ | 1,824 | | | $ | 2,372 | |
Transfers of bank property to held for sale | | $ | — | | | $ | 2,803 | |
| | | | | | | | |
Cash paid during the period for: | | | | | | | | |
Interest | | $ | 2,980 | | | $ | 1,421 | |
Income taxes | | $ | — | | | $ | 2,923 | |
See notes to the accompanying condensed consolidated financial statements.
8
CenterState Banks, Inc. and Subsidiaries
NOTES TO CONDENSED CONSOLIDATED FINANCIAL STATEMENTS (unaudited)
(in thousands of dollars, except per share data)
NOTE 1: Nature of operations and basis of presentation
The consolidated financial statements include the accounts of CenterState Banks, Inc. (the “Parent Company,” “Company” or “CSFL”), and its wholly owned subsidiary bank, CenterState Bank of Florida, N.A. (“CenterState” or “Bank”), and non bank subsidiaries, R4ALL, Inc. and CSFL Insurance Corp. As of March 31, 2017, the Bank provides traditional deposit and lending products and services to its commercial and retail customers through 69 full service banking locations in 24 counties throughout Florida.
The Bank also operates a correspondent banking and capital markets division headquartered in Winter Haven, Florida, although the majority of its bond salesmen, traders and operational personnel are physically housed in leased facilities located in Birmingham, Alabama, Atlanta, Georgia, Winston Salem, North Carolina and San Francisco, California. This division’s primary revenue generating activities are related to its capital markets division, which includes commissions earned on fixed income security sales, fees from hedging services, loan brokerage fees and consulting fees for services related to these activities; and its correspondent banking division, which includes spread income earned on correspondent bank deposits (i.e. federal funds purchased) and correspondent bank checking account deposits and fees from safe-keeping activities, bond accounting services for correspondents, asset/liability consulting related activities, international wires, and other clearing and corporate checking account services. The customer base includes small to medium size financial institutions primarily located in the Southeastern United States.
R4ALL, Inc. purchases troubled loans from the Bank and manages their eventual disposition. CSFL Insurance Corp. is a captive insurance subsidiary pursuant to Section 831(b) of the U.S. Tax Code.
The accompanying unaudited condensed consolidated financial statements have been prepared in accordance with accounting principles generally accepted in the United States of America for interim financial statements and with the instructions to Form 10-Q. Accordingly, they do not include all of the information and footnotes required by accounting principles generally accepted in the United States of America for complete financial statements. These statements should be read in conjunction with the consolidated financial statements included in the Annual Report on Form 10-K for the year ended December 31, 2016. In the Company’s opinion, all adjustments, consisting primarily of normal recurring adjustments, necessary for a fair presentation of the results for the interim periods have been made. The results of operations of the three month period ended March 31, 2017 are not necessarily indicative of the results expected for the full year.
Some items in the prior period financial statements were reclassified to conform to the current presentation. Reclassifications had no effect on prior period net income or shareholders’ equity.
9
CenterState Banks, Inc. and Subsidiaries
NOTES TO CONDENSED CONSOLIDATED FINANCIAL STATEMENTS (unaudited)
(in thousands of dollars, except per share data)
NOTE 2: Common stock outstanding and earnings per share data
The two-class method is used in the calculation of basic and diluted earnings per share. Under the two-class method, earnings available to common shareholders for the period are allocated between common shareholders and participating securities according to dividends declared (or accumulated) and participation rights in undistributed earnings. There were no anti-dilutive stock options for the three month period ending March 31, 2017. Stock options for 890,410 shares of common stock were not considered in computing diluted earnings per common share during the three month period ending March 31, 2016 because they were anti-dilutive. The following table presents the factors used in the earnings per share computations for the periods indicated.
| | Three months ended March 31, | |
| | 2017 | | | 2016 | |
Basic | | | | | | | | |
Net income (loss) available to common shareholders | | $ | 16,600 | | | $ | (4,804 | ) |
Less: Earnings allocated to participating securities | | | (41 | ) | | | — | |
Net income (loss) allocated to common shareholders | | $ | 16,559 | | | $ | (4,804 | ) |
| | | | | | | | |
Weighted average common shares outstanding | | | | | | | | |
including participating securities | | | 50,759,345 | | | | 46,343,033 | |
Less: Participating securities (1) | | | (127,334 | ) | | | — | |
Average shares | | | 50,632,011 | | | | 46,343,033 | |
Basic earnings (loss) per common share | | $ | 0.33 | | | $ | (0.10 | ) |
| | | | | | | | |
Diluted | | | | | | | | |
Net income (loss) available to common shareholders | | $ | 16,559 | | | $ | (4,804 | ) |
Weighted average common shares outstanding for | | | | | | | | |
basic earnings per common share | | | 50,632,011 | | | | 46,343,033 | |
Add: Dilutive effects of stock based compensation awards | | | 775,693 | | | | — | |
Average shares and dilutive potential common shares | | | 51,407,704 | | | | 46,343,033 | |
Diluted earnings (loss) per common share | | $ | 0.32 | | | $ | (0.10 | ) |
| 1. | Participating securities are restricted stock awards whereby the stock certificates have been issued, are included in outstanding shares, receive dividends and can be voted, but have not vested. |
NOTE 3: Fair value
Generally accepted accounting principles establish a fair value hierarchy which requires an entity to maximize the use of observable inputs and minimize the use of unobservable inputs when measuring fair value. The standard describes three levels of inputs that may be used to measure fair value:
Level 1: Quoted prices (unadjusted) for identical assets or liabilities in active markets that the entity has the ability to access as of the measurement date.
Level 2: Significant other observable inputs other than Level 1 prices such as quoted prices for similar assets or liabilities; quoted prices in markets that are not active; or other inputs that are observable or can be corroborated by observable market data.
Level 3: Significant unobservable inputs that reflect a reporting entity’s own assumptions about the assumptions that market participants would use in pricing and asset or liability.
The fair values of securities available for sale, excluding corporate debt securities, are determined by obtaining quoted prices on nationally recognized securities exchanges (Level 1 inputs) or matrix pricing, which is a mathematical technique widely used in the industry to value debt securities without relying exclusively on quoted prices for the specific securities but rather by relying on the securities’ relationship to other benchmark quoted securities (Level 2 inputs). The fair values of corporate debt securities are calculated using market indicators such as broker quotes (Level 2).
The fair values of trading securities are determined as follows: (1) for those securities that have traded prior to the date of the consolidated balance sheet but have not settled (date of sale) until after such date, the sales price is used as the fair value (Level 1); and, (2) for those securities which have not traded as of the date of the consolidated balance sheet, the fair value was determined by broker price indications of similar or same securities (Level 2).
10
CenterState Banks, Inc. and Subsidiaries
NOTES TO CONDENSED CONSOLIDATED FINANCIAL STATEMENTS (unaudited)
(in thousands of dollars, except per share data)
The fair value of derivatives is based on valuation models using observable market data as of the measurement date (Level 2). The derivatives are traded in an over-the-counter market where quoted market prices are not always available. Therefore, fair values of derivatives are determined using quantitative models that utilize multiple market inputs. The inputs will vary based on the type of derivative, but could include interest rates, prices and indices to generate continuous yield or pricing curves, prepayment rates,
and volatility factors to value the position. The majority of market inputs are actively quoted and can be validated through external sources, including brokers, market transactions and third-party pricing services.
Assets and liabilities measured at fair value on a recurring basis are summarized below.
| | | | | | Fair value measurements using |
| | | | | | Quoted prices | | Significant | | | |
| | | | | | in active | | other | | | Significant |
| | | | | | markets for | | observable | | | unobservable |
| | Carrying | | | identical assets | | inputs | | | inputs |
| | value | | | (Level 1) | | (Level 2) | | | (Level 3) |
at March 31, 2017 | | | | | | | | | | | | |
Assets: | | | | | | | | | | | | |
Available for sale securities | | | | | | | | | | | | |
Corporate debt securities | | $ | 5,000 | | | — | | $ | 5,000 | | | — |
Obligations of U.S. government sponsored entities and agencies | | | 9,515 | | | — | | | 9,515 | | | — |
Mortgage backed securities | | | 782,303 | | | — | | | 782,303 | | | — |
Municipal securities | | | 22,534 | | | — | | | 22,534 | | | — |
Interest rate swap derivatives | | | 35,107 | | | — | | | 35,107 | | | — |
| | | | | | | | | | | | |
Liabilities: | | | | | | | | | | | | |
Interest rate swap derivatives | | | 35,979 | | | — | | | 35,979 | | | — |
| | | | | | | | | | | | |
at December 31, 2016 | | | | | | | | | | | | |
Assets: | | | | | | | | | | | | |
Trading securities | | $ | 12,383 | | | — | | $ | 12,383 | | | — |
Available for sale securities | | | | | | | | | | | | |
U.S. Treasury securities | | | 1,001 | | | — | | | 1,001 | | | — |
Obligations of U.S. government sponsored entities and agencies | | | 9,301 | | | — | | | 9,301 | | | — |
Mortgage backed securities | | | 707,957 | | | — | | | 707,957 | | | — |
Municipal securities | | | 22,443 | | | — | | | 22,443 | | | — |
Interest rate swap derivatives | | | 31,817 | | | — | | | 31,817 | | | — |
| | | | | | | | | | | | |
Liabilities: | | | | | | | | | | | | |
Interest rate swap derivatives | | | 32,691 | | | — | | | 32,691 | | | — |
11
CenterState Banks, Inc. and Subsidiaries
NOTES TO CONDENSED CONSOLIDATED FINANCIAL STATEMENTS (unaudited)
(in thousands of dollars, except per share data)
The fair value of impaired loans with specific valuation allowance for loan losses and other real estate owned is based on recent real estate appraisals. For residential real estate impaired loans and other real estate owned, appraised values are based on the comparative sales approach. For commercial and commercial real estate impaired loans, and other real estate owned, appraisers may use either a single valuation approach or a combination of approaches such as comparative sales, cost or the income approach. A significant unobservable input in the income approach is the estimated income capitalization rate for a given piece of collateral. At March 31, 2017, the range of capitalization rates utilized to determine the fair value of the underlying collateral ranged from 7% to 10.5%. Adjustments to appraisals may be made by the appraiser to reflect local market conditions or other economic factors and may result in changes in the fair value of a given asset over time. As such, the fair value of impaired loans and other real estate owned are considered a Level 3 in the fair value hierarchy.
Assets and liabilities measured at fair value on a non-recurring basis are summarized below.
| | | | | | Fair value measurements using | |
| | | | | | | | Significant | | | | |
| | | | | | Quoted prices in | | other | | Significant | |
| | | | | | active markets for | | observable | | unobservable | |
| | Carrying | | | identical assets | | inputs | | inputs | |
| | value | | | (Level 1) | | (Level 2) | | (Level 3) | |
at March 31, 2017 | | | | | | | | | | | | |
Assets: | | | | | | | | | | | | |
Impaired loans | | | | | | | | | | | | |
Residential real estate | | $ | 2,401 | | | — | | — | | $ | 2,401 | |
Commercial real estate | | | 8,146 | | | — | | — | | | 8,146 | |
Land, land development and construction | | | 303 | | | — | | — | | | 303 | |
Commercial | | | 1,099 | | | — | | — | | | 1,099 | |
Consumer | | | 61 | | | — | | — | | | 61 | |
Other real estate owned | | | | | | | | | | | | |
Residential real estate | | | 842 | | | — | | — | | | 842 | |
Commercial real estate | | | 887 | | | — | | — | | | 887 | |
Land, land development and construction | | | 1,853 | | | — | | — | | | 1,853 | |
Bank property held for sale | | | 123 | | | — | | — | | | 123 | |
| | | | | | | | | | | | |
at December 31, 2016 | | | | | | | | | | | | |
Assets: | | | | | | | | | | | | |
Impaired loans | | | | | | | | | | | | |
Residential real estate | | $ | 2,937 | | | — | | — | | $ | 2,937 | |
Commercial real estate | | | 8,355 | | | — | | — | | | 8,355 | |
Land, land development and construction | | | 1,004 | | | — | | — | | | 1,004 | |
Commercial | | | 1,207 | | | — | | — | | | 1,207 | |
Consumer | | | 62 | | | — | | — | | | 62 | |
Other real estate owned | | | | | | | | | | | | |
Residential real estate | | | 137 | | | — | | — | | | 137 | |
Commercial real estate | | | 873 | | | — | | — | | | 873 | |
Land, land development and construction | | | 1,385 | | | — | | — | | | 1,385 | |
Bank property held for sale | | | 868 | | | — | | — | | | 868 | |
Impaired loans measured at fair value had a recorded investment of $12,334 with a valuation allowance of $324, at March 31, 2017, and a recorded investment of $13,951, with a valuation allowance of $386, at December 31, 2016. The Company recorded a provision for loan loss expense of $87 on these loans during the three month period ending March 31, 2017. The Company recorded a provision for loan loss expense of $115 on impaired loans carried at fair value during the three month period ending March 31, 2016.
Other real estate owned had a decline in fair value of $161 and $22 during the three month periods ending March 31, 2017 and 2016, respectively. Changes in fair value were recorded directly to current earnings through non interest expense.
12
CenterState Banks, Inc. and Subsidiaries
NOTES TO CONDENSED CONSOLIDATED FINANCIAL STATEMENTS (unaudited)
(in thousands of dollars, except per share data)
Bank property held for sale represents certain branch office buildings which the Company has closed and consolidated with other existing branches. The real estate was transferred out of the Bank Premises and Equipment category into bank property held for sale at the lower of amortized cost or fair value less estimated costs to sell. The fair values were based upon appraisals. The Company recognized an impairment charge, net of recoveries and gains on sale, of ($52) and $456 during the three month periods ending March 31, 2017 and 2016, respectively, related to bank properties held for sale.
Fair Value of Financial Instruments
The methods and assumptions, not previously presented, used to estimate fair value are described as follows:
Cash and Cash Equivalents: The carrying amounts of cash and cash equivalents approximate fair values and are classified as Level 1.
FHLB and FRB Stock: It is not practical to determine the fair value of FHLB and FRB stock due to restrictions placed on their transferability.
Investment securities held to maturity: The fair values of securities held to maturity are determined by obtaining quoted prices on nationally recognized securities exchanges (Level 1 inputs) or matrix pricing, which is a mathematical technique widely used in the industry to value debt securities without relying exclusively on quoted prices for the specific securities but rather by relying on the securities’ relationship to other benchmark quoted securities (Level 2 inputs).
Loans held for sale: The fair value of loans held for sale is estimated based upon binding contracts from third party investors resulting in a Level 2 classification.
Loans, net: Fair values of loans, excluding loans held for sale, are estimated as follows: For variable rate loans that reprice frequently and with no significant change in credit risk, fair values are based on carrying values resulting in a Level 3 classification. Fair values for other loans are estimated using discounted cash flow analyses, using interest rates currently being offered for loans with similar terms to borrowers of similar credit quality resulting in a Level 3 classification. Impaired loans are valued as described previously. The methods utilized to estimate the fair value of loans do not necessarily represent an exit price.
Accrued Interest Receivable: The carrying amount of accrued interest receivable approximates fair value and is classified as Level 2 for accrued interest receivable related to investment securities and Level 3 for accrued interest receivable related to loans.
Deposits: The fair values disclosed for demand deposits (e.g., interest and non-interest checking, savings, and money market accounts) are, by definition, equal to the amount payable on demand at the reporting date (i.e., their carrying amount) resulting in Level 1 classification. Fair values for fixed rate certificates of deposit are estimated using a discounted cash flows calculation that applies interest rates currently being offered on certificates to a schedule of aggregated expected monthly maturities on time deposits resulting in a Level 2 classification.
Short-term Borrowings: The carrying amounts of federal funds purchased, borrowings under repurchase agreements, and other short-term borrowings, generally maturing within ninety days, approximate their fair values resulting in a Level 2 classification.
Corporate Debentures: The fair values of the Company’s corporate debentures are estimated using discounted cash flow analyses based on the current borrowing rates for similar types of borrowing arrangements resulting in a Level 3 classification.
Accrued Interest Payable: The carrying amount of accrued interest payable approximates fair value resulting in a Level 2 classification.
Off-balance Sheet Instruments: The fair value of off-balance-sheet items is not considered material.
13
CenterState Banks, Inc. and Subsidiaries
NOTES TO CONDENSED CONSOLIDATED FINANCIAL STATEMENTS (unaudited)
(in thousands of dollars, except per share data)
The following table presents the carry amounts and estimated fair values of the Company’s financial instruments:
| | | | | | Fair value measurements | | | | | |
at March 31, 2017 | | Carrying amount | | | Level 1 | | | Level 2 | | | Level 3 | | | Total | |
Financial assets: | | | | | | | | | | | | | | | | | | | | |
Cash and cash equivalents | | $ | 279,483 | | | $ | 279,483 | | | $ | — | | | $ | — | | | $ | 279,483 | |
Trading securities | | | — | | | | — | | | | — | | | | — | | | | — | |
Investment securities available for sale | | | 819,352 | | | | — | | | | 819,352 | | | | — | | | | 819,352 | |
Investment securities held to maturity | | | 243,812 | | | | — | | | | 238,348 | | | | — | | | | 238,348 | |
FHLB and FRB stock | | | 17,910 | | | | — | | | | — | | | | — | | | n/a | |
Loans held for sale | | | 2,637 | | | | — | | | | 2,637 | | | | — | | | | 2,637 | |
Loans, less allowance for loan losses of $27,819 | | | 3,492,185 | | | | — | | | | — | | | | 3,480,845 | | | | 3,480,845 | |
Interest rate swap derivatives | | | 35,107 | | | | — | | | | 35,107 | | | | — | | | | 35,107 | |
Accrued interest receivable | | | 12,971 | | | | — | | | | 4,220 | | | | 8,751 | | | | 12,971 | |
| | | | | | | | | | | | | | | | | | | | |
Financial liabilities: | | | | | | | | | | | | | | | | | | | | |
Deposits- without stated maturities | | $ | 3,774,166 | | | $ | 3,774,166 | | | $ | — | | | $ | — | | | $ | 3,774,166 | |
Deposits- with stated maturities | | | 522,957 | | | | — | | | | 525,196 | | | | — | | | | 525,196 | |
Securities sold under agreement to repurchase | | | 37,866 | | | | — | | | | 37,866 | | | | — | | | | 37,866 | |
Federal funds purchased | | | 268,377 | | | | — | | | | 268,377 | | | | — | | | | 268,377 | |
Corporate debentures | | | 26,016 | | | | — | | | | — | | | | 22,496 | | | | 22,496 | |
Interest rate swap derivatives | | | 35,979 | | | | — | | | | 35,979 | | | | — | | | | 35,979 | |
Accrued interest payable | | | 711 | | | | — | | | | 711 | | | | — | | | | 711 | |
| | | | | | | | | | | | | | | | | | | | |
| | | | | | Fair value measurements | | | | | |
at December 31, 2016 | | Carrying amount | | | Level 1 | | | Level 2 | | | Level 3 | | | Total | |
Financial assets: | | | | | | | | | | | | | | | | | | | | |
Cash and cash equivalents | | $ | 175,654 | | | $ | 175,654 | | | $ | — | | | $ | — | | | $ | 175,654 | |
Trading securities | | | 12,383 | | | | — | | | | 12,383 | | | | — | | | | 12,383 | |
Investment securities available for sale | | | 740,702 | | | | — | | | | 740,702 | | | | — | | | | 740,702 | |
Investment securities held to maturity | | | 250,543 | | | | — | | | | 242,693 | | | | — | | | | 242,693 | |
FHLB and FRB stock | | | 17,669 | | | | — | | | | — | | | | — | | | n/a | |
Loans held for sale | | | 2,285 | | | | — | | | | 2,285 | | | | — | | | | 2,285 | |
Loans, less allowance for loan losses of $27,041 | | | 3,402,706 | | | | — | | | | — | | | | 3,395,975 | | | | 3,395,975 | |
Interest rate swap derivatives | | | 31,817 | | | | — | | | | 31,817 | | | | — | | | | 31,817 | |
Accrued interest receivable | | | 12,112 | | | | — | | | | 3,979 | | | | 8,133 | | | | 12,112 | |
| | | | | | | | | | | | | | | | | | | | |
Financial liabilities: | | | | | | | | | | | | | | | | | | | | |
Deposits- without stated maturities | | $ | 3,607,107 | | | $ | 3,607,107 | | | $ | — | | | $ | — | | | $ | 3,607,107 | |
Deposits- with stated maturities | | | 545,437 | | | | — | | | | 547,570 | | | | — | | | | 547,570 | |
Securities sold under agreement to repurchase | | | 28,427 | | | | — | | | | 28,427 | | | | — | | | | 28,427 | |
Federal funds purchased | | | 261,986 | | | | — | | | | 261,986 | | | | — | | | | 261,986 | |
Corporate debentures | | | 25,958 | | | | — | | | | — | | | | 22,363 | | | | 22,363 | |
Interest rate swap derivatives | | | 32,691 | | | | — | | | | 32,691 | | | | — | | | | 32,691 | |
Accrued interest payable | | | 851 | | | | — | | | | 851 | | | | — | | | | 851 | |
14
CenterState Banks, Inc. and Subsidiaries
NOTES TO CONDENSED CONSOLIDATED FINANCIAL STATEMENTS (unaudited)
(in thousands of dollars, except per share data)
NOTE 4: Reportable segments
The Company’s reportable segments represent the distinct product lines the Company offers and are viewed separately for strategic planning purposes by management. The table below is a reconciliation of the reportable segment revenues, expenses, and profit to the Company’s consolidated total for the three month periods ending March 31, 2017 and 2016.
| Three month period ending March 31, 2017 | | | | | | | | | |
| | | | | Correspondent | | | Corporate | | | | | | | | | |
| Commercial | | | banking and | | | overhead | | | | | | | | | |
| and retail | | | capital markets | | | and | | | Elimination | | | | | |
| banking | | | division | | | administration | | | entries | | | Total | |
Interest income | $ | 48,471 | | | $ | 2,632 | | | $ | — | | | $ | — | | | $ | 51,103 | |
Interest expense | | (1,927 | ) | | | (537 | ) | | | (318 | ) | | | — | | | | (2,782 | ) |
Net interest income (expense) | | 46,544 | | | | 2,095 | | | | (318 | ) | | | — | | | | 48,321 | |
Provision for loan losses | | (1,024 | ) | | | 29 | | | | — | | | | — | | | | (995 | ) |
Non interest income | | 8,053 | | | | 6,449 | | | | — | | | | — | | | | 14,502 | |
Non interest expense | | (32,443 | ) | | | (4,746 | ) | | | (854 | ) | | | — | | | | (38,043 | ) |
Net income (loss) before taxes | | 21,130 | | | | 3,827 | | | | (1,172 | ) | | | — | | | | 23,785 | |
Income tax (provision) benefit | | (6,414 | ) | | | (1,476 | ) | | | 705 | | | | — | | | | (7,185 | ) |
Net income (loss) | $ | 14,716 | | | $ | 2,351 | | | $ | (467 | ) | | $ | — | | | $ | 16,600 | |
Total assets | $ | 4,858,409 | | | $ | 465,219 | | | $ | 666,542 | | | $ | (661,174 | ) | | $ | 5,328,996 | |
| Three month period ending March 31, 2016 | | | | | | | | | |
| | | | | Correspondent | | | Corporate | | | | | | | | | |
| Commercial | | | banking and | | | overhead | | | | | | | | | |
| and retail | | | capital markets | | | and | | | Elimination | | | | | |
| banking | | | division | | | administration | | | entries | | | Total | |
Interest income | | 41,434 | | | | 2,064 | | | $ | — | | | $ | — | | | | 43,498 | |
Interest expense | | (1,513 | ) | | | (262 | ) | | | (248 | ) | | | — | | | | (2,023 | ) |
Net interest income (expense) | | 39,921 | | | | 1,802 | | | | (248 | ) | | | — | | | | 41,475 | |
Provision for loan losses | | (458 | ) | | | (52 | ) | | | — | | | | — | | | | (510 | ) |
Non interest income | | 5,478 | | | | 8,775 | | | | 308 | | | | — | | | | 14,561 | |
Non interest expense | | (56,022 | ) | | | (5,782 | ) | | | (1,049 | ) | | | — | | | | (62,853 | ) |
Net income (loss) before taxes | | (11,081 | ) | | | 4,743 | | | | (989 | ) | | | — | | | | (7,327 | ) |
Income tax (provision) benefit | | 3,983 | | | | (1,830 | ) | | | 370 | | | | — | | | | 2,523 | |
Net income (loss) | | (7,098 | ) | | | 2,913 | | | | (619 | ) | | $ | — | | | | (4,804 | ) |
Total assets | | 4,596,420 | | | | 366,956 | | | | 552,369 | | | | (546,090 | ) | | | 4,969,655 | |
Commercial and retail banking: The Company’s primary business is commercial and retail banking. Currently, the Company operates primarily through the Bank providing traditional deposit and lending products and services to its commercial and retail customers through 69 full service banking locations in 24 counties throughout Florida.
Correspondent banking and capital markets division: Operating as a division of our Bank, the correspondent area’s primary revenue generating activities are related to the capital markets division which includes commissions earned on fixed income security sales, fees from hedging services, loan brokerage fees and consulting fees for services related to these activities. Income generated related to the correspondent banking services includes spread income earned on correspondent bank deposits (i.e. federal funds purchased) and fees generated from safe-keeping activities, bond accounting services, asset/liability consulting services, international wires, clearing and corporate checking account services and other correspondent banking related services. The fees derived from the correspondent banking services are less volatile than those generated through the capital markets group. The customer base includes small to medium size financial institutions primarily located in Southeastern United States.
Corporate overhead and administration: Corporate overhead and administration is comprised primarily of compensation and benefits for certain members of management, interest on parent company debt, office occupancy and depreciation of parent company facilities, certain merger related costs and other expenses.
15
CenterState Banks, Inc. and Subsidiaries
NOTES TO CONDENSED CONSOLIDATED FINANCIAL STATEMENTS (unaudited)
(in thousands of dollars, except per share data)
NOTE 5: Investment securities
Available-for-Sale
All of the mortgage backed securities listed below were issued by U.S. government sponsored entities and agencies, primarily Fannie Mae, Freddie Mac and Ginnie Mae, institutions which the government has affirmed its commitment to support. The fair value of available for sale securities and the related gross unrealized gains and losses recognized in accumulated other comprehensive income (loss) were as follows:
| | March 31, 2017 | |
| | | | | | Gross | | | Gross | | | | | |
| | Amortized | | | Unrealized | | | Unrealized | | | Fair | |
| | Cost | | | Gains | | | Losses | | | Value | |
Corporate debt securities | | $ | 5,000 | | | $ | — | | | $ | — | | | $ | 5,000 | |
Obligations of U.S. government sponsored entities and agencies | | | 10,013 | | | | — | | | | 498 | | | | 9,515 | |
Mortgage backed securities | | | 791,193 | | | | 2,287 | | | | 11,177 | | | | 782,303 | |
Municipal securities | | | 21,898 | | | | 657 | | | | 21 | | | | 22,534 | |
Total available-for-sale | | $ | 828,104 | | | $ | 2,944 | | | $ | 11,696 | | | $ | 819,352 | |
| | | | | | | | | | | | | | | | |
| | | | | | | | | | | | | | | | |
| | December 31, 2016 | |
| | | | | | Gross | | | Gross | | | | | |
| | Amortized | | | Unrealized | | | Unrealized | | | Fair | |
| | Cost | | | Gains | | | Losses | | | Value | |
U.S. Treasury securities | | $ | 1,000 | | | $ | 1 | | | $ | — | | | $ | 1,001 | |
Obligations of U.S. government sponsored entities and agencies | | | 10,027 | | | | — | | | | 726 | | | | 9,301 | |
Mortgage backed securities | | | 721,657 | | | | 1,795 | | | | 15,495 | | | | 707,957 | |
Municipal securities | | | 21,976 | | | | 505 | | | | 38 | | | | 22,443 | |
Total available-for-sale | | $ | 754,660 | | | $ | 2,301 | | | $ | 16,259 | | | $ | 740,702 | |
The cost of securities sold is determined using the specific identification method. The securities sold during the first quarter of 2016 were securities acquired through the acquisitions of Community Bank of South Florida, Inc. (“Community”) and Hometown of Homestead Banking Company (“Hometown”) on March 1, 2016. These acquired securities were marked to fair value and subsequently sold after the acquisition date, and no gain or loss was recognized from the sale of these securities. Sales of available for sale securities for the three months ended March 31, 2017 and 2016 were as follows:
For the nine months ended: | | March 31, 2017 | | | March 31, 2016 | |
Proceeds | | $ | — | | | $ | 141,715 | |
Gross gains | | | — | | | | — | |
Gross losses | | | — | | | | — | |
The tax provision related to these net realized gains was $0 and $0, respectively.
The fair value of available for sale securities at March 31, 2017 by contractual maturity were as follows. Securities not due at a single maturity date, primarily mortgage-backed securities, are shown separately.
| | Fair | | | Amortized | |
Investment securities available for sale: | | Value | | | Cost | |
Due after one year through five years | | $ | 4,371 | | | $ | 4,188 | |
Due after five years through ten years | | | 11,920 | | | | 11,787 | |
Due after ten years through thirty years | | | 20,758 | | | | 20,936 | |
Mortgage backed securities | | | 782,303 | | | | 791,193 | |
Total available-for-sale | | $ | 819,352 | | | $ | 828,104 | |
Available for sale securities pledged at March 31, 2017 and December 31, 2016 had a carrying amount (estimated fair value) of $245,887 and $220,560 respectively. These securities were pledged primarily to secure public deposits and repurchase agreements.
16
CenterState Banks, Inc. and Subsidiaries
NOTES TO CONDENSED CONSOLIDATED FINANCIAL STATEMENTS (unaudited)
(in thousands of dollars, except per share data)
At March 31, 2017 and December 31, 2016, there were no holdings of securities of any one issuer, other than mortgage backed securities issued by U.S. Government sponsored entities, in an amount greater than 10% of stockholders’ equity.
The following tables show the Company’s available for sale investments’ gross unrealized losses and fair value, aggregated by investment category and length of time that individual securities have been in a continuous unrealized loss position, at March 31, 2017 and December 31, 2016.
| | March 31, 2017 | |
| | Less than 12 months | | | 12 months or more | | | Total | |
| | Fair | | | Unrealized | | | Fair | | | Unrealized | | | Fair | | | Unrealized | |
| | Value | | | Losses | | | Value | | | Losses | | | Value | | | Losses | |
Obligations of U.S. government sponsored entities and agencies | | $ | 9,515 | | | $ | 498 | | | $ | — | | | $ | — | | | $ | 9,515 | | | $ | 498 | |
Mortgage backed securities | | | 537,827 | | | | 9,918 | | | | 30,508 | | | | 1,259 | | | | 568,335 | | | | 11,177 | |
Municipal securities | | | 2,092 | | | | 21 | | | | — | | | | — | | | | 2,092 | | | | 21 | |
Total temporarily impaired available-for-sale securities | | $ | 549,434 | | | $ | 10,437 | | | $ | 30,508 | | | $ | 1,259 | | | $ | 579,942 | | | $ | 11,696 | |
| | | | | | | | | | | | | | | | | | | | | | | | |
| | December 31, 2016 | |
| | Less than 12 months | | | 12 months or more | | | Total | |
| | Fair | | | Unrealized | | | Fair | | | Unrealized | | | Fair | | | Unrealized | |
| | Value | | | Losses | | | Value | | | Losses | | | Value | | | Losses | |
Obligations of U.S. government sponsored entities and agencies | | $ | 9,301 | | | $ | 726 | | | $ | — | | | $ | — | | | $ | 9,301 | | | $ | 726 | |
Mortgage backed securities | | | 591,064 | | | | 13,941 | | | | 31,121 | | | | 1,554 | | | | 622,185 | | | | 15,495 | |
Municipal securities | | | 2,081 | | | | 38 | | | | — | | | | — | | | | 2,081 | | | | 38 | |
Total temporarily impaired available-for-sale securities | | $ | 602,446 | | | $ | 14,705 | | | $ | 31,121 | | | $ | 1,554 | | | $ | 633,567 | | | $ | 16,259 | |
At March 31, 2017, 100% of the mortgage-backed securities held by the Company were issued by U.S. government-sponsored entities and agencies, primarily Fannie Mae, Freddie Mac, and Ginnie Mae, institutions which the government has affirmed its commitment to support. Because the decline in fair value is attributable to changes in interest rates and illiquidity, and not credit quality, and because the Company does not have the intent to sell these mortgage-backed securities and it is likely that it will not be required to sell the securities before their anticipated recovery, the Company does not consider these securities to be other-than-temporarily impaired at March 31, 2017.
Unrealized losses on municipal securities have not been recognized into income because the issuers bonds are of high quality, and because management does not intend to sell these investments or more likely than not will not be required to sell these investments before their anticipated recovery. The fair value is expected to recover as the securities approach maturity.
Held-to-Maturity
The following reflects the fair value of held-to-maturity securities and the related gross unrecognized gains and losses as of March 31, 2017 and December 31, 2016.
| | March 31, 2017 | |
| | | | | | Gross | | | Gross | | | | | |
| | Amortized | | | Unrecognized | | | Unrecognized | | | Fair | |
| | Cost | | | Gains | | | Losses | | | Value | |
Mortgage backed securities | | $ | 113,763 | | | $ | — | | | $ | 1,098 | | | $ | 112,665 | |
Municipal securities | | | 130,049 | | | | 734 | | | | 5,100 | | | | 125,683 | |
Total held-to-maturity | | $ | 243,812 | | | $ | 734 | | | $ | 6,198 | | | $ | 238,348 | |
| | | | | | | | | | | | | | | | |
| | December 31, 2016 | |
| | | | | | Gross | | | Gross | | | | | |
| | Amortized | | | Unrecognized | | | Unrecognized | | | Fair | |
| | Cost | | | Gains | | | Losses | | | Value | |
Mortgage backed securities | | $ | 120,367 | | | $ | — | | | $ | 1,986 | | | $ | 118,381 | |
Municipal securities | | | 130,176 | | | | 434 | | | | 6,298 | | | | 124,312 | |
Total held to maturity | | $ | 250,543 | | | $ | 434 | | | $ | 8,284 | | | $ | 242,693 | |
17
CenterState Banks, Inc. and Subsidiaries
NOTES TO CONDENSED CONSOLIDATED FINANCIAL STATEMENTS (unaudited)
(in thousands of dollars, except per share data)
Held-to-maturity securities pledged at March 31, 2017 and December 31, 2016 had a carrying amount of $26,175 and $27,757 respectively. These securities were pledged primarily to secure public deposits and repurchase agreements.
At March 31, 2017, there were no holdings of held-to-maturity securities of any one issuer in an amount greater than 10% of stockholders’ equity.
The fair value and amortized cost of held-to-maturity securities at March 31, 2017 by contractual maturity were as follows. Mortgage-backed securities are not due at a single maturity date and are shown separately.
| | Fair | | | Amortized | |
Investment securities held-to-maturity | | Value | | | Cost | |
Due after five years through ten years | | $ | 1,541 | | | $ | 1,538 | |
Due after ten years through thirty years | | | 124,142 | | | | 128,511 | |
Mortgage backed securities | | | 112,665 | | | | 113,763 | |
Total held-to-maturity | | $ | 238,348 | | | $ | 243,812 | |
The following table shows the Company’s held-to-maturity investments’ gross unrecognized losses and fair value, aggregated by investment category and length of time the individual securities have been in a continuous unrecognized loss position, at March 31, 2017 and December 31, 2016.
| | March 31, 2017 | |
| | Less than 12 months | | | 12 months or more | | | Total | |
| | Fair | | | Unrecognized | | | Fair | | | Unrecognized | | | Fair | | | Unrecognized | |
| | Value | | | Losses | | | Value | | | Losses | | | Value | | | Losses | |
Mortgage backed securities | | $ | 112,665 | | | $ | 1,098 | | | $ | — | | | $ | — | | | $ | 112,665 | | | $ | 1,098 | |
Municipal securities | | | 85,969 | | | | 5,100 | | | | — | | | | — | | | | 85,969 | | | | 5,100 | |
Total temporarily impaired held-to-maturity securities | | $ | 198,634 | | | $ | 6,198 | | | $ | — | | | $ | — | | | $ | 198,634 | | | $ | 6,198 | |
| | | | | | | | | | | | | | | | | | | | | | | | |
| | December 31, 2016 | |
| | Less than 12 months | | | 12 months or more | | | Total | |
| | Fair | | | Unrecognized | | | Fair | | | Unrecognized | | | Fair | | | Unrecognized | |
| | Value | | | Losses | | | Value | | | Losses | | | Value | | | Losses | |
Mortgage backed securities | | $ | 118,381 | | | $ | 1,986 | | | $ | — | | | $ | — | | | $ | 118,381 | | | $ | 1,986 | |
Municipal securities | | | 95,552 | | | | 6,298 | | | | — | | | | — | | | | 95,552 | | | | 6,298 | |
Total temporarily impaired held-to-maturity securities | | $ | 213,933 | | | $ | 8,284 | | | $ | — | | | $ | — | | | $ | 213,933 | | | $ | 8,284 | |
At March 31, 2017, 100% of the mortgage-backed securities held by the Company were issued by U.S. government-sponsored entities and agencies, primarily Fannie Mae, Freddie Mac, and Ginnie Mae, institutions which the government has affirmed its commitment to support. Because the decline in fair value is attributable to changes in interest rates and illiquidity, and not credit quality, and because the Company does not have the intent to sell these mortgage-backed securities and it is likely that it will not be required to sell the securities before their anticipated recovery, the Company does not consider these securities to be other-than-temporarily impaired at March 31, 2017.
Unrealized losses on municipal securities have not been recognized into income because the issuers bonds are of high quality, and because management does not intend to sell these investments or more likely than not will not be required to sell these investments before their anticipated recovery. The fair value is expected to recover as the securities approach maturity.
18
CenterState Banks, Inc. and Subsidiaries
NOTES TO CONDENSED CONSOLIDATED FINANCIAL STATEMENTS (unaudited)
(in thousands of dollars, except per share data)
NOTE 6: Loans
The following table sets forth information concerning the loan portfolio by collateral types as of the dates indicated.
| | March 31, 2017 | | | December 31, 2016 | |
Loans excluding PCI loans | | | | | | | | |
Real estate loans | | | | | | | | |
Residential | | $ | 818,537 | | | $ | 816,304 | |
Commercial | | | 1,824,100 | | | | 1,755,922 | |
Land, development and construction | | | 148,585 | | | | 142,044 | |
Total real estate | | | 2,791,222 | | | | 2,714,270 | |
Commercial | | | 462,925 | | | | 439,540 | |
Consumer and other loans | | | 88,941 | | | | 89,538 | |
Loans before unearned fees and deferred cost | | | 3,343,088 | | | | 3,243,348 | |
Net unearned fees and costs | | | 858 | | | | 475 | |
Total loans excluding PCI loans | | | 3,343,946 | | | | 3,243,823 | |
PCI loans (note 1) | | | | | | | | |
Real estate loans | | | | | | | | |
Residential | | | 67,234 | | | | 72,179 | |
Commercial | | | 94,751 | | | | 99,566 | |
Land, development and construction | | | 9,522 | | | | 9,944 | |
Total real estate | | | 171,507 | | | | 181,689 | |
Commercial | | | 4,177 | | | | 3,825 | |
Consumer and other loans | | | 374 | | | | 410 | |
Total PCI loans | | | 176,058 | | | | 185,924 | |
Total loans | | | 3,520,004 | | | | 3,429,747 | |
Allowance for loan losses for loans that are not PCI loans | | | (27,521 | ) | | | (26,569 | ) |
Allowance for loan losses for PCI loans | | | (298 | ) | | | (472 | ) |
Total loans, net of allowance for loan losses | | $ | 3,492,185 | | | $ | 3,402,706 | |
note 1: | Purchased credit impaired (“PCI”) loans are being accounted for pursuant to ASC Topic 310-30. |
The table below set forth the activity in the allowance for loan losses for the periods presented.
| | Allowance for loan losses for loans that are not PCI loans | | | Allowance for loan losses on PCI loans | | | Total | |
Three months ended March 31, 2017 | | | | | | | | | | | | |
Balance at beginning of period | | $ | 26,569 | | | $ | 472 | | | $ | 27,041 | |
Loans charged-off | | | (902 | ) | | | — | | | | (902 | ) |
Recoveries of loans previously charged-off | | | 685 | | | | — | | | | 685 | |
Net charge-offs | | | (217 | ) | | | — | | | | (217 | ) |
Provision for loan losses | | | 1,169 | | | | (174 | ) | | | 995 | |
Balance at end of period | | $ | 27,521 | | | $ | 298 | | | $ | 27,819 | |
| | | | | | | | | | | | |
Three months ended March 31, 2016 | | | | | | | | | | | | |
Balance at beginning of period | | $ | 22,143 | | | $ | 121 | | | $ | 22,264 | |
Loans charged-off | | | (495 | ) | | | — | | | | (495 | ) |
Recoveries of loans previously charged-off | | | 843 | | | | — | | | | 843 | |
Net recoveries | | | 348 | | | | — | | | | 348 | |
Provision for loan losses | | | 511 | | | | (1 | ) | | | 510 | |
Balance at end of period | | $ | 23,002 | | | $ | 120 | | | $ | 23,122 | |
19
CenterState Banks, Inc. and Subsidiaries
NOTES TO CONDENSED CONSOLIDATED FINANCIAL STATEMENTS (unaudited)
(in thousands of dollars, except per share data)
The following tables present the activity in the allowance for loan losses by portfolio segment for the periods presented.
| | Real Estate Loans | | | | | | | | | | | | | |
| | Residential | | | Commercial | | | Land, develop., constr. | | | Comm. & industrial | | | Consumer & other | | | Total | |
| | | | | | | | | | | | | | | | | | | | | | | | |
Allowance for loan losses for loans that are not PCI loans: | | | | | | | | | | | | | | | | | | | | | |
| | | | | | | | | | | | | | | | | | | | | | | | |
Three months ended March 31, 2017 | | | | | | | | | | | | | | | | | | | | | | | | |
Beginning of the period | | $ | 5,640 | | | $ | 14,713 | | | $ | 883 | | | $ | 3,785 | | | $ | 1,548 | | | $ | 26,569 | |
Charge-offs | | | (86 | ) | | | (14 | ) | | | — | | | | (528 | ) | | | (274 | ) | | | (902 | ) |
Recoveries | | | 216 | | | | 279 | | | | 37 | | | | 53 | | | | 100 | | | | 685 | |
Provision for loan losses | | | (7 | ) | | | 635 | | | | 143 | | | | 234 | | | | 164 | | | | 1,169 | |
Balance at end of period | | $ | 5,763 | | | $ | 15,613 | | | $ | 1,063 | | | $ | 3,544 | | | $ | 1,538 | | | $ | 27,521 | |
| | | | | | | | | | | | | | | | | | | | | | | | |
Three months ended March 31, 2016 | | | | | | | | | | | | | | | | | | | | | | | | |
Beginning of the period | | $ | 6,015 | | | $ | 10,559 | | | $ | 936 | | | $ | 3,212 | | | $ | 1,421 | | | $ | 22,143 | |
Charge-offs | | | (81 | ) | | | (225 | ) | | | (34 | ) | | | — | | | | (155 | ) | | | (495 | ) |
Recoveries | | | 318 | | | | 204 | | | | 205 | | | | 58 | | | | 58 | | | | 843 | |
Provision for loan losses | | | (428 | ) | | | 871 | | | | (211 | ) | | | 163 | | | | 116 | | | | 511 | |
Balance at end of period | | $ | 5,824 | | | $ | 11,409 | | | $ | 896 | | | $ | 3,433 | | | $ | 1,440 | | | $ | 23,002 | |
| | | | | | | | | | | | | | | | | | | | | | | | |
| | | | | | | | | | | | | | | | | | | | | | | | |
| | Real Estate Loans | | | | | | | | | | | | | |
| | Residential | | | Commercial | | | Land, develop., constr. | | | Comm. & industrial | | | Consumer & other | | | Total | |
| | | | | | | | | | | | | | | | | | | | | | | | |
Allowance for loan losses for loans that are PCI loans: | | | | | | | | | | | | | | | | | | | | | |
| | | | | | | | | | | | | | | | | | | | | | | | |
Three months ended March 31, 2017 | | | | | | | | | | | | | | | | | | | | | | | | |
Beginning of the period | | $ | 54 | | | $ | 92 | | | $ | 312 | | | $ | — | | | $ | 14 | | | $ | 472 | |
Charge-offs | | | — | | | | — | | | | — | | | | — | | | | — | | | | — | |
Recoveries | | | — | | | | — | | | | — | | | | — | | | | — | | | | — | |
Provision for loan losses | | | (4 | ) | | | (34 | ) | | | (136 | ) | | | — | | | | — | | | | (174 | ) |
Balance at end of period | | $ | 50 | | | $ | 58 | | | $ | 176 | | | $ | — | | | $ | 14 | | | $ | 298 | |
| | | | | | | | | | | | | | | | | | | | | | | | |
Three months ended March 31, 2016 | | | | | | | | | | | | | | | | | | | | | | | | |
Beginning of the period | | $ | — | | | $ | 103 | | | $ | 1 | | | $ | 3 | | | $ | 14 | | | $ | 121 | |
Charge-offs | | | — | | | | — | | | | — | | | | — | | | | — | | | | — | |
Recoveries | | | — | | | | — | | | | — | | | | — | | | | — | | | | — | |
Provision for loan losses | | | — | | | | — | | | | — | | | | (1 | ) | | | — | | | | (1 | ) |
Balance at end of period | | $ | — | | | $ | 103 | | | $ | 1 | | | $ | 2 | | | $ | 14 | | | $ | 120 | |
20
CenterState Banks, Inc. and Subsidiaries
NOTES TO CONDENSED CONSOLIDATED FINANCIAL STATEMENTS (unaudited)
(in thousands of dollars, except per share data)
The following tables present the balance in the allowance for loan losses and the recorded investment in loans by portfolio segment and based on impairment method as of March 31, 2017 and December 31, 2016. Accrued interest receivable and unearned loan fees and costs are not included in the recorded investment because they are not material.
| | Real Estate Loans | | | | | | | | | | | | | |
As of March 31, 2017 | | Residential | | | Commercial | | | Land, develop., constr. | | | Comm. & industrial | | | Consumer & other | | | Total | |
Allowance for loan losses: | | | | | | | | | | | | | | | | | | | | | | | | |
Ending allowance balance attributable to loans: | | | | | | | | | | | | | | | | | | | | | |
Individually evaluated for impairment | | $ | 585 | | | $ | 2 | | | $ | 9 | | | $ | 5 | | | $ | 22 | | | $ | 623 | |
Collectively evaluated for impairment | | | 5,178 | | | | 15,611 | | | | 1,054 | | | | 3,539 | | | | 1,516 | | | | 26,898 | |
Purchased credit impaired | | | 50 | | | | 58 | | | | 176 | | | | — | | | | 14 | | | | 298 | |
Total ending allowance balance | | $ | 5,813 | | | $ | 15,671 | | | $ | 1,239 | | | $ | 3,544 | | | $ | 1,552 | | | $ | 27,819 | |
| | | | | | | | | | | | | | | | | | | | | | | | |
Loans: | | | | | | | | | | | | | | | | | | | | | | | | |
Individually evaluated for impairment | | $ | 7,687 | | | $ | 8,804 | | | $ | 354 | | | $ | 1,538 | | | $ | 223 | | | $ | 18,606 | |
Collectively evaluated for impairment | | | 810,850 | | | | 1,815,296 | | | | 148,231 | | | | 461,387 | | | | 88,718 | | | | 3,324,482 | |
Purchased credit impaired | | | 67,234 | | | | 94,751 | | | | 9,522 | | | | 4,177 | | | | 374 | | | | 176,058 | |
Total ending loan balances | | $ | 885,771 | | | $ | 1,918,851 | | | $ | 158,107 | | | $ | 467,102 | | | $ | 89,315 | | | $ | 3,519,146 | |
| Real Estate Loans | | | | | | | | | | | | | | | |
As of December 31, 2016 | | Residential | | | Commercial | | | Land, develop., constr. | | | Comm. & industrial | | | Consumer & other | | | Total | |
Allowance for loan losses: | | | | | | | | | | | | | | | | | | | | | | | | |
Ending allowance balance attributable to loans: | | | | | | | | | | | | | | | | | | | | | |
Individually evaluated for impairment | | $ | 653 | | | $ | — | | | $ | 10 | | | $ | 7 | | | $ | 25 | | | $ | 695 | |
Collectively evaluated for impairment | | | 4,987 | | | | 14,713 | | | | 873 | | | | 3,778 | | | | 1,523 | | | | 25,874 | |
Purchased credit impaired | | | 54 | | | | 92 | | | | 312 | | | | — | | | | 14 | | | | 472 | |
Total ending allowance balance | | $ | 5,694 | | | $ | 14,805 | | | $ | 1,195 | | | $ | 3,785 | | | $ | 1,562 | | | $ | 27,041 | |
| | | | | | | | | | | | | | | | | | | | | | | | |
Loans: | | | | | | | | | | | | | | | | | | | | | | | | |
Individually evaluated for impairment | | $ | 8,237 | | | $ | 9,017 | | | $ | 1,059 | | | $ | 1,710 | | | $ | 230 | | | $ | 20,253 | |
Collectively evaluated for impairment | | | 808,067 | | | | 1,746,905 | | | | 140,985 | | | | 437,830 | | | | 89,308 | | | | 3,223,095 | |
Purchased credit impaired | | | 72,179 | | | | 99,566 | | | | 9,944 | | | | 3,825 | | | | 410 | | | | 185,924 | |
Total ending loan balance | | $ | 888,483 | | | $ | 1,855,488 | | | $ | 151,988 | | | $ | 443,365 | | | $ | 89,948 | | | $ | 3,429,272 | |
Loans collectively evaluated for impairment reported at March 31, 2017 include loans acquired from Gulfstream Business Bank (“GSB”) on January 17, 2014 and from First Southern Bank (“FSB”) on June 1, 2014 and that are not PCI loans. These loans were performing loans recorded at estimated fair value at the acquisition date. The aggregate fair value adjustment for these loans at their respective acquisition dates was approximately $17,761, or approximately 2.10% of the aggregate acquisition date balances. The amount is accreted into interest income over the remaining lives of the related loans on a level yield basis. The aggregate unamortized acquisition date fair value adjustment was approximately $5,683 and $6,473, which represents approximately 1.19% and 1.29% of the remaining outstanding balance of these acquired loans at March 31, 2017 and December 31, 2016, respectively. Management has also estimated probable incurred losses based on performance since the respective acquisition dates, and based on these estimates, has included $2,089 and $2,230 in the Company’s general loan allowance with respect to these acquired loans at March 31, 2017 and December 31, 2016, respectively.
Loans collectively evaluated for impairment reported at March 31, 2017 also include loans acquired from Community and Hometown on March 1, 2016. Management evaluated the performance of these groups of loans over the period subsequent to the acquisition date and considered the accretion of the credit discount, levels of and trends in non-performing loans, past-due loans, adverse loan grade classification changes, net charge-offs and impaired loans. The loans acquired from Community and Hometown are performing as expected and therefore no allowance for loan losses was recorded for these loans at March 31, 2017.
21
CenterState Banks, Inc. and Subsidiaries
NOTES TO CONDENSED CONSOLIDATED FINANCIAL STATEMENTS (unaudited)
(in thousands of dollars, except per share data)
The table below summarizes impaired loan data for the periods presented.
| | Mar. 31, 2017 | | | Dec. 31, 2016 | |
Performing TDRs (these are not included in nonperforming loans ("NPLs")) | | $ | 10,976 | | | $ | 11,030 | |
Nonperforming TDRs (these are included in NPLs) | | | 1,295 | | | | 2,075 | |
Total TDRs (these are included in impaired loans) | | | 12,271 | | | | 13,105 | |
Impaired loans that are not TDRs | | | 6,335 | | | | 7,148 | |
Total impaired loans | | $ | 18,606 | | | $ | 20,253 | |
In certain situations it is more common to restructure or modify the terms of troubled loans (i.e. troubled debt restructure or “TDRs”). In those circumstances it may be beneficial to restructure the terms of a loan and work with the borrower for the benefit of both parties, versus forcing the property into foreclosure and having to dispose of it in a distressed sale. When the terms of a loan have been modified, usually the monthly payment and/or interest rate is reduced for generally twelve to twenty-four months. Material principal amounts on any loan modifications have not been forgiven to date.
TDRs as of March 31, 2017 and December 31, 2016 quantified by loan type classified separately as accrual (performing loans) and non-accrual (non performing loans) are presented in the tables below.
As of March 31, 2017 | | Accruing | | | Non Accrual | | | Total | |
Real estate loans: | | | | | | | | | | | | |
Residential | | $ | 7,098 | | | $ | 588 | | | $ | 7,686 | |
Commercial | | | 2,821 | | | | 597 | | | | 3,418 | |
Land, development, construction | | | 272 | | | | 82 | | | | 354 | |
Total real estate loans | | | 10,191 | | | | 1,267 | | | | 11,458 | |
Commercial | | | 590 | | | | — | | | | 590 | |
Consumer and other | | | 195 | | | | 28 | | | | 223 | |
Total TDRs | | $ | 10,976 | | | $ | 1,295 | | | $ | 12,271 | |
| | | | | | | | | | | | |
| | | | | | | | | | | | |
As of December 31, 2016 | | Accruing | | | Non-Accrual | | | Total | |
Real estate loans: | | | | | | | | | | | | |
Residential | | $ | 7,358 | | | $ | 879 | | | $ | 8,237 | |
Commercial | | | 2,442 | | | | 1,082 | | | | 3,524 | |
Land, development, construction | | | 281 | | | | 84 | | | | 365 | |
Total real estate loans | | | 10,081 | | | | 2,045 | | | | 12,126 | |
Commercial | | | 749 | | | | — | | | | 749 | |
Consumer and other | | | 200 | | | | 30 | | | | 230 | |
Total TDRs | | $ | 11,030 | | | $ | 2,075 | | | $ | 13,105 | |
Our policy is to return non accrual TDR loans to accrual status when all the principal and interest amounts contractually due, pursuant to its modified terms, are brought current and future payments are reasonably assured. Our policy also considers the payment history of the borrower, but is not dependent upon a specific number of payments. The Company recorded a provision for loan loss expense of $22 and partial charge offs of $23 on the TDR loans described above during the three month period ending March 31, 2017. The Company recorded a provision for loan loss expense of $94 and partial charge-offs of $63 on TDR loans during the three month period ending March 31, 2016.
Loans are modified to minimize loan losses when we believe the modification will improve the borrower’s financial condition and ability to repay the loan. We typically do not forgive principal. We generally either reduce interest rates or decrease monthly payments for a temporary period of time and those reductions of cash flows are capitalized into the loan balance. We may also extend maturities, convert balloon loans to longer term amortizing loans, or vice versa, or change interest rates between variable and fixed rate. Each borrower and situation is unique and we try to accommodate the borrower and minimize the Company’s potential losses. Approximately 89% of our TDRs are current pursuant to their modified terms, and $1,295, or approximately 11% of our total TDRs are not performing pursuant to their modified terms. There does not appear to be any significant difference in success rates with one type of concession versus another.
Loans modified as TDRs during the three month period ending March 31, 2017 were $70. The Company recorded a loan loss provision of $2 for loans modified during the three month period ending March 31, 2017. Loans modified as TDRs during the three month period ending March 31, 2016 were $1,049. The Company recorded a loan loss provision of $23 for loans modified during the three month period ending March 31, 2016.
22
CenterState Banks, Inc. and Subsidiaries
NOTES TO CONDENSED CONSOLIDATED FINANCIAL STATEMENTS (unaudited)
(in thousands of dollars, except per share data)
The following table presents loans by class modified and for which there was a payment default within twelve months following the modification during the periods ending March 31, 2017 and 2016.
| | Period ending | | | Period ending | |
| | March 31, 2017 | | | March 31, 2016 | |
| | Number | | | Recorded | | | Number | | | Recorded | |
| | of loans | | | investment | | | of loans | | | investment | |
Residential | | | — | | | $ | — | | | | — | | | $ | — | |
Commercial real estate | | | 1 | | | | 456 | | | | 2 | | | | 1,004 | |
Land, development, construction | | | — | | | | — | | | | — | | | | — | |
Commercial and Industrial | | | — | | | | — | | | | 1 | | | | 63 | |
Consumer and other | | | — | | | | — | | | | — | | | | — | |
Total | | | 1 | | | $ | 456 | | | | 3 | | | $ | 1,067 | |
The Company recorded a provision for loan loss expense of $5 and $7 and partial charge offs of $5 and $19, on TDR loans that subsequently defaulted as described above during the three month periods ending March 31, 2017 and 2016, respectively.
The following tables present loans individually evaluated for impairment by class of loans as of March 31, 2017 and December 31, 2016, excluding purchased credit impaired loans accounted for pursuant to ASC Topic 310-30. The recorded investment is less than the unpaid principal balance due to partial charge-offs.
As of March 31, 2017 | | Unpaid principal balance | | | Recorded investment | | | Allowance for loan losses allocated | |
With no related allowance recorded: | | | | | | | | | | | | |
Residential real estate | | $ | 4,324 | | | $ | 4,218 | | | $ | — | |
Commercial real estate | | | 10,043 | | | | 8,735 | | | | — | |
Land, development, construction | | | 213 | | | | 172 | | | | — | |
Commercial and industrial | | | 1,389 | | | | 1,335 | | | | — | |
Consumer, other | | | 126 | | | | 109 | | | | — | |
| | | | | | | | | | | | |
With an allowance recorded: | | | | | | | | | | | | |
Residential real estate | | | 3,626 | | | | 3,469 | | | | 585 | |
Commercial real estate | | | 70 | | | | 69 | | | | 2 | |
Land, development, construction | | | 209 | | | | 182 | | | | 9 | |
Commercial and industrial | | | 204 | | | | 203 | | | | 5 | |
Consumer, other | | | 119 | | | | 114 | | | | 22 | |
Total | | $ | 20,323 | | | $ | 18,606 | | | $ | 623 | |
23
CenterState Banks, Inc. and Subsidiaries
NOTES TO CONDENSED CONSOLIDATED FINANCIAL STATEMENTS (unaudited)
(in thousands of dollars, except per share data)
As of December 31, 2016 | | Unpaid principal balance | | | Recorded investment | | | Allowance for loan losses allocated | |
With no related allowance recorded: | | | | | | | | | | | | |
Residential real estate | | $ | 3,950 | | | $ | 3,847 | | | $ | — | |
Commercial real estate | | | 10,288 | | | | 9,017 | | | | — | |
Land, development, construction | | | 1,064 | | | | 874 | | | | — | |
Commercial and industrial | | | 1,493 | | | | 1,448 | | | | — | |
Consumer, other | | | 87 | | | | 83 | | | | — | |
| | | | | | | | | | | | |
With an allowance recorded: | | | | | | | | | | | | |
Residential real estate | | | 4,592 | | | | 4,390 | | | | 653 | |
Commercial real estate | | | — | | | | — | | | | — | |
Land, development, construction | | | 212 | | | | 185 | | | | 10 | |
Commercial and industrial | | | 263 | | | | 262 | | | | 7 | |
Consumer, other | | | 165 | | | | 147 | | | | 25 | |
Total | | $ | 22,114 | | | $ | 20,253 | | | $ | 695 | |
Three months ended March 31, 2017 | | Average of impaired loans | | | Interest income recognized during impairment | | | Cash basis interest income recognized | |
Real estate loans: | | | | | | | | | | | | |
Residential | | $ | 7,962 | | | $ | 61 | | | $ | — | |
Commercial | | | 8,910 | | | | 35 | | | | — | |
Land, development, construction | | | 706 | | | | 4 | | | | — | |
Total real estate loans | | | 17,578 | | | | 100 | | | | — | |
| | | | | | | | | | | | |
Commercial and industrial | | | 1,625 | | | | 8 | | | | — | |
Consumer and other loans | | | 227 | | | | 2 | | | | — | |
Total | | $ | 19,430 | | | $ | 110 | | | $ | — | |
| | | | | | | | | | | | |
Three months ended March 31, 2016 | | Average of impaired loans | | | Interest income recognized during impairment | | | Cash basis interest income recognized | |
Real estate loans: | | | | | | | | | | | | |
Residential | | $ | 8,278 | | | $ | 57 | | | $ | — | |
Commercial | | | 13,326 | | | | 55 | | | | — | |
Land, development, construction | | | 2,146 | | | | 12 | | | | — | |
Total real estate loans | | | 23,750 | | | | 124 | | | | — | |
| | | | | | | | | | | | |
Commercial and industrial | | | 1,525 | | | | 12 | | | | — | |
Consumer and other loans | | | 270 | | | | 3 | | | | — | |
Total | | $ | 25,545 | | | $ | 139 | | | $ | — | |
| | | | | | | | | | | | |
Nonperforming loans include both smaller balance homogeneous loans that are collectively evaluated for impairment and individually classified impaired loans, excluding purchased credit impaired loans accounted for pursuant to ASC Topic 310-30.
Nonperforming loans were as follows: | | Mar. 31, 2017 | | | Dec. 31, 2016 | |
Non accrual loans | | $ | 17,569 | | | $ | 19,003 | |
Loans past due over 90 days and still accruing interest | | | — | | | | — | |
Total non performing loans | | $ | 17,569 | | | $ | 19,003 | |
24
CenterState Banks, Inc. and Subsidiaries
NOTES TO CONDENSED CONSOLIDATED FINANCIAL STATEMENTS (unaudited)
(in thousands of dollars, except per share data)
The following table presents the recorded investment in nonaccrual loans and loans past due over 90 days still on accrual by class of loans as of March 31, 2017 and December 31, 2016, excluding purchased credit impaired loans:
As of March 31, 2017 | | Nonaccrual | | | Loans past due over 90 days still accruing | |
Residential real estate | | $ | 7,964 | | | $ | — | |
Commercial real estate | | | 7,499 | | | | — | |
Land, development, construction | | | 372 | | | | — | |
Commercial | | | 1,453 | | | | — | |
Consumer, other | | | 281 | | | | — | |
Total | | $ | 17,569 | | | $ | — | |
| | | | | | | | |
As of December 31, 2016 | | Nonaccrual | | | Loans past due over 90 days still accruing | |
Residential real estate | | $ | 7,068 | | | $ | — | |
Commercial real estate | | | 9,116 | | | | — | |
Land, development, construction | | | 1,060 | | | | — | |
Commercial | | | 1,421 | | | | — | |
Consumer, other | | | 338 | | | | — | |
Total | | $ | 19,003 | | | $ | — | |
The following table presents the aging of the recorded investment in past due loans as of March 31, 2017 and December 31, 2016, excluding purchased credit impaired loans:
| | | | | | | | | | Accruing Loans | | | | | | | | | | | | | |
| | Total | | | 30 - 59 days past due | | | 60 - 89 days past due | | | Greater than 90 days past due | | | Total Past Due | | | Loans Not Past Due | | | Nonaccrual Loans | |
As of March 31, 2017 | | | | | | | | | | | | | | | | | | | | | | | | | | | | |
Residential real estate | | $ | 818,537 | | | $ | 2,120 | | | $ | 4,655 | | | $ | — | | | $ | 6,775 | | | $ | 803,798 | | | $ | 7,964 | |
Commercial real estate | | | 1,824,100 | | | | 3,965 | | | | 2 | | | | — | | | | 3,967 | | | | 1,812,634 | | | | 7,499 | |
Land/dev/construction | | | 148,585 | | | | 765 | | | | — | | | | — | | | | 765 | | | | 147,448 | | | | 372 | |
Commercial | | | 462,925 | | | | 2,508 | | | | 1,050 | | | | — | | | | 3,558 | | | | 457,914 | | | | 1,453 | |
Consumer | | | 88,941 | | | | 499 | | | | 151 | | | | — | | | | 650 | | | | 88,010 | | | | 281 | |
| | $ | 3,343,088 | | | $ | 9,857 | | | $ | 5,858 | | | $ | — | | | $ | 15,715 | | | $ | 3,309,804 | | | $ | 17,569 | |
| | | | | | | | | | | | | | | | | | | | | | | | | | | | |
| | | | | | | | | | | | | | | | | | | | | | | | | | | | |
| | | | | | | | | | Accruing Loans | | | | | | | | | | | | | |
| | Total | | | 30 - 59 days past due | | | 60 - 89 days past due | | | Greater than 90 days past due | | | Total Past Due | | | Loans Not Past Due | | | Nonaccrual Loans | |
As of December 31, 2016 | | | | | | | | | | | | | | | | | | | | | | | | | | | | |
Residential real estate | | $ | 816,304 | | | $ | 3,739 | | | $ | 4,561 | | | $ | — | | | $ | 8,300 | | | $ | 800,936 | | | $ | 7,068 | |
Commercial real estate | | | 1,755,922 | | | | 3,580 | | | | 1,179 | | | | — | | | | 4,759 | | | | 1,742,047 | | | | 9,116 | |
Land/dev/construction | | | 142,044 | | | | 2,111 | | | | 71 | | | | — | | | | 2,182 | | | | 138,802 | | | | 1,060 | |
Commercial | | | 439,540 | | | | 2,584 | | | | 322 | | | | — | | | | 2,906 | | | | 435,213 | | | | 1,421 | |
Consumer | | | 89,538 | | | | 501 | | | | 178 | | | | — | | | | 679 | | | | 88,521 | | | | 338 | |
| | $ | 3,243,348 | | | $ | 12,515 | | | $ | 6,311 | | | $ | — | | | $ | 18,826 | | | $ | 3,205,519 | | | $ | 19,003 | |
25
CenterState Banks, Inc. and Subsidiaries
NOTES TO CONDENSED CONSOLIDATED FINANCIAL STATEMENTS (unaudited)
(in thousands of dollars, except per share data)
Credit Quality Indicators:
The Company categorizes loans into risk categories based on relevant information about the ability of borrowers to service their debt such as: current financial information, historical payment experience, credit documentation, public information, and current economic trends, among other factors. The Company analyzes loans individually by classifying the loans as to credit risk. This analysis is performed on at least an annual basis. The Company uses the following definitions for risk ratings:
Special Mention: Loans classified as special mention have a potential weakness that deserves management’s close attention. If left uncorrected, these potential weaknesses may result in deterioration of the repayment prospects for the loan or of the institution’s credit position at some future date.
Substandard: Loans classified as substandard are inadequately protected by the current net worth and paying capacity of the obligor or of the collateral pledged, if any. Loans so classified have a well-defined weakness or weaknesses that jeopardize the liquidation of the debt. They are characterized by the distinct possibility that the institution will sustain some loss if the deficiencies are not corrected.
Doubtful: Loans classified as doubtful have all the weaknesses inherent in those classified as substandard, with the added characteristic that the weaknesses make collection or liquidation in full, on the basis of currently existing facts, conditions, and values, highly questionable and improbable.
Loans not meeting the criteria above that are analyzed individually as part of the above described process are considered to be pass rated loans. The following table presents the risk category of loans by class of loans based on the most recent analysis performed, excluding purchased credit impaired loans accounted for pursuant to ASC Topic 310-30, as of March 31, 2017 and December 31, 2016.
| | | | | | As of March 31, 2017 | | | | | |
Loan Category | | Pass | | | Special Mention | | | Substandard | | | Doubtful | |
Residential real estate | $ | 786,646 | | | $ | 13,270 | | | $ | 18,621 | | | $ | — | |
Commercial real estate | | 1,705,877 | | | | 92,195 | | | | 26,028 | | | | — | |
Land/dev/construction | | 138,354 | | | | 8,998 | | | | 1,233 | | | | — | |
Commercial | | 449,928 | | | | 10,204 | | | | 2,793 | | | | — | |
Consumer | | | 88,204 | | | | 265 | | | | 472 | | | | — | |
Total | | $ | 3,169,009 | | | $ | 124,932 | | | $ | 49,147 | | | $ | — | |
| | | | | | | | | | | | | | | | |
| | | | | | | | | | | | | | | | |
| | | | | | As of December 31, 2016 | | | | | |
Loan Category | | Pass | | | Special Mention | | | Substandard | | | Doubtful | |
Residential real estate | $ | 784,491 | | | $ | 13,820 | | | $ | 17,993 | | | $ | — | |
Commercial real estate | | 1,636,473 | | | | 94,897 | | | | 24,552 | | | | — | |
Land/dev/construction | | 129,781 | | | | 10,278 | | | | 1,985 | | | | — | |
Commercial | | 426,894 | | | | 9,570 | | | | 3,076 | | | | — | |
Consumer | | | 88,714 | | | | 270 | | | | 554 | | | | — | |
Total | | $ | 3,066,353 | | | $ | 128,835 | | | $ | 48,160 | | | $ | — | |
The Company considers the performance of the loan portfolio and its impact on the allowance for loan losses. For residential and consumer loan classes, the Company also evaluates credit quality based on the aging status of the loan, which was previously presented, and by payment activity. The following table presents the recorded investment in residential and consumer loans, excluding purchased credit impaired loans, based on payment activity as of March 31, 2017 and December 31, 2016:
As of March 31, 2017 | | Residential | | | Consumer | |
Performing | | $ | 810,573 | | | $ | 88,660 | |
Nonperforming | | | 7,964 | | | | 281 | |
Total | | $ | 818,537 | | | $ | 88,941 | |
| | | | | | | | |
As of December 31, 2016 | | Residential | | | Consumer | |
Performing | | $ | 809,236 | | | $ | 89,200 | |
Nonperforming | | | 7,068 | | | | 338 | |
Total | | $ | 816,304 | | | $ | 89,538 | |
26
CenterState Banks, Inc. and Subsidiaries
NOTES TO CONDENSED CONSOLIDATED FINANCIAL STATEMENTS (unaudited)
(in thousands of dollars, except per share data)
Purchased Credit Impaired (“PCI”) loans:
Income is recognized on PCI loans pursuant to ASC Topic 310-30. A portion of the fair value discount has been ascribed as an accretable yield that is accreted into interest income over the estimated remaining life of the loans. The remaining non-accretable difference represents cash flows not expected to be collected.
The table below summarizes the total contractually required principal and interest cash payments, management’s estimate of expected total cash payments and carrying value of the loans as of March 31, 2017 and December 31, 2016. Contractually required principal and interest payments have been adjusted for estimated prepayments.
| | Mar. 31, 2017 | | | Dec. 31, 2016 | |
Contractually required principal and interest | | $ | 275,938 | | | $ | 297,821 | |
Non-accretable difference | | | (10,426 | ) | | | (18,372 | ) |
Cash flows expected to be collected | | | 265,512 | | | | 279,449 | |
Accretable yield | | | (89,454 | ) | | | (93,525 | ) |
Carrying value of acquired loans | | | 176,058 | | | | 185,924 | |
Allowance for loan losses | | | (298 | ) | | | (472 | ) |
Carrying value less allowance for loan losses | | $ | 175,760 | | | $ | 185,452 | |
We adjusted our estimates of future expected losses, cash flows and renewal assumptions during the current quarter. These adjustments resulted in an increase in expected cash flows and accretable yield, and a decrease in the non-accretable difference. We reclassified approximately $3,804 and $3,364 from non-accretable difference to accretable yield during the three month periods ending March 31, 2017 and 2016 to reflect our adjusted estimates of future expected cash flows. The table below summarizes the changes in total contractually required principal and interest cash payments, management’s estimate of expected total cash payments and carrying value of the loans during the three month periods ending March 31, 2017 and 2016.
Activity during the | | | | | | Effect of | | | income | | | all other | | | | | |
three month period ending March 31, 2017 | | Dec. 31, 2016 | | | acquisitions | | | accretion | | | adjustments | | | Mar. 31, 2017 | |
Contractually required principal and interest | | $ | 297,821 | | | $ | — | | | $ | — | | | $ | (21,883 | ) | | $ | 275,938 | |
Non-accretable difference | | | (18,372 | ) | | | — | | | | — | | | | 7,946 | | | | (10,426 | ) |
Cash flows expected to be collected | | | 279,449 | | | | — | | | | — | | | | (13,937 | ) | | | 265,512 | |
Accretable yield | | | (93,525 | ) | | | — | | | | 8,525 | | | | (4,454 | ) | | | (89,454 | ) |
Carry value of acquired loans | | $ | 185,924 | | | $ | — | | | $ | 8,525 | | | $ | (18,391 | ) | | $ | 176,058 | |
| | | | | | | | | | | | | | | | | | | | |
Activity during the | | | | | | Effect of | | | income | | | all other | | | | | |
three month period ending March 31, 2016 | | Dec. 31, 2015 | | | acquisitions | | | accretion | | | adjustments | | | Mar. 31, 2016 | |
Contractually required principal and interest | | $ | 332,570 | | | $ | 73,005 | | | $ | — | | | $ | (31,689 | ) | | $ | 373,886 | |
Non-accretable difference | | | (19,452 | ) | | | (9,295 | ) | | | — | | | | 6,520 | | | | (22,227 | ) |
Cash flows expected to be collected | | | 313,118 | | | | 63,710 | | | | — | | | | (25,169 | ) | | | 351,659 | |
Accretable yield | | | (102,590 | ) | | | (18,585 | ) | | | 8,908 | | | | (2,876 | ) | | | (115,143 | ) |
Carry value of acquired loans | | $ | 210,528 | | | $ | 45,125 | | | $ | 8,908 | | | $ | (28,045 | ) | | $ | 236,516 | |
NOTE 7: Securities sold under agreement to repurchase
Our Bank enters into borrowing arrangements with our retail business customers by agreements to repurchase (“securities sold under agreements to repurchase”) under which the bank pledges investment securities owned and under its control as collateral against these one-day borrowing arrangement. These short-term borrowings totaled $37,866 at March 31, 2017 compared to $28,427 at December 31, 2016. The following table provides additional details for the periods presented.
| | MBS | | | Municipal | | | | | |
As of March 31, 2017 | | Securities | | | Securities | | | Total | |
Market value of securities pledged | | $ | 45,910 | | | $ | 440 | | | $ | 46,350 | |
Borrowings related to pledged amounts | | | 37,683 | | | 183 | | | | 37,866 | |
Market value pledged as a % of borrowings | | | 122 | % | | | 240 | % | | | 122 | % |
| | | | | | | | | | | | |
As of December 31, 2016 | | | | | | | | | | | | |
Market value of securities pledged | | $ | 34,159 | | | $ | 1,363 | | | $ | 35,522 | |
Borrowings related to pledged amounts | | | 27,558 | | | 869 | | | | 28,427 | |
Market value pledged as a % of borrowings | | | 124 | % | | | 157 | % | | | 125 | % |
Any risk related to these arrangements, primarily market value changes, are minimized due to the overnight (one day) maturity and the additional collateral pledged over the borrowed amounts.
27
CenterState Banks, Inc. and Subsidiaries
NOTES TO CONDENSED CONSOLIDATED FINANCIAL STATEMENTS (unaudited)
(in thousands of dollars, except per share data)
NOTE 8: Derivatives
The Company enters into interest rate swaps in order to provide commercial loan clients the ability to swap from fixed to variable interest rates. Under these agreements, the Company enters into a fixed-rate loan with a client in addition to a swap agreement. This swap agreement effectively converts the client’s fixed rate loan into a variable rate. The Company then enters into a matching swap agreement with a third party dealer in order to offset its exposure on the customer swap. At March 31, 2017 and December 31, 2016, the notional amount of such arrangements was $2,706,598 and $2,441,768, respectively, and investment securities with a fair value of $16,601 and $22,562 were pledged as collateral to the third party dealers. As the interest rate swaps with the clients and third parties are not designated as hedges under ASC 815, changes in market values are reported in earnings.
Summary information about the derivative instruments is as follows:
| | Mar. 31, 2017 | | | Dec. 31, 2016 | |
Notional amount | | $ | 2,706,598 | | | $ | 2,441,768 | |
Weighted average pay rate on interest-rate swaps | | | 2.68 | % | | | 2.56 | % |
Weighted average receive rate on interest rate swaps | | | 2.68 | % | | | 2.55 | % |
Weighted average maturity (years) | | | 11 | | | 11 | |
Fair value of interest rate swap derivatives (asset) | | $ | 35,107 | | | | 31,817 | |
Fair value of interest rate swap derivatives (liability) | | $ | 35,979 | | | $ | 32,691 | |
NOTE 09: Stock Offering
On January 13, 2017, the Company raised approximately $63,791 through a public offering by issuing 2,695,000 shares of common stock, including 245,000 shares pursuant to the exercise of the underwriters’ over-allotment option. Net proceeds of the offering, after all expenses, were approximately $63,262.
NOTE 10: Recently Issued Accounting Standards
In May 2014, the FASB and the International Accounting Standards Board (the "IASB") jointly issued a comprehensive new revenue recognition standard that will supersede nearly all existing revenue recognition guidance under GAAP and International Financial Reporting Standards ("IFRS"). Previous revenue recognition guidance in GAAP consisted of broad revenue recognition concepts together with numerous revenue requirements for particular industries or transactions, which sometimes resulted in different accounting for economically similar transactions. In contrast, IFRS provided limited revenue recognition guidance and, consequently, could be difficult to apply to complex transactions. Accordingly, the FASB and the IASB initiated a joint project to clarify the principles for recognizing revenue and to develop a common revenue standard for U.S. GAAP and IFRS that would: (1) remove inconsistencies and weaknesses in revenue requirements; (2) provide a more robust framework for addressing revenue issues; (3) improve comparability of revenue recognition practices across entities, industries, jurisdictions, and capital markets; (4) provide more useful information to users of financial statements through improved disclosure requirements; and (5) simplify the preparation of financial statements by reducing the number of requirements to which an entity must refer. To meet those objectives, the FASB issued ASU No. 2014-09,"Revenue from Contracts with Customers." The standard’s core principle is that a company will recognize revenue when it transfers promised goods or services to customers in an amount that reflects the consideration to which the company expects to be entitled in exchange for those goods or services. In doing so, companies generally will be required to use more judgment and make more estimates than under current guidance. These may include identifying performance obligations in the contract, estimating the amount of variable consideration to include in the transaction price and allocating the transaction price to each separate performance obligation. The standard was initially effective for public entities for interim and annual reporting periods beginning after December 15, 2016; early adoption was not permitted. However, in August 2015, the FASB issued ASU No. 2015-14, "Revenue from Contracts with Customers - Deferral of the Effective Date" which deferred the effective date by one year (i.e., interim and annual reporting periods beginning after December 15, 2017). For financial reporting purposes, the standard allows for either full retrospective adoption, meaning the standard is applied to all of the periods presented, or modified retrospective adoption, meaning the standard is applied only to the most current period presented in the financial statements with the cumulative effect of initially applying the standard recognized at the date of initial application. In addition, the FASB has begun to issue targeted updates to clarify specific implementation issues of ASU 2014-09. These updates include ASU No. 2016-08, “Principal versus Agent Considerations (Reporting Revenue Gross versus Net),” ASU No. 2016-10, “Identifying Performance Obligations and Licensing,” and ASU No. 2016-12 “Narrow-Scope Improvements and Practical Expedients.” The Company is currently evaluating the provisions of ASU No. 2014-09 and its related updates and will be closely monitoring developments and additional guidance to determine the potential impact the new standard will have on the Company's Consolidated Financial Statements.
In January 2016, the FASB issued ASU No. 2016-01, "Recognition and Measurement of Financial Assets and Financial Liabilities." This ASU addresses certain aspects of recognition, measurement, presentation, and disclosure of financial instruments by
28
CenterState Banks, Inc. and Subsidiaries
NOTES TO CONDENSED CONSOLIDATED FINANCIAL STATEMENTS (unaudited)
(in thousands of dollars, except per share data)
making targeted improvements to GAAP as follows: (1) require equity investments (except those accounted for under the equity method of accounting or those that result in consolidation of the investee) to be measured at fair value with changes in fair value recognized in net income. However, an entity may choose to measure equity investments that do not have readily determinable fair values at cost minus impairment, if any, plus or minus changes resulting from observable price changes in orderly transactions for the identical or a similar investment of the same issuer; (2) simplify the impairment assessment of equity investments without readily determinable fair values by requiring a qualitative assessment to identify impairment. When a qualitative assessment indicates that impairment exists, an entity is required to measure the investment at fair value; (3) eliminate the requirement to disclose the fair value of financial instruments measured at amortized cost for entities that are not public business entities; (4) eliminate the requirement for public business entities to disclose the method(s) and significant assumptions used to estimate the fair value that is required to be disclosed for financial instruments measured at amortized cost on the balance sheet; (5) require public business entities to use the exit price notion when measuring the fair value of financial instruments for disclosure purposes; (6) require an entity to present separately in other comprehensive income the portion of the total change in the fair value of a liability resulting from a change in the instrument-specific credit risk when the entity has elected to measure the liability at fair value in accordance with the fair value option for financial instruments; (7) require separate presentation of financial assets and financial liabilities by measurement category and form of financial asset (that is, securities or loans and receivables) on the balance sheet or the accompanying notes to the financial statements; and (8) clarify that an entity should evaluate the need for a valuation allowance on a deferred tax asset related to available-for-sale securities in combination with the entity’s other deferred tax assets. ASU No. 2016-01 is effective for interim and annual reporting periods beginning after December 15, 2017. Early application is permitted as of the beginning of the fiscal year of adoption only for provisions (3) and (6) above. Early adoption of the other provisions mentioned above is not permitted. The Company has performed a preliminary evaluation of the provisions of ASU No. 2016-01. Based on this evaluation, the Company has determined that ASU No. 2016-01 is not expected to have a material impact on the Company's Consolidated Financial Statements; however, the Company will continue to closely monitor developments and additional guidance.
In February 2016, the FASB issued ASU No. 2016-02, "Leases." Under the new guidance, lessees will be required to recognize the following for all leases (with the exception of short-term leases): 1) a lease liability, which is the present value of a lessee's obligation to make lease payments, and 2) a right-of-use asset, which is an asset that represents the lessee's right to use, or control the use of, a specified asset for the lease term. Lessor accounting under the new guidance remains largely unchanged as it is substantially equivalent to existing guidance for sales-type leases, direct financing leases, and operating leases. Leveraged leases have been eliminated, although lessors can continue to account for existing leveraged leases using the current accounting guidance. Other limited changes were made to align lessor accounting with the lessee accounting model and the new revenue recognition standard. All entities will classify leases to determine how to recognize lease-related revenue and expense. Quantitative and qualitative disclosures will be required by lessees and lessors to meet the objective of enabling users of financial statements to assess the amount, timing, and uncertainty of cash flows arising from leases. The intention is to require enough information to supplement the amounts recorded in the financial statements so that users can understand more about the nature of an entity’s leasing activities. ASU No. 2016-02 is effective for interim and annual reporting periods beginning after December 15, 2018; early adoption is permitted. All entities are required to use a modified retrospective approach for leases that exist or are entered into after the beginning of the earliest comparative period in the financial statements. The Company is currently evaluating the provisions of ASU No. 2016-02 and will be closely monitoring developments and additional guidance to determine the potential impact the new standard will have on the Company's Consolidated Financial Statements.
In March 2016, the FASB issued ASU No. 2016-04, Liabilities – Extinguishments of Liabilities (Subtopic 405-20): Recognition of Breakage for Certain Prepaid Stored-Value Products. The amendments of this ASU narrowly address breakage, which is the monetary amount of the card that ultimately is not redeemed by the cardholder for prepaid stored-value products that are redeemable for monetary values of goods or services but may also be redeemable for cash. Examples of prepaid stored-value products included in this amendment are prepaid gift cards issued by specific payment networks and redeemable at network-accepting merchant locations, prepaid telecommunication cards, and traveler’s checks. The amendments in this update become effective for annual periods and interim periods within those annual periods beginning after December 15, 2017. The Company is currently evaluating the impact of adopting the new guidance on the Consolidated Financial Statements, but it is not expected to have a material impact.
In March 2016, the FASB issued ASU No. 2016-09, "Improvements to Employee Share-Based Payment Accounting.” This ASU includes provisions intended to simplify various aspects related to how share-based payments are accounted for and presented in the financial statements. Some of the key provisions of this new ASU include: (1) companies no longer record excess tax benefits and certain tax deficiencies in additional paid-in capital (“APIC”). Instead, they record all excess tax benefits and tax deficiencies as income tax expense or benefit in the income statement, and APIC pools are eliminated. The guidance also eliminates the requirement that excess tax benefits be realized before companies can recognize them. In addition, the guidance requires companies to present excess tax benefits as an operating activity on the statement of cash flows rather than as a financing activity; (2) increase the amount an employer can withhold to cover income taxes on awards and still qualify for the exception to liability classification for shares used to satisfy the employer’s statutory income tax withholding obligation. The new guidance requires an employer to classify the cash paid
29
CenterState Banks, Inc. and Subsidiaries
NOTES TO CONDENSED CONSOLIDATED FINANCIAL STATEMENTS (unaudited)
(in thousands of dollars, except per share data)
to a tax authority when shares are withheld to satisfy its statutory income tax withholding obligation as a financing activity on its statement of cash flows (previous guidance did not specify how these cash flows were to be classified); and (3) permit companies to make an accounting policy election for the impact of forfeitures on the recognition of expense for share-based payment awards. Forfeitures can be estimated, as required today, or recognized when they occur. ASU No. 2016-09 is effective for interim and annual reporting periods beginning after December 15, 2016. On January 1, 2017, the Company adopted this update which resulted in a reduction of income tax expense of approximately $1,083, or $0.02 per diluted earnings per share, for the three month period ending March 31, 2017. These excess tax benefits are also reported as an operating activity on the Condensed Consolidated Statement of Cash Flows. The Company also elected to recognize the impact of forfeitures when they occur.
In June 2016, the FASB issued ASU No. 2016-13, “Measurement of Credit Losses on Financial Instruments.” This ASU significantly changes how entities will measure credit losses for most financial assets and certain other instruments that aren’t measured at fair value through net income. In issuing the standard, the FASB is responding to criticism that today’s guidance delays recognition of credit losses. The standard will replace today’s “incurred loss” approach with an “expected loss” model. The new model, referred to as the current expected credit loss (“CECL”) model, will apply to: (1) financial assets subject to credit losses and measured at amortized cost, and (2) certain off-balance sheet credit exposures. This includes, but is not limited to, loans, leases, held-to-maturity securities, loan commitments, and financial guarantees. The CECL model does not apply to available-for-sale (“AFS”) debt securities. For AFS debt securities with unrealized losses, entities will measure credit losses in a manner similar to what they do today, except that the losses will be recognized as allowances rather than reductions in the amortized cost of the securities. As a result, entities will recognize improvements to estimated credit losses immediately in earnings rather than as interest income over time, as they do today. The ASU also simplifies the accounting model for purchased credit-impaired debt securities and loans. ASU 2016-13 also expands the disclosure requirements regarding an entity’s assumptions, models, and methods for estimating the allowance for loan and lease losses. In addition, entities will need to disclose the amortized cost balance for each class of financial asset by credit quality indicator, disaggregated by the year of origination. ASU No. 2016-13 is effective for interim and annual reporting periods beginning after December 15, 2019; early adoption is permitted for interim and annual reporting periods beginning after December 15, 2018. Entities will apply the standard’s provisions as a cumulative-effect adjustment to retained earnings as of the beginning of the first reporting period in which the guidance is effective (i.e., modified retrospective approach). The Company is currently evaluating the provisions of ASU No. 2016-13 to determine the potential impact the new standard will have on the Company's Consolidated Financial Statements.
In October 2016, the FASB issued ASU No. 2016-16, Income Taxes (Topic 740): Intra-Entity Transfers of Assets Other Than Inventory. Current guidance prohibits the recognition of current and deferred income taxes for an intra-entity asset transfer until the asset has been sold to an outside party. This prohibition on recognition is an exception to the principle of comprehensive recognition of current and deferred income taxes in generally accepted accounting principles. The exception has led to diversity in practice and is a source of complexity in financial reporting. FASB decided that an entity should recognize the income tax consequences of an intra-entity transfer of an asset other than inventory when the transfer occurs. Consequently, the amendments in this update eliminate the exception for an intra-entity transfer of an asset other than inventory. The amendments in this update do not include new disclosure requirements; however, existing disclosure requirements might be applicable when accounting for the current and deferred income taxes for an intra-entity transfer of an asset other than inventory. For public business entities, the amendments in this update are effective for annual reporting periods beginning after December 15, 2017, including interim reporting periods within those annual reporting periods. The amendments in this update should be applied on a modified retrospective basis through a cumulative-effect adjustment directly to retained earnings as of the beginning of the period of adoption. The Company is currently evaluating the impact of adopting the new guidance on the Consolidated Financial Statements, but it is not expected to have a material impact.
In January 2017, the FASB issued ASU No. 2017-01, Business Combinations (Topic 805): Clarifying the Definition of a Business. The amendments in this update provide a more robust framework to use in determining when a set of assets and activities is a business. Because the current definition of a business is interpreted broadly and can be difficult to apply, stakeholders indicated that analyzing transactions is inefficient and costly and that the definition does not permit the use of reasonable judgment. The amendments provide more consistency in applying the guidance, reduce the costs of application, and make the definition of a business more operable. The amendments in this update become effective for annual periods and interim periods within those annual periods beginning after December 15, 2017. The Company is currently evaluating the impact of adopting the new guidance on the Consolidated Financial Statements, but it is not expected to have a material impact.
In January 2017, the FASB issued ASU No. 2017-04, “Simplifying the Test for Goodwill Impairment”, to simplify how an entity is required to test goodwill for impairment by eliminating Step 2 from the goodwill impairment test. Step 2 measures a goodwill impairment loss by comparing the implied fair value of a reporting unit’s goodwill with the carrying amount of that goodwill. In computing the implied fair value of goodwill under Step 2, an entity had to perform procedures to determine the fair value at the impairment testing date of its assets and liabilities (including unrecognized assets and liabilities) following the procedure that would be required in determining the fair value of assets acquired and liabilities assumed in a business combination. Instead, under the
30
CenterState Banks, Inc. and Subsidiaries
NOTES TO CONDENSED CONSOLIDATED FINANCIAL STATEMENTS (unaudited)
(in thousands of dollars, except per share data)
amendments in this update, an entity should perform its annual, or interim, goodwill impairment test by comparing the fair value of a reporting unit with its carrying amount. An entity should recognize an impairment charge for the amount by which the carrying amount exceeds the reporting unit’s fair value; however, the loss recognized should not exceed the total amount of goodwill allocated to that reporting unit. Additionally, an entity should consider income tax effects from any tax deductible goodwill on the carrying amount of the reporting unit when measuring the goodwill impairment loss, if applicable. FASB also eliminated the requirements for any reporting unit with a zero or negative carrying amount to perform a qualitative assessment and, if it fails that qualitative test, to perform Step 2 of the goodwill impairment test. Therefore, the same impairment assessment applies to all reporting units. An entity is required to disclose the amount of goodwill allocated to each reporting unit with a zero or negative carrying amount of net assets.
An entity still has the option to perform the qualitative assessment for a reporting unit to determine if the quantitative impairment test is necessary. The amendments in this update become effective for annual periods and interim periods within those annual periods beginning after December 15, 2019. The Company is currently evaluating the impact of adopting the new guidance on the Consolidated Financial Statements, but it is not expected to have a material impact.
In March 2017, the FASB issued ASU No. 2017-08, “Premium Amortization on Purchased Callable Debt Securities”, to amend the amortization period for certain purchased callable debt securities held at a premium. Under current GAAP, entities generally amortize the premium as an adjustment of yield over the contractual life of the instrument. The amendments in this update require the premium to be amortized to the earliest call date. No accounting change is required for securities held at a discount. For public business entities, the amendments in this update become effective for annual periods, and interim periods within those annual periods, beginning after December 15, 2018. Early adoption is permitted, including adoption in an interim period. If an entity early adopts the amendments in an interim period, any adjustments should be reflected as of the beginning of the fiscal year that includes that interim period. An entity should apply the amendments in this update on a modified retrospective basis through a cumulative-effect adjustment directly to retained earnings as of the beginning of the period of adoption. The Company is currently evaluating the impact of adopting the new guidance on the Consolidated Financial Statements, but it is not expected to have a material impact.
NOTE 11: Subsequent Events
On April 1, 2017, the Company closed its previously announced acquisition of Platinum Bank Holding Company (“Platinum”) in Brandon, Florida. The purchase price was approximately $119,431 comprised of both stock and cash consideration. The Company’s primary reasons for the transaction were to further solidify its market share in the West Central Florida market and expand its customer base to enhance deposit fee income and leverage operating costs through economies of scale. During the first quarter of 2017, the Company incurred approximately $232 of acquisition costs related to this transaction. These acquisition costs are reported in merger and acquisition related expenses on the Company’s Condensed Consolidated Statements of Operations and Comprehensive Income. The majority of the acquisition costs for this transaction are expected to be recorded during the second quarter of 2017. Additional disclosures required by ASC 805 have been omitted because the information needed for the disclosures is not available due to the close proximity of the closing of this transaction with the date these financial statements are being issued. On March 31, 2017, Platinum, with seven banking locations, reported total assets of $606,155, gross loans of $463,149 and deposits of $518,614. Five banking locations were consolidated on April 20, 2017.
On May 1, 2017, the Company closed its previously announced acquisition of Gateway Financial Holdings of Florida, Inc. (“Gateway”) located in Daytona, Florida. The purchase price was approximately $157,372 comprised of both stock and cash consideration. The Company’s primary reasons for the transaction were to expand its market share in the Central Florida market, together with its acquisition of Platinum as described above, and expand its customer base to enhance deposit fee income and leverage operating cost through economies of scale. During the first quarter of 2017, the Company incurred approximately $627 of acquisition costs related to this transaction. These acquisition costs are reported in merger and acquisition related expenses on the Company’s Consolidated Statements of Operations and Comprehensive Income. The majority of the acquisition costs for this transaction are expected to be recorded during the second quarter of 2017. Additional disclosures required by ASC 805 have been omitted because the information needed for the disclosures is not available due to the close proximity of the closing of this transaction with the date these financial statements are being issued. On March 31, 2017, Gateway, with nine banking branch offices, reported total assets of $879,898, total loans of $571,549 and total deposits of $731,002.
31
ITEM 2:MANAGEMENT’S DISCUSSION AND ANALYSIS OF FINANCIAL CONDITION AND RESULTS OF OPERATIONS
(All dollar amounts presented herein are in thousands, except per share data, or unless otherwise noted.)
Cautionary Note Regarding Any Forward-Looking Statements
Some of the statements made in this report are “forward-looking statements” within the meaning of the Securities Act of 1933 (the “Securities Act”) and the Securities Exchange Act of 1934 (the “Exchange Act”). Forward-looking statements include statements with respect to our beliefs, plans, objectives, goals, expectations, anticipations, assumptions, estimates, intentions and future performance and involve known and unknown risks, uncertainties and other factors, many of which may be beyond our control and which may cause the actual results, performance or achievements of the Company to be materially different from future results, performance or achievements expressed or implied by such forward-looking statements.
All statements other than statements of historical fact are statements that could be forward-looking statements. You can identify these forward-looking statements through our use of words such as “may,” “will,” “anticipate,” “assume,” “should,” “indicate,” “would,” “believe,” “contemplate,” “expect,” “estimate,” “continue,” “plan,” “point to,” “project,” “predict,” “could,” “intend,” “target,” “potential” and other similar words and expressions of the future. These forward-looking statements may not be realized due to a variety of factors, including, without limitation, legislative and regulatory initiatives; additional competition in our markets; potential business strategies, including acquisitions or dispositions of assets or internal restructuring, that may be pursued by us; state and federal banking regulations; changes in or application of environmental and other laws and regulations to which we are subject; political, legal and economic conditions and developments; financial market conditions and the results of financing efforts; changes in commodity prices and interest rates; weather, natural disasters and other catastrophic events; and other factors discussed in our filings with the Securities and Exchange Commission under the Exchange Act.
All written or oral forward-looking statements that are made by or are attributable to us are expressly qualified in their entirety by this cautionary notice. Our forward-looking statements apply only as of the date of this report or the respective date of the document from which they are incorporated herein by reference. We have no obligation and do not undertake to update, revise or correct any of the forward-looking statements after the date of this report, or after the respective dates on which such statements otherwise are made, whether as a result of new information, future events or otherwise.
COMPARISON OF BALANCE SHEETS AT MARCH 31, 2017 AND DECEMBER 31, 2016
Overview
Our total assets increased approximately 5% from December 31, 2016 to March 31, 2017, which was primarily the result of deposit growth. Deposits increased $144,579, or 14% annualized, primarily in commercial checking. The growth in liquidity from the liability increases was used primarily to support the 11% annualized loan growth during the period. Our loan to deposit ratio was 81.9% and 82.6% at March 31, 2017 and December 31, 2016, respectively.
The Company completed the sale of 2,695,000 shares of common stock pursuant to a public offering which resulted in approximately $63.3 million in net proceeds on January 13, 2017. Tangible book value increased 12% from $8.93 at December 31, 2016 to $10.03 at March 31, 2017.
These changes are discussed and analyzed below and on the following pages.
Federal funds sold and Federal Reserve Bank deposits
Federal funds sold and Federal Reserve Bank deposits were $214,369 at March 31, 2017 (approximately 4% of total assets) as compared to $109,286 at December 31, 2016 (approximately 2% of total assets). We use our available-for-sale securities portfolio, as well as federal funds sold and Federal Reserve Bank deposits for liquidity management and for investment yields. These accounts, as a group, will fluctuate as a function of loans outstanding, and to some degree the amount of correspondent bank deposits (i.e. federal funds purchased) outstanding.
Investment securities available for sale
Securities available-for-sale, consisting primarily of U.S. government sponsored enterprises and municipal tax exempt securities, were $819,352 at March 31, 2017 (approximately 15% of total assets) compared to $740,702 at December 31, 2016 (approximately 15% of total assets), an increase of $78,650 or 11%. We use our available-for-sale securities portfolio, as well as federal funds sold and Federal Reserve Bank deposits for liquidity management and for investment yields. These accounts, as a group, will fluctuate as a function of loans outstanding as discussed above, under the caption “Federal funds sold and Federal Reserve Bank
32
deposits.” We classify the majority of our securities as “available for sale” to provide for greater flexibility to respond to changes in interest rates as well as future liquidity needs. Our available for sale securities are carried at fair value.
Trading securities
We also have a trading securities portfolio. Realized and unrealized gains and losses are included in trading securities revenue, a component of our non interest income, in our Condensed Consolidated Statement of Operations and Comprehensive Income. Securities purchased for this portfolio have primarily been various municipal securities. A list of the activity in this portfolio is summarized below.
| | Three month periods ended | |
| | Mar. 31, 2017 | | | Mar. 31, 2016 | |
Beginning balance | | $ | 12,383 | | | $ | 2,107 | |
Purchases | | | 25,934 | | | | 47,734 | |
Proceeds from sales | | | (38,398 | ) | | | (47,476 | ) |
Net realized gain on sales | | | 81 | | | 326 | |
Net unrealized gains | | | — | | | 28 | |
Ending balance | | $ | — | | | $ | 2,719 | |
Investment securities held to maturity
At March 31, 2017, we had $243,812 (unamortized cost basis) of securities with an estimated fair value of $238,348, resulting in a net unrecognized loss of $5,464, compared to $250,543 (unamortized cost basis) of securities with an estimated fair value of $242,693 and a net unrecognized loss of $7,850 at December 31, 2016. This portfolio generally holds longer term securities for the primary purpose of yield. This classification was chosen to minimize temporary effects on our tangible equity and tangible equity ratio due to increases and decreases in general market interest rates.
Loans held for sale
We also have a loans held for sale portfolio, whereby we originate single family home loans and sell those mortgages into the secondary market, servicing released. These loans are recorded at the lower of cost or market. Gains and losses on the sale of loans held for sale are included as a component of non-interest income in our Condensed Consolidated Statement of Operations and Comprehensive Income. A list of the activity in this portfolio is summarized below.
| | Three month periods ended | |
| | Mar. 31, 2017 | | | Mar. 31, 2016 | |
Beginning balance | | $ | 2,285 | | | $ | 1,529 | |
Effect from acquisitions | | | — | | | | 732 | |
Loans originated | | | 10,722 | | | | 5,425 | |
Proceeds from sales | | | (10,601 | ) | | | (5,598 | ) |
Net realized gain on sales | | | 231 | | | 98 | |
Ending balance | | $ | 2,637 | | | $ | 2,186 | |
Loans
Lending-related income is the most important component of our net interest income and is a major contributor to profitability. The loan portfolio is the largest component of earning assets, and it therefore generates the largest portion of revenues. The absolute volume of loans and the volume of loans as a percentage of earning assets is an important determinant of net interest margin as loans are expected to produce higher yields than securities and other earning assets. Average loans during the three month period ended March 31, 2017, were $3,483,481 or 74.1% of average earning assets, as compared to $2,784,238, or 71.4% of average earning assets, for the three month period ending March 31, 2016. Total loans at March 31, 2017 and December 31, 2016 were $3,520,004 and $3,429,747, respectively. This represents a loan to total asset ratio of 66.1% and 67.5% and a loan to deposit ratio of 81.9% and 82.6%, at March 31, 2017 and December 31, 2016, respectively.
Non-PCI loans
At March 31, 2017, we have total Non-PCI loans of $3,343,946. Total new loans originated during the three month period ended March 31, 2017 approximated $306.1 million, of which $266.9 million were funded at the time of origination. The weighted average tax equivalent interest rate on funded loans was approximately 4.05% during the three month period. The loan origination pipeline is approximately $460 million at March 31, 2017 compared to $372 million at December 31, 2016.
33
The graph below summarizes new loan originations and funded loan production over the past nine quarters.
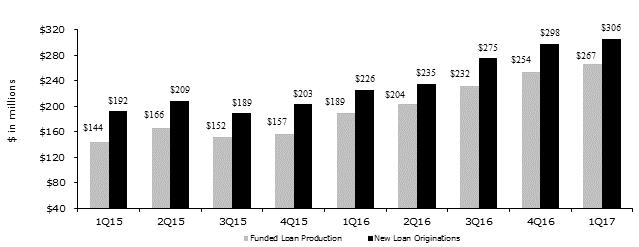
PCI loans
Total Purchased Credit Impaired (“PCI”) loans at March 31, 2017 were $176,058 compared to $185,924 at December 31, 2016.
Loan concentrations are considered to exist where there are amounts loaned to multiple borrowers engaged in similar activities, which collectively could be similarly impacted by economic or other conditions and when the total of such amounts would exceed 25% of total capital. Due to the lack of diversified industry and the relative proximity of markets served, the Company has concentrations in geographic as well as in types of loans funded.
Total loans at March 31, 2017 were $3,520,004. Of this amount, approximately 84.2% are collateralized by real estate, 13.3% are commercial non real estate loans and the remaining 2.5% are consumer and other non real estate loans. We have $885,771 of single family residential loans which represents about 25% of our total loan portfolio. Our largest category of loans is commercial real estate which represents approximately 54.5% of our total loan portfolio.
The following table sets forth information concerning the loan portfolio by collateral types as of the dates indicated.
| | March 31, 2017 | | | December 31, 2016 | |
Loans excluding PCI loans | | | | | | | | |
Real estate loans | | | | | | | | |
Residential | | $ | 818,537 | | | $ | 816,304 | |
Commercial | | | 1,824,100 | | | | 1,755,922 | |
Land, development and construction | | | 148,585 | | | | 142,044 | |
Total real estate | | | 2,791,222 | | | | 2,714,270 | |
Commercial | | | 462,925 | | | | 439,540 | |
Consumer and other loans | | | 88,941 | | | | 89,538 | |
Loans before unearned fees and deferred cost | | | 3,343,088 | | | | 3,243,348 | |
Net unearned fees and costs | | | 858 | | | | 475 | |
Total loans excluding PCI loans | | | 3,343,946 | | | | 3,243,823 | |
PCI loans (note 1) | | | | | | | | |
Real estate loans | | | | | | | | |
Residential | | | 67,234 | | | | 72,179 | |
Commercial | | | 94,751 | | | | 99,566 | |
Land, development and construction | | | 9,522 | | | | 9,944 | |
Total real estate | | | 171,507 | | | | 181,689 | |
Commercial | | | 4,177 | | | | 3,825 | |
Consumer and other loans | | | 374 | | | | 410 | |
Total PCI loans | | | 176,058 | | | | 185,924 | |
Total loans | | | 3,520,004 | | | | 3,429,747 | |
Allowance for loan losses for loans that are not PCI loans | | | (27,521 | ) | | | (26,569 | ) |
Allowance for loan losses for PCI loans | | | (298 | ) | | | (472 | ) |
Total loans, net of allowance for loan losses | | $ | 3,492,185 | | | $ | 3,402,706 | |
note 1: | PCI loans are accounted for pursuant to ASC Topic 310-30. |
34
The table below summarizes the Company’s loan mix for the periods presented.
| | March 31, 2017 | | | December 31, 2016 | |
Originated Loans | | | | | | | | |
Real estate loans | | | | | | | | |
Residential | | $ | 574,494 | | | $ | 552,749 | |
Commercial | | | 1,201,768 | | | | 1,112,149 | |
Land, development and construction loans | | | 125,115 | | | | 115,983 | |
Total real estate loans | | | 1,901,377 | | | | 1,780,881 | |
Commercial loans | | | 407,884 | | | | 382,009 | |
Consumer and other loans | | | 86,902 | | | | 87,266 | |
Total loans before unearned fees and costs | | | 2,396,163 | | | | 2,250,156 | |
Unearned fees and costs | | | 858 | | | | 475 | |
Total originated loans | | | 2,397,021 | | | | 2,250,631 | |
| | | | | | | | |
Acquired Loans (1) | | | | | | | | |
Real estate loans | | | | | | | | |
Residential | | | 244,043 | | | | 263,555 | |
Commercial | | | 622,332 | | | | 643,773 | |
Land, development and construction loans | | | 23,470 | | | | 26,061 | |
Total real estate loans | | | 889,845 | | | | 933,389 | |
Commercial loans | | | 55,041 | | | | 57,531 | |
Consumer and other loans | | | 2,039 | | | 2272 | |
Total acquired loans | | | 946,925 | | | | 993,192 | |
| | | | | | | | |
PCI loans | | | | | | | | |
Real estate loans | | | | | | | | |
Residential | | | 67,234 | | | | 72,179 | |
Commercial | | | 94,751 | | | | 99,566 | |
Land, development and construction loans | | | 9,522 | | | | 9,944 | |
Total real estate loans | | | 171,507 | | | | 181,689 | |
Commercial loans | | | 4,177 | | | | 3,825 | |
Consumer and other loans | | 374 | | | 410 | |
Total PCI loans | | | 176,058 | | | | 185,924 | |
| | | | | | | | |
Total Loans | | $ | 3,520,004 | | | $ | 3,429,747 | |
| (1) | Acquired loans include the non-PCI loans purchased pursuant to the following acquisitions: |
| • | Branch and loan transaction from TD Bank (year 2011); |
| • | Federal Trust Bank acquisition (year 2011); |
| • | Gulfstream Business Bank acquisition (year 2014); |
| • | First Southern Bank acquisition (year 2014); |
| • | Community Bank of South Florida acquisition (year 2016); and |
| • | Hometown of Homestead Banking Company acquisition (year 2016). |
Credit quality and allowance for loan losses
We maintain an allowance for loan losses that we believe is adequate to absorb probable losses incurred in our loan portfolio. The allowance is increased by the provision for loan losses, which is a charge to current period earnings and decreased by loan charge-offs net of recoveries of prior period loan charge-offs. Loans are charged against the allowance when management believes collection of the principal is unlikely.
The allowance consists of three components. The first component is an allocation for impaired loans, as defined by ASC 310. Impaired loans are those loans whereby management has arrived at a determination that the Company will not be repaid according to the original terms of the loan agreement. Each of these loans is required to have a written analysis supporting the amount of specific allowance allocated to the particular loan, if any. That is to say, a loan may be impaired (i.e., not expected to be repaid as agreed), but may be sufficiently collateralized such that we expect to recover all principal and interest eventually, and therefore no specific allowance is warranted.
35
Commercial, commercial real estate, land, land development and construction loans in excess of $500 are monitored and evaluated for impairment on an individual loan basis. Commercial, commercial real estate, land, land development and construction loans less than $500 are evaluated for impairment on a pool basis. All consumer and single family residential loans are evaluated for impairment on a pool basis.
On at least a quarterly basis, management reviews each impaired loan to determine whether it should have a specific reserve or partial charge-off. Management relies on appraisals to help make this determination. Updated appraisals are obtained for collateral dependent loans when a loan is scheduled for renewal or refinance. In addition, if the classification of the loan is downgraded to substandard, identified as impaired, or placed on nonaccrual status (collectively “Problem Loans”), an updated appraisal is obtained if the loan amount is greater than $500 and individually evaluated for impairment.
After an updated appraisal is obtained for a Problem Loan, as described above, an additional updated appraisal will be obtained on at least an annual basis. Thus, current appraisals for Problem Loans in excess of $500 will not be older than one year.
After the initial updated appraisal is obtained for a Problem Loan and before its next annual appraisal update is due, management considers the need for a downward adjustment to the current appraisal amount to reflect current market conditions, based on management’s analysis, judgment and experience. In an extremely volatile market, we may update the appraisal prior to the one year anniversary date.
The second component is a general allowance on all of the Company’s loans other than PCI loans and those identified as impaired. The general component covers non-impaired loans and is based on historical loss experience adjusted for current factors. The historical loss experience is determined by portfolio segment and is based on the actual loss history experienced by the Company over the most recent two years. The portfolio segments identified by the Company are residential loans, commercial real estate loans, construction and land development loans, commercial and industrial and consumer and other. This actual loss experience is supplemented with other economic factors based on the risks present for each portfolio segment. These economic, or qualitative, factors include consideration of the following: levels of and trends in delinquencies and impaired loans; levels of and trends in charge-offs and recoveries; trends in volume and terms of loans; effects of any changes in risk selection and underwriting standards; other changes in lending policies, procedures, and practices; experience, ability, and depth of lending management and other relevant staff; national and local economic trends and conditions; industry conditions; levels and trends in special mention and substandard loans; and effects of changes in credit concentrations.
The third component consists of amounts reserved for purchased credit impaired loans. On a quarterly basis, the Company updates the amount of loan principal and interest cash flows expected to be collected, incorporating assumptions regarding default rates, loss severities, the amounts and timing of prepayments and other factors that are reflective of current market conditions. Probable decreases in expected loan principal cash flows trigger the recognition of impairment, which is then measured as the present value of the expected principal loss plus any related foregone interest cash flows discounted at the pool’s effective interest rate. Impairments that occur after the acquisition date are recognized through the provision for loan losses. Probable and significant increases in expected principal cash flows would first reverse any previously recorded allowance for loan losses; any remaining increases are recognized prospectively as interest income. The impacts of (i) prepayments, (ii) changes in variable interest rates, and (iii) any other changes in the timing of expected cash flows are recognized prospectively as adjustments to interest income. Disposals of loans, which may include sales of loans, receipt of payments in full by the borrower, or foreclosure, result in removal of the loan from the PCI portfolio. The aggregate of these three components results in our total allowance for loan losses.
36
In the table below we have shown the components, as discussed above, of our allowance for loan losses at March 31, 2017 and December 31, 2016.
| Mar. 31, 2017 | | | Dec. 31, 2016 | | | increase (decrease) |
| Loan | | ALLL | | | | | | Loan | | ALLL | | | | | | Loan | | ALLL | | |
| balance | | balance | | % | | | balance | | balance | | % | | | balance | | balance | | |
Originated loans | $ | 2,380,220 | | $ | 24,129 | | | 1.01 | % | | $ | 2,232,474 | | $ | 22,934 | | | 1.03 | % | | $ | 147,746 | | $ | 1,195 | | | (2 | ) | bps |
Impaired originated loans | | 16,801 | | | 583 | | | 3.47 | % | | | 18,157 | | | 652 | | | 3.59 | % | | | (1,356 | ) | | (69 | ) | | (12 | ) | bps |
Total originated loans | | 2,397,021 | | | 24,712 | | | 1.03 | % | | | 2,250,631 | | | 23,586 | | | 1.05 | % | | | 146,390 | | | 1,126 | | | (2 | ) | bps |
| | | | | | | | | | | | | | | | | | | | | | | | | | | | | | |
Acquired loans (2) | | 945,120 | | | 2,769 | | | 0.29 | % | | | 991,096 | | | 2,940 | | | 0.30 | % | | | (45,976 | ) | | (171 | ) | | (1 | ) | bps |
Impaired acquired loans (1) | | 1,805 | | 40 | | | 2.22 | % | | | 2,096 | | 43 | | | 2.05 | % | | | (291 | ) | | (3 | ) | | 17 | | bps |
Total acquired loans | | 946,925 | | | 2,809 | | | 0.30 | % | | | 993,192 | | | 2,983 | | | 0.30 | % | | | (46,267 | ) | | (174 | ) | – | | bps |
| | | | | | | | | | | | | | | | | | | | | | | | | | | | | | |
Total non-PCI loans | | 3,343,946 | | | 27,521 | | | | | | | 3,243,823 | | | 26,569 | | | | | | | 100,123 | | | 952 | | |
PCI loans | | 176,058 | | | 298 | | | | | | | 185,924 | | | 472 | | | | | | | (9,866 | ) | | (174 | ) | | | | |
Total loans | $ | 3,520,004 | | $ | 27,819 | | | | | | $ | 3,429,747 | | $ | 27,041 | | | | | | $ | 90,257 | | $ | 778 | | |
(1) | These are loans that were acquired as performing loans that subsequently became impaired. |
(2) | These are performing acquired loans that were recorded at estimated fair value on the related acquisition dates. The total net unamortized fair value adjustment at March 31, 2017 was approximately $13,718 or 1.4% of the aggregate outstanding related loan balances. Prior to March 31, 2016, the Company did not previously include loans acquired pursuant to the TD Bank and Federal Trust acquisitions that occurred in 2011. Acquired loans currently include performing loans acquired from the TD Bank acquisition (year 2011), the Federal Trust acquisition (year 2011), the Gulfstream Bank acquisition (year 2014), the First Southern Bank acquisition (year 2014), the Community Bank acquisition (year 2016) and the Hometown of Homestead Banking Company acquisition (year 2016). |
The general loan loss allowance relating to originated loans increased by $1,126 resulting primarily from an increase in loans outstanding of $146,390. Net changes resulting from a mixture of decreases and increases in the Company’s various two year historical loss factors and qualitative factors also slightly affected the net change.
The general loan loss allowance relating to acquired loans decreased by $174 resulting primarily from a decline in loans outstanding of $46,267. Acquired loans include loans from the two bank acquisitions (Community Bank and Hometown of Homestead Banking Company), as discussed above in note 2, and were recorded at estimated fair value at the March 1, 2016 acquisition date. As of the end of the current quarter, the Company has a 13 month history with the performing loans acquired from Community and Hometown. Management evaluated the performance of these groups of loans over the period subsequent to the acquisition date and considered the accretion of the credit discount, levels of and trends in nonperforming loans, past-due loans, adverse loan grade classification changes, net charge-offs and impaired loans. The loans acquired from Community and Hometown are performing as expected and therefore no provision for loan loss was recorded for these loans as of March 31, 2017.
The specific loan loss allowance (impaired loans) for both originated loans and acquired loans is the aggregate of the results of individual analyses prepared for each one of the impaired loans, excluding PCI loans. Total impaired loans at March 31, 2017 are equal to $18,606 ($16,801 originated impaired loans plus $1,805 acquired impaired loans).
The Company recorded partial charge offs in lieu of specific allowance for a number of the impaired loans. The Company’s impaired loans have been written down by $1,717 to $18,606 ($17,983 when the $623 specific allowance is considered) from their legal unpaid principal balance outstanding of $20,323. In the aggregate, total impaired loans have been written down to approximately 88% of their legal unpaid principal balance, and non-performing impaired loans have been written down to approximately 85% of their legal unpaid principal balance. Approximately $9,860 of the Company’s impaired loans, or 53% of total impaired loans, are accruing performing loans. This group of impaired loans is not included in the Company’s non-performing loans or non-performing assets categories.
PCI loans are accounted for pursuant to ASC Topic 310-30. PCI loan pools are evaluated for impairment each quarter. If a pool is impaired, an allowance for loan loss is recorded.
The allowance is increased by the provision for loan losses, which is a charge to current period earnings and decreased by loan charge-offs net of recoveries of prior period loan charge-offs. Loans are charged against the allowance when management believes collection of the principal is unlikely. We believe our allowance for loan losses was adequate at March 31, 2017. However, we
37
recognize that many factors can adversely impact various segments of the Company’s markets and customers, and therefore there is no assurance as to the amount of losses or probable losses which may develop in the future.
The tables below summarize the changes in allowance for loan losses during the periods presented.
| | Allowance for loan losses for loans that are not PCI loans | | | Allowance for loan losses on PCI loans | | | Total | |
Three months ended March 31, 2017 | | | | | | | | | | | | |
Balance at beginning of period | | $ | 26,569 | | | $ | 472 | | | $ | 27,041 | |
Loans charged-off | | | (902 | ) | | | — | | | | (902 | ) |
Recoveries of loans previously charged-off | | | 685 | | | | — | | | | 685 | |
Net charge-offs | | | (217 | ) | | | — | | | | (217 | ) |
Provision for loan losses | | | 1,169 | | | | (174 | ) | | | 995 | |
Balance at end of period | | $ | 27,521 | | | $ | 298 | | | $ | 27,819 | |
| | | | | | | | | | | | |
Three months ended March 31, 2016 | | | | | | | | | | | | |
Balance at beginning of period | | $ | 22,143 | | | $ | 121 | | | $ | 22,264 | |
Loans charged-off | | | (495 | ) | | | — | | | | (495 | ) |
Recoveries of loans previously charged-off | | | 843 | | | | — | | | | 843 | |
Net recoveries | | | 348 | | | | — | | | | 348 | |
Provision for loan losses | | | 511 | | | | (1 | ) | | | 510 | |
Balance at end of period | | $ | 23,002 | | | $ | 120 | | | $ | 23,122 | |
Nonperforming loans and nonperforming assets
Non-performing loans exclude PCI loans and are defined as non-accrual loans plus loans past due 90 days or more and still accruing interest. Generally, we place loans on non-accrual status when they are past due 90 days and management believes the borrower’s financial condition, after giving consideration to economic conditions and collection efforts, is such that collection of interest is doubtful. When we place a loan on non-accrual status, interest accruals cease and uncollected interest is reversed and charged against current income. Interest received on such loans is accounted for on the cash-basis or cost-recovery method, until qualifying for return to accrual. Loans are returned to accrual status when all the principal and interest amounts contractually due are brought current and future payments are reasonably assured. Non-performing loans, as defined above, as a percentage of total non-PCI loans, were 0.53% at March 31, 2017, compared to 0.59% at December 31, 2016.
Non-performing assets (which we define as non-performing loans, as defined above, plus (a) OREO (i.e., real estate acquired through foreclosure, in substance foreclosure, or deed in lieu of foreclosure); and (b) other repossessed assets that are not real estate), were $24,888 at March 31, 2017, compared to $26,207 at December 31, 2016. Non-performing assets as a percentage of total assets were 0.47% at March 31, 2017, compared to 0.52% at December 31, 2016. The table below summarizes selected credit quality data at the dates indicated.
The table below summarizes selected credit quality data at the dates indicated.
| Mar. 31, 2017 | | | Dec. 31, 2016 | |
Non-accrual loans (note 1) | $ | 17,569 | | | $ | 19,003 | |
Accruing loans 90 days or more past due (note 1) | | — | | | | — | |
Total non-performing loans ("NPLs") (note 1) | | 17,569 | | | | 19,003 | |
Other real estate owned ("OREO") | | 7,201 | | | | 7,090 | |
Repossessed assets other than real estate ("ORAs") (note 1) | | 118 | | | 114 | |
Total NPAs | $ | 24,888 | | | $ | 26,207 | |
| | | | | | | |
NPLs as percentage of total loans (note 1) | | 0.53 | % | | | 0.59 | % |
NPAs as percentage of total assets | | 0.47 | % | | | 0.52 | % |
NPAs as percentage of loans and OREO and ORAs (note 1) | | 0.74 | % | | | 0.81 | % |
30-89 days past due accruing loans as percentage of total loans (note 1) | | 0.47 | % | | | 0.58 | % |
Allowance for loan losses as percentage of NPLs (note 1) | | 157 | % | | | 140 | % |
note 1: | Excludes PCI loans. |
38
As shown in the table above, the largest component of non-performing loans is non-accrual loans. As of March 31, 2017 the Company had non-accrual loans with an aggregate book value of $17,569 compared to December 31, 2016 when an aggregate book value of $19,003 was reported.
The second largest component of non-performing assets after non-accrual loans is OREO. At March 31, 2017, total OREO was $7,201 compared to $7,090 at December 31, 2016. OREO is carried at the lower of cost or market less the estimated cost to sell. Further declines in real estate values can affect the market value of these assets. Any further decline in market value beyond its cost basis is recorded as a current expense in the Company’s Condensed Consolidated Statement of Income and Comprehensive Income.
Impaired loans are defined as loans that management has determined will not repay as agreed pursuant to the terms of the related loan agreement. Small balance homogeneous loans are not considered for impairment purposes. Once management has determined a loan is impaired, we perform a specific reserve analysis to determine if it is probable that we will eventually collect all contractual cash flows. If management determines that a shortfall is probable, then a specific valuation allowance is placed against the loan. This loan is then placed on non-accrual basis, even if the borrower is current with his/her contractual payments, and will remain on non-accrual until payments collected reduce the loan balance such that it eliminates the specific valuation allowance or equivalent partial charge-down or other economic conditions change. At March 31, 2017 we have identified a total of $18,606 impaired loans, excluding PCI loans. A specific valuation allowance of $623 has been attached to $4,037 of impaired loans included in the total $18,606 of identified impaired loans. It should also be noted that the total carrying balance of the impaired loans, or $18,606, has been partially charged down by $1,717 from their aggregate legal unpaid balance of $20,323.
The table below summarizes impaired loan data for the periods presented.
| Mar. 31, 2017 | | | Dec. 31, 2016 | |
Impaired loans with a specific valuation allowance | $ | 4,037 | | | $ | 4,984 | |
Impaired loans without a specific valuation allowance | | 14,569 | | | | 15,269 | |
Total impaired loans | $ | 18,606 | | | $ | 20,253 | |
| | | | | | | |
Performing TDRs (these are not included in NPLs) | $ | 10,976 | | | $ | 11,030 | |
Non performing TDRs (these are included in NPLs) | | 1,295 | | | | 2,075 | |
Total TDRs | | 12,271 | | | | 13,105 | |
Impaired loans that are not TDRs | | 6,335 | | | | 7,148 | |
Total impaired loans | $ | 18,606 | | | $ | 20,253 | |
Bank premises and equipment
Bank premises and equipment was $115,400 at March 31, 2017 compared to $114,815 at December 31, 2016, an increase of $585 or 0.5%. A summary of our bank premises and equipment for the period end indicated is presented in the table below.
| Mar. 31, 2017 | | | Dec. 31, 2016 | |
Land | $ | 40,952 | | | $ | 40,952 | |
Land improvements | | 1,177 | | | 1146 | |
Buildings | | 71,242 | | | | 71,069 | |
Leasehold improvements | | 5,359 | | | | 5,310 | |
Furniture, fixtures and equipment | | 35,955 | | | | 34,912 | |
Construction in progress | | 3,849 | | | | 2,878 | |
Subtotal | | 158,534 | | | | 156,267 | |
Less: accumulated depreciation | | 43,134 | | | | 41,452 | |
Total | $ | 115,400 | | | $ | 114,815 | |
Our branch real estate held for sale at March 31, 2017 and December 31, 2016 was $5,307 and $8,599, respectively, a net decrease of $3,292. We sold three properties during the quarter and received net proceeds of $3,344.
Interest Rate Swap Derivatives
The Company enters into interest rate swaps in order to provide commercial loan clients the ability to swap from fixed to variable interest rates. Under these agreements, the Company enters into a fixed-rate loan with a client in addition to a swap agreement. This swap agreement effectively converts the client’s fixed rate loan into a variable rate. The Company then enters into a matching swap agreement with a third party dealer in order to offset its exposure on the customer swap. The fair value of interest rate swap derivatives (asset component) was $35,107 at March 31, 2017 compared to $31,817 at December 31, 2016. The fair value of interest rate swap derivatives (liability component) was $35,979 at March 31, 2017 compared to $32,691 at December 31, 2016.
39
Deposits
Total deposits were $4,297,123 at March 31, 2017 compared to $4,152,544 at December 31, 2016, an increase of $144,579, or approximately 14% on an annualized basis. Non-time deposits increased $167,059 during the period. The increase in non-time deposits was offset by the continued decline in time deposits, which decreased $22,480 during the period. The majority of the increase in non-time deposits during the period was in commercial checking accounts. The cost of interest bearing deposits in the current quarter is 0.28%, the same as the fourth quarter of 2016. The overall cost of total deposits (i.e. includes non-interest bearing checking accounts) in the current quarter was 0.18%, the same as the fourth quarter of 2016. The table below summarizes the Company’s deposit mix for the periods presented.
| | | | | % of | | | | | | | % of | |
| Mar. 31, 2017 | | | total | | | Dec. 31, 2016 | | | total | |
Demand - non-interest bearing | $ | 1,585,963 | | | | 37 | % | | $ | 1,426,624 | | | | 34 | % |
Demand - interest bearing | | 893,945 | | | | 21 | % | | | 917,004 | | | | 22 | % |
Savings deposits | | 384,202 | | | | 9 | % | | | 362,947 | | | | 9 | % |
Money market accounts | | 910,056 | | | | 21 | % | | | 900,532 | | | | 22 | % |
Time deposits | | 522,957 | | | | 12 | % | | | 545,437 | | | | 13 | % |
Total deposits | $ | 4,297,123 | | | | 100 | % | | $ | 4,152,544 | | | | 100 | % |
.
Securities sold under agreement to repurchase
Our Bank enters into borrowing arrangements with our retail business customers by agreements to repurchase (“securities sold under agreements to repurchase”) under which the Bank pledges investment securities owned and under their control as collateral against these one-day borrowing arrangement. These short-term borrowings totaled $37,866 at March 31, 2017 compared to $28,427 at December 31, 2016.
Federal funds purchased
Federal funds purchased are overnight deposits from correspondent banks. Federal funds purchased acquired from other than our correspondent bank deposits are included with Federal Home Loan Bank advances and other borrowed funds as described below, if any. At March 31, 2017 we had $268,377 of correspondent bank deposits or federal funds purchased, compared to $261,986 at December 31, 2016.
Federal Home Loan Bank advances and other borrowed funds
From time to time, we borrow either through Federal Home Loan Bank advances or Federal Funds Purchased, other than correspondent bank deposits (i.e. federal funds purchased) listed above. We had no advances from the Federal Home Loan Bank during the periods ending March 31, 2017 and December 31, 2016.
Corporate debentures
Below is a schedule of statutory trust entities and the related corporate debentures formed and assumed through various acquisitions:
| | | | | |
| Amount | | Interest Rate | | Maturity |
CenterState Banks of Florida Statutory Trust I | $10,000 | | LIBOR + 3.05% | | Sep. 2033 |
Valrico Capital Statutory Trust | $2,500 | | LIBOR + 2.70% | | Sep. 2034 |
Federal Trust Statutory Trust I | $5,000 | | LIBOR + 2.95% | | Sep. 2033 |
Gulfstream Bancshares Capital Trust II | $3,000 | | LIBOR + 1.70% | | Mar. 2037 |
Homestead Statutory Trust I | $10,000 | | LIBOR + 1.65% | | Oct. 2036 |
40
Stockholders’ equity
Stockholders’ equity at March 31, 2017, was $634,401, or 11.9% of total assets, compared to $552,457, or 10.9% of total assets at December 31, 2016. The increase in stockholders’ equity was due to the following items:
Total stockholders' equity at December 31, 2016 | $ | 552,457 | |
Net income during the period | | 16,600 | |
Dividends paid on common shares ($0.06 per share) | | (3,067 | ) |
Net increase in market value of securities available for sale, net of deferred taxes | | 3,199 | |
Stock options exercised | | 1,348 | |
Equity based compensation | | 1,345 | |
Stock repurchase (30,474 shares, average price of $24.38 per share) | | (743 | ) |
Net proceeds from stock issued pursuant to public offering | | 63,262 | |
Total stockholders' equity at March 31, 2017 | $ | 634,401 | |
The Company and the Bank are subject to various regulatory capital requirements administered by the federal banking agencies. Under capital adequacy guidelines and the regulatory framework for prompt corrective action, the Company and the Bank must meet specific capital guidelines that involve quantitative measures of assets, liabilities and certain off-balance-sheet items as calculated under regulatory accounting practices. The capital amounts and classification are also subject to qualitative judgments by the regulators about components, risk weightings and other factors. Failure to meet minimum capital requirements can initiate certain mandatory and possibly additional discretionary actions by regulators that, if undertaken, could have a direct material effect on the Company’s consolidated financial statements. The final rules implementing Basel Committee on Banking Supervision’s capital guidelines for U.S. banks (Basel III rules) became effective for the Company on January 1, 2015 with full compliance with all of the requirements being phased in over a multi-year schedule, and fully phased in by January 1, 2019. Under these rules, banks are required to maintain a minimum CET1 ratio of 4.5%, a minimum Tier 1 capital to risk-weighted assets of 6%, a total risk-based capital ratio of 8%, and a minimum leverage capital ratio of 4%. In addition, the rules require a capital conservation buffer of up to 2.5% above each of CET1, tier 1, and total risk-based capital which must be met for a bank to be able to pay dividends, engage in share buybacks or make discretionary bonus payments to executive management without restriction. This capital conservation buffer
is being phased in over a four year period starting on January 1, 2016 and was 0.625% in 2016 and 1.25% as of January 1, 2017. When fully implemented, a banking organization would need to maintain a CET1 capital ratio of at least 7%, a total Tier 1 capital ratio of at least 8.5% and a total risk-based capital ratio of at least 10.5%. The net unrealized gain or loss on available for sale securities is not included in computing regulatory capital.
Quantitative measures established by regulation to ensure capital adequacy require the Company and the Bank to maintain minimum amounts and ratios (set forth in the table below) of total capital, Tier I capital and CET1 (as defined in the regulations) to risk-weighted assets. Management believes, as of March 31, 2017, that the Company and the Bank meet all capital adequacy requirements to which they are subject.
41
Selected consolidated capital ratios at March 31, 2017 and December 31, 2016 for the Company and the Bank are presented in the tables below. The ratios for capital adequacy purposes do not include capital conservation buffer requirements.
CenterState Banks, Inc. (the Company) | | Actual | | | Capital Adequacy | | Excess | |
| | Amount | | | Ratio | | | Amount | | | Ratio | | Amount | |
March 31, 2017 | | | | | | | | | | | | | | | | | | |
Total capital (to risk weighted assets) | | $ | 557,718 | | | | 14.1 | % | | $ | 315,319 | | | >8.0% | | $ | 242,399 | |
Tier 1 capital (to risk weighted assets) | | | 529,898 | | | | 13.4 | % | | | 236,489 | | | >6.0% | | | 293,409 | |
Common equity Tier 1 capital (to risk weighted assets) | | | 503,782 | | | | 12.8 | % | | | 177,367 | | | >4.5% | | | 326,415 | |
Tier 1 capital (to average assets) | | | 529,898 | | | | 10.4 | % | | | 203,005 | | | >4.0% | | | 326,893 | |
| | | | | | | | | | | | | | | | | | |
December 31, 2016 | | | | | | | | | | | | | | | | | | |
Total capital (to risk weighted assets) | | $ | 479,966 | | | | 12.5 | % | | $ | 306,281 | | | >8.0% | | $ | 173,685 | |
Tier 1 capital (to risk weighted assets) | | | 452,925 | | | | 11.8 | % | | | 229,711 | | | >6.0% | | | 223,214 | |
Common equity Tier 1 capital (to risk weighted assets) | | | 431,546 | | | | 11.3 | % | | | 172,283 | | | >4.5% | | | 259,263 | |
Tier 1 capital (to average assets) | | | 452,925 | | | | 9.1 | % | | | 198,891 | | | >4.0% | | | 254,034 | |
| | | | | | | | | | | | | | | | | | |
CenterState Bank of Florida, N.A. | | Actual | | | Well Capitalized | | Excess | |
| | Amount | | | Ratio | | | Amount | | | Ratio | | Amount | |
March 31, 2017 | | | | | | | | | | | | | | | | | | |
Total capital (to risk weighted assets) | | $ | 467,215 | | | | 11.9 | % | | $ | 393,959 | | | >10.0% | | $ | 73,256 | |
Tier 1 capital (to risk weighted assets) | | | 439,402 | | | | 11.2 | % | | | 315,167 | | | >8.0% | | | 124,235 | |
Common equity Tier 1 capital (to risk weighted assets) | | | 439,402 | | | | 11.2 | % | | | 256,073 | | | >6.5% | | | 183,329 | |
Tier 1 capital (to average assets) | | | 439,402 | | | | 8.6 | % | | | 254,113 | | | >5.0% | | | 185,289 | |
| | | | | | | | | | | | | | | | | | |
December 31, 2016 | | | | | | | | | | | | | | | | | | |
Total capital (to risk weighted assets) | | $ | 451,152 | | | | 11.8 | % | | $ | 382,682 | | | >10.0% | | $ | 68,470 | |
Tier 1 capital (to risk weighted assets) | | | 424,118 | | | | 11.1 | % | | | 306,145 | | | >8.0% | | | 117,973 | |
Common equity Tier 1 capital (to risk weighted assets) | | | 424,118 | | | | 11.1 | % | | | 248,743 | | | >6.5% | | | 175,375 | |
Tier 1 capital (to average assets) | | | 424,118 | | | | 8.5 | % | | | 248,565 | | | >5.0% | | | 175,553 | |
42
COMPARISON OF RESULTS OF OPERATIONS FOR THE THREE MONTH PERIODS ENDED MARCH 31, 2017 AND 2016
Overview
We recognized net income of $16,600 or $0.33 per share basic and $0.32 per share diluted for the three month period ended March 31, 2017, compared to net loss of $4,804 or $0.10 per share basic and diluted for the same period in 2016. A summary of the differences are listed in the table below.
| | Mar. 31, | | | Mar. 31, | | | increase | |
Three month period ending | | 2017 | | | 2016 | | | (decrease) | |
Net interest income | | $ | 48,321 | | | $ | 41,475 | | | $ | 6,846 | |
Provision for loan losses | | | 995 | | | | 510 | | | | 485 | |
Net interest income after loan loss provision | | | 47,326 | | | | 40,965 | | | | 6,361 | |
| | | | | | | | | | | | |
Correspondent banking and capital markets division | | | 6,449 | | | | 8,775 | | | | (2,326 | ) |
IA amortization | | | — | | | | (1,166 | ) | | | 1,166 | |
FDIC revenue | | | — | | | | 96 | | | | (96 | ) |
Gain on early extinguishment of debt | | | — | | | | 308 | | | | (308 | ) |
Gain on sale of bank property held for sale | | | 129 | | | | — | | | | 129 | |
All other non interest income | | | 7,924 | | | | 6,548 | | | | 1,376 | |
Total non interest income | | | 14,502 | | | | 14,561 | | | | (59 | ) |
| | | | | | | | | | | | |
Correspondent banking and capital markets division | | | 4,746 | | | | 5,782 | | | | (1,036 | ) |
Credit related expenses | | 655 | | | | 359 | | | | 296 | |
Merger related expenses | | | 870 | | | | 11,172 | | | | (10,302 | ) |
Impairment (recovery) of branch real estate held for sale | | | 77 | | | | 456 | | | | (379 | ) |
Termination of FDIC loss share agreements | | | — | | | | 17,560 | | | | (17,560 | ) |
All other non interest expense | | | 31,695 | | | | 27,524 | | | | 4,171 | |
Total non interest expense | | | 38,043 | | | | 62,853 | | | | (24,810 | ) |
| | | | | | | | | | | | |
Net income before provision for income taxes | | | 23,785 | | | | (7,327 | ) | | | 31,112 | |
Provision for income taxes | | | 7,185 | | | | (2,523 | ) | | | 9,708 | |
Net income (loss) | | $ | 16,600 | | | $ | (4,804 | ) | | $ | 21,404 | |
The primary differences between the two quarters presented above relate the termination of the FDIC loss share agreements in February 2016 resulting in a charge of $17,560 during the first quarter of 2016 and merger related expenses of $11,172 for the acquisitions of Community and Hometown on March 1, 2016. Other differences between both quarters include lower IA amortization expense due to the termination of FDIC loss share agreements as state above and higher net interest income.
The increase in our net interest income relates primarily to the increase in our average interest earning assets as a result of loan growth and the acquisitions of Community and Hometown. The increase in our “all other non interest expense,” which represents the operating expenses of our commercial/retail banking segment, is primarily due to the acquisition of Community and Hometown as of March 1, 2016. These items along with others are discussed and analyzed below.
Net interest income/margin
Net interest income increased $6,846 or 16.5% to $48,321 during the three month period ended March 31, 2017 compared to $41,475 for the same period in 2016. The $6,846 increase was the result of a $7,605 increase in interest income and a $759 increase in interest expense.
Interest earning assets averaged $4,704,187 during the three month period ended March 31, 2017 as compared to $3,899,028 for the same period in 2016, an increase of $805,159, or 20.7%. The yield on average interest earning assets decreased 8 bps to 4.41% (4 bps to 4.52% tax equivalent basis) during the three month period ended March 31, 2017, compared to 4.49% (4.56% tax equivalent basis) for the same period in 2016. The combined effects of the $805,159 increase in average interest earning assets and the 8 bps (4 bps tax equivalent basis) decrease in yield on average interest earning assets resulted in the $7,605 ($8,259 tax equivalent basis) increase in interest income between the two periods.
Interest bearing liabilities averaged $3,025,290 during the three month period ended March 31, 2017 as compared to $2,519,372 for the same period in 2016, an increase of $505,918 or 20.1%. The cost of average interest bearing liabilities was 0.37% during the three month period ended March 31, 2017, compared to 0.32% for the same period in 2016. The effect of the $505,918 increase in average interest bearing liabilities and the 5 bps increase in cost of funds resulted in the $759 increase in interest expense between the two periods.
43
The table below summarizes the analysis of changes in interest income and interest expense for the three month periods ended March 31, 2017 and 2016 on a tax equivalent basis.
| Three months ended March 31, | |
| 2017 | | | 2016 | |
| Average | | | Interest | | | Average | | | Average | | | Interest | | | Average | |
| Balance | | | inc / exp | | | rate | | | balance | | | inc / exp | | | rate | |
Loans (notes 1, 2, 8) | $ | 3,300,971 | | | $ | 36,474 | | | | 4.48 | % | | $ | 2,569,240 | | | $ | 28,489 | | | | 4.46 | % |
PCI loans (note 9) | | 182,510 | | | | 8,525 | | | | 18.94 | % | | | 214,998 | | | | 8,908 | | | | 16.66 | % |
Securities- taxable | | 861,031 | | | | 5,001 | | | | 2.36 | % | | | 791,292 | | | | 5,062 | | | | 2.57 | % |
Securities- tax exempt (note 8) | | 155,550 | | | | 1,791 | | | | 4.67 | % | | | 98,196 | | | | 1,186 | | | | 4.86 | % |
Fed funds sold and other (note 3) | | 204,125 | | | 651 | | | | 1.29 | % | | | 225,302 | | | 538 | | | | 0.96 | % |
Total interest earning assets | | 4,704,187 | | | | 52,442 | | | | 4.52 | % | | | 3,899,028 | | | | 44,183 | | | | 4.56 | % |
| | | | | | | | | | | | | | | | | | | | | | | |
Allowance for loan losses | | (26,984 | ) | | | | | | | | | | | (22,616 | ) | | | | | | | | |
All other assets | | 538,312 | | | | | | | | | | | | 479,454 | | | | | | | | | |
Total assets | $ | 5,215,515 | | | | | | | | | | | $ | 4,355,866 | | | | | | | | | |
| | | | | | | | | | | | | | | | | | | | | | | |
Interest bearing deposits (note 4) | | 2,704,860 | | | | 1,897 | | | | 0.28 | % | | | 2,266,700 | | | | 1,481 | | | | 0.26 | % |
Fed funds purchased | | 259,831 | | | 537 | | | | 0.84 | % | | | 197,335 | | | 262 | | | | 0.53 | % |
Other borrowings (note 5) | | 34,612 | | | 30 | | | | 0.35 | % | | | 34,285 | | | 32 | | | | 0.38 | % |
Corporate debenture (note 10) | | 25,987 | | | 318 | | | | 4.96 | % | | | 21,052 | | | 248 | | | | 4.74 | % |
Total interest bearing liabilities | | 3,025,290 | | | | 2,782 | | | | 0.37 | % | | | 2,519,372 | | | | 2,023 | | | | 0.32 | % |
Demand deposits | | 1,508,058 | | | | | | | | | | | | 1,282,422 | | | | | | | | | |
Other liabilities | | 65,899 | | | | | | | | | | | | 56,650 | | | | | | | | | |
Stockholders’ equity | | 616,268 | | | | | | | | | | | | 497,422 | | | | | | | | | |
Total liabilities and stockholders’ equity | $ | 5,215,515 | | | | | | | | | | | $ | 4,355,866 | | | | | | | | | |
Net interest spread (tax equivalent basis) (note 6) | | | | | | | | | | 4.15 | % | | | | | | | | | | | 4.24 | % |
Net interest income (tax equivalent basis) | | | | | $ | 49,660 | | | | | | | | | | | $ | 42,160 | | | | | |
Net interest margin (tax equivalent basis) (note 7) | | | | | | | | | | 4.28 | % | | | | | | | | | | | 4.35 | % |
note 1: | Loan balances are net of deferred origination fees and costs. |
note 2: | Interest income on average loans includes amortization of loan fee recognition of $427 and $112 for the three month periods ended March 31, 2017 and 2016. |
note 3: | Includes federal funds sold, interest earned on deposits at the Federal Reserve Bank and earnings on Federal Reserve Bank stock and Federal Home Loan Bank stock. |
note 4: | Includes interest bearing deposits only. Non-interest bearing checking accounts are included in the demand deposits listed above. Also, includes net amortization of fair market value adjustments related to various acquisitions of time deposits of ($112) and ($200) for the three month periods ended March 31, 2017 and 2016. |
note 5: | Includes securities sold under agreements to repurchase and Federal Home Loan Bank advances. |
note 6: | Represents the average rate earned on interest earning assets minus the average rate paid on interest bearing liabilities (Non-GAAP). |
note 7: | Represents net interest income divided by total interest earning assets (Non-GAAP). |
note 8: | Interest income and rates include the effects of a tax equivalent adjustment using applicable statutory tax rates to adjust tax exempt interest income on tax exempt investment securities and loans to a fully taxable basis (Non-GAAP). |
note 9: | PCI loans are accounted for pursuant to ASC 310-30. |
note 10: | Includes amortization of fair value adjustments related to various acquisitions of corporate debentures of $59 and $37 for the three month periods ended March 31, 2017 and 2016. |
The primary reason for the decrease in our net interest margin (“NIM”) during the current period was due to the mix of interest earning assets between the two periods presented above. Higher average balances in lower yielding assets, such as taxable securities and federal funds sold, and lower average balances in higher yielding assets, such as PCI loans, during the three month period ending March 31, 2017 compared to the three month period ending March 31, 2016 contributed to the decrease in NIM.
The Company acquired two banks, Community and Hometown (the “Homestead banks”), on March 1, 2016. As such, the acquired assets and assumed liabilities were fully integrated into the current quarter averages and income, resulting in a yield reduction on PCI loans due to the lower yield on the Homestead banks acquired PCI loans.
Provision for loan losses
The provision for loan losses increased $485 to $995 during the three month period ending March 31, 2017 compared to a provision expense of $510 for the comparable period in 2016. Our policy is to maintain the allowance for loan losses at a level sufficient to absorb probable incurred losses in the loan portfolio. The allowance is increased by the provision for loan losses, which is
44
a charge to current period earnings, and is decreased by charge-offs, net of recoveries on prior loan charge-offs. Therefore, the provision for loan losses (Income Statement effect) is a residual of management’s determination of allowance for loan losses (Balance Sheet approach). In determining the adequacy of the allowance for loan losses, we consider the conditions of individual borrowers, the historical loan loss experience, the general economic environment, the overall portfolio composition, and other information. As these factors change, the level of loan loss provision changes. The increase in our loan loss provision between the comparable periods is a result of an increase in non-impaired loan balances. See “Credit quality and allowance for loan losses” for additional information regarding the allowance for loan losses.
Non-interest income
Non-interest income for the three months ended March 31, 2017 was $14,502 compared to $14,561 for the comparable period in 2016. This decrease was the result of the following components listed in the table below.
| | Mar. 31, | | | Mar. 31, | | | $ increase | | | % increase | | |
Three month period ending: | | 2017 | | | 2016 | | | (decrease) | | | (decrease) | | |
Income from correspondent banking capital markets division (note 1) | | $ | 5,376 | | | $ | 7,371 | | | $ | (1,995 | ) | | | (27.1 | ) | % |
Other correspondent banking related revenue (note 2) | | | 1,073 | | | | 1,404 | | | | (331 | ) | | | (23.6 | ) | % |
Wealth management related revenue | | | 893 | | | | 735 | | | | 158 | | | | 21.5 | | % |
Service charges on deposit accounts | | | 3,575 | | | | 2,736 | | | | 839 | | | | 30.7 | | % |
Debit, prepaid, ATM and merchant card related fees | | | 2,265 | | | | 2,046 | | | | 219 | | | | 10.7 | | % |
BOLI income | | | 641 | | | | 565 | | | | 76 | | | | 13.5 | | % |
Other service charges and fees | | | 550 | | | | 466 | | | | 84 | | | | 18.0 | | % |
Subtotal | | $ | 14,373 | | | $ | 15,323 | | | $ | (950 | ) | | | (6.2 | ) | % |
Gain on early extinguishment of debt | | | — | | | | 308 | | | | (308 | ) | | | (100.0 | ) | % |
Gain on sale of bank properties held for sale | | | 129 | | | | — | | | | 129 | | | NM | | % |
FDIC indemnification asset-amortization(see explanation below) | | | — | | | | (1,166 | ) | | | 1,166 | | | | (100.0 | ) | % |
FDIC indemnification income | | | — | | | | 96 | | | | (96 | ) | | | (100.0 | ) | % |
Total non-interest income | | $ | 14,502 | | | $ | 14,561 | | | $ | (59 | ) | | | (0.4 | ) | % |
note 1: | Includes gross commissions earned on bond sales, fees from hedging services, loan brokering fees and related consulting fees. The fee income in this category is based on sales volume in any particular period and is therefore volatile between comparable periods. |
note 2: | Includes fees from safe-keeping activities, bond accounting services, asset/liability consulting services, international wires, clearing and corporate checking account services and other correspondent banking related revenue and fees. The fees included in this category are less volatile than those described above in note 1. |
“Income from correspondent banking capital markets division” decreased between the two periods presented above due to decreased fees from bond and capital market sales. Service charges on deposit accounts increased $839 in part due to the acquisitions of Community and Hometown on March 1, 2016 and new product changes on personal and business accounts implemented during the third quarter of 2016. In addition, the termination of the FDIC loss share agreements in February 2016 resulted in no further FDIC indemnification asset amortization during the three month period ending March 31, 2017 which increased non-interest income by $1,166 compared to the same period in 2016.
45
Non-interest expense
Non-interest expense for the three months ended March 31, 2017 decreased $24,810, or 39.5%, to $38,043, compared to $62,853 for the same period in 2016. Components of our non-interest expenses are listed in the table below.
| | Mar. 31, | | | Mar. 31, | | | $ increase | | | % increase | | |
Three month period ending: | | 2017 | | | 2016 | | | (decrease) | | | (decrease) | | |
Salaries and wages | | $ | 17,474 | | | $ | 16,137 | | | $ | 1,337 | | | | 8.3 | | % |
Incentive/bonus compensation | | | 1,321 | | | | 1,259 | | | | 62 | | | | 4.9 | | % |
Stock based compensation | | | 1,139 | | | | 1,080 | | | | 59 | | | | 5.5 | | % |
Employer 401K matching contributions | | | 507 | | | | 477 | | | | 30 | | | | 6.3 | | % |
Deferred compensation expense | | | 144 | | | | 160 | | | | (16 | ) | | | (10.0 | ) | % |
Health insurance and other employee benefits | | | 1,477 | | | | 1,260 | | | | 217 | | | | 17.2 | | % |
Payroll taxes | | | 1,426 | | | | 1,423 | | | | 3 | | | | 0.2 | | % |
Other employee related expenses | | | 375 | | | | 291 | | | | 84 | | | | 28.9 | | % |
Incremental direct cost of loan origination | | | (981 | ) | | | (632 | ) | | | (349 | ) | | | 55.2 | | % |
Total salaries, wages and employee benefits | | | 22,882 | | | | 21,455 | | | | 1,427 | | | | 6.7 | | % |
| | | | | | | | | | | | | | | | | |
Gain on sale of OREO | | | (104 | ) | | | (158 | ) | | | 54 | | | | (34.2 | ) | % |
Valuation write down of OREO | | | 161 | | | | 22 | | | | 139 | | | | 631.8 | | % |
(Gain) loss on repossessed assets other than real estate | | | (7 | ) | | | 6 | | | | (13 | ) | | | (216.7 | ) | % |
Foreclosure and repossession related expenses | | | 605 | | | | 489 | | | | 116 | | | | 23.7 | | % |
Total credit related expenses | | | 655 | | | | 359 | | | | 296 | | | | 82.5 | | % |
| | | | | | | | | | | | | | | | | |
Occupancy expense | | | 2,749 | | | | 2,147 | | | | 602 | | | | 28.0 | | % |
Depreciation of premises and equipment | | | 1,684 | | | | 1,497 | | | | 187 | | | | 12.5 | | % |
Supplies, stationary and printing | | | 354 | | | | 299 | | | | 55 | | | | 18.4 | | % |
Marketing expenses | | | 852 | | | | 690 | | | | 162 | | | | 23.5 | | % |
Data processing expense | | | 1,826 | | | | 1,527 | | | | 299 | | | | 19.6 | | % |
Legal, auditing and other professional fees | | | 888 | | | | 903 | | | | (15 | ) | | | (1.7 | ) | % |
Bank regulatory related expenses | | | 727 | | | | 810 | | | | (83 | ) | | | (10.2 | ) | % |
Postage and delivery | | | 428 | | | | 355 | | | | 73 | | | | 20.6 | | % |
Debit, prepaid, ATM and merchant card related expenses | | | 706 | | | | 596 | | | | 110 | | | | 18.5 | | % |
CDI amortization | | | 725 | | | | 642 | | | | 83 | | | | 12.9 | | % |
Other intangible amortization | | | 37 | | | | 36 | | | | 1 | | | | 2.8 | | % |
Internet and telephone banking | | | 518 | | | | 564 | | | | (46 | ) | | | (8.2 | ) | % |
Operational write-offs and losses | | | 205 | | | | 8 | | | | 197 | | | | 2,462.5 | | % |
Correspondent accounts and Federal Reserve charges | | | 190 | | | | 176 | | | | 14 | | | | 8.0 | | % |
Conferences/Seminars/Education/Training | | | 232 | | | | 133 | | | | 99 | | | | 74.4 | | % |
Director fees | | | 178 | | | | 209 | | | | (31 | ) | | | (14.8 | ) | % |
Travel expenses | | | 60 | | | | 79 | | | | (19 | ) | | | (24.1 | ) | % |
Other expenses | | | 1,200 | | | | 1,180 | | | | 20 | | | | 1.7 | | % |
Subtotal | | | 37,096 | | | | 33,665 | | | | 3,431 | | | | 10.2 | | % |
Impairment of bank property held for sale, net | | | 77 | | | | 456 | | | | (379 | ) | | | (83.1 | ) | % |
Merger and acquisition related expenses | | | 870 | | | | 11,172 | | | | (10,302 | ) | | | (92.2 | ) | % |
Loss from termination of FDIC loss share agreements | | | — | | | | 17,560 | | | | (17,560 | ) | | | (100.0 | ) | % |
Total non-interest expense | | $ | 38,043 | | | $ | 62,853 | | | $ | (24,810 | ) | | | (39.5 | ) | % |
Excluding net impairments on bank property held for sale, merger related expenses and charges related to termination of FDIC loss sharing agreements, our non-interest expenses increased $3,431, or 10.2% to $37,096 during the current quarter compared to $33,665 during the same quarter last year. The overall primary reason for the increase relates to the acquisitions of Community and Hometown on March 1, 2016.
Provision for income taxes
We recognized an income tax expense for the three months ended March 31, 2017 of $7,185 on pre-tax income of $23,785 (an effective tax rate of 30.2%) compared to an income tax benefit of $2,523 on pre-tax loss of $7,327 (an effective tax rate of 34.4%) for the comparable quarter in 2016. The primary reason for the decrease in the effective tax rates is due to a larger percentage of tax exempt interest income relative to total revenue and excess tax benefits of $1,083 recorded during the current quarter as a result of implementing ASU 2016-09, Stock Compensation Improvements to Employee Share-Based Payment Activity, on January 1, 2017.
46
Liquidity
Liquidity is defined as the ability to meet anticipated customer demands for funds under credit commitments and deposit withdrawals at a reasonable cost and on a timely basis. We measure liquidity position by giving consideration to both on- and off-balance sheet sources of and demands for funds on a daily and weekly basis.
Our Bank regularly assesses the amount and likelihood of projected funding requirements through a review of factors such as historical deposit volatility and funding patterns, present and forecasted market and economic conditions, individual client funding needs, and existing and planned business activities. The Bank’s asset/liability committee (ALCO) provides oversight to the liquidity management process and recommends guidelines, subject to the approval of its board of directors, and courses of action to address actual and projected liquidity needs.
Short term sources of funding and liquidity include cash and cash equivalents, net of federal requirements to maintain reserves against deposit liabilities; investment securities eligible for pledging to secure borrowings from customers pursuant to securities sold under repurchase agreements; loan repayments; deposits and certain interest rate-sensitive deposits; and borrowings under overnight federal fund lines available from correspondent banks. In addition to interest rate-sensitive deposits, the primary demand for liquidity is anticipated fundings under credit commitments to customers.
Off-Balance Sheet Arrangements
We do not have any material off-balance sheet arrangements except for approved and unfunded loans and letters of credit to our customers in the ordinary course of business.
47
Use of Non-GAAP Financial Measures and Ratios
The accounting and reporting policies of the Company conform to generally accepted accounting principles (“GAAP”) in the United States and prevailing practices in the banking industry. However, certain non-GAAP performance measures and ratios are used by management to evaluate and measure the Company’s performance. These include tax-equivalent net interest income (including its individual components) and net interest margin (including its individual components). Management believes that these measures and ratios provide users of the Company’s financial information with a more meaningful view of the performance of the interest-earning assets and interest-bearing liabilities. Other financial holding companies may define or calculate these measures differently.
Management reviews yields on certain asset categories and the net interest margin of the Company and its banking subsidiaries on a fully taxable equivalent basis. In this non-GAAP presentation, net interest income is adjusted to reflect tax-exempt interest income on an equivalent before-tax basis. This measure ensures the comparability of net interest income arising from both taxable and tax-exempt sources.
These disclosures should not be considered in isolation or a substitute for results determined in accordance with GAAP, and are not necessarily comparable to non-GAAP performance measures which may be presented by other financial holding companies. Management compensates for these limitations by providing detailed reconciliations between GAAP information and the non-GAAP financial measures.
| | Three months ended March 31, | |
(Dollars in thousands) | | 2017 | | | 2016 | |
Income Statement Non-GAAP measures and ratios | | | | | | | | |
Interest income (GAAP) | | | | | | | | |
Loans, excluding PCI loans | | $ | 35,724 | | | $ | 28,210 | |
PCI loans | | | 8,525 | | | | 8,908 | |
Securities - taxable | | | 5,001 | | | | 5,062 | |
Securities - tax-exempt | | | 1,202 | | | | 780 | |
Federal funds sold and other | | | 651 | | | | 538 | |
Total Interest income (GAAP) | | | 51,103 | | | | 43,498 | |
| | | | | | | | |
Tax equivalent adjustment | | | | | | | | |
Non PCI loans | | | 750 | | | 279 | |
Securities - tax-exempt | | | 589 | | | | 406 | |
Total tax equivalent adjustment | | | 1,339 | | | | 685 | |
| | | | | | | | |
Interest income - tax equivalent | | | | | | | | |
Loans excluding PCI loans | | | 36,474 | | | | 28,489 | |
PCI loans | | | 8,525 | | | | 8,908 | |
Securities - taxable | | | 5,001 | | | | 5,062 | |
Securities - tax-exempt | | | 1,791 | | | | 1,186 | |
Federal funds sold and other | | | 651 | | | | 538 | |
Total interest income - tax equivalent | | | 52,442 | | | | 44,183 | |
| | | | | | | | |
Total Interest expense (GAAP) | | | (2,782 | ) | | | (2,023 | ) |
| | | | | | | | |
Net interest income - tax equivalent | | $ | 49,660 | | | $ | 42,160 | |
| | | | | | | | |
Net interest income (GAAP) | | $ | 48,321 | | | $ | 41,475 | |
| | | | | | | | |
Yields and costs | | | | | | | | |
Yield on loans excluding PCI - tax equivalent | | | 4.48 | % | | | 4.46 | % |
Yield on securities tax-exempt - tax equivalent | | | 4.67 | % | | | 4.86 | % |
Yield on interest earning assets (GAAP) | | | 4.41 | % | | | 4.49 | % |
Yield on interest earning assets - tax equivalent | | | 4.52 | % | | | 4.56 | % |
Cost of interest bearing liabilities (GAAP) | | | 0.37 | % | | | 0.32 | % |
Net interest spread (GAAP) | | | 4.04 | % | | | 4.17 | % |
Net interest spread - tax equivalent | | | 4.15 | % | | | 4.24 | % |
Net interest margin (GAAP) | | | 4.17 | % | | | 4.28 | % |
Net interest margin - tax equivalent | | | 4.28 | % | | | 4.35 | % |
48
ITEM 3. | QUANTITATIVE AND QUALITATIVE DISCLOSURES: MARKET RISK |
Market risk
We believe interest rate risk is the most significant market risk impacting us. We monitor and manage interest rate risk using interest rate sensitivity “gap” analysis to measure the impact of market interest rate changes on net interest income. See our Annual Report on Form 10-K for the fiscal year ended December 31, 2016 for disclosure of the quantitative and qualitative information regarding the interest rate risk inherent in interest rate risk sensitive instruments as of December 31, 2016. There have been no changes in the assumptions used in monitoring interest rate risk as of March 31, 2017. The impact of other types of market risk, such as foreign currency exchange risk and equity price risk, is deemed immaterial.
ITEM 4. | CONTROLS AND PROCEDURES |
As of the end of the period covered by this report, an evaluation was carried out under the supervision and with the participation of our management, including the Chief Executive Officer (CEO) and Chief Financial Officer (CFO), of the effectiveness of the design and operation of our disclosure controls and procedures (as defined in Rules 13a-15(e) or 15d-15(e)). Based on that evaluation, the CEO and CFO have concluded that our disclosure controls and procedures are effective to ensure that information required to be disclosed by us in reports that we file or submit under the Securities Exchange Act of 1934 are recorded, processed, summarized and reported within the time periods specified in Securities and Exchange Commission rules and forms. There was no change in our internal control over financial reporting (as defined in Rules 13a-15(f) or 15d-15(f)) during the quarter covered by this report that has materially affected, or is reasonably likely to materially affect, our internal control over financial reporting.
49
PART II. OTHER INFORMATION
None.
There have been no material changes in our risk factors from our disclosure in Item 1A of our December 31, 2016 annual report on Form 10-K.
Item 2. | Unregistered Sales of Equity Securities and Use of Proceeds |
| | | | | |
| | | | Total Number | Maximum Number |
| | | | of Shares | of Shares that |
| | Total | | Purchased as | may yet be |
| | Number of | Average | part of Publicly | Purchased Under |
Period | Shares | Price paid | Announced Plans | the Plans or |
Beginning | Ending | Purchased | per Share | or Programs | Programs |
January 1, 2017 | January 31, 2017 | --- | --- | --- | 1,934,735 |
February 1, 2017 | February 28, 2017 | 30,474 (1) | $24.38 | --- | 1,934,735 |
March 1, 2017 | March 31, 2017 | --- | --- | --- | 1,934,735 |
Total for quarter ending March 31, 2017 | 30,474 | $24.38 | --- | 1,934,735 |
| (1) | We did not repurchase any shares of our common stock during the first quarter of 2017 pursuant to our stock repurchase plan currently in place. We repurchased 30,474 shares of our common stock from our employees during the first quarter of 2017 for settlement of certain tax withholding obligations related to certain equity based compensation awards. |
Item 3. | Defaults Upon Senior Securities |
None.
Item 4. | [Removed and Reserved] |
None
Exhibit 31.1 | | The Chairman, President and Chief Executive Officer’s certification required under section 302 of the Sarbanes-Oxley Act of 2002 |
Exhibit 31.2 | | The Chief Financial Officer’s certification required under section 302 of the Sarbanes-Oxley Act of 2002 |
Exhibit 32.1 | | The Chairman, President and Chief Executive Officer’s certification required under section 906 of the Sarbanes-Oxley Act of 2002 |
Exhibit 32.2 | | The Chief Financial Officer’s certification required under section 906 of the Sarbanes-Oxley Act of 2002 |
Exhibit 101.1 | | Interactive Data File |
101.INS | | XBRL Instance Document |
101.SCH | | XBRL Schema Document |
101.CAL | | XBRL Calculation Linkbase Document |
101.DEF | | XBRL Definition Linkbase Document |
101.LAB | | XBRL Label Linkbase Document |
101.PRE | | XBRL Presentation Linkbase Document |
50
CENTERSTATE BANKS, INC.
SIGNATURES
In accordance with the requirements of the Securities Exchange Act of 1934, the Registrant has duly caused this report to be signed on its behalf by the undersigned thereunto duly authorized.
CENTERSTATE BANKS, INC.
(Registrant)
Date: May 4, 2017 | | | | By: | | /s/ John C. Corbett |
| | | | | | John C. Corbett |
| | | | | | President and Chief Executive Officer |
Date: May 4, 2017 | | | | By: | | /s/ Jennifer L. Idell |
| | | | | | Jennifer L. Idell |
| | | | | | Executive Vice President |
| | | | | | and Chief Financial Officer |
51