3rd Quarter 2019 Investor Presentation Exhibit 99.1
Forward Looking Statements Information in this presentation, other than statements of historical facts, may constitute forward-looking statements, within the meaning of the Private Securities Litigation Reform Act of 1995. These statements include, but are not limited to, CenterState’s plans, objectives, expectations and intentions, and other statements that are not historical facts. Forward-looking statements may be identified by terminology such as “may,” “will,” “should,” “scheduled,” “plans,” “intends,” “anticipates,” “expects,” “believes,” estimates,” “potential,” or “continue” or negative of such terms or other comparable terminology. All forward-looking statements are subject to risks, uncertainties and other facts that may cause the actual results, performance or achievements of CenterState to differ materially from any results expressed or implied by such forward-looking statements. Such factors include, among others, the impact on failing to implement our business strategy, including our growth and acquisition strategy, including the merger with National Commerce Corporation (“NCOM”) and its integration; the ability to successfully integrate our acquisitions, including that of NCOM; additional capital requirements due to our growth plans; the impact of an increase in our asset size to over $10 billion; the risks of changes in interest rates and the level and composition of deposits; loan demand, the credit and other risks in our loan portfolio and the values of loan collateral; the impact of us not being able to manage our risk; the impact on a loss of management or other experienced employees; the impact if we failed to maintain our culture and attract and retain skilled people; the risk of changes in technology and customer preferences; the impact of any material failure or breach in our infrastructure or the infrastructure of third parties on which we rely including as a result of cyber-attacks; or material regulatory liability in areas such as BSA or consumer protection; or other areas of legal or other liability as a result of law suits, other legal proceedings, or information-gathering requests, investigations and other proceedings by government and self-regulatory agencies, reputational risks from such failures or liabilities or other events; legislative and regulatory changes; general competitive, political, legal, economic and market conditions and developments; financial market conditions and the results of financing efforts; changes in commodity prices and interest rates; weather, natural disasters and other catastrophic events that may or may not be caused by climate change; and other factors discussed in our filings with the Securities and Exchange Commission under the Exchange Act. Additional factors that could cause results to differ materially from those contemplated by forward-looking statements can be found in CenterState’s Annual Report on Form 10-K for the year ended December 31, 2018, and otherwise in our SEC reports and filings, which are available in the “Investor Relations” section of CenterState’s website, http://www.centerstatebanks.com. Forward-looking statements speak only as of the date they are made. You should not expect us to update any forward-looking statements.
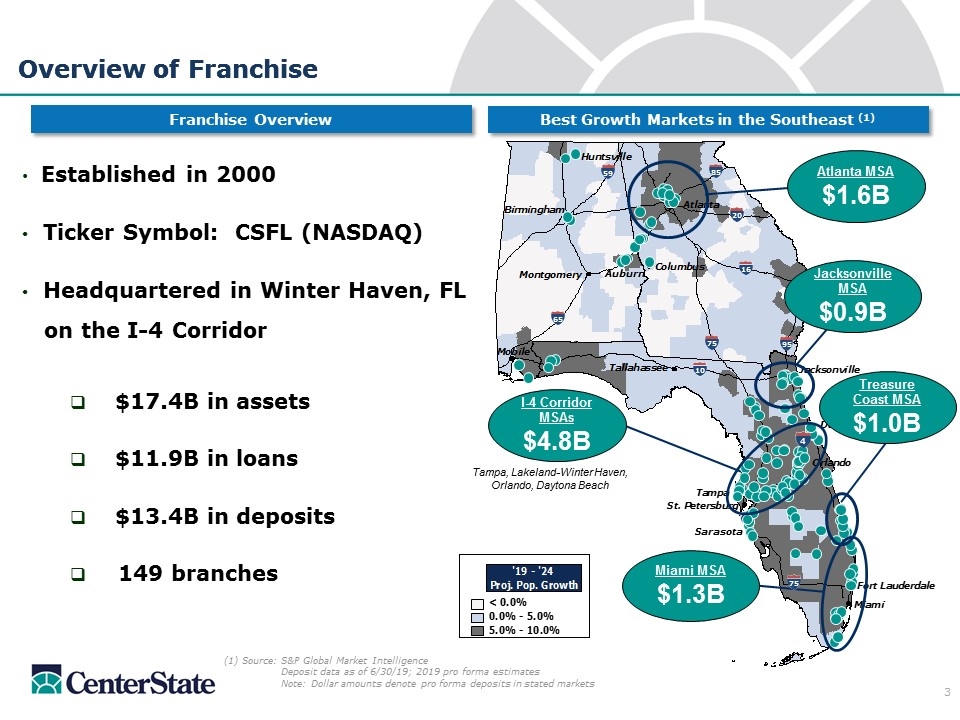
Overview of Franchise (1) Source: S&P Global Market Intelligence Deposit data as of 6/30/19; 2019 pro forma estimates Note: Dollar amounts denote pro forma deposits in stated markets Overview of Franchise Established in 2000 Ticker Symbol: CSFL (NASDAQ) Headquartered in Winter Haven, FL on the I-4 Corridor $17.4B in assets $11.9B in loans $13.4B in deposits 149 branches Auburn Sarasota Daytona Beach 20 95 16 65 59 75 10 75 85 Atlanta MSA $1.6B Jacksonville MSA $0.9B Miami MSA $1.3B I-4 Corridor MSAs $4.8B Tampa, Lakeland-Winter Haven, Orlando, Daytona Beach 4 Best Growth Markets in the Southeast (1) Franchise Overview Treasure Coast MSA $1.0B
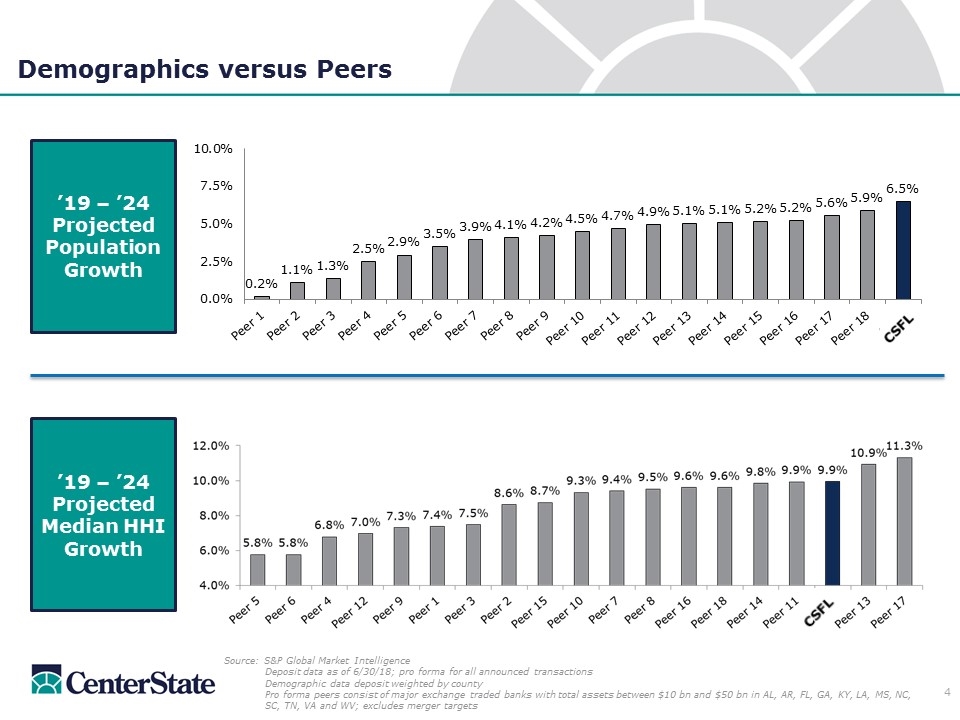
Demographics versus Peers ’19 – ’24 Projected Population Growth ’19 – ’24 Projected Median HHI Growth Source: S&P Global Market Intelligence Deposit data as of 6/30/18; pro forma for all announced transactions Demographic data deposit weighted by county Pro forma peers consist of major exchange traded banks with total assets between $10 bn and $50 bn in AL, AR, FL, GA, KY, LA, MS, NC, SC, TN, VA and WV; excludes merger targets
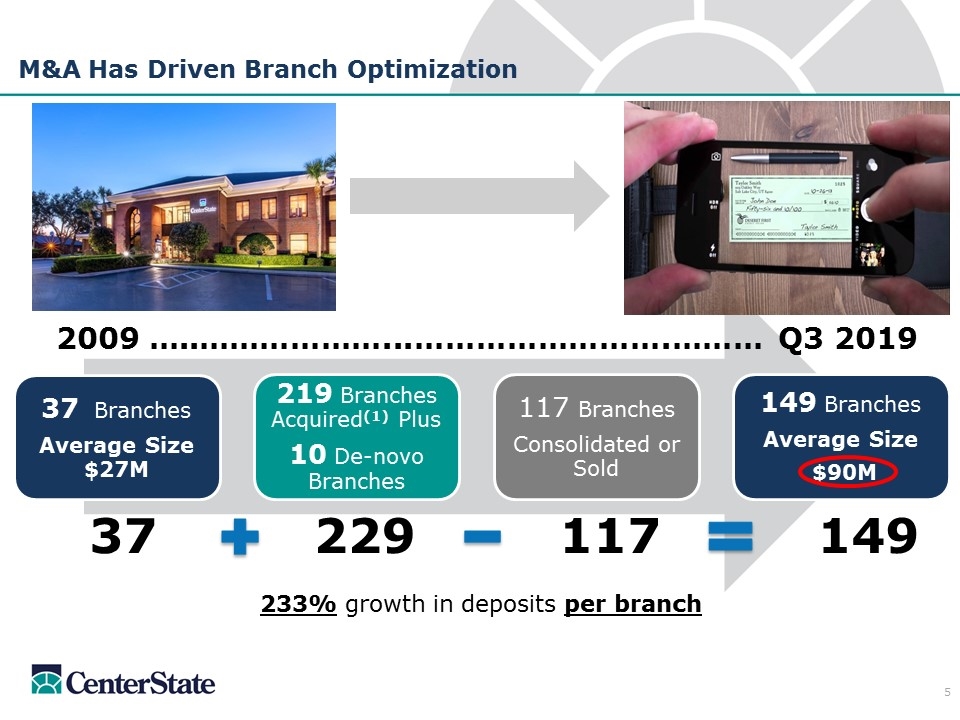
233% growth in deposits per branch 37 229 117 149 2009 …..………………...…………………….……… Q3 2019 M&A Has Driven Branch Optimization 37 Branches Average Size $27M 219 Branches Acquired (1) Plus 10 De-novo Branches 117 Branches Consolidated or Sold 149 Branches Average Size $90M
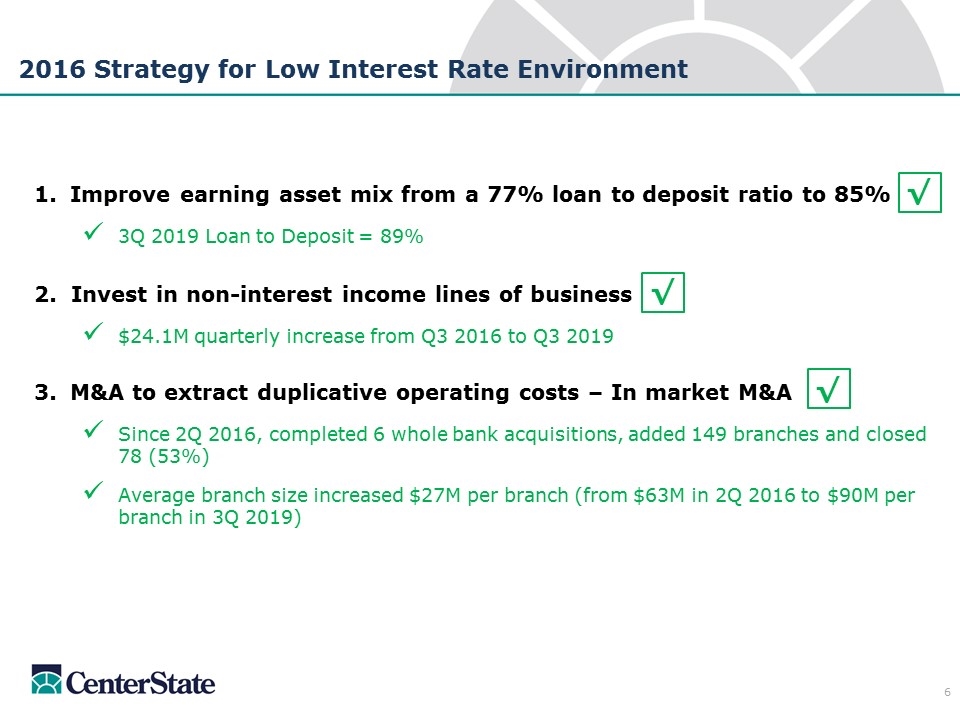
Improve earning asset mix from a 77% loan to deposit ratio to 85% √ 3Q 2019 Loan to Deposit = 89% 2. Invest in non-interest income lines of business √ $24.1M quarterly increase from Q3 2016 to Q3 2019 M&A to extract duplicative operating costs – In market M&A √ Since 2Q 2016, completed 6 whole bank acquisitions, added 149 branches and closed 78 (53%) Average branch size increased $27M per branch (from $63M in 2Q 2016 to $90M per branch in 3Q 2019) 2016 Strategy for Low Interest Rate Environment
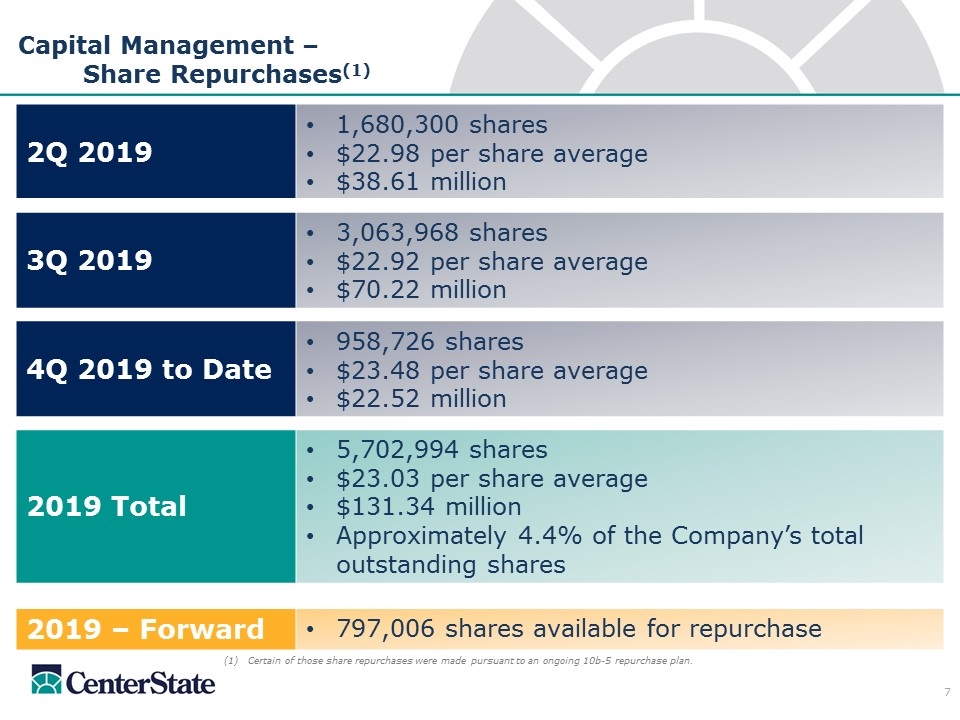
Capital Management – Share Repurchases(1) (1) Certain of those share repurchases were made pursuant to an ongoing 10b-5 repurchase plan. 2Q 2019 1,680,300 shares $22.98 per share average $38.61 million 3Q 2019 3,063,968 shares $22.92 per share average $70.22 million 4Q 2019 to Date 958,726 shares $23.48 per share average $22.52 million 2019 Total 5,702,994 shares $23.03 per share average $131.34 million Approximately 4.4% of the Company’s total outstanding shares 2019 – Forward 797,006 shares available for repurchase
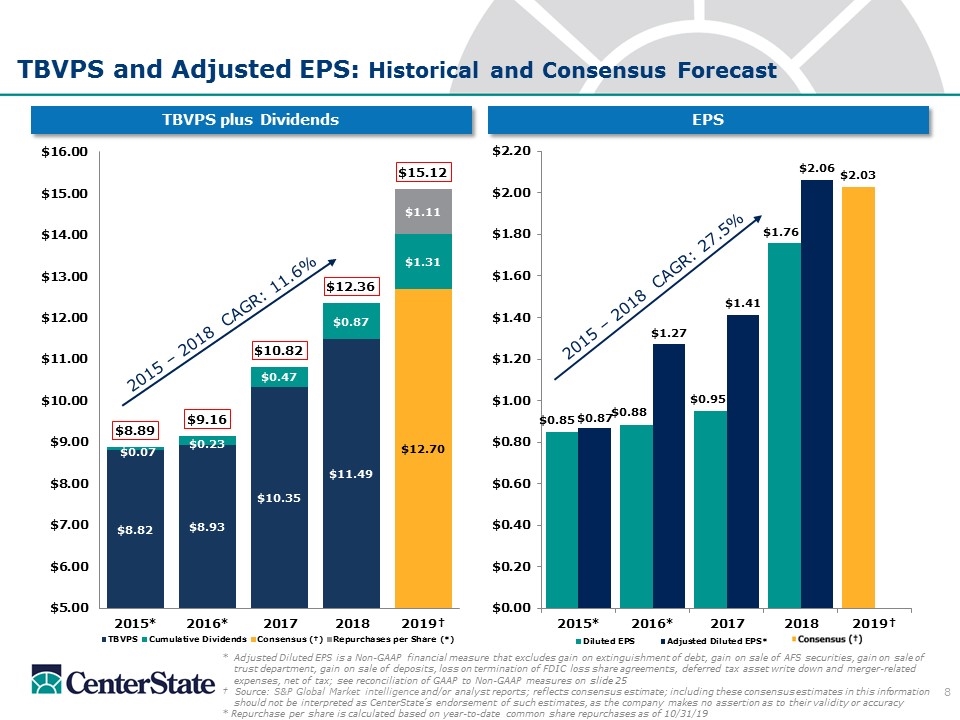
TBVPS and Adjusted EPS: Historical and Consensus Forecast *Adjusted Diluted EPS is a Non-GAAP financial measure that excludes gain on extinguishment of debt, gain on sale of AFS securities, gain on sale of trust department, gain on sale of deposits, loss on termination of FDIC loss share agreements, deferred tax asset write down and merger-related expenses, net of tax; see reconciliation of GAAP to Non-GAAP measures on slide 25 † Source: S&P Global Market intelligence and/or analyst reports; reflects consensus estimate; including these consensus estimates in this information should not be interpreted as CenterState’s endorsement of such estimates, as the company makes no assertion as to their validity or accuracy * Repurchase per share is calculated based on year-to-date common share repurchases as of 10/31/19 TBVPS plus Dividends EPS 2015 – 2018 CAGR: 27.5% 2015 – 2018 CAGR: 11.6%
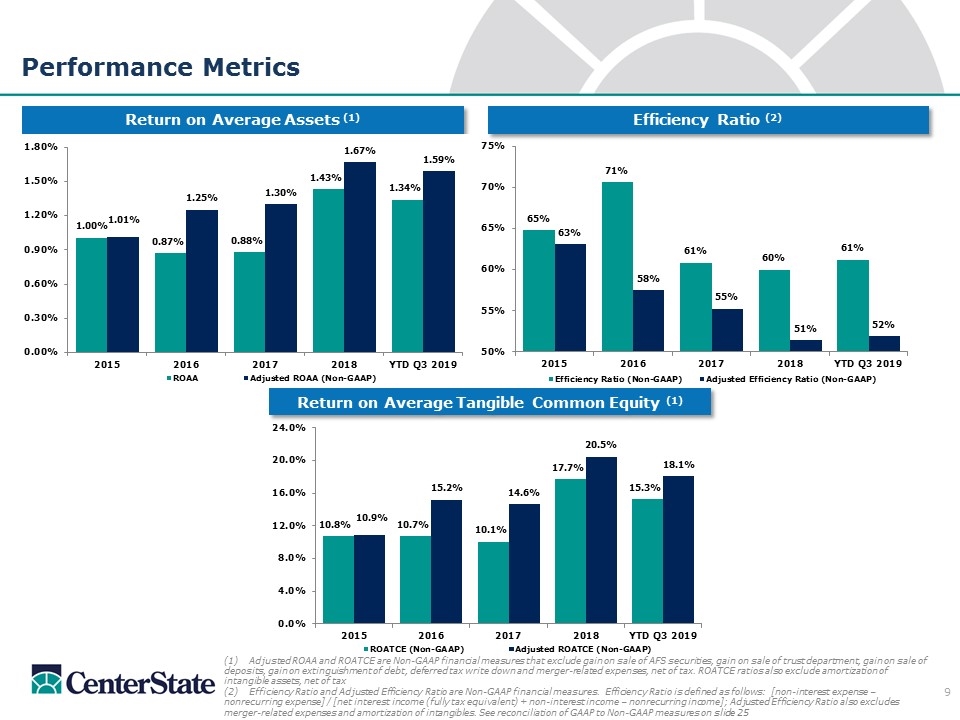
(1) Adjusted ROAA and ROATCE are Non-GAAP financial measures that exclude gain on sale of AFS securities, gain on sale of trust department, gain on sale of deposits, gain on extinguishment of debt, deferred tax write down and merger-related expenses, net of tax. ROATCE ratios also exclude amortization of intangible assets, net of tax (2) Efficiency Ratio and Adjusted Efficiency Ratio are Non-GAAP financial measures. Efficiency Ratio is defined as follows: [non-interest expense – nonrecurring expense] / [net interest income (fully tax equivalent) + non-interest income – nonrecurring income]; Adjusted Efficiency Ratio also excludes merger-related expenses and amortization of intangibles. See reconciliation of GAAP to Non-GAAP measures on slide 25 Efficiency Ratio (2) Performance Metrics Return on Average Tangible Common Equity (1) Return on Average Assets (1)
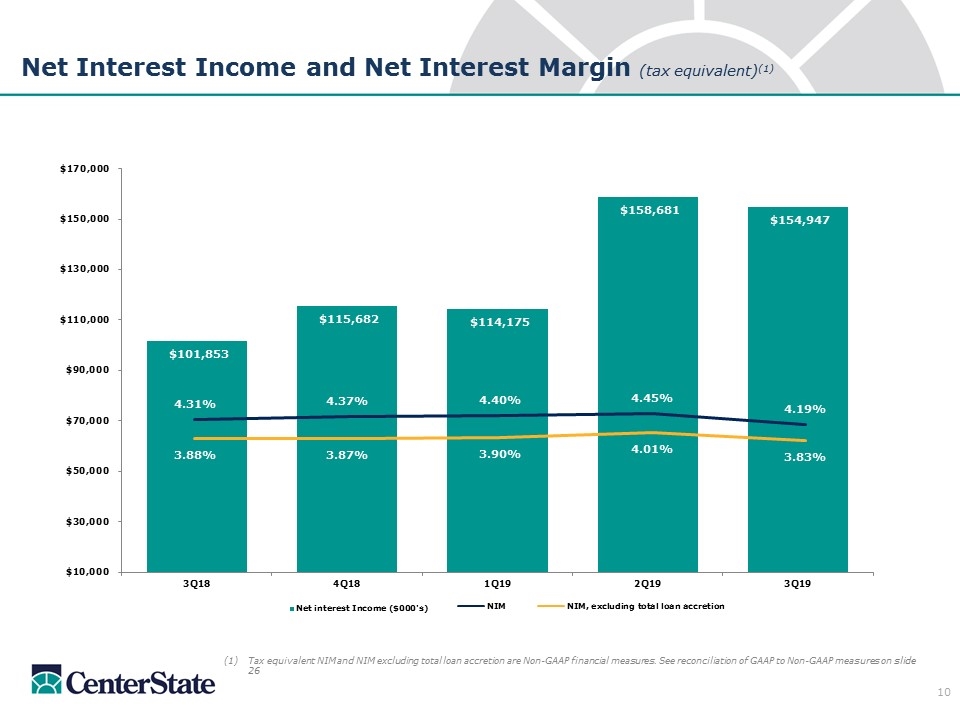
Net Interest Income and Net Interest Margin (tax equivalent)(1) Tax equivalent NIM and NIM excluding total loan accretion are Non-GAAP financial measures. See reconciliation of GAAP to Non-GAAP measures on slide 26
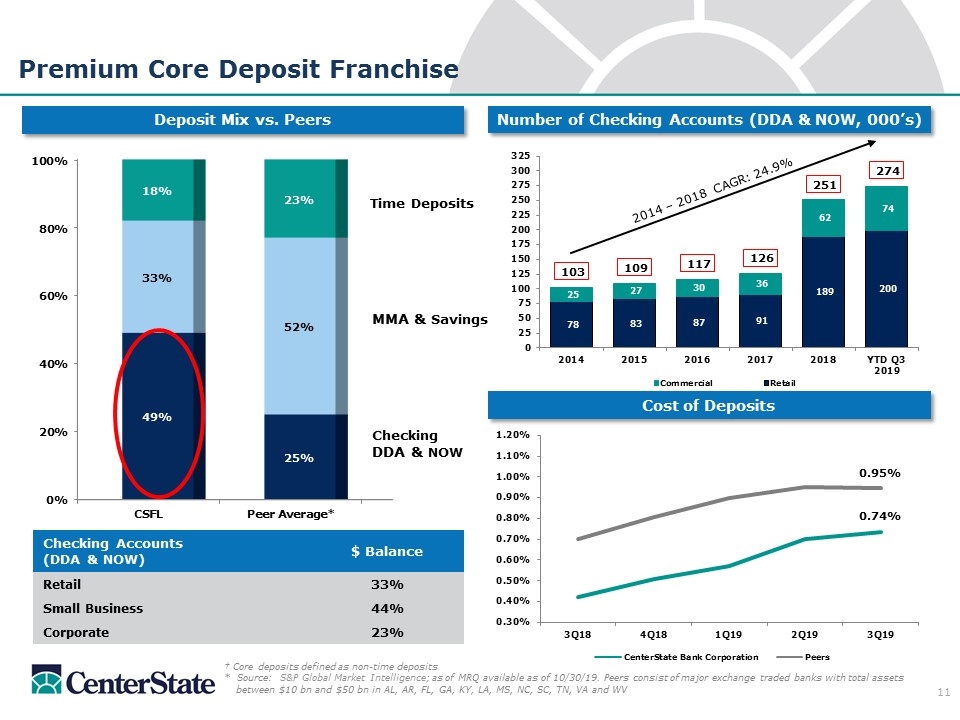
Number of Checking Accounts (DDA & NOW, 000’s) Premium Core Deposit Franchise Cost of Deposits Deposit Mix vs. Peers † Core deposits defined as non-time deposits * Source: S&P Global Market Intelligence; as of MRQ available as of 10/30/19. Peers consist of major exchange traded banks with total assets between $10 bn and $50 bn in AL, AR, FL, GA, KY, LA, MS, NC, SC, TN, VA and WV MMA & Savings Time Deposits Checking Accounts (DDA & NOW) $ Balance Retail 33% Small Business 44% Corporate 23% Checking DDA & NOW 2014 – 2018 CAGR: 24.9%
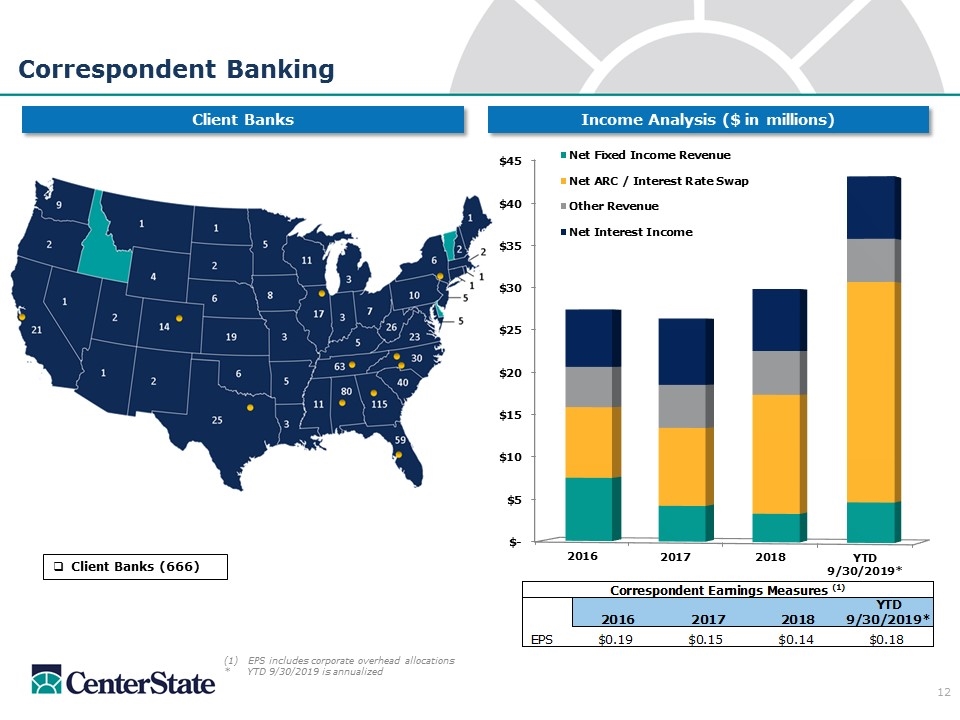
Client Banks (666) EPS includes corporate overhead allocations * YTD 9/30/2019 is annualized Correspondent Banking Income Analysis ($ in millions) Client Banks
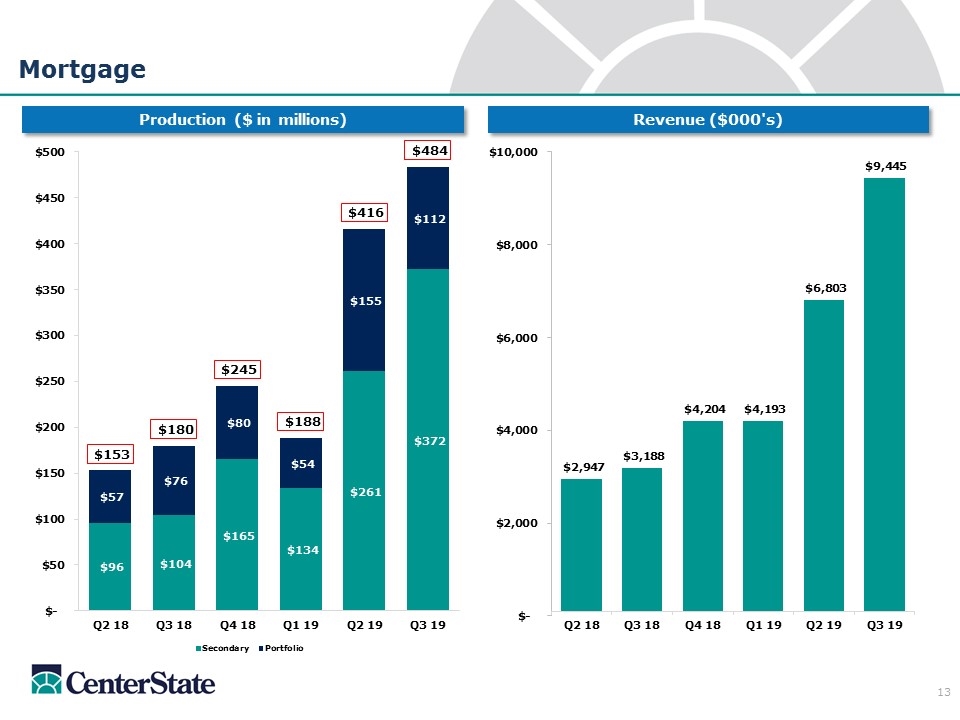
Mortgage Production ($ in millions) Revenue ($000's)
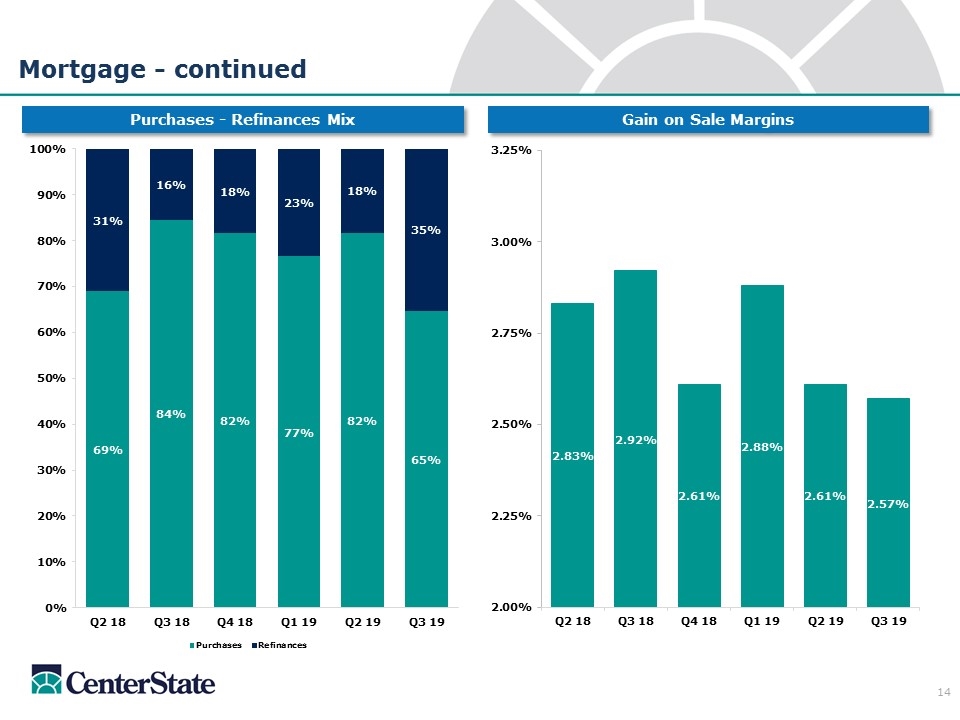
Mortgage - continued Purchases - Refinances Mix Gain on Sale Margins
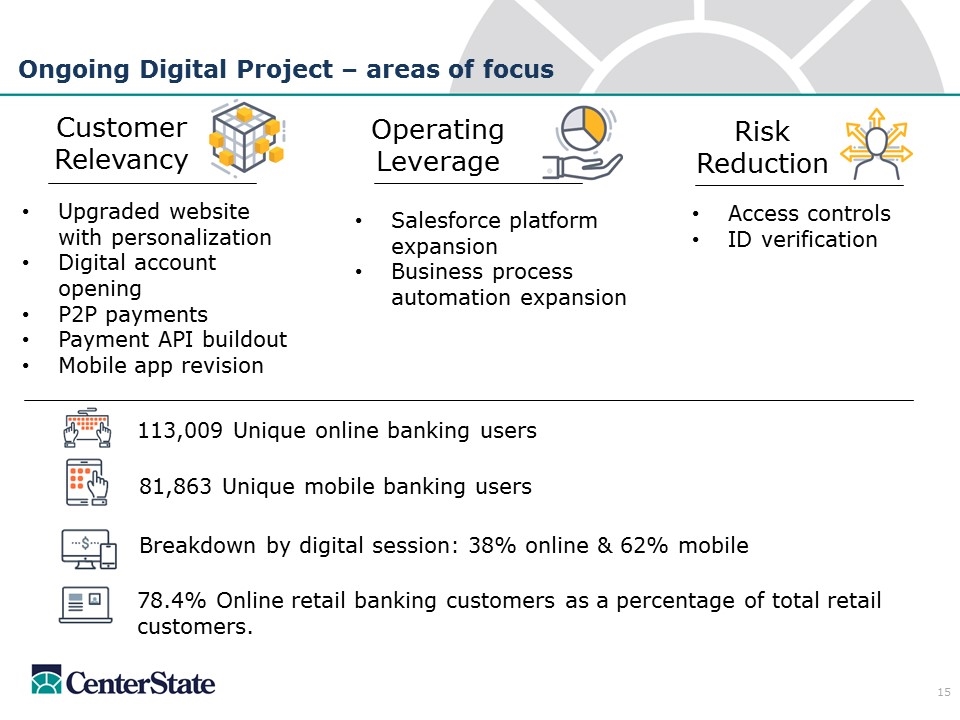
Customer Relevancy Operating Leverage Risk Reduction Access controls ID verification Upgraded website with personalization Digital account opening P2P payments Payment API buildout Mobile app revision Salesforce platform expansion Business process automation expansion Ongoing Digital Project – areas of focus 113,009 Unique online banking users 81,863 Unique mobile banking users Breakdown by digital session: 38% online & 62% mobile 78.4% Online retail banking customers as a percentage of total retail customers.
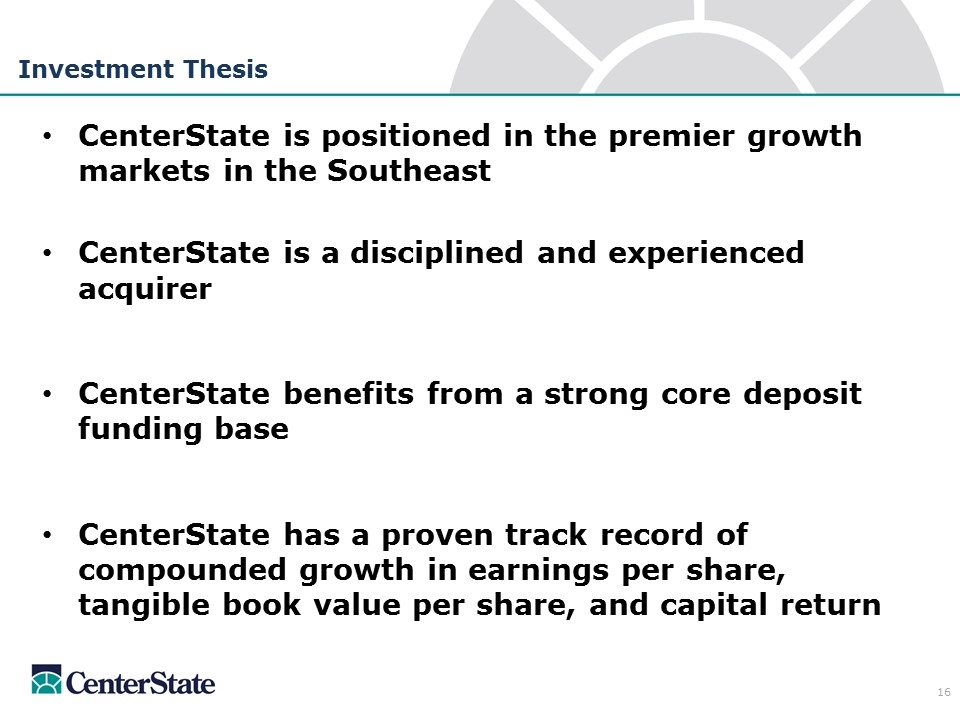
Investment Thesis CenterState is positioned in the premier growth markets in the Southeast CenterState is a disciplined and experienced acquirer CenterState benefits from a strong core deposit funding base CenterState has a proven track record of compounded growth in earnings per share, tangible book value per share, and capital return
Supplemental
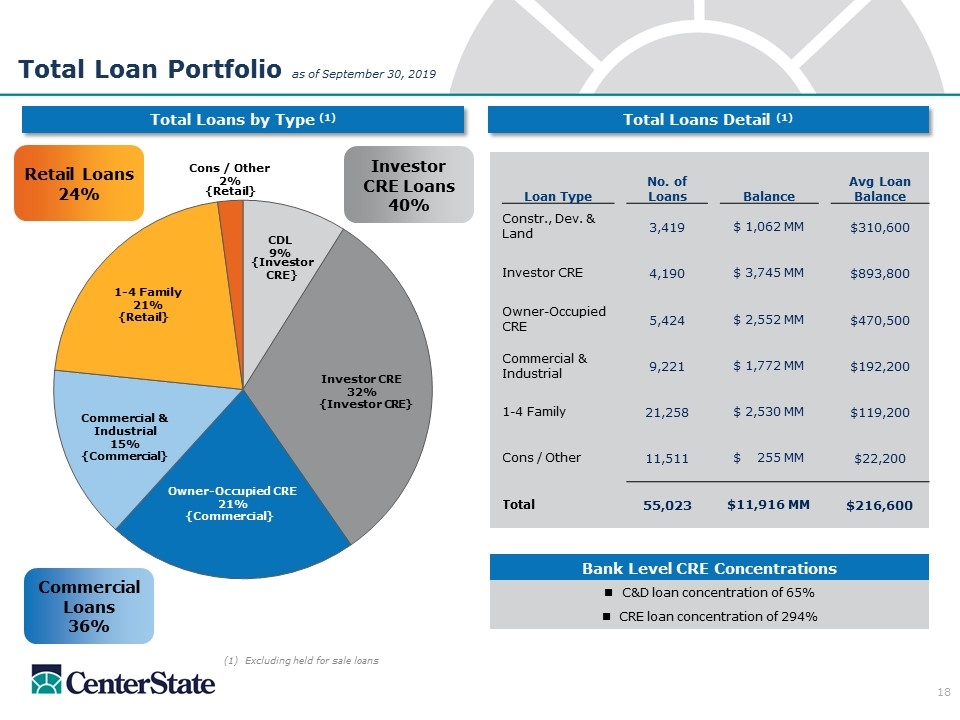
Total Loan Portfolio as of September 30, 2019 Total Loans by Type (1) Total Loans Detail (1) (1) Excluding held for sale loans Bank Level CRE Concentrations C&D loan concentration of 65% CRE loan concentration of 294% Loan Type No. of Loans Balance Avg Loan Balance Constr., Dev. & Land 3,419 $ 1,062 MM $310,600 Investor CRE 4,190 $ 3,745 MM $893,800 Owner-Occupied CRE 5,424 $ 2,552 MM $470,500 Commercial & Industrial 9,221 $ 1,772 MM $192,200 1-4 Family 21,258 $ 2,530 MM $119,200 Cons / Other 11,511 $ 255 MM $22,200 Total 55,023 $11,916 MM $216,600
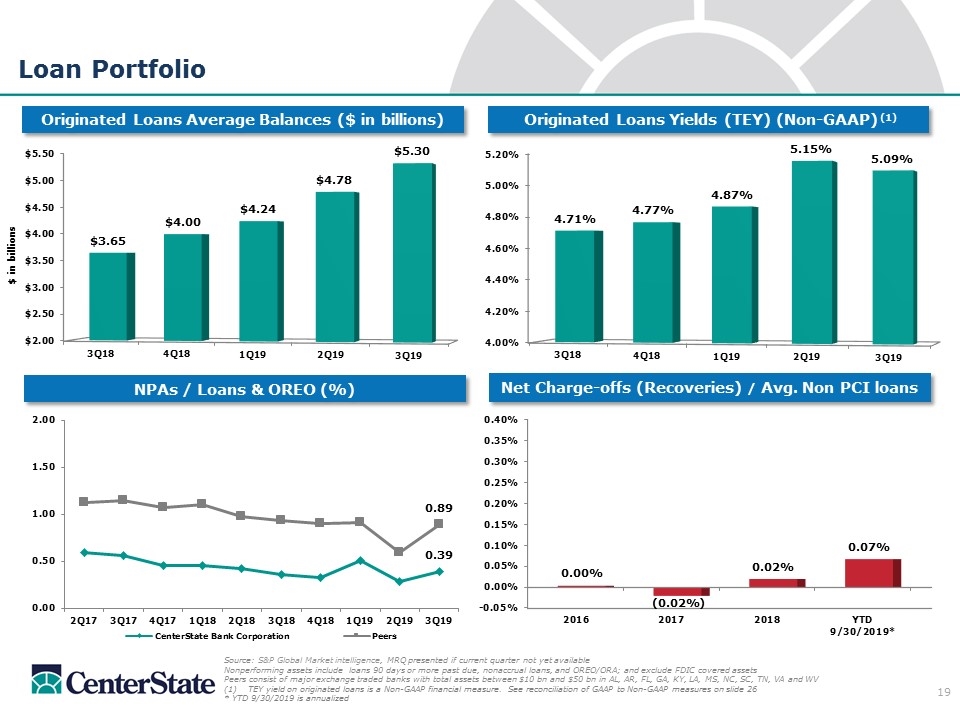
Loan Portfolio Originated Loans Yields (TEY) (Non-GAAP) (1) Originated Loans Average Balances ($ in billions) Source: S&P Global Market intelligence, MRQ presented if current quarter not yet available Nonperforming assets include loans 90 days or more past due, nonaccrual loans, and OREO/ORA; and exclude FDIC covered assets Peers consist of major exchange traded banks with total assets between $10 bn and $50 bn in AL, AR, FL, GA, KY, LA, MS, NC, SC, TN, VA and WV TEY yield on originated loans is a Non-GAAP financial measure. See reconciliation of GAAP to Non-GAAP measures on slide 26 * YTD 9/30/2019 is annualized NPAs / Loans & OREO (%) Net Charge-offs (Recoveries) / Avg. Non PCI loans
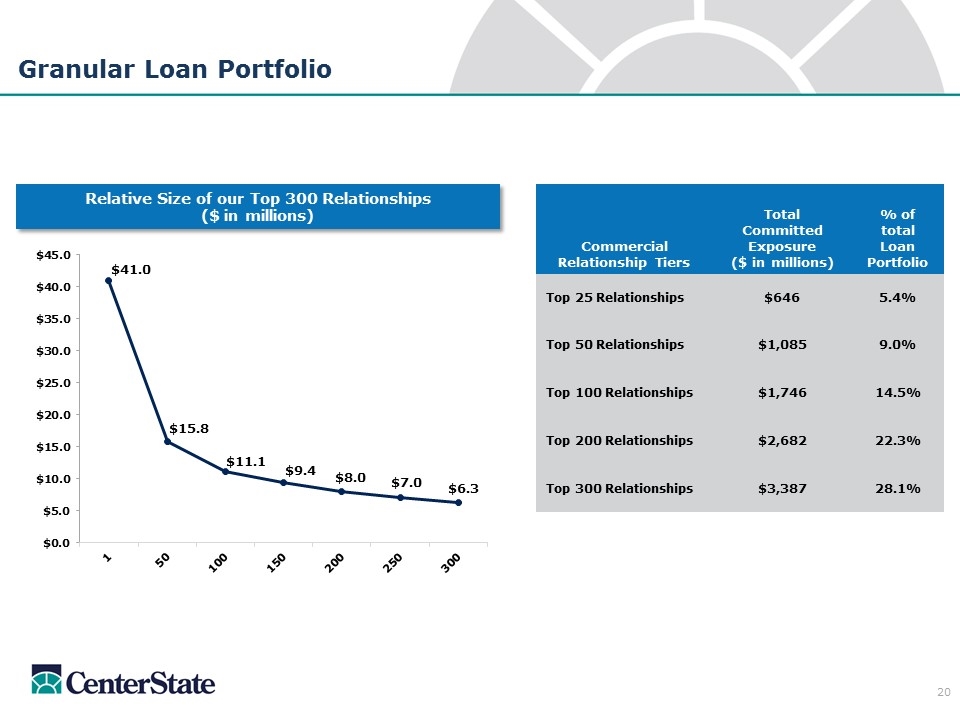
Granular Loan Portfolio Commercial Relationship Tiers Total Committed Exposure ($ in millions) % of total Loan Portfolio Top 25 Relationships $646 5.4% Top 50 Relationships $1,085 9.0% Top 100 Relationships $1,746 14.5% Top 200 Relationships $2,682 22.3% Top 300 Relationships $3,387 28.1% Relative Size of our Top 300 Relationships ($ in millions)
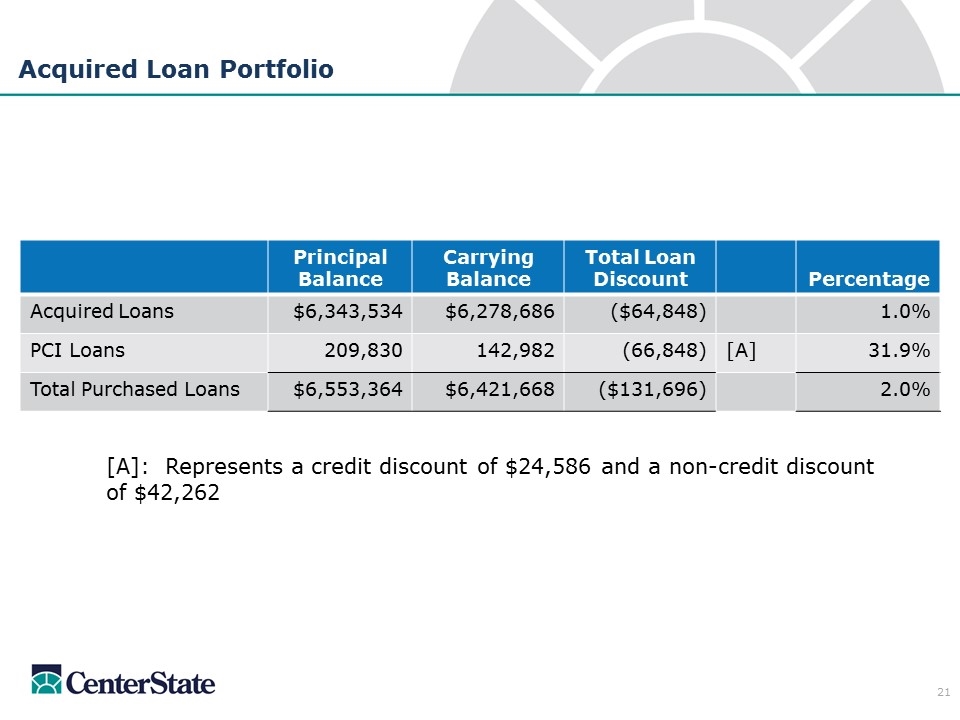
Acquired Loan Portfolio [A]: Represents a credit discount of $24,586 and a non-credit discount of $42,262 Principal Balance Carrying Balance Total Loan Discount Percentage Acquired Loans $6,343,534 $6,278,686 ($64,848) 1.0% PCI Loans 209,830 142,982 (66,848) [A] 31.9% Total Purchased Loans $6,553,364 $6,421,668 ($131,696) 2.0%
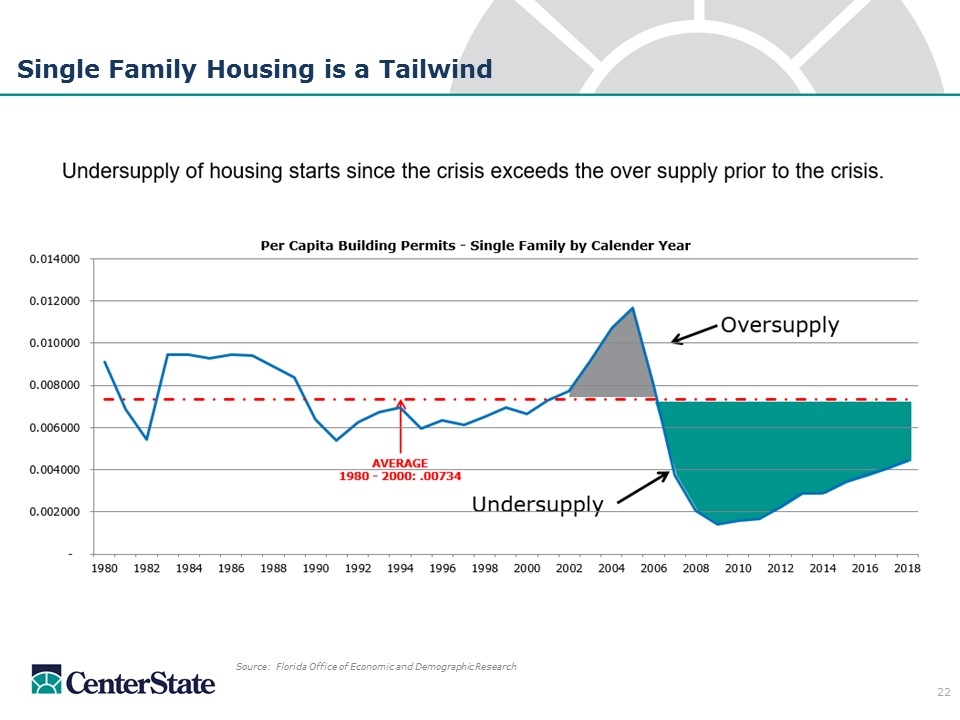
Single Family Housing is a Tailwind Source: Florida Office of Economic and Demographic Research
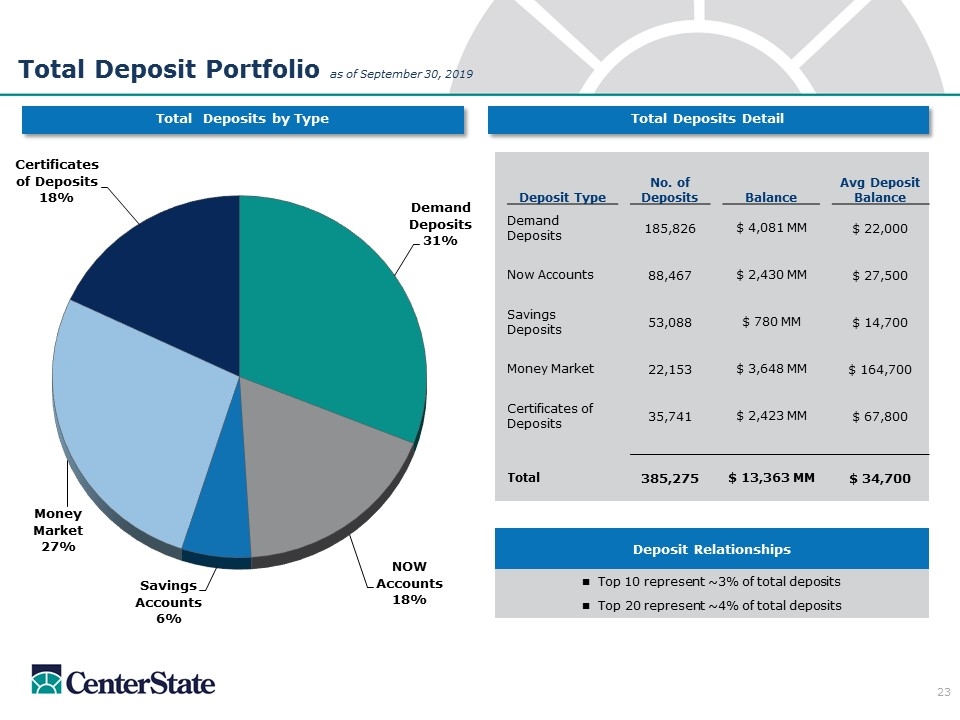
Deposit Relationships n Top 10 represent ~3% of total deposits n Top 20 represent ~4% of total deposits Total Deposits by Type Total Deposits Detail Total Deposit Portfolio as of September 30, 2019 Deposit Type No. of Deposits Balance Avg Deposit Balance Demand Deposits 185,826 $ 4,081 MM $ 22,000 Now Accounts 88,467 $ 2,430 MM $ 27,500 Savings Deposits 53,088 $ 780 MM $ 14,700 Money Market 22,153 $ 3,648 MM $ 164,700 Certificates of Deposits 35,741 $ 2,423 MM $ 67,800 Total 385,275 $ 13,363 MM $ 34,700
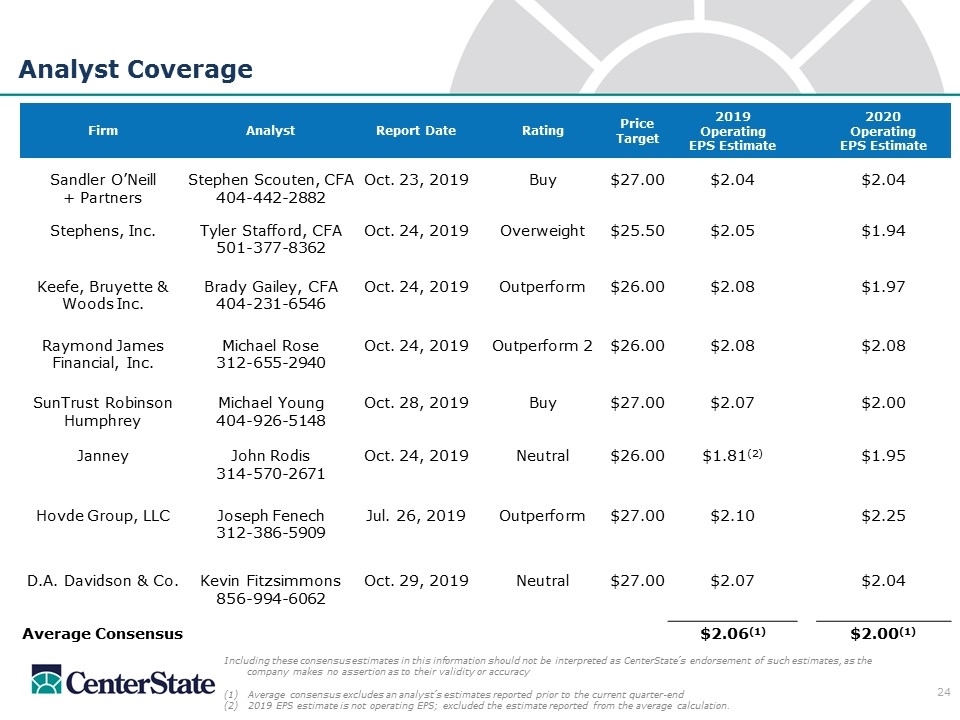
Analyst Coverage Including these consensus estimates in this information should not be interpreted as CenterState’s endorsement of such estimates, as the company makes no assertion as to their validity or accuracy Average consensus excludes an analyst’s estimates reported prior to the current quarter-end (2) 2019 EPS estimate is not operating EPS; excluded the estimate reported from the average calculation. Firm Analyst Report Date Rating Price Target 2019 Operating EPS Estimate 2020 Operating EPS Estimate Sandler O’Neill Stephen Scouten, CFA Oct. 23, 2019 Buy $27.00 $2.04 $2.04 + Partners 404-442-2882 Stephens, Inc. Tyler Stafford, CFA Oct. 24, 2019 Overweight $25.50 $2.05 $1.94 501-377-8362 Keefe, Bruyette & Brady Gailey, CFA Oct. 24, 2019 Outperform $26.00 $2.08 $1.97 Woods Inc. 404-231-6546 Raymond James Michael Rose Oct. 24, 2019 Outperform 2 $26.00 $2.08 $2.08 Financial, Inc. 312-655-2940 SunTrust Robinson Michael Young Oct. 28, 2019 Buy $27.00 $2.07 $2.00 Humphrey 404-926-5148 Janney John Rodis Oct. 24, 2019 Neutral $26.00 $1.81(2) $1.95 314-570-2671 Hovde Group, LLC Joseph Fenech Jul. 26, 2019 Outperform $27.00 $2.10 $2.25 312-386-5909 D.A. Davidson & Co. Kevin Fitzsimmons Oct. 29, 2019 Neutral $27.00 $2.07 $2.04 856-994-6062 Average Consensus $2.06(1) $2.00(1)
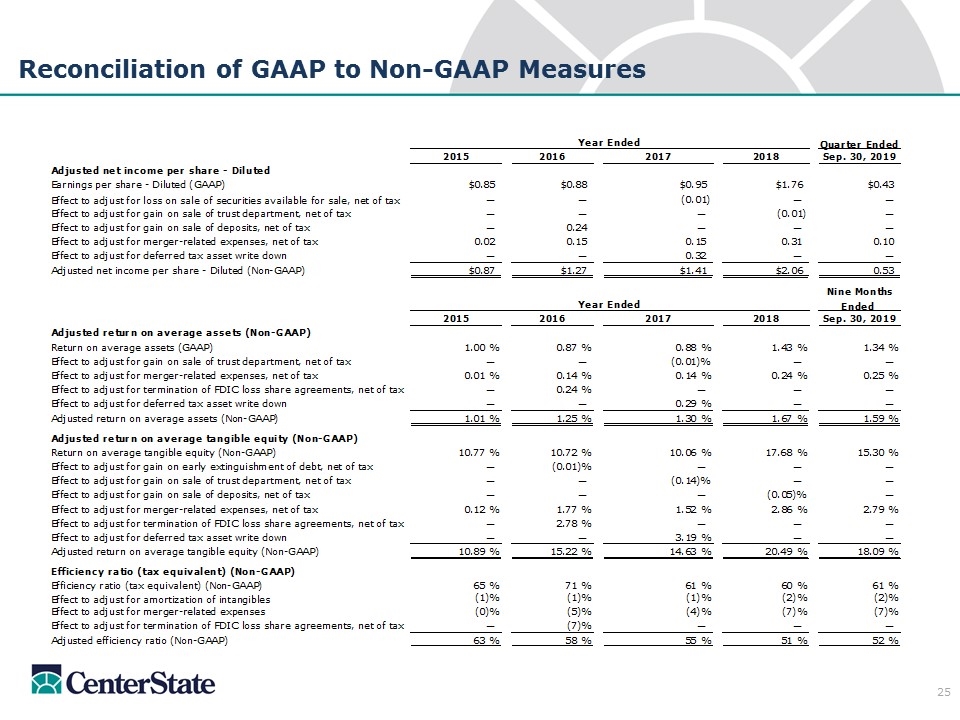
Reconciliation of GAAP to Non-GAAP Measures
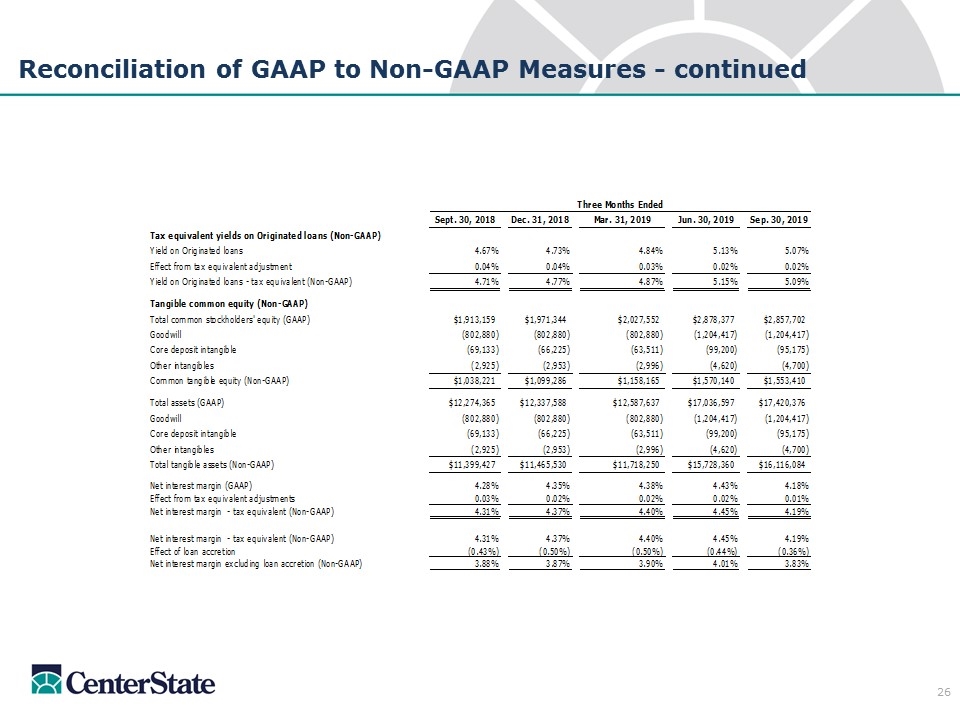
Reconciliation of GAAP to Non-GAAP Measures - continued
Investor Contacts John Corbett President & CEO jcorbett@centerstatebank.com Steve Young Chief Operating Officer syoung@centerstatebank.com Phone Number 863-293-4710 Richard Murray CEO of CenterState Bank, N.A. rmurray@centerstatebank.com Will Matthews Chief Financial Officer wmatthews@centerstatebank.com


