UNITED STATES
SECURITIES AND EXCHANGE COMMISSION
WASHINGTON, D.C. 20549 |
CERTIFIED SHAREHOLDER REPORT OF REGISTERED MANAGEMENT INVESTMENT COMPANIES
| Investment Company Act file number 811-09781 |
PFS FUNDS
(Exact name of registrant as specified in charter) |
| 1939 Friendship Drive, Suite C | |
| El Cajon, CA | 92020 |
| (Address of principal executive offices) | (Zip code) |
CT Corporation System
155 Federal St., Suite 700,
Boston, MA 02110
(Name and address of agent for service) |
Registrant's telephone number, including area code: (619) 588-9700
Date of fiscal year end: November 30
Date of reporting period: November 30, 2013
Form N-CSR is to be used by management investment companies to file reports with the Commission not later than 10 days after the transmission to stockholders of any report that is required to be transmitted to stockholders under Rule 30e-1 under the Investment Company Act of 1940 (17 CFR 270.30e -1). The Commission may use the information provided on Form N-CSR in its regulatory, disclosure review, inspection and policymaking roles.
A registrant is required to disclose the information specified by Form N-CSR, and the Commission will make this information public. A registrant is not required to respond to the collection of information contained in Form N-CSR unless the Form displays a currently valid Office of Management and Budget ("OMB") control number. Please direct comments concerning the accuracy of the information collection burden estimate and any suggestions for reducing the burden to Secretary, Securities and Exchange Commission, 450 Fifth Street, NW, Washington, DC 20549-0609. The OMB has reviewed this collection of information under the clearance requirements of 44 U.S.C. § 3507.
Item 1. Reports to Stockholders.
Christopher Weil & Company Core Investment Fund
Ticker CWCFX
Christopher Weil & Company Global Dividend Fund
Ticker CWGDX
For Investors Seeking Long-Term Capital Appreciation
ANNUAL REPORT
November 30, 2013 |
| Table of Contents | |
| |
| |
| |
| CHRISTOPHER WEIL & COMPANY FUNDS | |
| Letters to Shareholders | 2 |
| Sector Allocation | 7 |
| Performance Information | 8 |
| Schedules of Investments | 10 |
| Statements of Assets and Liabilities | 14 |
| Statements of Operations | 14 |
| Statements of Changes in Net Assets | 15 |
| Financial Highlights | 16 |
| NOTES TO FINANCIAL STATEMENTS | 17 |
| DISCLOSURE OF EXPENSES | 24 |
| ADDITIONAL INFORMATION | 26 |
| REPORT OF INDEPENDENT REGISTERED PUBLIC ACCOUNTING FIRM | 27 |
| TRUSTEES AND OFFICERS | 28 |
2013 Annual Report 1
Christopher Weil & Company Core Investment Fund
Market and Investment Commentary for the fiscal year ended November 30, 2013.
Investment Summary
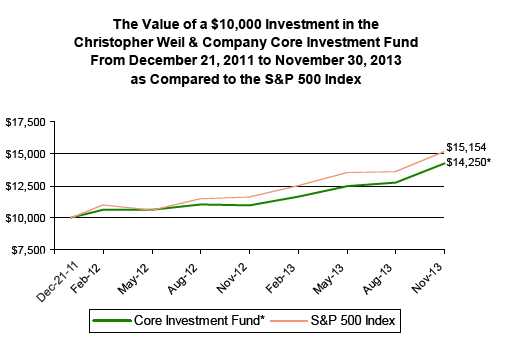
The Christopher Weil & Company Core Investment Fund (the "Fund") returned 29.78% for the fiscal year ended November 30, 2013, compared to 30.30% for the S&P 500® index. In July, we began paring back the number of positions in the portfolio and increasing the weightings of the remaining positions as we believed a more concentrated portfolio would serve us better with the market conditions.
The Fund's performance was negatively affected by our exposure to homebuilding, utilities and telecom stocks. In these sectors, Lennar (LEN) and BCE (BCE) were some of our worst performers in the Fund. Exposure to the energy sector through Oceaneering International (OII) also dragged on the Fund's performance. Finally, exposure to F5 Networks (FFIV) and Mellanox Technologies (MLNX), two companies in the technology sector that experienced uneven growth, negatively affected the Fund’s performance. On the positive side, our exposure to payment processors such as FleetCor Technologies (FLT) and Mastercard (MA) helped the Fund's performance. Exposure to the internet and mobile sectors through Google (GOOG) and Priceline.com (PCLN) also helped. Finally, growth plays in the industrial sector through Kansas City Southern (KSU) and Generac Holdings (GNRC) and exposure to Jazz Pharmaceuticals (JAZZ), a value health stock, helped us keep our performance in line with our benchmark.
During the course of the year, the Portfolio used covered call options to generate incremental income and put options to hedge market declines. Overall, the options had a slight negative impact on performance.
Themes of 2013
2013 was a great year for U.S. equities. A major sentiment shift away from bonds and into stocks occurred in the spring, helping to push the market to record highs. Weak commodity prices helped both consumers and businesses while giving the Fed more room to expand its balance sheet without causing excessive inflation. With Europe and Japan showing signs of recovery and tensions in the Middle East (somewhat) contained, investor worries were minimized. Gains in the housing sector also played a major role in improving consumer confidence. The drama in Washington surrounding the government shutdown and potential default barely fazed the markets. The capstone for the markets was the appointment of Janet Yellen, a perceived dove, as chairman of the Federal Reserve.
Investment Strategy
Currently, we intend to maintain a target portfolio that consists of approximately 30 stocks, aiming for each to have a weighting of between 2.5% and 4% of the value of the Fund. As the economic and investment climate changes we may increase or decrease our target number of positions. We take a bottom up approach, finding companies in various sectors that have strong revenue growth and strong balance sheets, avoiding the most volatile issues. Technical analysis helps in choosing entry and exit points. Companies represent most major industry sectors, but we have, in practice, generally, over weighted technology and consumer discretionary while underweighting financials, utilities, and telecoms.
While we look to macro trends for guidance, note that our methodology is fundamentally bottoms up. We rigorously screen the investable universe for stocks that have strong balance sheets and income statements along with positive track records and likely potential for growth. The search for good value remains a top priority as we believe that even a great company can trade for too high a price and a mediocre one can trade well below its intrinsic value. We look for stocks that will outperform over the next few years and mostly shun short term plays, maintaining a mix of stocks of varied sectors, market capitalization, and anticipated volatility.
Investment Summary
Despite uncertainties and slowing earnings growth, we believe many equities are still reasonably priced. With bond yields for both investment grade and high yield still low, the equity risk to reward ratio is favorable for investors who can tolerate short to medium term volatility. Businesses have, in many cases, been improving their balance sheets and are much more able to handle shocks than in times past. We continue to believe that well managed companies will continue to lead their industries, take market share, and grow earnings. Investors in well run companies should continue to profit over the longer term. We continue to buy companies we hope will deliver outsized positive returns over the long term. We may employ some hedging strategies if necessary to weather more volatile times.
Christopher Weil, Chairman & John Wells, President/CEO
Christopher Weil & Company, Inc., Investment Advisor
Christopher Weil & Co. Global Dividend Fund
Market and Investment Commentary for the fiscal year ended November 30, 2013.
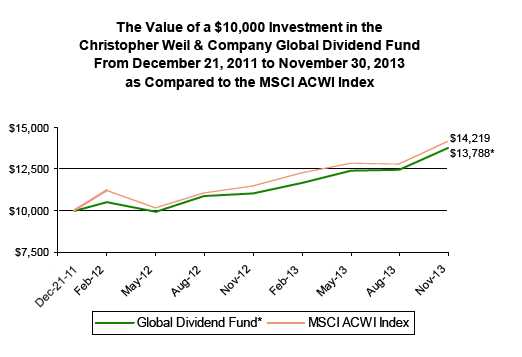
The Christopher Weil & Company Global Dividend Fund (the "Fund") returned 24.77% for the fiscal year ended November 30, 2013, compared to 23.45% for the MSCI ACWI Index. On November 30th, the Fund had net assets of $32.3 million.
The Market Commentary
Global equity markets were again buoyed by strong performances from major U.S. equity indices, with the Dow Jones Industrial Average and the S&P 500® Index gaining 26.6% and 30.3%, respectively for the 1 year period ended November 30, 2013. Stimulated by signs of recovery in the Euro zone and Asia, global markets posted modest gains. Leading all countries in performance for the year was Japan, whose Nikkei index gained 33.6% for the 1 year period ended November 30, 2013.
As a result of strong equity performance, global equity valuations moved into challenging territory: The MSCI ACWI traded at 15 times earnings, MSCI EAFE, the international benchmark, traded at 19.8 times earnings while the S&P 500® Index traded at 17.3 times earnings, and the Dow Jones Euro at 17.5 times earnings, all numbers as of November 30, 2013.
It was a year of pleasant surprises in the market, as a theme of strong positive momentum with occasional corrections emerged. Buoyed by steady economic growth and the seeming emergence of several countries from financial crises, the equity markets posted impressive gains during the 2013 calendar year. Several pullbacks occurred as global investors weighed the impact of a government shutdown and potential tapering activities by the Fed, which kept a healthy amount of skepticism in the market.
We continue to see positive signs in the U.S. economy. Earlier this year in mid-October, the United States overtook Russia and Saudi Arabia to become the world's largest oil producing country, thanks to improved shale production in the Midwest. In addition, the Fed's willingness to begin tapering suggests confidence that the economy will grow even with decreasing monetary stimulus.
Other traditional measures of economic growth in the U.S. have seen sustained improvement through the end of the year. In October alone, new home sales increased by 25.4%, even amidst concerns about rising interest rates. Additionally, unemployment dropped to 7.0% on a strong jobs report this November, the first time it has reached that level in five years. Manufacturing data suggests lasting growth, as the Institute for Supply Management's Manufacturing Index hit 57.3, its highest level in 2.5 years. In the U.S. automotive sector, shipments of autos overseas rose 9% in the first 10 months of 2013, topping a record year in 2012. Ford Motor Company expects to sell its signature Mustang in a staggering 110 countries next year.
Asia
In Japan, Prime Minister Shinzo Abe's three arrow plan of economic stimulus appears to have set the Japanese economy on the track to recovery. The three arrows plan constitutes monetary easing practices by the Bank of Japan, a deficit-financed supplemental government budget filled with new public works spending, and a program of reforms to achieve growth-stimulating private investment.
In China, however, the growth outlook has been less optimistic as the government has taken steps to tighten liquidity resulting in credit constraints for manufacturers. This has resulted in stagnant Chinese equity growth, as evidenced by the flat performance of the Hang Seng index, which only gained 2.2% for the year.
Most of emerging Asia was strong as well. Vietnam closed out a strong year, with the VN Index adding 25% as growing stability and structural reforms strengthen the Vietnamese economy.
Europe
Despite a host of economic problems in the Euro zone, a slow thaw is under way for the European economy. Car sales rose for the third consecutive month on strength in Volkswagen and Renault, and manufacturing output reached a 30 month high in December. Across the 28-strong European Union, GDP was stagnant this year (after falling by 0.5% in 2012) and is set to expand by 1.4% in 2014, according to new forecasts from the European Commission on November 5th.
The German stock exchange DAX was the star performer in the Euro zone, rising more than 23%. The UK index gained 7.6% for the year, while France added 11.5%, struggling in the fourth quarter. Elsewhere, Spain seems to be emerging from its recession, with the Spanish IBEX index adding roughly 15% in the second half of the year.
South America
Amid a stormy climate for global emerging markets, Brazil continues to struggle. The instability of the Brazilian Real currency and the threat of tapering in the United States mean that Brazil could see an outflow of capital. Additionally, Brazil is running a budget deficit which accounts for 3.5% of the country's GDP.
Investment Strategy
Our longstanding approach to investing remains unchanged. Soledad Investment Management, the sub-adviser to the Fund, utilizes a long-term oriented buy-and-hold value philosophy in picking stocks for the Fund. We are a bottom-up manager, looking first at the fundamentals of a company. As such, when others are exuberant, we are typically cautious. Amidst heightened valuation, we will maintain our strategy of searching for established businesses with cheap valuations.
Our overall sentiment in the market is one of caution as stock markets across the board reach market highs. We continue to take advantage of market upturns and protect against downside risks accordingly.
We have assembled a diversified portfolio of compelling investments trading below our estimate of their intrinsic value while paying healthy dividends. We carefully monitor our holdings and have highlighted some of our top performers as well as detractors to our annual performance.
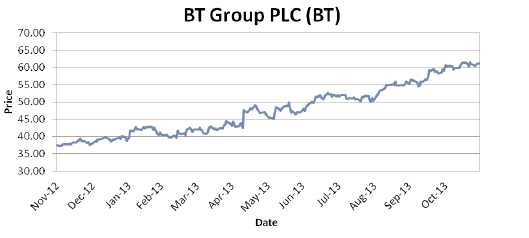
Strong Performers: BT Group PLC ADR (3.5% of the Fund on November 30th) and Avery Dennison (3.6% of the Fund on November 30th) helped pushed the Fund's performance for the year.
BT Group PLC is a provider of telecommunications networks and services in Great Britain. It provides local and long-distance telephone products and services, broadband network solutions, web hosting and related services. BT ended the year ending November 30, 2013 up 63.5% . BT has worked to improve efficiencies in their business even when struggling to grow revenues by consistently reducing costs, enabling margins to improve. BT has a forward price to earnings of 15 times earnings (Bloomberg) with a dividend yield of 2.5% .
Avery Dennison capped off an excellent year, gaining 45.1% . AVY has a forward price to earnings of 18 times earnings (Bloomberg) and dividend yield of 2.3% . The firm engages in the production of adhesive materials such as labels and tags, medical products, and equipment for data transfer. Avery Dennison consistently beat analyst earnings estimates in 2013. Strategic partnerships as well as analyst upgrades have boosted its stock price to all-time highs. Avery Dennison continues to decrease costs and increase cash flow by improving margins and increasing its consumer base, and remains one of the most dominant label manufacturers in the world.
2013 Annual Report 4
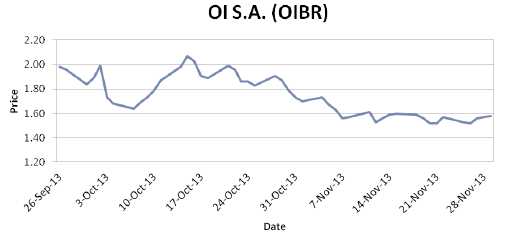
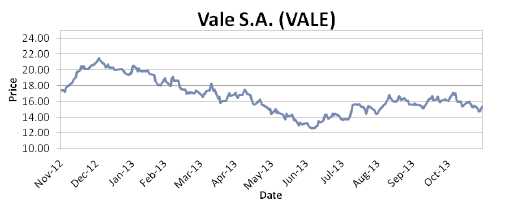
Weak Performers: OI SA (1.9% of the Fund on November 30th) and Vale SA (1.8% of the Fund on November 30th) both hurt results during the period.
OI SA ADR is a telecommunication service providing company in Brazil. It was down 21% from acquisition on September 26, 2013 through the end of the reporting period. The company offers telecommunications services that include fixed-line & mobile telecommunication services, data transmission services, ISP and other services. Nearly 70% of the firm's revenues come from wire-line business but that segment is in decline due to the fixed-line to mobile transition. OI SA posted solid third quarter earnings and is doing a solid job of improving its competitive position. OI has a forward price to earnings of 8 times earnings (Bloomberg), which we find very compelling.
VALE SA is a global metals and mining company based in Brazil, and was down 8% for the reporting period. It produces and supplies iron ore, iron ore pellets, nickel, manganese ore, copper, coal and others. The company also provides logistics services and invests in the energy and steel industry. Vale was especially affected by falling global iron ore prices as well as slowed demand from China. Vale maintains its competitive advantage from its very large, low-cost iron ore operations in Brazil. Vale's operational strength was hampered in 2013 by weakness in metal prices and the proliferation of a global market slowdown which led to decreased demand in the mining space. Copper, Vale's second largest mining product, saw its price fall by 10.2% in 2013 while iron ore, its premier commodity, fell by 7.5% . These downward pressures led to a 12.1% drop in Vale's stock price. Vale trades at a forward price to earnings of 6.7 times earnings (Bloomberg). For a global firm of Vale's reach, we think Vale's current valuation offers very compelling risk adjusted opportunities.
2013 Annual Report 5
Summary
Soledad Investment Management, which sub-advises the Fund, utilizes a long term oriented buy-and-hold value philosophy in picking stocks for the mutual fund. Our longstanding time-tested approach to investing remains unchanged. We are bottom-up managers, looking first at the fundamentals of a company to determine intrinsic value. We are confident that our value investment philosophy should reward patient investors with superior long term risk adjusted returns. Soledad Investment Management consistently searches globally on behalf of our clients for opportunities that will enhance their portfolio of holdings.
We thank you for your patience and steadfast confidence in our organization.
Louie Nguyen, Managing Member/Chief Investment Officer
Soledad Investment Management, Sub-Advisor
Past performance does not guarantee future results. The investment return and principal value of an investment will fluctuate so that an investor's shares, when redeemed, may be worth more or less than their original cost. Current performance may be lower or higher than the performance data quoted. You may obtain performance data current to the most recent month-end by calling toll free 1-888-550-9266. Investors should consider the investment objectives, risks, and charges and expenses of the Funds carefully before investing. The prospectus contains this and other information about the Funds. You may obtain a prospectus on our website www.cweil.com or by calling toll free 1-888-550-9266. The Fund's Distributor Is Rafferty Capital Markets, LLC.
Christopher Weil & Company Global Dividend Fund
Country Diversification as of November 30, 2013
(UNAUDITED)

*Net Cash represents cash equivalents and liabilities in excess of other assets.
2013 Annual Report 6
Christopher Weil & Company Funds
CHRISTOPHER WEIL & COMPANY CORE INVESTMENT FUND
Sector Allocation (Unaudited)
(As a Percentage of Net Assets)

*Net Cash represents cash equivalents and liabilities in excess of other assets.
CHRISTOPHER WEIL & COMPANY GLOBAL DIVIDEND FUND
Sector Allocation (Unaudited)
(As a Percentage of Net Assets)
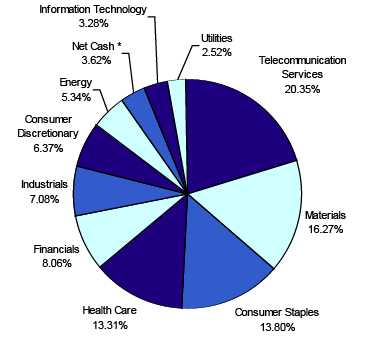
*Net Cash represents cash equivalents and liabilities in excess of other assets.
2013 Annual Report 7
Christopher Weil & Company Core Investment Fund (Unaudited)
PERFORMANCE INFORMATION
November 30, 2013 NAV $14.21
Average Annual Total Returns for the Periods Ended November 30, 2013.
| | | | Since | |
| | 1 Year(A) | | Inception(A) | |
| Christopher Weil & Company Core Investment Fund | 29.78% | | 19.99% | |
| S&P 500® Index (B) | 30.30% | | 23.84% | |
Total Annual Fund Operating Expense Ratio (from Prospectus dated 3/28/13): 1.50%
The Total Annual Fund Operating Expense Ratio reported above may not correlate to the expense ratio in the Fund’s financial highlights because the financial highlights include only the direct operating expenses incurred by the Fund, not the indirect costs of investing in acquired funds.
(A) 1 Year and Since Inception returns include change in share prices and in each case includes reinvestment of any dividends and capital gain distributions. The inception date of the Christopher Weil & Company Core Investment Fund was December 21, 2011.
(B) The S&P 500® Index is a widely recognized unmanaged index of equity prices and is representative of a broader market and range of securities than is found in the Fund’s portfolio. The Index is an unmanaged benchmark that assumes reinvestment of all distributions and excludes the effect of taxes and fees. Individuals cannot invest directly in this Index; however, an individual can invest in exchange traded funds or other investment vehicles that attempt to track the performance of a benchmark index.
PAST PERFORMANCE DOES NOT GUARANTEE FUTURE RESULTS. INVESTMENT RETURN AND PRINCIPAL VALUE WILL FLUCTUATE SO THAT SHARES, WHEN REDEEMED, MAY BE WORTH MORE OR LESS THAN THEIR ORIGINAL COST. RETURNS DO NOT REFLECT THE DEDUCTION OF TAXES THAT A SHAREHOLDER WOULD PAY ON FUND DISTRIBUTIONS OR THE REDEMPTION OF FUND SHARES. CURRENT PERFORMANCE MAY BE LOWER OR HIGHER THAN THE PERFORMANCE DATA QUOTED. TO OBTAIN PERFORMANCE DATA CURRENT TO THE MOST RECENT MONTH END, PLEASE CALL 1-888-550-9266 OR VISIT OUR WEBSITE AT www.cweil.com. THE FUND'S DISTRIBUTOR IS RAFFERTY CAPITAL MARKETS, LLC.
2013 Annual Report 8
Christopher Weil & Company Global Dividend Fund (Unaudited)
PERFORMANCE INFORMATION
November 30, 2013 NAV $13.53
Average Annual Total Returns for the Periods Ended November 30, 2013.
| | | | Since | |
| | 1 Year(A) | | Inception(A) | |
| Christopher Weil & Company Global Dividend Fund | 24.77% | | 17.97% | |
| MSCI ACWI Index (B) | 23.45% | | 19.85% | |
Total Annual Fund Operating Expense Ratio (from Prospectus dated 3/28/13): 1.76%
The Total Annual Fund Operating Expense Ratio reported above may not correlate to the expense ratio in the Fund’s financial highlights because the financial highlights include only the direct operating expenses incurred by the Fund, not the indirect costs of investing in acquired funds.
(A) 1 Year and Since Inception returns include change in share prices and in each case includes reinvestment of any dividends and capital gain distributions. The inception date of the Christopher Weil & Company Global Dividend Fund was December 21, 2011.
(B) The MSCI ACWI Index is a free float-adjusted market capitalization weighted index that is designed to measure the equity market performance of developed and emerging markets. The MSCI ACWI consists of 45 country indices comprising 24 developed and 21 emerging market country indices.
PAST PERFORMANCE DOES NOT GUARANTEE FUTURE RESULTS. INVESTMENT RETURN AND PRINCIPAL VALUE WILL FLUCTUATE SO THAT SHARES, WHEN REDEEMED, MAY BE WORTH MORE OR LESS THAN THEIR ORIGINAL COST. RETURNS DO NOT REFLECT THE DEDUCTION OF TAXES THAT A SHAREHOLDER WOULD PAY ON FUND DISTRIBUTIONS OR THE REDEMPTION OF FUND SHARES. CURRENT PERFORMANCE MAY BE LOWER OR HIGHER THAN THE PERFORMANCE DATA QUOTED. TO OBTAIN PERFORMANCE DATA CURRENT TO THE MOST RECENT MONTH END, PLEASE CALL 1-888-550-9266 OR VISIT OUR WEBSITE AT www.cweil.com. THE FUND'S DISTRIBUTOR IS RAFFERTY CAPITAL MARKETS, LLC.
2013 Annual Report 9
| Christopher Weil & Company Core Investment Fund |
| |
| | | | Schedule of Investments |
| | | | November 30, 2013 |
| Shares/Principal Amount | Fair Value | % of Net Assets |
| COMMON STOCKS | | | | |
| | | | |
| COMMUNICATIONS | | | | |
| Services - Business Services, NEC | | | | |
| 1,000 | priceline.com Incorporated * | $ | 1,192,330 | | |
| Services - Computer Programming, Data Processing, Etc. | | | | |
| 15,900 | Facebook, Inc. Class A * | | 747,459 | | |
| 1,100 | Google Inc. Class A * | | 1,165,549 | | |
| | | | 1,913,008 | | |
| Total for Communications | | 3,105,338 | 8.94 | % |
| | | | |
| CONSUMER DISCRETIONARY | | | | |
| Apparel & Other Finished Products Of Fabrics & Similar Material | | | | |
| 12,600 | Under Armour, Inc. Class A * | | 1,016,820 | | |
| Leather & Leather Products | | | | |
| 12,800 | Michael Kors Holdings Limited * (Hong Kong) | | 1,043,840 | | |
| Retail - Retail Stores, NEC | | | | |
| 7,800 | Ulta Salon, Cosmetics & Fragrance, Inc. * | | 990,132 | | |
| Retail - Variety Stores | | | | |
| 19,600 | Five Below, Inc. * | | 1,041,936 | | |
| Soap, Detergents, Cleaning Preparations, Perfumes, Cosmetics | | | | |
| 12,288 | Ecolab Inc. | | 1,316,905 | | |
| Wholesale - Motor Vehicles & Motor Vehicle Parts & Supplies | | | | |
| 31,462 | LKQ Corporation * | | 1,042,965 | | |
| Total for Consumer Discretionary | | 6,452,598 | 18.60 | % |
| | | | |
| CONSUMER STAPLES | | | | |
| Food And Kindred Products | | | | |
| 14,000 | The Hain Celestial Group, Inc. * | | 1,157,660 | | |
| Household Appliances | | | | |
| 15,200 | SodaStream International Ltd. * (Israel) | | 873,696 | | |
| Total for Consumer Staples | | 2,031,356 | 5.85 | % |
| | | | | |
| ENERGY | | | | | |
| Crude Petroleum & Natural Gas | | | | |
| 13,902 | Noble Energy, Inc. | | 976,476 | | |
| Total for Energy | | 976,476 | 2.81 | % |
| | | | | |
| FINANCIALS | | | | | |
| Investment Advice | | | | |
| 5,000 | Affiliated Managers Group, Inc. * | | 1,001,250 | | |
| Services - Consumer Credit Reporting, Collection Agencies | | | | |
| 12,619 | Portfolio Recovery Associates, Inc. * | | 736,950 | | |
| Services - Business Services, NEC | | | | |
| 7,195 | FleetCor Technologies, Inc. * | | 876,207 | | |
| 1,600 | Mastercard, Inc. | | 1,217,296 | | |
| | | | 2,093,503 | | |
| Total for Financials | | 3,831,703 | 11.04 | % |
| | | | | |
| HEALTH CARE | | | | | |
| Biological Products, (No Diagnostic Substances) | | | | |
| 4,400 | Biogen Idec Inc. * | | 1,280,268 | | |
| Laboratory Analytical Instruments | | | | |
| 11,000 | Illumina, Inc. * | | 1,078,000 | | |
* Non-Income Producing Securities.
The accompanying notes are an integral part of these
financial statements. |
2013 Annual Report 10
| Christopher Weil & Company Core Investment Fund |
| |
| | | | Schedule of Investments |
| | | | November 30, 2013 |
| Shares/Principal Amount | | Fair Value | | % of Net Assets |
| COMMON STOCKS - Continued | | | | | |
| | | | | |
| Pharmaceutical Preparations | | | | | |
| 7,300 | Celgene Corporation * | $ | 1,180,921 | | | |
| 11,400 | Jazz Pharmaceuticals plc * (Ireland) | | 1,332,888 | | | |
| 12,000 | Salix Pharmaceuticals, Ltd. * | | 1,017,720 | | | |
| | | | 3,531,529 | | | |
| Total for Health Care | | 5,889,797 | | 16.96 | % |
| | | | | | |
| INDUSTRIALS | | | | | | |
| Air Transportation, Scheduled | | | | | |
| 23,000 | Spirit Airlines, Inc. * | | 1,055,010 | | | |
| Construction - Special Trade Contractors | | | | | |
| 13,600 | Chicago Bridge & Iron Company N.V. (Netherlands) | | 1,042,848 | | | |
| General Building Contractors - Residential Buildings | | | | | |
| 23,800 | Fortune Brands Home & Security, Inc. | | 1,037,680 | | | |
| Motors & Generators | | | | | |
| 21,200 | Generac Holdings Inc. | | 1,129,112 | | | |
| Railroads, Line-Haul Operating | | | | | |
| 7,072 | Kansas City Southern | | 855,853 | | | |
| Total for Industrials | | 5,120,503 | | 14.75 | % |
| | | | | |
| INFORMATION TECHNOLOGY | | | | | |
| Computer Peripheral Equipment, NEC | | | | | |
| 8,700 | Stratasys LTD * | | 1,024,599 | | | |
| Electronic Computers | | | | | |
| 2,608 | Apple Inc. | | 1,450,231 | | | |
| Services - Business Services, NEC | | | | | |
| 20,400 | MAXIMUS, Inc. | | 928,200 | | | |
| Services - Computer Programming Services | | | | | |
| 28,800 | EPAM Systems, Inc. * | | 1,021,536 | | | |
| Total for Information Technology | | 4,424,566 | | 12.74 | % |
| Total for Common Stocks (Cost $25,965,585) | $ | 31,832,337 | | 91.69 | % |
| | | | | |
| MONEY MARKET FUNDS | | | | | |
| 5,242,706 | Invesco Short Term Investments Treasury Class I 0.02%*** | | 5,242,706 | | 15.10 | % |
| | (Cost $5,242,706) | | | | | |
| Total Investment Securities | | 37,075,043 | | 106.79 | % |
| | (Cost $31,208,291) | | | | | |
| Liabilities In Excess of Other Assets | | (2,357,570 | ) | -6.79 | % |
| Net Assets | | $ | 34,717,473 | | 100.00 | % |
* Non-Income Producing Securities.
*** The rate shown was the 7-day yield at November 30, 2013. |
The accompanying notes are an integral part of these
financial statements. |
2013 Annual Report 11
| Christopher Weil & Company Global Dividend Fund |
| |
| | | | Schedule of Investments |
| | | | November 30, 2013 |
| Shares/Principal Amount | Fair Value | % of Net Assets |
| COMMON STOCKS | | | | |
| |
| CONSUMER DISCRETIONARY | | | | |
| Games, Toys & Children's Vehicles (No Dolls & Bicycles) | | | | |
| 21,730 | Hasbro, Inc. | $ | 1,169,509 | | |
| Retail - Miscellaneous Shopping Goods Stores | | | | |
| 57,400 | Staples, Inc. | | 891,422 | | |
| Total for Consumer Discretionary | | 2,060,931 | 6.37 | % |
| | | | |
| CONSUMER STAPLES | | | | |
| Beverages | | | | | |
| 10,320 | PepsiCo, Inc. | | 871,627 | | |
| Cigarettes | | | | | |
| 17,095 | Altria Group, Inc. | | 632,173 | | |
| Converted Paper & Paperboard Products (No Containers/Boxes) | | | | |
| 7,256 | Kimberly-Clark Corporation | | 792,065 | | |
| Food And Kindred Products | | | | |
| 5,403 | Kraft Foods Inc. | | 287,007 | | |
| 27,782 | Unilever plc ** | | 1,125,171 | | |
| | | | 1,412,178 | | |
| Malt Beverages | | | | |
| 14,350 | Molson Coors Brewing Company Class B | | 755,815 | | |
| Total for Consumer Staples | | 4,463,858 | 13.80 | % |
| | | | | |
| ENERGY | | | | | |
| Crude Petroleum & Natural Gas | | | | |
| 21,421 | TOTAL S.A. ** | | 1,292,115 | | |
| Petroleum Refining | | | | |
| 3,562 | Chevron Corporation | | 436,131 | | |
| Total for Energy | | 1,728,246 | 5.34 | % |
| | | | | |
| FINANCIALS | | | | | |
| Commercial Banks, NEC | | | | |
| 81,000 | Banco Santander (Brasil) S.A. ** | | 724,140 | | |
| Savings Institution, Federally Chartered | | | | |
| 20,792 | HSBC Holdings plc ** | | 1,166,431 | | |
| Services - Business Services, NEC | | | | |
| 43,000 | The Western Union Company | | 716,810 | | |
| Total for Financials | | 2,607,381 | 8.06 | % |
| | | | | |
| HEALTH CARE | | | | | |
| Pharmaceutical Preparations | | | | |
| 15,055 | AstraZeneca plc ** | | 860,995 | | |
| 16,392 | GlaxoSmithKline plc ** | | 867,465 | | |
| 16,243 | Merck & Co., Inc. | | 809,389 | | |
| 28,533 | Pfizer Inc. | | 905,352 | | |
| 16,309 | Sanofi S.A. ** | | 861,604 | | |
| | | | 4,304,805 | | |
| Total for Health Care | | 4,304,805 | 13.31 | % |
| | | | | |
| INDUSTRIALS | | | | | |
| Electronic & Other Electrical Equipment (No Computer Equip) | | | | |
| 43,867 | General Electric Company | | 1,169,494 | | |
| 31,280 | Koninklijke Philips Electronics N.V. ** | | 1,118,573 | | |
| | | | 2,288,067 | | |
| Total for Industrials | | 2,288,067 | 7.08 | % |
** ADR - American Depository Receipt.
The accompanying notes are an integral part of these
financial statements. |
2013 Annual Report 12
| Christopher Weil & Company Global Dividend Fund |
| |
| | | | Schedule of Investments |
| | | | November 30, 2013 |
| Shares/Principal Amount | Fair Value | | % of Net Assets |
| COMMON STOCKS - Continued | | | | | |
| |
| INFORMATION TECHNOLOGY | | | | | |
| Semiconductors & Related Devices | | | | | |
| 44,461 | Intel Corporation | $ | 1,059,950 | | | |
| Total for Information Technology | | 1,059,950 | | 3.28 | % |
| | | | | | |
| MATERIALS | | | | | | |
| Cement, Hydraulic | | | | | |
| 39,304 | CRH plc ** | | 1,000,680 | | | |
| Chemicals - Diversified | | | | | |
| 8,693 | BASF Aktiengesellschaft ** | | 929,629 | | | |
| 12,266 | E.I. du Pont de Nemours and Company | | 752,887 | | | |
| | | | 1,682,516 | | | |
| Converted Paper & Paperboard Products (No Containers/Boxes) | | | | | |
| 23,831 | Avery Dennison Corporation | | 1,165,336 | | | |
| Metal Mining | | | | | | |
| 15,930 | Rio Tinto plc ** | | 845,087 | | | |
| 37,000 | Vale S.A. ** | | 566,840 | | | |
| | | | 1,411,927 | | | |
| Total for Materials | | 5,260,459 | | 16.27 | % |
| | | | | |
| TELECOMMUNICATION SERVICES | | | | | |
| Radiotelephone Communications | | | | | |
| 29,748 | Vodafone Group plc ** | | 1,103,353 | | | |
| Telephone Communications (No Radiotelephone) | | | | | |
| 12,932 | AT&T Inc. | | 455,336 | | | |
| 15,189 | BCE Inc. (Canada) | | 671,202 | | | |
| 18,336 | BT Group plc ** | | 1,119,963 | | | |
| 381,000 | Oi S.A. ** | | 601,980 | | | |
| 78,488 | Orange S.A. ** | | 1,018,774 | | | |
| 67,037 | Telefonica S.A. ** | | 1,101,418 | | | |
| 10,177 | Verizon Communications Inc. | | 504,983 | | | |
| | | | 5,473,656 | | | |
| Total for Telecommunication Services | | 6,577,009 | | 20.35 | % |
| | | | | | |
| UTILITIES | | | | | | |
| Electric Services | | | | | |
| 26,539 | PPL Corporation | | 815,013 | | | |
| Total for Utilities | | 815,013 | | 2.52 | % |
| Total for Common Stocks (Cost $24,937,158) | $ | 31,165,719 | | 96.38 | % |
| | | | | |
| MONEY MARKET FUNDS | | | | | |
| 1,202,304 | Invesco Short Term Investments Treasury Class I 0.02%*** | | 1,202,304 | | 3.72 | % |
| | (Cost $1,202,304) | | | | | |
| Total Investment Securities | | 32,368,023 | | 100.10 | % |
| | (Cost $26,139,462) | | | | | |
| Liabilities In Excess of Other Assets | | (31,533 | ) | -0.10 | % |
| Net Assets | | $ | 32,336,490 | | 100.00 | % |
** ADR - American Depository Receipt.
*** The rate shown was the 7-day yield at November 30, 2013. |
The accompanying notes are an integral part of these
financial statements. |
2013 Annual Report 13
| Christopher Weil & Company Funds |
| |
| Statements of Assets and Liabilities | | Core Investment | | | Global Dividend |
| November 30, 2013 | | Fund | | | Fund |
| |
| Assets: | | | | | |
| Investment Securities at Fair Value* | $ | 37,075,043 | | $ | 32,368,023 |
| Dividends Receivable | | - | | | 76,044 |
| Interest Receivable | | 82 | | | 19 |
| Total Assets | | 37,075,125 | | | 32,444,086 |
| Liabilities: | | | | | |
| Payable for Securities Purchased | | 2,263,853 | | | - |
| Payable for Advisor Fees | | 27,878 | | | 32,737 |
| Payable for Services Fees | | 13,939 | | | 13,095 |
| Payable to Custodian | | 51,982 | | | 61,764 |
| Total Liabilities | | 2,357,652 | | | 107,596 |
| Net Assets | $ | 34,717,473 | | $ | 32,336,490 |
| Net Assets Consist of: | | | | | |
| Paid In Capital | $ | 25,675,787 | | $ | 24,928,792 |
| Accumulated Undistributed Net Investment Income | | 0 | | | 439,180 |
| Accumulated Realized Gain (Loss) on Investments - Net | | 3,174,934 | | | 739,957 |
| Unrealized Appreciation (Depreciation) in Value of Investments - Net | | 5,866,752 | | | 6,228,561 |
| Net Assets | $ | 34,717,473 | | $ | 32,336,490 |
| |
| Net Asset Value and Offering Price (Note 2) | $ | 14.21 | | $ | 13.53 |
| Minimum Redemption Price (Note 2) | $ | 13.93 | | $ | 13.26 |
| |
| * Investments at Identified Cost | $ | 31,208,291 | | $ | 26,139,462 |
| |
| Shares Outstanding (Unlimited number of shares | | 2,443,984 | | | 2,389,673 |
| authorized without par value) | | | | | |
| |
| Statements of Operations | | | | | |
| For the fiscal year ended November 30, 2013 | | | | | |
| |
| Investment Income: | | | | | |
| Dividends ** | $ | 345,171 | | $ | 985,728 |
| Interest | | 372 | | | 391 |
| Total Investment Income | | 345,543 | | | 986,119 |
| Expenses: | | | | | |
| Investment Advisor Fees | | 288,959 | | | 349,504 |
| Services Fees | | 144,479 | | | 139,802 |
| Total Expenses | | 433,438 | | | 489,306 |
| |
| Net Investment Income (Loss) | | (87,895 | ) | | 496,813 |
| |
| Realized and Unrealized Gain (Loss) on Investments, Options Purchased and Options Written: | | | |
| Net Realized Gain (Loss) on Investments | | 3,972,004 | | | 747,657 |
| Net Realized Gain (Loss) on Options Purchased | | (142,276 | ) | | - |
| Net Realized Gain (Loss) on Options Written | | 10,768 | | | - |
| Net Change in Unrealized Appreciation (Depreciation) on Investments | | 3,866,083 | | | 4,913,797 |
| Net Realized and Unrealized Gain (Loss) on Investments, Options Purchased | | | | | |
| and Options Written | | 7,706,579 | | | 5,661,454 |
| |
| Net Increase (Decrease) in Net Assets from Operations | $ | 7,618,684 | | $ | 6,158,267 |
| |
| ** Net of Foreign Withholding Taxes and ADR Fees | $ | 4,651 | | $ | 73,064 |
The accompanying notes are an integral part of these
financial statements. |
2013 Annual Report 14
| Christopher Weil & Company Funds |
| |
| Statements of Changes in Net Assets | | Core Investment Fund | | | Global Dividend Fund | |
| |
| | | 12/1/2012 | | | 12/21/2011* | | | 12/1/2012 | | | 12/21/2011* | |
| | | to | | | to | | | to | | | to | |
| | | 11/30/2013 | | | 11/30/2012 | | | 11/30/2013 | | | 11/30/2012 | |
| From Operations: | | | | | | | | | | | | |
| Net Investment Income (Loss) | $ | (87,895 | ) | $ | 60,978 | | $ | 496,813 | | $ | 400,004 | |
| Net Realized Gain (Loss) | | 3,840,496 | | | (568,419 | ) | | 747,657 | | | (7,700 | ) |
| Change in Net Unrealized Appreciation (Depreciation) | | 3,866,083 | | | 2,000,669 | | | 4,913,797 | | | 1,314,764 | |
| Increase (Decrease) in Net Assets from Operations | | 7,618,684 | | | 1,493,228 | | | 6,158,267 | | | 1,707,068 | |
| From Distributions to Shareholders: | | | | | | | | | | | | |
| Net Investment Income | | (70,226 | ) | | - | | | (457,637 | ) | | - | |
| Net Realized Gain from Security Transactions | | - | | | - | | | - | | | - | |
| Total Distributions to Shareholders | | (70,226 | ) | | - | | | (457,637 | ) | | - | |
| From Capital Share Transactions: | | | | | | | | | | | | |
| Proceeds From Sale of Shares | | 4,650,520 | | | 24,422,459 | | | 4,568,009 | | | 23,759,887 | |
| Proceeds from Redemption Fees (Note 2) | | - | | | - | | | - | | | - | |
| Shares Issued on Reinvestment of Dividends | | 70,226 | | | - | | | 457,637 | | | - | |
| Cost of Shares Redeemed | | (2,507,651 | ) | | (959,767 | ) | | (2,861,617 | ) | | (995,124 | ) |
| Net Increase (Decrease) from Shareholder Activity | | 2,213,095 | | | 23,462,692 | | | 2,164,029 | | | 22,764,763 | |
| Net Increase (Decrease) in Net Assets | | 9,761,553 | | | 24,955,920 | | | 7,864,659 | | | 24,471,831 | |
| |
| Net Assets at Beginning of Period | | 24,955,920 | | | - | | | 24,471,831 | | | - | |
| |
| Net Assets at End of Period | $ | 34,717,473 | | $ | 24,955,920 | | $ | 32,336,490 | | $ | 24,471,831 | |
| |
| Accumulated Undistributed Net Investment Income | $ | - | | $ | 60,978 | | $ | 439,180 | | $ | 400,004 | |
| |
| |
| Share Transactions: | | | | | | | | | | | | |
| Issued | | 367,210 | | | 2,359,730 | | | 367,713 | | | 2,307,058 | |
| Reinvested | | 6,431 | | | - | | | 41,908 | | | - | |
| Redeemed | | (202,051 | ) | | (87,336 | ) | | (234,973 | ) | | (92,033 | ) |
| Net Increase (Decrease) in Shares | | 171,590 | | | 2,272,394 | | | 174,648 | | | 2,215,025 | |
| Shares Outstanding Beginning of Period | | 2,272,394 | | | - | | | 2,215,025 | | | - | |
| Shares Outstanding End of Period | | 2,443,984 | | | 2,272,394 | | | 2,389,673 | | | 2,215,025 | |
* Commencement of Operations.
The accompanying notes are an integral part of these
financial statements. |
2013 Annual Report 15
| Christopher Weil & Company Core Investment Fund |
| |
| |
| Financial Highlights | | | | | | |
| |
| Selected data for a share outstanding throughout the period: | | 12/1/2012 | | | 12/21/2011* | |
| | | to | | | to | |
| | | 11/30/2013 | | | 11/30/2012 | |
| Net Asset Value - Beginning of Period | $ | 10.98 | | $ | 10.00 | |
| Net Investment Income (Loss) (a) | | (0.04 | ) | | 0.03 | |
| Net Gains (Loss) on Investments (Realized and Unrealized) | | 3.30 | | | 0.95 | |
| Total from Investment Operations (b) | | 3.26 | | | 0.98 | |
| Distributions (From Net Investment Income) | | (0.03 | ) | | - | |
| Distributions (From Capital Gains) | | - | | | - | |
| Total Distributions | | (0.03 | ) | | - | |
| Proceeds from Redemption Fee (Note 2) | | - | | | - | |
| Net Asset Value - End of Period | $ | 14.21 | | $ | 10.98 | |
| Total Return (c) | | 29.78% | | | 9.80% | *** |
| Ratios/Supplemental Data | | | | | | |
| Net Assets - End of Period (Thousands) | $ | 34,717 | | $ | 24,956 | |
| Ratio of Expenses to Average Net Assets | | 1.50% | | | 1.50% | ** |
| Ratio of Net Investment Income (Loss) to Average Net Assets | | -0.30% | | | 0.30% | ** |
| Portfolio Turnover Rate | | 164.60% | | | 59.33% | *** |
| Christopher Weil & Company Global Dividend Fund |
| |
| |
| Financial Highlights | | | | | | |
| |
| Selected data for a share outstanding throughout the period: | | 12/1/2012 | | | 12/21/2011* | |
| | | to | | | to | |
| | | 11/30/2013 | | | 11/30/2012 | |
| Net Asset Value - Beginning of Period | $ | 11.05 | | $ | 10.00 | |
| Net Investment Income (Loss) (a) | | 0.22 | | | 0.21 | |
| Net Gains (Loss) on Investments (Realized and Unrealized) (b) | | 2.47 | | | 0.84 | |
| Total from Investment Operations | | 2.69 | | | 1.05 | |
| Distributions (From Net Investment Income) | | (0.21 | ) | | - | |
| Distributions (From Capital Gains) | | - | | | - | |
| Total Distributions | | (0.21 | ) | | - | |
| Proceeds from Redemption Fee (Note 2) | | - | | | - | |
| Net Asset Value - End of Period | $ | 13.53 | | $ | 11.05 | |
| Total Return (c) | | 24.77% | | | 10.50% | *** |
| Ratios/Supplemental Data | | | | | | |
| Net Assets - End of Period (Thousands) | $ | 32,336 | | $ | 24,472 | |
| Ratio of Expenses to Average Net Assets | | 1.75% | | | 1.75% | ** |
| Ratio of Net Investment Income (Loss) to Average Net Assets | | 1.78% | | | 2.05% | ** |
| Portfolio Turnover Rate | | 9.59% | | | 4.91% | *** |
* Commencement of Operations.
** Annualized.
*** Not Annualized.
(a) Per share amount calculated using the average shares method.
(b) Realized and unrealized gains and losses per share in this caption are balancing amounts necessary to reconcile the
change in net asset value for the period, and may not reconcile with the aggregate gains and losses in the Statement of
Operations due to share transactions for the period.
(c) Total return in the above table represents the rate that the investor would have earned or lost on an investment in the Fund
assuming reinvestment of dividends. Returns do not reflect the deduction of taxes a shareholder would pay on Fund
distributions or redemption of Fund shares. |
The accompanying notes are an integral part of these
financial statements. |
2013 Annual Report 16
NOTES TO FINANCIAL STATEMENTS
CHRISTOPHER WEIL & COMPANY CORE INVESTMENT FUND
CHRISTOPHER WEIL & COMPANY GLOBAL DIVIDEND FUND
November 30, 2013
1.) ORGANIZATION
Christopher Weil & Company Core Investment Fund (“Core Investment”) and Christopher Weil & Company Global Dividend Fund (“Global Dividend”) (collectively, the “Funds” or the “CWC Funds”) were each organized as a diversified series of the PFS Funds (the “Trust”) on December 16, 2011. The Trust was established under the laws of Massachusetts by an Agreement and Declaration of Trust dated January 13, 2000, which was amended and restated as of January 20, 2011. Prior to March 5, 2010, the Trust was named Wireless Fund. The Trust is registered as an open-end investment company under the Investment Company Act of 1940, as amended (the “1940 Act”). The Trust may offer an unlimited number of shares of beneficial interest in a number of separate series, each series representing a distinct fund with its own investment objectives and policies. As of November 30, 2013, there were nine series authorized by the Trust. The investment advisor to Core Investment and Global Dividend is Christopher Weil & Company, Inc. (the “Advisor” or “CWC”). The Funds commenced operations on December 21, 2011. The Funds’ investment objective is to seek long-term capital appreciation. Significant accounting policies of the Funds are presented in Note 2 below.
2.) SIGNIFICANT ACCOUNTING POLICIES
SECURITY VALUATION: All investments in securities are recorded at their estimated fair value, as described in Note 3.
SHARE VALUATION: The net asset value (the “NAV”) is generally calculated as of the close of trading on the New York Stock Exchange (“Exchange”) (normally 4:00 p.m. Eastern time) every day the Exchange is open. The NAV for each Fund is calculated by taking the total value of each Fund’s assets, subtracting its liabilities, and then dividing by the total number of shares outstanding, rounded to the nearest cent. The offering price and redemption price per share is equal to the net asset value per share, except that shares of each Fund are subject to a redemption fee of 2% if redeemed within 90 days of purchase. During the fiscal year ended November 30, 2013, proceeds from redemption fees were $0 and $0 for Core Investment and Global Dividend, respectively.
SHORT SALES: Each Fund may sell a security it does not own in anticipation of a decline in the fair value of the security. When a Fund sells a security short, it must borrow the security sold short and deliver it to the broker-dealer through which it made the short sale. A gain, limited to the price at which a Fund sold the security short, or a loss, unlimited in size, will be recognized upon the termination of a short sale.
OPTIONS: The purchase and writing of options requires additional skills and techniques beyond normal portfolio management, and involves certain risks. The purchase of options limits a Fund’s potential loss to the amount of the premium paid and can afford a Fund the opportunity to profit from favorable movements in the price of the underlying security to a greater extent than if the transaction were effected directly. When a Fund writes an option, an amount equal to the premium received by the Fund is recorded as a liability and is subsequently adjusted to the current fair value of the option written. Premiums received from writing options that expire unexercised are treated by a Fund on the expiration date as realized gains from investments. The difference between the premium and the amount paid on effecting a closing purchase transaction, including brokerage commissions, is also treated as a realized gain, or, if the premium is less than the amount paid for the closing purchase transaction, as a realized loss. If a written call option is exercised, the premium is added to the proceeds from the sale of the underlying security or currency in determining whether a Fund has realized a gain or a loss. If a written put option is exercised, the premium reduces the cost basis of the securities purchased by the Fund. A Fund, as writer of an option, bears the market risk of an unfavorable change in the price of the security underlying the written option.
INCOME TAXES: The Funds’ policy is to continue to comply with the requirements of the Internal Revenue Code that are applicable to regulated investment companies and to distribute all of their taxable income to shareholders. Therefore, no federal income tax provision is required. It is the Funds’ policy to distribute annually, prior to the end of the calendar year, dividends sufficient to satisfy excise tax requirements of the Internal Revenue Code. This Internal Revenue Code requirement may cause an excess of distributions over the book year-end accumulated income. In addition, it is the Funds’ policy to distribute annually, after the end of the fiscal year, any remaining net investment income and net realized capital gains.
2013 Annual Report 17
Notes to Financial Statements - continued
The Funds recognize the tax benefits of certain tax positions only where the position is “more likely than not” to be sustained assuming examination by tax authorities. Management has analyzed the Funds’ tax positions, and has concluded that no liability for unrecognized tax benefits should be recorded related to uncertain tax positions taken on returns filed for open tax year 2011, or expected to be taken in the Funds’ 2012 tax returns. The Funds identify their major tax jurisdictions as U.S. Federal tax authorities; however the Funds are not aware of any tax positions for which they are reasonably possible that the total amounts of unrecognized tax benefits will change materially in the next twelve months. The Funds recognize interest and penalties, if any, related to unrecognized tax benefits as income tax expense in the statements of operations. During the fiscal year ended November 30, 2013, the Funds did not incur any interest or penalties.
USE OF ESTIMATES: The preparation of financial statements in conformity with accounting principles generally accepted in the United States (“GAAP”) requires management to make estimates and assumptions that affect the reported amounts of assets and liabilities and disclosure of contingent assets and liabilities at the date of the financial statements and the reported amounts of increases and decreases in net assets from operations during the reporting period. Actual results could differ from those estimates.
DISTRIBUTIONS TO SHAREHOLDERS: Distributions to shareholders, which are determined in accordance with income tax regulations, are recorded on the ex-dividend date. The treatment for financial reporting purposes of distributions made to shareholders during the year from net investment income or net realized capital gains may differ from their ultimate treatment for federal income tax purposes. These differences are caused primarily by differences in the timing of recognition of certain components of income, expense or realized capital gain for federal income tax purposes. Where such differences are permanent in nature, they are reclassified in the components of the net assets based on their ultimate characterization for federal income tax purposes. Any such reclassification will have no effect on net assets, results of operations or net asset values per share of any Fund. As of November 30, 2013, as a result of permanent book to tax differences, Core Fund accumulated net investment losses totaling $87,895 and distributions in excess of book ordinary income of $9,248 were reclassified to accumulated realized gain on investments – net.
EXPENSES: Expenses incurred by the Trust that do not relate to a specific fund of the Trust are allocated to the individual fund based on each fund’s relative net assets or another appropriate basis.
OTHER: Each Fund records security transactions based on a trade date. Dividend income is recognized on the ex-dividend date, and interest income is recognized on an accrual basis. Discounts and premiums on securities purchased are accreted and amortized over the lives of the respective securities. Withholding taxes on foreign dividends have been provided for in accordance with each Fund’s understanding of the applicable country’s tax rules and rates.
3.) SECURITY VALUATIONS
The Funds utilize various methods to measure the fair value of their investments on a recurring basis. GAAP establishes a hierarchy that prioritizes inputs to valuation methods. The three levels of inputs are:
Level 1 - Unadjusted quoted prices in active markets for identical assets or liabilities that the Funds have the ability to access.
Level 2 - Observable inputs other than quoted prices included in level 1 that are observable for the asset or liability, either directly or indirectly. These inputs may include quoted prices for the identical instrument on an inactive market, prices for similar instruments, interest rates, prepayment speeds, credit risk, yield curves, default rates and similar data.
Level 3 - Unobservable inputs for the asset or liability, to the extent relevant observable inputs are not available, representing the Funds’ own assumptions about the assumptions a market participant would use in valuing the assets or liabilities, and would be based on the best information available.
The availability of observable inputs can vary from security to security and is affected by a wide variety of factors, including, for example, the type of security, whether the security is new and not yet established in the marketplace, the liquidity of markets, and other characteristics particular to the security. To the extent that valuation is based on models or inputs that are less observable or unobservable in the market, the determination of fair value requires more judgment. Accordingly, the degree of judgment exercised in determining fair value is greatest for instruments categorized in level 3.
2013 Annual Report 18
Notes to Financial Statements - continued
The inputs used to measure fair value may fall into different levels of the fair value hierarchy. In such cases, for disclosure purposes, the level in the fair value hierarchy within which the fair value measurement falls in its entirety, is determined based on the lowest level input that is significant to the fair value measurement in its entirety.
FAIR VALUE MEASUREMENTS
A description of the valuation techniques applied to the Funds’ major categories of assets and liabilities measured at fair value on a recurring basis follows:
Equity securities (common stocks, including ADRs). Equity securities are carried at fair value. The market quotation used for equity securities, including those listed on the NASDAQ National Market System, is the last sale price on the date on which the valuation is made or, in the absence of sales, at the closing bid price. Over-the-counter securities will be valued on the basis of the bid price at the close of each business day. Generally, if the security is traded in an active market and is valued at the last sale price, the security is categorized as a level 1 security. When the security position is not considered to be part of an active market or when the security is valued at the bid price, the position is generally categorized as level 2. When market quotations are not readily available, when the Advisor determines the last bid price does not accurately reflect the current value or when restricted securities are being valued, such securities are valued as determined in good faith by the Advisor, in conformity with guidelines adopted by and subject to review of the Board of Trustees (the “Trustees”) and are categorized in level 2 or level 3, when appropriate.
Money market funds. Money market funds are valued at a net asset value of $1.00 and are classified in level 1 of the fair value hierarchy.
Options. Option positions that are traded on any exchange or on the NASDAQ over-the-counter market are valued at the last quoted sale price. To the extent these option positions are actively traded and valuation adjustments are not applied, they are classified in level 1 of the fair value hierarchy. Lacking a last sale price, a purchased option position is valued at its last bid price except when, in the Advisor’s opinion, the last bid price does not accurately reflect the current value of the option position. Lacking a last sale price, a written option position is valued at its last ask price except when, in the Advisor’s opinion, the last ask price does not accurately reflect the current value of the option position. When such bid or ask prices are used for valuation or when the security is not actively traded, those securities are generally categorized in level 2 or level 3 of the fair value hierarchy.
Fixed income securities. Fixed income securities generally are valued by using market quotations, but may be valued on the basis of prices furnished by a pricing service when the Advisor believes such prices accurately reflect the fair value of such securities. A pricing service utilizes electronic data processing techniques based on yield spreads relating to securities with similar characteristics to determine prices for normal institutional-size trading units of debt securities without regard to sale or bid prices. When prices are not readily available from a pricing service, or when restricted or illiquid securities are being valued, securities are valued at fair value as determined in good faith by the Advisor, subject to review of the Trustees. Short-term investments in fixed income securities with maturities of less than 60 days when acquired, or which subsequently are within 60 days of maturity, are valued by using the amortized cost method of valuation. Generally, fixed income securities are categorized as level 2.
In accordance with the Trust's good faith pricing guidelines, the Advisor is required to consider all appropriate factors relevant to the value of securities for which it has determined other pricing sources are not available or reliable as described above. There is no single standard for determining fair value, since fair value depends upon the circumstances of each individual case. As a general principle, the current fair value of an issue of securities being valued by the Advisor would appear to be the amount which the owner might reasonably expect to receive for them upon their current sale. Methods which are in accordance with this principle may, for example, be based on (i) a multiple of earnings; (ii) a discount from market of a similar freely traded security (including a derivative security or a basket of securities traded on other markets, exchanges or among dealers); or (iii) yield to maturity with respect to debt issues, or a combination of these and other methods.
The following tables summarize the inputs used to value the Funds’ assets measured at fair value as of November 30, 2013:
2013 Annual Report 19
| Notes to Financial Statements - continued | | | | | | |
| |
| Core Investment: | | | | | | | | |
| Valuation Inputs of Assets | | Level 1 | | Level 2 | | Level 3 | | Total |
| Common Stocks | | $31,832,337 | | $0 | | $0 | | $31,832,337 |
| Money Market Funds | | 5,242,706 | | 0 | | 0 | | 5,242,706 |
| Total | | $37,075,043 | | $0 | | $0 | | $37,075,043 |
| |
| Global Dividend: | | | | | | | | |
| Valuation Inputs of Assets | | Level 1 | | Level 2 | | Level 3 | | Total |
| Common Stocks | | $31,165,719 | | $0 | | $0 | | $31,165,719 |
| Money Market Funds | | 1,202,304 | | 0 | | 0 | | 1,202,304 |
| Total | | $32,368,023 | | $0 | | $0 | | $32,368,023 |
Refer to each Fund’s Schedule of Investments for a listing of securities by industry. The Funds did not hold any level 3 assets during the fiscal year ended November 30, 2013. There were no transfers into or out of the levels during the fiscal year ended November 30, 2013. It is the Funds’ policy to consider transfers into or out of the levels as of the end of the reporting period.
4.) INVESTMENT ADVISORY AGREEMENTS AND SERVICES AGREEMENTS
Each of the Funds has an investment advisory agreement (collectively the "Management Agreements") with the Advisor. Under the Management Agreements, the Advisor, at its own expense and without reimbursement from the Funds, furnishes office space and all necessary office facilities, equipment and executive personnel necessary for managing the assets of the Funds. For its services the Advisor receives an investment management fee equal to 1.00% of the average daily net assets of Core Investment and an investment management fee equal to 1.25% of the average daily net assets of Global Dividend. Soledad Investment Management, LLC (the "Sub-Advisor") serves as the sub-advisor of Global Dividend and is paid by the Advisor, not the Fund. Core Investment does not have a Sub-Advisor. For the fiscal year ended November 30, 2013, the Advisor earned management fees of $288,959 and $349,504 for Core Investment and Global Dividend, respectively. At November 30, 2013, Core Investment and Global Dividend owed the Advisor management fees of $27,878 and $32,737, respectively.
Additionally, the Funds each have a Services Agreement with the Advisor (the “Services Agreements”). Under the Services Agreements the Advisor receives an additional fee of 0.50% of the average daily net assets per Fund and is obligated to pay the operating expenses of the Funds excluding, as applicable, management fees and sub-advisory fees, brokerage fees and commissions, 12b-1 fees, taxes, borrowing costs (such as (a) interest and (b) dividend expenses on securities sold short), ADR fees, the cost of acquired funds and extraordinary expenses. For the fiscal year ended November 30, 2013, the Advisor earned services fees of $144,479 and $139,802 for Core Investment and Global Dividend, respectively. At November 30, 2013, the Funds owed the Advisor services fees of $13,939 and $13,095 for Core Investment and Global Dividend, respectively.
5.) RELATED PARTY TRANSACTIONS
Jeffrey R. Provence of Premier Fund Solutions, Inc. (the “Administrator”) also serves as trustee/officer of the Funds. This individual receives benefits from the Administrator resulting from administration fees paid to the Administrator of the Funds by the Advisor.
The Trustees who are not interested persons of the Funds were paid a total of $3,000 in Trustees’ fees for both Funds for the fiscal year ended November 30, 2013 by the Advisor.
6.) DERIVATIVES
At November 30, 2013, the Funds did not hold any derivative instruments. However, Core Investment invested in derivatives during the fiscal year ended November 30, 2013. Global Dividend did not invest in derivatives during the fiscal year ended November 30, 2013. The following information summarizes Core Investment’s (defined as the “Fund” for Note 6) use of derivatives:
Transactions in written call options during the fiscal year ended November 30, 2013 were as follows:
| | Number of | | | Premiums | |
| | Contracts | | | Received | |
| Options outstanding at November 30, 2012 | 0 | | | $0 | |
| Options written | 502 | | | 67,310 | |
| Options terminated in closing purchase transactions | (502 | ) | | (67,310 | ) |
| Options expired | 0 | | | 0 | |
| Options exercised | 0 | | | 0 | |
| Options outstanding at November 30, 2013 | 0 | | | $0 | |
2013 Annual Report 20
Notes to Financial Statements - continued
Transactions in purchased put options during the fiscal year ended November 30, 2013 were as follows:
| | Number of | | | Premiums | |
| | Contracts | | | Paid | |
| Options outstanding at November 30, 2012 | 0 | | | $0 | |
| Options purchased | 1,351 | | | 311,532 | |
| Options terminated in closing sale transactions | (111 | ) | | (83,422 | ) |
| Options expired | (1,240 | ) | | (228,110 | ) |
| Options exercised | 0 | | | 0 | |
| Options outstanding at November 30, 2013 | 0 | | | $0 | |
The locations on the statement of assets and liabilities of the Fund's derivative positions, which are not accounted for as hedging instruments under GAAP, are as follows:
| | | Asset | | | Liability |
| | | Derivatives | | | Derivatives |
| Options purchased: | | | Written Options at | | |
| Included In Investments in | | $0 | Fair Value | | $0 |
| Securities at Fair Value | | | | | |
Realized and unrealized gains and losses on derivatives contracts entered into during the fiscal year ended November 30, 2013 by the Fund are recorded in the following locations in the Statement of Operations:
| | | | Realized | | | | Unrealized |
| Equity Contracts | Location | | Gain/(Loss) | | Location | | Gain/(Loss) |
| Options | Net Realized | | | | Change In Unrealized | | |
| Purchased | Gain (Loss) on | | ($142,276) | | Appreciation (Depreciation) | | $0 |
| | Options Purchased | | | | on Options Purchased | | |
| |
| Options | Net Realized | | | | Change In Unrealized | | |
| Written | Gain (Loss) on | | $10,768 | | Appreciation (Depreciation) | | $0 |
| | Options Written | | | | on Options Written | | |
The Fund engages in option transactions involving individual securities and stock indexes. An option involves either: (a) the right or the obligation to buy or sell a specific instrument at a specific price until the expiration date of the option; or (b) the right to receive payments or the obligation to make payments representing the difference between the closing price of a stock index and the exercise price of the option expressed in dollars times a specified multiple until the expiration date of the option. The Fund may purchase and write options. Options are sold (written) on securities and stock indexes. The purchaser of an option on a security pays the seller (the writer) a premium for the right granted but is not obligated to buy or sell the underlying security. The purchaser of an option on a stock index pays the seller a premium for the right granted, and in return the seller of such an option is obligated to make the payment. A writer of an option may terminate the obligation prior to expiration of the option by making an offsetting purchase of an identical option. Options are traded on organized exchanges and in the over-the-counter market. To cover the potential obligations involved in writing options, a Fund will either: (a) own the underlying security, or in the case of an option on a market index, will hold a portfolio of stocks substantially replicating the movement of the index; or (b) the Fund will segregate with the custodian high grade liquid assets sufficient to purchase the underlying security or equal to the market value of the stock index option, marked to market daily.
The purchase of options limits a Fund's potential loss to the amount of the premium paid and can afford the Fund the opportunity to profit from favorable movements in the price of an underlying security to a greater extent than if transactions were effected in the security directly. However, the purchase of an option could result in the Fund losing a greater percentage of its investment than if the transaction were effected directly. When the Fund writes a call option, it will receive a premium, but it will give up the opportunity to profit from a price increase in the underlying security above the exercise price as long as its obligation as a writer continues, and it will retain the risk of loss should the price of the security decline. When the Fund writes a put option, it will assume the risk that the price of the underlying security or instrument will fall below the exercise price, in which case the Fund may be required to purchase the security or instrument at a higher price than the market price of the security or instrument. In addition, there can be no assurance that the Fund can effect a closing transaction on a particular option it has written. Further, the total premium paid for any option may be lost if the Fund does not exercise the option.
2013 Annual Report 21
Notes to Financial Statements - continued
The Fund engages in option transactions involving securities and stock indices in order to gain exposure to particular securities or markets, in connection with hedging transactions, or to try to enhance returns. Options require additional skills and techniques beyond normal portfolio management. The Fund's use of options involves risk that such instruments may not work as intended due to unanticipated developments, especially in abnormal market conditions, or if the Advisor makes an error in judgment, or other causes. The use of options may magnify the increase or decrease in the performance of the Fund, and may also subject the Fund to higher price volatility.
The premiums paid for the options represent the cost of the investment and the options are valued daily at their closing price. The Fund recognizes a realized gain or loss when the option is sold or expires. Option holdings within the Fund, which may include put options and call options, are subject to loss of value with the passage of time, and may experience a total loss of value upon expiration. With options, there is minimal counterparty risk to the Fund since they are exchange traded.
7.) INVESTMENTS
For the fiscal year ended November 30, 2013, purchases and sales of investment securities other than U.S. Government obligations and short-term investments were as follows:
| | | Core Investment | | Global Dividend |
| Purchases | | $44,429,752 | | $5,314,300 |
| Sales | | $45,110,694 | | $2,496,987 |
There were no purchases or sales of U.S. Government obligations.
For federal income tax purposes, at November 30, 2013 the cost of securities on a tax basis and the composition of gross unrealized appreciation (the excess of value over tax cost) and depreciation (the excess of tax cost over value) were as follows:
| | | Core Investment | | | Global Dividend | |
| Cost of Investments | | $31,277,249 | | | $26,139,465 | |
| Gross Unrealized Appreciation | | $6,000,871 | | | $6,607,538 | |
| Gross Unrealized Depreciation | | ($203,077) | | | ($378,980) | |
| Net Unrealized Appreciation | | | | | | |
| (Depreciation) on Investments | | $5,797,794 | | | $6,228,558 | |
The primary differences between book basis and tax basis unrealized appreciation/(depreciation) were due to wash sales.
8.) CAPITAL SHARES
At November 30, 2013, the Trust was authorized to issue an unlimited number of shares of beneficial interest. The following are the shares issued and paid in capital outstanding for the Funds at November 30, 2013:
| | | Core Investment | | Global Dividend |
| Shares Issued | | | | |
| and Outstanding | | 2,443,984 | | 2,389,673 |
| Paid in Capital | | $25,675,787 | | $24,928,792 |
9.) CONTROL OWNERSHIP
The beneficial ownership, either directly or indirectly, of more than 25% of the voting shares of a fund creates a presumption of control of the fund, under section 2(a)(9) of the Investment Company Act of 1940. At November 30, 2013, National Financial Services, LLC, located at 200 Liberty Street, New York, New York 10281, held for the benefit of its customers, in aggregate, 99.91% of the Core Investment Fund shares. National Financial Services, LLC, located at 200 Liberty Street, New York, New York 10281, held for the benefit of its customers, in aggregate, 99.81% of Global Dividend Fund shares. The Trust does not know whether National Financial Services, LLC or any of the accounts having a beneficial interest in accounts held of record by National Financial Services, Inc. (the "Underlying Accounts") hold beneficially 25% or more of the outstanding voting securities of the Funds. Accordingly, it is not known whether National Financial Services, Inc. or any of the Underlying Accounts could be deemed to control the Funds.
10.) DISTRIBUTIONS TO SHAREHOLDERS
There was a distribution paid on December 26, 2012 to the Funds’ shareholders of record on December 24, 2012. Core Investment paid a distribution of $0.0310 per share from net investment
2013 Annual Report 22
Notes to Financial Statements - continued
income. Also, Global Dividend paid a distribution of $0.2079 per share from net investment income. The Funds did not have any distributions during the period December 21, 2011 through November 30, 2012.
| Core Investment distributions paid from: | | |
| | | Fiscal Year Ended |
| | | November 30, 2013 |
| Ordinary Income | | $ 70,226 |
| Short-term Capital Gain | | 0 |
| Long-term Capital Gain | | 0 |
| | | $ 70,226 |
| |
| Global Dividend distributions paid from: | | |
| | | Fiscal Year Ended |
| | | November 30, 2013 |
| Ordinary Income | | $ 457,637 |
| Short-term Capital Gain | | 0 |
| Long-term Capital Gain | | 0 |
| | | $ 457,637 |
As of November 30, 2013, the components of distributable earnings / (accumulated losses) on a tax basis were as follows for the Funds:
| Core Investment: | | |
| |
| Undistributed ordinary income/(accumulated losses) | | $ 852,946 |
| Undistributed long-term capital gain/(accumulated losses) | | 2,390,946 |
| Unrealized appreciation/(depreciation) - net | | 5,797,794 |
| | | $9,041,686 |
| |
| Global Dividend: | | |
| |
| Undistributed ordinary income/(accumulated losses) | | $ 599,345 |
| Undistributed long-term capital gain/(accumulated losses) | | 579,795 |
| Unrealized appreciation/(depreciation) - net | | 6,228,558 |
| | | $7,407,698 |
Income and capital gains are determined in accordance with income tax regulations that may differ from GAAP. These differences are due to differing treatments for items such as the tax treatment of options on indexes and the deferral of wash sale losses.
Subsequent to November 30, 2013, there was a distribution paid on December 26, 2013 to the Funds’ shareholders of record on December 24, 2013. Core Investment paid a distribution of $0.34454 per share from short-term capital gains and $0.97302 per share from long-term capital gains. Also, Global Dividend paid a distribution of $0.21573 per share from net investment income, $0.06686 per share from short-term capital gains and $0.24204 per share from long-term capital gains.
11.) LOSS CARRYFORWARDS
Capital loss carryforwards are available to offset future capital gains. To the extent that these carry-forwards are used to offset future capital gains, it is probable that the amount that is offset will not be distributed to shareholders. During the fiscal year ended November 30, 2013, Core Investment utilized available capital loss carryforwards of $568,419, of which $273,266 was used to offset short-term capital gains and $295,153 was used to offset long-term capital gains. Additionally, during the fiscal year ended November 30, 2013 Global Dividend utilized available capital loss carry-forwards of $7,697, of which the entire amount was used to offset short-term capital gains.
2013 Annual Report 23
DISCLOSURE OF EXPENSES
(Unaudited)
As a shareholder of the Funds, you incur two types of costs: (1) transaction costs, including sales charges (loads) on purchase payments; and (2) ongoing costs, including management fees; and other Fund expenses. This Example is intended to help you understand your ongoing costs (in dollars) of investing in the Funds and to compare these costs with the ongoing costs of investing in other mutual funds. If Fund shares are redeemed within 90 days of purchase from the Funds, the shares are subject to a 2% redemption fee. Additionally, IRA accounts will be charged an $8.00 annual maintenance fee.
The Example is based on an investment of $1,000 invested in the Funds on June 1, 2013, and held through November 30, 2013.
Actual Expenses
The first line of the table below provides information about actual account values and actual expenses. You may use the information in this line, together with the amount you invested, to estimate the expenses that you paid over the period. Simply divide your account value by $1,000 (for example, an $8,600 account value divided by $1,000 = 8.6), then multiply the result by the number in the first line under the heading entitled "Expenses Paid During Period" to estimate the expenses you paid on your account during this period.
Hypothetical Example for Comparison Purposes
The second line of the table below provides information about hypothetical account values and hypothetical expenses based on the Funds’ actual expense ratio and an assumed rate of return of 5% per year before expenses, which is not the Funds’ actual return. The hypothetical account values and expenses may not be used to estimate the actual ending account balance or expenses you paid for the period. You may use this information to compare the ongoing costs of investing in these Funds and other funds. To do so, compare this 5% hypothetical example with the 5% hypothetical examples that appear in the shareholder reports of the other funds.
Please note that the expenses shown in the table are meant to highlight your ongoing costs only and do not reflect any transactional costs, such as redemption fees or IRA maintenance fees described above. Therefore, the second line of the table is useful in comparing ongoing costs only, and will not help you determine the relative cost of owning different funds. In addition, if these transactional costs were included, your cost could have been higher.
| CORE INVESTMENT | | | | | | |
| |
| |
| | | | | | | Expenses Paid |
| | | Beginning | | Ending | | During the Period* |
| | | Account Value | | Account Value | | June 1, 2013 to |
| | | June 1, 2013 | | November 30, 2013 | | November 30, 2013 |
| |
| |
| Actual | | $1,000.00 | | $1,145.97 | | $8.07 |
| |
| Hypothetical | | $1,000.00 | | $1,017.55 | | $7.59 |
| (5% annual return | | | | | | |
| before expenses) | | | | | | |
* Expenses are equal to the Fund’s annualized expense ratio of 1.50%, multiplied by the average
account value over the period, multiplied by 183/365 (to reflect the one-half year period). |
2013 Annual Report 24
| Disclosure of Expenses (Unaudited) - continued | | |
| |
| GLOBAL DIVIDEND | | | | | | |
| |
| |
| | | | | | | Expenses Paid |
| | | Beginning | | Ending | | During the Period* |
| | | Account Value | | Account Value | | June 1, 2013 to |
| | | June 1, 2013 | | November 30, 2013 | | November 30, 2013 |
| |
| Actual | | $1,000.00 | | $1,109.93 | | $9.26 |
| |
| Hypothetical | | $1,000.00 | | $1,016.29 | | $8.85 |
| (5% annual return | | | | | | |
| before expenses) | | | | | | |
* Expenses are equal to the Fund’s annualized expense ratio of 1.75%, multiplied by the average
account value over the period, multiplied by 183/365 (to reflect the one-half year period). |
2013 Annual Report 25
ADDITIONAL INFORMATION
November 30, 2013
(Unaudited)
AVAILABILITY OF QUARTERLY SCHEDULE OF INVESTMENTS
The Funds file their complete schedules of portfolio holdings with the Securities and Exchange Commission ("SEC") for the first and third quarters of each fiscal year on Form N-Q. The Funds’ Forms N-Q are available on the SEC's website at http://www.sec.gov. The Funds’ Forms N-Q may also be reviewed and copied at the SEC's Public Reference Room in Washington, DC. Information on the operation of the Public Reference Room may be obtained by calling 1-800-SEC-0330.
PROXY VOTING GUIDELINES
Christopher Weil & Company, Inc., the Funds’ Advisor, is responsible for exercising the voting rights associated with the securities held by the Funds. A description of the policies and procedures used by the Advisor in fulfilling this responsibility is available without charge on the Funds’ web site at www.cweil.com. It is also included in the Funds’ Statement of Additional Information, which is available on the Securities and Exchange Commission’s website at http://www.sec.gov. Information regarding how the Funds voted proxies, Form N-PX, relating to portfolio securities during the most recent 12-month period ended June 30 is available without charge, upon request, by calling our toll free number(1-888-550-9266). This information is also available on the Securities and Exchange Commission’s web site at http://www.sec.gov.
ADDITIONAL INFORMATION
You will find more information about the Funds at www.cweil.com. For shareholder inquiries, please call toll-free in the U.S. at 1-888-550-9266.
2013 Annual Report 26
Cohen Fund Audit Services, Ltd.
1350 Euclid Avenue, Ste 800
Cleveland, Ohio 44115 www.cohenfund.com | 216.649.1700
216.579.0111 fax |
REPORT OF INDEPENDENT REGISTERED PUBLIC ACCOUNTING FIRM
To the Shareholders of
Christopher Weil & Company Core Investment Fund and
Christopher Weil & Company Global Dividend Fund and
Board of Trustees of PFS Funds
We have audited the accompanying statements of assets and liabilities, including the schedules of investments, of Christopher Weil & Company Core Investment Fund and Christopher Weil & Company Global Dividend Fund (the "Funds"), each a series of PFS Funds, as of November 30, 2013, and the related statements of operations for the year then ended, and the changes in net assets and the financial highlights for each of the two periods in the period then ended. These financial statements and financial highlights are the responsibility of the Funds' management. Our responsibility is to express an opinion on these financial statements and financial highlights based on our audits.
We conducted our audits in accordance with the standards of the Public Company Accounting Oversight Board (United States). Those standards require that we plan and perform the audit to obtain reasonable assurance about whether the financial statements and financial highlights are free of material misstatement. An audit includes examining, on a test basis, evidence supporting the amounts and disclosures in the financial statements. Our procedures included confirmation of securities owned as of November 30, 2013, by correspondence with the custodian and brokers. An audit also includes assessing the accounting principles used and significant estimates made by management, as well as evaluating the overall financial statement presentation. We believe that our audits provide a reasonable basis for our opinion.
In our opinion, the financial statements and financial highlights referred to above present fairly, in all material respects, the financial position of each of the Funds as of November 30, 2013, the results of their operations for the year then ended, and the changes in their net assets and the financial highlights for each of the two periods in the period then ended, in conformity with accounting principles generally accepted in the United States of America.

COHEN FUND AUDIT SERVICES, LTD.
Cleveland, Ohio
January 27, 2014
2013 Annual Report 27
Trustees and Officers (Unaudited)
The Board of Trustees supervises the business activities of the Trust. The names of the Trustees and executive officers of the Trust are shown below. For more information regarding the Trustees, please refer to the Statement of Additional Information, which is available upon request by calling 1-888-550-9266. Each Trustee serves until the Trustee sooner dies, resigns, retires, or is removed.
The Trustees and Officers of the Trust and their principal business activities during the past five years are:
Interested Trustees and Officers
| | | | | Number of | Other |
| | | | Principal | Portfolios In | Directorships |
| Name, | Position(s) | Term of Office | Occupation(s) | Fund | Held By |
| Address(1), | Held With | and Length of | During | Complex | Trustee or |
| and Year of Birth | the Trust | Time Served | Past 5 Years | Overseen By | Officer |
| | | | | Trustee | |
| |
| Ross C. Provence(3), | President | Indefinite Term; | General Partner and Portfolio | N/A | Blue Chip |
| Year of Birth: 1938 | | Since 2000 | Manager for Value Trend Capital | | Investor Funds, |
| | | | Management, LP (1995 to current). | | PFS Funds |
| | | | Estate planning attorney (1963 to | | (January 2000 - |
| | | | current). | | May 2013) |
| �� |
| Jeffrey R. Provence(2), | Trustee, | Indefinite Term; | General Partner and Portfolio | 9 | Blue Chip |
| Year of Birth:1969 | Secretary | Since 2000 | Manager for Value Trend Capital | | Investor Funds, |
| | and | | Management, LP (1995 to current). | | Sycuan Funds |
| | Treasurer | | CEO, Premier Fund Solutions, Inc. | | |
| | | | (2001 to current). | | |
| |
| Julian G. Winters, | Chief | Chief | Managing Member, Watermark | N/A | N/A |
| Year of Birth: 1968 | Compliance | Compliance | Solutions LLC (investment compli- | | |
| | Officer | Officer Since | ance and consulting) since March | | |
| | | 2010 | 2007. | | |
(1) The address of each trustee and officer is c/o PFS Funds, 1939 Friendship Drive, Suite C, El Cajon, California 92020.
(2) Jeffrey R. Provence is considered "interested person" as defined in Section 2(a)(19) of the Investment Company Act of 1940 by
virtue of his position with the Trust.
(3) Ross C. Provence resigned from the Board of Trustees on May 17, 2013. Mr. Ross C. Provence is the father of Mr. Jeffrey R.
Provence.
Independent Trustees |
| | | | | Number of | Other |
| | | | Principal | Portfolios In | Directorships |
| Name, | Position | Term of Office | Occupation(s) | Fund | Held By |
| Address(1), | Held With | and Length of | During | Complex | Trustee or |
| and Year of Birth | the Trust | Time Served | Past 5 Years | Overseen By | Officer |
| | | | | Trustee | |
| |
| Thomas H. Addis III, | Independent | Indefinite Term; | Executive Director/CEO, Southern | 9 | None |
| Year of Birth: 1945 | Trustee | Since 2000 | California PGA (2006 to current). | | |
| |
| Allen C. Brown, | Independent | Indefinite Term; | Co-owner of Stebleton & Brown | 9 | Blue Chip |
| Year of Birth: 1943 | Trustee | Since 2010 | (1994 to Current). Estate planning | | Investor Funds, |
| | | | and business attorney (1970 to cur- | | Sycuan Funds |
| rent). |
| |
| George Cossolias, CPA, | Independent | Indefinite Term; | Owner of George Cossolias & | 9 | Blue Chip |
| Year of Birth: 1935 | Trustee | Since 2000 | Company, CPAs (1972 to current). | | Investor Funds, |
| | | | President of Lubrication Specialists, | | Sycuan Funds, |
| | | | Inc. (1996 to current). | | Temecula |
| | | | | | Valley Bank |
(1) The address of each trustee and officer is c/o PFS Funds, 1939 Friendship Drive, Suite C, El Cajon, California 92020.
2013 Annual Report 28
Investment Advisor
Christopher Weil & Company, Inc.
Sub-Advisor
Soledad Investment Management, LLC
(Christopher Weil & Company Global Dividend Fund only)
Custodian
US Bank N.A.
Distributor
Rafferty Capital Markets, LLC
Fund Administrator
Premier Fund Solutions, Inc.
Independent Registered
Public Accounting Firm
Cohen Fund Audit Services, Ltd.
Legal Counsel
The Law Offices of John H. Lively & Associates, Inc.
A member firm of The 1940 Act Law GroupTM
Transfer Agent
Mutual Shareholder Services, LLC |
This report is provided for the general information of the shareholders of the Christopher
Weil & Company Core Investment Fund and the Christopher Weil & Company Global
Dividend Fund. This report is not intended for distribution to prospective investors in the
Funds, unless preceded or accompanied by an effective prospectus.
|
Christopher Weil & Company Funds
12555 High Bluff Drive, Suite 180
San Diego, California 92130
1-888-550-9266 OR 1-800-355-9345
www.cweil.com
Item 2. Code of Ethics.
The registrant has adopted a code of ethics that applies to the registrant’s principal executive officer and the principal financial officer. The registrant has not made any amendments to its code of ethics during the covered period. The registrant has not granted any waivers from any provisions of the code of ethics during the covered period. A copy of the registrant’s Code of Ethics is filed herewith.
Item 3. Audit Committee Financial Expert.
The registrant’s Board of Trustees has determined that George Cossolias is an audit committee finical expert. Mr. Cossolias is independent for purposes of this Item 3.
Item 4. Principal Accountant Fees and Services.
(a-d) The following table details the aggregate fees billed for each of the last two fiscal years for audit fees, audit-related fees, tax fees and other fees by the principal accountant to the registrant. The principal accountant has provided no services to the adviser or any entity controlled by, or under common control with the adviser that provides ongoing services to the registrant.
| | | FYE 11/30/13 | | FYE 11/30/12 |
| Audit Fees | | $25,700 | | $20,450 |
| Audit-Related Fees | | $0 | | $0 |
| Tax Fees | | $5,000 | | $5,000 |
| All Other Fees | | $800 | | $1,200 |
Nature of Tax Fees: Preparation of Excise Tax Statement and 1120 RIC.
Nature of All Other Fees: Review of Semi-Annual Report.
(e) (1) The audit committee approves all audit and non-audit related services and, therefore, has not adopted pre-approval policies and procedures described in paragraph (c)(7) of Rule 2-01 of Regulation S-X.
(e) (2) None of the services described in paragraph (b) through (d) of this Item were approved by the audit committee pursuant to paragraph (c)(7)(i)(C) of Rule 2-01 of Regulation S-X.
(f) All of the principal accountant’s hours spent on auditing the registrant’s financial statements were attributed to work performed by full-time permanent employees of the principal accountant.
(g) The following table indicates the aggregate non-audit fees billed by the registrant’s principal accountant for services to the registrant , the registrant’s investment adviser (not sub-adviser), and any entity controlling, controlled by, or under common control with the adviser that provides ongoing services to the registrant, for the last two years.
| Non-Audit Fees | | FYE 11/30/13 | | FYE 11/30/12 |
| Registrant | | $5,800 | | $6,200 |
| Registrant’s Investment Adviser | | $0 | | $0 |
(h) The principal accountant provided no services to the investment adviser or any entity controlling, controlled by, or under common control with the adviser that provides ongoing services to the registrant.
Item 5. Audit Committee of Listed Companies. Not applicable.
Item 6. Schedule of Investments. Schedule filed with Item 1.
Item 7. Disclosure of Proxy Voting Policies and Procedures for Closed-End Management Investment Companies. Not applicable.
Item 8. Portfolio Managers of Closed End Management Investment Companies. Not applicable.
Item 9. Purchases of Equity Securities by Closed-End Management Investment Companies and Affiliated Purchasers. Not applicable.
Item 10. Submission of Matters to a Vote of Security Holders.
The registrant has not adopted procedures by which shareholders may recommend nominees to the registrant’s board of trustees.
Item 11. Controls and Procedures.
(a) The registrant’s president and chief financial officer concluded that the disclosure controls and procedures (as defined in Rule 30a-3(c) under the Investment Company Act of 1940 (the “Act”)) were effective as of a date within 90 days of the filing date of this report, based on the evaluation of these controls and procedures required by Rule 30a-3(b) under the Act.
(b) There were no changes in the registrant’s internal control over financial reporting (as defined in Rule 30a-3(d) under the Act) that occurred during the registrant’s second fiscal quarter of the period covered by this report that have materially affected, or are reasonably likely to materially affect, the registrant’s internal control over financial reporting.
Item 12. Exhibits.
(a)(1) Code of Ethics. Filed herewith.
(a)(2) Certifications pursuant to Section 302 of the Sarbanes-Oxley Act of 2002. Filed herewith.
(b) Certification pursuant to Section 906 Certification of the Sarbanes-Oxley Act of 2002. Filed herewith.
Pursuant to the requirements of the Securities Exchange Act of 1934 and the Investment Company Act of 1940, the registrant has duly caused this report to be signed on its behalf by the undersigned, thereunto duly authorized.
| | By: /s/Ross C. Provence
Ross C. Provence
President |
Pursuant to the requirements of the Securities Exchange Act of 1934 and the Investment Company Act of 1940, this report has been signed below by the following persons on behalf of the registrant and in the capacities and on the dates indicated.
| | By: /s/Ross C. Provence
Ross C. Provence
President |
| | By: /s/Jeffrey R. Provence
Jeffrey R. Provence
Chief Financial Officer |