UNITED STATES
SECURITIES AND EXCHANGE COMMISSION
WASHINGTON, D.C. 20549
FORM N-CSR
CERTIFIED SHAREHOLDER REPORT OF REGISTERED MANAGEMENT
INVESTMENT COMPANIES
Investment Company Act file number 811-09781
PFS Funds
(Exact name of registrant as specified in charter)
1939 Friendship Drive, Suite C, El Cajon, CA 92020
(Address of principal executive offices) (Zip code)
CT Corporation System.
155 Federal St., Suite 700, Boston, MA 02110
(Name and address of agent for service)
Registrant's telephone number, including area code: (619) 588-9700
Date of fiscal year end: December 31
Date of reporting period: December 31, 2013
Form N-CSR is to be used by management investment companies to file reports with the Commission not later than 10 days after the transmission to stockholders of any report that is required to be transmitted to stockholders under Rule 30e-1 under the Investment Company Act of 1940 (17 CFR 270.30e -1). The Commission may use the information provided on Form N-CSR in its regulatory, disclosure review, inspection and policymaking roles.
A registrant is required to disclose the information specified by Form N-CSR, and the Commission will make this information public. A registrant is not required to respond to the collection of information contained in Form N-CSR unless the Form displays a currently valid Office of Management and Budget ("OMB") control number. Please direct comments concerning the accuracy of the information collection burden estimate and any suggestions for reducing the burden to Secretary, Securities and Exchange Commission, 450 Fifth Street, NW, Washington, DC 20549-0609. The OMB has reviewed this collection of information under the clearance requirements of 44 U.S.C. § 3507.
Item 1. Reports to Stockholders.

Annual Report
December 31, 2013
BRTNX |
February 20, 2014
Dear Fellow Shareholders:
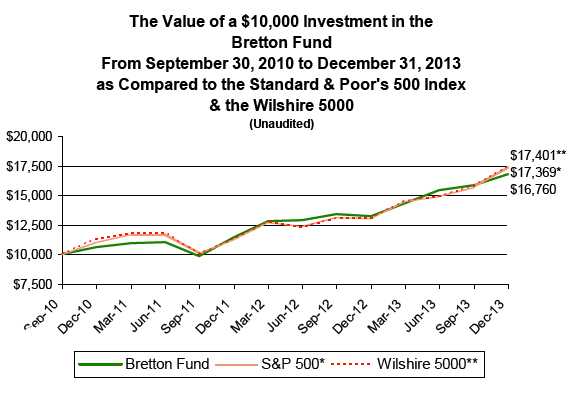
The Bretton Fund’s net asset value per share (NAV) as of December 31, 2013, was $23.44. For the quarter ended December 31, 2013, the fund’s total return was 5.86%, compared to 10.51% for the S&P 500. For the full calendar year, the fund’s total return was 26.53%, while the S&P 500 returned 32.39% .
| Total Returns as of December 31, 2013 | | | | | |
| | | | | | Since Inception - | |
| | 4th Quarter | | 1 Year | | Annualized(A) | |
| Bretton Fund | 5.86% | | 26.53% | | 17.21% | |
| S&P 500® Index(B) | 10.51% | | 32.39% | | 18.50% | |
| Wilshire 5000 Total Market Index(C) | 10.11% | | 33.07% | | 18.57% | |
| Calendar Year Total Returns | | | | | | |
| | | | | | Wilshire 5000 Total | |
| | Bretton Fund | | S&P 500 Index(B) | | Market Index(C) | |
| 2013 | 26.53% | | 32.39% | | 33.07% | |
| 2012 | 15.66% | | 16.00% | | 16.06% | |
| 2011 | 7.90% | | 2.11% | | 0.98% | |
| 9/30/10–12/31/10 | 6.13% | | 10.76% | | 11.59% | |
| Cumulative Since Inception(A) | 67.60% | | 73.69% | | 74.01% | |
(A) Since Inception returns include change in share prices and, in each case, include reinvestment of any dividends and capital gain distributions. The inception date of the Bretton Fund was September 30, 2010.
(B) The S&P 500® is a broad, market-weighted average dominated by blue-chip stocks and is an unmanaged group of stocks whose composition is different from the Fund.
(C) The Wilshire 5000 Total Market Index is a market-capitalization-weighted index of the market value of all stocks actively traded in the United States.
Performance data quoted represents past performance. Past performance does not guarantee future results. The investment return and principal value of an investment will fluctuate so that an investor’s shares, when redeemed, may be worth more or less than their original cost. All returns include change in share prices, and reinvestment of any dividends and capital gains distributions. Current performance may be lower or higher than the performance data quoted. Indices shown are broad-based, unmanaged indices commonly used to measure performance of US stocks. These indices do not incur expenses and are not available for investment. You may obtain performance data current to the most recent month-end by calling 800.231.2901. The fund’s total annual operating expense ratio from the prospectus dated May 1, 2013 was 1.50% . The fund’s expense ratio for the fiscal year ended December 31, 2013 can be found in the financial highlights included within this report. An investment in the fund is subject to investment risks, including the possible loss of the principal amount invested. The fund’s principal underwriter is Rafferty Capital Markets, LLC.
4th Quarter
The biggest impact on the fund’s performance during the fourth quarter was Wells Fargo, which added 1.2% to the NAV. Other significant, positive contributors were Armanino Foods, Norfolk Southern, and American Express, which added 0.9%, 0.9%, and 0.8%, respectively. The investment that had the biggest negative impact was America’s Car-Mart, which took 0.4% off the NAV.
The fund made one new investment during the quarter, initiating a position in Bank of America. The rationale behind the investment is similar to those for Wells Fargo and JPMorgan: 1) These banks have inherent competitive advantages (e.g., structurally lower costs), and they provide an important service that isn’t going away or being replaced. 2)
1
While they made mistakes preceding the financial crisis and are still recovering, they’re well past the worst of it. 3) Their shares are selling substantially below what they’re worth. The fund did not eliminate any investments during the quarter.
Contributors to Performance for 2013
Our tiny pesto sauce maker, Armanino Foods of Distinction, was the biggest contributor to performance for the full year, adding 3.9% to performance. The Eastern railroads CSX and Norfolk Southern staged a nice comeback and together added 3.8% to the fund. Well Fargo was close behind, increasing NAV by 3.1%, and Ross Stores added 2.3% . There were no material detractors for the year.
Cash and Recent Performance
As in 2012, the fund’s investments did quite well, but our overall performance was held back by our cash levels, which averaged 20% throughout the year. Last year, I wrote, “After four straight years of positive returns, the market hasn’t left a lot of easy money lying around.” Let’s now make that five years in a row and even slimmer pickings. The current market is priced within the realm of reason, but it’s definitely on the high side of that range and possibly stretching the upward bounds of that definition. That doesn’t mean the market will crash imminently; the market could eventually grow into its valuation. What it does mean is that the risk–reward ratio from stocks overall is just so-so and we don’t see a lot of compelling investments right now. We own some great businesses, many of them still at low prices, but not enough to fill out a full portfolio.
A reasonable question might be, “Why don’t I just buy the most attractive stocks of the bunch, even if the expected returns are just so-so? Wouldn’t that help the fund keep up with the S&P 500?” That is, indeed, what I believe the large majority of mutual fund managers do. Many mutual fund managers think of themselves as “products” that are meant to track a specific benchmark closely and remain fully invested all the time. But what that means in times when valuations are high is that you’re committing your capital to a mediocre return with a fair amount of risk because you have to buy something—anything. Would you invest that way with most of your net worth if you were buying private businesses? “Say, I’ll sell you this laundromat that’ll give you a 3–4% return. But there’s a good chance the building will get torn down and you’ll lose most your investment. How ’bout it?” The appropriate response to this type of solicitation is “Go pound sand,” not “Oh, why not? I’ve got nothing else better to do.” You’d keep looking for a better deal. Fractional ownership in public businesses is no different. In essence, we’re telling Mr. Market to go pound a little bit of sand right now. He has a tendency to come back with better options.
Taxes
The fund made a long-term capital gain distribution on December 26 of $0.39674. For the second year in a row, the fund avoided incurring any short-term capital gains, which are taxed at a higher rate. The capital gain represented 1.7% of the NAV compared to the fund’s 26.5% gain. The fund’s primary goal isn’t to completely avoid taxes—if it was, we would just avoid making money—but we try hard to reduce them by avoiding short-term capital gains and not turning over our portfolio frequently. Of our 18 holdings, nine of them have been with the fund since the fund’s first reporting period back in 2010. Portfolio turnover was 6.85% in 2013.
| Portfolio | | |
| |
| Security | % of Net Assets | |
| Wells Fargo & Company | 12.1% | |
| Coach, Inc. | 7.1% | |
| Ross Stores, Inc. | 6.3% | |
| America’s Car-Mart, Inc. | 6.3% | |
| Armanino Foods of Distinction, Inc. | 6.0% | |
| Aflac, Inc. | 5.5% | |
| Norfolk Southern Corp. | 5.2% | |
2
| American Express Co. | 4.7 | % |
| JPMorgan Chase & Co. | 4.6 | % |
| Bank of America Corp. | 4.3 | % |
| Union Pacific Corp. | 4.3 | % |
| CSX Corp. | 4.0 | % |
| Carter’s, Inc. | 3.0 | % |
| New Resource Bank | 2.1 | % |
| The Gap, Inc. | 1.5 | % |
| Standard Financial Corp. | 1.4 | % |
| SI Financial Group, Inc. | 1.1 | % |
| Apollo Group, Inc. | 0.9 | % |
| Cash* | 19.6 | % |
| |
| *Cash represents cash and other assets in excess of liabilities. | | |
Portfolio Discussion
Wells Fargo
Wells Fargo continues to add customers, pare its bad-loan losses, return capital, and achieve record earnings. Earnings per share increased 16% this past year. Its stock’s total return was 38%, yet the ratio of its share price to its current earnings is still only 11, well below the market average and well, well below a reasonable ratio for a business that can grow while also returning cash to shareholders. Banking in the US is still relatively fragmented, and Wells Fargo consistently gains market share by adding customers who open new checking accounts or take out small business loans. I believe it to be the most conservatively run of the major banks, and it has significant excess capital that’ll be distributed to shareholders at an increasing rate. All of this—for a low, low price—is why Wells Fargo is our largest holding.
Coach
The New York–based luxury handbag maker continues to expand its business quite successfully in Asia, while its US business remains stagnant due to competition from “hotter” brands. Most of Coach’s growth will likely come from international markets, specifically Asia, as it’s still in the early stages of selling there. Sales in China grew 35% last year. Revenue there is now about half the size of its North American sales and could eventually be larger, as is the case with many other luxury goods companies that got earlier starts there. Coach returns almost all its free cash flow to shareholders, making its total shareholder payout—dividends plus stock buybacks—around 7%. We initially acquired Coach in February 2013, and our total return so far is 18%.
Ross Stores
Ross just keeps doing what it does. It sold lots of brand-name clothes at steep discounts and continued to build out stores. It has a structural competitive advantage in purchasing excess inventory (i.e., stuff that can’t sell for full price) from large apparel makers since Ross can take entire lots of unwanted clothes quickly and efficiently from vendors who would rather not dribble them out to hundreds of small retailers over many months. The stock returned 40% last year, and the company estimates its earnings per share increased 9%.
America’s Car-Mart
Car-Mart struggled during the year as increased competition from aggressive lenders made it tougher for Car-Mart to sell cars on reasonable terms. Much of the used-car industry outsources the loan portion of the transaction to banks and fixed-income investors, but Car-Mart believes that doing both the selling and the lending in this portion of the market gives it a long-term competitive advantage because it can make better loan decisions, more effectively collect payments, and have a dedicated source of funding if/when outside credit dries up.
3
The downside is that Car-Mart is more susceptible to competition and larger loan losses if third-party finance companies prodigally lend on loose terms, which can happen every now and then like it is now. But these influxes of capital don’t last long. The losses at this end of the loan market run high by nature, and unless you have serious domain expertise, net returns can be elusive. Ultra-low interest rates pushed institutional investors into this market as they sought greater yields, but as their losses mount and interest rates eventually rise, I expect them to pull back and Car-Mart to regain its previous per-car profitability. In the meantime, it continues to open new locations at a rate of 10% per year, establish lasting customer relationships, and make profitable sales and loans. This business is cyclical, and Car-Mart has done well through many cycles over three decades. Earnings per share for the most recent 12-month period were 4% below the preceding one, and its stock returned 4% in 2013.
Armanino Foods of Distinction
Armanino was our star of 2013. At last report, it was on pace to grow its earnings per share 13% as it continued to sell more of its (tasty) frozen pesto sauce. Equally important, management’s behavior demonstrates that they actually like their shareholders, and it paid out a significant portion of its free cash flow via dividends. We started buying Armanino at the beginning of 2013, and our total return so far is 103%. I wish we had found 20 Armaninos. Despite the run-up, the value of the shares remain relatively reasonable, with the total shareholder payout still in the mid-single digits.
Aflac
Aflac’s core business of providing supplemental health insurance in Japan and the US continued to do well in 2013, but since most of its income comes from Japan, earnings in US-dollar terms were hurt as the yen depreciated 20% against the dollar last year. Through the first nine months of 2013 that have been reported so far, Aflac’s operating earnings per share in US dollars were down 7%, but would have risen 5% without the yen depreciation. The yen won’t slide forever, and Aflac’s cash flows are continuing to accrue to shareholders at an attractive rate. The stock returned 29% last year.
American Express
American Express has been a bit of an unsung hero for Bretton shareholders. It’s been one of our best investments to date. Last year, the stock returned 60%, and its annualized total return since the fund’s inception is 29%. The company increased its operating earnings per share by 12% last year, and its shares, while no longer the screaming bargain they were after the financial crisis, remain reasonably priced.
Apollo Group
Apollo, the company behind the University of Phoenix, finally showed signs of life. Its stock was up 31% during the year as its earnings per share decreased 11%, less than investors were expecting. Overall, Apollo has been a disappointment—in other words, a mistake. New student loan regulations affected Apollo a bit, but the bigger damage was the hit to the reputation of for-profit colleges from increased regulatory scrutiny. Also, while the company saw a surge in demand at the beginning of the recession from the newly unemployed deciding to go back to school, employment has since recovered, and demand is back down. Our approach to Apollo now is one of salvaging our remaining stake, as I believe the shares are undervalued even with its reduced earnings. Including the shares we sold for a profit at the beginning of 2012, the investment is just slightly below break-even for us.
Railroads
Last year, CSX and Norfolk Southern dragged down the fund’s NAV as they struggled with declining coal volume, but they rebounded strongly in 2013 as coal fell less quickly and revenue from other traffic more than made up the difference. All three of the railroads, including Union Pacific, achieved record earnings per share. CSX, Norfolk Southern, and Union Pacific increased their earnings per share by 2%, 12%, and 14%, and their stocks returned 49%, 54%, and 36%, respectively.
4
Big Banks
JPMorgan and Bank of America continue to see much lower loan losses, lower expenses, and modestly higher loan demand. As I see it, litigation and regulatory fines are the remaining hurdles for the large banks. These are unpleasant, but easily survivable, bumps in the road. They certainly reduce the amount of money available to shareholders, but don’t materially impair the banks’ ability to earn money in the future. For example, JPMorgan recently settled with regulators to pay a $13 billion fine for its—and its predecessors—actions leading up to the financial crisis. That’s an awful lot of money, but it’s a manageable amount compared to the $24–$28 billion I estimate JPMorgan can earn in a normal year. Plus, those earnings are going to grow as the bank continues to add customers and interest rates rise; penalties of that size aren’t going to happen every year. JPMorgan’s earnings per share decreased 16% in 2013 due to its legal costs, and its stock returned 37% during the year. Our return so far from Bank of America is 9%.
Small Banks
The small banks did okay in 2013, but not as well as their larger cousins. Shares of Standard Financial and SI Financial, small community banks converted from mutualized thrifts, remain cheap, and while they return capital via dividends and buybacks, they’re not able to grow as quickly as the big banks. New Resource Bank, a relatively young bank focused on environmentally friendly loans, is growing at a rapid pace: Its 2013 earnings are on track to increase 50% over 2012’s. Compared to the rest of the market, the total returns from our small banks were anemic in 2013, roughly flat to mid-single-digit returns.
Apparel
The fund has trimmed its holding of both Gap and Carter’s over the past two years as their shares appreciated. Both businesses continue to grow nicely and return cash to shareholders. Gap’s earnings per share increased about 13% for the year, and its stock returned 27%. Carter’s operating earnings per share went up roughly 16%, while its stock returned 30%.
Investments Initiated in 2013
Armanino Foods of Distinction, Inc.
Bank of America Corp.
Coach, Inc. Investments Exited During 2013
Investment
CapitalSource, Inc. | Internal Rate of Return (Annualized Return)
22% |
Reading in 2013
I took my time getting around to Sam Walton’s autobiography, Sam Walton: Made In America, which was published in 1992. It has been strongly recommended by no less an authority than Warren E. Buffett, and I thoroughly enjoyed it.
When Sam Walton opened the first Wal-Mart in 1962, one of the country’s largest retailers at the time was S.S. Kresge, which ran 800 variety stores across the US. That same year, S.S. Kresge started its first discount store—a bigger store with lower prices—and called it Kmart. Within five years, there were 250 Kmarts with $800 million in sales and only 19 Wal-Marts selling $9 million a year. Spoiler: Kmart filed for bankruptcy a few decades later, eventually acquired by a recently bankrupted Sears, while Wal-Mart went on to become the world’s largest retailer.
How did it happen? Obviously, Wal-Mart didn’t start out with an inherent competitive advantage over Kmart or anyone else. It had a distinct disadvantage being a tiny, rural retailer in a business where scale is so important. The story of Wal-Mart is fascinating because it covers a long period of time and the gradual evolution of its competitive advantage. In the beginning, Sam Walton ran franchised variety stores, which pretty
5
much sold the same goods, acquired at the same price, as other stores. Team Walton simply worked harder and executed better than the competition. In his words: “Friend, we got after it and stayed after it.” He started their discount stores—inventively dubbed Wal-Mart—in small towns because that’s where he and his wife happened to be from, which inadvertently led to a strategic advantage because Wal-Mart was selling in towns with little competition while Kmart was slugging it out in urban areas against Woolworth, Sears, Target, et al. Eventually, Wal-Mart got so big and so efficient that its competitive advantage became structural: There was very little the competition could do to sell things more cheaply than Wal-Mart. Wal-Mart’s management of its own logistics and the negotiating power over vendors gave it the ability to sell goods at lower prices than just about anyone else. That competitive advantage, which translates into relatively modest price differences, was persistent, and it led to large effects over long periods of time.
Odds & Ends
We’ve been joined recently by Cameron Susk, who’ll be working as a research analyst for us before he departs for business school later this year. Cameron, a fellow San Francisco native, is an alumnus of Williams College and previously worked for a hedge fund in Los Angeles. He played baseball in college (shortstop), and I’ve had to restrain myself from asking arcane baseball questions (“What should one expect on a 2-1 count with a runner on?”) during our working sessions. He was instrumental to our Bank of America investment and has also been quite helpful in our eternal search for underappreciated investments.
As I mentioned in the semiannual report, I did a long interview with the Mutual Fund Observer last May. I finally managed to make a transcript of the call, and you can now find it on our website.
As always, thank you for investing.
Stephen J. Dodson
President
Bretton Capital Management
6
Bretton Fund by Sectors
(as a percentage of Net Assets)
(Unaudited) |
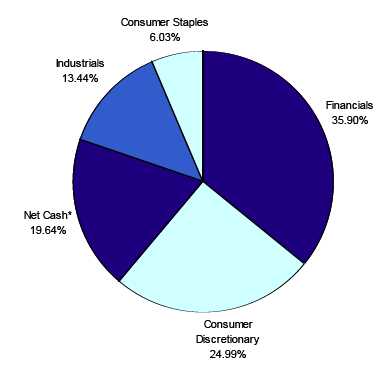
* Net Cash represents cash and other assets less liabilities.
7
| Bretton Fund |
| |
| | | | | | | Schedule of Investments |
| | | | | | | December 31, 2013 |
| Shares | | | Cost | | | Fair Value | | % of Net Assets |
| COMMON STOCKS | | | | | | | | |
| Accident & Health Insurance | | | | | | | | |
| 6,500 | Aflac Inc. | $ | 343,550 | | $ | 434,200 | | 5.50 | % |
| Apparel & Other Finished Products of Fabrics & Similar Material | | | | | | | | |
| 3,300 | Carter's, Inc. | | 90,589 | | | 236,907 | | 3.00 | % |
| Canned, Frozen & Preserved Fruit, Vegetables & Food Specialties | | | | | | | | |
| 245,430 | Armanino Foods Of Distinction, Inc. | | 241,491 | | | 476,134 | | 6.03 | % |
| Finance Services | | | | | | | | |
| 4,100 | American Express Company | | 191,768 | | | 371,993 | | 4.71 | % |
| Leather & Leather Products | | | | | | | | |
| 10,000 | Coach, Inc. | | 484,886 | | | 561,300 | | 7.11 | % |
| National Commercial Banks | | | | | | | | |
| 22,000 | Bank of America Corporation | | 315,395 | | | 342,540 | | | |
| 6,200 | JPMorgan Chase & Co. | | 227,866 | | | 362,576 | | | |
| 21,000 | Wells Fargo & Company | | 730,019 | | | 953,400 | | | |
| | | | 1,273,280 | | | 1,658,516 | | 21.03 | % |
| Railroad, Line-Haul Operating | | | | | | | | |
| 11,000 | CSX Corp. | | 241,122 | | | 316,470 | | | |
| 4,400 | Norfolk Southern Corp. | | 298,937 | | | 408,452 | | | |
| 2,000 | Union Pacific Corporation | | 208,466 | | | 336,000 | | | |
| | | | 748,525 | | | 1,060,922 | | 13.44 | % |
| Regional - Pacific Banks | | | | | | | | |
| 41,800 | New Resource Bank * (a) (b) | | 132,150 | | | 165,110 | | 2.09 | % |
| Retail - Auto Dealers & Gasoline Stations | | | | | | | | |
| 11,700 | America's Car-Mart, Inc. * | | 513,251 | | | 494,091 | | 6.26 | % |
| Retail - Family Clothing Stores | | | | | | | | |
| 3,000 | The Gap, Inc. | | 57,090 | | | 117,240 | | | |
| 6,600 | Ross Stores Inc. | | 190,516 | | | 494,538 | | | |
| | | | 247,606 | | | 611,778 | | 7.75 | % |
| Saving Institution, Federally Chartered | | | | | | | | |
| 7,526 | SI Financial Group Inc. | | 71,994 | | | 90,688 | | 1.15 | % |
| Services - Educational Services | | | | | | | | |
| 2,500 | Apollo Group Inc. Class A * | | 97,525 | | | 68,300 | | 0.87 | % |
| State Commercial Banks | | | | | | | | |
| 6,000 | Standard Financial Corp. (b) | | 86,372 | | | 112,200 | | 1.42 | % |
| Total for Common Stocks | $ | 4,522,987 | | $ | 6,342,139 | | 80.36 | % |
| Total Investment Securities | $ | 4,522,987 | | $ | 6,342,139 | | 80.36 | % |
| Other Assets in Excess of Liabilities | | | | $ | 1,549,631 | | 19.64 | % |
| Net Assets | | | | | $ | 7,891,770 | | 100.00 | % |
| | * Non-Income Producing Securities.
(a) Illiquid security. See Note 3.
(b) Level 2 investment.
The accompanying notes are an integral part of these
financial statements. |
8
| Bretton Fund |
| |
| Statement of Assets and Liabilities | | |
| December 31, 2013 | | |
| |
| Assets: | | |
| Investment Securities at Fair Value | $ | 6,342,139 |
| (Cost $4,522,987) | | |
| Cash | | 1,543,955 |
| Dividend Receivable | | 8,882 |
| Receivable for Shareholder Purchases | | 6,649 |
| Total Assets | | 7,901,625 |
| Liabilities: | | |
| Payable to Adviser (Note 4) | | 9,765 |
| Payable for Shareholder Redemptions | | 90 |
| Total Liabilities | | 9,855 |
| Net Assets | $ | 7,891,770 |
| |
| Net Assets Consist of: | | |
| Paid In Capital (Note 5) | $ | 6,071,271 |
| Accumulated Undistributed Net Investment Income (Loss) | | 1,347 |
| Unrealized Appreciation (Depreciation) in Value of Investments | | |
| Based on Identified Cost - Net | | 1,819,152 |
| Net Assets, for 336,724 Shares Outstanding | $ | 7,891,770 |
| (Unlimited shares authorized) | | |
| Net Asset Value, Offering Price and Redemption Price Per Share | | |
| ($7,891,770/336,724 shares) | $ | 23.44 |
| |
| Statement of Operations | | |
| For the fiscal year ended December 31, 2013 | | |
| |
| Investment Income: | | |
| Dividends | $ | 95,459 |
| Interest | | 19 |
| Total Investment Income | | 95,478 |
| Expenses: | | |
| Management Fees (Note 4) | | 94,131 |
| Total Expenses | | 94,131 |
| |
| Net Investment Income (Loss) | | 1,347 |
| |
| Realized and Unrealized Gain (Loss) on Investments: | | |
| Realized Gain (Loss) on Investments | | 131,250 |
| Net Change in Unrealized Appreciation (Depreciation) on Investments | | 1,298,490 |
| Net Realized and Unrealized Gain (Loss) on Investments | | 1,429,740 |
| |
| Net Increase (Decrease) in Net Assets from Operations | $ | 1,431,087 |
The accompanying notes are an integral part of these
financial statements. |
9
| Bretton Fund |
| |
| Statements of Changes in Net Assets | | | | | | | |
| | | 1/1/2013 | | | | 1/1/2012 | |
| | | to | | | | to | |
| | | 12/31/2013 | | | | 12/31/2012 | |
| From Operations: | | | | | | | |
| Net Investment Income (Loss) | $ | 1,347 | | | $ | (144 | ) |
| Net Realized Gain (Loss) on Investments | | 131,250 | | | | 195,526 | |
| Change in Net Unrealized Appreciation (Depreciation) | | 1,298,490 | | | | 260,739 | |
| Increase (Decrease) in Net Assets from Operations | | 1,431,087 | | | | 456,121 | |
| From Distributions to Shareholders: | | | | | | | |
| Net Investment Income | | - | | | | - | |
| Net Realized Gain from Security Transactions | | (131,250 | ) | | | (195,522 | ) |
| Change in Net Assets from Distributions | | (131,250 | ) | | | (195,522 | ) |
| From Capital Share Transactions: | | | | | | | |
| Proceeds From Sale of Shares | | 1,875,859 | | | | 1,760,737 | |
| Shares Issued on Reinvestment of Distributions | | 131,250 | | | | 195,522 | |
| Cost of Shares Redeemed | | (260,886 | ) | | | (124,416 | ) |
| Net Increase (Decrease) from Shareholder Activity | | 1,746,223 | | | | 1,831,843 | |
| |
| Net Increase (Decrease) in Net Assets | | 3,046,060 | | | | 2,092,442 | |
| |
| Net Assets at Beginning of Period | | 4,845,710 | | | | 2,753,268 | |
| Net Assets at End of Period (Including Accumulated Undistributed | | | | | | | |
| Net Investment Income of $1,347 and $0, respectively) | $ | 7,891,770 | | | $ | 4,845,710 | |
| |
| Share Transactions: | | | | | | | |
| Issued | | 85,831 | | | | 90,945 | |
| Reinvested | | 5,625 | | | | 10,450 | |
| Redeemed | | (11,997 | ) | | | (6,301 | ) |
| Net Increase in Shares | | 79,459 | | | | 95,094 | |
| Shares Outstanding Beginning of Period | | 257,265 | | | | 162,171 | |
| Shares Outstanding End of Period | | 336,724 | | | | 257,265 | |
| Financial Highlights | | | | | | | | | | | | |
| Selected data for a share outstanding throughout the period: | | | | | | | | | | | | |
| | | 1/1/2013 | | | 1/1/2012 | | | 1/1/2011 | | | 9/30/2010* | |
| | | to | | | to | | | to | | | to | |
| | | 12/31/2013 | | | 12/31/2012 | | | 12/31/2011 | | | 12/31/2010 | |
| Net Asset Value - | | | | | | | | | | | | |
| Beginning of Period | $ | 18.84 | | $ | 16.98 | | $ | 15.92 | | $ | 15.00 | |
| Net Investment Income (Loss) (a) | | - | (b) | | - | (b) | | (0.07 | ) | | (0.02 | ) |
| Net Gain (Loss) on Securities | | | | | | | | | | | | |
| (Realized and Unrealized) | | 5.00 | | | 2.65 | | | 1.33 | | | 0.94 | |
| Total from Investment Operations | | 5.00 | | | 2.65 | | | 1.26 | | | 0.92 | |
| |
| Distributions (From Net Investment Income) | | - | | | - | | | - | | | - | |
| Distributions (From Realized Capital Gains) | | (0.40 | ) | | (0.79 | ) | | (0.20 | ) | | - | |
| Distributions (From Return of Capital) | | - | | | - | | | - | (b) | | - | |
| Total Distributions | | (0.40 | ) | | (0.79 | ) | | (0.20 | ) | | - | |
| |
| Net Asset Value - | | | | | | | | | | | | |
| End of Period | $ | 23.44 | | $ | 18.84 | | $ | 16.98 | | $ | 15.92 | |
| Total Return (c) | | 26.53% | | | 15.66% | | | 7.90% | | | 6.13% | *** |
| Ratios/Supplemental Data | | | | | | | | | | | | |
| Net Assets - End of Period (Thousands) | $ | 7,892 | | $ | 4,846 | | $ | 2,753 | | $ | 1,846 | |
| Ratio of Expenses to Average Net Assets | | 1.50% | | | 1.50% | | | 1.50% | | | 1.50% | ** |
| Ratio of Net Investment Income (Loss) to Average Net Assets | | 0.02% | | | 0.00% | | | (0.41)% | | | (0.56)% | ** |
| Portfolio Turnover Rate | | 6.85% | | | 20.14% | | | 13.14% | | | 0.00% | *** |
* Commencement of Operations. ** Annualized. *** Not Annualized.
(a) Per share amounts were calculated using the average shares method.
(b) Less than $0.005 per share.
(c) Total return in the above table represents the rate that the investor would have earned
or lost on an investment in the Fund assuming reinvestment of dividends and distributions.
The accompanying notes are an integral part of these financial statements.
10
Notes to Financial Statements
Bretton Fund
December 31, 2013
1.) ORGANIZATION
Bretton Fund (the “Fund”) was organized as a non-diversified series of the PFS Funds (the “Trust”) on September 21, 2010. The Trust was established under the laws of Massachusetts by an Agreement and Declaration of Trust dated January 13, 2000, which was amended and restated January 20, 2011. Prior to March 5, 2010, the Trust was named Wireless Fund. The Fund is registered as an open-end investment company under the Investment Company Act of 1940, as amended. The Trust may offer an unlimited number of shares of beneficial interest in a number of separate series, each series representing a distinct fund with its own investment objectives and policies. As of December 31, 2013, there were eight series authorized by the Trust. The Fund commenced operations on September 30, 2010. The Fund's investment objective is to seek long-term capital appreciation. The investment adviser to the Fund is Bretton Capital Management, LLC (the “Adviser”).
2.) SIGNIFICANT ACCOUNTING POLICIES
SECURITY VALUATION:
All investments in securities are recorded at their estimated fair value, as described in Note 3.
FEDERAL INCOME TAXES:
The Fund’s policy is to continue to comply with the requirements of the Internal Revenue Code that are applicable to regulated investment companies and to distribute all of its taxable income to shareholders. Therefore, no federal income tax provision is required. It is the Fund’s policy to distribute annually, prior to the end of the calendar year, dividends sufficient to satisfy excise tax requirements of the Internal Revenue Code. This Internal Revenue Code requirement may cause an excess of distributions over the book year-end accumulated income. In addition, it is the Fund’s policy to distribute annually, after the end of the fiscal year, any remaining net investment income and net realized capital gains.
The Fund recognizes the tax benefits of certain tax positions only where the position is “more likely than not” to be sustained assuming examination by tax authorities. Management has analyzed the Fund’s tax positions, and has concluded that no liability for unrecognized tax benefits should be recorded related to uncertain tax positions taken on returns filed for open tax years (2010-2012), or expected to be taken in the Fund’s 2013 tax returns. The Fund identifies its major tax jurisdictions as U.S. Federal tax authorities; however, the Fund is not aware of any tax positions for which it is reasonably possible that the total amounts of unrecognized tax benefits will change materially in the next 12 months. The Fund recognizes interest and penalties, if any, related to unrecognized tax benefits as income tax expense in the Statement of Operations. During the fiscal year ended December 31, 2013, the Fund did not incur any interest or penalties.
DISTRIBUTIONS TO SHAREHOLDERS:
Distributions to shareholders, which are determined in accordance with income tax regulations, are recorded on the ex-dividend date.
The treatment for financial reporting purposes of distributions made to shareholders during the period from net investment income or net realized capital gains may differ from their ultimate treatment for federal income tax purposes. These differences are caused primarily by differences in the timing of the recognition of certain components of income, expense, or realized capital gain for federal income tax purposes. Where such differences are permanent in nature, they are reclassified in the components of the net assets based on their ultimate characterization for federal income tax purposes. Any such reclassifications will have no effect on net assets, results of operations, or net asset value per share of the Fund.
USE OF ESTIMATES:
The preparation of financial statements in conformity with accounting principles generally accepted in the United States of America (“GAAP”) requires management to make estimates and assumptions that affect the reported amounts of assets and liabilities and disclosure of contingent assets and liabilities at the date of the financial statements and the reported amounts of increases and decreases in net assets from operations during the reporting period. Actual results could differ from those estimates.
11
Notes to Financial Statements - continued
EXPENSES:
Expenses incurred by the Trust that do not relate to a specific fund of the Trust are allocated to the individual funds based on each fund’s relative net assets or another appropriate basis.
OTHER:
The Fund records security transactions based on the trade date. Dividend income is recognized on the ex-dividend date. Interest income is recognized on an accrual basis. The Fund uses the specific identification method in computing gain or loss on sales of investment securities. Discounts and premiums on securities purchased are accreted and amortized over the life of the respective securities. Withholding taxes on foreign dividends have been provided for in accordance with the Fund’s understanding of the applicable country’s tax rules and rates.
3.) SECURITIES VALUATIONS
As described in Note 2, the Fund utilizes various methods to measure the fair value of most of its investments on a recurring basis. GAAP establishes a hierarchy that prioritizes inputs to valuation methods. The three levels of inputs are:
Level 1 - Unadjusted quoted prices in active markets for identical assets or liabilities that the Fund has the ability to access.
Level 2 - Observable inputs other than quoted prices included in level 1 that are observable for the asset or liability, either directly or indirectly. These inputs may include quoted prices for the identical instrument in an inactive market, prices for similar instruments, interest rates, prepayment speeds, credit risk, yield curves, default rates, and similar data.
Level 3 - Unobservable inputs for the asset or liability, to the extent relevant observable inputs are not available, representing the Fund’s own assumptions about the assumptions a market participant would use in valuing the asset or liability, and would be based on the best information available.
The availability of observable inputs can vary from security to security and is affected by a wide variety of factors, including, for example, the type of security, whether the security is new and not yet established in the marketplace, the liquidity of markets, and other characteristics particular to the security. To the extent that valuation is based on models or inputs that are less observable or unobservable in the market, the determination of fair value requires more judgment. Accordingly, the degree of judgment exercised in determining fair value is greatest for instruments categorized in level 3.
The inputs used to measure fair value may fall into different levels of the fair value hierarchy. In such cases, for disclosure purposes, the level in the fair value hierarchy within which the fair value measurement falls in its entirety, is determined based on the lowest level input that is significant to the fair value measurement in its entirety.
FAIR VALUE MEASUREMENTS
A description of the valuation techniques applied to the Fund’s major categories of assets and liabilities measured at fair value on a recurring basis follows.
Equity securities (common stocks). Equity securities generally are valued by using market quotations, but may be valued on the basis of prices furnished by a pricing service when the Adviser believes such prices more accurately reflect the fair value of such securities. Securities that are traded on any stock exchange or on the NASDAQ over-the-counter market are generally valued by the pricing service at the last quoted sale price. Lacking a last sale price, an equity security is generally valued by the pricing service at its last bid price. To the extent these securities are actively traded and valuation adjustments are not applied, they are classified in level 1 of the fair value hierarchy. When market quotations are not readily available, when the Adviser determines that the market quotation or the price provided by the pricing service does not accurately reflect the current fair value, or when restricted or illiquid securities are being valued, such securities are valued as determined in good faith by the Adviser, in conformity with guidelines adopted by and subject to review of the Board of Trustees of the Trust, and are categorized in level 2 or level 3, when appropriate.
Illiquid securities. A security may be considered to be illiquid if it has a limited trading market. Securities are generally considered to be liquid if they can be sold or disposed of in the ordinary course of business within seven days at approximately the price at which the security is valued by the Fund. These securities are valued at fair value as described above. The Fund intends to hold
12
Notes to Financial Statements - continued
no more than 15% of its net assets in illiquid securities. As of December 31, 2013 illiquid securities as identified on the Schedule of Investments represented 2.09% of net assets.
Fixed income securities. Fixed income securities generally are valued by using market quotations, but may be valued on the basis of prices furnished by a pricing service when the Adviser believes such prices accurately reflect the fair market value of such securities. A pricing service utilizes electronic data processing techniques based on yield spreads relating to securities with similar characteristics to determine prices for normal institutional-size trading units of debt securities without regard to sale or bid prices. If the Adviser decides that a price provided by the pricing service does not accurately reflect the fair value of the securities, when prices are not readily available from a pricing service, or when restricted or illiquid securities are being valued, securities are valued at fair value as determined in good faith by the Adviser, subject to review of the Board of Trustees. Short-term investments in fixed income securities with maturities of less than 60 days when acquired, or which subsequently are within 60 days of maturity, are valued by using the amortized cost method of valuation, which the Board has determined will represent fair value. Generally, fixed income securities are categorized as level 2.
In accordance with the Trust's good faith pricing guidelines, the Adviser is required to consider all appropriate factors relevant to the value of securities for which it has determined other pricing sources are not available or reliable as described above. There is no single standard for determining fair value controls, since fair value depends upon the circumstances of each individual case. As a general principle, the current fair value of an issue of securities being valued by the Adviser would appear to be the amount which the owner might reasonably expect to receive for them upon their current sale. Methods which are in accordance with this principle may, for example, be based on (i) a multiple of earnings; (ii) a discount from market of a similar freely traded security (including a derivative security or a basket of securities traded on other markets, exchanges or among dealers); or (iii) yield to maturity with respect to debt issues, or a combination of these and other methods.
The following table summarizes the inputs used to value the Fund’s assets measured at fair value as of December 31, 2013:
| Valuation Inputs of Assets | | Level 1 | | Level 2 | | Level 3 | | Total |
| Common Stocks | | | | | | | | |
| Regional - Pacific Banks | | $0 | | $165,110 | | $0 | | $ 165,110 |
| State Commercial Banks | | 0 | | 112,200 | | 0 | | 112,200 |
| All Other | | $6,064,829 | | 0 | | 0 | | 6,064,829 |
| Total Investments in Securities | | $6,064,829 | | $277,310 | | $0 | | $6,342,139 |
Refer to the Fund’s Schedule of Investments for a listing of securities by industry. The Fund did not hold any Level 3 assets during the fiscal year ended December 31, 2013. There were no transfers into or out of the levels during the fiscal year ended December 31, 2013. It is the Fund’s policy to consider transfers into or out of the levels as of the end of the reporting period.
The Fund did not invest in derivative instruments during the fiscal year ended December 31, 2013.
4.) INVESTMENT ADVISORY AGREEMENT AND RELATED PARTY TRANSACTIONS
The Fund has entered into an investment advisory agreement (“Management Agreement”) with the Adviser. The Adviser manages the investment portfolio of the Fund, subject to policies adopted by the Trust's Board of Trustees, and, at its own expense and without reimbursement from the Fund, furnishes office space and all necessary office facilities, equipment, and executive personnel necessary for managing the Fund. The Adviser pays the expenses of the Fund except for the management fee, all brokerage fees and commissions, taxes, borrowing costs (such as (a) interest and (b) dividend expenses on securities sold short), fees and expenses of acquired funds, extraordinary or non-recurring expenses as may arise, including litigation to which the Fund may be a party and indemnification of the Trust’s Trustees and officers with respect thereto. For its services, the Adviser receives an investment management fee equal to 1.50% of the average daily net assets of the Fund.
For the fiscal year ended December 31, 2013, the Adviser earned management fees totaling $94,131, of which $9,765 was due to the Adviser at December 31, 2013.
13
Notes to Financial Statements - continued
5.) CAPITAL SHARES
The Trust is authorized to issue an unlimited number of shares of beneficial interest. Paid-in capital at December 31, 2013, was $6,071,271 representing 336,724 shares outstanding.
6.) RELATED PARTY TRANSACTIONS
Mr. Jeffrey R. Provence of Premier Fund Solutions, Inc. (the “Administrator”) also serves as trustee/officer of the Fund. This individual receives benefits from the Administrator resulting from administration fees paid to the Administrator of the Fund by the Adviser.
The Trustees who are not interested persons of the Trust received a total of $3,750 in Trustees’ fees plus travel and related expenses related to the Bretton Fund for the fiscal year ended December 31, 2013. Under the Services Agreement, the Adviser pays these fees.
7.) PURCHASES AND SALES OF SECURITIES
For the fiscal year ended December 31, 2013, purchases and sales of investment securities other than U.S. Government obligations and short-term investments aggregated $1,803,910 and $348,021, respectively. Purchases and sales of U.S. Government obligations aggregated $0 and $0, respectively.
8.) SECURITY TRANSACTIONS
For Federal income tax purposes, the cost of investments owned at December 31, 2013, was $4,522,987. At December 31, 2013, the composition of unrealized appreciation (the excess of value over tax cost) and depreciation (the excess of tax cost over value) was as follows:
| | Appreciation | | (Depreciation) | | Net Appreciation (Depreciation) |
| | $1,872,463 | | ($53,311) | | $1,819,152 |
There were no differences between book basis and tax basis unrealized appreciation.
9.) CONTROL OWNERSHIP
The beneficial ownership, either directly or indirectly, of more than 25% of the voting shares of a fund creates a presumption of control of the Fund, under Section 2(a)(9) of the Investment Company Act of 1940. As of December 31, 2013, Stephen Dodson and family members, located at 338 Spear Street, San Francisco, California 94105, beneficially held, in aggregate, approximately 62.77% of the Fund and therefore, may be deemed to control the Fund. Stephen Dodson is the control person of the Adviser.
10.) DISTRIBUTIONS TO SHAREHOLDERS
There was a distribution from long-term capital gain of $0.39674 per share paid on December 26, 2013 to the shareholders of record on December 24, 2013.
The tax character of distributions was as follows:
| | | 2013 | | | 2012 | |
| Ordinary Income . | | $ -0 | - | | $ -0 | - |
| Long-Term Capital Gain | | 131,250 | | | 195,522 | |
| | | $ 131,250 | | | $ 195,522 | |
As of December 31, 2013, the components of distributable earnings (accumulated losses) on a tax basis were as follows:
| Undistributed ordinary income/(accumulated losses) | | $ 1,347 |
| Undistributed long-term capital gain/(accumulated losses) | | -0- |
| Unrealized appreciation/(depreciation) | | 1,819,152 |
| | | $ 1,820,499 |
There were no differences between book basis and tax basis unrealized appreciation.
14
This page was intentionally left blank.
15
This page was intentionally left blank.
16
Additional Information
December 31, 2013
(Unaudited)
1.) AVAILABILITY OF QUARTERLY SCHEDULE OF INVESTMENTS
The Fund files its complete schedule of portfolio holdings with the Securities and Exchange Commission ("SEC") for the first and third quarters of each fiscal year on Form N-Q. The Fund’s Form N-Q is available on the SEC's website at http://www.sec.gov. The Fund’s Form N-Q may also be reviewed and copied at the SEC's Public Reference Room in Washington, DC. Information on the operation of the Public Reference Room may be obtained by calling 800.SEC.0330.
2.) PROXY VOTING GUIDELINES
Bretton Capital Management, LLC, the Fund’s investment adviser (“Adviser”), is responsible for exercising the voting rights associated with the securities held by the Fund. A description of the policies and procedures used by the Adviser in fulfilling this responsibility is available without charge by calling our toll free number (800.231.2901) . It is also included in the Fund’s Statement of Additional Information, which is available on the SEC’s website at http://www.sec.gov.
Information regarding how the Fund voted proxies, Form N-PX, relating to portfolio securities during the most recent 12-month period ended June 30, is available without charge, upon request, by calling our toll free number (800.231.2901) . This information is also available on the SEC’s website at http://www.sec.gov.
3.) APPROVAL OF INVESTMENT ADVISORY AGREEMENT
At a meeting held on September 18, 2013 (the “Meeting”), the Board of Trustees (the "Board") considered the approval of the continuation of the Investment Advisory Agreement (the "Agreement") between the Trust and Bretton Capital Management, LLC ("Bretton") on behalf of the Bretton Fund (the "Fund").
In approving the Agreement, the Board of Trustees considered and evaluated the following factors: (i) the nature, extent and quality of the services provided by Bretton to the Fund; (ii) the investment performance of the Fund and Bretton; (iii) the cost of the services to be provided and the profits to be realized by Bretton from the relationship with the Fund; (iv) the extent to which economies of scale will be realized as the Fund grows and whether the fee levels reflect these economies of scale to the benefit of shareholders; and (v) Bretton's practices regarding possible conflicts of interest and other benefits to be realized by Bretton.
In assessing these factors and reaching its decisions, the Board took into consideration information furnished for the Board's review and consideration throughout the year at regular Board meetings, as well as information specifically prepared and/or presented in connection with the annual renewal process, including information presented at the Meeting. The Board requested and was provided with information and reports relevant to the annual renewal of the Agreement, including: (i) information regarding the services and support provided to the Fund and its shareholders by Bretton; (ii) assessments of the investment performance of the Fund by the principal of Bretton; (iii) commentary on the reasons for the performance; (iv) presentations addressing Bretton's investment philosophy, investment strategy, personnel and operations; (v) compliance and audit related information concerning the Fund and Bretton; (vi) disclosure information contained in the registration statement of the Trust and the Form ADV of Bretton; and (vii) a memorandum from Legal Counsel that summarized the fiduciary duties and responsibilities of the Board in reviewing and approving the Agreement, including the material factors set forth above and the types of information included in each factor that should be considered by the Board in order to make an informed decision. The Board also requested and received various informational materials including, without limitation: (i) documents containing information about Bretton, including financial information, a description of personnel and the services provided to the Fund, information on investment advice, performance, summaries of Fund expenses, compliance program, current legal matters, and other general information; (ii) comparative expense and performance information for other mutual funds with strategies similar to the Fund; (iii) the anticipated effect of size on the Fund's performance and expenses; and (iv) benefits to be realized by Bretton from its relationship with the Fund. The Board did not identify any particular information that was most relevant to its consideration to approve the Agreement and each Trustee may have afforded different weight to the various factors.
1. Nature, Extent and Quality of the Services Provided by Bretton
In considering the nature, extent, and quality of the services provided by Bretton, the Trustees reviewed the responsibilities of Bretton under the Agreement. The Trustees reviewed the services
17
Additional Information (Unaudited) - continued
being provided by Bretton including, without limitation: the quality of investment advisory services (including research and recommendations with respect to portfolio securities); the process for formulating investment recommendations and assuring compliance with the Fund's investment objective, strategies, and limitations, as well as for ensuring compliance with regulatory requirements. The Trustees considered the coordination of services for the Fund among Bretton and the service providers and the Independent Trustees; and the efforts of Bretton to promote the Fund and grow its assets. The Trustees noted the qualifications of Bretton's principal and his commitment to enhance Bretton's resources and systems and the continued cooperation with the Independent Trustees and Legal Counsel for the Fund. The Trustees evaluated Bretton's principal, including his education and experience. After reviewing the foregoing information and further information in the materials provided by Bretton, the Board concluded that, in light of all the facts and circumstances, the nature, extent, and quality of the services provided by Bretton were satisfactory and adequate for the Fund.
2. Investment Performance of the Fund and Bretton
In considering the investment performance of the Fund and Bretton, the Trustees compared the short-term and since inception performance of the Fund with the performance of funds with similar objectives managed by other investment advisers, as well as with aggregated peer group data. As to the performance of the Fund, the Report included information regarding the performance of the Fund compared to a group of funds of similar size, style and objective, categorized by Morningstar (the "Peer Group"). All performance data was through the period ended June 30, 2013. The Trustees noted that for the 12 month period ended June 30, 2013 the Fund underperformed its benchmark index and its Peer Group average, and outperformed its benchmark index since inception. After reviewing and discussing the investment performance of the Fund further, Bretton's experience managing the Fund, and other relevant factors, the Board concluded, in light of all the facts and circumstances, that the investment performance of the Fund and Bretton was satisfactory.
3. Costs of the Services to be provided and profits to be realized by Bretton
In considering the costs of the services to be provided and profits to be realized by Bretton from the relationship with the Fund, the Trustees considered: (1) Bretton's financial condition and the level of commitment to the Fund and Bretton by the principal of Bretton; (2) the asset level of the Fund; (3) the overall expenses of the Fund; and (4) the nature and frequency of advisory fee payments. The Trustees reviewed information provided by Bretton regarding its profits associated with managing the Fund. The Trustees also considered potential benefits for Bretton in managing the Fund. The Trustees then compared the fees and expenses of the Fund (including the management fee) to other comparable mutual funds. The Trustees reviewed the fees under the Agreement compared to other mutual funds with similar investment objectives and asset levels and noted that the net expense ratio was approximately 20 basis points lower than its Peer Group average. The Trustees also reviewed the management fee of 1.50% noting that it was at the high end of the Peer Group. The Trustees also recognized that Bretton was obligated to pay certain expenses of the Fund out of its management fee, and that after paying those expenses, the Adviser's relationship with the Fund was not profitable due to the Fund's current asset level. Based on the foregoing, the Board concluded that the fees to be paid to Bretton and the profits to be realized by Bretton, in light of all the facts and circumstances, were fair and reasonable in relation to the nature and quality of the services provided by Bretton.
4. Economies of Scale
The Trustees next considered the impact of economies of scale on the Fund's size and whether advisory fee levels reflect those economies of scale for the benefit of the Fund's investors. The Trustees considered that while the management fee remained the same at all asset levels, the Fund's shareholders had experienced benefits from the fact that Bretton was obligated to pay certain of the Fund's operating expenses which had the effect of limiting the overall fees paid by the Fund. In light of its ongoing consideration of the Fund's asset levels, expectations for growth in the Fund, and fee levels, the Board determined that the Fund's fee arrangements, in light of all the facts and circumstances, were fair and reasonable in relation to the nature and quality of the services provided by Bretton.
5. Interest and Benefits to the Adviser
In considering Bretton's practices regarding conflicts of interest, the Trustees evaluated the potential for conflicts of interest and considered such matters as the experience and ability of the principal of Bretton; the basis of decisions to buy or sell securities for the Fund; and the sub-
18
Additional Information (Unaudited) - continued
stance and administration of Bretton's code of ethics. The Trustees also considered disclosure in the registration statement of the Trust related to Bretton's potential conflicts of interest. The Board noted that Bretton does not use "soft dollars." The Trustees noted and accepted Bretton's representation that it does not realize any benefits from advising the Fund other than the direct benefit of being compensated by the Fund for serving as its investment adviser. Based on the foregoing, the Board determined that Bretton's standards and practices relating to the identification and mitigation of possible conflicts of interest were satisfactory.
The Board then reflected on its in-person discussion with a representative of the Adviser earlier in the Meeting. Next, the Independent Trustees met in executive session to discuss the continuation of the Agreement. The officers of the Trust were excused during this discussion. Upon reconvening, it was the Board's consensus (including a majority of the independent Trustees) that the fees to be paid to Bretton, pursuant to the Agreement, were reasonable, that the overall arrangements provided under the terms of the Agreement were reasonable and within a range of what could have been negotiated at arms-length in light of all surrounding circumstances, including such services to be rendered and such other matters as the Trustees considered to be relevant in the exercise of their reasonable business judgment.
4.) DISCLOSURE OF EXPENSES
As a shareholder of the Fund, you incur ongoing expenses consisting solely of management fees. You will be assessed fees for outgoing wire transfers, returned checks and stop payment orders at prevailing rates charged by Mutual Shareholder Services, LLC, the Fund's transfer agent, and IRA accounts will be charged an $8.00 annual maintenance fee. This Example is intended to help you understand your ongoing costs (in dollars) of investing in the Fund and to compare these costs with the ongoing costs of investing in other mutual funds.
The Example is based on an investment of $1,000 invested in the Fund on July 1, 2013, and held through December 31, 2013.
Actual Expenses
The first line of the table below provides information about actual account values and actual expenses. You may use the information in this line, together with the amount you invested, to estimate the expenses that you paid over the period. Simply divide your account value by $1,000 (for example, an $8,600 account value divided by $1,000 = 8.6), then multiply the result by the number in the first line under the heading entitled "Expenses Paid During Period" to estimate the expenses you paid on your account during this period.
Hypothetical Example for Comparison Purposes
The second line of the table below provides information about hypothetical account values and hypothetical expenses based on the Fund's actual expense ratio and an assumed rate of return of 5% per year before expenses, which is not the Fund's actual return. The hypothetical account values and expenses may not be used to estimate the actual ending account balance or expenses you paid for the period. You may use this information to compare the ongoing costs of investing in this Fund and other funds. To do so, compare this 5% hypothetical example with the 5% hypothetical examples that appear in the shareholder reports of the other funds.
Please note that the expenses shown in the table are meant to highlight your ongoing costs only and do not reflect any transactional costs, such as sales charges (loads) or the charges assessed by Mutual Shareholder Services, LLC as described above. Therefore, the second line of the table is useful in comparing ongoing costs only, and will not help you determine the relative cost of owning different funds. In addition, if these transactional costs were included, your cost could have been higher.
| | | | | | | Expenses Paid |
| | | Beginning | | Ending | | During the Period* |
| | | Account Value | | Account Value | | July 1, 2013 to |
| | | July 1, 2013 | | December 31, 2013 | | December 31, 2013 |
| |
| Actual | | $1,000.00 | | $1,086.54 | | $7.89 |
| |
| Hypothetical | | $1,000.00 | | $1,017.64 | | $7.63 |
| (5% annual return | | | | | | |
| before expenses) | | | | | | |
* Expenses are equal to the Fund’s annualized expense ratio of 1.50%, multiplied by the
average account value over the period, multiplied by 184/365 (to reflect the one-half year
period ended December 31, 2013). |
19
Cohen Fund Audit Services, Ltd.
Certified Public Accountants | 1350 Euclid Ave., Ste 800
Cleveland, Ohio 44115
Phone: (440) 835-8500
Fax: (440) 835-1093
www.cohenfund.com |
REPORT OF INDEPENDENT REGISTERED PUBLIC ACCOUNTING FIRM
To the Shareholders of Bretton Fund
and Board of Trustees of PFS Funds
We have audited the accompanying statement of assets and liabilities, including the schedule of investments, of Bretton Fund (the "Fund"), a series of PFS Funds, as of December 31, 2013 and the related statement of operations for the year then ended, the statements of changes in net assets for each of the two years in the period then ended, and the financial highlights for each of the four periods in the period then ended. These financial statements and financial highlights are the responsibility of the Fund's management. Our responsibility is to express an opinion on these financial statements and financial highlights based on our audits.
We conducted our audits in accordance with the standards of the Public Company Accounting Oversight Board (United States). Those standards require that we plan and perform the audit to obtain reasonable assurance about whether the financial statements and financial highlights are free of material misstatement. An audit includes examining, on a test basis, evidence supporting the amounts and disclosures in the financial statements. Our procedures included confirmation of securities owned as of December 31, 2013 by correspondence with the custodian. An audit also includes assessing the accounting principles used and significant estimates made by management, as well as evaluating the overall financial statement presentation. We believe that our audits provide a reasonable basis for our opinion.
In our opinion, the financial statements and financial highlights referred to above present fairly, in all material respects, the financial position of Bretton Fund as of December 31, 2013, the results of its operations for the year then ended, the changes in its net assets for each of the two years in the period then ended, and the financial highlights for each of the four periods in the period then ended, in conformity with accounting principles generally accepted in the United States of America.

COHEN FUND AUDIT SERVICES, LTD.
Cleveland, Ohio
February 25, 2014
20
Trustees and Officers
(Unaudited)
The Board of Trustees supervises the business activities of the Trust. The names of the Trustees and executive officers of the Trust are shown below. For more information regarding the Trustees, please refer to the Statement of Additional Information, which is available upon request by calling 800.231.2901. Each Trustee serves until the Trustee sooner dies, resigns, retires, or is removed.
The Trustees and Officers of the Trust and their principal business activities during the past five years are:
Interested Trustees and Officers
| | | | | Number of | Other |
| | | | Principal | Portfolios In | Directorships |
| Name, | Position(s) | Term of Office | Occupation(s) | Fund | Held By |
| Address(1), | Held With | and Length of | During | Complex | Trustee or |
| and Year of Birth | the Trust | Time Served | Past 5 Years | Overseen By | Officer |
| | | | | Trustee | |
| |
| Ross C. Provence, | President | Indefinite Term; | General Partner and Portfolio | N/A | Blue Chip |
| Year of Birth: 1938 | | Since 2000 | Manager for Value Trend Capital | | Investor Funds, |
| | | | Management, LP (1995 to current). | | PFS Funds |
| | | | Estate planning attorney (1963 to | | (Jan. 2000 - |
| | | | current). | | May 2013) |
| |
| Jeffrey R. Provence(2), | Trustee, | Indefinite Term; | General Partner and Portfolio | 8 | Blue Chip |
| Year of Birth:1969 | Secretary | Since 2000 | Manager for Value Trend Capital | | Investor Funds, |
| | and | | Management, LP (1995 to current). | | Sycuan Funds |
| | Treasurer | | CEO, Premier Fund Solutions, Inc. | | |
| | | | (2001 to current). | | |
| |
| Julian G. Winters, | Chief | Chief | Managing Member, Watermark | N/A | N/A |
| Year of Birth: 1968 | Compliance | Compliance | Solutions LLC (investment compli- | | |
| | Officer | Officer Since | ance and consulting) since March | | |
| | | 2010 | 2007. | | |
(1) The address of each trustee and officer is c/o PFS Funds, 1939 Friendship Drive, Suite C, El Cajon, California 92020.
(2) Jeffrey R. Provence is considered an "interested person" as defined in Section 2(a)(19) of the Investment Company Act of 1940 by virtue of his position with the Trust.
Independent Trustees
| | | | | Number of | Other |
| | | | Principal | Portfolios In | Directorships |
| Name, | Position | Term of Office | Occupation(s) | Fund | Held By |
| Address(1), | Held With | and Length of | During | Complex | Trustee or |
| and Year of Birth | the Trust | Time Served | Past 5 Years | Overseen By | Officer |
| | | | | Trustee | |
| |
| Thomas H. Addis III, | Independent | Indefinite Term; | Executive Director/CEO, Southern | 8 | None |
| Year of Birth: 1945 | Trustee | Since 2000 | California PGA (2006 to current). | | |
| |
| Allen C. Brown, | Independent | Indefinite Term; | Co-owner of Stebleton & Brown | 8 | Blue Chip |
| Year of Birth: 1943 | Trustee | Since 2010 | (1994 to Current). Estate planning | | Investor Funds, |
| | | | and business attorney (1970 to cur- | | Sycuan Funds |
| rent). |
| |
| George Cossolias, CPA, | Independent | Indefinite Term; | Owner of George Cossolias & | 8 | Blue Chip |
| Year of Birth: 1935 | Trustee | Since 2000 | Company, CPAs (1972 to current). | | Investor Funds, |
| | | | President of Lubrication Specialists, | | Sycuan Funds, |
| | | | Inc. (1996 to current). | | Temecula |
| | | | | | Valley Bank |
(1) The address of each trustee and officer is c/o PFS Funds, 1939 Friendship Drive, Suite C, El Cajon, California 92020.
21

Investment Adviser
Bretton Capital Management, LLC
Legal Counsel
The Law Offices of John H. Lively
A member firm of The 1940 Act Law GroupTM
Custodian
US Bank N.A.
Dividend Paying Agent,
Shareholders' Servicing Agent,
Transfer Agent
Mutual Shareholder Services, LLC
Fund Administrator
Premier Fund Solutions, Inc.
Independent Registered Public Accounting Firm
Cohen Fund Audit Services, Ltd. |
This report is provided for the general information of the shareholders of the Bretton
Fund. This report is not intended for distribution to prospective investors in the Fund,
unless preceded or accompanied by an effective prospectus. |
Item 2. Code of Ethics.
The registrant has adopted a code of ethics that applies to the registrant’s principal executive officer and the principal financial officer. The registrant has not made any amendments to its code of ethics during the covered period. The registrant has not granted any waivers from any provisions of the code of ethics during the covered period. A copy of the registrant’s Code of Ethics is filed herewith.
Item 3. Audit Committee Financial Expert.
The registrant’s Board of Trustees has determined that George Cossolias is an audit committee finical expert. Mr. Cossolias is independent for purposes of this Item 3.
Item 4. Principal Accountant Fees and Services.
(a-d) The following table details the aggregate fees billed for each of the last two fiscal years for audit fees, audit-related fees, tax fees and other fees by the principal accountant to the registrant. The principal accountant has provided no services to the adviser or any entity controlled by, or under common control with the adviser that provides ongoing services to the registrant.
| | | FYE 12/31/13 | | FYE 12/31/12 |
| Audit Fees | | $13,250 | | $13,250 |
| Audit-Related Fees | | $0 | | $0 |
| Tax Fees | | $2,500 | | $2,500 |
| All Other Fees | | $750 | | $750 |
Nature of Tax Fees: preparation of Excise Tax Statement and 1120 RIC.
Nature of All Other Fees: Review of Semi-Annual Report.
(e) (1) The audit committee approves all audit and non-audit related services and, therefore, has not adopted pre-approval policies and procedures described in paragraph (c)(7) of Rule 2-01 of Regulation S-X.
(e) (2) None of the services described in paragraph (b) through (d) of this Item were approved by the audit committee pursuant to paragraph (c)(7)(i)(C) of Rule 2-01 of Regulation S-X.
(f) All of the principal accountant’s hours spent on auditing the registrant’s financial statements were attributed to work performed by full-time permanent employees of the principal accountant.
(g) The following table indicates the aggregate non-audit fees billed by the registrant’s principal accountant for services to the registrant , the registrant’s investment adviser (not sub-adviser), and any entity controlling, controlled by, or under common control with the adviser that provides ongoing services to the registrant, for the last two years.
| Non-Audit Fees | | FYE 12/31/13 | | FYE 12/31/12 |
| Registrant | | $3,250 | | $3,250 |
| Registrant’s Investment Adviser | | $0 | | $0 |
(h) The principal accountant provided no services to the investment adviser or any entity controlling, controlled by, or under common control with the adviser that provides ongoing services to the registrant.
Item 5. Audit Committee of Listed Companies. Not applicable.
Item 6. Schedule of Investments. Schedule filed with Item 1.
Item 7. Disclosure of Proxy Voting Policies and Procedures for Closed-End Management Investment Companies. Not applicable.
Item 8. Portfolio Managers of Closed End Management Investment Companies. Not applicable.
Item 9. Purchases of Equity Securities by Closed-End Management Investment Companies and Affiliated Purchasers. Not applicable.
Item 10. Submission of Matters to a Vote of Security Holders.
The registrant has not adopted procedures by which shareholders may recommend nominees to the registrant’s board of trustees.
Item 11. Controls and Procedures.
(a) The registrant’s president and chief financial officer concluded that the disclosure controls and procedures (as defined in Rule 30a-3(c) under the Investment Company Act of 1940 (the “Act”)) were effective as of a date within 90 days of the filing date of this report, based on the evaluation of these controls and procedures required by Rule 30a-3(b) under the Act.
(b) There were no changes in the registrant’s internal control over financial reporting (as defined in Rule 30a-3(d) under the Act) that occurred during the registrant’s second fiscal quarter of the period covered by this report that have materially affected, or are reasonably likely to materially affect, the registrant’s internal control over financial reporting.
Item 12. Exhibits.
(a)(1) Code of Ethics. Filed herewith.
(a)(2) Certifications pursuant to Section 302 of the Sarbanes-Oxley Act of 2002. Filed herewith.
(b) Certification pursuant to Section 906 Certification of the Sarbanes-Oxley Act of 2002. Filed herewith.
SIGNATURES
Pursuant to the requirements of the Securities Exchange Act of 1934 and the Investment Company Act of 1940, the registrant has duly caused this report to be signed on its behalf by the undersigned, thereunto duly authorized.
| | By: /s/Ross C. Provence
Ross C. Provence
President |
Pursuant to the requirements of the Securities Exchange Act of 1934 and the Investment Company Act of 1940, this report has been signed below by the following persons on behalf of the registrant and in the capacities and on the dates indicated.
| | By: /s/Ross C. Provence
Ross C. Provence
President |
| | By: /s/Jeffrey R. Provence
Jeffrey R. Provence
Chief Financial Officer |