UNITED STATES
SECURITIES AND EXCHANGE COMMISSION
WASHINGTON, D.C. 20549
FORM N-CSR
CERTIFIED SHAREHOLDER REPORT OF REGISTERED MANAGEMENT
INVESTMENT COMPANIES
Investment Company Act file number 811-09781
PFS Funds
(Exact name of registrant as specified in charter)
| 1939 Friendship Drive, Suite C, El Cajon, CA 92020 |
| (Address of principal executive offices) | (Zip code) |
CT Corporation System
155 Federal St., Suite 700, Boston, MA 02110
(Name and address of agent for service)
Registrant's telephone number, including area code: (619) 588-9700
Date of fiscal year end: June 30
Date of reporting period: June 30, 2018
Form N-CSR is to be used by management investment companies to file reports with the Commission not later than 10 days after the transmission to stockholders of any report that is required to be transmitted to stockholders under Rule 30e-1 under the Investment Company Act of 1940 (17 CFR 270.30e -1). The Commission may use the information provided on Form N-CSR in its regulatory, disclosure review, inspection and policymaking roles.
A registrant is required to disclose the information specified by Form N-CSR, and the Commission will make this information public. A registrant is not required to respond to the collection of information contained in Form N-CSR unless the Form displays a currently valid Office of Management and Budget ("OMB") control number.
Item 1. Reports to Stockholders.

MOATXInvestor Shares
CASTXClass C
For Investors Seeking Long-Term Capital Appreciation
Annual Report
June 30, 2018
Dear Fellow Shareholders:
We are pleased to present the Annual Report for the Castle Focus Fund (the “Fund”). This report provides you with important financial information on the Fund as well as portfolio manager commentary for the fiscal year ended June 30, 2018. We are very appreciative of your continued investments in the Fund.
The Fund completed its eighth year of operations at the end of this fiscal year. Shareholder investments in the Fund totaled more than $133 Million. The letter on the following page is from the Fund’s Sub-Adviser – St. James Investment Company – and provides you with an explanation of how the Fund performed over this past fiscal year.
We appreciate your trust and confidence in our management of the Fund.
Kind Regards,

Caeli Andrews
Co-Founder, Managing Director
Castle Investment Management | Andrew Welle
Co-Founder, Managing Director
Castle Investment Management |
2018 Annual Report 1
Dear Castle Focus Fund Shareholder:
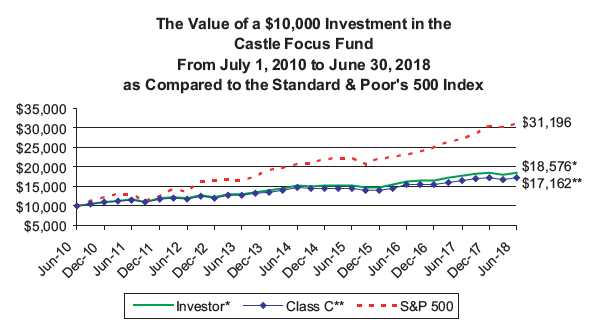
Thank you for your continued investments in the Castle Focus Fund (the “Fund”). It is our pleasure to report to you on the Fund’s performance over the last fiscal year. For the fiscal year ended June 30, 2018, the Investor Class Shares returned 4.40% (Class C Shares returned 3.43%) . Over that same one-year period, the S&P 500® Index (the Fund’s “Benchmark”) returned 14.37% . Our firm, St. James Investment Company, has served as Sub-Adviser to the Castle Focus Fund since the Fund’s inception in 2010. Over that eight-year period the Investor Class Shares have experienced an average annual return of 8.05% (Class C Shares returned 6.98%) .
The following were primary contributing factors to the Fund’s one-year performance relative to its Benchmark:
Some of the Fund’s holdings that added to performance during the fiscal year included TJX Companies, Inc. (TJX) and Royal Gold, Inc. (RGLD). We added TJX Companies to the Fund during the fiscal year. We initiated the position in November 2017 when it appeared to us that brick-and-mortar retail was a depressed and despised sector. Our view was that the market was incorrectly lumping the TJX Companies – an off-price retailer – with all other retailers. As value investors, we believe that investing in well-managed companies when prices and expectations are low creates greater potential for capital appreciation. At the end of the Fund’s fiscal year, the price of TJX Companies stock had rebounded and moved up more than 39% from our initial purchase price. We trimmed the Fund’s position as the stock price moved up but still held part of the position at the end of the fiscal year. Royal Gold, Inc. has been a long-term holding of the Fund – we’ve owned it since 2013 –and it was among the Fund’s largest holdings throughout the fiscal year. The company’s stock price moved up more than 18% over the fiscal year and positively impacted the Fund’s performance. Other Fund holdings that added to performance during the fiscal year include Conduent, Inc. (CNDT), Expeditors International (EXPD), Berkshire Hathaway, Inc. B (BRK.B), and News Corp (NWSA).
The Fund’s position in Dominion Energy, Inc. (D) detracted from performance during the fiscal year. Dominion’s stock price dropped more than 11% over the fiscal year. As mentioned earlier, as our view on a company diverges from the consensus, we often find investment opportunities. We believe this is the case with Dominion and we took the market’s dissatisfaction with the company as an opportunity to add to the Fund’s position. Dominion was a relatively small position at the beginning of the fiscal year, but grew to one of the Fund’s largest holdings as we added to the position at lower prices throughout the year. At year end, Dominion was the Fund’s fourth largest position representing 5.54% of net assets. We look forward to updating Fund shareholders on the Fund’s investment in Dominion in a future letter. Other Fund holdings that underperformed the Benchmark during the year include CVS Health Corp. (CVS), Nestle SA (NSRGY), and Schlumberger Ltd. (SLB).
The Fund held a significant cash position throughout the fiscal year. The Benchmark holds no cash. This significant difference between the Fund and its Benchmark detracted from the Fund’s relative performance during the fiscal year. It is important to note that the Fund’s cash position is not a ‘market call’ on our part. Rather, cash in the Fund’s portfolio is simply an outcome of our conservative approach to selecting equity investments for the Fund. Again, we want to buy exceptional companies when their stock is trading at a significant discount to our conservative estimate of their intrinsic value. These types of opportunities are rare. As the bull market in stocks grows older, it has become more difficult for us to find investment opportunities that meet our strict investment criteria. We are patient value investors who place little weight on short-term returns versus a benchmark. Thus, in the current market environment we are content to add to our cash position as we continue to seek out compelling investment opportunities.
2018 Annual Report 2
Finally, differences in sector weightings between the Fund and its Benchmark played a role in the Fund’s relative performance. Most notably, the Fund held a 1.91% position in the Information Technology sector at the end of the fiscal year. The Benchmark, conversely, had a 26% weight. Let that sink in for a moment – The broad-based basket of stocks that describes itself as “the best single gauge of large-cap U.S. equities” had more than one quarter of its total value in one sector. There are eleven sectors in the Benchmark. If you add up the bottom six sectors their combined weight is 23.7% of the Benchmark— still less than the Information Technology sector alone. Our underweight position in the Information Technology sector hurt the Fund’s relative performance this fiscal year. We look forward to revisiting this item in future shareholder letters.
Kind Regards,

| Robert J. Mark | Larry J. Redell |
| Portfolio Manager | St. James Investment Company |
| St. James Investment Company | |
Past performance does not guarantee future results. The investment return and principal value of an investment in the Fund will fluctuate so that an investor’s shares, when redeemed, may be worth more or less than their original cost. Current performance may be higher or lower than the performance data quoted. Performance data current to the most recent month end are available by calling 1-877-743-7820.
The Castle Focus Fund’s prospectus contains important information about the Fund’s investment objectives, potential risks, management fees, charges and expenses, and other information and should be read and considered carefully before investing. You may obtain a current copy of the Fund’s prospectus by calling 1-877-743-7820. Distributed by Rafferty Capital Markets, LLC-Garden City, NY 11530.
2018 Annual Report 3
CASTLE FOCUS FUND (Unaudited)
CASTLE FOCUS FUND PERFORMANCE INFORMATION
AVERAGE ANNUAL RETURNS AS OF JUNE 30, 2018
| | | | | | Since | |
| | 1 Year(A) | | 5 Year(A) | | Inception(A) | |
| Investor Shares | 4.40% | | 7.37% | | 8.05% | |
| Class C | 3.43% | | 6.30% | | 6.98% | |
| S&P 500® Index (B) | 14.37% | | 13.42% | | 15.28% | |
The Fund's Total Annual Operating Expense Ratios (from November 1, 2017 Prospectus):
Investor Shares – Gross 1.65%, Net 1.41%;
Class C – Gross 2.65%, Net 2.41%
The Fund’s actual expense ratios for the fiscal year ended June 30, 2018 can be found in the financial highlights included in this report. The Total Annual Operating Expense Ratios reported above will not correlate to the expense ratio in the Fund’s financial highlights because (a) the financial highlights include only the direct operating expenses incurred by the Fund, not the indirect costs of investing in the Fund, (b) the expense ratios may be for different periods, and (c) the Adviser has contractually agreed to waive Services Agreement fees (see Note 4).
(A) 1 Year, 5 Year and Since Inception returns include change in share prices and in each case includes reinvestment of any dividends and capital gain distributions. The Castle Focus Fund commenced operations on July 1, 2010.
(B) The S&P 500® Index is an unmanaged index comprised of the stocks of large capitalization issues in the United States and it is considered representative of the U.S. equity markets as a whole.
PAST PERFORMANCE DOES NOT GUARANTEE FUTURE RESULTS. INVESTMENT RETURN AND PRINCIPAL VALUE WILL FLUCTUATE SO THAT SHARES, WHEN REDEEMED, MAY BE WORTH MORE OR LESS THAN THEIR ORIGINAL COST. RETURNS DO NOT REFLECT THE DEDUCTION OF TAXES THAT A SHAREHOLDER WOULD PAY ON FUND DISTRIBUTIONS OR THE REDEMPTION OF FUND SHARES. CURRENT PERFORMANCE MAY BE LOWER OR HIGHER THAN THE PERFORMANCE DATA QUOTED. TO OBTAIN PERFORMANCE DATA CURRENT TO THE MOST RECENT MONTH END, PLEASE CALL 1-877-743-7820. AN INVESTMENT IN THE FUND IS SUBJECT TO INVESTMENT RISKS, INCLUDING THE POSSIBLE LOSS OF THE PRINCIPAL AMOUNT INVESTED. THE FUND’S DISTRIBUTOR IS RAFFERTY CAPITAL MARKETS, LLC.
2018 Annual Report 4
| | CASTLE FOCUS FUND (Unaudited) |
Castle Focus Fund
by Sectors (as a percentage of Net Assets)
June 30, 2018

*Net Cash represents cash equivalents and liabilities in excess of other assets.
Availability of Quarterly Schedule of Investments
The Fund files its complete schedule of portfolio holdings with the Securities and Exchange Commission (“SEC”) for the first and third quarters of each fiscal year on Form N-Q. The Fund’s Form N-Q is available on the SEC’s website at http://www.sec.gov. The Fund’s Form N-Q may also be reviewed and copied at the SEC’s Public Reference Room in Washington, DC. Information on the operation of the Public Reference Room may be obtained by calling 1-800-SEC-0330.
Proxy Voting Guidelines
St. James Investment Company, LLC (the “Sub-Adviser”) is responsible for exercising the voting rights associated with the securities held by the Fund. A description of the policies and procedures used by the Sub-Adviser in fulfilling this responsibility is available without charge by calling 1-877-743-7820. It is also included in the Fund’s Statement of Additional Information, which is available on the SEC’s website at http://www.sec.gov.
Information regarding how the Fund voted proxies, Form N-PX, relating to portfolio securities during the most recent 12-month period ended June 30, is available without charge, upon request, by calling 1-877-743-7820. This information is also available on the SEC’s website at http://www.sec.gov.
2018 Annual Report 5
Disclosure of Expenses
(Unaudited)
As a shareholder of the Fund, you incur two types of costs: (1) transaction costs, including sales charges (loads) on purchase payments; and (2) ongoing costs, including management fees; distribution and/or service (12b-1) fees; and other Fund expenses. This Example is intended to help you understand your ongoing costs (in dollars) of investing in the Fund and to compare these costs with the ongoing costs of investing in other mutual funds. You will be assessed fees for outgoing wire transfers, returned checks and stop payment orders at prevailing rates charged by Mutual Shareholder Services, LLC, the Fund’s transfer agent, and IRA accounts will be charged an $8.00 annual maintenance fee.
The Example is based on an investment of $1,000 invested at the beginning of the period and held for the period January 1, 2018 through June 30, 2018.
Actual Expenses
The first line of the table below provides information about actual account values and actual expenses. You may use the information in this line, together with the amount you invested, to estimate the expenses that you paid over the period. Simply divide your account value by $1,000 (for example, an $8,600 account value divided by $1,000 = 8.6), then multiply the result by the number in the first line under the heading entitled “Expenses Paid During Period” to estimate the expenses you paid on your account during this period.
Hypothetical Example for Comparison Purposes
The second line of the table below provides information about hypothetical account values and hypothetical expenses based on the Fund’s actual expense ratio and an assumed rate of return of 5% per year before expenses, which is not the Fund’s actual return. The hypothetical account values and expenses may not be used to estimate the actual ending account balance or expenses you paid for the period. You may use this information to compare the ongoing costs of investing in this Fund and other funds. To do so, compare this 5% hypothetical example with the 5% hypothetical examples that appear in the shareholder reports of the other funds.
Please note that the expenses shown in the table are meant to highlight your ongoing costs only and do not reflect any transactional costs, such as, the charges assessed by Mutual Shareholder Services, LLC as described above or the expenses of underlying funds. Therefore, the second line of the table is useful in comparing ongoing costs only, and will not help you determine the relative total costs of owning different funds. In addition, if these transactional costs were included, your costs would have been higher.
| Investor Shares | | | | | | |
| | | | | | | Expenses Paid |
| | | Beginning | | Ending | | During the Period* |
| | | Account Value | | Account Value | | January 1, 2018 |
| | | January 1, 2018 | | June 30, 2018 | | to June 30, 2018 |
| |
| Actual | | $1,000.00 | | $1,002.25 | | $6.65 |
| |
| Hypothetical | | $1,000.00 | | $1,018.15 | | $6.71 |
| (5% annual return | | | | | | |
| before expenses) | | | | | | |
| * | Expenses are equal to the Fund’s annualized expense ratio of 1.34% for Investor Shares, multiplied by the average account value over the period, multiplied by 181/365 (to reflect the one-half year period). |
| |
| Class C | | | | | | |
| | | | | | | Expenses Paid |
| | | Beginning | | Ending | | During the Period* |
| | | Account Value | | Account Value | | January 1, 2018 |
| | | January 1, 2018 | | June 30, 2018 | | to June 30, 2018 |
| |
| Actual | | $1,000.00 | | $997.60 | | $11.59 |
| |
| Hypothetical | | $1,000.00 | | $1,013.19 | | $11.68 |
| (5% annual return | | | | | | |
| before expenses) | | | | | | |
| * | Expenses are equal to the Fund’s annualized expense ratio of 2.34% for Class C, multiplied by the average account value over the period, multiplied by 181/365 (to reflect the one-half year period). |
| |
2018 Annual Report 6
| Castle Focus Fund |
| | | | Schedule of Investments |
| | | | | | | June 30, 2018 |
| Shares | | Fair Value | | % of Net Assets |
| | | | | | | |
| COMMON STOCKS | | | | | | |
| Arrangement of Transportation of Freight & Cargo | | | | | | |
| 35,200 | Expeditors International of Washington, Inc. | $ | 2,573,120 | | | 1.93 | % |
| Cable & Other Pay Television Services | | | | | | |
| 120,000 | Liberty Global plc - Class C (United Kingdom) * | | 3,193,200 | | | | |
| 26,000 | The Walt Disney Company | | 2,725,060 | | | | |
| | | | 5,918,260 | | | 4.43 | % |
| Electric Services | | | | | | |
| 108,500 | Dominion Energy, Inc. | | 7,397,530 | | | 5.54 | % |
| Fire, Marine & Casualty Insurance | | | | | | |
| 27,000 | Berkshire Hathaway Inc. - Class B * | | 5,039,550 | | | | |
| 80,000 | Loews Corporation | | 3,862,400 | | | | |
| 50,000 | W.R. Berkley Corporation | | 3,620,500 | | | | |
| | | | 12,522,450 | | | 9.38 | % |
| Food and Kindred Products | | | | | | |
| 45,000 | Nestle S.A. ** | | 3,484,350 | | | 2.61 | % |
| Malt Beverages | | | | | | |
| 70,500 | Anheuser-Busch InBev SA/NV ** | | 7,103,580 | | | 5.32 | % |
| Mineral Royalty Traders | | | | | | |
| 59,000 | Royal Gold, Inc. | | 5,477,560 | | | 4.10 | % |
| Miscellaneous Metal Ores | | | | | | |
| 100,000 | Cameco Corporation (Canada) | | 1,125,000 | | | 0.84 | % |
| Newspapers: Publishing or Publishing & Printing | | | | | | |
| 100,000 | News Corporation - Class A | | 1,550,000 | | | 1.16 | % |
| Oil & Gas Field Services, NEC | | | | | | |
| 40,000 | Schlumberger Limited | | 2,681,200 | | | 2.01 | % |
| Operators of Nonresidential Buildings | | | | | | |
| 130,000 | Brookfield Asset Management Inc. - Class A (Canada) | | 5,270,200 | | | 3.95 | % |
| Paints, Varnishes, Lacquers, Enamels & Allied Products | | | | | | |
| 62,500 | Axalta Coating Systems Ltd. * | | 1,894,375 | | | 1.42 | % |
| Pharmaceutical Preparations | | | | | | |
| 190,000 | Sanofi ** | | 7,601,900 | | | 5.69 | % |
| Pipe Lines (No Natural Gas) | | | | | | |
| 250,000 | Enbridge Inc. (Canada) | | 8,922,500 | | | 6.68 | % |
| Real Estate Investment Trusts | | | | | | |
| 15,000 | The Howard Hughes Corporation * | | 1,987,500 | | | 1.49 | % |
| Retail - Drug Stores and Proprietary Stores | | | | | | |
| 75,000 | CVS Health Corporation | | 4,826,250 | | | 3.61 | % |
| Retail - Family Clothing Stores | | | | | | |
| 50,000 | The TJX Companies, Inc. | | 4,759,000 | | | 3.56 | % |
| Services - Business Services, NEC | | | | | | |
| 140,000 | Conduent Incorporated * | | 2,543,800 | | | 1.91 | % |
| State Commercial Banks | | | | | | |
| 85,000 | The Bank of New York Mellon Corporation | | 4,584,050 | | | 3.43 | % |
| Total for Common Stocks (Cost - $78,341,760) | | 92,222,625 | | | 69.06 | % |
| MONEY MARKET FUNDS | | | | | | |
| 41,577,901 | Invesco Short-Term Investments Trust Treasury Portfolio | | | | | | |
| | Institutional Class 1.77% *** | | 41,577,901 | | | 31.14 | % |
| (Cost - $41,577,901) | | | | | | |
| | Total Investments | | 133,800,526 | | | 100.20 | % |
| | (Cost - $119,919,661) | | | | | | |
| | Liabilities in Excess of Other Assets | | (273,235 | ) | | -0.20 | % |
| | Net Assets | $ | 133,527,291 | | | 100.00 | % |
* Non-Income Producing Security.
** ADR - American Depositary Receipt.
*** The yield shown represents the 7-day yield at June 30, 2018. See Note 10 for additional information. |
The accompanying notes are an integral part of these
financial statements. |
2018 Annual Report 7
| Castle Focus Fund | | | |
| |
| Statement of Assets and Liabilities | | | |
| June 30, 2018 | | | |
| | | | |
| Assets: | | | |
| Investment Securities at Fair Value | $ | 133,800,526 | |
| (Cost - $119,919,661) | | | |
| Receivables: | | | |
| Dividends | | 77,841 | |
| Shareholder Purchases | | 8,316 | |
| Total Assets | | 133,886,683 | |
| Liabilities: | | | |
| Payable for Shareholder Redemptions | | 169,363 | |
| Accrued Advisory Fees | | 110,469 | |
| Accrued Service Fees | | 37,560 | |
| Accrued Distribution and Service (12b-1) Fees - Class C | | 42,000 | |
| Total Liabilities | | 359,392 | |
| Net Assets | $ | 133,527,291 | |
| Net Assets Consist of: | | | |
| Paid In Capital | $ | 106,595,249 | |
| Accumulated Undistributed Net Investment Income | | 501,803 | |
| Accumulated Undistributed Realized Gain on Investments - Net | | 12,549,374 | |
| Unrealized Appreciation in Value | | | |
| of Investments Based on Identified Cost - Net | | 13,880,865 | |
| Net Assets | $ | 133,527,291 | |
| |
| Investor Shares | | | |
| Net Assets | $ | 116,677,577 | |
| Shares of beneficial interest outstanding | | | |
| (Unlimited number of shares authorized without par value) | | 5,245,380 | |
| Net Asset Value, Offering Price per Share and Redemption Price per Share | $ | 22.24 | |
| |
| Class C | | | |
| Net Assets | $ | 16,849,714 | |
| Shares of beneficial interest outstanding | | | |
| (Unlimited number of shares authorized without par value) | | 810,153 | |
| Net Asset Value, Offering Price per Share and Redemption Price per Share | $ | 20.80 | |
| |
| Statement of Operations | | | |
| For the fiscal year ended June 30, 2018 | | | |
| Investment Income: | | | |
| Dividends (Net of foreign withholding tax of $240,240) | $ | 3,060,863 | |
| Total Investment Income | | 3,060,863 | |
| Expenses: | | | |
| Advisory Fees | | 1,776,977 | |
| Service Fees | | 1,030,647 | |
| Distribution and Service (12b-1) Fees - Class C | | 177,911 | |
| Total Expenses | | 2,985,535 | |
| Less: Expenses Waived | | (426,475 | ) |
| Net Expenses | | 2,559,060 | |
| Net Investment Income | | 501,803 | |
| Net Realized and Unrealized Gain on Investments: | | | |
| Net Realized Gain on Investments | | 18,393,097 | |
| Net Change in Unrealized Appreciation on Investments | | (11,634,161 | ) |
| Net Realized and Unrealized Gain on Investments | | 6,758,936 | |
| |
| Net Increase in Net Assets from Operations | $ | 7,260,739 | |
The accompanying notes are an integral part of these
financial statements. |
2018 Annual Report 8
| Castle Focus Fund | | | |
| |
| Statement of Operations | | | |
| For the fiscal year ended June 30, 2018 | | | |
| Investment Income: | | | |
| Dividends (Net of foreign withholding tax of $240,240) | $ | 3,060,863 | |
| Total Investment Income | | 3,060,863 | |
| Expenses: | | | |
| Advisory Fees | | 1,776,977 | |
| Service Fees | | 1,030,647 | |
| Distribution and Service (12b-1) Fees - Class C | | 177,911 | |
| Total Expenses | | 2,985,535 | |
| Less: Expenses Waived | | (426,475 | ) |
| Net Expenses | | 2,559,060 | |
| Net Investment Income | | 501,803 | |
| Net Realized and Unrealized Gain on Investments: | | | |
| Net Realized Gain on Investments | | 18,393,097 | |
| Net Change in Unrealized Appreciation on Investments | | (11,634,161 | ) |
| Net Realized and Unrealized Gain on Investments | | 6,758,936 | |
| |
| Net Increase in Net Assets from Operations | $ | 7,260,739 | |
The accompanying notes are an integral part of these
financial statements. |
2018 Annual Report 9
Castle Focus Fund |
| | |
| Statements of Changes in Net Assets | | | | | | | | |
| | | 7/1/2017 | | | | 7/1/2016 | | |
| | | to | | | | to | | |
| | | 6/30/2018 | | | | 6/30/2017 | | |
| From Operations: | | | | | | | | |
| Net Investment Income | $ | 501,803 | | | $ | 103,141 | | |
| Net Realized Gain on Investments | | 18,393,097 | | | | 9,193,497 | | |
| Net Change in Unrealized Appreciation on Investments | | (11,634,161 | ) | | | 5,637,423 | | |
| Net Increase in Net Assets from Operations | | 7,260,739 | | | | 14,934,061 | | |
| From Distributions to Shareholders: | | | | | | | | |
| Net Investment Income | | | | | | | | |
| Investor Shares | | (103,240 | ) | | | (183,022 | ) | |
| Class C | | - | | | | - | | |
| Net Realized Gain from Investment Transactions | | | | | | | | |
| Investor Shares | | (7,963,751 | ) | | | (3,655,589 | ) | |
| Class C | | (853,154 | ) | | | (573,495 | ) | |
| Change in Net Assets from Distributions | | (8,920,145 | ) | | | (4,412,106 | ) | |
| From Capital Share Transactions: | | | | | | | | |
| Proceeds From Sale of Shares | | | | | | | | |
| Investor Shares | | 44,087,008 | | | | 60,827,000 | | |
| Class C | | 434,170 | | | | 2,196,945 | | |
| Shares Issued on Reinvestment of Dividends | | | | | | | | |
| Investor Shares | | 7,271,781 | | | | 3,523,483 | | |
| Class C | | 826,492 | | | | 563,592 | | |
| Cost of Shares Redeemed | | | | | | | | |
| Investor Shares | | (96,386,490 | ) | | | (60,987,469 | ) | |
| Class C | | (4,048,519 | ) | | | (5,280,054 | ) | |
| Net Increase (Decrease) from Shareholder Activity | | (47,815,558 | ) | | | 843,497 | | |
| Net Increase (Decrease) in Net Assets | | (49,474,964 | ) | | | 11,365,452 | | |
| Net Assets at Beginning of Period | | 183,002,255 | | | | 171,636,803 | | |
| Net Assets at End of Period (Including Accumulated Undistributed | $ | 133,527,291 | | | $ | 183,002,255 | | |
| Net Investment Income of $501,803 and $103,240, respectively) | | | | | | | | |
| Share Transactions: | | | | | | | | |
| Issued | | | | | | | | |
| Investor Shares | | 1,963,946 | | | | 2,852,264 | | |
| Class C | | 20,560 | | | | 108,011 | | |
| Reinvested | | | | | | | | |
| Investor Shares | | 329,487 | | | | 170,960 | | |
| Class C | | 39,831 | | | | 28,740 | | |
| Redeemed | | | | | | | | |
| Investor Shares | | (4,360,430 | ) | | | (2,854,113 | ) | |
| Class C | | (191,718 | ) | | | (255,686 | ) | |
| Net Increase (Decrease) in Shares | | (2,198,324 | ) | | | 50,176 | | |
| Shares Outstanding at Beginning of Period | | 8,253,857 | | | | 8,203,681 | | |
| Shares Outstanding at End of Period | | 6,055,533 | | | | 8,253,857 | | |
The accompanying notes are an integral part of these
financial statements. |
2018 Annual Report 10
| Castle Focus Fund |
| |
| Financial Highlights - Investor Shares | | | | | | | | | | | | | | | | | | | | |
| Selected data for a share outstanding | | 7/1/2017 | | | | 7/1/2016 | | | | 7/1/2015 | | | | 7/1/2014 | | | | 7/1/2013 | | |
| throughout the period: | | to | | | | to | | | | to | | | | to | | | | to | | |
| | | 6/30/2018 | | | | 6/30/2017 | | | | 6/30/2016 | | | | 6/30/2015 | | | | 6/30/2014 | | |
| Net Asset Value - | | | | | | | | | | | | | | | | | | | | |
| Beginning of Period | $ | 22.31 | | | $ | 21.04 | | | $ | 19.78 | | | $ | 21.47 | | | $ | 18.76 | | |
| Net Investment Income (a) | | 0.08 | | | | 0.04 | | | | 0.04 | | | | 0.07 | | | | 0.02 | | |
| Net Gains or Losses on Investments | | | | | | | | | | | | | | | | | | | | |
| (realized and unrealized) | | 0.89 | | | | 1.79 | | | | 1.45 | | | | (0.17 | ) | | | 3.15 | | |
| Total from Investment Operations | | 0.97 | | | | 1.83 | | | | 1.49 | | | | (0.10 | ) | | | 3.17 | | |
| Proceeds from Redemption Fees | | - | | | | - | | | | - | | + | | - | | + | | - | | + |
| Distributions (From Net Investment Income) | | (0.01 | ) | | | (0.03 | ) | | | (0.05 | ) | | | (0.01 | ) | | | (0.05 | ) | |
| Distributions (From Capital Gains) | | (1.03 | ) | | | (0.53 | ) | | | (0.18 | ) | | | (1.58 | ) | | | (0.41 | ) | |
| Total Distributions | | (1.04 | ) | | | (0.56 | ) | | | (0.23 | ) | | | (1.59 | ) | | | (0.46 | ) | |
| Net Asset Value - | | | | | | | | | | | | | | | | | | | | |
| End of Period | $ | 22.24 | | | $ | 22.31 | | | $ | 21.04 | | | $ | 19.78 | | | $ | 21.47 | | |
| Total Return (b) | | 4.40% | | | | 8.92% | | | | 7.65% | | | | (0.53)% | | | | 17.17% | | |
| Ratios/Supplemental Data | | | | | | | | | | | | | | | | | | | | |
| Net Assets - End of Period (Thousands) | $ | 116,678 | | | $ | 163,123 | | | $ | 150,304 | | | $ | 141,283 | | | $ | 113,338 | | |
| Before Waiver | | | | | | | | | | | | | | | | | | | | |
| Ratio of Expenses to Average Net Assets | | 1.58% | | | | 1.58% | | | | 1.58% | | | | 1.58% | | | | 1.58% | | |
| Ratio of Net Investment Income (Loss) to | | | | | | | | | | | | | | | | | | | | |
| Average Net Assets | | 0.14% | | | | -0.06% | | | | -0.02% | | | | 0.08% | | | | -0.13% | | |
| After Waiver | | | | | | | | | | | | | | | | | | | | |
| Ratio of Expenses to Average Net Assets | | 1.34% | | | | 1.34% | | | | 1.34% | | | | 1.34% | | | | 1.34% | | |
| Ratio of Net Investment Income to Average | | | | | | | | | | | | | | | | | | | | |
| Net Assets | | 0.38% | | | | 0.18% | | | | 0.22% | | | | 0.32% | | | | 0.11% | | |
| Portfolio Turnover Rate | | 38.71% | | | | 47.50% | | | | 37.88% | | | | 34.57% | | | | 50.60% | | |
| Financial Highlights - Class C | | | | | | | | | | | | | | | | | | | | |
| Selected data for a share outstanding | | 7/1/2017 | | | | 7/1/2016 | | | | 7/1/2015 | | | | 7/1/2014 | | | | 7/1/2013 | | |
| throughout the period: | | to | | | | to | | | | to | | | | to | | | | to | | |
| | | 6/30/2018 | | | | 6/30/2017 | | | | 6/30/2016 | | | | 6/30/2015 | | | | 6/30/2014 | | |
| Net Asset Value - | | | | | | | | | | | | | | | | | | | | |
| Beginning of Period | $ | 21.11 | | | $ | 20.12 | | | $ | 19.06 | | | $ | 20.94 | | | $ | 18.44 | | |
| Net Investment Loss (a) | | (0.12 | ) | | | (0.17 | ) | | | (0.13 | ) | | | (0.13 | ) | | | (0.17 | ) | |
| Net Gains or Losses on Investments | | | | | | | | | | | | | | | | | | | | |
| (realized and unrealized) | | 0.84 | | | | 1.69 | | | | 1.37 | | | | (0.17 | ) | | | 3.08 | | |
| Total from Investment Operations | | 0.72 | | | | 1.52 | | | | 1.24 | | | | (0.30 | ) | | | 2.91 | | |
| Proceeds from Redemption Fees | | - | | | | - | | | | - | | + | | - | | + | | - | | + |
| Distributions (From Net Investment Income) | | - | | | | - | | | | - | | | | - | | | | - | | |
| Distributions (From Capital Gains) | | (1.03 | ) | | | (0.53 | ) | | | (0.18 | ) | | | (1.58 | ) | | | (0.41 | ) | |
| Total Distributions | | (1.03 | ) | | | (0.53 | ) | | | (0.18 | ) | | | (1.58 | ) | | | (0.41 | ) | |
| Net Asset Value - | | | | | | | | | | | | | | | | | | | | |
| End of Period | $ | 20.80 | | | $ | 21.11 | | | $ | 20.12 | | | $ | 19.06 | | | $ | 20.94 | | |
| Total Return (b) | | 3.43% | | | | 7.78% | | | | 6.61% | | | | (1.52)% | | | | 15.99% | | |
| Ratios/Supplemental Data | | | | | | | | | | | | | | | | | | | | |
| Net Assets - End of Period (Thousands) | $ | 16,850 | | | $ | 19,879 | | | $ | 21,332 | | | $ | 13,983 | | | $ | 8,801 | | |
| Before Waiver | | | | | | | | | | | | | | | | | | | | |
| Ratio of Expenses to Average Net Assets | | 2.58% | | | | 2.58% | | | | 2.58% | | | | 2.58% | | | | 2.58% | | |
| Ratio of Net Investment Loss to Average | | | | | | | | | | | | | | | | | | | | |
| Net Assets | | -0.80% | | | | -1.06% | | | | -0.95% | | | | -0.89% | | | | -1.13% | | |
| After Waiver | | | | | | | | | | | | | | | | | | | | |
| Ratio of Expenses to Average Net Assets | | 2.34% | | | | 2.34% | | | | 2.34% | | | | 2.34% | | | | 2.34% | | |
| Ratio of Net Investment Loss to Average | | | | | | | | | | | | | | | | | | | | |
| Net Assets | | -0.56% | | | | -0.82% | | | | -0.71% | | | | -0.65% | | | | -0.89% | | |
| Portfolio Turnover Rate | | 38.71% | | | | 47.50% | | | | 37.88% | | | | 34.57% | | | | 50.60% | | |
+ Amount was less than $0.005 per share.
(a) Based on Average Shares Outstanding.
(b) Total return represents the rate that the investor would have earned or lost on an investment in the Fund
assuming reinvestment of dividends. |
The accompanying notes are an integral part of these
financial statements. |
2018 Annual Report 11
NOTES TO THE FINANCIAL STATEMENTS
CASTLE FOCUS FUND
June 30, 2018
1.) ORGANIZATION
Castle Focus Fund (the “Fund”) was organized as a non-diversified series of the PFS Funds (the “Trust”) on June 28, 2010. The Trust was established under the laws of Massachusetts by an Agreement and Declaration of Trust dated January 13, 2000, which was amended and restated January 20, 2011. The Trust is registered as an open-end investment company under the Investment Company Act of 1940, as amended (the “1940 Act”). The Trust may offer an unlimited number of shares of beneficial interest in a number of separate series, each series representing a distinct fund with its own investment objectives and policies. As of June 30, 2018, there were six series authorized by the Trust. The Fund commenced operations on July 1, 2010. The Fund currently offers Investor Shares and Class C Shares. The classes differ principally in their respective distribution expenses and service arrangements as well as their respective sales charge structure. All classes of shares have identical rights to earnings, assets and voting privileges, except for class specific expenses and exclusive rights to vote on matters affecting only individual classes. Investor Shares of the Fund are sold at the net asset value (the “NAV”) without an initial sales charge and are not subject to 12b-1 distribution fees. The Fund’s investment objective is to seek long-term capital appreciation. The Investment Adviser to the Fund is Castle Investment Management, LLC (the “Adviser”) and the Sub-Adviser to the Fund is St. James Investment Company, LLC (the “Sub-Adviser”). Significant accounting policies of the Fund are presented below.
2.) SIGNIFICANT ACCOUNTING POLICIES
The Fund is an investment company and accordingly follows the investment company accounting and reporting guidance of the Financial Accounting Standards Board (“FASB”) Accounting Standards Codification Topic 946 Financial Services - Investment Companies. The financial statements are prepared in conformity with accounting principles generally accepted in the United States of America (“GAAP”). The Fund follows the significant accounting policies described in this section.
SECURITY VALUATION:
All investments in securities are recorded at their estimated fair value, as described in Note 3.
SHARE VALUATION:
The NAV is generally calculated as of the close of trading on the New York Stock Exchange (the “Exchange”) (normally 4:00 p.m. Eastern time) every day the Exchange is open. The NAV is calculated by taking the total value of the Fund’s assets, subtracting its liabilities, and then dividing by the total number of shares outstanding, rounded to the nearest cent. The offering price and redemption price per share is equal to the net asset value per share.
FEDERAL INCOME TAXES:
The Fund’s policy is to continue to comply with the requirements of the Internal Revenue Code that are applicable to regulated investment companies and to distribute all of its taxable income to shareholders. Therefore, no federal income tax provision is required. It is the Fund’s policy to distribute annually, prior to the end of the calendar year, dividends sufficient to satisfy excise tax requirements of the Internal Revenue Code. This Internal Revenue Code requirement may cause an excess of distributions over the book year-end accumulated income. In addition, it is the Fund’s policy to distribute annually, after the end of the fiscal year, any remaining net investment income and net realized capital gains.
The Fund recognizes the tax benefits of certain tax positions only where the position is “more likely than not” to be sustained assuming examination by tax authorities. Management has analyzed the Fund’s tax positions, and has concluded that no liability for unrecognized tax benefits should be recorded related to uncertain tax positions taken on returns filed for open tax years. The Fund identifies its major tax jurisdictions as U.S. Federal tax authorities; however, the Fund is not aware of any tax positions for which it is reasonably possible that the total amounts of unrecognized tax benefits will change materially in the next twelve months. The Fund recognizes interest and penalties, if any, related to unrecognized tax benefits as income tax expense in the Statement of Operations. During the fiscal year ended June 30, 2018, the Fund did not incur any interest or penalties.
DISTRIBUTIONS TO SHAREHOLDERS:
Distributions to shareholders, which are determined in accordance with income tax regulations, are recorded on the ex-dividend date.
2018 Annual Report 12
Notes to the Financial Statements - continued
The treatment for financial reporting purposes of distributions made to shareholders during the period from net investment income or net realized capital gains may differ from their ultimate treatment for federal income tax purposes. These differences are caused primarily by differences in the timing of the recognition of certain components of income, expense, or realized capital gain for federal income tax purposes. Where such differences are permanent in nature, they are reclassified in the components of the net assets based on their ultimate characterization for federal income tax purposes. Any such reclassifications will have no effect on net assets, results of operations, or net asset value per share of the Fund. For the fiscal year ended June 30, 2018, $4,521,820 was reclassified from accumulated undistributed realized gains on investments – net to paid in capital as a result of the use of equalization for tax purposes.
USE OF ESTIMATES:
The financial statements are prepared in accordance with GAAP, which requires management to make estimates and assumptions that affect the reported amounts of assets and liabilities and disclosure of contingent assets and liabilities at the date of the financial statements and the reported amounts of increases and decreases in net assets from operations during the reporting period. Actual results could differ from those estimates.
OTHER:
The Fund records security transactions based on a trade date. Dividend income is recognized on the ex-dividend date, and interest income, if any, is recognized on an accrual basis. The Fund uses the specific identification method in computing gain or loss on the sale of investment securities. Withholding taxes on foreign dividends have been provided for in accordance with the Fund’s understanding of the applicable country’s tax rules and rates.
ALLOCATION OF EXPENSES:
Expenses incurred by the Trust that don’t relate to a specific fund of the Trust are allocated pro-rata to the funds based on the total number of funds in the Trust at the time the expense was incurred or by another appropriate method. Class specific expenses are borne by each specific class. Income, non-class specific expenses, and realized and unrealized gains/losses are allocated to the respective classes based on the basis of relative net assets.
3.) SECURITIES VALUATIONS
The Fund utilizes various methods to measure the fair value of most of its investments on a recurring basis. GAAP establishes a hierarchy that prioritizes inputs to valuation methods. The three levels of inputs are:
Level 1 - Unadjusted quoted prices in active markets for identical assets or liabilities that the Fund has the ability to access.
Level 2 - Inputs other than quoted prices included in level 1 that are observable for the asset or liability, either directly or indirectly. These inputs may include quoted prices for the identical instrument on an inactive market, prices for similar instruments, interest rates, prepayment speeds, credit risk, yield curves, default rates and similar data.
Level 3 - Unobservable inputs for the asset or liability, to the extent relevant observable inputs are not available, representing the Fund’s own assumptions about the assumptions a market participant would use in valuing the asset or liability, and would be based on the best information available.
The availability of observable inputs can vary from security to security and is affected by a wide variety of factors, including, for example, the type of security, whether the security is new and not yet established in the marketplace, the liquidity of markets, and other characteristics particular to the security. To the extent that valuation is based on models or inputs that are less observable or unobservable in the market, the determination of fair value requires more judgment. Accordingly, the degree of judgment exercised in determining fair value is greatest for instruments categorized in level 3.
The inputs used to measure fair value may fall into different levels of the fair value hierarchy. In such cases, for disclosure purposes, the level in the fair value hierarchy within which the fair value measurement falls in its entirety, is determined based on the lowest level input that is significant to the fair value measurement in its entirety.
2018 Annual Report 13
Notes to the Financial Statements - continued
FAIR VALUE MEASUREMENTS
A description of the valuation techniques applied to the Fund’s major categories of assets and liabilities measured at fair value on a recurring basis follows.
Equity securities (common stocks, including ADRs). Equity securities generally are valued by using market quotations, but may be valued on the basis of prices furnished by a pricing service when the Adviser believes such prices accurately reflect the fair value of such securities. Securities that are traded on any stock exchange or on the NASDAQ over-the-counter market are generally valued by the pricing service at the last quoted sale price. Lacking a last sale price, an equity security is generally valued by the pricing service at its last bid price. Generally, if the security is traded in an active market and is valued at the last sale price, the security is categorized as a level 1 security. When market quotations are not readily available, when the Adviser determines that the market quotation or the price provided by the pricing service does not accurately reflect the current fair value, or when restricted securities are being valued, such securities are valued as determined in good faith by the Adviser, subject to review of the Board of Trustees (the “Trustees” or the “Board”) and are categorized in level 2 or level 3, when appropriate.
Money market funds. Money market funds are valued at net asset value and are classified in level 1 of the fair value hierarchy.
In accordance with the Trust’s good faith pricing guidelines, the Adviser is required to consider all appropriate factors relevant to the value of securities for which it has determined other pricing sources are not available or reliable as described above. There is no single standard for determining fair value, since fair value depends upon the circumstances of each individual case. As a general principle, the current fair value of an issue of securities being valued by the Adviser would appear to be the amount which the owner might reasonably expect to receive for them upon their current sale. Methods which are in accordance with this principle may, for example, be based on (i) a multiple of earnings; (ii) a discount from market of a similar freely traded security (including a derivative security or a basket of securities traded on other markets, exchanges or among dealers); or (iii) yield to maturity with respect to debt issues, or a combination of these and other methods.
The following table summarizes the inputs used to value the Fund’s assets measured at fair value as of June 30, 2018:
| Valuation Inputs of Assets | | Level 1 | | Level 2 | | Level 3 | | Total |
| Common Stocks (including ADRs) | | $ 92,222,625 | | $0 | | $0 | | $ 92,222,625 |
| Money Market Funds | | 41,577,901 | | 0 | | 0 | | 41,577,901 |
| Total | | $ 133,800,526 | | $0 | | $0 | | $ 133,800,526 |
Refer to the Fund’s Schedule of Investments for a listing of securities by industry. The Fund did not hold any Level 3 assets during the fiscal year ended June 30, 2018. There were no transfers into or out of the levels during the fiscal year ended June 30, 2018. It is the Fund’s policy to consider transfers into or out of the levels as of the end of the reporting period.
The Fund did not invest in derivative instruments during the fiscal year ended June 30, 2018.
4.) INVESTMENT ADVISORY AGREEMENT AND SERVICES AGREEMENT
The Fund entered into an Investment Management Agreement with Castle Investment Management, LLC as the investment adviser of the Fund. Under the terms of the Investment Management Agreement, the Adviser manages the investment portfolio of the Fund, subject to policies adopted by the Trust’s Trustees. The Adviser, at its own expense and without reimbursement from the Fund, furnishes office space and all necessary office facilities, equipment and executive personnel necessary for managing the assets of the Fund. The Adviser also pays the salaries and fees of all of its officers and employees that serve as officers of the Trust. For its services, the Adviser receives a fee of 1.00% per year of the average daily net assets of the Fund. The Sub-Adviser of the Fund has responsibility for providing investment ideas and recommendations for the assets of the Fund, subject to the supervision of the Adviser. As full compensation for all services rendered, including investment ideas and recommendations for the assets of the Fund, the Adviser pays the Sub-Adviser a sub-advisor fee. For the fiscal year ended June 30, 2018, the Adviser received management fees totaling $1,776,977. At June 30, 2018, the Fund owed $110,469 to the Adviser.
The Fund also has a Services Agreement with the Adviser (the “Services Agreement”), under which the Fund pays the Adviser. Under the Services Agreement, the Adviser shall supervise the Fund’s business affairs and is obligated to pay the operating expenses of the Fund excluding management fees, 12b-1 fees, brokerage fees and commissions, taxes, borrowing costs (such as (a) interest and
2018 Annual Report 14
Notes to the Financial Statements - continued
(b) dividend expenses on securities sold short), ADR fees, the cost of acquired funds and extraordinary expenses. In addition, to the extent not otherwise provided by other parties under agreements with the Trust, the Adviser shall supply: (i) non-investment related statistical and research data; (ii) the services of a Chief Compliance Officer for the Trust; and (iii) executive and administrative services. The Adviser shall also assist with and/or supervise the preparation by the Trust’s administrator, transfer agent, and/or auditors of: (i) tax returns; (ii) reports to shareholders of the Fund; (iii) reports to, and filings with, the Securities and Exchange Commission, state securities commissions and Blue Sky authorities including preliminary and definitive proxy materials and post-effective amendments to the Trust’s registration statement; and (iv) necessary materials for meetings of the Trust’s Board of Trustees. The Adviser shall provide personnel to serve as officers of the Trust if so elected by the Trustees. Executive and administrative services include, but are not limited to, the coordination of all third parties furnishing services to the Fund, review of the books and records of the Fund maintained by such third parties, and the review and submission to the officers of the Fund for their approval, of invoices or other requests for payment of Fund expenses; and such other action with respect to the Fund as may be necessary in the opinion of the Adviser to perform its duties. For its services, the Adviser receives a service fee equal to 0.58% of the average daily net assets of the Fund. For the fiscal year ended June 30, 2018, the Adviser earned service fees of $1,030,647. At June 30, 2018, the Fund owed the Adviser service fees of $37,560. Beginning November 1, 2013 the Adviser has contractually agreed to waive Services Agreement fees by 0.24% of its average daily net assets. The Services Agreement fee waiver will automatically terminate on October 31, 2018 unless it is renewed by the Adviser. The Adviser may not terminate the fee waiver before October 31, 2018. From October 29, 2012 through October 31, 2013, the Adviser had contractually agreed to waive Service Agreement fees by 0.23% . There are no recoupment provisions for the waivers described above. A total of $426,475 was waived for the fiscal year ended June 30, 2018.
5.) DISTRIBUTION AND SHAREHOLDER SERVICING PLAN
The Fund has adopted a Distribution Plan in accordance with Rule 12b-1 under the 1940 Act (the “Plan”) with respect to the Class C Shares of the Fund. Pursuant to the Distribution Plan, the Fund compensates the Distributor for services rendered and expenses borne in connection with activities primarily intended to result in the sale of the Fund’s Class C Shares. This Plan provides that the Fund will pay the annual rate of 1.00% of the average daily net assets of the Fund’s Class C Shares for activities primarily intended to result in the sale of those shares. These activities include payment to entities for providing distribution and shareholder servicing with respect to the Fund’s Class C Shares. The 1.00% for the Class C Shares is comprised of a 0.25% service fee and a 0.75% distribution fee. The Fund incurred distribution and service (12b-1) fees of $177,911 for Class C Shares during the fiscal year ended June 30, 2018. At June 30, 2018, the Fund owed distribution and service (12b-1) fees of $42,000 for Class C Shares.
6.) RELATED PARTY TRANSACTIONS
Jeffrey R. Provence of Premier Fund Solutions, Inc. (the “Administrator”) also serves as a trustee/officer of the Fund. This individual receives benefits from the Administrator resulting from administration fees paid to the Administrator by the Adviser.
The Trustees who are not interested persons of the Fund were paid $1,500 each, for a total of $4,500, in Trustees’ fees for the fiscal year ended June 30, 2018 by the Adviser.
7.) INVESTMENT TRANSACTIONS
For the fiscal year ended June 30, 2018, purchases and sales of investment securities other than U.S. Government obligations and short-term investments aggregated $45,003,846 and $83,228,563, respectively. Purchases and sales of U.S. Government obligations aggregated $0 and $0, respectively.
8.) CONTROL OWNERSHIP
The beneficial ownership, either directly or indirectly, of more than 25% of the voting securities of a fund creates a presumption of control of the fund, under Section 2(a)(9) of the Investment Company Act of 1940. As of June 30, 2018, RBC Capital Markets, LLC, held for the benefit of its customers, in the aggregate, 28.33% of Fund shares. The Trust does not know whether the foregoing entity or any of the underlying beneficial holders owned or controlled 25% or more of the voting securities of the Fund. Accordingly, it is not known whether RBC Capital Markets, LLC or any of the underlying accounts could be deemed to control the Fund.
2018 Annual Report 15
Notes to the Financial Statements - continued
9.) TAX MATTERS
For Federal income tax purposes, the cost of securities owned at June 30, 2018 was $119,974,239.
At June 30, 2018, the composition of gross unrealized appreciation (the excess of value over tax cost) and depreciation (the excess of tax cost over value) of investments on a tax basis was as follows:
| | Appreciation | | (Depreciation) | | Net Appreciation (Depreciation) |
| | $16,394,937 | | ($2,568,650) | | $13,826,287 |
Investor Shares paid a distribution on December 14, 2017 to the shareholders of record on December 13, 2017 of which $0.013361 per share was paid from net investment income, $0.888616 per share was paid from long-term capital gain and $0.142023 per share was paid from short-term capital gain.
The tax character of Investor Shares distributions was as follows:
| | | Fiscal Year Ended | | Fiscal Year Ended |
| | | June 30, 2018 | | June 30, 2017 |
| Ordinary Income | | $ 1,200,652 | | $ 906,835 |
| Long-term Capital Gain | | 6,866,339 | | 2,931,776 |
| | | $ 8,066,991 | | $ 3,838,611 |
Class C also paid distributions on December 14, 2017 to the shareholders of record on December 13, 2017 of which $0.888616 per share was paid from long-term capital gain and $0.142023 per share was paid from short-term capital gain.
The tax character of Class C distributions was as follows:
| | | Fiscal Year Ended | | Fiscal Year Ended |
| | | June 30, 2018 | | June 30, 2017 |
| Ordinary Income | | $ 117,565 | | $ 113,553 |
| Long-term Capital Gain | | 735,589 | | 459,942 |
| | | $ 853,154 | | $ 573,495 |
As of June 30, 2018, the components of distributable earnings on a tax basis were as follows:
| Undistributed ordinary income | | $ 3,212,327 |
| Undistributed long-term capital gain/(accumulated losses) | | 9,893,428 |
| Unrealized appreciation/(depreciation) - net | | 13,826,287 |
| | | $ 26,932,042 |
Book to tax differences are primarily attributable to the tax deferral of wash sales.
10.) DEFENSIVE POSITIONS
The Fund may hold all or a portion of its assets in cash or cash-equivalents like money market funds, certificates of deposit, short-term debt obligations, and repurchase agreements, either due to pending investments or when investment opportunities are limited or market conditions are adverse. Under these circumstances, the Fund may not participate in stock market advances or declines to the same extent it would had it remained more fully invested in common stocks. If the Fund invests in shares of a money market fund, shareholders of the Fund generally will be subject to duplicative management and other fees and expenses. As of June 30, 2018, the Fund had 31.14% of the value of its net assets invested in the Invesco Short-Term Investments Trust Treasury Portfolio Institutional Class. Additional information for this money market fund, including its financial statements, is available from the Securities and Exchange Commission’s website at www.sec.gov.
11.) SUBSEQUENT EVENTS
Subsequent events after the date of the Statement of Assets and Liabilities have been evaluated through the date the financial statements were issued. Management has concluded that there is no impact requiring adjustment to or disclosure in the financial statements.
2018 Annual Report 16
REPORT OF INDEPENDENT REGISTERED PUBLIC ACCOUNTING FIRM
To the Shareholders of Castle Focus Fund
and Board of Trustees of PFS Funds
Opinion on the Financial Statements
We have audited the accompanying statement of assets and liabilities, including the schedule of investments, of Castle Focus Fund (the “Fund”), a series of PFS Funds, as of June 30, 2018, and the related statement of operations for the year then ended, the statements of changes in net assets for each of the two years in the period then ended, including the related notes, and the financial highlights for each of the five years in the period then ended (collectively referred to as “the financial statements”). In our opinion, the financial statements present fairly, in all material respects, the financial position of the Fund as of June 30, 2018, the results of its operations for the year then ended, the changes in its net assets for each of the two years in the period then ended, and the financial highlights for each of the five years in the period then ended, in conformity with accounting principles generally accepted in the United States of America.
Basis for Opinion
These financial statements are the responsibility of the Fund’s management. Our responsibility is to express an opinion on the Fund’s financial statements based on our audits. We are a public accounting firm registered with the Public Company Accounting Oversight Board (United States) (“PCAOB”) and are required to be independent with respect to the Fund in accordance with the U.S. federal securities laws and the applicable rules and regulations of the Securities and Exchange Commission and the PCAOB.
We conducted our audits in accordance with the standards of the PCAOB. Those standards require that we plan and perform the audit to obtain reasonable assurance about whether the financial statements are free of material misstatement, whether due to error or fraud.
Our audits included performing procedures to assess the risks of material misstatement of the financial statements, whether due to error or fraud, and performing procedures that respond to those risks. Such procedures include examining, on a test basis, evidence regarding the amounts and disclosures in the financial statements and confirmation of securities owned as of June 30, 2018, by correspondence with the custodian. Our audits also included evaluating the accounting principles used and significant estimates made by management, as well as evaluating the overall presentation of the financial statements. We believe that our audits provide a reasonable basis for our opinion.
We have served as the Fund’s auditor since 2010.

COHEN & COMPANY, LTD.
Cleveland, Ohio
August 23, 2018
2018 Annual Report 17
ADDITIONAL INFORMATION
June 30, 2018
(Unaudited)
APPROVAL OF CONTINUATION OF THE MANAGEMENT AGREEMENT BETWEEN THE TRUST AND CASTLE INVESTMENT MANAGEMENT, LLC ON BEHALF OF THE CASTLE FOCUS FUND AND THE INVESTMENT SUB-ADVISORY AGREEMENT BETWEEN CASTLE INVESTMENT MANAGEMENT, LLC AND ST. JAMES INVESTMENT COMPANY, LLC ON BEHALF OF THE CASTLE FOCUS FUND
On June 21, 2018, the Board of Trustees (the “Board” or the “Trustees”) considered the renewal of the Management Agreement between the Trust and Castle Investment Management, LLC (“Castle”) on behalf of the Castle Focus Fund and the Investment Sub-Advisory Agreement between Castle and St. James Investment Company, LLC (“St. James”) on behalf of the Castle Focus Fund (the “Agreements”). In approving the Agreements, the Board considered and evaluated the following factors: (i) the nature, extent, and quality of the services provided by Castle and St. James to the Castle Focus Fund; (ii) the investment performance of the Castle Focus Fund, Castle and St. James; (iii) the cost of the services to be provided and the profits to be realized by Castle and St. James and their respective affiliates from the relationship with the Castle Focus Fund; (iv) the extent to which economies of scale will be realized as the Castle Focus Fund grows and whether the fee levels reflect these economies of scale to the benefit of its shareholders; and (v) Castle’s and St. James’ practices regarding possible conflicts of interest.
In assessing these factors and reaching its decisions, the Board took into consideration information furnished for its review and consideration throughout the year at regular Board meetings, as well as information specifically prepared or presented in connection with the annual renewal process, including information presented at the Meeting. The Board reflected on the presentations by representatives of Castle earlier in the Meeting. The Board requested and was provided with information and reports relevant to the annual renewal of the Agreements, including (i) reports regarding the services and support provided to the Castle Focus Fund and its shareholders by Castle and St. James; (ii) assessments of the investment performance of the Castle Focus Fund by personnel of Castle; (iii) commentary on the reasons for the performance; (iv) presentations addressing Castle’s and St. James’ investment philosophy, investment strategy, personnel, and operations; (v) compliance and audit reports concerning the Castle Focus Fund, Castle, and St. James; (vi) disclosure information contained in the registration statement of the Trust and the Forms ADV of Castle and St. James; and (vii) a memorandum from Counsel that summarized the fiduciary duties and responsibilities of the Board in reviewing and approving the Agreements, including the material factors set forth above and the types of information included in each factor that should be considered by the Board in order to make an informed decision. The Board also requested and received various informational materials including, without limitation: (i) documents containing information about Castle and St. James, including financial information, a description of personnel and the services provided to the Castle Focus Fund, information on investment advice, performance, summaries of Castle Focus Fund expenses, compliance program, current legal matters, and other general information; (ii) comparative expense and performance information for other mutual funds with strategies similar to the Castle Focus Fund; and (iii) benefits to be realized by Castle and St. James from their relationship with the Castle Focus Fund. The Board did not identify any particular information that was most relevant to its consideration to approve the Agreements, and each Trustee may have afforded different weight to the various factors.
1. Nature, Extent, and Quality of the Services Provided by Castle and St. James
In considering the nature, extent, and quality of the services provided by Castle and St. James, the Trustees reviewed the responsibilities of Castle and St. James under the Agreements. The Trustees reviewed the services being provided by Castle and St. James including, without limitation: the quality of investment advisory services (including research and recommendations with respect to portfolio securities); the process for formulating investment recommendations and assuring compliance with the Castle Focus Fund’s investment objective, strategies and limitations, and regulatory requirements. The Trustees reflected on their discussions with representatives from Castle and St. James throughout the past year. The Trustees considered the coordination of services for the Castle Focus
2018 Annual Report 18
Additional Information (Unaudited) - continued
Fund among Castle and the service providers (including St. James) and Castle’s interactions with the Independent Trustees; and the efforts of Castle to promote the Castle Focus Fund and grow its assets. The Trustees noted Castle’s and St. James’ continuity of, and commitment to retain, qualified personnel and to maintain and enhance its resources and systems and the continued cooperation with the Independent Trustees and Counsel for the Castle Focus Fund. The Trustees evaluated Castle’s and St. James’ personnel, including the education and experience of their personnel. The Trustees reflected on discussions with the representatives from Castle during the Meeting. After reviewing the foregoing information and further information in the materials provided by Castle and St. James, the Board concluded that, considering all the facts and circumstances, the nature, extent, and quality of the services provided by Castle and St. James were satisfactory and adequate for the Castle Focus Fund.
2. Investment Performance of the Castle Focus Fund, Castle, and St. James
In considering the investment performance of the Castle Focus Fund, Castle and St. James, the Trustees compared the short-term and longer-term performance of the Castle Focus Fund with the performance of funds with similar objectives managed by other investment advisers, as well as with aggregated peer group data. The Trustees noted that Castle did not have any clients other than the Castle Focus Fund. The Trustees discussed the performance of the Castle Focus Fund compared to other accounts managed by St. James, noting that St. James represented the performance to be within its typical dispersion and any differences in performance can be primarily attributed to the differences in fees charged to the respective accounts. As to the performance of the Castle Focus Fund, the Board was provided with a report that included information regarding the performance of the Castle Focus Fund compared to a group of funds of similar size, style and objective, categorized by Morningstar (the “Peer Group”), as well as the Fund’s Morningstar category of US Fund Large Blend (the “Category”). The Trustees noted that for the three-month period ended March 31, 2018, the Castle Focus Fund underperformed the S&P 500, its benchmark, and its Category. The Trustees noted that for the 1-year, 3-year, and 5-year periods ended March 31, 2018, the Castle Focus Fund underperformed relative to the Category, the Peer Group and benchmark. They also noted that the Castle Focus Fund has generally maintained a large cash position, which has detracted from performance during periods of general market appreciation. It was further noted that the large cash position is consistent with the philosophy of St. James and the investment strategies for the Castle Focus Fund. The Trustees reflected on conversations with representatives of Castle and St. James on the investment philosophy of the Castle Focus Fund being geared toward longer-term performance and that the Castle Focus Fund may not perform as well as its peers in certain types of markets. The Trustees noted that St. James actively manages the Castle Focus Fund to maintain lower risk levels as compared to other funds in its Category and Peer Group. They noted that this risk management component makes for a more difficult comparison to its Peer Group and Category during periods of positive market performance. The Trustees noted that differences in performance for the Castle Focus Fund’s Class C shares versus those of the Investor Class shares were attributable to different fee structures. After reviewing and discussing the investment performance of the Castle Focus Fund further, Castle’s and St. James’ experience managing the Castle Focus Fund, their historical investment performance, and other relevant factors, the Board concluded, considering all the facts and circumstances, that the investment performance of the Castle Focus Fund, Castle, and St. James was satisfactory.
3. Costs of the Services to be Provided and Profits to be Realized by Castle and St. James
In considering the costs of the services to be provided and profits to be realized by Castle and St. James from the relationship with the Castle Focus Fund, the Trustees considered: (1) Castle’s and St. James’ financial condition and the level of commitment to the Castle Focus Fund and Castle by the principals of Castle; (2) the asset level of the Castle Focus Fund; (3) the overall expenses of the Castle Focus Fund; and (4) the nature and frequency of advisory and sub-advisory fee payments. The Trustees reviewed the information provided by Castle and St. James regarding their respective profits associated with managing the Castle Focus Fund. The Trustees also considered potential benefits for Castle and St. James in managing the Castle Focus Fund. The Trustees then compared the fees and expenses of the Castle Focus Fund (including the management fee) to other comparable mutual funds. The Trustees reviewed the fees under the Agreements compared to the Peer Group and Category, noting that the net expense ratio for Investor Class Shares was above the Peer
2018 Annual Report 19
Additional Information (Unaudited) - continued
Group and Category averages. It was noted that the Class C shares expense ratio was at the high end of the Category range. The Trustees also considered the fees charged by St. James relative to the fees it charged to their other accounts, noting that the fees charged to the Castle Focus Fund were less than those charged to the other accounts. The Trustees also reviewed the management fee as compared to the Peer Group and Category average and noted that the management fee was within the range of management fees of the Peer Group and at the high end of the Category. The Trustees also received information on the sub-advisory portion of the fee as compared to other sub-advised funds in the Category and noted that the sub-advisory fee was within the range of fees charged by these other sub-advisers. The Trustees recognized that Castle instituted a waiver of a portion of its fees under the Services Agreement with the Trust, effective through October 31, 2018, which is recognized in the current net expense ratio. The Trustees also noted the intention expressed at the Meeting of the principals of Castle to keep the waiver in place through October 31, 2019. The Trustees considered that under the contractual arrangements with Castle, it was required to pay most of the Castle Focus Fund’s operating expenses out of its assets. Based on the foregoing, the Board concluded that the fees to be paid to Castle (and in turn Castle’s payment to St. James) and the profits to be realized by Castle and St. James, in light of all the facts and circumstances, were fair and reasonable in relation to the nature and quality of the services provided by Castle and St. James.
4. Economies of Scale
The Trustees next considered the impact of economies of scale on the Castle Focus Fund’s size and whether advisory fee levels reflect those economies of scale for the benefit of the Castle Focus Fund’s investors. The Trustees considered that while the management fee remained the same at all asset levels, the Castle Focus Fund’s shareholders had experienced benefits from the fact that Castle was obligated to pay certain of the Castle Focus Fund’s operating expenses, which had the effect of limiting the overall fees paid by the Castle Focus Fund. The Trustees also recognized, as noted above, that Castle instituted a waiver of a portion of its fees under the Services Agreement until October 31, 2018 and has indicated that it intends to keep the waiver in place through October 31, 2019. The Trustees also noted that the contractual arrangements with the Trust required that Castle effectively cap the expenses of the Castle Focus Fund, which has a similar effect as a breakpoint, although the Trustees noted that shareholders would benefit without the need for the Castle Focus Fund’s assets to reach or be maintained at certain asset thresholds. The Trustees also noted that the fees payable to St. James were paid from the amounts paid to Castle and not paid directly by Castle Focus Fund shareholders. In light of its ongoing consideration of the Castle Focus Fund’s asset levels, expectations for growth in the Castle Focus Fund, and fee levels, the Board determined that the Castle Focus Fund’s fee arrangements, in light of all the facts and circumstances, were fair and reasonable in relation to the nature and quality of the services provided by Castle and St. James.
5. Possible Conflicts of Interest and Benefits to Castle and St. James
In considering Castle’s and St. James’ practices regarding conflicts of interest, the Trustees evaluated the potential for conflicts of interest and considered such matters as the experience and ability of the advisory personnel assigned to the Castle Focus Fund; the basis of decisions to buy or sell securities for the Castle Focus Fund; and the substance and administration of Castle’s and St. James’ respective codes of ethics. The Trustees also considered disclosure in the registration statement of the Trust related to Castle’s and St. James’ potential conflicts of interest. The Trustees noted that Castle has no other clients other than the Castle Focus Fund and that it oversees St. James’ compliance with the Trust’s code of ethics. The Trustees also considered St. James’ practices regarding brokerage and portfolio transactions, including particularly St. James’ practice for seeking best execution for the Castle Focus Fund’s portfolio transactions. The Trustees noted that St. James does not utilize soft dollars. The Trustees considered the process by which evaluations are made of the overall reasonableness of commissions paid. The Trustees noted the potential benefit of additional public exposure of St. James based on marketing that is done for the Castle Focus Fund. No other potential benefits (other than the management and service fees paid to Castle and sub-advisory fees paid to St. James) were identified by the Trustees. Based on the foregoing, the Board determined that Castle’s and St. James’ standards and practices relating to the identification and mitigation of possible conflicts of interest were satisfactory.
2018 Annual Report 20
Additional Information (Unaudited) - continued
Next, the Independent Trustees met in executive session along with Counsel to discuss the continuation of the Agreements. The officers of the Trust and others present were excused during this discussion.
After further review, discussion, and determination that the best interests of the Castle Focus Fund’s shareholders were served by the renewal of the Agreements.
2018 Annual Report 21
Trustees and Officers
(Unaudited)
The Board of Trustees supervises the business activities of the Trust. The names of the Trustees and executive officers of the Trust are shown below. For more information regarding the Trustees, please refer to the Statement of Additional Information, which is available upon request by calling 1-877-743-7820. Each Trustee serves until the Trustee sooner dies, resigns, retires, or is removed.
The Trustees and Officers of the Trust and their principal business activities during the past five years are:
Interested Trustees and Officers
| | | | | Number of | |
| | | | Principal | Portfolios In | Other |
| Name, | Position(s) | Term of Office | Occupation(s) | Fund | Directorships |
| Address(1), | Held With | and Length of | During | Complex | Held By |
| and Year of Birth | the Trust | Time Served | Past 5 Years | Overseen By | Trustee |
| | | | | Trustee | |
| |
| Ross C. Provence, | President | Indefinite Term; | General Partner and Portfolio | N/A | N/A |
| Year of Birth: 1938 | | Since 2000 | Manager for Value Trend Capital | | |
| | | | Management, LP (1995 to current). | | |
| | | | Estate planning attorney (1963 to | | |
| current). |
| |
| Jeffrey R. Provence(2), | Trustee, | Indefinite Term; | CEO, Premier Fund Solutions, Inc. | 6 | Blue Chip |
| Year of Birth: 1969 | Secretary | Since 2000 | (2001 to current). General Partner | | Investor Funds |
| | and | | and Portfolio Manager for Value | | Meeder Funds |
| | Treasurer | | Trend Capital Management, LP | | |
| | | | (1995 to current). | | |
| |
| Julian G. Winters, | Chief | Chief | Managing Member, Watermark | N/A | N/A |
| Year of Birth: 1968 | Compliance | Compliance | Solutions LLC (investment compli- | | |
| | Officer | Officer Since | ance and consulting) since March | | |
| | | 2010 | 2007. | | |
(1) The address of each trustee and officer is c/o PFS Funds, 1939 Friendship Drive, Suite C, El Cajon, California 92020.
(2) Jeffrey R. Provence is considered an “interested person” as defined in Section 2(a)(19) of the Investment Company Act of 1940 by
virtue of his position with the Trust. |
Independent Trustees
| | | | | Number of | |
| | | | Principal | Portfolios In | Other |
| Name, | Position | Term of Office | Occupation(s) | Fund | Directorships |
| Address(1), | Held With | and Length of | During | Complex | Held By |
| and Year of Birth | the Trust | Time Served | Past 5 Years | Overseen By | Trustee |
| | | | | Trustee | |
| |
| Thomas H. Addis III, | Independent | Indefinite Term; | Executive Director/CEO, Southern | 6 | None |
| Year of Birth: 1945 | Trustee | Since 2000 | California PGA (2006 to current). | | |
| |
| Allen C. Brown, | Independent | Indefinite Term; | Law Office of Allen C. Brown, Estate | 6 | Blue Chip |
| Year of Birth: 1943 | Trustee | Since 2010 | planning and business attorney | | Investor Funds |
| | | | (1970 to current). | | |
| |
| George Cossolias, CPA, | Independent | Indefinite Term; | Partner of CWDL, CPAs (February 1, | 6 | Blue Chip |
| Year of Birth: 1935 | Trustee | Since 2000 | 2014 to current). Owner of George | | Investor Funds |
| | | | Cossolias & Company, CPAs (1972 | | |
| | | | to January 31, 2014). President of | | |
| | | | LubricationSpecialists, Inc. (1996 to | | |
| current). |
| | (1) The address of each trustee and officer is c/o PFS Funds, 1939 Friendship Drive, Suite C, El Cajon, California 92020. |
2018 Annual Report 22
Investment Adviser
Castle Investment Management, LLC
Sub-Adviser
St. James Investment Company, LLC
Legal Counsel
Practus, LLP
Custodian
U.S. Bank, N.A.
Distributor
Rafferty Capital Markets, LLC
Dividend Paying Agent,
Shareholders' Servicing Agent,
Transfer Agent
Mutual Shareholder Services, LLC
Fund Administrator
Premier Fund Solutions, Inc.
Independent Registered Public Accounting Firm
Cohen & Company, Ltd. |
This report is provided for the general information of the shareholders of the Castle
Focus Fund. This report is not intended for distribution to prospective investors in the
Fund, unless preceded or accompanied by an effective prospectus. |
Castle Focus Fund
277 South Washington Street, Suite 335
Alexandria, Virginia 22314
www.castleim.com
703-260-1921
Item 2. Code of Ethics.
The registrant has adopted a code of ethics that applies to the registrant’s principal executive officer and the principal financial officer. The registrant has not made any amendments to its code of ethics during the covered period. The registrant has not granted any waivers from any provisions of the code of ethics during the covered period. A copy of the registrant’s Code of Ethics is filed herewith.
Item 3. Audit Committee Financial Expert.
The registrant’s Board of Trustees has determined that George Cossolias is an audit committee finical expert. Mr. Cossolias is independent for purposes of this Item 3.
Item 4. Principal Accountant Fees and Services.
(a-d) The following table details the aggregate fees billed for each of the last two fiscal years for audit fees, audit-related fees, tax fees and other fees by the principal accountant to the registrant. The principal accountant has provided no services to the adviser or any entity controlled by, or under common control with the adviser that provides ongoing services to the registrant.
| | | FYE 6/30/18 | | FYE 6/30/17 |
| Audit Fees | | $14,250 | | $14,250 |
| Audit-Related Fees | | $0 | | $0 |
| Tax Fees | | $3,000 | | $2,500 |
| All Other Fees | | $750 | | $750 |
Nature of Tax Fees: preparation of Excise Tax Statement and 1120 RIC.
All Other Fees: Semi-Annual Report Review
(e) (1) The audit committee approves all audit and non-audit related services and, therefore, has not adopted pre-approval policies and procedures described in paragraph (c)(7) of Rule 2-01 of Regulation S-X.
(e) (2) None of the services described in paragraph (b) through (d) of this Item were approved by the audit committee pursuant to paragraph (c)(7)(i)(C) of Rule 2-01 of Regulation S-X.
(f) All of the principal accountant’s hours spent on auditing the registrant’s financial statements were attributed to work performed by full-time permanent employees of the principal accountant.
(g) The following table indicates the aggregate non-audit fees billed by the registrant’s principal accountant for services to the registrant , the registrant’s investment adviser (not sub-adviser), and any entity controlling, controlled by, or under common control with the adviser that provides ongoing services to the registrant, for the last two years.
| Non-Audit Fees | | FYE 6/30/18 | | FYE 6/30/17 |
| Registrant | | $3,750 | | $3,250 |
| Registrant’s Investment Adviser | | $0 | | $0 |
(h) The principal accountant provided no services to the investment adviser or any entity controlling, controlled by, or under common control with the adviser that provides ongoing services to the registrant.
Item 5. Audit Committee of Listed Companies. Not applicable.
Item 6. Schedule of Investments. Schedule filed with Item 1.
Item 7. Disclosure of Proxy Voting Policies and Procedures for Closed-End Management Investment Companies. Not applicable.
Item 8. Portfolio Managers of Closed End Management Investment Companies. Not applicable.
Item 9. Purchases of Equity Securities by Closed-End Management Investment Companies and Affiliated Purchasers. Not applicable.
Item 10. Submission of Matters to a Vote of Security Holders.
The registrant has not adopted procedures by which shareholders may recommend nominees to the registrant’s board of trustees.
Item 11. Controls and Procedures.
(a) The registrant’s president and chief financial officer concluded that the disclosure controls and procedures (as defined in Rule 30a-3(c) under the Investment Company Act of 1940 (the “Act”)) were effective as of a date within 90 days of the filing date of this report, based on the evaluation of these controls and procedures required by Rule 30a-3(b) under the Act.
(b) There were no changes in the registrant’s internal control over financial reporting (as defined in Rule 30a-3(d) under the Act) that occurred during the registrant’s second fiscal quarter of the period covered by this report that have materially affected, or are reasonably likely to materially affect, the registrant’s internal control over financial reporting.
Item 12. Exhibits.
(a)(1) Code of Ethics. Filed herewith.
(a)(2) Certifications pursuant to Section 302 of the Sarbanes-Oxley Act of 2002. Filed herewith.
(a)(3) Not applicable.
(b) Certification pursuant to Section 906 Certification of the Sarbanes-Oxley Act of 2002. Filed herewith.
Pursuant to the requirements of the Securities Exchange Act of 1934 and the Investment Company Act of 1940, the registrant has duly caused this report to be signed on its behalf by the undersigned, thereunto duly authorized.
| | By: /s/Ross C. Provence
Ross C. Provence
President |
Pursuant to the requirements of the Securities Exchange Act of 1934 and the Investment Company Act of 1940, this report has been signed below by the following persons on behalf of the registrant and in the capacities and on the dates indicated.
| | By: /s/Ross C. Provence
Ross C. Provence
President |
| | By: /s/Jeffrey R. Provence
Jeffrey R. Provence
Chief Financial Officer |