UNITED STATES
SECURITIES AND EXCHANGE COMMISSION
WASHINGTON, D.C. 20549
FORM N-CSR
CERTIFIED SHAREHOLDER REPORT OF REGISTERED MANAGEMENT
INVESTMENT COMPANIES
Investment Company Act file number: 811-09781
PFS Funds
(Exact name of registrant as specified in charter)
| 1939 Friendship Drive. | |
| Suite C | |
| El Cajon, CA | 92020 |
| (Address of principal executive offices) | (Zip code) |
CT Corporation System
155 Federal St., Suite 700,
Boston, MA 02110
(Name and address of agent for service)
Registrant's telephone number, including area code: (619) 588-9700
Date of fiscal year end: March 31
Date of reporting period: March 31, 2018
Form N-CSR is to be used by management investment companies to file reports with the Commission not later than 10 days after the transmission to stockholders of any report that is required to be transmitted to stockholders under Rule 30e-1 under the Investment Company Act of 1940 (17 CFR 270.30e -1). The Commission may use the information provided on Form N-CSR in its regulatory, disclosure review, inspection and policymaking roles.
A registrant is required to disclose the information specified by Form N-CSR, and the Commission will make this information public. A registrant is not required to respond to the collection of information contained in Form N-CSR unless the Form displays a currently valid Office of Management and Budget ("OMB") control number.
Item 1. Reports to Stockholders.
NWM MOMENTUM FUND
ANNUAL REPORT
March 31, 2018
TICKER MOMOX
NWM Momentum Fund
Annual Report
March 31, 2018
After a year (2017) in which the stock market seemed to only go up, where records were set for longest streak of days without a 1% drop, as well as the longest streak of days without a 3% pullback, things escalated quickly. The market changed its tune in February when the Dow dropped 1600 point during the day and closed down 1175 points, which was the worst point decline in history. Investors were dizzy as we transitioned from the calmest market in history to the biggest point drop in history in such a short period of time.
Large drops that happen quickly are one of the hardest markets to know what to do with. When the market is rising strongly, investors have to be involved or risk falling further and further behind. This can create a FOMO (fear of missing out) response in the investor who can then be influenced by recency bias. This is where stock market participants evaluate their portfolio performance based on recent results or on their perspective of recent results and make incorrect conclusions that ultimately lead to incorrect decisions about how the stock market behaves. So, when the market goes up seemingly daily with no real pullback, investors begin to assume this is the new normal, and wonder why their advisors aren’t matching or beating the markets during this time. The markets, in their mind, will always return 20%+ with barely a pullback. I knew we were close to something changing when my 90+ year old client wondered why she was only up 12% for the year when the market was up over 20%, and demanded a phone call to explain myself.
Fast forward to 1Q18 when the market entered correction territory. This was a fantastic reminder for investors that having something non-correlated to the Large Cap US Stock market might make sense in the long run. While the run in January was breathtaking to the upside, the give back in February was even more breathtaking. But it served as a reminder that having a plan to potentially avoid long and protracted down moves in the market may actually have a place still in their portfolios. While our strategy was not able to avoid the drastic down move which immediately followed the drastic up move, we had enough market chaos take place to enter into the new fiscal year in risk off mode. This doesn’t mean our strategy will be right, but the 1Q18 chaos was enough for us to
2018 Annual Report 1
move to the sidelines as we begin the new fiscal year. It has yet to ‘feel right’ to us when we move to risk-off as we always worry that we will look like fools sitting on the sidelines while the market takes off like a rocket. This most recent occurrence has been no different. Yet, you pay us to follow a model that is mechanical and has zero emotional input. My only job is to execute the orders that the non-emotional strategy tells me to execute. From there, I can whine and complain and lose sleep and wish differently on my own time. I learned long ago that it doesn’t matter what I feel or think. As I state often, the worst thing that could happen is I don’t follow the model and end up being right. If that is the case, as a human, I would imagine I would be confident in trading by my gut, which in the end means I am an emotional trader with responsibility to manage tens of millions of dollars without any way to measure whether my gut is worthy to trust in the long term. Therefore, we continue to follow the model and execute the trades as they come regardless of how we, as your managers, feel at the moment.
Year in Review:
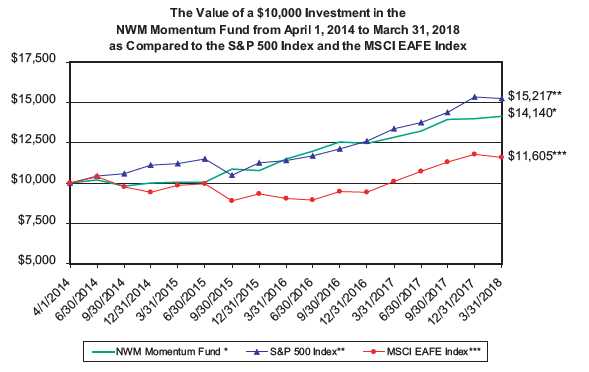
The Fund ended the previous year at $10.25 on March 31, 2017. On March 29, 2018, the Fund closed at $10.30. The Fund also paid a long term-capital gain of $0.0561, a short term-capital gain distribution of $0.8490 and a dividend of $0.0880 to investors on 12/27/2017. During the fiscal year, the total return of the Fund was 10.29% .
The Fund underperformed the S&P 500® Index by -3.70% for the fiscal year ended March 31, 2018.
Until next time, let’s keep hoping for higher prices!
Tim Ayles
Performance data quoted represents past performance. Past performance does not guarantee future results. The investment return and principal value of an investment will fluctuate so that an investor’s shares, when redeemed, may be worth more or less than their original cost. All returns include change in share prices, and reinvestment of any dividends and capital gains distributions. Current performance may be lower or higher than the performance data quoted. You may obtain performance data current to the most recent month-end by calling 1-888-331-9609. An investment in the Fund is subject to investment risks, including the possible loss of the principal amount invested. The Fund’s principal underwriter is Rafferty Capital Markets, LLC.
2018 Annual Report 2
NWM MOMENTUM FUND (Unaudited)
PERFORMANCE INFORMATION
March 31, 2018 NAV $10.30
AVERAGE ANNUAL RETURNS (%) AS OF MARCH 31, 2018
| | | | | | Since | |
| | 1 Year(A) | | 3 Year(A) | | Inception(A) | |
| NWM Momentum Fund | 10.29% | | 12.09% | | 9.05% | |
| S&P 500® Index (B) | 13.99% | | 10.78% | | 11.07% | |
| MSCI® EAFE® Index (C) | 14.80% | | 5.55% | | 3.79% | |
Annual Fund Operating Expense Ratio (from 7/28/17 Prospectus): 1.81%
The Annual Fund Operating Expense Ratio reported above will not correlate to the expense ratio in the Fund’s financial highlights because the financial highlights include only the direct operating expenses incurred by the Fund, not the indirect costs of investing in acquired funds.
(A)1 Year, 3 Year and Since Inception returns include change in share prices and in each case includes reinvestment of any dividends and capital gain distributions. The NWM Momentum Fund commenced operations on April 1, 2014.
(B)The S&P 500® Index is a widely recognized unmanaged index of equity prices and is representative of a broader market and range of securities than is found in the Fund’s portfolio. The Index is an unmanaged benchmark that assumes reinvestment of all distributions and excludes the effect of taxes and fees. Individuals cannot invest directly in this Index; however, an individual can invest in exchange traded funds or other investment vehicles that attempt to track the performance of a benchmark index.
(C)The MSCI® EAFE® Index (Europe, Australasia, Far East) is a free float-adjusted market capitalization index that is designed to measure the equity market performance of developed markets, excluding the U.S. and Canada. The MSCI EAFE Index consists of the following 21 developed market country indices: Australia, Austria, Belgium, Denmark, Finland, France, Germany, Hong Kong, Ireland, Israel, Italy, Japan, the Netherlands, New Zealand, Norway, Portugal, Singapore, Spain, Sweden, Switzerland, and the United Kingdom.
PAST PERFORMANCE DOES NOT GUARANTEE FUTURE RESULTS. INVESTMENT RETURN AND PRINCIPAL VALUE WILL FLUCTUATE SO THAT SHARES, WHEN REDEEMED, MAY BE WORTH MORE OR LESS THAN THEIR ORIGINAL COST. RETURNS DO NOT REFLECT THE DEDUCTION OF TAXES THAT A SHAREHOLDER WOULD PAY ON FUND DISTRIBUTIONS OR THE REDEMPTION OF FUND SHARES. CURRENT PERFORMANCE MAY BE LOWER OR HIGHER THAN THE PERFORMANCE DATA QUOTED. TO OBTAIN PERFORMANCE DATA CURRENT TO THE MOST RECENT MONTH END, PLEASE CALL 1-888-331-9609. AN INVESTMENT IN THE FUND IS SUBJECT TO INVESTMENT RISKS, INCLUDING THE POSSIBLE LOSS OF THE PRINCIPAL AMOUNT INVESTED. THE FUND'S DISTRIBUTOR IS RAFFERTY CAPITAL MARKETS, LLC.
2018 Annual Report 3
NWM MOMENTUM FUND (Unaudited)
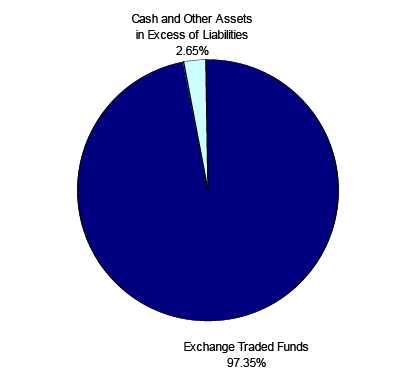
NWM Momentum Fund
by Sectors (as a percentage of Net Assets)
Availability of Quarterly Schedule of Investments
The Fund files its complete schedule of portfolio holdings with the Securities and Exchange Commission (“SEC”) for the first and third quarters of each fiscal year on Form N-Q. The Fund’s Form N-Q is available on the SEC’s Web site at http://www.sec.gov. The Fund’s Form N-Q may also be reviewed and copied at the SEC’s Public Reference Room in Washington, DC. Information on the operation of the Public Reference Room may be obtained by calling 1-800-SEC-0330.
Proxy Voting Guidelines
NWM Fund Group, LLC, the Fund’s investment adviser (“Adviser”), is responsible for exercising the voting rights associated with the securities held by the Fund. A description of the policies and procedures used by the Adviser in fulfilling this responsibility is available without charge on the Fund’s website at www.nwmfund.com. It is also included in the Fund’s Statement of Additional Information, which is available on the SEC’s website at http://www.sec.gov.
Information regarding how the Fund voted proxies, Form N-PX, relating to portfolio securities during the most recent period ended June 30th, is available without charge, upon request, by calling our toll free number (1-888-331-9609). This information is also available on the SEC’s website at http://www.sec.gov.
2018 Annual Report 4
Expense Example
(Unaudited)
Shareholders of this Fund incur ongoing costs consisting of management fees and service fees. Although the Fund charges no sales loads or transaction fees, you will be assessed fees for outgoing wire transfers, returned checks and stop payment orders at prevailing rates charged by Mutual Shareholder Services, LLC, the Fund’s transfer agent. IRA accounts will be charged an $8.00 annual maintenance fee. If shares are redeemed within 90 days of purchase from the Fund, the shares are subject to a 2% redemption fee. Additionally, your account will be indirectly subject to the expenses of the underlying funds. The following example is intended to help you understand your ongoing costs of investing in the Fund and to compare these costs with similar costs of investing in other mutual funds. The example is based on an investment of $1,000 invested in the Fund on October 1, 2017 and held through March 31, 2018.
The first line of the table below provides information about actual account values and actual expenses. In order to estimate the expenses a shareholder paid during the period covered by this report, shareholders can divide their account value by $1,000 (for example, an $8,600 account value divided by $1,000 = 8.6) and then multiply the result by the number in the first line under the heading entitled “Expenses Paid During the Period.”
The second line of the table below provides information about hypothetical account values and hypothetical expenses based on the Fund’s actual expense ratio and an assumed rate of return of 5% per year before expenses, which is not the Fund’s actual return. The hypothetical account values and expenses may not be used to estimate the actual ending account balance or expenses paid by a shareholder for the period. Shareholders may use this information to compare the ongoing costs of investing in this Fund and other funds. To do so, compare this 5% hypothetical example with the 5% hypothetical examples that appear in other funds’ shareholder reports.
Please note that the expenses shown in the table are meant to highlight your ongoing costs only and do not reflect any transactional costs, such as redemption fees or the charges assessed by Mutual Shareholder Services, LLC as described above and expenses of underlying funds. Therefore, the second line of the table is useful in comparing ongoing costs only, and will not help you determine the relative total costs of owning different funds. In addition, if these transactional costs and expenses of underlying funds were included, your costs would have been higher.
| | | | | | | Expenses Paid |
| | | Beginning | | Ending | | During the Period* |
| | | Account Value | | Account Value | | October 1, 2017 |
| | | October 1, 2017 | | March 31, 2018 | | to March 31, 2018 |
| |
| Actual | | $1,000.00 | | $1,015.71 | | $7.49 |
| |
| Hypothetical | | $1,000.00 | | $1,017.50 | | $7.49 |
| (5% annual return | | | | | | |
| before expenses) | | | | | | |
| * | Expenses are equal to the Fund’s annualized expense ratio of 1.49%, multiplied by the average account value over the period, multiplied by 182/365 (to reflect the one-half year period). |
| |
2018 Annual Report 5
| NWM Momentum Fund |
| | | | Schedule of Investments |
| | | | March 31, 2018 |
| Shares | | Fair Value | | % of Net Assets |
| | | | | | |
| EXCHANGE TRADED FUNDS | | | | | |
| 89,959 | iShares® iBoxx $ High Yield Corporate Bond ETF | $ | 7,704,089 | | | |
| 337,360 | iShares® Latin America 40 ETF | | 12,674,615 | | | |
| 283,687 | iShares® MSCI Brazil Capped ETF | | 12,731,872 | | | |
| 171,658 | iShares® MSCI China ETF | | 11,770,589 | | | |
| 334,206 | iShares® MSCI India ETF | | 11,406,451 | | | |
| 268,805 | PowerShares Emerging Markets Sovereign Debt Portfolio | | 7,577,613 | | | |
| 153,936 | SPDR® Bloomberg Barclays Convertible Securities ETF | | 7,952,334 | | | |
| 213,716 | SPDR® Bloomberg Barclays High Yield Bond ETF | | 7,661,719 | | | |
| Total for Exchange Traded Funds (Cost - $78,497,465) | | 79,479,282 | | 97.35 | % |
| | | | | | |
| Total Investment Securities | | 79,479,282 | | | |
| | (Cost $78,497,465) | | | | | |
| Other Assets in Excess of Liabilities | | 2,162,099 | | 2.65 | % |
| Net Assets | | $ | 81,641,381 | | 100.00 | % |
The accompanying notes are an integral part of these
financial statements. |
2018 Annual Report 6
| NWM Momentum Fund | | | |
| |
| Statement of Assets and Liabilities | | | |
| March 31, 2018 | | | |
| |
| Assets: | | | |
| Investment Securities at Fair Value | $ | 79,479,282 | |
| (Cost $78,497,465) | | | |
| Cash | | 2,234,250 | |
| Receivable for Shareholder Purchases | | 30,981 | |
| Total Assets | | 81,744,513 | |
| Liabilities: | | | |
| Management Fees Payable | | 68,524 | |
| Service Fees Payable | | 34,608 | |
| Total Liabilities | | 103,132 | |
| Net Assets | $ | 81,641,381 | |
| |
| Net Assets Consist of: | | | |
| Paid In Capital | $ | 79,016,751 | |
| Accumulated Undistributed Net Investment Income/(Loss) | | 17,421 | |
| Accumulated Undistributed Realized Gain/(Loss) on Investments - Net | | 1,625,392 | |
| Unrealized Appreciation/(Depreciation) in Value of Investments | | | |
| Based on Identified Cost - Net | | 981,817 | |
| Net Assets, for 7,924,641 Shares Outstanding | $ | 81,641,381 | |
| (Unlimited shares authorized) | | | |
| Net Asset Value and Offering Price Per Share | | | |
| ($81,641,381/7,924,641 shares) | $ | 10.30 | |
| Redemption Price * ($10.30 x 0.98) (Note 2) | $ | 10.09 | |
| |
| Statement of Operations | | | |
| For the fiscal year ended March 31, 2018 | | | |
| |
| Investment Income: | | | |
| Dividends | $ | 1,603,760 | |
| Total Investment Income | | 1,603,760 | |
| Expenses: | | | |
| Management Fees (Note 4) | | 724,893 | |
| Service Fees (Note 4) | | 366,108 | |
| Total Expenses | | 1,091,001 | |
| |
| Net Investment Income/(Loss) | | 512,759 | |
| |
| Realized and Unrealized Gain/(Loss) on Investments: | | | |
| Net Realized Gain/(Loss) on Investments | | 6,121,911 | |
| Net Change in Unrealized Appreciation/(Depreciation) on Investments | | (6,008 | ) |
| Net Realized and Unrealized Gain/(Loss) on Investments | | 6,115,903 | |
| |
| Net Increase/(Decrease) in Net Assets from Operations | $ | 6,628,662 | |
| * Reflects a 2% redemption fee if shares are redeemed within 90 days of purchase. |
The accompanying notes are an integral part of these
financial statements. |
2018 Annual Report 7
| NWM Momentum Fund |
| | |
| Statements of Changes in Net Assets | | | | | | | | |
| | | 4/1/2017 | | | | 4/1/2016 | | |
| | | to | | | | to | | |
| | | 3/31/2018 | | | | 3/31/2017 | | |
| From Operations: | | | | | | | | |
| Net Investment Income/(Loss) | $ | 512,759 | | | $ | 766,000 | | |
| Net Realized Gain/(Loss) on Investments | | 6,121,911 | | | | 3,848,107 | | |
| Net Change in Unrealized Appreciation/(Depreciation) | | (6,008 | ) | | | 630,686 | | |
| Increase/(Decrease) in Net Assets from Operations | | 6,628,662 | | | | 5,244,793 | | |
| From Distributions to Shareholders: | | | | | | | | |
| Net Investment Income | | (493,444 | ) | | | (731,250 | ) | |
| Net Realized Gain from Security Transactions | | (5,075,644 | ) | | | (4,931,515 | ) | |
| Change in Net Assets from Distributions | | (5,569,088 | ) | | | (5,662,765 | ) | |
| From Capital Share Transactions: | | | | | | | | |
| Proceeds From Sale of Shares | | 37,482,551 | | | | 22,535,183 | | |
| Proceeds From Redemption Fees (Note 2) | | 26,611 | | | | 2,047 | | |
| Shares Issued on Reinvestment of Dividends | | 5,569,088 | | | | 5,662,765 | | |
| Cost of Shares Redeemed | | (22,443,794 | ) | | | (8,995,046 | ) | |
| Net Increase/(Decrease) from Shareholder Activity | | 20,634,456 | | | | 19,204,949 | | |
| Net Increase/(Decrease) in Net Assets | | 21,694,030 | | | | 18,786,977 | | |
| Net Assets at Beginning of Period | | 59,947,351 | | | | 41,160,374 | | |
| Net Assets at End of Period (Including Accumulated Undistributed Net | | | | | | | | |
| Investment Income/(Loss) of $17,421 and ($136)) | $ | 81,641,381 | | | $ | 59,947,351 | | |
| Share Transactions: | | | | | | | | |
| Issued | | 3,571,768 | | | | 2,136,393 | | |
| Reinvested | | 547,062 | | | | 570,268 | | |
| Redeemed | | (2,042,770 | ) | | | (821,719 | ) | |
| Net Increase/(Decrease) in Shares | | 2,076,060 | | | | 1,884,942 | | |
| Shares Outstanding Beginning of Period | | 5,848,581 | | | | 3,963,639 | | |
| Shares Outstanding End of Period | | 7,924,641 | | | | 5,848,581 | | |
| Financial Highlights | | | | | | | | | | | | | | | |
| Selected data for a share outstanding throughout the period: | | 4/1/2017 | | | | 4/1/2016 | | | | 4/1/2015 | | | | 4/1/2014* | |
| | | to | | | | to | | | | to | | | | to | |
| | | 3/31/2018 | | | | 3/31/2017 | | | | 3/31/2016 | | | | 3/31/2015 | |
| Net Asset Value - | | | | | | | | | | | | | | | |
| Beginning of Period | $ | 10.25 | | | $ | 10.38 | | | $ | 9.94 | | | $ | 10.00 | |
| Net Investment Income/(Loss) (a) (e) | | 0.08 | | | | 0.17 | | | | - | | + | | 0.11 | |
| Net Gain/(Loss) on Securities (b) | | | | | | | | | | | | | | | |
| (Realized and Unrealized) | | 0.96 | | | | 1.01 | | | | 1.35 | | | | (0.07 | ) |
| Total from Investment Operations | | 1.04 | | | | 1.18 | | | | 1.35 | | | | 0.04 | |
| Distributions (From Net Investment Income) | | (0.09 | ) | | | (0.17 | ) | | | (0.01 | ) | | | (0.10 | ) |
| Distributions (From Realized Capital Gains) | | (0.90 | ) | | | (1.14 | ) | | | (0.90 | ) | | | - | |
| Total Distributions | | (0.99 | ) | | | (1.31 | ) | | | (0.91 | ) | | | (0.10 | ) |
| Proceeds from Redemption Fee (Note 2) | | - | | + | | - | | + | | - | | + | | - | |
| Net Asset Value - | | | | | | | | | | | | | | | |
| End of Period | $ | 10.30 | | | $ | 10.25 | | | $ | 10.38 | | | $ | 9.94 | |
| Total Return (c) | | 10.29% | | | | 11.80% | | | | 14.21% | | | | 0.40% | |
| Ratios/Supplemental Data | | | | | | | | | | | | | | | |
| Net Assets - End of Period (Thousands) | $ | 81,641 | | | $ | 59,947 | | | $ | 41,160 | | | $ | 32,797 | |
| Ratio of Expenses to Average Net Assets (d) | | 1.49% | | | | 1.49% | | | | 1.57% | | | | 1.75% | |
| Ratio of Net Investment Income/(Loss) to Average Net Assets (d) (e) | | 0.70% | | | | 1.56% | | | | 0.01% | | | | 1.14% | |
| Portfolio Turnover Rate | | 365.25% | | | | 395.80% | | | | 1301.72% | | | | 1153.56% | |
* Commencement of Operations.
+ Amount calculated is less than $0.005.
(a) Per share amounts were calculated using the average shares method.
(b) Realized and unrealized gains and losses per share in this caption are balancing amounts necessary to
reconcile the change in net asset value for the period and may not reconcile with the aggregate gains and
losses in the Statement of Operations due to share transactions for the period.
(c) Total return represents the rate that the investor would have earned or lost on an investment in
assuming reinvestment of dividends and distributions.
(d) These ratios exclude the impact of expenses of the underlying investment security holdings listed in the
Schedule of Investments.
(e) Recognition of net investment income/(loss) by the Fund is affected by the timing of the declaration of
dividends by the underlying investment security holdings listed on the Schedule of Investments. |
The accompanying notes are an integral part of these
financial statements. |
2018 Annual Report 8
NOTES TO THE FINANCIAL STATEMENTS
NWM MOMENTUM FUND
March 31, 2018
1.) ORGANIZATION
NWM Momentum Fund (the “Fund”) was organized as a non-diversified series of the PFS Funds (the “Trust”) on March 5, 2014. The Trust was established under the laws of Massachusetts by an Agreement and Declaration of Trust dated January 13, 2000. The Trust is registered as an open-end investment company under the Investment Company Act of 1940, as amended (the “1940 Act”). The Trust may offer an unlimited number of shares of beneficial interest in a number of separate series, each series representing a distinct fund with its own investment objectives and policies. As of March 31, 2018, there were eight series authorized by the Trust. The Fund commenced operations on April 1, 2014. The Fund’s investment objective is to seek long-term capital appreciation. The investment adviser to the Fund is NWM Fund Group, LLC (the “Adviser”).
2.) SIGNIFICANT ACCOUNTING POLICIES
The Fund is an investment company and accordingly follows the investment company accounting and reporting guidance of the Financial Accounting Standards Board (“FASB”) Accounting Standards Codification Topic 946 Financial Services - Investment Companies. The financial statements are prepared in conformity with accounting principles generally accepted in the United States of America (“GAAP”). The Fund follows the significant accounting policies described in this section.
SECURITY VALUATION
All investments in securities are recorded at their estimated fair value, as described in Note 3.
SHARE VALUATION
The net asset value per share (the “NAV”) is generally calculated as of the close of trading on the New York Stock Exchange (the “Exchange”)(normally 4:00 p.m. Eastern time) every day the Exchange is open. The NAV is calculated by taking the total value of the Fund’s assets, subtracting its liabilities, and then dividing by the total number of shares outstanding, rounded to the nearest cent. The offering price and redemption price per share is equal to the net asset value per share, except that shares of the Fund are subject to a redemption fee of 2% if redeemed within 90 days of purchase. During the fiscal year ended March 31, 2018, proceeds from redemption fees were $26,611.
FEDERAL INCOME TAXES
The Fund’s policy is to continue to comply with the requirements of the Internal Revenue Code that are applicable to regulated investment companies and to distribute all of its taxable income to shareholders. Therefore, no federal income tax provision is required. It is the Fund’s policy to distribute annually, prior to the end of the calendar year, dividends sufficient to satisfy excise tax requirements of the Internal Revenue Code. This Internal Revenue Code requirement may cause an excess of distributions over the book year-end accumulated income. In addition, it is the Fund’s policy to distribute annually, after the end of the fiscal year, any remaining net investment income and net realized capital gains.
The Fund recognizes the tax benefits of certain tax positions only where the position is “more likely than not” to be sustained assuming examination by tax authorities. Management has analyzed the Fund’s tax positions, and has concluded that no liability for unrecognized tax benefits should be recorded related to uncertain tax positions taken on returns filed for open tax years. The Fund identifies its major tax jurisdictions as U.S. Federal tax authorities; however, the Fund is not aware of any tax positions for which it is reasonably possible that the total amounts of unrecognized tax benefits will change materially in the next twelve months. The Fund recognizes interest and penalties, if any, related to unrecognized tax benefits as income tax expense in the Statement of Operations. During the fiscal year ended March 31, 2018, the Fund did not incur any interest or penalties.
DISTRIBUTIONS TO SHAREHOLDERS
Distributions to shareholders, which are determined in accordance with income tax regulations, are recorded on the ex-dividend date.
The treatment for financial reporting purposes of distributions made to shareholders during the year from net investment income or net realized capital gains may differ from their ultimate treatment for federal income tax purposes. These differences are caused primarily by differences in the timing of the recognition of certain components of income, expense, or realized capital gain for federal income tax purposes. Where such differences are permanent in nature, they are reclassified in the components of the net assets based on their ultimate characterization for feder-
2018 Annual Report 9
Notes to the Financial Statements - continued
al income tax purposes. Any such reclassifications will have no effect on net assets, result of operations, or net asset value per share of the Fund. As of March 31, 2018, accumulated undistributed net investment income/(loss) was reduced by $1,758 and accumulated realized gain/(loss) on investments – net was increased by $1,758. The reclassification was attributed to partnership adjustments.
USE OF ESTIMATES
The financial statements are prepared in accordance with GAAP, which requires management to make estimates and assumptions that affect the reported amounts of assets and liabilities and disclosure of contingent assets and liabilities at the date of the financial statements and the reported amounts of increases and decreases in net assets from operations during the reporting period. Actual results could differ from those estimates.
EXPENSES
Expenses incurred by the Trust that do not relate to a specific fund of the Trust are allocated to the individual funds based on each fund’s relative net assets or another appropriate basis.
OTHER
The Fund records security transactions based on a trade date for financial statement reporting purposes. Dividend income is recognized on the ex-dividend date, and interest income, if any, is recognized on an accrual basis. The Fund uses the specific identification method in computing gain or loss on the sale of investment securities. Withholding taxes on foreign dividends have been provided for in accordance with the Fund’s understanding of the applicable country’s tax rules and rates.
The Fund may invest in Master Limited Partnerships (“MLPs”), which generally are treated as partnerships for Federal income tax purposes. As a limited partner in the MLPs, the Fund includes its allocable shares of the MLPs’ taxable income in computing its own taxable income. The tax character of these distributions is not known until after the fiscal year of the Fund. For financial reporting purposes, management does not estimate the tax character of MLP distributions for which actual information has not been reported.
3.) INVESTMENT SECURITIES VALUATION
The Fund utilizes various methods to measure the fair value of most of its investments on a recurring basis. GAAP establishes a hierarchy that prioritizes inputs to valuation methods. The three levels of inputs are:
Level 1 - Unadjusted quoted prices in active markets for identical assets or liabilities that the Fund has the ability to access.
Level 2 - Inputs other than quoted prices included in level 1 that are observable for the asset or liability, either directly or indirectly. These inputs may include quoted prices for the identical instrument on an inactive market, prices for similar instruments, interest rates, prepayment speeds, credit risk, yield curves, default rates and similar data.
Level 3 - Unobservable inputs for the asset or liability, to the extent relevant observable inputs are not available, representing the Fund’s own assumptions about the assumptions a market participant would use in valuing the asset or liability, and would be based on the best information available.
The availability of observable inputs can vary from security to security and is affected by a wide variety of factors, including, for example, the type of security, whether the security is new and not yet established in the marketplace, the liquidity of markets, and other characteristics particular to the security. To the extent that valuation is based on models or inputs that are less observable or unobservable in the market, the determination of fair value requires more judgment. Accordingly, the degree of judgment exercised in determining fair value is greatest for instruments categorized in level 3.
The inputs used to measure fair value may fall into different levels of the fair value hierarchy. In such cases, for disclosure purposes, the level in the fair value hierarchy within which the fair value measurement falls in its entirety, is determined based on the lowest level input that is significant to the fair value measurement in its entirety.
FAIR VALUE MEASUREMENTS
A description of the valuation techniques applied to the Fund’s major categories of assets measured at fair value on a recurring basis follows:
2018 Annual Report 10
Notes to the Financial Statements - continued
Equity securities (including exchange traded funds). Equity securities generally are valued by using market quotations, but may be valued on the basis of prices furnished by a pricing service when the Adviser believes such prices accurately reflect the fair market value of such securities. Securities that are traded on any stock exchange or on the NASDAQ over-the-counter market are generally valued by the pricing service at the last quoted sale price. Lacking a last sale price, an equity security is generally valued by the pricing service at its last bid price. Generally, if the security is traded in an active market and is valued at the last sale price, the security is categorized as a level 1 security. When market quotations are not readily available, when the Adviser determines that the market quotation or the price provided by the pricing service does not accurately reflect the current fair value, or when restricted securities are being valued, such securities are valued as determined in good faith by the Adviser, subject to review of the Board of Trustees (the “Trustees” or the “Board”) and are categorized in level 2 or level 3, when appropriate.
In accordance with the Trust’s good faith pricing guidelines, the Adviser is required to consider all appropriate factors relevant to the value of securities for which it has determined other pricing sources are not available or reliable as described above. There is no single method for determining fair value, since fair value depends upon the circumstances of each individual case. As a general principle, the current fair value of an issue of securities being valued by the Adviser would appear to be the amount which the owner might reasonably expect to receive for them upon their current sale. Methods which are in accordance with this principle may, for example, be based on (i) a multiple of earnings; (ii) a discount from market of a similar freely traded security (including a derivative security or a basket of securities traded on other markets, exchanges or among dealers); or (iii) yield to maturity with respect to debt issues, or a combination of these and other methods.
The following table summarizes the inputs used to value the Fund’s assets measured at fair value as of March 31, 2018:
| Valuation Inputs of Assets | | Level 1 | | Level 2 | | Level 3 | | Total |
| Exchange Traded Funds | | $79,479,282 | | $0 | | $0 | | $79,479,282 |
| Total | | $79,479,282 | | $0 | | $0 | | $79,479,282 |
The Fund did not hold any Level 3 assets during the fiscal year ended March 31, 2018. There were no transfers into or out of level 1 and level 2 during the fiscal year ended March 31, 2018. It is the Fund’s policy to consider transfers into or out of the levels as of the end of the reporting period.
The Fund did not invest in derivative instruments during the fiscal year ended March 31, 2018. 4.) INVESTMENT ADVISORY AGREEMENT AND SERVICES AGREEMENT
The Fund has entered into an investment advisory agreement (“Management Agreement”) with the Adviser. The Adviser manages the investment portfolio of the Fund, subject to policies adopted by the Trust’s Board of Trustees, and, at its own expense and without reimbursement from the Trust, furnishes office space and all necessary office facilities, equipment and executive personnel necessary for managing the Fund. The Adviser receives an investment management fee equal to 0.99% of the Fund’s average daily net assets up to $200 million and 0.90% of the Fund’s average daily net assets in excess of $200 million. Prior to July 31, 2015, the Adviser received an investment management fee equal to 1.25% of the Fund’s average daily net assets up to $100 million, 1.10% of the Fund’s average daily net assets between $100 million and $150 million, 1.00% of the Fund’s average daily net assets between $150 million and $200 million and 0.90% of the Fund’s average daily net assets in excess of $200 million.
Under the terms of the Services Agreement between the Trust and the Adviser (the “Services Agreement”), the Adviser renders administrative and supervisory services to the Fund, provides the services of a chief compliance officer and assumes and pays all ordinary expenses of the Fund, excluding management fees, brokerage fees and commissions, 12b-1 fees (if adopted), taxes, borrowing costs (such as (a) interest and (b) dividend expenses on securities sold short), ADR fees, fees and expenses of acquired funds, and extraordinary or non-recurring expenses. For its services, the Adviser receives a service fee equal to 0.50% of the average daily net assets of the Fund.
For the fiscal year ended March 31, 2018, the Adviser earned management fees totaling $724,893, of which $68,524 was due to the Adviser at March 31, 2018. For the same period, the Adviser earned service fees of $366,108, of which $34,608 was due to the Adviser at March 31, 2018.
2018 Annual Report 11
Notes to the Financial Statements - continued
5.) RELATED PARTY TRANSACTIONS
Jeffrey R. Provence of Premier Fund Solutions, Inc. (the “Administrator”) also serves as trustee/officer of the Fund. This individual receives benefits from the Administrator resulting from administration fees paid to the Administrator of the Fund by the Adviser.
For the fiscal year ended March 31, 2018, the Trustees who are not interested persons of the Fund received Trustees’ fees of $1,875 each, for a total of $5,625, plus travel expenses from the Adviser of the Fund. Under the Services Agreement, the Adviser pays these fees.
6.) PURCHASES AND SALES OF SECURITIES
For the fiscal year ended March 31, 2018, purchases and sales of investment securities other than U.S. Government obligations and short-term investments aggregated $261,953,406 and $246,470,387, respectively. Purchases and sales of U.S. Government obligations aggregated $0 and $0, respectively.
7.) CONTROL OWNERSHIP
The beneficial ownership, either directly or indirectly, of more than 25% of the voting securities of a fund creates a presumption of control of that fund, under Section 2(a)(9) of the Investment Company Act of 1940. As of March 31, 2018, TD Ameritrade Inc., for the benefit of its customers, held, in aggregate, 90.92% of the shares in the Fund. The Trust does not know whether the foregoing entity or any of the underlying beneficial holders owned or controlled 25% or more of the voting securities of the Fund.
8.) TAX MATTERS
For Federal income tax purposes, the cost of securities owned at March 31, 2018 was $78,645,459.
At March 31, 2018, the composition of gross unrealized appreciation (the excess of value over tax cost) and depreciation (the excess of tax cost over value) of investments on a tax basis was as follows:
| | Appreciation | | (Depreciation) | | | Net Appreciation/(Depreciation) |
| | $2,147,494 | | ($1,313,671) | | | $833,823 |
| |
| The tax character of distributions was as follows: | | | |
| |
| | | | Fiscal Year Ended | | | Fiscal Year Ended |
| | | | March 31, 2018 | | | March 31, 2017 |
| | Ordinary Income: | | $ 5,254,275 | | | $ 5,662,765 |
| | Long-term Capital Gain: | | 314,813 | | | 0 |
| | | | $ 5,569,088 | | | $ 5,662,765 |
As of March 31, 2018, the components of distributable earnings/(accumulated losses) on a tax basis were as follows:
| Undistributed ordinary income | $ | 1,899,321 | |
| Other accumulated losses | | (108,514 | ) |
| Unrealized appreciation/(depreciation) – net | | 833,823 | |
| | $ | 2,624,630 | |
As of March 31, 2018, the difference between book basis and tax basis unrealized appreciation (depreciation) is primarily attributable to the tax deferral of losses on wash sales. Other accumulated losses includes deferred late year ordinary losses of $58,088 and post-October capital losses of $50,426.
9.) SUBSEQUENT EVENTS
Subsequent to March 31, 2018 the Adviser completed a strategic review of the management and operations of the Fund and determined that it would be advisable to pursue a reorganization by transferring all of the assets and liabilities of the Fund to a newly formed portfolio of The Saratoga Advantage Trust with substantially the same investment objective, principal investment strategies and risks as the Fund (the “Reorganization”). Following this strategic review process, the Adviser believes that the Reorganization is in the best interests of the Fund and its shareholders. Based upon the Adviser’s representations, the Board of Trustees of the Fund has approved the Reorganization, subject to shareholder approval. The Adviser provides day-to-day investment management for the Fund’s investment strategies and will continue to do so as sub-adviser if the Reorganization is approved by the shareholders of the Fund. James Alpha Advisors, LLC will serve as the investment manager if the Reorganization is approved by the shareholders of the Fund. Shareholders of record as of the close of business on April 9, 2018 are entitled to notice of,
2018 Annual Report 12
Notes to the Financial Statements - continued
and to vote at, the meeting or any adjournment or postponement of the meeting, and will receive a proxy statement in June.
Additionally, effective April 1, 2018, the Adviser agreed to reduce the fee it receives under the Services Agreement to reflect a breakpoint structure, which states that the Adviser receives an additional fee of 0.50% of the Fund’s average daily net assets up to $50 million, and 0.25% of such assets in excess of $50 million and is obligated to pay the operating expenses of the Fund excluding management fees, brokerage fees and commissions, 12b-1 fees, taxes, borrowing costs (such as (a) interest and (b) dividend expenses on securities sold short), ADR fees, fees and expenses of acquired funds, and extraordinary expenses.
2018 Annual Report 13
REPORT OF INDEPENDENT REGISTERED PUBLIC ACCOUNTING FIRM
To the Shareholders of NWM Momentum Fund
and Board of Trustees of PFS Funds
Opinion on the Financial Statements
We have audited the accompanying statement of assets and liabilities, including the schedule of investments, of NWM Momentum Fund (the “Fund”), a series of PFS Funds, as of March 31, 2018, and the related statement of operations for the year then ended, the statements of changes in net assets for each of the two years in the period then ended, including the related notes, and the financial highlights for each of the four periods in the period then ended (collectively referred to as the “financial statements”). In our opinion, the financial statements present fairly, in all material respects, the financial position of the Fund as of March 31, 2018, the results of its operations for the year then ended, the changes in its net assets for each of the two years in the period then ended, and the financial highlights for each of the four periods in the period then ended, in conformity with accounting principles generally accepted in the United States of America.
Basis for Opinion
These financial statements are the responsibility of the Fund’s management. Our responsibility is to express an opinion on the Fund’s financial statements based on our audits. We are a public accounting firm registered with the Public Company Accounting Oversight Board (United States) (“PCAOB”) and are required to be independent with respect to the Fund in accordance with the U.S. federal securities laws and the applicable rules and regulations of the Securities and Exchange Commission and the PCAOB.
We conducted our audits in accordance with the standards of the PCAOB. Those standards require that we plan and perform the audit to obtain reasonable assurance about whether the financial statements are free of material misstatement, whether due to error or fraud.
Our audits include performing procedures to assess the risks of material misstatement of the financial statements, whether due to error or fraud, and performing procedures that respond to those risks. Such procedures include examining, on a test basis, evidence regarding the amounts and disclosures in the financial statements and confirmation of securities owned as of March 31, 2018, by correspondence with the custodian. Our audits also included evaluating the accounting principles used and significant estimates made by management, as well as evaluating the overall presentation of the financial statements. We believe that our audits provide a reasonable basis for our opinion.
We have served as auditor of one or more investment companies within the Trust since 2014.

COHEN & COMPANY, LTD.
Cleveland, Ohio
May 23, 2018
2018 Annual Report 14
ADDITIONAL INFORMATION
NWM MOMENTUM FUND
March 31, 2018
(UNAUDITED)
APPROVAL OF THE CONTINUATION OF THE MANAGEMENT AGREEMENT
On March 8, 2018 the Board of Trustees (the “Board” or “Trustees”) for the NWM Momentum Fund met to consider the renewal of the Management Agreement (the “Management Agreement”). In approving the Management Agreement, the Board of Trustees considered and evaluated the following factors: (i) the nature, extent and quality of the services provided by NWM to the NWM Momentum Fund; (ii) the investment performance of the NWM Momentum Fund; (iii) the cost of the services to be provided and the profits to be realized by NWM and its affiliates from the relationship with the NWM Momentum Fund; (iv) the extent to which economies of scale will be realized as the NWM Momentum Fund grows and whether the fee levels reflect these economies of scale to the benefit of shareholders; and (v) NWM’s practices regarding possible conflicts of interest.
In assessing these factors and reaching its decisions, the Board took into consideration information furnished for the Board’s review and consideration throughout the year at regular Board meetings, as well as information specifically prepared and/or presented in connection with the annual renewal process, including information presented at the Meeting, including the presentation by management of NWM earlier in the Meeting. The Board requested and was provided with information and reports relevant to the annual renewal of the Management Agreement, including: (i) information regarding the services and support provided to the NWM Momentum Fund and its shareholders by NWM; (ii) assessments of the investment performance of the NWM Momentum Fund by NWM; (iii) commentary on the reasons for the performance; (iv) presentations addressing NWM’s investment philosophy, investment strategy, personnel and operations; (v) compliance and audit reports concerning the NWM Momentum Fund and NWM; (vi) disclosure information contained in the registration statement of the NWM Momentum Fund and the Form ADV of NWM; and (vii) a memorandum from Counsel that summarized the fiduciary duties and responsibilities of the Board in reviewing and approving the Management Agreement, including the material factors set forth above and the types of information included in each factor that should be considered by the Board in order to make an informed decision. The Board also requested and received various informational materials including, without limitation: (i) documents containing information about NWM, including financial information, a description of personnel and the services provided to the NWM Momentum Fund, information on investment advice, performance, summaries of NWM Momentum Fund expenses, compliance program, current legal matters, and other general information; (ii) comparative expense and performance information for other mutual funds with strategies similar to the NWM Momentum Fund; and (iii) benefits to be realized by NWM from its relationship with the NWM Momentum Fund.
The Board did not identify any particular information that was most relevant to its consideration to approve the Management Agreement and each Trustee may have afforded different weight to the various factors.
In deciding whether to approve the Management Agreement, the Trustees considered numerous factors, including:
1. The nature, extent, and quality of the services to be provided by NWM
In this regard, the Board considered the responsibilities of NWM under the Management Agreement. The Board reviewed the services to be provided by NWM to the NWM Momentum Fund including, without limitation, the procedures for formulating investment recommendations and assuring compliance with the NWM Momentum Fund’s investment objectives and limitations; NWM’s coordination of services for the NWM Momentum Fund among the service providers; and the efforts of NWM to promote the NWM Momentum Fund and grow assets. The Board considered: NWM’s staffing, personnel, and methods of operating; the education and experience of its personnel; and its compliance programs, policies, and procedures. After reviewing the foregoing and further information from NWM, the Board concluded that the quality, extent, and nature of the services provided by NWM was satisfactory and adequate for the NWM Momentum Fund.
2. Investment Performance of the NWM Momentum Fund and NWM
In considering the investment performance of the NWM Momentum Fund and NWM, the Trustees compared the short and long-term performance of the NWM Momentum Fund with the performance of funds with similar objectives managed by other investment advisers, as well as with aggregated peer group data and category averages. As to the performance of the NWM Momentum Fund, the Report included information regarding the performance its Morningstar Category (the Tactical Allocation category – the “Category”) and a group of funds of similar size,
2018 Annual Report 15
Additional Information (Unaudited) - continued
style and objective, derived from the Category (the “Peer Group”). Although not the determining factor in the Trustees’ considerations, this information assisted the Trustees in concluding to approve the Management Agreement by a measure of how the NWM Momentum Fund compares to other similar products. The performance data from the Category covered the periods ended December 31, 2017 and January 31, 2018 and for the Peer Group covered the period ended December 31, 2017. The Trustees noted that for the 1-year period ended December 31, 2017, the NWM Momentum Fund underperformed the Category, the Peer Group and the S&P 500 Index, but outperformed the Category, the Peer Group and the S&P 500 Index over the 3-year period ended December 31, 2017. They further noted that for the 1-year and 3-year periods ended January 31, 2018, the NWM Momentum Fund outperformed the Category, but underper-formed the S&P 500 Index over those same periods. The Trustees discussed NWM Momentum Fund’s investment strategy, noting that it is not designed to track the performance of the S&P 500 Index. The Trustees noted that neither NWM nor its affiliate managed other investment accounts with similar strategies as the NWM Momentum Fund. Notwithstanding the foregoing, after discussing the investment performance of the NWM Momentum Fund further, NWM’s experience managing and providing services to the NWM Momentum Fund, and other relevant factors, the Board concluded, in light of all the facts and circumstances, that the investment performance of the NWM Momentum Fund and NWM was satisfactory.
3. The Costs of the services to be provided and the profits to be realized by NWM from the relationship with the NWM Momentum Fund
In this regard, the Board considered: the financial condition of NWM and its affiliate and the level of commitment to the NWM Momentum Fund by NWM’s principals; the projected asset levels of the NWM Momentum Fund; and the overall expenses of the NWM Momentum Fund, including the expected nature and frequency of advisory fee payments. The Board also considered potential benefits for NWM in managing the NWM Momentum Fund. The Board compared the fees and expenses of the NWM Momentum Fund (including the management fee) to other funds comparable to it in terms of the type of fund, the style of investment management, the anticipated size of fund and the nature of the investment strategy and markets invested in, among other factors. The Board noted that the management fee payable to NWM under the Management Agreement was on the higher-range of the Category and Peer Group. They noted that the overall expense ratio was also higher than the averages for the Category and Peer Group. The Board also determined that these management fees were within an acceptable range in light of the services rendered by NWM. In light of the obligation of NWM to assume most of the operational expenses of the NWM Momentum Fund pursuant to a services agreement (the “Services Agreement”), the Board also determined that the overall fee arrangements for NWM with respect to the NWM Momentum Fund were fair and reasonable. They considered NWM’s decision to add breakpoints to its management fee structure in July of 2015 and its recommendation to add breakpoints to the Services Agreement at this meeting. The Board noted that NWM was profitable as it relates to its services to the NWM Momentum Fund before allocation of portfolio manager draws for the year ended December 31, 2017. Following this comparison and upon further consideration and discussion of the foregoing, the Board concluded that the fees to be paid to NWM were fair and reasonable.
4. The extent to which economies of scale would be realized as the NWM Momentum Fund grows and whether advisory fee levels reflect these economies of scale for the benefit of the NWM Momentum Fund’s investors
In this regard, the Board considered the NWM Momentum Fund’s fee arrangements with NWM. The Board noted that the management fee has breakpoints built into its current structure and that NWM is recommending the addition of breakpoints to the Services Agreement. They discussed NWM’s commitment to pay certain of the NWM Momentum Fund’s operating expenses, which has the effect of limiting the overall fees paid by the NWM Momentum Fund. Following further discussion of the NWM Momentum Fund’s asset levels, expectations for growth, and levels of fees, the Board determined that the NWM Momentum Fund’s fee arrangement with NWM was fair and reasonable and reasonable in relation to the nature and quality of the services to be provided by NWM.
5. Possible conflicts of interest and benefits to NWM
In evaluating the possibility for conflicts of interest, the Board considered such matters as: the experience and ability of the advisory personnel assigned to the NWM Momentum Fund; the basis of decisions to buy or sell securities for the NWM Momentum Fund; the method for bunching of portfolio securities transactions; NWM’s decision not to participate in soft dollar arrangements; the substance and administration of NWM’s Code of Ethics and other relevant policies described in NWM’s Form ADV. Following further consideration and discussion, the Board indicated that NWM’s standards and practices relating to the identification and mitigation of potential conflicts of interest were satisfactory.
2018 Annual Report 16
Additional Information (Unaudited) - continued
The Independent Trustees met in executive session to discuss the continuation of the Management Agreement. It was the Trustees’ consensus that the fee to be paid to NWM Fund Group, LLC pursuant to the Management Agreement was reasonable, that the overall arrangement provided under the terms of the Management Agreement was a reasonable business arrangement, and that the renewal of the Management Agreement was in the best interest of the Fund’s shareholders.
2018 Annual Report 17
Trustees and Officers
(Unaudited)
The Board of Trustees supervises the business activities of the Trust. The names of the Trustees and executive officers of the Trust are shown below. For more information regarding the Trustees, please refer to the Statement of Additional Information, which is available upon request by calling 1-888-331-9609. Each Trustee serves until the Trustee sooner dies, resigns, retires, or is removed.
The Trustees and Officers of the Trust and their principal business activities during the past five years are:
Interested Trustees and Officers
| | | | | Number of | |
| | | | Principal | Portfolios In | Other |
| Name, | Position(s) | Term of Office | Occupation(s) | Fund | Directorships |
| Address(1), | Held With | and Length of | During | Complex | Held By |
| and Year of Birth | the Trust | Time Served | Past 5 Years | Overseen By | Trustee |
| | | | | Trustee | |
| |
| Ross C. Provence, | President | Indefinite Term; | General Partner and Portfolio | N/A | N/A |
| Year of Birth: 1938 | | Since 2000 | Manager for Value Trend Capital | | |
| | | | Management, LP (1995 to current). | | |
| | | | Estate planning attorney (1963 to | | |
| current). |
| |
| Jeffrey R. Provence(2), | Trustee, | Indefinite Term; | CEO, Premier Fund Solutions, Inc. | 8 | Blue Chip |
| Year of Birth: 1969 | Secretary | Since 2000 | (2001 to current). General Partner | | Investor Funds, |
| | and | | and Portfolio Manager for Value | | Meeder Funds |
| | Treasurer | | Trend Capital Management, LP | | |
| | | | (1995 to current). | | |
| |
| Julian G. Winters, | Chief | Chief | Managing Member, Watermark | N/A | N/A |
| Year of Birth: 1968 | Compliance | Compliance | Solutions LLC (investment compli- | | |
| | Officer | Officer Since | ance and consulting) since March | | |
| | | 2010 | 2007. | | |
(1) The address of each trustee and officer is c/o PFS Funds, 1939 Friendship Drive, Suite C, El Cajon, California 92020.
(2) Jeffrey R. Provence is considered an “interested person” as defined in Section 2(a)(19) of the Investment Company Act of 1940 by virtue of his position with the Trust.
| | | | | Number of | |
| | | | Principal | Portfolios In | Other |
| Name, | Position | Term of Office | Occupation(s) | Fund | Directorships |
| Address(1), | Held With | and Length of | During | Complex | Held By |
| and Year of Birth | the Trust | Time Served | Past 5 Years | Overseen By | Trustee |
| | | | | Trustee | |
| |
| Thomas H. Addis III, | Independent | Indefinite Term; | Executive Director/CEO, Southern | 8 | None |
| Year of Birth: 1945 | Trustee | Since 2000 | California PGA (2006 to current). | | |
| |
| Allen C. Brown, | Independent | Indefinite Term; | Law Office of Allen C. Brown, Estate | 8 | Blue Chip |
| Year of Birth: 1943 | Trustee | Since 2010 | planning and business attorney | | Investor Funds |
| | | | (1970 to current). | | |
| |
| George Cossolias, CPA, | Independent | Indefinite Term; | Partner of CWDL, CPAs (February 1, | 8 | Blue Chip |
| Year of Birth: 1935 | Trustee | Since 2000 | 2014 to current). Owner of George | | Investor Funds |
| | | | Cossolias & Company, CPAs (1972 | | |
| | | | to January 31, 2014). President of | | |
| | | | Lubrication Specialists, Inc. (1996 to | | |
| current). |
(1) The address of each trustee and officer is c/o PFS Funds, 1939 Friendship Drive, Suite C, El Cajon, California 92020.
2018 Annual Report 18
Investment Adviser
NWM Fund Group, LLC
Legal Counsel
Practus, LLP
Custodian
US Bank, N.A.
Distributor
Rafferty Capital Markets, LLC
Dividend Paying Agent,
Shareholders’ Servicing Agent,
Transfer Agent
Mutual Shareholder Services, LLC
Fund Administrator
Premier Fund Solutions, Inc.
Independent Registered Public Accounting Firm
Cohen & Company, Ltd. |
This report is provided for the general information of the shareholders of the NWM
Momentum Fund. This report is not intended for distribution to prospective investors in
the Fund, unless preceded or accompanied by an effective prospectus. |
NWM Momentum Fund
www.nwmfund.com
1-888-331-9609
THE MOMENTUM BOND FUND
ANNUAL REPORT
March 31, 2018
TICKER MOMBX
The Momentum Bond Fund
Annual Report
March 31, 2018
We figured when we launched a bond fund in the middle of generational record low interest rates, it would be tough sledding. We were right. Our performance since launching has been just plain bad, mostly due to the fact we have only had one full quarter rotation in the fixed income securities. There is really not much to explain, but to say we are well aware that we will never outperform ever quarter, and there will be plenty of quarters like we have experienced during 1Q18 where we just flat out stink. That being said, we continue to believe in the strategy long term to help us navigate the fixed income market which will be more and more difficult to do in this recently more volatile rate changing environment.
The Fund was mostly impacted in 1Q18 from owning lower quality bonds that are more correlated to a rising stock market. With high quality bonds falling, matched with stock market volatility, our ‘junk bonds’ and convertible bond exposures were hit hard and contributed to adverse performance in the Fund. The signal at the time was like being long the stock market in a new fund launch right at the peak of the market.
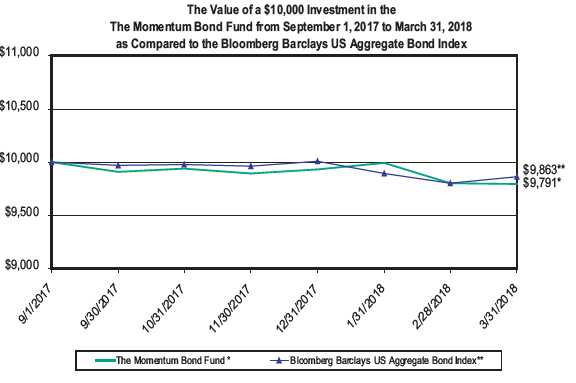
The Fund launched on September 1, 2017 at $10.00 and ended March 29, 2018 at $9.68. The Fund paid $0.1129 on December 27, 2017 for a total loss since inception of -2.09% .
Thanks for the patience!
Tim Ayles
Performance data quoted represents past performance. Past performance does not guarantee future results. The investment return and principal value of an investment will fluctuate so that an investor’s shares, when redeemed, may be worth more or less than their original cost. All returns include change in share prices, and reinvestment of any dividends and capital gains distributions. Current performance may be lower or higher than the performance data quoted. You may obtain performance data current to the most recent month-end by calling 1-888-331-9609. An investment in the fund is subject to investment risks, including the possible loss of the principal amount invested. The Fund’s principal underwriter is Rafferty Capital Markets, LLC.
2018 Annual Report 1
THE MOMENTUM BOND FUND (Unaudited)
PERFORMANCE INFORMATION
March 31, 2018 NAV $9.68
TOTAL RETURNS AS OF MARCH 31, 2018
| | Since | |
| | Inception(A) | |
| The Momentum Bond Fund | -2.09% | |
| Bloomberg Barclays US Aggregate Bond Index (B) | -1.37% | |
Annual Fund Operating Expense Ratio (from 9/1/17 Prospectus): 1.68%
The Annual Fund Operating Expense Ratio reported above will not correlate to the expense ratio in the Fund’s financial highlights because the financial highlights include only the direct operating expenses incurred by the Fund, not the indirect costs of investing in acquired funds.
(A)Since Inception returns include change in share prices and in each case includes reinvestment of any dividends and capital gain distributions. The Momentum Bond Fund commenced operations on September 1, 2017.
(B)The Bloomberg Barclays US Aggregate Bond Index is a broad-based flagship benchmark that measures the investment grade, US dollar-denominated, fixed-rate taxable bond market. The Index includes Treasuries, government-related and corporate securities, MBS (agency fixed-rate and hybrid ARM pass throughs), ABS and CMBS (agency and non-agency). Investors cannot directly invest in an index.
PAST PERFORMANCE DOES NOT GUARANTEE FUTURE RESULTS. INVESTMENT RETURN AND PRINCIPAL VALUE WILL FLUCTUATE SO THAT SHARES, WHEN REDEEMED, MAY BE WORTH MORE OR LESS THAN THEIR ORIGINAL COST. RETURNS DO NOT REFLECT THE DEDUCTION OF TAXES THAT A SHAREHOLDER WOULD PAY ON FUND DISTRIBUTIONS OR THE REDEMPTION OF FUND SHARES. CURRENT PERFORMANCE MAY BE LOWER OR HIGHER THAN THE PERFORMANCE DATA QUOTED. TO OBTAIN PERFORMANCE DATA CURRENT TO THE MOST RECENT MONTH END, PLEASE CALL 1-888-331-9609. AN INVESTMENT IN THE FUND IS SUBJECT TO INVESTMENT RISKS, INCLUDING THE POSSIBLE LOSS OF THE PRINCIPAL AMOUNT INVESTED. THE FUND'S DISTRIBUTOR IS RAFFERTY CAPITAL MARKETS, LLC.
2018 Annual Report 2
THE MOMENTUM BOND FUND (Unaudited)
The Momentum Bond Fund
by Sectors (as a percentage of Net Assets)

Availability of Quarterly Schedule of Investments
The Fund files its complete schedule of portfolio holdings with the Securities and Exchange Commission (“SEC”) for the first and third quarters of each fiscal year on Form N-Q. The Fund’s Form N-Q is available on the SEC’s Web site at http://www.sec.gov. The Fund’s Form N-Q may also be reviewed and copied at the SEC’s Public Reference Room in Washington, DC. Information on the operation of the Public Reference Room may be obtained by calling 1-800-SEC-0330.
Proxy Voting Guidelines
NWM Fund Group, LLC, the Fund’s investment adviser (“Adviser”), is responsible for exercising the voting rights associated with the securities held by the Fund. A description of the policies and procedures used by the Adviser in fulfilling this responsibility is available without charge on the Fund’s website at www.nwmfund.com. It is also included in the Fund’s Statement of Additional Information, which is available on the SEC’s website at http://www.sec.gov. Information regarding how the Fund voted proxies, Form N-PX, relating to portfolio securities during the most recent period ended June 30th, is available without charge, upon request, by calling our toll free number (1-888-331-9609). This information will be also available on the SEC’s website at http://www.sec.gov.
2018 Annual Report 3
Expense Example
(Unaudited)
Shareholders of this Fund incur ongoing costs consisting of management fees and service fees. Although the Fund charges no sales loads or transaction fees, you will be assessed fees for outgoing wire transfers, returned checks and stop payment orders at prevailing rates charged by Mutual Shareholder Services, LLC, the Fund’s transfer agent. IRA accounts will be charged an $8.00 annual maintenance fee. If shares are redeemed within 90 days of purchase from the Fund, the shares are subject to a 2% redemption fee. Additionally, your account will be indirectly subject to the expenses of the underlying funds. The following example is intended to help you understand your ongoing costs of investing in the Fund and to compare these costs with similar costs of investing in other mutual funds. The example is based on an investment of $1,000 invested in the Fund on October 1, 2017 and held through March 31, 2018.
The first line of the table below provides information about actual account values and actual expenses. In order to estimate the expenses a shareholder paid during the period covered by this report, shareholders can divide their account value by $1,000 (for example, an $8,600 account value divided by $1,000 = 8.6) and then multiply the result by the number in the first line under the heading entitled “Expenses Paid During the Period.”
The second line of the table below provides information about hypothetical account values and hypothetical expenses based on the Fund’s actual expense ratio and an assumed rate of return of 5% per year before expenses, which is not the Fund’s actual return. The hypothetical account values and expenses may not be used to estimate the actual ending account balance or expenses paid by a shareholder for the period. Shareholders may use this information to compare the ongoing costs of investing in this Fund and other funds. To do so, compare this 5% hypothetical example with the 5% hypothetical examples that appear in other funds’ shareholder reports.
Please note that the expenses shown in the table are meant to highlight your ongoing costs only and do not reflect any transactional costs, such as redemption fees or the charges assessed by Mutual Shareholder Services, LLC as described above and expenses of underlying funds. Therefore, the second line of the table is useful in comparing ongoing costs only, and will not help you determine the relative total costs of owning different funds. In addition, if these transactional costs and expenses of underlying funds were included, your costs would have been higher.
| | | | | | | Expenses Paid |
| | | Beginning | | Ending | | During the Period* |
| | | Account Value | | Account Value | | October 1, 2017 |
| | | October 1, 2017 | | March 31, 2018 | | to March 31, 2018 |
| |
| Actual | | $1,000.00 | | $988.03 | | $7.14 |
| |
| Hypothetical | | $1,000.00 | | $1,017.75 | | $7.24 |
| (5% annual return | | | | | | |
| before expenses) | | | | | | |
| * | Expenses are equal to the Fund’s annualized expense ratio of 1.44%, multiplied by the average account value over the period, multiplied by 182/365 (to reflect the one-half year period). |
| |
2018 Annual Report 4
| The Momentum Bond Fund |
| | | | Schedule of Investments |
| | | | March 31, 2018 |
| Shares | | | Fair Value | | % of Net Assets |
| | | | | | |
| EXCHANGE TRADED FUNDS | | | | | |
| 27,980 | iShares® iBoxx $ High Yield Corporate Bond ETF | $ | 2,396,207 | | | |
| 21,337 | iShares® J.P. Morgan USD Emerging Markets Bond ETF | | 2,407,240 | | | |
| 83,142 | PowerShares Emerging Markets Sovereign Debt Portfolio | | 2,343,773 | | | |
| 48,263 | SPDR® Bloomberg Barclays Convertible Securities ETF | | 2,493,267 | | | |
| 66,526 | SPDR® Bloomberg Barclays High Yield Bond ETF | | 2,384,957 | | | |
| Total for Exchange Traded Funds (Cost $12,367,688) | | 12,025,444 | | 97.15 | % |
| | | | | | |
| Total Investment Securities | | 12,025,444 | | | |
| | (Cost $12,367,688) | | | | | |
| Other Assets in Excess of Liabilities | | 352,787 | | 2.85 | % |
| Net Assets | | $ | 12,378,231 | | 100.00 | % |
The accompanying notes are an integral part of these
financial statements. |
2018 Annual Report 5
| The Momentum Bond Fund | | | |
| |
| Statement of Assets and Liabilities | | | |
| March 31, 2018 | | | |
| |
| Assets: | | | |
| Investment Securities at Fair Value | $ | 12,025,444 | |
| (Cost $12,367,688) | | | |
| Cash | | 367,961 | |
| Total Assets | | 12,393,405 | |
| Liabilities: | | | |
| Management Fees Payable | | 10,432 | |
| Service Fees Payable | | 4,742 | |
| Total Liabilities | | 15,174 | |
| Net Assets | $ | 12,378,231 | |
| |
| Net Assets Consist of: | | | |
| Paid In Capital | $ | 12,758,886 | |
| Accumulated Undistributed Net Investment Income/(Loss) | | 47,154 | |
| Accumulated Undistributed Realized Gain/(Loss) on Investments - Net | | (85,565 | ) |
| Unrealized Appreciation/(Depreciation) in Value of Investments | | | |
| Based on Identified Cost - Net | | (342,244 | ) |
| Net Assets, for 1,279,352 Shares Outstanding | $ | 12,378,231 | |
| (Unlimited shares authorized, without par value) | | | |
| Net Asset Value and Offering Price Per Share | | | |
| ($12,378,231/1,279,352 shares) | $ | 9.68 | |
| Redemption Price ($9.68 x 0.98) (Note 2) * | $ | 9.49 | |
| |
| Statement of Operations | | | |
| For the period September 1, 2017** through March 31, 2018 | | | |
| |
| Investment Income: | | | |
| Dividends | $ | 283,850 | |
| Total Investment Income | | 283,850 | |
| Expenses: | | | |
| Management Fees (Note 4) | | 67,720 | |
| Service Fees (Note 4) | | 34,202 | |
| Total Expenses | | 101,922 | |
| Less: Expenses Waived (Note 4) | | (3,420 | ) |
| Net Expenses | | 98,502 | |
| |
| Net Investment Income/(Loss) | | 185,348 | |
| |
| Realized and Unrealized Gain/(Loss) on Investments: | | | |
| Net Realized Gain/(Loss) on Investments | | (85,565 | ) |
| Net Change in Unrealized Appreciation/(Depreciation) on Investments | | (342,244 | ) |
| Net Realized and Unrealized Gain/(Loss) on Investments | | (427,809 | ) |
| |
| Net Increase/(Decrease) in Net Assets from Operations | $ | (242,461 | ) |
* Reflects a 2% redemption fee if shares are redeemed within 90 days of purchase.
** Commencement of Operations. |
The accompanying notes are an integral part of these
financial statements. |
2018 Annual Report 6
| The Momentum Bond Fund |
| | |
| Statement of Changes in Net Assets | | | | |
| | | 9/1/2017* | | |
| | | to | | |
| | | 3/31/2018 | | |
| From Operations: | | | | |
| Net Investment Income/(Loss) | $ | 185,348 | | |
| Net Realized Gain/(Loss) on Investments | | (85,565 | ) | |
| Net Change in Unrealized Appreciation/(Depreciation) | | (342,244 | ) | |
| Increase/(Decrease) in Net Assets from Operations | | (242,461 | ) | |
| From Distributions to Shareholders: | | | | |
| Net Investment Income | | (138,194 | ) | |
| Net Realized Gain from Security Transactions | | - | | |
| Change in Net Assets from Distributions | | (138,194 | ) | |
| From Capital Share Transactions: | | | | |
| Proceeds From Sale of Shares | | 13,309,324 | | |
| Proceeds From Redemption Fees (Note 2) | | 2,009 | | |
| Shares Issued on Reinvestment of Dividends | | 138,194 | | |
| Cost of Shares Redeemed | | (690,641 | ) | |
| Net Increase/(Decrease) from Shareholder Activity | | 12,758,886 | | |
| Net Increase/(Decrease) in Net Assets | | 12,378,231 | | |
| Net Assets at Beginning of Period | | - | | |
| Net Assets at End of Period (Including Accumulated Undistributed | | | | |
| Net Investment Income/(Loss) of $47,154) | $ | 12,378,231 | | |
| Share Transactions: | | | | |
| Issued | | 1,335,438 | | |
| Reinvested | | 14,072 | | |
| Redeemed | | (70,158 | ) | |
| Net Increase/(Decrease) in Shares | | 1,279,352 | | |
| Shares Outstanding Beginning of Period | | - | | |
| Shares Outstanding End of Period | | 1,279,352 | | |
| | |
| Financial Highlights | | | | |
| Selected data for a share outstanding throughout the period: | | 9/1/2017* | | |
| | | to | | |
| | | 3/31/2018 | | |
| Net Asset Value - | | | | |
| Beginning of Period | $ | 10.00 | | |
| Net Investment Income/(Loss) (a) (e) | | 0.15 | | |
| Net Gain/(Loss) on Securities | | | | |
| (Realized and Unrealized) (b) | | (0.36 | ) | |
| Total from Investment Operations | | (0.21 | ) | |
| Distributions (From Net Investment Income) | | (0.11 | ) | |
| Distributions (From Realized Capital Gains) | | - | | |
| Total Distributions | | (0.11 | ) | |
| Proceeds from Redemption Fee (Note 2) | | - | | + |
| Net Asset Value - End of Period | $ | 9.68 | | |
| Total Return (c) | | (2.09)% | | ** |
| Ratios/Supplemental Data | | | | |
| Net Assets - End of Period (Thousands) | $ | 12,378 | | |
| Before Waiver | | | | |
| Ratio of Expenses to Average Net Assets (d) | | 1.49% | | *** |
| Ratio of Net Investment Income/(Loss) to Average Net Assets (d) (e) | | 2.66% | | *** |
| After Waiver | | | | |
| Ratio of Expenses to Average Net Assets (d) | | 1.44% | | *** |
| Ratio of Net Investment Income/(Loss) to Average Net Assets (d) (e) | | 2.71% | | *** |
| Portfolio Turnover Rate | | 26.56% | | ** |
* Commencement of Operations. ** Not Annualized. *** Annualized.
+ Amount calculated is less than +/- $0.005.
(a) Per share amounts were calculated using the average shares method.
(b) Realized and unrealized gains and losses per share in this caption are balancing amounts necessary to
reconcile the change in net asset value for the period and may not reconcile with the aggregate gains and
losses in the Statement of Operations due to share transactions for the period.
(c) Total return represents the rate that the investor would have earned or lost on an investment in the Fund
assuming reinvestment of dividends and distributions.
(d) These ratios exclude the impact of expenses of the underlying investment security holdings listed in the
Schedule of Investments.
(e) Recognition of net investment income/(loss) by the Fund is affected by the timing of the declaration of
dividends by the underlying investment security holdings listed on the Schedule of Investments. |
The accompanying notes are an integral part of these
financial statements. |
2018 Annual Report 7
NOTES TO THE FINANCIAL STATEMENTS
THE MOMENTUM BOND FUND
March 31, 2018
1.) ORGANIZATION
The Momentum Bond Fund (the “Fund”) was organized as a non-diversified series of the PFS Funds (the “Trust”) on June 20, 2017. The Trust was established under the laws of Massachusetts by an Agreement and Declaration of Trust dated January 13, 2000. The Trust is registered as an open-end investment company under the Investment Company Act of 1940, as amended (the “1940 Act”). The Trust may offer an unlimited number of shares of beneficial interest in a number of separate series, each series representing a distinct fund with its own investment objectives and policies. As of March 31, 2018, there were eight series authorized by the Trust. The Fund commenced operations on September 1, 2017. The Fund’s primary investment objective is capital growth with a secondary objective of generating income. The investment adviser to the Fund is NWM Fund Group, LLC (the “Adviser”).
2.) SIGNIFICANT ACCOUNTING POLICIES
The Fund is an investment company and accordingly follows the investment company accounting and reporting guidance of the Financial Accounting Standards Board (“FASB”) Accounting Standards Codification Topic 946 Financial Services - Investment Companies. The financial statements are prepared in conformity with accounting principles generally accepted in the United States of America (“GAAP”). The Fund follows the significant accounting policies described in this section.
SECURITY VALUATION
All investments in securities are recorded at their estimated fair value, as described in Note 3.
SHARE VALUATION
The net asset value per share (the “NAV”) is generally calculated as of the close of trading on the New York Stock Exchange (the “Exchange”)(normally 4:00 p.m. Eastern time) every day the Exchange is open. The NAV is calculated by taking the total value of the Fund’s assets, subtracting its liabilities, and then dividing by the total number of shares outstanding, rounded to the nearest cent. The offering price and redemption price per share is equal to the net asset value per share, except that shares of the Fund are subject to a redemption fee of 2% if redeemed within 90 days of purchase. During the period September 1, 2017 (commencement of operations) through March 31, 2018, proceeds from redemption fees were $2,009.
FEDERAL INCOME TAXES
The Fund’s policy is to continue to comply with the requirements of the Internal Revenue Code that are applicable to regulated investment companies and to distribute all of its taxable income to shareholders. Therefore, no federal income tax provision is required. It is the Fund’s policy to distribute annually, prior to the end of the calendar year, dividends sufficient to satisfy excise tax requirements of the Internal Revenue Code. This Internal Revenue Code requirement may cause an excess of distributions over the book year-end accumulated income. In addition, it is the Fund’s policy to distribute annually, after the end of the fiscal year, any remaining net investment income and net realized capital gains.
The Fund recognizes the tax benefits of certain tax positions only where the position is “more likely than not” to be sustained assuming examination by tax authorities. Management has analyzed the Fund’s tax positions, and has concluded that no liability for unrecognized tax benefits should be recorded related to uncertain tax positions taken on returns filed for open tax years. The Fund identifies its major tax jurisdictions as U.S. Federal tax authorities; however, the Fund is not aware of any tax positions for which it is reasonably possible that the total amounts of unrecognized tax benefits will change materially in the next twelve months. The Fund recognizes interest and penalties, if any, related to unrecognized tax benefits as income tax expense in the Statement of Operations. During the period September 1, 2017 (commencement of operations) through March 31, 2018, the Fund did not incur any interest or penalties.
DISTRIBUTIONS TO SHAREHOLDERS
Distributions to shareholders, which are determined in accordance with income tax regulations, are recorded on the ex-dividend date.
The treatment for financial reporting purposes of distributions made to shareholders during the year from net investment income or net realized capital gains may differ from their ultimate treatment for federal income tax purposes. These differences are caused primarily by differences in the timing of the recognition of certain components of income, expense, or realized capital gain for federal income tax purposes. Where such differences are permanent in nature, they are
2018 Annual Report 8
Notes to the Financial Statements - continued
reclassified in the components of the net assets based on their ultimate characterization for federal income tax purposes. Any such reclassifications will have no effect on net assets, result of operations, or net asset value per share of the Fund.
USE OF ESTIMATES
The financial statements are prepared in accordance with GAAP, which requires management to make estimates and assumptions that affect the reported amounts of assets and liabilities and disclosure of contingent assets and liabilities at the date of the financial statements and the reported amounts of increases and decreases in net assets from operations during the reporting period. Actual results could differ from those estimates.
ORGANIZATIONAL & OFFERING EXPENSES
All costs incurred by the Fund in connection with the organization, offering and initial registration of the Fund, principally professional fees, were paid on behalf of the Fund by the Adviser and will not be borne by the Fund.
EXPENSES
Expenses incurred by the Trust that do not relate to a specific fund of the Trust are allocated to the individual funds based on each fund’s relative net assets or another appropriate basis.
OTHER
The Fund records security transactions based on a trade date for financial reporting purposes. Dividend income is recognized on the ex-dividend date, and interest income, if any, is recognized on an accrual basis. The Fund uses the specific identification method in computing gain or loss on the sale of investment securities. Withholding taxes on foreign dividends have been provided for in accordance with the Fund’s understanding of the applicable country’s tax rules and rates.
3.) INVESTMENT SECURITIES VALUATION
The Fund utilizes various methods to measure the fair value of most of its investments on a recurring basis. GAAP establishes a hierarchy that prioritizes inputs to valuation methods. The three levels of inputs are:
Level 1 - Unadjusted quoted prices in active markets for identical assets or liabilities that the Fund has the ability to access.
Level 2 - Inputs other than quoted prices included in level 1 that are observable for the asset or liability, either directly or indirectly. These inputs may include quoted prices for the identical instrument on an inactive market, prices for similar instruments, interest rates, prepayment speeds, credit risk, yield curves, default rates and similar data.
Level 3 - Unobservable inputs for the asset or liability, to the extent relevant observable inputs are not available, representing the Fund’s own assumptions about the assumptions a market participant would use in valuing the asset or liability, and would be based on the best information available.
The availability of observable inputs can vary from security to security and is affected by a wide variety of factors, including, for example, the type of security, whether the security is new and not yet established in the marketplace, the liquidity of markets, and other characteristics particular to the security. To the extent that valuation is based on models or inputs that are less observable or unobservable in the market, the determination of fair value requires more judgment. Accordingly, the degree of judgment exercised in determining fair value is greatest for instruments categorized in level 3.
The inputs used to measure fair value may fall into different levels of the fair value hierarchy. In such cases, for disclosure purposes, the level in the fair value hierarchy within which the fair value measurement falls in its entirety, is determined based on the lowest level input that is significant to the fair value measurement in its entirety.
FAIR VALUE MEASUREMENTS
A description of the valuation techniques applied to the Fund’s major categories of assets measured at fair value on a recurring basis follows:
Equity securities (exchange traded funds). Equity securities generally are valued by using market quotations, but may be valued on the basis of prices furnished by a pricing service when the Adviser believes such prices accurately reflect the fair market value of such securities. Securities that are traded on any stock exchange or on the NASDAQ over-the-counter market are generally valued by the pricing service at the last quoted sale price. Lacking a last sale price, an equity
2018 Annual Report 9
Notes to the Financial Statements - continued
security is generally valued by the pricing service at its last bid price. Generally, if the security is traded in an active market and is valued at the last sale price, the security is categorized as a level 1 security. When market quotations are not readily available, when the Adviser determines that the market quotation or the price provided by the pricing service does not accurately reflect the current fair value, or when restricted securities are being valued, such securities are valued as determined in good faith by the Adviser, subject to review of the Board of Trustees (the “Trustees” or the “Board”) and are categorized in level 2 or level 3, when appropriate.
In accordance with the Trust’s good faith pricing guidelines, the Adviser is required to consider all appropriate factors relevant to the value of securities for which it has determined other pricing sources are not available or reliable as described above. There is no single method for determining fair value, since fair value depends upon the circumstances of each individual case. As a general principle, the current fair value of an issue of securities being valued by the Adviser would appear to be the amount which the owner might reasonably expect to receive for them upon their current sale. Methods which are in accordance with this principle may, for example, be based on (i) a multiple of earnings; (ii) a discount from market of a similar freely traded security (including a derivative security or a basket of securities traded on other markets, exchanges or among dealers); or (iii) yield to maturity with respect to debt issues, or a combination of these and other methods.
The following table summarizes the inputs used to value the Fund’s assets measured at fair value as of March 31, 2018:
| Valuation Inputs of Assets | | Level 1 | | Level 2 | | Level 3 | | Total |
| Exchange Traded Funds | | $12,025,444 | | $0 | | $0 | | $12,025,444 |
| Total | | $12,025,444 | | $0 | | $0 | | $12,025,444 |
The Fund did not hold any Level 3 assets during the period September 1, 2017 (commencement of operations) through March 31, 2018. There were no transfers into or out of level 1 and level 2 during the period September 1, 2017 (commencement of operations) through March 31, 2018. It is the Fund’s policy to consider transfers into or out of the levels as of the end of the reporting period.
The Fund did not invest in derivative instruments during the period September 1, 2017 (commencement of operations) through March 31, 2018.
4.) INVESTMENT ADVISORY AGREEMENT AND SERVICES AGREEMENT
The Fund has entered into an investment advisory agreement (“Management Agreement”) with the Adviser. The Adviser manages the investment portfolio of the Fund, subject to policies adopted by the Trust’s Board of Trustees, and, at its own expense and without reimbursement from the Trust, furnishes office space and all necessary office facilities, equipment and executive personnel necessary for managing the Fund. The Adviser receives an investment management fee equal to 0.99% of the Fund’s average daily net assets up to $200 million and 0.90% of the Fund’s average daily net assets in excess of $200 million.
Under the terms of the Services Agreement between the Trust and the Adviser (the “Services Agreement”), the Adviser renders administrative and supervisory services to the Fund, provides the services of a chief compliance officer and assumes and pays all ordinary expenses of the Fund, excluding management fees, brokerage fees and commissions, 12b-1 fees (if adopted), taxes, borrowing costs (such as (a) interest and (b) dividend expenses on securities sold short), ADR fees, fees and expenses of acquired funds, and extraordinary or non-recurring expenses. For its services, the Adviser receives a service fee equal to 0.50% of the average daily net assets of the Fund. Effective September 1, 2017 the Adviser has contractually agreed to waive Services Agreement fees by 0.05% of its average daily net assets through July 31, 2019. The Services Agreement fee waiver will automatically terminate on July 31, 2019 unless it is renewed by the Adviser. The Adviser may not terminate the fee waiver before July 31, 2019. The Adviser is not entitled to recoupment of fees waived.
For the period September 1, 2017 (commencement of operations) through March 31, 2018, the Adviser earned management fees totaling $67,720, of which $10,432 was due to the Adviser at March 31, 2018. For the same period, the Adviser earned service fees of $34,202, of which $4,742 was due to the Adviser at March 31, 2018. Service fees totaling $3,420 were waived with no recapture provision for the period September 1, 2017 (commencement of operations) through March 31, 2018.
2018 Annual Report 10
Notes to the Financial Statements - continued
5.) RELATED PARTY TRANSACTIONS
Jeffrey R. Provence of Premier Fund Solutions, Inc. (the “Administrator”) also serves as trustee/officer of the Fund. This individual receives benefits from the Administrator resulting from administration fees paid to the Administrator of the Fund by the Adviser.
For the period September 1, 2017 (commencement of operations) through March 31, 2018, the Trustees who are not interested persons of the Fund received Trustees’ fees of $750 each, for a total of $2,250, plus travel expenses from the Adviser of the Fund. Under the Services Agreement, the Adviser pays these fees.
6.) PURCHASES AND SALES OF SECURITIES
For the period September 1, 2017 (commencement of operations) through March 31, 2018, purchases and sales of investment securities other than U.S. Government obligations and short-term investments aggregated $15,201,519 and $2,748,266, respectively. Purchases and sales of U.S. Government obligations aggregated $0 and $0, respectively.
7.) CONTROL OWNERSHIP
The beneficial ownership, either directly or indirectly, of more than 25% of the voting securities of a fund creates a presumption of control of that fund, under Section 2(a)(9) of the Investment Company Act of 1940. As of March 31, 2018, TD Ameritrade Inc., for the benefit of its customers, held, in aggregate, 97.57% of the shares in the Fund. The Trust does not know whether the foregoing entity or any of the underlying beneficial holders owned or controlled 25% or more of the voting securities of the Fund.
8.) TAX MATTERS
For Federal income tax purposes, the cost of securities owned at March 31, 2018 was $12,376,092.
At March 31, 2018, the composition of gross unrealized appreciation (the excess of value over tax cost) and depreciation (the excess of tax cost over value) of investments on a tax basis was as follows:
| | Appreciation | | (Depreciation) | | Net Appreciation/(Depreciation) | |
| | $33,178 | | ($383,826) | | ($350,648) | |
The tax character of distributions was as follows:
| | | September 1, 2017 |
| | | through March 31, 2018 |
| Ordinary Income: | | $ 138,194 |
| Long-term Capital Gain: | | 0 |
| | | $ 138,194 |
As of March 31, 2018, the components of distributable earnings/(accumulated losses) on a tax basis were as follows:
| Undistributed ordinary income | | $ 47,154 | |
| Other accumulated losses | | (177 | ) |
| Undistributed long-term capital gain/(accumulated losses) | | (76,984 | ) |
| Unrealized appreciation/(depreciation) – net | | (350,648 | ) |
| | | $ 380,655 | |
As of March 31, 2018, the difference between book basis and tax basis unrealized appreciation (depreciation) is primarly attributable to the tax deferral of losses on wash sales. Other accumulated losses includes post–October capital losses of $177.
As of March 31, 2018, the Fund had available for federal tax purposes an unused capital loss car-ryforward of $76,984, of which the entire amount is short-term with no expiration.
9.) SUBSEQUENT EVENTS
Subsequent events after the date of the Statement of Assets and Liabilities have been evaluated through the date the financial statements were issued. Management has concluded that there is no impact requiring adjustment to or disclosure in the financial statements.
2018 Annual Report 11
REPORT OF INDEPENDENT REGISTERED PUBLIC ACCOUNTING FIRM
To the Shareholders of The Momentum Bond Fund
and Board of Trustees of PFS Funds
Opinion on the Financial Statements
We have audited the accompanying statement of assets and liabilities, including the schedule of investments, of The Momentum Bond Fund (the “Fund”), a series of PFS Funds, as of March 31, 2018, and the related statements of operations and changes in net assets, including the related notes, and the financial highlights for the period September 1, 2017 (commencement of operations) through March 31, 2018 (collectively referred to as the “financial statements”). In our opinion, the financial statements present fairly, in all material respects, the financial position of the Fund as of March 31, 2018, the results of its operations, the changes in its net assets, and the financial highlights for the period September 1, 2017 (commencement of operations) through March 31, 2018, in conformity with accounting principles generally accepted in the United States of America.
Basis for Opinion
These financial statements are the responsibility of the Fund’s management. Our responsibility is to express an opinion on the Fund’s financial statements based on our audit. We are a public accounting firm registered with the Public Company Accounting Oversight Board (United States) (“PCAOB”) and are required to be independent with respect to the Fund in accordance with the U.S. federal securities laws and the applicable rules and regulations of the Securities and Exchange Commission and the PCAOB.
We conducted our audit in accordance with the standards of the PCAOB. Those standards require that we plan and perform the audit to obtain reasonable assurance about whether the financial statements are free of material misstatement, whether due to error or fraud.
Our audit includes performing procedures to assess the risks of material misstatement of the financial statements, whether due to error or fraud, and performing procedures that respond to those risks. Such procedures include examining, on a test basis, evidence regarding the amounts and disclosures in the financial statements and confirmation of securities owned as of March 31, 2018, by correspondence with the custodian. Our audit also included evaluating the accounting principles used and significant estimates made by management, as well as evaluating the overall presentation of the financial statements. We believe that our audit provides a reasonable basis for our opinion.
We have served as auditor of one or more investment companies within the Trust since 2014.

COHEN & COMPANY, LTD.
Cleveland, Ohio
May 23, 2018
2018 Annual Report 12
Trustees and Officers
(Unaudited)
The Board of Trustees supervises the business activities of the Trust. The names of the Trustees and executive officers of the Trust are shown below. For more information regarding the Trustees, please refer to the Statement of Additional Information, which is available upon request by calling 1-888-331-9609. Each Trustee serves until the Trustee sooner dies, resigns, retires, or is removed.
The Trustees and Officers of the Trust and their principal business activities during the past five years are:
Interested Trustees and Officers
| | | | | Number of | |
| | | | Principal | Portfolios In | Other |
| Name, | Position(s) | Term of Office | Occupation(s) | Fund | Directorships |
| Address(1), | Held With | and Length of | During | Complex | Held By |
| and Year of Birth | the Trust | Time Served | Past 5 Years | Overseen By | Trustee |
| | | | | Trustee | |
| |
| Ross C. Provence, | President | Indefinite Term; | General Partner and Portfolio | N/A | N/A |
| Year of Birth: 1938 | | Since 2000 | Manager for Value Trend Capital | | |
| | | | Management, LP (1995 to current). | | |
| | | | Estate planning attorney (1963 to | | |
| current). |
| |
| Jeffrey R. Provence(2), | Trustee, | Indefinite Term; | CEO, Premier Fund Solutions, Inc. | 8 | Blue Chip |
| Year of Birth: 1969 | Secretary | Since 2000 | (2001 to current). General Partner | | Investor Funds, |
| | and | | and Portfolio Manager for Value | | Meeder Funds |
| | Treasurer | | Trend Capital Management, LP | | |
| | | | (1995 to current). | | |
| |
| Julian G. Winters, | Chief | Chief | Managing Member, Watermark | N/A | N/A |
| Year of Birth: 1968 | Compliance | Compliance | Solutions LLC (investment compli- | | |
| | Officer | Officer Since | ance and consulting) since March | | |
| | | 2010 | 2007. | | |
(1) The address of each trustee and officer is c/o PFS Funds, 1939 Friendship Drive, Suite C, El Cajon, California 92020.
(2) Jeffrey R. Provence is considered an “interested person” as defined in Section 2(a)(19) of the Investment Company Act of 1940 by
virtue of his position with the Trust. |
| | | | | Number of | |
| | | | Principal | Portfolios In | Other |
| Name, | Position | Term of Office | Occupation(s) | Fund | Directorships |
| Address(1), | Held With | and Length of | During | Complex | Held By |
| and Year of Birth | the Trust | Time Served | Past 5 Years | Overseen By | Trustee |
| | | | | Trustee | |
| |
| Thomas H. Addis III, | Independent | Indefinite Term; | Executive Director/CEO, Southern | 8 | None |
| Year of Birth: 1945 | Trustee | Since 2000 | California PGA (2006 to current). | | |
| |
| Allen C. Brown, | Independent | Indefinite Term; | Law Office of Allen C. Brown, Estate | 8 | Blue Chip |
| Year of Birth: 1943 | Trustee | Since 2010 | planning and business attorney | | Investor Funds |
| | | | (1970 to current). | | |
| |
| George Cossolias, CPA, | Independent | Indefinite Term; | Partner of CWDL, CPAs (February 1, | 8 | Blue Chip |
| Year of Birth: 1935 | Trustee | Since 2000 | 2014 to current). Owner of George | | Investor Funds |
| | | | Cossolias & Company, CPAs (1972 | | |
| | | | to January 31, 2014). President of | | |
| | | | Lubrication Specialists, Inc. (1996 to | | |
| current). |
(1) The address of each trustee and officer is c/o PFS Funds, 1939 Friendship Drive, Suite C, El Cajon, California 92020.
2018 Annual Report 13
Investment Adviser
NWM Fund Group, LLC
Legal Counsel
Practus, LLP
Custodian
US Bank, N.A.
Distributor
Rafferty Capital Markets, LLC
Dividend Paying Agent,
Shareholders' Servicing Agent,
Transfer Agent
Mutual Shareholder Services, LLC
Fund Administrator
Premier Fund Solutions, Inc.
Independent Registered Public Accounting Firm
Cohen & Company, Ltd. |
This report is provided for the general information of the shareholders of The
Momentum Bond Fund. This report is not intended for distribution to prospective
investors in the Fund, unless preceded or accompanied by an effective prospectus. |
The Momentum Bond Fund
www.nwmfund.com
1-888-331-9609
Item 2. Code of Ethics.
The registrant has adopted a code of ethics that applies to the registrant’s principal executive officer and the principal financial officer. The registrant has not made any amendments to its code of ethics during the covered period. The registrant has not granted any waivers from any provisions of the code of ethics during the covered period. A copy of the registrant’s Code of Ethics is filed herewith.
Item 3. Audit Committee Financial Expert.
The registrant’s Board of Trustees has determined that George Cossolias is an audit committee finical expert. Mr. Cossolias is independent for purposes of this Item 3.
Item 4. Principal Accountant Fees and Services.
(a-d) The following table details the aggregate fees billed for each of the last two fiscal years for audit fees, audit-related fees, tax fees and other fees by the principal accountant to the registrant. The principal accountant has provided no services to the adviser or any entity controlled by, or under common control with the adviser that provides ongoing services to the registrant.
| | | FYE 3/31/18 | | FYE 3/31/17 |
| Audit Fees | | $26,000 | | $13,250 |
| Audit-Related Fees | | $0 | | $0 |
| Tax Fees | | $6,000 | | $2,500 |
| All Other Fees | | $1,500 | | $0 |
Nature of Tax Fees: preparation of Excise Tax Statement and 1120 RIC.
Nature of All Other Fees: Review of Semi-Annual Report.
(e) (1) The audit committee approves all audit and non-audit related services and, therefore, has not adopted pre-approval policies and procedures described in paragraph (c)(7) of Rule 2-01 of Regulation S-X.
(e) (2) None of the services described in paragraph (b) through (d) of this Item were approved by the audit committee pursuant to paragraph (c)(7)(i)(C) of Rule 2-01 of Regulation S-X.
(f) All of the principal accountant’s hours spent on auditing the registrant’s financial statements were attributed to work performed by full-time permanent employees of the principal accountant.
(g) The following table indicates the aggregate non-audit fees billed by the registrant’s principal accountant for services to the registrant , the registrant’s investment adviser (not sub-adviser), and any entity controlling, controlled by, or under common control with the adviser that provides ongoing services to the registrant, for the last two years.
| Non-Audit Fees | | FYE 3/31/18 | | FYE 3/31/17 |
| Registrant | | $7,500 | | $2,500 |
| Registrant’s Investment Adviser | | $0 | | $0 |
(h) The principal accountant provided no services to the investment adviser or any entity controlling, controlled by, or under common control with the adviser that provides ongoing services to the registrant.
Item 5. Audit Committee of Listed Companies. Not applicable.
Item 6. Schedule of Investments. Schedule filed with Item 1.
Item 7. Disclosure of Proxy Voting Policies and Procedures for Closed-End Management Investment Companies. Not applicable.
Item 8. Portfolio Managers of Closed End Management Investment Companies. Not applicable.
Item 9. Purchases of Equity Securities by Closed-End Management Investment Companies and Affiliated Purchasers. Not applicable.
Item 10. Submission of Matters to a Vote of Security Holders.
The registrant has not adopted procedures by which shareholders may recommend nominees to the registrant’s board of trustees.
Item 11. Controls and Procedures.
(a) The registrant’s president and chief financial officer concluded that the disclosure controls and procedures (as defined in Rule 30a-3(c) under the Investment Company Act of 1940 (the “Act”)) were effective as of a date within 90 days of the filing date of this report, based on the evaluation of these controls and procedures required by Rule 30a-3(b) under the Act.
(b) There were no changes in the registrant’s internal control over financial reporting (as defined in Rule 30a-3(d) under the Act) that occurred during the registrant’s second fiscal quarter of the period covered by this report that have materially affected, or are reasonably likely to materially affect, the registrant’s internal control over financial reporting.
Item 12. Exhibits.
(a)(1) Code of Ethics. Filed herewith.
(a)(2) Certifications pursuant to Section 302 of the Sarbanes-Oxley Act of 2002. Filed herewith.
(a)(3) Not applicable.
(b) Certification pursuant to Section 906 Certification of the Sarbanes-Oxley Act of 2002. Filed herewith.
SIGNATURES
Pursuant to the requirements of the Securities Exchange Act of 1934 and the Investment Company Act of 1940, the registrant has duly caused this report to be signed on its behalf by the undersigned, thereunto duly authorized.
| | By: /s/Ross C. Provence
Ross C. Provence
President |
Pursuant to the requirements of the Securities Exchange Act of 1934 and the Investment Company Act of 1940, this report has been signed below by the following persons on behalf of the registrant and in the capacities and on the dates indicated.
| | By: /s/Ross C. Provence
Ross C. Provence
President |
| | By: /s/Jeffrey R. Provence
Jeffrey R. Provence
Chief Financial Officer |