UNITED STATES
SECURITIES AND EXCHANGE COMMISSION
WASHINGTON, D.C. 20549
FORM N-CSR
CERTIFIED SHAREHOLDER REPORT OF REGISTERED MANAGEMENT
INVESTMENT COMPANIES
Investment Company Act file number 811-09781
PFS FUNDS
(Exact name of registrant as specified in charter)
| 1939 Friendship Drive, Suite C | |
| El Cajon, CA | 92020 |
| (Address of principal executive offices) | (Zip code) |
CT Corporation System
155 Federal St., Suite 700,
Boston, MA 02110
(Name and address of agent for service)
Registrant's telephone number, including area code: (619) 588-9700
Date of fiscal year end: November 30
Date of reporting period: November 30, 2017
Item 1. Reports to Stockholders.

ANNUAL REPORT
November 30, 2017
TICKER TFCGX
Taylor Frigon Core Growth Fund
Annual Report
November 30, 2017
|
The Taylor Frigon Core Growth Fund (the “Fund”) had a total return of 22.80% for the Fund’s first fiscal period beginning December 27, 2016 (i.e., commencement of operations) and ending November 30, 2017. For comparative purposes, the S&P 500® Index had a total return of 18.93% and the Russell 2500® Index had a total return of 14.94% during the same time-period.
In the wake of the 2016 U.S. presidential election, strong stock price performance of companies with the potential for “high growth” became much more prevalent. This circumstance benefited the Fund and enabled the portfolio to outperform its benchmarks rather handily.
In recent years, the concept of “risk on” (outperformance from higher growth companies) and “risk off” (outperformance from slower growth, less volatile companies) has been like a see-saw, depending on the market’s mood at any given moment and the outlook for economic growth.
While we are pleased to outperform our benchmarks, as long-term fundamentals-based investors we are far more interested in the performance of the underlying businesses of our portfolio companies than the market’s view on economic growth potential and, as such, see less meaning in such short periods of outperformance.
That said, we do believe such perceptions are warranted and are seeing signs that a friendlier business environment emanating from Washington D.C. is spurring capital investment. This is a necessary component for our portfolio of businesses to thrive, given that many of the themes we focus on rely on continued capital investments by other businesses.
While some of our performance over the last year can be attributed to favorable macroeconomic factors, we believe that other, more secular, trends have proven to be largely responsible for our performance. We see evidence of this in some of the Fund’s best performing positions described below.
For instance, Arista Networks is driving the move towards more software and less hardware in cloud data centers used for storage and computing. Simply put, as cloud networks become more prevalent, the need for more speed and functionality are making it more cost effective for companies to adopt software-centric solutions like those offered by Arista.
Another holding, Silicom, Ltd., is an Israeli company that builds specialized systems for hyperscale cloud service providers and is also benefitting from similar trends in computing that involves the “need for speed” amongst both major cloud companies and enterprise data centers.
A similar but different secular trend can be found in Myriad Genetics, another top performer for the portfolio. Myriad is a pioneer in molecular diagnostics. The company is building tests utilizing the human genome that allow for early detection of various diseases that can lead to far superior patient outcomes.
Another company benefitting from a major technological theme is top performer Nvidia, the manufacturer of Graphics Processor Units (GPUs). No longer are GPUs used solely for enabling video games to be played, as these high-performance computing chips are enabling advances in artificial intelligence to be used for automated driver assist systems (ADAS), and ultimately the “driverless car”.
2017 Annual Report 1
Companies in our portfolio that have experienced poor performance, such as Compugen, Impinj and Acacia Communications, are also related to similar themes in either computing technology or medical technology that we expect will come to fruition as these broader, general themes we’ve described materialize over the coming years. Nonetheless, these companies served as a drag on our performance due to either company-specific issues, or timing issues as newer entrants into the portfolio.
As long-term investors in the businesses in our portfolio, short-term price movements in any of our companies are of little significance to us. However, as the investment themes which we have focused on for many years begin to take shape in a more concrete fashion, spurred by a stronger economic environment, we see the potential for further realization of our core themes in computing, and medical technology.
Gerry Frigon
Portfolio Manager
Past performance does not guarantee future results. The investment return and principal value of an investment in the Fund will fluctuate so that an investor’s shares, when redeemed, may be worth more or less than their original cost. Current performance may be higher or lower than the performance data quoted. Performance data current to the most recent month end are available by calling 1-888-897-4821.
The Taylor Frigon Core Growth Fund’s prospectus contains important information about the Fund’s investment objectives, potential risks, management fees, charges and expenses, and other information and should be read and considered carefully before investing. You may obtain a current copy of the Fund’s prospectus by calling 1-888-897-4821. Distributed by Rafferty Capital Markets, LLC-Garden City, NY 11530.
2017 Annual Report 2
Taylor Frigon Core Growth Fund (Unaudited)

PERFORMANCE INFORMATION
November 30, 2017 NAV $12.28
| TOTAL RETURNS AS OF NOVEMBER 30, 2017 | | |
| | Since | |
| | Inception(A) | |
| Taylor Frigon Core Growth Fund | 22.80% | |
| Russell 2500® Index (B) | 14.94% | |
| S&P 500® Index (C) | 18.93% | |
Annual Fund Operating Expense Ratio (from 12/27/2016 Prospectus): 1.45%
The Fund’s expense ratio for the period ended November 30, 2017 can be found in the financial highlights included within this report.
(A)Since Inception returns include change in share prices and in each case includes reinvestment of any dividends and capital gain distributions. The Taylor Frigon Core Growth Fund commenced operations on December 27, 2016.
(B)The Russell 2500® Index (whose composition is different from the Fund) measures the performance of the small to mid-cap segment of the U.S. equity universe, commonly referred to as “mid” cap. The Russell 2500® Index is a subset of the Russell 3000® Index. It includes approximately 2,500 of the smallest securities based on a combination of their market cap and current index membership.
(C)The S&P 500® Index is a widely recognized unmanaged index of equity prices and is representative of a broader market and range of securities than is found in the Fund’s portfolio. The Index is an unmanaged benchmark that assumes reinvestment of all distributions and excludes the effect of taxes and fees. Individuals cannot invest directly in this Index; however, an individual can invest in exchange traded funds or other investment vehicles that attempt to track the performance of a benchmark index.
PAST PERFORMANCE DOES NOT GUARANTEE FUTURE RESULTS. INVESTMENT RETURN AND PRINCIPAL VALUE WILL FLUCTUATE SO THAT SHARES, WHEN REDEEMED, MAY BE WORTH MORE OR LESS THAN THEIR ORIGINAL COST. RETURNS DO NOT REFLECT THE DEDUCTION OF TAXES THAT A SHAREHOLDER WOULD PAY ON FUND DISTRIBUTIONS OR THE REDEMPTION OF FUND SHARES. CURRENT PERFORMANCE MAY BE LOWER OR HIGHER THAN THE PERFORMANCE DATA QUOTED. TO OBTAIN PERFORMANCE DATA CURRENT TO THE MOST RECENT MONTH END, PLEASE CALL 1-888-897-4821. AN INVESTMENT IN THE FUND IS SUBJECT TO INVESTMENT RISKS, INCLUDING THE POSSIBLE LOSS OF THE PRINCIPAL AMOUNT INVESTED. THE FUND'S DISTRIBUTOR IS RAFFERTY CAPITAL MARKETS, LLC.
2017 Annual Report 3
Taylor Frigon Core Growth Fund (Unaudited)
Taylor Frigon Core Growth Fund
by Sectors (as a percentage of Net Assets)
November 30, 2017
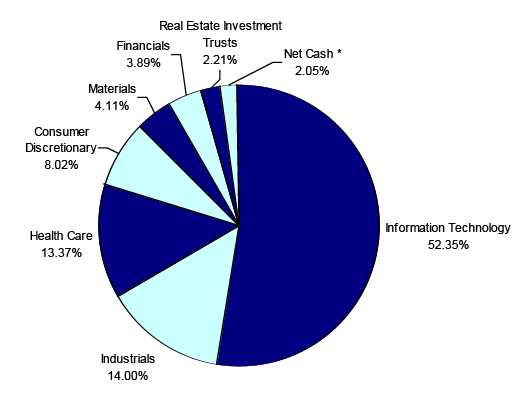
* Net Cash represents cash and other assets in excess of liabilities.
Availability of Quarterly Schedule of Investments
The Fund files its complete schedule of portfolio holdings with the Securities and Exchange Commission (“SEC”) for the first and third quarters of each fiscal year on Form N-Q. The Fund’s Form N-Q is available on the SEC’s Web site at http://www.sec.gov. The Fund’s Form N-Q may also be reviewed and copied at the SEC’s Public Reference Room in Washington, DC. Information on the operation of the Public Reference Room may be obtained by calling 1-800-SEC-0330.
Taylor Frigon Capital Management, LLC, the Fund’s investment adviser (“Adviser”), is responsible for exercising the voting rights associated with the securities held by the Fund. A description of the policies and procedures used by the Adviser in fulfilling this responsibility is available without charge on the Fund’s website at www.taylorfrigonfunds.com. It is also included in the Fund’s Statement of Additional Information, which is available on the SEC’s website at http://www.sec.gov.
Information regarding how the Fund voted proxies, Form N-PX, relating to portfolio securities during the most recent period ended June 30th, is available without charge, upon request, by calling our toll free number (1-888-897-4821). This information is also available on the SEC’s website at http://www.sec.gov.
2017 Annual Report 4
Expense Example
(Unaudited)
Shareholders of this Fund incur ongoing costs consisting of management and service fees. Although the Fund charges no sales loads or transaction fees, you will be assessed fees for outgoing wire transfers, returned checks and stop payment orders at prevailing rates charged by Mutual Shareholder Services, LLC, the Fund’s transfer agent. IRA accounts will be charged an $8.00 annual maintenance fee. If shares are redeemed within 90 days of purchase from the Fund, the shares are subject to a 2% redemption fee. Additionally, your account will be indirectly subject to the expenses of any underlying funds. The following example is intended to help you understand your ongoing costs of investing in the Fund and to compare these costs with similar costs of investing in other mutual funds. The example is based on an investment of $1,000 invested in the Fund on June 1, 2017 and held through November 30, 2017.
The first line of the table below provides information about actual account values and actual expenses. In order to estimate the expenses a shareholder paid during the period covered by this report, shareholders can divide their account value by $1,000 (for example, an $8,600 account value divided by $1,000 = 8.6) and then multiply the result by the number in the first line under the heading entitled “Expenses Paid During the Period.”
The second line of the table below provides information about hypothetical account values and hypothetical expenses based on the Fund’s actual expense ratio and an assumed rate of return of 5% per year before expenses, which is not the Fund’s actual return. The hypothetical account values and expenses may not be used to estimate the actual ending account balance or expenses paid by a shareholder for the period. Shareholders may use this information to compare the ongoing costs of investing in this Fund and other funds. To do so, compare this 5% hypothetical example with the 5% hypothetical examples that appear in other funds’ shareholder reports.
Please note that the expenses shown in the table are meant to highlight your ongoing costs only and do not reflect any transactional costs, such as redemption fees or the charges assessed by Mutual Shareholder Services, LLC as described above and expenses of any underlying funds. Therefore, the second line of the table is useful in comparing ongoing costs only, and will not help you determine the relative total costs of owning different funds. In addition, if these transactional costs were included, your costs would have been higher.
| | | | | | | Expenses Paid |
| | | Beginning | | Ending | | During the Period* |
| | | Account Value | | Account Value | | June 1, 2017 to |
| | | June 1, 2017 | | November 30, 2017 | | November 30, 2017 |
| |
| Actual | | $1,000.00 | | $1,095.45 | | $7.62 |
| |
| Hypothetical | | $1,000.00 | | $1,017.80 | | $7.33 |
| (5% annual return | | | | | | |
| before expenses) | | | | | | |
| * | Expenses are equal to the Fund’s annualized expense ratio of 1.45%, multiplied by the average account value over the period, multiplied by 183/365 (to reflect the one-half year period). |
| |
2017 Annual Report 5
| Taylor Frigon Core Growth Fund | | | | |
| | | | Schedule of Investments |
| | | | November 30, 2017 |
| Shares | | Fair Value | % of Net Assets |
| COMMON STOCKS | | | | |
| | | | | |
| Arrangement of Transportation of Freight & Cargo | | | | |
| 8,227 | Echo Global Logistics, Inc. * | $ | 222,129 | 3.62 | % |
| Biological Products (No Diagnostic Substances) | | | | |
| 21,115 | Compugen Ltd. * (Israel) | | 51,732 | 0.84 | % |
| Chemicals & Allied Products | | | | |
| 1,378 | Balchem Corporation | | 120,258 | 1.96 | % |
| Computer Communications Equipment | | | | |
| 895 | Arista Networks, Inc. * | | 208,642 | | |
| 2,089 | Silicom Ltd. (Israel) | | 151,703 | | |
| | | | 360,345 | 5.88 | % |
| Computer Peripheral Equipment, NEC | | | | |
| 8,236 | Radcom Ltd. * (Israel) | | 165,132 | 2.69 | % |
| Electronic Components, NEC | | | | |
| 6,506 | Impinj, Inc. * | | 165,708 | 2.70 | % |
| Electronic Connectors | | | | |
| 1,357 | Amphenol Corporation - Class A | | 122,931 | 2.01 | % |
| Hazardous Waste Management | | | | |
| 875 | Stericycle, Inc. * | | 58,021 | 0.95 | % |
| In Vitro & In Vivo Diagnostic Substances | | | | |
| 695 | IDEXX Laboratories, Inc. * | | 108,705 | | |
| 3,292 | Myriad Genetics, Inc. * | | 114,002 | | |
| | | | 222,707 | 3.63 | % |
| Operative Builders | | | | |
| 2,301 | Toll Brothers, Inc. | | 115,809 | 1.89 | % |
| Orthopedic, Prosthetic & Surgical Appliances & Supplies | | | | |
| 1,529 | Edwards Lifesciences Corporation * | | 179,199 | 2.92 | % |
| Printing Trades Machinery & Equipment | | | | |
| 9,233 | Kornit Digital Ltd. * (Israel) | | 164,347 | 2.68 | % |
| Radio & TV Broadcasting & Communications Equipment | | | | |
| 10,950 | Airgain, Inc. * | | 103,915 | 1.70 | % |
| Refrigeration & Service Industry Machinery | | | | |
| 1,314 | The Middleby Corporation * | | 167,561 | 2.73 | % |
| Retail - Auto Dealers & Gasoline Stations | | | | |
| 1,401 | CarMax, Inc. * | | 96,543 | 1.58 | % |
| Retail - Building Materials, Hardware, Garden Supply | | | | |
| 2,142 | Tractor Supply Company | | 146,170 | 2.38 | % |
| Retail - Catalog & Mail-Order Houses | | | | |
| 113 | Amazon.com, Inc. * | | 132,973 | 2.17 | % |
| Semiconductors & Related Devices | | | | |
| 2,357 | Acacia Communications, Inc. * | | 91,169 | | |
| 3,351 | Applied Optoelectronics, Inc. * | | 146,305 | | |
| 3,023 | Inphi Corporation * | | 124,155 | | |
| 3,993 | Mellanox Technologies, Ltd. * (Israel) | | 235,986 | | |
| 500 | Monolithic Power Systems, Inc. | | 59,175 | | |
| 1,242 | NVIDIA Corporation | | 249,282 | | |
| 157,475 | QuickLogic Corporation * | | 248,810 | | |
| 6,253 | Tower Semiconductor Ltd. * (Israel) | | 220,168 | | |
| | | | 1,375,050 | 22.43 | % |
| Services - Business Services, NEC | | | | |
| 583 | Alliance Data Systems Corporation | | 139,494 | 2.28 | % |
| Services - Computer Processing & Data Preparation | | | | |
| 867 | Fiserv, Inc. * | | 113,967 | | |
| 1,192 | Verisk Analytics, Inc. - Class A * | | 114,933 | | |
| | | | 228,900 | 3.74 | % |
* Non-Income Producing Security.
The accompanying notes are an integral part of these
financial statements. |
2017 Annual Report 6
| Taylor Frigon Core Growth Fund |
| | | | Schedule of Investments |
| | | | November 30, 2017 |
| Shares | | Fair Value | | % of Net Assets |
| COMMON STOCKS | | | | | |
| | | | | | |
| Services - Computer Programming Services | | | | | |
| 1,498 | EPAM Systems, Inc. * | $ | 151,957 | | 2.48 | % |
| Services - Computer Programming, Data Processing, Etc. | | | | | |
| 510 | FactSet Research Systems, Inc. | | 101,939 | | | |
| 2,923 | IHS Markit Ltd. (United Kingdom) * | | 130,424 | | | |
| 1,568 | Wix.com Ltd. * | | 86,083 | | | |
| | | | 318,446 | | 5.20 | % |
| Services - Consumer Credit Reporting, Collection Agencies | | | | | |
| 3,930 | PRA Group, Inc. * | | 136,764 | | 2.23 | % |
| Services - Prepackaged Software | | | | | |
| 1,431 | salesforce.com, inc. * | | 149,282 | | | |
| 2,239 | Splunk Inc. * | | 179,321 | | | |
| 3,586 | Twilio Inc. - Class A * | | 95,603 | | | |
| | | | 424,206 | | 6.92 | % |
| Soap, Detergent, Cleaning Preparations, Perfumes, Cosmetics | | | | | |
| 968 | Ecolab Inc. | | 131,571 | | 2.15 | % |
| Surgical & Medical Instruments & Apparatus | | | | | |
| 4,092 | Glaukos Corporation * | | 109,543 | | | |
| 2,253 | Mazor Robotics Ltd. * ** | | 131,012 | | | |
| 1,478 | ResMed Inc. | | 126,221 | | | |
| | | | 366,776 | | 5.98 | % |
| Total for Common Stocks (Cost $5,236,001) | | 5,868,644 | | 95.74 | % |
| REAL ESTATE INVESTMENT TRUSTS | | | | | |
| 291 | Equinix, Inc | | 135,167 | | 2.21 | % |
| | (Cost $115,620) | | | | | |
| Total Investment Securities | | 6,003,811 | | 97.95 | % |
| | (Cost $5,351,621) | | | | | |
| Other Assets In Excess of Liabilities | | 125,476 | | 2.05 | % |
| Net Assets | | $ | 6,129,287 | | 100.00 | % |
* Non-Income Producing Security.
** ADR - American Depositary Receipt.
The accompanying notes are an integral part of these
financial statements. |
2017 Annual Report 7
| Taylor Frigon Core Growth Fund | | | |
| |
| Statement of Assets and Liabilities | | | |
| November 30, 2017 | | | |
| |
| Assets: | | | |
| Investment Securities at Fair Value | $ | 6,003,811 | |
| (Cost $5,351,621) | | | |
| Cash | | 130,106 | |
| Dividends Receivable | | 2,453 | |
| Total Assets | | 6,136,370 | |
| Liabilities: | | | |
| Management Fees Payable | | 4,885 | |
| Service Fees Payable | | 2,198 | |
| Total Liabilities | | 7,083 | |
| Net Assets | $ | 6,129,287 | |
| |
| Net Assets Consist of: | | | |
| Paid In Capital | $ | 5,493,960 | |
| Accumulated Net Investment Income/(Loss) | | (16,863 | ) |
| Unrealized Appreciation/(Depreciation) in Value of Investments | | | |
| Based on Identified Cost - Net | | 652,190 | |
| Net Assets, for 499,310 Shares Outstanding | $ | 6,129,287 | |
| (Unlimited shares authorized) | | | |
| Net Asset Value and Offering Price Per Share | | | |
| ($6,129,287/499,310 shares) | $ | 12.28 | |
| Redemption Price * ($12.28 x 0.98) (Note 2) | $ | 12.03 | |
| |
| Statement of Operations | | | |
| For the period December 27, 2016** through November 30, 2017 | | | |
| |
| Investment Income: | | | |
| Dividends (Net of Foreign Withholding Taxes of $246) | $ | 9,150 | |
| Interest | | 1 | |
| Total Investment Income | | 9,151 | |
| Expenses: | | | |
| Management Fees (Note 4) | | 32,223 | |
| Service Fees (Note 4) | | 14,500 | |
| Total Expenses | | 46,723 | |
| |
| Net Investment Income/(Loss) | | (37,572 | ) |
| |
| Realized and Unrealized Gain/(Loss) on Investments | | | |
| Realized Gain/(Loss) on Investments | | 20,709 | |
| Net Change in Unrealized Appreciation/(Depreciation) on Investments | | 652,190 | |
| Net Realized and Unrealized Gain/(Loss) on Investments | | 672,899 | |
| |
| Net Increase/(Decrease) in Net Assets from Operations | $ | 635,327 | |
* Reflects a 2% redemption fee if shares are redeemed within 90 days of purchase.
** Commencement of Operations. |
The accompanying notes are an integral part of these
financial statements. |
2017 Annual Report 8
| Taylor Frigon Core Growth Fund |
| | |
| Statement of Changes in Net Assets | | | | |
| | | 12/27/2016* | | |
| | | to | | |
| | | 11/30/2017 | | |
| From Operations: | | | | |
| Net Investment Income/(Loss) | $ | (37,572 | ) | |
| Net Realized Gain/(Loss) on Investments | | 20,709 | | |
| Net Change in Unrealized Appreciation/(Depreciation) on Investments | | 652,190 | | |
| Increase/(Decrease) in Net Assets from Operations | | 635,327 | | |
| From Distributions to Shareholders: | | | | |
| Net Investment Income | | - | | |
| Net Realized Gain on Investments | | - | | |
| Change in Net Assets from Distributions | | - | | |
| From Capital Share Transactions: | | | | |
| Proceeds From Sale of Shares | | 5,594,472 | | |
| Proceeds From Redemption Fees (Note 2) | | 710 | | |
| Shares Issued on Reinvestment of Dividends | | - | | |
| Cost of Shares Redeemed | | (101,222 | ) | |
| Net Increase/(Decrease) from Shareholder Activity | | 5,493,960 | | |
| Net Increase/(Decrease) in Net Assets | | 6,129,287 | | |
| Net Assets at Beginning of Period | | - | | |
| Net Assets at End of Period (Including Accumulated Net Investment | | | | |
| Income/(Loss) of ($16,863)) | $ | 6,129,287 | | |
| Share Transactions: | | | | |
| Issued | | 507,996 | | |
| Reinvested | | - | | |
| Redeemed | | (8,686 | ) | |
| Net Increase/(Decrease) in Shares | | 499,310 | | |
| Shares Outstanding Beginning of Period | | - | | |
| Shares Outstanding End of Period | | 499,310 | | |
| | |
| Financial Highlights | | | | |
| Selected data for a share outstanding throughout the period: | | 12/27/2016* | | |
| | | to | | |
| | | 11/30/2017 | | |
| Net Asset Value - | | | | |
| Beginning of Period | $ | 10.00 | | |
| Net Investment Income/(Loss) (a) | | (0.12 | ) | |
| Net Gain/(Loss) on Securities (b) | | | | |
| (Realized and Unrealized) | | 2.40 | | |
| Total from Investment Operations | | 2.28 | | |
| Distributions (From Net Investment Income) | | - | | |
| Distributions (From Realized Capital Gains) | | - | | |
| Total Distributions | | - | | |
| Proceeds from Redemption Fee (Note 2) | | - | | + |
| Net Asset Value - | | | | |
| End of Period | $ | 12.28 | | |
| Total Return | | 22.80% | | ** |
| Ratios/Supplemental Data | | | | |
| Net Assets - End of Period (Thousands) | $ | 6,129 | | |
| Ratio of Expenses to Average Net Assets | | 1.45% | | *** |
| Ratio of Net Investment Income/(Loss) to Average Net Assets | | (1.17)% | | *** |
| Portfolio Turnover Rate | | 5.61% | | ** |
* Commencement of Operations.
** Not Annualized.
*** Annualized.
+ Less than $0.005.
(a) Per share amounts were calculated using the average shares method.
(b) Realized and unrealized gains and losses per share in this caption are balancing amounts
necessary to reconcile the change in net asset value for the period, and may not reconcile
with the aggregate gains and losses in the Statement of Operations due to share transactions
for the period. |
The accompanying notes are an integral part of these
financial statements. |
2017 Annual Report 9
NOTES TO THE FINANCIAL STATEMENTS
TAYLOR FRIGON CORE GROWTH FUND
November 30, 2017
1.) ORGANIZATION
The Taylor Frigon Core Growth Fund (the “Fund”) was organized as a diversified series of PFS Funds (the “Trust”) on December 7, 2016 and commenced operations on December 27, 2016. The Trust was established under the laws of Massachusetts by an Agreement and Declaration of Trust dated January 13, 2000. The Trust is registered as an open-end investment company under the Investment Company Act of 1940, as amended (the “1940 Act”). The Trust may offer an unlimited number of shares of beneficial interest in a number of separate series, each series representing a distinct fund with its own investment objectives and policies. As of November 30, 2017, there were eight series authorized by the Trust. The Fund’s objective is to seek long-term capital appreciation. The investment adviser to the Fund is Taylor Frigon Capital Management, LLC (the “Adviser”).
2.) SIGNIFICANT ACCOUNTING POLICIES
The Fund is an investment company and accordingly follows the investment company accounting and reporting guidance of the Financial Accounting Standards Board (“FASB”) Accounting Standards Codification Topic 946 Financial Services - Investment Companies. The financial statements are prepared in conformity with accounting principles generally accepted in the United States of America (“GAAP”). The Fund follows the significant accounting policies described in this section.
SECURITY VALUATION
All investments in securities are recorded at their estimated fair value, as described in Note 3.
SHARE VALUATION
The net asset value (the “NAV”) is generally calculated as of the close of trading on the New York Stock Exchange (the “Exchange”) (normally 4:00 p.m. Eastern time) every day the Exchange is open. The NAV is calculated by taking the total value of the Fund’s assets, subtracting its liabilities, and then dividing by the total number of shares outstanding, rounded to the nearest cent. The offering price and redemption price per share is equal to the net asset value per share, except that shares of the Fund are subject to a redemption fee of 2% if redeemed within 90 days of purchase. During the period December 27, 2016 (commencement) through November 30, 2017, proceeds from redemption fees were $710.
FEDERAL INCOME TAXES
The Fund’s policy is to continue to comply with the requirements of the Internal Revenue Code that are applicable to regulated investment companies and to distribute all of its taxable income to shareholders. Therefore, no federal income tax provision is required. It is the Fund’s policy to distribute annually, prior to the end of the calendar year, dividends sufficient to satisfy excise tax requirements of the Internal Revenue Code. This Internal Revenue Code requirement may cause an excess of distributions over the book year-end accumulated income. In addition, it is the Fund’s policy to distribute annually, after the end of the fiscal year, any remaining net investment income and net realized capital gains.
The Fund recognizes the tax benefits of certain tax positions only where the position is “more likely than not” to be sustained assuming examination by tax authorities. Management has analyzed the Fund’s tax positions, and has concluded that no liability for unrecognized tax benefits should be recorded related to uncertain tax positions expected to be taken in the Fund’s initial tax return. The Fund identifies its major tax jurisdictions as U.S. Federal tax authorities; however, the Fund is not aware of any tax positions for which it is reasonably possible that the total amounts of unrecognized tax benefits will change materially in the next twelve months. The Fund recognizes interest and penalties, if any, related to unrecognized tax benefits as income tax expense in the Statement of Operations. During the period December 27, 2016 (commencement) through November 30, 2017, the Fund did not incur any interest or penalties.
DISTRIBUTIONS TO SHAREHOLDERS
Distributions to shareholders, which are determined in accordance with income tax regulations, are recorded on the ex-dividend date.
The treatment for financial reporting purposes of distributions made to shareholders during the year from net investment income or net realized capital gains may differ from their ultimate treatment for federal income tax purposes. The differences between book and tax basis are caused primarily by differences in the timing of the recognition of certain components of income, expense, or realized capital gain for federal income tax purposes. Where such differences are permanent in
2017 Annual Report 10
Notes to the Financial Statements - continued
nature, they are reclassified in the components of the net assets based on their ultimate characterization for federal income tax purposes. Any such reclassifications will have no effect on net assets, result of operations, or net asset value per share of the Fund. At November 30, 2017, accumulated net investment income/(loss) was increased by $20,709 and accumulated realized gain/(loss) - net was decreased by $20,709. The adjustment was attributed to the reclassification of net investment loss.
USE OF ESTIMATES
The financial statements are prepared in accordance with GAAP, which requires management to make estimates and assumptions that affect the reported amounts of assets and liabilities and disclosure of contingent assets and liabilities at the date of the financial statements and the reported amounts of increases and decreases in net assets from operations during the reporting period. Actual results could differ from those estimates.
ORGANIZATIONAL & OFFERING EXPENSES
All costs incurred by the Fund in connection with the organization, offering and initial registration of the Fund, principally professional fees, were paid on behalf of the Fund by the Adviser and will not be borne by the Fund.
EXPENSES
Expenses incurred by the Trust that do not relate to a specific fund of the Trust are allocated to the individual funds based on each fund’s relative net assets or another appropriate basis.
OTHER
The Fund records security transactions based on a trade date for financial reporting purposes. Dividend income is recognized on the ex-dividend date, and interest income is recognized on an accrual basis. The Fund uses the specific identification method in computing gain or loss on the sale of investment securities. Withholding taxes on foreign dividends have been provided for in accordance with the Fund’s understanding of the applicable country’s tax rules and rates.
3.) INVESTMENT SECURITIES VALUATIONS
The Fund utilizes various methods to measure the fair value of most of its investments on a recurring basis. GAAP establishes a hierarchy that prioritizes inputs to valuation methods. The three levels of inputs are:
Level 1 - Unadjusted quoted prices in active markets for identical assets or liabilities that the Fund has the ability to access.
Level 2 - Observable inputs other than quoted prices in active markets included in level 1 that are observable for the asset or liability, either directly or indirectly. These inputs may include quoted prices for the identical instrument on an inactive market, prices for similar instruments, interest rates, prepayment speeds, credit risk, yield curves, default rates and similar data.
Level 3 - Unobservable inputs for the asset or liability, to the extent relevant observable inputs are not available, representing the Fund’s own assumptions about the assumptions a market participant would use in valuing the asset or liability, and would be based on the best information available.
The availability of observable inputs can vary from security to security and is affected by a wide variety of factors, including, for example, the type of security, whether the security is new and not yet established in the marketplace, the liquidity of markets, and other characteristics particular to the security. To the extent that valuation is based on models or inputs that are less observable or unobservable in the market, the determination of fair value requires more judgment. Accordingly, the degree of judgment exercised in determining fair value is greatest for instruments categorized in level 3.
The inputs used to measure fair value may fall into different levels of the fair value hierarchy. In such cases, for disclosure purposes, the level in the fair value hierarchy within which the fair value measurement falls in its entirety, is determined based on the lowest level input that is significant to the fair value measurement in its entirety.
FAIR VALUE MEASUREMENTS
A description of the valuation techniques applied to the Fund’s major categories of assets and liabilities measured at fair value on a recurring basis follows.
2017 Annual Report 11
Notes to the Financial Statements - continued
Equity securities (common stocks and real estate investment trusts). Equity securities generally are valued by using market quotations, but may be valued on the basis of prices furnished by a pricing service when the Adviser believes such prices accurately reflect the fair value of such securities. Securities that are traded on any stock exchange or on the NASDAQ over-the-counter market are generally valued by the pricing service at the last quoted sale price. Lacking a last sale price, an equity security is generally valued by the pricing service at its last bid price. Generally, if the security is traded in an active market and is valued at the last sale price, the security is categorized as a level 1 security. When market quotations are not readily available, when the Adviser determines that the market quotation or the price provided by the pricing service does not accurately reflect the current fair value, or when restricted securities are being valued, such securities are valued as determined in good faith by the Adviser, subject to review of the Board of Trustees (the “Trustees” or the “Board”) and are categorized in level 2 or level 3, when appropriate.
In accordance with the Trust’s good faith pricing guidelines, the Adviser is required to consider all appropriate factors relevant to the value of securities for which it has determined other pricing sources are not available or reliable as described above. There is no standard procedure for determining fair value, since fair value depends upon the circumstances of each individual case. As a general principle, the current fair value of an issue of securities being valued by the Adviser would appear to be the amount which the owner might reasonably expect to receive for them upon their current sale. Methods which are in accordance with this principle may, for example, be based on (i) a multiple of earnings; (ii) a discount from market of a similar freely traded security (including a derivative security or a basket of securities traded on other markets, exchanges or among dealers); or (iii) yield to maturity with respect to debt issues, or a combination of these and other methods.
The following table summarizes the inputs used to value the Fund’s assets measured at fair value as of November 30, 2017:
| Valuation Inputs of Assets | | Level 1 | | Level 2 | | Level 3 | | Total |
| Common Stocks | | $5,868,644 | | $0 | | $0 | | $5,868,644 |
| Real Estate Investment Trusts | | 135,167 | | 0 | | 0 | | 135,167 |
| Total | | $6,003,811 | | $0 | | $0 | | $6,003,811 |
The Fund did not hold any Level 3 assets during the period December 27, 2016 (commencement) through November 30, 2017. There were no transfers into or out of level 1 and level 2 during the period December 27, 2016 (commencement) through November 30, 2017. It is the Fund’s policy to consider transfers into or out of level 1 and level 2 as of the end of the reporting period.
The Fund did not invest in derivative instruments during the period December 27, 2016 (commencement) through November 30, 2017.
4.) INVESTMENT ADVISORY AGREEMENT
The Fund has entered into an investment advisory agreement (“Management Agreement”) with the Adviser. The Adviser manages the investment portfolio of the Fund, subject to policies adopted by the Trust’s Board of Trustees. Under the Management Agreement, the Adviser, at its own expense and without reimbursement from the Trust, furnishes office space and all necessary office facilities, equipment, and executive personnel necessary for managing the Fund and pays the operating expenses of the Fund excluding management fees, brokerage fees and commissions, taxes, borrowing costs (such as (a) interest and (b) dividend expenses on securities sold short), ADR fees, fees and expenses of acquired funds, fees pursuant to Rule 12b-1 distribution plans, and extraordinary or non-recurring expenses. For its services, the Adviser receives an investment management fee equal to 1.00% of the average daily net assets of the Fund.
As a result of the above calculation, for the period December 27, 2016 (commencement) through November 30, 2017, the Adviser earned management fees totaling $32,223. At November 30, 2017, the Fund owed $4,885 to the Adviser.
Additionally, the Fund has a Services Agreement with the Adviser (the “Services Agreement”). Under the Services Agreement the Adviser receives an additional fee of 0.45% of the average daily net assets of the Fund and is obligated to pay the operating expenses of the Fund excluding, as applicable, management fees and sub-advisory fees, brokerage fees and commissions, 12b-1 fees, taxes, borrowing costs (such as (a) interest and (b) dividend expenses on securities sold short), ADR fees, the cost of acquired funds and extraordinary expenses.
2017 Annual Report 12
Notes to the Financial Statements - continued
For the period December 27, 2016 (commencement) through November 30, 2017, the Adviser earned services fees of $14,500. At November 30, 2017, the Fund owed the Adviser services fees of $2,198.
5.) RELATED PARTY TRANSACTIONS
Jeffrey R. Provence of Premier Fund Solutions, Inc. (the “Administrator”) also serves as trustee/officer of the Fund. This individual receives benefits from the Administrator resulting from administration fees paid to the Administrator of the Fund by the Adviser.
The Trustees who are not interested persons of the Fund were each paid $750, for a total of $2,250, in Trustees’ fees for the period December 27, 2016 (commencement) through November 30, 2017 by the Adviser.
6.) PURCHASES AND SALES OF SECURITIES
For the period December 27, 2016 (commencement) through November 30, 2017, purchases and sales of investment securities other than U.S. Government obligations and short-term investments aggregated $5,501,311 and $170,399, respectively. Purchases and sales of U.S. Government obligations aggregated $0 and $0, respectively.
7.) CONTROL OWNERSHIP
The beneficial ownership, either directly or indirectly, of more than 25% of the voting securities of a fund creates a presumption of control of that fund, under Section 2(a)(9) of the Investment Company Act of 1940. As of November 30, 2017, Charles Schwab & Co., Inc., for the benefit of its customers, held, in aggregate, 85.51% of the shares in the Fund.
8.) TAX MATTERS
For Federal income tax purposes, the cost of securities owned at November 30, 2017 was $5,351,621. At November 30, 2017, the composition of unrealized appreciation (the excess of value over tax cost) and depreciation (the excess of tax cost over value) on a tax basis was as follows:
| | Appreciation | | (Depreciation) | | Net Appreciation/(Depreciation) |
| | $938,232 | | ($286,042) | | $652,190 |
The tax character of distributions was as follows:
| | | December 27, 2016* through |
| | | November 30, 2017 |
| Ordinary Income | | $ 0 |
| Long-term Capital Gain | | 0 |
| | | $ 0 |
* Commencement of Operations.
As of November 30, 2017, the components of distributable earnings (accumulated losses) on a tax basis were as follows:
| Deferred late-year ordinary losses | $ | (16,863 | ) |
| Unrealized appreciation/(depreciation) on investments - net | | 652,190 | |
| | $ | 635,327 | |
As of November 30, 2017, there were no differences between book and tax basis.
9.) SUBSEQUENT EVENTS
Subsequent events after the date of the Statement of Assets and Liabilities have been evaluated through the date the financial statements were issued. Management has concluded that there are no items requiring adjustment to or disclosure in the financial statements.
2017 Annual Report 13
REPORT OF INDEPENDENT REGISTERED PUBLIC ACCOUNTING FIRM
To the Shareholders of Taylor Frigon Core Growth Fund and
Board of Trustees of PFS Funds
We have audited the accompanying statement of assets and liabilities, including the schedule of investments, of Taylor Frigon Core Growth Fund (the "Fund"), a series of PFS Funds, as of November 30, 2017, and the related statements of operations and changes in net assets and the financial highlights for the period December 27, 2016 (commencement of operations) through November 30, 2017. These financial statements and financial highlights are the responsibility of the Fund's management. Our responsibility is to express an opinion on these financial statements and financial highlights based on our audit.
We conducted our audit in accordance with the standards of the Public Company Accounting Oversight Board (United States). Those standards require that we plan and perform the audit to obtain reasonable assurance about whether the financial statements and financial highlights are free of material misstatement. An audit includes examining, on a test basis, evidence supporting the amounts and disclosures in the financial statements. Our procedures included confirmation of securities owned as of November 30, 2017, by correspondence with the custodian. An audit also includes assessing the accounting principles used and significant estimates made by management, as well as evaluating the overall financial statement presentation. We believe that our audit provides a reasonable basis for our opinion.
In our opinion, the financial statements and financial highlights referred to above present fairly, in all material respects, the financial position of Taylor Frigon Core Growth Fund as of November 30, 2017, the results of its operations, the changes in its net assets, and the financial highlights for the period December 27, 2016 (commencement of operations) through November 30, 2017, in conformity with accounting principles generally accepted in the United States of America.

COHEN & COMPANY, LTD.
Cleveland, Ohio
January 18, 2018
2017 Annual Report 14
This page was intentionally left blank.
2017 Annual Report 15
This page was intentionally left blank.
2017 Annual Report 16
Trustees and Officers
(Unaudited)
The Board of Trustees supervises the business activities of the Trust. The names of the Trustees and executive officers of the Trust are shown below. For more information regarding the Trustees, please refer to the Statement of Additional Information, which is available upon request by calling 1-888-897-4821. Each Trustee serves until the Trustee sooner dies, resigns, retires, or is removed.
The Trustees and Officers of the Trust and their principal business activities during the past five years are:
Interested Trustees and Officers
| | | | | Number of | |
| | | | Principal | Portfolios In | Other |
| Name, | Position(s) | Term of Office | Occupation(s) | Fund | Directorships |
| Address(1), | Held With | and Length of | During | Complex | Held By |
| and Year of Birth | the Trust | Time Served | Past 5 Years | Overseen By | Trustee |
| | | | | Trustee | |
| |
| Ross C. Provence, | President | Indefinite Term; | General Partner and Portfolio | N/A | N/A |
| Year of Birth: 1938 | | Since 2000 | Manager for Value Trend Capital | | |
| | | | Management, LP (1995 to current). | | |
| | | | Estate planning attorney (1963 to | | |
| current). |
| |
| Jeffrey R. Provence(2), | Trustee, | Indefinite Term; | CEO, Premier Fund Solutions, Inc. | 8 | Blue Chip |
| Year of Birth: 1969 | Secretary | Since 2000 | (2001 to current). General Partner | | Investor Funds, |
| | and | | and Portfolio Manager for Value | | Meeder Funds |
| | Treasurer | | Trend Capital Management, LP | | |
| | | | (1995 to current). | | |
| |
| Julian G. Winters, | Chief | Chief | Managing Member, Watermark | N/A | N/A |
| Year of Birth: 1968 | Compliance | Compliance | Solutions LLC (investment compli- | | |
| | Officer | Officer Since | ance and consulting) (2007 to cur- | | |
| | | 2010 | rent). | | |
(1) The address of each trustee and officer is c/o PFS Funds, 1939 Friendship Drive, Suite C, El Cajon, California 92020.
(2) Jeffrey R. Provence is considered an “interested person” as defined in Section 2(a)(19) of the Investment Company Act of 1940 by
virtue of his position with the Trust.
Independent Trustees |
| | | | | Number of | |
| | | Principal | Portfolios In | Other |
| Name, | Position | Term of Office | Occupation(s) | Fund | Directorships |
| Address(1), | Held With | and Length of | During | Complex | Held By |
| and Year of Birth | the Trust | Time Served | Past 5 Years | Overseen By | Trustee |
| | | | Trustee | |
| |
| Thomas H. Addis III, | Independent | Indefinite Term; | Executive Director/CEO, Southern | 8 | None |
| Year of Birth: 1945 | Trustee | Since 2000 | California PGA (2006 to current). | | |
| |
| Allen C. Brown, | Independent | Indefinite Term; | Co-owner of Stebleton & Brown | 8 | Blue Chip |
| Year of Birth: 1943 | Trustee | Since 2010 | (1994 to Current). Estate planning | | Investor Funds |
| | | | and business attorney (1970 to cur- | | |
| rent). |
| |
| George Cossolias, CPA, | Independent | Indefinite Term; | Partner of CWDL, CPAs (February 1, | 8 | Blue Chip |
| Year of Birth: 1935 | Trustee | Since 2000 | 2014 to current). Owner of George | | Investor Funds |
| | | | Cossolias & Company, CPAs (1972 | | |
| | | | to January 31, 2014). President of | | |
| | | | Lubrication Specialists, Inc. (1996 to | | |
| current). |
(1) The address of each trustee and officer is c/o PFS Funds, 1939 Friendship Drive, Suite C, El Cajon, California 92020.
2017 Annual Report 17
Investment Adviser
Taylor Frigon Capital Management, LLC
Legal Counsel
The Law Offices of John H. Lively & Associates, Inc.
A member firm of The 1940 Act Law GroupTM
Custodian
US Bank, N.A.
Distributor
Rafferty Capital Markets, LLC
Dividend Paying Agent,
Shareholders' Servicing Agent,
Transfer Agent
Mutual Shareholder Services, LLC
Fund Administrator
Premier Fund Solutions, Inc.
Independent Registered Public Accounting Firm
Cohen & Company, Ltd. |
This report is provided for the general information of the shareholders of the Taylor
Frigon Core Growth Fund. This report is not intended for distribution to prospective
investors in the Fund, unless preceded or accompanied by an effective prospectus. |
Taylor Frigon Core Growth Fund
www.taylorfrigonfunds.com
1-888-897-4821
Item 2. Code of Ethics.
The registrant has adopted a code of ethics that applies to the registrant’s principal executive officer and the principal financial officer. The registrant has not made any amendments to its code of ethics during the covered period. The registrant has not granted any waivers from any provisions of the code of ethics during the covered period. A copy of the registrant’s Code of Ethics is filed herewith.
Item 3. Audit Committee Financial Expert.
The registrant’s Board of Trustees has determined that George Cossolias is an audit committee finical expert. Mr. Cossolias is independent for purposes of this Item 3.
Item 4. Principal Accountant Fees and Services.
(a-d) The following table details the aggregate fees billed for each of the last two fiscal years for audit fees, audit-related fees, tax fees and other fees by the principal accountant to the registrant. The principal accountant has provided no services to the adviser or any entity controlled by, or under common control with the adviser that provides ongoing services to the registrant.
| | | FYE 11/30/17 |
| Audit Fees | | $13,250 |
| Audit-Related Fees | | $0 |
| Tax Fees | | $2,500 |
| All Other Fees | | $750 |
Nature of Tax Fees: Preparation of Excise Tax Statement and 1120 RIC.
Nature of All Other Fees: Review of Semi-Annual Report.
(e) (1) The audit committee approves all audit and non-audit related services and, therefore, has not adopted pre-approval policies and procedures described in paragraph (c)(7) of Rule 2-01 of Regulation S-X.
(e) (2) None of the services described in paragraph (b) through (d) of this Item were approved by the audit committee pursuant to paragraph (c)(7)(i)(C) of Rule 2-01 of Regulation S-X.
(f) All of the principal accountant’s hours spent on auditing the registrant’s financial statements were attributed to work performed by full-time permanent employees of the principal accountant.
(g) The following table indicates the aggregate non-audit fees billed by the registrant’s principal accountant for services to the registrant , the registrant’s investment adviser (not sub-adviser), and any entity controlling, controlled by, or under common control with the adviser that provides ongoing services to the registrant, for the last two years.
| Non-Audit Fees | | FYE 11/30/17 |
| Registrant | | $3, 250 |
| Registrant’s Investment Adviser | | $0 |
(h) The principal accountant provided no services to the investment adviser or any entity controlling, controlled by, or under common control with the adviser that provides ongoing services to the registrant.
Item 5. Audit Committee of Listed Companies. Not applicable.
Item 6. Schedule of Investments. Schedule filed with Item 1.
Item 7. Disclosure of Proxy Voting Policies and Procedures for Closed-End Management Investment Companies. Not applicable.
Item 8. Portfolio Managers of Closed End Management Investment Companies. Not applicable.
Item 9. Purchases of Equity Securities by Closed-End Management Investment Companies and Affiliated Purchasers. Not applicable.
Item 10. Submission of Matters to a Vote of Security Holders.
The registrant has not adopted procedures by which shareholders may recommend nominees to the registrant’s board of trustees.
Item 11. Controls and Procedures.
(a) The registrant’s president and chief financial officer concluded that the disclosure controls and procedures (as defined in Rule 30a-3(c) under the Investment Company Act of 1940 (the “Act”)) were effective as of a date within 90 days of the filing date of this report, based on the evaluation of these controls and procedures required by Rule 30a-3(b) under the Act.
(b) There were no changes in the registrant’s internal control over financial reporting (as defined in Rule 30a-3(d) under the Act) that occurred during the registrant’s second fiscal quarter of the period covered by this report that have materially affected, or are reasonably likely to materially affect, the registrant’s internal control over financial reporting.
Item 12. Exhibits.
(a)(1) Code of Ethics. Filed herewith.
(a)(2) Certifications pursuant to Section 302 of the Sarbanes-Oxley Act of 2002. Filed herewith.
(a)(3) Not applicable.
(b) Certification pursuant to Section 906 Certification of the Sarbanes-Oxley Act of 2002. Filed herewith.
Pursuant to the requirements of the Securities Exchange Act of 1934 and the Investment Company Act of 1940, the registrant has duly caused this report to be signed on its behalf by the undersigned, thereunto duly authorized.
| | By: /s/Ross C. Provence
Ross C. Provence
President |
Pursuant to the requirements of the Securities Exchange Act of 1934 and the Investment Company Act of 1940, this report has been signed below by the following persons on behalf of the registrant and in the capacities and on the dates indicated.
| | By: /s/Ross C. Provence
Ross C. Provence
President |
| | By: /s/Jeffrey R. Provence
Jeffrey R. Provence
Chief Financial Officer |