UNITED STATES
SECURITIES AND EXCHANGE COMMISSION
WASHINGTON, D.C. 20549
FORM N-CSR
CERTIFIED SHAREHOLDER REPORT OF REGISTERED MANAGEMENT
INVESTMENT COMPANIES
Investment Company Act file number: 811-09781
PFS Funds
(Exact name of registrant as specified in charter)
| 1939 Friendship Drive. | |
| Suite C | |
| El Cajon, CA | 92020 |
| (Address of principal executive offices) | (Zip code) |
CT Corporation System
155 Federal St., Suite 700,
Boston, MA 02110
(Name and address of agent for service)
Registrant's telephone number, including area code: (619) 588-9700
Date of fiscal year end: May 31
Date of reporting period: May 31, 2017
Form N-CSR is to be used by management investment companies to file reports with the Commission not later than 10 days after the transmission to stockholders of any report that is required to be transmitted to stockholders under Rule 30e-1 under the Investment Company Act of 1940 (17 CFR 270.30e -1). The Commission may use the information provided on Form N-CSR in its regulatory, disclosure review, inspection and policymaking roles.
A registrant is required to disclose the information specified by Form N-CSR, and the Commission will make this information public. A registrant is not required to respond to the collection of information contained in Form N-CSR unless the Form displays a currently valid Office of Management and Budget ("OMB") control number.
Item 1. Reports to Stockholders.
Annual Report
May 31, 2017
Ticker TSCVX
Triad Small Cap Value Fund
Annual Letter
As of May 31, 2017
Dear Fellow Shareholders,
We are pleased to write to you in our annual Triad Small-Cap Value Fund letter for the year ended May 31, 2017.
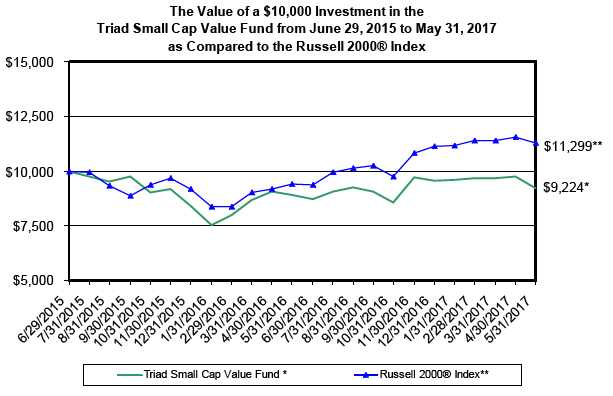
Our results for the year ended May 31, 2017 were 3.73%, below the 20.36% return of the benchmark Russell 2000 Index. Since inception on June 29, 2015 through May 31, 2017, the Fund had an average annualized return of -4.12% while the benchmark Russell 2000 Index had an average annualized return of 6.56% over the same period.
Contributing positively to results were Colfax Corp., Sotheby’s and Esterline Technologies. Colfax is beginning to emerge from a deep recession in its energy-dependent business segments, and an earnings rebound is taking hold. Sotheby’s has benefited from new management’s aggressive steps to improve the core art auction business, including higher commission rates and lower expenses. Esterline is also seeing the fruits of a multiyear process of integrating numerous acquisitions made over many years, with the result of lower expenses and higher earnings.
Negative contributors included Sears Holdings, Diamond Offshore Drilling and Fossil Group. Sears continues to suffer from weak store traffic amid a tough bricks and mortar retail environment. While the company has raised funds from closing and selling stores while reducing expenses, it so far hasn’t offset the operating losses. Diamond Offshore has been impacted by the steep decline in offshore drilling for oil due to the significant multiyear decline in oil prices. We expect an eventual rebound, but it appears to be a few more years away. Fossil results have been weakened lately by the rollout of connected devices such as Apple Watch and other competitors. We expect eventual category growth and new product rollouts to improve sales and earnings over the next few years.
When we launched the Fund we knew the marketing challenges would be significant. Many investors increasingly prefer “passive” index funds instead of actively managed funds such as ours. As well, we didn’t have broad distribution within large custodians such as Fidelity or Charles Schwab, forcing us to use word of mouth to grow our asset base. Ultimately we didn’t attract enough assets into the Fund, and since inception have been supporting the significant fund expenses with our own resources.
After two years of efforts, and not enough asset flows into the Fund, we have decided to close the Fund effective June 23, 2017.
2017 Annual Report 1
We appreciate your support during our tenure managing the Fund. And we wish each of you much success in future investment endeavors.
Best regards,
John Heldman, CFA
Partner | Portfolio Manager
Triad Investment Management, LLC
Adviser to the Triad Small Cap Value Fund | David Hutchison, CFA
Partner | Portfolio Manager
Triad Investment Management, LLC
Adviser to the Triad Small Cap Value Fund |
Performance data quoted represents past performance. Past performance does not guarantee future results. The investment return and principal value of an investment will fluctuate so that an investor’s shares, when redeemed, may be worth more or less than their original cost. All returns include change in share prices, and reinvestment of any dividends and capital gains distributions. Current performance may be lower or higher than the performance data quoted. You may obtain performance data current to the most recent month-end by calling 1-888-501-1036. An investment in the Fund is subject to investment risks, including the possible loss of the principal amount invested. The Russell 2000® Index (whose composition is different from the Fund) measures the performance of the small-cap segment of the U.S. equity universe. The Russell 2000® Index is a subset of the Russell 3000® Index representing approximately 10% of the total market capitalization of that index. It includes approximately 2000 of the smallest securities based on a combination of their market cap and current index membership. The Fund’s principal underwriter is Rafferty Capital Markets, LLC.
2017 Annual Report 2
TRIAD SMALL CAP VALUE FUND (Unaudited)
PERFORMANCE INFORMATION
May 31, 2017 NAV $9.17
AVERAGE ANNUAL TOTAL RETURNS AS OF MAY 31, 2017
| | | | Since | |
| | 1 Year(A) | | Inception(A) | |
| Triad Small Cap Value Fund | 3.73% | | -4.12% | |
| Russell 2000® Index (B) | 20.36% | | 6.56% | |
Annual Fund Operating Expense Ratio (from 9/28/16 Prospectus): 1.50%
(A)1 Year and Since Inception returns include change in share prices and in each case includes reinvestment of any dividends and capital gain distributions. The Triad Small Cap Value Fund commenced operations on June 29, 2015.
(B)The Russell 2000® Index (whose composition is different from the Fund) measures the performance of the small-cap segment of the U.S. equity universe. The Russell 2000® Index is a subset of the Russell 3000® Index and it represents approximately 10% of the total market capitalization of that index. It includes approximately 2000 of the smallest securities based on a combination of their market cap and current index membership. Investors cannot invest directly in an index.
PAST PERFORMANCE DOES NOT GUARANTEE FUTURE RESULTS. INVESTMENT RETURN AND PRINCIPAL VALUE WILL FLUCTUATE SO THAT SHARES, WHEN REDEEMED, MAY BE WORTH MORE OR LESS THAN THEIR ORIGINAL COST. RETURNS DO NOT REFLECT THE DEDUCTION OF TAXES THAT A SHAREHOLDER WOULD PAY ON FUND DISTRIBUTIONS OR THE REDEMPTION OF FUND SHARES. CURRENT PERFORMANCE MAY BE LOWER OR HIGHER THAN THE PERFORMANCE DATA QUOTED. TO OBTAIN PERFORMANCE DATA CURRENT TO THE MOST RECENT MONTH END, PLEASE CALL 1-888-501-1036. AN INVESTMENT IN THE FUND IS SUBJECT TO INVESTMENT RISKS, INCLUDING THE POSSIBLE LOSS OF THE PRINCIPAL AMOUNT INVESTED. THE FUND'S DISTRIBUTOR IS RAFFERTY CAPITAL MARKETS, LLC.
2017 Annual Report 3
TRIAD SMALL CAP VALUE FUND (Unaudited)
Triad Small Cap Value Fund
by Sectors (as a percentage of Net Assets) |
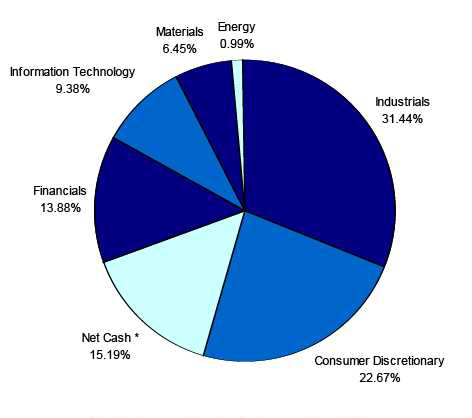
*Net Cash represents cash and other assets less liabilities.
Availability of Quarterly Schedule of Investments
The Fund files its complete schedule of portfolio holdings with the Securities and Exchange Commission (“SEC”) for the first and third quarters of each fiscal year on Form N-Q. The Fund’s Form N-Q is available on the SEC’s website at http://www.sec.gov. The Fund’s Form N-Q may also be reviewed and copied at the SEC’s Public Reference Room in Washington, DC. Information on the operation of the Public Reference Room may be obtained by calling 1-800-SEC-0330.
Proxy Voting Guidelines
Triad Investment Management, LLC, the Fund’s investment adviser (“Adviser”), is responsible for exercising the voting rights associated with the securities held by the Fund. A description of the policies and procedures used by the Adviser in fulfilling this responsibility is available without charge on the Fund’s website at www.triadmutualfunds.com. It is also included in the Fund’s Statement of Additional Information, which is available on the SEC’s website at http://www.sec.gov.
Information regarding how the Fund voted proxies, Form N-PX, relating to portfolio securities during the most recent period ended June 30th, is available without charge, upon request, by calling our toll free number (1-888-501-1036). This information is also available on the SEC’s website at http://www.sec.gov.
2017 Annual Report 4
Disclosure of Expenses
(Unaudited)
Shareholders of this Fund incur ongoing costs consisting of management fees and service fees. Although the Fund charges no sales loads or transaction fees, you will be assessed fees for outgoing wire transfers, returned checks and stop payment orders at prevailing rates charged by Mutual Shareholder Services, LLC, the Fund’s transfer agent. IRA accounts will be charged an $8.00 annual maintenance fee. If shares are redeemed within 90 days of purchase from the Fund, the shares are subject to a 2% redemption fee. Additionally, your account will be indirectly subject to the expenses of the underlying funds. The following example is intended to help you understand your ongoing costs of investing in the Fund and to compare these costs with similar costs of investing in other mutual funds. The example is based on an investment of $1,000 invested in the Fund on December 1, 2016 and held through May 31, 2017.
The first line of the table below provides information about actual account values and actual expenses. In order to estimate the expenses a shareholder paid during the period covered by this report, shareholders can divide their account value by $1,000 (for example, an $8,600 account value divided by $1,000 = 8.6) and then multiply the result by the number in the first line under the heading entitled “Expenses Paid During the Period.”
The second line of the table below provides information about hypothetical account values and hypothetical expenses based on the Fund’s actual expense ratio and an assumed rate of return of 5% per year before expenses, which is not the Fund’s actual return. The hypothetical account values and expenses may not be used to estimate the actual ending account balance or expenses paid by a shareholder for the period. Shareholders may use this information to compare the ongoing costs of investing in this Fund and other funds. To do so, compare this 5% hypothetical example with the 5% hypothetical examples that appear in other funds’ shareholder reports.
Please note that the expenses shown in the table are meant to highlight your ongoing costs only and do not reflect any transactional costs, such as redemption fees or the charges assessed by Mutual Shareholder Services, LLC as described above and expenses of underlying funds. Therefore, the second line of the table is useful in comparing ongoing costs only, and will not help you determine the relative total costs of owning different funds. In addition, if these transactional costs were included, your costs would have been higher.
| | | | | | | Expenses Paid |
| | | Beginning | | Ending | | During the Period* |
| | | Account Value | | Account Value | | December 1, 2016 |
| | | December 1, 2016 | | May 31, 2017 | | to May 31, 2017 |
| |
| Actual | | $1,000.00 | | $951.24 | | $7.30 |
| |
| Hypothetical | | $1,000.00 | | $1,017.45 | | $7.54 |
| (5% annual return | | | | | | |
| before expenses) | | | | | | |
| * | Expenses are equal to the Fund’s annualized expense ratio of 1.50%, multiplied by the average account value over the period, multiplied by 182/365 (to reflect the one-half year period) |
| |
2017 Annual Report 5
| Triad Small Cap Value Fund | | | | |
| | | | Schedule of Investments |
| | | | | May 31, 2017 |
| Shares | | Fair Value | % of Net Assets |
| | | | | |
| COMMON STOCKS | | | | |
| | | | | |
| Cable & Other Pay Television Services | | | | |
| 448 | AMC Networks Inc. * | $ | 23,735 | 2.94 | % |
| Concrete, Gypsum & Plaster Products | | | | |
| 737 | USG Corporation * | | 20,960 | 2.59 | % |
| Construction Machinery & Equipment | | | | |
| 600 | Douglas Dynamics, Inc. | | 18,270 | 2.26 | % |
| Construction - Special Trade Contractors | | | | |
| 753 | Chicago Bridge & Iron Company N.V. (Netherlands) | | 14,247 | 1.76 | % |
| Drawing & Insulating of Nonferrous Wire | | | | |
| 290 | Belden Inc. | | 20,590 | 2.55 | % |
| Drilling Oil & Gas Wells | | | | |
| 692 | Diamond Offshore Drilling, Inc. * | | 7,993 | 0.99 | % |
| Fabricated Plate Work (Boiler Shops) | | | | |
| 693 | Chart Industries, Inc. * | | 23,805 | 2.95 | % |
| Fabricated Structural Metal Products | | | | |
| 405 | Proto Labs, Inc. * | | 25,920 | 3.21 | % |
| Footwear, (No Rubber) | | | | |
| 2,610 | Iconix Brand Group, Inc. * | | 15,634 | 1.93 | % |
| Industrial Instruments For Measurement, Display, And Control | | | | |
| 250 | Esterline Technologies Corporation * | | 24,362 | 3.01 | % |
| Investment Advice | | | | |
| 381 | Eaton Vance Corp. | | 17,743 | 2.20 | % |
| Land Subdividers & Developers (No Cemeteries) | | | | |
| 1,921 | The St. Joe Company * | | 33,906 | 4.20 | % |
| Miscellaneous Chemical Products | | | | |
| 2,499 | Platform Specialty Products Corporation * | | 31,188 | 3.86 | % |
| Miscellaneous Industrial & Commercial Machinery & Equipment | | | | |
| 602 | Actuant Corporation - Class A | | 15,622 | 1.93 | % |
| Motor Vehicle Parts & Accessories | | | | |
| 209 | LCI Industries | | 18,601 | 2.30 | % |
| Motors & Generators | | | | |
| 437 | Generac Holdings Inc. * | | 15,142 | 1.87 | % |
| Plastics Products, NEC | | | | |
| 534 | Armstrong World Industries, Inc. * | | 22,241 | 2.75 | % |
| Pumps & Pumping Equipment | | | | |
| 609 | Colfax Corporation * | | 24,701 | 3.06 | % |
| Real Estate | | | | | |
| 1,223 | Kennedy-Wilson Holdings, Inc. | | 23,971 | 2.97 | % |
| Retail - Department Stores | | | | |
| 1,051 | Sears Holdings Corporation * | | 7,767 | 0.96 | % |
| Retail - Eating Places | | | | |
| 1,899 | J. Alexander’s Holdings, Inc. * | | 21,554 | 2.67 | % |
| Retail - Family Clothing Stores | | | | |
| 266 | The Buckle, Inc. | | 4,522 | 0.56 | % |
| Retail - Miscellaneous Shopping Goods Stores | | | | |
| 490 | HSN, Inc. | | 16,243 | 2.01 | % |
| Services - Business Services, NEC | | | | |
| 787 | FTD Companies, Inc. * | | 13,631 | | |
| 408 | MAXIMUS, Inc. | | 25,329 | | |
| 705 | Sotheby’s Holdings, Inc. - Class A * | | 37,076 | | |
| | | | 76,036 | 9.40 | % |
* Non-Income Producing Security.
The accompanying notes are an integral part of these
financial statements. |
2017 Annual Report 6
| Triad Small Cap Value Fund |
| | | | Schedule of Investments |
| | | | | | May 31, 2017 |
| Shares | | | Fair Value | | % of Net Assets |
| | | | | | |
| COMMON STOCKS | | | | | |
| | | | | | |
| Services - Computer Processing & Data Preparation | | | | | |
| 538 | CoreLogic, Inc. * | $ | 23,295 | | 2.88 | % |
| Services - Computer Programming Services | | | | | |
| 379 | Syntel, Inc. * | | 6,625 | | 0.82 | % |
| Services - Educational Services | | | | | |
| 33 | Graham Holdings Company | | 19,760 | | 2.44 | % |
| Services - Employment Agencies | | | | | |
| 710 | Korn/Ferry International | | 22,798 | | 2.82 | % |
| Title Insurance | | | | | | |
| 2,610 | Fidelity National Financial Ventures * | | 36,409 | | 4.51 | % |
| Trucking (No Local) | | | | | |
| 490 | Knight Transportation, Inc. | | 16,341 | | 2.02 | % |
| Watches, Clocks, Clockwork Operated Devices/Parts | | | | | |
| 441 | Fossil Group, Inc. * | | 4,750 | | 0.59 | % |
| Wholesale - Hardware | | | | | |
| 3,182 | Wesco Aircraft Holdings, Inc. * | | 30,706 | | 3.80 | % |
| Total for Common Stocks (Cost $666,421) | | 685,437 | | 84.81 | % |
| | Total Investment Securities | | 685,437 | | 84.81 | % |
| | (Cost $666,421) | | | | | |
| | Other Assets In Excess of Liabilities | | 122,743 | | 15.19 | % |
| | Net Assets | $ | 808,180 | | 100.00 | % |
* Non-Income Producing Security.
The accompanying notes are an integral part of these
financial statements. |
2017 Annual Report 7
| Triad Small Cap Value Fund | | | |
| |
| Statement of Assets and Liabilities | | | |
| May 31, 2017 | | | |
| |
| Assets: | | | |
| Investment Securities at Fair Value | $ | 685,437 | |
| (Cost $666,421) | | | |
| Cash | | 28,083 | |
| Dividends Receivable | | 369 | |
| Receivable for Securities Sold | | 95,346 | |
| Total Assets | | 809,235 | |
| Liabilities: | | | |
| Management Fees Payable | | 703 | |
| Service Fees Payable | | 352 | |
| Total Liabilities | | 1,055 | |
| Net Assets | $ | 808,180 | |
| |
| Net Assets Consist of: | | | |
| Paid In Capital | $ | 830,320 | |
| Accumulated Undistributed Realized Gain/(Loss) on Investments - Net | | (41,156 | ) |
| Unrealized Appreciation/(Depreciation) in Value of Investments | | | |
| Based on Identified Cost - Net | | 19,016 | |
| Net Assets, for 88,128 Shares Outstanding | $ | 808,180 | |
| (Unlimited shares authorized) | | | |
| Net Asset Value and Offering Price Per Share | | | |
| ($808,180/88,128 shares) | $ | 9.17 | |
| Redemption Price * ($9.17 x 0.98) (Note 2) | $ | 8.99 | |
| |
| Statement of Operations | | | |
| For the fiscal year ended May 31, 2017 | | | |
| |
| Investment Income: | | | |
| Dividends (Net of foreign withholding taxes of $25) | $ | 10,480 | |
| Interest | | 2 | |
| Total Investment Income | | 10,482 | |
| Expenses: | | | |
| Management Fees (Note 4) | | 8,067 | |
| Service Fees (Note 4) | | 4,033 | |
| Total Expenses | | 12,100 | |
| |
| Net Investment Income/(Loss) | | (1,618 | ) |
| |
| Realized and Unrealized Gain/(Loss) on Investments | | | |
| Realized Gain/(Loss) on Investments | | (16,241 | ) |
| Net Change in Unrealized Appreciation/(Depreciation) on Investments | | 47,084 | |
| Net Realized and Unrealized Gain/(Loss) on Investments | | 30,843 | |
| |
| Net Increase/(Decrease) in Net Assets from Operations | $ | 29,225 | |
| | * Reflects a 2% redemption fee if shares are redeemed within 90 days of purchase. |
The accompanying notes are an integral part of these
financial statements. |
2017 Annual Report 8
| Triad Small Cap Value Fund |
| | |
| Statements of Changes in Net Assets | | | | | | | | |
| | | 6/1/2016 | | | | 6/29/2015* | | |
| | | to | | | | to | | |
| | | 5/31/2017 | | | | 5/31/2016 | | |
| From Operations: | | | | | | | | |
| Net Investment Income/(Loss) | $ | (1,618 | ) | | $ | (5,578 | ) | |
| Net Realized Gain/(Loss) on Investments | | (16,241 | ) | | | (18,454 | ) | |
| Change in Net Unrealized Appreciation/(Depreciation) | | 47,084 | | | | (28,068 | ) | |
| Increase/(Decrease) in Net Assets from Operations | | 29,225 | | | | (52,100 | ) | |
| From Distributions to Shareholders: | | | | | | | | |
| Net Investment Income | | - | | | | - | | |
| Net Realized Gain from Security Transactions | | - | | | | (3,916 | ) | |
| Change in Net Assets from Distributions | | - | | | | (3,916 | ) | |
| From Capital Share Transactions: | | | | | | | | |
| Proceeds From Sale of Shares | | 19,900 | | | | 816,251 | | |
| Proceeds From Redemption Fees (Note 2) | | - | | | | - | | |
| Shares Issued on Reinvestment of Dividends | | - | | | | 3,916 | | |
| Cost of Shares Redeemed | | (5,096 | ) | | | - | | |
| Net Increase/(Decrease) from Shareholder Activity | | 14,804 | | | | 820,167 | | |
| Net Increase/(Decrease) in Net Assets | | 44,029 | | | | 764,151 | | |
| Net Assets at Beginning of Period | | 764,151 | | | | - | | |
| Net Assets at End of Period (Including Accumulated Undistributed Net | | | | | | | | |
| Investment Income/(Loss) of $0 and ($3,064), respectively) | $ | 808,180 | | | $ | 764,151 | | |
| | | | | | | | | |
| Share Transactions: | | | | | | | | |
| Issued | | 2,253 | | | | 85,987 | | |
| Reinvested | | - | | | | 455 | | |
| Redeemed | | (567 | ) | | | - | | |
| Net Increase/(Decrease) in Shares | | 1,686 | | | | 86,442 | | |
| Shares Outstanding Beginning of Period | | 86,442 | | | | - | | |
| Shares Outstanding End of Period | | 88,128 | | | | 86,442 | | |
* Commencement of Operations.
The accompanying notes are an integral part of these
financial statements. |
2017 Annual Report 9
| Triad Small Cap Value Fund |
| | |
| Financial Highlights | | | | | | | | |
| Selected data for a share outstanding throughout the period: | | 6/1/2016 | | | | 6/29/2015* | | |
| | | to | | | | to | | |
| | | 5/31/2017 | | | | 5/31/2016 | | |
| Net Asset Value - | | | | | | | | |
| Beginning of Period | $ | 8.84 | | | $ | 10.00 | | |
| Net Investment Income/(Loss) (a) | | (0.02 | ) | | | (0.08 | ) | |
| Net Gain/(Loss) on Securities (b) | | | | | | | | |
| (Realized and Unrealized) | | 0.35 | | | | (1.03 | ) | |
| Total from Investment Operations | | 0.33 | | | | (1.11 | ) | |
| Distributions (From Net Investment Income) | | - | | | | - | | |
| Distributions (From Realized Capital Gains) | | - | | | | (0.05 | ) | |
| Total Distributions | | - | | | | (0.05 | ) | |
| Proceeds from Redemption Fee (Note 2) | | - | | | | - | | |
| Net Asset Value - | | | | | | | | |
| End of Period | $ | 9.17 | | | $ | 8.84 | | |
| Total Return (c) | | 3.73% | | | | (11.08)% | | ** |
| Ratios/Supplemental Data | | | | | | | | |
| Net Assets - End of Period (Thousands) | $ | 808 | | | $ | 764 | | |
| Ratio of Expenses to Average Net Assets | | 1.50% | | | | 1.50% | | *** |
| Ratio of Net Investment Income/(Loss) to Average Net Assets | | (0.20)% | | | | (0.96)% | | *** |
| Portfolio Turnover Rate | | 53.38% | | | | 75.98% | | ** |
* Commencement of Operations.
** Not Annualized.
*** Annualized.
(a) Per share amounts were calculated using the average shares method.
(b) Realized and unrealized gains and losses per share in this caption are balancing amounts necessary to
reconcile the change in net asset value for the period, and may not reconcile with the aggregate gains and
losses in the Statement of Operations due to share transactions for the period.
(c) Total return represents the rate that the investor would have earned or lost on an investment in the Fund
assuming reinvestment of dividends and distributions. |
The accompanying notes are an integral part of these
financial statements. |
2017 Annual Report 10
NOTES TO THE FINANCIAL STATEMENTS
TRIAD SMALL CAP VALUE FUND
May 31, 2017
1.) ORGANIZATION
Triad Small Cap Value Fund (the “Fund”) was organized as a diversified series of the PFS Funds (the “Trust”) on June 18, 2015 and commenced operations on June 29, 2015. The Trust was established under the laws of Massachusetts by an Agreement and Declaration of Trust dated January 13, 2000, as amended on January 20, 2011. The Trust is registered as an open-end investment company under the Investment Company Act of 1940, as amended (the “1940 Act”). The Trust may offer an unlimited number of shares of beneficial interest in a number of separate series, each series representing a distinct fund with its own investment objectives and policies. As of May 31, 2017, there were eight series authorized by the Trust. The Fund’s primary objective is to seek long-term capital appreciation. The investment adviser to the Fund is Triad Investment Management, LLC (the “Adviser”).
2.) SIGNIFICANT ACCOUNTING POLICIES
The Fund is an investment company and accordingly follows the investment company accounting and reporting guidance of the Financial Accounting Standards Board (“FASB”) Accounting Standards Codification Topic 946 Financial Services - Investment Companies. The financial statements are prepared in conformity with accounting principles generally accepted in the United States (“GAAP”). The Fund follows the significant accounting policies described in this section.
SECURITY VALUATION
All investments in securities are recorded at their estimated fair value, as described in Note 3.
SHARE VALUATION
The net asset value (the “NAV”) is generally calculated as of the close of trading on the New York Stock Exchange (the “Exchange”) (normally 4:00 p.m. Eastern time) every day the Exchange is open. The NAV is calculated by taking the total value of the Fund’s assets, subtracting its liabilities, and then dividing by the total number of shares outstanding, rounded to the nearest cent. The offering price and redemption price per share are equal to the net asset value per share, except that shares of the Fund are subject to a redemption fee of 2% if redeemed within 90 days of purchase. During the fiscal year ended May 31, 2017, proceeds from redemption fees were $0.
FEDERAL INCOME TAXES
The Fund’s policy is to continue to comply with the requirements of the Internal Revenue Code that are applicable to regulated investment companies and to distribute all of its taxable income to shareholders. Therefore, no federal income tax provision is required. It is the Fund’s policy to distribute annually, prior to the end of the calendar year, dividends sufficient to satisfy excise tax requirements of the Internal Revenue Code. This Internal Revenue Code requirement may cause an excess of distributions over the book year-end accumulated income. In addition, it is the Fund’s policy to distribute annually, after the end of the fiscal year, any remaining net investment income and net realized capital gains.
The Fund recognizes the tax benefits of certain tax positions only where the position is “more likely than not” to be sustained assuming examination by tax authorities. Management has analyzed the Fund’s tax positions, and has concluded that no liability for unrecognized tax benefits should be recorded related to uncertain tax positions taken on returns filed for open tax years. The Fund identifies its major tax jurisdictions as U.S. Federal tax authorities; however, the Fund is not aware of any tax positions for which it is reasonably possible that the total amounts of unrecognized tax benefits will change materially in the next twelve months. The Fund recognizes interest and penalties, if any, related to unrecognized tax benefits as income tax expense in the Statement of Operations. During the fiscal year ended May 31, 2017, the Fund did not incur any interest or penalties.
DISTRIBUTIONS TO SHAREHOLDERS
Distributions to shareholders, which are determined in accordance with income tax regulations, are recorded on the ex-dividend date.
2017 Annual Report 11
Notes to the Financial Statements - continued
The treatment for financial reporting purposes of distributions made to shareholders during the year from net investment income or net realized capital gains may differ from their ultimate treatment for federal income tax purposes. These differences are caused primarily by differences in the timing of the recognition of certain components of income, expense, or realized capital gain for federal income tax purposes. Where such differences are permanent in nature, they are reclassified in the components of the net assets based on their ultimate characterization for federal income tax purposes. Any such reclassifications will have no effect on net assets, results of operations, or net asset value per share of the Fund. For the fiscal year ended May 31, 2017, $4,682 of net investment loss was reclassified to paid in capital.
USE OF ESTIMATES
The financial statements are prepared in accordance with GAAP, which requires management to make estimates and assumptions that affect the reported amounts of assets and liabilities and disclosure of contingent assets and liabilities at the date of the financial statements and the reported amounts of increases and decreases in net assets from operations during the reporting period. Actual results could differ from those estimates.
EXPENSES
Expenses incurred by the Trust that do not relate to a specific fund of the Trust are allocated to the individual funds based on each fund’s relative net assets or another appropriate basis.
OTHER
The Fund records security transactions based on the trade date for financial statement reporting purposes. Dividend income is recognized on the ex-dividend date. Interest income is recognized on an accrual basis. The Fund uses the specific identification method in computing gain or loss on the sale of investment securities. Withholding taxes on foreign dividends have been provided for in accordance with the Fund’s understanding of the applicable country’s tax rules and rates.
3.) SECURITIES VALUATIONS
The Fund utilizes various methods to measure the fair value of most of its investments on a recurring basis. GAAP establishes a hierarchy that prioritizes inputs to valuation methods. The three levels of inputs are:
Level 1 - Unadjusted quoted prices in active markets for identical assets or liabilities that the Fund has the ability to access.
Level 2 - Inputs other than quoted prices included in level 1 that are observable for the asset or liability, either directly or indirectly. These inputs may include quoted prices for the identical instrument on an inactive market, prices for similar instruments, interest rates, prepayment speeds, credit risk, yield curves, default rates and similar data.
Level 3 - Unobservable inputs for the asset or liability, to the extent relevant observable inputs are not available, representing the Fund’s own assumptions about the assumptions a market participant would use in valuing the asset or liability, and would be based on the best information available.
The availability of observable inputs can vary from security to security and is affected by a wide variety of factors, including, for example, the type of security, whether the security is new and not yet established in the marketplace, the liquidity of markets, and other characteristics particular to the security. To the extent that valuation is based on models or inputs that are less observable or unobservable in the market, the determination of fair value requires more judgment. Accordingly, the degree of judgment exercised in determining fair value is greatest for instruments categorized in level 3.
The inputs used to measure fair value may fall into different levels of the fair value hierarchy. In such cases, for disclosure purposes, the level in the fair value hierarchy within which the fair value measurement falls in its entirety, is determined based on the lowest level input that is significant to the fair value measurement in its entirety.
2017 Annual Report 12
Notes to the Financial Statements - continued
FAIR VALUE MEASUREMENTS
A description of the valuation techniques applied to the Fund’s major categories of assets and liabilities measured at fair value on a recurring basis follows.
Equity securities (common stocks). Equity securities generally are valued by using market quotations, but may be valued on the basis of prices furnished by a pricing service when the Adviser believes such prices accurately reflect the fair market value of such securities. Securities that are traded on any stock exchange or on the NASDAQ over-the-counter market are generally valued by the pricing service at the last quoted sale price. Lacking a last sale price, an equity security is generally valued by the pricing service at its last bid price. Generally, if the security is traded in an active market and is valued at the last sale price, the security is categorized as a level 1 security. When market quotations are not readily available, when the Adviser determines that the market quotation or the price provided by the pricing service does not accurately reflect the current market value, or when restricted securities are being valued, such securities are valued as determined in good faith by the Adviser, subject to review of the Board of Trustees (the “Trustees” or the “Board”) and are categorized in level 2 or level 3, when appropriate.
In accordance with the Trust’s good faith pricing guidelines, the Adviser is required to consider all appropriate factors relevant to the value of securities for which it has determined other pricing sources are not available or reliable as described above. There is no single standard for determining fair value, since fair value depends upon the circumstances of each individual case. As a general principle, the current fair value of an issue of securities being valued by the Adviser would appear to be the amount which the owner might reasonably expect to receive for them upon their current sale. Methods which are in accordance with this principle may, for example, be based on (i) a multiple of earnings; (ii) a discount from market of a similar freely traded security (including a derivative security or a basket of securities traded on other markets, exchanges or among dealers); or (iii) yield to maturity with respect to debt issues, or a combination of these and other methods.
The following table summarizes the inputs used to value the Fund’s assets measured at fair value as of May 31, 2017:
| Valuation Inputs of Assets | | Level 1 | | Level 2 | | Level 3 | | Total |
| Common Stocks | | $685,437 | | $0 | | $0 | | $685,437 |
| Total | | $685,437 | | $0 | | $0 | | $685,437 |
Refer to the Fund’s Schedule of Investments for a listing of securities by industry. The Fund did not hold any Level 3 assets during the fiscal year ended May 31, 2017. There were no transfers into or out of the levels during the fiscal year ended May 31, 2017. It is the Fund’s policy to consider transfers into or out of the levels as of the end of the reporting period.
The Fund did not invest in derivative instruments during the fiscal year ended May 31, 2017.
4.) INVESTMENT ADVISORY AGREEMENT AND SERVICES AGREEMENT
The Fund entered into an Investment Management Agreement with Triad Investment Management, LLC as the investment adviser of the Fund. Under the terms of the Investment Management Agreement, the Adviser manages the investment portfolio of the Fund, subject to policies adopted by the Trust’s Trustees. The Adviser, at its own expense and without reimbursement from the Fund, furnishes office space and all necessary office facilities, equipment and executive personnel necessary for managing the assets of the Fund. The Adviser also pays the salaries and fees of all of its Officers and employees that serve as Officers and Trustees of the Trust. For its services, the Adviser receives a fee of 1.00% of the average daily net assets of the Fund.
Under the Services Agreement, the Adviser receives an additional fee of 0.50% of the average daily net assets of the Fund, and is obligated to pay the operating expenses of the Fund excluding management fees, brokerage fees and commissions, taxes, borrowing costs (such as (a) interest and (b) dividend expenses on securities sold short), ADR fees, the cost of acquired funds and extraordinary expenses.
2017 Annual Report 13
Notes to the Financial Statements - continued
For the fiscal year ended May 31, 2017, the Adviser earned management fees totaling $8,067 and service fees totaling $4,033. As a result of the management fees and services fees, as of May 31, 2017, the Fund owed the Adviser $703 and $352, respectively.
5.) RELATED PARTY TRANSACTIONS
Jeffrey R. Provence of Premier Fund Solutions, Inc. (the “Administrator”) also serves as a trustee/officer of the Fund. This individual receives benefits from the Administrator resulting from administration fees paid to the Administrator by the Adviser.
The Trustees who are not interested persons of the Trust were each paid $1,000, for a total of $3,000, in Trustees’ fees for the fiscal year ended May 31, 2017, with respect to the Fund.
6.) PURCHASES AND SALES OF SECURITIES
For the fiscal year ended May 31, 2017, purchases and sales of investment securities other than U.S. Government obligations and short-term investments aggregated $412,470 and $495,296, respectively. Purchases and sales of U.S. Government obligations aggregated $0 and $0, respectively.
7.) CONTROL OWNERSHIP
The beneficial ownership, either directly or indirectly, of more than 25% of the voting securities of a fund creates a presumption of control of a fund, under Section 2(a)(9) of the 1940 Act. As of May 31, 2017, The Smith Trust, beneficially held, in aggregate, 57.07% of the Fund and therefore may be deemed to control the Fund.
8.) TAX MATTERS
For Federal income tax purposes, the cost of investments owned at May 31, 2017 was $699,620. At May 31, 2017, the composition of unrealized appreciation (the excess of value over tax cost) and depreciation (the excess of tax cost over value) was as follows:
| | Appreciation | | (Depreciation) | | Net Appreciation/(Depreciation) | |
| | $96,736 | | ($110,919) | | ($14,183) | |
The tax character of distributions was as follows:
| | | Fiscal Year Ended | | June 29, 2015 to |
| | | May 31, 2017 | | May 31, 2016 |
| Ordinary Income . | | $ 0 | | $ 3,916 |
| Long–Term Capital Gain | | 0 | | 0 |
| | | $ 0 | | $ 3,916 |
As of May 31, 2017, the components of distributable earnings/(accumulated losses) on a tax basis were as follows:
| Accumulated net realized losses | $ | (7,957 | ) |
| Unrealized appreciation/(depreciation) | | (14,183 | ) |
| | $ | (22,140 | ) |
As of May 31, 2017, these differences were primarily due to the deferral of wash sale losses and post–October losses. Post–October loss deferrals totaled $33,177.
9.) LOSS CARRYFORWARDS
At May 31, 2017, the Fund had available for federal tax purposes an unused capital loss carryforward of $7,957, of which $341 is short-term with no expiration and $7,616 is long-term with no expiration.
10.) SUBSEQUENT EVENTS
The Board of Trustees of the Trust has approved a Plan of Liquidation (the “Plan”) relating to the Fund on June 1, 2017. The Fund’s investment adviser had recommended to the Board to approve the Plan based on its representations of its inability to market the Fund and the Adviser’s indication that it does not desire to continue to support the Fund. As a result, the Board concluded that it is in
2017 Annual Report 14
Notes to the Financial Statements - continued
the best interest of the shareholders to liquidate the Fund. The Fund liquidated on June 23, 2017. Any remaining shareholders on the date of liquidation received a distribution of their remaining investment value in full liquidation of the Fund.
2017 Annual Report 15
REPORT OF INDEPENDENT REGISTERED PUBLIC ACCOUNTING FIRM
To the Shareholders of Triad Small Cap Value Fund and
Board of Trustees of PFS Funds
We have audited the accompanying statement of assets and liabilities, including the schedule of investments, of Triad Small Cap Value Fund (the “Fund”), a series of PFS Funds, as of May 31, 2017, and the related statement of operations for the year then ended, and the statements of changes in net assets and the financial highlights for each of the two periods in the period then ended. These financial statements and financial highlights are the responsibility of the Fund’s management. Our responsibility is to express an opinion on these financial statements and financial highlights based on our audits.
We conducted our audits in accordance with the standards of the Public Company Accounting Oversight Board (United States). Those standards require that we plan and perform the audit to obtain reasonable assurance about whether the financial statements and financial highlights are free of material misstatement. An audit includes examining, on a test basis, evidence supporting the amounts and disclosures in the financial statements. Our procedures included confirmation of securities owned as of May 31, 2017, by correspondence with the custodian and brokers. An audit also includes assessing the accounting principles used and significant estimates made by management, as well as evaluating the overall financial statement presentation. We believe that our audits provide a reasonable basis for our opinion.
In our opinion, the financial statements and financial highlights referred to above present fairly, in all material respects, the financial position of Triad Small Cap Value Fund as of May 31, 2017, the results of its operations, and the changes in its net assets and the financial highlights for each of the two periods in the period then ended, in conformity with accounting principles generally accepted in the United States of America.
As discussed within Note 10 to the financial statements, on June 1, 2017, the Board of Trustees approved the liquidation of Triad Small Cap Value Fund.

COHEN & COMPANY, LTD.
Cleveland, Ohio
July 19, 2017
2017 Annual Report 16
Trustees and Officers
(Unaudited)
The Board of Trustees supervises the business activities of the Trust. The names of the Trustees and executive officers of the Trust are shown below. For more information regarding the Trustees, please refer to the Statement of Additional Information, which is available upon request by calling 1-888-501-1036. Each Trustee serves until the Trustee sooner dies, resigns, retires, or is removed.
The Trustees and Officers of the Trust and their principal business activities during the past five years are:
Interested Trustees and Officers
| | | | | Number of | |
| | | | Principal | Portfolios In | Other |
| Name, | Position(s) | Term of Office | Occupation(s) | Fund | Directorships |
| Address(1), | Held With | and Length of | During | Complex | Held By |
| and Year of Birth | the Trust | Time Served | Past 5 Years | Overseen By | Trustee |
| | | | | Trustee | |
| |
| Ross C. Provence, | President | Indefinite Term; | General Partner and Portfolio | N/A | N/A |
| Year of Birth: 1938 | | Since 2000 | Manager for Value Trend Capital | | |
| | | | Management, LP (1995 to current). | | |
| | | | Estate planning attorney (1963 to | | |
| current). |
| |
| Jeffrey R. Provence(2), | Trustee, | Indefinite Term; | CEO, Premier Fund Solutions, Inc. | 8 | Blue Chip |
| Year of Birth: 1969 | Secretary | Since 2000 | (2001 to current). General Partner | | Investor Funds |
| | and | | and Portfolio Manager for Value | | |
| | Treasurer | | Trend Capital Management, LP | | |
| | | | (1995 to current). | | |
| |
| Julian G. Winters, | Chief | Chief | Managing Member, Watermark | N/A | N/A |
| Year of Birth: 1968 | Compliance | Compliance | Solutions LLC (investment compli- | | |
| | Officer | Officer Since | ance and consulting) since March | | |
| | | 2010 | 2007. | | |
| | (1) The address of each trustee and officer is c/o PFS Funds, 1939 Friendship Drive, Suite C, El Cajon, California 92020.
(2) Jeffrey R. Provence is considered an “interested person” as defined in Section 2(a)(19) of the Investment Company Act of 1940 by
virtue of his position with the Trust. |
Independent Trustees
| | | | | Number of | |
| | | | Principal | Portfolios In | Other |
| Name, | Position | Term of Office | Occupation(s) | Fund | Directorships |
| Address(1), | Held With | and Length of | During | Complex | Held By |
| and Year of Birth | the Trust | Time Served | Past 5 Years | Overseen By | Trustee |
| | | | | Trustee | |
| |
| Thomas H. Addis III, | Independent | Indefinite Term; | Executive Director/CEO, Southern | 8 | None |
| Year of Birth: 1945 | Trustee | Since 2000 | California PGA (2006 to current). | | |
| |
| Allen C. Brown, | Independent | Indefinite Term; | Co-owner of Stebleton & Brown | 8 | Blue Chip |
| Year of Birth: 1943 | Trustee | Since 2010 | (1994 to Current). Estate planning | | Investor Funds |
| | | | and business attorney (1970 to cur- | | |
| rent). |
| |
| George Cossolias, CPA, | Independent | Indefinite Term; | Partner of CWDL, CPAs (February 1, | 8 | Blue Chip |
| Year of Birth: 1935 | Trustee | Since 2000 | 2014 to current). Owner of George | | Investor Funds |
| | | | Cossolias & Company, CPAs (1972 | | |
| | | | to January 31, 2014). President of | | |
| | | | Lubrication Specialists, Inc. (1996 to | | |
| current). |
(1) The address of each trustee and officer is c/o PFS Funds, 1939 Friendship Drive, Suite C, El Cajon, California 92020.
2017 Annual Report 17
Investment Adviser
Triad Investment Management, LLC
Legal Counsel
The Law Offices of John H. Lively & Associates, Inc.
A member firm of The 1940 Act Law GroupTM
Custodian
US Bank, N.A.
Distributor
Rafferty Capital Markets, LLC
Dividend Paying Agent,
Shareholders' Servicing Agent,
Transfer Agent
Mutual Shareholder Services, LLC
Fund Administrator
Premier Fund Solutions, Inc.
Independent Registered Public Accounting Firm
Cohen & Company, Ltd. |
This report is provided for the general information of the shareholders of the Triad Small
Cap Value Fund. This report is not intended for distribution to prospective investors in
the Fund, unless preceded or accompanied by an effective prospectus. |
Triad Small Cap Value Fund
www.triadmutualfunds.com
1-888-501-1036
Item 2. Code of Ethics.
The registrant has adopted a code of ethics that applies to the registrant’s principal executive officer and the principal financial officer. The registrant has not made any amendments to its code of ethics during the covered period. The registrant has not granted any waivers from any provisions of the code of ethics during the covered period. A copy of the registrant’s Code of Ethics is filed herewith.
Item 3. Audit Committee Financial Expert.
The registrant’s Board of Trustees has determined that George Cossolias is an audit committee finical expert. Mr. Cossolias is independent for purposes of this Item 3.
Item 4. Principal Accountant Fees and Services.
(a-d) The following table details the aggregate fees billed for each of the last two fiscal years for audit fees, audit-related fees, tax fees and other fees by the principal accountant to the registrant. The principal accountant has provided no services to the adviser or any entity controlled by, or under common control with the adviser that provides ongoing services to the registrant.
| | | FYE 5/31/17 | | FYE 5/31/16 |
| Audit Fees | | $13,250 | | $13,250 |
| Audit-Related Fees | | $0 | | $0 |
| Tax Fees | | $2,500 | | $2,500 |
| All Other Fees | | $750 | | $0 |
Nature of Tax Fees: preparation of Excise Tax Statement and 1120 RIC.
Nature of All Other Fees: Review of Semi-Annual Report.
(e) (1) The audit committee approves all audit and non-audit related services and, therefore, has not adopted pre-approval policies and procedures described in paragraph (c)(7) of Rule 2-01 of Regulation S-X.
(e) (2) None of the services described in paragraph (b) through (d) of this Item were approved by the audit committee pursuant to paragraph (c)(7)(i)(C) of Rule 2-01 of Regulation S-X.
(f) All of the principal accountant’s hours spent on auditing the registrant’s financial statements were attributed to work performed by full-time permanent employees of the principal accountant.
(g) The following table indicates the aggregate non-audit fees billed by the registrant’s principal accountant for services to the registrant , the registrant’s investment adviser (not sub-adviser), and any entity controlling, controlled by, or under common control with the adviser that provides ongoing services to the registrant, for the last two years.
| Non-Audit Fees | | FYE 5/31/17 | | FYE 5/31/16 |
| Registrant | | $3,250 | | $2,500 |
| Registrant’s Investment Adviser | | $0 | | $0 |
(h) The principal accountant provided no services to the investment adviser or any entity controlling, controlled by, or under common control with the adviser that provides ongoing services to the registrant.
Item 5. Audit Committee of Listed Companies. Not applicable.
Item 6. Schedule of Investments. Schedule filed with Item 1.
Item 7. Disclosure of Proxy Voting Policies and Procedures for Closed-End Management Investment Companies. Not applicable.
Item 8. Portfolio Managers of Closed End Management Investment Companies. Not applicable.
Item 9. Purchases of Equity Securities by Closed-End Management Investment Companies and Affiliated Purchasers. Not applicable.
Item 10. Submission of Matters to a Vote of Security Holders.
The registrant has not adopted procedures by which shareholders may recommend nominees to the registrant’s board of trustees.
Item 11. Controls and Procedures.
(a) The registrant’s president and chief financial officer concluded that the disclosure controls and procedures (as defined in Rule 30a-3(c) under the Investment Company Act of 1940 (the “Act”)) were effective as of a date within 90 days of the filing date of this report, based on the evaluation of these controls and procedures required by Rule 30a-3(b) under the Act.
(b) There were no changes in the registrant’s internal control over financial reporting (as defined in Rule 30a-3(d) under the Act) that occurred during the registrant’s second fiscal quarter of the period covered by this report that have materially affected, or are reasonably likely to materially affect, the registrant’s internal control over financial reporting.
Item 12. Exhibits.
(a)(1) Code of Ethics. Filed herewith.
(a)(2) Certifications pursuant to Section 302 of the Sarbanes-Oxley Act of 2002. Filed herewith.
(a)(3) Not applicable.
(b) Certification pursuant to Section 906 Certification of the Sarbanes-Oxley Act of 2002. Filed herewith.
SIGNATURES
Pursuant to the requirements of the Securities Exchange Act of 1934 and the Investment Company Act of 1940, the registrant has duly caused this report to be signed on its behalf by the undersigned, thereunto duly authorized.
| | By: /s/Ross C. Provence
Ross C. Provence
President |
Pursuant to the requirements of the Securities Exchange Act of 1934 and the Investment Company Act of 1940, this report has been signed below by the following persons on behalf of the registrant and in the capacities and on the dates indicated.
| | By: /s/Ross C. Provence
Ross C. Provence
President |
| | By: /s/Jeffrey R. Provence
Jeffrey R. Provence
Chief Financial Officer |