UNITED STATES
SECURITIES AND EXCHANGE COMMISSION
WASHINGTON, D.C. 20549
FORM N-CSR
CERTIFIED SHAREHOLDER REPORT OF REGISTERED MANAGEMENT
INVESTMENT COMPANIES
Investment Company Act file number 811-09781
PFS Funds
(Exact name of registrant as specified in charter)
1939 Friendship Drive, Suite C, El Cajon, CA 92020
(Address of principal executive offices) (Zip code)
CT Corporation System
155 Federal St., Suite 700, Boston, MA 02110
(Name and address of agent for service)
Registrant's telephone number, including area code: (619) 588-9700
Date of fiscal year end: December 31
Date of reporting period: December 31, 2016
Form N-CSR is to be used by management investment companies to file reports with the Commission not later than 10 days after the transmission to stockholders of any report that is required to be transmitted to stockholders under Rule 30e-1 under the Investment Company Act of 1940 (17 CFR 270.30e -1). The Commission may use the information provided on Form N-CSR in its regulatory, disclosure review, inspection and policymaking roles.
A registrant is required to disclose the information specified by Form N-CSR, and the Commission will make this information public. A registrant is not required to respond to the collection of information contained in Form N-CSR unless the Form displays a currently valid Office of Management and Budget ("OMB") control number.
Item 1. Reports to Stockholders.

Annual Report
December 31, 2016
BRTNX |
February 17, 2017
Dear Fellow Shareholders:
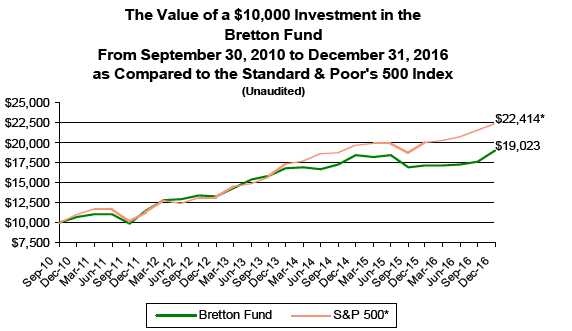
The Bretton Fund’s net asset value per share (NAV) as of December 31, 2016, was $26.12. For the year, the fund returned 10.68% compared to the S&P 500’s 11.96% .
Total Returns as of December 31, 2016(A)
| | | | | | Annualized | | Annualized | | Annualized | |
| | 4th Quarter | | 1 Year | | 3 Years | | 5 Years | | Since Inception | |
| Bretton Fund | 8.02% | | 10.68% | | 4.31% | | 10.68% | | 10.83% | |
| S&P 500 Index(B) | 3.82% | | 11.96% | | 8.87% | | 14.66% | | 13.78% | |
| Calendar Year Total Returns(A) | | | | |
| | Bretton Fund | | S&P 500 Index | |
| 2016 | 10.68% | | 11.96% | |
| 2015 | -6.59% | | 1.38% | |
| 2014 | 9.79% | | 13.69% | |
| 2013 | 26.53% | | 32.39% | |
| 2012 | 15.66% | | 16.00% | |
| 2011 | 7.90% | | 2.11% | |
| 9/30/10–12/31/10 | 6.13% | | 10.76% | |
| Cumulative Since Inception | 90.23% | | 124.14% | |
(A) All returns include change in share prices and, in each case, include reinvestment of any dividends and capital gain distributions. The inception date of the Bretton Fund was September 30, 2010.
(B) The S&P 500® Index is a stock market index based on the market capitalizations of 500 leading companies publicly traded in the US stock market, as determined by Standard & Poor’s, and captures approximately 80% coverage of available market capitalization.
Performance data quoted represents past performance. Past performance does not guarantee future results. The investment return and principal value of an investment will fluctuate so that an investor’s shares, when redeemed, may be worth more or less than their original cost. Current performance may be lower or higher than the performance data quoted. You may obtain performance data current to the most recent month-end at http://brettonfund.com or by calling 800.231.2901.
All returns include change in share prices, reinvestment of any dividends, and capital gains distributions. Indices shown are broad-based, unmanaged indices commonly used to measure performance of US stocks. These indices do not incur expenses and are not available for investment. The fund’s expense ratio is 1.50% .The fund’s principal underwriter is Rafferty Capital Markets, LLC.
1
4th Quarter
The fund returned 8.02% in the fourth quarter, compared to 3.82% for the S&P 500. Our investment in banks, as well as construction supplier HD Supply, surged on investor optimism in those sectors following the election. Bank of America added 1.8% to performance, while HD Supply added 1.6%, Wells Fargo 1.3%, and JPMorgan Chase 1.3% . Visa and new holding Continental Building Products each took away 0.1% from the fund.
In the quarter, we sold our shares in Nordson as its stock price almost doubled from the start of the year, reaching our target valuation. Our annualized return (aka, internal rate of return) on Nordson was 19.4% .
We added two companies in the quarter: wallboard manufacturer Continental Building Products and paint company PPG Industries. We discuss these investments in more detail below.
Contributors to Performance for 2016
For the year, the fund benefited from a rebound in bank and infrastructure stocks. HD Supply added 2.1% to the fund’s performance, and the other main contributors were Union Pacific with 1.9%, Bank of America 1.8%, JPMorgan Chase 1.5%, Valspar 1.3%, Nordson 1.1%, and Ross Stores 1.1% .
We were hurt by two of our healthcare investments, along with our real estate agency investment. They were Community Health Systems, taking -0.7% off the fund, MEDNAX -0.4%, and Realogy -0.3% .
Tax Distributions
The fund made a long-term capital-gain distribution of $0.42651 per share to shareholders on December 22, amounting to 1.6% of the fund’s NAV. There were no other distributions during the year.
| Portfolio | | |
| |
| Security | % of Net Assets |
| Alphabet, Inc. | 7.5 | % |
| Wells Fargo & Company | 6.5 | % |
| Union Pacific Corp. | 6.5 | % |
| HD Supply Holdings, Inc. | 6.3 | % |
| Bank of America Corp. | 6.1 | % |
| AutoZone, Inc. | 6.1 | % |
| JPMorgan Chase & Co. | 5.4 | % |
| MEDNAX, Inc. | 5.3 | % |
| Ross Stores, Inc. | 5.1 | % |
| American Express Co. | 5.0 | % |
| Berkshire Hathaway, Inc. | 4.6 | % |
| MasterCard, Inc. | 4.6 | % |
| Carter’s, Inc. | 3.9 | % |
| Valspar Corp. | 3.9 | % |
| Discovery Communications, Inc. | 3.7 | % |
| Visa, Inc. | 3.3 | % |
| Continental Building Products, Inc. | 3.3 | % |
| PPG Industries, Inc. | 2.7 | % |
| Armanino Foods of Distinction, Inc. | 2.2 | % |
| Flowserve Corp. | 1.9 | % |
| Verisk Analytics, Inc. | 1.4 | % |
| Whole Foods Market, Inc. | 1.2 | % |
| Cash* | 3.5 | % |
* Cash represents cash and other assets less liabilities.
2
Portfolio Discussion
Retail & Consumer
The retail industry in general is undergoing a tectonic shift as consumers shift their spending online. It’s a whole lot easier to get things delivered to your door than fighting your way through traffic and crowds to get to a Macy’s that may not even have what you want in stock. Much of retail is under pressure from Amazon and others, and that pressure isn’t going to abate, ever. A lot of retail stocks have suffered and are trading at ostensible bargains, yet we’re likely to pass on almost every one of them. Investing in retail today, one has to ask, “Why can’t Amazon eventually replace this business?” Retailers that can thrive in this new environment are ones whose products or shopping experiences are somehow insulated from online competition. Most auto parts purchased at AutoZone are needed right away; many customers are mechanics who can’t afford to wait for even one- or two-day delivery for critical parts. Ross Stores (and its primary competitor, TJX with its T.J. Maxx and Marshalls stores) provides a rapid-fire, “treasure hunting” experience, with thousands of distinct items at enormous discounts; in effect the Ross shopper is staffing her own distribution center, purchasing items with an average price comparable to UPS shipping costs. We believe the retailers we own are set for the internet age.
AutoZone’s steady growth in stores (+4%) and sales per store last year (+2%), combined with buying back 5.3% of the company’s stock, led to a 13% increase in earnings per share. We think the company can continue to do this for years. The stock returned 6.7% last year.
Ross Stores was on pace to increase sales 7% and earnings per share 12%. The market rewarded Ross’s stock price, giving it a total return of 22.9% last year.
Baby clothes producer Carter’s is set to increase its 2016 earnings per share 9% over 2015 levels. Its stock price lagged, in part due to investors expecting even higher growth and general concern about the apparel sector, for a total return of -0.9% . We expect this lull to be temporary; management expects earnings per share growth to return to low double digits this year.
Armanino Foods of Distinction, our maker of frozen pesto sauce, rebounded from a tepid 2015 and hit record sales and earnings in 2016. It has also revamped its production process, doubling capacity and exceeding industry food safety standards. Its stock returned 16.1% .
Whole Foods Markets continued to struggle, increasing its earnings per share by only 4%, due to a 2.5% decline in sales per store. After a rough few quarters, the business seems to be stabilizing, and we still believe the company has a long runway to build stores. Grocery shopping is very much a local activity, and it’ll be many years before Whole Foods reaches saturation. However, competition isn’t likely to get any easier. The stock’s total return was -6.2% . At 1.2%, it remains a small position for us.
Industrial Products & Transportation
Despite an early decline, Union Pacific’s traffic stabilized toward the end of the year, which along with solid pricing gains led to a total return of 34.0% for the stock. Earnings per share dropped 8%, but is expected to gain 12% in 2017.
HD Supply had a good year; its stock price had an even better year. It refinanced and paid down its heavy debt load, sold off an ancillary division, and grew its earnings and free cash flow significantly. The market rewarded the company by boosting its stock price
3
43.4%, though some of that is based on an anticipated—but yet-to-be substantiated—boon in infrastructure construction spending.
The stock price of new addition Berkshire Hathaway increased 12.8% over our average cost. Warren Buffett’s conglomerate benefited from its large holdings of bank stocks, as well as its broad collection of industrial and insurance businesses.
Flowserve, the maker of industrial-scale pumps and seals—much of it for the energy sectors—also saw a sharp stock price rebound, producing a total return of 18.3%, based on higher oil prices and increased investor optimism about infrastructure spending. Earnings per share was on pace to drop 30% from the previous year. We sold around half our position, as we became less enthusiastic about the timing of a significant turnaround and took advantage of the share price rally.
Banking
It took a little longer than we thought it would, but we’re beginning to see the benefits of higher interest rates on our bank investments. The Federal Reserve raised its benchmark interest rate target toward the end of the year, after almost a year of no changes and a decade pushing zero, and indicated it will raise rates a few more times in 2017. JPMorgan Chase and Bank of America are more sensitive to short-term rates than Wells Fargo and thus saw a more immediate benefit, but we expect all three to benefit significantly from higher rates combined with low loan losses and tight cost control. Furthermore, the regulatory environment is more pro-bank than we (or the market) would have expected a quarter ago. Despite their run-ups, the stocks remain fairly cheap relative to the companies’ abilities to grow earnings per share.
Wells Fargo had a mixed year, to put it mildly. Regulators discovered that branch staff members at many Wells locations opened thousands of accounts without authorization—sometimes going so far as to forge signatures—to meet overly aggressive sales goals set by management. Despite the headlines and public antipathy, the immediate financial hit to Wells wasn’t very large, but could eventually be meaningful if customers defect en masse (so far, they haven’t) or if this issue is the tip of a larger compliance iceberg. Wells has since replaced both its CEO and retail banking chief, and we are watching closely to see how well they do in restoring their customers’ trust. Earnings per share declined 3% for the year, while its stock’s total return was 5.8% .
JPMorgan Chase benefited from the higher rates and greater trading activity, particularly toward the end of the year. Earnings per share increased 3%; its stock returned 34.9% .
Bank of America also benefited from higher rates and continued to cut its legacy costs stemming from the financial crisis. Earnings per share increased 15%, and its stock returned 35.4% .
Payments
Our three investments in the payments sector all have what we look for in long-term compounders: a long runway for healthy growth (the world is rapidly moving from cash to card), a defensible business (it’s very difficult to create a payments network from scratch), and the ability to return excess capital to shareholders (all three companies issue dividends and buy back stock).
After coming off a tough 2015—losing its largest card partner in Costco—American Express spent the year trying to make up for that lost business. Helped by a one-time gain from the sale of its Costco-related loans, earnings per share increased 12%. It spent
4
much of that gain on promotions and marketing, trying to woo back old customers, retain its most valued customers from increased competition, and add new cardholders with large incentives. Its stock returned 10.1% last year, and it remains a bargain compared to its earnings.
Mastercard increased its adjusted earnings per share by 19%, and we expect future growth to be be close to its historic rate of low-to-mid teens for a long time.
We added Visa last year as we felt the market was significantly underestimating the benefits of its reunion with Visa Europe, which had been separately owned and run by its European bank partners. We also didn’t think investors were fully appreciating for how long the company will continue to see high growth. Like Mastercard, Visa isn’t cheap based on its current earnings, but given its growth, we think we’ll see a nice return from it. Our return to date on the stock is -2.5% .
Media & Technology
Alphabet, Inc., aka Google, became our largest holding this year. Though the stock only returned 3.6% for the full year, we loaded up on shares during a handful of weak spells; our overall gain to date is 17.5% . Despite its large size (it’s one of the world’s largest companies by market capitalization), earnings per share grew 22% last year and would have grown even more if not for the unfavorable currency swing. Unlike earlier in its history, the company seems to be increasingly considerate of outside shareholders and maintaining spending discipline. Despite this very fast growth rate and capital restraint, it trades at only a slight premium to the market.
Discovery Communications, proprietor of its eponymous Discovery Channel and other channels, had an outstanding year, which unfortunately was obscured by broader industry concerns. Earnings per share, before currency fluctuations, increased more than 20% last year, and management believes they can grow cash flow and earnings per share in the low teens for the next few years. Despite this performance, the stock rose only 4.8% . More US subscribers are “cutting the cord” from traditional providers and watching video online. More video subscribers are buying “skinny bundles,” with fewer channels at a lower cost, and some of these bundles don’t include all of Discovery’s channels. Discovery’s programming blend is well-suited for linear programming—it is fun to watch and has devout viewers the company calls “superfans”—but unlike, say, Disney’s iconic movies, Discovery’s content doesn’t do as well in an on-demand world. We share these concerns. However, the market is offering us a growing, globally distributed platform of original content for a 9% free cash flow yield. Management has been a good steward of capital, buying back stock and making prudent acquisitions, and controlling shareholder John Malone has a history of seeking value-maximizing deals for shareholders. Discovery’s overhead is roughly similar to its operating income, which would mean tremendous synergies in a combination with Fox or another content owner. And we can’t help but notice that both Netflix and Amazon have been pushing hard to own their own content. We are cautiously optimistic that the low valuation and strategic value balance the industry risks.
Verisk, the provider of data and software for various industries including property insurance, was on pace for 9% earnings per share growth from its core business. The stock returned 5.8% last year.
Building Products
Valspar announced its acquisition by larger paint company Sherwin-Williams early in the year, which led to a 26.7% total return. We sold a large portion of our position after the
5
announcement, though we continue to hold some remaining shares. There’s a small gap between the current share price and the eventual acquisition price, and we gain some favorable capital-gains tax treatment for the shares we end up owning for longer than a year.
We like the paint business so much that we decided to invest in another one. We added PPG Industries, the world’s largest maker of paints and other coatings, to the fund in the fourth quarter. Based just outside Pittsburgh and originally known as Pittsburgh Plate Glass Company, the company has been around since 1883. Over time it has transformed itself from a glass and chemicals maker—both poor, volatile businesses—to a higher-return, higher-margin coatings company, patiently selling off its legacy businesses and opportunistically buying up smaller paints and coatings companies at attractive prices. Organic growth in the business is relatively modest (the phrase “watching paint dry” comes to mind), but PPG has been able to grow its coatings revenue by 12% a year for 10 years through good acquisitions. The coatings business has high returns on capital since it’s such a defensible industry. Given the economies of scale of both manufacturing and distribution, there aren’t really new entrants. We’ve acquired PPG at a reasonable price and expect to see a nice return from a high return of capital combined with smart acquisitions. We have a gain of 2.9% to date.
Also in the fourth quarter, we added Continental Building Products, a maker of wallboard. Made out of gypsum and thick paper and often known as drywall, wallboard is used by builders for most residential walls built in the US today. Like many building products, the wallboard industry saw rough times after the housing bust, but has slowly rebounded with the housing market. New home construction is still way below its 50-year average, so there’s a lot more room to grow. More important, the wallboard industry has consolidated and is much more rational about pricing. The product essentially is a commodity, but the combination of its low price and high relative shipping cost leaves each region with only a few competitors. Due to a wrinkle in accounting standards, Continental’s free cash flow is considerably higher than its reported earnings—which are usually similar for most companies—and we think the market is missing this important detail. Continental’s management is taking advantage of its low stock price and high free cash flow by buying back as much stock as it can, acquiring 10% of its own shares the past 18 months. We are down 2.6% on the investment so far.
Healthcare
Doctor-staffing company MEDNAX had a mediocre year, with roughly flat earnings per share growth and a stock price decline of 6.5% . MEDNAX grows mostly through acquisitions, buying private doctor groups in its core historic verticals of anesthesiology and neonatology. As the company has expanded its scope to teleradiology (remote doctor assessments of X-rays and CT scans) and other fields like hospital billing software, it’s had growing pains in achieving the same economics with these acquisitions. Management maintains these are short-term speed bumps (e.g., there’s a decent lag time between when you hire and start paying a radiologist and when she passes multiple states’ board examinations to be able to start working), and we’re inclined to agree. Revenue grew 15% last year, and we think earnings will catch up eventually.
Investments Initiated in 2016
Berkshire Hathaway
Continental Building Products
PPG Industries
Realogy Holdings
Visa
6
| Investments Exited During 2016 | | |
| Investment | Internal Rate of Return |
| PGT Industries | 3.7 | % |
| Community Health Systems | -66.9 | % |
| Nordson | 19.4 | % |
| T-Mobile | 4.5 | % |
| Centene | 11.2 | % |
| Realogy Holdings | -32.2 | % |
As always, thank you for investing.
Stephen Dodson
Portfolio Manager | Raphael de Balmann
Portfolio Manager |
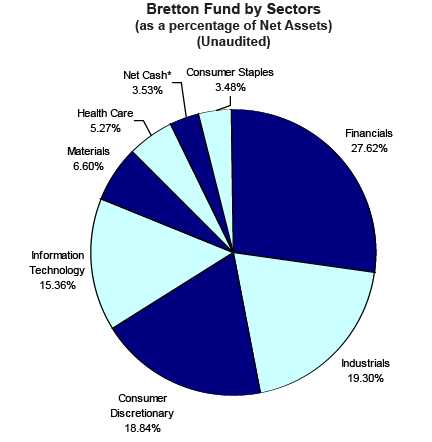
* Net Cash represents cash and other assets less liabilities.
7
| Bretton Fund |
| | | | | | | Schedule of Investments |
| | | | | | | December 31, 2016 |
| Shares | | Cost | | Fair Value | | % of Net Assets |
| COMMON STOCKS | | | | | | | | |
| | | | | | | |
| Apparel & Other Finished Products of Fabrics & Similar Material | | | | | | |
| 11,200 | Carter's, Inc. | $ | 806,016 | | $ | 967,568 | | 3.92 | % |
| Cable & Other Pay Television Services | | | | | | | | |
| 33,500 | Discovery Communications, Inc. - Class A * | | 1,065,807 | | | 918,235 | | 3.72 | % |
| Canned, Frozen & Preserved Fruit, Vegetables & Food Specialties | | | | | | |
| 245,430 | Armanino Foods of Distinction, Inc. | | 241,491 | | | 549,763 | | 2.23 | % |
| Concrete, Gypsum & Plaster Products | | | | | | | | |
| 35,000 | Continental Building Products, Inc. * | | 837,126 | | | 808,500 | | 3.28 | % |
| Finance Services | | | | | | | | |
| 16,600 | American Express Company | | 1,162,234 | | | 1,229,728 | | 4.99 | % |
| Fire, Marine & Casualty Insurance | | | | | | | | |
| 7,000 | Berkshire Hathaway Inc. - Class B * | | 1,016,650 | | | 1,140,860 | | 4.63 | % |
| National Commercial Banks | | | | | | | | |
| 68,400 | Bank of America Corporation | | 1,087,675 | | | 1,511,640 | | | |
| 15,400 | JPMorgan Chase & Co. | | 824,088 | | | 1,328,866 | | | |
| 29,000 | Wells Fargo & Company | | 1,124,110 | | | 1,598,190 | | | |
| | | | 3,035,873 | | | 4,438,696 | | 18.00 | % |
| Paints, Varnishes, Lacquers, Enamels & Allied Products | | | | | | | | |
| 7,000 | PPG Industries, Inc. | | 650,424 | | | 663,320 | | | |
| 9,300 | The Valspar Corporation | | 755,344 | | | 963,573 | | | |
| | | | 1,405,768 | | | 1,626,893 | | 6.60 | % |
| Pumps & Pumping Equipment | | | | | | | | |
| 9,750 | Flowserve Corporation | | 417,721 | | | 468,488 | | 1.90 | % |
| Railroad, Line-Haul Operating | | | | | | | | |
| 15,350 | Union Pacific Corporation | | 1,243,056 | | | 1,591,488 | | 6.45 | % |
| Retail - Auto & Home Supply Stores | | | | | | | | |
| 1,900 | AutoZone, Inc. * | | 1,360,150 | | | 1,500,601 | | 6.09 | % |
| Retail - Family Clothing Stores | | | | | | | | |
| 19,200 | Ross Stores Inc. | | 381,166 | | | 1,259,520 | | 5.11 | % |
| Retail - Grocery Stores | | | | | | | | |
| 10,000 | Whole Foods Market, Inc. | | 395,698 | | | 307,600 | | 1.25 | % |
| Services - Business Services, NEC | | | | | | | | |
| 10,880 | MasterCard Incorporated - Class A | | 975,719 | | | 1,123,360 | | | |
| 10,400 | Visa Inc. - Class A | | 848,971 | | | 811,408 | | | |
| | | | 1,824,690 | | | 1,934,768 | | 7.85 | % |
| Services - Computer Processing & Data Preparation | | | | | | | | |
| 2,400 | Alphabet Inc. - Class C * | | 1,605,383 | | | 1,852,368 | | | |
| 4,200 | Verisk Analytics, Inc. - Class A * | | 300,739 | | | 340,914 | | | |
| | | | 1,906,122 | | | 2,193,282 | | 8.89 | % |
| Services - Hospitals | | | | | | | | |
| 19,500 | MEDNAX, Inc. * | | 1,438,983 | | | 1,299,870 | | 5.27 | % |
| Wholesale - Durable Goods | | | | | | | | |
| 36,500 | HD Supply Holdings, Inc. * | | 1,187,210 | | | 1,551,615 | | 6.29 | % |
| Total for Common Stocks | $ | 19,725,761 | | $ | 23,787,475 | | 96.47 | % |
| Total Investment Securities | $ | 19,725,761 | | $ | 23,787,475 | | | |
| Other Assets in Excess of Liabilities | | | | $ | 870,020 | | 3.53 | % |
| Net Assets | | | | | $ | 24,657,495 | | 100.00 | % |
| | * Non-Income Producing Securities.
The accompanying notes are an integral part of these
financial statements. |
8
| Bretton Fund | | | |
| |
| Statement of Assets and Liabilities | | | |
| December 31, 2016 | | | |
| |
| Assets: | | | |
| Investment Securities at Fair Value | $ | 23,787,475 | |
| (Cost $19,725,761) | | | |
| Cash | | 894,813 | |
| Dividend Receivable | | 6,761 | |
| Total Assets | | 24,689,049 | |
| Liabilities: | | | |
| Payable to Adviser (Note 4) | | 31,554 | |
| Total Liabilities | | 31,554 | |
| Net Assets | $ | 24,657,495 | |
| |
| Net Assets Consist of: | | | |
| Paid In Capital (Note 5) | $ | 20,922,773 | |
| Accumulated Undistributed Realized Gain (Loss) on Investments - Net | | (326,992 | ) |
| Unrealized Appreciation (Depreciation) in Value of Investments | | | |
| Based on Identified Cost - Net | | 4,061,714 | |
| Net Assets, for 943,954 Shares Outstanding | $ | 24,657,495 | |
| (Unlimited shares authorized) | | | |
| Net Asset Value, Offering Price and Redemption Price Per Share | | | |
| ($24,657,495/943,954 shares) | $ | 26.12 | |
| |
| Statement of Operations | | | |
| For the fiscal year ended December 31, 2016 | | | |
| |
| Investment Income: | | | |
| Dividends | $ | 228,218 | |
| Interest | | 17 | |
| Total Investment Income | | 228,235 | |
| Expenses: | | | |
| Management Fees (Note 4) | | 333,422 | |
| Total Expenses | | 333,422 | |
| |
| Net Investment Income (Loss) | | (105,187 | ) |
| |
| Realized and Unrealized Gain (Loss) on Investments: | | | |
| Realized Gain (Loss) on Investments | | (326,992 | ) |
| Net Change in Unrealized Appreciation (Depreciation) on Investments | | 2,894,400 | |
| Net Realized and Unrealized Gain (Loss) on Investments | | 2,567,408 | |
| |
| Net Increase (Decrease) in Net Assets from Operations | $ | 2,462,221 | |
| | The accompanying notes are an integral part of these
financial statements. |
9
| Bretton Fund |
| |
| Statements of Changes in Net Assets | | | | | | | |
| | | 1/1/2016 | | | | 1/1/2015 | |
| | | to | | | | to | |
| | | 12/31/2016 | | | | 12/31/2015 | |
| From Operations: | | | | | | | |
| Net Investment Income (Loss) | $ | (105,187 | ) | | $ | (7,719 | ) |
| Net Realized Gain (Loss) on Investments | | (326,992 | ) | | | 421,731 | |
| Change in Net Unrealized Appreciation (Depreciation) | | 2,894,400 | | | | (1,573,238 | ) |
| Increase (Decrease) in Net Assets from Operations | | 2,462,221 | | | | (1,159,226 | ) |
| From Distributions to Shareholders: | | | | | | | |
| Net Investment Income | | - | | | | - | |
| Net Realized Gain from Security Transactions | | (396,220 | ) | | | (37,515 | ) |
| Change in Net Assets from Distributions | | (396,220 | ) | | | (37,515 | ) |
| From Capital Share Transactions: | | | | | | | |
| Proceeds From Sale of Shares | | 2,119,677 | | | | 11,410,246 | |
| Shares Issued on Reinvestment of Distributions | | 396,058 | | | | 37,498 | |
| Cost of Shares Redeemed | | (455,012 | ) | | | (268,740 | ) |
| Net Increase (Decrease) from Shareholder Activity | | 2,060,723 | | | | 11,179,004 | |
| |
| Net Increase (Decrease) in Net Assets | | 4,126,724 | | | | 9,982,263 | |
| |
| Net Assets at Beginning of Period | | 20,530,771 | | | | 10,548,508 | |
| Net Assets at End of Period (Including Accumulated Undistributed | | | | | | | |
| Net Investment Income of $0 and $0, respectively) | $ | 24,657,495 | | | $ | 20,530,771 | |
| |
| Share Transactions: | | | | | | | |
| Issued | | 91,085 | | | | 455,194 | |
| Reinvested | | 14,968 | | | | 1,546 | |
| Redeemed | | (18,342 | ) | | | (10,688 | ) |
| Net Increase (Decrease) in Shares | | 87,711 | | | | 446,052 | |
| Shares Outstanding Beginning of Period | | 856,243 | | | | 410,191 | |
| Shares Outstanding End of Period | | 943,954 | | | | 856,243 | |
| Financial Highlights | | | | | | | | | | | | | | | | | | | | |
| Selected data for a share outstanding | | | | | | | | | | | | | | | | | | | | |
| throughout the period: | | 1/1/2016 | | | | 1/1/2015 | | | | 1/1/2014 | | | | 1/1/2013 | | | | 1/1/2012 | | |
| | | to | | | | to | | | | to | | | | to | | | | to | | |
| | | 12/31/2016 | | | | 12/31/2015 | | | | 12/31/2014 | | | | 12/31/2013 | | | | 12/31/2012 | | |
| Net Asset Value - | | | | | | | | | | | | | | | | | | | | |
| Beginning of Period | $ | 23.98 | | | $ | 25.72 | | | $ | 23.44 | | | $ | 18.84 | | | $ | 16.98 | | |
| Net Investment Income (Loss) (a) | | (0.11 | ) | | | (0.01 | ) | | | 0.01 | | | | - | | (b) | | - | | (b) |
| Net Gain (Loss) on Securities | | | | | | | | | | | | | | | | | | | | |
| (Realized and Unrealized) | | 2.68 | | | | (1.69 | ) | | | 2.28 | | | | 5.00 | | | | 2.65 | | |
| Total from Investment Operations | | 2.57 | | | | (1.70 | ) | | | 2.29 | | | | 5.00 | | | | 2.65 | | |
| | |
| Distributions (From Net Investment Income) | | - | | | | - | | | | (0.01 | ) | | | - | | | | - | | |
| Distributions (From Realized Capital Gains) | | (0.43 | ) | | | (0.04 | ) | | | - | | | | (0.40 | ) | | | (0.79 | ) | |
| Total Distributions | | (0.43 | ) | | | (0.04 | ) | | | (0.01 | ) | | | (0.40 | ) | | | (0.79 | ) | |
| | |
| Net Asset Value - | | | | | | | | | | | | | | | | | | | | |
| End of Period | $ | 26.12 | | | $ | 23.98 | | | $ | 25.72 | | | $ | 23.44 | | | $ | 18.84 | | |
| Total Return (c) | | 10.68% | | | | (6.59)% | | | | 9.79% | | | | 26.53% | | | | 15.66% | | |
| Ratios/Supplemental Data | | | | | | | | | | | | | | | | | | | | |
| Net Assets - End of Period (Thousands) | $ | 24,657 | | | $ | 20,531 | | | $ | 10,549 | | | $ | 7,892 | | | $ | 4,846 | | |
| Ratio of Expenses to Average Net Assets | | 1.50% | | | | 1.50% | | | | 1.50% | | | | 1.50% | | | | 1.50% | | |
| Ratio of Net Investment Income (Loss) to | | | | | | | | | | | | | | | | | | | | |
| Average Net Assets | | -0.47% | | | | -0.05% | | | | 0.05% | | | | 0.02% | | | | 0.00% | | |
| Portfolio Turnover Rate | | 16.27% | | | | 26.81% | | | | 10.68% | | | | 6.85% | | | | 20.14% | | |
(a) Per share amounts were calculated using the average shares method.
(b) Less than $0.005 per share.
(c) Total return in the above table represents the rate that the investor would have earned
or lost on an investment in the Fund assuming reinvestment of dividends and distributions.
The accompanying notes are an integral part of these financial statements. |
10
Notes to Financial Statements
Bretton Fund
December 31, 2016
1.) ORGANIZATION
Bretton Fund (the “Fund”) was organized as a non-diversified series of the PFS Funds (the “Trust”) on September 21, 2010. The Trust was established under the laws of Massachusetts by an Agreement and Declaration of Trust dated January 13, 2000, which was amended and restated January 20, 2011. The Trust is registered as an open-end investment company under the Investment Company Act of 1940, as amended. The Trust may offer an unlimited number of shares of beneficial interest in a number of separate series, each series representing a distinct fund with its own investment objectives and policies. As of December 31, 2016, there were eight series authorized by the Trust. The Fund commenced operations on September 30, 2010. The Fund’s investment objective is to seek long-term capital appreciation. The investment adviser to the Fund is Bretton Capital Management, LLC (the “Adviser”).
2.) SIGNIFICANT ACCOUNTING POLICIES
SECURITY VALUATION:
The Fund is an investment company and accordingly follows the investment company accounting and reporting guidance of the Financial Accounting Standards Board (“FASB”) Accounting Standards Codification Topic 946 Financial Services - Investment Companies. All investments in securities are recorded at their estimated fair value, as described in Note 3.
FEDERAL INCOME TAXES:
The Fund’s policy is to continue to comply with the requirements of the Internal Revenue Code that are applicable to regulated investment companies and to distribute all of its taxable income to shareholders. Therefore, no federal income tax provision is required. It is the Fund’s policy to distribute annually, prior to the end of the calendar year, dividends sufficient to satisfy excise tax requirements of the Internal Revenue Code. This Internal Revenue Code requirement may cause an excess of distributions over the book year-end accumulated income. In addition, it is the Fund’s policy to distribute annually, after the end of the fiscal year, any remaining net investment income and net realized capital gains.
The Fund recognizes the tax benefits of certain tax positions only where the position is “more likely than not” to be sustained assuming examination by tax authorities. Management has analyzed the Fund’s tax positions, and has concluded that no liability for unrecognized tax benefits should be recorded related to uncertain tax positions taken on returns filed for open tax years. The Fund identifies its major tax jurisdictions as U.S. Federal tax authorities; however, the Fund is not aware of any tax positions for which it is reasonably possible that the total amounts of unrecognized tax benefits will change materially in the next 12 months. The Fund recognizes interest and penalties, if any, related to unrecognized tax benefits as income tax expense in the Statement of Operations. During the fiscal year ended December 31, 2016, the Fund did not incur any interest or penalties.
DISTRIBUTIONS TO SHAREHOLDERS:
Distributions to shareholders, which are determined in accordance with income tax regulations, are recorded on the ex-dividend date.
The treatment for financial reporting purposes of distributions made to shareholders during the period from net investment income or net realized capital gains may differ from their ultimate treatment for federal income tax purposes. These differences are caused primarily by differences in the timing of the recognition of certain components of income, expense, or realized capital gain for federal income tax purposes. Where such differences are permanent in nature, they are reclassified in the components of the net assets based on their ultimate characterization for federal income tax purposes. Any such reclassifications will have no effect on net assets, results of operations, or net asset value per share of the Fund. As of December 31, 2016, accumulated undistributed net investment income was increased by $105,187 and paid-in capital was decreased by $105,187.
USE OF ESTIMATES:
The preparation of financial statements in conformity with accounting principles generally accepted in the United States of America (“GAAP”) requires management to make estimates and assumptions that affect the reported amounts of assets and liabilities and disclosure of contingent
11
Notes to Financial Statements - continued
assets and liabilities at the date of the financial statements and the reported amounts of increases and decreases in net assets from operations during the reporting period. Actual results could differ from those estimates.
EXPENSES:
Expenses incurred by the Trust that do not relate to a specific fund of the Trust are allocated to the individual funds based on each fund’s relative net assets or another appropriate basis.
OTHER:
The Fund records security transactions based on the trade date. Dividend income is recognized on the ex-dividend date. Interest income is recognized on an accrual basis. The Fund uses the specific identification method in computing gain or loss on sales of investment securities. Discounts and premiums on securities purchased are accreted and amortized over the life of the respective securities. Withholding taxes on foreign dividends have been provided for in accordance with the Fund’s understanding of the applicable country’s tax rules and rates.
3.) SECURITIES VALUATIONS
As described in Note 2, the Fund utilizes various methods to measure the fair value of most of its investments on a recurring basis. GAAP establishes a hierarchy that prioritizes inputs to valuation methods. The three levels of inputs are:
Level 1 - Unadjusted quoted prices in active markets for identical assets or liabilities that the Fund has the ability to access.
Level 2 - Observable inputs other than quoted prices included in level 1 that are observable for the asset or liability, either directly or indirectly. These inputs may include quoted prices for the identical instrument in an inactive market, prices for similar instruments, interest rates, prepayment speeds, credit risk, yield curves, default rates, and similar data.
Level 3 - Unobservable inputs for the asset or liability, to the extent relevant observable inputs are not available, representing the Fund’s own assumptions about the assumptions a market participant would use in valuing the asset or liability, and would be based on the best information available.
The availability of observable inputs can vary from security to security and is affected by a wide variety of factors, including, for example, the type of security, whether the security is new and not yet established in the marketplace, the liquidity of markets, and other characteristics particular to the security. To the extent that valuation is based on models or inputs that are less observable or unobservable in the market, the determination of fair value requires more judgment. Accordingly, the degree of judgment exercised in determining fair value is greatest for instruments categorized in level 3.
The inputs used to measure fair value may fall into different levels of the fair value hierarchy. In such cases, for disclosure purposes, the level in the fair value hierarchy within which the fair value measurement falls in its entirety, is determined based on the lowest level input that is significant to the fair value measurement in its entirety.
FAIR VALUE MEASUREMENTS
A description of the valuation techniques applied to the Fund’s major categories of assets and liabilities measured at fair value on a recurring basis follows.
Equity securities (common stocks). Equity securities that are traded on any exchange or on the NASDAQ over-the-counter market are valued at the last quoted sale price. Lacking a last sale price, a long security is valued at its last bid price except when, in the Adviser’s opinion, the last bid price does not accurately reflect the current value of the long security. To the extent these securities are actively traded and valuation adjustments are not applied, they are classified in level 1 of the fair value hierarchy. When market quotations are not readily available, when the Adviser determines the last bid price does not accurately reflect the current value or when restricted securities are being valued, such securities are valued as determined in good faith by the Adviser, in conformity with guidelines adopted by and subject to review of the Board of Trustees (the “Trustees” or the “Board”) and are categorized in level 2 or level 3, when appropriate.
12
Notes to Financial Statements - continued
In accordance with the Trust’s good faith pricing guidelines, the Adviser is required to consider all appropriate factors relevant to the value of securities for which it has determined other pricing sources are not available or reliable as described above. There is no single standard for determining fair value controls, since fair value depends upon the circumstances of each individual case. As a general principle, the current fair value of an issue of securities being valued by the Adviser would appear to be the amount which the owner might reasonably expect to receive for them upon their current sale. Methods which are in accordance with this principle may, for example, be based on (i) a multiple of earnings; (ii) a discount from market of a similar freely traded security (including a derivative security or a basket of securities traded on other markets, exchanges or among dealers); or (iii) yield to maturity with respect to debt issues, or a combination of these and other methods.
The following table summarizes the inputs used to value the Fund’s assets measured at fair value as of December 31, 2016:
| Valuation Inputs of Assets | | Level 1 | | Level 2 | | Level 3 | | Total |
| Common Stocks | | $23,787,475 | | $0 | | $0 | | $23,787,475 |
| Total Investments in Securities | | $23,787,475 | | $0 | | $0 | | $23,787,475 |
Refer to the Fund’s Schedule of Investments for a listing of securities by industry. The Fund did not hold any Level 3 assets during the fiscal year ended December 31, 2016. There were no transfers into or out of the levels during the fiscal year ended December 31, 2016. It is the Fund’s policy to consider transfers into or out of the levels as of the end of the reporting period.
The Fund did not invest in derivative instruments during the fiscal year ended December 31, 2016.
4.) INVESTMENT ADVISORY AGREEMENT AND RELATED PARTY TRANSACTIONS
The Fund has entered into an investment advisory agreement (“Management Agreement”) with the Adviser. The Adviser manages the investment portfolio of the Fund, subject to policies adopted by the Trust’s Board of Trustees, and, at its own expense and without reimbursement from the Fund, furnishes office space and all necessary office facilities, equipment, and executive personnel necessary for managing the Fund. The Adviser pays the expenses of the Fund except for the management fee, all brokerage fees and commissions, taxes, borrowing costs (such as (a) interest and (b) dividend expenses on securities sold short), fees and expenses of acquired funds, extraordinary or non-recurring expenses as may arise, including litigation to which the Fund may be a party and indemnification of the Trust’s Trustees and officers with respect thereto. For its services, the Adviser receives a management fee equal to 1.50% of the average daily net assets of the Fund.
For the fiscal year ended December 31, 2016, the Adviser earned management fees totaling $333,422, of which $31,554 was due to the Adviser at December 31, 2016.
5.) CAPITAL SHARES
The Trust is authorized to issue an unlimited number of shares of beneficial interest. Paid-in capital at December 31, 2016, was $20,922,773 representing 943,954 shares outstanding.
6.) RELATED PARTY TRANSACTIONS
Mr. Jeffrey R. Provence of Premier Fund Solutions, Inc. (the “Administrator”) also serves as trustee/officer of the Fund. This individual receives benefits from the Administrator resulting from administration fees paid to the Administrator of the Fund by the Adviser.
The Trustees who are not interested persons of the Trust each received received $1,500, for a total of $4,500, in Trustees’ fees plus travel and related expenses related to the Bretton Fund for the fiscal year ended December 31, 2016. Under the Management Agreement, the Adviser pays these fees.
7.) PURCHASES AND SALES OF SECURITIES
For the fiscal year ended December 31, 2016, purchases and sales of investment securities other than U.S. Government obligations and short-term investments aggregated $6,310,868 and $3,312,238, respectively. Purchases and sales of U.S. Government obligations aggregated $0 and $0, respectively.
13
Notes to Financial Statements - continued
8.) CONTROL OWNERSHIP
The beneficial ownership, either directly or indirectly, of more than 25% of the voting shares of a fund creates a presumption of control of the Fund, under Section 2(a)(9) of the Investment Company Act of 1940. As of December 31, 2016, YDB LLC, beneficially held, in aggregate, approximately 35.15% of the Fund and therefore, may be deemed to control the Fund.
9.) TAX MATTERS
For Federal income tax purposes, the cost of investments owned at December 31, 2016, was $19,854,556. At December 31, 2016, the composition of unrealized appreciation (the excess of value over tax cost) and depreciation (the excess of tax cost over value) was as follows:
| | Appreciation | | (Depreciation) | | Net Appreciation (Depreciation) |
| | $4,626,572 | | ($693,653) | | $3,932,919 |
| |
| The tax character of distributions was as follows: | | |
| |
| | | | 2016 | | 2015 |
| | Ordinary Income . | | $ -0- | | $ 11 |
| | Long-Term Capital Gain | | 396,220 | | 37,504 |
| | | | $ 396,220 | | $ 37,515 |
As of December 31, 2016, the components of distributable earnings (accumulated losses) on a tax basis were as follows:
| Undistributed long-term capital gain/(accumulated losses) | | $ (198,197 | ) |
| Unrealized appreciation/(depreciation) | | 3,932,919 | |
| | | $ 3,734,722 | |
As of December 31, 2016, the difference between book basis and tax basis unrealized appreciation was due to the deferral of post-October losses totaling $128,795.
10.) CAPITAL LOSS CARRYFORWARDS
As of December 31, 2016, the Fund had available for federal tax purposes an unused capital loss carryforward of $198,197, of which $139,299 is short-term with no expiration and $58,898 is long-term with no expiration.
14
Additional Information
December 31, 2016
(Unaudited)
1.) AVAILABILITY OF QUARTERLY SCHEDULE OF INVESTMENTS
The Fund files its complete schedule of portfolio holdings with the Securities and Exchange Commission (“SEC”) for the first and third quarters of each fiscal year on Form N-Q. The Fund’s Form N-Q is available on the SEC’s website at http://www.sec.gov. The Fund’s Form N-Q may also be reviewed and copied at the SEC’s Public Reference Room in Washington, DC. Information on the operation of the Public Reference Room may be obtained by calling 800.SEC.0330.
2.) PROXY VOTING GUIDELINES
Bretton Capital Management, LLC, the Fund’s investment adviser (“Adviser”), is responsible for exercising the voting rights associated with the securities held by the Fund. A description of the policies and procedures used by the Adviser in fulfilling this responsibility is available without charge on the Fund’s website at www.brettonfund.com. It is also included in the Fund’s Statement of Additional Information, which is available on the SEC’s website at http://www.sec.gov.
Information regarding how the Fund voted proxies, Form N-PX, relating to portfolio securities during the most recent 12-month period ended June 30, is available without charge, upon request, by calling our toll free number (800.231.2901) . This information is also available on the SEC’s website at http://www.sec.gov.
3.) DISCLOSURE OF EXPENSES
As a shareholder of the Fund, you incur ongoing expenses consisting solely of management fees. You will be assessed fees for outgoing wire transfers, returned checks and stop payment orders at prevailing rates charged by Mutual Shareholder Services, LLC, the Fund’s transfer agent, and IRA accounts will be charged an $8.00 annual maintenance fee. This Example is intended to help you understand your ongoing costs (in dollars) of investing in the Fund and to compare these costs with the ongoing costs of investing in other mutual funds.
The Example is based on an investment of $1,000 invested in the Fund on July 1, 2016, and held through December 31, 2016.
Actual Expenses
The first line of the table below provides information about actual account values and actual expenses. You may use the information in this line, together with the amount you invested, to estimate the expenses that you paid over the period. Simply divide your account value by $1,000 (for example, an $8,600 account value divided by $1,000 = 8.6), then multiply the result by the number in the first line under the heading entitled “Expenses Paid During Period” to estimate the expenses you paid on your account during this period.
Hypothetical Example for Comparison Purposes
The second line of the table below provides information about hypothetical account values and hypothetical expenses based on the Fund’s actual expense ratio and an assumed rate of return of 5% per year before expenses, which is not the Fund’s actual return. The hypothetical account values and expenses may not be used to estimate the actual ending account balance or expenses you paid for the period. You may use this information to compare the ongoing costs of investing in this Fund and other funds. To do so, compare this 5% hypothetical example with the 5% hypothetical examples that appear in the shareholder reports of the other funds.
Please note that the expenses shown in the table are meant to highlight your ongoing costs only and do not reflect any transactional costs, such as sales charges (loads) or the charges assessed by Mutual Shareholder Services, LLC as described above. Therefore, the second line of the table is useful in comparing ongoing costs only, and will not help you determine the relative cost of owning different funds. In addition, if these transactional costs were included, your cost could have been higher.
15
| Additional Information (Unaudited) - continued | | |
| |
| | | | | | | Expenses Paid |
| | | Beginning | | Ending | | During the Period* |
| | | Account Value | | Account Value | | July 1, 2016 to |
| | | July 1, 2016 | | December 31, 2016 | | December 31, 2016 |
| |
| Actual | | $1,000.00 | | $1,101.29 | | $7.92 |
| |
| Hypothetical | | $1,000.00 | | $1,017.60 | | $7.61 |
| (5% annual return | | | | | | |
| before expenses) | | | | | | |
* Expenses are equal to the Fund’s annualized expense ratio of 1.50%, multiplied by the
average account value over the period, multiplied by 184/366 (to reflect the one-half year
period ended December 31, 2016). |
16
REPORT OF INDEPENDENT REGISTERED PUBLIC ACCOUNTING FIRM
To the Shareholders of Bretton Fund and
Board of Trustees of PFS Funds
We have audited the accompanying statement of assets and liabilities, including the schedule of investments, of Bretton Fund (the “Fund”), a series of PFS Funds, as of December 31, 2016, and the related statement of operations for the year then ended, the statements of changes in net assets for each of the two years in the period then ended, and the financial highlights for each of the five years in the period then ended. These financial statements and financial highlights are the responsibility of the Fund’s management. Our responsibility is to express an opinion on these financial statements and financial highlights based on our audits.
We conducted our audits in accordance with the standards of the Public Company Accounting Oversight Board (United States). Those standards require that we plan and perform the audit to obtain reasonable assurance about whether the financial statements and financial highlights are free of material misstatement. An audit includes examining, on a test basis, evidence supporting the amounts and disclosures in the financial statements. Our procedures included confirmation of securities owned as of December 31, 2016, by correspondence with the custodian. An audit also includes assessing the accounting principles used and significant estimates made by management, as well as evaluating the overall financial statement presentation. We believe that our audits provide a reasonable basis for our opinion.
In our opinion, the financial statements and financial highlights referred to above present fairly, in all material respects, the financial position of Bretton Fund as of December 31, 2016, the results of its operations for the year then ended, the changes in its net assets for each of the two years in the period then ended, and the financial highlights for each of the five years in the period then ended, in conformity with accounting principles generally accepted in the United States of America.

COHEN & COMPANY, LTD.
Cleveland, Ohio
February 17, 2017
17
Trustees and Officers
(Unaudited)
The Board of Trustees supervises the business activities of the Trust. The names of the Trustees and executive officers of the Trust are shown below. For more information regarding the Trustees, please refer to the Statement of Additional Information, which is available upon request by calling 800.231.2901. Each Trustee serves until the Trustee sooner dies, resigns, retires, or is removed.
The Trustees and Officers of the Trust and their principal business activities during the past five years are:
Interested Trustees and Officers
| | | | | Number of | |
| | | | Principal | Portfolios In | Other |
| Name, | Position(s) | Term of Office | Occupation(s) | Fund | Directorships |
| Address(1), | Held With | and Length of | During | Complex | Held By |
| and Year of Birth | the Trust | Time Served | Past 5 Years | Overseen By | Trustee |
| | | | | Trustee | |
| |
| Ross C. Provence, | President | Indefinite Term; | General Partner and Portfolio | N/A | N/A |
| Year of Birth: 1938 | | Since 2000 | Manager for Value Trend Capital | | |
| | | | Management, LP (1995 to current). | | |
| | | | Estate planning attorney (1963 to | | |
| current). |
| |
| Jeffrey R. Provence(2), | Trustee, | Indefinite Term; | CEO, Premier Fund Solutions, Inc. | 8 | Blue Chip |
| Year of Birth: 1969 | Secretary | Since 2000 | (2001 to current). General Partner | | Investor Funds |
| | and | | and Portfolio Manager for Value | | |
| | Treasurer | | Trend Capital Management, LP | | |
| | | | (1995 to current). | | |
| |
| Julian G. Winters, | Chief | Indefinite Term; | Managing Member, Watermark | N/A | N/A |
| Year of Birth: 1968 | Compliance | Since 2010 | Solutions LLC (investment compli- | | |
| | Officer | | ance and consulting) since March | | |
| | | | 2007. | | |
(1) The address of each trustee and officer is c/o PFS Funds, 1939 Friendship Drive, Suite C, El Cajon, California 92020.
(2) Jeffrey R. Provence is considered an "interested person" as defined in Section 2(a)(19) of the Investment Company Act of 1940 by
virtue of his position with the Trust. |
Independent Trustees
| | | | | Number of | |
| | | | Principal | Portfolios In | Other |
| Name, | Position | Term of Office | Occupation(s) | Fund | Directorships |
| Address(1), | Held With | and Length of | During | Complex | Held By |
| and Year of Birth | the Trust | Time Served | Past 5 Years | Overseen By | Trustee |
| | | | | Trustee | |
| |
| Thomas H. Addis III, | Independent | Indefinite Term; | Executive Director/CEO, Southern | 8 | None |
| Year of Birth: 1945 | Trustee | Since 2000 | California PGA (2006 to current). | | |
| |
| Allen C. Brown, | Independent | Indefinite Term; | Co-owner of Stebleton & Brown | 8 | Blue Chip |
| Year of Birth: 1943 | Trustee | Since 2010 | (1994 to current). Estate planning | | Investor Funds |
| | | | and business attorney (1970 to cur- | | |
| rent). |
| |
| George Cossolias, CPA, | Independent | Indefinite Term; | Partner of CWDL, CPAs (February 1, | 8 | Blue Chip |
| Year of Birth: 1935 | Trustee | Since 2000 | 2014 to current). Owner of George | | Investor Funds |
| | | | Cossolias & Company, CPAs (1972 | | |
| | | | to January 31, 2014). President of | | |
| | | | LubricationSpecialists, Inc. (1996 to | | |
| current). |
(1) The address of each trustee and officer is c/o PFS Funds, 1939 Friendship Drive, Suite C, El Cajon, California 92020.
18

Investment Adviser
Bretton Capital Management, LLC
Legal Counsel
The Law Offices of John H. Lively
A member firm of The 1940 Act Law GroupTM
Custodian
US Bank, N.A.
Dividend Paying Agent,
Shareholders’ Servicing Agent,
Transfer Agent
Mutual Shareholder Services, LLC
Fund Administrator
Premier Fund Solutions, Inc.
Independent Registered Public Accounting Firm
Cohen & Company, Ltd.
Distributor
Rafferty Capital Markets, LLC |
This report is provided for the general information of the shareholders of the Bretton
Fund. This report is not intended for distribution to prospective investors in the Fund,
unless preceded or accompanied by an effective prospectus. |
Item 2. Code of Ethics.
The registrant has adopted a code of ethics that applies to the registrant’s principal executive officer and the principal financial officer. The registrant has not made any amendments to its code of ethics during the covered period. The registrant has not granted any waivers from any provisions of the code of ethics during the covered period. A copy of the registrant’s Code of Ethics is filed herewith.
Item 3. Audit Committee Financial Expert.
The registrant’s Board of Trustees has determined that George Cossolias is an audit committee finical expert. Mr. Cossolias is independent for purposes of this Item 3.
Item 4. Principal Accountant Fees and Services.
(a-d) The following table details the aggregate fees billed for each of the last two fiscal years for audit fees, audit-related fees, tax fees and other fees by the principal accountant to the registrant. The principal accountant has provided no services to the adviser or any entity controlled by, or under common control with the adviser that provides ongoing services to the registrant.
| | | FYE 12/31/16 | | FYE 12/31/15 |
| Audit Fees | | $13,250 | | $13,250 |
| Audit-Related Fees | | $0 | | $0 |
| Tax Fees | | $2,500 | | $2,500 |
| All Other Fees | | $750 | | $750 |
Nature of Tax Fees: preparation of Excise Tax Statement and 1120 RIC.
Nature of All Other Fees: Review of Semi-Annual Report.
(e) (1) The audit committee approves all audit and non-audit related services and, therefore, has not adopted pre-approval policies and procedures described in paragraph (c)(7) of Rule 2-01 of Regulation S-X.
(e) (2) None of the services described in paragraph (b) through (d) of this Item were approved by the audit committee pursuant to paragraph (c)(7)(i)(C) of Rule 2-01 of Regulation S-X.
(f) All of the principal accountant’s hours spent on auditing the registrant’s financial statements were attributed to work performed by full-time permanent employees of the principal accountant.
(g) The following table indicates the aggregate non-audit fees billed by the registrant’s principal accountant for services to the registrant , the registrant’s investment adviser (not sub-adviser), and any entity controlling, controlled by, or under common control with the adviser that provides ongoing services to the registrant, for the last two years.
| Non-Audit Fees | | FYE 12/31/16 | | FYE 12/31/15 |
| Registrant | | $3,250 | | $3,250 |
| Registrant’s Investment Adviser | | $0 | | $0 |
(h) The principal accountant provided no services to the investment adviser or any entity controlling, controlled by, or under common control with the adviser that provides ongoing services to the registrant.
Item 5. Audit Committee of Listed Companies. Not applicable.
Item 6. Schedule of Investments. Schedule filed with Item 1.
Item 7. Disclosure of Proxy Voting Policies and Procedures for Closed-End Management Investment Companies. Not applicable.
Item 8. Portfolio Managers of Closed End Management Investment Companies. Not applicable.
Item 9. Purchases of Equity Securities by Closed-End Management Investment Companies and Affiliated Purchasers. Not applicable.
Item 10. Submission of Matters to a Vote of Security Holders.
The registrant has not adopted procedures by which shareholders may recommend nominees to the registrant’s board of trustees.
Item 11. Controls and Procedures.
(a) The registrant’s president and chief financial officer concluded that the disclosure controls and procedures (as defined in Rule 30a-3(c) under the Investment Company Act of 1940 (the “Act”)) were effective as of a date within 90 days of the filing date of this report, based on the evaluation of these controls and procedures required by Rule 30a-3(b) under the Act.
(b) There were no changes in the registrant’s internal control over financial reporting (as defined in Rule 30a-3(d) under the Act) that occurred during the registrant’s second fiscal quarter of the period covered by this report that have materially affected, or are reasonably likely to materially affect, the registrant’s internal control over financial reporting.
Item 12. Exhibits.
(a)(1) Code of Ethics. Filed herewith.
(a)(2) Certifications pursuant to Section 302 of the Sarbanes-Oxley Act of 2002. Filed herewith.
(a)(3) Not applicable.
(b) Certification pursuant to Section 906 Certification of the Sarbanes-Oxley Act of 2002. Filed herewith.
SIGNATURES
Pursuant to the requirements of the Securities Exchange Act of 1934 and the Investment Company Act of 1940, the registrant has duly caused this report to be signed on its behalf by the undersigned, thereunto duly authorized.
| | By: /s/Ross C. Provence
Ross C. Provence
President |
Pursuant to the requirements of the Securities Exchange Act of 1934 and the Investment Company Act of 1940, this report has been signed below by the following persons on behalf of the registrant and in the capacities and on the dates indicated.
| | By: /s/Ross C. Provence
Ross C. Provence
President |
| | By: /s/Jeffrey R. Provence
Jeffrey R. Provence
Chief Financial Officer |