UNITED STATES
SECURITIES AND EXCHANGE COMMISSION
WASHINGTON, D.C. 20549
FORM N-CSR
CERTIFIED SHAREHOLDER REPORT OF REGISTERED MANAGEMENT
INVESTMENT COMPANIES
Investment Company Act file number 811-09781
PFS Funds
(Exact name of registrant as specified in charter)
1939 Friendship Drive, Suite C, El Cajon, CA 92020
(Address of principal executive offices) (Zip code)
CT Corporation System
155 Federal St., Suite 700, Boston, MA 02110
(Name and address of agent for service)
Registrant's telephone number, including area code: (619) 588-9700
Date of fiscal year end: June 30
Date of reporting period: June 30, 2016
Form N-CSR is to be used by management investment companies to file reports with the Commission not later than 10 days after the transmission to stockholders of any report that is required to be transmitted to stockholders under Rule 30e-1 under the Investment Company Act of 1940 (17 CFR 270.30e -1). The Commission may use the information provided on Form N-CSR in its regulatory, disclosure review, inspection and policymaking roles.
A registrant is required to disclose the information specified by Form N-CSR, and the Commission will make this information public. A registrant is not required to respond to the collection of information contained in Form N-CSR unless the Form displays a currently valid Office of Management and Budget ("OMB") control number.
Item 1. Reports to Stockholders.

MOATXInvestor Shares
CASTXClass C
For Investors Seeking Long-Term Capital Appreciation
Annual Report
June 30, 2016
Dear Fellow Shareholders:
We are pleased to present the Annual Report for the Castle Focus Fund (the “Fund”) for the fiscal year ended June 30, 2016.
The Fund completed its sixth year of operations on June 30, 2016. Over these six years the Fund has grown substantially, and as of June 30, 2016, shareholders have entrusted more than $171 million of their assets to the Fund’s management.
Over the past several years the market has had an uncanny ability to shake off bad news and advance higher. We are value investors and by nature we are skeptical as we see ignored risks piling up. As markets move up and risks increase we have a more difficult time finding great companies at great prices and thus our cash position has grown. The process that the Fund’s Sub-Adviser has employed has not changed and continues to be a bottom-up, value-driven fundamental investment process.
Please read the following letter from the Fund’s Sub-Adviser, which discusses in more detail how the Fund performed during the fiscal year ended June 30, 2016.
Kind Regards,

Caeli Andrews
Co-Founder, Managing Director
Castle Investment Management | Andrew Welle
Co-Founder, Managing Director
Castle Investment Management |
2016 Annual Report 1
Dear Castle Focus Fund Shareholder:
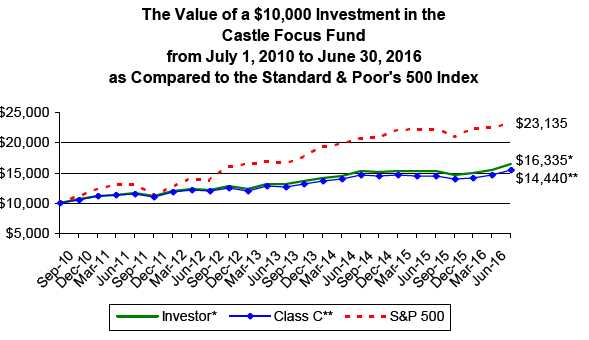
For the fiscal year ended June 30, 2016, the Investor Class Shares returned 7.65% (Class C Shares returned 6.61%) . Over that same one year period, the S&P 500® Index (the Fund’s benchmark) returned 3.99% . Over the six years that we have served as Sub-Adviser to the Fund, the Investor Class Shares have experienced an average annual return of 8.52% (Class C Shares returned 7.46%) .
We view a period of one year as short-term by definition. Our process is rooted in making long-term investments in high-quality companies at prices that are significantly below what we believe is the intrinsic value of each company. We will sell the Fund’s position in those types of companies when the stock price approaches our conservative estimate of its intrinsic value. Often times these investments can take years to materialize. However, as this is the Fund’s Annual Report, we will comment on the short-term performance of select positions over the fiscal year.
The following were primary contributing factors to the Fund’s one-year performance relative to its benchmark, the S&P 500® Index:
The Fund held nine positions for the entire fiscal year that appreciated more than the benchmark. In particular Royal Gold, Inc., Phillip Morris International, Inc., Becton Dickinson & Co., Franco-Nevada Corp. and ITC Holdings Corp. all experienced price appreciation significantly greater than the benchmark.
The Fund held four positions for the entire fiscal year that underperformed relative to the benchmark. Express Scripts Holding Co., Sanofi SA ADR, Bank of New York Mellon Corp. and Praxair Inc. each experienced negative returns in their respective share prices over the fiscal year.
The Energy sector had a volatile year and we had two positions in particular that were affected. Spectra Energy Corp. was our largest equity holding at the beginning of the fiscal year. The stock price fell during the first half of the fiscal year, rebounded in the second half of the fiscal year, and ultimately closed the fiscal year at a stock price higher than it opened the year. The stock price of Schlumberger Ltd. also dropped throughout the first half of the fiscal year and ultimately closed the year at a lower price.
We exited four positions during the fiscal year, including original Fund holdings Microsoft Corp. and Sysco Corp. Microsoft’s stock price moved higher and we exited the position as it approached and then exceeded our estimate of its fair value. Sysco Corp. was also a strong performer and we sold the position during the first half of the fiscal year.
Our investment approach applies little importance to sector weightings. Again, we simply seek out quality investments that can be made at a significant discount to our conservative estimate of fair value. From a sector standpoint, two of our investments in the materials sector were gold-related companies. Gold experienced strong price appreciation over the fiscal year and thus our weighting in the materials sector had a positive impact on the Fund. Cash (and cash equivalents) continues to be a major holding of the Fund. When considering cash purely as a sector, this investment will be a detriment during periods of market appreciation. However, cash is an important part of the Fund’s investment process as it provides optionality, allowing us to take advantage of compelling valuations when buying opportunities arise.
_____________________________________________________________
Birds that live on remote islands with no predators can eventually develop the condition of flightlessness. The parallels of this phenomenon to today’s financial landscape are interesting, as central banks have changed markets in the same sense that large bodies of water insulate birds from predators. Investors today now allocate capital with less fear of predators. Just as island birds lose their ability to fly over time, we believe that investors now operate today in an artificial environment created by central banks where investors are losing the desire to invest based on fundamentals. Investors continue to increase their alloca-
2016 Annual Report 2
tion to passive index strategies despite deteriorating fundamentals and frighteningly expensive valuations in today’s stock market.
Distortions also exist in sovereign bond markets. Japanese government bonds (JGB) are now the first sovereign debt in history to offer yields of less than 0.1% across every maturity. Even the longest-dated Japanese bond, the 40-year JGB, is now yielding just 0.065% . Japan’s benchmark debt, the 10-year JGB, dropped to a new record of negative 0.23% —hardly a “risk free” rate to use when making rationale investment decisions.
These record-low yields are a result of central bankers influencing markets. Japan’s central bank, the Bank of Japan (BOJ), has pushed short-term interest rates down into negative territory. In turn, these actions push money into bonds with longer and longer maturities in search of higher yields. Today, anyone who lends money to the Japanese government for forty years, at just 0.065% per year, can expect a total return of just 2.6% . There is no way to economically rationalize this investment decision—such an investor operates without fear.
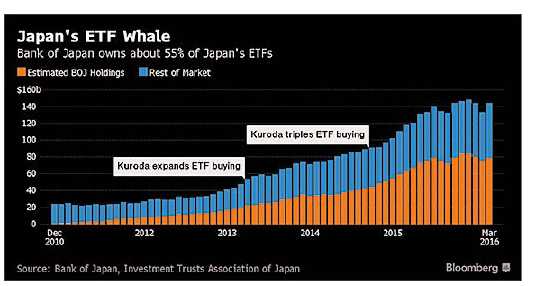
Unfortunately, these islands of distortion are not limited to the bond markets. The Bank of Japan already owns over half of all Japanese exchange traded funds (ETFs) and seeks to own more, buying $30 billion of ETFs a year under its current policy. The natural question is why is the BOJ monopolizing the equity market. We believe the simple reason is that they are running out of bonds to purchase. Japan’s ETF market is just 15.8 trillion yen, of which the BOJ already owns 52%. Fortunately for the BOJ, new ETFs can be easily assembled by eager Wall Street banks—there will always be a ready supply to meet this artificial demand. While the Bank of Japan’s purchasing of ETFs does temporarily boost demand for Japanese stocks, the question remains just how can they ever exit their position without collapsing prices?
We do not believe that the BOJ will ever be able to “retract” from the markets. According to Bloomberg, the Bank of Japan’s exchange-traded fund purchases have made it a top 10 shareholder in about 90% of the Nikkei 225 Stock Index. The BOJ’s growing presence in the stock market distorts valuations, as the longer the BOJ’s buying persists, the bigger the risk that market prices will further detach from fundamentals. While bulls cheer the BOJ’s efforts to lift share prices, the central bank must unwind its intervention at some point. Should Japan’s central bank decide to exit the market, we believe that prices will drop and wealth will be destroyed.
To be more precise, the Austrian School of economic thought argues that the wealth destroyed is simply wealth which never should have existed. Credit provided by central banks, or “liquidity” or “easy money”, inevitably leads to the misallocation of capital. Easy money distorts relative prices in the economy, which in turn falsifies economic calculation.
2016 Annual Report 3
Meaning, the balance between saving, investment and consumption is no longer optimally aligned. Businessmen underestimate current consumer demand and overestimate both currently available savings and future consumer demand. The inevitable long-term result is that investment capital is directed toward the wrong lines and capital consumption eventually ensues. Money and credit provide the incentive for this process, but what is actually consumed is society’s real capital.
The longer central banks impose their will on markets, the greater potential for capital mis-allocations. Easy money fueled the expansion into solar and wind power but in reality, easy money led to the consumption of real capital. SunEdison, a renewable-energy startup, was the poster child of a company that took advantage of easy money and low interest rates to transform itself into an icon for clean-energy investors. Mesmerized by the promise of high yields and fast growth, investors repeatedly turned a blind eye to warning signs that ultimately left the company vulnerable to predators, such as a rise in interest rates.
SunEdison traces its roots to MEMC Electronic Materials (MEMC), a maker of silicon parts that was once part of Monsanto. In 2009, MEMC hired a charismatic chief executive who promised to transform the company into a clean-energy giant. His first big move was buying a solar-project developer called SunEdison. MEMC changed its name to SunEdison, spun off its semiconductor business and began a buying spree to acquire energy projects. The company made nine acquisitions in 2014 and another eighteen acquisitions in 2015. Management bought solar-panel installers and battery startups and pursued projects around the world. In 2015, SunEdison expanded into wind power with the $2.4 billion takeover of First Wind, the company’s largest deal ever.
To finance this robust deal flow, SunEdison turned to an increasingly popular idea known as “captive buyers.” SunEdison created a company called TerraForm Power to handle the less exciting day-to-day business of operating power plants under long-term utility contracts. TerraForm would raise cash from public shareholders and buy completed power plants from SunEdison, which would in turn reinvest the proceeds into new projects. TerraForm offered shares to the public in July 2014, but SunEdison retained a controlling interest, making TerraForm Power the captive buyer to SunEdison’s projects.
TerraForm was one of a handful of such companies making their debut during this time period—these companies were called “yieldcos” (short for yield companies) because they distributed most of their cash to shareholders. As you might guess, in a low yielding environment, investors loved the concept. Demand for TerraForm’s initial public offering (IPO) outpaced supply by more than twentyfold.
With a dedicated buyer for its power projects, SunEdison aggressively expanded and the company’s projects soon generated a gigawatt’s worth of electricity. SunEdison predicted that one day they would manage 100 gigawatts worth of electricity, enough to power twenty million homes. As SunEdison’s acquisition pace increased, standards slipped and deals were sometimes executed with little planning or at unrealistic valuations. In early 2015, SunEdison decided to expand into residential power and focused on acquiring Vivint Solar, which had become a residential leader by hiring former Mormon missionaries to go door-to-door selling solar installations. SunEdison announced the $1.9 billion acquisition in July, 2015, upsetting shareholders. SunEdison had ventured too far from its core operations and investors revolted – shares fell 18% over the next week. Shares of TerraForm, which had offered to buy some of Vivint Solar’s assets, also tumbled. As TerraForm’s stock price fell, the company could no longer afford to buy SunEdison’s power plant projects.
A financing arrangement that had once worked so easily for SunEdison suddenly looked risky to investors. The environment had changed—flightless SunEdison found itself surrounded by new predators. Falling oil prices hurt energy stocks across the board. The Federal Reserve hinted it would soon raise interest rates, which would make high-yielding stocks like TerraForm less attractive. By September, SunEdison shares had fallen by two-thirds. Cash dwindled, and the company delayed payments to suppliers and contractors. In November, a loan against SunEdison’s ownership in TerraForm Power came due and the end was near.
2016 Annual Report 4
SunEdison, once the fastest-growing U.S. renewable energy company, filed for Chapter 11 bankruptcy protection in April 2016 as years of debt-fueled acquisitions proved unsustainable. In less than a year, SunEdison vaporized $10 billion in shareholder value and filed for bankruptcy. Easy money once again led to the misallocation and eventual destruction of real investment capital.
George Goodman wrote Supermoney in 1971 under the pen name of Adam Smith as a follow-up to the best-selling The Money Game (1968). Goodman’s book chronicled an investment era that verged on financial insanity: the triumph of perception over reality, the illusion of company reported earnings despite the reality of fundamentals found in the balance sheets and cash flows statements. Goodman described an era where investors considered “concepts” and “trends” as the crux of investing because perception wasn’t tethered by the facts. John Bogle, founder of the Vanguard Group, succinctly summarized it best: “The more things change, the more they remain the same.” But each era of financial speculation has its own characteristics - and today’s environment is all about the influence of central banks and how their policies impact the capital markets. Goodman’s words continue to echo in our heads… “Those who leave early are saved, but the ball is so splendid no one wants to leave while there is still time, so that everyone keeps asking, “What time is it? What time is it?” But none of the clocks have any hands.”
INVESTMENT PHILOSOPHY
We believe that investors should always seek to own successful businesses with competent management, who think like owners because they are in fact significant owners, and who maintain companies that have little or no debt. Lastly, and most crucially, one should never consciously overpay for the shares of any business. Whatever happens to the share price in the short run, which we define as anything less than two to three years, is not really significant. Just like Benjamin Graham advised in The Intelligent Investor – the disciplined investor can take advantage of other people’s impatience and mood swings – a subtlety that is all too often ignored by the vast majority of market participants.
Growth in intrinsic value is what every investor wants to see in their stock portfolio – but just about everyone gets distracted by what the share price happens to be doing from one day to the next. The reality is that as long as management is doing its job to the best of its ability, and the company continues to be run well, investors should have every expectation that the company’s growth in intrinsic value and the company’s share price will move in lockstep over time. Daily fluctuations in the share price, provided that the business itself is not impaired, should be regarded as potential opportunities to increase, or reduce, one’s holding in the stock. Better yet, one should simply leave the investment alone and fundamentally focus on something more constructive with one’s time.
Howard Marks, co-chairman of global asset-management firm Oaktree Capital, is the author of a book we consider essential reading, “The Most Important Thing: Uncommon Sense for the Thoughtful Investor.” He is one of the great investors and investment writers of the past few decades. Marks once published an investor letter based entirely on what he believed were the all-time great quotes on investing by Charlie Munger, Vice Chairman of Berkshire Hathaway, including “It’s not supposed to be easy. Anyone who finds it easy is stupid.” Marks reflected on the quote and concluded that a good part of the basis for Charlie’s comment is that anyone who thinks it’s easy to achieve unusual profits is overlooking the way markets operate. Stock picking is difficult to do successfully. Investing is not easy.
Given our high regard for his work and writing, we culled through previous letters and generated a list of great quotes from Howard Marks:
“Superior investors know – and buy – when the price of something is lower than it should be. And the price of an investment can be lower than it should be only when most people don’t see its merit.”
“There are two primary elements in superior investing: seeing some quality that others don’t see or appreciate (and that isn’t reflected in the price), and having it turn out to be true (or at least accepted by the market).”
2016 Annual Report 5
“What has to be remembered is the defining role of price. Regardless of whether the fundamental outlook is positive or negative, the level of investment risk is determined largely by the relationship between the price of an asset and its intrinsic value.”
“There is no asset so good that it can’t become overpriced and thus risky, and few so bad that there’s no price at which they’re a buy (and safe). This is one of the greatest examples of counter intuitiveness. Only those who are able to see its logic can hope to be superior investors.”
“Most great investments begin in discomfort. Good investors are subjected to the same misleading influences and emotions as everyone else. They’re just more capable of keeping them under control.”
“Superior investors may not be insulated, but they manage to act as if they are.”
“Superior investment results can only stem from a better-than-average ability to figure out when risk-taking will lead to gain and when it will end in loss. There is no alternative.”
“Superior investors and their well-thought-out approaches can produce returns on average in the long run. But even they are far from perfect. The best they can hope for is that they’ll be right more often than they’re wrong, and that their successful decisions will add more than their mistakes subtract.”
Although not always successful, we try to measure ourselves against the standards laid out by Howard Marks. We do our best to be perceptive, unconventional, and to possess a better-than-average ability to figure out when risk-taking will lead to a gain and when it will end in a loss. We are right more often than we are wrong and our successful decisions have added more than our mistakes have subtracted. We readily acknowledge that we are far from perfect, but fortunately one does not have to be perfect to add value as a stock picker.
Kind Regards,

| Robert J. Mark | Larry J. Redell |
| Portfolio Manager | St. James Investment Company |
| St. James Investment Company | |
Past performance does not guarantee future results. The investment return and principal value of an investment in the Fund will fluctuate so that an investor’s shares, when redeemed, may be worth more or less than their original cost. Current performance may be higher or lower than the performance data quoted. Performance data current to the most recent month end are available by calling 1-877-743-7820.
The Castle Focus Fund’s prospectus contains important information about the Fund’s investment objectives, potential risks, management fees, charges and expenses, and other information and should be read and considered carefully before investing. You may obtain a current copy of the Fund’s prospectus by calling 1-877-743-7820. Distributed by Rafferty Capital Markets, LLC-Garden City, NY 11530.
2016 Annual Report 6
CASTLE FOCUS FUND (Unaudited)
CASTLE FOCUS FUND PERFORMANCE INFORMATION
AVERAGE ANNUALIZED RETURNS AS OF JUNE 30, 2016.
| | | | | | Since | |
| | 1 Year(A) | | 5 Year(A) | | Inception(A) | |
| Investor Shares | 7.65% | | 7.02% | | 8.52% | |
| CLASS C (without CDSC)* | 6.61% | | 5.96% | | 7.46% | |
| CLASS C (with CDSC)* | 5.61% | | 5.96% | | 7.46% | |
| S&P 500 Index (B) | 3.99% | | 12.10% | | 15.00% | |
The Fund's Total Annual Operating Expense Ratios (from November 1, 2015 Prospectus):
Investor Shares – Gross 1.60%, Net 1.36%;
Class C – Gross 2.60%, Net 2.36%
The Fund’s expense ratios for the fiscal year ended June 30, 2016 can be found in the financial highlights included in this report. The Annual Operating Expense Ratios reported above will not correlate to the expense ratio in the Fund’s financial highlights because the financial highlights include only the direct operating expenses incurred by the Fund, not the indirect costs of investing in the Fund.
(A) 1 Year, 5 Year and Since Inception returns include change in share prices and in each case includes reinvestment of any dividends and capital gain distributions. The Castle Focus Fund commenced operations on July 1, 2010.
(B) The S&P 500 Index is an unmanaged index comprised of the stocks of large capitalization issues in the United States and it is considered representative of the U.S. equity markets as a whole.
* Class C shares of the Fund are offered at their NAV without sales charge. However, Class C shares are subject to a contingent deferred sales charge (“CDSC”) of 1% if redeemed within one year of the original purchase date. No CDSC will be charged if redeemed after one year of the purchase date.
PAST PERFORMANCE DOES NOT GUARANTEE FUTURE RESULTS. INVESTMENT RETURN AND PRINCIPAL VALUE WILL FLUCTUATE SO THAT SHARES, WHEN REDEEMED, MAY BE WORTH MORE OR LESS THAN THEIR ORIGINAL COST. RETURNS DO NOT REFLECT THE DEDUCTION OF TAXES THAT A SHAREHOLDER WOULD PAY ON FUND DISTRIBUTIONS OR THE REDEMPTION OF FUND SHARES. CURRENT PERFORMANCE MAY BE LOWER OR HIGHER THAN THE PERFORMANCE DATA QUOTED. TO OBTAIN PERFORMANCE DATA CURRENT TO THE MOST RECENT MONTH END, PLEASE CALL 1-877-743-7820. AN INVESTMENT IN THE FUND IS SUBJECT TO INVESTMENT RISKS, INCLUDING THE POSSIBLE LOSS OF THE PRINCIPAL AMOUNT INVESTED. THE FUND’S DISTRIBUTOR IS RAFFERTY CAPITAL MARKETS, LLC.
2016 Annual Report 7
CASTLE FOCUS FUND (Unaudited)
Castle Focus Fund
by Sectors (as a percentage of Net Assets)
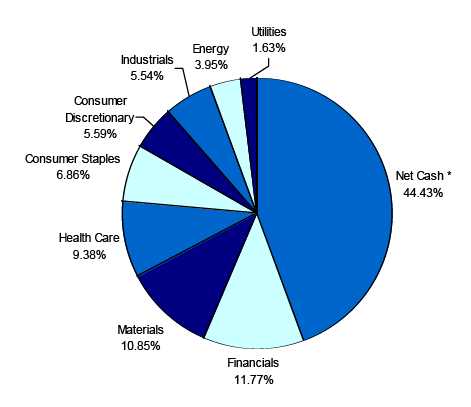
*Net Cash represents cash and cash equivalents and other assets less liabilities.
Availability of Quarterly Schedule of Investments
The Fund files its complete schedule of portfolio holdings with the Securities and Exchange Commission (“SEC”) for the first and third quarters of each fiscal year on Form N-Q. The Fund’s Form N-Q is available on the SEC’s website at http://www.sec.gov. The Fund’s Form N-Q may also be reviewed and copied at the SEC’s Public Reference Room in Washington, DC. Information on the operation of the Public Reference Room may be obtained by calling 1-800-SEC-0330.
Proxy Voting Guidelines
St. James Investment Company, LLC (the “Sub-Adviser”) is responsible for exercising the voting rights associated with the securities held by the Fund. A description of the policies and procedures used by the Sub-Adviser in fulfilling this responsibility is available without charge by calling 1-877-743-7820. It is also included in the Fund’s Statement of Additional Information, which is available on the SEC’s website at http://www.sec.gov.
Information regarding how the Fund voted proxies, Form N-PX, relating to portfolio securities during the most recent 12-month period ended June 30, is available without charge, upon request, by calling 1-877-743-7820. This information is also available on the SEC’s website at http://www.sec.gov.
2016 Annual Report 8
Disclosure of Expenses
(Unaudited)
As a shareholder of the Fund, you incur two types of costs: (1) transaction costs, including sales charges (loads) on purchase payments; and (2) ongoing costs, including management fees; service fees; a distribution fee (12b-1); shareholder service fees; and other Fund expenses. This Example is intended to help you understand your ongoing costs (in dollars) of investing in the Fund and to compare these costs with the ongoing costs of investing in other mutual funds. You will be assessed fees for outgoing wire transfers, returned checks and stop payment orders at prevailing rates charged by Mutual Shareholder Services, LLC, the Fund’s transfer agent, and IRA accounts will be charged an $8.00 annual maintenance fee. Class C shares may be charged a contingent deferred sales charge (“CDSC”) of 1% on shares redeemed within one year of purchase.
The Example is based on an investment of $1,000 invested at the beginning of the period and held for the period January 1, 2016 through June 30, 2016.
Actual Expenses
The first line of the table below provides information about actual account values and actual expenses. You may use the information in this line, together with the amount you invested, to estimate the expenses that you paid over the period. Simply divide your account value by $1,000 (for example, an $8,600 account value divided by $1,000 = 8.6), then multiply the result by the number in the first line under the heading entitled “Expenses Paid During Period” to estimate the expenses you paid on your account during this period.
Hypothetical Example for Comparison Purposes
The second line of the table below provides information about hypothetical account values and hypothetical expenses based on the Fund’s actual expense ratio and an assumed rate of return of 5% per year before expenses, which is not the Fund’s actual return. The hypothetical account values and expenses may not be used to estimate the actual ending account balance or expenses you paid for the period. You may use this information to compare the ongoing costs of investing in this Fund and other funds. To do so, compare this 5% hypothetical example with the 5% hypothetical examples that appear in the shareholder reports of the other funds.
Please note that the expenses shown in the table are meant to highlight your ongoing costs only and do not reflect any transactional costs, such as CDSC, or the charges assessed by Mutual Shareholder Services, LLC as described above or the expenses of underlying funds. Therefore, the second line of the table is useful in comparing ongoing costs only, and will not help you determine the relative total costs of owning different funds. In addition, if these transactional costs were included, your costs would have been higher.
| Investor Shares | | | | | | |
| | | | | | | Expenses Paid |
| | | Beginning | | Ending | | During the Period* |
| | | Account Value | | Account Value | | January 1, 2016 |
| | | January 1, 2016 | | June 30, 2016 | | to June 30, 2016 |
| |
| Actual | | $1,000.00 | | $1,099.27 | | $6.99 |
| |
| Hypothetical | | $1,000.00 | | $1,018.20 | | $6.72 |
| (5% annual return | | | | | | |
| before expenses) | | | | | | |
* Expenses are equal to the Fund’s annualized expense ratio of 1.34% for Investor Shares, multiplied
by the average account value over the period, multiplied by 182/366 (to reflect the one-half year period). |
| Class C | | | | | | |
| | | | | | | Expenses Paid |
| | | Beginning | | Ending | | During the Period* |
| | | Account Value | | Account Value | | January 1, 2016 |
| | | January 1, 2016 | | June 30, 2016 | | to June 30, 2016 |
| |
| Actual | | $1,000.00 | | $1,094.07 | | $12.18 |
| |
| Hypothetical | | $1,000.00 | | $1,013.23 | | $11.71 |
| (5% annual return | | | | | | |
| before expenses) | | | | | | |
* Expenses are equal to the Fund’s annualized expense ratio of 2.34% for Class C, multiplied by the
average account value over the period, multiplied by 182/366 (to reflect the one-half year period). |
2016 Annual Report 9
| Castle Focus Fund |
| | | | Schedule of Investments |
| | | | | June 30, 2016 |
| Shares | | Fair Value | | % of Net Assets |
| COMMON STOCKS | | | | | |
| Agriculture Chemicals | | | | | |
| 30,000 | Monsanto Company | $ | 3,102,300 | | 1.81 | % |
| Arrangement of Transportation of Freight & Cargo | | | | | |
| 120,000 | Expeditors International of Washington, Inc. | | 5,884,800 | | 3.43 | % |
| Beverages | | | | | | |
| 30,000 | Diageo plc ** | | 3,386,400 | | 1.97 | % |
| Cigarettes | | | | | | |
| 82,500 | Philip Morris International Inc. | | 8,391,900 | | 4.89 | % |
| Construction - Special Trade Contractors | | | | | |
| 3,100 | Brookfield Business Partners L.P. (Canada) * | | 59,179 | | 0.03 | % |
| Electric Services | | | | | |
| 60,000 | ITC Holdings Corp. | | 2,809,200 | | 1.63 | % |
| Electronic & Other Electrical Equipment (No Computer Equipment) | | | | | |
| 10,000 | Emerson Electric Co. | | 521,600 | | 0.30 | % |
| Fire, Marine & Casualty Insurance | | | | | |
| 150,000 | W.R. Berkley Corporation | | 8,988,000 | | 5.24 | % |
| Food and Kindred Products | | | | | |
| 120,000 | Nestle S.A. ** | | 9,277,200 | | 5.41 | % |
| Gold and Silver Ores | | | | | |
| 20,000 | Franco-Nevada Corporation (Canada) | | 1,521,200 | | 0.89 | % |
| Industrial Inorganic Chemicals | | | | | |
| 37,000 | Praxair, Inc. | | 4,158,430 | | 2.42 | % |
| Men's & Boys' Furnishings, Work Clothing & Allied Garments | | | | | |
| 5,000 | V. F. Corporation | | 307,450 | | 0.18 | % |
| Mineral Royalty Traders | | | | | |
| 180,000 | Royal Gold, Inc. | | 12,963,600 | | 7.54 | % |
| Natural Gas Transmission & Distribution | | | | | |
| 185,000 | Spectra Energy Corp. | | 6,776,550 | | 3.95 | % |
| Operators of Nonresidential Buildings | | | | | |
| 155,000 | Brookfield Asset Management Inc. - Class A (Canada) | | 5,125,850 | | 2.99 | % |
| Pharmaceutical Preparations | | | | | |
| 150,000 | Sanofi ** | | 6,277,500 | | 3.66 | % |
| Retail - Drug Stores and Proprietary Stores | | | | | |
| 107,000 | Express Scripts Holding Company * | | 8,110,600 | | 4.73 | % |
| State Commercial Banks | | | | | |
| 155,000 | The Bank of New York Mellon Corporation | | 6,021,750 | | 3.51 | % |
| Surgical & Medical Instruments & Apparatus | | | | | |
| 10,000 | Becton, Dickinson and Company | | 1,695,900 | | 0.99 | % |
| Total for Common Stocks (Cost - $75,501,806) | | 95,379,409 | | 55.57 | % |
| MONEY MARKET FUNDS | | | | | |
| 75,414,656 | Invesco Short-Term Investments Trust Treasury Portfolio | | | | | |
| | Institutional Class 0.27% *** | $ | 75,414,656 | | 43.94 | % |
| (Cost - $75,414,656) | | | | | |
| | Total Investments | | 170,794,065 | | 99.51 | % |
| | (Cost - $150,916,462) | | | | | |
| | Other Assets in Excess of Liabilities | | 842,738 | | 0.49 | % |
| | Net Assets | $ | 171,636,803 | | 100.00 | % |
* Non-Income Producing Security.
** ADR - American Depository Receipt.
*** The yield shown represents the 7-day yield at June 30, 2016. See Note 10 for additional information. |
The accompanying notes are an integral part of these
financial statements. |
2016 Annual Report 10
| Castle Focus Fund | | |
| |
| Statement of Assets and Liabilities | | |
| June 30, 2016 | | |
| Assets: | | |
| Investment Securities at Fair Value | $ | 170,794,065 |
| (Cost - $150,916,462) | | |
| Cash | | 20,867 |
| Receivables: | | |
| Dividends | | 148,733 |
| Interest | | 15,002 |
| Shareholder Purchases | | 961,513 |
| Total Assets | | 171,940,180 |
| Liabilities: | | |
| Payable for Shareholder Redemptions | | 69,931 |
| Accrued Advisory Fees | | 136,209 |
| Accrued Service Fees | | 46,311 |
| Accrued Distribution and Service (12b-1) Fees - Class C | | 50,926 |
| Total Liabilities | | 303,377 |
| Net Assets | $ | 171,636,803 |
| | | |
| Net Assets Consist of: | | |
| Paid In Capital | $ | 149,045,490 |
| Accumulated Undistributed Net Investment Income | | 183,004 |
| Accumulated Undistributed Realized Gain on Investments - Net | | 2,530,706 |
| Unrealized Appreciation in Value | | |
| of Investments Based on Identified Cost - Net | | 19,877,603 |
| Net Assets | $ | 171,636,803 |
| |
| Investor Shares | | |
| Net Assets | $ | 150,304,384 |
| Shares of beneficial interest outstanding | | |
| (Unlimited number of shares authorized without par value) | | 7,143,266 |
| Net Asset Value, Offering Price per Share and Redemption Price per Share | $ | 21.04 |
| |
| Class C | | |
| Net Assets | $ | 21,332,419 |
| Shares of beneficial interest outstanding | | |
| (Unlimited number of shares authorized without par value) | | 1,060,415 |
| Net Asset Value and Offering Price per Share | $ | 20.12 |
| Minimum Redemption Price per Share with CDSC fee ($20.12x0.99)* | $ | 19.92 |
* A contingent deferred sales charge (“CDSC”) of 1% may be charged on shares redeemed within one
year of purchase. Redemption price per share is equal to net asset value less any CDSC fees. |
The accompanying notes are an integral part of these
financial statements. |
2016 Annual Report 11
| Castle Focus Fund | | | |
| |
| Statement of Operations | | | |
| For the fiscal year ended June 30, 2016 | | | |
| Investment Income: | | | |
| Dividends (Net of foreign withholding tax and fees of $181,319) | $ | 2,354,244 | |
| Interest | | 69,142 | |
| Total Investment Income | | 2,423,386 | |
| Expenses: | | | |
| Advisory Fees | | 1,544,140 | |
| Service Fees | | 895,601 | |
| Distribution and Service (12b-1) Fees - Class C | | 171,235 | |
| Total Expenses | | 2,610,976 | |
| Less: Expenses Waived | | (370,594 | ) |
| Net Expenses | | 2,240,382 | |
| Net Investment Income | | 183,004 | |
| Realized and Unrealized Gain on Investments: | | | |
| Realized Gain on Investments | | 2,530,714 | |
| Change In Unrealized Appreciation on Investments | | 8,884,582 | |
| Net Realized and Unrealized Gain on Investments | | 11,415,296 | |
| |
| Net Increase in Net Assets from Operations | $ | 11,598,300 | |
The accompanying notes are an integral part of these
financial statements. |
2016 Annual Report 12
| Castle Focus Fund |
| | |
| Statements of Changes in Net Assets | | | | | | | | |
| | | 7/1/2015 | | | | 7/1/2014 | | |
| | | to | | | | to | | |
| | | 6/30/2016 | | | | 6/30/2015 | | |
| From Operations: | | | | | | | | |
| Net Investment Income | $ | 183,004 | | | $ | 343,052 | | |
| Net Realized Gain on Investments | | 2,530,714 | | | | 6,847,232 | | |
| Change in Net Unrealized Appreciation on Investments | | 8,884,582 | | | | (8,010,072 | ) | |
| Increase (Decrease) in Net Assets from Operations | | 11,598,300 | | | | (819,788 | ) | |
| From Distributions to Shareholders: | | | | | | | | |
| Net Investment Income | | | | | | | | |
| Investor Shares | | (342,874 | ) | | | (38,015 | ) | |
| Class C | | - | | | | - | | |
| Net Realized Gain from Security Transactions | | | | | | | | |
| Investor Shares | | (1,318,075 | ) | | | (9,623,026 | ) | |
| Class C | | (171,478 | ) | | | (817,057 | ) | |
| Change in Net Assets from Distributions | | (1,832,427 | ) | | | (10,478,098 | ) | |
| From Capital Share Transactions: | | | | | | | | |
| Proceeds From Sale of Shares | | | | | | | | |
| Investor Shares | | 51,833,629 | | | | 70,658,773 | | |
| Class C | | 8,607,507 | | | | 7,061,331 | | |
| Proceeds From Redemption Fees (Note 2) | | | | | | | | |
| Investor Shares | | 7,406 | | | | 2,211 | | |
| Class C | | 207 | | | | 129 | | |
| Shares Issued on Reinvestment of Dividends | | | | | | | | |
| Investor Shares | | 1,455,333 | | | | 8,457,609 | | |
| Class C | | 170,056 | | | | 809,814 | | |
| Cost of Shares Redeemed | | | | | | | | |
| Investor Shares | | (52,811,134 | ) | | | (40,874,360 | ) | |
| Class C | | (2,657,487 | ) | | | (1,690,698 | ) | |
| Net Increase from Shareholder Activity | | 6,605,517 | | | | 44,424,809 | | |
| Net Increase in Net Assets | | 16,371,390 | | | | 33,126,923 | | |
| Net Assets at Beginning of Period | | 155,265,413 | | | | 122,138,490 | | |
| Net Assets at End of Period (Including Accumulated Undistributed | $ | 171,636,803 | | | $ | 155,265,413 | | |
| Net Investment Income of $183,004 and $342,881, respectively) | | | | | | | | |
| Share Transactions: | | | | | | | | |
| Issued | | | | | | | | |
| Investor Shares | | 2,631,307 | | | | 3,438,365 | | |
| Class C | | 458,789 | | | | 355,094 | | |
| Reinvested | | | | | | | | |
| Investor Shares | | 76,275 | | | | 425,005 | | |
| Class C | | 9,272 | | | | 42,003 | | |
| Redeemed | | | | | | | | |
| Investor Shares | | (2,706,105 | ) | | | (2,000,748 | ) | |
| Class C | | (141,097 | ) | | | (83,931 | ) | |
| Net Increase in Shares | | 328,441 | | | | 2,175,788 | | |
| Shares Outstanding at Beginning of Period | | 7,875,240 | | | | 5,699,452 | | |
| Shares Outstanding at End of Period | | 8,203,681 | | | | 7,875,240 | | |
The accompanying notes are an integral part of these
financial statements. |
2016 Annual Report 13
| Castle Focus Fund |
| |
| Financial Highlights - Investor Shares | | | | | | | | | | | | | | | | | | | | |
| Selected data for a share outstanding | | 7/1/2015 | | | | 7/1/2014 | | | | 7/1/2013 | | | | 7/1/2012 | | | | 7/1/2011 | | |
| throughout the period: | | to | | | | to | | | | to | | | | to | | | | to | | |
| | | 6/30/2016 | | | | 6/30/2015 | | | | 6/30/2014 | | | | 6/30/2013 | | | | 6/30/2012 | | |
| Net Asset Value - | | | | | | | | | | | | | | | | | | | | |
| Beginning of Period | $ | 19.78 | | | $ | 21.47 | | | $ | 18.76 | | | $ | 18.04 | | | $ | 17.44 | | |
| Net Investment Income (a) | | 0.04 | | | | 0.07 | | | | 0.02 | | | | 0.16 | | | | 0.14 | | |
| Net Gains or Losses on Securities | | | | | | | | | | | | | | | | | | | | |
| (realized and unrealized) | | 1.45 | | | | (0.17 | ) | | | 3.15 | | | | 1.17 | | | | 0.56 | | |
| Total from Investment Operations | | 1.49 | | | | (0.10 | ) | | | 3.17 | | | | 1.33 | | | | 0.70 | | |
| Proceeds from Redemption Fees | | - | | + | | - | | + | | - | | + | | - | | + | | - + | | |
| Distributions (From Net Investment Income) | | (0.05 | ) | | | (0.01 | ) | | | (0.05 | ) | | | (0.21 | ) | | | (0.03 | ) | |
| Distributions (From Capital Gains) | | (0.18 | ) | | | (1.58 | ) | | | (0.41 | ) | | | (0.40 | ) | | | (0.07 | ) | |
| Total Distributions | | (0.23 | ) | | | (1.59 | ) | | | (0.46 | ) | | | (0.61 | ) | | | (0.10 | ) | |
| Net Asset Value - | | | | | | | | | | | | | | | | | | | | |
| End of Period | $ | 21.04 | | | $ | 19.78 | | | $ | 21.47 | | | $ | 18.76 | | | $ | 18.04 | | |
| Total Return (b) | | 7.65% | | | | (0.53)% | | | | 17.17% | | | | 7.57% | | | | 4.04% | | |
| Ratios/Supplemental Data | | | | | | | | | | | | | | | | | | | | |
| Net Assets - End of Period (Thousands) | $ | 150,304 | | | $ | 141,283 | | | $ | 113,338 | | | $ | 98,961 | | | $ | 100,668 | | |
| Before Reimbursement | | | | | | | | | | | | | | | | | | | | |
| Ratio of Expenses to Average Net Assets | | 1.58% | | | | 1.58% | | | | 1.58% | | | | 1.58% | | | | 1.58% | | |
| Ratio of Net Investment Income (Loss) to | | | | | | | | | | | | | | | | | | | | |
| Average Net Assets | | -0.02% | | | | 0.08% | | | | -0.13% | | | | 0.68% | | | | 0.63% | | |
| After Reimbursement | | | | | | | | | | | | | | | | | | | | |
| Ratio of Expenses to Average Net Assets | | 1.34% | | | | 1.34% | | | | 1.34% | | | | 1.37% | | | | 1.45% | | |
| Ratio of Net Investment Income (Loss) to | | | | | | | | | | | | | | | | | | | | |
| Average Net Assets | | 0.22% | | | | 0.32% | | | | 0.11% | | | | 0.89% | | | | 0.76% | | |
| Portfolio Turnover Rate | | 37.88% | | | | 34.57% | | | | 50.60% | | | | 25.89% | | | | 24.38% | | |
| Financial Highlights - Class C | | | | | | | | | | | | | | | | | | | | |
| Selected data for a share outstanding | | 7/1/2015 | | | | 7/1/2014 | | | | 7/1/2013 | | | | 7/1/2012 | | | | 7/1/2011 | | |
| throughout the period: | | to | | | | to | | | | to | | | | to | | | | to | | |
| | | 6/30/2016 | | | | 6/30/2015 | | | | 6/30/2014 | | | | 6/30/2013 | | | | 6/30/2012 | | |
| Net Asset Value - | | | | | | | | | | | | | | | | | | | | |
| Beginning of Period | $ | 19.06 | | | $ | 20.94 | | | $ | 18.44 | | | $ | 17.73 | | | $ | 17.29 | | |
| Net Investment Loss (a) | | (0.13 | ) | | | (0.13 | ) | | | (0.17 | ) | | | (0.02 | ) | | | (0.04 | ) | |
| Net Gains or Losses on Securities | | | | | | | | | | | | | | | | | | | | |
| (realized and unrealized) | | 1.37 | | | | (0.17 | ) | | | 3.08 | | | | 1.15 | | | | 0.55 | | |
| Total from Investment Operations | | 1.24 | | | | (0.30 | ) | | | 2.91 | | | | 1.13 | | | | 0.51 | | |
| Proceeds from Redemption Fees | | - | | + | | - | | + | | - | | + | | - | | | | - | | + |
| Distributions (From Net Investment Income) | | - | | | | - | | | | - | | | | (0.02 | ) | | | - | | |
| Distributions (From Capital Gains) | | (0.18 | ) | | | (1.58 | ) | | | (0.41 | ) | | | (0.40 | ) | | | (0.07 | ) | |
| Total Distributions | | (0.18 | ) | | | (1.58 | ) | | | (0.41 | ) | | | (0.42 | ) | | | (0.07 | ) | |
| Net Asset Value - | | | | | | | | | | | | | | | | | | | | |
| End of Period | $ | 20.12 | | | $ | 19.06 | | | $ | 20.94 | | | $ | 18.44 | | | $ | 17.73 | | |
| Total Return (b) | | 6.61% | | | | (1.52)% | | | | 15.99% | | | | 6.50% | | | | 2.98% | | |
| Ratios/Supplemental Data | | | | | | | | | | | | | | | | | | | | |
| Net Assets - End of Period (Thousands) | $ | 21,332 | | | $ | 13,983 | | | $ | 8,801 | | | $ | 7,129 | | | $ | 7,510 | | |
| Before Reimbursement | | | | | | | | | | | | | | | | | | | | |
| Ratio of Expenses to Average Net Assets | | 2.58% | | | | 2.58% | | | | 2.58% | | | | 2.58% | | | | 2.58% | | |
| Ratio of Net Investment Loss to Average | | | | | | | | | | | | | | | | | | | | |
| Net Assets | | -0.95% | | | | -0.89% | | | | -1.13% | | | | -0.31% | | | | -0.36% | | |
| After Reimbursement | | | | | | | | | | | | | | | | | | | | |
| Ratio of Expenses to Average Net Assets | | 2.34% | | | | 2.34% | | | | 2.34% | | | | 2.37% | | | | 2.45% | | |
| Ratio of Net Investment Loss to Average | | | | | | | | | | | | | | | | | | | | |
| Net Assets | | -0.71% | | | | -0.65% | | | | -0.89% | | | | -0.11% | | | | -0.23% | | |
| Portfolio Turnover Rate | | 37.88% | | | | 34.57% | | | | 50.60% | | | | 25.89% | | | | 24.38% | | |
+ Amount was less than $0.005 per share.
(a) Based on Average Shares Outstanding.
(b) Total return in the above table represents the rate that the investor would have earned or lost on an
investment in the Fund assuming reinvestment of dividends. |
The accompanying notes are an integral part of these
financial statements. |
2016 Annual Report 14
NOTES TO THE FINANCIAL STATEMENTS
CASTLE FOCUS FUND
June 30, 2016
1.) ORGANIZATION
Castle Focus Fund (the “Fund”) was organized as a non-diversified series of the PFS Funds (the “Trust”) on June 28, 2010. The Trust was established under the laws of Massachusetts by an Agreement and Declaration of Trust dated January 13, 2000, which was amended and restated January 20, 2011. Prior to March 5, 2010, the Trust was named Wireless Fund. The Trust is registered as an open-end investment company under the Investment Company Act of 1940, as amended (the “1940 Act”). The Trust may offer an unlimited number of shares of beneficial interest in a number of separate series, each series representing a distinct fund with its own investment objectives and policies. As of June 30, 2016, there were eight series authorized by the Trust. The Fund commenced operations on July 1, 2010. The Fund currently offers Investor Shares and Class C Shares. The classes differ principally in their respective distribution expenses and service arrangements as well as their respective sales charge structure. All classes of shares have identical rights to earnings, assets and voting privileges, except for class specific expenses and exclusive rights to vote on matters affecting only individual classes. Investor Shares of the Fund are sold at the net asset value (the “NAV”) without an initial sales charge and are not subject to 12b-1 distribution fees. Additionally, Class C Shares may be subject to a contingent deferred sales charge (“CDSC”) as described in Note 2 and 12b-1 distribution fees as described in Note 5. The Fund’s investment objective is to seek long-term capital appreciation. The Investment Adviser to the Fund is Castle Investment Management, LLC (the “Adviser”) and the Sub-Adviser to the Fund is St. James Investment Company, LLC (the “Sub-Adviser”). Significant accounting policies of the Fund are presented below.
2.) SIGNIFICANT ACCOUNTING POLICIES
SECURITY VALUATION:
The Fund is an investment company and accordingly follows the investment company accounting and reporting guidance of the Financial Accounting Standards Board (“FASB”) Accounting Standards Codification Topic 946 Financial Services - Investment Companies. All investments in securities are recorded at their estimated fair value, as described in Note 3.
SHARE VALUATION:
The NAV is generally calculated as of the close of trading on the New York Stock Exchange (normally 4:00 p.m. Eastern time) every day the Exchange is open. The NAV is calculated by taking the total value of the Fund’s assets, subtracting its liabilities, and then dividing by the total number of shares outstanding, rounded to the nearest cent. The offering price and redemption price per share is equal to the net asset value per share. Prior to November 1, 2015, shares of the Fund were subject to a redemption fee of 2% if redeemed within 90 days of purchase. During the fiscal year ended June 30, 2016, proceeds from redemption fees were $7,406 and $207 for Investor Shares and Class C, respectively. Class C Shares of the Fund, may be subject to a 1.00% CDSC if the shares are redeemed less than one year after the original purchase of the Class C Shares. The CDSC will be assessed on an amount equal to the lesser of the current market value or the cost of the shares being redeemed. During the fiscal year ended June 30, 2016, the Adviser received $2,484 resulting from CDSC fees incurred by Class C shareholders.
FEDERAL INCOME TAXES:
The Fund’s policy is to continue to comply with the requirements of the Internal Revenue Code that are applicable to regulated investment companies and to distribute all of its taxable income to shareholders. Therefore, no federal income tax provision is required. It is the Fund’s policy to distribute annually, prior to the end of the calendar year, dividends sufficient to satisfy excise tax requirements of the Internal Revenue Code. This Internal Revenue Code requirement may cause an excess of distributions over the book year-end accumulated income. In addition, it is the Fund’s policy to distribute annually, after the end of the fiscal year, any remaining net investment income and net realized capital gains.
The Fund recognizes the tax benefits of certain tax positions only where the position is “more likely than not” to be sustained assuming examination by tax authorities. Management has analyzed the Fund’s tax positions, and has concluded that no liability for unrecognized tax benefits should be recorded related to uncertain tax positions taken on returns filed for open tax years. The Fund identifies its major tax jurisdictions as U.S. Federal tax authorities; however, the Fund is not aware of any
2016 Annual Report 15
Notes to the Financial Statements - continued
tax positions for which it is reasonably possible that the total amounts of unrecognized tax benefits will change materially in the next twelve months. The Fund recognizes interest and penalties, if any, related to unrecognized tax benefits as income tax expense in the Statement of Operations. During the fiscal year ended June 30, 2016, the Fund did not incur any interest or penalties.
DISTRIBUTIONS TO SHAREHOLDERS:
Distributions to shareholders, which are determined in accordance with income tax regulations, are recorded on the ex-dividend date.
The treatment for financial reporting purposes of distributions made to shareholders during the period from net investment income or net realized capital gains may differ from their ultimate treatment for federal income tax purposes. These differences are caused primarily by differences in the timing of the recognition of certain components of income, expense, or realized capital gain for federal income tax purposes. Where such differences are permanent in nature, they are reclassified in the components of the net assets based on their ultimate characterization for federal income tax purposes. Any such reclassifications will have no effect on net assets, results of operations, or net asset value per share of the Fund.
USE OF ESTIMATES:
The preparation of financial statements in conformity with accounting principles generally accepted in the United States (“GAAP”) requires management to make estimates and assumptions that affect the reported amounts of assets and liabilities and disclosure of contingent assets and liabilities at the date of the financial statements and the reported amounts of increases and decreases in net assets from operations during the reporting period. Actual results could differ from those estimates.
OTHER:
The Fund records security transactions based on a trade date. Dividend income is recognized on the ex-dividend date, and interest income is recognized on an accrual basis. The Fund uses the specific identification method in computing gain or loss on the sale of investment securities. Discounts and premiums on securities purchases are accreted and amortized over the lives of the respective securities. Withholding taxes on foreign dividends have been provided for in accordance with the Fund’s understanding of the applicable country’s tax rules and rates.
ALLOCATION OF EXPENSES:
Expenses incurred by the Trust that don’t relate to a specific fund of the Trust are allocated pro-rata to the funds based on the total number of funds in the Trust at the time the expense was incurred or by another appropriate method. Class specific expenses are borne by each specific class. Income, non-class specific expenses, and realized and unrealized gains/losses are allocated to the respective classes based on the basis of relative net assets.
3.) SECURITIES VALUATIONS
The Fund utilizes various methods to measure the fair value of most of its investments on a recurring basis. GAAP establishes a hierarchy that prioritizes inputs to valuation methods. The three levels of inputs are:
Level 1 - Unadjusted quoted prices in active markets for identical assets or liabilities that the Fund has the ability to access.
Level 2 - Inputs other than quoted prices included in level 1 that are observable for the asset or liability, either directly or indirectly. These inputs may include quoted prices for the identical instrument on an inactive market, prices for similar instruments, interest rates, prepayment speeds, credit risk, yield curves, default rates and similar data.
Level 3 - Unobservable inputs for the asset or liability, to the extent relevant observable inputs are not available, representing the Fund’s own assumptions about the assumptions a market participant would use in valuing the asset or liability, and would be based on the best information available.
The availability of observable inputs can vary from security to security and is affected by a wide variety of factors, including, for example, the type of security, whether the security is new and not yet established in the marketplace, the liquidity of markets, and other characteristics particular to the security. To the extent that valuation is based on models or inputs that are less observable or unob-
2016 Annual Report 16
Notes to the Financial Statements - continued
servable in the market, the determination of fair value requires more judgment. Accordingly, the degree of judgment exercised in determining fair value is greatest for instruments categorized in level 3.
The inputs used to measure fair value may fall into different levels of the fair value hierarchy. In such cases, for disclosure purposes, the level in the fair value hierarchy within which the fair value measurement falls in its entirety, is determined based on the lowest level input that is significant to the fair value measurement in its entirety.
FAIR VALUE MEASUREMENTS
A description of the valuation techniques applied to the Fund’s major categories of assets and liabilities measured at fair value on a recurring basis follows.
Equity securities (common stocks, including ADRs and limited partnerships). Equity securities generally are valued by using market quotations, but may be valued on the basis of prices furnished by a pricing service when the Adviser believes such prices accurately reflect the fair market value of such securities. Securities that are traded on any stock exchange or on the NASDAQ over-the-counter market are generally valued by the pricing service at the last quoted sale price. Lacking a last sale price, an equity security is generally valued by the pricing service at its last bid price. Generally, if the security is traded in an active market and is valued at the last sale price, the security is categorized as a level 1 security. When market quotations are not readily available, when the Adviser determines that the market quotation or the price provided by the pricing service does not accurately reflect the current market value, or when restricted securities are being valued, such securities are valued as determined in good faith by the Adviser, subject to review of the Board of Trustees (the “Trustees” or the “Board”) and are categorized in level 2 or level 3, when appropriate.
Money market funds. Money market securities are valued at net asset value and are classified in level 1 of the fair value hierarchy.
In accordance with the Trust’s good faith pricing guidelines, the Adviser is required to consider all appropriate factors relevant to the value of securities for which it has determined other pricing sources are not available or reliable as described above. There is no single standard for determining fair value, since fair value depends upon the circumstances of each individual case. As a general principle, the current fair value of an issue of securities being valued by the Adviser would appear to be the amount which the owner might reasonably expect to receive for them upon their current sale. Methods which are in accordance with this principle may, for example, be based on (i) a multiple of earnings; (ii) a discount from market of a similar freely traded security (including a derivative security or a basket of securities traded on other markets, exchanges or among dealers); or (iii) yield to maturity with respect to debt issues, or a combination of these and other methods.
The following table summarizes the inputs used to value the Fund’s assets measured at fair value as of June 30, 2016:
| Valuation Inputs of Assets | | Level 1 | | Level 2 | | Level 3 | | Total |
| Common Stocks | | $95,379,409 | | $0 | | $0 | | $95,379,409 |
| Money Market Funds | | 75,414,656 | | 0 | | 0 | | 75,414,656 |
| Total | | $170,794,065 | | $0 | | $0 | | $170,794,065 |
Refer to the Fund’s Schedule of Investments for a listing of securities by industry. The Fund did not hold any Level 3 assets during the fiscal year ended June 30, 2016. There were no transfers into or out of the levels during the fiscal year ended June 30, 2016. It is the Fund’s policy to consider transfers into or out of the levels as of the end of the reporting period.
The Fund did not invest in derivative instruments during the fiscal year ended June 30, 2016.
4.) INVESTMENT ADVISORY AGREEMENT AND SERVICES AGREEMENT
The Fund entered into an Investment Management Agreement with Castle Investment Management, LLC as the investment adviser of the Fund. Under the terms of the Investment Management Agreement, the Adviser manages the investment portfolio of the Fund, subject to policies adopted by the Trust’s Trustees. The Adviser, at its own expense and without reimbursement from the Fund, furnishes office space and all necessary office facilities, equipment and executive personnel necessary
2016 Annual Report 17
Notes to the Financial Statements - continued
for managing the assets of the Fund. The Adviser also pays the salaries and fees of all of its officers and employees that serve as officers and trustees of the Trust. For its services, the Adviser receives a fee of 1.00% per year of the average daily net assets of the Fund. The Sub-Adviser of the Fund has the responsibility to provide a continuous program of investment management, make investment decisions and place orders to purchase and seel securities for the Fund, subject to the supervision of the Adviser. As full compensation for all services rendered, including investment ideas and recommendations for the assets of the Fund, the Adviser pays the Sub-Adviser a sub-advisor fee. For the fiscal year ended June 30, 2016, the Adviser received management fees totaling $1,544,140. At June 30, 2016, the Fund owed $136,209 to the Adviser.
The Fund also has a Services Agreement with the Adviser (the “Services Agreement”), under which the Fund pays the Adviser. Under the Services Agreement, the Adviser shall supervise the Fund’s business affairs and is obligated to pay the operating expenses of the Fund excluding management fees, 12b-1 fees, brokerage fees and commissions, taxes, borrowing costs (such as (a) interest and (b) dividend expenses on securities sold short), ADR fees, the cost of acquired funds and extraordinary expenses. In addition, to the extent not otherwise provided by other parties under agreements with the Trust, the Adviser shall supply: (i) non-investment related statistical and research data; (ii) the services of a Chief Compliance Officer for the Trust; and (iii) executive and administrative services. The Adviser shall also assist with and/or supervise the preparation by the Trust’s administrator, transfer agent, and/or auditors of: (i) tax returns; (ii) reports to shareholders of the Fund; (iii) reports to, and filings with, the Securities and Exchange Commission, state securities commissions and Blue Sky authorities including preliminary and definitive proxy materials and post-effective amendments to the Trust’s registration statement; and (iv) necessary materials for meetings of the Trust’s Board of Trustees. The Adviser shall provide personnel to serve as officers of the Trust if so elected by the Trustees. Executive and administrative services include, but are not limited to, the coordination of all third parties furnishing services to the Fund, review of the books and records of the Fund maintained by such third parties, and the review and submission to the officers of the Fund for their approval, of invoices or other requests for payment of Fund expenses; and such other action with respect to the Fund as may be necessary in the opinion of the Adviser to perform its duties. For its services, the Adviser receives a service fee equal to 0.58% of the average daily net assets of the Fund. For the fiscal year ended June 30, 2016, the Adviser earned service fees of $895,601. At June 30, 2016, the Fund owed the Adviser service fees of $46,311. Effective November 1, 2013 the Adviser has contractually agreed to waive Services Agreement fees by 0.24% of its average daily net assets through October 31, 2016. The Services Agreement fee waiver will automatically terminate on October 31, 2016 unless it is renewed by the Adviser. The Adviser may not terminate the fee waiver before October 31, 2016. From October 29, 2012 through October 31, 2013, the Adviser had contractually agreed to waive Service Agreement fees by 0.23% . From November 1, 2011 through October 28, 2012, the Adviser had contractually agreed to waive Service Agreement fees by 0.16% . There are no recoupment provisions for the waivers described above. A total of $370,594 was waived for the fiscal year ended June 30, 2016.
5.) DISTRIBUTION AND SHAREHOLDER SERVICING PLAN
The Fund has adopted a Distribution Plan in accordance with Rule 12b-1 under the 1940 Act (the “Plan”) with respect to the Class C Shares of the Fund. Pursuant to the Distribution Plan, the Fund compensates the Distributor for services rendered and expenses borne in connection with activities primarily intended to result in the sale of the Fund’s Class C Shares. This Plan provides that the Fund will pay the annual rate of 1.00% of the average daily net assets of the Fund’s Class C Shares for activities primarily intended to result in the sale of those shares. These activities include payment to entities for providing distribution and shareholder servicing with respect to the Fund’s shares. The 1.00% for the Class C Shares is comprised of a 0.25% service fee and a 0.75% distribution fee. The Fund incurred distribution and service (12b-1) fees of $171,235 for Class C Shares, during the fiscal year ended June 30, 2016. At June 30, 2016, the Fund owed distribution and service (12b-1) fees of $50,926 for Class C Shares.
6.) RELATED PARTY TRANSACTIONS
Jeffrey R. Provence of Premier Fund Solutions, Inc. (the “Administrator”) also serves as a trustee/officer of the Fund. This individual receives benefits from the Administrator resulting from administration fees paid to the Administrator by the Adviser.
The Trustees who are not interested persons of the Fund were paid $1,500 each, for a total of $4,500, in Trustees’ fees for the fiscal year ended June 30, 2016 by the Adviser.
2016 Annual Report 18
Notes to the Financial Statements - continued
7.) INVESTMENT TRANSACTIONS
For the fiscal year ended June 30, 2016, purchases and sales of investment securities other than U.S. Government obligations and short-term investments aggregated $38,436,785 and $63,130,896, respectively. Purchases and sales of U.S. Government obligations aggregated $0 and $0, respectively.
8.) CONTROL OWNERSHIP
The beneficial ownership, either directly or indirectly, of more than 25% of the voting securities of a fund creates a presumption of control of the Fund, under Section 2(a)(9) of the Investment Company Act of 1940. As of June 30, 2016, National Financial Services, LLC, located at 200 Liberty Street, New York, New York, for the benefit of its customers, held, in aggregate, 35.65% of Investor Shares. As of June 30, 2016, RBC Capital Markets LLC located at 60 South Sixth Street, Minneapolis, Minnesota, held for the benefit of its customers, in the aggregate, 68.13% of Class C Shares. The Trust does not know whether the foregoing entities or any of the underlying beneficial holders owned or controlled 25% or more of the voting securities of the Fund. Accordingly, it is not known whether National Financial Services, LLC or RBC Capital Markets LLC or any of the underlying accounts could be deemed to control the Fund.
9.) TAX MATTERS
For Federal income tax purposes, the cost of securities owned at June 30, 2016 was $150,916,462.
At June 30, 2016, the composition of gross unrealized appreciation (the excess of value over tax cost) and depreciation (the excess of tax cost over value) of investments on a tax basis was as follows:
| | Appreciation | | (Depreciation) | | Net Appreciation (Depreciation) |
| | $19,921,299 | | ($43,696) | | $19,877,603 |
As of June 30, 2016, there were no differences between book basis and tax basis unrealized appreciation.
| The tax character of Investor Share distributions was as follows: | | |
| |
| | | Fiscal Year Ended | | Fiscal Year Ended |
| | | June 30, 2016 | | June 30, 2015 |
| Ordinary Income | | $ 882,057 | | $ 181,485 |
| Long-term Capital Gain | | 778,892 | | 9,479,556 |
| | | $ 1,660,949 | | $ 9,661,041 |
| |
| The tax character of Class C distributions was as follows: | | |
| |
| | | Fiscal Year Ended | | Fiscal Year Ended |
| | | June 30, 2016 | | June 30, 2015 |
| Ordinary Income | | $ 70,146 | | $ 12,181 |
| Long-term Capital Gain | | 101,332 | | 804,876 |
| | | $ 171,478 | | $ 817,057 |
As of June 30, 2016, the components of distributable earnings on a tax basis were as follows:
| Undistributed ordinary income | | $ 419,145 |
| Undistributed long-term capital gain/(accumulated losses) | | 2,294,565 |
| Unrealized appreciation/(depreciation) - net | | 19,877,603 |
| | | $ 22,591,313 |
10.) DEFENSIVE POSITIONS
The Fund may hold all or a portion of its assets in cash or cash-equivalents like money market funds, certificates of deposit, short-term debt obligations, and repurchase agreements, either due to pending investments or when investment opportunities are limited or market conditions are adverse. Under these circumstances, the Fund may not participate in stock market advances or declines to the same extent it would had it remained more fully invested in common stocks. If the Fund invests in shares of a money market fund, shareholders of the Fund generally will be subject to duplicative management
2016 Annual Report 19
Notes to the Financial Statements - continued
and other fees and expenses. As of June 30, 2016, the Fund had 43.94% of the value of its net assets invested in the Invesco Short-Term Investments Trust Treasury Portfolio Institutional Class. Additional information for this security, including its financial statements, is available from the Securities and Exchange Commission’s website at www.sec.gov.
11.) SUBSEQUENT EVENTS
Subsequent events after the date of the Statement of Assets and Liabilities have been evaluated through the date the financial statements were issued. Management has concluded that there is no impact requiring adjustment or disclosure in the financial statements.
2016 Annual Report 20
ADDITIONAL INFORMATION
June 30, 2016
(Unaudited)
APPROVAL OF CONTINUATION OF THE MANAGEMENT AGREEMENT BETWEEN THE TRUST AND CASTLE
INVESTMENT MANAGEMENT, LLC ON BEHALF OF THE CASTLE FOCUS FUND AND THE INVESTMENT SUB-
ADVISORY AGREEMENT BETWEEN CASTLE INVESTMENT MANAGEMENT, LLC AND ST. JAMES INVESTMENT
COMPANY, LLC ON BEHALF OF THE CASTLE FOCUS FUND
On June 9, 2016, the Board of Trustees (the “Board” or the “Trustees”) considered the renewal of the Management Agreement between the Trust and Castle Investment Management, LLC (“Castle”) on behalf of the Castle Focus Fund and the Investment Sub-Advisory Agreement between Castle and St. James Investment Company, LLC (“St. James”) on behalf of the Castle Focus Fund (the “Agreements”). In approving the Agreements, the Board of Trustees considered and evaluated the following factors: (i) the nature, extent and quality of the services provided by Castle and St. James to the Castle Focus Fund; (ii) the investment performance of the Castle Focus Fund, Castle and St. James; (iii) the cost of the services to be provided and the profits to be realized by Castle and St. James and their respective affiliates from the relationship with the Castle Focus Fund; (iv) the extent to which economies of scale will be realized as the Castle Focus Fund grows and whether the fee levels reflect these economies of scale to the benefit of shareholders; and (v) Castle’s and St. James’ practices regarding possible conflicts of interest.
In assessing these factors and reaching its decisions, the Board took into consideration information furnished for the Board’s review and consideration throughout the year at regular Board meetings, as well as information specifically prepared and/or presented in connection with the annual renewal process, including information presented at the Meeting. The Board reflected on the presentations by representatives of Castle and St. James earlier in the Meeting. The Board requested and was provided with information and reports relevant to the annual renewal of the Agreements, including: (i) reports regarding the services and support provided to the Castle Focus Fund and its shareholders by Castle and St. James; (ii) assessments of the investment performance of the Castle Focus Fund by personnel of Castle; (iii) commentary on the reasons for the performance; (iv) presentations addressing Castle’s and St. James’ investment philosophy, investment strategy, personnel and operations; (v) compliance and audit reports concerning the Castle Focus Fund, Castle and St. James; (vi) disclosure information contained in the registration statement of the Trust and the Form ADVs of Castle and St. James; and (vii) a memorandum from Counsel, that summarized the fiduciary duties and responsibilities of the Board in reviewing and approving the Agreements, including the material factors set forth above and the types of information included in each factor that should be considered by the Board in order to make an informed decision. The Board also requested and received various informational materials including, without limitation: (i) documents containing information about Castle and St. James, including financial information, a description of personnel and the services provided to the Castle Focus Fund, information on investment advice, performance, summaries of Castle Focus Fund expenses, compliance program, current legal matters, and other general information; (ii) comparative expense and performance information for other mutual funds with strategies similar to the Castle Focus Fund; and (iii) benefits to be realized by Castle and St. James from their relationship with the Castle Focus Fund. The Board also considered certain ownership changes that were occurring at St. James and any potential impact they would have on the contractual relationship with the Trust and the Castle Focus Fund, and any impact that it may have on the nature, quality and extent of services to be provided to the Castle Focus Fund. The Board did not identify any particular information that was most relevant to its consideration to approve the Agreements and each Trustee may have afforded different weight to the various factors.
1. Nature, Extent and Quality of the Services Provided by Castle and St. James
In considering the nature, extent, and quality of the services provided by Castle and St. James, the Trustees reviewed the responsibilities of Castle and St. James under the Agreements. The Trustees reviewed the services being provided by Castle and St. James including, without limitation: the quality of investment advisory services (including research and recommendations with respect to portfolio securities); the process for formulating investment recommendations and assuring compliance with the Castle Focus Fund’s investment objective, strategies, and limitations, as well as for ensuring compliance with regulatory requirements. The Trustees reflected on their discussions with representatives from Castle and St. James. The Trustees considered the coordination of services for the
2016 Annual Report 21
Additional Information (Unaudited) - continued
Castle Focus Fund among Castle and the service providers (including St. James) and the Independent Trustees; and the efforts of Castle to promote the Castle Focus Fund and grow its assets. The Trustees noted Castle’s and St. James’ continuity of, and commitment to retain, qualified personnel and to maintain and enhance its resources and systems and the continued cooperation with the Independent Trustees and Counsel for the Castle Focus Fund. The Trustees evaluated Castle’s and St. James’ personnel, including the education and experience of their personnel. The Trustees reflected on discussions with the representatives from Castle and St. James during the Meeting and, in particular, in regards to organizational changes taking place at St. James and representations that such changes in organizational structure would have no negative effects to the nature, quality and extent of services provided to the Castle Focus Fund. After reviewing the foregoing information and further information in the materials provided by Castle and St. James, the Board concluded that, in light of all the facts and circumstances, the nature, extent, and quality of the services provided by Castle and St. James were satisfactory and adequate for the Castle Focus Fund.
2. Investment Performance of the Castle Focus Fund, Castle and St. James
In considering the investment performance of the Castle Focus Fund, Castle and St. James, the Trustees compared the short-term and longer-term performance of the Castle Focus Fund with the performance of funds with similar objectives managed by other investment advisers, as well as with aggregated peer group data. The Trustees noted that Castle did not have any clients other than the Castle Focus Fund. The Trustees noted that the performance of the Castle Focus Fund compared to other accounts managed by St. James was represented by St. James to be within its typical dispersion and it was represented by St. James that the performance difference of the Castle Focus Fund versus the composite was generally attributed to the differences in fees. As to the performance of the Castle Focus Fund, the Board was provided with a report that included information regarding the performance of the Castle Focus Fund compared to a group of funds of similar size, style and objective, categorized by Morningstar (the “Peer Group”) as well as the Fund’s Morningstar category (the “Category”). The Trustees noted that for the 12-month period ended March 31, 2016, the Castle Focus Fund’s Investor Class shares outperformed its Peer Group average, Category average and closely tracked benchmark index. The Trustees also noted that performance for a more recent period ended May 31, 2016 reflected more significant outperformance by the Castle Focus Fund of the Peer Group, Category average and the benchmark. The Trustees noted that the Castle Focus Fund underperformed its benchmark index, Category and Peer Group averages for the three- and five-year periods ended March 31, 2016 and May 31, 2016. However, they also noted that the Castle Focus Fund tended to, for significant periods, hold large cash positions, which detracted from performance but was consistent with the philosophy of St. James and the investment strategies for the Castle Focus Fund. The Trustees reflected on conversations with representatives of Castle and St. James on the investment philosophy of the Castle Focus Fund being geared toward longer-term performance and that the Castle Focus Fund may not perform as well as its peers in certain types of markets. The Trustees noted that they recognized the attempt to have lower risk levels for the Castle Focus Fund as compared to others in its Peer Group noting that this makes for a more difficult comparison to Peers and the benchmark index. The Trustees noted that differences in performance for the Castle Focus Fund’s Class C shares versus those of the Investor Class shares was generally attributable to the higher fee structure for the Class C shares. After reviewing and discussing the investment performance of the Castle Focus Fund further, Castle’s and St. James’ experience managing the Castle Focus Fund, their historical investment performance, and other relevant factors, the Board concluded, in light of all the facts and circumstances, that the investment performance of the Castle Focus Fund, Castle and St. James was satisfactory.
3. Costs of the Services to be Provided and Profits to be Realized by Castle and St. James
In considering the costs of the services to be provided and profits to be realized by Castle and St. James from the relationship with the Castle Focus Fund, the Trustees considered: (1) Castle’s and St. James’ financial condition and the level of commitment to the Castle Focus Fund and Castle by the principals of Castle; (2) the asset level of the Castle Focus Fund; (3) the overall expenses of the Castle Focus Fund; and (4) the nature and frequency of advisory and sub-advisory fee payments. It was noted that the sub-advisory fee portion of the total advisory fee was increasing at the request by St. James and Castle to amend the sub-advisory agreement, but that the overall fee paid by investors was not changing. The Trustees reviewed information provided by Castle and St. James regarding
2016 Annual Report 22
Additional Information (Unaudited) - continued
their respective profits associated with managing the Castle Focus Fund. The Trustees also considered potential benefits for Castle and St. James in managing the Castle Focus Fund. The Trustees then compared the fees and expenses of the Castle Focus Fund (including the management fee) to other comparable mutual funds. The Trustees reviewed the fees under the Agreements compared to other mutual funds with similar investment objectives and asset levels as well as the Fund’s Category and noted that the net expense ratio for Investor Class Shares was above the Peer Group and Category average. It was noted that Class C Shares were at the high end of the Category range. The Trustees also considered the fees assessed by St. James relative to the fees they assessed to their other separate account clients and noted that the fees charged the Castle Focus Fund were less than those charged to the other accounts. The Trustees also reviewed the management fee as compared to the Peer Group and Category average and noted that the management fee was at the high end of the Peer Group and Category range. The Trustees also received information on the sub-advisory portion of the fee as compared to other sub-advised funds in the Category and noted that the sub-advisory fee was generally within the range of these funds. The Trustees recognized that Castle instituted a waiver of a portion of its fees under the Services Agreement with the Trust effective through October 31, 2016 that is recognized in the current net expense ratio - the Trustees also noted the intention expressed at the Meeting of the principals of Castle to keep the waiver in place after October 31, 2016. The Trustees also noted that under the contractual arrangements with Castle, Castle was required to pay most of the Castle Focus Fund’s operating expenses. Based on the foregoing, the Board concluded that the fees to be paid to Castle (and in turn Castle’s payment to St. James) and the profits to be realized by Castle and St. James, in light of all the facts and circumstances, were fair and reasonable in relation to the nature and quality of the services provided by Castle and St. James.
4. Economies of Scale
The Trustees next considered the impact of economies of scale on the Castle Focus Fund’s size and whether advisory fee levels reflect those economies of scale for the benefit of the Castle Focus Fund’s investors. The Trustees considered that while the management fee remained the same at all asset levels, the Castle Focus Fund’s shareholders had experienced benefits from the fact that Castle was obligated to pay certain of the Castle Focus Fund’s operating expenses which had the effect of limiting the overall fees paid by the Castle Focus Fund. The Trustees also recognized, as noted above, that Castle instituted a waiver of a portion of its fees under the Services Agreement until October 31, 2016, and as noted above, the Trustees also noted the intention expressed at the Meeting of the principals of Castle to keep the waiver in place after October 31, 2016. The Trustees also noted that the contractual arrangements with the Trust required that Castle effectively cap the expenses of the Castle Focus Fund, which has a similar effect as a breakpoint, although the Trustees noted that shareholders would benefit without the need for the Castle Focus Fund’s assets to reach or be maintained at certain asset thresholds. The Trustees also noted that the fees payable to St. James were paid from the overall amount paid to Castle and, as a result, asset growth would not result in economies of scale for shareholders of the Castle Focus Fund with respect to that fee. In light of its ongoing consideration of the Castle Focus Fund’s asset levels, expectations for growth in the Castle Focus Fund, and fee levels, the Board determined that the Castle Focus Fund’s fee arrangements, in light of all the facts and circumstances, were fair and reasonable in relation to the nature and quality of the services provided by Castle and St. James.
5. Possible Conflicts of Interest and Benefits to Castle and St. James
In considering Castle’s and St. James’ practices regarding conflicts of interest, the Trustees evaluated the potential for conflicts of interest and considered such matters as the experience and ability of the advisory personnel assigned to the Castle Focus Fund; the basis of decisions to buy or sell securities for the Castle Focus Fund; and the substance and administration of Castle’s and St. James’ respective codes of ethics. The Trustees also considered disclosure in the registration statement of the Trust related to Castle’s and St. James’ potential conflicts of interest. The Trustees also considered St. James’ practices regarding brokerage and portfolio transactions, including particularly St. James’ practice for seeking best execution for the Castle Focus Fund’s portfolio transactions and noted that St. James does not utilize soft dollars. The Trustees considered the process by which evaluations are made of the overall reasonableness of commissions paid. The Trustees noted the potential benefit of additional public exposure of St. James based on marketing that is done for the Castle
2016 Annual Report 23
Additional Information (Unaudited) - continued
Focus Fund. No other potential benefits (other than the management and sub-advisory fees) were identified by the Trustees. Based on the foregoing, the Board determined that Castle’s and St. James’ standards and practices relating to the identification and mitigation of possible conflicts of interest were satisfactory.
Next, the Independent Trustees met in executive session along with Counsel to discuss the continuation of the Agreements. The officers of the Trust and others present were excused during this discussion.
After further review and discussion, it was determined that the best interests of the Castle Focus Fund’s shareholders were served by the renewal of the Agreements.
2016 Annual Report 24
REPORT OF INDEPENDENT REGISTERED PUBLIC ACCOUNTING FIRM
To the Shareholders of Castle Focus Fund and
Board of Trustees of PFS Funds
We have audited the accompanying statement of assets and liabilities, including the schedule of investments, of Castle Focus Fund (the “Fund”), a series of PFS Funds, as of June 30, 2016, and the related statement of operations for the year then ended, the statements of changes in net assets for each of the two years in the period then ended, and the financial highlights for each of the five years in the period then ended. These financial statements and financial highlights are the responsibility of the Fund’s management. Our responsibility is to express an opinion on these financial statements and financial highlights based on our audits.
We conducted our audits in accordance with the standards of the Public Company Accounting Oversight Board (United States). Those standards require that we plan and perform the audit to obtain reasonable assurance about whether the financial statements and financial highlights are free of material misstatement. An audit includes examining, on a test basis, evidence supporting the amounts and disclosures in the financial statements. Our procedures included confirmation of securities owned as of June 30, 2016, by correspondence with the custodian. An audit also includes assessing the accounting principles used and significant estimates made by management, as well as evaluating the overall financial statement presentation. We believe that our audits provide a reasonable basis for our opinion.
In our opinion, the financial statements and financial highlights referred to above present fairly, in all material respects, the financial position of Castle Focus Fund as of June 30, 2016, the results of its operations for the year then ended, the changes in its net assets for each of the two years in the period then ended, and the financial highlights for each of the five years in the period then ended, in conformity with accounting principles generally accepted in the United States of America.

COHEN FUND AUDIT SERVICES, LTD.
Cleveland, Ohio
August 23, 2016
2016 Annual Report 25
Trustees and Officers
(Unaudited)
The Board of Trustees supervises the business activities of the Trust. The names of the Trustees and executive officers of the Trust are shown below. For more information regarding the Trustees, please refer to the Statement of Additional Information, which is available upon request by calling 1-877-743-7820. Each Trustee serves until the Trustee sooner dies, resigns, retires, or is removed.
The Trustees and Officers of the Trust and their principal business activities during the past five years are:
Interested Trustees and Officers
| | | | | Number of | |
| | | | Principal | Portfolios In | Other |
| Name, | Position(s) | Term of Office | Occupation(s) | Fund | Directorships |
| Address(1), | Held With | and Length of | During | Complex | Held By |
| and Year of Birth | the Trust | Time Served | Past 5 Years | Overseen By | Trustee |
| | | | | Trustee | |
| |
| Ross C. Provence, | President | Indefinite Term; | General Partner and Portfolio | N/A | N/A |
| Year of Birth: 1938 | | Since 2000 | Manager for Value Trend Capital | | |
| | | | Management, LP (1995 to current). | | |
| | | | Estate planning attorney (1963 to | | |
| current). |
| |
| Jeffrey R. Provence(2), | Trustee, | Indefinite Term; | CEO, Premier Fund Solutions, Inc. | 8 | Blue Chip |
| Year of Birth: 1969 | Secretary | Since 2000 | (2001 to current). General Partner | | Investor Funds |
| | and | | and Portfolio Manager for Value | | |
| | Treasurer | | Trend Capital Management, LP | | |
| | | | (1995 to current). | | |
| |
| Julian G. Winters, | Chief | Chief | Managing Member, Watermark | N/A | N/A |
| Year of Birth: 1968 | Compliance | Compliance | Solutions LLC (investment compli- | | |
| | Officer | Officer Since | ance and consulting) since March | | |
| | | 2010 | 2007. | | |
(1) The address of each trustee and officer is c/o PFS Funds, 1939 Friendship Drive, Suite C, El Cajon, California 92020.
(2) Jeffrey R. Provence is considered an “interested person” as defined in Section 2(a)(19) of the Investment Company Act of 1940 by
virtue of his position with the Trust.
Independent Trustees |
| | | | | Number of | |
| | | | Principal | Portfolios In | Other |
| Name, | Position | Term of Office | Occupation(s) | Fund | Directorships |
| Address(1), | Held With | and Length of | During | Complex | Held By |
| and Year of Birth | the Trust | Time Served | Past 5 Years | Overseen By | Trustee |
| | | | | Trustee | |
| |
| Thomas H. Addis III, | Independent | Indefinite Term; | Executive Director/CEO, Southern | 8 | None |
| Year of Birth: 1945 | Trustee | Since 2000 | California PGA (2006 to current). | | |
| |
| Allen C. Brown,�� | Independent | Indefinite Term; | Co-owner of Stebleton & Brown | 8 | Blue Chip |
| Year of Birth: 1943 | Trustee | Since 2010 | (1994 to Current). Estate planning | | Investor Funds |
| | | | and business attorney (1970 to cur- | | |
| rent). |
| |
| George Cossolias, CPA, | Independent | Indefinite Term; | Partner of CWDL, CPAs (February 1, | 8 | Blue Chip |
| Year of Birth: 1935 | Trustee | Since 2000 | 2014 to current). Owner of George | | Investor Funds |
| | | | Cossolias & Company, CPAs (1972 | | |
| | | | to January 31, 2014). President of | | |
| | | | LubricationSpecialists, Inc. (1996 to | | |
| current). |
(1) The address of each trustee and officer is c/o PFS Funds, 1939 Friendship Drive, Suite C, El Cajon, California 92020.
2016 Annual Report 26
Investment Adviser
Castle Investment Management, LLC
Sub-Adviser
St. James Investment Company, LLC
Legal Counsel
The Law Offices of John H. Lively & Associates, Inc.
A member firm of The 1940 Act Law GroupTM
Custodian
U.S. Bank, N.A.
Distributor
Rafferty Capital Markets, LLC
Dividend Paying Agent,
Shareholders' Servicing Agent,
Transfer Agent
Mutual Shareholder Services, LLC
Fund Administrator
Premier Fund Solutions, Inc.
Independent Registered Public Accounting Firm
Cohen Fund Audit Services, Ltd. |
This report is provided for the general information of the shareholders of the Castle
Focus Fund. This report is not intended for distribution to prospective investors in the
Fund, unless preceded or accompanied by an effective prospectus.
Castle Focus Fund
210 N. Lee Street, Suite 105
Alexandria, Virginia 22314
www.castleim.com
703-260-1921
Item 2. Code of Ethics.
The registrant has adopted a code of ethics that applies to the registrant’s principal executive officer and the principal financial officer. The registrant has not made any amendments to its code of ethics during the covered period. The registrant has not granted any waivers from any provisions of the code of ethics during the covered period. A copy of the registrant’s Code of Ethics is filed herewith.
Item 3. Audit Committee Financial Expert.
The registrant’s Board of Trustees has determined that George Cossolias is an audit committee finical expert. Mr. Cossolias is independent for purposes of this Item 3.
Item 4. Principal Accountant Fees and Services.
(a-d) The following table details the aggregate fees billed for each of the last two fiscal years for audit fees, audit-related fees, tax fees and other fees by the principal accountant to the registrant. The principal accountant has provided no services to the adviser or any entity controlled by, or under common control with the adviser that provides ongoing services to the registrant.
| | | FYE 6/30/16 | | FYE 6/30/15 |
| Audit Fees | | $14,250 | | $14,250 |
| Audit-Related Fees | | $0 | | $0 |
| Tax Fees | | $2,500 | | $2,500 |
| All Other Fees | | $750 | | $750 |
Nature of Tax Fees: preparation of Excise Tax Statement and 1120 RIC.
All Other Fees: Semi-Annual Report Review
(e) (1) The audit committee approves all audit and non-audit related services and, therefore, has not adopted pre-approval policies and procedures described in paragraph (c)(7) of Rule 2-01 of Regulation S-X.
(e) (2) None of the services described in paragraph (b) through (d) of this Item were approved by the audit committee pursuant to paragraph (c)(7)(i)(C) of Rule 2-01 of Regulation S-X.
(f) All of the principal accountant’s hours spent on auditing the registrant’s financial statements were attributed to work performed by full-time permanent employees of the principal accountant.
(g) The following table indicates the aggregate non-audit fees billed by the registrant’s principal accountant for services to the registrant , the registrant’s investment adviser (not sub-adviser), and any entity controlling, controlled by, or under common control with the adviser that provides ongoing services to the registrant, for the last two years.
| Non-Audit Fees | | FYE 6/30/16 | | FYE 6/30/15 |
| Registrant | | $3,250 | | $3,250 |
| Registrant’s Investment Adviser | | $0 | | $0 |
(h) The principal accountant provided no services to the investment adviser or any entity controlling, controlled by, or under common control with the adviser that provides ongoing services to the registrant.
Item 5. Audit Committee of Listed Companies. Not applicable.
Item 6. Schedule of Investments. Schedule filed with Item 1.
Item 7. Disclosure of Proxy Voting Policies and Procedures for Closed-End Management Investment Companies. Not applicable.
Item 8. Portfolio Managers of Closed End Management Investment Companies. Not applicable.
Item 9. Purchases of Equity Securities by Closed-End Management Investment Companies and Affiliated Purchasers. Not applicable.
Item 10. Submission of Matters to a Vote of Security Holders.
The registrant has not adopted procedures by which shareholders may recommend nominees to the registrant’s board of trustees.
Item 11. Controls and Procedures.
(a) The registrant’s president and chief financial officer concluded that the disclosure controls and procedures (as defined in Rule 30a-3(c) under the Investment Company Act of 1940 (the “Act”)) were effective as of a date within 90 days of the filing date of this report, based on the evaluation of these controls and procedures required by Rule 30a-3(b) under the Act.
(b) There were no changes in the registrant’s internal control over financial reporting (as defined in Rule 30a-3(d) under the Act) that occurred during the registrant’s second fiscal quarter of the period covered by this report that have materially affected, or are reasonably likely to materially affect, the registrant’s internal control over financial reporting.
Item 12. Exhibits.
(a)(1) Code of Ethics. Filed herewith.
(a)(2) Certifications pursuant to Section 302 of the Sarbanes-Oxley Act of 2002. Filed herewith.
(a)(3) Not applicable.
(b) Certification pursuant to Section 906 Certification of the Sarbanes-Oxley Act of 2002. Filed herewith.
SIGNATURES
Pursuant to the requirements of the Securities Exchange Act of 1934 and the Investment Company Act of 1940, the registrant has duly caused this report to be signed on its behalf by the undersigned, thereunto duly authorized.
| | By: /s/Ross C. Provence
Ross C. Provence
President
|
Pursuant to the requirements of the Securities Exchange Act of 1934 and the Investment Company Act of 1940, this report has been signed below by the following persons on behalf of the registrant and in the capacities and on the dates indicated.
| | By: /s/Ross C. Provence
Ross C. Provence
President |
| | By: /s/Jeffrey R. Provence
Jeffrey R. Provence
Chief Financial Officer
|