UNITED STATES
SECURITIES AND EXCHANGE COMMISSION
WASHINGTON, D.C. 20549
FORM N-CSR
CERTIFIED SHAREHOLDER REPORT OF REGISTERED MANAGEMENT
INVESTMENT COMPANIES
Investment Company Act file number: 811-09781
PFS Funds
(Exact name of registrant as specified in charter)
| 1939 Friendship Drive. | |
| Suite C | |
| El Cajon, CA | 92020 |
| (Address of principal executive offices) | (Zip code) |
CT Corporation System
155 Federal St., Suite 700,
Boston, MA 02110
(Name and address of agent for service)
Registrant's telephone number, including area code: (619) 588-9700
Date of fiscal year end: March 31
Date of reporting period: March 31, 2016
Form N-CSR is to be used by management investment companies to file reports with the Commission not later than 10 days after the transmission to stockholders of any report that is required to be transmitted to stockholders under Rule 30e-1 under the Investment Company Act of 1940 (17 CFR 270.30e -1). The Commission may use the information provided on Form N-CSR in its regulatory, disclosure review, inspection and policymaking roles.
A registrant is required to disclose the information specified by Form N-CSR, and the Commission will make this information public. A registrant is not required to respond to the collection of information contained in Form N-CSR unless the Form displays a currently valid Office of Management and Budget ("OMB") control number.
Item 1. Reports to Stockholders.
NWM MOMENTUM FUNDANNUAL REPORT
March 31, 2016
TICKER MOMOX
NWM Momentum Fund
Annual Report
March 31, 2016
Dear NWM Momentum Fund Investors,
Your Fund Manager Is An Emotional Investor
I am human. With that comes emotions, and emotional investing, we are told, is no way to manage one’s money. Keep emotions out of the investing equation, and an investor will be okay in the long run!
If investors as a whole could truly do this, investing would be easy. If it is truly easy, there is no need for investment managers like us at Napa Wealth Management. Therefore, everyone must ask themselves this question: “Is it really worth paying someone to do this for me?”
What we as financial advisors do is not rocket science, but for some reason many people have trouble doing it on their own. The main reason people should hire a manager is studies show the average investor makes wrong decisions at the wrong time, based on emotions. Society calls this phenomenon The Lake Wobegon effect:
The Lake Wobegon effect, a natural human tendency to overestimate one’s capabilities, is named after the town. The characterization of the fictional location, where “all the women are strong, all the men are good looking, and all the children are above average,” has been used to describe a real and pervasive human tendency to overestimate one's achievements and capabilities in relation to others. – Wikipedia
Is this effect true in the investing world as well? As you can see below, there is some evidence that may support this idea.
“According to an investing study from Davis Advisors, the average stock-holding mutual fund returned 9.9% annualized from 1991 to 2010, but the average fund owner earned only 3.8% on average per year.”
The data does not get any better through 2011:
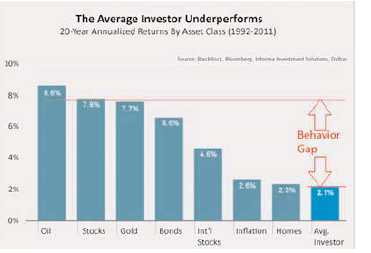
Source: Blackrock, Bloomberg, Informa Investment Solutions, Dalbar
Why do I explain all of this to you? During the past fiscal year (April 1, 2015 – March 31, 2016) the NWM Momentum Fund (the “Fund”) made drastic changes to the allocation, based on the adviser's screening model. The Fund’s exposure to fixed income securities, equity securities, and other asset groups is achieved by the advisers allocation of the Fund’s assets among
2016 Annual Report 1
investment categories based on a “risk on” / “risk off” proprietary screening model (as more fully described in the prospectus). We entered the year in “risk-on” mode and had nearly 100% of the Fund’s assets invested in equity securities; however, very early on in the fiscal year, we changed our posture and went into a “risk-off” mode and spent nearly 75% of the year in “risk-off” mode – we were completely out of equity and invested in different mixes of US Treasuries, bonds, and cash.
Being human, I am always certain that I can beat the market and that I “know” where the market is supposed to go. When we went into “risk-off” mode entering the July 1, 2015 quarter, I was certain the Fund’s model was going to sorely underperform the S&P 500® Index. The S&P 500® Index was within whisper distance of new all-time highs, the talking heads in the financial media were adamant things were rosy and equity securities should continue to march higher, and yet our model was telling us to get out of equity securities and into cash and US Treasuries!
The Fund was positioned completely contrary to the direction Wall Street seemed to be headed. Sitting in bonds when rates were supposed to be rising, and while equity securities were going up relentlessly, just didn’t feel right.
This is where the emotions come in to play.
The human part of us wanted to ignore the signal to rotate Fund’s assets into the cash and US Treasuries, but we are hard-wired to follow the model rules, no matter what. The worst thing we could ever do, the most dangerous mistake we could ever make, would be to over-ride the model…… and be right.
If that ever were to happen, the very next time our instincts told us to override the rules again, we would quickly remember how well it worked out the last time, leaving us invested in something with no historical testing to verify whether we have a positive expectancy. You see, the model with which the Fund operates has been tested back to 2003 through all kinds up and down cycles. Those cycles have included periods of earnings growth and earnings drops. It includes periods of debt ceiling debates, elections, wars, natural disasters, terrorism, etc. The buy and sell signals came and went with no emotion during the test.
What we were not able to test, is what our emotions were like during all of those events dating back to 2003 (the original test date). How were we feeling during the last US Debt Ceiling debacle? Were we scared during the Japan Tsunami? The Indian Ocean Tsunami? Were we bullish or bearish during the flash crash?
Without being able to test what we would have done during those times, we are not able to test whether our emotions would have helped or hindered the signal performance in the back tests. The Davis Advisors studies suggest that our results would have been much worse if we relied upon emotions.
Thankfully, in July of 2015, we didn’t get to rely upon our emotions. When the model said to get out of equity securities and go into cash and US Treasuries, we followed the model. The result was that during that quarter, the S&P 500® Index pulled back over 10%, while the Fund rallied over 7%.
That is a 17% difference we would have missed out on if we were allowed to let our emotions drive the process for investment. That is a difference that is hard to overcome in a time frame that is under 1-2 years. While this is only one example and past performance cannot predict future result, we believe our model that is used by the Fund is an incredibly valuable tool in helping to navigate the murky waters of investing.
Please, the next time you think it is wise to time the Fund by waiting to buy, or maybe selling to buy it back lower, remember this story. The model helped us navigate through the volatile stock market performance from July 1, 2015 through Q1 2016 by being out of equity securities the
2016 Annual Report 2
majority of the time and invested in US Treasuries, bonds, and cash. It did it without emotion. In the end, we are all the better for it this past year.
Year in Review:
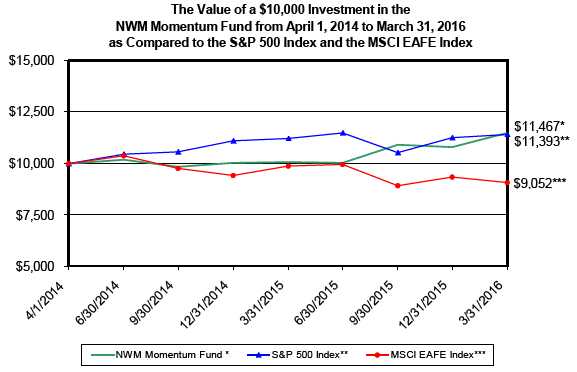
The Fund ended the previous year at $9.94 on March 31, 2015. On March 31, 2016, the Fund closed at $10.38. The Fund also paid a short term-capital gain distribution of $0.90378 and a dividend of $0.0087 to investors on 12/29/2015. During the fiscal year, the total return of the Fund was 14.21% .
Likewise, the S&P 500® Index (total return) ended March 31, 2015 at 3,805.27, and March 31, 2016 at 3,873.11 for a gain of 1.78% . The Fund outperformed the S&P 500® Index by 12.43% for the year.
The main factors for the outperformance of the Fund during this time frame was due to rotations out of equity securities in July 2015, and into US Treasuries, cash, and other fixed income securities for the majority of the next three quarters. This allowed the Fund to sidestep stock market volatility that was seen in August 2015 when the S&P 500® Index dropped over 12% from mid-July 2015 through the end of August 2015. After the S&P 500® Index rallied from the August lows through the end of the year, it began 2016 with a lot of volatility. After ending the calendar 2015 at 3,821.60, the S&P 500® Index hit 3,428.99 on February 11, creating the worst start to a year in the stock market ever. In a matter of weeks, investors that had exposure to the S&P 500® Index saw their portfolios drop over 10%. The talking heads at the time all gave their opinion as to what they thought the reasons were, which ranged, from the Fed raising interest rates too fast, to oil collapsing, junk bonds showing signs of stress, to China’s economy slowing down, plus a myriad of other possible reasons. The Fund did not know or care what the reasons were; it just sat in cash, US Treasuries, and other core US bonds during the volatility. During the ensuing stock market rally from the February 11 lows until the end of the quarter, the Fund saw multiple risk-on signals take place, and began the Fund’s New Year in a risk-on fashion, completely out of US Treasuries and other risk-off investments as determined by the model.
Many are still quite shaken by two very large and very quick drops of over 10% in the stock market in a matter of 6 months. Once again, we do not know if their reasons for concern are valid and with merit, all we know is we need to follow the risk-on signal until the model tells us it is time to exit risk assets and return to the warm confines of US Treasuries, cash and other bonds.
Until then, let’s keep hoping for higher prices!
Tim Ayles
Performance data quoted represents past performance. Past performance does not guarantee future results. The investment return and principal value of an investment will fluctuate so that an investor’s shares, when redeemed, may be worth more or less than their original cost. All returns include change in share prices, and reinvestment of any dividends and capital gains distributions. Current performance may be lower or higher than the performance data quoted. You may obtain performance data current to the most recent month-end by calling 1-888-331-9609. An investment in the fund is subject to investment risks, including the possible loss of the principal amount invested. The Fund’s principal underwriter is Rafferty Capital Markets, LLC.
2016 Annual Report 3
NWM MOMENTUM FUND (Unaudited)
PERFORMANCE INFORMATION
March 31, 2016 NAV $10.38
AVERAGE ANNUALIZED RETURNS (%) AS OF MARCH 31, 2016
| | | | Since | |
| | 1 Year(A) | | Inception(A) | |
| NWM Momentum Fund | 14.21% | | 7.09% | |
| S&P 500® Index (B) | 1.78% | | 6.74% | |
| MSCI® EAFE® Index (C) | -8.27% | | -4.86% | |
Annual Fund Operating Expense Ratio (from 7/31/15 Prospectus): 1.65%
The Annual Fund Operating Expense Ratio reported above will not correlate to the expense ratio in the Fund’s financial highlights because (a) the financial highlights include only the direct operating expenses incurred by the Fund, not the indirect costs of investing in acquired funds and (b) the contractual fees set forth in the Management Agreement changed during the period as discussed in Note 4.
(A)1 Year and Since Inception returns include change in share prices and in each case includes reinvestment of any dividends and capital gain distributions. The NWM Momentum Fund commenced operations on April 1, 2014.
(B)The S&P 500® Index is a widely recognized unmanaged index of equity prices and is representative of a broader market and range of securities than is found in the Fund’s portfolio. The Index is an unmanaged benchmark that assumes reinvestment of all distributions and excludes the effect of taxes and fees. Individuals cannot invest directly in this Index; however, an individual can invest in exchange traded funds or other investment vehicles that attempt to track the performance of a benchmark index.
(C)The MSCI® EAFE® Index (Europe, Australasia, Far East) is a free float-adjusted market capitalization index that is designed to measure the equity market performance of developed markets, excluding the U.S. and Canada. The MSCI EAFE Index consists of the following 21 developed market country indices: Australia, Austria, Belgium, Denmark, Finland, France, Germany, Hong Kong, Ireland, Israel, Italy, Japan, the Netherlands, New Zealand, Norway, Portugal, Singapore, Spain, Sweden, Switzerland, and the United Kingdom.
PAST PERFORMANCE DOES NOT GUARANTEE FUTURE RESULTS. INVESTMENT RETURN AND PRINCIPAL VALUE WILL FLUCTUATE SO THAT SHARES, WHEN REDEEMED, MAY BE WORTH MORE OR LESS THAN THEIR ORIGINAL COST. RETURNS DO NOT REFLECT THE DEDUCTION OF TAXES THAT A SHAREHOLDER WOULD PAY ON FUND DISTRIBUTIONS OR THE REDEMPTION OF FUND SHARES. CURRENT PERFORMANCE MAY BE LOWER OR HIGHER THAN THE PERFORMANCE DATA QUOTED. TO OBTAIN PERFORMANCE DATA CURRENT TO THE MOST RECENT MONTH END, PLEASE CALL 1-888-331-9609. AN INVESTMENT IN THE FUND IS SUBJECT TO INVESTMENT RISKS, INCLUDING THE POSSIBLE LOSS OF THE PRINCIPAL AMOUNT INVESTED. THE FUND'S DISTRIBUTOR IS RAFFERTY CAPITAL MARKETS, LLC.
2016 Annual Report 4
NWM MOMENTUM FUND (Unaudited)
NWM Momentum Fund
by Sectors (as a percentage of Net Assets)
Availability of Quarterly Schedule of Investments
The Fund files its complete schedule of portfolio holdings with the Securities and Exchange Commission (“SEC”) for the first and third quarters of each fiscal year on Form N-Q. The Fund’s Form N-Q is available on the SEC’s Web site at http://www.sec.gov. The Fund’s Form N-Q may also be reviewed and copied at the SEC’s Public Reference Room in Washington, DC. Information on the operation of the Public Reference Room may be obtained by calling 1-800-SEC-0330.
Proxy Voting Guidelines
NWM Fund Group, LLC, the Fund’s investment adviser (“Adviser”), is responsible for exercising the voting rights associated with the securities held by the Fund. A description of the policies and procedures used by the Adviser in fulfilling this responsibility is available without charge on the Fund’s website at www.nwmfund.com. It is also included in the Fund’s Statement of Additional Information, which is available on the SEC’s website at http://www.sec.gov.
Information regarding how the Fund voted proxies, Form N-PX, relating to portfolio securities during the most recent period ended June 30th, is available without charge, upon request, by calling our toll free number (1-888-331-9609). This information is also available on the SEC’s website at http://www.sec.gov.
2016 Annual Report 5
Expense Example
(Unaudited)
Shareholders of this Fund incur ongoing costs consisting of management fees and service fees. Although the Fund charges no sales loads or transaction fees, you will be assessed fees for outgoing wire transfers, returned checks and stop payment orders at prevailing rates charged by Mutual Shareholder Services, LLC, the Fund’s transfer agent. IRA accounts will be charged an $8.00 annual maintenance fee. If shares are redeemed within 90 days of purchase from the Fund, the shares are subject to a 2% redemption fee. Additionally, your account will be indirectly subject to the expenses of the underlying funds. The following example is intended to help you understand your ongoing costs of investing in the Fund and to compare these costs with similar costs of investing in other mutual funds. The example is based on an investment of $1,000 invested in the Fund on October 1, 2015 and held through March 31, 2016.
The first line of the table below provides information about actual account values and actual expenses. In order to estimate the expenses a shareholder paid during the period covered by this report, shareholders can divide their account value by $1,000 (for example, an $8,600 account value divided by $1,000 = 8.6) and then multiply the result by the number in the first line under the heading entitled “Expenses Paid During the Period.”
The second line of the table below provides information about hypothetical account values and hypothetical expenses based on the Fund’s actual expense ratio and an assumed rate of return of 5% per year before expenses, which is not the Fund’s actual return. The hypothetical account values and expenses may not be used to estimate the actual ending account balance or expenses paid by a shareholder for the period. Shareholders may use this information to compare the ongoing costs of investing in this Fund and other funds. To do so, compare this 5% hypothetical example with the 5% hypothetical examples that appear in other funds’ shareholder reports.
Please note that the expenses shown in the table are meant to highlight your ongoing costs only and do not reflect any transactional costs, such as redemption fees or the charges assessed by Mutual Shareholder Services, LLC as described above and expenses of underlying funds. Therefore, the second line of the table is useful in comparing ongoing costs only, and will not help you determine the relative total costs of owning different funds. In addition, if these transactional costs were included, your costs would have been higher.
| | | | | | | Expenses Paid |
| | | Beginning | | Ending | | During the Period* |
| | | Account Value | | Account Value | | October 1, 2015 |
| | | October 1, 2015 | | March 31, 2016 | | to March 31, 2016 |
| |
| Actual | | $1,000.00 | | $1,053.10 | | $7.65 |
| |
| Hypothetical | | $1,000.00 | | $1,017.55 | | $7.52 |
| (5% annual return | | | | | | |
| before expenses) | | | | | | |
* Expenses are equal to the Fund’s annualized expense ratio of 1.49%, multiplied
by the average account value over the period, multiplied by 183/366 (to reflect
the one-half year period). |
2016 Annual Report 6
| NWM Momentum Fund |
| | | | Schedule of Investments |
| | | | March 31, 2016 |
| Shares | | Fair Value | | % of Net Assets |
| EXCHANGE TRADED FUNDS | | | | | |
| 90,902 | iShares Core U.S. Aggregate Bond ETF * | $ | 10,074,214 | | | |
| 77,017 | iShares 20+ Year Treasury Bond ETF * | | 10,059,191 | | | |
| 131,359 | iShares 7-10 Year Treasury Bond ETF * | | 14,494,152 | | | |
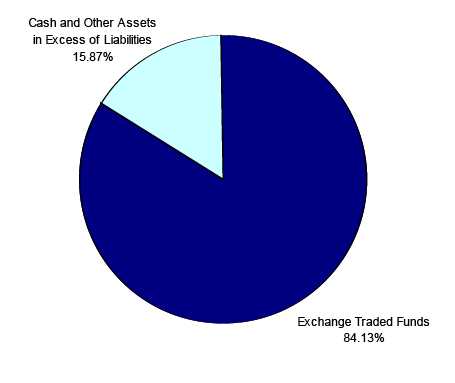
| Total for Exchange Traded Funds (Cost - $34,270,418) | | 34,627,557 | | 84.13 | % |
| Other Assets in Excess of Liabilities | | 6,532,817 | | 15.87 | % |
| Net Assets | | $ | 41,160,374 | | 100.00 | % |
* Additional Information, including current Prospectuses and Annual Reports,
is available at: https://www.ishares.com/us/library/financial-legal-tax. |
The accompanying notes are an integral part of these
financial statements. |
2016 Annual Report 7
| NWM Momentum Fund | | | |
| |
| Statement of Assets and Liabilities | | | |
| March 31, 2016 | | | |
| |
| Assets: | | | |
| Investment Securities at Fair Value | $ | 34,627,557 | |
| (Cost $34,270,418) | | | |
| Cash | | 6,581,934 | |
| Total Assets | | 41,209,491 | |
| Liabilities: | | | |
| Management Fees Payable | | 32,639 | |
| Service Fees Payable | | 16,478 | |
| Total Liabilities | | 49,117 | |
| Net Assets | $ | 41,160,374 | |
| |
| Net Assets Consist of: | | | |
| Paid In Capital | $ | 39,177,346 | |
| Accumulated Net Investment Income/(Loss) | | (28,857 | ) |
| Accumulated Undistributed Realized Gain/(Loss) on Investments - Net | | 1,654,746 | |
| Unrealized Appreciation/(Depreciation) in Value of Investments | | | |
| Based on Identified Cost - Net | | 357,139 | |
| Net Assets, for 3,963,639 Shares Outstanding | $ | 41,160,374 | |
| (Unlimited shares authorized) | | | |
| Net Asset Value and Offering Price Per Share | | | |
| ($41,160,374/3,963,639 shares) | $ | 10.38 | |
| Redemption Price * ($10.38 x 0.98) (Note 2) | $ | 10.17 | |
| |
| Statement of Operations | | | |
| For the fiscal year ended March 31, 2016 | | | |
| |
| Investment Income: | | | |
| Dividends | $ | 562,693 | |
| Interest | | 5 | |
| Total Investment Income | | 562,698 | |
| Expenses: | | | |
| Management Fees (Note 4) | | 381,078 | |
| Service Fees (Note 4) | | 178,151 | |
| Total Expenses | | 559,229 | |
| |
| Net Investment Income/(Loss) | | 3,469 | |
| |
| Realized and Unrealized Gain/(Loss) on Investments: | | | |
| Realized Gain/(Loss) on Investments | | 4,604,584 | |
| Net Change in Unrealized Appreciation/(Depreciation) on Investments | | 98,602 | |
| Net Realized and Unrealized Gain/(Loss) on Investments | | 4,703,186 | |
| |
| Net Increase/(Decrease) in Net Assets from Operations | $ | 4,706,655 | |
| * Reflects a 2% redemption fee if shares are redeemed within 90 days of purchase. |
The accompanying notes are an integral part of these
financial statements. |
2016 Annual Report 8
| NWM Momentum Fund | | | | | | | |
| |
| Statements of Changes in Net Assets | | | | | | | |
| | | 4/1/2015 | | | | 4/1/2014* | |
| | | to | | | | to | |
| | | 3/31/2016 | | | | 3/31/2015 | |
| From Operations: | | | | | | | |
| Net Investment Income/(Loss) | $ | 3,469 | | | $ | 362,069 | |
| Net Realized Gain/(Loss) on Investments | | 4,604,584 | | | | (182,898 | ) |
| Change in Net Unrealized Appreciation/(Depreciation) | | 98,602 | | | | 258,537 | |
| Increase/(Decrease) in Net Assets from Operations | | 4,706,655 | | | | 437,708 | |
| From Distributions to Shareholders: | | | | | | | |
| Net Investment Income | | (26,635 | ) | | | (367,760 | ) |
| Net Realized Gain from Security Transactions | | (2,766,940 | ) | | | - | |
| Change in Net Assets from Distributions | | (2,793,575 | ) | | | (367,760 | ) |
| From Capital Share Transactions: | | | | | | | |
| Proceeds From Sale of Shares | | 20,983,834 | | | | 37,394,245 | |
| Proceeds From Redemption Fees (Note 2) | | 12,158 | | | | - | |
| Shares Issued on Reinvestment of Dividends | | 2,793,575 | | | | 367,760 | |
| Cost of Shares Redeemed | | (17,339,531 | ) | | | (5,034,695 | ) |
| Net Increase/(Decrease) from Shareholder Activity | | 6,450,036 | | | | 32,727,310 | |
| Net Increase/(Decrease) in Net Assets | | 8,363,116 | | | | 32,797,258 | |
| Net Assets at Beginning of Period | | 32,797,258 | | | | - | |
| Net Assets at End of Period (Including Accumulated Net Investment | | | | | | | |
| Income/(Loss) of ($28,857) and ($5,691)) | $ | 41,160,374 | | | $ | 32,797,258 | |
| Share Transactions: | | | | | | | |
| Issued | | 2,035,040 | | | | 3,765,962 | |
| Reinvested | | 286,814 | | | | 37,072 | |
| Redeemed | | (1,656,606 | ) | | | (504,643 | ) |
| Net Increase in Shares | | 665,248 | | | | 3,298,391 | |
| Shares Outstanding Beginning of Period | | 3,298,391 | | | | - | |
| Shares Outstanding End of Period | | 3,963,639 | | | | 3,298,391 | |
| |
| Financial Highlights | | | | | | | |
| Selected data for a share outstanding throughout the period: | | 4/1/2015 | | | | 4/1/2014* | |
| | | to | | | | to | |
| | | 3/31/2016 | | | | 3/31/2015 | |
| Net Asset Value - | | | | | | | |
| Beginning of Period | $ | 9.94 | | | $ | 10.00 | |
| Net Investment Income/(Loss) (a) (e) | | - | | + | | 0.11 | |
| Net Gain/(Loss) on Securities (b) | | | | | | | |
| (Realized and Unrealized) | | 1.35 | | | | (0.07 | ) |
| Total from Investment Operations | | 1.35 | | | | 0.04 | |
| Distributions (From Net Investment Income) | | (0.01 | ) | | | (0.10 | ) |
| Distributions (From Realized Capital Gains) | | (0.90 | ) | | | - | |
| Total Distributions | | (0.91 | ) | | | (0.10 | ) |
| Proceeds from Redemption Fee (Note 2) | | - | | + | | - | |
| Net Asset Value - | | | | | | | |
| End of Period | $ | 10.38 | | | $ | 9.94 | |
| Total Return (c) | | 14.21% | | | | 0.40% | |
| Ratios/Supplemental Data | | | | | | | |
| Net Assets - End of Period (Thousands) | $ | 41,160 | | | $ | 32,797 | |
| Ratio of Expenses to Average Net Assets (d) | | 1.57% | | | | 1.75% | |
| Ratio of Net Investment Income/(Loss) to Average Net Assets (d) (e) | | 0.01% | | | | 1.14% | |
| Portfolio Turnover Rate | | 1301.72% | | | | 1153.56% | |
* Commencement of Operations.
+ Amount calculated is less than $0.005.
(a) Per share amounts were calculated using the average shares method.
(b) Realized and unrealized gains and losses per share in this caption are balancing amounts necessary to
reconcile the change in net asset value for the period and may not reconcile with the aggregate gains and
losses in the Statement of Operations due to share transactions for the period.
(c) Total return in the above table represents the rate that the investor would have earned or lost on an
investment in the Fund assuming reinvestment of dividends and distributions.
(d) These ratios exclude the impact of expenses of the underlying security holdings listed in the Schedule
of Investments.
(e) Recognition of net investment income/(loss) by the Fund is affected by the timing of the declaration of dividends
by the underlying security holdings listed on the Schedule of Investments. |
The accompanying notes are an integral part of these
financial statements. |
2016 Annual Report 9
NOTES TO THE FINANCIAL STATEMENTS
NWM MOMENTUM FUND
March 31, 2016
1.) ORGANIZATION
NWM Momentum Fund (the “Fund”) was organized as a non-diversified series of the PFS Funds (the “Trust”) on March 5, 2014. The Trust was established under the laws of Massachusetts by an Agreement and Declaration of Trust dated January 13, 2000. Prior to March 5, 2010, the Trust was named Wireless Fund. The Trust is registered as an open-end investment company under the Investment Company Act of 1940, as amended (the “1940 Act”). The Trust may offer an unlimited number of shares of beneficial interest in a number of separate series, each series representing a distinct fund with its own investment objectives and policies. As of March 31, 2016, there were ten series authorized by the Trust. The Fund commenced operations on April 1, 2014. The Fund’s investment objective is to seek long-term capital appreciation. The investment adviser to the Fund is NWM Fund Group, LLC (the “Adviser”). Significant accounting policies of the Fund are presented below:
2.) SIGNIFICANT ACCOUNTING POLICIES
SECURITY VALUATION
The Fund is an investment company and accordingly follows the investment company accounting and reporting guidance of the Financial Accounting Standards Board (“FASB”) Accounting Standards Codification Topic 946 Financial Services - Investment Companies. All investments in securities are recorded at their estimated fair value, as described in Note 3.
SHARE VALUATION
The net asset value (the “NAV”) is generally calculated as of the close of trading on the New York Stock Exchange (normally 4:00 p.m. Eastern time) every day the Exchange is open. The NAV is calculated by taking the total value of the Fund’s assets, subtracting its liabilities, and then dividing by the total number of shares outstanding, rounded to the nearest cent. The offering price and redemption price per share is equal to the net asset value per share, except that shares of the Fund are subject to a redemption fee of 2% if redeemed within 90 days of purchase. During the fiscal year ended March 31, 2016, proceeds from redemption fees were $12,158.
FEDERAL INCOME TAXES
The Fund’s policy is to continue to comply with the requirements of the Internal Revenue Code that are applicable to regulated investment companies and to distribute all of its taxable income to shareholders. Therefore, no federal income tax provision is required. It is the Fund’s policy to distribute annually, prior to the end of the calendar year, dividends sufficient to satisfy excise tax requirements of the Internal Revenue Code. This Internal Revenue Code requirement may cause an excess of distributions over the book year-end accumulated income. In addition, it is the Fund’s policy to distribute annually, after the end of the fiscal year, any remaining net investment income and net realized capital gains.
The Fund recognizes the tax benefits of certain tax positions only where the position is “more likely than not” to be sustained assuming examination by tax authorities. Management has analyzed the Fund’s tax positions, and has concluded that no liability for unrecognized tax benefits should be recorded related to uncertain tax positions taken on returns filed for open tax years (2014), or expected to be taken in the Fund’s 2015 tax returns. The Fund identifies its major tax jurisdictions as U.S. Federal tax authorities; however, the Fund is not aware of any tax positions for which it is reasonably possible that the total amounts of unrecognized tax benefits will change materially in the next twelve months. The Fund recognizes interest and penalties, if any, related to unrecognized tax benefits as income tax expense in the Statement of Operations. During the fiscal year ended March 31, 2016, the Fund did not incur any interest or penalties.
DISTRIBUTIONS TO SHAREHOLDERS
Distributions to shareholders, which are determined in accordance with income tax regulations, are recorded on the ex-dividend date.
The treatment for financial reporting purposes of distributions made to shareholders during the year from net investment income or net realized capital gains may differ from their ultimate treatment for federal income tax purposes. These differences are caused primarily by differences in the timing of the recognition of certain components of income, expense, or realized capital gain for federal income tax purposes. Where such differences are permanent in nature, they are reclassified in the components of the net assets based on their ultimate characterization for feder-
2016 Annual Report 10
Notes to the Financial Statements - continued
al income tax purposes. Any such reclassifications will have no effect on net assets, result of operations, or net asset value per share of the Fund.
USE OF ESTIMATES
The preparation of financial statements in conformity with accounting principles generally accepted in the United States (“GAAP”) requires management to make estimates and assumptions that affect the reported amounts of assets and liabilities and disclosure of contingent assets and liabilities at the date of the financial statements and the reported amounts of increases and decreases in net assets from operations during the reporting period. Actual results could differ from those estimates.
EXPENSES
Expenses incurred by the Trust that do not relate to a specific fund of the Trust are allocated to the individual funds based on each fund’s relative net assets or another appropriate basis.
OTHER
The Fund records security transactions based on a trade date. Dividend income is recognized on the ex-dividend date, and interest income is recognized on an accrual basis. The Fund uses the specific identification method in computing gain or loss on the sale of investment securities. Discounts and premiums on securities purchased are accreted and amortized over the lives of the respective securities. Withholding taxes on foreign dividends have been provided for in accordance with the Fund’s understanding of the applicable country’s tax rules and rates.
3.) INVESTMENT SECURITIES VALUATION
The Fund utilizes various methods to measure the fair value of most of its investments on a recurring basis. GAAP establishes a hierarchy that prioritizes inputs to valuation methods. The three levels of inputs are:
Level 1 - Unadjusted quoted prices in active markets for identical assets or liabilities that the Fund has the ability to access.
Level 2 - Inputs other than quoted prices included in level 1 that are observable for the asset or liability, either directly or indirectly. These inputs may include quoted prices for the identical instrument on an inactive market, prices for similar instruments, interest rates, prepayment speeds, credit risk, yield curves, default rates and similar data.
Level 3 - Unobservable inputs for the asset or liability, to the extent relevant observable inputs are not available, representing the Fund’s own assumptions about the assumptions a market participant would use in valuing the asset or liability, and would be based on the best information available.
The availability of observable inputs can vary from security to security and is affected by a wide variety of factors, including, for example, the type of security, whether the security is new and not yet established in the marketplace, the liquidity of markets, and other characteristics particular to the security. To the extent that valuation is based on models or inputs that are less observable or unobservable in the market, the determination of fair value requires more judgment. Accordingly, the degree of judgment exercised in determining fair value is greatest for instruments categorized in level 3.
The inputs used to measure fair value may fall into different levels of the fair value hierarchy. In such cases, for disclosure purposes, the level in the fair value hierarchy within which the fair value measurement falls in its entirety, is determined based on the lowest level input that is significant to the fair value measurement in its entirety.
FAIR VALUE MEASUREMENTS
A description of the valuation techniques applied to the Fund’s major categories of assets measured at fair value on a recurring basis follows: Equity securities (exchange traded funds). Equity securities generally are valued by using market quotations, but may be valued on the basis of prices furnished by a pricing service when the Adviser believes such prices accurately reflect the fair market value of such securities. Securities that are traded on any stock exchange or on the NASDAQ over-the-counter market are generally valued by the pricing service at the last quoted sale price. Lacking a last sale price, an equity security is generally valued by the pricing service at its last bid price. Generally, if the security is
2016 Annual Report 11
Notes to the Financial Statements - continued
traded in an active market and is valued at the last sale price, the security is categorized as a level 1 security. When market quotations are not readily available, when the Adviser determines that the market quotation or the price provided by the pricing service does not accurately reflect the current market value, or when restricted securities are being valued, such securities are valued as determined in good faith by the Adviser, subject to review of the Board of Trustees (the “Trustees” or the “Board”) and are categorized in level 2 or level 3, when appropriate.
In accordance with the Trust’s good faith pricing guidelines, the Adviser is required to consider all appropriate factors relevant to the value of securities for which it has determined other pricing sources are not available or reliable as described above. There is no single standard for determining fair value, since fair value depends upon the circumstances of each individual case. As a general principle, the current fair value of an issue of securities being valued by the Adviser would appear to be the amount which the owner might reasonably expect to receive for them upon their current sale. Methods which are in accordance with this principle may, for example, be based on (i) a multiple of earnings; (ii) a discount from market of a similar freely traded security (including a derivative security or a basket of securities traded on other markets, exchanges or among dealers); or (iii) yield to maturity with respect to debt issues, or a combination of these and other methods.
The following table summarizes the inputs used to value the Fund’s assets measured at fair value as of March 31, 2016:
| Valuation Inputs of Assets | | Level 1 | | Level 2 | | Level 3 | | Total |
| Exchange Traded Funds | | $34,627,557 | | $0 | | $0 | | $34,627,557 |
| Total | | $34,627,557 | | $0 | | $0 | | $34,627,557 |
The Fund did not hold any Level 3 assets during the fiscal year ended March 31, 2016. There were no transfers into or out of level 1 and level 2 during the fiscal year ended March 31, 2016. It is the Fund’s policy to consider transfers into or out of level 1 and level 2 as of the end of the reporting period.
The Fund did not invest in derivative instruments during the fiscal year ended March 31, 2016.
4.) INVESTMENT ADVISORY AGREEMENT AND SERVICES AGREEMENT
The Fund has entered into an investment advisory agreement (“Management Agreement”) with the Adviser. The Adviser manages the investment portfolio of the Fund, subject to policies adopted by the Trust’s Board of Trustees, and, at its own expense and without reimbursement from the Trust, furnishes office space and all necessary office facilities, equipment and executive personnel necessary for managing the Fund. At a meeting held on June 10, 2015 the Adviser proposed and the Board agreed to reduce the fee. Effective July 31, 2015, the Adviser receives an investment management fee equal to 0.99% of the Fund’s average daily net assets up to $200 million and 0.90% of the Fund’s average daily net assets in excess of $200 million. Prior to July 31, 2015, the Adviser received an investment management fee equal to 1.25% of the Fund’s average daily net assets up to $100 million, 1.10% of the Fund’s average daily net assets between $100 million and $150 million, 1.00% of the Fund’s average daily net assets between $150 million and $200 million and 0.90% of the Fund’s average daily net assets in excess of $200 million.
Under the terms of the Services Agreement between the Trust and the Adviser (the “Services Agreement”), the Adviser renders administrative and supervisory services to the Fund, provides the services of a chief compliance officer and assumes and pays all ordinary expenses of the Fund, excluding management fees, brokerage fees and commissions, 12b-1 fees (if adopted), taxes, borrowing costs (such as (a) interest and (b) dividend expenses on securities sold short), ADR fees, fees and expenses of acquired funds, and extraordinary or non-recurring expenses. For its services, the Adviser receives a service fee equal to 0.50% of the average daily net assets of the Fund.
For the fiscal year ended March 31, 2016, the Adviser earned management fees totaling $381,078, of which $32,639 was due to the Adviser at March 31, 2016. For the same period, the Adviser earned service fees of $178,151, of which $16,478 was due to the Adviser at March 31, 2016.
5.) RELATED PARTY TRANSACTIONS
Jeffrey R. Provence of Premier Fund Solutions, Inc. (the “Administrator”) also serves as trustee/officer of the Fund. This individual receives benefits from the Administrator resulting from administration fees paid to the Administrator of the Fund by the Adviser.
2016 Annual Report 12
Notes to the Financial Statements - continued
For the fiscal year ended March 31, 2016, the Trustees who are not interested persons of the Fund received Trustees’ fees of $1,500 each, for a total of $4,500, plus travel expenses from the Adviser of the Fund. Under the Management Agreement, the Adviser pays these fees.
6.) CAPITAL SHARES
The Trust is authorized to issue an unlimited number of shares. Paid in capital at March 31, 2016 was $39,177,346, representing 3,963,639 shares outstanding.
7.) PURCHASES AND SALES OF SECURITIES
For the fiscal year ended March 31, 2016, purchases and sales of investment securities other than U.S. Government obligations and short-term investments aggregated $414,477,642 and $416,787,956, respectively. Purchases and sales of U.S. Government obligations aggregated $0 and $0, respectively.
8.) CONTROL OWNERSHIP
The beneficial ownership, either directly or indirectly, of more than 25% of the voting securities of a fund creates a presumption of control of the Fund, under Section 2(a)(9) of the Investment Company Act of 1940. As of March 31, 2016, TD Ameritrade Inc., for the benefit of its customers, held, in aggregate, 99.05% of the shares in the Fund. The Trust does not know whether the foregoing entity or any of the underlying beneficial holders owned or controlled 25% or more of the voting securities of the Fund.
9.) TAX MATTERS
For Federal income tax purposes, the cost of securities owned at March 31, 2016 was $34,270,418.
At March 31, 2016, the composition of gross unrealized appreciation (the excess of value over tax cost) and depreciation (the excess of tax cost over value) of investments on a tax basis was as follows:
| | Appreciation | | (Depreciation) | | Net Appreciation/(Depreciation) |
| | $357,139 | | $0 | | $357,139 |
The tax character of distributions was as follows:
| | | Fiscal Year Ended | | Fiscal Year Ended |
| | | March 31, 2016 | | March 31, 2015 |
| Ordinary Income: | | $ 26,635 | | $ 367,760 |
| Short-term Capital Gain: | | 2,766,940 | | 0 |
| Long-term Capital Gain: | | 0 | | 0 |
| | | $ 2,793,575 | | $ 367,760 |
As of March 31, 2016, the components of distributable earnings/(accumulated losses) on a tax basis were as follows:
| Late year ordinary losses | | $ (38,342 | ) |
| Undistributed ordinary income/(accumulated losses) | | 1,664,231 | |
| Unrealized appreciation/(depreciation) | | 357,139 | |
| | | $ 1,983,028 | |
As of March 31, 2016, differences between book and tax basis primarily consisted of the deferral of wash sales and late-year ordinary losses. Deferred late year ordinary losses totaled $38,342.
During the fiscal year ended March 31, 2016, the Fund utilized available capital loss carryfor-wards of $114,668. As of March 31, 2016, there are no remaining capital loss carryforwards available to be utilized by the Fund.
10.) SUBSEQUENT EVENTS
Subsequent events after the date of the Statement of Assets and Liabilities have been evaluated through the date the financial statements were issued. Management has concluded that there is no impact requiring adjustment or disclosure in the financial statements.
2016 Annual Report 13
ADDITIONAL INFORMATION
NWM MOMENTUM FUND
March 31, 2016
(UNAUDITED)
APPROVAL OF THE CONTINUATION OF THE MANAGEMENT AGREEMENT
On March 4, 2016 the Board of Trustees (the “Board” or “Trustees”) for the NWM Momentum Fund met to consider the renewal of the Management Agreement (the “Management Agreement”). In approving the Management Agreement, the Board of Trustees considered and evaluated the following factors: (i) the nature, extent and quality of the services provided by NWM Fund Group, LLC (“NWM”) to the NWM Momentum Fund; (ii) the investment performance of the NWM Momentum Fund; (iii) the cost of the services to be provided and the profits to be realized by NWM and its affiliates from the relationship with the NWM Momentum Fund; (iv) the extent to which economies of scale will be realized as the NWM Momentum Fund grows and whether the fee levels reflect these economies of scale to the benefit of shareholders; and (v) NWM’s practices regarding possible conflicts of interest.
In assessing these factors and reaching its decisions, the Board took into consideration information furnished for the Board’s review and consideration throughout the year at regular Board meetings, as well as information specifically prepared and/or presented in connection with the annual renewal process, including information presented at the Meeting, including the presentation by management of NWM earlier in the Meeting. The Board requested and was provided with information and reports relevant to the annual renewal of the Management Agreement, including: (i) information regarding the services and support provided to the NWM Momentum Fund and its shareholders by NWM; (ii) assessments of the investment performance of the NWM Momentum Fund by NWM; (iii) commentary on the reasons for the performance; (iv) presentations addressing NWM’s investment philosophy, investment strategy, personnel and operations; (v) compliance and audit reports concerning the NWM Momentum Fund and NWM; (vi) disclosure information contained in the registration statement of the NWM Momentum Fund and the Form ADV of NWM; (vii) information on relevant developments in the mutual fund industry and how the NWM Momentum Fund and/or NWM are responding to them; and (viii) a memorandum from Counsel that summarized the fiduciary duties and responsibilities of the Board in reviewing and approving the Management Agreement, including the material factors set forth above and the types of information included in each factor that should be considered by the Board in order to make an informed decision. The Board also requested and received various informational materials including, without limitation: (i) documents containing information about NWM, including financial information, a description of personnel and the services provided to the NWM Momentum Fund, information on investment advice, performance, summaries of NWM Momentum Fund expenses, compliance program, current legal matters, and other general information; (ii) comparative expense and performance information for other mutual funds with strategies similar to the NWM Momentum Fund; and (iii) benefits to be realized by NWM from its relationship with the NWM Momentum Fund. The Board did not identify any particular information that was most relevant to its consideration to approve the Management Agreement and each Trustee may have afforded different weight to the various factors.
In deciding whether to approve the Management Agreement, the Trustees considered numerous factors, including:
1. The nature, extent, and quality of the services to be provided by NWM.
In this regard, the Board considered the responsibilities of NWM under the Management Agreement. The Board reviewed the services to be provided by NWM to the NWM Momentum Fund including, without limitation, the procedures for formulating investment recommendations and assuring compliance with the NWM Momentum Fund’s investment objectives and limitations; the efforts of NWM during the NWM Momentum Fund’s start-up phase, its coordination of services for the NWM Momentum Fund among the service providers, and the efforts of NWM to promote the NWM Momentum Fund and grow assets. The Board considered: NWM’s staffing, personnel, and methods of operating; the education and experience of its personnel; and its compliance programs, policies, and procedures. After reviewing the foregoing and further information from NWM, the Board concluded that the quality, extent, and nature of the services provided by NWM was satisfactory and adequate for the NWM Momentum Fund.
2. Investment Performance of the NWM Momentum Fund and NWM.
In considering the investment performance of the NWM Momentum Fund and NWM, the Trustees compared the short and long-term performance of the NWM Momentum Fund with the performance of funds with similar objectives managed by other investment advisers, as well as with aggregated peer group data and category averages. As to the performance of the NWM Momentum Fund, the Report included information regarding the performance of the NWM Momentum Fund compared to a group of funds of similar size, style and objective, categorized by Morningstar (the “Peer Group”). Although not the determining factor in the Trustees’ considerations, this information assisted the Trustees in concluding to approve the Management Agreement
2016 Annual Report 14
Additional Information (Unaudited) - continued
by a measure of how the NWM Momentum Fund compares to other similar products. Generally, the performance data from the Peer Group was for periods ending December 31, 2015. The Trustees noted that for the 1-year period, the NWM Momentum Fund outperformed its Peer Group Average, the Tactical Allocation Category, as well as the S&P 500 Index. The Trustees noted that neither the Adviser nor its affiliate managed other investment accounts with similar strategies as the NWM Momentum Fund. Notwithstanding the foregoing, after discussing the investment performance of the NWM Momentum Fund further, NWM’s experience managing and providing services to the NWM Momentum Fund, and other relevant factors, the Board concluded, in light of all the facts and circumstances, that the investment performance of the NWM Momentum Fund and NWM was satisfactory.
3. The Costs of the services to be provided and the profits to be realized by NWM from the relationship with the NWM Momentum Fund.
In this regard, the Board considered: the financial condition of NWM and its affiliate and the level of commitment to the NWM Momentum Fund by NWM’s principals; the projected asset levels of the NWM Momentum Fund; and the overall expenses of the NWM Momentum Fund, including the expected nature and frequency of advisory fee payments. The Board also considered potential benefits for NWM in managing the NWM Momentum Fund. The Board compared the fees and expenses of the NWM Momentum Fund (including the advisory fee) to other funds comparable to it in terms of the type of fund, the style of investment management, the anticipated size of fund and the nature of the investment strategy and markets invested in, among other factors. The Board noted that the advisory fee payable to NWM under the Management Agreement was on the higher-range of the peer group, but the overall expense ratio was below the peer group average. The Board also determined that these advisory fees were within an acceptable range in light of the services rendered by NWM. In light of the obligation of NWM to assume most of the operational expenses of the NWM Momentum Fund pursuant to a services agreement, the Board also determined that the overall fee arrangements for NWM with respect to the NWM Momentum Fund were fair and reasonable. The Trustees noted that NWM was profitable with regard to the NWM Momentum Fund. The Trustees reflected on their discussion with representatives of NWM during the Meeting in regard to the computation of their profitability analysis. Following this comparison and upon further consideration and discussion of the foregoing, the Board concluded that the fees to be paid to NWM were fair and reasonable.
4. The extent to which economies of scale would be realized as the NWM Momentum Fund grows and whether advisory fee levels reflect these economies of scale for the benefit of the NWM Momentum Fund’s investors.
In this regard, the Board considered the NWM Momentum Fund’s fee arrangements with NWM. The Board noted that the advisory fee would stay the same as asset levels increased, although it noted that under a Services Agreement, NWM was obligated to pay certain of the NWM Momentum Fund’s operating expenses which had the effect of limiting the overall fees paid by the NWM Momentum Fund. The Board noted that in July 2015, the Adviser had voluntarily agreed to reduce its advisory fee. Following further discussion of the NWM Momentum Fund’s asset levels, expectations for growth, and levels of fees, the Board determined that the NWM Momentum Fund’s fee arrangement with NWM was fair and reasonable and reasonable in relation to the nature and quality of the services to be provided by NWM.
5. Possible conflicts of interest and benefits to NWM.
In evaluating the possibility for conflicts of interest, the Board considered such matters as: the experience and ability of the advisory personnel assigned to the NWM Momentum Fund; the basis of decisions to buy or sell securities for the NWM Momentum Fund; the method for bunching of portfolio securities transactions; the substance and administration of NWM’s Code of Ethics and other relevant policies described in NWM’s Form ADV. Following further consideration and discussion, the Board indicated that NWM’s standards and practices relating to the identification and mitigation of potential conflicts of interest were satisfactory. The Trustees noted that NWM will only manage the NWM Momentum Fund, but that its affiliated advisory firm may benefit from being able to direct smaller accounts to the NWM Momentum Fund. It was noted that NWM does not utilize soft dollars.
The Independent Trustees met in executive session to discuss the continuation of the Management Agreement. It was the Trustees’ consensus that the fee to be paid to NWM Fund Group, LLC pursuant to the Management Agreement was reasonable, that the overall arrangement provided under the terms of the Management Agreement was a reasonable business arrangement, and that the renewal of the Management Agreement was in the best interest of the Fund’s shareholders.
2016 Annual Report 15
REPORT OF INDEPENDENT REGISTERED PUBLIC ACCOUNTING FIRM
To the Shareholders of NWM Momentum Fund
and Board of Trustees of PFS Funds
We have audited the accompanying statement of assets and liabilities, including the schedule of investments, of NWM Momentum Fund (the “Fund”), a series of PFS Funds, as of March 31, 2016, and the related statement of operations for the year then ended and the statements of changes in net assets and financial highlights for each of the two periods in the period then ended. These financial statements and financial highlights are the responsibility of the Fund's management. Our responsibility is to express an opinion on these financial statements and financial highlights based on our audits.
We conducted our audits in accordance with the standards of the Public Company Accounting Oversight Board (United States). Those standards require that we plan and perform the audit to obtain reasonable assurance about whether the financial statements and financial highlights are free of material misstatement. An audit includes examining, on a test basis, evidence supporting the amounts and disclosures in the financial statements. Our procedures included confirmation of securities owned as of March 31, 2016, by correspondence with the custodian. An audit also includes assessing the accounting principles used and significant estimates made by management, as well as evaluating the overall financial statement presentation. We believe that our audits provide a reasonable basis for our opinion.
In our opinion, the financial statements and financial highlights referred to above present fairly, in all material respects, the financial position of NWM Momentum Fund as of March 31, 2016, the results of its operations for the year then ended and the changes in its net assets and financial highlights for each of the two periods in the period then ended, in conformity with accounting principles generally accepted in the United States of America.

COHEN FUND AUDIT SERVICES, LTD.
Cleveland, Ohio
May 25, 2016
2016 Annual Report 16
Trustees and Officers
(Unaudited)
The Board of Trustees supervises the business activities of the Trust. The names of the Trustees and executive officers of the Trust are shown below. For more information regarding the Trustees, please refer to the Statement of Additional Information, which is available upon request by calling 1-888-331-9609. Each Trustee serves until the Trustee sooner dies, resigns, retires, or is removed.
The Trustees and Officers of the Trust and their principal business activities during the past five years are:
Interested Trustees and Officers
| | | | | Number of | |
| | | | Principal | Portfolios In | Other |
| Name, | Position(s) | Term of Office | Occupation(s) | Fund | Directorships |
| Address(1), | Held With | and Length of | During | Complex | Held By |
| and Year of Birth | the Trust | Time Served | Past 5 Years | Overseen By | Trustee |
| | | | | Trustee | |
| |
| Ross C. Provence, | President | Indefinite Term; | General Partner and Portfolio | N/A | N/A |
| Year of Birth: 1938 | | Since 2000 | Manager for Value Trend Capital | | |
| | | | Management, LP (1995 to current). | | |
| | | | Estate planning attorney (1963 to | | |
| current). |
| |
| Jeffrey R. Provence(2), | Trustee, | Indefinite Term; | CEO, Premier Fund Solutions, Inc. | 10 | Blue Chip |
| Year of Birth: 1969 | Secretary | Since 2000 | (2001 to current). General Partner | | Investor Funds |
| | and | | and Portfolio Manager for Value | | |
| | Treasurer | | Trend Capital Management, LP | | |
| | | | (1995 to current). | | |
| |
| Julian G. Winters, | Chief | Chief | Managing Member, Watermark | N/A | N/A |
| Year of Birth: 1968 | Compliance | Compliance | Solutions LLC (investment compli- | | |
| | Officer | Officer Since | ance and consulting) since March | | |
| | | 2010 | 2007. | | |
(1) The address of each trustee and officer is c/o PFS Funds, 1939 Friendship Drive, Suite C, El Cajon, California 92020.
(2) Jeffrey R. Provence is considered an “interested person” as defined in Section 2(a)(19) of the Investment Company Act of 1940 by
virtue of his position with the Trust.
Independent Trustees |
| | | | | Number of | |
| | | | Principal | Portfolios In | Other |
| Name, | Position | Term of Office | Occupation(s) | Fund | Directorships |
| Address(1), | Held With | and Length of | During | Complex | Held By |
| and Year of Birth | the Trust | Time Served | Past 5 Years | Overseen By | Trustee |
| | | | | Trustee | |
| |
| Thomas H. Addis III, | Independent | Indefinite Term; | Executive Director/CEO, Southern | 10 | None |
| Year of Birth: 1945 | Trustee | Since 2000 | California PGA (2006 to current). | | |
| |
| Allen C. Brown, | Independent | Indefinite Term; | Co-owner of Stebleton & Brown | 10 | Blue Chip |
| Year of Birth: 1943 | Trustee | Since 2010 | (1994 to Current). Estate planning | | Investor Funds |
| | | | and business attorney (1970 to cur- | | |
| rent). |
| |
| George Cossolias, CPA, | Independent | Indefinite Term; | Partner of CWDL, CPAs (February 1, | 10 | Blue Chip |
| Year of Birth: 1935 | Trustee | Since 2000 | 2014 to current). Owner of George | | Investor Funds |
| | | | Cossolias & Company, CPAs (1972 | | |
| | | | to January 31, 2014). President of | | |
| | | | LubricationSpecialists, Inc. (1996 to | | |
| current). |
(1) The address of each trustee and officer is c/o PFS Funds, 1939 Friendship Drive, Suite C, El Cajon, California 92020.
2016 Annual Report 17
Investment Adviser
NWM Fund Group, LLC
Legal Counsel
The Law Offices of John H. Lively & Associates, Inc.
A member firm of The 1940 Act Law GroupTM
Custodian
US Bank, N.A.
Distributor
Rafferty Capital Markets, LLC
Dividend Paying Agent,
Shareholders’ Servicing Agent,
Transfer Agent
Mutual Shareholder Services, LLC
Fund Administrator
Premier Fund Solutions, Inc.
Independent Registered Public Accounting Firm
Cohen Fund Audit Services, Ltd. |
This report is provided for the general information of the shareholders of the NWM
Momentum Fund. This report is not intended for distribution to prospective investors in
the Fund, unless preceded or accompanied by an effective prospectus. |
NWM Momentum Fund
www.nwmfund.com
1-888-331-9609
Item 2. Code of Ethics.
The registrant has adopted a code of ethics that applies to the registrant’s principal executive officer and the principal financial officer. The registrant has not made any amendments to its code of ethics during the covered period. The registrant has not granted any waivers from any provisions of the code of ethics during the covered period. A copy of the registrant’s Code of Ethics is filed herewith.
Item 3. Audit Committee Financial Expert.
The registrant’s Board of Trustees has determined that George Cossolias is an audit committee finical expert. Mr. Cossolias is independent for purposes of this Item 3.
Item 4. Principal Accountant Fees and Services.
(a-d) The following table details the aggregate fees billed for each of the last two fiscal years for audit fees, audit-related fees, tax fees and other fees by the principal accountant to the registrant. The principal accountant has provided no services to the adviser or any entity controlled by, or under common control with the adviser that provides ongoing services to the registrant.
| | | FYE 3/31/16 | | FYE 3/31/15 |
| Audit Fees | | $13,100 | | $13,000 |
| Audit-Related Fees | | $0 | | $0 |
| Tax Fees | | $2,500 | | $2,500 |
| All Other Fees | | $500 | | $600 |
Nature of Tax Fees: preparation of Excise Tax Statement and 1120 RIC.
Nature of All Other Fees: Review of Semi-Annual Report.
(e) (1) The audit committee approves all audit and non-audit related services and, therefore, has not adopted pre-approval policies and procedures described in paragraph (c)(7) of Rule 2-01 of Regulation S-X.
(e) (2) None of the services described in paragraph (b) through (d) of this Item were approved by the audit committee pursuant to paragraph (c)(7)(i)(C) of Rule 2-01 of Regulation S-X.
(f) All of the principal accountant’s hours spent on auditing the registrant’s financial statements were attributed to work performed by full-time permanent employees of the principal accountant.
(g) The following table indicates the aggregate non-audit fees billed by the registrant’s principal accountant for services to the registrant , the registrant’s investment adviser (not sub-adviser), and any entity controlling, controlled by, or under common control with the adviser that provides ongoing services to the registrant, for the last two years.
| Non-Audit Fees | | FYE 3/31/16 | | FYE 3/31/15 |
| Registrant | | $3,000 | | $3,100 |
| Registrant’s Investment Adviser | | $0 | | $0 |
(h) The principal accountant provided no services to the investment adviser or any entity controlling, controlled by, or under common control with the adviser that provides ongoing services to the registrant.
Item 5. Audit Committee of Listed Companies. Not applicable.
Item 6. Schedule of Investments. Schedule filed with Item 1.
Item 7. Disclosure of Proxy Voting Policies and Procedures for Closed-End Management Investment Companies. Not applicable.
Item 8. Portfolio Managers of Closed End Management Investment Companies. Not applicable.
Item 9. Purchases of Equity Securities by Closed-End Management Investment Companies and Affiliated Purchasers. Not applicable.
Item 10. Submission of Matters to a Vote of Security Holders.
The registrant has not adopted procedures by which shareholders may recommend nominees to the registrant’s board of trustees.
Item 11. Controls and Procedures.
(a) The registrant’s president and chief financial officer concluded that the disclosure controls and procedures (as defined in Rule 30a-3(c) under the Investment Company Act of 1940 (the “Act”)) were effective as of a date within 90 days of the filing date of this report, based on the evaluation of these controls and procedures required by Rule 30a-3(b) under the Act.
(b) There were no changes in the registrant’s internal control over financial reporting (as defined in Rule 30a-3(d) under the Act) that occurred during the registrant’s second fiscal quarter of the period covered by this report that have materially affected, or are reasonably likely to materially affect, the registrant’s internal control over financial reporting.
Item 12. Exhibits.
(a)(1) Code of Ethics. Filed herewith.
(a)(2) Certifications pursuant to Section 302 of the Sarbanes-Oxley Act of 2002. Filed herewith.
(a)(3) Not applicable.
(b) Certification pursuant to Section 906 Certification of the Sarbanes-Oxley Act of 2002. Filed herewith.
SIGNATURES
Pursuant to the requirements of the Securities Exchange Act of 1934 and the Investment Company Act of 1940, the registrant has duly caused this report to be signed on its behalf by the undersigned, thereunto duly authorized.
| | By: /s/Ross C. Provence
Ross C. Provence
President |
Pursuant to the requirements of the Securities Exchange Act of 1934 and the Investment Company Act of 1940, this report has been signed below by the following persons on behalf of the registrant and in the capacities and on the dates indicated.
| |
By: /s/Ross C. Provence
Ross C. Provence
President |
| |
By: /s/Jeffrey R. Provence
Jeffrey R. Provence
Chief Financial Officer |