UNITED STATES
SECURITIES AND EXCHANGE COMMISSION
WASHINGTON, D.C. 20549
FORM N-CSR
CERTIFIED SHAREHOLDER REPORT OF REGISTERED MANAGEMENT
INVESTMENT COMPANIES
Investment Company Act file number 811-09781
PFS Funds
(Exact name of registrant as specified in charter)
1939 Friendship Drive, Suite C, El Cajon, CA 92020
(Address of principal executive offices) (Zip code)
CT Corporation System
155 Federal St., Suite 700, Boston, MA 02110
(Name and address of agent for service)
Registrant's telephone number, including area code: (619) 588-9700
Date of fiscal year end: December 31
Date of reporting period: December 31, 2015
Form N-CSR is to be used by management investment companies to file reports with the Commission not later than 10 days after the transmission to stockholders of any report that is required to be transmitted to stockholders under Rule 30e-1 under the Investment Company Act of 1940 (17 CFR 270.30e -1). The Commission may use the information provided on Form N-CSR in its regulatory, disclosure review, inspection and policymaking roles.
A registrant is required to disclose the information specified by Form N-CSR, and the Commission will make this information public. A registrant is not required to respond to the collection of information contained in Form N-CSR unless the Form displays a currently valid Office of Management and Budget ("OMB") control number.
Item 1. Reports to Stockholders.

Annual Report
December 31, 2015
BRTNX |
February 22, 2016
Dear Fellow Shareholders:
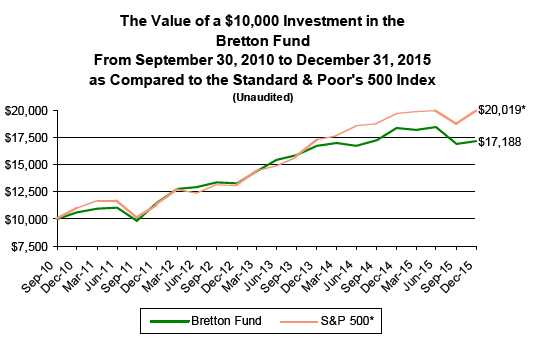
The Bretton Fund’s net asset value per share (NAV) as of December 31, 2015, was $23.98. For the year, the fund returned -6.59% compared to the S&P 500’s 1.38% .
| Total Returns as of December 31, 2015(A) |
| | | | | Annualized | | Annualized | | Annualized | |
| | 4th Quarter | | 1 Year | 3 Years | | 5 Years | | Since Inception | |
| Bretton Fund | 1.84% | | -6.59% | 9.07% | | 10.12% | | 10.86% | |
| S&P 500 Index(B) | 7.04% | | 1.38% | 15.13% | | 12.57% | | 14.13% | |
| Calendar Year Total Returns(A) | | | | |
| | Bretton Fund | | S&P 500 Index | |
| 2015 | -6.59% | | 1.38% | |
| 2014 | 9.79% | | 13.69% | |
| 2013 | 26.53% | | 32.39% | |
| 2012 | 15.66% | | 16.00% | |
| 2011 | 7.90% | | 2.11% | |
| 9/30/10–12/31/10 | 6.13% | | 10.76% | |
| Cumulative Since Inception | 71.88% | | 100.19% | |
(A) All returns include change in share prices and, in each case, include reinvestment of any dividends and capital gain distributions. The inception date of the Bretton Fund was September 30, 2010.
(B) The S&P 500® Index is a stock market index based on the market capitalizations of 500 leading companies publicly traded in the US stock market, as determined by Standard & Poor’s, and captures approximately 80% coverage of available market capitalization.
Performance data quoted represents past performance. Past performance does not guarantee future results. The investment return and principal value of an investment will fluctuate so that an investor’s shares, when redeemed, may be worth more or less than their original cost. Current performance may be lower or higher than the performance data quoted. You may obtain performance data current to the most recent month-end at http://brettonfund.com or by calling 800.231.2901.
All returns include change in share prices, reinvestment of any dividends, and capital gains distributions. Indices shown are broad-based, unmanaged indices commonly used to measure performance of US stocks. These indices do not incur expenses and are not available for investment. The fund's expense ratio is 1.50% .The fund’s principal underwriter is Rafferty Capital Markets, LLC.
1
4th Quarter
For the fourth quarter, the total return for the fund was 1.84% compared to 7.04% for the S&P 500 Index. The largest impact on the fund’s performance was Alphabet, Inc., the parent company of Google, which increased the fund’s value by 1.1% . Ross Stores added 0.6% to performance, while paint company Valspar chipped in 0.6% and Wells Fargo added 0.5% . The biggest detractors from performance were Community Health Systems, taking away 1.0% from performance, and Union Pacific, which took away 0.5% .
The fund closed out four positions during the quarter: IPC Healthcare, CSX, The Gap, and New Resource Bank. IPC, our hospitalist-staffing company, was acquired by a larger competitor, Team Health; our total gain was 91%. We sold CSX to reallocate our rail investment toward Union Pacific, the more promising investment. Our annualized return (aka, internal rate of return or IRR) was 7.3% . The Gap (33.4% IRR), originally purchased in 2011 at distressed values because of a temporary spike in cotton prices, has long since recovered, but its recent fashion struggles gave us less confidence in its long-term earning potential. New Resource Bank (12.0% IRR), which we have owned since early 2011 as it was recovering from the financial crisis, has since rebounded nicely.
We initiated a position in data analytics company Verisk during the quarter.
Contributors to Performance for 2015
The largest negative contributor to performance during the year was our rail investment, which reduced the fund’s value by 3.6% . Over time, US rail traffic does a remarkably consistent job of tracking slightly ahead of the industrial economy, but traffic can be lumpy from year to year. Rail volume in 2015 declined only 2.5%, including a pronounced deterioration toward the end of the year, dropping 9% in December. Despite a slowly recovering economy overall, US industrial production has been weakening, particularly in energy-related industries. We are now six or seven years into widespread hydraulic fracturing, which has slashed prices for natural gas and made coal uneconomic in many places for power generation. For most of this time, the railroads have been able to replace declining coal volume with increased traffic in other goods; in 2015, far more coal fell out of the system than the rails were able to replace. We think the railroads’ superior economics remain intact: faster delivery times and lower prices are still allowing them to take share from trucking, improving technology is still reducing their operating costs, and limited competition allows for strong pricing. Rail traffic is cyclical, and the market tends to overreact to upswings and downswings. Over the long run, we are confident our remaining rail investment, Union Pacific, will continue to increase its earnings.
The other investments that materially hurt the year’s performance were Community Health System for a -2.1% impact, American Express (-1.4%), Flowserve (-1.2%), and Discovery Communications (-1.1%) .
The largest positive impact to the fund’s performance in 2015 was the acquired IPC Healthcare, which added 2.0% . Other contributors were Alphabet (1.2%) and Ross Stores (1.0%) .
Taxes
The fund made a long-term capital-gain distribution of $0.04498 per share to shareholders on December 23, 2015, amounting to 0.19% of the fund’s NAV. It was the fund’s first capital gain distribution in three years. There were no other tax distributions this year.
| Portfolio | | |
| |
| Security | % of Net Assets | |
| Wells Fargo & Company | 7.7% | |
| Alphabet, Inc. | 6.3% | |
| Union Pacific Corp. | 5.9% | |
2
| MEDNAX, Inc. | 5.8 | % |
| American Express Co. | 5.4 | % |
| Ross Stores, Inc. | 5.0 | % |
| Bank of America Corp. | 4.8 | % |
| Carter’s, Inc. | 4.7 | % |
| HD Supply Holdings, Inc. | 4.7 | % |
| AutoZone, Inc. | 4.6 | % |
| Valspar Corp. | 4.4 | % |
| MasterCard, Inc. | 4.3 | % |
| Discovery Communications, Inc. | 3.9 | % |
| Flowserve Corp. | 3.0 | % |
| PGT, Inc. | 2.8 | % |
| Centene Corporation | 2.7 | % |
| JPMorgan Chase & Co. | 2.4 | % |
| Armanino Foods of Distinction, Inc. | 2.4 | % |
| Nordson Corp. | 2.2 | % |
| Community Health Systems, Inc. | 1.7 | % |
| Whole Foods Market, Inc. | 1.6 | % |
| Verisk Analytics, Inc. | 1.6 | % |
| T-Mobile US, Inc. | 0.9 | % |
| Cash* | 11.2 | % |
* Cash represents cash, cash equivalents and other assets less liabilities.
Portfolio Discussion
Retail & Consumer
It’s starting to sound like a broken record, but Ross continued to build stores, increase its sales per store, and return money to shareholders. We estimate its earnings per share increased 13% (Ross hasn’t announced its results yet), and its stock’s total return was 15.2% in 2015.
People keep buying baby clothes. We estimate Carter’s increased its earnings per share by 14%, while its stock returned 3.0% . The stock was fairly volatile during the year, and we added more at the lower prices.
Like Ross, AutoZone opened more stores, increased its per store sales, and bought back a lot of stock, translating a revenue increase of 8% into an earnings per share increase of 14%. Our return over our average cost was 6.4% .
Armanino’s growth was hurt a bit as its sales of pasta sauce in Asia translated into fewer US dollars given the stronger dollar. Earnings per share increased 5%, and its stock returned 0.7% .
Whole Foods Market expanded its store base last year, building 38 stores and growing its square footage by 10%, but had a hard time with per store profitability. After decades of virtually unimpeded growth, competition is starting to have a real impact on Whole Foods. Sales per store grew 2.5% for the full year, but declined in the fourth quarter. Whole Foods has had to lower prices to match the competition, and its gross margin dropped from 35.5% to 35.2% . Earnings per share declined 5%, and our unrealized loss on the stock is 15%. The increased competition is troubling, and we’re watching it, but we still think Whole Foods can build a lot more stores, potentially up to three times what it has today.
Banking
The good news for our banks—Wells Fargo, Bank of America, and JPMorgan Chase—was that their earnings continued to grow and they continued to return capital to shareholders. The bad news was that the Federal Reserve didn’t increase interest rates until the end of the year, which kept a damper on revenue growth.
3
While a bit obscured by ultra-low rates, Wells Fargo continued to do what it does: add customers, loans, and deposits. Compared to other developed countries, banking in the US is highly fragmented, and Wells Fargo has plenty of runway to grow. Wells Fargo grew its earnings per share by 1% last year, and its stock returned 1.9% .
Given their larger problems during the financial crisis, JPMorgan and Bank of America had more to improve upon compared to Wells Fargo, and they continued to do so. JPMorgan increased its earnings per share by 13%, and its total return was 8.2% . Bank of America’s earnings per share nearly quadrupled—off a low base—and the stock’s return was -4.8% .
Media & Technology
Despite the stock increasing 42% in 2015, we still find Alphabet (better known by the name of its largest subsidiary, Google) a bargain compared to how rapidly its earnings are growing. Earnings per share are on track to increase 25%, and we’ve seen a 15.6% gain over our average cost. On a global basis, Alphabet has a strong competitive position (how often do you “Bing” something?) and a suite of critical customer touch points that address basic user questions: search to help people find information, email and messaging to communicate the information, phone and mapping to make the information accessible and geographically relevant. What tipped us into the stock last year was management indicating they’d be more cost-conscious and shareholder-friendly than they had in the past.
Like all US businesses with meaningful foreign operations, Discovery Communications (Discovery Channel, TLC, Animal Planet, and others) faced tough headwinds this year from the decline in global currencies versus the dollar. Adjusting for the currency, management estimates earnings per share increased by a low double-digit percentage. Its US business grew nicely with surprisingly strong ratings for its revamped lineup; its international business grew even faster. But the stock struggled, dropping 22.6%, as investors became concerned that “cord-cutting” could unwind the pay-TV ecosystem. We do think cord-cutting will continue to happen, but at a modest pace, while Discovery’s international business will continue to grow quickly and more than make up the difference.
Verisk was our lone purchase in the fourth quarter. Verisk was founded in 1971 by large property insurance companies so they could pool together their actuarial data and help them make better decisions about rates and probabilities. About 15 years ago, management convinced their insurance company owners to let them convert Verisk into an independent, for-profit company. Since, Verisk has identified and acquired other companies serving as central repositories for granular, difficult-to-replicate data sets. It purchased similar data sets in other countries, then acquired health insurance information, environmental health and safety information, and, with last year’s purchase of Wood Mackenzie, natural resources information. In each case, the data is cost-prohibitive for one user, yet it costs a negligible amount to add an incremental user, so the product can be deployed attractively across an entire industry. Our return so far is 7.4% .
T-Mobile has been treading water for the past six months. The “uncarrier” positions itself as the high-growth alternative to wireless market giants Verizon and AT&T. The company has performed well operationally, but most of the excitement centers around the strategic value of merging the company with another market participant. We believe that the government is hesitant to allow for further consolidation among the majors in the wireless market, which would, in our view, possibly allow for consolidation with a new entrant, such as spectrum-rich DISH or Comcast. This, in turn, might create an alternative network using its large base of customer routers. Our return over our average cost is -1.4% .
4
Housing & Building Products
HD Supply’s business of selling building-maintenance products and construction materials improved as the building market recovered. Revenue grew around 6%, and earnings grew even faster, almost doubling, as those additional revenues were spread over a similar fixed-cost base. The stock is down 9.9% from our average cost.
We purchased Valspar, the paint and coatings company, on the heels of a large reduction from its largest customer, Lowe’s Home Improvement. The Lowe’s business was low margin, and the rest of its business, including its food container business, thrived. Earnings per share increased 6%, and our return over our average cost is 1.2% .
PGT, our Florida-based maker of impact-resistant windows for hurricanes, saw a big jump in its earnings from a number of factors: improvement in the Florida housing market, acquisition of its largest competitor, and the achievement of economies of scale with a new factory. We expect earnings per share increased over 30% from 2014. The stock’s return was 9.1% .
Industrial Products & Transportation
It may not feel like it, but after a sharp and painful financial crisis in 2008–2009 the US economy has made a pretty good, albeit slow, recovery. Indeed, the current economic expansion is one of the longest in US history. Unemployment levels are low, consumer spending is increasing, home prices are increasing, and consumer debt levels are low. But this past year has been a poor one for the industrial economy, and it’s likely to get worse. Low oil and commodity prices, in part caused by a severe, long-coming slowdown in China, combined with a weak European economy, have put the brakes on the demand for high-ticket machinery. The US economy is one of the sole bright spots in a weak global economy; that, along with the world anticipating higher US interest rates, caused the dollar to strengthen considerably. Businesses with significant foreign operations made much less in dollar terms.
We started the year with three rail investments, and when the price of Union Pacific dropped sharply, we focused our rail allocation on Union Pacific. Given its territory includes long hauls in the western US, access to the Pacific Ocean, and connections to Mexico, it has a stronger advantage over trucking and will benefit from increased trade with Asia and Mexico. It also has a much smaller proportion of coal traffic than the eastern railroads, and its coal traffic originates in the Powder River Basin, the lowest-cost coal region in North America. Earnings per share declined 5% last year, and the stock’s return was -32.5% . With the shares down so low, we think the market is giving us a great business at a distressed price.
Pump manufacturer Flowserve saw its earnings per share drop by almost 20%, much of that from the stronger dollar, and its stock’s return was -28.5% . Flowserve does a lot of its business in energy and emerging markets, both tough places to be last year. Despite the harsh environment, most of its revenue is driven by recurring maintenance on the installed fleet of pumps, not one-time sales. Its oil and gas business is mostly in refineries—not drilling—which operated at record volumes and uptime levels in 2015. Refinery owners are loathe to pause production when the market is hot, but we think the current practice of deferring maintenance will reach its natural end. Adjusted for the effects of currency, management estimates earnings per share only dropped 5–7% last year.
Nordson, the maker of adhesive-application equipment (the machines that apply glue to consumer products like diapers and juice boxes), similarly saw its international business hurt by the currency decline. Seventy percent of its revenue is from outside the US, so its 7% increase in earnings per share before the effects of currency translated into a 10% decline in dollar terms. Our return on the investment so far is -18.1% .
Healthcare
MEDNAX, our doctor group of neonatologists and anesthesiologists, kept up its rapid growth, increasing earnings per share by 13% by acquiring doctor groups around the
5
country. We think they have a very long runway to maintain this pace, and we think we’re getting this business at a wonderful price. Our return over our average cost is -4.5% .
Community Health Systems went through a perfect storm of bad news in the fall; our return so far is -46.1% . Hospital economics are highly dependent on the breadth of insurance coverage; hospitals are forced to provide many kinds of care to all who arrive, yet patients without insurance coverage are rarely able to pay. The Affordable Care Act (ACA) was meant to remedy this, but throughout the fall there were alarming stories that enrollment might have peaked. Furthermore, the announcement by UnitedHealthcare, the largest insurance company in the US, that it is likely to cease offering ACA policies highlighted the concern of a “death spiral,” in which rates rise and healthy people drop out of the insurance pool, causing rates to rise again. As this drama played out, credit markets deteriorated and it became unlikely Community could raise the financing to complete a planned spinoff of its rural hospitals. We own the company for less than 10 times earnings.
Centene is the leading provider of Medicaid Managed Care (MMC) in the country. Although the ACA is best known for its online exchanges for individual insurance policies, more people are covered through the expansion of Medicaid, and these programs are increasingly insured by private firms that contract with states at a capitated rate. While large commercial insurers compete on the basis of network breadth, the MMC providers compete on the basis of network cost: the ability to recruit a provider population willing to work for Medicaid’s low rates. When the dust settles from the flurry of health insurance mergers, Centene should be the fourth largest private health insurance company, and one of the very few of any size that can deliver high service quality scores to lower-income Americans at sustainable economics. These economics should improve materially with the pending Health Net acquisition, which will generate savings by eliminating duplicative overhead. So far, our return is 7.7% over our average cost.
Payments
American Express’s stock price was hit hard when it lost its contract as the exclusive credit card to Costco. The total return on the stock in 2015 was -24.1% . In addition to losing Costco, American Express was hurt by the strong dollar, as well as weak pricing, as it lowered its rates to some vendors to encourage smaller merchants to take AmEx. Earnings per share declined 9%. American Express is certainly facing some real challenges: weak currency, tougher competition for co-branded cards, and an anemic spending environment. But it also has a lot going for it: its market share in the US card market is 25%, up from 20% 15 years ago; it has a disproportionate share of large spenders, online purchases, and mobile purchases; the world is steadily shifting from cash/check to cards; and, importantly, we believe the stock is very cheap.
Our other payments investment, MasterCard, had a much easier go of it. Despite tough currency headwinds (70% of its business is outside the US), it was able to increase its earnings per share by 11% (18% without any currency impact). Like American Express, MasterCard is benefitting from the steady conversion of payment to card from cash; MasterCard, along with its chief competitor Visa, is growing considerably faster because more of its business is in developing markets where that conversion trend is more pronounced. Our return so far on its stock is 8.2% .
Investments Initiated in 2015
Alphabet
AutoZone
Cardno
Centene
Community Health Systems
HD Supply Holdings
HMS Holdings |
MEDNAX
MasterCard
PGT
Nordson
Valspar
Verisk Analytics
Whole Foods Market
|
6
| Investments Exited During 2015 | | |
| Investment | Internal Rate of Return | |
| Aflac | 6.0% | |
| America’s Car-Mart | 8.5% | |
| Cardno | NM* (-16.1% overall) | |
| Coach | -13.3% | |
| CSX | 7.3% | |
| The Gap | 33.4% | |
| HMS Holdings | NM* (-21.4% overall) | |
| IPC Healthcare | 94.3% | |
| New Resource Bank | 12.0% | |
| NexPoint | -4.1% | |
| Norfolk Southern | 12.8% | |
| Standard Financial | 10.1% | |
*NM denotes “not meaningful.”
As always, thank you for investing.
Stephen Dodson
Portfolio Manager | Raphael de Balmann
Portfolio Manager |
Bretton Fund by Sectors
(as a percentage of Net Assets)
(Unaudited)
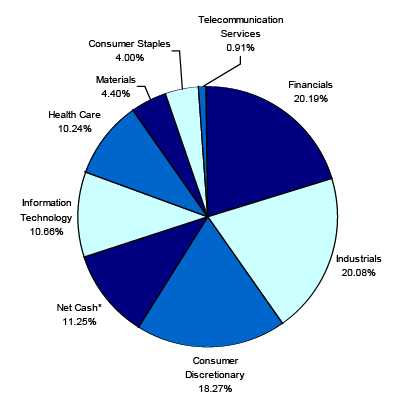
* Net Cash represents cash and other assets less liabilities.
7
| Bretton Fund |
| | | | | | | Schedule of Investments |
| | | | | | | December 31, 2015 |
| Shares | | Cost | | Fair Value | | % of Net Assets |
| COMMON STOCKS | | | | | | | | |
| Apparel & Other Finished Products of Fabrics & Similar Material | | | | | | |
| 10,950 | Carter's, Inc. | $ | 782,263 | | $ | 974,879 | | 4.75 | % |
| Cable & Other Pay Television Services | | | | | | | | |
| 29,700 | Discovery Communications, Inc. - Class A * | | 955,422 | | | 792,396 | | 3.86 | % |
| Canned, Frozen & Preserved Fruit, Vegetables & Food Specialties | | | | | | |
| 245,430 | Armanino Foods of Distinction, Inc. | | 241,490 | | | 485,951 | | 2.37 | % |
| Finance Services | | | | | | | | |
| 15,800 | American Express Company | | 1,110,422 | | | 1,098,890 | | 5.35 | % |
| General Industrial Machinery & Equipment, NEC | | | | | | | | |
| 7,150 | Nordson Corporation | | 560,309 | | | 458,672 | | 2.23 | % |
| Hospital & Medical Service Plans | | | | | | | | |
| 8,500 | Centene Corporation * | | 519,191 | | | 559,385 | | 2.72 | % |
| Metal Doors, Sash, Frames, Moldings & Trim | | | | | | | | |
| 49,800 | PGT, Inc. * | | 519,995 | | | 567,222 | | 2.76 | % |
| National Commercial Banks | | | | | | | | |
| 58,200 | Bank of America Corporation | | 931,953 | | | 979,506 | | | |
| 7,400 | JPMorgan Chase & Co. | | 294,670 | | | 488,622 | | | |
| 29,000 | Wells Fargo & Company | | 1,124,110 | | | 1,576,440 | | | |
| | | | 2,350,733 | | | 3,044,568 | | 14.84 | % |
| Paints, Varnishes, Lacquers, Enamels & Allied Products | | | | | | | | |
| 10,900 | The Valspar Corporation | | 893,507 | | | 904,155 | | 4.40 | % |
| Pumps & Pumping Equipment | | | | | | | | |
| 14,750 | Flowserve Corporation | | 814,923 | | | 620,680 | | 3.02 | % |
| Radiotelephone Communications | | | | | | | | |
| 4,800 | T-Mobile US, Inc. * | | 190,392 | | | 187,776 | | 0.91 | % |
| Railroad, Line-Haul Operating | | | | | | | | |
| 15,350 | Union Pacific Corporation | | 1,243,056 | | | 1,200,370 | | 5.85 | % |
| Retail - Auto & Home Supply Stores | | | | | | | | |
| 1,280 | AutoZone, Inc. * | | 892,114 | | | 949,645 | | 4.63 | % |
| Retail - Family Clothing Stores | | | | | | | | |
| 19,200 | Ross Stores Inc. | | 381,166 | | | 1,033,152 | | 5.03 | % |
| Retail - Grocery Stores | | | | | | | | |
| 10,000 | Whole Foods Market, Inc. | | 395,698 | | | 335,000 | | 1.63 | % |
| Services - Business Services, NEC | | | | | | | | |
| 9,130 | MasterCard Incorporated - Class A | | 821,748 | | | 888,897 | | 4.33 | % |
| Services - Computer Processing & Data Preparation | | | | | | | | |
| 1,710 | Alphabet Inc. - Class C * | | 1,122,808 | | | 1,297,685 | | | |
| 4,200 | Verisk Analytics, Inc. * | | 300,739 | | | 322,896 | | | |
| | | | 1,423,547 | | | 1,620,581 | | 7.90 | % |
| Services - General Medical & Surgical Hospitals, NEC | | | | | | | | |
| 13,100 | Community Health Systems, Inc. * | | 645,087 | | | 347,543 | | 1.69 | % |
| Services - Hospitals | | | | | | | | |
| 16,700 | MEDNAX, Inc. * | | 1,252,926 | | | 1,196,722 | | 5.83 | % |
| Wholesale - Durable Goods | | | | | | | | |
| 31,800 | HD Supply Holdings, Inc. * | | 1,060,135 | | | 954,954 | | 4.65 | % |
| Total for Common Stocks | $ | 17,054,124 | | $ | 18,221,438 | | 88.75 | % |
| Total Investment Securities | $ | 17,054,124 | | $ | 18,221,438 | | | |
| Other Assets in Excess of Liabilities | | | | $ | 2,309,333 | | 11.25 | % |
| Net Assets | | | | | $ | 20,530,771 | | 100.00 | % |
* Non-Income Producing Securities.
The accompanying notes are an integral part of these
financial statements. |
8
| Bretton Fund | | | |
| |
| Statement of Assets and Liabilities | | | |
| December 31, 2015 | | | |
| |
| Assets: | | | |
| Investment Securities at Fair Value | $ | 18,221,438 | |
| (Cost $17,054,124) | | | |
| Cash | | 2,325,596 | |
| Dividend Receivable | | 9,034 | |
| Total Assets | | 20,556,068 | |
| Liabilities: | | | |
| Payable to Adviser (Note 4) | | 25,297 | |
| Total Liabilities | | 25,297 | |
| Net Assets | $ | 20,530,771 | |
| |
| Net Assets Consist of: | | | |
| Paid In Capital (Note 5) | $ | 18,967,238 | |
| Accumulated Undistributed Realized Gain (Loss) on Investments - Net | | 396,219 | |
| Unrealized Appreciation (Depreciation) in Value of Investments | | | |
| Based on Identified Cost - Net | | 1,167,314 | |
| Net Assets, for 856,243 Shares Outstanding | $ | 20,530,771 | |
| (Unlimited shares authorized) | | | |
| Net Asset Value, Offering Price and Redemption Price Per Share | | | |
| ($20,530,771/856,243 shares) | $ | 23.98 | |
| |
| Statement of Operations | | | |
| For the fiscal year ended December 31, 2015 | | | |
| |
| Investment Income: | | | |
| Dividends | $ | 204,585 | |
| Interest | | 68 | |
| Total Investment Income | | 204,653 | |
| Expenses: | | | |
| Management Fees (Note 4) | | 212,372 | |
| Total Expenses | | 212,372 | |
| |
| Net Investment Income (Loss) | | (7,719 | ) |
| |
| Realized and Unrealized Gain (Loss) on Investments: | | | |
| Realized Gain (Loss) on Investments | | 421,731 | |
| Net Change in Unrealized Appreciation (Depreciation) on Investments | | (1,573,238 | ) |
| Net Realized and Unrealized Gain (Loss) on Investments | | (1,151,507 | ) |
| |
| Net Increase (Decrease) in Net Assets from Operations | $ | (1,159,226 | ) |
| | The accompanying notes are an integral part of these
financial statements. |
9
| Bretton Fund |
| | |
| Statements of Changes in Net Assets | | | | | | | | |
| | | 1/1/2015 | | | | 1/1/2014 | | |
| | | to | | | | to | | |
| | | 12/31/2015 | | | | 12/31/2014 | | |
| From Operations: | | | | | | | | |
| Net Investment Income (Loss) | $ | (7,719 | ) | | $ | 4,512 | | |
| Net Realized Gain (Loss) on Investments | | 421,731 | | | | 11,992 | | |
| Change in Net Unrealized Appreciation (Depreciation) | | (1,573,238 | ) | | | 921,400 | | |
| Increase (Decrease) in Net Assets from Operations | | (1,159,226 | ) | | | 937,904 | | |
| From Distributions to Shareholders: | | | | | | | | |
| Net Investment Income | | - | | | | (5,848 | ) | |
| Net Realized Gain from Security Transactions | | (37,515 | ) | | | - | | |
| Change in Net Assets from Distributions | | (37,515 | ) | | | (5,848 | ) | |
| From Capital Share Transactions: | | | | | | | | |
| Proceeds From Sale of Shares | | 11,410,246 | | | | 2,075,230 | | |
| Shares Issued on Reinvestment of Distributions | | 37,498 | | | | 5,842 | | |
| Cost of Shares Redeemed | | (268,740 | ) | | | (356,390 | ) | |
| Net Increase (Decrease) from Shareholder Activity | | 11,179,004 | | | | 1,724,682 | | |
| | |
| Net Increase (Decrease) in Net Assets | | 9,982,263 | | | | 2,656,738 | | |
| | |
| Net Assets at Beginning of Period | | 10,548,508 | | | | 7,891,770 | | |
| Net Assets at End of Period (Including Accumulated Undistributed | | | | | | | | |
| Net Investment Income of $0 and $11, respectively) | $ | 20,530,771 | | | $ | 10,548,508 | | |
| | |
| Share Transactions: | | | | | | | | |
| Issued | | 455,194 | | | | 88,217 | | |
| Reinvested | | 1,546 | | | | 227 | | |
| Redeemed | | (10,688 | ) | | | (14,977 | ) | |
| Net Increase (Decrease) in Shares | | 446,052 | | | | 73,467 | | |
| Shares Outstanding Beginning of Period | | 410,191 | | | | 336,724 | | |
| Shares Outstanding End of Period | | 856,243 | | | | 410,191 | | |
| Financial Highlights | | | | | | | | | | | | | | | | | | | | |
| Selected data for a share outstanding | | | | | �� | | | | | | | | | | | | | | | |
| throughout the period: | | 1/1/2015 | | | | 1/1/2014 | | | | 1/1/2013 | | | | 1/1/2012 | | | | 1/1/2011 | | |
| | | to | | | | to | | | | to | | | | to | | | | to | | |
| | | 12/31/2015 | | | | 12/31/2014 | | | | 12/31/2013 | | | | 12/31/2012 | | | | 12/31/2011 | | |
| Net Asset Value - | | | | | | | | | | | | | | | | | | | | |
| Beginning of Period | $ | 25.72 | | | $ | 23.44 | | | $ | 18.84 | | | $ | 16.98 | | | $ | 15.92 | | |
| Net Investment Income (Loss) (a) | | (0.01 | ) | | | 0.01 | | | | - | | (b) | | - | | (b) | | (0.07 | ) | |
| Net Gain (Loss) on Securities | | | | | | | | | | | | | | | | | | | | |
| (Realized and Unrealized) | | (1.69 | ) | | | 2.28 | | | | 5.00 | | | | 2.65 | | | | 1.33 | | |
| Total from Investment Operations | | (1.70 | ) | | | 2.29 | | | | 5.00 | | | | 2.65 | | | | 1.26 | | |
| | |
| Distributions (From Net Investment Income) | | - | | | | (0.01 | ) | | | - | | | | - | | | | - | | |
| Distributions (From Realized Capital Gains) | | (0.04 | ) | | | - | | | | (0.40 | ) | | | (0.79 | ) | | | (0.20 | ) | |
| Distributions (From Return of Capital) | | - | | | | - | | | | - | | | | - | | | | - | | (b) |
| Total Distributions | | (0.04 | ) | | | (0.01 | ) | | | (0.40 | ) | | | (0.79 | ) | | | (0.20 | ) | |
| | |
| Net Asset Value - | | | | | | | | | | | | | | | | | | | | |
| End of Period | $ | 23.98 | | | $ | 25.72 | | | $ | 23.44 | | | $ | 18.84 | | | $ | 16.98 | | |
| Total Return (c) | | (6.59)% | | | | 9.79% | | | | 26.53% | | | | 15.66% | | | | 7.90% | | |
| Ratios/Supplemental Data | | | | | | | | | | | | | | | | | | | | |
| Net Assets - End of Period (Thousands) | $ | 20,531 | | | $ | 10,549 | | | $ | 7,892 | | | $ | 4,846 | | | $ | 2,753 | | |
| Ratio of Expenses to Average Net Assets | | 1.50% | | | | 1.50% | | | | 1.50% | | | | 1.50% | | | | 1.50% | | |
| Ratio of Net Investment Income (Loss) to | | | | | | | | | | | | | | | | | | | | |
| Average Net Assets | | -0.05% | | | | 0.05% | | | | 0.02% | | | | 0.00% | | | | (0.41)% | | |
| Portfolio Turnover Rate | | 26.81% | | | | 10.68% | | | | 6.85% | | | | 20.14% | | | | 13.14% | | |
(a) Per share amounts were calculated using the average shares method.
(b) Less than $0.005 per share.
(c) Total return in the above table represents the rate that the investor would have earned
or lost on an investment in the Fund assuming reinvestment of dividends and distributions.
The accompanying notes are an integral part of these financial statements. |
10
Notes to Financial Statements
Bretton Fund
December 31, 2015
1.) ORGANIZATION
Bretton Fund (the “Fund”) was organized as a non-diversified series of the PFS Funds (the “Trust”) on September 21, 2010. The Trust was established under the laws of Massachusetts by an Agreement and Declaration of Trust dated January 13, 2000, which was amended and restated January 20, 2011. Prior to March 5, 2010, the Trust was named Wireless Fund. The Fund is registered as an open-end investment company under the Investment Company Act of 1940, as amended. The Trust may offer an unlimited number of shares of beneficial interest in a number of separate series, each series representing a distinct fund with its own investment objectives and policies. As of December 31, 2015, there were eleven series authorized by the Trust. The Fund commenced operations on September 30, 2010. The Fund’s investment objective is to seek long-term capital appreciation. The investment adviser to the Fund is Bretton Capital Management, LLC (the “Adviser”).
2.) SIGNIFICANT ACCOUNTING POLICIES
SECURITY VALUATION:
The Fund is an investment company and accordingly follows the investment company accounting and reporting guidance of the Financial Accounting Standards Board (“FASB”) Accounting Standard Codification Topic 946 Financial Services - Investment Companies. All investments in securities are recorded at their estimated fair value, as described in Note 3.
FEDERAL INCOME TAXES:
The Fund’s policy is to continue to comply with the requirements of the Internal Revenue Code that are applicable to regulated investment companies and to distribute all of its taxable income to shareholders. Therefore, no federal income tax provision is required. It is the Fund’s policy to distribute annually, prior to the end of the calendar year, dividends sufficient to satisfy excise tax requirements of the Internal Revenue Code. This Internal Revenue Code requirement may cause an excess of distributions over the book year-end accumulated income. In addition, it is the Fund’s policy to distribute annually, after the end of the fiscal year, any remaining net investment income and net realized capital gains.
The Fund recognizes the tax benefits of certain tax positions only where the position is “more likely than not” to be sustained assuming examination by tax authorities. Management has analyzed the Fund’s tax positions, and has concluded that no liability for unrecognized tax benefits should be recorded related to uncertain tax positions taken on returns filed for open tax years (2012-2014), or expected to be taken in the Fund’s 2015 tax returns. The Fund identifies its major tax jurisdictions as U.S. Federal tax authorities; however, the Fund is not aware of any tax positions for which it is reasonably possible that the total amounts of unrecognized tax benefits will change materially in the next 12 months. The Fund recognizes interest and penalties, if any, related to unrecognized tax benefits as income tax expense in the Statement of Operations. During the fiscal year ended December 31, 2015, the Fund did not incur any interest or penalties.
DISTRIBUTIONS TO SHAREHOLDERS:
Distributions to shareholders, which are determined in accordance with income tax regulations, are recorded on the ex-dividend date.
The treatment for financial reporting purposes of distributions made to shareholders during the period from net investment income or net realized capital gains may differ from their ultimate treatment for federal income tax purposes. These differences are caused primarily by differences in the timing of the recognition of certain components of income, expense, or realized capital gain for federal income tax purposes. Where such differences are permanent in nature, they are reclassified in the components of the net assets based on their ultimate characterization for federal income tax purposes. Any such reclassifications will have no effect on net assets, results of operations, or net asset value per share of the Fund. As of December 31, 2015, accumulated net operating loss was increased by $7,719 and paid-in capital was reduced by $7,719.
USE OF ESTIMATES:
The preparation of financial statements in conformity with accounting principles generally accepted in the United States of America (“GAAP”) requires management to make estimates and assumptions that affect the reported amounts of assets and liabilities and disclosure of contingent
11
Notes to Financial Statements - continued
assets and liabilities at the date of the financial statements and the reported amounts of increases and decreases in net assets from operations during the reporting period. Actual results could differ from those estimates.
EXPENSES:
Expenses incurred by the Trust that do not relate to a specific fund of the Trust are allocated to the individual funds based on each fund’s relative net assets or another appropriate basis. OTHER: The Fund records security transactions based on the trade date. Dividend income is recognized on the ex-dividend date. Interest income is recognized on an accrual basis. The Fund uses the specific identification method in computing gain or loss on sales of investment securities. Discounts and premiums on securities purchased are accreted and amortized over the life of the respective securities. Withholding taxes on foreign dividends have been provided for in accordance with the Fund’s understanding of the applicable country’s tax rules and rates.
3.) SECURITIES VALUATIONS
As described in Note 2, the Fund utilizes various methods to measure the fair value of most of its investments on a recurring basis. GAAP establishes a hierarchy that prioritizes inputs to valuation methods. The three levels of inputs are:
Level 1 - Unadjusted quoted prices in active markets for identical assets or liabilities that the Fund has the ability to access.
Level 2 - Observable inputs other than quoted prices included in level 1 that are observable for the asset or liability, either directly or indirectly. These inputs may include quoted prices for the identical instrument in an inactive market, prices for similar instruments, interest rates, prepayment speeds, credit risk, yield curves, default rates, and similar data.
Level 3 - Unobservable inputs for the asset or liability, to the extent relevant observable inputs are not available, representing the Fund’s own assumptions about the assumptions a market participant would use in valuing the asset or liability, and would be based on the best information available.
The availability of observable inputs can vary from security to security and is affected by a wide variety of factors, including, for example, the type of security, whether the security is new and not yet established in the marketplace, the liquidity of markets, and other characteristics particular to the security. To the extent that valuation is based on models or inputs that are less observable or unobservable in the market, the determination of fair value requires more judgment. Accordingly, the degree of judgment exercised in determining fair value is greatest for instruments categorized in level 3.
The inputs used to measure fair value may fall into different levels of the fair value hierarchy. In such cases, for disclosure purposes, the level in the fair value hierarchy within which the fair value measurement falls in its entirety, is determined based on the lowest level input that is significant to the fair value measurement in its entirety.
FAIR VALUE MEASUREMENTS
A description of the valuation techniques applied to the Fund’s major categories of assets and liabilities measured at fair value on a recurring basis follows.
Equity securities (common stocks). Equity securities that are traded on any exchange or on the NASDAQ over-the-counter market are valued at the last quoted sale price. Lacking a last sale price, a long security is valued at its last bid price except when, in the Adviser’s opinion, the last bid price does not accurately reflect the current value of the long security. To the extent these securities are actively traded and valuation adjustments are not applied, they are classified in level 1 of the fair value hierarchy. When market quotations are not readily available, when the Adviser determines the last bid price does not accurately reflect the current value or when restricted securities are being valued, such securities are valued as determined in good faith by the Adviser, in conformity with guidelines adopted by and subject to review of the Board of Trustees (the “Trustees” or the “Board”) and are categorized in level 2 or level 3, when appropriate.
Illiquid securities. A security may be considered to be illiquid if it has a limited trading market. Securities are generally considered to be liquid if they can be sold or disposed of in the ordinary
12
Notes to Financial Statements - continued
course of business within seven days at approximately the price at which the security is valued by the Fund. These securities are valued at fair value as described above. The Fund intends to hold no more than 15% of its net assets in illiquid securities.
Fixed income securities. Fixed income securities generally are valued by using market quotations, but may be valued on the basis of prices furnished by a pricing service when the Adviser believes such prices accurately reflect the fair market value of such securities. A pricing service utilizes electronic data processing techniques based on yield spreads relating to securities with similar characteristics to determine prices for normal institutional-size trading units of debt securities without regard to sale or bid prices. If the Adviser decides that a price provided by the pricing service does not accurately reflect the fair value of the securities, when prices are not readily available from a pricing service, or when restricted or illiquid securities are being valued, securities are valued at fair value as determined in good faith by the Adviser, subject to review of the Board of Trustees. Short-term investments in fixed income securities with maturities of less than 60 days when acquired, or which subsequently are within 60 days of maturity, are valued by using the amortized cost method of valuation, which the Board has determined will represent fair value. Generally, fixed income securities are categorized as level 2.
In accordance with the Trust’s good faith pricing guidelines, the Adviser is required to consider all appropriate factors relevant to the value of securities for which it has determined other pricing sources are not available or reliable as described above. There is no single standard for determining fair value controls, since fair value depends upon the circumstances of each individual case. As a general principle, the current fair value of an issue of securities being valued by the Adviser would appear to be the amount which the owner might reasonably expect to receive for them upon their current sale. Methods which are in accordance with this principle may, for example, be based on (i) a multiple of earnings; (ii) a discount from market of a similar freely traded security (including a derivative security or a basket of securities traded on other markets, exchanges or among dealers); or (iii) yield to maturity with respect to debt issues, or a combination of these and other methods.
The following table summarizes the inputs used to value the Fund’s assets measured at fair value as of December 31, 2015:
| Valuation Inputs of Assets | | Level 1 | | Level 2 | | Level 3 | | Total |
| Common Stocks | | $18,221,438 | | $0 | | $0 | | $18,221,438 |
| Total Investments in Securities | | $18,221,438 | | $0 | | $0 | | $18,221,438 |
Refer to the Fund’s Schedule of Investments for a listing of securities by industry. The Fund did not hold any Level 3 assets during the fiscal year ended December 31, 2015. There were no transfers into or out of the levels during the fiscal year ended December 31, 2015. It is the Fund’s policy to consider transfers into or out of the levels as of the end of the reporting period.
The Fund did not invest in derivative instruments during the fiscal year ended December 31, 2015.
4.) INVESTMENT ADVISORY AGREEMENT AND RELATED PARTY TRANSACTIONS
The Fund has entered into an investment advisory agreement (“Management Agreement”) with the Adviser. The Adviser manages the investment portfolio of the Fund, subject to policies adopted by the Trust’s Board of Trustees, and, at its own expense and without reimbursement from the Fund, furnishes office space and all necessary office facilities, equipment, and executive personnel necessary for managing the Fund. The Adviser pays the expenses of the Fund except for the management fee, all brokerage fees and commissions, taxes, borrowing costs (such as (a) interest and (b) dividend expenses on securities sold short), fees and expenses of acquired funds, extraordinary or non-recurring expenses as may arise, including litigation to which the Fund may be a party and indemnification of the Trust’s Trustees and officers with respect thereto. For its services, the Adviser receives a management fee equal to 1.50% of the average daily net assets of the Fund.
For the fiscal year ended December 31, 2015, the Adviser earned management fees totaling $212,372, of which $25,297 was due to the Adviser at December 31, 2015.
5.) CAPITAL SHARES
The Trust is authorized to issue an unlimited number of shares of beneficial interest. Paid-in capital at December 31, 2015, was $18,967,249 representing 856,243 shares outstanding.
13
Notes to Financial Statements - continued
6.) RELATED PARTY TRANSACTIONS
Mr. Jeffrey R. Provence of Premier Fund Solutions, Inc. (the “Administrator”) also serves as trustee/officer of the Fund. This individual receives benefits from the Administrator resulting from administration fees paid to the Administrator of the Fund by the Adviser.
The Trustees who are not interested persons of the Trust each received received $1,000, for a total of $3,000, in Trustees’ fees plus travel and related expenses related to the Bretton Fund for the fiscal year ended December 31, 2015. Under the Management Agreement, the Adviser pays these fees.
7.) PURCHASES AND SALES OF SECURITIES
For the fiscal year ended December 31, 2015, purchases and sales of investment securities other than U.S. Government obligations and short-term investments aggregated $13,922,033 and $3,447,430, respectively. Purchases and sales of U.S. Government obligations aggregated $0 and $0, respectively.
8.) CONTROL OWNERSHIP
The beneficial ownership, either directly or indirectly, of more than 25% of the voting shares of a fund creates a presumption of control of the Fund, under Section 2(a)(9) of the Investment Company Act of 1940. As of December 31, 2015, YDB LLC, located in California 95476 beneficially held, in aggregate, approximately 32.95% of the Fund and therefore, also may be deemed to control the Fund.
9.) TAX MATTERS
For Federal income tax purposes, the cost of investments owned at December 31, 2015, was $17,054,124. At December 31, 2015, the composition of unrealized appreciation (the excess of value over tax cost) and depreciation (the excess of tax cost over value) was as follows:
| | Appreciation | | (Depreciation) | | Net Appreciation (Depreciation) |
| | $2,471,235 | | ($1,303,921) | | $1,167,314 |
| The tax character of distributions was as follows: | | |
| |
| | | 2015 | | 2014 |
| Ordinary Income . | | $ 11 | | $ 5,848 |
| Long-Term Capital Gain | | 37,504 | | -0- |
| | | $ 37,515 | | $ 5,848 |
As of December 31, 2015, the components of distributable earnings (accumulated losses) on a tax basis were as follows:
| Undistributed long-term capital gain/(accumulated losses) | | $ 396,219 |
| Unrealized appreciation/(depreciation) | | 1,167,314 |
| | | $ 1,563,533 |
As of December 31, 2015, there were no differences between book basis and tax basis unrealized appreciation.
10.) SUBSEQUENT EVENTS
Subsequent events after the date of the Statement of Assets and Liabilities have been evaluated through the date the financial statements were issued. Management has concluded that there is no impact requiring adjustment or disclosure in the financial statements.
14
Additional Information
December 31, 2015
(Unaudited)
1.) AVAILABILITY OF QUARTERLY SCHEDULE OF INVESTMENTS
The Fund files its complete schedule of portfolio holdings with the Securities and Exchange Commission (“SEC”) for the first and third quarters of each fiscal year on Form N-Q. The Fund’s Form N-Q is available on the SEC’s website at http://www.sec.gov. The Fund’s Form N-Q may also be reviewed and copied at the SEC’s Public Reference Room in Washington, DC. Information on the operation of the Public Reference Room may be obtained by calling 800.SEC.0330.
2.) PROXY VOTING GUIDELINES
Bretton Capital Management, LLC, the Fund’s investment adviser (“Adviser”), is responsible for exercising the voting rights associated with the securities held by the Fund. A description of the policies and procedures used by the Adviser in fulfilling this responsibility is available without charge on the Fund’s website at www.brettonfund.com. It is also included in the Fund’s Statement of Additional Information, which is available on the SEC’s website at http://www.sec.gov.
Information regarding how the Fund voted proxies, Form N-PX, relating to portfolio securities during the most recent 12-month period ended June 30, is available without charge, upon request, by calling our toll free number (800.231.2901) . This information is also available on the SEC’s website at http://www.sec.gov.
3.) DISCLOSURE OF EXPENSES
As a shareholder of the Fund, you incur ongoing expenses consisting solely of management fees. You will be assessed fees for outgoing wire transfers, returned checks and stop payment orders at prevailing rates charged by Mutual Shareholder Services, LLC, the Fund’s transfer agent, and IRA accounts will be charged an $8.00 annual maintenance fee. This Example is intended to help you understand your ongoing costs (in dollars) of investing in the Fund and to compare these costs with the ongoing costs of investing in other mutual funds.
The Example is based on an investment of $1,000 invested in the Fund on July 1, 2015, and held through December 31, 2015.
Actual Expenses
The first line of the table below provides information about actual account values and actual expenses. You may use the information in this line, together with the amount you invested, to estimate the expenses that you paid over the period. Simply divide your account value by $1,000 (for example, an $8,600 account value divided by $1,000 = 8.6), then multiply the result by the number in the first line under the heading entitled “Expenses Paid During Period” to estimate the expenses you paid on your account during this period.
Hypothetical Example for Comparison Purposes
The second line of the table below provides information about hypothetical account values and hypothetical expenses based on the Fund’s actual expense ratio and an assumed rate of return of 5% per year before expenses, which is not the Fund’s actual return. The hypothetical account values and expenses may not be used to estimate the actual ending account balance or expenses you paid for the period. You may use this information to compare the ongoing costs of investing in this Fund and other funds. To do so, compare this 5% hypothetical example with the 5% hypothetical examples that appear in the shareholder reports of the other funds.
Please note that the expenses shown in the table are meant to highlight your ongoing costs only and do not reflect any transactional costs, such as sales charges (loads) or the charges assessed by Mutual Shareholder Services, LLC as described above. Therefore, the second line of the table is useful in comparing ongoing costs only, and will not help you determine the relative cost of owning different funds. In addition, if these transactional costs were included, your cost could have been higher.
15
| Additional Information (Unaudited) - continued | | |
| |
| | | | | | | Expenses Paid |
| | | Beginning | | Ending | | During the Period* |
| | | Account Value | | Account Value | | July 1, 2015 to |
| | | July 1, 2015 | | December 31, 2015 | | December 31, 2015 |
| |
| Actual | | $1,000.00 | | $930.10 | | $7.30 |
| |
| Hypothetical | | $1,000.00 | | $1,017.64 | | $7.63 |
| (5% annual return | | | | | | |
| before expenses) | | | | | | |
* Expenses are equal to the Fund’s annualized expense ratio of 1.50%, multiplied by the
average account value over the period, multiplied by 184/365 (to reflect the one-half year
period ended December 31, 2015). |
16
REPORT OF INDEPENDENT REGISTERED PUBLIC ACCOUNTING FIRM
To the Shareholders of Bretton Fund and
Board of Trustees of PFS Funds
We have audited the accompanying statement of assets and liabilities, including the schedule of investments, of Bretton Fund (the "Fund"), a series of PFS Funds, as of December 31, 2015, and the related statement of operations for the year then ended, the statements of changes in net assets for each of the two years in the period then ended, and the financial highlights for each of the five years in the period then ended. These financial statements and financial highlights are the responsibility of the Fund's management. Our responsibility is to express an opinion on these financial statements and financial highlights based on our audits.
We conducted our audits in accordance with the standards of the Public Company Accounting Oversight Board (United States). Those standards require that we plan and perform the audit to obtain reasonable assurance about whether the financial statements and financial highlights are free of material misstatement. An audit includes examining, on a test basis, evidence supporting the amounts and disclosures in the financial statements. Our procedures included confirmation of securities owned as of December 31, 2015, by correspondence with the custodian. An audit also includes assessing the accounting principles used and significant estimates made by management, as well as evaluating the overall financial statement presentation. We believe that our audits provide a reasonable basis for our opinion.
In our opinion, the financial statements and financial highlights referred to above present fairly, in all material respects, the financial position of Bretton Fund as of December 31, 2015, the results of its operations for the year then ended, the changes in its net assets for each of the two years in the period then ended, and the financial highlights for each of the five years in the period then ended, in conformity with accounting principles generally accepted in the United States of America.

COHEN FUND AUDIT SERVICES, LTD.
Cleveland, Ohio
February 19, 2016
17
Trustees and Officers (Unaudited)
The Board of Trustees supervises the business activities of the Trust. The names of the Trustees and executive officers of the Trust are shown below. For more information regarding the Trustees, please refer to the Statement of Additional Information, which is available upon request by calling 800.231.2901. Each Trustee serves until the Trustee sooner dies, resigns, retires, or is removed.
The Trustees and Officers of the Trust and their principal business activities during the past five years are:
Interested Trustees and Officers
| | | | | Number of | |
| | | | Principal | Portfolios In | Other |
| Name, | Position(s) | Term of Office | Occupation(s) | Fund | Directorships |
| Address(1), | Held With | and Length of | During | Complex | Held By |
| and Year of Birth | the Trust | Time Served | Past 5 Years | Overseen By | Trustee |
| | | | | Trustee | |
| |
| Ross C. Provence, | President | Indefinite Term; | General Partner and Portfolio | N/A | N/A |
| Year of Birth: 1938 | | Since 2000 | Manager for Value Trend Capital | | |
| | | | Management, LP (1995 to current). | | |
| | | | Estate planning attorney (1963 to | | |
| current). |
| |
| Jeffrey R. Provence(2), | Trustee, | Indefinite Term; | CEO, Premier Fund Solutions, Inc. | 11 | Blue Chip |
| Year of Birth: 1969 | Secretary | Since 2000 | (2001 to current). General Partner | | Investor Funds |
| | and | | and Portfolio Manager for Value | | |
| | Treasurer | | Trend Capital Management, LP | | |
| | | | (1995 to current). | | |
| |
| Julian G. Winters, | Chief | Chief | Managing Member, Watermark | N/A | N/A |
| Year of Birth: 1968 | Compliance | Compliance | Solutions LLC (investment compli- | | |
| | Officer | Officer Since | ance and consulting) since March | | |
| | | 2010 | 2007. | | |
(1) The address of each trustee and officer is c/o PFS Funds, 1939 Friendship Drive, Suite C, El Cajon, California 92020.
(2) Jeffrey R. Provence is considered an "interested person" as defined in Section 2(a)(19) of the Investment Company Act of 1940 by
virtue of his position with the Trust.
Independent Trustees |
| | | | | Number of | |
| | | | Principal | Portfolios In | Other |
| Name, | Position | Term of Office | Occupation(s) | Fund | Directorships |
| Address(1), | Held With | and Length of | During | Complex | Held By |
| and Year of Birth | the Trust | Time Served | Past 5 Years | Overseen By | Trustee |
| | | | | Trustee | |
| |
| Thomas H. Addis III, | Independent | Indefinite Term; | Executive Director/CEO, Southern | 11 | None |
| Year of Birth: 1945 | Trustee | Since 2000 | California PGA (2006 to current). | | |
| |
| Allen C. Brown, | Independent | Indefinite Term; | Co-owner of Stebleton & Brown | 11 | Blue Chip |
| Year of Birth: 1943 | Trustee | Since 2010 | (1994 to current). Estate planning | | Investor Funds |
| | | | and business attorney (1970 to cur- | | |
| rent). |
| |
| George Cossolias, CPA, | Independent | Indefinite Term; | Partner of CWDL, CPAs (February 1, | 11 | Blue Chip |
| Year of Birth: 1935 | Trustee | Since 2000 | 2014 to current). Owner of George | | Investor Funds |
| | | | Cossolias & Company, CPAs (1972 | | |
| | | | to January 31, 2014). President of | | |
| | | | LubricationSpecialists, Inc. (1996 to | | |
| current). |
(1) The address of each trustee and officer is c/o PFS Funds, 1939 Friendship Drive, Suite C, El Cajon, California 92020.
18

Investment Adviser
Bretton Capital Management, LLC
Legal Counsel
The Law Offices of John H. Lively
A member firm of The 1940 Act Law GroupTM
Custodian
US Bank N.A.
Dividend Paying Agent,
Shareholders' Servicing Agent,
Transfer Agent
Mutual Shareholder Services, LLC
Fund Administrator
Premier Fund Solutions, Inc.
Independent Registered Public Accounting Firm
Cohen Fund Audit Services, Ltd. |
This report is provided for the general information of the shareholders of the Bretton
Fund. This report is not intended for distribution to prospective investors in the Fund,
unless preceded or accompanied by an effective prospectus. |
Item 2. Code of Ethics.
The registrant has adopted a code of ethics that applies to the registrant’s principal executive officer and the principal financial officer. The registrant has not made any amendments to its code of ethics during the covered period. The registrant has not granted any waivers from any provisions of the code of ethics during the covered period. A copy of the registrant’s Code of Ethics is filed herewith.
Item 3. Audit Committee Financial Expert.
The registrant’s Board of Trustees has determined that George Cossolias is an audit committee finical expert. Mr. Cossolias is independent for purposes of this Item 3.
Item 4. Principal Accountant Fees and Services.
(a-d) The following table details the aggregate fees billed for each of the last two fiscal years for audit fees, audit-related fees, tax fees and other fees by the principal accountant to the registrant. The principal accountant has provided no services to the adviser or any entity controlled by, or under common control with the adviser that provides ongoing services to the registrant.
| | | FYE 12/31/15 | | FYE 12/31/14 |
| Audit Fees | | $13,250 | | $13,310 |
| Audit-Related Fees | | $0 | | $0 |
| Tax Fees | | $2,500 | | $2,500 |
| All Other Fees | | $750 | | $750 |
Nature of Tax Fees: preparation of Excise Tax Statement and 1120 RIC. Nature of All Other Fees: Review of Semi-Annual Report.
| (e) (1) The audit committee approves all audit and non-audit related services and, therefore, has not adopted |
| pre-approval policies and procedures described in paragraph (c)(7) of Rule 2-01 of Regulation S-X. |
(e) (2) None of the services described in paragraph (b) through (d) of this Item were approved by the audit committee pursuant to paragraph (c)(7)(i)(C) of Rule 2-01 of Regulation S-X.
(f) All of the principal accountant’s hours spent on auditing the registrant’s financial statements were attributed to work performed by full-time permanent employees of the principal accountant.
(g) The following table indicates the aggregate non-audit fees billed by the registrant’s principal accountant for services to the registrant , the registrant’s investment adviser (not sub-adviser), and any entity controlling, controlled by, or under common control with the adviser that provides ongoing services to the registrant, for the last two years.
| Non-Audit Fees | | FYE 12/31/15 | | FYE 12/31/14 |
| Registrant | | $3,250 | | $3,250 |
| Registrant’s Investment Adviser | | $0 | | $0 |
(h) The principal accountant provided no services to the investment adviser or any entity controlling, controlled by, or under common control with the adviser that provides ongoing services to the registrant.
Item 5. Audit Committee of Listed Companies. Not applicable.
Item 6. Schedule of Investments. Schedule filed with Item 1.
Item 7. Disclosure of Proxy Voting Policies and Procedures for Closed-End Management Investment Companies. Not applicable.
Item 8. Portfolio Managers of Closed End Management Investment Companies. Not applicable.
Item 9. Purchases of Equity Securities by Closed-End Management Investment Companies and Affiliated Purchasers. Not applicable.
Item 10. Submission of Matters to a Vote of Security Holders.
The registrant has not adopted procedures by which shareholders may recommend nominees to the registrant’s board of trustees.
Item 11. Controls and Procedures.
(a) The registrant’s president and chief financial officer concluded that the disclosure controls and procedures (as defined in Rule 30a-3(c) under the Investment Company Act of 1940 (the “Act”)) were effective as of a date within 90 days of the filing date of this report, based on the evaluation of these controls and procedures required by Rule 30a-3(b) under the Act.
(b) There were no changes in the registrant’s internal control over financial reporting (as defined in Rule 30a-3(d) under the Act) that occurred during the registrant’s second fiscal quarter of the period covered by this report that have materially affected, or are reasonably likely to materially affect, the registrant’s internal control over financial reporting.
Item 12. Exhibits.
(a)(1) Code of Ethics. Filed herewith.
(a)(2) Certifications pursuant to Section 302 of the Sarbanes-Oxley Act of 2002. Filed herewith.
(a)(3) Not applicable.
(b) Certification pursuant to Section 906 Certification of the Sarbanes-Oxley Act of 2002. Filed herewith.
SIGNATURES
Pursuant to the requirements of the Securities Exchange Act of 1934 and the Investment Company Act of 1940, the registrant has duly caused this report to be signed on its behalf by the undersigned, thereunto duly authorized.
| | By: /s/Ross C. Provence
Ross C. Provence
President |
Pursuant to the requirements of the Securities Exchange Act of 1934 and the Investment Company Act of 1940, this report has been signed below by the following persons on behalf of the registrant and in the capacities and on the dates indicated.
| | By: /s/Ross C. Provence
Ross C. Provence
President |
| | By: /s/Ross C. Provence
Jeffrey R. Provence
Chief Financial Officer |