UNITED STATES
SECURITIES AND EXCHANGE COMMISSION
WASHINGTON, D.C. 20549
FORM N-CSR
CERTIFIED SHAREHOLDER REPORT OF REGISTERED MANAGEMENT INVESTMENT COMPANIES
Investment Company Act file number 811-09781
PFS Funds
(Exact name of registrant as specified in charter)
1939 Friendship Drive, Suite C, El Cajon, CA 92020
(Address of principal executive offices) (Zip code)
CT Corporation System
155 Federal St., Suite 700, Boston, MA 02110
(Name and address of agent for service)
Registrant's telephone number, including area code: (619) 588-9700
Date of fiscal year end: June 30
Date of reporting period: June 30, 2015
Form N-CSR is to be used by management investment companies to file reports with the Commission not later than 10 days after the transmission to stockholders of any report that is required to be transmitted to stockholders under Rule 30e-1 under the Investment Company Act of 1940 (17 CFR 270.30e -1). The Commission may use the information provided on Form N-CSR in its regulatory, disclosure review, inspection and policymaking roles.
A registrant is required to disclose the information specified by Form N-CSR, and the Commission will make this information public. A registrant is not required to respond to the collection of information contained in Form N-CSR unless the Form displays a currently valid Office of Management and Budget ("OMB") control number.
Item 1. Reports to Stockholders.

MOATXInvestor Shares
CASTXClass C
For Investors Seeking Long-Term Capital Appreciation
Annual Report
June 30, 2015
Dear Fellow Shareholders:
We are pleased to present the Annual Report for the Castle Focus Fund (the “Fund”) for the fiscal year ended June 30, 2015.
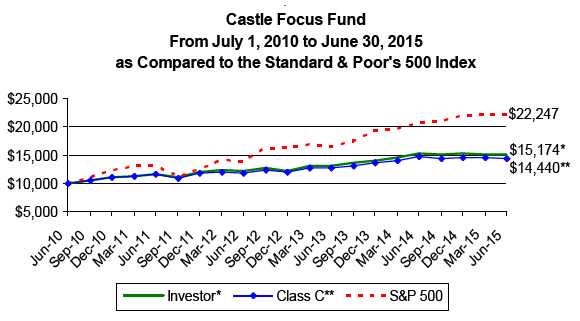
June 30, 2015 marked the five year anniversary of the Fund. During this initial five-year period, the Investor Class Shares of the Fund have experienced an average annual return of 8.70% (C Shares returned 7.63%) . The Fund’s benchmark, the S&P 500® Index, has produced an average annual return of 17.34% over that same five year period. Over the last year, the Investor Class Shares of the Fund have returned -0.53% (C Shares returned -1.52%) while the S&P 500 ® Index has advanced 7.42% .
We believe that in order to outperform a benchmark over a full market cycle, your portfolio has to be constructed differently than the benchmark. Over the past five years we have looked different than the S&P 500® Index by holding a large cash position (cash and cash equivalents) and a concentrated basket of stocks. While cash has been a drag on performance, its core function within the Fund is the ‘optionality’ it provides us during periods when the market is crowded with sellers and attractive prices arise.
Thank you for your investment in the Castle Focus Fund.
Kind Regards,

Caeli Andrews
Co-Founder, Managing Director
Castle Investment Management | Andrew Welle
Co-Founder, Managing Director
Castle Investment Management |
2015 Annual Report 1
Dear Castle Focus Fund Shareholder:
We are pleased to report the results of our fifth full year as sub-advisor to the Castle Focus Fund (the “Fund”). For the fiscal year ended June 30, 2015, the Investor Class Shares returned -0.53% (Class C Shares returned -1.52%) . Over that same one year period, the S&P 500® Index returned 7.42% . Over the five years that we have subadvised the Fund, the Investor Class Shares have experienced an average annual return of 8.70% (Class C Shares returned 7.63%) .
There were three primary contributing factors to the Fund’s one-year performance relative to its benchmark, the S&P 500® Index:
Select Positions — Several Fund positions enjoyed significant appreciation and were sold over the latter half of 2014 in accordance with our process. Molson Coors, CVS, Novartis and Medtronic all exceeded our estimate of fair value and were sold in entirety. This allowed us to initiate or add to positions in Nestle SA, Philip Morris, ITC Holdings, and Bank of New York Mellon. Over the past year some of our strongest performers have been Express Scripts, Becton Dickinson and W.R. Berkley, while our positions in Energy (namely Schlumberger and Spectra Energy) as well as Basic Materials (Franco Nevada and Royal Gold) have detracted from performance.
Cash Position — The Fund held a sizable position in cash and cash equivalents (“cash”) throughout the year. As of June 30, 2015, we held 30.02% in cash. Although a drag on performance in exuberant markets, cash has been instrumental to our process historically, allowing us to take advantage of compelling valuations when available. As we contend that entry price is a key determinant of performance, cash is a by-product of our strict price discipline.
Spectra Energy — Spectra Energy represents our largest non-cash position in the Fund. Over the Fund’s fiscal year, Spectra’s stock price has declined from roughly $42.45 to $32.60 in concert with the decline in crude oil. We, in-turn, have viewed this decline as an opportunity to add to Spectra, as our holdings in the stock have increased from a 3.99% position at the beginning of the Fund’s fiscal year to now 6.40% of the portfolio.
We view Spectra as a terrific opportunity the market fails to understand, as roughly 80% of revenue is derived from commodity transportation via long-dated contracts. Thus, financial results are largely commodity-price neutral while stock weakness appears primarily tied to the word “Energy” in the company name. Although we are never certain as to timing, we believe our patience will be rewarded should financial results materialize and support our targeted fair value estimate.
Market Comments
“Everything that needs to be said has already been said. But since no one was listening, everything must be said again.”
André Gide
Rarely have market participants placed such confidence in the central banks’ abilities to protect financial markets and rescue economies. As the risk of an eventual Federal Reserve interest rate increase is largely ignored, there exists a widely-held notion that central bankers will make everything all right. We believe that investor memories are short and faith in central banks misplaced.
2015 Annual Report 2
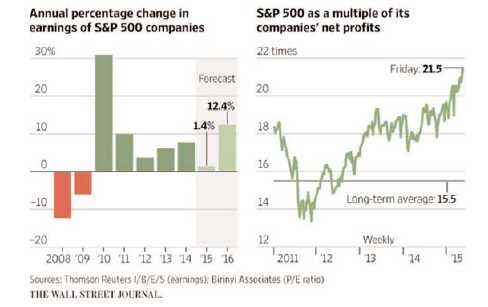
Beneath the seemingly calm surface, the U.S. stock market shows increasing signs of anxiety. The S&P 500 trades at 21.5 times its net earnings for the past 12 months, far above the historical average of 15.5. Further, future earnings growth projections are a mere 1.4% --the worst since the recession ended in 2009, according to Thomson Reuters I/B/E/S. Although major indexes are near record price highs, only half of all stocks listed on the New York Stock Exchange trade above their average prices for the past 30 weeks—an internal weakness that often signals a market change. Of course, as long as market participants believe that central banks hold the answers to any and all problems, the benign financial environment will continue until perceptions meet reality.
Index funds have emerged as the giants of today’s market, accounting for 35% of total assets in all stock mutual funds and exchange-traded funds at the end of 2014 (up from 25% in 2010, according to Empirical Research Partners, a firm in New York). Passive index funds essentially buy and hold all the securities in a market index regardless of valuation. In the past five years, Morningstar estimates that investors pulled $73.6 billion out of “active” U.S. stock funds and added $208.8 billion to “passive” index funds. If investors keep funding vehicles that have no opinion as to which stocks or bonds are better than others, one wonders how prices will be set. What will stop all stocks and bonds from going up and down together?
Last year, according to S&P Dow Jones Indices, 87% of active U.S. equity mutual funds underperformed the S&P Composite 1500 Index, a broad measure of the stock market. As a result, the triumph of indexing seems indisputable. However, financial history teaches us that once financial market participants believe something to be obvious it doesn’t last. As Benjamin Graham warned on the first page of his book The Intelligent Investor, “There are no sure and easy paths to riches on Wall Street or anywhere else.”
History suggests that the popularity, ease and apparent certainty of indexing will leave many of today’s new index owners disappointed. Most people do not have the biological makeup to buy low, hold for an indeterminable period of time, and then sell high--there is an almost irresistible human urge to stay with the consensus. Retail and professional investors alike fear acting differently -- motivated by heightened sensitivity to periods of underperfor-mance. Of course, owning the market cannot give an investor returns that are different from the market. As a result, the more people index their investments, the better the opportunity for those who do the opposite and conduct fundamental research.
2015 Annual Report 3
Howard Marks, chairman of Oaktree Capital Management in Los Angeles, wrote last year that “Unconventional behavior is the only road to superior investment results, but it isn't for everyone.” Clearly, if unconventional behavior were for everyone, then it would no longer be unconventional. Indexing allocates capital not as it should be allocated—according to the marginal return on invested capital—but rather according to fluctuations in the market capitalization of the underlying assets. In a normal world, investors should expect the distribution of asset performances to be wide and uneven. In fact, a large dispersion of investment performance should ensure that capital is being properly allocated. Instead, capital is today increasingly allocated according to the market capitalization of the assets under consideration, as capital is progressively directed to an investment if it outperforms. In simple terms, this means that capital is allocated to companies with rising stock prices, not on returns on invested capital. Today indexing has become the dominant asset management style. Investments dictated by changes in market capitalization are another way of saying that capital is now deployed according to momentum-based rules.
Logically, if investors always followed a “return to the mean” investment approach; meaning, when the price movements of an asset became excessive compared to its expected return on investment capital (ROIC), then one bought—or sold—the asset. With capital increasingly allocated towards marginal variations in the price of the asset, the more the asset goes up in price, the more index managers invest in the asset. Likewise, the more the asset goes down in price, the less the index managers own. A return to the mean methodology leads naturally to a more stable, but moving, equilibrium. Momentum-based investing predictably creates market environments where asset prices swing wildly from booms to busts and back again. Coupled with the current monetary policy advocated by central banks, these price swings will grow more pronounced—both up and down.
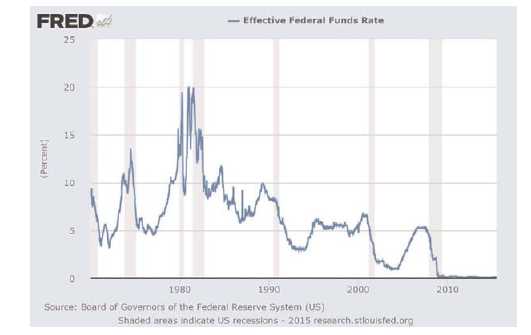
The short term rate of the Federal Reserve Board, officially known as the Federal Funds Rate, continues to stand at 0% since the financial crisis in 2008. The Federal Reserve has never lowered and kept its short-term interest rate at zero percent, let alone for more than six years. And yet, after years of staying on the sidelines, the individual investor is once again being drawn to the price action in the stock market. Investing in stocks is once again popular because investors increasingly believe that there is no other investment choice other than investing in stocks. Bank savings accounts yield nothing; bonds are universally labeled as ‘bad’, and, in the long term, one ‘always wins’ with stocks.
2015 Annual Report 4
Today, the higher that asset prices climb, the less performance dispersion among investors, as each index investor increasingly owns the same assets in the same size. Strangely enough, the goal of every socialist experiment is for everybody to earn the same amount of money—in today’s investment landscape, we appear to have achieved the same utopian socialist result. Unfortunately, our collective investment capital is being massively misallo-cated. And, yet, economists wonder why they see no economic growth.
As Charles Hugh Smith from the website “Of Two Minds” suggests, think of current central bank policies as similar to monoculture agriculture practices where a farmer grows a single crop in a field at a time. At first, the farmer deploys large amounts of nitrogen and phosphate fertilizers, herbicides and pesticides across the fields which, in turn, yield bumper crops.
In similar fashion, the Federal Reserve’s zero percent interest rate policy and massive injections of credit appear to work wonders on the economy and financial markets. Unfortunately, the magic of flooding the farm fields with fertilizer does not last forever. The soil is eventually stripped of nutritional value and crop yields plummet. Likewise, the marginal investment returns diminish over time when central banks flood the economy with credit: only marginal borrowers and the riskiest speculation remain. Similar to insects developing resistance to pesticides, the economy develops resistance to cheap credit. Because interest rates cannot fall much below zero, investment gains stagnate. The economy has pulled forward future demand—qualified borrowers have already bought a new vehicle or home. As flooding a field with fertilizers and pesticides does not restore the soil, flooding the financial system with liquidity and cheap credit does not restore health to a stripped economy. Just as monoculture agriculture erodes the soil, financialization hollows out the economy and strips away the values that underpin a sustainable and healthy economic expansion.
This increasingly short term focus on economic results by bank officials goes against numerous studies by psychologists which demonstrate that people who can focus their minds on more distant objects tend to have greater self-control and a heightened ability to defer gratification. Studies of individual and institutional investors find that those who trade less earn more—partly because more trading generates realized gains subject to taxes in addition to brokerage commission costs. Because many investors exhibit a habit of buying what is hot right before it goes cold and selling what is cold just before it turns hot, investors squander their greatest advantage—time. Investors cannot compete in a high-speed race that even most professional trading firms lose. “Time arbitrage”— the ability to invest on a longer horizon than most other people—is harder than ever for many investors, who are compelled to measure whether they are beating the market this year, this month, this week, this day, this hour, this minute.
As Warren Buffett wrote in 1991, “the stock market serves as a relocation center at which money is moved from the active to the patient.” Let the rest of the world grow ever more impatient. In the long run, we believe that less trading equals greater gains.
According to the New York Stock Exchange (NYSE), annualized turnover—the rate at which stocks are bought and sold—is down to 63% from a high of 110% in 2010. If a 100% annual turnover rate equals a holding period of one year, a 63% rate implies that investors are holding the average NYSE stock for 19 months at a time, up from an average of 11 months five years ago. Mark Twain’s quote “Lies, damned lies, and statistics” would best describe this turnover data. Far from market participants growing more patient, investors are actually jumpier when one considers that the NYSE turnover figures only cover those stocks listed and traded on the New York Stock Exchange. Many of the same stocks also trade elsewhere; about three-quarters of the total volume for these stocks occur on other
2015 Annual Report 5
exchanges and trading platforms. Including trades on all marketplaces, the annual turnover rate in U.S. stocks is actually running at 307% so far this year, up from 303% in 2014, according to investment bank Credit Suisse. Although turnover peaked at 481% in 2009, today’s average holding period still only amounts to seventeen weeks. This turnover figure does not include exchange-traded funds (ETFs) which, according to John Bogle, founder of the Vanguard Group, the twenty largest ETFs traded last year at an average turnover rate of 1,244%. That figure includes activity by individual and institutional investors as well as high-frequency traders who rapidly buy and sell via computer. A 1,244% turnover rate implies a holding period of only 29 days—a period of time that is completely disconnected from fundamental investing.
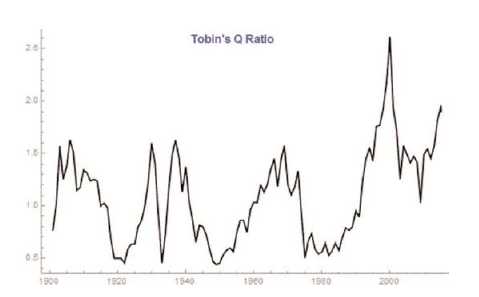
More evidence of this detachment from reality can be found in a statistic known as Tobin’s Q ratio, a way of measuring equity valuations developed by the late Nobel Prize-winning Yale economist James Tobin. Tobin’s Q compares the total value of stocks against the replacement value of the underlying assets (inventory, equipment, buildings, property, etc.). In a simple math exercise, the underlying assets of the companies in the market are subtracted from the overall market value. If there is residual cash, essentially indicating that the market is trading above replacement cost, then Professor Tobin would consider the stock market overvalued. Today, based on the current Tobin Q ratio, stocks are currently more overvalued than at any time in history with the exception of the 1999 technology bubble.
Logically, if the average company becomes higher valued relative to its tangible capital, this implies the company earns high returns on its existing equipment. If so, the company will allocate more capital to investments in equipment. The company’s subsequent growth from the additional investment should, in turn, generate a higher valuation in the market; thereby paying for the additional investment. But in an efficient and competitive market, each additional increase of investment leads to smaller increases in valuation, and the average company’s Q ratios subsequently reverts back to the mean. Correspondingly, if the average company’s Q ratio is too low, then one assumes the company will dispose of equipment, or at least stop replacing it—therefore pushing Q ratios back up.
We believe the Q ratio’s doubling, since 2009, is an unsustainable symptom of companies diverting money from their businesses and over to the stock market, choosing buybacks over capital spending. An extended period of zero percent interest rates continues to elevate the paper value of assets over the underlying tangible physical assets, as corporate investment in physical plant and equipment lags, while purchases of paper stock escalate.
2015 Annual Report 6
With equity prices surging and investment growth lagging, the Q ratio stands 58% above its average since 1900, according to data maintained by the U.S. Federal Reserve. This unnatural environment carries negative implications for long term economic growth.
Corporate America now practices policies that we believe virtually ensure the value of publicly-traded equity outpaces the replacement costs of underlying assets. Companies use today’s record low interest rates and insatiable investor appetite for corporate bonds to issue record amounts of debt. The problem is that money raised from new debt issuance is not allocated to capital expenditures in order to generate future growth but, rather, towards stock buybacks. Standard & Poor’s 500 Index members last year spent 95% of their profits on share buybacks and dividends according to data compiled by S&P Dow Jones Indices. Through April of this year, companies announced $400 billion of buybacks, with February, March and April ranking as three of the four busiest months in history.
Investors must now navigate a market where stocks climb higher thanks to a perpetual bid from price insensitive corporate management teams repurchasing expensively-valued stock. As a consequence of artificially low interest rates, corporate balance sheets grow increasingly leveraged while investments in productive assets deteriorate. Eventually, the long-term impact will be sluggish top line revenue growth and, in turn, the strained ability to service debt costs once interest rates normalize at higher levels.
In finance, a “black swan” is a major event that ‘comes out of the blue’. Of course, a stock market decline should not be a complete surprise as the market’s valuation resides at what we believe are unsustainable levels. Every market-based economy contains negative feedback loops that should logically prevent massive valuation swings. Unfortunately, we now operate in a market subject to intervention by non-market forces, primarily central banks. For example, when interest rates are naturally low, caused by an abundance of patient savers, businesses spend on investment and production. When interest rates are artificially low, savers chase yield through leverage while businesses spend on stock buybacks and dividends in order to attract the investors who desire yields beyond what the artificially distorted market offers. This artificial dynamic drives stocks and, subsequently, valuations higher.
2015 Annual Report 7
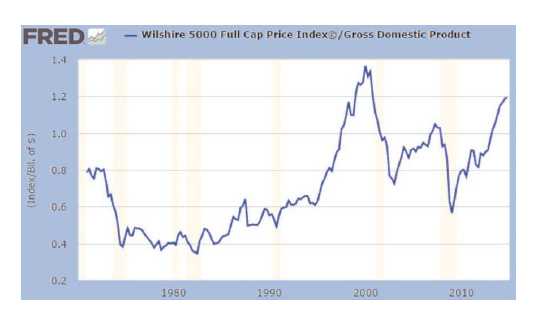
Other value-based indicators with reliable long-term track records echo the same warning as the Tobin Q ratio. The Wilshire5000/GDP ratio provides a simple way of comparing the stock market’s equity capitalization against the country’s economic output. Currently, the Wilshire5000/GDP ratio stands 15% higher than at the 2007 market peak, although, like Tobin’s Q ratio, it still sits below the high reached during the dot-com bubble. Nobody should be surprised if stocks drop in order for valuations to return to, or below, their historic valuations. But, of course, almost everyone will be surprised.
Market drops are not dreaded “black swan” events. They are logically predictable; the same logic that says governments cannot manipulate market prices without creating distortions that will always prove counterproductive. Any time the market falls, we are told that the fault resides in some surprising economic or geopolitical shock. An unexpected event might serve as a proximate cause but not the ultimate cause. The ultimate cause is the same ultimate cause that has been demonstrated historically: artificially distorted markets push asset valuations to unsustainable levels. The markets are speaking to us yet again. This time around, we need to listen.
Investment Philosophy
“At the root of value investing is the belief, first espoused by Benjamin Graham, that the market is a voting machine and not a weighing machine. Thus an investor must have more confidence in his or her own opinion than in the combined weight of all other opinions. This borders on arrogance, the necessary arrogance that is required to make investment decisions. This arrogance must be tempered with extreme caution, giving due respect to the opinions of others, many of whom are very intelligent and hard working. Their sale of shares to you at a seeming bargain price may be the result of ignorance, emotion or various institutional constraints, or it may be that the apparent bargain is in fact flawed, that it is actually fairly priced or even overvalued and that sellers know more than you do. This is a serious risk, but one that can be mitigated first by extensive fundamental analysis and second by knowing not only that something is bargain-priced but, as best you can, also why it is so. You never know for certain why sellers are getting out but you may be able to reasonably surmise a rationale.”
Seth Klarman
The stock market is not a machine that assigns prices based on a calm and objective assessment of value. In fact, when it comes to value, the stock market is totally clueless. This reality is contrary to the way many strategists and analysts portray the market — they discuss the stock market as if it were an all-seeing prophet. However, if this were true then dramatic price swings would never occur. The simple fact that such price adjustments occur quite often reflects the reality that the stock market is composed of a manic-depressive crowd which is typically far too optimistic or far too pessimistic.
We view the stock market as an emotional pendulum — the further it swings in one direction the closer it comes to swinging back in the other direction. Unfortunately, there are no rigid benchmarks and we can never be sure that the pendulum has swung as far in one direction as it is going to go. There is always the possibility that the market pendulum will swing even further.
Echoing André Gide’s sentiments, because everything that needs to be said has already been said but no one was listening, everything must be said again: governments and central banks distort the financial markets. Their actions amplify the market’s emotional pendulum. Due to the central bank’s manipulation of the money supply and interest rates, valuations are able to go much higher during the pendulum’s up swing than would otherwise be
2015 Annual Report 8
possible. As the size of the market’s down swing is typically proportional to the size of the preceding up swing, then we all need to listen to what history teaches us.
We believe that there are two types of investors. There are those investors who see things for what they are, and then there are those investors who see things for what they want them to be. We believe that we see the current environment as it really is and remain ready to act when the market’s perception inevitably meets reality.
Kind Regards,

| Robert J. Mark | Larry J. Redell |
| Portfolio Manager | St. James Investment Company |
| St. James Investment Company | |
Past performance does not guarantee future results. The investment return and principal value of an investment in the Fund will fluctuate so that an investor’s shares, when redeemed, may be worth more or less than their original cost. Current performance may be higher or lower than the performance data quoted. Performance data current to the most recent month end are available by calling 1-877-743-7820.
The Castle Focus Fund’s prospectus contains important information about the Fund’s investment objectives, potential risks, management fees, charges and expenses, and other information and should be read and considered carefully before investing. You may obtain a current copy of the Fund’s prospectus by calling 1-877-743-7820. Distributed by Rafferty Capital Markets, LLC-Garden City, NY 11530.
2015 Annual Report 9
CASTLE FOCUS FUND (Unaudited)
CASTLE FOCUS FUND PERFORMANCE INFORMATION
AVERAGE ANNUALIZED RETURNS AS OF JUNE 30, 2015.
| | | | | | Since | |
| | 1 Year(A) | | 3 Year(A) | | Inception(A) | |
| Investor Shares | -0.53% | | 7.83% | | 8.70% | |
| CLASS C (without CDSC)* | -1.52% | | 6.75% | | 7.63% | |
| CLASS C (with CDSC)* | -2.51% | | 6.75% | | 7.63% | |
| S&P 500 Index (B) | 7.42% | | 17.31% | | 17.34% | |
The Fund's Total Annual Operating Expense Ratios (from November 1, 2014 Prospectus):
Investor Shares – Gross 1.60%, Net 1.36%;
Class C – Gross 2.60%, Net 2.36%
The Fund’s expense ratios for the fiscal year ended June 30, 2015 can be found in the financial highlights included in this report. The Annual Operating Expense Ratios reported above will not correlate to the expense ratio in the Fund’s financial highlights because the financial highlights include only the direct operating expenses incurred by the Fund, not the indirect costs of investing in the Fund.
(A) 1 Year, 3 Year and Since Inception returns include change in share prices and in each case includes reinvestment of any dividends and capital gain distributions. The Castle Focus Fund commenced operations on July 1, 2010.
(B) The S&P 500 Index is an unmanaged index comprised of the stocks of large capitalization issues in the United States and it is considered representative of the U.S. equity markets as a whole.
* Class C shares of the Fund are offered at their NAV without sales charge. However, Class C shares are subject to a contingent deferred sales charge (“CDSC”) of 1% if redeemed within one year of the original purchase date. No CDSC will be charged if redeemed after one year of the purchase date.
PAST PERFORMANCE DOES NOT GUARANTEE FUTURE RESULTS. INVESTMENT RETURN AND PRINCIPAL VALUE WILL FLUCTUATE SO THAT SHARES, WHEN REDEEMED, MAY BE WORTH MORE OR LESS THAN THEIR ORIGINAL COST. RETURNS DO NOT REFLECT THE DEDUCTION OF TAXES THAT A SHAREHOLDER WOULD PAY ON FUND DISTRIBUTIONS OR THE REDEMPTION OF FUND SHARES. CURRENT PERFORMANCE MAY BE LOWER OR HIGHER THAN THE PERFORMANCE DATA QUOTED. TO OBTAIN PERFORMANCE DATA CURRENT TO THE MOST RECENT MONTH END, PLEASE CALL 1-877-743-7820. AN INVESTMENT IN THE FUND IS SUBJECT TO INVESTMENT RISKS, INCLUDING THE POSSIBLE LOSS OF THE PRINCIPAL AMOUNT INVESTED. THE FUND'S DISTRIBUTOR IS RAFFERTY CAPITAL MARKETS, LLC.
2015 Annual Report 10
CASTLE FOCUS FUND (Unaudited)
Castle Focus Fund
by Sectors (as a percentage of Net Assets)
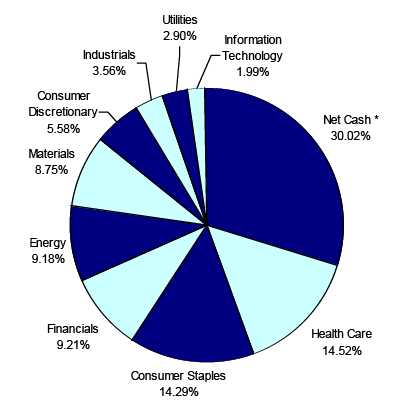
*Net Cash represents cash equivalents and other assets less liabilities.
Availability of Quarterly Schedule of Investments
The Fund files its complete schedule of portfolio holdings with the Securities and Exchange Commission (“SEC”) for the first and third quarters of each fiscal year on Form N-Q. The Fund’s Form N-Q is available on the SEC's website at http://www.sec.gov. The Fund’s Form N-Q may also be reviewed and copied at the SEC's Public Reference Room in Washington, DC. Information on the operation of the Public Reference Room may be obtained by calling 1-800-SEC-0330.
Proxy Voting Guidelines
St. James Investment Company, LLC (the “Sub-Adviser”) is responsible for exercising the voting rights associated with the securities held by the Fund. A description of the policies and procedures used by the Sub-Adviser in fulfilling this responsibility is available without charge by calling 1-877-743-7820. It is also included in the Fund’s Statement of Additional Information, which is available on the SEC’s website at http://www.sec.gov.
Information regarding how the Fund voted proxies, Form N-PX, relating to portfolio securities during the most recent 12-month period ended June 30, is available without charge, upon request, by calling 1-877-743-7820. This information is also available on the SEC’s website at http://www.sec.gov.
2015 Annual Report 11
Disclosure of Expenses (Unaudited)
As a shareholder of the Fund, you incur two types of costs: (1) transaction costs, including sales charges (loads) on purchase payments; and (2) ongoing costs, including management fees; service fees; a distribution fee (12b-1); shareholder service fees; and other Fund expenses. This Example is intended to help you understand your ongoing costs (in dollars) of investing in the Fund and to compare these costs with the ongoing costs of investing in other mutual funds. You will be assessed fees for outgoing wire transfers, returned checks and stop payment orders at prevailing rates charged by Mutual Shareholder Services, LLC, the Fund’s transfer agent, and IRA accounts will be charged an $8.00 annual maintenance fee. Additionally, if Fund shares are redeemed within 90 days of purchase from the Fund, the shares are subject to a 2% redemption fee. Class C shares may be charged a contingent deferred sales charge (“CDSC”) of 1% on shares redeemed within one year of purchase. When applicable, such CDSC would be in addition to the above stated redemption fee for a maximum charge of 3%.
The Example is based on an investment of $1,000 invested at the beginning of the period and held for the period January 1, 2015 through June 30, 2015.
Actual Expenses
The first line of the table below provides information about actual account values and actual expenses. You may use the information in this line, together with the amount you invested, to estimate the expenses that you paid over the period. Simply divide your account value by $1,000 (for example, an $8,600 account value divided by $1,000 = 8.6), then multiply the result by the number in the first line under the heading entitled "Expenses Paid During Period" to estimate the expenses you paid on your account during this period.
Hypothetical Example for Comparison Purposes
The second line of the table below provides information about hypothetical account values and hypothetical expenses based on the Fund's actual expense ratio and an assumed rate of return of 5% per year before expenses, which is not the Fund's actual return. The hypothetical account values and expenses may not be used to estimate the actual ending account balance or expenses you paid for the period. You may use this information to compare the ongoing costs of investing in this Fund and other funds. To do so, compare this 5% hypothetical example with the 5% hypothetical examples that appear in the shareholder reports of the other funds.
Please note that the expenses shown in the table are meant to highlight your ongoing costs only and do not reflect any transactional costs, such as redemption fees, CDSC, or the charges assessed by Mutual Shareholder Services, LLC as described above or the expenses of underlying funds. Therefore, the second line of the table is useful in comparing ongoing costs only, and will not help you determine the relative total costs of owning different funds. In addition, if these transactional costs were included, your costs would have been higher.
| Investor Shares | | | | | | |
| | | | | | | Expenses Paid |
| | | Beginning | | Ending | | During the Period* |
| | | Account Value | | Account Value | | January 1, 2015 |
| | | January 1, 2015 | | June 30, 2015 | | to June 30, 2015 |
| |
| Actual | | $1,000.00 | | $994.97 | | $6.63 |
| |
| Hypothetical | | $1,000.00 | | $1,018.15 | | $6.71 |
| (5% annual return | | | | | | |
| before expenses) | | | | | | |
* Expenses are equal to the Fund’s annualized expense ratio of 1.34% for Investor Shares, multiplied
by the average account value over the period, multiplied by 181/365 (to reflect the one-half year
period). |
| Class C | | | | | | |
| | | | | | | Expenses Paid |
| | | Beginning | | Ending | | During the Period* |
| | | Account Value | | Account Value | | January 1, 2015 |
| | | January 1, 2015 | | June 30, 2015 | | to June 30, 2015 |
| |
| Actual | | $1,000.00 | | $990.13 | | $11.55 |
| |
| Hypothetical | | $1,000.00 | | $1,013.19 | | $11.68 |
| (5% annual return | | | | | | |
| before expenses) | | | | | | |
* Expenses are equal to the Fund’s annualized expense ratio of 2.34% for Class C, multiplied by the
average account value over the period, multiplied by 181/365 (to reflect the one-half year period). |
2015 Annual Report 12
| Castle Focus Fund |
| | | | Schedule of Investments |
| | | | | | June 30, 2015 |
| Shares | | Fair Value | | % of Net Assets |
| COMMON STOCKS | | | | | |
| Arrangement of Transportation of Freight & Cargo | | | | | |
| 120,000 | Expeditors International of Washington, Inc. | $ | 5,532,600 | | 3.56 | % |
| Beverages | | | | | | |
| 15,000 | Diageo plc ** | | 1,740,600 | | 1.12 | % |
| Cigarettes | | | | | | |
| 105,000 | Philip Morris International Inc. | | 8,417,850 | | 5.42 | % |
| Electric Services | | | | | |
| 140,000 | ITC Holdings Corp. | | 4,505,200 | | 2.90 | % |
| Fire, Marine & Casualty Insurance | | | | | |
| 150,000 | W.R. Berkley Corporation | | 7,789,500 | | 5.02 | % |
| Food and Kindred Products | | | | | |
| 120,000 | Nestle S.A. ** | | 8,659,200 | | 5.58 | % |
| Gold and Silver Ores | | | | | |
| 100,000 | Franco-Nevada Corporation (Canada) | | 4,765,000 | | 3.07 | % |
| Groceries & Related Products | | | | | |
| 165,000 | Sysco Corp. | | 5,956,500 | | 3.84 | % |
| Industrial Inorganic Chemicals | | | | | |
| 30,000 | Praxair, Inc. | | 3,586,500 | | 2.31 | % |
| Mineral Royalty Traders | | | | | |
| 85,000 | Royal Gold, Inc. | | 5,235,150 | | 3.37 | % |
| Miscellaneous Food Preparations & Kindred Products | | | | | |
| 75,000 | McCormick & Company, Incorporated | | 6,071,250 | | 3.91 | % |
| Natural Gas Transmission & Distribution | | | | | |
| 305,000 | Spectra Energy Corp. | | 9,943,000 | | 6.40 | % |
| Oil & Gas Field Services, NEC | | | | | |
| 50,000 | Schlumberger Limited | | 4,309,500 | | 2.78 | % |
| Pharmaceutical Preparations | | | | | |
| 165,000 | Sanofi ** | | 8,172,450 | | 5.26 | % |
| Prepackaged Software | | | | | |
| 70,000 | Microsoft Corporation | | 3,090,500 | | 1.99 | % |
| Retail - Drug Stores and Proprietary Stores | | | | | |
| 110,000 | Express Scripts Holding Company * | | 9,783,400 | | 6.30 | % |
| State Commercial Banks | | | | | |
| 155,000 | The Bank of New York Mellon Corporation | | 6,505,350 | | 4.19 | % |
| Surgical & Medical Instruments & Apparatus | | | | | |
| 10,000 | Baxter International Inc. | | 699,300 | | | |
| 27,500 | Becton, Dickinson and Company | | 3,895,375 | | | |
| | | | 4,594,675 | | 2.96 | % |
| Total for Common Stocks (Cost - $97,665,204) | | 108,658,225 | | 69.98 | % |
| MONEY MARKET FUNDS | | | | | |
| 45,853,185 | Invesco Short Term Investments Treasury Portfolio 0.01% *** | $ | 45,853,185 | | 29.53 | % |
| | (Cost - $45,853,185) | | | | | |
| | Total Investments | | 154,511,410 | | 99.51 | % |
| | (Cost - $143,518,389) | | | | | |
| | Other Assets in Excess of Liabilities | | 754,003 | | 0.49 | % |
| | Net Assets | $ | 155,265,413 | | 100.00 | % |
* Non-Income Producing Security.
** ADR - American Depository Receipt.
*** The yield shown represents the 7-day yield at June 30, 2015.
The accompanying notes are an integral part of these
financial statements. |
2015 Annual Report 13
| Castle Focus Fund | | |
| |
| Statement of Assets and Liabilities | | |
| June 30, 2015 | | |
| Assets: | | |
| Investment Securities at Fair Value | $ | 154,511,410 |
| (Cost - $143,518,389) | | |
| Cash | | 558,358 |
| Receivables: | | |
| Dividends and Interest | | 223,193 |
| Shareholder Purchases | | 227,798 |
| Total Assets | | 155,520,759 |
| Liabilities: | | |
| Payable for Shareholder Redemptions | | 47,150 |
| Accrued Advisory Fees | | 129,662 |
| Accrued Service Fees | | 44,085 |
| Accrued Distribution and Service (12b-1) Fees - Class C | | 34,449 |
| Total Liabilities | | 255,346 |
| Net Assets | $ | 155,265,413 |
| Net Assets Consist of: | | |
| Paid In Capital | $ | 142,439,973 |
| Accumulated Undistributed Net Investment Income | | 342,881 |
| Accumulated Undistributed Realized Gain on Investments - Net | | 1,489,538 |
| Unrealized Appreciation in Value | | |
| of Investments Based on Identified Cost - Net | | 10,993,021 |
| Net Assets | $ | 155,265,413 |
| |
| Investor Shares | | |
| Net Assets | $ | 141,282,807 |
| Shares of beneficial interest outstanding | | |
| (Unlimited number of shares authorized without par value) | | 7,141,789 |
| Net Asset Value and Offering Price Per Share | $ | 19.78 |
| Minimum Redemption Price Per Share ($19.78x0.98)* | $ | 19.38 |
| |
| Class C | | |
| Net Assets | $ | 13,982,606 |
| Shares of beneficial interest outstanding | | |
| (Unlimited number of shares authorized without par value) | | 733,451 |
| Net Asset Value and Offering Price Per Share | $ | 19.06 |
| Minimum Redemption Price Per Share with CDSC fee ($19.06x0.99)** | $ | 18.87 |
| Minimum Redemption Price Per Share ($19.06x0.98)* | $ | 18.68 |
* Reflects a 2% redemption fee if shares are redeemed within 90 days of purchase.
** A contingent deferred sales charge (“CDSC”) of 1% may be charged on shares redeemed within one year of
purchase. Redemption price per share is equal to net asset value less any redemption and/or CDSC fees. This
CDSC is in addition to a 2% redemption fee that may be applied if shares are redeemed within 90 days of pur-
chase. |
The accompanying notes are an integral part of these
financial statements. |
2015 Annual Report 14
| Castle Focus Fund | | | |
| |
| Statement of Operations | | | |
| For the fiscal year ended June 30, 2015 | | | |
| Investment Income: | | | |
| Dividends (Net of foreign withholding tax and fees of $196,322) | $ | 2,355,788 | |
| Interest | | 9,295 | |
| Total Investment Income | | 2,365,083 | |
| Expenses: | | | |
| Advisory Fees | | 1,424,068 | |
| Service Fees | | 825,959 | |
| Distribution and Service (12b-1) Fees - Class C | | 113,780 | |
| Total Expenses | | 2,363,807 | |
| Less: Expenses Waived | | (341,776 | ) |
| Net Expenses | | 2,022,031 | |
| Net Investment Income | | 343,052 | |
| Realized and Unrealized Gain (Loss) on Investments: | | | |
| Realized Gain on Investments | | 6,847,232 | |
| Change In Unrealized Appreciation on Investments | | (8,010,072 | ) |
| Net Realized and Unrealized Gain (Loss) on Investments | | (1,162,840 | ) |
| |
| Net Decrease in Net Assets from Operations | $ | (819,788 | ) |
The accompanying notes are an integral part of these
financial statements. |
2015 Annual Report 15
| Castle Focus Fund |
| |
| Statements of Changes in Net Assets | | | | | | | |
| | | 7/1/2014 | | | | 7/1/2013 | |
| | | to | | | | to | |
| | | 6/30/2015 | | | | 6/30/2014 | |
| From Operations: | | | | | | | |
| Net Investment Income | $ | 343,052 | | | $ | 54,223 | |
| Net Realized Gain on Investments | | 6,847,232 | | | | 5,636,084 | |
| Change in Net Unrealized Appreciation on Investments | | (8,010,072 | ) | | | 11,899,103 | |
| Increase (Decrease) in Net Assets from Operations | | (819,788 | ) | | | 17,589,410 | |
| From Distributions to Shareholders: | | | | | | | |
| Net Investment Income | | | | | | | |
| Investor Shares | | (38,015 | ) | | | (301,108 | ) |
| Class C | | - | | | | - | |
| Net Realized Gain from Security Transactions | | | | | | | |
| Investor Shares | | (9,623,026 | ) | | | (2,253,615 | ) |
| Class C | | (817,057 | ) | | | (130,745 | ) |
| Change in Net Assets from Distributions | | (10,478,098 | ) | | | (2,685,468 | ) |
| From Capital Share Transactions: | | | | | | | |
| Proceeds From Sale of Shares | | | | | | | |
| Investor Shares | | 70,658,773 | | | | 38,264,815 | |
| Class C | | 7,061,331 | | | | 3,091,330 | |
| Proceeds From Redemption Fees (Note 2) | | | | | | | |
| Investor Shares | | 2,211 | | | | 19,709 | |
| Class C | | 129 | | | | 56 | |
| Shares Issued on Reinvestment of Dividends | | | | | | | |
| Investor Shares | | 8,457,609 | | | | 2,065,045 | |
| Class C | | 809,814 | | | | 129,594 | |
| Cost of Shares Redeemed | | | | | | | |
| Investor Shares | | (40,874,360 | ) | | | (39,951,863 | ) |
| Class C | | (1,690,698 | ) | | | (2,474,036 | ) |
| Net Increase from Shareholder Activity | | 44,424,809 | | | | 1,144,650 | |
| Net Increase in Net Assets | | 33,126,923 | | | | 16,048,592 | |
| Net Assets at Beginning of Period | | 122,138,490 | | | | 106,089,898 | |
| Net Assets at End of Period (Including Accumulated Undistributed | $ | 155,265,413 | | | $ | 122,138,490 | |
| Net Investment Income of $342,881 and $37,844, respectively) | | | | | | | |
| Share Transactions: | | | | | | | |
| Issued | | | | | | | |
| Investor Shares | | 3,438,365 | | | | 1,915,659 | |
| Class C | | 355,094 | | | | 155,422 | |
| Reinvested | | | | | | | |
| Investor Shares | | 425,005 | | | | 106,172 | |
| Class C | | 42,003 | | | | 6,792 | |
| Redeemed | | | | | | | |
| Investor Shares | | (2,000,748 | ) | | | (2,018,561 | ) |
| Class C | | (83,931 | ) | | | (128,554 | ) |
| Net Increase in Shares | | 2,175,788 | | | | 36,930 | |
| Shares Outstanding at Beginning of Period | | 5,699,452 | | | | 5,662,522 | |
| Shares Outstanding at End of Period | | 7,875,240 | | | | 5,699,452 | |
The accompanying notes are an integral part of these
financial statements. |
2015 Annual Report 16
| Castle Focus Fund |
| |
| Financial Highlights - Investor Shares | | | | | | | | | | | | | | | | | | | | |
| Selected data for a share outstanding | | 7/1/2014 | | | | 7/1/013 | | | | 7/1/2012 | | | | 7/1/2011 | | | | 7/1/2010* | | |
| throughout the period: | | to | | | | to | | | | to | | | | to | | | | to | | |
| | | 6/30/2015 | | | | 6/30/2014 | | | | 6/30/2013 | | | | 6/30/2012 | | | | 6/30/2011 | | |
| Net Asset Value - | | | | | | | | | | | | | | | | | | | | |
| Beginning of Period | $ | 21.47 | | | $ | 18.76 | | | $ | 18.04 | | | $ | 17.44 | | | $ | 15.00 | | |
| Net Investment Income (a) | | 0.07 | | | | 0.02 | | | | 0.16 | | | | 0.14 | | | | 0.15 | | |
| Net Gains or Losses on Securities | | | | | | | | | | | | | | | | | | | | |
| (realized and unrealized) | | (0.17 | ) | | | 3.15 | | | | 1.17 | | | | 0.56 | | | | 2.30 | | |
| Total from Investment Operations | | (0.10 | ) | | | 3.17 | | | | 1.33 | | | | 0.70 | | | | 2.45 | | |
| Proceeds from Redemption Fees | | - | | + | | - | | + | | - | | + | | - | | + | | - | | + |
| Distributions (From Net Investment Income) | | (0.01 | ) | | | (0.05 | ) | | | (0.21 | ) | | | (0.03 | ) | | | (0.01 | ) | |
| Distributions (From Capital Gains) | | (1.58 | ) | | | (0.41 | ) | | | (0.40 | ) | | | (0.07 | ) | | | - | | + |
| Total Distributions | | (1.59 | ) | | | (0.46 | ) | | | (0.61 | ) | | | (0.10 | ) | | | (0.01 | ) | |
| Net Asset Value - | | | | | | | | | | | | | | | | | | | | |
| End of Period | $ | 19.78 | | | $ | 21.47 | | | $ | 18.76 | | | $ | 18.04 | | | $ | 17.44 | | |
| Total Return (b) | | (0.53)% | | | | 17.17% | | | | 7.57% | | | | 4.04% | | | | 16.34% | | |
| Ratios/Supplemental Data | | | | | | | | | | | | | | | | | | | | |
| Net Assets - End of Period (Thousands) | $ | 141,283 | | | $ | 113,338 | | | $ | 98,961 | | | $ | 100,668 | | | $ | 26,624 | | |
| Before Reimbursement | | | | | | | | | | | | | | | | | | | | |
| Ratio of Expenses to Average Net Assets | | 1.58% | | | | 1.58% | | | | 1.58% | | | | 1.58% | | | | 1.58% | | |
| Ratio of Net Investment Income/(Loss) to | | | | | | | | | | | | | | | | | | | | |
| Average Net Assets | | 0.08% | | | | -0.13% | | | | 0.68% | | | | 0.63% | | | | 0.86% | | |
| After Reimbursement | | | | | | | | | | | | | | | | | | | | |
| Ratio of Expenses to Average Net Assets | | 1.34% | | | | 1.34% | | | | 1.37% | | | | 1.45% | | | | 1.58% | | |
| Ratio of Net Investment Income to Average | | | | | | | | | | | | | | | | | | | | |
| Net Assets | | 0.32% | | | | 0.11% | | | | 0.89% | | | | 0.76% | | | | 0.86% | | |
| Portfolio Turnover Rate | | 34.57% | | | | 50.60% | | | | 25.89% | | | | 24.38% | | | | 39.80% | | |
| Financial Highlights - Class C | | | | | | | | | | | | | | | | | | | | |
| Selected data for a share outstanding | | 7/1/2014 | | | | 7/1/2013 | | | | 7/1/2012 | | | | 7/1/2011 | | | | 7/1/2010* | | |
| throughout the period: | | to | | | | to | | | | to | | | | to | | | | to | | |
| | | 6/30/2015 | | | | 6/30/2014 | | | | 6/30/2013 | | | | 6/30/2012 | | | | 6/30/2011 | | |
| Net Asset Value - | | | | | | | | | | | | | | | | | | | | |
| Beginning of Period | $ | 20.94 | | | $ | 18.44 | | | $ | 17.73 | | | $ | 17.29 | | | $ | 15.00 | | |
| Net Investment Loss (a) | | (0.13 | ) | | | (0.17 | ) | | | (0.02 | ) | | | (0.04 | ) | | | (0.03 | ) | |
| Net Gains or Losses on Securities | | | | | | | | | | | | | | | | | | | | |
| (realized and unrealized) | | (0.17 | ) | | | 3.08 | | | | 1.15 | | | | 0.55 | | | | 2.32 | | |
| Total from Investment Operations | | (0.30 | ) | | | 2.91 | | | | 1.13 | | | | 0.51 | | | | 2.29 | | |
| Proceeds from Redemption Fees | | - | | + | | - | | + | | - | | | | - | | + | | - | | |
| Distributions (From Net Investment Income) | | - | | | | - | | | | (0.02 | ) | | | - | | | | - | | |
| Distributions (From Capital Gains) | | (1.58 | ) | | | (0.41 | ) | | | (0.40 | ) | | | (0.07 | ) | | | - | | + |
| Total Distributions | | (1.58 | ) | | | (0.41 | ) | | | (0.42 | ) | | | (0.07 | ) | | | - | | |
| Net Asset Value - | | | | | | | | | | | | | | | | | | | | |
| End of Period | $ | 19.06 | | | $ | 20.94 | | | $ | 18.44 | | | $ | 17.73 | | | $ | 17.29 | | |
| Total Return (b) | | (1.52)% | | | | 15.99% | | | | 6.50% | | | | 2.98% | | | | 15.27% | | |
| Ratios/Supplemental Data | | | | | | | | | | | | | | | | | | | | |
| Net Assets - End of Period (Thousands) | $ | 13,983 | | | $ | 8,801 | | | $ | 7,129 | | | $ | 7,510 | | | $ | 2,608 | | |
| Before Reimbursement | | | | | | | | | | | | | | | | | | | | |
| Ratio of Expenses to Average Net Assets | | 2.58% | | | | 2.58% | | | | 2.58% | | | | 2.58% | | | | 2.58% | | |
| Ratio of Net Investment Loss to Average | | | | | | | | | | | | | | | | | | | | |
| Net Assets | | -0.89% | | | | -1.13% | | | | -0.31% | | | | -0.36% | | | | -0.19% | | |
| After Reimbursement | | | | | | | | | | | | | | | | | | | | |
| Ratio of Expenses to Average Net Assets | | 2.34% | | | | 2.34% | | | | 2.37% | | | | 2.45% | | | | 2.58% | | |
| Ratio of Net Investment Loss to Average | | | | | | | | | | | | | | | | | | | | |
| Net Assets | | -0.65% | | | | -0.89% | | | | -0.11% | | | | -0.23% | | | | -0.19% | | |
| Portfolio Turnover Rate | | 34.57% | | | | 50.60% | | | | 25.89% | | | | 24.38% | | | | 39.80% | | |
| | * Commencement of operations.
+ Amount was less than $0.005 per share.
(a) Based on Average Shares Outstanding.
(b) Total return in the above table represents the rate that the investor would have earned or lost on an
investment in the Fund assuming reinvestment of dividends. |
The accompanying notes are an integral part of these
financial statements. |
2015 Annual Report 17
NOTES TO THE FINANCIAL STATEMENTS
CASTLE FOCUS FUND
June 30, 2015
1.) ORGANIZATION
Castle Focus Fund (the “Fund”) was organized as a non-diversified series of the PFS Funds (the “Trust”) on June 28, 2010. The Trust was established under the laws of Massachusetts by an Agreement and Declaration of Trust dated January 13, 2000, which was amended and restated January 20, 2011. Prior to March 5, 2010, the Trust was named Wireless Fund. The Trust is registered as an open-end investment company under the Investment Company Act of 1940, as amended (the “1940 Act”). The Trust may offer an unlimited number of shares of beneficial interest in a number of separate series, each series representing a distinct fund with its own investment objectives and policies. As of June 30, 2015, there were ten series authorized by the Trust. The Fund commenced operations on July 1, 2010. The Fund currently offers Investor Shares and Class C Shares. The classes differ principally in their respective distribution expenses and service arrangements as well as their respective sales charge structure. All classes of shares have identical rights to earnings, assets and voting privileges, except for class specific expenses and exclusive rights to vote on matters affecting only individual classes. Investor Shares of the Fund are sold at the net asset value (the “NAV”) without an initial sales charge and are not subject to 12b-1 distribution fees. Additionally, Class C Shares may be subject to a contingent deferred sales charge (“CDSC”) as described in Note 2 and 12b-1 distribution fees as described in Note 5. The Fund’s investment objective is to seek long-term capital appreciation. The investment adviser to the Fund is Castle Investment Management, LLC (the “Adviser”) and the sub-adviser to the Fund is St. James Investment Company, LLC (the “Sub-Adviser”). Significant accounting policies of the Fund are presented below:
2.) SIGNIFICANT ACCOUNTING POLICIES
SECURITY VALUATION:
All investments in securities are recorded at their estimated fair value, as described in Note 3.
SHARE VALUATION:
The NAV is generally calculated as of the close of trading on the New York Stock Exchange (normally 4:00 p.m. Eastern time) every day the Exchange is open. The NAV is calculated by taking the total value of the Fund’s assets, subtracting its liabilities, and then dividing by the total number of shares outstanding, rounded to the nearest cent. The offering price and redemption price per share is equal to the net asset value per share, except that shares of the Fund are subject to a redemption fee of 2% if redeemed within 90 days of purchase. During the fiscal year ended June 30, 2015, proceeds from redemption fees were $2,211 and $129 for Investor Shares and Class C, respectively. Class C Shares of the Fund, may be subject to a 1.00% CDSC if the shares are redeemed less than one year after the original purchase of the Class C Shares. The CDSC will be assessed on an amount equal to the lesser of the current market value or the cost of the shares being redeemed. During the fiscal year ended June 30, 2015, $159 of CDSC fees were assessed as a result of redemptions by Class C shareholders.
FEDERAL INCOME TAXES:
The Fund’s policy is to continue to comply with the requirements of the Internal Revenue Code that are applicable to regulated investment companies and to distribute all of its taxable income to shareholders. Therefore, no federal income tax provision is required. It is the Fund’s policy to distribute annually, prior to the end of the calendar year, dividends sufficient to satisfy excise tax requirements of the Internal Revenue Code. This Internal Revenue Code requirement may cause an excess of distributions over the book year-end accumulated income. In addition, it is the Fund’s policy to distribute annually, after the end of the fiscal year, any remaining net investment income and net realized capital gains.
The Fund recognizes the tax benefits of certain tax positions only where the position is “more likely than not” to be sustained assuming examination by tax authorities. Management has analyzed the Fund’s tax positions, and has concluded that no liability for unrecognized tax benefits should be recorded related to uncertain tax positions taken on returns filed for open tax years (2011-2013), or expected to be taken on the Fund’s 2014 tax return. The Fund identifies its major tax jurisdictions as U.S. Federal tax authorities; however, the Fund is not aware of any tax positions for which it is reasonably possible that the total amounts of unrecognized tax benefits will change materially in the next twelve months. The Fund recognizes interest and penalties, if any, related to unrecognized tax benefits as income tax expense in the Statement of Operations. During the fiscal year ended June 30, 2015, the Fund did not incur any interest or penalties.
DISTRIBUTIONS TO SHAREHOLDERS:
Distributions to shareholders, which are determined in accordance with income tax regulations, are recorded on the ex-dividend date.
2015 Annual Report 18
Notes to the Financial Statements - continued
The treatment for financial reporting purposes of distributions made to shareholders during the period from net investment income or net realized capital gains may differ from their ultimate treatment for federal income tax purposes. These differences are caused primarily by differences in the timing of the recognition of certain components of income, expense, or realized capital gain for federal income tax purposes. Where such differences are permanent in nature, they are reclassified in the components of the net assets based on their ultimate characterization for federal income tax purposes. Any such reclassifications will have no effect on net assets, results of operations, or net asset value per share of the Fund.
USE OF ESTIMATES:
The preparation of financial statements in conformity with accounting principles generally accepted in the United States (“GAAP”) requires management to make estimates and assumptions that affect the reported amounts of assets and liabilities and disclosure of contingent assets and liabilities at the date of the financial statements and the reported amounts of increases and decreases in net assets from operations during the reporting period. Actual results could differ from those estimates.
OTHER:
The Fund records security transactions based on a trade date. Dividend income is recognized on the ex-dividend date, and interest income is recognized on an accrual basis. Discounts and premiums on securities purchases are accreted and amortized over the lives of the respective securities. Withholding taxes on foreign dividends have been provided for in accordance with the Fund’s understanding of the applicable country’s tax rules and rates.
ALLOCATION OF EXPENSES:
Expenses incurred by the Trust that don’t relate to a specific fund of the Trust are allocated pro-rata to the funds based on the total number of funds in the Trust at the time the expense was incurred or by another appropriate method. Class specific expenses are borne by each specific class. Income, non-class specific expenses, and realized and unrealized gains/losses are allocated to the respective classes based on the basis of relative net assets.
3.) SECURITIES VALUATIONS
The Fund utilizes various methods to measure the fair value of most of its investments on a recurring basis. GAAP establishes a hierarchy that prioritizes inputs to valuation methods. The three levels of inputs are:
Level 1 - Unadjusted quoted prices in active markets for identical assets or liabilities that the Fund has the ability to access.
Level 2 - Inputs other than quoted prices included in level 1 that are observable for the asset or liability, either directly or indirectly. These inputs may include quoted prices for the identical instrument on an inactive market, prices for similar instruments, interest rates, prepayment speeds, credit risk, yield curves, default rates and similar data.
Level 3 - Unobservable inputs for the asset or liability, to the extent relevant observable inputs are not available, representing the Fund’s own assumptions about the assumptions a market participant would use in valuing the asset or liability, and would be based on the best information available.
The availability of observable inputs can vary from security to security and is affected by a wide variety of factors, including, for example, the type of security, whether the security is new and not yet established in the marketplace, the liquidity of markets, and other characteristics particular to the security. To the extent that valuation is based on models or inputs that are less observable or unobservable in the market, the determination of fair value requires more judgment. Accordingly, the degree of judgment exercised in determining fair value is greatest for instruments categorized in level 3.
The inputs used to measure fair value may fall into different levels of the fair value hierarchy. In such cases, for disclosure purposes, the level in the fair value hierarchy within which the fair value measurement falls in its entirety, is determined based on the lowest level input that is significant to the fair value measurement in its entirety.
FAIR VALUE MEASUREMENTS
A description of the valuation techniques applied to the Fund’s major categories of assets and liabilities measured at fair value on a recurring basis follows.
Equity securities (common stocks, including ADRs). Equity securities that are traded on any exchange or on the NASDAQ over-the-counter market are valued at the last quoted sale price. Lacking a last sale price, a long security is valued at its last bid price except when, in the Adviser’s
2015 Annual Report 19
Notes to the Financial Statements - continued
opinion, the last bid price does not accurately reflect the current value of the long security. To the extent these securities are actively traded and valuation adjustments are not applied, they are classified in level 1 of the fair value hierarchy. When market quotations are not readily available, when the Adviser determines the last bid price does not accurately reflect the current value or when restricted securities are being valued, such securities are valued as determined in good faith by the Adviser, in conformity with guidelines adopted by and subject to review of the Board of Trustees (the “Trustees”) and are categorized in level 2 or level 3, when appropriate.
Money market funds. Money market securities are valued at net asset value and are classified in level 1 of the fair value hierarchy.
In accordance with the Trust’s good faith pricing guidelines, the Adviser is required to consider all appropriate factors relevant to the value of securities for which it has determined other pricing sources are not available or reliable as described above. There is no single standard for determining fair value, since fair value depends upon the circumstances of each individual case. As a general principle, the current fair value of an issue of securities being valued by the Adviser would appear to be the amount which the owner might reasonably expect to receive for them upon their current sale. Methods which are in accordance with this principle may, for example, be based on (i) a multiple of earnings; (ii) a discount from market of a similar freely traded security (including a derivative security or a basket of securities traded on other markets, exchanges or among dealers); or (iii) yield to maturity with respect to debt issues, or a combination of these and other methods.
The following table summarizes the inputs used to value the Fund’s assets measured at fair value as of June 30, 2015:
| Valuation Inputs of Assets | | Level 1 | | Level 2 | | Level 3 | | Total |
| Common Stocks | | $108,658,225 | | $0 | | $0 | | $108,658,225 |
| Money Market Funds | | 45,853,185 | | 0 | | 0 | | 45,853,185 |
| Total | | $154,511,410 | | $0 | | $0 | | $154,511,410 |
Refer to the Fund’s Schedule of Investments for a listing of securities by industry. The Fund did not hold any Level 3 assets during the fiscal year ended June 30, 2015. There were no transfers into or out of the levels during the fiscal year ended June 30, 2015. It is the Fund’s policy to consider transfers into or out of the levels as of the end of the reporting period.
The Fund did not invest in derivative instruments during the fiscal year ended June 30, 2015.
4.) INVESTMENT ADVISORY AGREEMENT AND SERVICES AGREEMENT
The Fund entered into an Investment Management Agreement with Castle Investment Management, LLC as the investment adviser of the Fund. Under the terms of the Investment Management Agreement, the Adviser manages the investment portfolio of the Fund, subject to policies adopted by the Trust’s Trustees. The Adviser, at its own expense and without reimbursement from the Fund, furnishes office space and all necessary office facilities, equipment and executive personnel necessary for managing the assets of the Fund. The Adviser also pays the salaries and fees of all of its officers and employees that serve as officers and trustees of the Trust. For its services, the Adviser receives a fee of 1.00% per year of the average daily net assets of the Fund. The Sub-Adviser of the Fund has responsibility for providing investment ideas and recommendations for the assets of the Fund, subject to the supervision of the Adviser. As full compensation for all services rendered, including investment ideas and recommendations for the assets of the Fund, the Adviser pays the Sub-Adviser a sub-advisor fee. For the fiscal year ended June 30, 2015, the Adviser received management fees totaling $1,424,068. At June 30, 2015, the Fund owed $129,662 to the Adviser.
The Fund also has a Services Agreement with the Adviser (the “Services Agreement”), under which the Fund pays the Adviser. Under the Services Agreement, the Adviser shall supervise the Fund’s business affairs and is obligated to pay the operating expenses of the Fund excluding management fees, 12b-1 fees, brokerage fees and commissions, taxes, borrowing costs (such as (a) interest and (b) dividend expenses on securities sold short), ADR fees, the cost of acquired funds and extraordinary expenses. In addition, to the extent not otherwise provided by other parties under agreements with the Trust, the Adviser shall supply: (i) non-investment related statistical and research data; (ii) the services of a Chief Compliance Officer for the Trust; and (iii) executive and administrative services. The Adviser shall also assist with and/or supervise the preparation by the Trust’s administrator, transfer agent, and/or auditors of: (i) tax returns; (ii) reports to shareholders of the Fund; (iii) reports to, and filings with, the Securities and Exchange Commission, state securities commissions and Blue Sky authorities including preliminary and definitive proxy materials and post-effective amendments to the Trust’s registration statement; and (iv) necessary materials for meetings of the Trust’s Board of Trustees. The Adviser shall provide personnel to serve as officers of the Trust if so elected by the Trustees. Executive and administrative services include, but are not limited to, the coordination of all
2015 Annual Report 20
Notes to the Financial Statements - continued
third parties furnishing services to the Fund, review of the books and records of the Fund maintained by such third parties, and the review and submission to the officers of the Fund for their approval, of invoices or other requests for payment of Fund expenses; and such other action with respect to the Fund as may be necessary in the opinion of the Adviser to perform its duties. For its services, the Adviser receives a service fee equal to 0.58% of the average daily net assets of the Fund. For the fiscal year ended June 30, 2015, the Adviser earned service fees of $825,959. At June 30, 2015, the Fund owed the Adviser service fees of $44,085. Beginning November 1, 2013 the Adviser has contractually agreed to waive Services Agreement fees by 0.24% of its average daily net assets. The Services Agreement fee waiver will be effective through October 31, 2015 and will automatically terminate on October 31, 2015 unless it is renewed by the Adviser. The Adviser may not terminate the fee waiver before October 31, 2015. Prior to November 1, 2013, the Adviser had contractually agreed to waive Service Agreement fees by 0.23% . There are no recoupment provisions for the waivers described above. A total of $341,776 was waived for the fiscal year ended June 30, 2015.
5.) DISTRIBUTION AND SHAREHOLDER SERVICING PLAN
The Fund has adopted a Distribution Plan in accordance with Rule 12b-1 under the 1940 Act (the “Plan”) with respect to the Class C Shares of the Fund. Pursuant to the Distribution Plan, the Fund compensates the Distributor for services rendered and expenses borne in connection with activities primarily intended to result in the sale of the Fund’s Class C Shares. This Plan provides that the Fund will pay the annual rate of 1.00% of the average daily net assets of the Fund’s Class C Shares for activities primarily intended to result in the sale of those shares. These activities include payment to entities for providing distribution and shareholder servicing with respect to the Fund’s shares. The 1.00% for the Class C Shares is comprised of a 0.25% service fee and a 0.75% distribution fee. The Fund incurred distribution and service (12b-1) fees of $113,780 for Class C Shares, during the fiscal year ended June 30, 2015. At June 30, 2015, the Fund owed distribution and service (12b-1) fees of $34,449 for Class C Shares.
6.) RELATED PARTY TRANSACTIONS
Jeffrey R. Provence of Premier Fund Solutions, Inc. (the “Administrator”) also serves as a trustee/officer of the Fund. This individual receives benefits from the Administrator resulting from administration fees paid to the Administrator by the Adviser.
The Trustees who are not interested persons of the Fund were paid $1,250 each, for a total of $3,750, in Trustees’ fees for the fiscal year ended June 30, 2015 by the Adviser.
7.) INVESTMENT TRANSACTIONS
For the fiscal year ended June 30, 2015, purchases and sales of investment securities other than U.S. Government obligations and short-term investments aggregated $60,880,371 and $34,043,959, respectively. Purchases and sales of U.S. Government obligations aggregated $0 and $0, respectively.
8.) CONTROL OWNERSHIP
The beneficial ownership, either directly or indirectly, of more than 25% of the voting securities of a fund creates a presumption of control of the Fund, under Section 2(a)(9) of the Investment Company Act of 1940. As of June 30, 2015, Charles Schwab & Co., Inc. located at 211 Main Street, San Francisco, California, held for the benefit of its customers, in the aggregate, 26.49% of Investor Shares. Also, National Financial Services, LLC, located at 200 Liberty Street, New York, New York, for the benefit of its customers, held, in aggregate, 29.77% of Investor Shares. As of June 30, 2015, RBC Capital Markets LLC located at 60 South Sixth Street, Minneapolis, Minnesota, held for the benefit of its customers, in the aggregate, 52.72% of Class C Shares. The Trust does not know whether the foregoing entities or any of the underlying accounts owned or controlled beneficially 25% or more of the voting securities of the Fund. Accordingly, it is not known whether Charles Schwab & Co., Inc., National Financial Services, LLC, RBC Capital Markets LLC or any of the underlying accounts could be deemed to control the Fund.
9.) TAX MATTERS
For Federal income tax purposes, the cost of securities owned at June 30, 2015 was $143,518,389.
At June 30, 2015, the composition of gross unrealized appreciation (the excess of value over tax cost) and depreciation (the excess of tax cost over value) of investments on a tax basis was as follows:
| | Appreciation | | (Depreciation) | | Net Appreciation (Depreciation) |
| | $14,026,753 | | ($3,033,732) | | $10,993,021 |
As of June 30, 2015, there were no differences between book basis and tax basis unrealized appreciation.
2015 Annual Report 21
Notes to the Financial Statements - continued
Investor Shares paid a distribution on December 18, 2014 to the shareholders of record on December 17, 2014 of which $0.00624 per share was paid from net investment income, $1.55603 per share was paid from long-term capital gain and $0.02355 per share was paid from short-term capital gain.
| The tax character of Investor Share distributions was as follows: | | |
| |
| | | Fiscal Year Ended | | Fiscal Year Ended |
| | | June 30, 2015 | | June 30, 2014 |
| Ordinary Income | | $ 38,015 | | $ 301,108 |
| Short-term Capital Gain | | 143,470 | | 0 |
| Long-term Capital Gain | | 9,479,556 | | 2,253,615 |
| | | $ 9,661,041 | | $ 2,554,723 |
Class C also paid distributions on December 18, 2014 to the shareholders of record on December 17, 2014 of which $1.55603 per share was paid from long-term capital and $0.02355 per share was paid from short-term capital gain.
| The tax character of Class C distributions was as follows: | | |
| |
| | | Fiscal Year Ended | | Fiscal Year Ended |
| | | June 30, 2015 | | June 30, 2014 |
| Ordinary Income | | $ 0 | | $ 0 |
| Short-term Capital Gain | | 12,181 | | 0 |
| Long-term Capital Gain | | 804,876 | | 130,745 |
| | | $ 817,057 | | $ 130,745 |
As of June 30, 2015, the components of distributable earnings on a tax basis were as follows:
| Undistributed ordinary income | | $ 952,186 |
| Undistributed long-term capital gain/(accumulated losses) | | 880,233 |
| Unrealized appreciation/(depreciation) - net | | 10,993,021 |
| | | $ 12,825,440 |
10.) SUBSEQUENT EVENTS
Subsequent events after the date of the Statement of Assets and Liabilities have been evaluated through the date the financial statements were issued. Management has concluded that there is no impact requiring adjustment or disclosure in the financial statements.
ADDITIONAL INFORMATION
June 30, 2015
(Unaudited)
APPROVAL OF CONTINUATION OF THE MANAGEMENT AGREEMENT BETWEEN THE TRUST AND CASTLE INVESTMENT MANAGEMENT, LLC ON BEHALF OF THE CASTLE FOCUS FUND AND THE INVESTMENT SUB-ADVISORY AGREEMENT BETWEEN CASTLE INVESTMENT MANAGEMENT, LLC AND ST. JAMES INVESTMENT COMPANY, LLC ON BEHALF OF THE CASTLE FOCUS FUND
On June 10, 2015, the Board of Trustees (the “Board” or the “Trustees”) considered the renewal of the Management Agreement between the Trust and Castle Investment Management, LLC (“Castle”) on behalf of the Castle Focus Fund (the "Fund") and the Investment Sub-Advisory Agreement between Castle and St. James Investment Company, LLC ("St. James") on behalf of the Fund (the "Agreements"). In approving the Agreements, the Board of Trustees considered and evaluated the following factors: (i) the nature, extent and quality of the services provided by Castle and St. James to the Fund; (ii) the investment performance of the Fund, Castle and St. James; (iii) the cost of the services to be provided and the profits to be realized by Castle and St. James and their respective affiliates from the relationship with the Fund; (iv) the extent to which economies of scale will be realized as the Fund grows and whether the fee levels reflect these economies of scale to the benefit of shareholders; and (v) Castle's and St. James' practices regarding possible conflicts of interest.
In assessing these factors and reaching its decisions, the Board took into consideration information furnished for the Board's review and consideration throughout the year at regular Board meetings, as well as information specifically prepared and/or presented in connection with the annual renewal process, including information presented at the Meeting. The Board reflected on the presentations by representatives of Castle and St. James earlier in the Meeting. The Board requested and was provided with information and reports relevant to the annual renewal of the Agreements, including: (i) reports regarding the services and support provided to the Fund and its shareholders by Castle and St. James; (ii) assessments of the investment performance of the Fund by personnel of Castle; (iii)
2015 Annual Report 22
Additional Information (Unaudited) - continued
commentary on the reasons for the performance; (iv) presentations addressing Castle's and St. James' investment philosophy, investment strategy, personnel and operations; (v) compliance and audit reports concerning the Fund, Castle and St. James; (vi) disclosure information contained in the registration statement of the Trust and the Form ADVs of Castle and St. James; and (vii) a memorandum from Counsel, that summarized the fiduciary duties and responsibilities of the Board in reviewing and approving the Agreements, including the material factors set forth above and the types of information included in each factor that should be considered by the Board in order to make an informed decision. The Board also requested and received various informational materials including, without limitation: (i) documents containing information about Castle and St. James, including financial information, a description of personnel and the services provided to the Fund, information on investment advice, performance, summaries of Fund expenses, compliance program, current legal matters, and other general information; (ii) comparative expense and performance information for other mutual funds with strategies similar to the Fund; and (iii) benefits to be realized by Castle and St. James from their relationship with the Fund. The Board did not identify any particular information that was most relevant to its consideration to approve the Agreements and each Trustee may have afforded different weight to the various factors.
1. Nature, Extent and Quality of the Services Provided by Castle and St. James
In considering the nature, extent, and quality of the services provided by Castle and St. James, the Trustees reviewed the responsibilities of Castle and St. James under the Agreements. The Trustees reviewed the services being provided by Castle and St. James including, without limitation: the quality of investment advisory services (including research and recommendations with respect to portfolio securities); the process for formulating investment recommendations and assuring compliance with the Fund's investment objective, strategies, and limitations, as well as for ensuring compliance with regulatory requirements. The Trustees reflected on their discussions with representatives from Castle and St. James. The Trustees considered the coordination of services for the Fund among Castle and the service providers (including St. James) and the Independent Trustees; and the efforts of Castle to promote the Fund and grow its assets. The Trustees noted Castle's and St. James' continuity of, and commitment to retain, qualified personnel and to maintain and enhance its resources and systems and the continued cooperation with the Independent Trustees and Counsel for the Fund. The Trustees evaluated Castle's and St. James' personnel, including the education and experience of their personnel. After reviewing the foregoing information and further information in the materials provided by Castle and St. James (including Castle's and St. James' Form ADVs), the Board concluded that, in light of all the facts and circumstances, the nature, extent, and quality of the services provided by Castle and St. James were satisfactory and adequate for the Fund.
2. Investment Performance of the Fund, Castle and St. James
In considering the investment performance of the Fund, Castle and St. James, the Trustees compared the short-term and longer-term performance of the Fund with the performance of funds with similar objectives managed by other investment advisers, as well as with aggregated peer group data. The Trustees noted that Castle did not have any clients other than the Fund. The Trustees noted that the performance of the Fund compared to other accounts managed by St. James was represented by St. James to be comparable and within typical dispersion. As to the performance of the Fund, the Board was provided with a report that included information regarding the performance of the Fund compared to a group of funds of similar size, style and objective, categorized by Morningstar (the "Peer Group"). All performance data was through the period ended March 31, 2015. The Trustees noted that for the 12 month period ended March 31, 2015, the Fund underperformed its Peer Group average and its benchmark index. The Trustees also noted that the Fund underperformed its benchmark index and Peer Group average for the longer term. The Trustees reflected on conversations with representatives of Castle and St. James on the investment philosophy of the Fund being geared toward longer-term performance and that the Fund may not perform as well as its peers in up markets. The Trustees also noted that the Fund is intended to perform well over market cycles and that the Fund has not been in operation for a full market cycle as of this time. The Trustees noted that they recognized the lower risk level of the Fund as compared to others in its Peer Group noting that this makes for a more difficult comparison to Peers and the benchmark index. The Trustees also concluded that the Fund had held for a significant period of time large cash positons, which while detracting from performance during up markets, was consistent with the philosophy of St. James and the investment approach for the Fund. After reviewing and discussing the investment performance of the Fund further, Castle's and St. James' experience managing the Fund, their historical investment performance, and other relevant factors, the Board concluded, in light of all the facts and circumstances, that the investment performance of the Fund, Castle and St. James was satisfactory.
3. Costs of the Services to be Provided and Profits to be Realized by Castle and St. James
In considering the costs of the services to be provided and profits to be realized by Castle and St. James from the relationship with the Fund, the Trustees considered: (1) Castle's and St. James' financial condi-
2015 Annual Report 23
Additional Information (Unaudited) - continued
tion and the level of commitment to the Fund and Castle by the principals of Castle; (2) the asset level of the Fund; (3) the overall expenses of the Fund; and (4) the nature and frequency of advisory and sub-advisory fee payments. The Trustees reviewed information provided by Castle and St. James regarding their respective profits associated with managing the Fund. The Trustees also considered potential benefits for Castle and St. James in managing the Fund. The Trustees then compared the fees and expenses of the Fund (including the management fee) to other comparable mutual funds. The Trustees reviewed the fees under the Agreements compared to other mutual funds with similar investment objectives and asset levels and noted that the expense ratio for Investor Class Shares and for Class C Shares were above the Peer Group average. It was noted that Class C Shares were at the high end of the Peer Group range. The Trustees also considered the fees assessed by St. James relative to the fees they assessed to their other separate account clients and noted that the fees charged the Fund were less than those charged to the other accounts. It was also noted that Class C Shares had significantly less assets than the Peer Group average. The Trustees also reviewed the management fee as compared to the Peer Group average and noted that the management fee was at the high end of the Peer Group range. The Trustees recognized that Castle instituted a waiver of a portion of its fees under the Services Agreement with the Trust effective through October 31, 2015 that is recognized in the current net expense ratio. The Trustees also noted that under the contractual arrangements with Castle, Castle was required to pay most of the Fund's operating expenses. Based on the foregoing, the Board concluded that the fees to be paid to Castle (and in turn Castle's payment to St. James) and the profits to be realized by Castle and St. James, in light of all the facts and circumstances, were fair and reasonable in relation to the nature and quality of the services provided by Castle and St. James.
4. Economies of Scale
The Trustees next considered the impact of economies of scale on the Fund's size and whether advisory fee levels reflect those economies of scale for the benefit of the Fund's investors. The Trustees considered that while the management fee remained the same at all asset levels, the Fund's shareholders had experienced benefits from the fact that Castle was obligated to pay certain of the Fund's operating expenses which had the effect of limiting the overall fees paid by the Fund. The Trustees also recognized that Castle instituted a waiver of a portion of its fees under the Services Agreement until October 31, 2015. The Trustees also noted that the contractual arrangements with the Trust required that Castle effectively cap the expenses of the Fund, which has a similar effect as a breakpoint, although the Trustees noted that shareholders would benefit without the need for the Fund's assets to reach or be maintained at certain asset thresholds. The Trustees also noted that the fees payable to St. James were paid from the overall amount paid to Castle and, as a result, asset growth would not result in economies of scale for shareholders of the Fund with respect to that fee. In light of its ongoing consideration of the Fund's asset levels, expectations for growth in the Fund, and fee levels, the Board determined that the Fund's fee arrangements, in light of all the facts and circumstances, were fair and reasonable in relation to the nature and quality of the services provided by Castle and St. James.
5. Possible Conflicts of Interest and Benefits to Castle and St. James
In considering Castle's and St. James' practices regarding conflicts of interest, the Trustees evaluated the potential for conflicts of interest and considered such matters as the experience and ability of the advisory personnel assigned to the Fund; the basis of decisions to buy or sell securities for the Fund; and the substance and administration of Castle's and St. James' respective codes of ethics. The Trustees also considered disclosure in the registration statement of the Trust related to Castle's and St. James' potential conflicts of interest. The Trustees also considered St. James' practices regarding brokerage and portfolio transactions, including particularly St. James' practice for seeking best execution for the Fund's portfolio transactions and noted that St. James does not utilize soft dollars. The Trustees considered the process by which evaluations are made of the overall reasonableness of commissions paid. The Trustees noted the potential benefit of additional public exposure of St. James based on marketing that is done for the Fund. No other potential benefits (other than the management and sub-advisory fees) were identified by the Trustees. Based on the foregoing, the Board determined that Castle's and St. James' standards and practices relating to the identification and mitigation of possible conflicts of interest were satisfactory.
Next, the Independent Trustees met in executive session along with legal counsel to discuss the continuation of the Agreements. The officers of the Trust and others present were excused during this discussion. After further review, discussion, and determination it was the Board's consensus (including a majority of the independent Trustees) that the best interests of the Fund's shareholders were served by the renewal of the Agreements, that the fees to be paid to the Adviser and Sub-Adviser, pursuant to the Agreements, were reasonable, and that the overall arrangements provided under the terms of the Agreements were reasonable and within a range of what could have been negotiated at arms-length in light of all surrounding circumstances, including such services to be rendered and such other matters as the Trustees considered to be relevant in the exercise of their reasonable business judgment.
2015 Annual Report 24
Cohen Fund Audit Services, Ltd.
1350 Euclid Avenue, Ste 800
Cleveland, Ohio 44115 www.cohenfund.com | 216.649.1700
216.579.0111 fax |
REPORT OF INDEPENDENT REGISTERED PUBLIC ACCOUNTING FIRM
To the Shareholders of Castle Focus Fund and
Board of Trustees of PFS Funds
We have audited the accompanying statement of assets and liabilities, including the schedule of investments, of Castle Focus Fund (the "Fund"), a series of PFS Funds, as of June 30, 2015, and the related statement of operations for the year then ended, the statements of changes in net assets for each of the two years in the period then ended, and the financial highlights for each of the five years in the period then ended. These financial statements and financial highlights are the responsibility of the Fund's management. Our responsibility is to express an opinion on these financial statements and financial highlights based on our audits.
We conducted our audits in accordance with the standards of the Public Company Accounting Oversight Board (United States). Those standards require that we plan and perform the audit to obtain reasonable assurance about whether the financial statements and financial highlights are free of material misstatement. An audit includes examining, on a test basis, evidence supporting the amounts and disclosures in the financial statements. Our procedures included confirmation of securities owned as of June 30, 2015, by correspondence with the custodian. An audit also includes assessing the accounting principles used and significant estimates made by management, as well as evaluating the overall financial statement presentation. We believe that our audits provide a reasonable basis for our opinion.
In our opinion, the financial statements and financial highlights referred to above present fairly, in all material respects, the financial position of Castle Focus Fund as of June 30, 2015, the results of its operations for the year then ended, the changes in its net assets for each of the two years in the period then ended, and the financial highlights for each of the five years in the period then ended, in conformity with accounting principles generally accepted in the United States of America.

COHEN FUND AUDIT SERVICES, LTD.
Cleveland, Ohio
August 26, 2015
2015 Annual Report 25
Trustees and Officers
(Unaudited)
The Board of Trustees supervises the business activities of the Trust. The names of the Trustees and executive officers of the Trust are shown below. For more information regarding the Trustees, please refer to the Statement of Additional Information, which is available upon request by calling 1-877-743-7820. Each Trustee serves until the Trustee sooner dies, resigns, retires, or is removed.
The Trustees and Officers of the Trust and their principal business activities during the past five years are:
Interested Trustees and Officers
| | | | | Number of | |
| | | | Principal | Portfolios In | Other |
| Name, | Position(s) | Term of Office | Occupation(s) | Fund | Directorships |
| Address(1), | Held With | and Length of | During | Complex | Held By |
| and Year of Birth | the Trust | Time Served | Past 5 Years | Overseen By | Trustee |
| | | | | Trustee | |
| |
| Ross C. Provence, | President | Indefinite Term; | General Partner and Portfolio | N/A | N/A |
| Year of Birth: 1938 | | Since 2000 | Manager for Value Trend Capital | | |
| | | | Management, LP (1995 to current). | | |
| | | | Estate planning attorney (1963 to | | |
| current). |
| |
| Jeffrey R. Provence(2), | Trustee, | Indefinite Term; | CEO, Premier Fund Solutions, Inc. | 10 | Blue Chip |
| Year of Birth: 1969 | Secretary | Since 2000 | (2001 to current). General Partner | | Investor Funds |
| | and | | and Portfolio Manager for Value | | |
| | Treasurer | | Trend Capital Management, LP | | |
| | | | (1995 to current). | | |
| |
| Julian G. Winters, | Chief | Chief | Managing Member, Watermark | N/A | N/A |
| Year of Birth: 1968 | Compliance | Compliance | Solutions LLC (investment compli- | | |
| | Officer | Officer Since | ance and consulting) since March | | |
| | | 2010 | 2007. | | |
(1) The address of each trustee and officer is c/o PFS Funds, 1939 Friendship Drive, Suite C, El Cajon, California 92020.
(2) Jeffrey R. Provence is considered an "interested person" as defined in Section 2(a)(19) of the Investment Company Act of 1940 by
virtue of his position with the Trust.
Independent Trustees |
| | | | | Number of | |
| | | | Principal | Portfolios In | Other |
| Name, | Position | Term of Office | Occupation(s) | Fund | Directorships |
| Address(1), | Held With | and Length of | During | Complex | Held By |
| and Year of Birth | the Trust | Time Served | Past 5 Years | Overseen By | Trustee |
| | | | | Trustee | |
| |
| Thomas H. Addis III, | Independent | Indefinite Term; | Executive Director/CEO, Southern | 10 | None |
| Year of Birth: 1945 | Trustee | Since 2000 | California PGA (2006 to current). | | |
| |
| Allen C. Brown, | Independent | Indefinite Term; | Co-owner of Stebleton & Brown | 10 | Blue Chip |
| Year of Birth: 1943 | Trustee | Since 2010 | (1994 to current). Estate planning | | Investor Funds |
| | | | and business attorney (1970 to cur- | | |
| rent). |
| |
| George Cossolias, CPA, | Independent | Indefinite Term; | Partner of CWDL, CPAs (February 1, | 10 | Blue Chip |
| Year of Birth: 1935 | Trustee | Since 2000 | 2014 to current). Owner of George | | Investor Funds |
| | | | Cossolias & Company, CPAs (1972 | | |
| | | | to January 31, 2014). President of | | |
| | | | LubricationSpecialists, Inc. (1996 to | | |
| current). |
(1) The address of each trustee and officer is c/o PFS Funds, 1939 Friendship Drive, Suite C, El Cajon, California 92020.
2015 Annual Report 26
Investment Adviser
Castle Investment Management, LLC
Sub-Adviser
St. James Investment Company, LLC
Legal Counsel
The Law Offices of John H. Lively & Associates, Inc.
A member firm of The 1940 Act Law GroupTM
Custodian
U.S. Bank, N.A.
Distributor
Rafferty Capital Markets, LLC
Dividend Paying Agent,
Shareholders' Servicing Agent,
Transfer Agent
Mutual Shareholder Services, LLC
Fund Administrator
Premier Fund Solutions, Inc.
Independent Registered Public Accounting Firm
Cohen Fund Audit Services, Ltd. |
This report is provided for the general information of the shareholders of the Castle
Focus Fund. This report is not intended for distribution to prospective investors in the
Fund, unless preceded or accompanied by an effective prospectus. |
Castle Focus Fund
210 N. Lee Street, Suite 105
Alexandria, Virginia 22314
www.castleim.com
703-260-1921
Item 2. Code of Ethics.
The registrant has adopted a code of ethics that applies to the registrant’s principal executive officer and the principal financial officer. The registrant has not made any amendments to its code of ethics during the covered period. The registrant has not granted any waivers from any provisions of the code of ethics during the covered period. A copy of the registrant’s Code of Ethics is filed herewith.
Item 3. Audit Committee Financial Expert.
The registrant’s Board of Trustees has determined that George Cossolias is an audit committee finical expert. Mr. Cossolias is independent for purposes of this Item 3.
Item 4. Principal Accountant Fees and Services.
(a-d) The following table details the aggregate fees billed for each of the last two fiscal years for audit fees, audit-related fees, tax fees and other fees by the principal accountant to the registrant. The principal accountant has provided no services to the adviser or any entity controlled by, or under common control with the adviser that provides ongoing services to the registrant.
| | | FYE 6/30/15 | | FYE 6/30/14 |
| Audit Fees | | $14,250 | | $14,250 |
| Audit-Related Fees | | $0 | | $0 |
| Tax Fees | | $2,500 | | $2,500 |
| All Other Fees | | $750 | | $750 |
Nature of Tax Fees: preparation of Excise Tax Statement and 1120 RIC.
All Other Fees: Semi-Annual Report Review
(e) (1) The audit committee approves all audit and non-audit related services and, therefore, has not adopted pre-approval policies and procedures described in paragraph (c)(7) of Rule 2-01 of Regulation S-X.
(e) (2) None of the services described in paragraph (b) through (d) of this Item were approved by the audit committee pursuant to paragraph (c)(7)(i)(C) of Rule 2-01 of Regulation S-X.
(f) All of the principal accountant’s hours spent on auditing the registrant’s financial statements were attributed to work performed by full-time permanent employees of the principal accountant.
(g) The following table indicates the aggregate non-audit fees billed by the registrant’s principal accountant for services to the registrant , the registrant’s investment adviser (not sub-adviser), and any entity controlling, controlled by, or under common control with the adviser that provides ongoing services to the registrant, for the last two years.
| Non-Audit Fees | | FYE 6/30/15 | | FYE 6/30/14 |
| Registrant | | $3,250 | | $3,250 |
| Registrant’s Investment Adviser | | $0 | | $0 |
(h) The principal accountant provided no services to the investment adviser or any entity controlling, controlled by, or under common control with the adviser that provides ongoing services to the registrant.
Item 5. Audit Committee of Listed Companies. Not applicable.
Item 6. Schedule of Investments. Schedule filed with Item 1.
Item 7. Disclosure of Proxy Voting Policies and Procedures for Closed-End Management Investment Companies. Not applicable.
Item 8. Portfolio Managers of Closed End Management Investment Companies. Not applicable.
Item 9. Purchases of Equity Securities by Closed-End Management Investment Companies and Affiliated Purchasers. Not applicable.
Item 10. Submission of Matters to a Vote of Security Holders.
The registrant has not adopted procedures by which shareholders may recommend nominees to the registrant’s board of trustees.
Item 11. Controls and Procedures.
(a) The registrant’s president and chief financial officer concluded that the disclosure controls and procedures (as defined in Rule 30a-3(c) under the Investment Company Act of 1940 (the “Act”)) were effective as of a date within 90 days of the filing date of this report, based on the evaluation of these controls and procedures required by Rule 30a-3(b) under the Act.
(b) There were no changes in the registrant’s internal control over financial reporting (as defined in Rule 30a-3(d) under the Act) that occurred during the registrant’s second fiscal quarter of the period covered by this report that have materially affected, or are reasonably likely to materially affect, the registrant’s internal control over financial reporting.
Item 12. Exhibits.
(a)(1) Code of Ethics. Filed herewith.
(a)(2) Certifications pursuant to Section 302 of the Sarbanes-Oxley Act of 2002. Filed herewith.
(a)(3) Not applicable.
(b) Certification pursuant to Section 906 Certification of the Sarbanes-Oxley Act of 2002. Filed herewith.
SIGNATURES
Pursuant to the requirements of the Securities Exchange Act of 1934 and the Investment Company Act of 1940, the registrant has duly caused this report to be signed on its behalf by the undersigned, thereunto duly authorized.
| | By: /s/Ross C. Provence
Ross C. Provence
President |
Pursuant to the requirements of the Securities Exchange Act of 1934 and the Investment Company Act of 1940, this report has been signed below by the following persons on behalf of the registrant and in the capacities and on the dates indicated.
| | By: /s/Ross C. Provence
Ross C. Provence
President |
| | By: /s/Jeffrey R. Provence
Jeffrey R. Provence
Chief Financial Officer Date: 8/27/15 |