UNITED STATES
SECURITIES AND EXCHANGE COMMISSION
WASHINGTON, D.C. 20549
FORM N-CSR
CERTIFIED SHAREHOLDER REPORT OF REGISTERED MANAGEMENT
INVESTMENT COMPANIES
Investment Company Act file number 811-09781
PFS Funds
(Exact name of registrant as specified in charter)
1939 Friendship Drive, Suite C, El Cajon, CA 92020
(Address of principal executive offices) (Zip code)
CT Corporation System
155 Federal St., Suite 700, Boston, MA 02110
(Name and address of agent for service)
Registrant's telephone number, including area code: (619) 588-9700
Date of fiscal year end: October 31
Date of reporting period: October 31, 2015
Form N-CSR is to be used by management investment companies to file reports with the Commission not later than 10 days after the transmission to stockholders of any report that is required to be transmitted to stockholders under Rule 30e-1 under the Investment Company Act of 1940 (17 CFR 270.30e -1). The Commission may use the information provided on Form N-CSR in its regulatory, disclosure review, inspection and policymaking roles.
A registrant is required to disclose the information specified by Form N-CSR, and the Commission will make this information public. A registrant is not required to respond to the collection of information contained in Form N-CSR unless the Form displays a currently valid Office of Management and Budget ("OMB") control number.
Item 1. Reports to Stockholders.
Greenleaf Income Growth Fund
ANNUAL REPORT
October 31, 2015
TICKER GIGFX
Greenleaf Income Growth Fund
Annual Report
October 31, 2015
Dear Fellow Shareholders,
Since our Semi-Annual Report as of April 30, 2015, we have continued to hold income and dividend producing securities for the Greenleaf Income Growth Fund (the "Fund"), which helps us meet our objective of increasing dividend income over time. These investments are primarily large, moderately growing companies in 21 different industry groups with long track records of increasing dividends.
Our Fund's portfolio includes common stocks, Master Limited Partnerships, Real Estate Investment Trusts, Closed-End Funds and Exchange Traded Funds, all of which have a history of generous yields. We have made these investments carefully so our largely all-equity Fund is well-diversified. At the end of our year on October 31, 2015, we have about 12% of the Fund's assets in cash which we are holding, while we seek buying opportunities that support our primary objective. In addition, we have used covered call options on some securities that we own to generate extra income for our Fund. Although most of these call options expire worthless, call-writing can help us to grow income as we may earn fresh cash which can then be reinvested.
The first twelve months of our Fund's operations were conducted in turbulent markets during which the price of crude oil dropped over 50% and stayed down through the end of our fiscal year. Believing that this price decline would hold for a longer period than we originally expected, we reduced our over-weighted position in energy stocks. Further, a number of large U.S. companies with extensive worldwide operations reported lower than expected earnings due to the dollar gaining strength during the year which led to some price pressure on our holdings. Our Fund was not immune to these major changes. For the period from the November 3, 2014 inception through October 31, 2015 our Fund's total return was down 11.03% . As a comparison, the S&P 500 Stock Index's total return was up 5.20%, including income.
We continue to aim for growing dividend income in our portfolio and maintaining the quality and diversity of our holdings to improve on our secondary objective of capital appreciation performance. We thank you for investing with us.
Sincerely,
Geofrey Greenleaf Rakesh Mehra
Performance data quoted represents past performance. Past performance does not guarantee future results. The investment return and principal value of an investment will fluctuate so that an investor’s shares, when redeemed, may be worth more or less than their original cost. All returns include change in share prices, and reinvestment of any dividends, capital gains and return of capital distributions. Current performance may be lower or higher than the performance data quoted. You may obtain performance data current to the most recent month-end by calling 1-888-511-4340. An investment in the Fund is subject to investment risks, including the possible loss of the principal amount invested. The Fund’s principal underwriter is Rafferty Capital Markets, LLC.
2015 Annual Report 1
Greenleaf Income Growth Fund
PERFORMANCE INFORMATION (Unaudited)
October 31, 2015 NAV $8.65
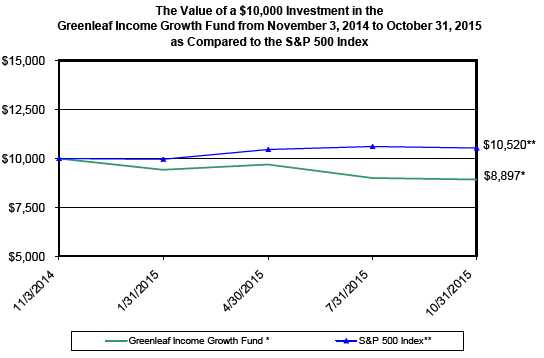
TOTAL RETURNS AS OF OCTOBER 31, 2015
| | Since | |
| | Inception(A) | |
| Greenleaf Income Growth Fund | -11.03% | |
| S&P 500 Index (B) | 5.20% | |
Annual Fund Operating Expense Ratio (from 11/3/14 Prospectus): 1.48%
The Annual Fund Operating Expense Ratio reported above will not correlate to the expense ratio in the Fund’s financial highlights because the financial highlights include only the direct operating expenses incurred by the Fund, not the indirect costs of investing in acquired funds.
(A)Since Inception returns include change in share prices and in each case includes reinvestment of any dividends and capital gain distributions. The Greenleaf Income Growth Fund commenced operations on November 3, 2014.
(B)The S&P 500® Index is a widely recognized unmanaged index of equity prices and is representative of a broader market and range of securities than is found in the Fund’s portfolio. The Index is an unmanaged benchmark that assumes reinvestment of all distributions and excludes the effect of taxes and fees. Individuals cannot invest directly in this Index; however, an individual can invest in exchange traded funds or other investment vehicles that attempt to track the performance of a benchmark index.
PAST PERFORMANCE DOES NOT GUARANTEE FUTURE RESULTS. INVESTMENT RETURN AND PRINCIPAL VALUE WILL FLUCTUATE SO THAT SHARES, WHEN REDEEMED, MAY BE WORTH MORE OR LESS THAN THEIR ORIGINAL COST. RETURNS DO NOT REFLECT THE DEDUCTION OF TAXES THAT A SHAREHOLDER WOULD PAY ON FUND DISTRIBUTIONS OR THE REDEMPTION OF FUND SHARES. CURRENT PERFORMANCE MAY BE LOWER OR HIGHER THAN THE PERFORMANCE DATA QUOTED. TO OBTAIN PERFORMANCE DATA CURRENT TO THE MOST RECENT MONTH END, PLEASE CALL 1-888-511-4340. AN INVESTMENT IN THE FUND IS SUBJECT TO INVESTMENT RISKS, INCLUDING THE POSSIBLE LOSS OF THE PRINCIPAL AMOUNT INVESTED. THE FUND'S DISTRIBUTOR IS RAFFERTY CAPITAL MARKETS, LLC.
2015 Annual Report 2
Greenleaf Income Growth Fund
Greenleaf Income Growth Fund
by Sectors (as a percentage of Net Assets)
October 31, 2015
(Unaudited)
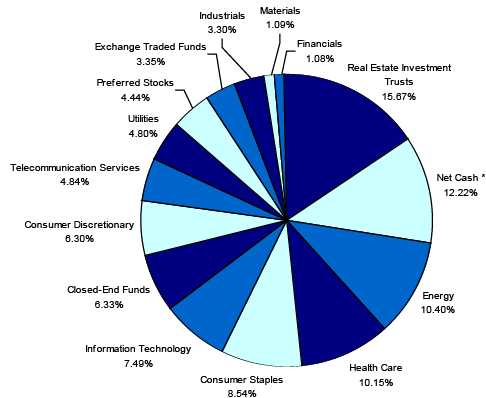
* Net Cash represents cash equivalents and other assets in excess of liabilities.
Availability of Quarterly Schedule of Investments
(Unaudited)
The Fund files its complete schedule of portfolio holdings with the Securities and Exchange Commission ("SEC") for the first and third quarters of each fiscal year on Form N-Q. The Fund’s Form N-Q is available on the SEC's Web site at http://www.sec.gov. The Fund’s Form N-Q may also be reviewed and copied at the SEC's Public Reference Room in Washington, DC. Information on the operation of the Public Reference Room may be obtained by calling 1-800-SEC-0330.
Proxy Voting Guidelines
(Unaudited)
42 Investment Advisory Group, LLC, the Fund’s investment adviser (“Adviser”), is responsible for exercising the voting rights associated with the securities held by the Fund. A description of the policies and procedures used by the Adviser in fulfilling this responsibility is available without charge on the Fund’s website at www.greenleafincomegrowthfund.com. It is also included in the Fund’s Statement of Additional Information, which is available on the SEC’s website at http://www.sec.gov.
Information regarding how the Fund voted proxies, Form N-PX, relating to portfolio securities during the most recent period ended June 30th, is available without charge, upon request, by calling our toll free number (1-888-511-4340). This information is also available on the SEC’s website at http://www.sec.gov.
2015 Annual Report 3
Expense Example
(Unaudited)
Shareholders of this Fund incur ongoing costs consisting of management fees and service fees. Although the Fund charges no sales loads or transaction fees, you will be assessed fees for outgoing wire transfers, returned checks and stop payment orders at prevailing rates charged by Mutual Shareholder Services, LLC, the Fund’s transfer agent. IRA accounts will be charged an $8.00 annual maintenance fee. If shares are redeemed within 90 days of purchase from the Fund, the shares are subject to a 1% redemption fee. Additionally, your account will be indirectly subject to the expenses of the underlying funds. The following example is intended to help you understand your ongoing costs of investing in the Fund and to compare these costs with similar costs of investing in other mutual funds. The example is based on an investment of $1,000 invested in the Fund on May 1, 2015 and held through October 31, 2015.
The first line of the table below provides information about actual account values and actual expenses. In order to estimate the expenses a shareholder paid during the period covered by this report, shareholders can divide their account value by $1,000 (for example, an $8,600 account value divided by $1,000 = 8.6) and then multiply the result by the number in the first line under the heading entitled "Expenses Paid During the Period." The second line of the table below provides information about hypothetical account values and hypothetical expenses based on the Fund's actual expense ratio and an assumed rate of return of 5% per year before expenses, which is not the Fund’s actual return. The hypothetical account values and expenses may not be used to estimate the actual ending account balance or expenses paid by a shareholder for the period. Shareholders may use this information to compare the ongoing costs of investing in this Fund and other funds. To do so, compare this 5% hypothetical example with the 5% hypothetical examples that appear in other funds' shareholder reports.
Please note that the expenses shown in the table are meant to highlight your ongoing costs only and do not reflect any transactional costs, such as redemption fees or the charges assessed by Mutual Shareholder Services, LLC as described above and expenses of underlying funds. Therefore, the second line of the table is useful in comparing ongoing costs only, and will not help you determine the relative total costs of owning different funds. In addition, if these transactional costs were included, your costs would have been higher.
| | | | | | | Expenses Paid |
| | | Beginning | | Ending | | During the Period* |
| | | Account Value | | Account Value | | May 1, 2015 to |
| | | May 1, 2015 | | October 31, 2015 | | October 31, 2015 |
| |
| Actual | | $1,000.00 | | $918.10 | | $6.96 |
| |
| Hypothetical | | $1,000.00 | | $1,017.95 | | $7.32 |
| (5% annual return | | | | | | |
| before expenses) | | | | | | |
* Expenses are equal to the Fund’s annualized expense ratio of 1.44%, multiplied by
the average account value over the period, multiplied by 184/365 (to reflect the
one-half year period). |
2015 Annual Report 4
| Greenleaf Income Growth Fund | | | | |
| | | | Schedule of Investments |
| | | | October 31, 2015 |
| Shares | | | Fair Value | % of Net Assets |
| COMMON STOCKS | | | | |
| Beverages | | | | | |
| 1,200 | PepsiCo, Inc. | $ | 122,628 | 2.62 | % |
| Chemicals & Allied Products | | | | |
| 538 | Olin Corporation | | 10,319 | 0.22 | % |
| Cigarettes | | | | | |
| 1,200 | Philip Morris International Inc. | | 106,080 | 2.27 | % |
| Computer & Office Equipment | | | | |
| 2,800 | Lexmark International, Inc. | | 90,972 | 1.95 | % |
| Cutlery, Handtools & General Hardware | | | | |
| 375 | Snap-on Incorporated | | 62,209 | 1.33 | % |
| Drilling Oil & Gas Wells | | | | |
| 5,800 | Noble Corporation plc (United Kingdom) | | 78,126 | 1.67 | % |
| Electric & Other Services Combined | | | | |
| 1,500 | Duke Energy Corporation | | 107,205 | 2.29 | % |
| Electric Services | | | | |
| 2,600 | The Southern Company | | 117,260 | 2.51 | % |
| Games, Toys & Children's Vehicles (No Dolls & Bicycles) | | | | |
| 750 | Hasbro, Inc. | | 57,622 | 1.23 | % |
| Investment Advice | | | | |
| 1,500 | The Blackstone Group L.P. | | 49,590 | | |
| 38 | PJT Partners Inc. * | | 806 | | |
| | | | 50,396 | 1.08 | % |
| Natural Gas Transmission | | | | |
| 2,032 | Energy Transfer Partners, L.P. | | 89,777 | | |
| 3,200 | Kinder Morgan, Inc. | | 87,520 | | |
| | | | 177,297 | 3.79 | % |
| Petroleum Refining | | | | |
| 1,000 | BP p.l.c. ** | | 35,700 | | |
| 1,000 | ConocoPhillips + | | 53,350 | | |
| 1,200 | Exxon Mobil Corporation | | 99,288 | | |
| | | | 188,338 | 4.03 | % |
| Pharmaceutical Preparations | | | | |
| 2,000 | AbbVie Inc. | | 119,100 | | |
| 1,100 | Johnson & Johnson | | 111,133 | | |
| 2,000 | Merck & Co., Inc. | | 109,320 | | |
| 4,000 | Pfizer Inc. | | 135,280 | | |
| | | | 474,833 | 10.15 | % |
| Plastic Materials, Synth Resins & Nonvulcan Elastomers | | | | |
| 790 | The Dow Chemical Company | | 40,819 | 0.87 | % |
| Retail - Apparel & Accessory Stores | | | | |
| 1,800 | Hanesbrands Inc. | | 57,492 | 1.23 | % |
| Retail - Eating Places | | | | |
| 900 | McDonald's Corporation | | 101,025 | 2.16 | % |
| Semiconductors & Related Devices | | | | |
| 3,600 | Intel Corporation | | 121,896 | 2.61 | % |
| Services - Miscellaneous Amusement & Recreation | | | | |
| 1,400 | Cedar Fair, L.P. | | 78,400 | 1.68 | % |
| Services - Miscellaneous Equipment Rental & Leasing | | | | |
| 7,000 | Fly Leasing Limited ** | | 92,330 | 1.97 | % |
* Non-Income Producing Security.
** ADR - American Depositary Receipt.
+ Portion or all of the security is pledged as collateral for call
options written.
The accompanying notes are an integral part of these
financial statements. |
2015 Annual Report 5
| Greenleaf Income Growth Fund |
| | | | Schedule of Investments |
| | | | October 31, 2015 |
| Shares | | Fair Value | | % of Net Assets |
| COMMON STOCKS | | | | | |
| Services - Prepackaged Software | | | | | |
| 2,600 | Microsoft Corporation | $ | 136,864 | | 2.93 | % |
| Soap, Detergent, Cleaning Preparations, Perfumes, Cosmetics | | | | | |
| 1,350 | Procter & Gamble Company | | 103,113 | | | |
| 1,500 | Unilever N.V. ** | | 67,470 | | | |
| | | | 170,583 | | 3.65 | % |
| Telephone Communications (No Radio Telephone) | | | | | |
| 3,400 | AT&T Inc. | | 113,934 | | | |
| 2,400 | Verizon Communications Inc. | | 112,512 | | | |
| | | | 226,446 | | 4.84 | % |
| Wholesale - Petroleum Bulk Stations & Terminals | | | | | |
| 1,300 | Global Partners LP | | 42,588 | | 0.91 | % |
| Total for Common Stocks (Cost $2,927,103) | | 2,711,728 | | 57.99 | % |
| CLOSED - END FUNDS | | | | | |
| 10,000 | Eaton Vance Tax-Managed Global Buy-Write Opportunities | | 117,400 | | | |
| 3,000 | Fiduciary/Claymore MLP Opportunity Fund | | 51,150 | | | |
| 4,000 | GAMCO Natural Resources, Gold & Income Trust | | 24,840 | | | |
| 14,000 | Prospect Capital Corporation | | 102,620 | | | |
| Total for Closed - End Funds (Cost $333,908) | | 296,010 | | 6.33 | % |
| EXCHANGE TRADED FUNDS | | | | | |
| 2,800 | First Trust Multi-Asset Diversified Income Index Fund | | 53,816 | | | |
| 5,000 | Global X SuperDividend™ ETF | | 103,050 | | | |
| Total for Exchange Traded Funds (Cost $181,009) | | 156,866 | | 3.35 | % |
| PREFERRED STOCKS | | | | | |
| 2,000 | Goldman Sachs Group, Inc. Series K, 6.37% | | 53,660 | | | |
| 2,000 | JPMorgan Chase & Co. Series W, 6.30% | | 52,100 | | | |
| 2,000 | Stanley Black & Decker, Inc., 5.75% | | 52,180 | | | |
| 2,000 | WR Berkley Corp., 5.625% | | 49,840 | | | |
| Total for Preferred Stocks (Cost $205,140) | | 207,780 | | 4.44 | % |
| REAL ESTATE INVESTMENT TRUSTS | | | | | |
| 10,400 | Annaly Capital Management, Inc. | | 103,480 | | | |
| 9,600 | Capstead Mortgage Corporation | | 92,640 | | | |
| 10,000 | NorthStar Realty Finance Corp. | | 120,100 | | | |
| 2,600 | Realty Income Corporation | | 128,596 | | | |
| 650 | Sovran Self Storage, Inc. | | 64,916 | | | |
| 13,200 | Vereit, Inc. | | 109,032 | | | |
| 1,800 | W.P. Carey Inc. | | 114,066 | | | |
| Total for Real Estate Investment Trusts (Cost $825,350) | | 732,830 | | 15.67 | % |
| Total Investment Securities | | 4,105,214 | | | |
| | (Cost $4,472,510) | | | | | |
| Other Assets in Excess of Liabilities | | 571,692 | | 12.22 | % |
| Net Assets | | $ | 4,676,906 | | 100.00 | % |
** ADR - American Depositary Receipt.
The accompanying notes are an integral part of these
financial statements. |
2015 Annual Report 6
| Greenleaf Income Growth Fund | | | | |
| | | Schedule of Options Written |
| | | October 31, 2015 |
| Underlying Security | | Shares Subject | | Fair Value |
| Expiration Date/Exercise Price | | to Call | | |
| ConocoPhillips | | | | |
| November 2015 Calls @ 67.50 | | 1,000 | | $ 40 |
| Total (Premiums Received $2,186) | | | | $ 40 |
The accompanying notes are an integral part of these
financial statements. |
2015 Annual Report 7
| Greenleaf Income Growth Fund | | | |
| |
| Statement of Assets and Liabilities | | | |
| October 31, 2015 | | | |
| |
| Assets: | | | |
| Investment Securities at Fair Value | $ | 4,105,214 | |
| (Cost $4,472,510) | | | |
| Cash | | 562,732 | |
| Dividends Receivable | | 14,625 | |
| Total Assets | | 4,682,571 | |
| Liabilities: | | | |
| Covered Call Options Written at Fair Value (Premiums Received $2,186) | | 40 | |
| Management Fees Payable | | 3,906 | |
| Service Fees Payable | | 1,719 | |
| Total Liabilities | | 5,665 | |
| Net Assets | $ | 4,676,906 | |
| |
| Net Assets Consist of: | | | |
| Paid In Capital | $ | 5,338,177 | |
| Accumulated Undistributed Net Investment Income/(Loss) | | (510 | ) |
| Accumulated Undistributed Realized Gain/(Loss) on Investments - Net | | (295,611 | ) |
| Unrealized Appreciation/(Depreciation) in Value of Investments | | | |
| Based on Identified Cost - Net | | (365,150 | ) |
| Net Assets, for 540,614 Shares Outstanding | $ | 4,676,906 | |
| (Unlimited shares authorized) | | | |
| Net Asset Value and Offering Price Per Share | | | |
| ($4,676,906/540,614 shares) | $ | 8.65 | |
| Redemption Price * ($8.65 x 0.99) (Note 2) | $ | 8.56 | |
| |
| Statement of Operations | | | |
| For the period November 3, 2014** through October 31, 2015 | | | |
| |
| Investment Income: | | | |
| Dividends from Common Stock (net of foreign taxes withheld of $459) | $ | 162,794 | |
| Distributions Received from Master Limited Partnerships | | 33,388 | |
| Less: Return of Capital on Distributions from Master Limited Partnerships | | (33,388 | ) |
| Interest | | 43 | |
| Total Investment Income | | 162,837 | |
| Expenses: | | | |
| Management Fees (Note 4) | | 47,683 | |
| Service Fees (Note 4) | | 20,981 | |
| Total Expenses | | 68,664 | |
| |
| Net Investment Income/(Loss) | | 94,173 | |
| |
| Realized and Unrealized Gain/(Loss) on Investments & Options Written: | | | |
| Capital Gain Distributions from Investment Companies | | 1,039 | |
| Realized Gain/(Loss) on Investments | | (316,307 | ) |
| Realized Gain/(Loss) on Options Written | | 19,657 | |
| Net Change in Unrealized Appreciation/(Depreciation) on Investments | | (367,296 | ) |
| Net Change in Unrealized Appreciation/(Depreciation) on Options Written | | 2,146 | |
| Net Realized and Unrealized Gain/(Loss) on Investments & Options Written | | (660,761 | ) |
| |
| Net Increase/(Decrease) in Net Assets from Operations | $ | (566,588 | ) |
* Reflects a 1% redemption fee if shares are redeemed within 90 days of purchase.
** Commencement of Operations. |
The accompanying notes are an integral part of these
financial statements. |
2015 Annual Report 8
| Greenleaf Income Growth Fund |
| | |
| Statement of Changes in Net Assets | | | | |
| | | 11/3/2014* | | |
| | | to | | |
| | | 10/31/2015 | | |
| From Operations: | | | | |
| Net Investment Income/(Loss) | $ | 94,173 | | |
| Capital Gain Distributions from Investment Companies | | 1,039 | | |
| Net Realized Gain/(Loss) on Investments | | (316,307 | ) | |
| Net Realized Gain/(Loss) on Options Written | | 19,657 | | |
| Change in Net Unrealized Appreciation/(Depreciation) on | | | | |
| Investments and Options Written | | (365,150 | ) | |
| Increase/(Decrease) in Net Assets from Operations | | (566,588 | ) | |
| From Distributions to Shareholders: | | | | |
| Net Investment Income | | (94,683 | ) | |
| Return of Capital | | (38,733 | ) | |
| Net Realized Gain from Security Transactions | | - | | |
| Change in Net Assets from Distributions | | (133,416 | ) | |
| From Capital Share Transactions: | | | | |
| Proceeds From Sale of Shares | | 5,243,502 | | |
| Proceeds From Redemption Fees (Note 2) | | - | | |
| Shares Issued on Reinvestment of Dividends | | 133,416 | | |
| Cost of Shares Redeemed | | (8 | ) | |
| Net Increase/(Decrease) from Shareholder Activity | | 5,376,910 | | |
| Net Increase/(Decrease) in Net Assets | | 4,676,906 | | |
| Net Assets at Beginning of Period | | - | | |
| Net Assets at End of Period (Including Accumulated Undistributed Net | | | | |
| Investment Income/(Loss) of ($510)) | $ | 4,676,906 | | |
| Share Transactions: | | | | |
| Issued | | 525,758 | | |
| Reinvested | | 14,857 | | |
| Redeemed | | (1 | ) | |
| Net Increase/(Decrease) in Shares | | 540,614 | | |
| Shares Outstanding Beginning of Period | | - | | |
| Shares Outstanding End of Period | | 540,614 | | |
| | |
| Financial Highlights | | | | |
| Selected data for a share outstanding throughout the period: | | 11/3/2014* | | |
| | | to | | |
| | | 10/31/2015 | | |
| Net Asset Value - | | | | |
| Beginning of Period | $ | 10.00 | | |
| Net Investment Income/(Loss) (a) (e) | | 0.18 | | |
| Net Gain/(Loss) on Securities (b) | | | | |
| (Realized and Unrealized) | | (1.28 | ) | |
| Total from Investment Operations | | (1.10 | ) | |
| Distributions (From Net Investment Income) | | (0.18 | ) | |
| Distributions (From Return of Capital) | | (0.07 | ) | |
| Distributions (From Realized Capital Gains) | | - | | |
| Total Distributions | | (0.25 | ) | |
| Proceeds from Redemption Fee (Note 2) | | - | | |
| Net Asset Value - End of Period | $ | 8.65 | | |
| Total Return (c) | | (11.03)% | | ** |
| Ratios/Supplemental Data | | | | |
| Net Assets - End of Period (Thousands) | $ | 4,677 | | |
| Ratio of Expenses to Average Net Assets (d) | | 1.44% | | *** |
| Ratio of Net Investment Income/(Loss) to Average Net Assets (d) (e) | | 1.97% | | *** |
| Portfolio Turnover Rate | | 21.48% | | ** |
* Commencement of Operations. ** Not Annualized. *** Annualized.
(a) Per share amounts were calculated using the average shares method.
(b) Realized and unrealized gains and losses per share in this caption are balancing amounts
necessary to reconcile the change in net asset value for the period, and may not reconcile
with the aggregate gains and losses in the Statement of Operations due to share transactions
for the period.
(c) Total return in the above table represents the rate that the investor would have earned
or lost on an investment in the Fund assuming reinvestment of dividends and distributions.
(d) These ratios exclude the impact of expenses of the underlying security holdings listed
on the Schedule of Investments.
(e) Recognition of net investment income by the Fund is affected by the timing of the
declaration of dividends by the underlying investment companies in which the Fund invests. |
The accompanying notes are an integral part of these
financial statements. |
2015 Annual Report 9
NOTES TO THE FINANCIAL STATEMENTS
GREENLEAF INCOME GROWTH FUND
October 31, 2015
1.) ORGANIZATION
Greenleaf Income Growth Fund (the “Fund”) was organized as a diversified series of PFS Funds (the “Trust”) on September 18, 2014 and commenced operations on November 3, 2014. The Trust was established under the laws of Massachusetts by an Agreement and Declaration of Trust dated January 13, 2000. Prior to March 5, 2010, the Trust was named Wireless Fund. The Trust is registered as an open-end investment company under the Investment Company Act of 1940, as amended (the “1940 Act”). The Trust may offer an unlimited number of shares of beneficial interest in a number of separate series, each series representing a distinct fund with its own investment objectives and policies. As of October 31, 2015, there were ten series authorized by the Trust. The Fund's primary objective is to seek increasing dividend income over time and its secondary objective is capital appreciation. The investment adviser to the Fund is 42 Investment Advisory Group, LLC (the “Adviser”). Significant accounting policies of the Fund are presented below:
2.) SIGNIFICANT ACCOUNTING POLICIES
SECURITY VALUATION
All investments in securities are recorded at their estimated fair value, as described in Note 3.
SHARE VALUATION
The net asset value (the “NAV”) is generally calculated as of the close of trading on the New York Stock Exchange (normally 4:00 p.m. Eastern time) every day the Exchange is open. The NAV is calculated by taking the total value of the Fund’s assets, subtracting its liabilities, and then dividing by the total number of shares outstanding, rounded to the nearest cent. The offering price and redemption price per share is equal to the net asset value per share, except that shares of the Fund are subject to a redemption fee of 1% if redeemed within 90 days of purchase. During the period November 3, 2014 through October 31, 2015, proceeds from redemption fees were $0.
OPTIONS
The purchase and writing of options requires additional skills and techniques beyond normal portfolio management, and involves certain risks. The purchase of options limits a Fund’s potential loss to the amount of the premium paid and can afford a Fund the opportunity to profit from favorable movements in the price of the underlying security to a greater extent than if the transaction were effected directly. When a Fund writes an option, an amount equal to the premium received by the Fund is recorded as a liability and is subsequently adjusted to the current fair value of the option written. Premiums received from writing options that expire unexercised are treated by a Fund on the expiration date as realized gains from investments. The difference between the premium and the amount paid on effecting a closing purchase transaction, including brokerage commissions, is also treated as a realized gain, or, if the premium is less than the amount paid for the closing purchase transaction, as a realized loss. If a written call option is exercised, the premium is added to the proceeds from the sale of the underlying security or currency in determining whether a Fund has realized a gain or a loss. If a written put option is exercised, the premium reduces the cost basis of the securities purchased by the Fund. A Fund, as writer of an option, bears the market risk of an unfavorable change in the price of the security underlying the written option.
FEDERAL INCOME TAXES
The Fund’s policy is to continue to comply with the requirements of the Internal Revenue Code that are applicable to regulated investment companies and to distribute all of its taxable income to shareholders. Therefore, no federal income tax provision is required. It is the Fund’s policy to distribute annually, prior to the end of the calendar year, dividends sufficient to satisfy excise tax requirements of the Internal Revenue Code. This Internal Revenue Code requirement may cause an excess of distributions over the book year-end accumulated income. In addition, it is the Fund’s policy to distribute annually, after the end of the fiscal year, any remaining net investment income and net realized capital gains.
The Fund recognizes the tax benefits of certain tax positions only where the position is “more likely than not” to be sustained assuming examination by tax authorities. Management has analyzed the Fund’s tax positions, and has concluded that no liability for unrecognized tax benefits should be recorded related to uncertain tax positions expected to be taken in the Fund’s initial tax return. The Fund identifies its major tax jurisdictions as U.S. Federal tax authorities; however, the Fund is not aware of any tax positions for which it is reasonably possible that the total amounts of unrecognized tax benefits will change materially in the next twelve months. The Fund recognizes interest and penalties, if any, related to unrecognized tax benefits as income tax expense in the Statement of Operations. During the period November 3, 2014 through October 31, 2015, the Fund did not incur any interest or penalties.
2015 Annual Report 10
Notes to the Financial Statements - continued
DISTRIBUTIONS TO SHAREHOLDERS
Distributions to shareholders, which are determined in accordance with income tax regulations, are recorded on the ex-dividend date.
The treatment for financial reporting purposes of distributions made to shareholders during the year from net investment income or net realized capital gains may differ from their ultimate treatment for federal income tax purposes. The tax character of distributions paid during the year ending October 31, 2015 will be determined in early 2016. The differences between book and tax basis are caused primarily by differences in the timing of the recognition of certain components of income, expense, or realized capital gain for federal income tax purposes. Where such differences are permanent in nature, they are reclassified in the components of the net assets based on their ultimate characterization for federal income tax purposes. Any such reclassifications will have no effect on net assets, result of operations, or net asset value per share of the Fund. As of October 31, 2015, due to permanent book to tax differences, $38,733 of distributions in excess of net investment income was reclassified to paid in capital.
USE OF ESTIMATES
The preparation of financial statements in conformity with accounting principles generally accepted in the United States (“GAAP”) requires management to make estimates and assumptions that affect the reported amounts of assets and liabilities and disclosure of contingent assets and liabilities at the date of the financial statements and the reported amounts of increases and decreases in net assets from operations during the reporting period. Actual results could differ from those estimates.
ORGANIZATIONAL & OFFERING EXPENSES
All costs incurred by the Fund in connection with the organization, offering and initial registration of the Fund, principally professional fees, were paid on behalf of the Fund by the Adviser and will not be borne by the Fund.
EXPENSES
Expenses incurred by the Trust that do not relate to a specific fund of the Trust are allocated to the individual funds based on each fund’s relative net assets or another appropriate basis.
OTHER
The Fund records security transactions based on a trade date for financial statement purposes. Dividend income is recognized on the ex-dividend date, and interest income is recognized on an accrual basis. Discounts and premiums on securities purchased are accreted and amortized over the lives of the respective securities. Withholding taxes on foreign dividends have been provided for in accordance with the Fund’s understanding of the applicable country’s tax rules and rates.
The Fund may own shares of real estate investment trusts (“REITs”), which report information on the source of their distributions annually. Distributions received from investments in REITs in excess of income from underlying investments are recorded as realized gain and/or as reduction to the cost of the individual REIT. Additionally, the Fund may invest in Master Limited Partnerships (“MLPs”), which generally are treated as partnerships for Federal income tax purposes. As a limited partner in the MLPs, the Fund includes its allocable shares of the MLPs’ taxable income in computing its own taxable income. The tax character of these distributions is not known until after the fiscal year of the Fund. When actual tax character information is not known for REITs and MLPs, management estimates such amounts based on historical data.
3.) INVESTMENT SECURITIES VALUATIONS
The Fund utilizes various methods to measure the fair value of most of its investments on a recurring basis. GAAP establishes a hierarchy that prioritizes inputs to valuation methods. The three levels of inputs are:
Level 1 - Unadjusted quoted prices in active markets for identical assets or liabilities that the Fund has the ability to access.
Level 2 - Observable inputs other than quoted prices in active markets included in level 1 that are observable for the asset or liability, either directly or indirectly. These inputs may include quoted prices for the identical instrument on an inactive market, prices for similar instruments, interest rates, prepayment speeds, credit risk, yield curves, default rates and similar data.
Level 3 - Unobservable inputs for the asset or liability, to the extent relevant observable inputs are not available, representing the Fund’s own assumptions about the assumptions a market partici-
2015 Annual Report 11
Notes to the Financial Statements - continued
pant would use in valuing the asset or liability, and would be based on the best information available.
The availability of observable inputs can vary from security to security and is affected by a wide variety of factors, including, for example, the type of security, whether the security is new and not yet established in the marketplace, the liquidity of markets, and other characteristics particular to the security. To the extent that valuation is based on models or inputs that are less observable or unobservable in the market, the determination of fair value requires more judgment. Accordingly, the degree of judgment exercised in determining fair value is greatest for instruments categorized in level 3.
The inputs used to measure fair value may fall into different levels of the fair value hierarchy. In such cases, for disclosure purposes, the level in the fair value hierarchy within which the fair value measurement falls in its entirety, is determined based on the lowest level input that is significant to the fair value measurement in its entirety.
FAIR VALUE MEASUREMENTS
A description of the valuation techniques applied to the Fund’s major categories of assets and liabilities measured at fair value on a recurring basis follows.
Equity securities (common stocks, including ADRs and MLPs, closed-end funds, exchange traded funds, preferred stocks and real estate investment trusts). Equity securities are generally valued by using market quotations. The market quotation used for common stocks, including those listed on the NASDAQ National Market System, is the last sale price on the date on which the valuation is made or, in the absence of sales, at the closing bid price. Over-the-counter securities will be valued on the basis of the bid price at the close of each business day. Generally, if the security is traded in an active market and is valued at the last sale price, the security is categorized as a level 1 security. When the security position is not considered to be part of an active market or when the security is valued at the bid price, the position is generally categorized as a level 2 security. When market quotations are not readily available, when the Adviser determines the last bid price does not accurately reflect the current value or when restricted securities are being valued, such securities are valued as determined in good faith by the Adviser, in conformity with guidelines adopted by and subject to review of the Board of Trustees (the “Trustees”) and are categorized as level 2 or level 3 securities, when appropriate.
Money market funds. Shares of money market funds are valued at net asset value and are classified in level 1 of the fair value hierarchy.
Options. Option positions that are traded on any exchange or on the NASDAQ over-the-counter market are valued at the last quoted sale price. To the extent these option positions are actively traded and valuation adjustments are not applied, they are classified in level 1 of the fair value hierarchy. Lacking a last sale price, a purchased option position is valued at its last bid price except when, in the Adviser’s opinion, the last bid price does not accurately reflect the current value of the option position. Lacking a last sale price, a written option position is valued at its last ask price except when, in the Adviser’s opinion, the last ask price does not accurately reflect the current value of the option position. When such bid or ask prices are used for valuation or when the security is not actively traded, those securities are generally categorized in level 2 or level 3 of the fair value hierarchy.
Fixed income securities. Fixed income securities generally are valued by using market quotations, but may be valued on the basis of prices furnished by a pricing service when the Adviser believes such prices accurately reflect the fair market value of such securities. A pricing service utilizes electronic data processing techniques based on yield spreads relating to securities with similar characteristics to determine prices for normal institutional-size trading units of debt securities without regard to sale or bid prices. When prices are not readily available from a pricing service, or when restricted or illiquid securities are being valued, securities are valued at fair value as determined in good faith by the Adviser, subject to review of the Trustees. Short-term investments in fixed income securities with maturities of less than 60 days when acquired, or which subsequently are within 60 days of maturity, are valued by using the amortized cost method of valuation. Generally, fixed income securities are categorized as level 2.
In accordance with the Trust's good faith pricing guidelines, the Adviser is required to consider all appropriate factors relevant to the value of securities for which it has determined other pricing sources are not available or reliable as described above. There is no standard procedure for determining fair value, since fair value depends upon the circumstances of each individual case. As a
2015 Annual Report 12
Notes to the Financial Statements - continued
general principle, the current fair value of an issue of securities being valued by the Adviser would appear to be the amount which the owner might reasonably expect to receive for them upon their current sale. Methods which are in accordance with this principle may, for example, be based on (i) a multiple of earnings; (ii) a discount from market of a similar freely traded security (including a derivative security or a basket of securities traded on other markets, exchanges or among dealers); or (iii) yield to maturity with respect to debt issues, or a combination of these and other methods.
The following table summarizes the inputs used to value the Fund’s assets and liabilities measured at fair value as of October 31, 2015:
| Valuation Inputs of Assets | | Level 1 | | Level 2 | | Level 3 | | Total |
| Common Stocks, including ADRs & MLPs | | $2,711,728 | | $0 | | $0 | | $2,711,728 |
| Closed-End Funds | | 296,010 | | 0 | | 0 | | 296,010 |
| Exchange Traded Funds | | 156,866 | | 0 | | 0 | | 156,866 |
| Preferred Stocks | | 207,780 | | 0 | | 0 | | 207,780 |
| Real Estate Investment Trusts | | 732,830 | | 0 | | 0 | | 732,830 |
| Total | | $4,105,214 | | $0 | | $0 | | $4,105,214 |
| |
| Valuation Inputs of Liabilities | | Level 1 | | Level 2 | | Level 3 | | Total |
| Written Options | | $0 | | $40 | | $0 | | $40 |
| Total | | $0 | | $40 | | $0 | | $40 |
The Fund did not hold any Level 3 assets during the period November 3, 2014 through October 31, 2015. There were no transfers into or out of level 1 and level 2 during the period November 3, 2014 through October 31, 2015. It is the Fund’s policy to consider transfers into or out of level 1 and level 2 as of the end of the reporting period.
4.) INVESTMENT ADVISORY AGREEMENT AND SERVICES AGREEMENT
The Fund has entered into an investment advisory agreement (“Management Agreement”) with the Adviser. The Adviser manages the investment portfolio of the Fund, subject to policies adopted by the Trust's Board of Trustees. Under the Management Agreement, the Adviser, at its own expense and without reimbursement from the Trust, furnishes office space and all necessary office facilities, equipment and executive personnel necessary for managing the assets of the Fund. For its services the Adviser receives an investment management fee equal to 1.00% of the average daily net assets of the Fund up to $200 million and 0.84% of the Fund’s average daily net assets in excess of $200 million.
Under the Services Agreement the Adviser receives an additional fee of 0.44% and is obligated to pay the operating expenses of the Fund excluding management fees, brokerage fees and commissions, taxes, borrowing costs (such as (a) interest and (b) dividend expenses on securities sold short), ADR fees, the cost of acquired funds and extraordinary expenses.
For the period November 3, 2014 through October 31, 2015, the Adviser earned management fees totaling $47,683 and service fees totaling $20,981. As a result of the management fees and services fees, as of October 31, 2015, the Fund owed the Adviser $3,906 and $1,719, respectively.
5.) RELATED PARTY TRANSACTIONS
Jeffrey R. Provence of Premier Fund Solutions, Inc. (the “Administrator”) also serves as trustee/officer of the Fund. This individual receives benefits from the Administrator resulting from administration fees paid to the Administrator of the Fund by the Adviser.
The Trustees who are not interested persons of the Fund were each paid $1,000, for a total of $3,000, in Trustees’ fees for the period November 3, 2014 through October 31, 2015 by the Adviser.
6.) CAPITAL SHARES
The Trust is authorized to issue an unlimited number of shares. Paid in capital at October 31, 2015 was $5,338,177, representing 540,614 shares outstanding.
7.) PURCHASES AND SALES OF SECURITIES
For the period November 3, 2014 through October 31, 2015, purchases and sales of investment securities other than U.S. Government obligations and short-term investments aggregated $5,701,838 and $852,004, respectively. Purchases and sales of U.S. Government obligations aggregated $0 and $0, respectively.
2015 Annual Report 13
Notes to the Financial Statements - continued
8.) WRITTEN OPTIONS
As of October 31, 2015, portfolio securities valued at $53,350 were held by the Fund as collateral for options written by the Fund.
Transactions in written options during the period November 3, 2014 through October 31, 2015 were as follows:
| | Number of | | | Premiums | |
| | Contracts | | | Received | |
| Options outstanding at November 3, 2014 | 0 | | | $0 | |
| Options written | 260 | | | $29,026 | |
| Options terminated in closing purchase transactions | (16 | ) | | ($2,294 | ) |
| Options expired | (157 | ) | | ($18,264 | ) |
| Options exercised | (77 | ) | | ($6,282 | ) |
| Options outstanding at October 31, 2015 | 10 | | | $2,186 | |
The location on the Statement of Assets and Liabilities of the Fund's derivative positions, which are not accounted for as hedging instruments under GAAP, is as follows:
| | Liability
Derivatives |
Call Options Written | ($40) |
Realized and unrealized gains and losses on derivatives contracts entered into during the period November 3, 2014 through October 31, 2015 by the Fund are recorded in the following locations in the Statement of Operations:
| | | | Realized | | | Unrealized |
| | Location | | Gain/(Loss) | Location | | Gain/(Loss) |
| Call Options | Realized Gain | | | Change In Unrealized | | |
| Written | (Loss) on Written | | $19,657 | Appreciation (Depreciation) | | $2,146 |
| | Options | | | on Written Options | | |
The selling of covered call options may be used by the Fund to reduce volatility of the Fund because the premiums received from selling the options will reduce any losses on the underlying securities, but only by the amount of the premiums. However, selling the options may also limit the Fund’s gain on the underlying securities. Written call options expose the Fund to minimal counter-party risk since they are exchange-traded and the exchange’s clearing house guarantees the options against default.
The table below shows offsetting assets and liabilities relating to written options shown on the Statement of Assets and Liabilities as of October 31, 2015.
| Liabilities: | | | | | | | | | | | | |
| | | | | | | | | Gross Amounts Not | | |
| | | | | | | | | Offset in the Statement of | | |
| | | | | | | | | Assets and Liabilities | | |
| | | | | Gross | | Net Amount of | | | | | | |
| | | | | Amounts | | Liabilities | | | | | | |
| | | Gross | | Offset in the | | Presented in the | | | | | | |
| | | Amounts of | | Statement of | | Statement of | | | | | | |
| | | Recognized | | Assets and | | Assets and | | Financial | | Collateral | | |
| Description | | Liabilities | | Liabilities | | Liabilities | | Instruments | | Pledged | | Net Amount |
| Call Options | | | | | | | | | | | | |
| Written | | $40 | | $0 | | $40 | | $0 | | ($40) | | $0 |
9.) CONTROL OWNERSHIP
The beneficial ownership, either directly or indirectly, of more than 25% of the voting securities of a fund creates a presumption of control of the Fund, under Section 2(a)(9) of the Investment Company Act of 1940. As of October 31, 2015, Geofrey Greenleaf, located at 7600 Thistle Lane, Novelty, Ohio 44072, beneficially held, in aggregate, approximately 95.91% of the Fund and therefore, may be deemed to control the Fund. Geofrey Greenleaf is a control person of the Adviser.
2015 Annual Report 14
Notes to the Financial Statements - continued
10.) TAX MATTERS
For Federal income tax purposes, the cost of securities owned at October 31, 2015 was $4,472,653 and premiums received from written call options was $2,186. At October 31, 2015, the composition of unrealized appreciation (the excess of value over tax cost) and depreciation (the excess of tax cost over value) on a tax basis was as follows:
| | Appreciation | | (Depreciation) | | Net Appreciation/(Depreciation) | |
| | $90,119 | | ($455,412) | | ($365,293) | |
| |
| | The tax character of distributions was as follows: | | | |
| |
| | | | November 3, 2014 to | | | |
| | | | October 31, 2015 | | | |
| | Ordinary Income . | | $ 94,683 | | | |
| | Return of Capital . | | 38,733 | | | |
| | Long-Term Capital Gain | | 0 | | | |
| | | | $ 133,416 | | | |
As of October 31, 2015, the components of distributable earnings/(accumulated losses) on a tax basis were as follows:
| Undistributed ordinary income/(accumulated losses) | $ | (367 | ) |
| Undistributed long-term capital gain/(accumulated losses) | | (295,611 | ) |
| Unrealized appreciation/(depreciation) | | (365,293 | ) |
| | $ | (661,271 | ) |
As of October 31, 2015, the difference between book basis unrealized and tax basis unrealized is due to partnership adjustments.
11.) LOSS CARRYFORWARDS
As of October 31, 2015, the Fund had available for federal tax purposes an unused capital loss carryforward of $295,611, which may offset future short-term gains and has no expiration. To the extent that these capital loss carryforwards are used to offset future capital gains, it is probable that the amount, which is offset, will not be distributed to shareholders.
2015 Annual Report 15
Cohen Fund Audit Services, Ltd.
1350 Euclid Avenue, Ste 800
Cleveland, Ohio 44115 www.cohenfund.com | 216.649.1700
216.579.0111 fax |
REPORT OF INDEPENDENT REGISTERED PUBLIC ACCOUNTING FIRM
To the Shareholders of Greenleaf Income Growth Fund and
Board of Trustees of PFS Funds
We have audited the accompanying statement of assets and liabilities, including the schedules of investments and options written, of Greenleaf Income Growth Fund (the "Fund"), a series of PFS Funds, as of October 31, 2015, and the related statement of operations, the statement of changes in net assets, and the financial highlights for the period November 3, 2014 (commencement of operations) through October 31, 2015. These financial statements and financial highlights are the responsibility of the Fund's management. Our responsibility is to express an opinion on these financial statements and financial highlights based on our audit.
We conducted our audit in accordance with the standards of the Public Company Accounting Oversight Board (United States). Those standards require that we plan and perform the audit to obtain reasonable assurance about whether the financial statements and financial highlights are free of material misstatement. An audit includes examining, on a test basis, evidence supporting the amounts and disclosures in the financial statements. Our procedures included confirmation of securities owned as of October 31, 2015, by correspondence with the custodian and brokers. An audit also includes assessing the accounting principles used and significant estimates made by management, as well as evaluating the overall financial statement presentation. We believe that our audit provides a reasonable basis for our opinion.
In our opinion, the financial statements and financial highlights referred to above present fairly, in all material respects, the financial position of Greenleaf Income Growth Fund as of October 31, 2015, the results of its operations, the changes in its net assets, and the financial highlights for the period indicated above, in conformity with accounting principles generally accepted in the United States of America.

COHEN FUND AUDIT SERVICES, LTD.
Cleveland, Ohio
December 18, 2015
2015 Annual Report 16
Trustees and Officers
(Unaudited)
The Board of Trustees supervises the business activities of the Trust. The names of the Trustees and executive officers of the Trust are shown below. For more information regarding the Trustees, please refer to the Statement of Additional Information, which is available upon request by calling 1-888-511-4340. Each Trustee serves until the Trustee sooner dies, resigns, retires, or is removed.
The Trustees and Officers of the Trust and their principal business activities during the past five years are:
Interested Trustees and Officers
| | | | | Number of | |
| | | | Principal | Portfolios In | Other |
| Name, | Position(s) | Term of Office | Occupation(s) | Fund | Directorships |
| Address(1), | Held With | and Length of | During | Complex | Held By |
| and Year of Birth | the Trust | Time Served | Past 5 Years | Overseen By | Trustee |
| | | | | Trustee | |
| |
| Ross C. Provence, | President | Indefinite Term; | General Partner and Portfolio | N/A | N/A |
| Year of Birth: 1938 | | Since 2000 | Manager for Value Trend Capital | | |
| | | | Management, LP (1995 to current). | | |
| | | | Estate planning attorney (1963 to | | |
| current). |
| |
| Jeffrey R. Provence(2), | Trustee, | Indefinite Term; | CEO, Premier Fund Solutions, Inc. | 10 | Blue Chip |
| Year of Birth: 1969 | Secretary | Since 2000 | (2001 to current). General Partner | | Investor Funds |
| | and | | and Portfolio Manager for Value | | |
| | Treasurer | | Trend Capital Management, LP | | |
| | | | (1995 to current). | | |
| |
| Julian G. Winters, | Chief | Chief | Managing Member, Watermark | N/A | N/A |
| Year of Birth: 1968 | Compliance | Compliance | Solutions LLC (investment compli- | | |
| | Officer | Officer Since | ance and consulting) since March | | |
| | | 2010 | 2007. | | |
(1) The address of each trustee and officer is c/o PFS Funds, 1939 Friendship Drive, Suite C, El Cajon, California 92020.
(2) Jeffrey R. Provence is considered an "interested person" as defined in Section 2(a)(19) of the Investment Company Act of 1940 by virtue of his position with the Trust.
Independent Trustees
| | | | | Number of | |
| | | | Principal | Portfolios In | Other |
| Name, | Position | Term of Office | Occupation(s) | Fund | Directorships |
| Address(1), | Held With | and Length of | During | Complex | Held By |
| and Year of Birth | the Trust | Time Served | Past 5 Years | Overseen By | Trustee |
| | | | | Trustee | |
| |
| Thomas H. Addis III, | Independent | Indefinite Term; | Executive Director/CEO, Southern | 10 | None |
| Year of Birth: 1945 | Trustee | Since 2000 | California PGA (2006 to current). | | |
| |
| Allen C. Brown, | Independent | Indefinite Term; | Co-owner of Stebleton & Brown | 10 | Blue Chip |
| Year of Birth: 1943 | Trustee | Since 2010 | (1994 to current). Estate planning | | Investor Funds |
| | | | and business attorney (1970 to cur- | | |
| rent). |
| |
| George Cossolias, CPA, | Independent | Indefinite Term; | Partner of CWDL, CPAs (February 1, | 10 | Blue Chip |
| Year of Birth: 1935 | Trustee | Since 2000 | 2014 to current). Owner of George | | Investor Funds |
| | | | Cossolias & Company, CPAs (1972 | | |
| | | | to January 31, 2014). President of | | |
| | | | Lubrication Specialists, Inc. (1996 to | | |
| current). |
(1) The address of each trustee and officer is c/o PFS Funds, 1939 Friendship Drive, Suite C, El Cajon, California 92020.
2015 Annual Report 17
Investment Adviser
42 Investment Advisory Group, LLC
Legal Counsel
The Law Offices of John H. Lively & Associates, Inc.
A member firm of The 1940 Act Law GroupTM
Custodian
US Bank, N.A.
Distributor
Rafferty Capital Markets, LLC
Dividend Paying Agent,
Shareholders' Servicing Agent,
Transfer Agent
Mutual Shareholder Services, LLC
Fund Administrator
Premier Fund Solutions, Inc.
Independent Registered Public Accounting Firm
Cohen Fund Audit Services, Ltd. |
This report is provided for the general information of the shareholders of the Greenleaf
Income Growth Fund. This report is not intended for distribution to prospective investors
in the Fund, unless preceded or accompanied by an effective prospectus. |
Greenleaf Income Growth Fund
www.greenleafincomegrowthfund.com
1-888-511-4340
Item 2. Code of Ethics.
The registrant has adopted a code of ethics that applies to the registrant’s principal executive officer and the principal financial officer. The registrant has not made any amendments to its code of ethics during the covered period. The registrant has not granted any waivers from any provisions of the code of ethics during the covered period. A copy of the registrant’s Code of Ethics is filed herewith.
Item 3. Audit Committee Financial Expert.
The registrant’s Board of Trustees has determined that George Cossolias is an audit committee finical expert. Mr. Cossolias is independent for purposes of this Item 3.
Item 4. Principal Accountant Fees and Services.
(a-d) The following table details the aggregate fees billed for each of the last two fiscal years for audit fees, audit-related fees, tax fees and other fees by the principal accountant to the registrant. The principal accountant has provided no services to the adviser or any entity controlled by, or under common control with the adviser that provides ongoing services to the registrant.
| | | FYE 10/31/15 |
| Audit Fees | | $15,700 |
| Audit-Related Fees | | $0 |
| Tax Fees | | $1,000 |
| All Other Fees | | $750 |
Nature of Tax Fees: preparation of Excise Tax Statement and 1120 RIC.
All Other Fees: Semi-Annual Report Review
(e) (1) The audit committee approves all audit and non-audit related services and, therefore, has not adopted pre-approval policies and procedures described in paragraph (c)(7) of Rule 2-01 of Regulation S-X.
(e) (2) None of the services described in paragraph (b) through (d) of this Item were approved by the audit committee pursuant to paragraph (c)(7)(i)(C) of Rule 2-01 of Regulation S-X.
(f) All of the principal accountant’s hours spent on auditing the registrant’s financial statements were attributed to work performed by full-time permanent employees of the principal accountant.
(g) The following table indicates the aggregate non-audit fees billed by the registrant’s principal accountant for services to the registrant , the registrant’s investment adviser (not sub-adviser), and any entity controlling, controlled by, or under common control with the adviser that provides ongoing services to the registrant, for the last two years.
| Non-Audit Fees | | FYE 10/31/15 |
| Registrant | | $1,750 |
| Registrant’s Investment Adviser | | $0 |
(h) The principal accountant provided no services to the investment adviser or any entity controlling, controlled by, or under common control with the adviser that provides ongoing services to the registrant.
Item 5. Audit Committee of Listed Companies. Not applicable.
Item 6. Schedule of Investments. Schedule filed with Item 1.
Item 7. Disclosure of Proxy Voting Policies and Procedures for Closed-End Management Investment Companies. Not applicable.
Item 8. Portfolio Managers of Closed End Management Investment Companies. Not applicable.
Item 9. Purchases of Equity Securities by Closed-End Management Investment Companies and Affiliated Purchasers. Not applicable.
Item 10. Submission of Matters to a Vote of Security Holders.
The registrant has not adopted procedures by which shareholders may recommend nominees to the registrant’s board of trustees.
Item 11. Controls and Procedures.
(a) The registrant’s president and chief financial officer concluded that the disclosure controls and procedures (as defined in Rule 30a-3(c) under the Investment Company Act of 1940 (the “Act”)) were effective as of a date within 90 days of the filing date of this report, based on the evaluation of these controls and procedures required by Rule 30a-3(b) under the Act.
(b) There were no changes in the registrant’s internal control over financial reporting (as defined in Rule 30a-3(d) under the Act) that occurred during the registrant’s second fiscal quarter of the period covered by this report that have materially affected, or are reasonably likely to materially affect, the registrant’s internal control over financial reporting.
Item 12. Exhibits.
(a)(1) Code of Ethics. Filed herewith.
(a)(2) Certifications pursuant to Section 302 of the Sarbanes-Oxley Act of 2002. Filed herewith.
(a)(3) Not applicable.
(b) Certification pursuant to Section 906 Certification of the Sarbanes-Oxley Act of 2002. Filed herewith.
SIGNATURES
Pursuant to the requirements of the Securities Exchange Act of 1934 and the Investment Company Act of 1940, the registrant has duly caused this report to be signed on its behalf by the undersigned, thereunto duly authorized.
| | By: /s/Ross C. Provence
Ross C. Provence
President |
Pursuant to the requirements of the Securities Exchange Act of 1934 and the Investment Company Act of 1940, this report has been signed below by the following persons on behalf of the registrant and in the capacities and on the dates indicated.
| | By: /s/Ross C. Provence
Ross C. Provence
President |
| | By: /s/Jeffrey R. Provence
Jeffrey R. Provence
Chief Financial Officer |