UNITED STATES
SECURITIES AND EXCHANGE COMMISSION
WASHINGTON, D.C. 20549
FORM N-CSR
CERTIFIED SHAREHOLDER REPORT OF REGISTERED MANAGEMENT
INVESTMENT COMPANIES
Investment Company Act file number 811-09781
PFS FUNDS
(Exact name of registrant as specified in charter)
| 1939 Friendship Drive, Suite C | |
| El Cajon, CA | 92020 |
| (Address of principal executive offices) | (Zip code) |
CT Corporation System
155 Federal St., Suite 700,
Boston, MA 02110
(Name and address of agent for service)
Registrant's telephone number, including area code: (619) 588-9700
Date of fiscal year end: November 30
Date of reporting period: November 30, 2015
Item 1. Reports to Stockholders.
Christopher Weil & Company Core Investment Fund
Ticker CWCFX
Christopher Weil & Company Global Dividend Fund
Ticker CWGDX
For Investors Seeking Long-Term Capital Appreciation
ANNUAL REPORT
November 30, 2015
| Table of Contents | |
| |
| |
| |
| CHRISTOPHER WEIL & COMPANY FUNDS | |
| Letters to Shareholders | 1 |
| Sector Allocation | 4 |
| Performance Information | 5 |
| Schedules of Investments | 7 |
| Statements of Assets and Liabilities | 11 |
| Statements of Operations | 11 |
| Statements of Changes in Net Assets | 12 |
| Financial Highlights | 13 |
| NOTES TO FINANCIAL STATEMENTS | 14 |
| DISCLOSURE OF EXPENSES | 20 |
| ADDITIONAL INFORMATION | 21 |
| REPORT OF INDEPENDENT REGISTERED PUBLIC ACCOUNTING FIRM | 22 |
| TRUSTEES AND OFFICERS | 23 |
Christopher Weil & Company Core Investment Fund
Management’s Discussion of Fund Performance
Investment Summary
The Christopher Weil & Company Core Investment Fund (the “Fund”) returned -0.93% for the fiscal year ended November 30, 2015, compared to a positive 2.75% for the S&P 500® Index.
We increased our positions slightly, starting the period with 29 equity positions and ending with 33 positions. We fully liquidated 18 positions, while 22 new positions were purchased with the proceeds. We added new positions in the technology, financials, healthcare and consumer discretionary sectors, while we reduced the number of positions in energy, and materials. We did not purchase any put or call options during the period.
The Fund’s performance was most negatively affected by exposure to transportation and consumer discretionary stocks. In the transportation sector, Spirit Airlines (SAVE) was the Fund’s worst performing asset. Exposure to the transportation sector through Old Dominion Freight Line (ODFL), Union Pacific (UNP) and Kansas City Southern (KSU) also dragged on the Fund’s performance. Additionally, exposure to apparel consumer discretionary stocks Michael Kors (KORS), VF Corp (VFC) and Under Armour (UA) dragged on performance. On the positive side, our overweight exposure to technology stocks, including Facebook (FB), Alphabet (GOOG) and Maximus (MMS) helped the Fund’s performance. Individual positions that also significantly contributed positively were Salix Pharmaceuticals (SLXP), Ulta Salon Cosmetics (ULTA) and Walt Disney (DIS).
Themes of the last year
The past year saw a continued strengthening of the U.S. economy. Unemployment declined to 5.2% while wages finally increased. GDP growth at 2.1% in the third quarter further confirmed the recovery in U.S. business. In spite of increased U.S. output, few signs of inflation appeared. Gasoline prices continued their decline as the price of oil continued its decline. The Fed continued its tapering down of its purchases of treasuries and mortgages, while continuing to reinvest interest payments. Most significantly, the Fed approved a quarter-point increase in its target federal funds rate, which was the first increase since 2006.
This was a more challenging year for the U.S. market as the S&P 500® Index was barely positive while delivering a significant, but brief, drop in August. U.S. stocks, once again, outperformed global indices, though the breadth of the U.S. market continued to narrow. Bond markets were flat as interest rates stayed low, while volatility in the high yield market increased due to balance sheet pressures in the energy and commodity sectors. For much of the year volatility, measured by the VIX Index, remained well below its historical average, only spiking significantly during the August market selloff.
Investment Strategy and Summary
Currently, we are targeting a portfolio that consists of approximately 30 positions, and we aim for each holding to have a weighting of between 2.5% and 4% of the net asset value of the Fund. As the economic and investment climate changes we may increase or decrease our target number of positions. We take a bottom up approach, finding companies in various sectors that have strong revenue growth and strong balance sheets, avoiding the most volatile issues. Technical analysis helps in choosing entry and exit points. Companies represent most major industry sectors, but we have, in practice, generally, over weighted technology and consumer discretionary while underweighting financials, energy, utilities, materials, and telecoms.
While we look to macro trends for guidance, note that our methodology is fundamentally bottoms up. We rigorously screen the investable universe for stocks that have strong balance sheets and income statements along with positive track records and likely potential for growth. The search for good value remains a top priority as we believe that even a great company can trade for too high a price and a mediocre one can trade well below its intrinsic value. We look for stocks that will outperform over the next few years and mostly shun short term plays, maintaining a mix of stocks of varied sec-
2015 Annual Report 1
tors, market capitalization, and anticipated volatility. We continue to believe that well managed companies will lead their industries, take market share, and grow earnings. Therefore, investors in well run companies should continue to profit over the longer term. We continue to buy companies we hope will deliver outsized positive returns, reserving the option to employ hedging strategies to weather more volatile times.
Christopher Weil, Chairman & John Wells, President/CEO
Christopher Weil & Company, Inc., Investment Advisor
Christopher Weil & Company Global Dividend Fund
Management’s Discussion of Fund Performance
Investment Summary
The Christopher Weil & Company Global Dividend Fund (the “Fund”) returned -6.27% for the fiscal year ended November 30, 2015, compared to -2.49% for the MSCI All Country World Index® (ACWI).
We reduced our positions slightly, starting the period with 38 equity positions and ending with 34 positions. 9 positions were fully liquidated while 3 new positions were purchased with the proceeds. The Fund received 2 new positions as the result of spinoffs, which were both disposed of during the period. We added, and retained through the period, new positions to the financials and consumer discretionary sectors, while we reduced the number of positions in consumer staples, energy, health-care, industrial, materials, telecom and utilities. We did not purchase any put or call options during the period.
The Fund’s performance was most negatively affected by exposure to financials, energy and tele-com. In the financial sector, Banco Santander (SAN) was the Fund’s worst performing asset. Exposure to the financial sector sector through Aegon (AEG) and HSBC Holdings (HSBC) also dragged on the Fund’s performance. Additionally, exposure to energy stocks Ensco (ESV), Chevron (CVX) and Transocean (RIG) and telecom stocks Telefonica (TEF) and Verizon (VZ) dragged on performance. On the positive side, our exposure to consumer staples stocks including Altria Group (MO) and Target (TGT) helped the Fund’s performance. Individual positions that also significantly contributed positively were General Electric (GE) and Avery Dennison (AVY).
Themes of the last year
This was a more challenging year for the global markets as the ACWI index turned in its first negative year since 2011. U.S. stocks, once again, outperformed global indices, though the breadth of the U.S. market continued to narrow. Bond markets were flat as interest rates stayed low, while volatility in the high yield market increased due to balance sheet pressures in the energy and commodity sectors. For much of the year volatility, measured by the VIX Index, remained well below its historical average, only spiking significantly during the August market selloff.
Investment Strategy and Summary
Currently, we are targeting a portfolio that consists of approximately 30 positions, and we aim for each holding to have a weighting of between 2.5% and 4% of the net asset value of the Fund. As the economic and investment climate changes we may increase or decrease our target number of positions. We take a bottom up approach, finding companies in various sectors that have strong revenue growth and strong balance sheets, avoiding the most volatile issues. Technical analysis helps in choosing entry and exit points. Companies represent most major industry sectors, but we have, in practice, generally, over weighted technology and consumer discretionary while underweighting financials, energy, utilities, materials, and telecoms.
2015 Annual Report 2
While we look to macro trends for guidance, note that our methodology is fundamentally bottoms up. We rigorously screen the investable universe for stocks that have strong balance sheets and income statements along with positive dividend track records and likely potential for growth. The search for good value remains a top priority as we believe that even a great company can trade for too high a price and a mediocre one can trade well below its intrinsic value. We look for stocks that will outperform over the next few years and mostly shun short term plays, maintaining a mix of stocks of varied sectors, market capitalization, and anticipated volatility. We continue to believe that well managed companies will lead their industries, take market share, and grow earnings. Therefore, investors in well run companies should continue to profit over the longer term. We continue to buy companies we hope will deliver steady dividends and positive returns, reserving the option to employ hedging strategies to weather more volatile times.
Christopher Weil, Chairman & John Wells, President/CEO
Christopher Weil & Company, Inc., Investment Advisor
Past performance does not guarantee future results. The investment return and principal value of an investment will fluctuate so that an investor’s shares, when redeemed, may be worth more or less than their original cost. Current performance may be lower or higher than the performance data quoted. You may obtain performance data current to the most recent month-end by calling toll free 1-888-550-9266. Investors should consider the investment objectives, risks, and charges and expenses of the Funds carefully before investing. The prospectus contains this and other information about the Funds. You may obtain a prospectus on our website www.cweil.com or by calling toll free 1-888-550-9266. The Fund’s Distributor is Rafferty Capital Markets, LLC.
Christopher Weil & Company Global Dividend Fund
Country Diversification as of November 30, 2015
(As a percentage of Net Assets)
(Unaudited)
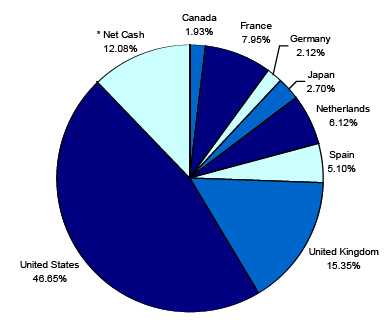
*Net Cash represents cash equivalents and other assets in excess of liabilities.
2015 Annual Report 3
Christopher Weil & Company Funds
CHRISTOPHER WEIL & COMPANY CORE INVESTMENT FUND
Sector Allocation (Unaudited)
(As a Percentage of Net Assets)
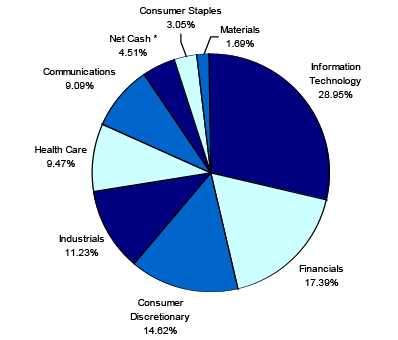
*Net Cash represents cash equivalents and other assets in excess of liabilities.
CHRISTOPHER WEIL & COMPANY GLOBAL DIVIDEND FUND
Sector Allocation (Unaudited)
(As a Percentage of Net Assets)
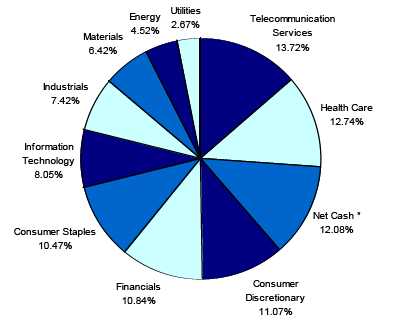
*Net Cash represents cash equivalents and other assets in excess of liabilities.
2015 Annual Report 4
Christopher Weil & Company Core Investment Fund (Unaudited)
PERFORMANCE INFORMATION
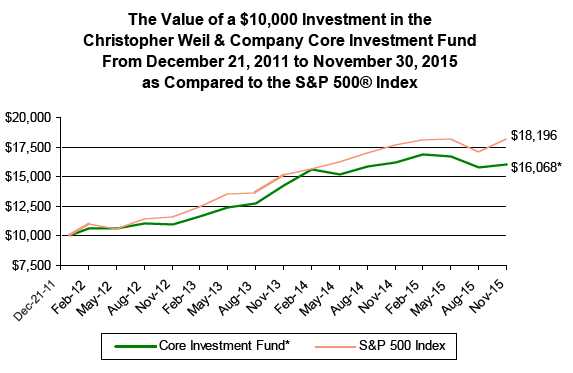
November 30, 2015 NAV $14.26
Average Annual Total Returns for the Periods Ended November 30, 2015.
| | | | Since | |
| | 1 Year(A) | | Inception(A) | |
| Christopher Weil & Company Core Investment Fund | -0.93% | | 12.78% | |
| S&P 500® Index (B) | 2.75% | | 16.40% | |
Total Annual Fund Operating Expense Ratio (from Prospectus dated 3/31/15): Gross – 1.50%; Net – 1.25%
The Total Annual Fund Operating Expense Ratio reported above will not correlate to the expense ratio in the Fund’s financial highlights because of the application of waivers as described below. Effective April 1, 2015, the Advisor has contractually agreed to waive a portion of its Management Fee such that it will be equal to 0.75% of the Core Investment Fund’s average daily net assets. Additionally, effective April 1, 2015, the Advisor has contractually agreed to waive a portion of its Services Fee to 0.20% of the Core Investment Fund’s average daily net assets greater than $35 million. These waivers will automatically terminate on March 31, 2016 unless they are renewed by the Advisor. The Advisor will not terminate these waivers prior to March 31, 2016.
(A) 1 Year and Since Inception returns include change in share prices and in each case includes reinvestment of any dividends and capital gain distributions. The inception date of the Christopher Weil & Company Core Investment Fund was December 21, 2011.
(B) The S&P 500® Index is a widely recognized unmanaged index of equity prices and is representative of a broader market and range of securities than is found in the Fund’s portfolio. The Index is an unmanaged benchmark that assumes reinvestment of all distributions and excludes the effect of taxes and fees. Individuals cannot invest directly in this Index; however, an individual can invest in exchange traded funds or other investment vehicles that attempt to track the performance of a benchmark index.
PAST PERFORMANCE DOES NOT GUARANTEE FUTURE RESULTS. INVESTMENT RETURN AND PRINCIPAL VALUE WILL FLUCTUATE SO THAT SHARES, WHEN REDEEMED, MAY BE WORTH MORE OR LESS THAN THEIR ORIGINAL COST. RETURNS DO NOT REFLECT THE DEDUCTION OF TAXES THAT A SHAREHOLDER WOULD PAY ON FUND DISTRIBUTIONS OR THE REDEMPTION OF FUND SHARES. CURRENT PERFORMANCE MAY BE LOWER OR HIGHER THAN THE PERFORMANCE DATA QUOTED. TO OBTAIN PERFORMANCE DATA CURRENT TO THE MOST RECENT MONTH END, PLEASE CALL 1-888-550-9266 OR VISIT OUR WEBSITE AT www.cweil.com. THE FUND'S DISTRIBUTOR IS RAFFERTY CAPITAL MARKETS, LLC.
2015 Annual Report 5
Christopher Weil & Company Global Dividend Fund (Unaudited)
PERFORMANCE INFORMATION
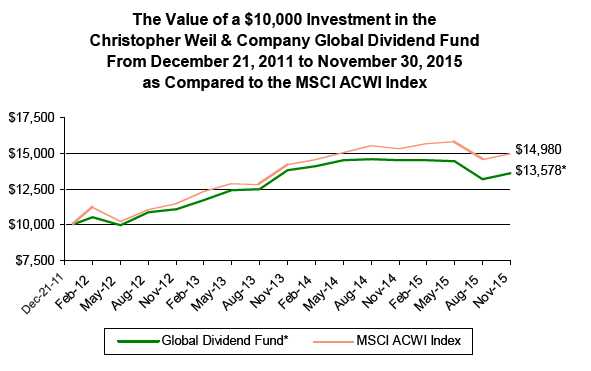
November 30, 2015 NAV $11.81
Average Annual Total Returns for the Periods Ended November 30, 2015.
| | | | Since | |
| | 1 Year(A) | | Inception(A) | |
| Christopher Weil & Company Global Dividend Fund | -6.27% | | 8.07% | |
| MSCI ACWI Index (B) | -2.49% | | 10.79% | |
Total Annual Fund Operating Expense Ratio (from Prospectus dated 3/31/15): 1.75%
The Total Annual Fund Operating Expense Ratio reported above may not correlate to the expense ratio in the Fund’s financial highlights because of the application of waivers as described below. Effective April 1, 2015, the Advisor has contractually agreed to waive a portion of its Management Fee such that it will be equal to 1.00% of the Global Dividend Fund's average daily net assets greater than $35 million. Additionally, effective April 1, 2015, the Advisor has contractually agreed to waive a portion of its Services Fee to 0.20% of the Global Dividend Fund's average daily net assets greater than $35 million. These waivers will automatically terminate on March 31, 2016 unless they are renewed by the Advisor. The Advisor will not terminate these waivers prior to March 31, 2016.
(A) 1 Year and Since Inception returns include change in share prices and in each case includes reinvestment of any dividends and capital gain distributions. The inception date of the Christopher Weil & Company Global Dividend Fund was December 21, 2011.
(B) The MSCI ACWI Index is a free float-adjusted market capitalization weighted index that is designed to measure the equity market performance of developed and emerging markets. The MSCI ACWI consists of 45 country indices comprising 24 developed and 21 emerging market country indices.
PAST PERFORMANCE DOES NOT GUARANTEE FUTURE RESULTS. INVESTMENT RETURN AND PRINCIPAL VALUE WILL FLUCTUATE SO THAT SHARES, WHEN REDEEMED, MAY BE WORTH MORE OR LESS THAN THEIR ORIGINAL COST. RETURNS DO NOT REFLECT THE DEDUCTION OF TAXES THAT A SHAREHOLDER WOULD PAY ON FUND DISTRIBUTIONS OR THE REDEMPTION OF FUND SHARES. CURRENT PERFORMANCE MAY BE LOWER OR HIGHER THAN THE PERFORMANCE DATA QUOTED. TO OBTAIN PERFORMANCE DATA CURRENT TO THE MOST RECENT MONTH END, PLEASE CALL 1-888-550-9266 OR VISIT OUR WEBSITE AT www.cweil.com. THE FUND'S DISTRIBUTOR IS RAFFERTY CAPITAL MARKETS, LLC.
2015 Annual Report 6
| Christopher Weil & Company Core Investment Fund |
| | | | Schedule of Investments |
| | | | November 30, 2015 |
| Shares | | Fair Value | % of Net Assets |
| COMMON STOCKS | | | | |
| | | | |
| COMMUNICATIONS | | | | |
| Services - Computer Programming, Data Processing, Etc. | | | | |
| 17,860 | Facebook, Inc. Class A * | $ | 1,861,726 | | |
| 1,160 | Alphabet Inc. Class A * | | 884,906 | | |
| 1,103 | Alphabet Inc. Class C * | | 819,088 | | |
| | | | 3,565,720 | | |
| Total for Communications | | 3,565,720 | 9.09 | % |
| CONSUMER DISCRETIONARY | | | | |
| Cable & Other Pay Television Services | | | | |
| 15,710 | The Walt Disney Co. | | 1,782,614 | | |
| Leather & Leather Products | | | | |
| 16,540 | Michael Kors Holdings Limited * (United Kingdom) | | 711,551 | | |
| Men's & Boys' Furnishings, Work Clothing, & Allied Garments | | | | |
| 10,825 | V.F. Corporation | | 700,377 | | |
| Retail - Family Clothing Stores | | | | |
| 14,500 | The TJX Companies, Inc. | | 1,023,700 | | |
| Retail - Retail Stores, NEC | | | | |
| 9,100 | Ulta Salon, Cosmetics & Fragrance, Inc. * | | 1,519,700 | | |
| Total for Consumer Discretionary | | 5,737,942 | 14.62 | % |
| CONSUMER STAPLES | | | | |
| Food And Kindred Products | | | | |
| 28,000 | The Hain Celestial Group, Inc. * | | 1,195,600 | | |
| Total for Consumer Staples | | 1,195,600 | 3.05 | % |
| FINANCIALS | | | | | |
| Investment Advice | | | | |
| 7,375 | Affiliated Managers Group, Inc. * | | 1,307,071 | | |
| National Commercial Banks | | | | |
| 20,000 | Wells Fargo & Company | | 1,102,000 | | |
| Security Brokers, Dealers & Flotation Companies | | | | |
| 4,775 | BlackRock, Inc. | | 1,736,763 | | |
| Services - Business Services, NEC | | | | |
| 6,930 | FleetCor Technologies, Inc. * | | 1,065,210 | | |
| 16,480 | Mastercard, Inc. Class A | | 1,613,722 | | |
| | | | 2,678,932 | | |
| Total for Financials | | 6,824,766 | 17.39 | % |
| HEALTH CARE | | | | | |
| Hospital & Medical Service Plans | | | | |
| 2,800 | UnitedHealth Group Incorporated | | 315,588 | | |
| Laboratory Analytical Instruments | | | | |
| 5,490 | Illumina, Inc. * | | 1,009,611 | | |
| Orthopedic, Prosthetic & Surgical Appliances & Supplies | | | | |
| 6,750 | Edwards Lifesciences Corporation * | | 1,100,250 | | |
| Pharmaceutical Preparations | | | | |
| 8,800 | Jazz Pharmaceuticals plc * (Ireland) | | 1,289,992 | | |
| Total for Health Care | | 3,715,441 | 9.47 | % |
* Non-Income Producing Securities.
The accompanying notes are an integral part of these
financial statements. |
2015 Annual Report 7
| Christopher Weil & Company Core Investment Fund |
| | | | Schedule of Investments |
| | | | November 30, 2015 |
| Shares | | Fair Value | | % of Net Assets |
| COMMON STOCKS - Continued | | | | | |
| |
| INDUSTRIALS | | | | | | |
| Air Transportation, Scheduled | | | | | |
| 19,100 | Alaska Air Group, Inc. | $ | 1,522,843 | | | |
| Railroads, Line-Haul Operating | | | | | |
| 10,700 | Kansas City Southern | | 972,844 | | | |
| Services - Computer Processing & Data Preparation | | | | | |
| 15,430 | Verisk Analytics, Inc. Class A * | | 1,156,478 | | | |
| Trucking (No Local) | | | | | |
| 11,860 | Old Dominion Freight Line, Inc. * | | 755,601 | | | |
| Total for Industrials | | 4,407,766 | | 11.23 | % |
| INFORMATION TECHNOLOGY | | | | | |
| Computer Communications Equipment | | | | | |
| 46,000 | Cisco Systems, Inc. | | 1,253,500 | | | |
| Electronic Computers | | | | | |
| 18,256 | Apple Inc. | | 2,159,685 | | | |
| Semiconductors & Related Devices | | | | | |
| 11,700 | NXP Semiconductors N.V. * (Netherlands) | | 1,093,482 | | | |
| Services - Business Services, NEC | | | | | |
| 10,000 | Alibaba Group Holding Limited * ** | | 840,800 | | | |
| Services - Computer Programming Services | | | | | |
| 17,700 | Amdocs Limited | | 1,001,289 | | | |
| 15,500 | Cognizant Technology Solutions Corporation Class A * | | 1,000,990 | | | |
| | | | 2,002,279 | | | |
| Services - Prepackaged Software | | | | | |
| 11,500 | ANSYS, Inc. * | | 1,071,915 | | | |
| 10,400 | Intuit Inc. | | 1,042,080 | | | |
| 21,400 | Oracle Corporation | | 833,958 | | | |
| 14,850 | SS&C Technologies Holdings, Inc. | | 1,067,715 | | | |
| | | | 4,015,668 | | | |
| Total for Information Technology | | 11,365,414 | | 28.95 | % |
| MATERIALS | | | | | | |
| Paints, Varnishes, Lacquers, Enamels & Allied Products | | | | | |
| 6,280 | PPG Industries, Inc. | | 664,047 | | | |
| Total for Materials | | 664,047 | | 1.69 | % |
| Total for Common Stocks (Cost $30,327,631) | $ | 37,476,696 | | 95.49 | % |
| MONEY MARKET FUNDS | | | | | |
| 1,560,554 | Invesco STIT Treasury Portfolio Institutional Class 0.01%*** | | 1,560,554 | | 3.98 | % |
| | (Cost $1,560,554) | | | | | |
| Total Investment Securities | | 39,037,250 | | 99.47 | % |
| | (Cost $31,888,185) | | | | | |
| Other Assets In Excess of Liabilities | | 208,379 | | 0.53 | % |
| Net Assets | | $ | 39,245,629 | | 100.00 | % |
* Non-Income Producing Securities.
** ADR - American Depository Receipt.
*** The rate shown was the 7-day yield at November 30, 2015.
The accompanying notes are an integral part of these
financial statements. |
2015 Annual Report 8
| Christopher Weil & Company Global Dividend Fund | | |
| | | | Schedule of Investments |
| | | | November 30, 2015 |
| Shares | | Fair Value | % of Net Assets |
| COMMON STOCKS | | | | |
| | | | | |
| CONSUMER DISCRETIONARY | | | | |
| Dolls & Stuffed Toys | | | | |
| 28,000 | Mattel, Inc. | $ | 696,080 | | |
| Motor Vehicles & Passenger Car Bodies | | | | |
| 28,000 | Honda Motor Co., Ltd. ** | | 915,040 | | |
| Retail - Miscellaneous Shopping Goods Stores | | | | |
| 79,700 | Staples, Inc. | | 961,979 | | |
| Retail - Variety Stores | | | | |
| 16,260 | Target Corporation | | 1,178,850 | | |
| Total for Consumer Discretionary | | 3,751,949 | 11.07 | % |
| CONSUMER STAPLES | | | | |
| Cigarettes | | | | | |
| 19,895 | Altria Group, Inc. | | 1,145,952 | | |
| Converted Paper & Paperboard Products (No Containers/Boxes) | | | | |
| 7,256 | Kimberly-Clark Corporation | | 864,552 | | |
| Food And Kindred Products | | | | |
| 27,782 | Unilever plc ** | | 1,190,459 | | |
| Retail - Variety Stores | | | | |
| 5,900 | Wal-Mart Stores, Inc. | | 347,156 | | |
| Total for Consumer Staples | | 3,548,119 | 10.47 | % |
| | | | | |
| ENERGY | | | | | |
| Crude Petroleum & Natural Gas | | | | |
| 9,610 | TOTAL S.A. ** | | 475,214 | | |
| Drilling Oil & Gas Wells | | | | |
| 20,640 | Ensco plc Class A (United Kingdom) | | 353,357 | | |
| Petroleum Refining | | | | |
| 7,690 | Chevron Corporation | | 702,251 | | |
| Total for Energy | | 1,530,822 | 4.52 | % |
| | | | | |
| FINANCIALS�� | | | | | |
| Commercial Banks, NEC | | | | |
| 137,413 | Banco Santander, S.A. ** | | 742,030 | | |
| Life Insurance | | | | | |
| 143,000 | Aegon N.V. ** | | 872,300 | | |
| Savings Institution, Federally Chartered | | | | |
| 24,192 | HSBC Holdings plc ** | | 965,261 | | |
| Services - Business Services, NEC | | | | |
| 58,100 | The Western Union Company | | 1,095,766 | | |
| Total for Financials | | 3,675,357 | 10.84 | % |
| | | | | |
| HEALTH CARE | | | | | |
| Pharmaceutical Preparations | | | | |
| 20,000 | AstraZeneca plc ** | | 681,000 | | |
| 23,920 | GlaxoSmithKline plc ** | | 968,999 | | |
| 16,243 | Merck & Co., Inc. | | 861,042 | | |
| 28,533 | Pfizer Inc. | | 935,026 | | |
| 19,709 | Sanofi S.A. ** | | 871,532 | | |
| | | | 4,317,599 | | |
| Total for Health Care | | 4,317,599 | 12.74 | % |
** ADR - American Depository Receipt.
The accompanying notes are an integral part of these
financial statements. |
2015 Annual Report 9
| Christopher Weil & Company Global Dividend Fund |
| | | | Schedule of Investments |
| | | | November 30, 2015 |
| Shares | | Fair Value | | % of Net Assets |
| COMMON STOCKS - Continued | | | | | |
| |
| INDUSTRIALS | | | | | | |
| Electronic & Other Electrical Equipment (No Computer Equipment) | | | | | |
| 43,867 | General Electric Company | $ | 1,313,378 | | | |
| 44,080 | Koninklijke Philips Electronics N.V. ** | | 1,200,298 | | | |
| | | | 2,513,676 | | | |
| Total for Industrials | | 2,513,676 | | 7.42 | % |
| INFORMATION TECHNOLOGY | | | | | |
| Computer Communications Equipment | | | | | |
| 39,000 | Cisco Systems, Inc. | | 1,062,750 | | | |
| Semiconductors & Related Devices | | | | | |
| 47,871 | Intel Corporation | | 1,664,475 | | | |
| Total for Information Technology | | 2,727,225 | | 8.05 | % |
| MATERIALS | | | | | | |
| Chemicals - Diversified | | | | | |
| 8,693 | BASF Aktiengesellschaft ** | | 716,999 | | | |
| 12,266 | E.I. du Pont de Nemours and Company | | 825,993 | | | |
| | | | 1,542,992 | | | |
| Metal Mining | | | | | | |
| 19,130 | Rio Tinto plc ** | | 632,820 | | | |
| Total for Materials | | 2,175,812 | | 6.42 | % |
| TELECOMMUNICATION SERVICES | | | | | |
| Radiotelephone Communications | | | | | |
| 12,204 | Vodafone Group plc ** | | 409,566 | | | |
| Telephone Communications (No Radiotelephone) | | | | | |
| 12,932 | AT&T Inc. | | 435,421 | | | |
| 15,189 | BCE Inc. (Canada) | | 654,038 | | | |
| 78,488 | Orange S.A. ** | | 1,349,209 | | | |
| 80,437 | Telefonica S.A. ** | | 986,962 | | | |
| 18,000 | Verizon Communications Inc. | | 818,100 | | | |
| | | | 4,243,730 | | | |
| Total for Telecommunication Services | | 4,653,296 | | 13.72 | % |
| UTILITIES | | | | | | |
| Electric Services | | | | | |
| 26,539 | PPL Corporation | | 903,388 | | | |
| Total for Utilities | | 903,388 | | 2.67 | % |
| Total for Common Stocks (Cost $27,343,746) | $ | 29,797,243 | | 87.92 | % |
| MONEY MARKET FUNDS | | | | | |
| 3,932,482 | Invesco STIT Treasury Portfolio Institutional Class 0.01%*** | | 3,932,482 | | 11.60 | % |
| | (Cost $3,932,482) | | | | | |
| Total Investment Securities | | 33,729,725 | | 99.52 | % |
| | (Cost $31,276,228) | | | | | |
| Other Assets In Excess of Liabilities | | 163,781 | | 0.48 | % |
| Net Assets | | $ | 33,893,506 | | 100.00 | % |
** ADR - American Depository Receipt.
*** The rate shown was the 7-day yield at November 30, 2015.
The accompanying notes are an integral part of these
financial statements. |
2015 Annual Report 10
| Christopher Weil & Company Funds |
| |
| Statements of Assets and Liabilities | | Core Investment | | | | Global Dividend | |
| November 30, 2015 | | Fund | | | | Fund | |
| |
| Assets: | | | | | | | |
| Investment Securities at Fair Value* | $ | 39,037,250 | | | $ | 33,729,725 | |
| Dividends Receivable | | 18,482 | | | | 127,109 | |
| Interest Receivable | | 19 | | | | 72 | |
| Receivable for Securities Sold | | 391,289 | | | | 90,515 | |
| Total Assets | | 39,447,040 | | | | 33,947,421 | |
| Liabilities: | | | | | | | |
| Payable for Management Fees | | 24,019 | | | | 34,939 | |
| Payable for Services Fees | | 15,035 | | | | 13,976 | |
| Payable for Securities Purchased | | 157,357 | | | | - | |
| Payable for Shareholder Redemptions | | 5,000 | | | | 5,000 | |
| Total Liabilities | | 201,411 | | | | 53,915 | |
| Net Assets | $ | 39,245,629 | | | $ | 33,893,506 | |
| Net Assets Consist of: | | | | | | | |
| Paid In Capital | $ | 29,451,588 | | | $ | 31,163,510 | |
| Accumulated Undistributed Net Investment Income (Loss) | | (37,361 | ) | | | 67,044 | |
| Accumulated Undistributed Realized Gain (Loss) on Investments - Net | | 2,682,337 | | | | 209,455 | |
| Unrealized Appreciation (Depreciation) in Value of Investments - Net | | 7,149,065 | | | | 2,453,497 | |
| Net Assets | $ | 39,245,629 | | | $ | 33,893,506 | |
| |
| Net Asset Value and Offering Price (Note 2) | $ | 14.26 | | | $ | 11.81 | |
| Minimum Redemption Price (Note 2) | $ | 13.97 | | | $ | 11.57 | |
| |
| * Investments at Identified Cost | $ | 31,888,185 | | | $ | 31,276,228 | |
| |
| Shares Outstanding (Unlimited number of shares | | 2,752,645 | | | | 2,870,309 | |
| authorized without par value) | | | | | | | |
| |
| Statements of Operations | | | | | | | |
| For the fiscal year ended November 30, 2015 | | | | | | | |
| |
| Investment Income: | | | | | | | |
| Dividends ** | $ | 314,465 | | | $ | 1,162,068 | |
| Interest | | 606 | | | | 640 | |
| Total Investment Income | | 315,071 | | | | 1,162,708 | |
| Expenses: | | | | | | | |
| Management Fees | | 397,026 | | | | 430,042 | |
| Services Fees | | 198,513 | | | | 172,017 | |
| Total Expenses | | 595,539 | | | | 602,059 | |
| Less: Management Fees Waived (Note 4) | | (64,584 | ) | | | - | |
| Less: Services Fees Waived (Note 4) | | (7,310 | ) | | | - | |
| Net Expenses | | 523,645 | | | | 602,059 | |
| |
| Net Investment Income (Loss) | | (208,574 | ) | | | 560,649 | |
| |
| Realized and Unrealized Gain (Loss) on Investments: | | | | | | | |
| Net Realized Gain (Loss) on Investments | | 2,890,775 | | | | 209,457 | |
| Net Change in Unrealized Appreciation (Depreciation) on Investments | | (2,846,674 | ) | | | (3,036,847 | ) |
| Net Realized and Unrealized Gain (Loss) on Investments | | 44,101 | | | | (2,827,390 | ) |
| |
| Net Increase (Decrease) in Net Assets from Operations | $ | (164,473 | ) | | $ | (2,266,741 | ) |
| |
| ** Net of Foreign Withholding Taxes and ADR Fees | $ | - | | | $ | 81,678 | |
The accompanying notes are an integral part of these
financial statements. |
2015 Annual Report 11
| Christopher Weil & Company Funds |
| | |
| Statements of Changes in Net Assets | | Core Investment Fund | | | | Global Dividend Fund | | |
| | |
| | | 12/1/2014 | | | | 12/1/2013 | | | | 12/1/2014 | | | | 12/1/2013 | | |
| | | to | | | | to | | | | to | | | | to | | |
| | | 11/30/2015 | | | | 11/30/2014 | | | | 11/30/2015 | | | | 11/30/2014 | | |
| From Operations: | | | | | | | | | | | | | | | | |
| Net Investment Income (Loss) | $ | (208,574 | ) | | $ | (405,307 | ) | | $ | 560,649 | | | $ | 1,186,825 | | |
| Net Realized Gain (Loss) | | 2,890,775 | | | | 1,326,095 | | | | 209,457 | | | | 1,274,074 | | |
| Change in Net Unrealized Appreciation (Depreciation) | | (2,846,674 | ) | | | 4,128,987 | | | | (3,036,847 | ) | | | (738,217 | ) | |
| Increase (Decrease) in Net Assets from Operations | | (164,473 | ) | | | 5,049,775 | | | | (2,266,741 | ) | | | 1,722,682 | | |
| From Distributions to Shareholders: | | | | | | | | | | | | | | | | |
| Net Investment Income | | - | | | | - | | | | (1,602,845 | ) | | | (516,770 | ) | |
| Net Realized Gain from Security Transactions | | (889,895 | ) | | | (3,237,581 | ) | | | (1,274,075 | ) | | | (739,953 | ) | |
| Total Distributions to Shareholders | | (889,895 | ) | | | (3,237,581 | ) | | | (2,876,920 | ) | | | (1,256,723 | ) | |
| From Capital Share Transactions: | | | | | | | | | | | | | | | | |
| Proceeds From Sale of Shares | | 6,793,996 | | | | 7,289,395 | | | | 6,133,466 | | | | 5,857,331 | | |
| Proceeds from Redemption Fees (Note 2) | | 398 | | | | 301 | | | | 278 | | | | - | | |
| Shares Issued on Reinvestment of Dividends | | 889,895 | | | | 3,237,581 | | | | 2,874,887 | | | | 1,256,611 | | |
| Cost of Shares Redeemed | | (10,163,733 | ) | | | (4,277,503 | ) | | | (7,122,933 | ) | | | (2,764,922 | ) | |
| Net Increase (Decrease) from Shareholder Activity | | (2,479,444 | ) | | | 6,249,774 | | | | 1,885,698 | | | | 4,349,020 | | |
| Net Increase (Decrease) in Net Assets | | (3,533,812 | ) | | | 8,061,968 | | | | (3,257,963 | ) | | | 4,814,979 | | |
| | |
| Net Assets at Beginning of Period | | 42,779,441 | | | | 34,717,473 | | | | 37,151,469 | | | | 32,336,490 | | |
| | |
| Net Assets at End of Period | $ | 39,245,629 | | | $ | 42,779,441 | | | $ | 33,893,506 | | | $ | 37,151,469 | | |
| | |
| Accumulated Undistributed Net Investment Income (Loss) | $ | (37,361 | ) | | $ | - | | | $ | 67,044 | | | $ | 1,109,235 | | |
| | |
| | |
| Share Transactions: | | | | | | | | | | | | | | | | |
| Issued | | 472,561 | | | | 528,852 | | | | 494,989 | | | | 439,782 | | |
| Reinvested | | 61,457 | | | | 246,391 | | | | 227,360 | | | | 95,705 | | |
| Redeemed | | (692,184 | ) | | | (308,416 | ) | | | (569,477 | ) | | | (207,723 | ) | |
| Net Increase (Decrease) in Shares | | (158,166 | ) | | | 466,827 | | | | 152,872 | | | | 327,764 | | |
| Shares Outstanding Beginning of Period | | 2,910,811 | | | | 2,443,984 | | | | 2,717,437 | | | | 2,389,673 | | |
| Shares Outstanding End of Period | | 2,752,645 | | | | 2,910,811 | | | | 2,870,309 | | | | 2,717,437 | | |
The accompanying notes are an integral part of these
financial statements. |
2015 Annual Report 12
| Christopher Weil & Company Core Investment Fund |
| | |
| Financial Highlights | | | | | | | | | | | | | | | | |
| Selected data for a share outstanding throughout the period: | | 12/1/2014 | | | | 12/1/2013 | | | | 12/1/2012 | | | | 12/21/2011* | | |
| | | to | | | | to | | | | to | | | | to | | |
| | | 11/30/2015 | | | | 11/30/2014 | | | | 11/30/2013 | | | | 11/30/2012 | | |
| Net Asset Value - Beginning of Period | $ | 14.70 | | | $ | 14.21 | | | $ | 10.98 | | | $ | 10.00 | | |
| Net Investment Income (Loss) (a) | | (0.08 | ) | | | (0.14 | ) | | | (0.04 | ) | | | 0.03 | | |
| Net Gains (Loss) on Investments (Realized and Unrealized) | | (0.05 | ) | | | 1.95 | | | | 3.30 | | | | 0.95 | | |
| Total from Investment Operations (b) | | (0.13 | ) | | | 1.81 | | | | 3.26 | | | | 0.98 | | |
| Distributions (From Net Investment Income) | | - | | | | - | | | | (0.03 | ) | | | - | | |
| Distributions (From Capital Gains) | | (0.31 | ) | | | (1.32 | ) | | | - | | | | - | | |
| Total Distributions | | (0.31 | ) | | | (1.32 | ) | | | (0.03 | ) | | | - | | |
| Proceeds from Redemption Fee (Note 2) | | - | | + | | - | | + | | - | | | | - | | |
| Net Asset Value - End of Period | $ | 14.26 | | | $ | 14.70 | | | $ | 14.21 | | | $ | 10.98 | | |
| Total Return (c) | | (0.93 | )% | | | 13.82 | % | | | 29.78 | % | | | 9.80 | % | ** |
| Ratios/Supplemental Data | | | | | | | | | | | | | | | | |
| Net Assets - End of Period (Thousands) | $ | 39,246 | | | $ | 42,779 | | | $ | 34,717 | | | $ | 24,956 | | |
| Before Waiver | | | | | | | | | | | | | | | | |
| Ratio of Expenses to Average Net Assets | | 1.50 | % | | | 1.50 | % | | | 1.50 | % | | | 1.50 | % | *** |
| Ratio of Net Investment Income (Loss) to Average Net Assets | | -0.71 | % | | | -1.05 | % | | | -0.30 | % | | | 0.30 | % | *** |
| After Waiver | | | | | | | | | | | | | | | | |
| Ratio of Expenses to Average Net Assets (d) | | 1.32 | % | | | 1.50 | % | | | 1.50 | % | | | 1.50 | % | *** |
| Ratio of Net Investment Income (Loss) to Average Net Assets (d) | | -0.53 | % | | | -1.05 | % | | | -0.30 | % | | | 0.30 | % | *** |
| Portfolio Turnover Rate | | 62.06 | % | | | 55.55 | % | | | 164.60 | % | | | 59.33 | % | ** |
| Christopher Weil & Company Global Dividend Fund |
| | |
| Financial Highlights | | | | | | | | | | | | | | | | | |
| Selected data for a share outstanding throughout the period: | | 12/1/2014 | | | | 12/1/2013 | | | | 12/1/2012 | | | | 12/21/2011* | | |
| | | | to | | | | to | | | | to | | | | to | | |
| | | | 11/30/2015 | | | | 11/30/2014 | | | | 11/30/2013 | | | | 11/30/2012 | | |
| Net Asset Value - Beginning of Period | | $ | 13.67 | | | $ | 13.53 | | | $ | 11.05 | | | $ | 10.00 | | |
| Net Investment Income (Loss) (a) | | | 0.20 | | | | 0.46 | | | | 0.22 | | | | 0.21 | | |
| Net Gains (Loss) on Investments (Realized and Unrealized) (b) | | (1.00 | ) | | | 0.21 | | | | 2.47 | | | | 0.84 | | |
| Total from Investment Operations | | | (0.80 | ) | | | 0.67 | | | | 2.69 | | | | 1.05 | | |
| Distributions (From Net Investment Income) | | (0.59 | ) | | | (0.22 | ) | | | (0.21 | ) | | | - | | |
| Distributions (From Capital Gains) | | | (0.47 | ) | | | (0.31 | ) | | | - | | | | - | | |
| Total Distributions | | | (1.06 | ) | | | (0.53 | ) | | | (0.21 | ) | | | - | | |
| Proceeds from Redemption Fee (Note 2) | | | - | | + | | - | | | | - | | | | - | | |
| | |
| Net Asset Value - End of Period | | $ | 11.81 | | | $ | 13.67 | | | $ | 13.53 | | | $ | 11.05 | | |
| Total Return (c) | | | (6.27 | )% | | | 5.07 | % | | | 24.77 | % | | | 10.50 | % | ** |
| Ratios/Supplemental Data | | | | | | | | | | | | | | | | | |
| Net Assets - End of Period (Thousands) | | $ | 33,894 | | | $ | 37,151 | | | $ | 32,336 | | | $ | 24,472 | | |
| Before Waiver | | | | | | | | | | | | | | | | | |
| Ratio of Expenses to Average Net Assets | | | 1.75 | % | | | 1.75 | % | | | 1.75 | % | | | 1.75 | % | *** |
| Ratio of Net Investment Income (Loss) to Average Net Assets | | 1.63 | % | | | 3.39 | % | | | 1.78 | % | | | 2.05 | % | *** |
| After Waiver | | | | | | | | | | | | | | | | | |
| Ratio of Expenses to Average Net Assets (d) | | 1.75 | % | | | 1.75 | % | | | 1.75 | % | | | 1.75 | % | *** |
| Ratio of Net Investment Income (Loss) to Average Net Assets (d) | | 1.63 | % | | | 3.39 | % | | | 1.78 | % | | | 2.05 | % | *** |
| Portfolio Turnover Rate | | | 9.74 | % | | | 23.02 | % | | | 9.59 | % | | | 4.91 | % | ** |
| | |
* Commencement of Operations. ** Not Annualized. *** Annualized.
+ Amount less than $0.005 per share.
(a) Per share amount calculated using the average shares method.
(b) Realized and unrealized gains and losses per share in this caption are balancing amounts necessary to reconcile the
change in net asset value for the period, and may not reconcile with the aggregate gains and losses in the Statement of
Operations due to share transactions for the period.
(c) Total return in the above table represents the rate that the investor would have earned or lost on an investment in the Fund
assuming reinvestment of dividends. Returns do not reflect the deduction of taxes a shareholder would pay on Fund
distributions or redemption of Fund shares.
(d) Effective April 1, 2015, the Advisor has contractually agreed to waive a portion of its Management and Service Fees. (Note 4) |
The accompanying notes are an integral part of these
financial statements. |
2015 Annual Report 13
NOTES TO FINANCIAL STATEMENTS
CHRISTOPHER WEIL & COMPANY CORE INVESTMENT FUND
CHRISTOPHER WEIL & COMPANY GLOBAL DIVIDEND FUND
November 30, 2015
1.) ORGANIZATION
Christopher Weil & Company Core Investment Fund (“Core Investment”) and Christopher Weil & Company Global Dividend Fund (“Global Dividend”) (collectively, the “Funds”) were each organized as a diversified series of the PFS Funds (the “Trust”) on December 16, 2011. The Trust was established under the laws of Massachusetts by an Agreement and Declaration of Trust dated January 13, 2000, which was amended and restated as of January 20, 2011. Prior to March 5, 2010, the Trust was named Wireless Fund. The Trust is registered as an open-end investment company under the Investment Company Act of 1940, as amended (the “1940 Act”). The Trust may offer an unlimited number of shares of beneficial interest in a number of separate series, each series representing a distinct fund with its own investment objectives and policies. As of November 30, 2015, there were eleven series authorized by the Trust. The investment advisor to Core Investment and Global Dividend is Christopher Weil & Company, Inc. (the “Advisor”). The Funds commenced operations on December 21, 2011. The Funds’ investment objective is to seek long-term capital appreciation. Significant accounting policies of the Funds are presented in Note 2 below.
2.) SIGNIFICANT ACCOUNTING POLICIES
SECURITY VALUATION: The Funds are investment companies and accordingly follow the investment company accounting and reporting guidance of the Financial Accounting Standards Board (“FASB”) Accounting Standard Codification Topic 946 Financial Services - Investment Companies. All investments in securities are recorded at their estimated fair value, as described in Note 3.
SHARE VALUATION: The net asset value (the “NAV”) is generally calculated as of the close of trading on the New York Stock Exchange (“Exchange”) (normally 4:00 p.m. Eastern time) every day the Exchange is open. The NAV for each Fund is calculated by taking the total value of each Fund’s assets, subtracting its liabilities, and then dividing by the total number of shares outstanding, rounded to the nearest cent. The offering price and redemption price per share are equal to the net asset value per share, except that shares of each Fund are subject to a redemption fee of 2% if redeemed within 90 days of purchase. During the fiscal year ended November 30, 2015, proceeds from redemption fees were $398 and $278 for Core Investment and Global Dividend, respectively.
SHORT SALES: Each Fund may sell a security it does not own in anticipation of a decline in the fair value of the security. When a Fund sells a security short, it must borrow the security sold short and deliver it to the broker-dealer through which it made the short sale. A gain, limited to the price at which a Fund sold the security short, or a loss, unlimited in size, will be recognized upon the termination of a short sale.
OPTIONS: The purchase and writing of options requires additional skills and techniques beyond normal portfolio management, and involves certain risks. The purchase of options limits a fund’s potential loss to the amount of the premium paid and can afford a fund the opportunity to profit from favorable movements in the price of the underlying security to a greater extent than if the transaction were effected directly. When a fund writes an option, an amount equal to the premium received by the fund is recorded as a liability and is subsequently adjusted to the current fair value of the option written. Premiums received from writing options that expire unexercised are treated by a fund on the expiration date as realized gains from investments. The difference between the premium and the amount paid on effecting a closing purchase transaction, including brokerage commissions, is also treated as a realized gain, or, if the premium is less than the amount paid for the closing purchase transaction, as a realized loss. If a written call option is exercised, the premium is added to the proceeds from the sale of the underlying security or currency in determining whether a fund has realized a gain or a loss. If a written put option is exercised, the premium reduces the cost basis of the securities purchased by the fund. A fund, as writer of an option, bears the market risk of an unfavorable change in the price of the security underlying the written option.
FEDERAL INCOME TAXES: The Funds’ policy is to continue to comply with the requirements of the Internal Revenue Code that are applicable to regulated investment companies and to distribute all of their taxable income to shareholders. Therefore, no federal income tax provision is required. It is the Funds’ policy to distribute annually, prior to the end of the calendar year, dividends sufficient to satisfy excise tax requirements of the Internal Revenue Code. This Internal Revenue Code requirement may cause an excess of distributions over the book year-end accumulated income. In addition, it is the
2015 Annual Report 14
Notes to Financial Statements - continued
Funds’ policy to distribute annually, after the end of the fiscal year, net realized capital gains. Core Investment intends to pay income distributions, if any, on an annual basis. Effective March 31, 2015, Global Dividend intends to pay income distributions, if any, on a quarterly basis. Prior to March 31, 2015, Global Dividend’s policy was to pay income distributions, if any, annually.
The Funds recognize the tax benefits of certain tax positions only where the position is “more likely than not” to be sustained assuming examination by tax authorities. Management has analyzed the Funds’ tax positions, and has concluded that no liability for unrecognized tax benefits should be recorded related to uncertain tax positions taken on returns filed for open tax years (2011-2013), or expected to be taken in the Funds’ 2014 tax returns. The Funds identify their major tax jurisdictions as U.S. Federal tax authorities; however the Funds are not aware of any tax positions for which they are reasonably possible that the total amounts of unrecognized tax benefits will change materially in the next twelve months. The Funds recognize interest and penalties, if any, related to unrecognized tax benefits as income tax expense in the Statements of Operations. During the fiscal year ended November 30, 2015, the Funds did not incur any interest or penalties.
USE OF ESTIMATES: The preparation of financial statements in conformity with accounting principles generally accepted in the United States (“GAAP”) requires management to make estimates and assumptions that affect the reported amounts of assets and liabilities and disclosure of contingent assets and liabilities at the date of the financial statements and the reported amounts of increases and decreases in net assets from operations during the reporting period. Actual results could differ from those estimates.
DISTRIBUTIONS TO SHAREHOLDERS: Distributions to shareholders, which are determined in accordance with income tax regulations, are recorded on the ex-dividend date. The treatment for financial reporting purposes of distributions made to shareholders during the year from net investment income or net realized capital gains may differ from their ultimate treatment for federal income tax purposes. These differences are caused primarily by differences in the timing of recognition of certain components of income, expense or realized capital gain for federal income tax purposes. Where such differences are permanent in nature, they are reclassified in the components of the net assets based on their ultimate characterization for federal income tax purposes. Any such reclassification will have no effect on net assets, results of operations or net asset values per share of any Fund. As of November 30, 2015, as a result of permanent book to tax differences, Core Investment accumulated net investment losses totaling $171,213 were reclassified to accumulated realized gain on investment - net.
EXPENSES: Expenses incurred by the Trust that do not relate to a specific fund of the Trust are allocated to the individual fund based on each fund’s relative net assets or another appropriate basis. OTHER: Each Fund records security transactions based on a trade date for financial statement purposes. Dividend income is recognized on the ex-dividend date, and interest income is recognized on an accrual basis. The Funds use the specific identification method in computing gain or loss on the sale of investment securities. Discounts and premiums on securities purchased are accreted and amortized over the lives of the respective securities. Withholding taxes on foreign dividends have been provided for in accordance with each Fund’s understanding of the applicable country’s tax rules and rates.
3.) SECURITY VALUATIONS
The Funds utilize various methods to measure the fair value of their investments on a recurring basis. GAAP establishes a hierarchy that prioritizes inputs to valuation methods. The three levels of inputs are:
Level 1 - Unadjusted quoted prices in active markets for identical assets or liabilities that the Funds have the ability to access.
Level 2 - Observable inputs other than quoted prices included in level 1 that are observable for the asset or liability, either directly or indirectly. These inputs may include quoted prices for the identical instrument on an inactive market, prices for similar instruments, interest rates, prepayment speeds, credit risk, yield curves, default rates and similar data.
Level 3 - Unobservable inputs for the asset or liability, to the extent relevant observable inputs are not available, representing the Funds’ own assumptions about the assumptions a market participant would use in valuing the assets or liabilities, and would be based on the best information available.
2015 Annual Report 15
Notes to Financial Statements - continued
The availability of observable inputs can vary from security to security and is affected by a wide variety of factors, including, for example, the type of security, whether the security is new and not yet established in the marketplace, the liquidity of markets, and other characteristics particular to the security. To the extent that valuation is based on models or inputs that are less observable or unobservable in the market, the determination of fair value requires more judgment. Accordingly, the degree of judgment exercised in determining fair value is greatest for instruments categorized in level 3.
The inputs used to measure fair value may fall into different levels of the fair value hierarchy. In such cases, for disclosure purposes, the level in the fair value hierarchy within which the fair value measurement falls in its entirety, is determined based on the lowest level input that is significant to the fair value measurement in its entirety.
FAIR VALUE MEASUREMENTS
A description of the valuation techniques applied to the Funds’ major categories of assets measured at fair value on a recurring basis follows:
Equity securities (common stocks, including ADRs). Equity securities that are traded on any exchange or on the NASDAQ over-the-counter market are valued at the last quoted sale price. Lacking a last sale price, a long security is valued at its last bid price except when, in the Advisor’s opinion, the last bid price does not accurately reflect the current value of the long security. To the extent these securities are actively traded and valuation adjustments are not applied, they are classified in level 1 of the fair value hierarchy. When market quotations are not readily available, when the Advisor determines the last bid price does not accurately reflect the current value or when restricted securities are being valued, such securities are valued as determined in good faith by the Advisor, in conformity with guidelines adopted by and subject to review of the Board of Trustees (the “Trustees”) and are categorized in level 2 or level 3, when appropriate.
Money market funds. Money market funds are valued at net asset value and are classified in level 1 of the fair value hierarchy.
Options. Option positions that are traded on any exchange or on the NASDAQ over-the-counter market are valued at the last quoted sale price. To the extent these option positions are actively traded and valuation adjustments are not applied, they are classified in level 1 of the fair value hierarchy. Lacking a last sale price, a purchased option position is valued at its last bid price except when, in the Advisor’s opinion, the last bid price does not accurately reflect the current value of the option position. Lacking a last sale price, a written option position is valued at its last ask price except when, in the Advisor’s opinion, the last ask price does not accurately reflect the current value of the option position. When such bid or ask prices are used for valuation or when the security is not actively traded, those securities are generally categorized in level 2 or level 3 of the fair value hierarchy.
Fixed income securities. Fixed income securities generally are valued by using market quotations, but may be valued on the basis of prices furnished by a pricing service when the Advisor believes such prices accurately reflect the fair value of such securities. A pricing service utilizes electronic data processing techniques based on yield spreads relating to securities with similar characteristics to determine prices for normal institutional-size trading units of debt securities without regard to sale or bid prices. When prices are not readily available from a pricing service, or when restricted or illiquid securities are being valued, securities are valued at fair value as determined in good faith by the Advisor, subject to review of the Trustees. Short-term investments in fixed income securities with maturities of less than 60 days when acquired, or which subsequently are within 60 days of maturity, are valued by using the amortized cost method of valuation. Generally, fixed income securities are categorized as level 2.
In accordance with the Trust’s good faith pricing guidelines, the Advisor is required to consider all appropriate factors relevant to the value of securities for which it has determined other pricing sources are not available or reliable as described above. There is no single standard for determining fair value, since fair value depends upon the circumstances of each individual case. As a general principle, the current fair value of an issue of securities being valued by the Advisor would appear to be the amount which the owner might reasonably expect to receive for them upon their current sale. Methods which are in accordance with this principle may, for example, be based on (i) a multiple of earnings; (ii) a discount from market of a similar freely traded security (including a derivative security or a basket of securities traded on other markets, exchanges or among dealers); or (iii) yield to maturity with respect to debt issues, or a combination of these and other methods.
2015 Annual Report 16
Notes to Financial Statements - continued
The following tables summarize the inputs used to value the Funds’ assets measured at fair value as of November 30, 2015:
| Core Investment: | | | | | | | | |
| Valuation Inputs of Assets | | Level 1 | | Level 2 | | Level 3 | | Total |
| Common Stocks | | $37,476,696 | | $0 | | $0 | | $37,476,696 |
| Money Market Funds | | 1,560,554 | | 0 | | 0 | | 1,560,554 |
| Total | | $39,037,250 | | $0 | | $0 | | $39,037,250 |
| |
| Global Dividend: | | | | | | | | |
| Valuation Inputs of Assets | | Level 1 | | Level 2 | | Level 3 | | Total |
| Common Stocks | | $29,797,243 | | $0 | | $0 | | $29,797,243 |
| Money Market Funds | | 3,932,482 | | 0 | | 0 | | 3,932,482 |
| Total | | $33,729,725 | | $0 | | $0 | | $33,729,725 |
Refer to each Fund’s Schedule of Investments for a listing of securities by industry. The Funds did not hold any level 3 assets during the fiscal year ended November 30, 2015. There were no transfers into or out of the levels during the fiscal year ended November 30, 2015. It is the Funds’ policy to consider transfers into or out of the levels as of the end of the reporting period.
4.) INVESTMENT ADVISORY AGREEMENTS AND SERVICES AGREEMENTS
Each of the Funds has an investment advisory agreement (collectively the “Management Agreements”) with the Advisor. Under the Management Agreements, the Advisor, at its own expense and without reimbursement from the Funds, furnishes office space and all necessary office facilities, equipment and executive personnel necessary for managing the assets of the Funds. For its services the Advisor receives a Management Fee equal to 1.00% of the average daily net assets of Core Investment and a Management Fee equal to 1.25% of the average daily net assets of Global Dividend. Soledad Investment Management, LLC (the “Sub-Advisor”) serves as the sub-advisor of Global Dividend and is paid by the Advisor, not the Fund. Core Investment does not have a sub-advisor. Effective April 1, 2015, the Advisor has contractually agreed to waive a portion of its Management Fee such that it will be equal to 0.75% of the Core Investment’s average daily net assets and equal to 1.00% of the Global Dividend’s average daily net assets greater than $35 million. These waivers will automatically terminate on March 31, 2016 unless they are renewed by the Advisor. The Advisor will not terminate these waivers prior to March 31, 2016.
For the fiscal year ended November 30, 2015, the Advisor earned management fees of $397,026 and $430,042 for Core Investment and Global Dividend, respectively. At November 30, 2015, Core Investment and Global Dividend owed the Advisor management fees of $24,019 and $34,939, respectively. A total of $64,584 of management fees were waived with no recoupment provisions by Core Investment for the fiscal year ended November 30, 2015.
Additionally, the Funds each have a Services Agreement with the Advisor (the “Services Agreements”). Under the Services Agreements the Advisor receives an additional fee of 0.50% of the average daily net assets per Fund and is obligated to pay the operating expenses of the Funds excluding, as applicable, management fees and sub-advisory fees, brokerage fees and commissions, 12b-1 fees, taxes, borrowing costs (such as (a) interest and (b) dividend expenses on securities sold short), ADR fees, the cost of acquired funds and extraordinary expenses. Effective April 1, 2015, the Advisor has contractually agreed to waive a portion of its Services Fee to 0.20% of each Funds’ average daily net assets greater than $35 million. These waivers will automatically terminate on March 31, 2016 unless they are renewed by the Advisor. The Advisor will not terminate these waivers prior to March 31, 2016.
For the fiscal year ended November 30, 2015, the Advisor earned services fees of $198,513 and $172,017 for Core Investment and Global Dividend, respectively. At November 30, 2015, the Funds owed the Advisor services fees of $15,035 and $13,976 for Core Investment and Global Dividend, respectively. A total of $7,310 of services fees were waived with no recoupment provisions by Core Investment for the fiscal year ended November 30, 2015.
5.) RELATED PARTY TRANSACTIONS
Jeffrey R. Provence of Premier Fund Solutions, Inc. (the “Administrator”) also serves as trustee/officer of the Funds. This individual receives benefits from the Administrator resulting from administration fees paid to the Administrator of the Funds by the Advisor.
2015 Annual Report 17
Notes to Financial Statements - continued
The Trustees who are not interested persons of the Funds were each paid $2,750, for a total of $8,250 in Trustees’ fees for both Funds for the fiscal year ended November 30, 2015 by the Advisor.
6.) DERIVATIVES
For the fiscal year ended November 30, 2015, the Funds did not hold any derivative instruments. However, Core Investment may engage in options transactions, as it has in previous years.
As of November 30, 2015, there were no offsetting arrangements of assets and liabilities for the Funds.
7.) INVESTMENTS
For the fiscal year ended November 30, 2015, purchases and sales of investment securities other than U.S. Government obligations and short-term investments were as follows:
| | | Core Investment | | Global Dividend |
| Purchases | | $22,843,102 | | $3,025,259 |
| Sales | | $22,919,624 | | $3,296,030 |
There were no purchases or sales of U.S. Government obligations.
8.) CAPITAL SHARES
At November 30, 2015, the Trust was authorized to issue an unlimited number of shares of beneficial interest. The following are the shares issued and paid in capital outstanding for the Funds at November 30, 2015:
| | | Core Investment | | Global Dividend |
| Shares Issued | | | | |
| and Outstanding | | 2,752,645 | | 2,870,309 |
| Paid in Capital | | $29,451,588 | | $31,163,510 |
9.) CONTROL OWNERSHIP
The beneficial ownership, either directly or indirectly, of more than 25% of the voting shares of a fund creates a presumption of control of the fund, under section 2(a)(9) of the Investment Company Act of 1940. At November 30, 2015, National Financial Services, LLC, located at 200 Liberty Street, New York, New York 10281, held for the benefit of its customers, in aggregate, 97.97% of the Core Investment shares. National Financial Services, LLC, located at 200 Liberty Street, New York, New York 10281, held for the benefit of its customers, in aggregate, 98.53% of Global Dividend shares. The Advisor has advised the Trust that with respect to the accounts held by National Financial Services, LLC for Core Investment and Global Dividend, it believes there are no underlying accounts that beneficially own more than 25% of the Funds’ outstanding voting securities.
10.) DISTRIBUTIONS TO SHAREHOLDERS
There was a distribution paid on December 26, 2014 to the Funds’ shareholders of record on December 24, 2014. Core Investment paid a distribution of $0.18153 per share from short-term capital gains and $0.12588 per share from long-term capital gains. Also, Global Dividend paid a distribution of $0.43266 per share from net investment income, $0.01744 per share from short-term capital gains and $0.45275 per share from long-term capital gains on December 26, 2014 to shareholders of record on December 24, 2014. Additionally, Global Dividend paid a distribution of $0.13357 per share from net investment income on June 23, 2015 to shareholders of record on June 22, 2015, and paid a distribution of $0.02535 per share from net investment income on September 23, 2015 to shareholders of record on September 22, 2015.
| Core Investment distributions paid from: | | | | |
| |
| | | Fiscal Year Ended | | Fiscal Year Ended |
| | | November 30, 2015 | | November 30, 2014 |
| Ordinary Income | | $ 0 | | $ 0 |
| Short-term Capital Gain | | 525,496 | | 846,623 |
| Long-term Capital Gain | | 364,399 | | 2,390,958 |
| | | $ 889,895 | | $ 3,237,581 |
2015 Annual Report 18
| Notes to Financial Statements - continued | | |
| Global Dividend distributions paid from: | | | | |
| |
| | | Fiscal Year Ended | | Fiscal Year Ended |
| | | November 30, 2015 | | November 30, 2014 |
| Ordinary Income | | $ 1,602,845 | | $ 516,770 |
| Short-term Capital Gain | | 47,257 | | 160,159 |
| Long-term Capital Gain | | 1,226,818 | | 579,794 |
| | | $ 2,876,920 | | $ 1,256,723 |
Subsequent to November 30, 2015, Core Investment paid a distribution of $0.98179 per share from long-term capital gains on December 28, 2015 to the shareholders of record on December 24, 2015. Also on December 28, 2015, Global Dividend paid a distribution of $0.03827 per share from net investment income, $0.00164 per share from short-term capital gains and $0.07145 per share from long-term capital gains to the shareholders of record on December 24, 2015.
11.) TAX MATTERS
For federal income tax purposes, at November 30, 2015 the cost of securities on a tax basis and the composition of gross unrealized appreciation (the excess of value over tax cost) and depreciation (the excess of tax cost over value) were as follows:
| | | Core Investment | | | Global Dividend | |
| Cost of Investments | | $31,925,404 | | | $31,276,231 | |
| Gross Unrealized Appreciation | | $8,014,157 | | | $4,934,728 | |
| Gross Unrealized Depreciation | | ($902,311 | ) | | ($2,481,234 | ) |
| Net Unrealized Appreciation | | | | | | |
| (Depreciation) on Investments | | $7,111,846 | | | $2,453,494 | |
As of November 30, 2015, book to tax differences in cost basis primarily were attributable to the deferral of wash sales.
As of November 30, 2015, the components of distributable earnings (accumulated losses) on a tax basis were as follows for the Funds:
| Core Investment: | | |
| |
| Undistributed long-term capital gain (accumulated losses) | $ | 2,719,556 |
| Unrealized appreciation (depreciation) - net | | 7,111,846 |
| | $ | 9,831,402 |
| |
| Global Dividend: | | |
| |
| Undistributed ordinary income (accumulated losses) | $ | 71,738 |
| Undistributed long-term capital gain (accumulated losses) | | 204,764 |
| Unrealized appreciation (depreciation) - net | | 2,453,494 |
| | $ | 2,729,996 |
Income and capital gains are determined in accordance with income tax regulations that may differ from GAAP. These differences are primarily due to the deferral of wash sale losses. Additionally, Core Investment elected to defer late year ordinary losses of $37,361 for tax purposes.
12.) SUBSEQUENT EVENTS
Soledad Investment Management, LLC (“Soledad”), the investment sub-advisor to Global Dividend during the period announced that, based on mutual agreement between it and Christopher Weil & Company, Inc. (“CWC”), the Fund’s investment advisor, as well as discussions between the Board of Trustees of PFS Funds and CWC, it has determined to resign as sub-advisor to Global Dividend. The resignation became effective on December 19, 2015. Based on presentations made to the Board of Trustees at its quarterly meeting held in December 2015, CWC assumed the day-to-day portfolio management responsibilities for Global Dividend on December 19, 2015.
2015 Annual Report 19
DISCLOSURE OF EXPENSES
(Unaudited)
As a shareholder of the Funds, you incur two types of costs: (1) transaction costs, including sales charges (loads) on purchase payments; and (2) ongoing costs, including management fees; and other Fund expenses. This Example is intended to help you understand your ongoing costs (in dollars) of investing in the Funds and to compare these costs with the ongoing costs of investing in other mutual funds. If Fund shares are redeemed within 90 days of purchase from the Funds, the shares are subject to a 2% redemption fee. Additionally, IRA accounts will be charged an $8.00 annual maintenance fee. Also, your account will be indirectly subject to the expenses of the underlying funds.
The Example is based on an investment of $1,000 invested in the Funds on June 1, 2015, and held through November 30, 2015.
Actual Expenses
The first line of the table below provides information about actual account values and actual expenses. You may use the information in this line, together with the amount you invested, to estimate the expenses that you paid over the period. Simply divide your account value by $1,000 (for example, an $8,600 account value divided by $1,000 = 8.6), then multiply the result by the number in the first line under the heading entitled “Expenses Paid During Period” to estimate the expenses you paid on your account during this period.
Hypothetical Example for Comparison Purposes
The second line of the table below provides information about hypothetical account values and hypothetical expenses based on the Funds’ actual expense ratio and an assumed rate of return of 5% per year before expenses, which is not the Funds’ actual return. The hypothetical account values and expenses may not be used to estimate the actual ending account balance or expenses you paid for the period. You may use this information to compare the ongoing costs of investing in these Funds and other funds. To do so, compare this 5% hypothetical example with the 5% hypothetical examples that appear in the shareholder reports of the other funds.
Please note that the expenses shown in the table are meant to highlight your ongoing costs only and do not reflect any transactional costs, such as redemption fees or IRA maintenance fees described above or the expenses of the underlying funds. Therefore, the second line of the table is useful in comparing ongoing costs only, and will not help you determine the relative cost of owning different funds. In addition, if these transactional costs were included, your cost could have been higher.
CORE INVESTMENT
| | | | | | | Expenses Paid |
| | | Beginning | | Ending | | During the Period* |
| | | Account Value | | Account Value | | June 1, 2015 to |
| | | June 1, 2015 | | November 30, 2015 | | November 30, 2015 |
| |
| Actual | | $1,000.00 | | $964.16 | | $6.01 |
| |
| Hypothetical | | $1,000.00 | | $1,018.95 | | $6.17 |
| (5% annual return | | | | | | |
| before expenses) | | | | | | |
* Expenses are equal to the Fund’s annualized expense ratio of 1.22%, multiplied by the average
account value over the period, multiplied by 183/365 (to reflect the one-half year period). |
GLOBAL DIVIDEND
| | | | | | | Expenses Paid |
| | | Beginning | | Ending | | During the Period* |
| | | Account Value | | Account Value | | June 1, 2015 to |
| | | June 1, 2015 | | November 30, 2015 | | November 30, 2015 |
| |
| Actual | | $1,000.00 | | $940.48 | | $8.51 |
| |
| Hypothetical | | $1,000.00 | | $1,016.29 | | $8.85 |
| (5% annual return | | | | | | |
| before expenses) | | | | | | |
* Expenses are equal to the Fund’s annualized expense ratio of 1.75%, multiplied by the average
account value over the period, multiplied by 183/365 (to reflect the one-half year period). |
2015 Annual Report 20
ADDITIONAL INFORMATION
November 30, 2015
(Unaudited)
AVAILABILITY OF QUARTERLY SCHEDULE OF INVESTMENTS
The Funds file their complete schedules of portfolio holdings with the Securities and Exchange Commission (“SEC”) for the first and third quarters of each fiscal year on Form N-Q. The Funds’ Forms N-Q are available on the SEC’s website at http://www.sec.gov. The Funds’ Forms N-Q may also be reviewed and copied at the SEC’s Public Reference Room in Washington, DC. Information on the operation of the Public Reference Room may be obtained by calling 1-800-SEC-0330.
PROXY VOTING GUIDELINES
Christopher Weil & Company, Inc., the Funds’ Advisor, is responsible for exercising the voting rights associated with the securities held by the Funds. A description of the policies and procedures used by the Advisor in fulfilling this responsibility is available without charge on the Funds’ web site at www.cweil.com. It is also included in the Funds’ Statement of Additional Information, which is available on the Securities and Exchange Commission’s website at http://www.sec.gov.
Information regarding how the Funds voted proxies, Form N-PX, relating to portfolio securities during the most recent 12-month period ended June 30 is available without charge, upon request, by calling our toll free number(1-888-550-9266). This information is also available on the Securities and Exchange Commission’s web site at http://www.sec.gov.
ADDITIONAL INFORMATION
You will find more information about the Funds at www.cweil.com. For shareholder inquiries, please call toll-free in the U.S. at 1-888-550-9266.
2015 Annual Report 21
Cohen Fund Audit Services, Ltd.
1350 Euclid Avenue, Ste 800
Cleveland, Ohio 44115
www.cohenfund.com
REPORT OF INDEPENDENT REGISTERED PUBLIC ACCOUNTING FIRM
To the Shareholders of
Christopher Weil & Company Core Investment Fund and
Christopher Weil & Company Global Dividend Fund and
Board of Trustees of PFS Funds
We have audited the accompanying statements of assets and liabilities, including the schedules of investments, of Christopher Weil & Company Core Investment Fund and Christopher Weil & Company Global Dividend Fund (the "Funds"), each a series of PFS Funds, as of November 30, 2015, and the related statements of operations for the year then ended, the statements of changes in net assets for each of the two years in the period then ended, and the financial highlights for each of the four periods in the period then ended. These financial statements and financial highlights are the responsibility of the Funds' management. Our responsibility is to express an opinion on these financial statements and financial highlights based on our audits.
We conducted our audits in accordance with the standards of the Public Company Accounting Oversight Board (United States). Those standards require that we plan and perform the audit to obtain reasonable assurance about whether the financial statements and financial highlights are free of material misstatement. An audit includes examining, on a test basis, evidence supporting the amounts and disclosures in the financial statements. Our procedures included confirmation of securities owned as of November 30, 2015, by correspondence with the custodian and brokers. An audit also includes assessing the accounting principles used and significant estimates made by management, as well as evaluating the overall financial statement presentation. We believe that our audits provide a reasonable basis for our opinion.
In our opinion, the financial statements and financial highlights referred to above present fairly, in all material respects, the financial position of each of the Funds as of November 30, 2015, the results of their operations for the year then ended, the changes in their net assets for each of the two years in the period then ended, and the financial highlights for each of the four periods in the period then ended, in conformity with accounting principles generally accepted in the United States of America.

COHEN FUND AUDIT SERVICES, LTD.
Cleveland, Ohio
January 25, 2016
2015 Annual Report 22
Trustees and Officers
(Unaudited)
The Board of Trustees supervises the business activities of the Trust. The names of the Trustees and executive officers of the Trust are shown below. For more information regarding the Trustees, please refer to the Statement of Additional Information, which is available upon request by calling 1-888-550-9266. Each Trustee serves until the Trustee sooner dies, resigns, retires, or is removed.
The Trustees and Officers of the Trust and their principal business activities during the past five years are:
Interested Trustees and Officers
| | | | | Number of | |
| | | | Principal | Portfolios In | Other |
| Name, | Position(s) | Term of Office | Occupation(s) | Fund | Directorships |
| Address(1), | Held With | and Length of | During | Complex | Held By |
| and Year of Birth | the Trust | Time Served | Past 5 Years | Overseen By | Trustee |
| | | | | Trustee | |
| |
| Ross C. Provence, | President | Indefinite Term; | General Partner and Portfolio | N/A | N/A |
| Year of Birth: 1938 | | Since 2000 | Manager for Value Trend Capital | | |
| | | | Management, LP (1995 to current). | | |
| | | | Estate planning attorney (1963 to | | |
| current). |
| |
| Jeffrey R. Provence(2), | Trustee, | Indefinite Term; | CEO, Premier Fund Solutions, Inc. | 11 | Blue Chip |
| Year of Birth: 1969 | Secretary | Since 2000 | (2001 to current). General Partner | | Investor Funds |
| | and | | and Portfolio Manager for Value | | |
| | Treasurer | | Trend Capital Management, LP | | |
| | | | (1995 to current). | | |
| |
| Julian G. Winters, | Chief | Chief | Managing Member, Watermark | N/A | N/A |
| Year of Birth: 1968 | Compliance | Compliance | Solutions LLC (investment compli- | | |
| | Officer | Officer Since | ance and consulting) since March | | |
| | | 2010 | 2007. | | |
| | (1) The address of each trustee and officer is c/o PFS Funds, 1939 Friendship Drive, Suite C, El Cajon, California 92020.
(2) Jeffrey R. Provence is considered an "interested person" as defined in Section 2(a)(19) of the Investment Company Act of 1940 by
virtue of his position with the Trust. |
Independent Trustees
| | | | | Number of | |
| | | | Principal | Portfolios In | Other |
| Name, | Position | Term of Office | Occupation(s) | Fund | Directorships |
| Address(1), | Held With | and Length of | During | Complex | Held By |
| and Year of Birth | the Trust | Time Served | Past 5 Years | Overseen By | Trustee |
| | | | | Trustee | |
| |
| Thomas H. Addis III, | Independent | Indefinite Term; | Executive Director/CEO, Southern | 11 | None |
| Year of Birth: 1945 | Trustee | Since 2000 | California PGA (2006 to current). | | |
| |
| Allen C. Brown, | Independent | Indefinite Term; | Co-owner of Stebleton & Brown | 11 | Blue Chip |
| Year of Birth: 1943 | Trustee | Since 2010 | (1994 to current). Estate planning | | Investor Funds |
| | | | and business attorney (1970 to cur- | | |
| rent). |
| |
| George Cossolias, CPA, | Independent | Indefinite Term; | Partner of CWDL, CPAs (February 1, | 11 | Blue Chip |
| Year of Birth: 1935 | Trustee | Since 2000 | 2014 to current). Owner of George | | Investor Funds |
| | | | Cossolias & Company, CPAs (1972 | | |
| | | | to January 31, 2014). President of | | |
| | | | LubricationSpecialists, Inc. (1996 to | | |
| current). |
(1) The address of each trustee and officer is c/o PFS Funds, 1939 Friendship Drive, Suite C, El Cajon, California 92020.
2015 Annual Report 23
This page intentionally left blank.
2015 Annual Report 24
This page intentionally left blank.
2015 Annual Report 25
Investment Advisor
Christopher Weil & Company, Inc.
Sub-Advisor
Soledad Investment Management, LLC
(Christopher Weil & Company Global Dividend Fund only)
Custodian
US Bank N.A.
Distributor
Rafferty Capital Markets, LLC
Fund Administrator
Premier Fund Solutions, Inc.
Independent Registered
Public Accounting Firm
Cohen Fund Audit Services, Ltd.
Legal Counsel
The Law Offices of John H. Lively & Associates, Inc.
A member firm of The 1940 Act Law GroupTM
Transfer Agent
Mutual Shareholder Services, LLC |
This report is provided for the general information of the shareholders of the Christopher
Weil & Company Core Investment Fund and the Christopher Weil & Company Global
Dividend Fund. This report is not intended for distribution to prospective investors in the
Funds, unless preceded or accompanied by an effective prospectus. |
Christopher Weil & Company Funds
11236 El Camino Real, Suite 200
San Diego, California 92130
1-888-550-9266 OR 1-800-355-9345
www.cweil.com
Item 2. Code of Ethics.
The registrant has adopted a code of ethics that applies to the registrant’s principal executive officer and the principal financial officer. The registrant has not made any amendments to its code of ethics during the covered period. The registrant has not granted any waivers from any provisions of the code of ethics during the covered period. A copy of the registrant’s Code of Ethics is filed herewith.
Item 3. Audit Committee Financial Expert.
The registrant’s Board of Trustees has determined that George Cossolias is an audit committee finical expert. Mr. Cossolias is independent for purposes of this Item 3.
Item 4. Principal Accountant Fees and Services.
(a-d) The following table details the aggregate fees billed for each of the last two fiscal years for audit fees, audit-related fees, tax fees and other fees by the principal accountant to the registrant. The principal accountant has provided no services to the adviser or any entity controlled by, or under common control with the adviser that provides ongoing services to the registrant.
| | | FYE 11/30/15 | | FYE 11/30/14 |
| Audit Fees | | $25,700 | | $25,750 |
| Audit-Related Fees | | $0 | | $0 |
| Tax Fees | | $5,000 | | $5,000 |
| All Other Fees | | $850 | | $800 |
Nature of Tax Fees: Preparation of Excise Tax Statement and 1120 RIC.
Nature of All Other Fees: Review of Semi-Annual Report.
(e) (1) The audit committee approves all audit and non-audit related services and, therefore, has not adopted pre-approval policies and procedures described in paragraph (c)(7) of Rule 2-01 of Regulation S-X.
(e) (2) None of the services described in paragraph (b) through (d) of this Item were approved by the audit committee pursuant to paragraph (c)(7)(i)(C) of Rule 2-01 of Regulation S-X.
(f) All of the principal accountant’s hours spent on auditing the registrant’s financial statements were attributed to work performed by full-time permanent employees of the principal accountant.
(g) The following table indicates the aggregate non-audit fees billed by the registrant’s principal accountant for services to the registrant , the registrant’s investment adviser (not sub-adviser), and any entity controlling, controlled by, or under common control with the adviser that provides ongoing services to the registrant, for the last two years.
| Non-Audit Fees | | FYE 11/30/15 | | FYE 11/30/14 |
| Registrant | | $5,850 | | $5,800 |
| Registrant’s Investment Adviser | | $0 | | $0 |
(h) The principal accountant provided no services to the investment adviser or any entity controlling, controlled by, or under common control with the adviser that provides ongoing services to the registrant.
Item 5. Audit Committee of Listed Companies. Not applicable.
Item 6. Schedule of Investments. Schedule filed with Item 1.
Item 7. Disclosure of Proxy Voting Policies and Procedures for Closed-End Management Investment Companies. Not applicable.
Item 8. Portfolio Managers of Closed End Management Investment Companies. Not applicable.
Item 9. Purchases of Equity Securities by Closed-End Management Investment Companies and Affiliated Purchasers. Not applicable.
Item 10. Submission of Matters to a Vote of Security Holders.
The registrant has not adopted procedures by which shareholders may recommend nominees to the registrant’s board of trustees.
Item 11. Controls and Procedures.
(a) The registrant’s president and chief financial officer concluded that the disclosure controls and procedures (as defined in Rule 30a-3(c) under the Investment Company Act of 1940 (the “Act”)) were effective as of a date within 90 days of the filing date of this report, based on the evaluation of these controls and procedures required by Rule 30a-3(b) under the Act.
(b) There were no changes in the registrant’s internal control over financial reporting (as defined in Rule 30a-3(d) under the Act) that occurred during the registrant’s second fiscal quarter of the period covered by this report that have materially affected, or are reasonably likely to materially affect, the registrant’s internal control over financial reporting.
Item 12. Exhibits.
(a)(1) Code of Ethics. Filed herewith.
(a)(2) Certifications pursuant to Section 302 of the Sarbanes-Oxley Act of 2002. Filed herewith.
(a)(3) Not applicable.
(b) Certification pursuant to Section 906 Certification of the Sarbanes-Oxley Act of 2002. Filed herewith.
SIGNATURES
Pursuant to the requirements of the Securities Exchange Act of 1934 and the Investment Company Act of 1940, the registrant has duly caused this report to be signed on its behalf by the undersigned, thereunto duly authorized.
| | By: /s/Ross C. Provence
Ross C. Provence
President |
Pursuant to the requirements of the Securities Exchange Act of 1934 and the Investment Company Act of 1940, this report has been signed below by the following persons on behalf of the registrant and in the capacities and on the dates indicated.
| |
By: /s/Ross C. Provence
Ross C. Provence
President |
| | By: /s/Jeffrey R. Provence
Jeffrey R. Provence
Chief Financial Officer |