UNITED STATES
SECURITIES AND EXCHANGE COMMISSION
WASHINGTON, D.C. 20549
FORM N-CSR
CERTIFIED SHAREHOLDER REPORT OF REGISTERED MANAGEMENT
INVESTMENT COMPANIES
Investment Company Act file number: 811-09781
PFS Funds
(Exact name of registrant as specified in charter)
| 1939 Friendship Drive. | |
| Suite C | |
| El Cajon, CA | 92020 |
| (Address of principal executive offices) | (Zip code) |
CT Corporation System
155 Federal St.,
Suite 700,
Boston, MA 02110
(Name and address of agent for service)
Registrant's telephone number, including area code: (619) 588-9700
Date of fiscal year end: March 31
Date of reporting period: March 31, 2015
Form N-CSR is to be used by management investment companies to file reports with the Commission not later than 10 days after the transmission to stockholders of any report that is required to be transmitted to stockholders under Rule 30e-1 under the Investment Company Act of 1940 (17 CFR 270.30e -1). The Commission may use the information provided on Form N-CSR in its regulatory, disclosure review, inspection and policymaking roles.
A registrant is required to disclose the information specified by Form N-CSR, and the Commission will make this information public. A registrant is not required to respond to the collection of information contained in Form N-CSR unless the Form displays a currently valid Office of Management and Budget ("OMB") control number.
Item 1. Reports to Stockholders.
NWM MOMENTUM FUND
ANNUAL REPORT
March 31, 2015
TICKER MOMOX
NWM Momentum Fund
Annual Report
March 31, 2015
Dear NWM Momentum Fund Investors,
We are pleased to have the opportunity to address you in what is our first annual shareholder letter. When starting any new endeavor, there is a certain anxiety that comes along with it. Notwithstanding, launching the NWM Momentum Fund (the "Fund") last year was a wonderful accomplishment for our firm. More importantly, we believe access to the strategy for our investors is a huge victory. We would like to thank you for your trust as we work hard to build and protect the precious assets you have entrusted to us to manage through the Fund.
The Fund launched on April 1, 2014 - accordingly, the conversation below will cover the period from April 1, 2014 until March 31, 2015.
VOLATILITY IS FINALLY HERE
Volatility finally began to pick up in US Markets in October after many quarters of seemingly steady upward drift, as the S&P 500 quickly went from having a decent up year, to being down in a few short weeks during the October correction. Investors quickly went from having a good year, to a bad year. But that wasn't to remain the case. The Federal Open Market Committee of the Federal Reserve Board continued to come to the rescue of US Stocks in the 4th quarter with what we believed to have been soothing words that the market used to turn on a dime and quickly recover all of the corrections in short order. The Bank of International Settlements, which is the Federal Reserve's own governing body, stated as much when they observed:
"It is, of course, possible to draw comfort from recent events. Those who do so stress the speed of the rebound. At the same time, a more sobering interpretation is also possible. To my mind, these events underline the fragility - dare I say growing fragility? - hidden beneath the markets' buoyancy. Small pieces of news can generate outsize effects. This, in turn, can amplify mood swings. And it would be imprudent to ignore that markets did not fully stabilize by themselves. Once again, on the heels of the turbulence, major central banks made soothing statements, suggesting that they might delay normalization in light of evolving macroeconomic conditions. Recent events, if anything, have highlighted once more the degree to which markets are relying on central banks: the markets' buoyancy hinges on central banks' every word and deed."
"The highly abnormal is becoming uncomfortably normal. Central banks and markets have been pushing benchmark sovereign yields to extraordinary lows - unimaginable just a few years back. Three-year government bond yields are well below zero in Germany, around zero in Japan and below 1 per cent in the United States. Moreover, estimates of term premia are pointing south again, with some evolving firmly in negative territory. And as all this is happening, global growth - in inflation-adjusted terms - is close to historical averages. There is something vaguely troubling when the unthinkable becomes routine."
Judging by the performance of the stock market, we believe that it seems the market has become complacent with risk. With violent spikes to new highs consistently coming immediately after strong periods of down moves, we are concerned that market participants may be becoming a bit overconfident this late in the rally. We believe that 2013 and 2014 will be remembered in history as the "V-bounce" market years. Since we rebalance asset classes as frequently as every two weeks, depending on the relative strength of certain risk on ETF's verses the risk off ETF's as stated in our prospectus, we have received many more false triggers due to this type of market action through the year. During the 4th quarter, it seemed our triggers were finally gaining some traction and avoiding a bit more of the whipsaw type action that we saw during the summer months with this strategy. We don't care which asset class is working, whether it be US Treasuries, US Stocks, or International stocks, we just hope for a continued trend in order to be
2015 Annual Report 1
able to participate in the asset classes strength. A continued market that has short and violent sell-offs followed by comparable strong rallies could prove to be a continued headwind for this strategy.
Regardless of where the markets go in 2015, we feel if there is a defined trend, the strategy will work hard to catch a ride on those trends while working hard to avoid the asset classes that show sustained periods of weakness, thus allowing us to work for acceptable risk adjusted returns for our clients.
Performance
The Fund launched at a price of $10.00 and ended March 31, 2015 at $9.94. The Fund paid a $0.10 per share dividend in December 2014, thus giving the fund a 1 year return of 0.40% .
Market Conditions Example
Had an investor fallen asleep during the operating year and woke up at the end of the year, they would see very strong performance from major U.S. Market Indexes, negative performance from International market indexes, and would have missed a lot of volatility in between.
The Fund is designed to try to rotate into U.S Treasuries during signs of adverse market conditions, and the past year proved to be very volatile for this strategy. There were a few points in the year where the Fund was invested 100% in U.S Treasuries, only to see a rotation back into stocks a few weeks later. To sum it up, the strategy was whipsawed in and out of stocks throughout the year.
This phenomenon can most obviously be seen during the September - October period. The S&P 500 closed on September 19th at 2010.40 which was up 8.76% YTD at that time. By October 15th, the index hit a low that day of 1820.66, leaving the index briefly down 1.5% YTD. During this intense downside move in the index, the Fund had rotated to nearly 90% U.S Treasuries and about 10% exposure to the S&P 500 ETF. From the beginning of October to October 15, the S&P 500 dropped over 5% while the Fund went from $9.78 to $10.05 for a gain of 2.76% . We were encouraged to see the strategy doing what we hoped it would during this down move. Unfortunately, which has been the case for over a year, the downside volatility wasn't long for this world as the market rallied violently to new all-time highs by the end of October, while U.S Treasuries dropped hard for the rest of the month.
We saw this same market characteristic at the start of 2015. Stocks, as measured by the S&P 500, fell 3.1% in January, only to rally from day one in February over 5.2% for the month. The Fund entered January with 75% exposure to U.S Treasuries, and by mid-month, the Fund was nearly 100% in U.S Treasuries. Once again, the market showed its continued resiliency and marched to new highs in February. As March started, the Fund rotated into nearly 100% stocks, just as the market fell from the beginning of March, until it bottomed on March 11. Because of the bounce from March 11, to mid-month, we were able to break this cycle of perfectly timed bad rotations from a whipsaw market. The Fund hit a closing low of $9.55 on March 10, and finished the month at $9.96 for a gain of 4.29% from the low. We had a number of months of perfectly timed bad rotations that seemed to have broken during this most recent market bounce.
That said, we just had to shake our heads and continue to rotate as the model tells us to rotate. The goal is not to get every rotation right, but to hopefully have rotated into cash or U.S Treasuries by the time the next sustained market crash takes place. Remember, every 50% market drop started with a drop of 5-10%. This past year, the 5 and 10% drops have recovered very quickly. Eventually, we believe this pattern will eventually fail, and another correction or crash will take place. Dana Lyon's did an interesting study1 on the recent V-bounce phenomena based on this definition:
1http://jlfmi.tumblr.com/post/101416437690/the-v-bottom-is-still-in-fashion
2015 Annual Report 2
| | |
| 1: Market hits a new 52-week high |
| 2: | A selloff of -3% or more happens within 1 month |
| 3: A subsequent rally to within 1% of the previous high with at least 7 or 10 days being up and no down days worse than -1% |
The bottom line is this, the chart is trying to find historical periods when the market has a quick sell off and is then followed by a VERY sharp rally back to the highs, as if that selloff never occurred:

Each blue line represents an occurrence of the rules outlined above, dating back to 1950. As you can see, the relentless buying since March 2013 has produced 9 occurrences of a V shaped rally. From 1950-2012, this type of buying only occurred 38 times. Basically out of the 47 times the market has melted up after a pullback in the past 65 years, 20% of those occurrences have taken place in a little over a year.
Based on the way Central Banks are playing in the markets, we believe this trend may not end soon.
What does that mean? Unfortunately, being conservative may not be "en vogue" in the near future. We remain hopeful though that the V bounce environment ends so we will no longer continue to get false triggers moving forward.
Tim Ayles
Performance data quoted represents past performance. Past performance does not guarantee future results. The investment return and principal value of an investment will fluctuate so that an investor’s shares, when redeemed, may be worth more or less than their original cost. All returns include change in share prices, and reinvestment of any dividends and capital gains distributions. Current performance may be lower or higher than the performance data quoted. You may obtain performance data current to the most recent month-end by calling 1-888-331-9609. An investment in the fund is subject to investment risks, including the possible loss of the principal amount invested. The Fund’s principal underwriter is Rafferty Capital Markets, LLC.
2015 Annual Report 3
NWM MOMENTUM FUND (Unaudited)
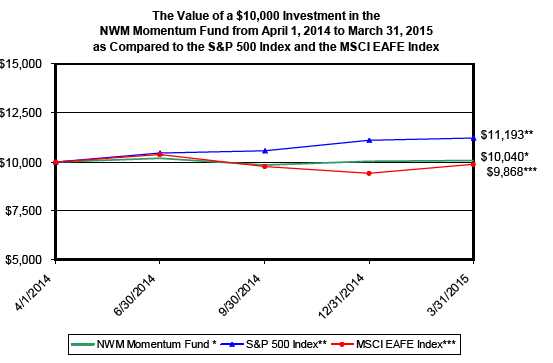
PERFORMANCE INFORMATION
March 31, 2015 NAV $9.94
TOTAL RETURNS AS OF MARCH 31, 2015
| | Since | |
| | Inception | (A) |
| NWM Momentum Fund | 0.40 | % |
| S&P 500 Index (B) | 11.93 | % |
| MSCI EAFE Index (C) | -1.32 | % |
Annual Fund Operating Expense Ratio (from 4/1/14 Prospectus): 1.95%
The Annual Fund Operating Expense Ratio reported above will not correlate to the expense ratio in the Fund’s financial highlights because the financial highlights include only the direct operating expenses incurred by the Fund, not the indirect costs of investing in acquired funds.
(A)Since Inception returns include change in share prices and in each case includes reinvestment of any dividends and capital gain distributions. The NWM Momentum Fund commenced operations on April 1, 2014.
(B)The S&P 500® Index is a widely recognized unmanaged index of equity prices and is representative of a broader market and range of securities than is found in the Fund’s portfolio. The Index is an unmanaged benchmark that assumes reinvestment of all distributions and excludes the effect of taxes and fees. Individuals cannot invest directly in this Index; however, an individual can invest in exchange traded funds or other investment vehicles that attempt to track the performance of a benchmark index.
(C)The MSCI® EAFE® Index (Europe, Australasia, Far East) is a free float-adjusted market capitalization index that is designed to measure the equity market performance of developed markets, excluding the U.S. and Canada. The MSCI EAFE Index consists of the following 22 developed market country indices: Australia, Austria, Belgium, Denmark, Finland, France, Germany, Greece, Hong Kong, Ireland, Israel, Italy, Japan, the Netherlands, New Zealand, Norway, Portugal, Singapore, Spain, Sweden, Switzerland, and the United Kingdom.
PAST PERFORMANCE DOES NOT GUARANTEE FUTURE RESULTS. INVESTMENT RETURN AND PRINCIPAL VALUE WILL FLUCTUATE SO THAT SHARES, WHEN REDEEMED, MAY BE WORTH MORE OR LESS THAN THEIR ORIGINAL COST. RETURNS DO NOT REFLECT THE DEDUCTION OF TAXES THAT A SHAREHOLDER WOULD PAY ON FUND DISTRIBUTIONS OR THE REDEMPTION OF FUND SHARES. CURRENT PERFORMANCE MAY BE LOWER OR HIGHER THAN THE PERFORMANCE DATA QUOTED. TO OBTAIN PERFORMANCE DATA CURRENT TO THE MOST RECENT MONTH END, PLEASE CALL 1-888-331-9609. AN INVESTMENT IN THE FUND IS SUBJECT TO INVESTMENT RISKS, INCLUDING THE POSSIBLE LOSS OF THE PRINCIPAL AMOUNT INVESTED. THE FUND'S DISTRIBUTOR IS RAFFERTY CAPITAL MARKETS, LLC.
2015 Annual Report 4
NWM MOMENTUM FUND (Unaudited)
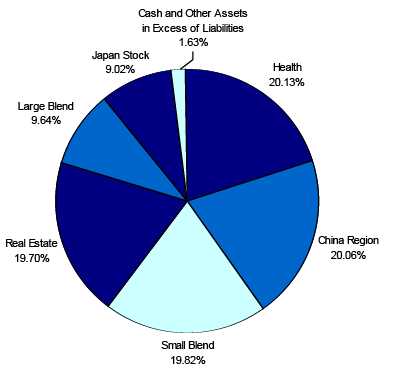
NWM Momentum Fund
by Sectors (as a percentage of Net Assets)
Availability of Quarterly Schedule of Investments
The Fund files its complete schedule of portfolio holdings with the Securities and Exchange Commission ("SEC") for the first and third quarters of each fiscal year on Form N-Q. The Fund’s Form N-Q is available on the SEC's Web site at http://www.sec.gov. The Fund’s Form N-Q may also be reviewed and copied at the SEC's Public Reference Room in Washington, DC. Information on the operation of the Public Reference Room may be obtained by calling 1-800-SEC-0330.
Proxy Voting Guidelines
NWM Fund Group, LLC, the Fund’s investment adviser (“Adviser”), is responsible for exercising the voting rights associated with the securities held by the Fund. A description of the policies and procedures used by the Adviser in fulfilling this responsibility is available without charge on the Fund’s website at www.nwmfund.com. It is also included in the Fund’s Statement of Additional Information, which is available on the SEC’s website at http://www.sec.gov.
Information regarding how the Fund voted proxies, Form N-PX, relating to portfolio securities during the most recent period ended June 30th, is available without charge, upon request, by calling our toll free number (1-888-331-9609). This information is also available on the SEC’s website at http://www.sec.gov.
2015 Annual Report 5
Expense Example
(Unaudited)
Shareholders of this Fund incur ongoing costs consisting of management fees and service fees. Although the Fund charges no sales loads or transaction fees, you will be assessed fees for outgoing wire transfers, returned checks and stop payment orders at prevailing rates charged by Mutual Shareholder Services, LLC, the Fund’s transfer agent. IRA accounts will be charged an $8.00 annual maintenance fee. If shares are redeemed within 90 days of purchase from the Fund, the shares are subject to a 2% redemption fee. Additionally, your account will be indirectly subject to the expenses of the underlying funds. The following example is intended to help you understand your ongoing costs of investing in the Fund and to compare these costs with similar costs of investing in other mutual funds. The example is based on an investment of $1,000 invested in the Fund on October 1, 2014 and held through March 31, 2015.
The first line of the table below provides information about actual account values and actual expenses. In order to estimate the expenses a shareholder paid during the period covered by this report, shareholders can divide their account value by $1,000 (for example, an $8,600 account value divided by $1,000 = 8.6) and then multiply the result by the number in the first line under the heading entitled "Expenses Paid During the Period."
The second line of the table below provides information about hypothetical account values and hypothetical expenses based on the Fund's actual expense ratio and an assumed rate of return of 5% per year before expenses, which is not the Fund’s actual return. The hypothetical account values and expenses may not be used to estimate the actual ending account balance or expenses paid by a shareholder for the period. Shareholders may use this information to compare the ongoing costs of investing in this Fund and other funds. To do so, compare this 5% hypothetical example with the 5% hypothetical examples that appear in other funds' shareholder reports.
Please note that the expenses shown in the table are meant to highlight your ongoing costs only and do not reflect any transactional costs, such as redemption fees or the charges assessed by Mutual Shareholder Services, LLC as described above and expenses of underlying funds. Therefore, the second line of the table is useful in comparing ongoing costs only, and will not help you determine the relative total costs of owning different funds. In addition, if these transactional costs were included, your costs would have been higher.
| | | | | | | Expenses Paid |
| | | Beginning | | Ending | | During the Period* |
| | | Account Value | | Account Value | | October 1, 2014 |
| | | October 1, 2014 | | March 31, 2015 | | to March 31, 2015 |
| |
| Actual | | $1,000.00 | | $1,022.45 | | $8.82 |
| |
| Hypothetical | | $1,000.00 | | $1,016.21 | | $8.80 |
| (5% annual return | | | | | | |
| before expenses) | | | | | | |
* Expenses are equal to the Fund’s annualized expense ratio of 1.75%, multiplied
by the average account value over the period, multiplied by 182/365 (to reflect
the one-half year period). |
2015 Annual Report 6
| NWM Momentum Fund |
| | | | Schedule of Investments |
| | | | March 31, 2015 |
| Shares | | | Fair Value | | % of Net Assets |
| EXCHANGE TRADED FUNDS | | | | | |
| 148,200 | iShares China Large-Cap ETF | $ | 6,580,080 | | | |
| 19,220 | iShares Nasdaq Biotechnology ETF | | 6,600,725 | | | |
| 52,273 | iShares Russell 2000 ETF | | 6,501,193 | | | |
| 76,654 | Vanguard REIT ETF | | 6,462,699 | | | |
| 29,473 | Vanguard Total Stock Market Index Fund ETF Shares | | 3,160,979 | | | |
| 53,676 | WisdomTree Japan Hedged Equity ETF | | 2,958,621 | | | |
| Total for Exchange Traded Funds (Cost - $32,005,760) | | 32,264,297 | | 98.37 | % |
| Other Assets in Excess of Liabilities | | 532,961 | | 1.63 | % |
| Net Assets | | $ | 32,797,258 | | 100.00 | % |
The accompanying notes are an integral part of these
financial statements. |
2015 Annual Report 7
| NWM Momentum Fund |
| |
| Statement of Assets and Liabilities | | | |
| March 31, 2015 | | | |
| |
| Assets: | | | |
| Investment Securities at Fair Value | $ | 32,264,297 | |
| (Cost $32,005,760) | | | |
| Cash | | 571,685 | |
| Receivable for Shareholder Purchases | | 9,421 | |
| Total Assets | | 32,845,403 | |
| Liabilities: | | | |
| Management Fees Payable | | 34,389 | |
| Service Fees Payable | | 13,756 | |
| Total Liabilities | | 48,145 | |
| Net Assets | $ | 32,797,258 | |
| |
| Net Assets Consist of: | | | |
| Paid In Capital | $ | 32,727,310 | |
| Accumulated Net Investment Income/(Loss) | | (5,691 | ) |
| Accumulated Realized Gain/(Loss) on Investments - Net | | (182,898 | ) |
| Unrealized Appreciation/(Depreciation) in Value of Investments | | | |
| Based on Identified Cost - Net | | 258,537 | |
| Net Assets, for 3,298,391 Shares Outstanding | $ | 32,797,258 | |
| (Unlimited shares authorized) | | | |
| Net Asset Value and Offering Price Per Share | | | |
| ($32,797,258/3,298,391 shares) | $ | 9.94 | |
| Redemption Price * ($9.94 x 0.98) (Note 2) | $ | 9.74 | |
| |
| Statement of Operations | | | |
| For the fiscal year ended March 31, 2015 | | | |
| |
| Investment Income: | | | |
| Dividends | $ | 917,397 | |
| Interest | | 8 | |
| Total Investment Income | | 917,405 | |
| Expenses: | | | |
| Management Fees (Note 4) | | 396,669 | |
| Service Fees (Note 4) | | 158,667 | |
| Total Expenses | | 555,336 | |
| |
| Net Investment Income/(Loss) | | 362,069 | |
| |
| Realized and Unrealized Gain/(Loss) on Investments: | | | |
| Realized Gain/(Loss) on Investments | | (182,898 | ) |
| Net Change in Unrealized Appreciation/(Depreciation) on Investments | | 258,537 | |
| Net Realized and Unrealized Gain/(Loss) on Investments | | 75,639 | |
| |
| Net Increase/(Decrease) in Net Assets from Operations | $ | 437,708 | |
* Reflects a 2% redemption fee if shares are redeemed within 90 days of purchase.
The accompanying notes are an integral part of these
financial statements. |
2015 Annual Report 8
| NWM Momentum Fund |
| |
| Statement of Changes in Net Assets | | | |
| | | 4/1/2014* | |
| | | to | |
| | | 3/31/2015 | |
| From Operations: | | | |
| Net Investment Income/(Loss) | $ | 362,069 | |
| Net Realized Gain/(Loss) on Investments | | (182,898 | ) |
| Change in Net Unrealized Appreciation/(Depreciation) | | 258,537 | |
| Increase/(Decrease) in Net Assets from Operations | | 437,708 | |
| From Distributions to Shareholders: | | | |
| Net Investment Income | | (367,760 | ) |
| Net Realized Gain from Security Transactions | | - | |
| Change in Net Assets from Distributions | | (367,760 | ) |
| From Capital Share Transactions: | | | |
| Proceeds From Sale of Shares | | 37,394,245 | |
| Proceeds From Redemption Fees (Note 2) | | - | |
| Shares Issued on Reinvestment of Dividends | | 367,760 | |
| Cost of Shares Redeemed | | (5,034,695 | ) |
| Net Increase/(Decrease) from Shareholder Activity | | 32,727,310 | |
| Net Increase/(Decrease) in Net Assets | | 32,797,258 | |
| Net Assets at Beginning of Period | | - | |
| Net Assets at End of Period (Including Accumulated Net Investment | | | |
| Income/(Loss) of ($5,691)) | $ | 32,797,258 | |
| Share Transactions: | | | |
| Issued | | 3,765,962 | |
| Reinvested | | 37,072 | |
| Redeemed | | (504,643 | ) |
| Net Increase in Shares | | 3,298,391 | |
| Shares Outstanding Beginning of Period | | - | |
| Shares Outstanding End of Period | | 3,298,391 | |
| |
| Financial Highlights | | | |
| Selected data for a share outstanding throughout the period: | | 4/1/2014* | |
| | | to | |
| | | 3/31/2015 | |
| Net Asset Value - | | | |
| Beginning of Period | $ | 10.00 | |
| Net Investment Income/(Loss) (a) (e) | | 0.11 | |
| Net Gain/(Loss) on Securities (b) | | | |
| (Realized and Unrealized) | | (0.07 | ) |
| Total from Investment Operations | | 0.04 | |
| Distributions (From Net Investment Income) | | (0.10 | ) |
| Distributions (From Realized Capital Gains) | | - | |
| Total Distributions | | (0.10 | ) |
| Proceeds from Redemption Fee (Note 2) | | - | |
| Net Asset Value - | | | |
| End of Period | $ | 9.94 | |
| Total Return (c) | | 0.40% | |
| Ratios/Supplemental Data | | | |
| Net Assets - End of Period (Thousands) | $ | 32,797 | |
| Ratio of Expenses to Average Net Assets (d) (e) | | 1.75% | |
| Ratio of Net Investment Income (Loss) to Average Net Assets (d) (e) | | 1.14% | |
| Portfolio Turnover Rate | | 1153.56% | |
* Commencement of Operations.
(a) Per share amounts were calculated using the average shares method.
(b) Realized and unrealized gains and losses per share in this caption are balancing amounts necessary to
reconcile the change in net asset value for the period and may not reconcile with the aggregate gains and
losses in the Statement of Operations due to share transactions for the period.
(c) Total return in the above table represents the rate that the investor would have earned or lost on an
investment in the Fund assuming reinvestment of dividends and distributions.
(d) These ratios exclude the impact of expenses of the underlying security holdings listed in the Schedule
of Investments.
(e) Recognition of net investment income/(loss) by the Fund is affected by the timing of the declaration of dividends
by the underlying security holdings listed on the Schedule of Investments. |
The accompanying notes are an integral part of these
financial statements. |
2015 Annual Report 9
NOTES TO THE FINANCIAL STATEMENTS
NWM MOMENTUM FUND
March 31, 2015
1.) ORGANIZATION
NWM Momentum Fund (the “Fund”) was organized as a non-diversified series of the PFS Funds (the “Trust”) on March 5, 2014. The Trust was established under the laws of Massachusetts by an Agreement and Declaration of Trust dated January 13, 2000. Prior to March 5, 2010, the Trust was named Wireless Fund. The Trust is registered as an open-end investment company under the Investment Company Act of 1940, as amended (the “1940 Act”). The Trust may offer an unlimited number of shares of beneficial interest in a number of separate series, each series representing a distinct fund with its own investment objectives and policies. As of March 31, 2015, there were nine series authorized by the Trust. The Fund commenced operations on April 1, 2014. The Fund's investment objective is to seek long-term capital appreciation. The investment adviser to the Fund is NWM Fund Group, LLC (the “Adviser”). Significant accounting policies of the Fund are presented below:
2.) SIGNIFICANT ACCOUNTING POLICIES
SECURITY VALUATION
All investments in securities are recorded at their estimated fair value, as described in Note 3.
SHARE VALUATION
The net asset value (the “NAV”) is generally calculated as of the close of trading on the New York Stock Exchange (normally 4:00 p.m. Eastern time) every day the Exchange is open. The NAV is calculated by taking the total value of the Fund’s assets, subtracting its liabilities, and then dividing by the total number of shares outstanding, rounded to the nearest cent. The offering price and redemption price per share is equal to the net asset value per share, except that shares of the Fund are subject to a redemption fee of 2% if redeemed within 90 days of purchase. During the fiscal year ended March 31, 2015, proceeds from redemption fees were $0.
FEDERAL INCOME TAXES
The Fund’s policy is to continue to comply with the requirements of the Internal Revenue Code that are applicable to regulated investment companies and to distribute all of its taxable income to shareholders. Therefore, no federal income tax provision is required. It is the Fund’s policy to distribute annually, prior to the end of the calendar year, dividends sufficient to satisfy excise tax requirements of the Internal Revenue Code. This Internal Revenue Code requirement may cause an excess of distributions over the book year-end accumulated income. In addition, it is the Fund’s policy to distribute annually, after the end of the fiscal year, any remaining net investment income and net realized capital gains.
The Fund recognizes the tax benefits of certain tax positions only where the position is “more likely than not” to be sustained assuming examination by tax authorities. Management has analyzed the Fund’s tax positions, and has concluded that no liability for unrecognized tax benefits should be recorded related to uncertain tax positions expected to be taken in the Fund’s initial tax return. The Fund identifies its major tax jurisdictions as U.S. Federal tax authorities; however, the Fund is not aware of any tax positions for which it is reasonably possible that the total amounts of unrecognized tax benefits will change materially in the next twelve months. The Fund recognizes interest and penalties, if any, related to unrecognized tax benefits as income tax expense in the Statement of Operations. During the fiscal year ended March 31, 2015, the Fund did not incur any interest or penalties.
DISTRIBUTIONS TO SHAREHOLDERS
Distributions to shareholders, which are determined in accordance with income tax regulations, are recorded on the ex-dividend date.
The treatment for financial reporting purposes of distributions made to shareholders during the year from net investment income or net realized capital gains may differ from their ultimate treatment for federal income tax purposes. These differences are caused primarily by differences in the timing of the recognition of certain components of income, expense, or realized capital gain for federal income tax purposes. Where such differences are permanent in nature, they are reclassified in the components of the net assets based on their ultimate characterization for federal income tax purposes. Any such reclassifications will have no effect on net assets, result of operations, or net asset value per share of the Fund.
2015 Annual Report 10
Notes to the Financial Statements - continued
USE OF ESTIMATES
The preparation of financial statements in conformity with accounting principles generally accepted in the United States (“GAAP”) requires management to make estimates and assumptions that affect the reported amounts of assets and liabilities and disclosure of contingent assets and liabilities at the date of the financial statements and the reported amounts of increases and decreases in net assets from operations during the reporting period. Actual results could differ from those estimates.
ORGANIZATIONAL & OFFERING EXPENSES
All costs incurred by the Fund in connection with the organization, offering and initial registration of the Fund, principally professional fees, were paid on behalf of the Fund by the Adviser and will not be borne by the Fund.
EXPENSES
Expenses incurred by the Trust that do not relate to a specific fund of the Trust are allocated to the individual funds based on each fund’s relative net assets or another appropriate basis.
OTHER
The Fund records security transactions based on a trade date. Dividend income is recognized on the ex-dividend date, and interest income is recognized on an accrual basis. Discounts and premiums on securities purchased are accreted and amortized over the lives of the respective securities. Withholding taxes on foreign dividends have been provided for in accordance with the Fund’s understanding of the applicable country’s tax rules and rates.
3.) INVESTMENT SECURITIES VALUATION
The Fund utilizes various methods to measure the fair value of most of its investments on a recurring basis. GAAP establishes a hierarchy that prioritizes inputs to valuation methods. The three levels of inputs are:
Level 1 - Unadjusted quoted prices in active markets for identical assets or liabilities that the Fund has the ability to access.
Level 2 - Inputs other than quoted prices included in level 1 that are observable for the asset or liability, either directly or indirectly. These inputs may include quoted prices for the identical instrument on an inactive market, prices for similar instruments, interest rates, prepayment speeds, credit risk, yield curves, default rates and similar data.
Level 3 - Unobservable inputs for the asset or liability, to the extent relevant observable inputs are not available, representing the Fund’s own assumptions about the assumptions a market participant would use in valuing the asset or liability, and would be based on the best information available.
The availability of observable inputs can vary from security to security and is affected by a wide variety of factors, including, for example, the type of security, whether the security is new and not yet established in the marketplace, the liquidity of markets, and other characteristics particular to the security. To the extent that valuation is based on models or inputs that are less observable or unobservable in the market, the determination of fair value requires more judgment. Accordingly, the degree of judgment exercised in determining fair value is greatest for instruments categorized in level 3.
The inputs used to measure fair value may fall into different levels of the fair value hierarchy. In such cases, for disclosure purposes, the level in the fair value hierarchy within which the fair value measurement falls in its entirety, is determined based on the lowest level input that is significant to the fair value measurement in its entirety.
FAIR VALUE MEASUREMENTS
A description of the valuation techniques applied to the Fund’s major categories of assets measured at fair value on a recurring basis follows:
Equity securities (exchange traded funds). Equity securities that are traded on any exchange or on the NASDAQ over-the-counter market are valued at the last quoted sale price. Lacking a last sale price, a long security is valued at its last bid price except when, in the Adviser's opinion, the last bid price does not accurately reflect the current value of the long security. To the extent these securities are actively traded and valuation adjustments are not applied, they are classified in
2015 Annual Report 11
Notes to the Financial Statements - continued
level 1 of the fair value hierarchy. When market quotations are not readily available, when the Adviser determines the last bid price does not accurately reflect the current value or when restricted securities are being valued, such securities are valued as determined in good faith by the Adviser, in conformity with guidelines adopted by and subject to review of the Board of Trustees (the “Trustees”) and are categorized in level 2 or level 3, when appropriate.
In accordance with the Trust's good faith pricing guidelines, the Adviser is required to consider all appropriate factors relevant to the value of securities for which it has determined other pricing sources are not available or reliable as described above. There is no single standard for determining fair value, since fair value depends upon the circumstances of each individual case. As a general principle, the current fair value of an issue of securities being valued by the Adviser would appear to be the amount which the owner might reasonably expect to receive for them upon their current sale. Methods which are in accordance with this principle may, for example, be based on (i) a multiple of earnings; (ii) a discount from market of a similar freely traded security (including a derivative security or a basket of securities traded on other markets, exchanges or among dealers); or (iii) yield to maturity with respect to debt issues, or a combination of these and other methods.
The following table summarizes the inputs used to value the Fund’s assets measured at fair value as of March 31, 2015:
| Valuation Inputs of Assets | | Level 1 | | Level 2 | | Level 3 | | Total |
| Exchange Traded Funds | | $32,264,297 | | $0 | | $0 | | $32,264,297 |
| Total | | $32,264,297 | | $0 | | $0 | | $32,264,297 |
The Fund did not hold any Level 3 assets during the fiscal year ended March 31, 2015. There were no transfers into or out of level 1 and level 2 during the fiscal year ended March 31, 2015. It is the Fund’s policy to consider transfers into or out of level 1 and level 2 as of the end of the reporting period.
The Fund did not invest in derivative instruments during the fiscal year ended March 31, 2015.
4.) INVESTMENT ADVISORY AGREEMENT AND SERVICES AGREEMENT
The Fund has entered into an investment advisory agreement (“Management Agreement”) with the Adviser. The Adviser manages the investment portfolio of the Fund, subject to policies adopted by the Trust's Board of Trustees, and, at its own expense and without reimbursement from the Trust, furnishes office space and all necessary office facilities, equipment and executive personnel necessary for managing the Fund. For its services the Adviser receives an investment management fee equal to 1.25% of the Fund's average daily net assets up to $100 million, 1.10% of the Fund's average daily net assets between $100 million and $150 million, 1.00% of the Fund's average daily net assets between $150 million and $200 million and 0.90% of the Fund's average daily net assets in excess of $200 million.
Under the terms of the Services Agreement between the Trust and the Adviser (the "Services Agreement"), the Adviser renders administrative and supervisory services to the Fund, provides the services of a chief compliance officer and assumes and pays all ordinary expenses of the Fund, excluding management fees, brokerage fees and commissions, 12b-1 fees (If adopted), taxes, borrowing costs (such as (a) interest and (b) dividend expenses on securities sold short), ADR fees, fees and expenses of acquired funds, and extraordinary or non-recurring expenses. For its services, the Adviser receives a service fee equal to 0.50% of the average daily net assets of the Fund.
For the fiscal year ended March 31, 2015, the Adviser earned management fees totaling $396,669, of which $34,389 was due to the Adviser at March 31, 2015. For the same period, the Adviser earned service fees of $158,667, of which $13,756 was due to the Adviser at March 31, 2015.
5.) RELATED PARTY TRANSACTIONS
Jeffrey R. Provence of Premier Fund Solutions, Inc. (the “Administrator”) also serves as trustee/officer of the Fund. This individual receives benefits from the Administrator resulting from administration fees paid to the Administrator of the Fund by the Adviser.
The Trustees who are not interested persons of the Fund were paid a total of $3,000 in Trustees’ fees for the fiscal year ended March 31, 2015 by the Adviser.
2015 Annual Report 12
Notes to the Financial Statements - continued
6.) CAPITAL SHARES
The Trust is authorized to issue an unlimited number of shares. Paid in capital at March 31, 2015 was $32,727,310, representing 3,298,391 shares outstanding.
7.) PURCHASES AND SALES OF SECURITIES
For the fiscal year ended March 31, 2015, purchases and sales of investment securities other than U.S. Government obligations and short-term investments aggregated $377,388,331 and $345,199,672, respectively. Purchases and sales of U.S. Government obligations aggregated $0 and $0, respectively.
8.) CONTROL OWNERSHIP
The beneficial ownership, either directly or indirectly, of more than 25% of the voting securities of a fund creates a presumption of control of the Fund, under Section 2(a)(9) of the Investment Company Act of 1940. As of March 31, 2015, Ameritrade Inc. located at P.O. Box 2226, Omaha, Nebraska, for the benefit of its customers, held, in aggregate, 99.65% of the shares in the Fund. The Trust does not know whether the foregoing entity or any of the underlying beneficial holders owned or controlled 25% or more of the voting securities of the Fund.
9.) TAX MATTERS
For Federal income tax purposes, the cost of securities owned at March 31, 2015 was $32,073,990.
At March 31, 2015, the composition of gross unrealized appreciation (the excess of value over tax cost) and depreciation (the excess of tax cost over value) of investments on a tax basis was as follows:
| | Appreciation | | (Depreciation) | | Net Appreciation/(Depreciation) |
| | $364,386 | | ($174,079) | | $190,307 |
For the fiscal year ended March 31, 2015, there was a distribution from ordinary income of $0.10022 per share paid on December 29, 2014 to the shareholders of record on December 26, 2014.
The tax character of distributions was as follows:
| | | Fiscal Year Ended |
| | | March 31, 2015 |
| Ordinary Income . | | $ 367,760 |
| Long-Term Capital Gain | | 0 |
| | | $ 367,760 |
As of March 31, 2015, the components of distributable earnings/(accumulated losses) on a tax basis were as follows:
| Undistributed ordinary income/(accumulated losses) | $ | 1,811 | |
| Undistributed long-term capital gain/(accumulated losses) | | (114,668 | ) |
| Unrealized appreciation/(depreciation) | | 190,307 | |
| | $ | 77,450 | |
As of March 31, 2015, differences between book and tax basis primarily consisted of the deferral of wash sales and late-year ordinary losses. Deferred late-year ordinary losses totaled $7,502.
10.) LOSS CARRYFORWARDS
As of March 31, 2015, the Fund had available for federal tax purposes an unused capital loss car-ryforward of $114,668, which may offset future short-term gains and has no expiration. To the extent that these capital loss carryforwards are used to offset future capital gains, it is probable that the amount, which is offset, will not be distributed to shareholders.
2015 Annual Report 13
This page was intentionally left blank.
2015 Annual Report 14
This page was intentionally left blank.
2015 Annual Report 15
Cohen Fund Audit Services, Ltd.
1350 Euclid Avenue, Ste 800
Cleveland, Ohio 44115 www.cohenfund.com | 216.649.1700
216.579.0111 fax |
REPORT OF INDEPENDENT REGISTERED PUBLIC ACCOUNTING FIRM
To the Shareholders of NWM Momentum Fund
and Board of Trustees of PFS Funds
We have audited the accompanying statement of assets and liabilities, including the schedule of investments, of NWM Momentum Fund (the "Fund"), a series of PFS Funds, as of March 31, 2015, and the related statements of operations and changes in net assets and the financial highlights for the year then ended. These financial statements and financial highlights are the responsibility of the Fund's management. Our responsibility is to express an opinion on these financial statements and financial highlights based on our audit.
We conducted our audit in accordance with the standards of the Public Company Accounting Oversight Board (United States). Those standards require that we plan and perform the audit to obtain reasonable assurance about whether the financial statements and financial highlights are free of material misstatement. An audit includes examining, on a test basis, evidence supporting the amounts and disclosures in the financial statements. Our procedures included confirmation of securities owned as of March 31, 2015, by correspondence with the custodian. An audit also includes assessing the accounting principles used and significant estimates made by management, as well as evaluating the overall financial statement presentation. We believe that our audit provides a reasonable basis for our opinion.
In our opinion, the financial statements and financial highlights referred to above present fairly, in all material respects, the financial position of NWM Momentum Fund as of March 31, 2015, the results of its operations, the changes in its net assets, and the financial highlights for the year then ended, in conformity with accounting principles generally accepted in the United States of America.

COHEN FUND AUDIT SERVICES, LTD.
Cleveland, Ohio
May 28, 2015
2015 Annual Report 16
Trustees and Officers
(Unaudited)
The Board of Trustees supervises the business activities of the Trust. The names of the Trustees and executive officers of the Trust are shown below. For more information regarding the Trustees, please refer to the Statement of Additional Information, which is available upon request by calling 1-888-331-9609. Each Trustee serves until the Trustee sooner dies, resigns, retires, or is removed.
The Trustees and Officers of the Trust and their principal business activities during the past five years are:
Interested Trustees and Officers
| | | | | Number of | |
| | | | Principal | Portfolios In | Other |
| Name, | Position(s) | Term of Office | Occupation(s) | Fund | Directorships |
| Address(1), | Held With | and Length of | During | Complex | Held By |
| and Year of Birth | the Trust | Time Served | Past 5 Years | Overseen By | Trustee |
| | | | | Trustee | |
| |
| Ross C. Provence, | President | Indefinite Term; | General Partner and Portfolio | N/A | N/A |
| Year of Birth: 1938 | | Since 2000 | Manager for Value Trend Capital | | |
| | | | Management, LP (1995 to current). | | |
| | | | Estate planning attorney (1963 to | | |
| current). |
| |
| Jeffrey R. Provence(2), | Trustee, | Indefinite Term; | CEO, Premier Fund Solutions, Inc. | 9 | Blue Chip |
| Year of Birth: 1969 | Secretary | Since 2000 | (2001 to current). General Partner | | Investor Funds |
| | and | | and Portfolio Manager for Value | | |
| | Treasurer | | Trend Capital Management, LP | | |
| | | | (1995 to current). | | |
| |
| Julian G. Winters, | Chief | Chief | Managing Member, Watermark | N/A | N/A |
| Year of Birth: 1968 | Compliance | Compliance | Solutions LLC (investment compli- | | |
| | Officer | Officer Since | ance and consulting) since March | | |
| | | 2010 | 2007. | | |
(1) The address of each trustee and officer is c/o PFS Funds, 1939 Friendship Drive, Suite C, El Cajon, California 92020.
(2) Jeffrey R. Provence is considered an "interested person" as defined in Section 2(a)(19) of the Investment Company Act of 1940 by virtue of his position with the Trust.
Independent Trustees
| | | | | Number of | |
| | | | Principal | Portfolios In | Other |
| Name, | Position | Term of Office | Occupation(s) | Fund | Directorships |
| Address(1), | Held With | and Length of | During | Complex | Held By |
| and Year of Birth | the Trust | Time Served | Past 5 Years | Overseen By | Trustee |
| | | | | Trustee | |
| |
| Thomas H. Addis III, | Independent | Indefinite Term; | Executive Director/CEO, Southern | 9 | None |
| Year of Birth: 1945 | Trustee | Since 2000 | California PGA (2006 to current). | | |
| |
| Allen C. Brown, | Independent | Indefinite Term; | Co-owner of Stebleton & Brown | 9 | Blue Chip |
| Year of Birth: 1943 | Trustee | Since 2010 | (1994 to Current). Estate planning | | Investor Funds |
| | | | and business attorney (1970 to cur- | | |
| rent). |
| |
| George Cossolias, CPA, | Independent | Indefinite Term; | Partner of CWDL, CPAs (February 1, | 9 | Blue Chip |
| Year of Birth: 1935 | Trustee | Since 2000 | 2014 to current). Owner of George | | Investor Funds |
| | | | Cossolias & Company, CPAs (1972 | | |
| | | | to January 31, 2014). President of | | |
| | | | Lubrication Specialists, Inc. (1996 to | | |
| current) |
(1) The address of each trustee and officer is c/o PFS Funds, 1939 Friendship Drive, Suite C, El Cajon, California 92020.
2015 Annual Report 17
Investment Adviser
NWM Fund Group, LLC
Legal Counsel
The Law Offices of John H. Lively & Associates, Inc.
A member firm of The 1940 Act Law GroupTM
Custodian
US Bank, N.A.
Distributor
Rafferty Capital Markets, LLC
Dividend Paying Agent,
Shareholders' Servicing Agent,
Transfer Agent
Mutual Shareholder Services, LLC
Fund Administrator
Premier Fund Solutions, Inc.
Independent Registered Public Accounting Firm
Cohen Fund Audit Services, Ltd. |
This report is provided for the general information of the shareholders of the NWM
Momentum Fund. This report is not intended for distribution to prospective investors in
the Fund, unless preceded or accompanied by an effective prospectus. |
NWM Momentum Fund
www.nwmfund.com
1-888-331-9609 |
Item 2. Code of Ethics.
The registrant has adopted a code of ethics that applies to the registrant’s principal executive officer and the principal financial officer. The registrant has not made any amendments to its code of ethics during the covered period. The registrant has not granted any waivers from any provisions of the code of ethics during the covered period. A copy of the registrant’s Code of Ethics is filed herewith.
Item 3. Audit Committee Financial Expert.
The registrant’s Board of Trustees has determined that George Cossolias is an audit committee finical expert. Mr. Cossolias is independent for purposes of this Item 3.
Item 4. Principal Accountant Fees and Services.
(a-d) The following table details the aggregate fees billed for each of the last two fiscal years for audit fees, audit-related fees, tax fees and other fees by the principal accountant to the registrant. The principal accountant has provided no services to the adviser or any entity controlled by, or under common control with the adviser that provides ongoing services to the registrant.
| | | FYE 3/31/15 |
| Audit Fees | | $13,000 |
| Audit-Related Fees | | $0 |
| Tax Fees | | $2,500 |
| All Other Fees | | $600 |
Nature of Tax Fees: preparation of Excise Tax Statement and 1120 RIC.
Nature of All Other Fees: Review of Semi-Annual Report.
(e) (1) The audit committee approves all audit and non-audit related services and, therefore, has not adopted pre-approval policies and procedures described in paragraph (c)(7) of Rule 2-01 of Regulation S-X.
(e) (2) None of the services described in paragraph (b) through (d) of this Item were approved by the audit committee pursuant to paragraph (c)(7)(i)(C) of Rule 2-01 of Regulation S-X.
(f) All of the principal accountant’s hours spent on auditing the registrant’s financial statements were attributed to work performed by full-time permanent employees of the principal accountant.
(g) The following table indicates the aggregate non-audit fees billed by the registrant’s principal accountant for services to the registrant , the registrant’s investment adviser (not sub-adviser), and any entity controlling, controlled by, or under common control with the adviser that provides ongoing services to the registrant, for the last two years.
| Non-Audit Fees | | FYE 3/31/15 |
| Registrant | | $3,100 |
| Registrant’s Investment Adviser | | $0 |
(h) The principal accountant provided no services to the investment adviser or any entity controlling, controlled by, or under common control with the adviser that provides ongoing services to the registrant.
Item 5. Audit Committee of Listed Companies. Not applicable.
Item 6. Schedule of Investments. Schedule filed with Item 1.
Item 7. Disclosure of Proxy Voting Policies and Procedures for Closed-End Management Investment Companies. Not applicable.
Item 8. Portfolio Managers of Closed End Management Investment Companies. Not applicable.
Item 9. Purchases of Equity Securities by Closed-End Management Investment Companies and Affiliated Purchasers. Not applicable.
Item 10. Submission of Matters to a Vote of Security Holders.
The registrant has not adopted procedures by which shareholders may recommend nominees to the registrant’s board of trustees.
Item 11. Controls and Procedures.
(a) The registrant’s president and chief financial officer concluded that the disclosure controls and procedures (as defined in Rule 30a-3(c) under the Investment Company Act of 1940 (the “Act”)) were effective as of a date within 90 days of the filing date of this report, based on the evaluation of these controls and procedures required by Rule 30a-3(b) under the Act.
(b) There were no changes in the registrant’s internal control over financial reporting (as defined in Rule 30a-3(d) under the Act) that occurred during the registrant’s second fiscal quarter of the period covered by this report that have materially affected, or are reasonably likely to materially affect, the registrant’s internal control over financial reporting.
Item 12. Exhibits.
(a)(1) Code of Ethics. Filed herewith.
(a)(2) Certifications pursuant to Section 302 of the Sarbanes-Oxley Act of 2002. Filed herewith.
(a)(3) Not applicable.
(b) Certification pursuant to Section 906 Certification of the Sarbanes-Oxley Act of 2002. Filed herewith.
SIGNATURES
Pursuant to the requirements of the Securities Exchange Act of 1934 and the Investment Company Act of 1940, the registrant has duly caused this report to be signed on its behalf by the undersigned, thereunto duly authorized.
| | By: /s/Ross C. Provence
Ross C. Provence
President |
Pursuant to the requirements of the Securities Exchange Act of 1934 and the Investment Company Act of 1940, this report has been signed below by the following persons on behalf of the registrant and in the capacities and on the dates indicated.
| | By: /s/Ross C. Provence
Ross C. Provence
President |
| | By: /s/Jeffrey R. Provence
Jeffrey R. Provence
Chief Financial Officer |