UNITED STATES
SECURITIES AND EXCHANGE COMMISSION
WASHINGTON, D.C. 20549
FORM N-CSR
CERTIFIED SHAREHOLDER REPORT OF REGISTERED MANAGEMENT
INVESTMENT COMPANIES
Investment Company Act file number 811-09781
PFS FUNDS
(Exact name of registrant as specified in charter)
| 1939 Friendship Drive, Suite C | |
| El Cajon, CA | 92020 |
| (Address of principal executive offices) | (Zip code) |
CT Corporation System
155 Federal St., Suite 700,
Boston, MA 02110
(Name and address of agent for service)
Registrant's telephone number, including area code: (619) 588-9700
Date of fiscal year end: November 30
Date of reporting period: November 30, 2014
Item 1. Reports to Stockholders.
Christopher Weil & Company Core Investment Fund
Ticker CWCFX
Christopher Weil & Company Global Dividend Fund
Ticker CWGDX
For Investors Seeking Long-Term Capital Appreciation
ANNUAL REPORT
November 30, 2014
| Table of Contents | |
| |
| |
| |
| CHRISTOPHER WEIL & COMPANY FUNDS | |
| Letters to Shareholders | 1 |
| Sector Allocation | 7 |
| Performance Information | 8 |
| Schedules of Investments | 10 |
| Statements of Assets and Liabilities | 14 |
| Statements of Operations | 14 |
| Statements of Changes in Net Assets | 15 |
| Financial Highlights | 16 |
| |
| NOTES TO FINANCIAL STATEMENTS | 17 |
| |
| DISCLOSURE OF EXPENSES | 24 |
| |
| ADDITIONAL INFORMATION | 25 |
| |
| REPORT OF INDEPENDENT REGISTERED PUBLIC ACCOUNTING FIRM | 26 |
| |
| TRUSTEES AND OFFICERS | 27 |
Christopher Weil & Company Core Investment Fund
Management's Discussion of Fund Performance
Investment Summary
The Christopher Weil & Company Core Investment Fund (the "Fund") returned 13.82% for the fiscal year ended November 30, 2014, compared to 16.86% for the S&P 500® index. We started the period with 30 equity positions and ended the period with 29 positions. 11 positions were fully liquidated while 10 new positions were purchased with the proceeds. We added new positions to the industrial, financial, materials, technology and consumer discretionary sectors, while we reduced the number of positions in healthcare, technology and consumer staples. Additionally, we purchased put options in December and January, which provided a slight positive impact on performance.
The Fund's performance was negatively affected by exposure to industrial and consumer discretionary stocks. In the industrial sector, Chicago Bridge and Iron (CBI) was the worst performing asset in the Fund. Exposure to the consumer discretionary sector through TripAdvisor (TRIP), Five Below (FIVE) and LKQ Corporation (LKQ) also dragged on the Fund's performance. On the positive side, exposure to the consumer discretionary stock Under Armour (UA), Illumina Inc. (ILMN), Apple (APPL) and Facebook (FB) in the technology sector and Spirit Airlines (SAVE) in the industrial sector helped the Fund's performance.
During the course of the year, the Fund used put options to hedge market declines. Overall, the options had a slight positive impact on performance.
Themes of the last year
The past year saw a strengthening of the U.S. economy. Unemployment declined to 5.7% although wages have barely moved over the past few years. GDP growth at 3.5% in the third quarter further confirmed the recovery in U.S. business. Yet, in spite of increased U.S. output, few signs of inflation appeared. Gasoline prices followed a steep decline in the price of oil as increased production of U.S. crude created more supply. Concerned that inflation might begin to appear over coming years, the Fed tapered down its purchases of treasuries and mortgages while continuing to reinvest interest payments.
Other parts of the world have been less sanguine. Europe continued with another period of stagnation with some countries entering into a third recession in just over five years. Even Germany, the powerhouse of the European economy is teetering on the brink of recession. China's roaring economy also began to show signs of a slowdown, particularly in the housing market. Japan's economy also fell back into a quadruple dip recession despite the efforts of "Abenomics."
As far as the markets, the S&P 500® Index continued on its inexorable upward march despite a significant, but brief, drop in October. U.S. stocks notably outperformed compared with global indices. Bond markets held up as interest rates stayed low, but returns were modest due to those low rates. Despite a brief spike in October, volatility as measured by the VIX Index remained well below its historical average.
Investment Strategy
Currently, we intend to target a portfolio that consists of approximately 30 positions, and we aim for each holding to have a weighting of between 2.5% and 4% of the net asset value of the Fund. As the economic and investment climate changes we may increase or decrease our target number of positions. We take a bottom up approach, finding companies in various sectors that have strong revenue growth and strong balance sheets, avoiding the most volatile issues. Technical analysis helps in choosing entry and exit points. Companies represent most major industry sectors, but we have, in practice, generally, over weighted technology and consumer discretionary while underweighting financials, energy, utilities, and telecoms.
While we look to macro trends for guidance, note that our methodology is fundamentally bottoms up. We rigorously screen the investable universe for stocks that have strong balance sheets and income statements along with positive track records and likely potential for growth. The search for good value remains a top priority as we believe that even a great company can trade for too high a price and a mediocre one can trade well below its intrinsic value. We look for stocks that will outperform over the next few years and mostly shun short term plays, maintaining a mix of stocks of varied sectors, market capitalization, and anticipated volatility.
Investment Summary
As stocks have risen to record highs over the past few months and stocks are generally trading near historic valuations. With bond yields for both investment grade and high yield still low, the equity risk to reward ratio continues to be favorable for investors who can tolerate short to medium term volatili-
2014 Annual Report 1
ty. Under these circumstances, the bull market could continue for a few more years before overvalu-ation sets in. We continue to believe that well managed companies will lead their industries, take market share, and grow earnings. Therefore, investors in well run companies should continue to profit over the longer term. We continue to buy companies we hope will deliver outsized positive returns, reserving the option to employ hedging strategies to weather more volatile times.
Christopher Weil, Chairman & John Wells, President/CEO
Christopher Weil & Company, Inc., Investment Advisor
Christopher Weil & Company Global Dividend Fund
Management's Discussion of Fund Performance
The Christopher Weil & Company Global Dividend Fund (the "Fund") returned 5.07% for the fiscal year ended November 30, 2014, compared to 8.04% for the MSCI All Country World Index (ACWI). As of November 30, 2014, the Fund had net assets of $37.2 million. As a result of continued solid equity performance, the MSCI ACWI was trading at 16.5x earnings, MSCI EAFE at 16x earnings, while the S&P 500® Index traded at 18.2x, and the Dow Jones Euro at 22.3x as of the end of the Fund's fiscal year end.
The Market Commentary
For the 1-year period ended November 30, 2014, the Dow Jones and S&P 500® Index returned 13.4% and 16.9% respectively. The MSCI EAFE, an international index, was down 0.02% . After a significant run-up in 2013, the U.S. markets cooled off in January; inclement weather on the East Coast and mediocre economic data left the first quarter of 2014 feeling sluggish. This soon was overtaken by positive upticks of economic recovery for the second and third quarters as U.S. employers increased hiring. While the U.S. economy showed signs of stability, there were persistent signs of underemployment (workers settling for part-time jobs when they can't find full-time employment).
In a sign of nascent improving economic conditions, the U.S. federal budget deficit decreased in November, helped by increased tax receipts according to Treasury Department data. Although the expectations for November were a $72 billion deficit, the actual figure came in at $56.8 billion.
The start of 2014 was also highlighted by the exit of Ben Bernanke as Chairman of the Federal Reserve. He will be remembered for steering Wall Street and Main Street away from a financial melt-down in 2008 with aggressive and unconventional monetary policies. Bernanke's replacement, Janet Yellen, was welcomed as Fed Chairwoman and stated in the Fed's January minutes that she would continue to pare bond purchases. However, in the FOMC meeting on March 20, 2014, Yellen spooked the market by giving a specific timetable on interest-rate hikes that will follow tapering. This resulted in a significant sell-off. The sell-off reflected investor anticipation of two things: continued tapering and, eventually, interest rate hikes.
The U.S. dollar approached a nine-year high as the economy continued to improve while other nations struggle. This has provided an appealing option over the currencies of a majority of other large nations. The U.S. dollar gained traction against major currencies for the year, but significantly during the third quarter. Against the U.S. dollar the Euro fell 5.3%; the UK Pound declined 5%, while the Yen dropped 11%. The Aussie Dollar plummeted 9%, most all of it during the month of September.
A major news item of 2014 was the drop of crude oil prices. Crude closed 2013 at $93.60 and in 2014 traded in a range from a high of $110.73 in June to a low of $67.85 at the end of November. The 2014 price drop was primarily due to a combination of increasing supplies from U.S. and Canadian shale production, as well as lowered demand in China. While the sharp drop in oil prices has significant ramifications for the global economy, specifically for the U.S. market, it reduces the everyday person's fuel costs and may potentially increase consumption.
Europe
The recovery of the Eurozone gained traction early in 2014, however the drop in oil prices lessened the strength of the recovery as the year-end approached. Positive developments early in 2014 included economic growth in Spain and a steady trickle of positive data in Greece and Italy. The Bank of Spain stressed that forecasted GDP growth of 1.0 to 1.7% will not be enough to significantly improve the 26% unemployment rate, though public deficits have begun to stabilize at a reasonable 6.6% of GDP. On a Euro-wide basis, GDP growth has been slow and mixed among the countries in the Eurozone. Unemployment continues to hover around a record 12% for the year and is a major danger to the strength of the European economy.
2014 Annual Report 2
Markets in Europe were further distracted this year by political theater as Vladimir Putin's Russia forcefully claimed control of the Crimean region of Ukraine in mid-March. While Putin received praise for the $50 billion Sochi Olympics in January, he ultimately lost any goodwill garnered and subjected his country to international disapproval. Uncertainty pertaining to UN sanctions and the potential for violent conflict rocked the Russian market. The Russian economy with more than 75% of its exports derived from oil and gas has seen significant drop in its budget revenues as oil prices continue to slide. The Russian Ruble slid 44% against the US Dollar for the period. The $600 billion Russian banks and companies owes to foreign creditors, along with sanctions imposed on these same institutions have escalated concerns of future access to international capital markets. The Russian economy has dropped to recessionary levels even after Putin raised interest rates to 17% in an attempt to support a falling Ruble.
While the U.K. market started out strong as the London FTSE index gained 15.6% for the six-month fiscal period ending May 31, 2014, oil prices have placed downward pressure on the market throughout the end of the year. The FTSE is energy heavy and is particularly vulnerable to oil price volatility.
Asia
Markets across Asia experienced a small decline, but overall withstood the period to remain only slightly negative. The Hang Seng Index had a marginal increase of 0.4%, while the Nikkei Index rose 11.5% . The China Shenzhen Composite Index saw significant returns compared to other markets as it advanced 30.4% at fiscal year-end.
Asian markets experienced downward pressure during Q1 2014 due mainly to numerous investor concerns with China. Chinese issues ranging from dangerous levels of credit supply, to government reforms curbing manufacturing activity, to slowing GDP growth all added to investors' worries. Among these concerns, default risks, in particular, spooked investors as a solar company and a major real estate developer defaulted on their debts this year. These defaults have drawn more attention to China's "shadow-banking" industry. With the Chinese economy threatening to slow (relatively of course), questions begin to arise concerning the potential of stimulus from the Chinese government. In April, China announced it would approve a series of "mini-stimuli" to boost the lagging Chinese economy. These stimuli, funded by loans from bond markets, differ from China's stimulus package of 2008, which relied on loans from local governments.
On November 27, China's stock market capitalization overtook Japan's stock market, making it the second largest stock market in the world. In 2014, the capitalization of the Chinese stock market increased by 33% to $4.48 trillion. In contrast, the Japanese stock market declined 3.2% to $4.46 trillion. The Shanghai Composite Index has climbed three times as much as Tokyo's Topix this year. The American stock market continues to be the world leader with $24.4 trillion market capitalization.
The expected 2014 sales tax hike in Japan hurt GDP growth for the third quarter, but overall the market seems to have accepted it pretty well. A Bank of Japan survey showed business sentiment as slightly deteriorated in overall expectations among manufacturers. More than two-thirds of the large and medium sized companies surveyed said they viewed the outlook as less than favorable. In April, Japan's economy slipped into a recession, forcing Abe to delay a proposed second tax hike in hopes of avoiding further disruption to growth. The Bank of Japan announced it will continue to monitor its policy easing stance until price stability is achieved. Most experts see this price stability as a target inflation rate of 2%.
South America
Since mid-2013, Brazil has seen economic weakness and slower-than-expected GDP growth, which has only been exacerbated by the broader sell-off in emerging markets this year. Tight monetary policy and weakness in China have contributed additional uncertainty, as China represents more than 15% of Brazil's exports. The World Cup alone was not enough to sustain economic development. Further, stagnation in China could significantly impact Brazil's GDP. Continued political uncertainty resulted in a downgrade of Brazil's credit to one level above a 'junk' designation (BBB-) by Standard & Poors. Moving forward, as the U.S. Fed continues to taper bond purchases, a decrease in the supply of 'cheap' money could continue to expand an already significant growth problem in Brazil and the South American economy as a whole.
Brazil saw a drop off in the 3Q with the end of the World Cup. The MSCI Brazil fell 7.4% during the fiscal year, its worst drop in three years. The market for iron ore, one of Brazil's main exports, has slowed significantly, particularly because of China's decreased demand. Since China constitutes two-thirds of the world's iron ore demand, the need for ore in China dictates the normal market price. Experts warn that the market for iron ore will not improve in the near future. Inevitably, this will impact the health of Brazil's economy moving forward.
2014 Annual Report 3
In Mexico, President Enrique Pena Nieto made good on his nationwide push for renewable energy by ending the monopoly status of the Petroleos Mexicanos oil company and paving the way for an energy trading market and renewable power. The abolishment of this monopoly is widely expected to reduce energy costs and to have a far reaching impact on Mexico's economy.
Investment Strategy
Markets across the globe were affected by falling oil prices as the shale revolution continued in the U.S. and Canada, increasing overall global supply. Oil prices peaked in June at $110 per barrel, but have seen a dramatic drop to sub $60 prices not seen since 2009. Oil prices have experienced significant declines creating downward pressure on the stock price of our oil holdings. We believe that current oil price is not sustainable in the long-run. We believe we are well positioned with our investments once normal market conditions emerge and feel strongly that our value investment philosophy will reward patient investors.
Given the current low bond yield environment, combined with the retiring baby-boomer generation, we believe global dividends will play a key role in investors' portfolios going forward. Investing outside of the United States allows investors to access a large universe of stocks. Furthermore, investing in dividend paying stocks has many benefits. Not only do dividends provide income, dividend paying stocks generally have demonstrated that they have the potential to retain their value better than other stocks during downturns as investors flock to them to seek attractive yield. In fact, for the last 80 years, dividends accounted for roughly 45% of the S&P 500's total return.
We have assembled a diversified portfolio of what we consider compelling investments that are trading below our estimate of their intrinsic value while paying healthy dividends. We remain confident in the long-run outlook for the Fund. Our assessment of top two contributors and the bottom two detractors from the Fund's 12-month performance follows.
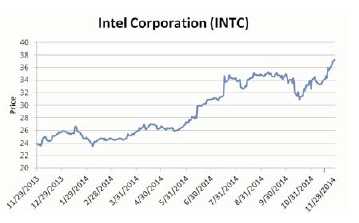
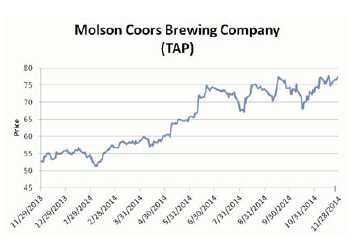
Top Two Contributors: Intel Corp and Molson Coors Brewing Company
Intel Corp. and Molson Coors Brewing Company helped the Fund's results this year.
Intel is the dominant force in the roughly $30 billion computer microprocessor market, in which it holds long-term advantages over smaller rival Advanced Micro Devices. Intel has benefited tremendously from the proliferation of personal computers in the past few decades and has long held the lead in microprocessor technology and performance. Intel boosted its dividend this year by 6%, to a 2.7% yield. During the period we increased our overall allocation. Intel Corp. ended up 61.2% within the period.
Molson Coors (TAP) has solid brand names (e.g. Coors and Miller) in its primary markets. The company is the second-largest brewer in Canada and the United States (the latter through its Miller Coors JV with SABMiller), trailing only Anheuser-Busch InBev (ABI) in both markets. TAP is also a strong participant in Western and Central Europe with about 21% market share. TAP gained 50.3% for the reporting period. Currently, there is a push for consolidation within the beer market. ABI is considering a takeover of SABMiller. If ABI were to bid for SAB, then its market share leadership in the U.S. would require it to divest SAB's 58% stake in Miller Coors. This deal would be transformational for TAP, as it would notably increase their exposure to the world's
2014 Annual Report 4
most profitable beer market. To take some profit, we pared this position slightly due to market appreciation, while still leaving an approximate 2% allocation.
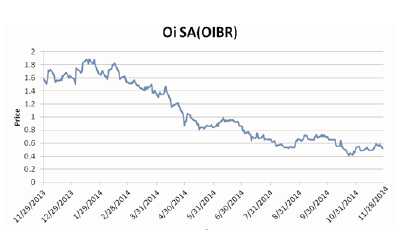
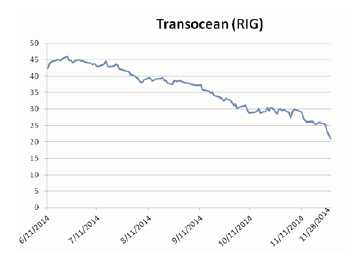
Bottom Two Detractors: OI SA and Transocean Limited both hurt results during the period
OI SA ADR (OI) is a telecommunication service providing company in Brazil and owns the country's largest fixed line network. The company offers telecommunications services that include fixed-line & mobile telecommunication services, data transmission services, ISP and other services. Nearly 70% of the firm's revenues come from wire-line business, but that segment is in decline due to the fixed line to mobile transition. It was down 67.2% for the fiscal year, mostly due to rising debt as well as uncertainty in its' merger agreement with Portugal Telecom. The company is seeking multiple ways of unloading Portugal telecom shares in order to raise proceeds that may be more applicable to its core business in Brazil as well as present a more attractive target for acquisition. On November 2, 2014, Altice S.A. announced it had made an offer for OI's shares of Portugal Telecom.
Transocean Ltd (RIG) is an international provider of offshore contract drilling services for oil and gas wells. The Company has two operating segments-contract drilling services and drilling management services. RIG was down 50.26% since we purchased it for the Fund on June 11, 2014. Most other oil and energy stocks also fell in line with dramatic drops in oil prices. Revenue decline has also been a contributing factor in the drop in RIG stock. Compared to same quarter last year, revenue fell 7.3% . In other related news, SeaDrill Ltd, an Oslo-listed industry peer of RIG, notified shareholders the company would be cutting their dividend citing debt concerns. This news caused a rippling effect in the industry as investors sold, fearing dividend cuts by other oil companies.
2014 Annual Report 5
Summary
Soledad Investment Management, the sub-adviser to the Fund, utilizes a long-term oriented, buy-and-hold value philosophy in picking stocks. Our long-standing, time-tested approach to investing remains unchanged. We are bottom-up managers, looking first at the fundamentals of a company to determine intrinsic value. Our value investment philosophy seeks to reward patient investors with superior long-term risk adjusted returns. Soledad Investment Management consistently searches globally on behalf of our clients for opportunities that will enhance their portfolio of holdings. We thank you for your patience and steadfast confidence in our philosophy.
Louie Nguyen
Managing Member/Chief Investment Officer
Soledad Investment Management
Past performance does not guarantee future results. The investment return and principal value of an investment will fluctuate so that an investor's shares, when redeemed, may be worth more or less than their original cost. Current performance may be lower or higher than the performance data quoted. You may obtain performance data current to the most recent month-end by calling toll free 1-888-550-9266. Investors should consider the investment objectives, risks, and charges and expenses of the Funds carefully before investing. The prospectus contains this and other information about the Funds. You may obtain a prospectus on our website www.cweil.com or by calling toll free 1-888-550-9266. The Fund's Distributor Is Rafferty Capital Markets, LLC.
Christopher Weil & Company Global Dividend Fund
Country Diversification as of November 30, 2014
(As a percentage of Net Assets)
(UNAUDITED)
*Net Cash represents cash equivalents and other assets in excess of liabilities.
2014 Annual Report 6
Christopher Weil & Company Funds
CHRISTOPHER WEIL & COMPANY CORE INVESTMENT FUND
Sector Allocation (Unaudited)
(As a Percentage of Net Assets)
*Net Cash represents cash equivalents and liabilities in excess of other assets.
CHRISTOPHER WEIL & COMPANY GLOBAL DIVIDEND FUND
Sector Allocation (Unaudited)
(As a Percentage of Net Assets)
*Net Cash represents cash equivalents and other assets in excess of liabilities.
2014 Annual Report 7
Christopher Weil & Company Core Investment Fund (Unaudited)
PERFORMANCE INFORMATION
November 30, 2014 NAV $14.70
Average Annual Total Returns for the Periods Ended November 30, 2014.
| | | | Since | |
| | 1 Year(A) | | Inception(A) | |
| Christopher Weil & Company Core Investment Fund | 13.82% | | 17.86% | |
| S&P 500® Index (B) | 16.86% | | 21.43% | |
Total Annual Fund Operating Expense Ratio (from Prospectus dated 3/28/14): 1.51%
The Total Annual Fund Operating Expense Ratio reported above may not correlate to the expense ratio in the Fund’s financial highlights because the financial highlights include only the direct operating expenses incurred by the Fund, not the indirect costs of investing in acquired funds.
(A) 1 Year and Since Inception returns include change in share prices and in each case includes reinvestment of any dividends and capital gain distributions. The inception date of the Christopher Weil & Company Core Investment Fund was December 21, 2011.
(B) The S&P 500® Index is a widely recognized unmanaged index of equity prices and is representative of a broader market and range of securities than is found in the Fund’s portfolio. The Index is an unmanaged benchmark that assumes reinvestment of all distributions and excludes the effect of taxes and fees. Individuals cannot invest directly in this Index; however, an individual can invest in exchange traded funds or other investment vehicles that attempt to track the performance of a benchmark index.
PAST PERFORMANCE DOES NOT GUARANTEE FUTURE RESULTS. INVESTMENT RETURN AND PRINCIPAL VALUE WILL FLUCTUATE SO THAT SHARES, WHEN REDEEMED, MAY BE WORTH MORE OR LESS THAN THEIR ORIGINAL COST. RETURNS DO NOT REFLECT THE DEDUCTION OF TAXES THAT A SHAREHOLDER WOULD PAY ON FUND DISTRIBUTIONS OR THE REDEMPTION OF FUND SHARES. CURRENT PERFORMANCE MAY BE LOWER OR HIGHER THAN THE PERFORMANCE DATA QUOTED. TO OBTAIN PERFORMANCE DATA CURRENT TO THE MOST RECENT MONTH END, PLEASE CALL 1-888-550-9266 OR VISIT OUR WEBSITE AT www.cweil.com. THE FUND'S DISTRIBUTOR IS RAFFERTY CAPITAL MARKETS, LLC.
2014 Annual Report 8
Christopher Weil & Company Global Dividend Fund (Unaudited)
PERFORMANCE INFORMATION
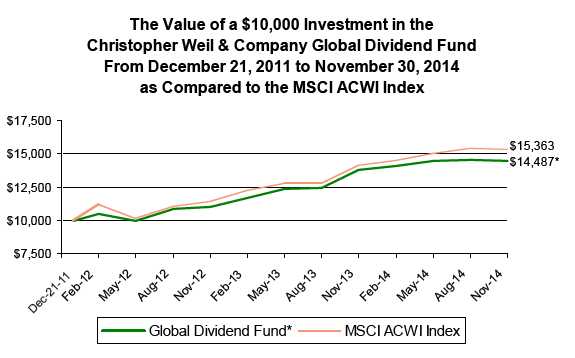
November 30, 2014 NAV $13.67
Average Annual Total Returns for the Periods Ended November 30, 2014.
| | | | Since | |
| | 1 Year(A) | | Inception(A) | |
| Christopher Weil & Company Global Dividend Fund | 5.07% | | 13.42% | |
| MSCI ACWI Index (B) | 8.04% | | 15.71% | |
Total Annual Fund Operating Expense Ratio (from Prospectus dated 3/28/14): 1.76%
The Total Annual Fund Operating Expense Ratio reported above may not correlate to the expense ratio in the Fund’s financial highlights because the financial highlights include only the direct operating expenses incurred by the Fund, not the indirect costs of investing in acquired funds.
(A) 1 Year and Since Inception returns include change in share prices and in each case includes reinvestment of any dividends and capital gain distributions. The inception date of the Christopher Weil & Company Global Dividend Fund was December 21, 2011.
(B) The MSCI ACWI Index is a free float-adjusted market capitalization weighted index that is designed to measure the equity market performance of developed and emerging markets. The MSCI ACWI consists of 45 country indices comprising 24 developed and 21 emerging market country indices.
PAST PERFORMANCE DOES NOT GUARANTEE FUTURE RESULTS. INVESTMENT RETURN AND PRINCIPAL VALUE WILL FLUCTUATE SO THAT SHARES, WHEN REDEEMED, MAY BE WORTH MORE OR LESS THAN THEIR ORIGINAL COST. RETURNS DO NOT REFLECT THE DEDUCTION OF TAXES THAT A SHAREHOLDER WOULD PAY ON FUND DISTRIBUTIONS OR THE REDEMPTION OF FUND SHARES. CURRENT PERFORMANCE MAY BE LOWER OR HIGHER THAN THE PERFORMANCE DATA QUOTED. TO OBTAIN PERFORMANCE DATA CURRENT TO THE MOST RECENT MONTH END, PLEASE CALL 1-888-550-9266 OR VISIT OUR WEBSITE AT www.cweil.com. THE FUND'S DISTRIBUTOR IS RAFFERTY CAPITAL MARKETS, LLC.
2014 Annual Report 9
| Christopher Weil & Company Core Investment Fund |
| | | | Schedule of Investments |
| | | | November 30, 2014 |
| Shares | | | Fair Value | % of Net Assets |
| COMMON STOCKS | | | | |
| | | | |
| COMMUNICATIONS | | | | |
| Services - Business Services, NEC | | | | |
| 1,030 | priceline.com Incorporated * | $ | 1,194,996 | | |
| Services - Computer Programming, Data Processing, Etc. | | | | |
| 17,160 | Facebook, Inc. Class A * | | 1,333,332 | | |
| 1,160 | Google Inc. Class A * | | 636,933 | | |
| 1,100 | Google Inc. Class C * | | 596,013 | | |
| | | | 2,566,278 | | |
| Total for Communications | | 3,761,274 | 8.79 | % |
| CONSUMER DISCRETIONARY | | | | |
| Apparel & Other Finished Products Of Fabrics & Similar Material | | | | |
| 14,000 | Under Armour, Inc. Class A * | | 1,014,860 | | |
| Cable & Other Pay Television Services | | | | |
| 18,710 | The Walt Disney Co. | | 1,730,862 | | |
| Leather & Leather Products | | | | |
| 8,240 | Michael Kors Holdings Limited * (Hong Kong) | | 632,090 | | |
| Men's & Boys' Furnishings, Work Clothing, & Allied Garments | | | | |
| 21,525 | V.F. Corporation | | 1,618,034 | | |
| Motor Vehicle Parts & Accessories | | | | |
| 25,575 | BorgWarner Inc. | | 1,446,522 | | |
| Retail - Retail Stores, NEC | | | | |
| 10,500 | Ulta Salon, Cosmetics & Fragrance, Inc. * | | 1,328,145 | | |
| Soap, Detergents, Cleaning Preparations, Perfumes, Cosmetics | | | | |
| 12,658 | Ecolab Inc. | | 1,379,089 | | |
| Total for Consumer Discretionary | | 9,149,602 | 21.39 | % |
| CONSUMER STAPLES | | | | |
| Food And Kindred Products | | | | |
| 14,000 | The Hain Celestial Group, Inc. * | | 1,585,080 | | |
| Total for Consumer Staples | | 1,585,080 | 3.71 | % |
| ENERGY | | | | | |
| Crude Petroleum & Natural Gas | | | | |
| 18,442 | Noble Energy, Inc. | | 906,978 | | |
| Total for Energy | | 906,978 | 2.12 | % |
| FINANCIALS | | | | | |
| Investment Advice | | | | |
| 6,475 | Affiliated Managers Group, Inc. * | | 1,318,245 | | |
| Security Brokers, Dealers & Flotation Companies | | | | |
| 4,275 | BlackRock, Inc. | | 1,535,067 | | |
| Services - Business Services, NEC | | | | |
| 9,885 | FleetCor Technologies, Inc. * | | 1,501,433 | | |
| 16,480 | Mastercard, Inc. | | 1,438,539 | | |
| | | | 2,939,972 | | |
| Total for Financials | | 5,793,284 | 13.54 | % |
* Non-Income Producing Securities.
The accompanying notes are an integral part of these
financial statements. |
2014 Annual Report 10
| Christopher Weil & Company Core Investment Fund |
| | | | Schedule of Investments |
| | | | November 30, 2014 |
| Shares | | | Fair Value | | % of Net Assets |
| COMMON STOCKS - Continued | | | | | |
| |
| HEALTH CARE | | | | | | |
| Laboratory Analytical Instruments | | | | | |
| 4,890 | Illumina, Inc. * | $ | 933,452 | | | |
| Pharmaceutical Preparations | | | | | |
| 7,300 | Jazz Pharmaceuticals plc * (Ireland) | | 1,292,757 | | | |
| 4,980 | Salix Pharmaceuticals, Ltd. * | | 511,396 | | | |
| | | | 1,804,153 | | | |
| Total for Health Care | | 2,737,605 | | 6.40 | % |
| INDUSTRIALS | | | | | | |
| Air Transportation, Scheduled | | | | | |
| 27,600 | Alaska Air Group, Inc. | | 1,629,228 | | | |
| 26,000 | Spirit Airlines, Inc. * | | 2,149,940 | | | |
| | | | 3,779,168 | | | |
| Motors & Generators | | | | | |
| 11,830 | Generac Holdings Inc. | | 513,185 | | | |
| Railroads, Line-Haul Operating | | | | | |
| 13,490 | Union Pacific Corporation | | 1,575,227 | | | |
| Total for Industrials | | 5,867,580 | | 13.72 | % |
| INFORMATION TECHNOLOGY | | | | | |
| Electronic Computers | | | | | |
| 18,256 | Apple Inc. | | 2,171,186 | | | |
| Services - Business Services, NEC | | | | | |
| 25,650 | MAXIMUS, Inc. | | 1,343,804 | | | |
| Trucking (No Local) | | | | | |
| 19,260 | Old Dominion Freight Line, Inc. * | | 1,560,831 | | | |
| Total for Information Technology | | 5,075,821 | | 11.86 | % |
| MATERIALS | | | | | | |
| Paints, Varnishes, Lacquers, Enamels & Allied Products | | | | | |
| 6,590 | PPG Industries, Inc. | | 1,442,024 | | | |
| Plastic Materials, Synth Resins & Nonvulcan Elastomers | | | | | |
| 31,900 | PolyOne Corporation | | 1,189,870 | | | |
| Total for Materials | | 2,631,894 | | 6.15 | % |
| Total for Common Stocks (Cost $27,513,379) | $ | 37,509,118 | | 87.68 | % |
| MONEY MARKET FUNDS | | | | | |
| 5,302,473 | Invesco Short Term Investments Treasury Class I 0.02%*** | | 5,302,473 | | 12.39 | % |
| | (Cost $5,302,473) | | | | | |
| Total Investment Securities | | 42,811,591 | | 100.07 | % |
| | (Cost $32,815,852) | | | | | |
| Liabilities In Excess of Other Assets | | (32,150 | ) | -0.07 | % |
| Net Assets | | $ | 42,779,441 | | 100.00 | % |
* Non-Income Producing Securities.
*** The rate shown was the 7-day yield at November 30, 2014.
The accompanying notes are an integral part of these
financial statements. |
2014 Annual Report 11
| Christopher Weil & Company Global Dividend Fund |
| | | | Schedule of Investments |
| | | | November 30, 2014 |
| Shares | | Fair Value | % of Net Assets |
| COMMON STOCKS | | | | |
| | | | |
| CONSUMER DISCRETIONARY | | | | |
| Motor Vehicles & Passenger Car Bodies | | | | |
| 22,000 | Honda Motor Co., Ltd. (Japan) | $ | 667,040 | | |
| Retail - Miscellaneous Shopping Goods Stores | | | | |
| 79,700 | Staples, Inc. | | 1,120,582 | | |
| Retail - Variety Stores | | | | |
| 23,260 | Target Corporation | | 1,721,240 | | |
| Total for Consumer Discretionary | | 3,508,862 | 9.44 | % |
| CONSUMER STAPLES | | | | |
| Beverages | | | | | |
| 10,320 | PepsiCo, Inc. | | 1,033,032 | | |
| Cigarettes | | | | | |
| 19,895 | Altria Group, Inc. | | 999,923 | | |
| Converted Paper & Paperboard Products (No Containers/Boxes) | | | | |
| 7,256 | Kimberly-Clark Corporation | | 845,977 | | |
| Food And Kindred Products | | | | |
| 27,782 | Unilever plc ** | | 1,170,733 | | |
| Malt Beverages | | | | |
| 9,570 | Molson Coors Brewing Company Class B | | 740,240 | | |
| Total for Consumer Staples | | 4,789,905 | 12.89 | % |
| ENERGY | | | | | |
| Crude Petroleum & Natural Gas | | | | |
| 6,210 | TOTAL S.A. ** | | 345,462 | | |
| Drilling Oil & Gas Wells | | | | |
| 20,640 | Ensco plc (United Kingdom) | | 697,632 | | |
| 17,250 | Transocean Ltd. (Switzerland) | | 362,423 | | |
| | | | 1,060,055 | | |
| Petroleum Refining | | | | |
| 7,690 | Chevron Corporation | | 837,210 | | |
| Total for Energy | | 2,242,727 | 6.04 | % |
| FINANCIALS | | | | | |
| Commercial Banks, NEC | | | | |
| 113,413 | Banco Santander (Brasil) S.A. ** | | 1,009,376 | | |
| Savings Institution, Federally Chartered | | | | |
| 24,192 | HSBC Holdings plc ** | | 1,203,552 | | |
| Services - Business Services, NEC | | | | |
| 58,100 | The Western Union Company | | 1,079,498 | | |
| Total for Financials | | 3,292,426 | 8.86 | % |
| HEALTH CARE | | | | | |
| Orthopedic, Prosthetic & Surgical Appliances & Supplies | | | | |
| 907 | Halyard Health, Inc. * | | 35,563 | | |
| Pharmaceutical Preparations | | | | |
| 10,000 | AstraZeneca plc ** | | 741,700 | | |
| 23,920 | GlaxoSmithKline plc ** | | 1,111,084 | | |
| 16,243 | Merck & Co., Inc. | | 981,077 | | |
| 28,533 | Pfizer Inc. | | 888,803 | | |
| 19,709 | Sanofi S.A. ** | | 951,748 | | |
| | | | 4,674,412 | | |
| Total for Health Care | | 4,709,975 | 12.68 | % |
* Non-Income Producing Securities.
** ADR - American Depository Receipt.
The accompanying notes are an integral part of these
financial statements. |
2014 Annual Report 12
| Christopher Weil & Company Global Dividend Fund |
| | | | Schedule of Investments |
| | | | November 30, 2014 |
| Shares | | | Fair Value | | % of Net Assets |
| COMMON STOCKS - Continued | | | | | |
| |
| INDUSTRIALS | | | | | | |
| Electronic & Other Electrical Equipment (No Computer Equip) | | | | | |
| 43,867 | General Electric Company | $ | 1,162,037 | | | |
| 31,280 | Koninklijke Philips Electronics N.V. ** | | 939,964 | | | |
| | | | 2,102,001 | | | |
| Total for Industrials | | 2,102,001 | | 5.66 | % |
| INFORMATION TECHNOLOGY | | | | | |
| Computer Communications Equipment | | | | | |
| 39,000 | Cisco Systems, Inc. | | 1,077,960 | | | |
| Semiconductors & Related Devices | | | | | |
| 47,871 | Intel Corporation | | 1,783,195 | | | |
| Total for Information Technology | | 2,861,155 | | 7.70 | % |
| MATERIALS | | | | | | |
| Chemicals - Diversified | | | | | |
| 8,693 | BASF Aktiengesellschaft ** | | 787,021 | | | |
| 12,266 | E.I. du Pont de Nemours and Company | | 875,792 | | | |
| | | | 1,662,813 | | | |
| Converted Paper & Paperboard Products (No Containers/Boxes) | | | | | |
| 7,830 | Avery Dennison Corporation | | 387,663 | | | |
| Metal Mining | | | | | | |
| 19,130 | Rio Tinto plc ** | | 891,458 | | | |
| 24,200 | Vale S.A. ** | | 218,042 | | | |
| | | | 1,109,500 | | | |
| Total for Materials | | 3,159,976 | | 8.51 | % |
| TELECOMMUNICATION SERVICES | | | | | |
| Radiotelephone Communications | | | | | |
| 12,204 | Vodafone Group plc ** | | 446,056 | | | |
| Telephone Communications (No Radiotelephone) | | | | | |
| 12,932 | AT&T Inc. | | 457,534 | | | |
| 15,189 | BCE Inc. (Canada) | | 712,668 | | | |
| 190,000 | Oi S.A. * ** | | 98,819 | | | |
| 78,488 | Orange S.A. ** | | 1,372,755 | | | |
| 80,437 | Telefonica S.A. ** | | 1,286,992 | | | |
| 18,000 | Verizon Communications Inc. | | 910,620 | | | |
| | | | 4,839,388 | | | |
| Total for Telecommunication Services | | 5,285,444 | | 14.23 | % |
| UTILITIES | | | | | | |
| Electric Services | | | | | |
| 26,539 | PPL Corporation | | 942,931 | | | |
| Total for Utilities | | 942,931 | | 2.54 | % |
| Total for Common Stocks (Cost $27,405,058) | $ | 32,895,402 | | 88.55 | % |
| MONEY MARKET FUNDS | | | | | |
| 3,036,884 | Invesco Short Term Investments Treasury Class I 0.02%*** | | 3,036,884 | | 8.17 | % |
| | (Cost $3,036,884) | | | | | |
| Total Investment Securities | | 35,932,286 | | 96.72 | % |
| | (Cost $30,441,942) | | | | | |
| Other Assets In Excess of Liabilities | | 1,219,183 | | 3.28 | % |
| Net Assets | | $ | 37,151,469 | | 100.00 | % |
* Non-Income Producing Securities.
** ADR - American Depository Receipt.
*** The rate shown was the 7-day yield at November 30, 2014.
The accompanying notes are an integral part of these
financial statements. |
2014 Annual Report 13
| Christopher Weil & Company Funds |
| |
| Statements of Assets and Liabilities | Core Investment | | Global Dividend | |
| November 30, 2014 | Fund | | Fund | |
| |
| Assets: | | | | | | |
| Investment Securities at Fair Value* | $ | 42,811,591 | | $ | 35,932,286 | |
| Cash | | 1,154 | | | - | |
| Dividends Receivable | | 17,584 | | | 142,219 | |
| Interest Receivable | | 27 | | | 22 | |
| Receivable for Securities Sold | | 898,456 | | | 1,129,385 | |
| Total Assets | | 43,728,812 | | | 37,203,912 | |
| Liabilities: | | | | | | |
| Payable for Advisor Fees | | 34,493 | | | 37,459 | |
| Payable for Services Fees | | 17,247 | | | 14,984 | |
| Payable for Securities Purchased | | 897,631 | | | - | |
| Total Liabilities | | 949,371 | | | 52,443 | |
| Net Assets | $ | 42,779,441 | | $ | 37,151,469 | |
| Net Assets Consist of: | | | | | | |
| Paid In Capital | $ | 31,931,032 | | $ | 29,277,812 | |
| Accumulated Undistributed Net Investment Income (Loss) | | - | | | 1,109,235 | |
| Accumulated Realized Gain (Loss) on Investments - Net | | 852,670 | | | 1,274,078 | |
| Unrealized Appreciation (Depreciation) in Value of Investments - Net | | 9,995,739 | | | 5,490,344 | |
| Net Assets | $ | 42,779,441 | | $ | 37,151,469 | |
| |
| Net Asset Value and Offering Price (Note 2) | $ | 14.70 | | $ | 13.67 | |
| Minimum Redemption Price (Note 2) | $ | 14.41 | | $ | 13.40 | |
| |
| * Investments at Identified Cost | $ | 32,815,852 | | $ | 30,441,942 | |
| |
| Shares Outstanding (Unlimited number of shares | | 2,910,811 | | | 2,717,437 | |
| authorized without par value) | | | | | | |
| |
| Statements of Operations | | | | | | |
| For the fiscal year ended November 30, 2014 | | | | | | |
| |
| Investment Income: | | | | | | |
| Dividends ** | $ | 175,933 | | $ | 1,798,531 | |
| Interest | | 400 | | | 244 | |
| Total Investment Income | | 176,333 | | | 1,798,775 | |
| Expenses: | | | | | | |
| Investment Advisor Fees | | 387,760 | | | 437,107 | |
| Services Fees | | 193,880 | | | 174,843 | |
| Total Expenses | | 581,640 | | | 611,950 | |
| |
| Net Investment Income (Loss) | | (405,307 | ) | | 1,186,825 | |
| |
| Realized and Unrealized Gain (Loss) on Investments and Options Purchased: | | | | | | |
| Net Realized Gain (Loss) on Investments | | 1,113,901 | | | 1,274,074 | |
| Net Realized Gain (Loss) on Options Purchased | | 212,194 | | | - | |
| Net Change in Unrealized Appreciation (Depreciation) on Investments | | 4,128,987 | | | (738,217 | ) |
| Net Realized and Unrealized Gain (Loss) on Investments and Options Purchased | | 5,455,082 | | | 535,857 | |
| |
| Net Increase (Decrease) in Net Assets from Operations | $ | 5,049,775 | | $ | 1,722,682 | |
| |
| ** Net of Foreign Withholding Taxes and ADR Fees | $ | 530 | | $ | 101,313 | |
The accompanying notes are an integral part of these
financial statements. |
2014 Annual Report 14
| Christopher Weil & Company Funds | |
| |
| Statements of Changes in Net Assets | Core Investment Fund | | | Global Dividend Fund | |
| |
| | | 12/1/2013 | | | | 12/1/2012 | | | | 12/1/2013 | | | | 12/1/2012 | |
| | | to | | | | to | | | | to | | | | to | |
| | | 11/30/2014 | | | | 11/30/2013 | | | | 11/30/2014 | | | | 11/30/2013 | |
| From Operations: | | | | | | | | | | | | | | | |
| Net Investment Income (Loss) | $ | (405,307 | ) | | $ | (87,895 | ) | | $ | 1,186,825 | | | $ | 496,813 | |
| Net Realized Gain (Loss) | | 1,326,095 | | | | 3,840,496 | | | | 1,274,074 | | | | 747,657 | |
| Change in Net Unrealized Appreciation (Depreciation) | | 4,128,987 | | | | 3,866,083 | | | | (738,217 | ) | | | 4,913,797 | |
| Increase (Decrease) in Net Assets from Operations | | 5,049,775 | | | | 7,618,684 | | | | 1,722,682 | | | | 6,158,267 | |
| From Distributions to Shareholders: | | | | | | | | | | | | | | | |
| Net Investment Income | | - | | | | (70,226 | ) | | | (516,770 | ) | | | (457,637 | ) |
| Net Realized Gain from Security Transactions | | (3,237,581 | ) | | | - | | | | (739,953 | ) | | | - | |
| Total Distributions to Shareholders | | (3,237,581 | ) | | | (70,226 | ) | | | (1,256,723 | ) | | | (457,637 | ) |
| From Capital Share Transactions: | | | | | | | | | | | | | | | |
| Proceeds From Sale of Shares | | 7,289,395 | | | | 4,650,520 | | | | 5,857,331 | | | | 4,568,009 | |
| Proceeds from Redemption Fees (Note 2) | | 301 | | | | - | | | | - | | | | - | |
| Shares Issued on Reinvestment of Dividends | | 3,237,581 | | | | 70,226 | | | | 1,256,611 | | | | 457,637 | |
| Cost of Shares Redeemed | | (4,277,503 | ) | | | (2,507,651 | ) | | | (2,764,922 | ) | | | (2,861,617 | ) |
| Net Increase (Decrease) from Shareholder Activity | | 6,249,774 | | | | 2,213,095 | | | | 4,349,020 | | | | 2,164,029 | |
| Net Increase (Decrease) in Net Assets | | 8,061,968 | | | | 9,761,553 | | | | 4,814,979 | | | | 7,864,659 | |
| |
| Net Assets at Beginning of Period | | 34,717,473 | | | | 24,955,920 | | | | 32,336,490 | | | | 24,471,831 | |
| |
| Net Assets at End of Period | $ | 42,779,441 | | | $ | 34,717,473 | | | $ | 37,151,469 | | | $ | 32,336,490 | |
| |
| Accumulated Undistributed Net Investment Income (Loss) | $ | - | | | $ | - | | | $ | 1,109,235 | | | $ | 439,180 | |
| |
| |
| Share Transactions: | | | | | | | | | | | | | | | |
| Issued | | 528,852 | | | | 367,210 | | | | 439,782 | | | | 367,713 | |
| Reinvested | | 246,391 | | | | 6,431 | | | | 95,705 | | | | 41,908 | |
| Redeemed | | (308,416 | ) | | | (202,051 | ) | | | (207,723 | ) | | | (234,973 | ) |
| Net Increase (Decrease) in Shares | | 466,827 | | | | 171,590 | | | | 327,764 | | | | 174,648 | |
| Shares Outstanding Beginning of Period | | 2,443,984 | | | | 2,272,394 | | | | 2,389,673 | | | | 2,215,025 | |
| Shares Outstanding End of Period | | 2,910,811 | | | | 2,443,984 | | | | 2,717,437 | | | | 2,389,673 | |
The accompanying notes are an integral part of these
financial statements. |
2014 Annual Report 15
| Christopher Weil & Company Core Investment Fund |
| |
| Financial Highlights | | | | | | | | | | | |
| |
| Selected data for a share outstanding throughout the period: | 12/1/2013 | | | 12/1/2012 | | | 12/21/2011* | |
| | to | | | to | | | to | |
| | 11/30/2014 | | | 11/30/2013 | | | 11/30/2012 | |
| Net Asset Value - Beginning of Period | $ | 14.21 | | | $ | 10.98 | | | $ | 10.00 | |
| Net Investment Income (Loss) (a) | | (0.14 | ) | | | (0.04 | ) | | | 0.03 | |
| Net Gains (Loss) on Investments (Realized and Unrealized) | | 1.95 | | | | 3.30 | | | | 0.95 | |
| Total from Investment Operations (b) | | 1.81 | | | | 3.26 | | | | 0.98 | |
| Distributions (From Net Investment Income) | | - | | | | (0.03 | ) | | | - | |
| Distributions (From Capital Gains) | | (1.32 | ) | | | - | | | | - | |
| Total Distributions | | (1.32 | ) | | | (0.03 | ) | | | - | |
| Proceeds from Redemption Fee (Note 2) | | - | | + | | - | | | | - | |
| Net Asset Value - End of Period | $ | 14.70 | | | $ | 14.21 | | | $ | 10.98 | |
| Total Return (c) | | 13.82% | | | | 29.78% | | | | 9.80% | *** |
| Ratios/Supplemental Data | | | | | | | | | | | |
| Net Assets - End of Period (Thousands) | $ | 42,779 | | | $ | 34,717 | | | $ | 24,956 | |
| Ratio of Expenses to Average Net Assets | | 1.50% | | | | 1.50% | | | | 1.50% | ** |
| Ratio of Net Investment Income (Loss) to Average Net Assets | | -1.05% | | | | -0.30% | | | | 0.30% | ** |
| Portfolio Turnover Rate | | 55.55% | | | | 164.60% | | | | 59.33% | *** |
| Christopher Weil & Company Global Dividend Fund |
| |
| Financial Highlights | | | | | | | | | | | |
| |
| Selected data for a share outstanding throughout the period: | 12/1/2013 | | | 12/1/2012 | | | 12/21/2011* | |
| | to | | | to | | | to | |
| | 11/30/2014 | | | 11/30/2013 | | | 11/30/2012 | |
| Net Asset Value - Beginning of Period | $ | 13.53 | | | $ | 11.05 | | | $ | 10.00 | |
| Net Investment Income (Loss) (a) | | 0.46 | | | | 0.22 | | | | 0.21 | |
| Net Gains (Loss) on Investments (Realized and Unrealized) (b) | | 0.21 | | | | 2.47 | | | | 0.84 | |
| Total from Investment Operations | | 0.67 | | | | 2.69 | | | | 1.05 | |
| Distributions (From Net Investment Income) | | (0.22 | ) | | | (0.21 | ) | | | - | |
| Distributions (From Capital Gains) | | (0.31 | ) | | | - | | | | - | |
| Total Distributions | | (0.53 | ) | | | (0.21 | ) | | | - | |
| Proceeds from Redemption Fee (Note 2) | | - | | | | - | | | | - | |
| Net Asset Value - End of Period | $ | 13.67 | | | $ | 13.53 | | | $ | 11.05 | |
| Total Return (c) | | 5.07% | | | | 24.77% | | | | 10.50% | *** |
| Ratios/Supplemental Data | | | | | | | | | | | |
| Net Assets - End of Period (Thousands) | $ | 37,151 | | | $ | 32,336 | | | $ | 24,472 | |
| Ratio of Expenses to Average Net Assets | | 1.75% | | | | 1.75% | | | | 1.75% | ** |
| Ratio of Net Investment Income (Loss) to Average Net Assets | | 3.39% | | | | 1.78% | | | | 2.05% | ** |
| Portfolio Turnover Rate | | 23.02% | | | | 9.59% | | | | 4.91% | *** |
* Commencement of Operations.
** Annualized.
*** Not Annualized.
+ Amount less than $0.005 per share.
(a) Per share amount calculated using the average shares method.
(b) Realized and unrealized gains and losses per share in this caption are balancing amounts necessary to reconcile the
change in net asset value for the period, and may not reconcile with the aggregate gains and losses in the Statements of
Operations due to share transactions for the period.
(c) Total return in the above table represents the rate that the investor would have earned or lost on an investment in the Fund
assuming reinvestment of dividends. Returns do not reflect the deduction of taxes a shareholder would pay on Fund
distributions or redemption of Fund shares. |
The accompanying notes are an integral part of these
financial statements. |
2014 Annual Report 16
NOTES TO FINANCIAL STATEMENTS
CHRISTOPHER WEIL & COMPANY CORE INVESTMENT FUND
CHRISTOPHER WEIL & COMPANY GLOBAL DIVIDEND FUND
November 30, 2014
1.) ORGANIZATION
Christopher Weil & Company Core Investment Fund (“Core Investment”) and Christopher Weil & Company Global Dividend Fund (“Global Dividend”) (collectively, the “Funds” or the “CWC Funds”) were each organized as a diversified series of the PFS Funds (the “Trust”) on December 16, 2011. The Trust was established under the laws of Massachusetts by an Agreement and Declaration of Trust dated January 13, 2000, which was amended and restated as of January 20, 2011. Prior to March 5, 2010, the Trust was named Wireless Fund. The Trust is registered as an open-end investment company under the Investment Company Act of 1940, as amended (the “1940 Act”). The Trust may offer an unlimited number of shares of beneficial interest in a number of separate series, each series representing a distinct fund with its own investment objectives and policies. As of November 30, 2014, there were nine series authorized by the Trust. The investment advisor to Core Investment and Global Dividend is Christopher Weil & Company, Inc. (the “Advisor” or “CWC”). The Funds commenced operations on December 21, 2011. The Funds’ investment objective is to seek long-term capital appreciation. Significant accounting policies of the Funds are presented in Note 2 below.
2.) SIGNIFICANT ACCOUNTING POLICIES
SECURITY VALUATION: All investments in securities are recorded at their estimated fair value, as described in Note 3.
SHARE VALUATION: The net asset value (the “NAV”) is generally calculated as of the close of trading on the New York Stock Exchange (“Exchange”) (normally 4:00 p.m. Eastern time) every day the Exchange is open. The NAV for each Fund is calculated by taking the total value of each Fund’s assets, subtracting its liabilities, and then dividing by the total number of shares outstanding, rounded to the nearest cent. The offering price and redemption price per share is equal to the net asset value per share, except that shares of each Fund are subject to a redemption fee of 2% if redeemed within 90 days of purchase. During the fiscal year ended November 30, 2014, proceeds from redemption fees were $301 and $0 for Core Investment and Global Dividend, respectively.
SHORT SALES: Each Fund may sell a security it does not own in anticipation of a decline in the fair value of the security. When a Fund sells a security short, it must borrow the security sold short and deliver it to the broker-dealer through which it made the short sale. A gain, limited to the price at which a Fund sold the security short, or a loss, unlimited in size, will be recognized upon the termination of a short sale.
OPTIONS: The purchase and writing of options requires additional skills and techniques beyond normal portfolio management, and involves certain risks. The purchase of options limits a Fund’s potential loss to the amount of the premium paid and can afford a Fund the opportunity to profit from favorable movements in the price of the underlying security to a greater extent than if the transaction were effected directly. When a Fund writes an option, an amount equal to the premium received by the Fund is recorded as a liability and is subsequently adjusted to the current fair value of the option written. Premiums received from writing options that expire unexercised are treated by a Fund on the expiration date as realized gains from investments. The difference between the premium and the amount paid on effecting a closing purchase transaction, including brokerage commissions, is also treated as a realized gain, or, if the premium is less than the amount paid for the closing purchase transaction, as a realized loss. If a written call option is exercised, the premium is added to the proceeds from the sale of the underlying security or currency in determining whether a Fund has realized a gain or a loss. If a written put option is exercised, the premium reduces the cost basis of the securities purchased by the Fund. A Fund, as writer of an option, bears the market risk of an unfavorable change in the price of the security underlying the written option.
INCOME TAXES: The Funds’ policy is to continue to comply with the requirements of the Internal Revenue Code that are applicable to regulated investment companies and to distribute all of their taxable income to shareholders. Therefore, no federal income tax provision is required. It is the Funds’ policy to distribute annually, prior to the end of the calendar year, dividends sufficient to satisfy excise tax requirements of the Internal Revenue Code. This Internal Revenue Code requirement may cause an excess of distributions over the book year-end accumulated income. In addition, it is the Funds’ policy to distribute annually, after the end of the fiscal year, any remaining net investment income and net realized capital gains.
2014 Annual Report 17
Notes to Financial Statements - continued
The Funds recognize the tax benefits of certain tax positions only where the position is “more likely than not” to be sustained assuming examination by tax authorities. Management has analyzed the Funds’ tax positions, and has concluded that no liability for unrecognized tax benefits should be recorded related to uncertain tax positions taken on returns filed for open tax years (2011-2012), or expected to be taken in the Funds’ 2013 tax returns. The Funds identify their major tax jurisdictions as U.S. Federal tax authorities; however the Funds are not aware of any tax positions for which they are reasonably possible that the total amounts of unrecognized tax benefits will change materially in the next twelve months. The Funds recognize interest and penalties, if any, related to unrecognized tax benefits as income tax expense in the Statements of Operations. During the fiscal year ended November 30, 2014, the Funds did not incur any interest or penalties.
USE OF ESTIMATES: The preparation of financial statements in conformity with accounting principles generally accepted in the United States (“GAAP”) requires management to make estimates and assumptions that affect the reported amounts of assets and liabilities and disclosure of contingent assets and liabilities at the date of the financial statements and the reported amounts of increases and decreases in net assets from operations during the reporting period. Actual results could differ from those estimates.
DISTRIBUTIONS TO SHAREHOLDERS: Distributions to shareholders, which are determined in accordance with income tax regulations, are recorded on the ex-dividend date. The treatment for financial reporting purposes of distributions made to shareholders during the year from net investment income or net realized capital gains may differ from their ultimate treatment for federal income tax purposes. These differences are caused primarily by differences in the timing of recognition of certain components of income, expense or realized capital gain for federal income tax purposes. Where such differences are permanent in nature, they are reclassified in the components of the net assets based on their ultimate characterization for federal income tax purposes. Any such reclassification will have no effect on net assets, results of operations or net asset values per share of any Fund. As of November 30, 2014, as a result of permanent book to tax differences, Core Investment accumulated net investment losses totaling $405,307 were reclassified to accumulated realized gain on investments – net, and $5,471 of gains included in accumulated realized gain on investments –net were reclassified to paid in capital. There were no permanent adjustments in Global Dividend.
EXPENSES: Expenses incurred by the Trust that do not relate to a specific fund of the Trust are allocated to the individual fund based on each fund’s relative net assets or another appropriate basis.
OTHER: Each Fund records security transactions based on a trade date. Dividend income is recognized on the ex-dividend date, and interest income is recognized on an accrual basis. Discounts and premiums on securities purchased are accreted and amortized over the lives of the respective securities. Withholding taxes on foreign dividends have been provided for in accordance with each Fund’s understanding of the applicable country’s tax rules and rates.
3.) SECURITY VALUATIONS
The Funds utilize various methods to measure the fair value of their investments on a recurring basis. GAAP establishes a hierarchy that prioritizes inputs to valuation methods. The three levels of inputs are:
Level 1 - Unadjusted quoted prices in active markets for identical assets or liabilities that the Funds have the ability to access.
Level 2 - Observable inputs other than quoted prices included in level 1 that are observable for the asset or liability, either directly or indirectly. These inputs may include quoted prices for the identical instrument on an inactive market, prices for similar instruments, interest rates, prepayment speeds, credit risk, yield curves, default rates and similar data.
Level 3 - Unobservable inputs for the asset or liability, to the extent relevant observable inputs are not available, representing the Funds’ own assumptions about the assumptions a market participant would use in valuing the assets or liabilities, and would be based on the best information available.
The availability of observable inputs can vary from security to security and is affected by a wide variety of factors, including, for example, the type of security, whether the security is new and not yet established in the marketplace, the liquidity of markets, and other characteristics particular to the security. To the extent that valuation is based on models or inputs that are less observable or unobservable in the market, the determination of fair value requires more judgment. Accordingly, the degree of judgment exercised in determining fair value is greatest for instruments categorized in level 3.
2014 Annual Report 18
Notes to Financial Statements - continued
The inputs used to measure fair value may fall into different levels of the fair value hierarchy. In such cases, for disclosure purposes, the level in the fair value hierarchy within which the fair value measurement falls in its entirety, is determined based on the lowest level input that is significant to the fair value measurement in its entirety.
FAIR VALUE MEASUREMENTS
A description of the valuation techniques applied to the Funds’ major categories of assets measured at fair value on a recurring basis follows:
Equity securities (common stocks, including ADRs). Equity securities are carried at fair value. The market quotation used for equity securities, including those listed on the NASDAQ National Market System, is the last sale price on the date on which the valuation is made or, in the absence of sales, at the closing bid price. Over-the-counter securities will be valued on the basis of the bid price at the close of each business day. Generally, if the security is traded in an active market and is valued at the last sale price, the security is categorized as a level 1 security. When the security position is not considered to be part of an active market or when the security is valued at the bid price, the position is generally categorized as level 2. When market quotations are not readily available, when the Advisor determines the last bid price does not accurately reflect the current value or when restricted securities are being valued, such securities are valued as determined in good faith by the Advisor, in conformity with guidelines adopted by and subject to review and approval of the Board of Trustees (the “Trustees”) and are categorized in level 2 or level 3, when appropriate.
Money market funds. Money market funds are valued at a net asset value of $1.00 and are classified in level 1 of the fair value hierarchy.
Options. Option positions that are traded on any exchange or on the NASDAQ over-the-counter market are valued at the last quoted sale price. To the extent these option positions are actively traded and valuation adjustments are not applied, they are classified in level 1 of the fair value hierarchy. Lacking a last sale price, a purchased option position is valued at its last bid price except when, in the Advisor’s opinion, the last bid price does not accurately reflect the current value of the option position. Lacking a last sale price, a written option position is valued at its last ask price except when, in the Advisor’s opinion, the last ask price does not accurately reflect the current value of the option position. When such bid or ask prices are used for valuation or when the security is not actively traded, those securities are generally categorized in level 2 or level 3 of the fair value hierarchy.
Fixed income securities. Fixed income securities generally are valued by using market quotations, but may be valued on the basis of prices furnished by a pricing service when the Advisor believes such prices accurately reflect the fair value of such securities. A pricing service utilizes electronic data processing techniques based on yield spreads relating to securities with similar characteristics to determine prices for normal institutional-size trading units of debt securities without regard to sale or bid prices. When prices are not readily available from a pricing service, or when restricted or illiquid securities are being valued, securities are valued at fair value as determined in good faith by the Advisor, subject to review of the Trustees. Short-term investments in fixed income securities with maturities of less than 60 days when acquired, or which subsequently are within 60 days of maturity, are valued by using the amortized cost method of valuation. Generally, fixed income securities are categorized as level 2.
In accordance with the Trust's good faith pricing guidelines, the Advisor is required to consider all appropriate factors relevant to the value of securities for which it has determined other pricing sources are not available or reliable as described above. There is no single standard for determining fair value, since fair value depends upon the circumstances of each individual case. As a general principle, the current fair value of an issue of securities being valued by the Advisor would appear to be the amount which the owner might reasonably expect to receive for them upon their current sale. Methods which are in accordance with this principle may, for example, be based on (i) a multiple of earnings; (ii) a discount from market of a similar freely traded security (including a derivative security or a basket of securities traded on other markets, exchanges or among dealers); or (iii) yield to maturity with respect to debt issues, or a combination of these and other methods.
The following tables summarize the inputs used to value the Funds’ assets measured at fair value as of November 30, 2014:
2014 Annual Report 19
| Notes to Financial Statements - continued | | | | | | |
| |
| Core Investment: | | | | | | | | |
| Valuation Inputs of Assets | | Level 1 | | Level 2 | | Level 3 | | Total |
| Common Stocks | | $37,509,118 | | $0 | | $0 | | $37,509,118 |
| Money Market Funds | | 5,302,473 | | 0 | | 0 | | 5,302,473 |
| Total | | $42,811,591 | | $0 | | $0 | | $42,811,591 |
| |
| Global Dividend: | | | | | | | | |
| Valuation Inputs of Assets | | Level 1 | | Level 2 | | Level 3 | | Total |
| Common Stocks | | $32,895,402 | | $0 | | $0 | | $32,895,402 |
| Money Market Funds | | 3,036,884 | | 0 | | 0 | | 3,036,884 |
| Total | | $35,932,286 | | $0 | | $0 | | $35,932,286 |
Refer to each Fund’s Schedule of Investments for a listing of securities by industry. The Funds did not hold any level 3 assets during the fiscal year ended November 30, 2014. There were no transfers into or out of the levels during the fiscal year ended November 30, 2014. It is the Funds’ policy to consider transfers into or out of the levels as of the end of the reporting period.
4.) INVESTMENT ADVISORY AGREEMENTS AND SERVICES AGREEMENTS
Each of the Funds has an investment advisory agreement (collectively the "Management Agreements") with the Advisor. Under the Management Agreements, the Advisor, at its own expense and without reimbursement from the Funds, furnishes office space and all necessary office facilities, equipment and executive personnel necessary for managing the assets of the Funds. For its services the Advisor receives an investment management fee equal to 1.00% of the average daily net assets of Core Investment and an investment management fee equal to 1.25% of the average daily net assets of Global Dividend. Soledad Investment Management, LLC (the "Sub-Advisor") serves as the sub-advisor of Global Dividend and is paid by the Advisor, not the Fund. Core Investment does not have a Sub-Advisor. For the fiscal year ended November 30, 2014, the Advisor earned management fees of $387,760 and $437,107 for Core Investment and Global Dividend, respectively. At November 30, 2014, Core Investment and Global Dividend owed the Advisor management fees of $34,493 and $37,459, respectively.
Additionally, the Funds each have a Services Agreement with the Advisor (the “Services Agreements”). Under the Services Agreements the Advisor receives an additional fee of 0.50% of the average daily net assets per Fund and is obligated to pay the operating expenses of the Funds excluding, as applicable, management fees and sub-advisory fees, brokerage fees and commissions, 12b-1 fees, taxes, borrowing costs (such as (a) interest and (b) dividend expenses on securities sold short), ADR fees, the cost of acquired funds and extraordinary expenses. For the fiscal year ended November 30, 2014, the Advisor earned services fees of $193,880 and $174,843 for Core Investment and Global Dividend, respectively. At November 30, 2014, the Funds owed the Advisor services fees of $17,247 and $14,984 for Core Investment and Global Dividend, respectively.
5.) RELATED PARTY TRANSACTIONS
Jeffrey R. Provence of Premier Fund Solutions, Inc. (the “Administrator”) also serves as trustee/officer of the Funds. This individual receives benefits from the Administrator resulting from administration fees paid to the Administrator of the Funds by the Advisor.
The Trustees who are not interested persons of the Funds were each paid a total of $2,000 in Trustees’ fees for both Funds for the fiscal year ended November 30, 2014 by the Advisor.
6.) DERIVATIVES
At November 30, 2014, the Funds did not hold any derivative instruments. However, Core Investment invested in derivatives during the fiscal year ended November 30, 2014. Global Dividend did not invest in derivatives during the fiscal year ended November 30, 2014. The following information summarizes Core Investment’s (defined as the “Fund” for Note 6) use of derivatives:
Transactions in purchased put options during the fiscal year ended November 30, 2014 were as follows:
| | Number of | | | Premiums | |
| | Contracts | | | Paid | |
| Options outstanding at November 30, 2013 | 0 | | | $0 | |
| Options purchased | 1,800 | | | 119,800 | |
| Options terminated in closing sale transactions | (1,800 | ) | | (119,800 | ) |
| Options expired | 0 | | | 0 | |
| Options exercised | 0 | | | 0 | |
| Options outstanding at November 30, 2014 | 0 | | | $0 | |
2014 Annual Report 20
Notes to Financial Statements - continued
The Fund did not engage in written options during the fiscal year ended November 30, 2014.
The locations on the Statements of Assets and Liabilities of the Fund's derivative positions, which are not accounted for as hedging instruments under GAAP, are as follows:
| | | Asset | | | Liability |
| | | Derivatives | | | Derivatives |
| Options purchased | | | Written Options at | | |
| Included In Investments in | | $0 | Fair Value | | $0 |
| Securities at Fair Value | | | | | |
Realized and unrealized gains and losses on derivatives contracts entered into during the fiscal year ended November 30, 2014 by the Fund are recorded in the following locations in the Statement of Operations:
| | | | Realized | | | Unrealized |
| Equity Contracts | Location | | Gain/(Loss) | Location | | Gain/(Loss) |
| Options | Net Realized | | | Change In Unrealized | | |
| Purchased | Gain (Loss) on | | $212,194 | Appreciation (Depreciation) | | $0 |
| Options Purchased | | | on Options Purchased | | |
The Fund engages in option transactions involving individual securities and stock indexes. An option involves either: (a) the right or the obligation to buy or sell a specific instrument at a specific price until the expiration date of the option; or (b) the right to receive payments or the obligation to make payments representing the difference between the closing price of a stock index and the exercise price of the option expressed in dollars times a specified multiple until the expiration date of the option. The Fund may purchase and write options. Options are sold (written) on securities and stock indexes. The purchaser of an option on a security pays the seller (the writer) a premium for the right granted but is not obligated to buy or sell the underlying security. The purchaser of an option on a stock index pays the seller a premium for the right granted, and in return the seller of such an option is obligated to make the payment. A writer of an option may terminate the obligation prior to expiration of the option by making an offsetting purchase of an identical option. Options are traded on organized exchanges and in the over-the-counter market. To cover the potential obligations involved in writing options, a Fund will either: (a) own the underlying security, or in the case of an option on a market index, will hold a portfolio of stocks substantially replicating the movement of the index; or (b) the Fund will segregate with the custodian high grade liquid assets sufficient to purchase the underlying security or equal to the market value of the stock index option, marked to market daily.
The purchase of options limits a Fund's potential loss to the amount of the premium paid and can afford the Fund the opportunity to profit from favorable movements in the price of an underlying security to a greater extent than if transactions were effected in the security directly. However, the purchase of an option could result in the Fund losing a greater percentage of its investment than if the transaction were effected directly. When the Fund writes a call option, it will receive a premium, but it will give up the opportunity to profit from a price increase in the underlying security above the exercise price as long as its obligation as a writer continues, and it will retain the risk of loss should the price of the security decline. When the Fund writes a put option, it will assume the risk that the price of the underlying security or instrument will fall below the exercise price, in which case the Fund may be required to purchase the security or instrument at a higher price than the market price of the security or instrument. In addition, there can be no assurance that the Fund can effect a closing transaction on a particular option it has written. Further, the total premium paid for any option may be lost if the Fund does not exercise the option.
The Fund engages in option transactions involving securities and stock indices in order to gain exposure to particular securities or markets, in connection with hedging transactions, or to try to enhance returns. Options require additional skills and techniques beyond normal portfolio management. The Fund's use of options involves risk that such instruments may not work as intended due to unanticipated developments, especially in abnormal market conditions, or if the Advisor makes an error in judgment, or other causes. The use of options may magnify the increase or decrease in the performance of the Fund, and may also subject the Fund to higher price volatility.
The premiums paid for the options represent the cost of the investment and the options are valued daily at their closing price. The Fund recognizes a realized gain or loss when the option is sold or expires. Option holdings within the Fund, which may include put options and call options, are subject to loss of value with the passage of time, and may experience a total loss of value upon expiration. With options, there is minimal counterparty risk to the Fund since they are exchange traded.
2014 Annual Report 21
Notes to Financial Statements - continued
As of November 30, 2014, there were no offsetting arrangements of assets and liabilities for the Funds.
7.) INVESTMENTS
For the fiscal year ended November 30, 2014, purchases and sales of investment securities other than U.S. Government obligations and short-term investments were as follows:
| | | Core Investment | | Global Dividend |
| Purchases | | $20,189,873 | | $8,337,228 |
| Sales | | $19,755,128 | | $7,539,629 |
There were no purchases or sales of U.S. Government obligations.
8.) CAPITAL SHARES
At November 30, 2014, the Trust was authorized to issue an unlimited number of shares of beneficial interest. The following are the shares issued and paid in capital outstanding for the Funds at November 30, 2014:
| | | Core Investment | | Global Dividend |
| Shares Issued | | | | |
| and Outstanding | | 2,910,811 | | 2,717,437 |
| Paid in Capital | | $31,931,032 | | $29,277,812 |
9.) CONTROL OWNERSHIP
The beneficial ownership, either directly or indirectly, of more than 25% of the voting shares of a fund creates a presumption of control of the fund, under section 2(a)(9) of the Investment Company Act of 1940. At November 30, 2014, National Financial Services, LLC, located at 200 Liberty Street, New York, New York 10281, held for the benefit of its customers, in aggregate, 98.99% of the Core Investment shares. National Financial Services, LLC, located at 200 Liberty Street, New York, New York 10281, held for the benefit of its customers, in aggregate, 99.00% of Global Dividend shares.
10.) DISTRIBUTIONS TO SHAREHOLDERS
There was a distribution paid on December 26, 2013 to the Funds’ shareholders of record on December 24, 2013. Core Investment paid a distribution of $0.34454 per share from short-term capital gains and $0.97302 per share from long-term capital gains. Also, Global Dividend paid a distribution of $0.21573 per share from net investment income, $0.06686 per share from short-term capital gains and $0.24204 per share from long-term capital gains.
| Core Investment distributions paid from: | | | | |
| |
| | | Fiscal Year Ended | | Fiscal Year Ended |
| | | November 30, 2014 | | November 30, 2013 |
| Ordinary Income | | $ 0 | | $ 70,226 |
| Short-term Capital Gain | | 846,623 | | 0 |
| Long-term Capital Gain | | 2,390,958 | | 0 |
| | | $ 3,237,581 | | $ 70,226 |
| |
| Global Dividend distributions paid from: | | | | |
| |
| | | Fiscal Year Ended | | Fiscal Year Ended |
| | | November 30, 2014 | | November 30, 2013 |
| Ordinary Income | | $ 516,770 | | $ 457,637 |
| Short-term Capital Gain | | 160,159 | | 0 |
| Long-term Capital Gain | | 579,794 | | 0 |
| | | $ 1,256,723 | | $ 457,637 |
Subsequent to November 30, 2014, there was a distribution paid on December 26, 2014 to the Funds’ shareholders of record on December 24, 2014. Core Investment paid a distribution of $0.18153 per share from short-term capital gains and $0.12588 per share from long-term capital gains. Also, Global Dividend paid a distribution of $0.43266 per share from net investment income, $0.01744 per share from short-term capital gains and $0.45275 per share from long-term capital gains.
2014 Annual Report 22
Notes to Financial Statements - continued
11.) TAX MATTERS
For federal income tax purposes, at November 30, 2014 the cost of securities on a tax basis and the composition of gross unrealized appreciation (the excess of value over tax cost) and depreciation (the excess of tax cost over value) were as follows:
| | | Core Investment | | Global Dividend | |
| Cost of Investments | | $32,853,071 | | $30,441,945 | |
| Gross Unrealized Appreciation | | $10,182,982 | | $6,713,530 | |
| Gross Unrealized Depreciation | | ($224,462) | | ($1,223,189) | |
| Net Unrealized Appreciation | | | | | |
| (Depreciation) on Investments | | $9,958,520 | | $5,490,341 | |
As of November 30, 2014, book to tax differences in cost basis primarily were attributable to the deferral of wash sales.
As of November 30, 2014, the components of distributable earnings / (accumulated losses) on a tax basis were as follows for the Funds:
| Core Investment: | | |
| |
| Undistributed ordinary income/(accumulated losses) | $ | 525,496 |
| Undistributed long-term capital gain/(accumulated losses) | | 364,393 |
| Unrealized appreciation/(depreciation) - net | | 9,958,520 |
| | $ | 10,848,409 |
| |
| Global Dividend: | | |
| |
| Undistributed ordinary income/(accumulated losses) | $ | 1,156,499 |
| Undistributed long-term capital gain/(accumulated losses) | | 1,226,817 |
| Unrealized appreciation/(depreciation) - net | | 5,490,341 |
| | $ | 7,873,657 |
Income and capital gains are determined in accordance with income tax regulations that may differ from GAAP. These differences are due to differing treatments for items such as the tax treatment of options on indexes and the deferral of wash sale losses.
2014 Annual Report 23
DISCLOSURE OF EXPENSES
(Unaudited)
As a shareholder of the Funds, you incur two types of costs: (1) transaction costs, including sales charges (loads) on purchase payments; and (2) ongoing costs, including management fees; and other Fund expenses. This Example is intended to help you understand your ongoing costs (in dollars) of investing in the Funds and to compare these costs with the ongoing costs of investing in other mutual funds. If Fund shares are redeemed within 90 days of purchase from the Funds, the shares are subject to a 2% redemption fee. Additionally, IRA accounts will be charged an $8.00 annual maintenance fee. Also, your account will be indirectly subject to the expenses of the underlying funds.
The Example is based on an investment of $1,000 invested in the Funds on June 1, 2014, and held through November 30, 2014.
Actual Expenses
The first line of the table below provides information about actual account values and actual expenses. You may use the information in this line, together with the amount you invested, to estimate the expenses that you paid over the period. Simply divide your account value by $1,000 (for example, an $8,600 account value divided by $1,000 = 8.6), then multiply the result by the number in the first line under the heading entitled "Expenses Paid During Period" to estimate the expenses you paid on your account during this period.
Hypothetical Example for Comparison Purposes
The second line of the table below provides information about hypothetical account values and hypothetical expenses based on the Funds’ actual expense ratio and an assumed rate of return of 5% per year before expenses, which is not the Funds’ actual return. The hypothetical account values and expenses may not be used to estimate the actual ending account balance or expenses you paid for the period. You may use this information to compare the ongoing costs of investing in these Funds and other funds. To do so, compare this 5% hypothetical example with the 5% hypothetical examples that appear in the shareholder reports of the other funds.
Please note that the expenses shown in the table are meant to highlight your ongoing costs only and do not reflect any transactional costs, such as redemption fees or IRA maintenance fees described above or the expenses of the underlying funds. Therefore, the second line of the table is useful in comparing ongoing costs only, and will not help you determine the relative cost of owning different funds. In addition, if these transactional costs were included, your cost could have been higher.
| CORE INVESTMENT | | | | | | |
| |
| | | | | | | Expenses Paid |
| | | Beginning | | Ending | | During the Period* |
| | | Account Value | | Account Value | | June 1, 2014 to |
| | | June 1, 2014 | | November 30, 2014 | | November 30, 2014 |
| |
| Actual | | $1,000.00 | | $1,066.76 | | $7.77 |
| |
| Hypothetical | | $1,000.00 | | $1,017.55 | | $7.59 |
| (5% annual return | | | | | | |
| before expenses) | | | | | | |
* Expenses are equal to the Fund’s annualized expense ratio of 1.50%, multiplied by the average
account value over the period, multiplied by 183/365 (to reflect the one-half year period). |
| GLOBAL DIVIDEND | | | | | | |
| |
| | | | | | | Expenses Paid |
| | | Beginning | | Ending | | During the Period* |
| | | Account Value | | Account Value | | June 1, 2014 to |
| | | June 1, 2014 | | November 30, 2014 | | November 30, 2014 |
| |
| Actual | | $1,000.00 | | $1,000.00 | | $8.77 |
| |
| Hypothetical | | $1,000.00 | | $1,016.29 | | $8.85 |
| (5% annual return | | | | | | |
| before expenses) | | | | | | |
* Expenses are equal to the Fund’s annualized expense ratio of 1.75%, multiplied by the average
account value over the period, multiplied by 183/365 (to reflect the one-half year period). |
2014 Annual Report 24
ADDITIONAL INFORMATION
November 30, 2014
(Unaudited)
AVAILABILITY OF QUARTERLY SCHEDULE OF INVESTMENTS
The Funds file their complete schedules of portfolio holdings with the Securities and Exchange Commission ("SEC") for the first and third quarters of each fiscal year on Form N-Q. The Funds’ Forms N-Q are available on the SEC's website at http://www.sec.gov. The Funds’ Forms N-Q may also be reviewed and copied at the SEC's Public Reference Room in Washington, DC. Information on the operation of the Public Reference Room may be obtained by calling 1-800-SEC-0330.
PROXY VOTING GUIDELINES
Christopher Weil & Company, Inc., the Funds’ Advisor, is responsible for exercising the voting rights associated with the securities held by the Funds. A description of the policies and procedures used by the Advisor in fulfilling this responsibility is available without charge on the Funds’ web site at www.cweil.com. It is also included in the Funds’ Statement of Additional Information, which is available on the Securities and Exchange Commission’s website at http://www.sec.gov.
Information regarding how the Funds voted proxies, Form N-PX, relating to portfolio securities during the most recent 12-month period ended June 30 is available without charge, upon request, by calling our toll free number(1-888-550-9266). This information is also available on the Securities and Exchange Commission’s web site at http://www.sec.gov.
ADDITIONAL INFORMATION
You will find more information about the Funds at www.cweil.com. For shareholder inquiries, please call toll-free in the U.S. at 1-888-550-9266.
2014 Annual Report 25
Cohen Fund Audit Services, Ltd.
1350 Euclid Avenue, Ste 800
Cleveland, Ohio 44115 www.cohenfund.com | 216.649.1700
216.579.0111 fax |
REPORT OF INDEPENDENT REGISTERED PUBLIC ACCOUNTING FIRM
To the Shareholders of
Christopher Weil & Company Core Investment Fund and
Christopher Weil & Company Global Dividend Fund and
Board of Trustees of PFS Funds
We have audited the accompanying statements of assets and liabilities, including the schedules of investments, of Christopher Weil & Company Core Investment Fund and Christopher Weil & Company Global Dividend Fund (the "Funds"), each a series of PFS Funds, as of November 30, 2014, and the related statements of operations for the year then ended, the statements of changes in net assets for each of the two years in the period then ended and the financial highlights for each of the three periods in the period then ended. These financial statements and financial highlights are the responsibility of the Funds' management. Our responsibility is to express an opinion on these financial statements and financial highlights based on our audits.
We conducted our audits in accordance with the standards of the Public Company Accounting Oversight Board (United States). Those standards require that we plan and perform the audit to obtain reasonable assurance about whether the financial statements and financial highlights are free of material misstatement. An audit includes examining, on a test basis, evidence supporting the amounts and disclosures in the financial statements. Our procedures included confirmation of securities owned as of November 30, 2014, by correspondence with the custodian and brokers. An audit also includes assessing the accounting principles used and significant estimates made by management, as well as evaluating the overall financial statement presentation. We believe that our audits provide a reasonable basis for our opinion.
In our opinion, the financial statements and financial highlights referred to above present fairly, in all material respects, the financial position of each of the Funds as of November 30, 2014, the results of their operations for the year then ended, the changes in their net assets for each of the two years in the period then ended and the financial highlights for each of the three periods in the period then ended, in conformity with accounting principles generally accepted in the United States of America.

COHEN FUND AUDIT SERVICES, LTD.
Cleveland, Ohio
January 27, 2015
2014 Annual Report 26
Trustees and Officers
(Unaudited)
The Board of Trustees supervises the business activities of the Trust. The names of the Trustees and executive officers of the Trust are shown below. For more information regarding the Trustees, please refer to the Statement of Additional Information, which is available upon request by calling 1-888-550-9266. Each Trustee serves until the Trustee sooner dies, resigns, retires, or is removed.
The Trustees and Officers of the Trust and their principal business activities during the past five years are:
Interested Trustees and Officers
| | | | | Number of | Other |
| | | | Principal | Portfolios In | Directorships |
| Name, | Position(s) | Term of Office | Occupation(s) | Fund | Held By |
| Address(1), | Held With | and Length of | During | Complex | Trustee or |
| and Year of Birth | the Trust | Time Served | Past 5 Years | Overseen By | Officer |
| | | | | Trustee | |
| |
| Ross C. Provence, | President | Indefinite Term; | General Partner and Portfolio | N/A | N/A |
| Year of Birth: 1938 | | Since 2000 | Manager for Value Trend Capital | | |
| | | | Management, LP (1995 to current). | | |
| | | | Estate planning attorney (1963 to | | |
| current). |
| |
| Jeffrey R. Provence(2), | Trustee, | Indefinite Term; | General Partner and Portfolio | 9 | Blue Chip |
| Year of Birth: 1969 | Secretary | Since 2000 | Manager for Value Trend Capital | | Investor Funds |
| | and | | Management, LP (1995 to current). | | |
| | Treasurer | | CEO, Premier Fund Solutions, Inc. | | |
| | | | (2001 to current). | | |
| |
| Julian G. Winters, | Chief | Chief | Managing Member, Watermark | N/A | N/A |
| Year of Birth: 1968 | Compliance | Compliance | Solutions LLC (investment compli- | | |
| | Officer | Officer Since | ance and consulting) since March | | |
| | | 2010 | 2007. | | |
(1) The address of each trustee and officer is c/o PFS Funds, 1939 Friendship Drive, Suite C, El Cajon, California 92020.
(2) Jeffrey R. Provence is considered an "interested person" as defined in Section 2(a)(19) of the Investment Company Act of 1940 by
virtue of his position with the Trust. |
Independent Trustees
| | | | | Number of | Other |
| | | | Principal | Portfolios In | Directorships |
| Name, | Position | Term of Office | Occupation(s) | Fund | Held By |
| Address(1), | Held With | and Length of | During | Complex | Trustee or |
| and Year of Birth | the Trust | Time Served | Past 5 Years | Overseen By | Officer |
| | | | | Trustee | |
| |
| Thomas H. Addis III, | Independent | Indefinite Term; | Executive Director/CEO, Southern | 9 | None |
| Year of Birth: 1945 | Trustee | Since 2000 | California PGA (2006 to current). | | |
| |
| Allen C. Brown, | Independent | Indefinite Term; | Co-owner of Stebleton & Brown | 9 | Blue Chip |
| Year of Birth: 1943 | Trustee | Since 2010 | (1994 to Current). Estate planning | | Investor Funds |
| | | | and business attorney (1970 to cur- | | |
| rent). |
| |
| George Cossolias, CPA, | Independent | Indefinite Term; | Partner of CWDL, CPAs (February 1, | 9 | Blue Chip |
| Year of Birth: 1935 | Trustee | Since 2000 | 2014 to current). Owner of George | | Investor Funds |
| | | | Cossolias & Company, CPAs (1972 | | |
| | | | to January 31, 2014). President of | | |
| | | | Lubrication Specialists, Inc. (1996 to | | |
| current). |
| | (1) The address of each trustee and officer is c/o PFS Funds, 1939 Friendship Drive, Suite C, El Cajon, California 92020. |
2014 Annual Report 27
This page intentionally left blank.
This page intentionally left blank.
Investment Advisor
Christopher Weil & Company, Inc.
Sub-Advisor
Soledad Investment Management, LLC
(Christopher Weil & Company Global Dividend Fund only)
Custodian
US Bank N.A.
Distributor
Rafferty Capital Markets, LLC
Fund Administrator
Premier Fund Solutions, Inc.
Independent Registered
Public Accounting Firm
Cohen Fund Audit Services, Ltd.
Legal Counsel
The Law Offices of John H. Lively & Associates, Inc.
A member firm of The 1940 Act Law GroupTM
Transfer Agent
Mutual Shareholder Services, LLC |
This report is provided for the general information of the shareholders of the Christopher
Weil & Company Core Investment Fund and the Christopher Weil & Company Global
Dividend Fund. This report is not intended for distribution to prospective investors in the
Funds, unless preceded or accompanied by an effective prospectus.
|
Christopher Weil & Company Funds
12555 High Bluff Drive, Suite 180
San Diego, California 92130
1-888-550-9266 OR 1-800-355-9345
www.cweil.com
Item 2. Code of Ethics.
The registrant has adopted a code of ethics that applies to the registrant’s principal executive officer and the principal financial officer. The registrant has not made any amendments to its code of ethics during the covered period. The registrant has not granted any waivers from any provisions of the code of ethics during the covered period. A copy of the registrant’s Code of Ethics is filed herewith.
Item 3. Audit Committee Financial Expert.
The registrant’s Board of Trustees has determined that George Cossolias is an audit committee finical expert. Mr. Cossolias is independent for purposes of this Item 3.
Item 4. Principal Accountant Fees and Services.
(a-d) The following table details the aggregate fees billed for each of the last two fiscal years for audit fees, audit-related fees, tax fees and other fees by the principal accountant to the registrant. The principal accountant has provided no services to the adviser or any entity controlled by, or under common control with the adviser that provides ongoing services to the registrant.
| | | FYE 11/30/14 | | FYE 11/30/13 |
| Audit Fees | | $25,750 | | $25,700 |
| Audit-Related Fees | | $0 | | $0 |
| Tax Fees | | $5,000 | | $5,000 |
| All Other Fees | | $800 | | $800 |
Nature of Tax Fees: Preparation of Excise Tax Statement and 1120 RIC. Nature of All Other Fees: Review of Semi-Annual Report.
(e) (1) The audit committee approves all audit and non-audit related services and, therefore, has not adopted pre-approval policies and procedures described in paragraph (c)(7) of Rule 2-01 of Regulation S-X.
(e) (2) None of the services described in paragraph (b) through (d) of this Item were approved by the audit committee pursuant to paragraph (c)(7)(i)(C) of Rule 2-01 of Regulation S-X.
(f) All of the principal accountant’s hours spent on auditing the registrant’s financial statements were attributed to work performed by full-time permanent employees of the principal accountant.
(g) The following table indicates the aggregate non-audit fees billed by the registrant’s principal accountant for services to the registrant , the registrant’s investment adviser (not sub-adviser), and any entity controlling, controlled by, or under common control with the adviser that provides ongoing services to the registrant, for the last two years.
| Non-Audit Fees | | FYE 11/30/14 | | FYE 11/30/13 |
| Registrant | | $5,800 | | $5,800 |
| Registrant’s Investment Adviser | | $0 | | $0 |
(h) The principal accountant provided no services to the investment adviser or any entity controlling, controlled by, or under common control with the adviser that provides ongoing services to the registrant.
Item 5. Audit Committee of Listed Companies. Not applicable.
Item 6. Schedule of Investments. Schedule filed with Item 1.
Item 7. Disclosure of Proxy Voting Policies and Procedures for Closed-End Management Investment Companies. Not applicable.
Item 8. Portfolio Managers of Closed End Management Investment Companies. Not applicable.
Item 9. Purchases of Equity Securities by Closed-End Management Investment Companies and Affiliated Purchasers. Not applicable.
Item 10. Submission of Matters to a Vote of Security Holders.
The registrant has not adopted procedures by which shareholders may recommend nominees to the registrant’s board of trustees.
Item 11. Controls and Procedures.
(a) The registrant’s president and chief financial officer concluded that the disclosure controls and procedures (as defined in Rule 30a-3(c) under the Investment Company Act of 1940 (the “Act”)) were effective as of a date within 90 days of the filing date of this report, based on the evaluation of these controls and procedures required by Rule 30a-3(b) under the Act.
(b) There were no changes in the registrant’s internal control over financial reporting (as defined in Rule 30a-3(d) under the Act) that occurred during the registrant’s second fiscal quarter of the period covered by this report that have materially affected, or are reasonably likely to materially affect, the registrant’s internal control over financial reporting.
Item 12. Exhibits.
(a)(1) Code of Ethics. Filed herewith.
(a)(2) Certifications pursuant to Section 302 of the Sarbanes-Oxley Act of 2002. Filed herewith.
(a)(3) Not applicable.
(b) Certification pursuant to Section 906 Certification of the Sarbanes-Oxley Act of 2002. Filed herewith.
SIGNATURES
Pursuant to the requirements of the Securities Exchange Act of 1934 and the Investment Company Act of 1940, the registrant has duly caused this report to be signed on its behalf by the undersigned, thereunto duly authorized.
| | By: /s/Ross C. Provence
Ross C. Provence
President |
Pursuant to the requirements of the Securities Exchange Act of 1934 and the Investment Company Act of 1940, this report has been signed below by the following persons on behalf of the registrant and in the capacities and on the dates indicated.
| | By: /s/Ross C. Provence ��
Ross C. Provence
President |
| | By: /s/Jeffrey R. Provence
Jeffrey R. Provence
Chief Financial Officer |