UNITED STATES
SECURITIES AND EXCHANGE COMMISSION
WASHINGTON, D.C. 20549
FORM N-CSR
CERTIFIED SHAREHOLDER REPORT OF REGISTERED MANAGEMENT INVESTMENT COMPANIES
Investment Company Act file number 811-09781
PFS Funds
(Exact name of registrant as specified in charter)
1939 Friendship Drive, Suite C, El Cajon, CA 92020
(Address of principal executive offices) (Zip code)
CT Corporation System
155 Federal St., Suite 700, Boston, MA 02110
(Name and address of agent for service)
Registrant's telephone number, including area code: (619) 588-9700
Date of fiscal year end: January 31
Date of reporting period: January 31, 2015
Form N-CSR is to be used by management investment companies to file reports with the Commission not later than 10 days after the transmission to stockholders of any report that is required to be transmitted to stockholders under Rule 30e-1 under the Investment Company Act of 1940 (17 CFR 270.30e -1). The Commission may use the information provided on Form N-CSR in its regulatory, disclosure review, inspection and policymaking roles.
A registrant is required to disclose the information specified by Form N-CSR, and the Commission will make this information public. A registrant is not required to respond to the collection of information contained in Form N-CSR unless the Form displays a currently valid Office of Management and Budget ("OMB") control number.
Item 1. Reports to Stockholders.
OUTFITTER FUND
ANNUAL REPORT
January 31, 2015
Outfitter Fund
Annual Report
January 31, 2015
Dear Fellow Shareholder:
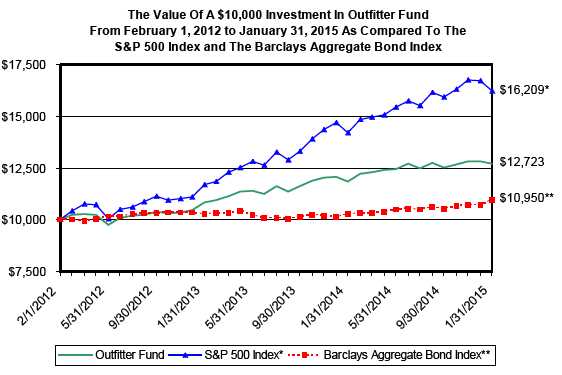
The Outfitter Fund completed its third year of operations, registering a return of 7.42% over the fiscal year that ended January 31, 2015.
We have broad discretion with respect to the investment strategy, and after three years of managing the Fund, its personality has begun to emerge. The Fund is balanced between stocks and bonds, and held a cash position at fiscal year-end of 6% of the Fund's assets. Holding some cash offers purchasing power, or the ability to invest for potentially higher-rates of return if sell-offs occur in stocks or bonds. The trade-off of this strategy was missed returns this past year as stocks & bonds generated gains.
The Outfitter Fund invests in international stocks in both developed and developing economies, representing 8% of the assets at year-end. Investing in non-dollar assets offers currency diversity, and it should enhance net asset value in periods of US dollar weakness, but in periods of US dollar strength, like this past year, international investments are likely to lag US market returns. The international stock index MSCI EAFE was down 0.43% for the one year period ended January 2015.
Taxable municipal bonds were 2% of the Fund's assets at year end, leaving 84% of the Fund's assets in US corporate stocks & bonds. The returns of the US stock & corporate bond market explain most of the return outcome for the Outfitter Fund, with the value we are able to add (or subtract) through the allocation to cash, international stocks, bonds vs. stocks, and individual security selection explaining the rest. US stocks measured by the S&P 500 index were up 14.22% over the Fund's fiscal year and the Barclays Aggregate Bond index gained 6.61% .
The rapid decline in the price of oil & gas late last year impacted the Fund's returns both positively and negatively. Investments in businesses that benefit from low oil prices including industrial company Dupont, paint manufacturer Valspar, and aerospace/defense contractor General Dynamics benefited Fund results. Gains in transportation companies Fed Ex and CSX and in semi-conductor & equipment manufacturers Texas Instruments & Applied Materials were strong performers as well.
Investment in businesses that benefit from high oil prices suffered last year including Chart Industries, Schlumberger, & Hess Corp. The Fund held stakes in non-investment grade bonds issued by oil & gas exploration companies Bill Barrett Corp and Comstock Resources that fell in price last year, but offer good prospects for a rebound this year and well above average income yields.
Low oil prices should support demand for auto related businesses, including German tire and auto parts supplier Continental AG and media company Gannett that sells advertising to auto companies. The fund holds shares in industrial companies like General Electric, Alliant Techsystems, and United Technologies that should benefit from solid demand in the aerospace market.
The Fund's assets are broadly diversified with a bias to investments in US stocks & corporate investment grade bonds that have rewarded shareholders over the three year life of the Fund. In periods when domestic financial markets decline, we expect cash and global diversity to provide some benefit.
Through our company retirement plan and personal account investments in the Outfitter Fund, the employees of Outfitter Financial have a meaningful stake in the Fund. We think the Fund is an outstanding vehicle for us to align interests with our clients, with great transparency. Thank you for letting us be your financial market guide and investing with us!
Benjamin J. Peress
Performance data quoted represents past performance. Past performance does not guarantee future results. The investment return and principal value of an investment will fluctuate so that an investor’s shares, when redeemed, may be worth more or less than their original cost. All returns include change in share prices, and reinvestment of any dividends and capital gains distributions. Current performance may be lower or higher than the performance data quoted. You may obtain performance data current to the most recent month-end by calling 1-888-450-4517. An investment in the fund is subject to investment risks, including the possible loss of the principal amount invested. The fund’s principal underwriter is Rafferty Capital Markets, LLC.
2015 Annual Report 1
OUTFITTER FUND (Unaudited)
PERFORMANCE INFORMATION
January 31, 2015 NAV $12.19
AVERAGE ANNUALIZED RETURNS (%) AS OF JANUARY 31, 2015.
| | | | Since | |
| | 1 Year(A) | | Inception(A) | |
| Outfitter Fund | 7.42% | | 8.37% | |
| S&P 500 Index (B) | 14.22% | | 17.47% | |
| Barclays Aggregate Bond Index(C) | 6.61% | | 3.07% | |
Annual Fund Operating Expense Ratio (from Prospectus dated 6/1/14): Gross - 1.20%, Net - 0.95%
The Annual Operating Expense Ratio reported above will not correlate to the expense ratio in the Fund’s current financial highlights because the financial highlights include only the direct operating expenses incurred by the Fund, not the indirect costs of investing in the Fund. For information regarding the contractual waivers of the Services Agreement fees and Management Agreement fees for the entire fiscal year ended January 31, 2015, please see Note 4 in the Notes to the Financial Statements.
(A)1 Year and Since Inception returns include change in share prices and in each case includes reinvestment of any dividends and capital gain distributions. The inception date of the Outfitter Fund was February 1, 2012.
(B)The S&P 500® Index is a widely recognized unmanaged index of equity prices and is representative of a broader market and range of securities than is found in the Fund’s portfolio. The Index is an unmanaged benchmark that assumes reinvestment of all distributions and excludes the effect of taxes and fees. Individuals cannot invest directly in this Index; however, an individual can invest in exchange traded funds or other investment vehicles that attempt to track the performance of a benchmark index.
(C)The Barclays Aggregate Bond Index is an unmanaged index comprised of U.S. investment grade, fixed rate bond market securities, including government, government agency, corporate and mortgage-backed securities between one and ten years. Index returns assume reinvestment of dividends. Investors may not invest in the Index directly.
PAST PERFORMANCE DOES NOT GUARANTEE FUTURE RESULTS. INVESTMENT RETURN AND PRINCIPAL VALUE WILL FLUCTUATE SO THAT SHARES, WHEN REDEEMED, MAY BE WORTH MORE OR LESS THAN THEIR ORIGINAL COST. RETURNS DO NOT REFLECT THE DEDUCTION OF TAXES THAT A SHAREHOLDER WOULD PAY ON FUND DISTRIBUTIONS OR THE REDEMPTION OF FUND SHARES. CURRENT PERFORMANCE MAY BE LOWER OR HIGHER THAN THE PERFORMANCE DATA QUOTED. TO OBTAIN PERFORMANCE DATA CURRENT TO THE MOST RECENT MONTH-END, PLEASE CALL 1-888-450-4517. THE FUND’S DISTRIBUTOR IS RAFFERTY CAPITAL MARKETS, LLC.
2015 Annual Report 2
OUTFITTER FUND
OUTFITTER FUND
by Security Type
(as a percentage of Net Assets)
(Unaudited)
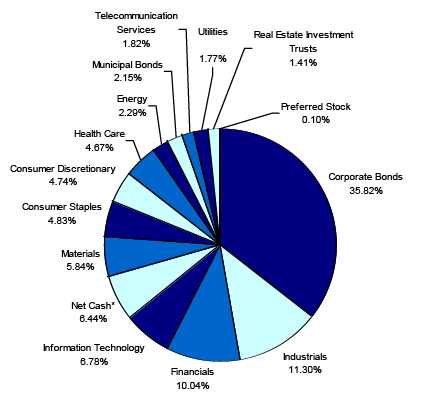
* Net Cash represents cash equivalents and other assets in excess of liabilities.
Availability of Quarterly Schedule of Investments
(Unaudited)
The Fund files its complete schedule of portfolio holdings with the Securities and Exchange Commission ("SEC") for the first and third quarters of each fiscal year on Form N-Q. The Fund’s Form N-Q is available on the SEC's Web site at http://www.sec.gov. The Fund’s Form N-Q may also be reviewed and copied at the SEC's Public Reference Room in Washington, DC. Information on the operation of the Public Reference Room may be obtained by calling 1-800-SEC-0330.
Proxy Voting Guidelines
(Unaudited)
Outfitter Financial Corp., the Fund’s investment advisor (“Advisor”), is responsible for exercising the voting rights associated with the securities held by the Fund. A description of the policies and procedures used by the Advisor in fulfilling this responsibility is available without charge on the Fund’s website at www.outfitterfunds.com. It is also included in the Fund’s Statement of Additional Information, which is available on the SEC’s website at http://www.sec.gov.
Information regarding how the Fund voted proxies, Form N-PX, relating to portfolio securities during the most recent period ended June 30th, is available without charge, upon request, by calling our toll free number (1-888-450-4517). This information is also available on the SEC’s website at http://www.sec.gov.
2015 Annual Report 3
Disclosure of Expenses
(Unaudited)
Shareholders of this Fund incur ongoing costs, consisting of management fees and other Fund expenses. The following example is intended to help you understand your ongoing costs of investing in the Fund and to compare these costs with similar costs of investing in other mutual funds. If shares are redeemed within 90 days of purchase from the Fund, the shares are subject to a 2% redemption fee. Additionally, you will be assessed fees for outgoing wire transfers, returned checks and stop payment orders at prevailing rates charged by Mutual Shareholder Services, LLC, the Fund's transfer agent, and IRA accounts will be charged an $8.00 annual maintenance fee. The example is based on an investment of $1,000 invested at the beginning of the period and held for the entire period from August 1, 2014 to January 31, 2015.
The first line of the table below provides information about actual account values and actual expenses. In order to estimate the expenses a shareholder paid during the period covered by this report, shareholders can divide their account value by $1,000 (for example, an $8,600 account value divided by $1,000 = 8.6) and then multiply the result by the number in the first line under the heading entitled "Expenses Paid During the Period."
The second line of the table below provides information about hypothetical account values and hypothetical expenses based on the Fund's actual expense ratio and an assumed rate of return of 5% per year before expenses, which is not the Fund’s actual return. The hypothetical account values and expenses may not be used to estimate the actual ending account balance or expenses paid by a shareholder for the period. You may use this information to compare the ongoing costs of investing in the Fund and other funds. To do so, compare the 5% hypothetical example with the 5% hypothetical examples that appear in other funds' shareholder reports.
Please note that the expenses shown in the table are meant to highlight your ongoing costs only and do not reflect any transactional costs, such as redemption fees or the charges assessed by Mutual Shareholder Services, LLC as described above or the expenses of underlying funds. Therefore, the second line of the table is useful in comparing ongoing costs only, and will not help you determine the relative total cost of owning different funds. In addition, if these transactional costs were included, your cost could have been higher.
| | | | | | | Expenses Paid |
| | | Beginning | | Ending | | During the Period* |
| | | Account Value | | Account Value | | August 1, 2014 to |
| | | August 1, 2014 | | January 31, 2015 | | January 31, 2015 |
| |
| Actual | | $1,000.00 | | $1,018.55 | | $4.78 |
| |
| Hypothetical | | $1,000.00 | | $1,020.47 | | $4.79 |
| (5% annual return | | | | | | |
| before expenses) | | | | | | |
* Expenses are equal to the Fund’s annualized expense ratio of 0.94%, multiplied
by the average account value over the period, multiplied by 184/365 (to reflect
the one-half year period). |
2015 Annual Report 4
| Outfitter Fund |
| | | | Schedule of Investments |
| | | | January 31, 2015 |
| Shares/Principal Amount | | Fair Value | % of Net Assets |
| COMMON STOCKS | | | | |
| |
| Consumer Discretionary | | | | |
| 6,500 | Continental Aktiengesellschaft ** | $ | 295,685 | | |
| 11,000 | Gannett Co., Inc. | | 341,110 | | |
| 1,600 | PepsiCo, Inc. | | 150,048 | | |
| 3,000 | PetSmart, Inc. | | 245,115 | | |
| Total for Consumer Discretionary | | 1,031,958 | 4.74 | % |
| |
| Consumer Staples | | | | |
| 4,500 | Boulder Brands, Inc. * | | 45,135 | | |
| 4,600 | Cia Brasileira de Distribuicao Grupo Pao de Acucar ** | | 150,926 | | |
| 4,580 | Compañía Cervecerías Unidas S.A. ** | | 83,997 | | |
| 4,000 | The Procter & Gamble Company | | 337,160 | | |
| 10,000 | Unilever N.V. ** | | 433,700 | | |
| Total for Consumer Staples | | 1,050,918 | 4.83 | % |
| |
| Energy | | | | | |
| 2,400 | Bill Barrett Corporation * | | 24,480 | | |
| 2,000 | Hess Corporation | | 134,980 | | |
| 5,000 | Natural Gas Services Group, Inc. * | | 100,950 | | |
| 1,800 | Schlumberger Limited | | 148,302 | | |
| 4,400 | Synergy Resources Corporation * | | 53,812 | | |
| 1,200 | Whiting Petroleum Corporation * | | 36,024 | | |
| Total for Energy | | 498,548 | 2.29 | % |
| |
| Financials | | | | | |
| 2,600 | Berkshire Hathaway Inc. Class B * | | 374,166 | | |
| 6,000 | CBOE Holdings, Inc. | | 386,820 | | |
| 2,400 | CME Group Inc. - Class A | | 204,720 | | |
| 5,400 | Lincoln National Corporation | | 269,892 | | |
| 7,000 | Republic Bancorp, Inc. Class A | | 159,530 | | |
| 4,800 | Royal Bank of Canada (Canada) | | 271,632 | | |
| 23,000 | Susquehanna Bancshares, Inc. | | 290,030 | | |
| 2,900 | T. Rowe Price Group, Inc. | | 228,288 | | |
| Total for Financials | | 2,185,078 | 10.04 | % |
| |
| Health Care | | | | | |
| 4,000 | Accuray Incorporated * | | 29,480 | | |
| 990 | Biogen Idec Inc. * | | 385,268 | | |
| 7,000 | H. Lundbeck A/S ** | | 141,960 | | |
| 4,000 | Merck & Co., Inc. | | 241,120 | | |
| 1,950 | Myriad Genetics, Inc. * | | 72,969 | | |
| 4,000 | NxStage Medical, Inc. * | | 71,560 | | |
| 20,000 | Sequenom, Inc. * | | 73,600 | | |
| Total for Health Care | | 1,015,957 | 4.67 | % |
| |
| Industrials | | | | | |
| 2,000 | Alliant Techsystems Inc. | | 260,620 | | |
| 500 | Chart Industries, Inc. * | | 14,250 | | |
| 10,500 | CSX Corporation | | 349,650 | | |
| 2,500 | Deere & Company | | 212,975 | | |
| 2,000 | FedEx Corporation | | 338,220 | | |
| 2,600 | General Dynamics Corporation | | 346,346 | | |
| 20,000 | General Electric Company | | 477,800 | | |
| 2,500 | The Manitowoc Company, Inc. | | 46,750 | | |
| 6,000 | MYR Group Inc. * | | 150,180 | | |
| 1,200 | Orbital Sciences Corp. * | | 33,708 | | |
| 2,000 | United Technologies Corporation | | 229,560 | | |
| Total for Industrials | | 2,460,059 | 11.30 | % |
* Non-Income Producing Securities.
** ADR - American Depository Receipt.
The accompanying notes are an integral part of these
financial statements. |
2015 Annual Report 5
| Outfitter Fund |
| | | | Schedule of Investments |
| | | | January 31, 2015 |
| Shares/Principal Amount | | Fair Value | % of Net Assets |
| COMMON STOCKS | | | | |
| |
| Information Technology | | | | |
| 14,000 | Applied Materials, Inc. | $ | 319,760 | | |
| 2,200 | comScore, Inc. * | | 91,432 | | |
| 1,950 | FireEye, Inc. * | | 65,930 | | |
| 320 | Google Inc. - Class A * | | 172,016 | | |
| 100 | Google Inc. - Class C * | | 53,452 | | |
| 17,100 | KVH Industries, Inc. * | | 206,910 | | |
| 1,000 | QUALCOMM Incorporated | | 62,460 | | |
| 1,700 | Red Hat, Inc. * | | 108,443 | | |
| 7,400 | Texas Instruments Incorporated | | 395,530 | | |
| Total for Information Technology | | 1,475,933 | 6.78 | % |
| |
| Materials | | | | | |
| 3,000 | Calgon Carbon Corporation * | | 59,190 | | |
| 4,200 | E. I. du Pont de Nemours and Company | | 299,082 | | |
| 1,000 | Monsanto Company | | 117,980 | | |
| 11,500 | Potash Corporation of Saskatchewan Inc. (Canada) | | 420,210 | | |
| 4,500 | The Valspar Corporation | | 375,435 | | |
| Total for Materials | | 1,271,897 | 5.84 | % |
| |
| Telecommunication Services | | | | |
| 5,200 | Consolidated Communications Holdings, Inc. | | 121,056 | | |
| 6,000 | Verizon Communications Inc. | | 274,260 | | |
| Total for Telecommunication Services | | 395,316 | 1.82 | % |
| |
| Utilities | | | | | |
| 5,000 | Dominion Resources, Inc. | | 384,450 | | |
| Total for Utilities | | 384,450 | 1.77 | % |
| |
| Total for Common Stocks (Cost $9,330,309) | | 11,770,114 | 54.08 | % |
| |
| CORPORATE BONDS | | | | |
| 474,000 | Belo Corp. 7.25% 9/15/2027 | | 507,180 | | |
| 250,000 | Bill Barrett Corporation 7.625% 10/1/2019 | | 230,000 | | |
| 300,000 | Citigroup Inc. 5.5% 2/15/2017 | | 323,219 | | |
| 300,000 | Computer Sciences Corp. 6.50% 3/15/2018 | | 335,364 | | |
| 180,000 | Comstock Resources, Inc. 7.75% 4/1/2019 | | 91,800 | | |
| 504,000 | Expedia, Inc. 5.95% 8/15/2020 | | 566,905 | | |
| 350,000 | Ford Motor Credit Company LLC 4.25% 2/3/2017 | | 368,655 | | |
| 150,000 | Ford Motor Credit Company LLC 2.597% 11/4/2019 | | 152,049 | | |
| 100,000 | Freeport-McMoRan Inc. 3.10% 3/15/2020 | | 92,234 | | |
| 70,000 | Gannett Co., Inc. 6.375% 9/1/2015 | | 71,750 | | |
| 237,000 | Gannett Co., Inc. 7.125% 9/1/2018 | | 245,591 | | |
| 300,000 | Gannett Co., Inc. 5.125% 7/15/2020 | | 309,000 | | |
| 475,000 | General Electric Cap Corp. 5.3% 2/11/2021 | | 553,039 | | |
| 250,000 | Goldman Sachs 3.625% 2/7/2016 | | 256,639 | | |
| 200,000 | Goldman Sachs 5.75% 1/24/2022 | | 237,279 | | |
| 300,000 | Hewlett-Packard Company 3.30% 12/9/2016 | | 311,388 | | |
| 400,000 | John Deere Capital Corporation 2.80% 3/4/2021 | | 414,022 | | |
| 470,000 | Microsoft Corp 4.5% 10/1/2040 | | 553,503 | | |
| 64,000 | The New York Times Company 5% 3/15/2015 | | 64,280 | | |
| 308,000 | Plains Exploration & Production, 6.5% 11/15/2020 | | 325,094 | | |
| 475,000 | Tyson Foods, Inc. 4.5% 6/15/2022 | | 531,324 | | |
| 490,000 | Wal-Mart Stores, Inc. 5.25% 9/1/2035 | | 624,584 | | |
| 200,000 | The WhiteWave Foods Company 5.375% 10/1/2022 | | 211,000 | | |
| 440,000 | Whiting Petroleum Corporation 5% 3/15/2019 | | 421,300 | | |
| Total for Corporate Bonds (Cost $7,664,218) | | 7,797,199 | 35.82 | % |
* Non-Income Producing Securities.
The accompanying notes are an integral part of these
financial statements. |
2015 Annual Report 6
| Outfitter Fund |
| | | | Schedule of Investments |
| | | | January 31, 2015 |
| Shares/Principal Amount | | Fair Value | | % of Net Assets |
| |
| PREFERRED STOCK | | | | | |
| 3,000 | Genie Energy Ltd. 7.5% Series 12-A Preferred | $ | 21,450 | | | |
| Total for Preferred Stock (Cost $20,236) | | 21,450 | | 0.10 | % |
| |
| REAL ESTATE INVESTMENT TRUSTS | | | | | |
| 13,000 | Two Harbors Investment Corp. | | 134,160 | | | |
| 6,000 | Washington Real Estate Investment Trust | | 172,260 | | | |
| Total for Real Estate Investment Trusts (Cost $282,794) | | 306,420 | | 1.41 | % |
| |
| MUNICIPAL BONDS | | | | | |
| 30,000 | Cook County Illinois School District No.035 Refunding | | 34,891 | | | |
| | Taxable Series A 5.125% 12/1/2020 | | | | | |
| 100,000 | Fort Lauderdale Florida Special Obligation Pension Funding | | 107,472 | | | |
| | Taxable Bonds 3.574% 1/1/2023 | | | | | |
| 150,000 | Maryland State Economic Development Corporation Refunding | | 153,726 | | | |
| | Aviation Administration Taxable Bonds 2.5% 6/1/2021 | | | | | |
| 40,000 | Massachusetts State Housing Finance Agency Taxable | | 41,243 | | | |
| | Series D 4.782% 12/1/2020 | | | | | |
| 45,000 | North Carolina Housing Finance Agency Revenue Refunding | | 47,413 | | | |
| | Taxable Series 33 3.363% 1/1/2022 | | | | | |
| 40,000 | Oakland California Pension Obligation Taxable Bonds | | 30,260 | | | |
| | 0.0% 12/15/2022 * *** | | | | | |
| 50,000 | Virginia State Housing Development Authority Taxable Rental | | 52,651 | | | |
| | Housing Series E 3.754% 3/1/2021 | | | | | |
| Total for Municipal Bonds (Cost $454,978) | | 467,656 | | 2.15 | % |
| |
| MONEY MARKET FUNDS | | | | | |
| 661,218 | Fidelity Money Market Portfolio Select Class 0.04% **** | | 661,218 | | | |
| 661,218 | Invesco Short-Term Investment Trust Liquid Asset Portfolio | | | | | |
| | Institutional Class 0.07% **** | | 661,218 | | | |
| Total for Money Market Funds (Cost $1,322,436) | | 1,322,436 | | 6.08 | % |
| Total Investment Securities | | 21,685,275 | | 99.64 | % |
| | (Cost $19,074,971) | | | | | |
| Other Assets In Excess of Liabilities | | 78,180 | | 0.36 | % |
| Net Assets | | $ | 21,763,455 | | 100.00 | % |
| | * Non-Income Producing Securities.
*** Zero coupon bond; Interest rate reflects effective yield on the date of purchase.
**** The yield shown represents the 7-day yield at January 31, 2015. |
The accompanying notes are an integral part of these
financial statements. |
2015 Annual Report 7
| Outfitter Fund |
| |
| Statement of Assets and Liabilities | | | |
| January 31, 2015 | | | |
| |
| Assets: | | | |
| Investment Securities at Fair Value | $ | 21,685,275 | |
| (Cost $19,074,971) | | | |
| Cash | | 100 | |
| Interest Receivable | | 133,850 | |
| Dividends Receivable | | 23,396 | |
| Receivable for Shareholder Purchases | | 42,000 | |
| Total Assets | | 21,884,621 | |
| Liabilities: | | | |
| Payable for Securities Purchased | | 103,878 | |
| Due to Advisor | | 17,288 | |
| Total Liabilities | | 121,166 | |
| Net Assets | $ | 21,763,455 | |
| |
| Net Assets Consist of: | | | |
| Paid In Capital | $ | 19,158,282 | |
| Accumulated Undistributed Net Investment Income | | 30,148 | |
| Accumulated Undistributed Realized Gain/(Loss) on Investments - Net | | (35,279 | ) |
| Unrealized Appreciation/(Depreciation) in Value of Investments | | | |
| Based on Identified Cost - Net | | 2,610,304 | |
| Net Assets, for 1,785,423 Shares Outstanding | $ | 21,763,455 | |
| (Unlimited shares authorized, without par value) | | | |
| Net Asset Value and Offering Price Per Share | | | |
| ($21,763,455/1,785,423 shares) | $ | 12.19 | |
| Redemption Price ($12.19 x 0.98) (Note 2) | $ | 11.95 | |
| |
| Statement of Operations | | | |
| For the fiscal year ended January 31, 2015 | | | |
| |
| Investment Income: | | | |
| Dividends (Net of foreign withholding taxes and fees of $8,712) | $ | 238,650 | |
| Interest | | 278,491 | |
| Total Investment Income | | 517,141 | |
| Expenses: | | | |
| Management Fees (Note 4) | | 188,558 | |
| Service Fees (Note 4) | | 47,636 | |
| Total Expenses | | 236,194 | |
| Less: Expenses Waived (Note 4) | | (49,621 | ) |
| Net Expenses | | 186,573 | |
| |
| Net Investment Income/(Loss) | | 330,568 | |
| |
| Realized and Unrealized Gain/(Loss) on Investments: | | | |
| Realized Gain/(Loss) on Investments | | 86,515 | |
| Net Change in Unrealized Appreciation/(Depreciation) on Investments | | 945,674 | |
| Net Realized and Unrealized Gain/(Loss) on Investments | | 1,032,189 | |
| |
| Net Increase/(Decrease) in Net Assets from Operations | $ | 1,362,757 | |
The accompanying notes are an integral part of these
financial statements. |
2015 Annual Report 8
| Outfitter Fund |
| |
| Statements of Changes in Net Assets | | | | | | | |
| | | 2/1/2014 | | | | 2/1/2013 | |
| | | to | | | | to | |
| | | 1/31/2015 | | | | 1/31/2014 | |
| From Operations: | | | | | | | |
| Net Investment Income/(Loss) | $ | 330,568 | | | $ | 275,812 | |
| Net Realized Gain/(Loss) on Investments | | 86,515 | | | | 9,811 | |
| Change in Net Unrealized Appreciation/(Depreciation) | | 945,674 | | | | 1,105,748 | |
| Increase/(Decrease) in Net Assets from Operations | | 1,362,757 | | | | 1,391,371 | |
| From Distributions to Shareholders: | | | | | | | |
| Net Investment Income | | (316,307 | ) | | | (272,192 | ) |
| Net Realized Gain from Security Transactions | | (27,458 | ) | | | (68,388 | ) |
| Change in Net Assets from Distributions | | (343,765 | ) | | | (340,580 | ) |
| From Capital Share Transactions: | | | | | | | |
| Proceeds From Sale of Shares | | 3,188,543 | | | | 1,862,901 | |
| Proceeds From Redemption Fees (Note 2) | | - | | | | - | |
| Shares Issued on Reinvestment of Dividends | | 343,766 | | | | 340,581 | |
| Cost of Shares Redeemed | | (280,596 | ) | | | (252,602 | ) |
| Net Increase/(Decrease) from Shareholder Activity | | 3,251,713 | | | | 1,950,880 | |
| Net Increase/(Decrease) in Net Assets | | 4,270,705 | | | | 3,001,671 | |
| Net Assets at Beginning of Period | | 17,492,750 | | | | 14,491,079 | |
| Net Assets at End of Period (Including Accumulated Undistributed Net | | | | | | | |
| Investment Income of $30,148 and $15,887, respectively) | $ | 21,763,455 | | | $ | 17,492,750 | |
| Share Transactions: | | | | | | | |
| Issued | | 263,103 | | | | 162,095 | |
| Reinvested | | 27,813 | | | | 29,035 | |
| Redeemed | | (23,247 | ) | | | (22,674 | ) |
| Net Increase in Shares | | 267,669 | | | | 168,456 | |
| Shares Outstanding Beginning of Period | | 1,517,754 | | | | 1,349,298 | |
| Shares Outstanding End of Period | | 1,785,423 | | | | 1,517,754 | |
The accompanying notes are an integral part of these
financial statements. |
2015 Annual Report 9
| Outfitter Fund |
| | |
| Financial Highlights | | | | | | | | | | | | |
| Selected data for a share outstanding throughout the period: | | 2/1/2014 | | | | 2/1/2013 | | | | 2/1/2012* | | |
| | | to | | | | to | | | | to | | |
| | | 1/31/2015 | | | | 1/31/2014 | | | | 1/31/2013 | | |
| Net Asset Value - | | | | | | | | | | | | |
| Beginning of Period | $ | 11.53 | | | $ | 10.74 | | | $ | 10.00 | | |
| Net Investment Income/(Loss) (a) | | 0.20 | | | | 0.20 | | | | 0.18 | | |
| Net Gain/(Loss) on Securities | | | | | | | | | | | | |
| (Realized and Unrealized) (b) | | 0.66 | | | | 0.83 | | | | 0.64 | | |
| Total from Investment Operations | | 0.86 | | | | 1.03 | | | | 0.82 | | |
| Distributions (From Net Investment Income) | | (0.18 | ) | | | (0.19 | ) | | | (0.08 | ) | |
| Distributions (From Realized Capital Gains) | | (0.02 | ) | | | (0.05 | ) | | | - | | |
| Total Distributions | | (0.20 | ) | | | (0.24 | ) | | | (0.08 | ) | |
| Proceeds from Redemption Fee (Note 2) | | - | | | | - | | | | - | | + |
| Net Asset Value - | | | | | | | | | | | | |
| End of Period | $ | 12.19 | | | $ | 11.53 | | | $ | 10.74 | | |
| Total Return(c) | | 7.42% | | | | 9.49% | | | | 8.18% | | |
| Ratios/Supplemental Data | | | | | | | | | | | | |
| Net Assets - End of Period (Thousands) | $ | 21,763 | | | $ | 17,493 | | | $ | 14,491 | | |
| Before Waiver | | | | | | | | | | | | |
| Ratio of Expenses to Average Net Assets (d) | | 1.19% | | | | 1.19% | | | | 1.19% | | |
| Ratio of Net Investment Income/(Loss) to Average Net Assets (d) | | 1.42% | | | | 1.44% | | | | 1.39% | | |
| After Waiver | | | | | | | | | | | | |
| Ratio of Expenses to Average Net Assets (d) | | 0.94% | | | | 0.91% | | | | 0.87% | | |
| Ratio of Net Investment Income/(Loss) to Average Net Assets (d) | | 1.67% | | | | 1.72% | | | | 1.71% | | |
| Portfolio Turnover Rate | | 19.45% | | | | 20.61% | | | | 14.65% | | |
| | * Commencement of Operations.
+ Amount calculated is less than $0.005.
(a) Per share amounts were calculated using the average shares method.
(b) Realized and unrealized gains and losses per share in this caption are balancing amounts necessary to
reconcile the change in net asset value for the period, and may not reconcile with the aggregate gains and
losses in the Statement of Operations due to share transactions for the period.
(c) Total return in the above table represents the rate that the investor would have earned or lost on an
investment in the Fund assuming reinvestment of dividends and distributions.
(d) These ratios exclude the impact of expenses of the underlying security holdings listed in the Schedule
of Investments. |
The accompanying notes are an integral part of these
financial statements. |
2015 Annual Report 10
NOTES TO FINANCIAL STATEMENTS
OUTFITTER FUND
January 31, 2015
1.) ORGANIZATION:
Outfitter Fund (the "Fund") was organized as a non-diversified series of the PFS Funds (the "Trust") on December 16, 2011. The Trust was established under the laws of Massachusetts by an Agreement and Declaration of Trust dated January 13, 2000, which was amended and restated January 20, 2011. Prior to March 5, 2010, the Trust was named Wireless Fund. The Trust is registered as an open-end investment company under the Investment Company Act of 1940, as amended (the “1940 Act”). The Trust may offer an unlimited number of shares of beneficial interest in a number of separate series, each series representing a distinct fund with its own investment objectives and policies. As of January 31, 2015, there were nine series authorized by the Trust. The Fund commenced operations on February 1, 2012. The investment advisor to the Fund is Outfitter Financial Corp. (the “Advisor”). The Fund seeks long-term capital appreciation as its primary objective, and investment income as the secondary objective.
2.) SIGNIFICANT ACCOUNTING POLICIES:
SECURITY VALUATION:
All investments in securities are recorded at their estimated fair value, as described in Note 3.
FEDERAL INCOME TAXES:
The Fund’s policy is to continue to comply with the requirements of the Internal Revenue Code that are applicable to regulated investment companies and to distribute all of its taxable income to shareholders. Therefore, no federal income tax provision is required. It is the Fund’s policy to distribute annually, prior to the end of the calendar year, dividends sufficient to satisfy excise tax requirements of the Internal Revenue Code. This Internal Revenue Code requirement may cause an excess of distributions over the book year-end accumulated income. In addition, it is the Fund’s policy to distribute annually, after the end of the fiscal year, any remaining net investment income and net realized capital gains.
The Fund recognizes the tax benefits of certain tax positions only where the position is “more likely than not” to be sustained assuming examination by tax authorities. Management has analyzed the Fund’s tax positions, and has concluded that no liability for unrecognized tax benefits should be recorded related to uncertain tax positions taken on returns filed for the open tax years (2012-2013), or expected to be taken in the Fund’s 2014 tax returns. The Fund identifies its major tax jurisdictions as U.S. Federal tax authorities; however, the Fund is not aware of any tax positions for which it is reasonably possible that the total amounts of unrecognized tax benefits will change materially in the next twelve months. The Fund recognizes interest and penalties, if any, related to unrecognized tax benefits as income tax expense in the statement of operations. During the fiscal year ended January 31, 2015, the Fund did not incur any interest or penalties.
SHARE VALUATION:
The net asset value per share of the Fund is calculated daily by dividing the total value of the Fund’s assets, less liabilities, by the number of shares outstanding, rounded to the nearest cent. The offering and redemption price per share is equal to the net asset value per share, except that shares of the Fund are subject to a redemption fee of 2% if redeemed after holding them for 90 days or less. During the fiscal year ended January 31, 2015, proceeds from redemption fees amounted to $0.
DISTRIBUTIONS TO SHAREHOLDERS:
Distributions to shareholders, which are determined in accordance with income tax regulations, are recorded on the ex-dividend date.
The treatment for financial reporting purposes of distributions made to shareholders during the year from net investment income or net realized capital gains may differ from their ultimate treatment for federal income tax purposes. These differences are caused primarily by differences in the timing of the recognition of certain components of income, expense, or realized capital gain for federal income tax purposes. Where such differences are permanent in nature, they are reclassified in the components of the net assets based on their ultimate characterization for federal income tax purposes. Any such reclassifications will have no effect on net assets, results of operations, or net asset value per share of the Fund.
2015 Annual Report 11
Notes to Financial Statements - continued
USE OF ESTIMATES:
The preparation of financial statements in conformity with accounting principles generally accepted in the United States of America (“GAAP”) requires management to make estimates and assumptions that affect the reported amounts of assets and liabilities and disclosure of contingent assets and liabilities at the date of the financial statements and the reported amounts of increases and decreases in net assets from operations during the reporting period. Actual results could differ from those estimates.
OTHER:
The Fund records security transactions based on the trade date. Dividend income is recognized on the ex-dividend date. Interest income is recognized on an accrual basis. The Fund uses the specific identification method in computing gain or loss on the sale of investment securities. Discounts and premiums on securities purchased are accreted and amortized over the life of the respective securities. The ability of issuers of debt securities held by the Fund to meet their obligations may be affected by economic and political developments in a specific country or region. Withholding taxes on foreign dividends have been provided for in accordance with the Fund’s understanding of the applicable country’s tax rules and rates. The Fund may invest in real estate investment trusts (REITs) that pay distributions to their shareholders based on available funds from operations. It is common for these distributions to exceed the REITs taxable earnings and profits resulting in the excess portion of such distribution to be designated as return of capital. Distributions received from REITs are generally recorded as dividend income and, if necessary, are reclassified annually in accordance with tax information provided by the underlying REITs.
EXPENSES:
Expenses incurred by the Trust that do not relate to a specific fund of the Trust are allocated to the individual funds based on each fund’s relative net assets or another appropriate basis.
3.) SECURITIES VALUATIONS:
As described in Note 2, the Fund utilizes various methods to measure the fair value of its investments on a recurring basis. GAAP establishes a hierarchy that prioritizes inputs to valuation methods. The three levels of inputs are:
Level 1 - Unadjusted quoted prices in active markets for identical assets or liabilities that the Fund has the ability to access.
Level 2 - Observable inputs other than quoted prices included as level 1 that are observable for the asset or liability, either directly or indirectly. These inputs may include quoted prices for the identical instrument on an inactive market, prices for similar instruments, interest rates, prepayment speeds, credit risk, yield curves, default rates and similar data.
Level 3 - Unobservable inputs for the asset or liability, to the extent relevant observable inputs are not available, representing the Fund’s own assumptions about the assumptions a market participant would use in valuing the asset or liability, and would be based on the best information available.
The availability of observable inputs can vary from security to security and is affected by a wide variety of factors, including, for example, the type of security, whether the security is new and not yet established in the marketplace, the liquidity of markets, and other characteristics particular to the security. To the extent that valuation is based on models or inputs that are less observable or unobservable in the market, the determination of fair value requires more judgment. Accordingly, the degree of judgment exercised in determining fair value is greatest for instruments categorized as level 3.
The inputs used to measure fair value may fall into different levels of the fair value hierarchy. In such cases, for disclosure purposes, the level in the fair value hierarchy within which the fair value measurement falls in its entirety, is determined based on the lowest level input that is significant to the fair value measurement in its entirety.
FAIR VALUE MEASUREMENTS:
A description of the valuation techniques applied to the Fund’s major categories of assets measured at fair value on a recurring basis follows.
2015 Annual Report 12
Notes to Financial Statements - continued
Equity securities (including common stocks, ADRs, preferred stock and real estate investment trusts). Equity securities are carried at fair value. The market quotation used for common stocks, including those listed on the NASDAQ National Market System, is the last sale price on the date on which the valuation is made or, in the absence of sales, at the closing bid price. Over-the-counter securities will be valued on the basis of the bid price at the close of each business day. Generally, if the security is traded in an active market and is valued at the last sale price, the security is categorized as a level 1 security. When the security position is not considered to be part of an active market or when the security is valued at the bid price, the position is generally categorized as level 2. When market quotations are not readily available, when the Advisor determines the last bid price does not accurately reflect the current value or when restricted securities are being valued, such securities are valued as determined in good faith by the Advisor, in conformity with guidelines adopted by and subject to review of the Board of Trustees (the “Trustees”) and are categorized as level 2 or level 3, when appropriate.
Money market funds. Shares of money market funds are valued at net asset value and are classified as level 1 of the fair value hierarchy.
Fixed income securities (including corporate bonds and municipal bonds). Fixed income securities generally are valued by using market quotations, but may be valued on the basis of prices furnished by a pricing service when the Advisor believes such prices accurately reflect the fair value of such securities. A pricing service utilizes electronic data processing techniques based on yield spreads relating to securities with similar characteristics to determine prices for normal institutional-size trading units of debt securities without regard to sale or bid prices. When prices are not readily available from a pricing service, or when restricted or illiquid securities are being valued, securities are valued at fair value as determined in good faith by the Advisor, in conformity with guidelines adopted by and subject to review of the Trustees. Short-term investments in fixed income securities with maturities of less than 60 days when acquired, or which subsequently are within 60 days of maturity, are valued by using the amortized cost method of valuation. Generally, fixed income securities are categorized as level 2.
In accordance with the Trust's good faith pricing guidelines, the Advisor is required to consider all appropriate factors relevant to the value of securities for which it has determined other pricing sources are not available or reliable as described above. There is no standard procedure for determining fair value, since fair value depends upon the circumstances of each individual case. As a general principle, the current fair value of an issue of securities being valued by the Advisor would appear to be the amount which the owner might reasonably expect to receive for them upon their current sale. Methods which are in accordance with this principle may, for example, be based on (i) a multiple of earnings; (ii) a discount from market of a similar freely traded security (including a derivative security or a basket of securities traded on other markets, exchanges or among dealers); or (iii) yield to maturity with respect to debt issues, or a combination of these and other methods.
The following table summarizes the inputs used to value the Fund’s assets measured at fair value as of January 31, 2015:
| Valuation Inputs of Assets | | Level 1 | | Level 2 | | Level 3 | | Total |
| Common Stocks | | $11,770,114 | | $ 0 | | $0 | | $11,770,114 |
| Corporate Bonds | | 0 | | 7,797,199 | | 0 | | 7,797,199 |
| Preferred Stock | | 21,450 | | 0 | | 0 | | 21,450 |
| Real Estate Investment Trusts | | 306,420 | | 0 | | 0 | | 306,420 |
| Municipal Bonds | | 0 | | 467,656 | | 0 | | 467,656 |
| Money Market Funds | | 1,322,436 | | 0 | | 0 | | 1,322,436 |
| Total | | $13,420,420 | | $ 8,264,855 | | $0 | | $21,685,275 |
Refer to the Fund’s Schedule of Investments for a listing of securities by industry. The Fund did not hold any Level 3 assets during the fiscal year ended January 31, 2015. There were no transfers into or out of the levels during the fiscal year ended January 31, 2015. It is the Fund’s policy to consider transfers into or out of the levels as of the end of the reporting period.
The Fund did not invest in any derivative instruments during the fiscal year ended January 31, 2015.
4.) INVESTMENT ADVISORY AGREEMENT AND SERVICES AGREEMENT:
The Advisor provides management services to the Fund pursuant to the Management
2015 Annual Report 13
Notes to Financial Statements - continued
Agreement (“Agreement”). The Advisor manages the investment portfolio of the Fund, subject to policies adopted by the Trust's Board of Trustees. Under the Agreement, the Advisor, at its own expense and without reimbursement from the Trust, furnishes office space and all necessary office facilities, equipment and executive personnel necessary for managing the assets of the Fund. For its services the Advisor receives an investment management fee equal to 0.95% of the average daily net assets of the Fund.
Additionally, the Advisor provides other services to the Fund pursuant to the Services Agreement (“Services Agreement”). Under the Services Agreement the Advisor receives an additional fee of 0.24% of the average daily net assets of the Fund and is obligated to pay the operating expenses of the Fund excluding management fees, brokerage fees and commissions, taxes, borrowing costs (such as (a) interest and (b) dividend expenses on securities sold short), ADR fees, fees and expenses of acquired funds, and extraordinary or non-recurring expenses as may arise, including litigation to which the Fund may be a party and indemnification of the Trust’s Trustees and officers.
From the period June 1, 2013 through May 31, 2014, and as renewed on June 1, 2014, the Adviser has contractually agreed to waive Services Agreement fees and Management Agreement fees and/or reimburse the Fund for expenses it incurs to the extent necessary to maintain the total annual operating expenses of the Fund (excluding brokerage fees and commissions, 12b-1 fees, taxes, borrowing costs (such as (a) interest and (b) dividend expenses on securities sold short), ADR fees, the cost of acquired funds and extraordinary expenses) at 0.94% of its average daily net assets. This wavier will extend through May 31, 2015. This arrangement may not be terminated by the Advisor prior to the end of the terms described in this footnote. From June 18, 2012 through May 31, 2013, the Advisor had contractually agreed to waive Services Agreement fees and Management Agreement fees and/or reimburse the Fund for expenses it incurs during that period, but only to the extent necessary to maintain the total annual operating expenses of the Fund (excluding brokerage fees and commissions, 12b-1 fees, taxes, borrowing costs (such as (a) interest and (b) dividend expenses on securities sold short), ADR fees, the cost of acquired funds and extraordinary expenses) at 0.84% of its average daily net assets for that period. Such waivers have no provision for recoupment by the Advisor. Prior to June 18, 2012, there were no waiver agreements.
For the fiscal year ended January 31, 2015, the Advisor earned management fees totaling $188,558 and service fees totaling $47,636. For the same period the Advisor waived service fees and management fees totaling $49,621. As a result of the advisory fees and services fees, net of the waiver noted above, as of January 31, 2015, the Fund owed the Advisor $17,288.
5.) RELATED PARTY TRANSACTIONS:
Jeffrey R. Provence of Premier Fund Solutions, Inc. (the “Administrator”) also serves as trustee/officer of the Fund. This individual receives benefits from the Administrator resulting from administration fees paid to the Administrator of the Fund by the Advisor.
The Trustees who are not interested persons of the Fund were each paid $1,000 for a total of $3,000 in Trustee fees for the fiscal year ended January 31, 2015.
6.) CAPITAL SHARES:
The Trust is authorized to issue an unlimited number of shares of beneficial interest for the Fund. Paid in capital for the Fund at January 31, 2015 was $19,158,282 representing 1,785,423 shares outstanding.
7.) PURCHASES AND SALES OF SECURITIES:
For the fiscal year ended January 31, 2015, purchases and sales of investment securities other than U.S. Government obligations and short-term investments aggregated $6,523,821 and $3,634,187, respectively. Purchases and sales of U.S. Government obligations aggregated $0 and $0, respectively.
8.) BENEFICIAL OWNERSHIP:
The beneficial ownership, either directly or indirectly, of more than 25% of the voting securities of a fund creates a presumption of control of a fund, under Section 2(a)(9) of the Investment Company Act of 1940. As of January 31, 2015, RBC Capital Markets Corp. located at 60 South Sixth Street, Minneapolis, Minnesota 55402, for the benefit of its clients, held, in aggregate, 75.37% of the shares of the Fund. An underlying account of RBC Capital Markets Corp. is held in the name of Wayne Laufer Revocable Trust, 4989 Joewood Drive, Sanibel, Florida 33957 - as
2015 Annual Report 14
Notes to Financial Statements - continued
of January 31, 2015, this underlying account held (indirectly) 37.77% of the shares of the Fund. Other than the aforementioned underlying account, the Trust does not know whether any other underlying beneficial holders owned or controlled 25% or more of the voting securities of the Fund.
9.) TAX MATTERS:
For Federal income tax purposes, the cost of investments owned at January 31, 2015 was $19,111,172. At January 31, 2015, the composition of unrealized appreciation (the excess of value over tax cost) and depreciation (the excess of tax cost over value) was as follows:
| | Appreciation | | (Depreciation) | | Net Appreciation (Depreciation) |
| | $2,972,195 | | ($398,092) | | $2,574,103 |
For the fiscal year ended January 31, 2015, there was a distribution from ordinary income of $0.18247 per share, long term capital gains of $0.01557 per share and short term capital gains of $0.00027 per share paid on December 26, 2014 to the shareholders of record on December 24, 2014.
| The tax character of distributions was as follows: | | |
| |
| | | Fiscal Year Ended | | Fiscal Year Ended |
| | | January 31, 2015 | | January 31, 2014 |
| Ordinary Income . | | $ 316,775 | | $ 313,076 |
| Long-Term Capital Gain | | 26,990 | | 27,504 |
| | | $ 343,765 | | $ 340,580 |
As of January 31, 2015, the components of distributable earnings (accumulated losses) on a tax basis were as follows:
| Undistributed ordinary income/(accumulated losses) | | $ 30,148 |
| Undistributed long-term capital gain/(accumulated losses) | | 922 |
| Unrealized appreciation/(depreciation) | | 2,574,103 |
| | | $ 2,605,173 |
Differences between book basis and tax basis unrealized appreciation/(depreciation) are primarily attributable to the tax deferral of wash sales and deferred post-October losses. Post-October losses totaled $8,276.
10.) PRINCIPAL RISKS:
The Fund may invest in a variety of securities described in its prospectus, including municipal securities. With respect to investments in municipal securities, the Fund is therefore more susceptible to political, economic, legislative, or regulatory factors adversely affecting issuers of municipal securities. Interest rate risk is the risk that bond prices will decline in value because of changes in interest rates. There is normally an inverse relationship between the fair value of securities sensitive to prevailing interest rates and actual changes in interest rates. The longer the average maturity of the Fund's portfolio, the greater its interest rate risk. A more indepth discussion of the Fund's principal investment strategies and risks is contained in the Fund's prospectus, which investors may obtain free of charge by contacting the Fund.
2015 Annual Report 15
This page was intentionally left blank.
2015 Annual Report 16
Cohen Fund Audit Services, Ltd.
1350 Euclid Avenue, Ste 800
Cleveland, Ohio 44115 www.cohenfund.com | 216.649.1700
216.579.0111 fax |
REPORT OF INDEPENDENT REGISTERED PUBLIC ACCOUNTING FIRM
To the Shareholders of Outfitter Fund and
Board of Trustees of PFS Funds
We have audited the accompanying statement of assets and liabilities, including the schedule of investments, of Outfitter Fund (the "Fund"), a series of PFS Funds, as of January 31, 2015, and the related statement of operations for the year then ended, the statements of changes in net assets for each of the two years in the period then ended and the financial highlights for each of the three years in the period then ended. These financial statements and financial highlights are the responsibility of the Fund's management. Our responsibility is to express an opinion on these financial statements and financial highlights based on our audits.
We conducted our audits in accordance with the standards of the Public Company Accounting Oversight Board (United States). Those standards require that we plan and perform the audit to obtain reasonable assurance about whether the financial statements and financial highlights are free of material misstatement. An audit includes examining, on a test basis, evidence supporting the amounts and disclosures in the financial statements. Our procedures included confirmation of securities owned as of January 31, 2015, by correspondence with the custodian and brokers. An audit also includes assessing the accounting principles used and significant estimates made by management, as well as evaluating the overall financial statement presentation. We believe that our audits provide a reasonable basis for our opinion.
In our opinion, the financial statements and financial highlights referred to above present fairly, in all material respects, the financial position of Outfitter Fund as of January 31, 2015, the results of its operations for the year then ended, the changes in its net assets for each of the two years in the period then ended and the financial highlights for each of the three years in the period then ended, in conformity with accounting principles generally accepted in the United States of America.

COHEN FUND AUDIT SERVICES, LTD.
Cleveland, Ohio
March 30, 2015
2015 Annual Report 17
Trustees and Officers
(Unaudited)
The Board of Trustees supervises the business activities of the Trust. The names of the Trustees and executive officers of the Trust are shown below. For more information regarding the Trustees, please refer to the Statement of Additional Information, which is available upon request by calling 1-888-450-4517. Each Trustee serves until the Trustee sooner dies, resigns, retires, or is removed.
The Trustees and Officers of the Trust and their principal business activities during the past five years are:
Interested Trustees and Officers
| | | | | Number of | |
| | | | Principal | Portfolios In | Other |
| Name, | Position(s) | Term of Office | Occupation(s) | Fund | Directorships |
| Address(1), | Held With | and Length of | During | Complex | Held By |
| and Year of Birth | the Trust | Time Served | Past 5 Years | Overseen By | Trustee |
| | | | | Trustee | |
| |
| Ross C. Provence, | President | Indefinite Term; | General Partner and Portfolio | N/A | N/A |
| Year of Birth: 1938 | | Since 2000 | Manager for Value Trend Capital | | |
| | | | Management, LP (1995 to current). | | |
| | | | Estate planning attorney (1963 to | | |
| current). |
| |
| Jeffrey R. Provence(2), | Trustee, | Indefinite Term; | General Partner and Portfolio | 9 | Blue Chip |
| Year of Birth:1969 | Secretary | Since 2000 | Manager for Value Trend Capital | | Investor Funds |
| | and | | Management, LP (1995 to current). | | |
| | Treasurer | | CEO, Premier Fund Solutions, Inc. | | |
| | | | (2001 to current). | | |
| |
| Julian G. Winters, | Chief | Chief | Managing Member, Watermark | N/A | N/A |
| Year of Birth: 1968 | Compliance | Compliance | Solutions LLC (investment compli- | | |
| | Officer | Officer Since | ance and consulting) since March | | |
| | | 2010 | 2007. | | |
(1) The address of each trustee and officer is c/o PFS Funds, 1939 Friendship Drive, Suite C, El Cajon, California 92020.
(2) Jeffrey R. Provence is considered an "interested person" as defined in Section 2(a)(19) of the Investment Company Act of 1940 by
virtue of his position with the Trust.
Independent Trustees
|
| | | | | Number of | |
| | | | Principal | Portfolios In | Other |
| Name, | Position | Term of Office | Occupation(s) | Fund | Directorships |
| Address(1), | Held With | and Length of | During | Complex | Held By |
| and Year of Birth | the Trust | Time Served | Past 5 Years | Overseen By | Trustee |
| | | | | Trustee | |
| |
| Thomas H. Addis III, | Independent | Indefinite Term; | Executive Director/CEO, Southern | 9 | None |
| Year of Birth: 1945 | Trustee | Since 2000 | California PGA (2006 to current). | | |
| |
| Allen C. Brown, | Independent | Indefinite Term; | Co-owner of Stebleton & Brown | 9 | Blue Chip |
| Year of Birth: 1943 | Trustee | Since 2010 | (1994 to Current). Estate planning | | Investor Funds |
| | | | and business attorney (1970 to cur- | | |
| rent). |
| |
| George Cossolias, CPA, | Independent | Indefinite Term; | Partner of CWDL, CPAs (February 1, | 9 | Blue Chip |
| Year of Birth: 1935 | Trustee | Since 2000 | 2014 to current). Owner of George | | Investor Funds |
| | | | Cossolias & Company, CPAs (1972 | | |
| | | | to January 31, 2014). President of | | |
| | | | LubricationSpecialists, Inc. (1996 to | | |
| current). |
(1) The address of each trustee and officer is c/o PFS Funds, 1939 Friendship Drive, Suite C, El Cajon, California 92020.
2015 Annual Report 18
Board of Trustees
Thomas H. Addis III
Allen C. Brown
George Cossolias, CPA
Jeffrey R. Provence
Investment Advisor
Outfitter Financial Corp.
Legal Counsel
The Law Offices of John H. Lively & Associates, Inc.
A member of The 1940 Act Law GroupTM
Custodian
US Bank N.A.
Dividend Paying Agent,
Shareholders' Servicing Agent,
Transfer Agent
Mutual Shareholder Services, LLC
Administrator
Premier Fund Solutions, Inc.
Independent Registered Public Accounting Firm
Cohen Fund Audit Services, Ltd.
Distributor
Rafferty Capital Markets, LLC |
This report is provided for the general information of the shareholders of the Outfitter
Fund. This report is not intended for distribution to prospective investors in the Fund,
unless preceded or accompanied by an effective prospectus. |
OUTFITTER FUND
1497 Chain Bridge Road
McLean, VA 22101
Item 2. Code of Ethics.
The registrant has adopted a code of ethics that applies to the registrant’s principal executive officer and the principal financial officer. The registrant has not made any amendments to its code of ethics during the covered period. The registrant has not granted any waivers from any provisions of the code of ethics during the covered period. A copy of the registrant’s Code of Ethics is filed herewith.
Item 3. Audit Committee Financial Expert.
The registrant’s Board of Trustees has determined that George Cossolias is an audit committee finical expert. Mr. Cossolias is independent for purposes of this Item 3.
Item 4. Principal Accountant Fees and Services.
(a-d) The following table details the aggregate fees billed for each of the last two fiscal years for audit fees, audit-related fees, tax fees and other fees by the principal accountant to the registrant. The principal accountant has provided no services to the adviser or any entity controlled by, or under common control with the adviser that provides ongoing services to the registrant.
| | | FYE 1/31/15 | | FYE 1/31/14 |
| Audit Fees | | $13,250 | | $13,250 |
| Audit-Related Fees | | $0 | | $0 |
| Tax Fees | | $2,500 | | $2,500 |
| All Other Fees | | $500 | | $500 |
Nature of Tax Fees: preparation of Excise Tax Statement and 1120 RIC. Nature of All Other Fees: Review of Semi-Annual Report.
(e) (1) The audit committee approves all audit and non-audit related services and, therefore, has not adopted pre-approval policies and procedures described in paragraph (c)(7) of Rule 2-01 of Regulation S-X.
(e) (2) None of the services described in paragraph (b) through (d) of this Item were approved by the audit committee pursuant to paragraph (c)(7)(i)(C) of Rule 2-01 of Regulation S-X.
(f) All of the principal accountant’s hours spent on auditing the registrant’s financial statements were attributed to work performed by full-time permanent employees of the principal accountant.
(g) The following table indicates the aggregate non-audit fees billed by the registrant’s principal accountant for services to the registrant , the registrant’s investment adviser (not sub-adviser), and any entity controlling, controlled by, or under common control with the adviser that provides ongoing services to the registrant, for the last two years.
| Non-Audit Fees | | FYE 1/31/15 | | FYE 1/31/14 |
| Registrant | | $3,000 | | $3,000 |
| Registrant’s Investment Adviser | | $0 | | $0 |
(h) The principal accountant provided no services to the investment adviser or any entity controlling, controlled by, or under common control with the adviser that provides ongoing services to the registrant.
Item 5. Audit Committee of Listed Companies. Not applicable.
Item 6. Schedule of Investments. Schedule filed with Item 1.
Item 7. Disclosure of Proxy Voting Policies and Procedures for Closed-End Management Investment Companies. Not applicable.
Item 8. Portfolio Managers of Closed End Management Investment Companies. Not applicable.
Item 9. Purchases of Equity Securities by Closed-End Management Investment Companies and Affiliated Purchasers. Not applicable.
Item 10. Submission of Matters to a Vote of Security Holders.
The registrant has not adopted procedures by which shareholders may recommend nominees to the registrant’s board of trustees.
Item 11. Controls and Procedures.
(a) The registrant’s president and chief financial officer concluded that the disclosure controls and procedures (as defined in Rule 30a-3(c) under the Investment Company Act of 1940 (the “Act”)) were effective as of a date within 90 days of the filing date of this report, based on the evaluation of these controls and procedures required by Rule 30a-3(b) under the Act.
(b) There were no changes in the registrant’s internal control over financial reporting (as defined in Rule 30a-3(d) under the Act) that occurred during the registrant’s second fiscal quarter of the period covered by this report that have materially affected, or are reasonably likely to materially affect, the registrant’s internal control over financial reporting.
Item 12. Exhibits.
(a)(1) Code of Ethics. Filed herewith.
(a)(2) Certifications pursuant to Section 302 of the Sarbanes-Oxley Act of 2002. Filed herewith.
(a)(3) Not applicable.
(b) Certification pursuant to Section 906 Certification of the Sarbanes-Oxley Act of 2002. Filed herewith.
SIGNATURES
Pursuant to the requirements of the Securities Exchange Act of 1934 and the Investment Company Act of 1940, the registrant has duly caused this report to be signed on its behalf by the undersigned, thereunto duly authorized.
| | By: /s/Ross C. Provence
Ross C. Provence
President |
Pursuant to the requirements of the Securities Exchange Act of 1934 and the Investment Company Act of 1940, this report has been signed below by the following persons on behalf of the registrant and in the capacities and on the dates indicated.
| | By: /s/Ross C. Provence
Ross C. Provence
President |
| | By: /s/Jeffrey R. Provence
Jeffrey R. Provence
Chief Financial Officer |