UNITED STATES
SECURITIES AND EXCHANGE COMMISSION
WASHINGTON, D.C. 20549
FORM N-CSR
CERTIFIED SHAREHOLDER REPORT OF REGISTERED MANAGEMENT
INVESTMENT COMPANIES
Investment Company Act file number 811-09781
PFS Funds
(Exact name of registrant as specified in charter)
1939 Friendship Drive, Suite C, El Cajon, CA 92020
(Address of principal executive offices) (Zip code)
CT Corporation System
155 Federal St., Suite 700, Boston, MA 02110
(Name and address of agent for service)
Registrant's telephone number, including area code: (619) 588-9700
Date of fiscal year end: June 30
Date of reporting period: June 30, 2014
Form N-CSR is to be used by management investment companies to file reports with the Commission not later than 10 days after the transmission to stockholders of any report that is required to be transmitted to stockholders under Rule 30e-1 under the Investment Company Act of 1940 (17 CFR 270.30e -1). The Commission may use the information provided on Form N-CSR in its regulatory, disclosure review, inspection and policymaking roles.
A registrant is required to disclose the information specified by Form N-CSR, and the Commission will make this information public. A registrant is not required to respond to the collection of information contained in Form N-CSR unless the Form displays a currently valid Office of Management and Budget ("OMB") control number. Please direct comments concerning the accuracy of the information collection burden estimate and any suggestions for reducing the burden to Secretary, Securities and Exchange Commission, 450 Fifth Street, NW, Washington, DC 20549-0609. The OMB has reviewed this collection of information under the clearance requirements of 44 U.S.C. § 3507.
Item 1. Reports to Stockholders.

For Investors Seeking Long-Term Capital Appreciation
Annual Report
June 30, 2014
Dear Fellow Shareholders:
We are pleased to present the Annual Report for the Castle Focus Fund for the fiscal year ended June 30, 2014.
Over the past year the S&P 500® Index has advanced 24.61% . In our view, this is an expensive market the gains of which have been largely built on a massive and unprecedented experiment by the Federal Reserve. The sub-advisor to the Castle Focus Fund expands on this subject in their letter that begins on the next page.
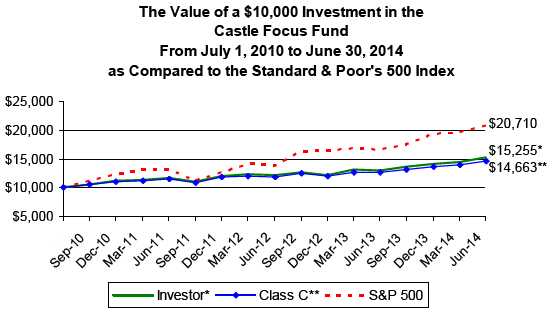
June 30, 2014 marked the four year anniversary of the Fund. During that four-year period, the Investor Class Shares of the Fund have experienced an average annual return of 11.13% (Class C Shares returned 10.04%) . The Fund's benchmark, the S&P 500® Index, has produced an average annual return of 19.96% over that same four-year period.
Although we have trailed the market over the past four years, we are nonetheless pleased with our results as we believe we have delivered those returns with an ever-mindful eye toward risk. Our goal is to produce positive returns for our shareholders and beat our benchmark over the long-term. How do we plan to do that? We invest in a focused group of what we believe are "obvious bargains" -- well-managed companies with predictable business models whose stock trades at an attractive discount to our conservative estimate of their intrinsic value. We sell those companies when their stock price approaches our estimate of fair value. In the absence of "obvious bargains" we are content to hold cash in the Fund's portfolio. While the party in the equities market has been raging for more than five years now, it has become increasingly difficult for us to find attractive investment opportunities. As such, our cash position has grown and as of June 30, 2014, the Castle Focus Fund held 32.06% in Cash and Cash Equivalents ("Cash").
We understand that the Castle Focus Fund may be managed a bit differently than other mutual funds. We believe that in order to beat the benchmark over the long-term, you have to be willing to look different than the benchmark. As we are willing to look different, we place a premium on communicating with shareholders. These regular communications are found on our website and cover various topics including why we own or sold a particular position in the Fund, as well as our thoughts on the overall market.
Kind Regards,

Caeli Andrews
Co-Founder, Managing Director
Castle Investment Management | Andrew Welle
Co-Founder, Managing Director
Castle Investment Management |
2014 Annual Report 1
Dear Castle Focus Fund Shareholder:
We are pleased to report the results of our fourth full year as sub-advisor to the Castle Focus Fund (the "Fund"). For the fiscal year ended June 30, 2014, the Investor Class Shares returned 17.17% (Class C Shares returned 15.99%) . Over that same one year period, the S&P 500® Index returned 24.61% . Over the four years that we have sub-advised the Fund, the Investor Class Shares have experienced an average annual return of 11.13% (Class C Shares returned 10.04%) .
There were three primary contributing factors to the Fund's one-year performance relative to its benchmark, the S&P 500® Index:
Select Positions — Several Fund positions enjoyed significant appreciation over the last 12 months. Molson Coors Brewing Co. and Novartis AG were both significant holdings of the Fund at the beginning of the Fund's fiscal year, representing 4.51% and 3.53% of Fund assets, respectively. Molson, which we initially purchased in February 2011, experienced price appreciation of 53.98% over the year. We trimmed our position in Molson as the price appreciated and approached our estimate of fair value. At year end, Molson represented 2.43% of Fund assets. Novartis was an original position of the Fund first purchased on July 1, 2010. The stock was up 27.74% during the fiscal year. Like we did with Molson, we also trimmed Novartis as its stock price approached our estimated of fair value. Novartis started the fiscal year as a top holding, but ended the year as minor holding representing 1.85% of Fund holdings. Other long-term holdings of the Fund that experienced strong price appreciation over the year include Microsoft Corp., Apache Corp., and Spectra Energy Corp.
Cash Position — The Fund held a sizable position in cash and cash equivalents ("cash") throughout the year. As of June 30, 2014 we held 32.06% in cash. Cash can limit volatility in both upward- and downward-moving markets and it did hamper our returns during the fiscal year as the market advanced strongly over the past 12 months - moving up in 10 of the last 12 months. While cash can hold us back in upward moving markets, it can limit volatility when markets pull back and provide us with an opportunity to be buyers when others are selling.
Re-allocation of the Fund's positions in "Gold" — The calendar year 2013 was a tough environment for owners of gold-related securities ("Gold") as the spot price for the precious metal was down more than 28%. At the beginning of the fiscal year, we saw an opportunity to improve the Fund's position in Gold. In December 2013 the Fund sold its position in the Sprott Physical Gold Trust (PHYS) at a loss. However, our conviction on Gold had not wavered and the corresponding reduction in valuation in the two most prominent royalty companies offered a great opportunity to enhance the portfolio. We re-allocated capital to Royal Gold (RGLD) and Franco-Nevada Corporation (FNV). We held Franco-Nevada at the beginning of the fiscal year and saw its price appreciate 57.96% during the fiscal year. Royal Gold was added to the Fund's portfolio in November 2013 and its price appreciated 61.73% from the date of our original purchase through the end of the fiscal year.
Market Comments
During periods of very low rates, capital is misallocated as markets grow addicted to the artificial safety net provided by the Federal Reserve. While monetary policy can make things appear better in the short-term (new home and auto sales, higher stock market, etc.), businesses and investors lose confidence in the system and exhibit an unwillingness to take risk. Investors do not trust an economy boosted by unsustainable monetary and fiscal policy, and therefore do not want to make longer term growth oriented and employment creating investments (as demonstrated by cash sitting idly on corporate balance sheets). The actions of the Federal Reserve are akin to parents that reward their children for bad
2014 Annual Report 2
behavior as opposed to trying to do what is right for their children over the long term. Despite all the monetary intervention, U.S. economic and job growth remains anemic. The Federal Reserve has now become a central part of the problem, as opposed to the solution.
When the Federal Reserve, or any central bank for that matter, lowers interest rates in an effort to prompt greater current spending it forces a wealth transfer from savers to speculators. We believe this is not only unethical and immoral, but unsound. In simple economics terms, monetary stimulus does not work as advertised by central bankers because you cannot get something for nothing. There are no free lunches. Although policies that suppress interest-rates appear to provide a free lunch, in the end, the bill ends up being much higher. Strangely enough, central bankers readily admit that their "monetary accommodation" hurts savers in the present, but with their very next breath they claim that the benefits to the overall economy outweigh the disadvantages to savers.
Central bankers apparently possess a level of wisdom that both enables and entitles them to determine who should become poorer and who should become richer, all with the aim of elevating the economy.
The key element that central banks deliberately or accidentally ignore is the variable of time. Increased saving does not mean reduced spending; it means reduced spending on consumer goods in the present in exchange for greater spending on consumer goods in the future. Likewise, reduced saving does not mean increased spending; it means increased consumer spending in the present in exchange for reduced consumer spending in the future. This tradeoff between current and future consumer spending will happen most efficiently, and for the greatest benefit to the overall economy, if it is allowed to happen naturally. Meaning, interest rates should reflect the collective market's actual time preferences. If the collective market of individuals are better positioned to determine when they should increase their savings (by reducing their current spending on consumer goods), in order to repair balance sheets weakened by excessive prior consumer spending, then the worst thing that central bankers can do is place obstacles in the way by creating artificial incentives for additional borrowing and spending.
After six years of unprecedented monetary experiments, the Federal Reserve continues to tinker with the balance of our complex market systems by artificially suppressing bond yields. Incredibly, the Federal Reserve now owns one-quarter of all US government debt and the performance of debt and equity markets suggests both markets are being driven less by economic fundamentals than by easy money. Based on unintended consequences of the Federal Reserve's actions, investors now find themselves forced back into stocks, which once again reside at valuations that are extraordinarily expensive.
A core tenet of value investing is that, over the long-term, stocks should track their underlying intrinsic value. When a stock market is dramatically above its intrinsic value, the index will usually drop or move sideways until it eventually converges with its underlying intrinsic value. Likewise, when a stock market is dramatically below its intrinsic value, it will usually rise towards its underlying intrinsic value.
Think of intrinsic value as "gravity" on the underlying price of the market-over time the price should gravitate towards intrinsic value. One method of defining the intrinsic value for the stock market is to use the average historical valuation of the stock market index.
The current stock market has reached a point where it now trades well above its intrinsic value. We believe that the Federal Reserve is largely responsible for this level of overvalua-tion due to the fact that we have now entered the sixth year of short-term interest rates near zero. Many investors now avoid holding cash in zero percent yielding money market funds
2014 Annual Report 3
and reallocate money into the stock market with the hope of earning a higher rate of return. This has pushed the stock market dramatically higher.
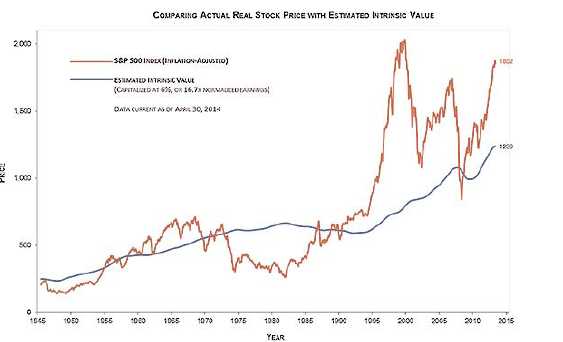
The foregoing chart compares the level of the stock market, as measured by the S&P 500 Index, against its underlying intrinsic value of 16.7 times cyclically adjusted earnings-its average valuation level since the end of World War II. The S&P 500 Index currently trades at roughly 50% above its intrinsic value. On each previous occasion when the index traded this far above its intrinsic value the stock market eventually gravitated back towards, if not below, the intrinsic value line. Therefore, investors should not be surprised if, over the next few years, the underlying index and its intrinsic value converge. However, we do not know if this will occur suddenly via a 20% or greater correction in the stock market, or a period of grinding out low single digit returns over the next decade.
Interestingly, the inverse of the average stock market valuation level of 16.7 times cyclically adjusted earnings equals 6%, or roughly the same average annual total return for U.S. stock from 1871 until today. Additionally, 6% is the same growth rate of corporate earnings in the S&P 500 Index since 1950. It is not a coincidence that stocks in the United States have produced an average real total return of around 6%--which nearly matches the average historical return on equity (ROE) for U.S. corporations. In theory, the average real total return that accrues to shareholders should match the average corporate ROE. For a simple model to explain this relationship, we assume that the following premises hold true over the very long term:
- The corporate sector operates at a 6% average ROE because it generates a 6% aver- age profit on its true book value, which is defined to mean assets at replacement cost minus liabilities.
- Publicly traded stock shares trade, on average, at "fair value", which we assume equals true book value.
The tendency for valuations to revert to the mean is what allows us to estimate long-term future returns. We are confident that we know what long-term future returns are going to
2014 Annual Report 4
be, on average, if stocks are purchased at fair value-a 6% real rate of return plus the average rate of inflation. Although valuations prove critically important when making longer-term capital allocation decisions, they can prove quite frustrating if one is attempting to time the market's short-term price movements.
Kind Regards,

| Robert J. Mark | Larry J. Redell |
| Portfolio Manager | St. James Investment Company |
| St. James Investment Company | |
2014 Annual Report 5
CASTLE FOCUS FUND (Unaudited)
CASTLE FOCUS FUND PERFORMANCE INFORMATION
AVERAGE ANNUAL RETURNS AS OF JUNE 30, 2014.
| | | | | | Since | |
| | 1 Year(A) | | 3 Year(A) | | Inception(A) | |
| Investor Shares | 17.17% | | 9.45% | | 11.13% | |
| CLASS C (without CDSC)* | 15.99% | | 8.35% | | 10.04% | |
| CLASS C (with CDSC)* | 14.99% | | 8.35% | | 10.04% | |
| S&P 500 Index (B) | 24.61% | | 16.58% | | 19.96% | |
The Fund's Total Annual Operating Expense Ratios (from November 1, 2013 Prospectus):
Investor Shares – Gross 1.64%, Net 1.40%;
Class C – Gross 2.64%, Net 2.40%
The Fund’s expense ratios for the fiscal year ended June 30, 2014 can be found in the financial highlights included in this report. The Annual Operating Expense Ratios reported above will not correlate to the expense ratio in the Fund’s financial highlights because (a) the financial highlights include only the direct operating expenses incurred by the Fund, not the indirect costs of investing in the Fund, and (b) the Annual Operating Expense Ratios were reported based on the contractual waiver of Service Fees which went effective November 1, 2013 and do not reflect the contractual waiver which was effective prior to November 1, 2013. For information regarding the contractual waiver of the Service Fees, please see Note 4 in the Notes to the Financial Statements.
(A) 1 Year, 3 Year and Since Inception returns include change in share prices and in each case includes reinvestment of any dividends and capital gain distributions. The Castle Focus Fund commenced operations on July 1, 2010.
(B) The S&P 500 Index is an unmanaged index comprised of the stocks of large capitalization issues in the United States and it is considered representative of the U.S. equity markets as a whole.
* Class C shares of the Fund are offered at their NAV without sales charge. However, Class C shares are subject to a contingent deferred sales charge (“CDSC”) of 1% if redeemed within one year of the original purchase date. No CDSC will be charged if redeemed after one year of the purchase date.
PAST PERFORMANCE DOES NOT GUARANTEE FUTURE RESULTS. INVESTMENT RETURN AND PRINCIPAL VALUE WILL FLUCTUATE SO THAT SHARES, WHEN REDEEMED, MAY BE WORTH MORE OR LESS THAN THEIR ORIGINAL COST. RETURNS DO NOT REFLECT THE DEDUCTION OF TAXES THAT A SHAREHOLDER WOULD PAY ON FUND DISTRIBUTIONS OR THE REDEMPTION OF FUND SHARES. CURRENT PERFORMANCE MAY BE LOWER OR HIGHER THAN THE PERFORMANCE DATA QUOTED. TO OBTAIN PERFORMANCE DATA CURRENT TO THE MOST RECENT MONTH END, PLEASE CALL 1-877-743-7820. AN INVESTMENT IN THE FUND IS SUBJECT TO INVESTMENT RISKS, INCLUDING THE POSSIBLE LOSS OF THE PRINCIPAL AMOUNT INVESTED. THE FUND'S DISTRIBUTOR IS RAFFERTY CAPITAL MARKETS, LLC.
2014 Annual Report 6
CASTLE FOCUS FUND (Unaudited)
Castle Focus Fund
by Sectors (as a percentage of Net Assets)
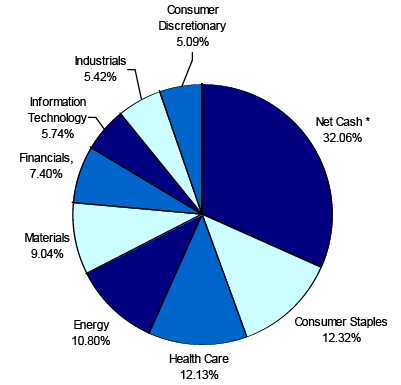
*Net Cash represents cash equivalents and other assets less liabilities.
Availability of Quarterly Schedule of Investments
The Fund files its complete schedule of portfolio holdings with the Securities and Exchange Commission (“SEC”) for the first and third quarters of each fiscal year on Form N-Q. The Fund’s Form N-Q is available on the SEC's website at http://www.sec.gov. The Fund’s Form N-Q may also be reviewed and copied at the SEC's Public Reference Room in Washington, DC. Information on the operation of the Public Reference Room may be obtained by calling 1-800-SEC-0330.
Proxy Voting Guidelines
The Sub-Adviser is responsible for exercising the voting rights associated with the securities held by the Fund. A description of the policies and procedures used by the Sub-Adviser in fulfilling this responsibility is available without charge by calling 1-877-743-7820. It is also included in the Fund’s Statement of Additional Information, which is available on the SEC’s website at http://www.sec.gov.
Information regarding how the Fund voted proxies, Form N-PX, relating to portfolio securities during the most recent 12-month period ended June 30, is available without charge, upon request, by calling 1-877-743-7820. This information is also available on the SEC’s website at http://www.sec.gov.
2014 Annual Report 7
Disclosure of Expenses (Unaudited)
As a shareholder of the Fund, you incur two types of costs: (1) transaction costs, including sales charges (loads) on purchase payments; and (2) ongoing costs, including management fees; distribution and/or service (12b-1) fees; and other Fund expenses. This Example is intended to help you understand your ongoing costs (in dollars) of investing in the Fund and to compare these costs with the ongoing costs of investing in other mutual funds. You will be assessed fees for outgoing wire transfers, returned checks and stop payment orders at prevailing rates charged by Mutual Shareholder Services, LLC, the Fund’s transfer agent, and IRA accounts will be charged an $8.00 annual maintenance fee. Additionally, if Fund shares are redeemed within 90 days of purchase from the Fund, the shares are subject to a 2% redemption fee. Class C shares may be charged a contingent deferred sales charge (“CDSC”) of 1% on shares redeemed within one year of purchase. When applicable, such CDSC would be in addition to the above stated redemption fee for a maximum charge of 3%.
The Example is based on an investment of $1,000 invested at the beginning of the period and held for the period January 1, 2014 through June 30, 2014.
Actual Expenses
The first line of the table below provides information about actual account values and actual expenses. You may use the information in this line, together with the amount you invested, to estimate the expenses that you paid over the period. Simply divide your account value by $1,000 (for example, an $8,600 account value divided by $1,000 = 8.6), then multiply the result by the number in the first line under the heading entitled "Expenses Paid During Period" to estimate the expenses you paid on your account during this period.
Hypothetical Example for Comparison Purposes
The second line of the table below provides information about hypothetical account values and hypothetical expenses based on the Fund's actual expense ratio and an assumed rate of return of 5% per year before expenses, which is not the Fund's actual return. The hypothetical account values and expenses may not be used to estimate the actual ending account balance or expenses you paid for the period. You may use this information to compare the ongoing costs of investing in this Fund and other funds. To do so, compare this 5% hypothetical example with the 5% hypothetical examples that appear in the shareholder reports of the other funds.
Please note that the expenses shown in the table are meant to highlight your ongoing costs only and do not reflect any transactional costs, such as redemption fees, CDSC, or the charges assessed by Mutual Shareholder Services, LLC as described above or the expenses of underlying funds. Therefore, the second line of the table is useful in comparing ongoing costs only, and will not help you determine the relative total costs of owning different funds. In addition, if these transactional costs were included, your costs would have been higher.
| Investor Shares | | | | | | |
| | | | | | | Expenses Paid |
| | | Beginning | | Ending | | During the Period* |
| | | Account Value | | Account Value | | January 1, 2014 |
| | | January 1, 2014 | | June 30, 2014 | | to June 30, 2014 |
| |
| Actual | | $1,000.00 | | $1,085.99 | | $6.93 |
| |
| Hypothetical | | $1,000.00 | | $1,018.15 | | $6.71 |
| (5% annual return | | | | | | |
| before expenses) | | | | | | |
* Expenses are equal to the Fund’s annualized expense ratio of 1.34% for Investor Shares, multiplied
by the average account value over the period, multiplied by 181/365 (to reflect the one-half year
period). |
| Class C | | | | | | |
| | | | | | | Expenses Paid |
| | | Beginning | | Ending | | During the Period* |
| | | Account Value | | Account Value | | January 1, 2014 |
| | | January 1, 2014 | | June 30, 2014 | | to June 30, 2014 |
| |
| Actual | | $1,000.00 | | $1,080.50 | | $12.07 |
| |
| Hypothetical | | $1,000.00 | | $1,013.19 | | $11.68 |
| (5% annual return | | | | | | |
| before expenses) | | | | | | |
* Expenses are equal to the Fund’s annualized expense ratio of 2.34% for Class C, multiplied by the
average account value over the period, multiplied by 181/365 (to reflect the one-half year period). |
2014 Annual Report 8
| Castle Focus Fund |
| |
| | | | Schedule of Investments |
| | | | | | June 30, 2014 |
| Shares | | | Fair Value | | % of Net Assets |
| COMMON STOCKS | | | | | |
| Arrangement of Transportation of Freight & Cargo | | | | | |
| 150,000 | Expeditors International of Washington, Inc. | $ | 6,624,000 | | 5.42 | % |
| Cigarettes | | | | | | |
| 50,000 | Philip Morris International Inc. | | 4,215,500 | | 3.45 | % |
| Crude Petroleum & Natural Gas | | | | | |
| 40,000 | Apache Corporation | | 4,024,800 | | 3.30 | % |
| Electromedical & Electrotherapeutic Apparatus | | | | | |
| 60,000 | Medtronic, Inc. | | 3,825,600 | | 3.13 | % |
| Fire, Marine & Casualty Insurance | | | | | |
| 140,000 | W.R. Berkley Corporation | | 6,483,400 | | 5.31 | % |
| Food and Kindred Products | | | | | |
| 80,000 | Nestle S.A. ** | | 6,213,600 | | 5.09 | % |
| Gold and Silver Ores | | | | | |
| 70,000 | Franco-Nevada Corporation (Canada) | | 4,013,800 | | 3.29 | % |
| Groceries & Related Products | | | | | |
| 170,000 | Sysco Corp. | | 6,366,500 | | 5.21 | % |
| Industrial Inorganic Chemicals | | | | | |
| 18,500 | Praxair, Inc. | | 2,457,540 | | 2.01 | % |
| Malt Beverages | | | | | |
| 40,000 | Molson Coors Brewing Company Class B | | 2,966,400 | | 2.43 | % |
| Mineral Royalty Traders | | | | | |
| 60,000 | Royal Gold, Inc. | | 4,567,800 | | 3.74 | % |
| Natural Gas Transmission & Distribution | | | | | |
| 115,000 | Spectra Energy Corp. | | 4,885,200 | | 4.00 | % |
| Pharmaceutical Preparations | | | | | |
| 25,000 | Novartis AG ** | | 2,263,250 | | 1.85 | % |
| Pipe Lines (No Natural Gas) | | | | | |
| 90,000 | Enbridge Inc. | | 4,272,300 | | 3.50 | % |
| Prepackaged Software | | | | | |
| 110,000 | Microsoft Corporation | | 4,587,000 | | 3.76 | % |
| Retail - Drug Stores and Proprietary Stores | | | | | |
| 20,000 | CVS Caremark Corporation | | 1,507,400 | | | |
| 90,000 | Express Scripts Holding Company * | | 6,239,700 | | | |
| | | | 7,747,100 | | 6.33 | % |
| Services - Prepackaged Software | | | | | |
| 36,000 | Check Point Software Technologies Ltd. (Israel) * | | 2,413,080 | | 1.98 | % |
| State Commercial Banks | | | | | |
| 68,000 | The Bank of New York Mellon Corporation | | 2,548,640 | | 2.09 | % |
| Surgical & Medical Instruments & Apparatus | | | | | |
| 21,210 | Becton, Dickinson and Company | | 2,509,143 | | 2.05 | % |
| Total for Common Stocks (Cost - $63,981,560) | | 82,984,653 | | 67.94 | % |
| MONEY MARKET FUNDS | | | | | |
| 39,031,645 | Invesco Short Term Investments Treasury Portfolio 0.01% *** | $ | 39,031,645 | | 31.96 | % |
| (Cost - $39,031,645) | | | | | |
| | Total Investments | | 122,016,298 | | 99.90 | % |
| | (Cost - $103,013,205) | | | | | |
| | Other Assets in Excess of Liabilities | | 122,192 | | 0.10 | % |
| | Net Assets | $ | 122,138,490 | | 100.00 | % |
* Non-Income Producing Security.
** ADR - American Depository Receipt.
*** Variable Rate Security; The Yield Rate shown represents
the 7-day yield at June 30, 2014.
The accompanying notes are an integral part of these
financial statements. |
2014 Annual Report 9
| Castle Focus Fund |
| |
| Statement of Assets and Liabilities | | |
| June 30, 2014 | | |
| Assets: | | |
| Investment Securities at Fair Value | $ | 122,016,298 |
| (Cost - $103,013,205) | | |
| Cash | | 183,457 |
| Receivables: | | |
| Dividends and Interest | | 62,717 |
| Shareholder Purchases | | 55,575 |
| Total Assets | | 122,318,047 |
| Liabilities: | | |
| Payable for Shareholder Redemptions | | 19,703 |
| Accrued Advisory Fees | | 101,668 |
| Accrued Service Fees | | 34,567 |
| Accrued Distribution and Service (12b-1) Fees - Class C | | 23,619 |
| Total Liabilities | | 179,557 |
| Net Assets | $ | 122,138,490 |
| Net Assets Consist of: | | |
| Paid In Capital | | 98,015,164 |
| Accumulated Undistributed Net Investment Income | | 37,844 |
| Accumulated Undistributed Realized Gain on Investments - Net | | 5,082,389 |
| Unrealized Appreciation in Value | | |
| of Investments Based on Identified Cost - Net | | 19,003,093 |
| Net Assets | $ | 122,138,490 |
| |
| Investor Shares | | |
| Net Assets | $ | 113,337,914 |
| Shares of beneficial interest outstanding | | |
| (Unlimited number of shares authorized without par value) | | 5,279,167 |
| Net Asset Value and Offering Price Per Share | $ | 21.47 |
| Minimum Redemption Price Per Share ($21.47x0.98)* | $ | 21.04 |
| |
| Class C | | |
| Net Assets | $ | 8,800,576 |
| Shares of beneficial interest outstanding | | |
| (Unlimited number of shares authorized without par value) | | 420,285 |
| Net Asset Value and Offering Price Per Share | $ | 20.94 |
| Minimum Redemption Price Per Share with CDSC fee ($20.94x0.99)** | $ | 20.73 |
| Minimum Redemption Price Per Share ($20.94x0.98)* | $ | 20.52 |
* Reflects a 2% redemption fee if shares are redeemed within 90 days of purchase.
** A contingent deferred sales charge ("CDSC") of 1% may be charged on shares redeemed within one year of
purchase. Redemption price per share is equal to net asset value less any redemption and/or CDSC fees.
Additionally, a 2% redemption fee may be applied if shares are redeemed within 90 days of purchase. |
The accompanying notes are an integral part of these
financial statements. |
2014 Annual Report 10
| Castle Focus Fund |
| |
| Statement of Operations | | | |
| For the fiscal year ended June 30, 2014 | | | |
| Investment Income: | | | |
| Dividends (Net of foreign withholding tax and fees of $117,111) | $ | 1,633,526 | |
| Interest | | 5,534 | |
| Total Investment Income | | 1,639,060 | |
| Expenses: | | | |
| Advisory Fees | | 1,129,140 | |
| Service Fees | | 654,901 | |
| Distribution and Service (12b-1) Fees - Class C | | 68,102 | |
| Total Expenses | | 1,852,143 | |
| Less: Expenses Waived | | (267,306 | ) |
| Net Expenses | | 1,584,837 | |
| Net Investment Income | | 54,223 | |
| Realized and Unrealized Gain on Investments: | | | |
| Realized Gain on Investments | | 5,636,084 | |
| Change In Unrealized Appreciation on Investments | | 11,899,103 | |
| Net Realized and Unrealized Gain on Investments | | 17,535,187 | |
| |
| Net Increase in Net Assets from Operations | $ | 17,589,410 | |
The accompanying notes are an integral part of these
financial statements. |
2014 Annual Report 11
| Castle Focus Fund |
| |
| Statements of Changes in Net Assets | | | | | | | |
| | | 7/1/2013 | | | | 7/1/2012 | |
| | | to | | | | to | |
| | | 6/30/2014 | | | | 6/30/2013 | |
| From Operations: | | | | | | | |
| Net Investment Income | $ | 54,223 | | | $ | 869,283 | |
| Net Realized Gain on Investments | | 5,636,084 | | | | 2,895,539 | |
| Change in Net Unrealized Appreciation on Investments | | 11,899,103 | | | | 3,958,267 | |
| Increase in Net Assets from Operations | | 17,589,410 | | | | 7,723,089 | |
| From Distributions to Shareholders: | | | | | | | |
| Net Investment Income | | | | | | | |
| Investor Shares | | (301,108 | ) | | | (1,070,796 | ) |
| Class C | | - | | | | (7,739 | ) |
| Net Realized Gain from Security Transactions | | | | | | | |
| Investor Shares | | (2,253,615 | ) | | | (2,085,913 | ) |
| Class C | | (130,745 | ) | | | (175,912 | ) |
| Change in Net Assets from Distributions | | (2,685,468 | ) | | | (3,340,360 | ) |
| From Capital Share Transactions: | | | | | | | |
| Proceeds From Sale of Shares | | | | | | | |
| Investor Shares | | 38,264,815 | | | | 31,349,299 | |
| Class C | | 3,091,330 | | | | 1,131,617 | |
| Proceeds From Redemption Fees (Note 2) | | | | | | | |
| Investor Shares | | 19,709 | | | | 11,386 | |
| Class C | | 56 | | | | - | |
| Shares Issued on Reinvestment of Dividends | | | | | | | |
| Investor Shares | | 2,065,045 | | | | 2,389,349 | |
| Class C | | 129,594 | | | | 182,150 | |
| Cost of Shares Redeemed | | | | | | | |
| Investor Shares | | (39,951,863 | ) | | | (39,536,991 | ) |
| Class C | | (2,474,036 | ) | | | (1,997,335 | ) |
| Net Increase/(Decrease) from Shareholder Activity | | 1,144,650 | | | | (6,470,525 | ) |
| Net Increase/(Decrease) in Net Assets | | 16,048,592 | | | | (2,087,796 | ) |
| Net Assets at Beginning of Period | | 106,089,898 | | | | 108,177,694 | |
| Net Assets at End of Period (Including Accumulated Undistributed | $ | 122,138,490 | | | $ | 106,089,898 | |
| Net Investment Income of $37,844 and $284,729, respectively) | | | | | | | |
| Share Transactions: | | | | | | | |
| Issued | | | | | | | |
| Investor Shares | | 1,915,659 | | | | 1,703,117 | |
| Class C | | 155,422 | | | | 61,970 | |
| Reinvested | | | | | | | |
| Investor Shares | | 106,172 | | | | 134,309 | |
| Class C | | 6,792 | | | | 10,361 | |
| Redeemed | | | | | | | |
| Investor Shares | | (2,018,561 | ) | | | (2,143,310 | ) |
| Class C | | (128,554 | ) | | | (109,280 | ) |
| Net Increase/(Decrease) in Shares | | 36,930 | | | | (342,833 | ) |
| Shares Outstanding at Beginning of Period | | 5,662,522 | | | | 6,005,355 | |
| Shares Outstanding at End of Period | | 5,699,452 | | | | 5,662,522 | |
The accompanying notes are an integral part of these
financial statements. |
2014 Annual Report 12
| Castle Focus Fund |
| |
| Financial Highlights - Investor Shares | | | | | | | | | | | | | | | | |
| Selected data for a share outstanding throughout the period: | | 7/1/2013 | | | | 7/1/2012 | | | | 7/1/2011 | | | | 7/1/2010* | | |
| | | to | | | | to | | | | to | | | | to | | |
| | | 6/30/2014 | | | | 6/30/2013 | | | | 6/30/2012 | | | | 6/30/2011 | | |
| Net Asset Value - | | | | | | | | | | | | | | | | |
| Beginning of Period | $ | 18.76 | | | $ | 18.04 | | | $ | 17.44 | | | $ | 15.00 | | |
| Net Investment Income/(Loss) (a) | | 0.02 | | | | 0.16 | | | | 0.14 | | | | 0.15 | | |
| Net Gains or Losses on Securities | | | | | | | | | | | | | | | | |
| (realized and unrealized) | | 3.15 | | | | 1.17 | | | | 0.56 | | | | 2.30 | | |
| Total from Investment Operations | | 3.17 | | | | 1.33 | | | | 0.70 | | | | 2.45 | | |
| Proceeds from Redemption Fees | | - | | + | | - | | + | | - | | + | | - | | + |
| Distributions (From Net Investment Income) | | (0.05 | ) | | | (0.21 | ) | | | (0.03 | ) | | | (0.01 | ) | |
| Distributions (From Capital Gains) | | (0.41 | ) | | | (0.40 | ) | | | (0.07 | ) | | | - | | + |
| Total Distributions | | (0.46 | ) | | | (0.61 | ) | | | (0.10 | ) | | | (0.01 | ) | |
| Net Asset Value - | | | | | | | | | | | | | | | | |
| End of Period | $ | 21.47 | | | $ | 18.76 | | | $ | 18.04 | | | $ | 17.44 | | |
| Total Return (b) | | 17.17 | % | | | 7.57 | % | | | 4.04 | % | | | 16.34 | % | |
| Ratios/Supplemental Data | | | | | | | | | | | | | | | | |
| Net Assets - End of Period (Thousands) | $ | 113,338 | | | $ | 98,961 | | | $ | 100,668 | | | $ | 26,624 | | |
| Before Reimbursement | | | | | | | | | | | | | | | | |
| Ratio of Expenses to Average Net Assets | | 1.58 | % | | | 1.58 | % | | | 1.58 | % | | | 1.58 | % | |
| Ratio of Net Investment Income/(Loss) to Average Net Assets | | -0.13 | % | | | 0.68 | % | | | 0.63 | % | | | 0.86 | % | |
| After Reimbursement | | | | | | | | | | | | | | | | |
| Ratio of Expenses to Average Net Assets | | 1.34 | % | | | 1.37 | % | | | 1.45 | % | | | 1.58 | % | |
| Ratio of Net Investment Income/(Loss) to Average Net Assets | | 0.11 | % | | | 0.89 | % | | | 0.76 | % | | | 0.86 | % | |
| Portfolio Turnover Rate | | 50.60 | % | | | 25.89 | % | | | 24.38 | % | | | 39.80 | % | |
| Castle Focus Fund |
| | |
| Financial Highlights - Class C | | | | | | | | | | | | | | | | |
| Selected data for a share outstanding throughout the period: | | 7/1/2013 | | | | 7/1/2012 | | | | 7/1/2011 | | | | 7/1/2010* | | |
| | | to | | | | to | | | | to | | | | to | | |
| | | 6/30/2014 | | | | 6/30/2013 | | | | 6/30/2012 | | | | 6/30/2011 | | |
| Net Asset Value - | | | | | | | | | | | | | | | | |
| Beginning of Period | $ | 18.44 | | | $ | 17.73 | | | $ | 17.29 | | | $ | 15.00 | | |
| Net Investment Income/(Loss) (a) | | (0.17 | ) | | | (0.02 | ) | | | (0.04 | ) | | | (0.03 | ) | |
| Net Gains or Losses on Securities | | | | | | | | | | | | | | | | |
| (realized and unrealized) | | 3.08 | | | | 1.15 | | | | 0.55 | | | | 2.32 | | |
| Total from Investment Operations | | 2.91 | | | | 1.13 | | | | 0.51 | | | | 2.29 | | |
| Proceeds from Redemption Fees | | - | | + | | - | | | | - | | + | | - | | |
| Distributions (From Net Investment Income) | | - | | | | (0.02 | ) | | | - | | | | - | | |
| Distributions (From Capital Gains) | | (0.41 | ) | | | (0.40 | ) | | | (0.07 | ) | | | - | | + |
| Total Distributions | | (0.41 | ) | | | (0.42 | ) | | | (0.07 | ) | | | - | | |
| Net Asset Value - | | | | | | | | | | | | | | | | |
| End of Period | $ | 20.94 | | | $ | 18.44 | | | $ | 17.73 | | | $ | 17.29 | | |
| Total Return (b) | | 15.99 | % | | | 6.50 | % | | | 2.98 | % | | | 15.27 | % | |
| Ratios/Supplemental Data | | | | | | | | | | | | | | | | |
| Net Assets - End of Period (Thousands) | $ | 8,801 | | | $ | 7,129 | | | $ | 7,510 | | | $ | 2,608 | | |
| Before Reimbursement | | | | | | | | | | | | | | | | |
| Ratio of Expenses to Average Net Assets | | 2.58 | % | | | 2.58 | % | | | 2.58 | % | | | 2.58 | % | |
| Ratio of Net Investment Income/(Loss) to Average Net Assets | | -1.13 | % | | | -0.31 | % | | | -0.36 | % | | | -0.19 | % | |
| After Reimbursement | | | | | | | | | | | | | | | | |
| Ratio of Expenses to Average Net Assets | | 2.34 | % | | | 2.37 | % | | | 2.45 | % | | | 2.58 | % | |
| Ratio of Net Investment Income/(Loss) to Average Net Assets | | -0.89 | % | | | -0.11 | % | | | -0.23 | % | | | -0.19 | % | |
| Portfolio Turnover Rate | | 50.60 | % | | | 25.89 | % | | | 24.38 | % | | | 39.80 | % | |
| | * Commencement of operations.
+ Amount was less than $0.005 per share.
(a) Based on Average Shares Outstanding.
(b) Total return in the above table represents the rate that the investor would have earned or lost on an
investment in the Fund assuming reinvestment of dividends. |
| | The accompanying notes are an integral part of these
financial statements. |
2014 Annual Report 13
NOTES TO THE FINANCIAL STATEMENTS
CASTLE FOCUS FUND
June 30, 2014
1.) ORGANIZATION
Castle Focus Fund (the “Fund”) was organized as a non-diversified series of the PFS Funds (the “Trust”) on June 28, 2010. The Trust was established under the laws of Massachusetts by an Agreement and Declaration of Trust dated January 13, 2000, which was amended and restated January 20, 2011. Prior to March 5, 2010, the Trust was named Wireless Fund. The Trust is registered as an open-end investment company under the Investment Company Act of 1940, as amended (the “1940 Act”). The Trust may offer an unlimited number of shares of beneficial interest in a number of separate series, each series representing a distinct fund with its own investment objectives and policies. As of June 30, 2014, there were nine series authorized by the Trust. The Fund commenced operations on July 1, 2010. The Fund currently offers Investor Shares and Class C Shares. The classes differ principally in their respective distribution expenses and service arrangements as well as their respective sales charge structure. All classes of shares have identical rights to earnings, assets and voting privileges, except for class specific expenses and exclusive rights to vote on matters affecting only individual classes. Investor Shares of the Fund are sold at the net asset value (the “NAV”) without an initial sales charge and are not subject to 12b-1 distribution fees. Additionally, Class C Shares may be subject to a contingent deferred sales charge (“CDSC”) as described in Note 2 and 12b-1 distribution fees as described in Note 5. The Fund's investment objective is to seek long-term capital appreciation. The Investment Adviser to the Fund is Castle Investment Management, LLC (the “Adviser”) and the Sub-Adviser to the Fund is St. James Investment Company, LLC (the “Sub-Adviser”). Significant accounting policies of the Fund are presented below:
2.) SIGNIFICANT ACCOUNTING POLICIES
SECURITY VALUATION:
All investments in securities are recorded at their estimated fair value, as described in Note 3.
SHARE VALUATION:
The NAV is generally calculated as of the close of trading on the New York Stock Exchange (normally 4:00 p.m. Eastern time) every day the Exchange is open. The NAV is calculated by taking the total value of the Fund’s assets, subtracting its liabilities, and then dividing by the total number of shares outstanding, rounded to the nearest cent. The offering price and redemption price per share is equal to the net asset value per share, except that shares of the Fund are subject to a redemption fee of 2% if redeemed within 90 days of purchase. During the fiscal year ended June 30, 2014, proceeds from redemption fees were $19,709 and $56 for Investor Shares and Class C, respectively. Class C Shares of the Fund, may be subject to a 1.00% CDSC if the shares are redeemed less than one year after the original purchase of the Class C Shares. The CDSC will be assessed on an amount equal to the lesser of the current market value or the cost of the shares being redeemed. During the fiscal year ended June 30, 2014, the Adviser received $438 resulting from CDSC fees incurred by Class C shareholders.
FEDERAL INCOME TAXES:
The Fund’s policy is to continue to comply with the requirements of the Internal Revenue Code that are applicable to regulated investment companies and to distribute all of its taxable income to shareholders. Therefore, no federal income tax provision is required. It is the Fund’s policy to distribute annually, prior to the end of the calendar year, dividends sufficient to satisfy excise tax requirements of the Internal Revenue Code. This Internal Revenue Code requirement may cause an excess of distributions over the book year-end accumulated income. In addition, it is the Fund’s policy to distribute annually, after the end of the fiscal year, any remaining net investment income and net realized capital gains.
The Fund recognizes the tax benefits of certain tax positions only where the position is “more likely than not” to be sustained assuming examination by tax authorities. Management has analyzed the Fund’s tax positions, and has concluded that no liability for unrecognized tax benefits should be recorded related to uncertain tax positions taken on returns filed for open tax years (2010-2012), or expected to be taken on the Fund’s 2013 tax return. The Fund identifies its major tax jurisdictions as U.S. Federal tax authorities; however, the Fund is not aware of any tax positions for which it is reasonably possible that the total amounts of unrecognized tax benefits will change materially in the next twelve months. The Fund recognizes interest and penalties, if any, related to unrecognized tax benefits as income tax expense in the statement of operations. During the fiscal year ended June 30, 2014, the Fund did not incur any interest or penalties.
DISTRIBUTIONS TO SHAREHOLDERS:
Distributions to shareholders, which are determined in accordance with income tax regulations, are recorded on the ex-dividend date.
2014 Annual Report 14
Notes to the Financial Statements - continued
The treatment for financial reporting purposes of distributions made to shareholders during the period from net investment income or net realized capital gains may differ from their ultimate treatment for federal income tax purposes. These differences are caused primarily by differences in the timing of the recognition of certain components of income, expense, or realized capital gain for federal income tax purposes. Where such differences are permanent in nature, they are reclassified in the components of the net assets based on their ultimate characterization for federal income tax purposes. Any such reclassifications will have no effect on net assets, results of operations, or net asset value per share of the Fund.
USE OF ESTIMATES:
The preparation of financial statements in conformity with accounting principles generally accepted in the United States (“GAAP”) requires management to make estimates and assumptions that affect the reported amounts of assets and liabilities and disclosure of contingent assets and liabilities at the date of the financial statements and the reported amounts of increases and decreases in net assets from operations during the reporting period. Actual results could differ from those estimates.
OTHER:
The Fund records security transactions based on a trade date. Dividend income is recognized on the ex-dividend date, and interest income is recognized on an accrual basis. Discounts and premiums on securities purchases are accreted and amortized over the lives of the respective securities. Withholding taxes on foreign dividends have been provided for in accordance with the Fund’s understanding of the applicable country’s tax rules and rates.
ALLOCATION OF EXPENSES:
Expenses incurred by the Trust that don’t relate to a specific fund of the Trust are allocated pro-rata to the funds based on the total number of funds in the Trust at the time the expense was incurred or by another appropriate method. Class specific expenses are borne by each specific class. Income, non-class specific expenses, and realized and unrealized gains/losses are allocated to the respective classes based on the basis of relative net assets.
3.) SECURITIES VALUATIONS
The Fund utilizes various methods to measure the fair value of most of its investments on a recurring basis. GAAP establishes a hierarchy that prioritizes inputs to valuation methods. The three levels of inputs are:
Level 1 - Unadjusted quoted prices in active markets for identical assets or liabilities that the Fund has the ability to access.
Level 2 - Inputs other than quoted prices included in level 1 that are observable for the asset or liability, either directly or indirectly. These inputs may include quoted prices for the identical instrument on an inactive market, prices for similar instruments, interest rates, prepayment speeds, credit risk, yield curves, default rates and similar data.
Level 3 - Unobservable inputs for the asset or liability, to the extent relevant observable inputs are not available, representing the Fund’s own assumptions about the assumptions a market participant would use in valuing the asset or liability, and would be based on the best information available.
The availability of observable inputs can vary from security to security and is affected by a wide variety of factors, including, for example, the type of security, whether the security is new and not yet established in the marketplace, the liquidity of markets, and other characteristics particular to the security. To the extent that valuation is based on models or inputs that are less observable or unobservable in the market, the determination of fair value requires more judgment. Accordingly, the degree of judgment exercised in determining fair value is greatest for instruments categorized in level 3.
The inputs used to measure fair value may fall into different levels of the fair value hierarchy. In such cases, for disclosure purposes, the level in the fair value hierarchy within which the fair value measurement falls in its entirety, is determined based on the lowest level input that is significant to the fair value measurement in its entirety.
FAIR VALUE MEASUREMENTS
A description of the valuation techniques applied to the Fund’s major categories of assets and liabilities measured at fair value on a recurring basis follows.
Equity securities (common stocks). Equity securities that are traded on any exchange or on the NASDAQ over-the-counter market are valued at the last quoted sale price. Lacking a last sale price, a long security is valued at its last bid price except when, in the Adviser's opinion, the last bid price
2014 Annual Report 15
Notes to the Financial Statements - continued
does not accurately reflect the current value of the long security. To the extent these securities are actively traded and valuation adjustments are not applied, they are classified in level 1 of the fair value hierarchy. When market quotations are not readily available, when the Adviser determines the last bid price does not accurately reflect the current value or when restricted securities are being valued, such securities are valued as determined in good faith by the Adviser, in conformity with guidelines adopted by and subject to review of the Board of Trustees (the “Trustees”) and are categorized in level 2 or level 3, when appropriate.
Money market funds. Money market securities are valued at a net asset value of $1.00 and are classified in level 1 of the fair value hierarchy.
In accordance with the Trust's good faith pricing guidelines, the Adviser is required to consider all appropriate factors relevant to the value of securities for which it has determined other pricing sources are not available or reliable as described above. There is no single standard for determining fair value, since fair value depends upon the circumstances of each individual case. As a general principle, the current fair value of an issue of securities being valued by the Adviser would appear to be the amount which the owner might reasonably expect to receive for them upon their current sale. Methods which are in accordance with this principle may, for example, be based on (i) a multiple of earnings; (ii) a discount from market of a similar freely traded security (including a derivative security or a basket of securities traded on other markets, exchanges or among dealers); or (iii) yield to maturity with respect to debt issues, or a combination of these and other methods.
The following table summarizes the inputs used to value the Fund’s assets measured at fair value as of June 30, 2014:
| Valuation Inputs of Assets | | Level 1 | | Level 2 | | Level 3 | | Total |
| Common Stocks | | $ 82,984,653 | | $0 | | $0 | | $ 82,984,653 |
| Money Market Funds | | 39,031,645 | | 0 | | 0 | | 39,031,645 |
| Total | | $122,016,298 | | $0 | | $0 | | $122,016,298 |
Refer to the Fund’s Schedule of Investments for a listing of securities by industry. The Fund did not hold any Level 3 assets during the fiscal year ended June 30, 2014. There were no transfers into or out of the levels during the fiscal year ended June 30, 2014. It is the Fund’s policy to consider transfers into or out of the levels as of the end of the reporting period.
The Fund did not invest in derivative instruments during the fiscal year ended June 30, 2014.
4.) INVESTMENT ADVISORY AGREEMENT AND SERVICES AGREEMENT
The Fund entered into an Investment Management Agreement with Castle Investment Management, LLC as the investment adviser of the Fund. Under the terms of the Investment Management Agreement, the Adviser manages the investment portfolio of the Fund, subject to policies adopted by the Trust’s Trustees. The Adviser, at its own expense and without reimbursement from the Fund, furnishes office space and all necessary office facilities, equipment and executive personnel necessary for managing the assets of the Fund. The Adviser also pays the salaries and fees of all of its officers and employees that serve as officers and trustees of the Trust. For its services, the Adviser receives a fee of 1.00% per year of the average daily net assets of the Fund. The Sub-Adviser of the Fund has responsibility for providing investment ideas and recommendations for the assets of the Fund, subject to the supervision of the Adviser. As full compensation for all services rendered, including investment ideas and recommendations for the assets of the Fund, the Adviser pays the Sub-Adviser a sub-advisor fee. For the fiscal year ended June 30, 2014, the Adviser received management fees totaling $1,129,140. At June 30, 2014, the Fund owed $101,668 to the Adviser.
The Fund also has a Services Agreement with the Adviser (the "Services Agreement"), under which the Fund pays the Adviser. Under the Services Agreement, the Adviser shall supervise the Fund’s business affairs and is obligated to pay the operating expenses of the Fund excluding management fees, 12b-1 fees, brokerage fees and commissions, taxes, borrowing costs (such as (a) interest and (b) dividend expenses on securities sold short), ADR fees, the cost of acquired funds and extraordinary expenses. In addition, to the extent not otherwise provided by other parties under agreements with the Trust, the Adviser shall supply: (i) non-investment related statistical and research data; (ii) the services of a Chief Compliance Officer for the Trust; and (iii) executive and administrative services. The Adviser shall also assist with and/or supervise the preparation by the Trust’s administrator, transfer agent, and/or auditors of: (i) tax returns; (ii) reports to shareholders of the Fund; (iii) reports to, and filings with, the Securities and Exchange Commission, state securities commissions and Blue Sky authorities including preliminary and definitive proxy materials and post-effective amendments to the Trust’s registration statement; and (iv) necessary materials for meetings of the Trust’s Board of Trustees. The Adviser shall provide personnel to serve as officers of the Trust if so elected by the Trustees. Executive and administrative services include, but are not limited to, the coordination of all
2014 Annual Report 16
Notes to the Financial Statements - continued
third parties furnishing services to the Fund, review of the books and records of the Fund maintained by such third parties, and the review and submission to the officers of the Fund for their approval, of invoices or other requests for payment of Fund expenses; and such other action with respect to the Fund as may be necessary in the opinion of the Adviser to perform its duties. For its services, the Adviser receives a service fee equal to 0.58% of the average daily net assets of the Fund. For the fiscal year ended June 30, 2014, the Adviser earned service fees of $654,901. At June 30, 2014, the Fund owed the Adviser service fees of $34,567. Effective November 1, 2013 the Adviser has contractually agreed to waive Services Agreement fees by 0.24% of its average daily net assets through October 31, 2014. The Services Agreement fee waiver will automatically terminate on October 31, 2014 unless it is renewed by the Adviser. The Adviser may not terminate the fee waiver before October 31, 2014. Prior to November 1, 2013, the Adviser had contractually agreed to waive Service Agreement fees by 0.23%. A total of $267,306 was waived with no recoupment provisions for the fiscal year ended June 30, 2014.
5.) DISTRIBUTION AND SHAREHOLDER SERVICING PLAN
The Fund has adopted a Distribution Plan in accordance with Rule 12b-1 under the 1940 Act (the “Plan”) with respect to the Class C Shares of the Fund. Pursuant to the Distribution Plan, the Fund compensates the Distributor for services rendered and expenses borne in connection with activities primarily intended to result in the sale of the Fund's Class C Shares. This Plan provides that the Fund will pay the annual rate of 1.00% of the average daily net assets of the Fund's Class C Shares for activities primarily intended to result in the sale of those shares. These activities include payment to entities for providing distribution and shareholder servicing with respect to the Fund's shares. The 1.00% for the Class C Shares is comprised of a 0.25% service fee and a 0.75% distribution fee. The Fund incurred distribution and service (12b-1) fees of $68,102 for Class C Shares, during the fiscal year ended June 30, 2014. At June 30, 2014, the Fund owed distribution and service (12b-1) fees of $23,619 for Class C Shares.
6.) RELATED PARTY TRANSACTIONS
Jeffrey R. Provence of Premier Fund Solutions, Inc. (the “Administrator”) also serves as a trustee/officer of the Fund. This individual receives benefits from the Administrator resulting from administration fees paid to the Administrator by the Adviser.
The Trustees who are not interested persons of the Fund were paid a total of $1,000 each in Trustees’ fees for the fiscal year ended June 30, 2014 by the Adviser.
7.) INVESTMENT TRANSACTIONS
For the fiscal year ended June 30, 2014, purchases and sales of investment securities other than U.S. Government obligations and short-term investments aggregated $39,968,590 and $50,081,999, respectively. Purchases and sales of U.S. Government obligations aggregated $0 and $0, respectively.
For Federal income tax purposes, the cost of securities owned at June 30, 2014 was $103,013,205.
At June 30, 2014, the composition of gross unrealized appreciation (the excess of value over tax cost) and depreciation (the excess of tax cost over value) of investments on a tax basis was as follows:
| | Appreciation | | (Depreciation) | | Net Appreciation (Depreciation) |
| | $19,236,413 | | ($233,320) | | $19,003,093 |
As of June 30, 2014, there were no differences between book basis and tax basis unrealized appreciation.
8.) CONTROL OWNERSHIP
The beneficial ownership, either directly or indirectly, of more than 25% of the voting securities of a fund creates a presumption of control of the Fund, under Section 2(a)(9) of the Investment Company Act of 1940. As of June 30, 2014, Charles Schwab & Co., Inc. located at 211 Main Street, San Francisco, California, held for the benefit of its customers, in the aggregate, 34.10% of Investor Shares. Also as of June 30, 2014, RBC Capital Markets LLC located at 60 South Sixth Street, Minneapolis, Minnesota, held for the benefit of its customers, in the aggregate, 25.19% of Class C Shares. The Trust does not know whether the foregoing entity or any of the underlying beneficial holders owned or controlled 25% or more of the voting securities of the Fund. Accordingly, it is not known whether Charles Schwab & Co., Inc., RBC Capital Markets LLC or any of the underlying accounts could be deemed to control the Fund.
2014 Annual Report 17
Notes to the Financial Statements - continued
9.) DISTRIBUTIONS TO SHAREHOLDERS
Investor Shares paid a distribution on December 19, 2013 to the shareholders of record on December 18, 2013 of which $0.0545 per share was paid from net investment income and $0.4079 per share was paid from long-term capital gain.
| The tax character of Investor Share distributions was as follows: | | |
| |
| | | Fiscal Year Ended | | Fiscal Year Ended |
| | | June 30, 2014 | | June 30, 2013 |
| Ordinary Income | | $ 301,108 | | $1,070,796 |
| Short-term Capital Gain | | 0 | | 1,477,566 |
| Long-term Capital Gain | | 2,253,615 | | 608,347 |
| | | $2,554,723 | | $3,156,709 |
Class C also paid distributions on December 19, 2013 to the shareholders of record on December 18, 2013 of which $0.4079 per share was paid from long-term capital.
| The tax character of Class C distributions was as follows: | | |
| |
| | | Fiscal Year Ended | | Fiscal Year Ended |
| | | June 30, 2014 | | June 30, 2013 |
| Ordinary Income | | $ 0 | | $ 7,739 |
| Short-term Capital Gain | | 0 | | 124,608 |
| Long-term Capital Gain | | 130,745 | | 51,304 |
| | | $130,745 | | $ 183,651 |
As of June 30, 2014, the components of distributable earnings on a tax basis were as follows:
| Undistributed ordinary income | | $ 193,468 |
| Undistributed long-term capital gain/(accumulated losses) | | 4,926,765 |
| Unrealized appreciation/(depreciation) - net | | 19,003,093 |
| | | $ 24,123,326 |
10.) SUBSEQUENT EVENTS
Subsequent events after the date of the Statement of Assets and Liabilities have been evaluated through the date the financial statements were issued. Management has concluded that there is no impact requiring adjustment or disclosure in the financial statements.
ADDITIONAL INFORMATION
June 30, 2014
(Unaudited)
APPROVAL OF CONTINUATION OF INVESTMENT ADVISORY AGREEMENT BETWEEN THE TRUST AND CASTLE
INVESTMENT MANAGEMENT, LLC ON BEHALF OF THE CASTLE FOCUS FUND AND THE SUB-ADVISORY
AGREEMENT BETWEEN CASTLE INVESTMENT MANAGEMENT, LLC AND ST. JAMES INVESTMENT COMPANY, LLC
ON BEHALF OF THE CASTLE FOCUS FUND
On June 12, 2014, the Board of Trustees (the "Board" or the "Trustees") considered the renewal of the Investment Advisory Agreement between the Trust and Castle on behalf of the Castle Focus Fund (the "Fund") and the Sub-Advisory Agreement between Castle and St. James Investment Company, LLC ("St. James") on behalf of the Fund (the "Agreements"). In approving the Agreements, the Board of Trustees considered and evaluated the following factors: (i) the nature, extent and quality of the services provided by Castle and St. James to the Fund (ii) the investment performance of the Fund, Castle and St. James; (iii) the cost of the services to be provided and the profits to be realized by Castle and St. James and their respective affiliates from the relationship with the Fund; (iv) the extent to which economies of scale will be realized as the Fund grows and whether the fee levels reflect these economies of scale to the benefit of shareholders; and (v) Castle's and St. James' practices regarding possible conflicts of interest.
In assessing these factors and reaching its decisions, the Board took into consideration information furnished for the Board's review and consideration throughout the year at regular Board meetings, as well as information specifically prepared and/or presented in connection with the annual renewal process, including information presented at the Meeting. The Board requested and was provided with information and reports relevant to the annual renewal of the Agreements, including: (i) reports regarding the services and support provided to the Fund and its shareholders by Castle and St. James; (ii) assessments of the investment performance of the Fund by personnel of Castle; (iii) com-
2014 Annual Report 18
Additional Information (Unaudited) - continued
mentary on the reasons for the performance; (iv) presentations addressing Castle's and St. James' investment philosophy, investment strategy, personnel and operations; (v) compliance and audit reports concerning the Fund, Castle and St. James; (vi) disclosure information contained in the registration statement of the Trust and the Form ADVs of Castle and St. James; and (vii) a memorandum from Counsel, that summarized the fiduciary duties and responsibilities of the Board in reviewing and approving the Agreements, including the material factors set forth above and the types of information included in each factor that should be considered by the Board in order to make an informed decision. The Board also requested and received various informational materials including, without limitation: (i) documents containing information about Castle and St. James, including financial information, a description of personnel and the services provided to the Fund, information on investment advice, performance, summaries of Fund expenses, compliance program, current legal matters, and other general information; (ii) comparative expense and performance information for other mutual funds with strategies similar to the Fund; and (iii) benefits to be realized by Castle and St. James from their relationship with the Fund. The Board did not identify any particular information that was most relevant to its consideration to approve the Agreements and each Trustee may have afforded different weight to the various factors.
1. Nature, Extent and Quality of the Services Provided by Castle and St. James
In considering the nature, extent, and quality of the services provided by Castle and St. James, the Trustees reviewed the responsibilities of Castle and St. James under the Agreements. The Trustees reviewed the services being provided by Castle and St. James including, without limitation: the quality of investment advisory services (including research and recommendations with respect to portfolio securities); the process for formulating investment recommendations and assuring compliance with the Fund's investment objective, strategies, and limitations, as well as for ensuring compliance with regulatory requirements. The Trustees reflected on their discussions with representatives from Castle as well as by Castle's chief compliance officer in regards to the operations of the compliance program. The Trustees considered the coordination of services for the Fund among Castle and the service providers and the Independent Trustees; and the efforts of Castle to promote the Fund and grow its assets. The Trustees noted Castle's and St. James' continuity of, and commitment to retain, qualified personnel and to maintain and enhance its resources and systems; and the continued cooperation with the Independent Trustees and Counsel for the Fund. The Trustees evaluated Castle's and St. James' personnel, including the education and experience of its personnel. After reviewing the foregoing information and further information in the materials provided by Castle and St. James (including Castle's and St. James' Form ADVs), the Board concluded that, in light of all the facts and circumstances, the nature, extent, and quality of the services provided by Castle and St. James were satisfactory and adequate for the Fund.
2. Investment Performance of the Fund, Castle and St. James
In considering the investment performance of the Fund, Castle and St. James, the Trustees compared the short-term and longer-term performance of the Fund with the performance of funds with similar objectives managed by other investment advisers, as well as with aggregated peer group data. The Trustees noted that Castle did not manage any other accounts other than the Fund. The Trustees noted that the performance of the Fund compared to other accounts managed by St. James was comparable and within typical dispersion as represented by St. James. As to the performance of the Fund, the Report included information regarding the performance of the Fund compared to a group of funds of similar size, style and objective, categorized by Morningstar (the "Peer Group"). All performance data was through the period ended April 30, 2014. The Trustees noted that for the 12 month period ended April 30, 2014, the Fund underperformed its Peer Group average and its benchmark index. The Trustees also noted that the Fund underperformed its benchmark index and Peer Group average for the longer term. The Trustees reflected on conversations with representatives of Castle on the investment philosophy of the Fund being geared toward longer-term performance and that the Fund may not perform as well as its peers in up markets. After reviewing and discussing the investment performance of the Fund further, Castle's and St. James' experience managing the Fund, their historical investment performance, and other relevant factors, the Board concluded, in light of all the facts and circumstances, that the investment performance of the Fund, Castle and St. James was satisfactory.
3. Costs of the Services to be provided and profits to be realized by Castle and St. James
In considering the costs of the services to be provided and profits to be realized by Castle and St. James from the relationship with the Fund, the Trustees considered: (1) Castle's and St. James' financial condition and the level of commitment to the Fund and Castle by the principals of Castle; (2) the asset level of the Fund; (3) the overall expenses of the Fund; and (4) the nature and frequency of advisory and sub-advisory fee payments. The Trustees reviewed information provided by Castle and St. James regarding their respective profits associated with managing the Fund. The Trustees also
2014 Annual Report 19
Additional Information (Unaudited) - continued
considered potential benefits for Castle and St. James in managing the Fund. The Trustees then compared the fees and expenses of the Fund (including the management fee) to other comparable mutual funds. The Trustees reviewed the fees under the Agreements compared to other mutual funds with similar investment objectives and asset levels and noted that the expense ratio for Investor Class Shares and for Class C Shares were above the Peer Group average. It was noted that Class C Shares were at the high end of the Peer Group range. The Trustees also considered the fees assessed by St. James relative to the fees they assessed to their other separate account clients and noted that the fees charged the Fund were less than those charged to the other accounts. It was also noted that Class C Shares had significantly less assets than the Peer Group average. The Trustees also reviewed the management fee as compared to the Peer Group average and noted that the management fee was at the high end of the Peer Group range. The Trustees recognized that Castle instituted a waiver of its fees under the Services Agreement with the Trust effective through October 31, 2014 which is recognized in the current net expense ratio. The Trustees also noted that under the contractual arrangements with the Castle, Castle was required to pay most of the Fund's operating expenses. Based on the foregoing, the Board concluded that the fees to be paid to Castle (and in turn Castle's payment to St. James) and the profits to be realized by Castle and St. James, in light of all the facts and circumstances, were fair and reasonable in relation to the nature and quality of the services provided by Castle and St. James.
4. Economies of Scale
The Trustees next considered the impact of economies of scale on the Fund's size and whether advisory fee levels reflect those economies of scale for the benefit of the Fund's investors. The Trustees considered that while the management fee remained the same at all asset levels, the Fund's shareholders had experienced benefits from the fact that Castle was obligated to pay certain of the Fund's operating expenses which had the effect of limiting the overall fees paid by the Fund. The Trustees also recognized that Castle instituted a waiver of its fees under the Services Agreement until October 31, 2014. The Trustees also noted that the contractual arrangements with the Trust required that Castle effectively cap the expenses of the Fund, which has a similar effect as breakpoint. The Trustees also noted that the fees payable to St. James were paid from the overall amount paid to Castle and, as a result, asset growth would not result in economies of scale for shareholders of the Fund with respect to that fee. In light of its ongoing consideration of the Fund's asset levels, expectations for growth in the Fund, and fee levels, the Board determined that the Fund's fee arrangements, in light of all the facts and circumstances, were fair and reasonable in relation to the nature and quality of the services provided by Castle and St. James.
5. Possible conflicts of interest and benefits to Castle and St. James
In considering Castle's and St. James' practices regarding conflicts of interest, the Trustees evaluated the potential for conflicts of interest and considered such matters as the experience and ability of the advisory personnel assigned to the Fund; the basis of decisions to buy or sell securities for the Fund; and the substance and administration of Castle's and St. James' respective codes of ethics. The Trustees also considered disclosure in the registration statement of the Trust related to Castle's and St. James' potential conflicts of interest. The Trustees also considered St. James' practices regarding brokerage and portfolio transactions, including particularly the Adviser's practice for seeking best execution for the Fund's portfolio transactions and noted that St. James does not utilize soft dollars. The Trustees considered the process by which evaluations are made of the overall reasonableness of commissions paid. The Trustees noted the potential benefit of additional public exposure of St. James based on marketing that is done for the Fund. No other potential benefits (other than the management and sub-advisory fees) were identified by the Trustees. Based on the foregoing, the Board determined that Castle's and St. James' standards and practices relating to the identification and mitigation of possible conflicts of interest were satisfactory.
After further review, discussion, and determination that the best interests of the Fund's shareholders were served by the renewal of the Agreements, the Independent Trustees met in executive session to discuss the approval of the continuation of the Agreements. The officers of the Trust were excused during this discussion. Upon reconvening, it was the Board's consensus (including a majority of the independent Trustees) that the fees to be paid to the Adviser and Sub-Adviser, pursuant to the Agreements, were reasonable, that the overall arrangements provided under the terms of the Agreements were reasonable and within a range of what could have been negotiated at arms-length in light of all surrounding circumstances, including such services to be rendered and such other matters as the Trustees considered to be relevant in the exercise of their reasonable business judgment.
2014 Annual Report 20
Cohen Fund Audit Services, Ltd.
1350 Euclid Avenue, Ste 800
Cleveland, Ohio 44115 www.cohenfund.com | 216.649.1700
216.579.0111 fax |
REPORT OF INDEPENDENT REGISTERED PUBLIC ACCOUNTING FIRM
To the Shareholders of Castle Focus Fund
and Board of Trustees of PFS Funds
We have audited the accompanying statement of assets and liabilities, including the schedule of investments, of Castle Focus Fund (the "Fund"), a series of PFS Funds, as of June 30, 2014, and the related statement of operations for the year then ended, the statements of changes in net assets for the two years in the period then ended, and the financial highlights for each of the four years in the period then ended. These financial statements and financial highlights are the responsibility of the Fund's management. Our responsibility is to express an opinion on these financial statements and financial highlights based on our audits.
We conducted our audits in accordance with the standards of the Public Company Accounting Oversight Board (United States). Those standards require that we plan and perform the audit to obtain reasonable assurance about whether the financial statements and financial highlights are free of material misstatement. An audit includes examining, on a test basis, evidence supporting the amounts and disclosures in the financial statements. Our procedures included confirmation of securities owned as of June 30, 2014, by correspondence with the custodian. An audit also includes assessing the accounting principles used and significant estimates made by management, as well as evaluating the overall financial statement presentation. We believe that our audits provide a reasonable basis for our opinion.
In our opinion, the financial statements and financial highlights referred to above present fairly, in all material respects, the financial position of Castle Focus Fund as of June 30, 2014, the results of its operations for the year then ended, the changes in its net assets for each of the two years in the period then ended, and the financial highlights for each of the four years in the period then ended, in conformity with accounting principles generally accepted in the United States of America.

COHEN FUND AUDIT SERVICES, LTD.
Cleveland, Ohio
August 27, 2014
2014 Annual Report 21
Trustees and Officers
(Unaudited)
The Board of Trustees supervises the business activities of the Trust. The names of the Trustees and executive officers of the Trust are shown below. For more information regarding the Trustees, please refer to the Statement of Additional Information, which is available upon request by calling 1-877-743-7820. Each Trustee serves until the Trustee sooner dies, resigns, retires, or is removed.
The Trustees and Officers of the Trust and their principal business activities during the past five years are:
Interested Trustees and Officers
| | | | | Number of | Other |
| | | | Principal | Portfolios In | Directorships |
| Name, | Position(s) | Term of Office | Occupation(s) | Fund | Held By |
| Address(1), | Held With | and Length of | During | Complex | Trustee or |
| and Year of Birth | the Trust | Time Served | Past 5 Years | Overseen By | Officer |
| | | | | Trustee | |
| |
| Ross C. Provence, | President | Indefinite Term; | General Partner and Portfolio | N/A | N/A |
| Year of Birth: 1938 | | Since 2000 | Manager for Value Trend Capital | | |
| | | | Management, LP (1995 to current). | | |
| | | | Estate planning attorney (1963 to | | |
| current). |
| |
| Jeffrey R. Provence(2), | Trustee, | Indefinite Term; | General Partner and Portfolio | 9 | Blue Chip |
| Year of Birth:1969 | Secretary | Since 2000 | Manager for Value Trend Capital | | Investor Funds |
| | and | | Management, LP (1995 to current). | | |
| | Treasurer | | CEO, Premier Fund Solutions, Inc. | | |
| | | | (2001 to current). | | |
| |
| Julian G. Winters, | Chief | Chief | Managing Member, Watermark | N/A | N/A |
| Year of Birth: 1968 | Compliance | Compliance | Solutions LLC (investment compli- | | |
| | Officer | Officer Since | ance and consulting) since March | | |
| | | 2010 | 2007. | | |
(1) The address of each trustee and officer is c/o PFS Funds, 1939 Friendship Drive, Suite C, El Cajon, California 92020.
(2) Jeffrey R. Provence is considered an "interested person" as defined in Section 2(a)(19) of the Investment Company Act of 1940 by
virtue of his position with the Trust.
Independent Trustees
|
| | | | | Number of | Other |
| | | | Principal | Portfolios In | Directorships |
| Name, | Position | Term of Office | Occupation(s) | Fund | Held By |
| Address(1), | Held With | and Length of | During | Complex | Trustee or |
| and Year of Birth | the Trust | Time Served | Past 5 Years | Overseen By | Officer |
| | | | | Trustee | |
| |
| Thomas H. Addis III, | Independent | Indefinite Term; | Executive Director/CEO, Southern | 9 | None |
| Year of Birth: 1945 | Trustee | Since 2000 | California PGA (2006 to current). | | |
| |
| Allen C. Brown, | Independent | Indefinite Term; | Co-owner of Stebleton & Brown | 9 | Blue Chip |
| Year of Birth: 1943 | Trustee | Since 2010 | (1994 to Current). Estate planning | | Investor Funds |
| | | | and business attorney (1970 to cur- | | |
| rent). |
| |
| George Cossolias, CPA, | Independent | Indefinite Term; | Partner of CWDL, CPAs (February 1, | 9 | Blue Chip |
| Year of Birth: 1935 | Trustee | Since 2000 | 2014 to current). Owner of George | | Investor Funds |
| | | | Cossolias & Company, CPAs (1972 | | |
| | | | to January 31, 2014). President of | | |
| | | | Lubrication Specialists, Inc. (1996 to | | |
| current). |
(1) The address of each trustee and officer is c/o PFS Funds, 1939 Friendship Drive, Suite C, El Cajon, California 92020.
2014 Annual Report 22
Investment Adviser
Castle Investment Management, LLC
Sub-Adviser
St. James Investment Company, LLC
Legal Counsel
The Law Offices of John H. Lively & Associates, Inc.
A member firm of The 1940 Act Law GroupTM
Custodian
US Bank N.A.
Distributor
Rafferty Capital Markets, LLC
Dividend Paying Agent,
Shareholders' Servicing Agent,
Transfer Agent
Mutual Shareholder Services, LLC
Fund Administrator
Premier Fund Solutions, Inc.
Independent Registered Public Accounting Firm
Cohen Fund Audit Services, Ltd. |
This report is provided for the general information of the shareholders of the Castle
Focus Fund. This report is not intended for distribution to prospective investors in the
Fund, unless preceded or accompanied by an effective prospectus. |
Castle Focus Fund
210 N. Lee Street, Suite 105
Alexandria, Virginia 22314
www.castleim.com
703-260-1921 |
Item 2. Code of Ethics.
The registrant has adopted a code of ethics that applies to the registrant’s principal executive officer and the principal financial officer. The registrant has not made any amendments to its code of ethics during the covered period. The registrant has not granted any waivers from any provisions of the code of ethics during the covered period. A copy of the registrant’s Code of Ethics is filed herewith.
Item 3. Audit Committee Financial Expert.
The registrant’s Board of Trustees has determined that George Cossolias is an audit committee finical expert. Mr. Cossolias is independent for purposes of this Item 3.
Item 4. Principal Accountant Fees and Services.
(a-d) The following table details the aggregate fees billed for each of the last two fiscal years for audit fees, audit-related fees, tax fees and other fees by the principal accountant to the registrant. The principal accountant has provided no services to the adviser or any entity controlled by, or under common control with the adviser that provides ongoing services to the registrant.
| | | FYE 6/30/14 | | FYE 6/30/13 |
| Audit Fees | | $14,250 | | $14,250 |
| Audit-Related Fees | | $0 | | $0 |
| Tax Fees | | $2,500 | | $2,500 |
| All Other Fees | | $750 | | $750 |
Nature of Tax Fees: preparation of Excise Tax Statement and 1120 RIC.
All Other Fees: Semi-Annual Report Review
(e) (1) The audit committee approves all audit and non-audit related services and, therefore, has not adopted pre-approval policies and procedures described in paragraph (c)(7) of Rule 2-01 of Regulation S-X.
(e) (2) None of the services described in paragraph (b) through (d) of this Item were approved by the audit committee pursuant to paragraph (c)(7)(i)(C) of Rule 2-01 of Regulation S-X.
(f) All of the principal accountant’s hours spent on auditing the registrant’s financial statements were attributed to work performed by full-time permanent employees of the principal accountant.
(g) The following table indicates the aggregate non-audit fees billed by the registrant’s principal accountant for services to the registrant , the registrant’s investment adviser (not sub-adviser), and any entity controlling, controlled by, or under common control with the adviser that provides ongoing services to the registrant, for the last two years.
| Non-Audit Fees | | FYE 6/30/14 | | FYE 6/30/13 |
| Registrant | | $3,250 | | $3,250 |
| Registrant’s Investment Adviser | | $0 | | $0 |
(h) The principal accountant provided no services to the investment adviser or any entity controlling, controlled by, or under common control with the adviser that provides ongoing services to the registrant.
Item 5. Audit Committee of Listed Companies. Not applicable.
Item 6. Schedule of Investments. Schedule filed with Item 1.
Item 7. Disclosure of Proxy Voting Policies and Procedures for Closed-End Management Investment Companies. Not applicable.
Item 8. Portfolio Managers of Closed End Management Investment Companies. Not applicable.
Item 9. Purchases of Equity Securities by Closed-End Management Investment Companies and Affiliated Purchasers. Not applicable.
Item 10. Submission of Matters to a Vote of Security Holders.
The registrant has not adopted procedures by which shareholders may recommend nominees to the registrant’s board of trustees.
Item 11. Controls and Procedures.
(a) The registrant’s president and chief financial officer concluded that the disclosure controls and procedures (as defined in Rule 30a-3(c) under the Investment Company Act of 1940 (the “Act”)) were effective as of a date within 90 days of the filing date of this report, based on the evaluation of these controls and procedures required by Rule 30a-3(b) under the Act.
(b) There were no changes in the registrant’s internal control over financial reporting (as defined in Rule 30a-3(d) under the Act) that occurred during the registrant’s second fiscal quarter of the period covered by this report that have materially affected, or are reasonably likely to materially affect, the registrant’s internal control over financial reporting.
Item 12. Exhibits.
(a)(1) Code of Ethics. Filed herewith.
(a)(2) Certifications pursuant to Section 302 of the Sarbanes-Oxley Act of 2002. Filed herewith.
(a)(3) Not applicable.
(b) Certification pursuant to Section 906 Certification of the Sarbanes-Oxley Act of 2002. Filed herewith.
SIGNATURES
Pursuant to the requirements of the Securities Exchange Act of 1934 and the Investment Company Act of 1940, the registrant has duly caused this report to be signed on its behalf by the undersigned, thereunto duly authorized.
| | By: /s/Ross C. Provence
Ross C. Provence
President |
Pursuant to the requirements of the Securities Exchange Act of 1934 and the Investment Company Act of 1940, this report has been signed below by the following persons on behalf of the registrant and in the capacities and on the dates indicated.
| | By: /s/Ross C. Provence
Ross C. Provence
President |
| | By: /s/Jeffrey R. Provence
Jeffrey R. Provence
Chief Financial Officer |