UNITED STATES
SECURITIES AND EXCHANGE COMMISSION
WASHINGTON, D.C. 20549
FORM N-CSR
CERTIFIED SHAREHOLDER REPORT OF REGISTERED MANAGEMENT INVESTMENT COMPANIES
Investment Company Act file number 811-09781
PFS Funds
(Exact name of registrant as specified in charter)
1939 Friendship Drive, Suite C, El Cajon, CA 92020
(Address of principal executive offices) (Zip code)
CT Corporation System
155 Federal St., Suite 700, Boston, MA 02110
(Name and address of agent for service)
Registrant's telephone number, including area code: (619) 588-9700
Date of fiscal year end: December 31
Date of reporting period: December 31, 2014
Form N-CSR is to be used by management investment companies to file reports with the Commission not later than 10 days after the transmission to stockholders of any report that is required to be transmitted to stockholders under Rule 30e-1 under the Investment Company Act of 1940 (17 CFR 270.30e -1). The Commission may use the information provided on Form N-CSR in its regulatory, disclosure review, inspection and policymaking roles.
A registrant is required to disclose the information specified by Form N-CSR, and the Commission will make this information public. A registrant is not required to respond to the collection of information contained in Form N-CSR unless the Form displays a currently valid Office of Management and Budget ("OMB") control number.
Item 1. Reports to Stockholders.

Annual Report
December 31, 2014
BRTNX |
February 24, 2015
Dear Fellow Shareholders:
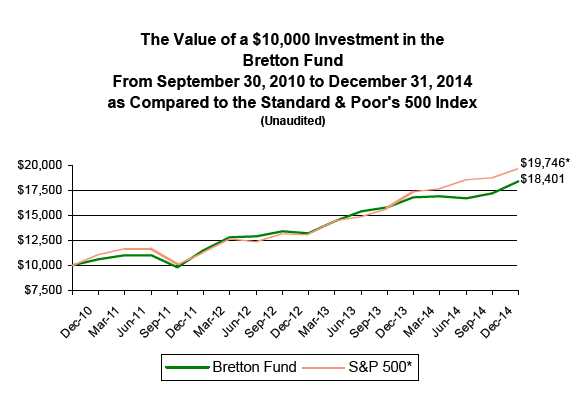
The Bretton Fund’s net asset value per share (NAV) as of December 31, 2014, was $25.72, and the total return for the fund for the fourth quarter was 6.91% compared to 4.93% for the S&P 500 Index. For the year, the fund returned 9.79% compared to the S&P 500’s 13.69% .
The fund’s cash balance muted returns again, but the volatility in the fourth quarter allowed us to put more of our cash to work by adding, what we believe, are three great businesses whose stock prices went on sale: Discovery Communications, Flowserve, and IPC Healthcare. We discuss these in more detail below.
Total Returns as of December 31, 2014
| | | | | | Annualized | | Annualized - | |
| | 4th Quarter | | 1 Year | | 3 Years | | Since Inception(A) | |
| Bretton Fund | 6.91% | | 9.79% | | 17.12% | | 15.42% | |
| S&P 500 Index(B) | 4.93% | | 13.69% | | 20.41% | | 17.35% | |
| Calendar Year Total Returns | | | | |
| |
| | Bretton Fund | | S&P 500 Index(B) | |
| 2014 | 9.79% | | 13.69% | |
| 2013 | 26.53% | | 32.39% | |
| 2012 | 15.66% | | 16.00% | |
| 2011 | 7.90% | | 2.11% | |
| 9/30/10–12/31/10 | 6.13% | | 10.76% | |
| Cumulative Since Inception(A) | 84.01% | | 97.46% | |
(A) Since Inception returns include change in share prices and, in each case, include reinvestment of any dividends and capital gain distributions. The inception date of the Bretton Fund was September 30, 2010.
(B) The S&P 500 is a stock market index based on the market capitalizations of 500 leading companies publicly traded in the US stock market, as determined by Standard & Poor’s, and captures approximately 80% coverage of available market capitalization.
Performance data quoted represents past performance. Past performance does not guarantee future results. The investment return and principal value of an investment will fluctuate so that an investor’s shares, when redeemed, may be worth more or less than their original cost. Current performance may be lower or higher than the performance data quoted. You may obtain performance data current to the most recent month-end at http://brettonfund.com or by calling 800.231.2901.
All returns include change in share prices, reinvestment of any dividends, and capital gains distributions. Indices shown are broad-based, unmanaged indices commonly used to measure performance of US stocks. These indices do not incur expenses and are not available for investment. The fund's expense ratio is 1.50% .The fund’s principal underwriter is Rafferty Capital Markets, LLC.
Note: In previous reports, we had shown the Wilshire 5000 Index in the above performance tables, with the goal of showing the broader market beyond the 500 largest companies that comprise the S&P 500 Index. But since those 500 companies dominate the market-capitalization-weighted Wilshire, the difference in those indices isn’t material. Going forward, we’ll just show the S&P 500.
4th Quarter
During the fourth quarter, the largest contributor to the fund’s performance was Ross Stores, adding 1.8% . Ross Stores, the company, continued to chug steadily along nicely
1
during the year, selling even more discounted clothes and adding stores, and in our estimation, steadily increasing its value. ROST, the stock, on the other hand, saw wide swings in its perceived value by the market, starting the year at a value of $16 billion, hitting a low of $13 billion in July, then recovering to almost $20 billion by the end of the year. The business hardly changed.
Car-Mart also made a significant contribution of 1.6% in the fourth quarter. The company continues to open stores and managed to significantly improve its per car profitability, getting back to its historical average as the fierce competitive environment waned a bit.
Wells Fargo added 0.9% and CSX added 0.6% .
Contributors to Performance for 2014
For the full year, the main detractor from the fund was Coach. As predicted, its sales grew overseas quite nicely, but its appeal in the US deteriorated much more than expected, with sales per store declining 24% last quarter. We have since sold some shares as our assessment of its value wasn’t quite what we thought it was. This mistake cost the fund 2.4% in 2014. Fortunately, there were no other significant detractors from performance this year.
Wells Fargo and Ross had the biggest impact on the fund, adding 3.1% and 2.5%, respectively. The railroads continued to charge ahead, adding 4.1% to the fund as a group, with Union Pacific having the largest impact, 1.9% .
Taxes
The fund made a tax distribution to shareholders on December 23 for $0.01427 per share, representing 0.06% of the fund’s NAV at the time. While minimizing taxes isn’t the fund’s raison d’être, we strive to reduce the amount of taxable distributions to shareholders. The fund managed to avoid making a capital gain tax distribution during the year, and for the third year in a row, the fund avoided incurring any short-term capital gains, which are taxed at a higher rate than long-term gains.
| Portfolio | | | | | |
| | % of Net | Initial Purchase | | Comparable | |
| Security | Assets | Date | IRR to Date(A) | S&P 500 IRR(B) | |
| |
| Wells Fargo & Company | 13.5% | 10/3/11 | 27.9% | 20.3% | |
| Ross Stores, Inc. | 8.6% | 10/4/10 | 37.3% | 16.3% | |
| American Express Co. | 6.0% | 10/4/10 | 24.8% | 17.8% | |
| Union Pacific Corp. | 5.2% | 10/4/10 | 35.4% | 19.2% | |
| CSX Corp. | 4.8% | 10/22/10 | 19.4% | 17.7% | |
| Armanino Foods of Distinction, Inc. | 4.7% | 1/2/13 | 53.9% | 20.5% | |
| Bank of America Corp. | 4.6% | 10/15/13 | 21.3% | 18.7% | |
| Norfolk Southern Corp. | 4.6% | 10/4/10 | 21.5% | 17.5% | |
| JPMorgan Chase & Co. | 4.4% | 9/1/11 | 23.9% | 20.7% | |
| Discovery Communications, Inc.(C) | 3.9% | 11/25/14 | NM | NM | |
| Flowserve Corp.(C) | 3.9% | 12/8/14 | NM | NM | |
| Aflac, Inc. | 3.8% | 10/4/10 | 6.2% | 16.4% | |
| The Gap, Inc. | 3.2% | 6/21/11 | 50.5% | 14.8% | |
| IPC Healthcare, Inc.(C) | 3.1% | 11/7/14 | NM | NM | |
| Coach, Inc. | 2.8% | 2/12/13 | -14.1% | 19.1% | |
| Carter’s, Inc. | 2.7% | 10/4/10 | 35.7% | 16.1% | |
| New Resource Bank | 1.8% | 2/7/11 | 9.7% | 15.0% | |
| America’s Car-Mart, Inc. | 1.3% | 7/24/12 | 9.4% | 22.1% | |
| Standard Financial Corp. | 1.2% | 12/2/10 | 12.2% | 15.0% | |
| Cash(D) | 15.9% | | | | |
(A) IRR stands for internal rate of return, a method of calculating annualized returns.
(B) Comparable S&P 500 IRR is calculated for each investment by looking at the purchases and sales for each security transaction and how a comparable amount would have performed if invested in the S&P 500.
2
(C) The IRR figures for Discovery, Flowserve, and IPC are not meaningful (NM) given that they have been held for a very short time.
(D) Cash represents cash equivalents and other assets in excess of liabilities.
Each quarter, we disclose which investments had the largest impact on the fund’s performance for that quarter, and in the annual and semiannual reports, the attached financial statements contain gain-loss information for each security. This time, we thought we’d break out more detail on each investment to give you a sense of the companies we own and how they performed to date. To date, none of our investments has led to a net realized loss, and excluding the investments we made in the last weeks of the year, only Coach is in a net loss position. Including our fully exited investments, about two-thirds of our investments have outperformed the market.
Portfolio Discussion
Big Banks
Our three large banks, Wells Fargo, Bank of America, and JPMorgan Chase, comprise our largest position both individually, with Wells Fargo, and the fund as a whole. While each of these companies has distinct qualities, the common theme has been the tremendous resurgence in earning power of the banking sector. In 2009, Wells Fargo—broadly considered the best managed and most transparent of the large banks—earned $1.75 per share after writing down over $22 billion of assets, which, at the time, was not clear would be enough. Last year, earnings were up to $4.10 per share in an environment where ultra-low interest rates have materially depressed its interest income. We expect Wells to earn at least $4.20 per share next year, which, we believe, is a bargain compared to its $55 year-end share price.
Bank of America and JPMorgan have had slightly more complicated stories, thanks to crisis-era liabilities that have not been fully resolved. Bank of America made what, at least in hindsight, was an ill-advised acquisition of Countrywide and its problems during the subprime mortgage crisis, and it is still digging out. It also wildly overpaid for Merrill Lynch when it was at death’s door and failed to terminate its purchase contract in the face of a material adverse event: a worldwide financial crisis centered on these investment banks. Despite the circumstances, Merrill turned out to be a strong franchise and now represents close to half of Bank of America’s earnings. As its elevated legal and credit costs fade, the underlying earning power of Merrill Lynch’s wealth management operation and BofA’s enormous deposit and loan franchise will accrue to us as its partial owners. We estimate it can earn about $2 a share within a few years compared to its year-end share price of only $18.
JPMorgan has spent nearly $30 billion on legal settlements since the financial crisis—an amount that could buy Whole Foods and Safeway, with enough left over for E*TRADE—and it is unlikely that the regulators are finished with it. Yet, the bank earned nearly $22 billion just in 2014, an amount that’s likely to increase in the coming years with higher rates, increased loans, and lower legal costs. For all of the unwieldiness of the universal bank model, JPMorgan is, in an important sense, a combination of Wells Fargo, BlackRock, and Goldman Sachs, trading for a lower ratio of price to earnings. At current prices, we have an earnings yield slightly above 10%.
For the year, the total return for the stocks of Wells, BofA, and JPMorgan were 25%, 12%, and 10%, respectively.
Railroads
The railroads are, collectively, our second largest position, and represent the most effective means of transporting the industrial inputs that make up the core of our economy. At the time of our original investment, the risk was that the decline of coal in the American energy grid would hurt the railroads’ earnings. As it happened, coal has fallen faster than most estimates, helped more by the halving of natural gas prices than any environmental regulations, yet the railroads have more than replaced the volume, much of it by taking share from costlier trucking. Equally important, the railroads don’t face the prospect of facing off against a large field of tough railroad competitors—there
3
are only two majors in each half of the US—giving them the ability to raise prices modestly every year.
Union Pacific has been the standout of the group. It has less exposure to coal, and the longer route distances of the western US enhance the value proposition of rail. The eastern rails have had to invest more in maintenance and upgrades to the fleet and, at current fuel prices, face more of a prospect of competition from truck transport.
Union Pacific, CSX, and Norfolk Southern returned 45%, 31%, and 23%, respectively.
Ross Stores
Ross continues to use its superior purchasing and logistics advantages to buy brand-name clothes at low prices from apparel makers, passing on those low prices to customers. Ross ended the year with about 1,400 stores, and it believes it can eventually have 2,500 in the US. The total return from the stock during 2014 was 28%, and management estimates earnings per share increased by 11%.
Apparel Retailers
Unlike the large banks, the apparel retailers have little in common with each other except a method of selling.
The Gap, Inc., is a multi-brand retailer of casual clothing. Beyond its namesake Gap brand, it operates a slightly more upmarket Banana Republic, a slightly more casual Old Navy, and Athleta, its answer to Lululemon. Of late, Banana Republic has struggled and is in the midst of a reinvigoration, Gap brand is treading water, and Old Navy and Athleta have performed exceptionally well. The markets have had an itchy trigger finger whenever one of the brands has an off month, and we have used this to pick up a few more shares during the year. Our core belief remains that the business generates a significant amount of free cash flow that management uses to return to shareholders and invest wisely, which provides it the breathing room to get the Gap brand back on track.
As mentioned above and in our third quarter report, Coach was a mistake. We underestimated the overall amount of fashion risk and the company’s reliance on outlet stores and discounting. The company changed its creative director and introduced a critically acclaimed holiday line, but it takes time and energy to reposition a major brand as big as Coach. Management spent a fair amount of time and energy—as well as money—acquiring the shoe brand Stuart Weitzman, which has broad appeal, but is not clear if it will revive Coach’s own brand or its earnings. We reduced our position.
People keep buying baby clothes. Carter’s continues to take advantage of its strengths, with its high margins and yet another year of over 15% earnings growth. The firm traces its history to Atlanta at the end of the Civil War, and when it finally went public in 2003, it had about $600 million of revenue and 40¢ per share in earnings. Our Carter’s of 2015 will generate more than $3 billion in revenue and earn nearly $4.50 per share next year.
Gap, Coach, and Carter’s returned 11%, -31%, and 22%, respectively.
American Express
American Express’s earnings per share continue to grow, increasing 14% last year, while the stock returned 5% for us. While earnings grew nicely from cost-cutting and greater efficiencies, the business had some challenges meeting its own revenue goals.
Reasons for the weaker than expected revenue growth: 1) The US dollar strengthened, which means spending by non-US AmEx cardholders translated into fewer US dollars for us. 2) Consumer spending across the world is still a bit weak. 3) The company is making a strong push in the US to sign up small merchants and is accepting lower fees to do so. 4) More of the company’s growth is shifting to its open-network payment business from its “closed-loop” charge card business, which has higher fees. If you use a traditional AmEx charge card, American Express is both the payment network and the bank that’s floating that transaction. In recent years, AmEx has shifted its model more toward the Visa-MasterCard model, whereby a third-party bank like Wells Fargo or Morgan Stanley
4
issues an AmEx-branded credit card to its own customers. AmEx facilitates the payment processing for a fee, but the bank partner is responsible for paying the merchant and collecting payment from its own customer. In the long run, we believe this, along with broader merchant acceptance, will lead to stronger growth and a longer runway for American Express, but this shifting mix of business is holding back growth a bit in the short-term.
Armanino Foods of Distinction
Tiny Armanino continues to deliver. Our Northern California–based pesto-sauce maker is on pace to earn 20% more than it did the year before as it continues to find markets for its frozen pesto sauce, even developing a growing market overseas. Last year, the stock returned 10%, and it continues to pay out a healthy 3.5% dividend.
Aflac
Aflac dominates a small niche in the insurance market: supplemental health insurance. It’s neither traditional healthcare, since Aflac doesn’t pay doctors or manage health plans, nor is it like the more-familiar homeowners or life insurance. In exchange for monthly payments, Aflac will pay out cash to you if you incur a specified health event like cancer. It does a decent business in the US, but does extraordinarily well in Japan (where 70% of its revenue comes from), a much larger market due to the high out-of-pocket expenses Japanese face for their healthcare. (The Japanese government has a mostly nationalized healthcare system, whereby the government pays 70% of a patient’s expenses, leaving 30% the patient’s responsibility, which can add up with a major health event like cancer.)
Aflac makes money by writing policies that have a positive actuarial value; that is, policyholders send Aflac more in premiums than Aflac will pay out in claims. Aflac also makes money from the investment income it receives off the “float,” the capital generated by collecting premiums now and paying out claims years later. Unfortunately, most of this float is in Japan, and Aflac has struggled to find good avenues to deploy this capital. Japanese government bonds offer negligible yields, and Japanese equity markets have challenging corporate governance issues. From time to time, the pressure to stretch for yield has been overwhelming, and Aflac experienced material investment losses in 2011 chasing higher rates in poorly capitalized European banks.
What Aflac has done well is continue to grow policies and earnings. From 2010 to 2014, Aflac’s core Japanese operation grew by a little over 25% in local currency; unfortunately for American shareholders, the dollar-yen exchange rate from 2010 to today fell by more than 25%. Through its investment losses to the collapse of the yen over the past two years, we have held onto our investment on the belief that its fair value is worth significantly more than its current market value, which is only about nine times more than its annual earnings, a steep discount to the rest of the market, particularly for a solid business that excels in its niche. The total return from Aflac last year was –5%.
Small Banks
As they’ve appreciated, we’ve reduced our holdings of small banks and now own only two: New Resource Bank and Standard Financial, the latter of which was formerly a mutualized thrift (a bank that is technically owned by its depositors). Four years ago, regulatory changes caused several small, mutualized thrifts to convert to a conventional stock-ownership structure.
A thrift conversion is a funny thing. Pre-conversion, the bank has a capital base that represents its cumulative retained earnings. During the conversion, the bank sells shares to interested parties: its depositors, managers, employees, and, to the extent there is room, the general public. Post-conversion, the new shareholders collectively own the IPO proceeds they supplied and the retained earnings of the old depositors. Fidelity’s Peter Lynch noted that this is like buying a house, moving in, and then finding what you paid for the house waiting for you on the kitchen counter.
In addition, the cynic might note that one group is particularly impacted by the share price of the conversion: management. Pre-conversion, management owns no part of the company and receives a salary. During the conversion, management will have a chance
5
to buy part of the company. Post-conversion, management’s equity incentives will be keyed off of the initial share price. Care to guess whether management wants a high or low conversion price?
These mis-pricings do not last long, and given our small size, we were able to pick up some shares in the open market while they lasted. From then on, the biggest risk we faced was that a management team would destroy the value it had just created by buying other banks for stock. The annualized gain (our internal rate of return) on our four investments since inception was: Kaiser Federal Financial 56%, People’s Federal Financial 16%, Standard Financial 12%, and SI Financial 6%. No prize for guessing which one decided to buy another bank. We exited SI Financial last quarter. The only one of our original four that we still hold, Standard Financial, returned 17% last year.
New Resource Bank, our San Francisco–based bank founded in 2006 and always a conventional stock company, is beginning to hit its stride. When we first invested in 2011, it was a turnaround situation: the bank had significant loan losses and had never been profitable. However, it had excess capital. Since our investment, the bank has grown its loans and deposits and achieved profitability, with its earnings through September 30 increasing by 53% over the prior year. The stock returned 13% in 2014 and still trades below 80% of its book value.
America’s Car-Mart
As we outlined in the 2012 third quarter shareholder letter, Car-Mart is one of the better operators in the subprime auto industry. It both sells the cars to its customers and makes them the loans necessary for those purchases, a model that puts significant strain on Car-Mart’s own finances—Car-Mart needs to carry both the vehicles in its showroom inventory and the vehicles in its fleet that are slowly paid off by customers. But it aligns Car-Mart’s incentives with those of its customers. A car is an economic lifeline for someone with subprime credit; it does neither Car-Mart nor the customer any favors to sell a lemon that the customer cannot service and will end up defaulting.
Much of the used-car world functions quite differently, with financing provided by third parties. When credit is tight, customers with damaged credit cannot buy a car. When credit is loose, typically a few years after a wave of defaults when finance companies have forgotten what happened the last time, it is open season to sell whatever car the dealer can get to whomever happens to walk in the door. The back half of 2013 and first half of 2014 were extremely loose.
Car-Mart management made the decision to sell fewer cars during this time period rather than chase poor deals. Earnings suffered. Cash flow increased, bringing down Car-Mart’s debt, and management took the opportunity to buy back 5% of its shares. When competition subsided in the summer, Car-Mart was able to regain its earnings pace. The stock returned 27% in 2014, and we took the opportunity to reduce a fair amount of our position.
| Investments Initiated in 2014 | | |
| Discovery Communications, Inc. | | |
| Flowserve Corp. | | |
| IPC Healthcare, Inc. | | |
| |
| Investments Exited During 2014 | | |
| Investment | Internal Rate of Return | |
| Apollo Group | 0.4% | |
| SI Financial | 5.8% | |
Portfolio Additions
Discovery Communications
Discovery is the world’s largest collection of nonfiction media, operating 13 networks in the US, including its three flagship channels—Discovery, TLC, and Animal Planet—that reach substantially all pay-TV households in the nation. Discovery is not built around big-budget, dramatic television; the highest-rated program in its history, Deadliest Catch, is
6
focused on the lives of Alaskan crab fisherman and poses no artistic threat to The Sopranos or Mad Men or The Wire.
What Discovery is built to do is create entertaining and informative video content about the real world in a low-cost way and distribute this content around the world. While most people associate Discovery with its main channels here in the US, it is the largest pay-TV programmer in the world. At last count, it had nearly three billion cumulative subscribers (defined by counting each channel in a household) across 48 channels, translated into 45 languages, distributed into 220 countries. While major US networks spend billions of dollars for the rights to highly perishable football content—content that is valuable precisely because it is so perishable and demands real-time viewing—Discovery is happy to rerun Gold Rush at odd hours. It turns out to be about as enjoyable in any culture.
The pay-TV ecosystem in the US has been wildly lucrative for over thirty years, guarded on one side by the natural monopoly of stringing coaxial cable to a living room, and on the other by intellectual property rights and federal program-carriage rules. Whenever there was conflict between distributors and content owners, it was solved by simply passing the cost to the end customer. Easy money attracts insurgents, and companies from Netflix and Amazon to Dish and Google are trying to change the status quo. We expect the domestic trend toward cord cutting (abandoning a pay-TV subscription for Internet-only) and unbundling (smaller channel packages) to continue. We also expect that there will continue to be a place for Discovery’s content and that, as these changes work through the US market, Discovery will continue to grow in overseas markets that don’t have enough local content to fill their rapidly expanding viewerships.
Since assembling its current portfolio of assets in 2008, Discovery has grown from $3.4 billion of revenue and 43¢ per share in earnings to what should be about $6.9 billion of revenue and $2.00 per share in earnings in 2015. The international nature of the business means that we are taking some foreign exchange risks translating earnings into dollars. The company has never paid a dividend, but instead has used its substantial free cash flow to expand its reach and buy back shares.
Flowserve
Flowserve is one of the global leaders in flow control. It makes pumps, valves, and seals—the products that move large volumes of liquid and gas. For those of us who think of a pump as something that inflates a bicycle tire, the scale and power of these industrial pumps are shocking. These are the devices that move some very unwieldy liquids along pipelines and through chemical facilities.
The sheer force applied to these pumps—let alone the nature of the fluids being pumped—means that, between the energy needed to operate the pump and the maintenance and retrofit needed to keep it going, the total cost of owning a pump is about nine times its original cost. Thoughtful customers tend to focus on the quality of the initial pump more than its sticker price; they will be investing in this tool for a long time.
Forty percent of Flowserve’s pumps are sold to the oil and gas industry, and the precipitous drop in the price of oil and, thusly, oil company spending budgets caused investors to sell Flowserve. We bought.
While investors may have been concerned that 40% of its revenue comes from the broader oil and gas industry, only about 8% of Flowserve’s revenue is from the upstream portion of the oil and gas industry—the actual removal of resources from the ground—the sector of the industry most at risk with low oil prices. Twelve percent comes from midstream—the moving and storing of oil and gas—and 20% comes from refining and other downstream activities.
Since the proximate cause of the oil price decline is too much oil, we don’t expect the world to move or refine any less of it. We certainly don’t expect much change to the half of revenue that comes from selling maintenance and repair parts to installed Flowserve pumps: it is the brave refinery manager who would risk his billion-dollar investment by saving a few dollars on a nonspecified replacement part.
7
We expect Flowserve to earn $3.75 to $4.00 per share in 2015. As with Discovery, the global nature of the business means that there is some short-term risk to reported earnings from exchange rate fluctuations.
IPC Healthcare
While the healthcare industry is nearly a fifth of the economy and home to tremendous innovation and progress, we have generally avoided investing in healthcare businesses. The ratio of prices to earnings are often high relative to their growth rates because of investors’ perception of safety, but healthcare companies have their own pronounced risks, notably technology risk.
The biotech, pharma, and medical device industries are littered with failed products, promising ideas that didn’t make it through some trial or other, or were pulled from the market, or just didn’t deliver much value. This isn’t surprising; the essence of innovation is a leap into the dark, and not all attempts will succeed. Each failed effort is accompanied by a suite of experts—executives, researchers, doctors, statisticians, investors—who had access to the best possible information and yet unsuccessfully bet millions of dollars and years of time. How could we hope to do better?
That said, we are happy to invest in healthcare when we find a business model that makes sense to us. IPC Healthcare is essentially a staffing agency for extremely talented staff: doctors.
Traditionally, a patient who found himself in a hospital was visited regularly by his primary care physician, who coordinated his care. Increasingly, this does not happen. Primary care physicians practice in their own offices, typically with busy schedules to compensate for limited reimbursement revenue per visit. Few have the time or incentive to drive to the hospital to check up on “their” patients who were admitted. So the patient sits in his hospital room, frustrated and confused, while specialist after specialist comes by and asks the same questions and orders the same tests before disappearing.
A hospitalist—a primary care doctor who practices in the hospital instead of a separate office—solves this problem by quarterbacking the patient’s recovery. The advantages to the patient are obvious: finally, there is someone to look out for you. The hospital also benefits: by eliminating duplicative work and expediting treatment, the hospitalist frees up space and lowers readmission rates. The payer (almost always insurance companies or the federal government via Medicare or Medicaid) benefits from reduced waste. And the doctor benefits from working for a hospitalist company by enjoying a steady income without any of the hassles of running a small business. Because of the clear benefits to all parties, hospitalists are now one of the fastest-growing segments in healthcare.
We were able to buy stock in IPC because of some short-term dislocations. The Justice Department is investigating a whistleblower complaint that IPC encouraged doctors to code visits inappropriately, essentially overbilling the government. Whistleblower lawsuits, lawsuits in which someone brings a complaint on behalf of the government and shares in any proceeds, have been a part of American law for 150 years, but until the mid-1990s were fairly rare, with perhaps 10 healthcare-related filed in a busy year. The government now pursues 400–500 cases a year, helped along by a cottage industry of law firms that identify disgruntled employees who can allege a billing error. There are 13,000 codes in the current Medicare system, soon to expand to 68,000, and many are distinguished by subjective measures. IPC’s case, for example, concerns whether some IPC doctors used code 99233 (evaluation and management, high level) when they should have used code 99232 (evaluation and management, medium level). IPC doctors have seven million patient encounters per year; we would be shocked if there were no coding errors. We expect the government to move slowly, but we believe the case will eventually be settled.
A long-term risk to IPC is that hospitals poach its doctors. It should be easy for a hospital to hire doctors: the doctors already show up to work in the hospital. In some cases, we expect that this is just what will happen. But hospitals have reacted to their own cost pressures by outsourcing functions, not absorbing them: they have found it’s more lucrative to run a mall and rent out space to vendors than it is to maintain a department
8
store and try to own every sale. We believe that IPC and the other practice management businesses, such as Envision, Mednax, and Team Health, have a growing role to play in the modern hospital.
In 2008, IPC’s first year as a public company, it earned 87¢ per share on revenue of $251 million. We expect that next year IPC will earn $2.50 per share on revenue of $760 million.
Growing Team Bretton
I’m proud and elated to announce a wonderful addition to the Bretton Fund team. Later this year, Raphael de Balmann will be joining the firm as a portfolio manager. Raphael and I have been close friends for almost ten years, emailing or talking on an almost daily basis about finance, business, sports, and public policy. We’ve talked on and off for a long time about managing money together (he even came up with the Bretton name), and the timing’s finally right.
Raphael has spent his entire career in private equity, buying businesses for less than their underlying values and holding them for years, which is basically the Bretton Fund strategy. He joins us most recently from One Equity Partners, the former private equity arm of JPMorgan, one of the most successful bank-owned private equity firms. He was previously a principal at Paine & Partners/Fox Paine, and he worked in the private equity groups of Blackstone and Lazard in New York and London. No academic slouch, he has an MBA from Stanford and an undergraduate degree from Harvard. Raphael fills what has been the biggest hole for us so far: finding enough great investments to fill a diversified portfolio. He has extensive background in industrial businesses, manufacturing, and healthcare—sectors that have been outside my circle of competence.
Raphael and his family—as I and my family have done—will be contributing significant assets to the fund. He’ll also be buying a stake in the fund’s adviser, Bretton Capital Management, and in conjunction with this transaction, shareholders will be asked for approval through a formal proxy voting process in the coming weeks.
Schwab
Thanks to your requests, Bretton is now on the Schwab platform, the largest of the “fund supermarkets” and the back office for 7,000 registered independent advisers. The fund is also available on E*TRADE and Vanguard. If we are not on a platform that you use, please contact your representative at the platform to ask them to add us and email us at info@brettonfund.com so that we can follow up. Our back office partners at Premier Fund Solutions are able to connect with pretty much any willing brokerage platform, and it’s always possible to invest directly by going to www.brettonfund.com and downloading the forms.
As always, thank you for investing.
Stephen J. Dodson
President
Bretton Capital Management
9
Bretton Fund by Sectors
(as a percentage of Net Assets)
(Unaudited)
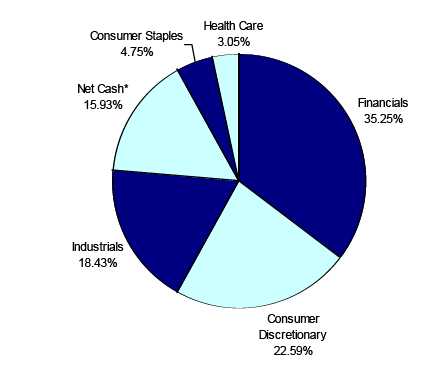
* Net Cash represents cash and other assets less liabilities.
10
| Bretton Fund |
| | | | | | | Schedule of Investments |
| | | | | | | December 31, 2014 |
| Shares | | Cost | | | Fair Value | | % of Net Assets |
| COMMON STOCKS | | | | | | | | |
| Accident & Health Insurance | | | | | | | | |
| 6,500 | Aflac Inc. | $ | 343,550 | | $ | 397,085 | | 3.76 | % |
| Apparel & Other Finished Products of Fabrics & Similar Material | | | | | | | |
| 3,300 | Carter's, Inc. | | 90,589 | | | 288,123 | | 2.73 | % |
| Cable & Other Pay Television Services | | | | | | | | |
| 12,000 | Discovery Communications, Inc. - Class A * | | 419,388 | | | 413,400 | | 3.92 | % |
| Canned, Frozen & Preserved Fruit, Vegetables & Food Specialties | | | | | | | |
| 245,430 | Armanino Foods of Distinction, Inc. | | 241,490 | | | 500,677 | | 4.75 | % |
| Finance Services | | | | | | | | |
| 6,800 | American Express Company | | 432,369 | | | 632,672 | | 6.00 | % |
| Leather & Leather Products | | | | | | | | |
| 8,000 | Coach, Inc. | | 393,190 | | | 300,480 | | 2.85 | % |
| National Commercial Banks | | | | | | | | |
| 27,000 | Bank of America Corporation | | 393,170 | | | 483,030 | | | |
| 7,400 | JPMorgan Chase & Co. | | 294,670 | | | 463,092 | | | |
| 26,000 | Wells Fargo & Company | | 961,960 | | | 1,425,320 | | | |
| | | | 1,649,800 | | | 2,371,442 | | 22.47 | % |
| Pumps & Pumping Equipment | | | | | | | | |
| 6,800 | Flowserve Corporation | | 418,686 | | | 406,844 | | 3.86 | % |
| Railroad, Line-Haul Operating | | | | | | | | |
| 14,000 | CSX Corp. | | 322,542 | | | 507,220 | | | |
| 4,400 | Norfolk Southern Corp. | | 298,937 | | | 482,284 | | | |
| 4,600 | Union Pacific Corporation | | 258,704 | | | 547,998 | | | |
| | | | 880,183 | | | 1,537,502 | | 14.57 | % |
| Regional - Pacific Banks | | | | | | | | |
| 41,800 | New Resource Bank * (a) (b) | | 132,150 | | | 187,264 | | 1.78 | % |
| Retail - Auto Dealers & Gasoline Stations | | | | | | | | |
| 2,600 | America's Car-Mart, Inc. * | | 118,432 | | | 138,788 | | 1.32 | % |
| Retail - Family Clothing Stores | | | | | | | | |
| 8,000 | The Gap, Inc. | | 254,223 | | | 336,880 | | | |
| 9,600 | Ross Stores Inc. | | 381,166 | | | 904,896 | | | |
| | | | 635,389 | | | 1,241,776 | | 11.77 | % |
| Services - Miscellaneous Health & Allied Services, NEC | | | | | | | | |
| 7,000 | IPC Healthcare, Inc. * | | 285,643 | | | 321,230 | | 3.05 | % |
| State Commercial Banks | | | | | | | | |
| 6,000 | Standard Financial Corp. (b) | | 86,372 | | | 130,500 | | 1.24 | % |
| Total for Common Stocks | $ | 6,127,231 | | $ | 8,867,783 | | 84.07 | % |
| Total Investment Securities | $ | 6,127,231 | | $ | 8,867,783 | | 84.07 | % |
| Other Assets in Excess of Liabilities | | | | $ | 1,680,725 | | 15.93 | % |
| Net Assets | | | | | $ | 10,548,508 | | 100.00 | % |
| | * Non-Income Producing Securities.
(a) Illiquid security. See Note 3.
(b) Level 2 investment.
The accompanying notes are an integral part of these
financial statements. |
11
| Bretton Fund |
| |
| Statement of Assets and Liabilities | | |
| December 31, 2014 | | |
| |
| Assets: | | |
| Investment Securities at Fair Value | $ | 8,867,783 |
| (Cost $6,127,231) | | |
| Cash | | 1,686,127 |
| Dividend Receivable | | 7,806 |
| Total Assets | | 10,561,716 |
| Liabilities: | | |
| Payable to Adviser (Note 4) | | 13,208 |
| Total Liabilities | | 13,208 |
| Net Assets | $ | 10,548,508 |
| |
| Net Assets Consist of: | | |
| Paid In Capital (Note 5) | $ | 7,795,953 |
| Accumulated Undistributed Net Investment Income (Loss) | | 11 |
| Accumulated Undistributed Realized Gain (Loss) on Investments - Net | | 11,992 |
| Unrealized Appreciation (Depreciation) in Value of Investments | | |
| Based on Identified Cost - Net | | 2,740,552 |
| Net Assets, for 410,191 Shares Outstanding | $ | 10,548,508 |
| (Unlimited shares authorized) | | |
| Net Asset Value, Offering Price and Redemption Price Per Share | | |
| ($10,548,508/410,191 shares) | $ | 25.72 |
| |
| Statement of Operations | | |
| For the fiscal year ended December 31, 2014 | | |
| |
| Investment Income: | | |
| Dividends | $ | 137,647 |
| Interest | | 16 |
| Total Investment Income | | 137,663 |
| Expenses: | | |
| Management Fees (Note 4) | | 133,151 |
| Total Expenses | | 133,151 |
| |
| Net Investment Income (Loss) | | 4,512 |
| |
| Realized and Unrealized Gain (Loss) on Investments: | | |
| Realized Gain (Loss) on Investments | | 11,992 |
| Net Change in Unrealized Appreciation (Depreciation) on Investments | | 921,400 |
| Net Realized and Unrealized Gain (Loss) on Investments | | 933,392 |
| |
| Net Increase (Decrease) in Net Assets from Operations | $ | 937,904 |
The accompanying notes are an integral part of these
financial statements. |
12
| Bretton Fund |
| |
| Statements of Changes in Net Assets | | | | | | | |
| | | 1/1/2014 | | | | 1/1/2013 | |
| | | to | | | | to | |
| | | 12/31/2014 | | | | 12/31/2013 | |
| From Operations: | | | | | | | |
| Net Investment Income (Loss) | $ | 4,512 | | | $ | 1,347 | |
| Net Realized Gain (Loss) on Investments | | 11,992 | | | | 131,250 | |
| Change in Net Unrealized Appreciation (Depreciation) | | 921,400 | | | | 1,298,490 | |
| Increase (Decrease) in Net Assets from Operations | | 937,904 | | | | 1,431,087 | |
| From Distributions to Shareholders: | | | | | | | |
| Net Investment Income | | (5,848 | ) | | | - | |
| Net Realized Gain from Security Transactions | | - | | | | (131,250 | ) |
| Change in Net Assets from Distributions | | (5,848 | ) | | | (131,250 | ) |
| From Capital Share Transactions: | | | | | | | |
| Proceeds From Sale of Shares | | 2,075,230 | | | | 1,875,859 | |
| Shares Issued on Reinvestment of Distributions | | 5,842 | | | | 131,250 | |
| Cost of Shares Redeemed | | (356,390 | ) | | | (260,886 | ) |
| Net Increase (Decrease) from Shareholder Activity | | 1,724,682 | | | | 1,746,223 | |
| |
| Net Increase (Decrease) in Net Assets | | 2,656,738 | | | | 3,046,060 | |
| |
| Net Assets at Beginning of Period | | 7,891,770 | | | | 4,845,710 | |
| Net Assets at End of Period (Including Accumulated Undistributed | | | | | | | |
| Net Investment Income of $11 and $1,347, respectively) | $ | 10,548,508 | | | $ | 7,891,770 | |
| |
| Share Transactions: | | | | | | | |
| Issued | | 88,217 | | | | 85,831 | |
| Reinvested | | 227 | | | | 5,625 | |
| Redeemed | | (14,977 | ) | | | (11,997 | ) |
| Net Increase in Shares | | 73,467 | | | | 79,459 | |
| Shares Outstanding Beginning of Period | | 336,724 | | | | 257,265 | |
| Shares Outstanding End of Period | | 410,191 | | | | 336,724 | |
| Financial Highlights | | | | | | | | | | | | | | | | | | | | |
| Selected data for a share outstanding | | | | | | | | | | | | | | | | | | | | |
| throughout the period: | | 1/1/2014 | | | | 1/1/2013 | | | | 1/1/2012 | | | | 1/1/2011 | | | | 9/30/2010* | | |
| | | to | | | | to | | | | to | | | | to | | | | to | | |
| | | 12/31/2014 | | | | 12/31/2013 | | | | 12/31/2012 | | | | 12/31/2011 | | | | 12/31/2010 | | |
| Net Asset Value - | | | | | | | | | | | | | | | | | | | | |
| Beginning of Period | $ | 23.44 | | | $ | 18.84 | | | $ | 16.98 | | | $ | 15.92 | | | $ | 15.00 | | |
| Net Investment Income (Loss) (a) | | 0.01 | | | | - | | (b) | | - | | (b) | | (0.07 | ) | | | (0.02 | ) | |
| Net Gain (Loss) on Securities | | | | | | | | | | | | | | | | | | | | |
| (Realized and Unrealized) | | 2.28 | | | | 5.00 | | | | 2.65 | | | | 1.33 | | | | 0.94 | | |
| Total from Investment Operations | | 2.29 | | | | 5.00 | | | | 2.65 | | | | 1.26 | | | | 0.92 | | |
| | |
| Distributions (From Net Investment Income) | | (0.01 | ) | | | - | | | | - | | | | - | | | | - | | |
| Distributions (From Realized Capital Gains) | | - | | | | (0.40 | ) | | | (0.79 | ) | | | (0.20 | ) | | | - | | |
| Distributions (From Return of Capital) | | - | | | | - | | | | - | | | | - | | (b) | | - | | |
| Total Distributions | | (0.01 | ) | | | (0.40 | ) | | | (0.79 | ) | | | (0.20 | ) | | | - | | |
| | |
| Net Asset Value - | | | | | | | | | | | | | | | | | | | | |
| End of Period | $ | 25.72 | | | $ | 23.44 | | | $ | 18.84 | | | $ | 16.98 | | | $ | 15.92 | | |
| Total Return (c) | | 9.79% | | | | 26.53% | | | | 15.66% | | | | 7.90 | % | | | 6.13% | | *** |
| Ratios/Supplemental Data | | | | | | | | | | | | | | | | | | | | |
| Net Assets - End of Period (Thousands) | $ | 10,549 | | | $ | 7,892 | | | $ | 4,846 | | | $ | 2,753 | | | $ | 1,846 | | |
| Ratio of Expenses to Average Net Assets | | 1.50% | | | | 1.50% | | | | 1.50% | | | | 1.50 | % | | | 1.50% | | ** |
| Ratio of Net Investment Income (Loss) to | | | | | | | | | | | | | | | | | | | | |
| Average Net Assets | | 0.05% | | | | 0.02% | | | | 0.00% | | | | (0.41 | )% | | | (0.56)% | | ** |
| Portfolio Turnover Rate | | 10.68% | | | | 6.85% | | | | 20.14% | | | | 13.14 | % | | | 0.00% | | *** |
* Commencement of Operations.
** Annualized.
*** Not Annualized.
(a) Per share amounts were calculated using the average shares method.
(b) Less than $0.005 per share.
(c) Total return in the above table represents the rate that the investor would have earned
or lost on an investment in the Fund assuming reinvestment of dividends and distributions.
The accompanying notes are an integral part of these financial statements. |
13
Notes to Financial Statements
Bretton Fund
December 31, 2014
1.) ORGANIZATION
Bretton Fund (the “Fund”) was organized as a non-diversified series of the PFS Funds (the “Trust”) on September 21, 2010. The Trust was established under the laws of Massachusetts by an Agreement and Declaration of Trust dated January 13, 2000, which was amended and restated January 20, 2011. Prior to March 5, 2010, the Trust was named Wireless Fund. The Fund is registered as an open-end investment company under the Investment Company Act of 1940, as amended. The Trust may offer an unlimited number of shares of beneficial interest in a number of separate series, each series representing a distinct fund with its own investment objectives and policies. As of December 31, 2014, there were nine series authorized by the Trust. The Fund commenced operations on September 30, 2010. The Fund's investment objective is to seek long-term capital appreciation. The investment adviser to the Fund is Bretton Capital Management, LLC (the “Adviser”).
2.) SIGNIFICANT ACCOUNTING POLICIES
SECURITY VALUATION:
All investments in securities are recorded at their estimated fair value, as described in Note 3.
FEDERAL INCOME TAXES:
The Fund’s policy is to continue to comply with the requirements of the Internal Revenue Code that are applicable to regulated investment companies and to distribute all of its taxable income to shareholders. Therefore, no federal income tax provision is required. It is the Fund’s policy to distribute annually, prior to the end of the calendar year, dividends sufficient to satisfy excise tax requirements of the Internal Revenue Code. This Internal Revenue Code requirement may cause an excess of distributions over the book year-end accumulated income. In addition, it is the Fund’s policy to distribute annually, after the end of the fiscal year, any remaining net investment income and net realized capital gains.
The Fund recognizes the tax benefits of certain tax positions only where the position is “more likely than not” to be sustained assuming examination by tax authorities. Management has analyzed the Fund’s tax positions, and has concluded that no liability for unrecognized tax benefits should be recorded related to uncertain tax positions taken on returns filed for open tax years (2011-2013), or expected to be taken in the Fund’s 2014 tax returns. The Fund identifies its major tax jurisdictions as U.S. Federal tax authorities; however, the Fund is not aware of any tax positions for which it is reasonably possible that the total amounts of unrecognized tax benefits will change materially in the next 12 months. The Fund recognizes interest and penalties, if any, related to unrecognized tax benefits as income tax expense in the Statement of Operations. During the fiscal year ended December 31, 2014, the Fund did not incur any interest or penalties.
DISTRIBUTIONS TO SHAREHOLDERS:
Distributions to shareholders, which are determined in accordance with income tax regulations, are recorded on the ex-dividend date.
The treatment for financial reporting purposes of distributions made to shareholders during the period from net investment income or net realized capital gains may differ from their ultimate treatment for federal income tax purposes. These differences are caused primarily by differences in the timing of the recognition of certain components of income, expense, or realized capital gain for federal income tax purposes. Where such differences are permanent in nature, they are reclassified in the components of the net assets based on their ultimate characterization for federal income tax purposes. Any such reclassifications will have no effect on net assets, results of operations, or net asset value per share of the Fund.
USE OF ESTIMATES:
The preparation of financial statements in conformity with accounting principles generally accepted in the United States of America (“GAAP”) requires management to make estimates and assumptions that affect the reported amounts of assets and liabilities and disclosure of contingent assets and liabilities at the date of the financial statements and the reported amounts of increases and decreases in net assets from operations during the reporting period. Actual results could differ from those estimates.
14
Notes to Financial Statements - continued
EXPENSES:
Expenses incurred by the Trust that do not relate to a specific fund of the Trust are allocated to the individual funds based on each fund’s relative net assets or another appropriate basis.
OTHER:
The Fund records security transactions based on the trade date. Dividend income is recognized on the ex-dividend date. Interest income is recognized on an accrual basis. The Fund uses the specific identification method in computing gain or loss on sales of investment securities. Discounts and premiums on securities purchased are accreted and amortized over the life of the respective securities. Withholding taxes on foreign dividends have been provided for in accordance with the Fund’s understanding of the applicable country’s tax rules and rates.
3.) SECURITIES VALUATIONS
As described in Note 2, the Fund utilizes various methods to measure the fair value of most of its investments on a recurring basis. GAAP establishes a hierarchy that prioritizes inputs to valuation methods. The three levels of inputs are:
Level 1 - Unadjusted quoted prices in active markets for identical assets or liabilities that the Fund has the ability to access.
Level 2 - Observable inputs other than quoted prices included in level 1 that are observable for the asset or liability, either directly or indirectly. These inputs may include quoted prices for the identical instrument in an inactive market, prices for similar instruments, interest rates, prepayment speeds, credit risk, yield curves, default rates, and similar data.
Level 3 - Unobservable inputs for the asset or liability, to the extent relevant observable inputs are not available, representing the Fund’s own assumptions about the assumptions a market participant would use in valuing the asset or liability, and would be based on the best information available.
The availability of observable inputs can vary from security to security and is affected by a wide variety of factors, including, for example, the type of security, whether the security is new and not yet established in the marketplace, the liquidity of markets, and other characteristics particular to the security. To the extent that valuation is based on models or inputs that are less observable or unobservable in the market, the determination of fair value requires more judgment. Accordingly, the degree of judgment exercised in determining fair value is greatest for instruments categorized in level 3.
The inputs used to measure fair value may fall into different levels of the fair value hierarchy. In such cases, for disclosure purposes, the level in the fair value hierarchy within which the fair value measurement falls in its entirety, is determined based on the lowest level input that is significant to the fair value measurement in its entirety.
FAIR VALUE MEASUREMENTS
A description of the valuation techniques applied to the Fund’s major categories of assets and liabilities measured at fair value on a recurring basis follows.
Equity securities (common stocks). Equity securities generally are valued by using market quotations, but may be valued on the basis of prices furnished by a pricing service when the Adviser believes such prices more accurately reflect the fair value of such securities. Securities that are traded on any stock exchange or on the NASDAQ over-the-counter market are generally valued by the pricing service at the last quoted sale price. Lacking a last sale price, an equity security is generally valued by the pricing service at its last bid price. To the extent these securities are actively traded and valuation adjustments are not applied, they are classified in level 1 of the fair value hierarchy. When market quotations are not readily available, when the Adviser determines that the market quotation or the price provided by the pricing service does not accurately reflect the current fair value, or when restricted or illiquid securities are being valued, such securities are valued as determined in good faith by the Adviser, in conformity with guidelines adopted by and subject to review of the Board of Trustees of the Trust, and are categorized in level 2 or level 3, when appropriate.
Illiquid securities. A security may be considered to be illiquid if it has a limited trading market. Securities are generally considered to be liquid if they can be sold or disposed of in the ordinary course of business within seven days at approximately the price at which the security is valued by the Fund. These securities are valued at fair value as described above. The Fund intends to hold
15
Notes to Financial Statements - continued
no more than 15% of its net assets in illiquid securities. As of December 31, 2014 illiquid securities as identified on the Schedule of Investments represented 1.78% of net assets.
Fixed income securities. Fixed income securities generally are valued by using market quotations, but may be valued on the basis of prices furnished by a pricing service when the Adviser believes such prices accurately reflect the fair market value of such securities. A pricing service utilizes electronic data processing techniques based on yield spreads relating to securities with similar characteristics to determine prices for normal institutional-size trading units of debt securities without regard to sale or bid prices. If the Adviser decides that a price provided by the pricing service does not accurately reflect the fair value of the securities, when prices are not readily available from a pricing service, or when restricted or illiquid securities are being valued, securities are valued at fair value as determined in good faith by the Adviser, subject to review of the Board of Trustees. Short-term investments in fixed income securities with maturities of less than 60 days when acquired, or which subsequently are within 60 days of maturity, are valued by using the amortized cost method of valuation, which the Board has determined will represent fair value. Generally, fixed income securities are categorized as level 2.
In accordance with the Trust's good faith pricing guidelines, the Adviser is required to consider all appropriate factors relevant to the value of securities for which it has determined other pricing sources are not available or reliable as described above. There is no single standard for determining fair value controls, since fair value depends upon the circumstances of each individual case. As a general principle, the current fair value of an issue of securities being valued by the Adviser would appear to be the amount which the owner might reasonably expect to receive for them upon their current sale. Methods which are in accordance with this principle may, for example, be based on (i) a multiple of earnings; (ii) a discount from market of a similar freely traded security (including a derivative security or a basket of securities traded on other markets, exchanges or among dealers); or (iii) yield to maturity with respect to debt issues, or a combination of these and other methods.
The following table summarizes the inputs used to value the Fund’s assets measured at fair value as of December 31, 2014:
| Valuation Inputs of Assets | | Level 1 | | Level 2 | | Level 3 | | Total |
| Common Stocks | | | | | | | | |
| Regional - Pacific Banks | | $ 0 | | $187,264 | | $0 | | $ 187,264 |
| State Commercial Banks | | 0 | | 130,500 | | 0 | | 130,500 |
| All Other | | 8,550,019 | | 0 | | 0 | | 8,550,019 |
| Total Investments in Securities | | $ 8,550,019 | | $317,764 | | $0 | | $ 8,867,783 |
Refer to the Fund’s Schedule of Investments for a listing of securities by industry. The Fund did not hold any Level 3 assets during the fiscal year ended December 31, 2014. There were no transfers into or out of the levels during the fiscal year ended December 31, 2014. It is the Fund’s policy to consider transfers into or out of the levels as of the end of the reporting period.
The Fund did not invest in derivative instruments during the fiscal year ended December 31, 2014.
4.) INVESTMENT ADVISORY AGREEMENT AND RELATED PARTY TRANSACTIONS
The Fund has entered into an investment advisory agreement (“Management Agreement”) with the Adviser. The Adviser manages the investment portfolio of the Fund, subject to policies adopted by the Trust's Board of Trustees, and, at its own expense and without reimbursement from the Fund, furnishes office space and all necessary office facilities, equipment, and executive personnel necessary for managing the Fund. The Adviser pays the expenses of the Fund except for the management fee, all brokerage fees and commissions, taxes, borrowing costs (such as (a) interest and (b) dividend expenses on securities sold short), fees and expenses of acquired funds, extraordinary or non-recurring expenses as may arise, including litigation to which the Fund may be a party and indemnification of the Trust’s Trustees and officers with respect thereto. For its services, the Adviser receives an investment management fee equal to 1.50% of the average daily net assets of the Fund.
For the fiscal year ended December 31, 2014, the Adviser earned management fees totaling $133,151, of which $13,208 was due to the Adviser at December 31, 2014.
16
Notes to Financial Statements - continued
5.) CAPITAL SHARES
The Trust is authorized to issue an unlimited number of shares of beneficial interest. Paid-in capital at December 31, 2014, was $7,795,953 representing 410,191 shares outstanding.
6.) RELATED PARTY TRANSACTIONS
Mr. Jeffrey R. Provence of Premier Fund Solutions, Inc. (the “Administrator”) also serves as trustee/officer of the Fund. This individual receives benefits from the Administrator resulting from administration fees paid to the Administrator of the Fund by the Adviser.
The Trustees who are not interested persons of the Trust received a total of $3,000 in Trustees’ fees plus travel and related expenses related to the Bretton Fund for the fiscal year ended December 31, 2014. Under the Management Agreement, the Adviser pays these fees.
7.) PURCHASES AND SALES OF SECURITIES
For the fiscal year ended December 31, 2014, purchases and sales of investment securities other than U.S. Government obligations and short-term investments aggregated $2,365,598 and $773,346, respectively. Purchases and sales of U.S. Government obligations aggregated $0 and $0, respectively.
8.) CONTROL OWNERSHIP
The beneficial ownership, either directly or indirectly, of more than 25% of the voting shares of a fund creates a presumption of control of the Fund, under Section 2(a)(9) of the Investment Company Act of 1940. As of December 31, 2014, Stephen Dodson, located at 870 Market Street, San Francisco, California 94102, beneficially held, in aggregate, approximately 27.67% of the Fund and therefore, may be deemed to control the Fund. Stephen Dodson is the control person of the Adviser. Also as of December 31, 2014, the Dodson family members, located at 338 Spear Street, San Francisco, California 94105, beneficially held, in aggregate, approximately 37.04% of the Fund and therefore, may be deemed to control the Fund.
9.) TAX MATTERS
For Federal income tax purposes, the cost of investments owned at December 31, 2014, was $6,127,231. At December 31, 2014, the composition of unrealized appreciation (the excess of value over tax cost) and depreciation (the excess of tax cost over value) was as follows:
| | Appreciation | | (Depreciation) | | | Net Appreciation (Depreciation) |
| | $2,851,092 | | ($110,540) | | | $2,740,552 |
There was a distribution from net investment income of $0.01427 per share paid on December 23, 2014 to the shareholders of record on December 22, 2014.
| The tax character of distributions was as follows: | | | |
| |
| | | 2014 | | 2013 | |
| Ordinary Income . | | $ 5,848 | | $ -0- | |
| Long-Term Capital Gain | | -0- | | 131,250 | |
| | | $ 5,848 | | $ 131,250 | |
As of December 31, 2014, the components of distributable earnings (accumulated losses) on a tax basis were as follows:
| Undistributed ordinary income/(accumulated losses) | | $ 11 |
| Undistributed long-term capital gain/(accumulated losses) | | 11,992 |
| Unrealized appreciation/(depreciation) | | 2,740,552 |
| | | $ 2,752,555 |
There were no differences between book basis and tax basis unrealized appreciation.
17
Additional Information
December 31, 2014
(Unaudited)
1.) AVAILABILITY OF QUARTERLY SCHEDULE OF INVESTMENTS
The Fund files its complete schedule of portfolio holdings with the Securities and Exchange Commission (“SEC”) for the first and third quarters of each fiscal year on Form N-Q. The Fund’s Form N-Q is available on the SEC’s website at http://www.sec.gov. The Fund’s Form N-Q may also be reviewed and copied at the SEC’s Public Reference Room in Washington, DC. Information on the operation of the Public Reference Room may be obtained by calling 800.SEC.0330.
2.) PROXY VOTING GUIDELINES
Bretton Capital Management, LLC, the Fund’s investment adviser (“Adviser”), is responsible for exercising the voting rights associated with the securities held by the Fund. A description of the policies and procedures used by the Adviser in fulfilling this responsibility is available without charge on the Fund’s website at www.brettonfund.com. It is also included in the Fund’s Statement of Additional Information, which is available on the SEC’s website at http://www.sec.gov.
Information regarding how the Fund voted proxies, Form N-PX, relating to portfolio securities during the most recent 12-month period ended June 30, is available without charge, upon request, by calling our toll free number (800.231.2901) . This information is also available on the SEC’s website at http://www.sec.gov.
3.) APPROVAL OF CONTINUATION OF INVESTMENT ADVISORY AGREEMENT BETWEEN THE TRUST AND BRETTON CAPITAL MANAGEMENT, LLC ON BEHALF OF THE BRETTON FUND
At a meeting held on September 18, 2014 (the “Meeting”), the Board of Trustees (the “Board” and the “Trustees”) considered the approval of the continuation of the Investment Advisory Agreement (the “Agreement”) between the Trust and Bretton Capital Management, LLC (“Bretton”) on behalf of the Bretton Fund (the “Fund”).
In approving the Agreement, the Board of Trustees considered and evaluated the following factors: (i) the nature, extent and quality of the services provided by Bretton to the Fund; (ii) the investment performance of the Fund and Bretton; (iii) the cost of the services to be provided and the profits to be realized by Bretton from the relationship with the Fund; (iv) the extent to which economies of scale will be realized as the Fund grows and whether the fee levels reflect these economies of scale to the benefit of shareholders; and (v) Bretton’s practices regarding possible conflicts of interest and other benefits to be realized by Bretton.
In assessing these factors and reaching its decisions, the Board took into consideration information furnished for the Board’s review and consideration throughout the year at regular Board meetings, as well as information specifically prepared and/or presented in connection with the annual renewal process, including information presented at the Meeting. The Board requested and was provided with information and reports relevant to the annual renewal of the Agreement, including: (i) information regarding the services and support provided to the Fund and its shareholders by Bretton; (ii) assessments of the investment performance of the Fund; (iii) commentary on the reasons for the performance; (iv) a presentation addressing Bretton’s investment philosophy, investment strategy, personnel and operations; (v) compliance and audit related information concerning the Fund and Bretton; (vi) disclosure information contained in the registration statement of the Trust; and (vii) a memorandum from Legal Counsel that summarized the fiduciary duties and responsibilities of the Board in reviewing and approving the Agreement, including the material factors set forth above and the types of information included in each factor that should be considered by the Board in order to make an informed decision. The Board also requested and received various informational materials including, without limitation: (i) documents containing information about Bretton, including financial information, a description of personnel and the services provided to the Fund, information on investment advice, performance, summaries of Fund expenses, compliance program, current legal matters, and other general information; (ii) comparative expense and performance information for other mutual funds with strategies similar to the Fund; (iii) the anticipated effect of size on the Fund’s performance and expenses; and (iv) benefits to be realized by Bretton from its relationship with the Fund. The Board did not identify any particular information that was most relevant to its consideration to approve the Agreement and each Trustee may have afforded different weight to the various factors.
18
Additional Information (Unaudited) - continued
1. Nature, Extent and Quality of the Services Provided by Bretton
In considering the nature, extent, and quality of the services provided by Bretton, the Trustees reviewed the responsibilities of Bretton under the Agreement. The Trustees reviewed the services being provided by Bretton including, without limitation: the quality of investment advisory services (including research and recommendations with respect to portfolio securities); the process for formulating investment recommendations and assuring compliance with the Fund’s investment objective, strategies, and limitations, as well as for ensuring compliance with regulatory requirements. The Trustees considered the coordination of services for the Fund among Bretton and the service providers and the Independent Trustees; and the efforts of Bretton to promote the Fund and grow its assets. The Trustees noted the continued cooperation with the Independent Trustees and Legal Counsel for the Fund. The Trustees evaluated the qualifications of Bretton’s principal, including his education and experience. After reviewing the foregoing information and further information in the materials provided by Bretton, the Board concluded that, in light of all the facts and circumstances, the nature, extent, and quality of the services provided by Bretton were satisfactory and adequate for the Fund.
2. Investment Performance of the Fund and Bretton
In considering the investment performance of the Fund and Bretton, the Trustees compared the short-term and since inception performance of the Fund with the performance of funds with similar objectives managed by other investment advisers, as well as with aggregated peer group data. As to the performance of the Fund, the Report included information regarding the performance of the Fund compared to a group of funds of similar size, style and objective, categorized by Morningstar (the “Peer Group”). All performance data was through the period ended June 30, 2014. The Trustees noted that for the 12 month period ended June 30, 2014 the Fund underper-formed its benchmark index and its Peer Group average, but for the longer-term (3 year period) the Fund underperformed its index and slightly outperformed its Peer Group average. After reviewing and discussing the investment performance of the Fund further, Bretton’s experience managing the Fund, and other relevant factors, the Board concluded, in light of all the facts and circumstances, that the investment performance of the Fund and Bretton was satisfactory.
3. Costs of the Services to be provided and profits to be realized by Bretton
In considering the costs of the services to be provided and profits to be realized by Bretton from the relationship with the Fund, the Trustees considered: (1) Bretton’s financial condition and the level of commitment to the Fund and Bretton by the principal of Bretton; (2) the asset level of the Fund; (3) the overall expenses of the Fund; and (4) the nature and frequency of advisory fee payments. The Trustees reviewed information provided by Bretton regarding its profits associated with managing the Fund. The Trustees also considered potential benefits for Bretton in managing the Fund. The Trustees then compared the fees and expenses of the Fund (including the management fee) to other comparable mutual funds. The Trustees reviewed the fees under the Agreement compared to other mutual funds with similar investment objectives and asset levels and noted that the net expense ratio was 1 basis point lower than its Peer Group average. The Trustees also reviewed the management fee of 1.50% noting that it was at the high end of the Peer Group. The Trustees also recognized that Bretton was obligated to pay certain expenses of the Fund out of its management fee, and that after paying those expenses, the Adviser’s relationship with the Fund was not profitable due to the Fund’s current asset level. Based on the foregoing, the Board concluded that the fees to be paid to Bretton and the profits to be realized by Bretton, in light of all the facts and circumstances, were fair and reasonable in relation to the nature and quality of the services provided by Bretton.
4. Economies of Scale
The Trustees next considered the impact of economies of scale on the Fund’s size and whether advisory fee levels reflect those economies of scale for the benefit of the Fund’s investors. The Trustees considered that while the management fee remained the same at all asset levels, the Fund’s shareholders had experienced benefits from the fact that Bretton was obligated to pay certain of the Fund’s operating expenses, which had the effect of limiting the overall fees paid by the Fund. In light of its ongoing consideration of the Fund’s asset levels, expectations for growth in the Fund, and fee levels, the Board determined that the Fund’s fee arrangements, in light of all the facts and circumstances, were fair and reasonable in relation to the nature and quality of the services provided by Bretton.
19
Additional Information (Unaudited) - continued
5. Interest and Benefits to the Adviser
In considering Bretton’s practices regarding conflicts of interest, the Trustees evaluated the potential for conflicts of interest and considered such matters as the experience and ability of the principal of Bretton; the basis of decisions to buy or sell securities for the Fund; and the substance and administration of Bretton’s code of ethics. The Trustees noted that the Fund is the only client of Bretton. The Trustees also considered disclosure in the registration statement of the Trust related to Bretton’s potential conflicts of interest. The Board noted that Bretton does not use “soft dollars.” The Trustees noted and accepted Bretton’s representation that it does not realize any benefits from advising the Fund other than the direct benefit of being compensated by the Fund for serving as its investment adviser. Based on the foregoing, the Board determined that Bretton’s standards and practices relating to the identification and mitigation of possible conflicts of interest were satisfactory.
The Board then reflected on its in-person discussion with a representative of the Adviser earlier in the Meeting. Next, the Independent Trustees met in executive session to discuss the continuation of the Agreement. The officers of the Trust were excused during this discussion. Upon reconvening, it was the Board’s consensus (including a majority of the independent Trustees) that the fees to be paid to Bretton, pursuant to the Agreement, were reasonable, that the overall arrangements provided under the terms of the Agreement were reasonable and within a range of what could have been negotiated at arms-length in light of all surrounding circumstances, including such services to be rendered and such other matters as the Trustees considered to be relevant in the exercise of their reasonable business judgment.
4.) APPROVAL OF NEW INVESTMENT ADVISORY AGREEMENT
Also, at a meeting held on September 18, 2014 (the “Meeting”), the Board of Trustees (the “Board” and the “Trustees”) were asked to approve a New Advisory agreement ("New Agreement") (in addition to their approval of the continuation of the existing advisory agreement) to take effect upon the closing of the change in control transaction of the Adviser (the "Transaction"). It was noted that the terms of the New Agreement will be identical to the existing agreement except for the dates. The Board then discussed the Transaction and reflected on their conversation earlier in the Meeting with representatives of the Adviser.
In approving the New Agreement, the Board of Trustees considered and evaluated the following factors: (i) the nature, extent and quality of the services to be provided by Bretton to the Fund after the Transaction; (ii) the investment performance of the Fund to date and the anticipated effect of the Transaction on the performance of the Fund; (iii) the cost of the services to be provided and the profits to be realized by Bretton from the relationship with the Fund; (iv) the extent to which economies of scale will be realized as the Fund grows and whether the fee levels reflect these economies of scale to the benefit of shareholders; and (v) Bretton's practices regarding possible conflicts of interest and other benefits to be realized by Bretton.
In assessing these factors and reaching its decisions, the Board took into consideration information furnished for the Board's review and consideration throughout the year by Bretton at regular Board meetings, as well as information specifically prepared and/or presented in connection with the annual renewal process as discussed earlier in the Meeting and additional information specifically presented at the Meeting relating to the Transaction. The Board requested and was provided with information and reports relevant to the New Agreement, including: (i) information regarding the services and support to be provided to the Fund and its shareholders by Bretton; (ii) assessments of the investment performance of the Fund; (iii) commentary on the reasons for the performance; (iv) presentations addressing Bretton's investment philosophy, investment strategy, operations and personnel, including the prospective new principal; (v) compliance and audit related information concerning the Fund and Bretton; (vi) disclosure information contained in the registration statement of the Trust; and (vii) a memorandum from Legal Counsel that summarized the fiduciary duties and responsibilities of the Board in reviewing and approving the New Agreement, including the material factors set forth above and the types of information included in each factor that should be considered by the Board in order to make an informed decision. The Board also requested and received various informational materials including, without limitation: (i) documents containing information about Bretton, including financial information, a description of personnel and the services provided to the Fund, information on investment advice, performance, summaries of Fund expenses, compliance program, current legal matters, and other general information; (ii) comparative expense and performance information for other mutual funds with strategies similar to the Fund; (iii) the anticipated effect of size on the Fund's performance and expenses; and (iv) benefits to be realized by Bretton from its relationship with the Fund. The Board did not identify any particular information that was most relevant to its consideration to approve the New Agreement and each Trustee may have afforded different weight to the various factors.
20
Additional Information (Unaudited) - continued
1. Nature, Extent and Quality of the Services Provided by Bretton
In considering the nature, extent, and quality of the services provided by Bretton, the Trustees reviewed the responsibilities of Bretton under the New Agreement. The Trustees noted that the services to be provided under the New Agreement would be identical to those currently being provided by Bretton. The Trustees reviewed the services being provided by Bretton, including, without limitation: the quality of investment advisory services (including research and recommendations with respect to portfolio securities); the process for formulating investment recommendations and assuring compliance with the Fund's investment objective, strategies, and limitations, as well as for ensuring compliance with regulatory requirements. The Trustees noted that the Fund may benefit from the additional personnel added to Bretton following the Transaction. The Trustees considered the coordination of services for the Fund among Bretton and the service providers and the Independent Trustees; and the efforts of Bretton to promote the Fund and grow its assets. The Trustees noted the continued cooperation with the Independent Trustees and Legal Counsel for the Fund. The Trustees evaluated Bretton's principal and proposed principal, including their respective education and experience. After reviewing the foregoing information and further information in the materials provided by Bretton, the Board concluded that, in light of all the facts and circumstances, the nature, extent, and quality of the services provided by Bretton were satisfactory and adequate for the Fund.
2. Investment Performance of the Fund and Bretton
In considering the investment performance of the Fund and Bretton, the Trustees compared the short-term and since inception performance of the Fund with the performance of funds with similar objectives managed by other investment advisers, as well as with aggregated peer group data. As to the performance of the Fund, the Report included information regarding the performance of the Fund compared to a group of funds of similar size, style and objective, categorized by Morningstar (the "Peer Group"). All performance data was through the period ended June 30, 2014. The Trustees noted that for the 12 month period ended June 30, 2014 the Fund underper-formed its benchmark index and its Peer Group average but for the longer-term (3 year period) the Fund underperformed its index and slightly outperformed its Peer Group average. The Trustees considered the possible impact to the performance of the Fund as a result of the Transaction. After reviewing and discussing the investment performance of the Fund further, Bretton's experience managing the Fund, and other relevant factors, the Board concluded, in light of all the facts and circumstances, that the investment performance of the Fund and Bretton was satisfactory.
3. Costs of the Services to be provided and profits to be realized by Bretton
In considering the costs of the services to be provided and profits to be realized by Bretton from the relationship with the Fund, the Trustees considered: (1) Bretton's financial condition and the level of commitment to the Fund and Bretton by the current principal of Bretton as well as investment by the new principal upon closing of the Transaction; (2) the asset level of the Fund; (3) the overall expenses of the Fund; and (4) the nature and frequency of advisory fee payments. The Trustees reviewed information provided by Bretton regarding its profits associated with managing the Fund. The Trustees also considered potential benefits for Bretton in managing the Fund. The Trustees then compared the fees and expenses of the Fund (including the management fee) to other comparable mutual funds. The Trustees reviewed the fees under the Agreement compared to other mutual funds with similar investment objectives and asset levels and noted that the net expense ratio was 1 basis point lower than its Peer Group average. The Trustees also reviewed the management fee of 1.50% noting that it was at the high end of the Peer Group. The Trustees also recognized that Bretton was obligated to pay certain expenses of the Fund out of its management fee, and that after paying those expenses, the Adviser's relationship with the Fund was not profitable due to the Fund's current asset level. Based on the foregoing, the Board concluded that the fees to be paid to Bretton and the profits to be realized by Bretton, in light of all the facts and circumstances, including those surrounding the Transaction, were fair and reasonable in relation to the nature and quality of the services provided by Bretton.
4. Economies of Scale
The Trustees next considered the impact of economies of scale on the Fund's size and whether advisory fee levels reflect those economies of scale for the benefit of the Fund's investors. The Trustees considered that while the management fee would remain the same at all asset levels
21
Additional Information (Unaudited) - continued
after the Transaction, the Fund's shareholders had experienced (and would continue to experience) benefits from the fact that Bretton was obligated to pay certain of the Fund's operating expenses, which had the effect of limiting the overall fees paid by the Fund. In light of its ongoing consideration of the Fund's asset levels, expectations for growth in the Fund, and fee levels, the Board determined that the Fund's fee arrangements, in light of all the facts and circumstances, were fair and reasonable in relation to the nature and quality of the services provided by Bretton, and that they would continue to be after the Transaction.
5. Possible conflicts of interest and benefits to Bretton
In considering Bretton's practices regarding conflicts of interest, the Trustees evaluated the potential for conflicts of interest and considered such matters as the experience and ability of the principal (and the prospective new principal) of Bretton; the basis of decisions to buy or sell securities for the Fund; and the substance and administration of Bretton's code of ethics. The Trustees noted that the Fund is the only client of Bretton and the Transaction would not change this. The Trustees also considered disclosure in the registration statement of the Trust related to Bretton's potential conflicts of interest. The Board noted that Bretton does not (and will not after the Transaction) use "soft dollars." The Trustees noted and accepted Bretton's representation that it does not realize any benefits from advising the Fund other than the direct benefit of being compensated by the Fund for serving as its investment adviser. Based on the foregoing, the Board determined that Bretton's standards and practices relating to the identification and mitigation of possible conflicts of interest were satisfactory and would continue to be after the Transaction.
The Board then reflected on its in-person discussion with representatives of Bretton earlier in the Meeting. Next, the Independent Trustees met in executive session to discuss the continuation of the Agreement. The officers of the Trust and personnel of Premier were excused during this discussion. After further review, discussion, and determination that the best interests of the Fund's shareholders were served by the renewal of the Agreement.
5.) SUBSEQUENT EVENT
The implementation of the measures to put in place the New Advisory Agreement, described above in Note 4, was delayed due to business reasons. The Board re-considered and approved the New Advisory Agreement at a special meeting held on February 11, 2015.
6.) DISCLOSURE OF EXPENSES
As a shareholder of the Fund, you incur ongoing expenses consisting solely of management fees. You will be assessed fees for outgoing wire transfers, returned checks and stop payment orders at prevailing rates charged by Mutual Shareholder Services, LLC, the Fund's transfer agent, and IRA accounts will be charged an $8.00 annual maintenance fee. This Example is intended to help you understand your ongoing costs (in dollars) of investing in the Fund and to compare these costs with the ongoing costs of investing in other mutual funds.
The Example is based on an investment of $1,000 invested in the Fund on July 1, 2014, and held through December 31, 2014.
Actual Expenses
The first line of the table below provides information about actual account values and actual expenses. You may use the information in this line, together with the amount you invested, to estimate the expenses that you paid over the period. Simply divide your account value by $1,000 (for example, an $8,600 account value divided by $1,000 = 8.6), then multiply the result by the number in the first line under the heading entitled "Expenses Paid During Period" to estimate the expenses you paid on your account during this period.
Hypothetical Example for Comparison Purposes
The second line of the table below provides information about hypothetical account values and hypothetical expenses based on the Fund's actual expense ratio and an assumed rate of return of 5% per year before expenses, which is not the Fund's actual return. The hypothetical account values and expenses may not be used to estimate the actual ending account balance or expenses you paid for the period. You may use this information to compare the ongoing costs of investing in this Fund and other funds. To do so, compare this 5% hypothetical example with the 5% hypothetical examples that appear in the shareholder reports of the other funds.
22
Additional Information (Unaudited) - continued
Please note that the expenses shown in the table are meant to highlight your ongoing costs only and do not reflect any transactional costs, such as sales charges (loads) or the charges assessed by Mutual Shareholder Services, LLC as described above. Therefore, the second line of the table is useful in comparing ongoing costs only, and will not help you determine the relative cost of owning different funds. In addition, if these transactional costs were included, your cost could have been higher.
| | | | | | | Expenses Paid |
| | | Beginning | | Ending | | During the Period* |
| | | Account Value | | Account Value | | July 1, 2014 to |
| | | July 1, 2014 | | December 31, 2014 | | December 31, 2014 |
| |
| Actual | | $1,000.00 | | $1,102.11 | | $7.95 |
| |
| Hypothetical | | $1,000.00 | | $1,017.64 | | $7.63 |
| (5% annual return | | | | | | |
| before expenses) | | | | | | |
* Expenses are equal to the Fund’s annualized expense ratio of 1.50%, multiplied by the
average account value over the period, multiplied by 184/365 (to reflect the one-half year
period ended December 31, 2014). |
23
This page was intentionally left blank.
24
Cohen Fund Audit Services, Ltd.
Certified Public Accountants | 1350 Euclid Ave., Ste 800
Cleveland, Ohio 44115
Phone: (440) 835-8500
Fax: (440) 835-1093
www.cohenfund.com |
REPORT OF INDEPENDENT REGISTERED PUBLIC ACCOUNTING FIRM
To the Shareholders of Bretton Fund and
Board of Trustees of PFS Funds
We have audited the accompanying statement of assets and liabilities, including the schedule of investments, of Bretton Fund (the "Fund"), a series of PFS Funds, as of December 31, 2014, and the related statement of operations for the year then ended, the statements of changes in net assets for each of the two years in the period then ended, and the financial highlights for each of the five periods in the period then ended. These financial statements and financial highlights are the responsibility of the Fund's management. Our responsibility is to express an opinion on these financial statements and financial highlights based on our audits.
We conducted our audits in accordance with the standards of the Public Company Accounting Oversight Board (United States). Those standards require that we plan and perform the audit to obtain reasonable assurance about whether the financial statements and financial highlights are free of material misstatement. An audit includes examining, on a test basis, evidence supporting the amounts and disclosures in the financial statements. Our procedures included confirmation of securities owned as of December 31, 2014, by correspondence with the custodian. An audit also includes assessing the accounting principles used and significant estimates made by management, as well as evaluating the overall financial statement presentation. We believe that our audits provide a reasonable basis for our opinion.
In our opinion, the financial statements and financial highlights referred to above present fairly, in all material respects, the financial position of Bretton Fund as of December 31, 2014, the results of its operations for the year then ended, the changes in its net assets for each of the two years in the period then ended, and the financial highlights for each of the five periods in the period then ended, in conformity with accounting principles generally accepted in the United States of America.

COHEN FUND AUDIT SERVICES, LTD.
Cleveland, Ohio
February 24, 2015
25
Trustees and Officers (Unaudited)
The Board of Trustees supervises the business activities of the Trust. The names of the Trustees and executive officers of the Trust are shown below. For more information regarding the Trustees, please refer to the Statement of Additional Information, which is available upon request by calling 800.231.2901. Each Trustee serves until the Trustee sooner dies, resigns, retires, or is removed.
The Trustees and Officers of the Trust and their principal business activities during the past five years are:
Interested Trustees and Officers
| | | | | Number of | |
| | | | Principal | Portfolios In | Other |
| Name, | Position(s) | Term of Office | Occupation(s) | Fund | Directorships |
| Address(1), | Held With | and Length of | During | Complex | Held By |
| and Year of Birth | the Trust | Time Served | Past 5 Years | Overseen By | Trustee |
| | | | | Trustee | |
| |
| Ross C. Provence, | President | Indefinite Term; | General Partner and Portfolio | N/A | N/A |
| Year of Birth: 1938 | | Since 2000 | Manager for Value Trend Capital | | |
| | | | Management, LP (1995 to current). | | |
| | | | Estate planning attorney (1963 to | | |
| current). |
| |
| Jeffrey R. Provence(2), | Trustee, | Indefinite Term; | General Partner and Portfolio | 9 | Blue Chip |
| Year of Birth:1969 | Secretary | Since 2000 | Manager for Value Trend Capital | | Investor Funds |
| | and | | Management, LP (1995 to current). | | |
| | Treasurer | | CEO, Premier Fund Solutions, Inc. | | |
| | | | (2001 to current). | | |
| |
| Julian G. Winters, | Chief | Chief | Managing Member, Watermark | N/A | N/A |
| Year of Birth: 1968 | Compliance | Compliance | Solutions LLC (investment compli- | | |
| | Officer | Officer Since | ance and consulting) since March | | |
| | | 2010 | 2007 | | |
(1) The address of each trustee and officer is c/o PFS Funds, 1939 Friendship Drive, Suite C, El Cajon, California 92020.
(2) Jeffrey R. Provence is considered an "interested person" as defined in Section 2(a)(19) of the Investment Company Act of 1940 by
virtue of his position with the Trust.
Independent Trustees |
| | | | | Number of | Other |
| | | | Principal | Portfolios In | Directorships |
| Name, | Position | Term of Office | Occupation(s) | Fund | Held By |
| Address(1), | Held With | and Length of | During | Complex | Trustee or |
| and Year of Birth | the Trust | Time Served | Past 5 Years | Overseen By | Officer |
| | | | | Trustee | |
| |
| Thomas H. Addis III, | Independent | Indefinite Term; | Executive Director/CEO, Southern | 9 | None |
| Year of Birth: 1945 | Trustee | Since 2000 | California PGA (2006 to current). | | |
| |
| Allen C. Brown, | Independent | Indefinite Term; | Co-owner of Stebleton & Brown | 9 | Blue Chip |
| Year of Birth: 1943 | Trustee | Since 2010 | (1994 to Current). Estate planning | | Investor Funds |
| | | | and business attorney (1970 to cur- | | |
| rent). |
| |
| George Cossolias, CPA, | Independent | Indefinite Term; | Partner of CWDL, CPAs (February 1, | 9 | Blue Chip |
| Year of Birth: 1935 | Trustee | Since 2000 | 2014 to current). Owner of George | | Investor Funds |
| | | | Cossolias & Company, CPAs (1972 | | |
| | | | to January 31, 2014). President of | | |
| | | | LubricationSpecialists, Inc. (1996 to | | |
| current) |
(1) The address of each trustee and officer is c/o PFS Funds, 1939 Friendship Drive, Suite C, El Cajon, California 92020.
26

Investment Adviser
Bretton Capital Management, LLC
Legal Counsel
The Law Offices of John H. Lively
A member firm of The 1940 Act Law GroupTM
Custodian
US Bank N.A.
Dividend Paying Agent,
Shareholders' Servicing Agent,
Transfer Agent
Mutual Shareholder Services, LLC
Fund Administrator
Premier Fund Solutions, Inc.
Independent Registered Public Accounting Firm
Cohen Fund Audit Services, Ltd. |
This report is provided for the general information of the shareholders of the Bretton
Fund. This report is not intended for distribution to prospective investors in the Fund,
unless preceded or accompanied by an effective prospectus. |
Item 2. Code of Ethics.
The registrant has adopted a code of ethics that applies to the registrant’s principal executive officer and the principal financial officer. The registrant has not made any amendments to its code of ethics during the covered period. The registrant has not granted any waivers from any provisions of the code of ethics during the covered period. A copy of the registrant’s Code of Ethics is filed herewith.
Item 3. Audit Committee Financial Expert.
The registrant’s Board of Trustees has determined that George Cossolias is an audit committee finical expert. Mr. Cossolias is independent for purposes of this Item 3.
Item 4. Principal Accountant Fees and Services.
(a-d) The following table details the aggregate fees billed for each of the last two fiscal years for audit fees, audit-related fees, tax fees and other fees by the principal accountant to the registrant. The principal accountant has provided no services to the adviser or any entity controlled by, or under common control with the adviser that provides ongoing services to the registrant.
| | | FYE 12/31/14 | | FYE 12/31/13 |
| Audit Fees | | $13,310 | | $13,250 |
| Audit-Related Fees | | $0 | | $0 |
| Tax Fees | | $2,500 | | $2,500 |
| All Other Fees | | $750 | | $750 |
Nature of Tax Fees: preparation of Excise Tax Statement and 1120 RIC.
Nature of All Other Fees: Review of Semi-Annual Report.
(e) (1) The audit committee approves all audit and non-audit related services and, therefore, has not adopted pre-approval policies and procedures described in paragraph (c)(7) of Rule 2-01 of Regulation S-X.
(e) (2) None of the services described in paragraph (b) through (d) of this Item were approved by the audit committee pursuant to paragraph (c)(7)(i)(C) of Rule 2-01 of Regulation S-X.
(f) All of the principal accountant’s hours spent on auditing the registrant’s financial statements were attributed to work performed by full-time permanent employees of the principal accountant.
(g) The following table indicates the aggregate non-audit fees billed by the registrant’s principal accountant for services to the registrant , the registrant’s investment adviser (not sub-adviser), and any entity controlling, controlled by, or under common control with the adviser that provides ongoing services to the registrant, for the last two years.
| Non-Audit Fees | | FYE 12/31/14 | | FYE 12/31/13 |
| Registrant | | $3,250 | | $3,250 |
| Registrant’s Investment Adviser | | $0 | | $0 |
(h) The principal accountant provided no services to the investment adviser or any entity controlling, controlled by, or under common control with the adviser that provides ongoing services to the registrant.
Item 5. Audit Committee of Listed Companies. Not applicable.
Item 6. Schedule of Investments. Schedule filed with Item 1.
Item 7. Disclosure of Proxy Voting Policies and Procedures for Closed-End Management Investment Companies. Not applicable.
Item 8. Portfolio Managers of Closed End Management Investment Companies. Not applicable.
Item 9. Purchases of Equity Securities by Closed-End Management Investment Companies and Affiliated Purchasers. Not applicable.
Item 10. Submission of Matters to a Vote of Security Holders.
The registrant has not adopted procedures by which shareholders may recommend nominees to the registrant’s board of trustees.
Item 11. Controls and Procedures.
(a) The registrant’s president and chief financial officer concluded that the disclosure controls and procedures (as defined in Rule 30a-3(c) under the Investment Company Act of 1940 (the “Act”)) were effective as of a date within 90 days of the filing date of this report, based on the evaluation of these controls and procedures required by Rule 30a-3(b) under the Act.
(b) There were no changes in the registrant’s internal control over financial reporting (as defined in Rule 30a-3(d) under the Act) that occurred during the registrant’s second fiscal quarter of the period covered by this report that have materially affected, or are reasonably likely to materially affect, the registrant’s internal control over financial reporting.
Item 12. Exhibits.
(a)(1) Code of Ethics. Filed herewith.
(a)(2) Certifications pursuant to Section 302 of the Sarbanes-Oxley Act of 2002. Filed herewith.
(a)(3) Not applicable.
(b) Certification pursuant to Section 906 Certification of the Sarbanes-Oxley Act of 2002. Filed herewith.
SIGNATURES
Pursuant to the requirements of the Securities Exchange Act of 1934 and the Investment Company Act of 1940, the registrant has duly caused this report to be signed on its behalf by the undersigned, thereunto duly authorized.
| | By: /s/Ross C. Provence
Ross C. Provence
President |
Pursuant to the requirements of the Securities Exchange Act of 1934 and the Investment Company Act of 1940, this report has been signed below by the following persons on behalf of the registrant and in the capacities and on the dates indicated.
| | By: /s/Ross C. Provence
Ross C. Provence
President |
| |
By: /s/Jeffrey R. Provence
Jeffrey R. Provence
Chief Financial Officer |