UNITED STATES
SECURITIES AND EXCHANGE COMMISSION
WASHINGTON, D.C. 20549
FORM N-CSR
CERTIFIED SHAREHOLDER REPORT OF REGISTERED MANAGEMENT
INVESTMENT COMPANIES
Investment Company Act file number: 811-09781
PFS Funds
(Exact name of registrant as specified in charter)
| 1939 Friendship Drive. | |
| Suite C | |
| El Cajon, CA | 92020 |
| (Address of principal executive offices) | (Zip code) |
CT Corporation System
155 Federal St., Suite 700,
Boston, MA 02110
(Name and address of agent for service)
Registrant's telephone number, including area code: (619) 588-9700
Date of fiscal year end: May 31
Date of reporting period: May 31, 2016
Form N-CSR is to be used by management investment companies to file reports with the Commission not later than 10 days after the transmission to stockholders of any report that is required to be transmitted to stockholders under Rule 30e-1 under the Investment Company Act of 1940 (17 CFR 270.30e -1). The Commission may use the information provided on Form N-CSR in its regulatory, disclosure review, inspection and policymaking roles.
A registrant is required to disclose the information specified by Form N-CSR, and the Commission will make this information public. A registrant is not required to respond to the collection of information contained in Form N-CSR unless the Form displays a currently valid Office of Management and Budget ("OMB") control number.
Item 1. Reports to Stockholders.
Annual Report
May 31, 2016
Ticker TSCVX
Triad Small Cap Value Fund
Annual Letter as of May 31, 2016
Dear Fellow Shareholders,
Welcome shareholders of the Triad Small Cap Value Fund (the “Fund”). We are pleased to present our annual report for the fiscal period ended May 31, 2016, representing eleven months of results since the Fund’s inception on June 29, 2015. Since this is our first annual letter, we’ll provide greater detail about our investment philosophy and process.
Our philosophy is to make long-term investments and think like business owners—not as short-term traders of stock certificates. We strive to own well-managed businesses with reasonable growth prospects and attractive, understandable economics. Yes, you say, who does-n’t? But we hope to obtain an advantage by staying focused on a small group of understandable, durable businesses, aligning ourselves with shareholder-oriented managements, and being price sensitive when buying and selling. Many investors profess to do this; the difference is discipline and execution.
Over long periods of time the market has rewarded business progress with higher stock prices. We repeat, over long periods of time. Over shorter time periods, the “market,” which is nothing more than a collection of individual decisions, can, and does, do really dumb things. Remaining patient through a dumb moment in the markets is psychologically difficult. But that’s where we hope to obtain an edge on the competition. It isn’t rocket science, and fortunately we don’t believe that rocket science is necessary for investment success. Independent thought, discipline, patience and fortitude are, in our view, necessary for success. We strive to be optimistic when others aren’t and cautious when carelessness seems to be in great supply.
Our philosophy can be described as why we do what we do. Our process is how we do what we do. It’s the nuts and bolts of making investment decisions. Our process is straightforward and favors a common sense approach. It’s what you might do, if you had a sum of money and were seeking to invest in a privately-held business. After identifying businesses with reasonable growth prospects and decent profitability, we seek to thoroughly analyze a company’s products or services, customers, competition, suppliers, growth prospects, management and profitability measures. While we’ll never know everything, we seek enough information to make an informed, rational decision.
Once we have studied the business, we calculate a private market value—a price that the business might sell for in an arms-length negotiated transaction—based on our estimates of the growth in business value over the next three to five years. Since the future is unknowable and our estimates can be wrong, we require a large discount to our view of intrinsic value before we will invest. Our sale process works in a similar common sense manner. As the stock price approaches our estimated future value, we reduce or sell entirely.
By using a common sense, real world approach to the stock market, we hope to reduce risk. But you should be aware that we don’t subscribe to the standard view of market volatility as risk. Instead, we view risk as the real chance of permanent capital loss, through permanent business impairment. For those of you old enough to remember Blockbuster Video, which was swept aside by Netflix and other new forms of video distribution, this is an example of a circumstance of a business that was exposed to our view of business risk.
Since we compete against many smart competitors we believe an advantage can be obtained by operating differently from most others. We do so in a couple of ways. First, we don’t attempt to mirror the benchmark indexes against which we compare ourselves. And we don’t believe in being overly diversified; we feel 30 to 45 holdings provides adequate diversification without diluting our best ideas. This compares with many similar funds which may have 100 or more holdings. Being free of benchmark constraints and focusing the portfolio on our best ideas provides greater flexibility and we believe increases our chances of above-average results. Although we acknowledge that this can result in greater short-term deviations from
2016 Annual Report 1
index results, and thus a source of temporary discomfort, we believe it’s the best way to achieve above-average long-term results.
How do you, our fellow shareholders, fit into the picture? Our life will be easier, and we believe the Fund prospects for success will be enhanced, if we are able to attract investors who understand and agree with the philosophy and process we have laid out here. We understand that as shareholders you can express your satisfaction (or lack thereof) with our performance by choosing to stay invested in the Fund or redeeming your investment – in this regard, please understand that we will work hard not only to invest well, but also to attract and retain other patient, long-term shareholders.
Attracting compatible shareholders also lessens the risk associated with redemptions during market downturns, or seeing an influx of new money during periods of market strength. We’d rather have shareholders invest more during weak market periods when valuations are lower, and less during stronger markets, when valuations are higher. This might seem rational, but market history has proven that many investors behave in the opposite manner. The fund industry doesn’t help by promoting good recent short-term performance. We hope you will resist the temptation to flee when markets are dropping, or shovel money at us when markets are soaring. This approach is somewhat unique: many mutual funds will take in new money come rain or shine.
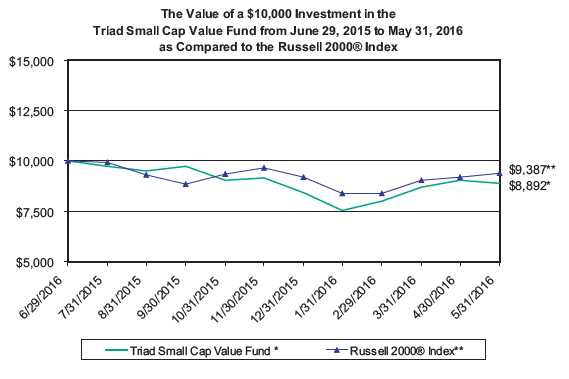
Now on to our investment results. While we suggest that results are best viewed over three to five year periods, we present our results for the eleven months since the Fund’s inception on June 29, 2015 through May 31, 2016:
| Period | June 29, 2015-May 31, 2016 | |
| |
| Triad Small Cap Value Fund | -11.08% | |
| Russell 2000® Index | -6.13% | |
The Fund underperformed the benchmark Russell 2000® Index for the period from inception through May 31, 2016.
Contributing positively to results was our underweight in Healthcare, as we had no investment in the sector during the period. Energy also contributed positively including contract drillers Patterson-UTI Energy and Diamond Offshore Drilling. Oil prices have rebounded somewhat in 2016 and after roughly two years of declining oil prices, the simple economics of lower supply and increasing global demand should lead to better industry conditions. Remy International also contributed to results as the company was acquired by BorgWarner.
Our Consumer Discretionary holdings detracted from results. Fossil Inc., Iconix and Sears Holdings all experienced weak operating results. Fossil is being impacted by wearable technology creating weakness in watch sales, but the company will be rolling out competitive offerings later this year. Iconix has new management and a plan to grow licensing revenues and reduce costs. Sears has never been primarily a retail investment for us; we believe there is significant value in the owned and leased real estate. If retail operations improve, all the better, but it’s not central to our investment thesis.
Having the benefit of over 50 years of collective investment experience, we find the current environment for common stock investments to be challenging. We have on one hand pockets of high valuations in certain popular investment themes. Think Biotechnology, Social Media, Big Data, Consumer Staples, and income-oriented areas such as Utilities and REITs (thank you Federal Reserve). In a world of geopolitical concerns, sluggish growth and low interest rates, there seems to be a bull market in safety, growth and income. Hence, the perceived safety of quality growth companies and income-oriented investments seems reasonable. What’s ironic, but seemingly too common, is the tendency for investors, much like bettors at horse races, to bet heavily on the favorite to the point where a good horse can be a bad bet. In the current quest for safety, growth and income, investors in our view seem to be paying very high prices, reducing future return prospects.
2016 Annual Report 2
At the same time, we observe undervaluation in areas where current results are lackluster, and investors have avoided these areas for the perceived safety of growth and income. This is the opposite of the safety trade, where investors perceive risk due to concerns about the economy, cyclically depressed industry conditions, lack of yield, or some combination of these risk factors. In this skittish world, risk avoidance can lead to a lack of investor demand, and in our view, depressed valuations. Think Energy, Agriculture, Industrial Manufacturing, old Media and Financial Services. Investors may avoid these depressed, out of favor areas until—drumroll please—they return to favor, when we expect the momentum crowd to hop on the bandwagon. It should be no surprise that given our tendency to go where the crowd isn’t, we have much of our portfolio in these areas.
While we do pay attention to current economic conditions, we don’t invest based upon forecasts of GDP growth, interest rates, inflation, currency exchange rates or other so-called “macro” economic factors. We simply attempt to find good businesses run by good people, purchased at good prices. If we do this, the irregular events that seem to occur with regularity (Brexit, terrorism, election results, China, etc.) will be less likely to sink our ship.
In summary, while high stock market valuations make the current environment challenging, with our focused approach we only need to find a relatively few good ideas to generate satisfactory long-term results. We believe that our current portfolio holdings can do just that over the longer term.
Both of your portfolio managers are Fund shareholders. Incentives drive behavior, and while we believe we’ll work just as hard regardless of our level of investment, our financial commitment is tangible proof of our belief in what we do. And we intend to increase our holdings over time.
Thank you for your support. We appreciate the trust you have placed in us to manage your long-term capital. We know you have choices, and we hope to reward your choice with investment excellence.
We look forward to reporting to you at the next semi-annual period.
Sincerely,
John Heldman, CFA
Partner | Portfolio Manager
Triad Investment Management, LLC
Adviser to the Triad Small Cap Value Fund
|
David Hutchison, CFA
Partner | Portfolio Manager
Triad Investment Management, LLC
Adviser to the Triad Small Cap Value Fund
|
Performance data quoted represents past performance. Past performance does not guarantee future results. The investment return and principal value of an investment will fluctuate so that an investor’s shares, when redeemed, may be worth more or less than their original cost. All returns include change in share prices, and reinvestment of any dividends and capital gains distributions. Current performance may be lower or higher than the performance data quoted. You may obtain performance data current to the most recent month-end by calling 1-888-501-1036. An investment in the Fund is subject to investment risks, including the possible loss of the principal amount invested. The Russell 2000® Index (whose composition is different from the Fund) measures the performance of the small-cap segment of the U.S. equity universe. The Russell 2000® Index is a subset of the Russell 3000® Index representing approximately 10% of the total market capitalization of that index. It includes approximately 2000 of the smallest securities based on a combination of their market cap and current index membership. The Fund’s principal underwriter is Rafferty Capital Markets, LLC.
2016 Annual Report 3
TRIAD SMALL CAP VALUE FUND (Unaudited)
PERFORMANCE INFORMATION
May 31, 2016 NAV $8.84
TOTAL RETURNS (%) AS OF MAY 31, 2016
| | Since | |
| | Inception(A) | |
| Triad Small Cap Value Fund | -11.08% | |
| Russell 2000® Index (B) | -6.13% | |
Annual Fund Operating Expense Ratio (from 6/29/15 Prospectus): 1.50%
(A)Since Inception returns include change in share prices and in each case includes reinvestment of any dividends and capital gain distributions. The Triad Small Cap Value Fund commenced operations on June 29, 2015.
(B)The Russell 2000® Index (whose composition is different from the Fund) measures the performance of the small-cap segment of the U.S. equity universe. The Russell 2000® Index is a subset of the Russell 3000® Index representing approximately 10% of the total market capitalization of that index. It includes approximately 2000 of the smallest securities based on a combination of their market cap and current index membership. Investors cannot invest directly in an index.
PAST PERFORMANCE DOES NOT GUARANTEE FUTURE RESULTS. INVESTMENT RETURN AND PRINCIPAL VALUE WILL FLUCTUATE SO THAT SHARES, WHEN REDEEMED, MAY BE WORTH MORE OR LESS THAN THEIR ORIGINAL COST. RETURNS DO NOT REFLECT THE DEDUCTION OF TAXES THAT A SHAREHOLDER WOULD PAY ON FUND DISTRIBUTIONS OR THE REDEMPTION OF FUND SHARES. CURRENT PERFORMANCE MAY BE LOWER OR HIGHER THAN THE PERFORMANCE DATA QUOTED. TO OBTAIN PERFORMANCE DATA CURRENT TO THE MOST RECENT MONTH END, PLEASE CALL 1-888-501-1036. AN INVESTMENT IN THE FUND IS SUBJECT TO INVESTMENT RISKS, INCLUDING THE POSSIBLE LOSS OF THE PRINCIPAL AMOUNT INVESTED. THE FUND'S DISTRIBUTOR IS RAFFERTY CAPITAL MARKETS, LLC.
2016 Annual Report 4
TRIAD SMALL CAP VALUE FUND (Unaudited)
Triad Small Cap Value Fund
by Sectors (as a percentage of Net Assets)
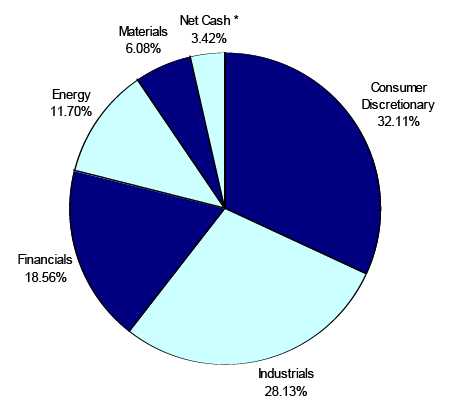
*Net Cash represents cash and cash equivalents and other assets less liabilities.
Availability of Quarterly Schedule of Investments
The Fund files its complete schedule of portfolio holdings with the Securities and Exchange Commission (“SEC”) for the first and third quarters of each fiscal year on Form N-Q. The Fund’s Form N-Q is available on the SEC’s website at http://www.sec.gov. The Fund’s Form N-Q may also be reviewed and copied at the SEC’s Public Reference Room in Washington, DC. Information on the operation of the Public Reference Room may be obtained by calling 1-800-SEC-0330.
Proxy Voting Guidelines
Triad Investment Management, LLC, the Fund’s investment adviser (“Adviser”), is responsible for exercising the voting rights associated with the securities held by the Fund. A description of the policies and procedures used by the Adviser in fulfilling this responsibility is available without charge on the Fund’s website at www.triadmutualfunds.com. It is also included in the Fund’s Statement of Additional Information, which is available on the SEC’s website at http://www.sec.gov.
Information regarding how the Fund voted proxies, Form N-PX, relating to portfolio securities during the most recent period ended June 30th, is available without charge, upon request, by calling our toll free number (1-888-501-1036). This information is also available on the SEC’s website at http://www.sec.gov.
2016 Annual Report 5
Disclosure of Expenses
(Unaudited)
Shareholders of this Fund incur ongoing costs consisting of management fees and service fees. Although the Fund charges no sales loads or transaction fees, you will be assessed fees for outgoing wire transfers, returned checks and stop payment orders at prevailing rates charged by Mutual Shareholder Services, LLC, the Fund’s transfer agent. IRA accounts will be charged an $8.00 annual maintenance fee. If shares are redeemed within 90 days of purchase from the Fund, the shares are subject to a 2% redemption fee. Additionally, your account will be indirectly subject to the expenses of the underlying funds. The following example is intended to help you understand your ongoing costs of investing in the Fund and to compare these costs with similar costs of investing in other mutual funds. The example is based on an investment of $1,000 invested in the Fund on December 1, 2015 and held through May 31, 2016.
The first line of the table below provides information about actual account values and actual expenses. In order to estimate the expenses a shareholder paid during the period covered by this report, shareholders can divide their account value by $1,000 (for example, an $8,600 account value divided by $1,000 = 8.6) and then multiply the result by the number in the first line under the heading entitled “Expenses Paid During the Period.”
The second line of the table below provides information about hypothetical account values and hypothetical expenses based on the Fund’s actual expense ratio and an assumed rate of return of 5% per year before expenses, which is not the Fund’s actual return. The hypothetical account values and expenses may not be used to estimate the actual ending account balance or expenses paid by a shareholder for the period. Shareholders may use this information to compare the ongoing costs of investing in this Fund and other funds. To do so, compare this 5% hypothetical example with the 5% hypothetical examples that appear in other funds’ shareholder reports.
Please note that the expenses shown in the table are meant to highlight your ongoing costs only and do not reflect any transactional costs, such as redemption fees or the charges assessed by Mutual Shareholder Services, LLC as described above and expenses of underlying funds. Therefore, the second line of the table is useful in comparing ongoing costs only, and will not help you determine the relative total costs of owning different funds. In addition, if these transactional costs were included, your costs would have been higher.
| | | | | | | Expenses Paid |
| | | Beginning | | Ending | | During the Period* |
| | | Account Value | | Account Value | | December 1, 2015 |
| | | December 1, 2015 | | May 31, 2016 | | to May 31, 2016 |
| |
| Actual | | $1,000.00 | | $970.72 | | $7.39 |
| |
| Hypothetical | | $1,000.00 | | $1,017.50 | | $7.57 |
| (5% annual return | | | | | | |
| before expenses) | | | | | | |
* Expenses are equal to the Fund’s annualized expense ratio of 1.50%, multiplied by
the average account value over the period, multiplied by 183/366 (to reflect the
one-half year period) |
2016 Annual Report 6
| Triad Small Cap Value Fund | | | | |
| | | | Schedule of Investments |
| | | | | May 31, 2016 |
| Shares | | Fair Value | % of Net Assets |
| COMMON STOCKS | | | | |
| | | | | |
| Cable & Other Pay Television Services | | | | |
| 416 | AMC Networks Inc. * | $ | 26,599 | | |
| 990 | Starz - Class A * | | 26,730 | | |
| | | | 53,329 | 6.98 | % |
| Concrete, Gypsum & Plaster Products | | | | |
| 533 | USG Corporation * | | 15,382 | 2.01 | % |
| Deep Sea Foreign Transportation Of Freight | | | | |
| 434 | SEACOR Holdings Inc. * | | 24,899 | 3.26 | % |
| Drilling Oil & Gas Wells | | | | |
| 1,340 | Diamond Offshore Drilling, Inc. | | 34,599 | | |
| 1,601 | Patterson-UTI Energy, Inc. | | 29,794 | | |
| | | | 64,393 | 8.44 | % |
| Fabricated Plate Work (Boiler Shops) | | | | |
| 1,074 | Chart Industries, Inc. * | | 27,881 | 3.65 | % |
| Footwear, (No Rubber) | | | | |
| 2,987 | Iconix Brand Group, Inc. * | | 23,030 | 3.01 | % |
| Industrial Instruments For Measurement, Display, And Control | | | | |
| 218 | Esterline Technologies Corporation * | | 14,695 | 1.92 | % |
| Industrial Trucks, Tractors, Trailers & Stackers | | | | |
| 546 | Terex Corporation | | 11,564 | 1.51 | % |
| Investment Advice | | | | |
| 656 | Eaton Vance Corp. | | 23,852 | 3.12 | % |
| Land Subdividers & Developers (No Cemeteries) | | | | |
| 2,376 | The St. Joe Company * | | 41,295 | 5.40 | % |
| Miscellaneous Chemical Products | | | | |
| 3,277 | Platform Specialty Products Corporation * | | 31,099 | 4.07 | % |
| Miscellaneous Industrial & Commercial Machinery & Equipment | | | | |
| 723 | Actuant Corporation Class A | | 19,731 | 2.58 | % |
| Motor Vehicle Parts & Accessories | | | | |
| 694 | Allison Transmission Holdings, Inc. | | 19,494 | 2.55 | % |
| Motors & Generators | | | | |
| 501 | Generac Holdings Inc. * | | 18,993 | 2.49 | % |
| Oil & Gas Filed Machinery & Equipment | | | | |
| 1,470 | NOW, Inc. * | | 25,490 | 3.34 | % |
| Pumps & Pumping Equipment | | | | |
| 1,078 | Colfax Corporation * | | 29,203 | 3.82 | % |
| Real Estate | | | | | |
| 1,112 | Kennedy-Wilson Holdings, Inc. | | 23,708 | | |
| 2,198 | Pico Holdings, Inc. * | | 20,353 | | |
| | | | 44,061 | 5.77 | % |
| Retail - Department Stores | | | | |
| 1,711 | Sears Holdings Corporation * | | 22,688 | 2.97 | % |
| Retail - Eating Places | | | | |
| 2,005 | J. Alexander’s Holdings, Inc. * | | 20,852 | 2.73 | % |
| Retail - Family Clothing Stores | | | | |
| 953 | The Buckle, Inc. | | 23,568 | 3.08 | % |
| Services - Business Services, NEC | | | | |
| 973 | Sotheby’s Holdings, Inc. - Class A | | 29,093 | 3.81 | % |
| Services - Educational Services | | | | |
| 38 | Graham Holdings Company | | 18,922 | 2.48 | % |
* Non-Income Producing Security.
The accompanying notes are an integral part of these
financial statements. |
2016 Annual Report 7
| Triad Small Cap Value Fund |
| | | | Schedule of Investments |
| | | | | | May 31, 2016 |
| Shares | | Fair Value | | % of Net Assets |
| COMMON STOCKS | | | | | |
| | | | | | |
| Television Broadcasting Stations | | | | | |
| 874 | Tribune Media Company Class A | $ | 35,179 | | 4.60 | % |
| Title Insurance | | | | | | |
| 2,717 | Fidelity National Financial Ventures * | | 32,658 | | 4.27 | % |
| Watches, Clocks, Clockwork Operated Devices/Parts | | | | | |
| 672 | Fossil Group, Inc. * | | 18,729 | | 2.45 | % |
| Wholesale - Hardware | | | | | |
| 1,274 | Wesco Aircraft Holdings, Inc. * | | 17,951 | | 2.35 | % |
| Wholesale - Industrial Machinery & Equipment | | | | | |
| 2,112 | MRC Global Inc. * | | 29,969 | | 3.92 | % |
| Total for Common Stocks (Cost $766,068) | | 738,000 | | 96.58 | % |
| | Total Investment Securities | | 738,000 | | 96.58 | % |
| | (Cost $766,068) | | | | | |
| | Other Assets In Excess of Liabilities | | 26,151 | | 3.42 | % |
| | Net Assets | $ | 764,151 | | 100.00 | % |
* Non-Income Producing Security.
The accompanying notes are an integral part of these
financial statements. |
2016 Annual Report 8
| Triad Small Cap Value Fund | | | |
| |
| Statement of Assets and Liabilities | | | |
| May 31, 2016 | | | |
| |
| Assets: | | | |
| Investment Securities at Fair Value | $ | 738,000 | |
| (Cost $766,068) | | | |
| Cash | | 14,172 | |
| Dividends Receivable | | 322 | |
| Receivable for Securities Sold | | 21,221 | |
| Total Assets | | 773,715 | |
| Liabilities: | | | |
| Payable for Securities Purchased | | 8,621 | |
| Management Fees Payable | | 629 | |
| Service Fees Payable | | 314 | |
| Total Liabilities | | 9,564 | |
| Net Assets | $ | 764,151 | |
| |
| Net Assets Consist of: | | | |
| Paid In Capital | $ | 820,198 | |
| Accumulated Undistributed Net Investment Income/(Loss) | | (3,064 | ) |
| Accumulated Undistributed Realized Gain/(Loss) on Investments - Net | | (24,915 | ) |
| Unrealized Appreciation/(Depreciation) in Value of Investments | | | |
| Based on Identified Cost - Net | | (28,068 | ) |
| Net Assets, for 86,442 Shares Outstanding | $ | 764,151 | |
| (Unlimited shares authorized) | | | |
| Net Asset Value and Offering Price Per Share | | | |
| ($764,151/86,442 shares) | $ | 8.84 | |
| Redemption Price * ($8.84 x 0.98) (Note 2) | $ | 8.66 | |
| |
| Statement of Operations | | | |
| For the period June 29, 2015** through May 31, 2016 | | | |
| |
| Investment Income: | | | |
| Dividends | $ | 3,111 | |
| Interest | | 3 | |
| Total Investment Income | | 3,114 | |
| Expenses: | | | |
| Management Fees (Note 4) | | 5,795 | |
| Service Fees (Note 4) | | 2,897 | |
| Total Expenses | | 8,692 | |
| |
| Net Investment Income/(Loss) | | (5,578 | ) |
| |
| Realized and Unrealized Gain/(Loss) on Investments | | | |
| Realized Gain/(Loss) on Investments | | (18,454 | ) |
| Net Change in Unrealized Appreciation/(Depreciation) on Investments | | (28,068 | ) |
| Net Realized and Unrealized Gain/(Loss) on Investments | | (46,522 | ) |
| |
| Net Increase/(Decrease) in Net Assets from Operations | $ | (52,100 | ) |
| | * Reflects a 2% redemption fee if shares are redeemed within 90 days of purchase.
** Commencement of Operations. |
The accompanying notes are an integral part of these
financial statements. |
2016 Annual Report 9
| Triad Small Cap Value Fund |
| | |
| Statement of Changes in Net Assets | | | | |
| | | 6/29/2015* | | |
| | | to | | |
| | | 5/31/2016 | | |
| From Operations: | | | | |
| Net Investment Income/(Loss) | $ | (5,578 | ) | |
| Net Realized Gain/(Loss) on Investments | | (18,454 | ) | |
| Change in Net Unrealized Appreciation/(Depreciation) | | (28,068 | ) | |
| Increase/(Decrease) in Net Assets from Operations | | (52,100 | ) | |
| From Distributions to Shareholders: | | | | |
| Net Investment Income | | - | | |
| Net Realized Gain from Security Transactions | | (3,916 | ) | |
| Change in Net Assets from Distributions | | (3,916 | ) | |
| From Capital Share Transactions: | | | | |
| Proceeds From Sale of Shares | | 816,251 | | |
| Proceeds From Redemption Fees (Note 2) | | - | | |
| Shares Issued on Reinvestment of Dividends | | 3,916 | | |
| Cost of Shares Redeemed | | - | | |
| Net Increase/(Decrease) from Shareholder Activity | | 820,167 | | |
| Net Increase/(Decrease) in Net Assets | | 764,151 | | |
| Net Assets at Beginning of Period | | - | | |
| Net Assets at End of Period (Including Accumulated Undistributed Net | | | | |
| Investment Income/(Loss) of ($3,064)) | $ | 764,151 | | |
| Share Transactions: | | | | |
| Issued | | 85,987 | | |
| Reinvested | | 455 | | |
| Redeemed | | - | | |
| Net Increase in Shares | | 86,442 | | |
| Shares Outstanding Beginning of Period | | - | | |
| Shares Outstanding End of Period | | 86,442 | | |
* Commencement of Operations.
The accompanying notes are an integral part of these
financial statements. |
2016 Annual Report 10
| Triad Small Cap Value Fund |
| | |
| Financial Highlights | | | | |
| Selected data for a share outstanding throughout the period: | | 6/29/2015* | | |
| | | to | | |
| | | 5/31/2016 | | |
| Net Asset Value - | | | | |
| Beginning of Period | $ | 10.00 | | |
| Net Investment Income/(Loss) (a) | | (0.08 | ) | |
| Net Gain/(Loss) on Securities (b) | | | | |
| (Realized and Unrealized) | | (1.03 | ) | |
| Total from Investment Operations | | (1.11 | ) | |
| Distributions (From Net Investment Income) | | - | | |
| Distributions (From Realized Capital Gains) | | (0.05 | ) | |
| Total Distributions | | (0.05 | ) | |
| Proceeds from Redemption Fee (Note 2) | | - | | |
| Net Asset Value - | | | | |
| End of Period | $ | 8.84 | | |
| Total Return (c) | | (11.08)% | | ** |
| Ratios/Supplemental Data | | | | |
| Net Assets - End of Period (Thousands) | $ | 764 | | |
| Ratio of Expenses to Average Net Assets | | 1.50% | | *** |
| Ratio of Net Investment Income/(Loss) to Average Net Assets | | (0.96)% | | *** |
| Portfolio Turnover Rate | | 75.98% | | ** |
* Commencement of Operations.
** Not Annualized.
*** Annualized.
(a) Per share amounts were calculated using the average shares method.
(b) Realized and unrealized gains and losses per share in this caption are balancing amounts necessary to
reconcile the change in net asset value for the period, and may not reconcile with the aggregate gains and
losses in the Statement of Operations due to share transactions for the period.
(c) Total return in the above table represents the rate that the investor would have earned or lost on an
investment in the Fund assuming reinvestment of dividends and distributions. |
The accompanying notes are an integral part of these
financial statements. |
2016 Annual Report 11
NOTES TO THE FINANCIAL STATEMENTS
TRIAD SMALL CAP VALUE FUND
May 31, 2016
1.) ORGANIZATION
Triad Small Cap Value Fund (the “Fund”) was organized as a diversified series of the PFS Funds (the “Trust”) on June 18, 2015 and commenced operations on June 29, 2015. The Trust is an open-end investment company established under the laws of Massachusetts by an Agreement and Declaration of Trust dated January 13, 2000, as amended on January 20, 2011. Prior to March 5, 2010, the Trust was named Wireless Fund. The Trust is registered as an open-end investment company under the Investment Company Act of 1940, as amended (the “1940 Act”). The Trust may offer an unlimited number of shares of beneficial interest in a number of separate series, each series representing a distinct fund with its own investment objectives and policies. As of May 31, 2016, there were nine series authorized by the Trust. The Fund’s primary objective is to seek long-term capital appreciation. The investment adviser to the Fund is Triad Investment Management, LLC (the “Adviser”). Significant accounting policies of the Fund are presented below.
2.) SIGNIFICANT ACCOUNTING POLICIES
SECURITY VALUATION
The Fund is an investment company and accordingly follows the investment company accounting and reporting guidance of the Financial Accounting Standards Board (“FASB”) Accounting Standards Codification Topic 946 Financial Services - Investment Companies. All investments in securities are recorded at their estimated fair value, as described in Note 3.
SHARE VALUATION
The net asset value (the “NAV”) is generally calculated as of the close of trading on the New York Stock Exchange (normally 4:00 p.m. Eastern time) every day the Exchange is open. The NAV is calculated by taking the total value of the Fund’s assets, subtracting its liabilities, and then dividing by the total number of shares outstanding, rounded to the nearest cent. The offering price and redemption price per share are equal to the net asset value per share, except that shares of the Fund are subject to a redemption fee of 2% if redeemed within 90 days of purchase. During the period June 29, 2015 through May 31, 2016, proceeds from redemption fees were $0.
FEDERAL INCOME TAXES
The Fund’s policy is to continue to comply with the requirements of the Internal Revenue Code that are applicable to regulated investment companies and to distribute all of its taxable income to shareholders. Therefore, no federal income tax provision is required. It is the Fund’s policy to distribute annually, prior to the end of the calendar year, dividends sufficient to satisfy excise tax requirements of the Internal Revenue Code. This Internal Revenue Code requirement may cause an excess of distributions over the book year-end accumulated income. In addition, it is the Fund’s policy to distribute annually, after the end of the fiscal year, any remaining net investment income and net realized capital gains.
The Fund recognizes the tax benefits of certain tax positions only where the position is “more likely than not” to be sustained assuming examination by tax authorities. Management has analyzed the Fund’s tax positions, and has concluded that no liability for unrecognized tax benefits should be recorded related to uncertain tax positions expected to be taken in the Fund’s initial tax return. The Fund identifies its major tax jurisdictions as U.S. Federal tax authorities; however, the Fund is not aware of any tax positions for which it is reasonably possible that the total amounts of unrecognized tax benefits will change materially in the next twelve months. The Fund recognizes interest and penalties, if any, related to unrecognized tax benefits as income tax expense in the Statement of Operations. During the period June 29, 2015 through May 31, 2016, the Fund did not incur any interest or penalties.
DISTRIBUTIONS TO SHAREHOLDERS
Distributions to shareholders, which are determined in accordance with income tax regulations, are recorded on the ex-dividend date.
The treatment for financial reporting purposes of distributions made to shareholders during the year from net investment income or net realized capital gains may differ from their ultimate treatment for federal income tax purposes. These differences are caused primarily by differences in the timing of the recognition of certain components of income, expense, or realized capital gain for federal income tax purposes. Where such differences are permanent in nature, they are reclassified in the components of the net assets based on their ultimate characterization for federal income tax purposes. Any such reclassifications will have no effect on net assets, results of operations, or net asset value per share of the Fund. For the fiscal period ended May 31, 2016, accumulated undistributed net invest-
2016 Annual Report 12
Notes to the Financial Statements - continued
ment income/loss was increased by $2,514 and accumulated undistributed realized gain/loss on investments – net was reduced by $2,514.
USE OF ESTIMATES
The preparation of financial statements in conformity with accounting principles generally accepted in the United States of America (“GAAP”) requires management to make estimates and assumptions that affect the reported amounts of assets and liabilities and disclosure of contingent assets and liabilities at the date of the financial statements and the reported amounts of increases and decreases in net assets from operations during the reporting period. Actual results could differ from those estimates.
ORGANIZATIONAL & OFFERING EXPENSES|
All costs incurred by the Fund in connection with the organization, offering and initial registration of the Fund, principally professional fees, were paid on behalf of the Fund by the Adviser and will not be borne by the Fund.
EXPENSES
Expenses incurred by the Trust that do not relate to a specific fund of the Trust are allocated to the individual funds based on each Fund’s relative net assets or another appropriate basis.
OTHER
The Fund records security transactions based on the trade date for financial statement reporting purposes. Dividend income is recognized on the ex-dividend date. Interest income is recognized on an accrual basis. The Fund uses the specific identification method in computing gain or loss on the sale of investment securities. Withholding taxes on foreign dividends have been provided for in accordance with the Fund’s understanding of the applicable country’s tax rules and rates.
3.) SECURITIES VALUATIONS
The Fund utilizes various methods to measure the fair value of most of its investments on a recurring basis. GAAP establishes a hierarchy that prioritizes inputs to valuation methods. The three levels of inputs are:
Level 1 - Unadjusted quoted prices in active markets for identical assets or liabilities that the Fund has the ability to access.
Level 2 - Inputs other than quoted prices included in level 1 that are observable for the asset or liability, either directly or indirectly. These inputs may include quoted prices for the identical instrument on an inactive market, prices for similar instruments, interest rates, prepayment speeds, credit risk, yield curves, default rates and similar data.
Level 3 - Unobservable inputs for the asset or liability, to the extent relevant observable inputs are not available, representing the Fund’s own assumptions about the assumptions a market participant would use in valuing the asset or liability, and would be based on the best information available.
The availability of observable inputs can vary from security to security and is affected by a wide variety of factors, including, for example, the type of security, whether the security is new and not yet established in the marketplace, the liquidity of markets, and other characteristics particular to the security. To the extent that valuation is based on models or inputs that are less observable or unobservable in the market, the determination of fair value requires more judgment. Accordingly, the degree of judgment exercised in determining fair value is greatest for instruments categorized in level 3.
The inputs used to measure fair value may fall into different levels of the fair value hierarchy. In such cases, for disclosure purposes, the level in the fair value hierarchy within which the fair value measurement falls in its entirety, is determined based on the lowest level input that is significant to the fair value measurement in its entirety.
FAIR VALUE MEASUREMENTS
A description of the valuation techniques applied to the Fund’s major categories of assets and liabilities measured at fair value on a recurring basis follows.
Equity securities (common stocks). Equity securities generally are valued by using market quotations, but may be valued on the basis of prices furnished by a pricing service when the Adviser believes such prices accurately reflect the fair market value of such securities. Securities that are traded on any stock exchange or on the NASDAQ over-the-counter market are generally valued by the pricing
2016 Annual Report 13
Notes to the Financial Statements - continued
service at the last quoted sale price. Lacking a last sale price, an equity security is generally valued by the pricing service at its last bid price. Generally, if the security is traded in an active market and is valued at the last sale price, the security is categorized as a level 1 security. When market quotations are not readily available, when the Adviser determines that the market quotation or the price provided by the pricing service does not accurately reflect the current market value, or when restricted securities are being valued, such securities are valued as determined in good faith by the Adviser, subject to review of the Board of Trustees (the “Trustees” or the “Board”) and are categorized in level 2 or level 3, when appropriate.
In accordance with the Trust’s good faith pricing guidelines, the Adviser is required to consider all appropriate factors relevant to the value of securities for which it has determined other pricing sources are not available or reliable as described above. There is no single standard for determining fair value, since fair value depends upon the circumstances of each individual case. As a general principle, the current fair value of an issue of securities being valued by the Adviser would appear to be the amount which the owner might reasonably expect to receive for them upon their current sale. Methods which are in accordance with this principle may, for example, be based on (i) a multiple of earnings; (ii) a discount from market of a similar freely traded security (including a derivative security or a basket of securities traded on other markets, exchanges or among dealers); or (iii) yield to maturity with respect to debt issues, or a combination of these and other methods.
The following table summarizes the inputs used to value the Fund’s assets measured at fair value as of May 31, 2016:
| Valuation Inputs of Assets | | Level 1 | | Level 2 | | Level 3 | | Total |
| Common Stocks | | $738,000 | | $0 | | $0 | | $738,000 |
| Total | | $738,000 | | $0 | | $0 | | $738,000 |
Refer to the Fund’s Schedule of Investments for a listing of securities by industry. The Fund did not hold any Level 3 assets during the period June 29, 2015 through May 31, 2016. There were no transfers into or out of the levels during the period June 29, 2015 through May 31, 2016. It is the Fund’s policy to consider transfers into or out of the levels as of the end of the reporting period.
The Fund did not invest in derivative instruments during the period June 29, 2015 through May 31, 2016.
4.) INVESTMENT ADVISORY AGREEMENT AND SERVICES AGREEMENT
The Fund entered into an Investment Management Agreement with Triad Investment Management, LLC as the investment adviser of the Fund. Under the terms of the Investment Management Agreement, the Adviser manages the investment portfolio of the Fund, subject to policies adopted by the Trust’s Trustees. The Adviser, at its own expense and without reimbursement from the Fund, furnishes office space and all necessary office facilities, equipment and executive personnel necessary for managing the assets of the Fund. The Adviser also pays the salaries and fees of all of its Officers and employees that serve as Officers and Trustees of the Trust. For its services, the Adviser receives a fee of 1.00% of the average daily net assets of the Fund.
Under the Services Agreement, the Adviser receives an additional fee of 0.50% and is obligated to pay the operating expenses of the Fund excluding management fees, brokerage fees and commissions, taxes, borrowing costs (such as (a) interest and (b) dividend expenses on securities sold short), ADR fees, the cost of acquired funds and extraordinary expenses.
For the period June 29, 2015 through May 31, 2016, the Adviser earned management fees totaling $5,795 and service fees totaling $2,897. As a result of the management fees and services fees, as of May 31, 2016, the Fund owed the Adviser $629 and $314, respectively.
5.) RELATED PARTY TRANSACTIONS
Jeffrey R. Provence of Premier Fund Solutions, Inc. (the “Administrator”) also serves as a trustee/officer of the Fund. This individual receives benefits from the Administrator resulting from administration fees paid to the Administrator by the Adviser.
The Trustees who are not interested persons of the Fund were each paid $750, for a total of $2,250, in Trustees’ fees for the period June 29, 2015 through May 31, 2016 by the Adviser.
6.) CAPITAL SHARES
The Trust is authorized to issue an unlimited number of shares of beneficial interest for the Fund. Paid in capital for the Fund at May 31, 2016 was $820,198 representing 86,442 shares outstanding.
2016 Annual Report 14
Notes to the Financial Statements - continued
7.) PURCHASES AND SALES OF SECURITIES
For the period June 29, 2015 through May 31, 2016, purchases and sales of investment securities other than U.S. Government obligations and short-term investments aggregated $1,179,203 and $393,791, respectively. Purchases and sales of U.S. Government obligations aggregated $0 and $0, respectively.
8.) CONTROL OWNERSHIP
The beneficial ownership, either directly or indirectly, of more than 25% of the voting securities of a fund creates a presumption of control of a fund, under Section 2(a)(9) of the Investment Company Act of 1940. As of May 31, 2016, The Smith Trust, beneficially held, in aggregate, 58.18% of the Fund and therefore may be deemed to control the Fund.
9.) TAX MATTERS
For Federal income tax purposes, the cost of investments owned at May 31, 2016 was $790,983. At May 31, 2016, the composition of unrealized appreciation (the excess of value over tax cost) and depreciation (the excess of tax cost over value) was as follows:
| | Appreciation | | (Depreciation) | | Net Appreciation/(Depreciation) | |
| | $56,020 | | ($109,003) | | ($52,983) | |
The tax character of distributions was as follows:
| | | June 29, 2015 to |
| | | May 31, 2016 |
| Ordinary Income . | | $ 0 |
| Short–Term Capital Gain | | 3,916 |
| | | $ 3,916 |
As of May 31, 2016, the components of distributable earnings/(accumulated losses) on a tax basis were as follows:
| Late year ordinary loss deferral | $ | (3,064 | ) |
| Unrealized appreciation/(depreciation) | | (52,983 | ) |
| | $ | (56,047 | ) |
Income and capital gains are determined in accordance with income tax regulations that may differ from GAAP. As of May 31, 2016, these differences were primarily due to the deferral of wash sale losses, post–October losses and late year losses. Post–October losses totaled $24,847 and deferred late year losses totaled $3,064.
10.) SUBSEQUENT EVENTS
Subsequent events after the date of the Statement of Assets and Liabilities have been evaluated through the date the financial statements were issued. Management has concluded that there is no impact requiring adjustment or disclosure in the financial statements.
2016 Annual Report 15
This page was intentionally left blank.
2016 Annual Report 16
REPORT OF INDEPENDENT REGISTERED PUBLIC ACCOUNTING FIRM
To the Shareholders of Triad Small Cap Value Fund and
Board of Trustees of PFS Funds
We have audited the accompanying statement of assets and liabilities, including the schedule of investments, of Triad Small Cap Value Fund (the “Fund”), a series of PFS Funds, as of May 31, 2016, and the related statements of operations, changes in net assets, and financial highlights for the period June 29, 2015 (commencement of operations) through May 31, 2016. These financial statements and financial highlights are the responsibility of the Fund’s management. Our responsibility is to express an opinion on these financial statements and financial highlights based on our audit.
We conducted our audit in accordance with the standards of the Public Company Accounting Oversight Board (United States). Those standards require that we plan and perform the audit to obtain reasonable assurance about whether the financial statements and financial highlights are free of material misstatement. An audit includes examining, on a test basis, evidence supporting the amounts and disclosures in the financial statements. Our procedures included confirmation of securities owned as of May 31, 2016, by correspondence with the custodian and brokers. An audit also includes assessing the accounting principles used and significant estimates made by management, as well as evaluating the overall financial statement presentation. We believe that our audit provides a reasonable basis for our opinion.
In our opinion, the financial statements and financial highlights referred to above present fairly, in all material respects, the financial position of Triad Small Cap Value Fund as of May 31, 2016, the results of its operations, the changes in its net assets, and its financial highlights for the period June 29, 2015 (commencement of operations) through May 31, 2016, in conformity with accounting principles generally accepted in the United States of America.

COHEN FUND AUDIT SERVICES, LTD.
Cleveland, Ohio
July 25, 2016
2016 Annual Report 17
Trustees and Officers
(Unaudited)
The Board of Trustees supervises the business activities of the Trust. The names of the Trustees and executive officers of the Trust are shown below. For more information regarding the Trustees, please refer to the Statement of Additional Information, which is available upon request by calling 1-888-501-1036. Each Trustee serves until the Trustee sooner dies, resigns, retires, or is removed.
The Trustees and Officers of the Trust and their principal business activities during the past five years are:
Interested Trustees and Officers
| | | | | Number of | |
| | | | Principal | Portfolios In | Other |
| Name, | Position(s) | Term of Office | Occupation(s) | Fund | Directorships |
| Address(1), | Held With | and Length of | During | Complex | Held By |
| and Year of Birth | the Trust | Time Served | Past 5 Years | Overseen By | Trustee |
| | | | | Trustee | |
| |
| Ross C. Provence, | President | Indefinite Term; | General Partner and Portfolio | N/A | N/A |
| Year of Birth: 1938 | | Since 2000 | Manager for Value Trend Capital | | |
| | | | Management, LP (1995 to current). | | |
| | | | Estate planning attorney (1963 to | | |
| current). |
| |
| Jeffrey R. Provence(2), | Trustee, | Indefinite Term; | CEO, Premier Fund Solutions, Inc. | 9 | Blue Chip |
| Year of Birth: 1969 | Secretary | Since 2000 | (2001 to current). General Partner | | Investor Funds |
| | and | | and Portfolio Manager for Value | | |
| | Treasurer | | Trend Capital Management, LP | | |
| | | | (1995 to current). | | |
| |
| Julian G. Winters, | Chief | Chief | Managing Member, Watermark | N/A | N/A |
| Year of Birth: 1968 | Compliance | Compliance | Solutions LLC (investment compli- | | |
| | Officer | Officer Since | ance and consulting) since March | | |
| | | 2010 | 2007. | | |
(1) The address of each trustee and officer is c/o PFS Funds, 1939 Friendship Drive, Suite C, El Cajon, California 92020.
(2) Jeffrey R. Provence is considered an “interested person” as defined in Section 2(a)(19) of the Investment Company Act of 1940 by
virtue of his position with the Trust.
Independent Trustees |
| | | | | Number of | |
| | | | Principal | Portfolios In | Other |
| Name, | Position | Term of Office | Occupation(s) | Fund | Directorships |
| Address(1), | Held With | and Length of | During | Complex | Held By |
| and Year of Birth | the Trust | Time Served | Past 5 Years | Overseen By | Trustee |
| | | | | Trustee | |
| |
| Thomas H. Addis III, | Independent | Indefinite Term; | Executive Director/CEO, Southern | 9 | None |
| Year of Birth: 1945 | Trustee | Since 2000 | California PGA (2006 to current). | | |
| |
| Allen C. Brown, | Independent | Indefinite Term; | Co-owner of Stebleton & Brown | 9 | Blue Chip |
| Year of Birth: 1943 | Trustee | Since 2010 | (1994 to Current). Estate planning | | Investor Funds |
| | | | and business attorney (1970 to cur- | | |
| rent). |
| |
| George Cossolias, CPA, | Independent | Indefinite Term; | Partner of CWDL, CPAs (February 1, | 9 | Blue Chip |
| Year of Birth: 1935 | Trustee | Since 2000 | 2014 to current). Owner of George | | Investor Funds |
| | | | Cossolias & Company, CPAs (1972 | | |
| | | | to January 31, 2014). President of | | |
| | | | LubricationSpecialists, Inc. (1996 to | | |
| current). |
(1) The address of each trustee and officer is c/o PFS Funds, 1939 Friendship Drive, Suite C, El Cajon, California 92020.
2016 Annual Report 18
Investment Adviser
Triad Investment Management, LLC
Legal Counsel
The Law Offices of John H. Lively & Associates, Inc.
A member firm of The 1940 Act Law GroupTM
Custodian
US Bank, N.A.
Distributor
Rafferty Capital Markets, LLC
Dividend Paying Agent,
Shareholders' Servicing Agent,
Transfer Agent
Mutual Shareholder Services, LLC
Fund Administrator
Premier Fund Solutions, Inc.
Independent Registered Public Accounting Firm
Cohen Fund Audit Services, Ltd. |
This report is provided for the general information of the shareholders of the Triad Small
Cap Value Fund. This report is not intended for distribution to prospective investors in
the Fund, unless preceded or accompanied by an effective prospectus. |
Triad Small Cap Value Fund
www.triadmutualfunds.com
1-888-501-1036
Item 2. Code of Ethics.
The registrant has adopted a code of ethics that applies to the registrant’s principal executive officer and the principal financial officer. The registrant has not made any amendments to its code of ethics during the covered period. The registrant has not granted any waivers from any provisions of the code of ethics during the covered period. A copy of the registrant’s Code of Ethics is filed herewith.
Item 3. Audit Committee Financial Expert.
The registrant’s Board of Trustees has determined that George Cossolias is an audit committee finical expert. Mr. Cossolias is independent for purposes of this Item 3.
Item 4. Principal Accountant Fees and Services.
(a-d) The following table details the aggregate fees billed for each of the last two fiscal years for audit fees, audit-related fees, tax fees and other fees by the principal accountant to the registrant. The principal accountant has provided no services to the adviser or any entity controlled by, or under common control with the adviser that provides ongoing services to the registrant.
| | | FYE 5/31/16 |
| Audit Fees | | $13,250 |
| Audit-Related Fees | | $0 |
| Tax Fees | | $2,500 |
| All Other Fees | | $0 |
Nature of Tax Fees: preparation of Excise Tax Statement and 1120 RIC.
Nature of All Other Fees: Review of Semi-Annual Report.
(e) (1) The audit committee approves all audit and non-audit related services and, therefore, has not adopted pre-approval policies and procedures described in paragraph (c)(7) of Rule 2-01 of Regulation S-X.
(e) (2) None of the services described in paragraph (b) through (d) of this Item were approved by the audit committee pursuant to paragraph (c)(7)(i)(C) of Rule 2-01 of Regulation S-X.
(f) All of the principal accountant’s hours spent on auditing the registrant’s financial statements were attributed to work performed by full-time permanent employees of the principal accountant.
(g) The following table indicates the aggregate non-audit fees billed by the registrant’s principal accountant for services to the registrant , the registrant’s investment adviser (not sub-adviser), and any entity controlling, controlled by, or under common control with the adviser that provides ongoing services to the registrant, for the last two years.
| Non-Audit Fees | | FYE 5/31/16 |
| Registrant | | $2,500 |
| Registrant’s Investment Adviser | | $0 |
(h) The principal accountant provided no services to the investment adviser or any entity controlling, controlled by, or under common control with the adviser that provides ongoing services to the registrant.
Item 5. Audit Committee of Listed Companies. Not applicable.
Item 6. Schedule of Investments. Schedule filed with Item 1.
Item 7. Disclosure of Proxy Voting Policies and Procedures for Closed-End Management Investment Companies. Not applicable.
Item 8. Portfolio Managers of Closed End Management Investment Companies. Not applicable.
Item 9. Purchases of Equity Securities by Closed-End Management Investment Companies and Affiliated Purchasers. Not applicable.
Item 10. Submission of Matters to a Vote of Security Holders.
The registrant has not adopted procedures by which shareholders may recommend nominees to the registrant’s board of trustees.
Item 11. Controls and Procedures.
(a) The registrant’s president and chief financial officer concluded that the disclosure controls and procedures (as defined in Rule 30a-3(c) under the Investment Company Act of 1940 (the “Act”)) were effective as of a date within 90 days of the filing date of this report, based on the evaluation of these controls and procedures required by Rule 30a-3(b) under the Act.
(b) There were no changes in the registrant’s internal control over financial reporting (as defined in Rule 30a-3(d) under the Act) that occurred during the registrant’s second fiscal quarter of the period covered by this report that have materially affected, or are reasonably likely to materially affect, the registrant’s internal control over financial reporting.
Item 12. Exhibits.
(a)(1) Code of Ethics. Filed herewith.
(a)(2) Certifications pursuant to Section 302 of the Sarbanes-Oxley Act of 2002. Filed herewith.
(a)(3) Not applicable.
(b) Certification pursuant to Section 906 Certification of the Sarbanes-Oxley Act of 2002. Filed herewith.
SIGNATURES
Pursuant to the requirements of the Securities Exchange Act of 1934 and the Investment Company Act of 1940, the registrant has duly caused this report to be signed on its behalf by the undersigned, thereunto duly authorized.
| | By: /s/Ross C. Provence
Ross C. Provence
President |
Pursuant to the requirements of the Securities Exchange Act of 1934 and the Investment Company Act of 1940, this report has been signed below by the following persons on behalf of the registrant and in the capacities and on the dates indicated.
| |
By: /s/Ross C. Provence
Ross C. Provence
President |
| | By: /s/Jeffrey R. Provence
Jeffrey R. Provence
Chief Financial Officer |