| Item 6. Investments. | | | | |
| | | | | | | |
| Taylor Frigon Core Growth Fund |
| | | | | Schedule of Investments |
| | | November 30, 2024 |
| | | | | | | |
| Shares | | | | Fair Value | | % of Net Assets |
| | | | | | | |
| COMMON STOCKS | | | | |
| | | | | | | |
| Biological Products (No Diagnostic Substances) | | | | |
| 242,969 | | Compugen Ltd. * (Israel) | | $ 386,321 | | 1.19% |
| | | | | | | |
| Communications Equipment, NEC | | | | |
| 17,786 | | Napco Security Technologies, Inc. | | 697,745 | | 2.16% |
| | | | | | | |
| Computer Storage Devices | | | | |
| 11,289 | | Pure Storage, Inc. - Class A * | | 598,204 | | 1.85% |
| | | | | | | |
| Electromedical & Electrotherapeutic Apparatus | | | | |
| 24,102 | | InMode Ltd. * (Israel) | | 470,712 | | |
| 6,147 | | TransMedics Group, Inc. * | | 533,006 | | |
| | | | | 1,003,718 | | 3.10% |
| | | | | | | |
| Electronic Components, NEC | | | | |
| 5,074 | | Impinj, Inc. * | | 975,273 | | 3.01% |
| | | | | | | |
| Food and Kindred Products | | | | |
| 176,360 | | Real Good Food Company, Inc. - Class A * | 45,942 | | 0.14% |
| | | | | | | |
| General Industrial Machinery & Equipment, NEC | | | | |
| 20,256 | | Symbotic Inc. * | | 544,886 | | 1.68% |
| | | | | | | |
| In Vitro & In Vivo Diagnostic Substances | | | | |
| 1,371 | | IDEXX Laboratories, Inc. * | | 578,219 | | 1.80% |
| | | | | | | |
| IT Services | | | | | | |
| 8,236 | | CloudFlare, Inc. - Class A * | | 822,200 | | |
| 34,944 | | Grid Dynamics Holdings, Inc. - Class A * | | 639,475 | | |
| 2,248 | | MongoDB, Inc. - Class A * | | 724,958 | | |
| 3,896 | | NICE Ltd. ADR * | | 710,786 | | |
| | | | | 2,897,419 | | 8.95% |
| | | | | | | |
| Measuring & Controlling Devices, NEC | | | | |
| 1,481 | | Onto Innovation Inc. * | | 243,151 | | 0.75% |
| | | | | | | |
| Optical Instruments & Lenses | | | | |
| 3,918 | | Camtek Ltd. (Israel) | | 291,891 | | |
| 682 | | KLA Corporation | | 441,274 | | |
| | | | | 733,165 | | 2.26% |
| | | | | | | |
| Orthopedic, Prosthetic & Surgical Appliances & Supplies | | | |
| 7,462 | | Edwards Lifesciences Corporation * | | 532,414 | | 1.64% |
| | | | | | | |
| Printed Circuit Boards | | | | |
| 134,027 | | Nano Dimension Ltd. ADR * | | 289,498 | | 0.89% |
| | | | | | | |
| Printing Trades Machinery & Equipment | | | | |
| 32,286 | | Kornit Digital Ltd. * (Israel) | | 1,026,695 | | 3.17% |
| | | | | | | |
| Radio & TV Broadcasting & Communications Equipment | | | |
| 152,986 | | Vuzix Corporation * | | 353,398 | | 1.09% |
| | | | | | | |
| Retail - Auto Dealers & Gasoline Stations | | | | |
| 3,793 | | Carvana Co. - Class A * | | 987,773 | | 3.05% |
| | | | | | | |
| Retail - Eating & Drinking Places | | | | |
| 18,059 | | Dutch Bros. Inc. - Class A * | | 970,310 | | 3.00% |
| | | | | | | |
| Retail - Shoe Stores | | | | |
| 5,036 | | Boot Barn Holdings, Inc. * | | 690,637 | | 2.13% |
| | | | | | | |
| Security & Commodity Brokers, Dealers, Exchanges & Services | | |
| 6,012 | | Tradeweb Markets Inc. - Class A | | 814,626 | | 2.52% |
| | | | | | | |
| Semiconductors & Related Devices | | | | |
| 1,484 | | Monolithic Power Systems, Inc. | | 842,378 | | |
| 66,600 | | QuickLogic Corporation * | | 508,158 | | |
| 15,268 | | Tower Semiconductor * (Israel) | | 719,581 | | |
| | | | | 2,070,117 | | 6.40% |
| | | | | | | |
| Services - Amusement & Recreation Services | | | | |
| 66,922 | | Bowlero Corp. - Class A | | 823,810 | | 2.54% |
| | | | | | | |
| Services - Business Services, NEC | | | | |
| 4,650 | | CBIZ, Inc. * | | 383,997 | | |
| 25,196 | | Fiverr International Ltd. * (Israel) | | 821,642 | | |
| 79,432 | | Repay Holdings Corporation - Class A * | | 641,810 | | |
| | | | | 1,847,449 | | 5.71% |
| | | | | | | |
| Services - Computer Processing & Data Preparation | | | | |
| 11,022 | | Toast, Inc. - Class A * | | 479,898 | | 1.48% |
| | | | | | | |
| Services - Computer Programming Services | | | | |
| 3,260 | | EPAM Systems, Inc. * | | 795,179 | | 2.46% |
| | | | | | | |
| Services - Computer Programming, Data Processing, Etc. | | | |
| 4,824 | | Wix.com Ltd. * (Israel) | | 1,079,322 | | 3.33% |
| | | | | | | |
| Services - Miscellaneous Business Services | | | | |
| 35,337 | | NV5 Global, Inc. * | | 768,933 | | 2.38% |
| | | | | | | |
| Services - Prepackaged Software | | | | |
| 20,048 | | Alkami Technologies, Inc. * | | 791,295 | | |
| 8,059 | | Bill.com Holdings, Inc. * | | 727,083 | | |
| 2,883 | | CyberArk Software Ltd. * (Israel) | | 932,679 | | |
| 43,181 | | Mobileye Global Inc. - Class A * (Israel) | | 779,417 | | |
| 2,217 | | monday.com Ltd. * (Israel) | | 632,643 | | |
| 12,670 | | Procore Technologies, Inc. * | | 1,028,804 | | |
| | | | | 4,891,921 | | 15.11% |
| | | | | | | |
| Surgical & Medical Instruments & Apparatus | | | | |
| 132,282 | | Apyx Medical Corporation * | | 212,974 | | |
| 46,770 | | ClearPoint Neuro, Inc. * | | 578,545 | | |
| 8,194 | | DexCom, Inc. * | | 639,050 | | |
| 6,535 | | Glaukos Corporation * | | 938,753 | | |
| 36,666 | | NovoCure Limited * (Jersey) | | 734,786 | | |
| 9,896 | | PROCEPT BioRobotics Corporation * | | 945,959 | | |
| | | | | 4,050,067 | | 12.51% |
| | | | | | | |
| Telephone & Telegraph Apparatus | | | | |
| 849,187 | | Akoustis Technologies, Inc. * | | 85,853 | | |
| 94,806 | | AudioCodes Ltd. (Israel) | | 881,696 | | |
| | | | | 967,549 | | 2.99% |
| | | | | | | |
| Total for Common Stocks (Cost $24,983,890) | | 32,143,639 | | 99.29% |
| | | | | | | |
| MONEY MARKET FUNDS | | | | |
| 302,627 | | Federated Hermes Government Obligations Money | | | |
| | | Market Fund Institutional Shares 4.50% ** | 302,627 | | 0.94% |
| (Cost $302,627) | | | | |
| Total Investment Securities | | 32,446,266 | | 100.23% |
| | | (Cost $25,286,517) | | | | |
| | | | | | | |
| Liabilities in Excess of Other Assets | | (73,524) | | -0.23% |
| | | | | | | |
| Net Assets | | | | $ 32,372,742 | | 100.00% |
| | | | | | | |
| | | | | | | |
| ADR - American Depositary Receipt. | | | | |
| * Non-Income Producing Security. | | | | |
| ** The rate shown represents the 7-day yield at November 30, 2024. | | | |
| The accompanying notes are an integral part of these financial statements. | | |
| NOTES TO THE FINANCIAL STATEMENTS | |
| TAYLOR FRIGON CORE GROWTH FUND | |
| November 30, 2024 | |
| | | | | | | | | | |
| 1.) ORGANIZATION | | | | | | | | | |
| The Taylor Frigon Core Growth Fund (the “Fund”) was organized as a diversified series of PFS Funds (the “Trust”) on December 7, 2016, and commenced operations on December 27, 2016. The Trust was established under the laws of Massachusetts by an Agreement and Declaration of Trust dated January 13, 2000, which was amended and restated as of January 20, 2011. The Trust is registered as an open-end investment company under the Investment Company Act of 1940, as amended (the “1940 Act”). The Trust may offer an unlimited number of shares of beneficial interest in a number of separate series, each series representing a distinct fund with its own investment objectives and policies. As of November 30, 2024, there were eleven series authorized by the Trust. The Fund’s objective is to seek long-term capital appreciation. The investment adviser to the Fund is Taylor Frigon Capital Management, LLC (the “Adviser”). |
| | | | | | | | | | |
| 2.) SIGNIFICANT ACCOUNTING POLICIES | | | | | | | |
| The Fund is an investment company and accordingly follows the investment company accounting and reporting guidance of the Financial Accounting Standards Board (“FASB”) Accounting Standards Codification Topic 946 Financial Services - Investment Companies. The financial statements are prepared in conformity with accounting principles generally accepted in the United States of America (“GAAP”). The Fund follows the significant accounting policies described in this section. |
| | | | | | | | | | |
| SECURITY VALUATION | | | | | | | | | |
| All investments in securities are valued as described in Note 3. The Trust’s Board of Trustees (“Board”) has designated the Adviser as “Valuation Designee” pursuant to Rule 2a-5 under the 1940 Act. |
| | | | | | | | | | |
| SHARE VALUATION | | | | | | | | | |
| The net asset value (the “NAV”) is generally calculated as of the close of trading on the New York Stock Exchange (the “Exchange”) (normally 4:00 p.m. Eastern time) every day the Exchange is open. The NAV is calculated by taking the total value of the Fund’s assets, subtracting its liabilities, and then dividing by the total number of shares outstanding, rounded to the nearest cent. The offering price and redemption price per share is equal to the net asset value per share, except that shares of the Fund are subject to a redemption fee of 2% if redeemed within 90 days or less of purchase. During the fiscal year ended November 30, 2024, proceeds from redemption fees were $902. |
| | | | | | | | | | |
| FEDERAL INCOME TAXES | | | | | | | | | |
| The Fund’s policy is to continue to comply with the requirements of the Internal Revenue Code that are applicable to regulated investment companies and to distribute all of its taxable income to shareholders. Therefore, no federal income tax provision is required. It is the Fund’s policy to distribute annually, prior to the end of the calendar year, dividends sufficient to satisfy excise tax requirements of the Internal Revenue Code. This Internal Revenue Code requirement may cause an excess of distributions over the book year-end accumulated income. In addition, it is the Fund’s policy to distribute annually, after the end of the fiscal year, any remaining net investment income and net realized capital gains. |
| | | | | | | | | | |
| The Fund recognizes the tax benefits of certain tax positions only where the position is “more likely than not” to be sustained assuming examination by tax authorities. Management has analyzed the Fund’s tax positions, and has concluded that no liability for unrecognized tax benefits should be recorded related to uncertain tax positions taken on returns filed for open tax years. The Fund identifies its major tax jurisdictions as U.S. Federal and State tax authorities; however, the Fund is not aware of any tax positions for which it is reasonably possible that the total amounts of unrecognized tax benefits will change materially in the next twelve months. The Fund recognizes interest and penalties, if any, related to unrecognized tax benefits as income tax expense in the Statement of Operations. During the fiscal year ended November 30, 2024, the Fund did not incur any interest or penalties. |
| | | | | | | | | | |
| DISTRIBUTIONS TO SHAREHOLDERS | | | | | | | |
| Distributions to shareholders, which are determined in accordance with income tax regulations, are recorded on the ex-dividend date. The treatment for financial reporting purposes of distributions made to shareholders during the year from net investment income or net realized capital gains may differ from their ultimate treatment for federal income tax purposes. The differences between book and tax basis are caused primarily by differences in the timing of the recognition of certain components of income, expense, or realized capital gain for federal income tax purposes. Where such differences are permanent in nature, they are reclassified in the components of the net assets based on their ultimate characterization for federal income tax purposes. Any such reclassifications will have no effect on net assets, result of operations, or net asset value per share of the Fund. |
| | | | | | | | | | |
| USE OF ESTIMATES | | | | | | | | | |
| The financial statements are prepared in accordance with GAAP, which requires management to make estimates and assumptions that affect the reported amounts of assets and liabilities and disclosure of contingent assets and liabilities at the date of the financial statements and the reported amounts of increases and decreases in net assets from operations during the reporting period. Actual results could differ from those estimates. |
| | | | | | | | | | |
| EXPENSES | | | | | | | | | |
| Expenses incurred by the Trust that do not relate to a specific fund of the Trust are allocated to the individual funds based on each fund’s relative net assets or another appropriate basis. |
| | | | | | | | | | |
| OTHER | | | | | | | | | |
| The Fund records security transactions based on a trade date for financial reporting purposes. Dividend income is recognized on the ex-dividend date, and interest income, if any, is recognized on an accrual basis. The Fund uses the specific identification method in computing gain or loss on the sale of investment securities. Withholding taxes on foreign dividends have been provided for in accordance with the Fund’s understanding of the applicable country’s tax rules and rates. |
| | | | | | | | | | |
| 3.) INVESTMENT SECURITIES VALUATIONS | | | | | | | |
| The Fund utilizes various methods to measure the fair value of its investments on a recurring basis. GAAP establishes a hierarchy that prioritizes inputs to valuation methods. The three levels of inputs are: |
| | | | | | | | | | |
| Level 1 - Unadjusted quoted prices in active markets for identical assets or liabilities that the Fund has the ability to access. |
| | | | | | | | | | |
| Level 2 - Observable inputs other than quoted prices in active markets included in level 1 that are observable for the asset or liability, either directly or indirectly. These inputs may include quoted prices for the identical instrument on an inactive market, prices for similar instruments, interest rates, prepayment speeds, credit risk, yield curves, default rates and similar data. |
| | | | | | | | | | |
| Level 3 - Unobservable inputs for the asset or liability, to the extent relevant observable inputs are not available, representing the Fund’s own assumptions about the assumptions a market participant would use in valuing the asset or liability, and would be based on the best information available. |
| | | | | | | | | | |
| The availability of observable inputs can vary from security to security and is affected by a wide variety of factors, including, for example, the type of security, whether the security is new and not yet established in the marketplace, the liquidity of markets, and other characteristics particular to the security. To the extent that valuation is based on models or inputs that are less observable or unobservable in the market, the determination of fair value requires more judgment. Accordingly, the degree of judgment exercised in determining fair value is greatest for instruments categorized in level 3. |
| | | | | | | | | | |
| The inputs used to measure fair value may fall into different levels of the fair value hierarchy. In such cases, for disclosure purposes, the level in the fair value hierarchy within which the fair value measurement falls in its entirety, is determined based on the lowest level input that is significant to the fair value measurement in its entirety. |
| | | | | | | | | | |
| VALUATION OF FUND ASSETS | | | | | | | | | |
| A description of the valuation techniques applied to the Fund’s major categories of assets and liabilities measured at fair value on a recurring basis follows. |
| | | | | | | | | | |
| Equity securities (common stocks, including ADRs). Equity securities generally are valued by using market quotations, but may be valued on the basis of prices furnished by a pricing service when the Valuation Designee believes such prices accurately reflect the fair value of such securities. Securities that are traded on any stock exchange or on the NASDAQ over-the-counter market are generally valued by the pricing service at the last quoted sale price. Lacking a last sale price, an equity security is generally valued by the pricing service at its last bid price. Generally, if the security is traded in an active market and is valued at the last sale price, the security is categorized as a level 1 security, and if an equity security is valued by the pricing service at its last bid, it is generally categorized as a level 2 security. When market quotations are not readily available, when the Valuation Designee determines that the market quotation or the price provided by the pricing service does not accurately reflect the current fair value, or when restricted securities are being valued, such securities are valued as determined in good faith by the Valuation Designee, subject to review of the Board and are categorized in level 2 or level 3, when appropriate. |
| | | | | | | | | | |
| Money market funds. Money market funds are valued at NAV provided by the fund and are classified in level 1 of the fair value hierarchy. |
| | | | | | | | | | |
| In accordance with the Trust’s good faith pricing guidelines, the Valuation Designee is required to consider all appropriate factors relevant to the value of securities for which it has determined other pricing sources are not available or reliable as described above. There is no standard procedure for determining fair value, since fair value depends upon the circumstances of each individual case. As a general principle, the current fair value of an issue of securities being valued by the Valuation Designee would appear to be the amount which the owner might reasonably expect to receive for them upon their current sale. Methods which are in accordance with this principle may, for example, be based on (i) a multiple of earnings; (ii) a discount from market of a similar freely traded security (including a derivative security or a basket of securities traded on other markets, exchanges or among dealers); or (iii) yield to maturity with respect to debt issues, or a combination of these and other methods. The Board maintains responsibilities for the fair value determinations under Rule 2a-5 under the 1940 Act and oversees the Valuation Designee. |
| | | | | | | | | | |
| The following table summarizes the inputs used to value the Fund’s assets measured at fair value as of November 30, 2024: |
| | | | | | | | | | |
| Valuation Input of Assets | | Level 1 | | Level 2 | | Level 3 | | Total | |
| Common Stocks | | $ 32,143,639 | | $ - | | $ - | | $ 32,143,639 | |
| Money Market Funds | | 302,627 | | - | | - | | 302,627 | |
| | | $ 32,446,266 | | $ - | | $ - | | $ 32,446,266 | |
| | | | | | | | | | |
| The Fund did not hold any Level 3 assets as of the fiscal year ended November 30, 2024. The Fund did not invest in derivative instruments during the fiscal year ended November 30, 2024. |
| | | | | | | | | | |
| 4.) INVESTMENT ADVISORY AGREEMENT | | | | | | | |
| The Fund has entered into an investment advisory agreement (“Management Agreement”) with the Adviser. The Adviser manages the investment portfolio of the Fund, subject to policies adopted by the Trust’s Board of Trustees. Under the Management Agreement, the Adviser, at its own expense and without reimbursement from the Trust, furnishes office space and all necessary office facilities, equipment, and executive personnel necessary for managing the Fund and pays the operating expenses of the Fund excluding management fees, brokerage fees and commissions, taxes, borrowing costs (such as (a) interest and (b) dividend expenses on securities sold short), ADR fees, fees and expenses of acquired funds, fees pursuant to Rule 12b-1 distribution plans, and extraordinary or non-recurring expenses. For its services, the Adviser receives an investment management fee equal to 1.00% of the average daily net assets of the Fund. |
| | | | | | | | | | |
| As a result of the above calculation, for the fiscal year ended November 30, 2024, the Adviser earned management fees totaling $310,614. At November 30, 2024, the Fund owed the Adviser management fees of $25,526. |
| | | | | | | | | | |
| Additionally, the Fund has a Services Agreement with the Adviser (the “Services Agreement”). Under the Services Agreement the Adviser receives an additional fee of 0.45% of the average daily net assets up to $100 million, and 0.25% of such assets in excess of $100 million and is obligated to pay the operating expenses of the Fund excluding management fees, brokerage fees and commissions, 12b-1 fees (if any), taxes, borrowing costs (such as (a) interest and (b) dividend expenses on securities sold short), ADR fees, the cost of acquired funds and extraordinary expenses. |
| | | | | | | | | | |
| For the fiscal year ended November 30, 2024, the Adviser earned services fees of $139,776. At November 30, 2024, the Fund owed the Adviser services fees of $11,487. |
| | | | | | | | | | |
| 5.) RELATED PARTY TRANSACTIONS | | | | | | | |
| Certain officers and a Trustee of the Trust are also officers of Premier Fund Solutions, Inc. (the “Administrator”). These individuals receive benefits from the Administrator resulting from administration fees paid to the Administrator of the Fund by the Adviser. |
| | | | | | | | | | |
| The Trustees who are not interested persons of the Fund were each paid $3,000, for a total of $12,000, in Trustees’ fees for the fiscal year ended November 30, 2024. These fees were paid by the Adviser. |
| | | | | | | | | | |
The Chief Compliance Officer ("CCO") of the Fund was paid $6,108, in CCO fees for the fiscal year ended November 30, 2024, by the Adviser.
|
| | | | | | | | | | |
| 6.) PURCHASES AND SALES OF SECURITIES | | | | | | | |
| For the fiscal year ended November 30, 2024, purchases and sales of investment securities other than short-term investments and U.S Government obligations aggregated $9,021,003 and $14,512,201, respectively. |
| | | | | | | | | | |
| 7.) CONTROL OWNERSHIP | | | | | | | | | |
The beneficial ownership, either directly or indirectly, of more than 25% of the voting securities of a fund creates a presumption of control of that fund, under Section 2(a)(9) of the 1940 Act. As of November 30, 2024, Charles Schwab & Co., Inc. (“Schwab”), for the benefit of its customers, held, in aggregate, 92.83% of the shares in the Fund. The Trust does not know whether any underlying accounts held at Schwab, owned or controlled 25% or more of the voting securities of the Fund.
|
| | | | | | | | | | |
| 8.) TAX MATTERS | | | | | | | | | |
For Federal income tax purposes, the cost of securities owned at November 30, 2024 was $25,333,398. At November 30, 2024, the composition of unrealized appreciation (the excess of value over tax cost) and depreciation (the excess of tax cost over value) on a tax basis was as follows:
|
| | | | | | | | | | |
| Appreciation | | (Depreciation) | Net Appreciation/(Depreciation) |
| $12,345,140 | | ($5,232,272) | | $7,112,868 | |
| | | | | | | | | | |
| The tax character of distributions was as follows: |
| | | | | | | | | | |
| | Fiscal Year Ended | | Fiscal Year Ended | | |
| | November 30, 2024 | | November 30, 2023 | | |
| Ordinary Income | | $ - | | | | $ - | | | |
| Long-term Capital Gain | | - | | | | - | | | |
| | | $ - | | | | $ - | | | |
| | | | | | | | | | |
| As of November 30, 2024, the components of distributable earnings (accumulated losses) on a tax basis were as follows: |
| | | | | | | | |
| Other Accumulated Losses | | | | | $ (1,162,286) | | |
| Unrealized Appreciation on Investments - Net | | | 7,112,868 | | |
| | | | | | $ 5,950,582 | | |
| | | | | | | | | | |
As of November 30, 2024, the difference between book and tax basis unrealized appreciation was attributed to the tax treatment of passive foreign investment companies (“PFICs”) and the deferral of wash sales. Under current tax law, late-year ordinary losses incurred after December 31 of a Fund’s fiscal year may be deferred and treated as occurring on the first business day of the following fiscal year for tax purposes. As of November 30, 2024, other accumulated losses included deferred late year ordinary losses of $322,878, an available unused short-term capital loss carryforward of $21,139 with no expiration and long-term capital loss carryforward of $818,269 with no expiration. During the fiscal year ended November 30, 2024, the Fund utilized $144,492 of short-term capital loss carryforward and $1,346,550 of long-term capital loss carryforward.
|
| | | | | | | | | | |
| For the fiscal year ended November 30, 2024, the following reclassification was primarily attributed to the reclassification of net operating loss. |
| | | | | | | | | | |
| Paid in Capital | | $ (426,504) | | | | | | | |
| Total Distributable Earnings | | $ 426,504 | | | | | | | |
| | | | | | | | | | |
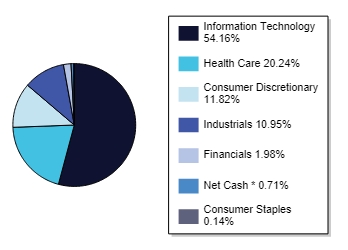
| 9.) CONCENTRATION OF SECTOR RISK | | | | | | | |
If a Fund has significant investments in the securities of issuers in industries within a particular sector, any development affecting that sector will have a greater impact on the value of the net assets of the Fund than would be the case if the Fund did not have significant investments in that sector. In addition, this may increase the risk of loss of an investment in the Fund and increase the volatility of the Fund’s NAV per share. From time to time, circumstances may affect a particular sector and the companies within such sector. For instance, economic or market factors, regulation or deregulation, and technological or other developments may negatively impact all companies in a particular sector and therefore the value of a Fund’s portfolio will be adversely affected. As of November 30, 2024, the Fund had 54.16% of the value of its net assets invested in stocks within the Information Technology sector.
|
| | | | | | | | | | |
| 10.) SUBSEQUENT EVENTS | | | | | | | | | |
Subsequent events after the date of the Statement of Assets and Liabilities have been evaluated through the date the financial statements were issued. Management has concluded that there are no events requiring adjustment or disclosure in the financial statements.
|